
A microearthquake survey of the high-temperature vent fields on the volcanically active East Pacific...
11
JOURNAL OF GEOPHYSICAL RESEARCH, VOL.104, NO.Bll, PAGES 25,367-25,377, NOVEMBER 10, 1999 A microearthquake survey of the high-temperature vent fields on the volcanically active East Pacific Rise (9ø 50'N) Robert A. Sohn, John A. Hildebrand, and Spahr C. Webb Scripps Institution of Oceanography, La Jolla,California Abstract. A 3 monthdeployment of nine ocean bottomseismometers (OBS) on the axis of the EastPacificRise at 9ø50'N detected 283 local microearthquakes in the spring of 1995. The earthquakes exhibit small, uniform seismic moments of 10•4-1016 dyne-cm (). Accurate locations weredetermined for 147 of the earthquakes, with hypocenters clustered beneath two high- temperature hydrothermal fields (Bio9/P andTube Worm Pillar/Y) at depths <1.4 km beneath the seafloor. Waveformcross-correlation techniques relocated 76 events, 65 of whichhad lateral standard errors <100 m. Relocated hypocenters lie alongtwo verticalcolumns from 0.7 to 1.1 km depth. A continuous level of seismic activitywasobserved beneath the Tube Worm Pillar andY vent fields, while activity beneath the Bio9 and P vent fields was dominated by a vigorous swarm of 162 events during 3 hours thattriggered a 7øCtemperature increase in Bio9 exit fluids.The close correlation between the hydrothermal systems andthe observed seismicity suggests the microearthquakes weregenerated by thermal strain associated with cooling of the shallow crust andthatthe water-rock reaction zoneis alsoa seismogenic zone.The earthquake depths suggest that brittledeformation on the rise axis is restricted to the upperkilometerof crust. 1. Introduction Oceanic crust at the East Pacific Rise (EPR) is extended at some of the fastest rates observedon Earth (>100 mm/yr), but thisextension produces almost no detectable teleseismic activity. The characteristics of earthquakes generated at oceanic spreading centers are a function of the thermal and elastic conditions on the rise crest.To generate an earthquake, crustaltemperatures must be low enoughto allow brittle deformation,and stresses must exceed the local rock strength. Aseismic deformation of the EPR crest indicates thatthroughout most of the crust, conditions favor plastic asopposed to brittlematerial behavior and that magmatic extension precludes the accumulation of significant tensile stresses [e.g., Cowie et al., 1993]. On-bottom seismic experiments have demonstrated that the EPR axis doesnot generate even moderate size earthquakes (M b 2-4) [e.g., Riedeselet al., 1982; Hildebrand et al., 1992]. The lack of deep and/or large earthquakessuggeststhat brittle deformation is restricted to a thin, surficial layer on the EPR axis. Apart from anomalous structural featuressuch as overlapping spreading centers [Wilcock et al., 1992], seismic activity observed on the EPR axis is restricted to small microearthquakes in the shallow crust[e.g., Riedesel et al., 1982; HiMebrand et al., 1992]. The source mechanism for these shallow microearthquakes has not been established, but there are indications that these events are associated with hydrothermal activity [Riedesel et al., 1982]. Hydrothermal convection at the EPR at 9ø50'N is driven by large thermal gradients that represent the extreme limit of naturally occurring systems within the Earth. Basalticmelt with temperatures of-1200øC is separated from circulatingseawater by an impermeable layer of crust only a few hundred meters thick Copyright !999 bythe American Geophysical Union. Paper number 1999JB900263. 0148-0227/99/1999JB900263 $09.00 [e.g., Kent etal., 1993; Lister, 1983; Cann etal., 1985]. Thermal gradients of-2øC/m are maintained withinthis impermeable layer, and thermal strain accumulates within the boundary layer as heat transfer into circulating fluids pushes isotherms downward. If the thermal strain rate is large enough, then the hydrothermal reaction zone is also a potential seismogenic zone for microearthquakes associated withthecontraction of basalt. Ocean Bottom Seismometers (OBSs) deployed near rise crest black smoker vents commonlydetect vigorous levels of microearthquake activity [e.g., McClain et al., 1993; Sohn et al., 1995], buthypocentral determinations have not previously been possible because of inadequate station coverage. Asa result, the seismogenic properties of high-temperature hydrothermal reaction zones have not been determined. Careful examinationof small microearthquakes associated with hydrothermal processes in theshallow crust requires dense on-bottom seismic arrays with interelement spacings of several hundred meters and total apertures of a few kilometers. To investigate this phenomenon, we deployed a dense array of OBSs on the EPR axisat 9ø50'N, a siteof robust black smoker venting and recent volcanism [Haymon et al., 1993; Rubin et al., 1994]. We monitored 283 microearthquakes in a 105 day deployment, and located 147events with standard errors of 150-250 m. We improved hypocentral estimates fora subset of these events by employing waveform cross-correlation techniques to reduce relative location errorsto a few tensof meters. The earthquakes are clustered beneath black smoker vent fieldswithin the study area, and include a 3 hour swarm of 162events that stimulated a 7 øC temperature increase in the overlying x/ent fluids [Sohn et al., 1998a]. We use our results to investigate the relationship between hydrothermal circulation and microseismicity and the accumulation of tectonic andthermal strain on theriseaxis. 2. Field Area In April 1991, evidence of a recent seafloor volcanic eruption on the EPR at 9ø50'N was observed during a series of 25,367
Transcript of A microearthquake survey of the high-temperature vent fields on the volcanically active East Pacific...
JOURNAL OF GEOPHYSICAL RESEARCH, VOL. 104, NO. Bll, PAGES 25,367-25,377, NOVEMBER 10, 1999
A microearthquake survey of the high-temperature vent fields on the volcanically active East Pacific Rise (9 ø 50'N)
Robert A. Sohn, John A. Hildebrand, and Spahr C. Webb Scripps Institution of Oceanography, La Jolla, California
Abstract. A 3 month deployment of nine ocean bottom seismometers (OBS) on the axis of the East Pacific Rise at 9ø50'N detected 283 local microearthquakes in the spring of 1995. The earthquakes exhibit small, uniform seismic moments of 10•4-1016 dyne-cm (). Accurate locations were determined for 147 of the earthquakes, with hypocenters clustered beneath two high- temperature hydrothermal fields (Bio9/P and Tube Worm Pillar/Y) at depths <1.4 km beneath the seafloor. Waveform cross-correlation techniques relocated 76 events, 65 of which had lateral standard errors <100 m. Relocated hypocenters lie along two vertical columns from 0.7 to 1.1 km depth. A continuous level of seismic activity was observed beneath the Tube Worm Pillar and Y vent fields, while activity beneath the Bio9 and P vent fields was dominated by a vigorous swarm of 162 events during 3 hours that triggered a 7øC temperature increase in Bio9 exit fluids. The close correlation between the hydrothermal systems and the observed seismicity suggests the microearthquakes were generated by thermal strain associated with cooling of the shallow crust and that the water-rock reaction zone is also a seismogenic zone. The earthquake depths suggest that brittle deformation on the rise axis is restricted to the upper kilometer of crust.
1. Introduction
Oceanic crust at the East Pacific Rise (EPR) is extended at some of the fastest rates observed on Earth (>100 mm/yr), but this extension produces almost no detectable teleseismic activity. The characteristics of earthquakes generated at oceanic spreading centers are a function of the thermal and elastic conditions on the
rise crest. To generate an earthquake, crustal temperatures must be low enough to allow brittle deformation, and stresses must exceed the local rock strength. Aseismic deformation of the EPR crest indicates that throughout most of the crust, conditions favor plastic as opposed to brittle material behavior and that magmatic extension precludes the accumulation of significant tensile stresses [e.g., Cowie et al., 1993].
On-bottom seismic experiments have demonstrated that the EPR axis does not generate even moderate size earthquakes (M b 2-4) [e.g., Riedesel et al., 1982; Hildebrand et al., 1992]. The lack of deep and/or large earthquakes suggests that brittle deformation is restricted to a thin, surficial layer on the EPR axis. Apart from anomalous structural features such as overlapping spreading centers [Wilcock et al., 1992], seismic activity observed on the EPR axis is restricted to small microearthquakes in the shallow crust [e.g., Riedesel et al., 1982; HiMebrand et al., 1992]. The source mechanism for these shallow microearthquakes has not been established, but there are indications that these events are associated with hydrothermal activity [Riedesel et al., 1982].
Hydrothermal convection at the EPR at 9ø50'N is driven by large thermal gradients that represent the extreme limit of naturally occurring systems within the Earth. Basaltic melt with temperatures of-1200øC is separated from circulating seawater by an impermeable layer of crust only a few hundred meters thick
Copyright !999 by the American Geophysical Union.
Paper number 1999JB900263. 0148-0227/99/1999JB900263 $09.00
[e.g., Kent et al., 1993; Lister, 1983; Cann et al., 1985]. Thermal gradients of-2øC/m are maintained within this impermeable layer, and thermal strain accumulates within the boundary layer as heat transfer into circulating fluids pushes isotherms downward. If the thermal strain rate is large enough, then the hydrothermal reaction zone is also a potential seismogenic zone for microearthquakes associated with the contraction of basalt. Ocean Bottom Seismometers (OBSs) deployed near rise crest black smoker vents commonly detect vigorous levels of microearthquake activity [e.g., McClain et al., 1993; Sohn et al., 1995], but hypocentral determinations have not previously been possible because of inadequate station coverage. As a result, the seismogenic properties of high-temperature hydrothermal reaction zones have not been determined.
Careful examination of small microearthquakes associated with hydrothermal processes in the shallow crust requires dense on-bottom seismic arrays with interelement spacings of several hundred meters and total apertures of a few kilometers. To investigate this phenomenon, we deployed a dense array of OBSs on the EPR axis at 9ø50'N, a site of robust black smoker venting and recent volcanism [Haymon et al., 1993; Rubin et al., 1994]. We monitored 283 microearthquakes in a 105 day deployment, and located 147 events with standard errors of 150-250 m. We improved hypocentral estimates for a subset of these events by employing waveform cross-correlation techniques to reduce relative location errors to a few tens of meters. The earthquakes are clustered beneath black smoker vent fields within the study area, and include a 3 hour swarm of 162 events that stimulated a 7 ø C temperature increase in the overlying x/ent fluids [Sohn et al., 1998a]. We use our results to investigate the relationship between hydrothermal circulation and microseismicity and the accumulation of tectonic and thermal strain on the rise axis.
2. Field Area
In April 1991, evidence of a recent seafloor volcanic eruption on the EPR at 9ø50'N was observed during a series of
25,367

25,368 SOHN ET AL.: EPR (9ø50'N) EARTHQUAKE SURVEY
9o51'N
9o50'N
9o49'N
PACIFIC
PLATE
Study COCOS 0 øN Area PLATE
I 10øW
OBS VENT FIELD
•io9 vents
Tube Wor•Pillar
104ø18'W 104ø17'W
Figure 1. Area map of the East Pacific Rise at 9ø50'N. Location of the study area is shown on the inset map. Location of seismic instruments, high-temperature hydro;.hermal fields, and axial summit trough are shown on the local bathymetric map.
submersible dives [Haymon et al., 1993]. Radiometric dating of lava samples confirmed that an eruption had occurred no more than 2 weeks before the submersible dives [Rubin et al., 1994], establishing "time zero" for a rise crest volcanic eruption for the first time. Since the eruption in 1991, a wide range of experiments and surveys have been conducted to study the response of rise crest hydrothermal, biologic, and volcanic processes to magmatic input.
Perhaps the most distinctive feature of the EPR at 9ø50'N is the extensive, high-temperature hydrothermal venting found along the rise axis (Figure 1). These vents have been continuously emitting hot fluids (T > 350øC) since the eruption in 1991 [Fornari et al., 1998], and several of these vents predate the eruption, having been active since at least November 1989 [Haymon et al., 1991 ]. The temperature [Fornari et al., 1998] and chemistry [ Von Damm et al., 1995] of exit fluids from these vents have been monitored since the eruption in 1991, and these data form the basis of current ideas regarding the response of high-temperature systems to volcanic eruptions [e.g., Butterfield et al., 1997]. The longevity of these circulation systems (~ 8 years) is also noteworthy. For comparison, high-temperature venting initiated by the 1993 eruption on the CoAxial segment of the Juan de Fuca Ridge had a much shorter life span of- 1 year [Baker et al., 1998].
The modest topography and linear features of the EPR from 9 ø-10øN have provided an attractive site for a number of seismic surveys since the 1970s. Early studies using OBS [Orcutt et al., 1975] and sonobuoy [Rosendahl et al., 1976] data imaged a low- velocity zone 1.5-5 km below the seafloor, but resolution was poor. These models were improved with expanding spread
profiles (ESP) [Vera et al., 1990] and multichannel seismic (MCS) reflection data [Herron et al., 1980; Detrick et al., 1987]. The MCS studies provided clear evidence of liquid melt or crystal mush at shallow depths on the rise axis, and the ESP data provided cross sections of compressional wave velocity throughout the entire crustal layer. Recent efforts have involved careful processing of the MCS data to precisely constrain the size of the magma chamber (10-50 m thick, -500 m wide, and 1.4 km beneath the seafloor [Kent et al., 1993], at 9ø50'N) and variations
in seismic layer 2A thickness [Harding et al., 1993].
3. Experiment
We free-fall deployed a dense array of nine OBSs on the EPR rise axis at 9ø50'N (Figure 1). The instruments recorded seismic data from March 13 to June 25, 1995 (105 days). The OBS array was designed to optimize the localization of shallow microearthquakes beneath the segment high and the high- temperature vent fields. Interelement spacings ranged from a few hundred meters to about a kilometer, and the total array aperture was -3 km. This configuration allowed us to observe seismic phases from small microearthquakes on all of the seismograms and to accurately locate shallow events within the array aperture.
Each instrument recorded continuous data from a three-
component I Hz natural period geophone (Mark Products L-4) and a hydrophone. Horizontal seismometer channels were sampled at 64 Hz, and vertical and hydrophone channels were sampled at 128 Hz. Instrument locations were determined with a shipboard acoustic survey. Two-way travel times were inverted for source and receiver locations using global positioning system

SOHN ET AL.: EPR (9ø50'N) EARTHQUAKE SURVEY 25,369
8.9xl 0 -4
-8.9xl 0 -4
• 0-4 E 8.9xl
O
0 _8.9x10-4 < 8.9x10 -4
-8.9xl 0 -4
P S W
VERTICAL
i I I
Hx
i i I
C
--•/• •'::"';•-- ' .... •
Hy I I I
2 3 4
TIME, sec
Figure 2. Sample waveforms (three-component) of microearthquakes observed during deployment. (a-c) Multiphase event with arrival times of compressional (P), shear (S), and sea surface-reflected (W) body phases.
(GPS) navigation and the joint inversion method of Creager and Dorman [1982]. Standard errors for the instrument locations were ~10m.
4. Data Analysis
We observed two types of events in the seismic record: (1) regional events from neighboring transform faults and (2) local microearthquakes. In this paper we limit our investigation to the 242 multiphase local microearthquakes observed. These events are characterized by an emergent P arrival, followed -0.5 s later by an S arrival and ~3 s later by a P arrival reflected from the sea surface (W phase) (Figure 2). The waveshapes of these events were strikingly similar on seismographs from a given station.
P, S, and W arrival times and uncertainties for individual microearthquakes were picked by hand. Arrival time uncertainties ranged from 0.01to 0.2 s, with typical values of -0.05 s. Earthquake hypocenters and errors were estimated with a three-dimensional (3-D) grid search routine [Sohn et al., 1998b]. Travel times for the grid search routine were generated by tracing rays through 2.5-D velocity models (2-D models expanded into three dimensions) of the 9ø50'N segment. Compressional and shear velocity models were generated based on the 2-D, across-axis models of Vera et al. [1990] and Crawford et al. [1999], respectively. The magma chamber and associated low-velocity zone in these models were modified to account for the improved thickness and width constraints provided by Kent et al. [1993]. These models span the rise crest from 9ø48'to 9ø52'N and from 104ø16'to 104ø19'W. Travel
times were calculated on a grid with spacings of 600 m in the horizontal and 200 m in the vertical. Finer hypocentral resolution was obtained by linearly interpolating travel times onto nodes spaced 60 m in the horizontal and 20 m in the vertical.
5. Microearthquakes
We obtained reliable hypocentral estimates for 147 of the multiphase microearthquakes with an a posteriori standard
deviation of 11 ms. The epicenters are located on the ridge axis (Figure 3a) and form two distinct clusters; a large cluster near the Bio9 and P vent black smoker fields (north group), and a smaller cluster beneath the Tube Worm Pillar and Y vent black smoker
fields (south group). Hypocenters for the localized microearthquakes are scattered throughout the upper 1.2 km of crust, with an especially dense concentration 100-200 m above the axial magma chamber (AMC) (Figure 3c). Three-dimensional error surfaces were calculated for the hypocenters using the method of Wilcock and Toomey [1991] (with corrected version of their equation 6 [cf. Sohn et al., 1998b, Appendix A]. Orthogonal error bars along the coordinate axes were calculated by determining the maximum extent of the error surfaces in the x, y, and z directions [Sohn et al., 1998b]. Average lty errors for the hypocenters are 150, 250, and 230 m in the x, y, and z directions, respectively. Seismic moments for the microearthquakes, estimated from average event spectral levels between 10 and 40 Hz [Sohn et al., 1998b], fall between 1014-1016 dyne-cm, corresponding to local magnitudes of -1_< Mr, <0 [Lee and Stewart, 1981 ].
The chronology of the north group events is markedly different than for the south group (Figure 3b). North group microearthquakes occurred in two distinct swarms, with a large, initial swarm 162 events, followed 22 days later by a smaller swarm (25 events). In contrast, the south group events occur as a fairly continuous series of low-level activity throughout the deployment.
6. Relative Relocation
The close spatial clustering of the microearthquakes and the repetitive waveforms at individual instruments (Figure 4) suggests that relative relocation techniques may improve hypocentral estimates for some events. Such techniques have been applied to subaerial microearthquake data sets [e.g., Poupinet et al., 1984; Fremont and Malone, 1987; Got et al., 1994] and have the ability to image buried faults and fractures.

25,370 SOHN ET AL.: EPR (9ø50'N) EARTHQUAKE SURVEY
9ø51 ,
9 ø 50'
9 ø 49'
9 ø 48'
-104 ø 19'
0-
E
I- n IJJ
I -
2-
-104 ø 18' -104 ø 17'
SEAFLOOR
////////
MELT lens
MAIN SECONDARY SWARM SWARM
_
:•:•:•:•:• ..........
"::•i •:•' '::
.
.: -
, : .
o
ß .
RELOCATED POSITION OF SWARM I I I I I I I I I I
3/22 4/1 4/11 4/21 5/1 5/11 5/21 5/31 6/10 6/20 DATE ( 1995 )
11 i i - 0 1
DISTANCE ACROSS AXIS, km
Figure 3. Results of grid search localization for multiphase events. (a) Event epicenters and classification of north and south groups. (b) Chronology of events versus latitude. Note swarm-like behavior of north group and continuous behavior of south group. (c) Ridge normal cross section of event hypocenters with 1 o' error bars. Melt lens location is from Kent et al. [1993].
9ø51 ,
9 ø 50'
9' 49'
9 ø 48'

SOHN ET AL.: EPR (9ø50'N) EARTHQUAKE SURVEY
EVENT WAVEFORMS
.. .
"'
I , .L .... ;.. .......... ,
• I • I • I -1 0 1 0 2 4 -1 0 1
Atp, sec TIME, sec At s, sec Figure 4. Example of event doublet during north group swarm and waveform cross-correlation method. The same event doublet is shown for each seismic station (station number shown in black circle). Note that waveforms from a given event have a different waveshape at each station but that different events generate nearly identical waveshapes at each station. Cross-correlation coefficients are calculated for both the compressional (P) and shear (S) arrivals, as shown in the boxes on either side of Figure 4. The peak of the cross-correlation function is used to determine the relative timing difference between events in a doublet.
25,371
We applied a relative relocation method [Shearer, 1997] to the north and south event groups independently. Waveform cross correlation was used both to characterize the degree of waveform similarity and to provide differential times between pairs of seismograms for correlated events. Cross correlation was performed separately for both compressional and shear arrivals, using 0.55 and 0.8 s data windows, respectively, after applying a 12-35 Hz band-pass filter to the records. Event pairs with average correlation coefficients from all stations >0.7 were considered to be doublets (819). Differential compressional and shear arrival times at each instrument were calculated by finding the peak of the cross correlation signature for each doublet. A grid of relative shear and compressional arrival times was constructed for each instrument with horizontal spacings of 70 m and vertical spacings of 53 m about the center of the swarm as determined by the 3-D grid search locations, with total dimensions of 2 x 2 x 1.5 km in the x, y, and z dimensions, respectively. The L1 norm best fit differential location of each doublet was found with a grid search method, with subgrid space precision achieved by linear
interpolation of the travel times between grid points. Finally, the set of differential locations between individual event pairs was inverted to obtain a final set of relative locations. Relative errors were estimated with a bootstrap method, and events with lateral l cr errors >100 m (11 events) were discarded.
Relocated hypocenters were obtained for 48 of the 115 north group events and 17 of the 32 south group events. Relocated hypocenters lie along vertical columns spanning -800-1100 m (north group) and 700-1100 m (south group) depth (Figure 5). Relative l cr errors for these locations are typically a few tens of meters.
7. Focal Mechanisms
Robust focal mechanism solutions require dense station coverage of the study area, and sufficient signal-to-noise ratios for unambiguous polarity observations. Achieving adequate station coverage with ocean bottom seismic experiments is problematic because of the logistical challenges associated with

25,372 SOHN ET AL.: EPR (9ø50'N) EARTHQUAKE SURVEY
a 9ø51 'N
ii M vent i 0
• B• 9
9ø50'N
9o49'N
104ø18'W 104ø17'W
0
1
2
b
7.///////////, ,
MELT lens
c -- SEAFLOOR-
•/////////
MELT lens
•) • -•1 •) 1 DISTANCE ACROSS AXIS, krn DISTANCE ACROSS AXIS, krn
Figure 5. Relative relocations. (a) Relocated epicenters. (b) Ridge normal cross section of relocated north group events with lo' error bars. Dashed box delineates lo' confidence limits for relocated groups. (c) Ridge normal cross section of relocated south group events as per Figure 5b.
deploying large numbers of ocean bottom seismic instruments. To date, focal mechanisms for earthquakes on the axis of the EPR remain unresolved because of inadequate station coverage.
Azimuthal coverage for our experiment is good, but our total number of stations (9) is too small to permit robust focal mechanism determinations. In addition, the small size of the
earthquakes makes it difficult to accurately determine the polarity of the first arrivals. Even at close range, the signal-to-noise ratio of the first break is often too small to confidently determine its sense of motion. To improve the signal-to-noise ratio of the first arrival, we applied waveform stacking techniques to similar events within the north group swarm.
Cross-correlation coefficients between swarm event pairs at individual stations commonly exceeded 0.7, and therefore it seems likely that many, if not all, of these events share a common source mechanism. Maximum correlation coefficients were
positive rather than negative for 89% of the relocated events, suggesting that the swarm events represent the repeated activation of a single source mechanism. We stacked 32 swarm events with maximum P wave correlation coefficients >0.7, and aligned the P wave arrival based on delay times determined during the relocation process.
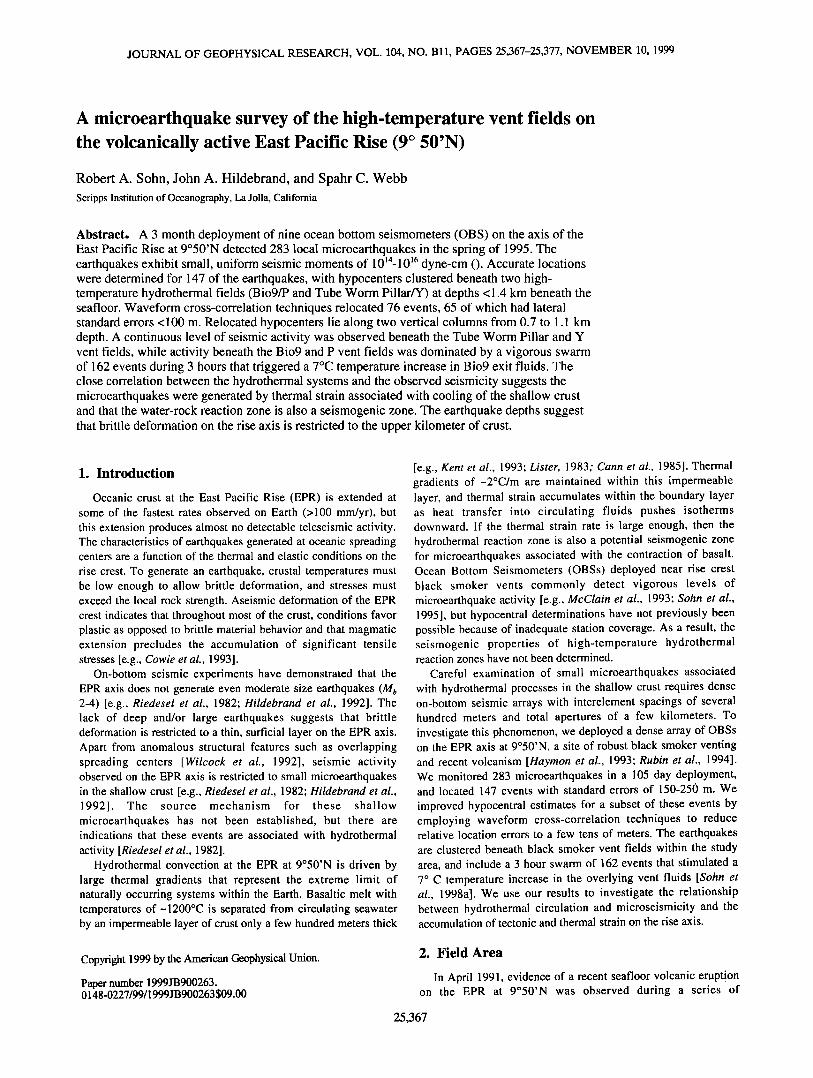
The signal-to-noise ratio of the stacked waveforms is better than that observed for single events, but the emergent character of the first arrival remains (Figure 6). For most of the stations the first arrival precedes a more impulsive and larger arrival 0.05- 0.10 s later. This waveshape is common to all of the stations and is therefore either a characteristic of the source mechanism or the
propagation path (e.g., forward scattering). First arrival polarities can be confidently determined for some,
but not all, of the stacked waveforms (Figure 6). Stations 4, 8, and 9 are clearly compressional, stations 2 and 7 are probably compressional, and stations 5 and 6 are probably dilatational. If we assume a double-couple source for the events, then the polarity picks of the stacked data are best fit by oblique normal faulting, with the axis of minimum compressive stress oriented perpendicular to the ridge strike (Figure 7). We can not discriminate the fault and auxiliary planes, but in either case the
slip vector represents a mix of normal and strike-slip faulting on a plane dipping at 60ø-70 ø to the horizontal.
The stacked polarity data do not require a double-couple source mechanism. Indeed, many microearthquakes generated within subaerial geothermal systems have significant non-double couple components [e.g., Miller et al., 1998; Foulger and Long, 1984], usually explosive/implosive components as would be expected from thermal effects. The station coverage of our study is insufficient to discriminate between double-couple and non- double-couple solutions.
8. Discussion
8.1. Hydrothermal System and Thermal Structure
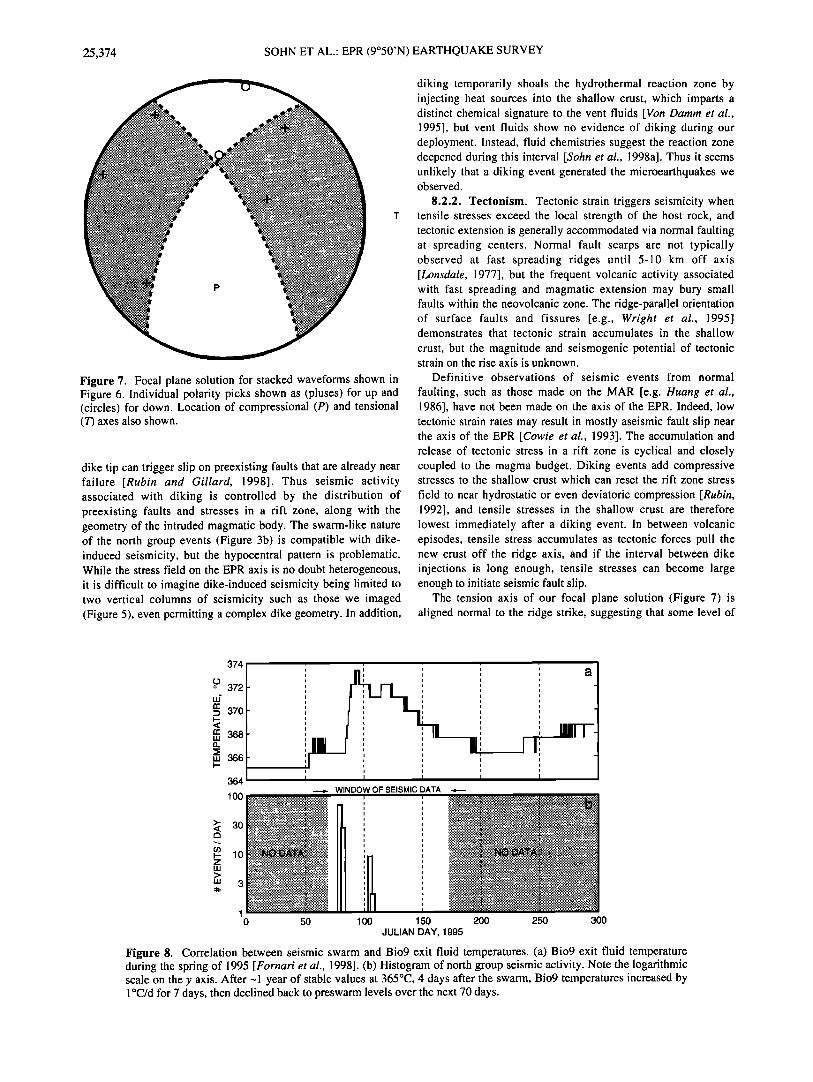
An important feature of our seismic data is the correlation between the north group seismic swarm and exit fluid temperatures from the overlying Bio9 vent. Vent fluid temperature data have been collected from the EPR black smoker vents at 9ø50'N since December 1993 [Fornari et al., 1998]. Bio9 vent fluid temperatures, measured with an accuracy of + IøC, were relatively stable at-365ø-366øC for nearly a year prior to our OBS deployment. On March 26, 1995, four days after the north group seismic swarm, vent fluid temperatures at Bio9 began to rise at a rate of--.løC/day for 7 days (Figure 8) [Fornari et al., 1998]. After reaching a maximum of 373øC, fluid temperatures gradually decayed back to just above preswarm levels over the next 70 days. After these fluctuations, Bio9 vent fluids entered a period of gradual increase, rising back to 373øC by the end of 1997.
The correlation between the seismic swarm and the Bio9 fluid
temperature anomaly links the earthquakes to the high- temperature hydrothermal system [Sohn et al., 1998a]. Since the small microearthquakes we observed do not generate significant amounts of heat in and of themselves, increased hydrothermal fluid temperatures most likely result from perturbations to the circulation system permeability structure. The pressure, temperature, and permeability of the water-rock reaction zone
SOHN ET AL.: EPR (9ø50'N) EARTHQUAKE SURVEY 25,373
3.0
2.5
2.0
1.5
1.0
O D
O U
z 1.o <•
n' •t D
0.5
1.0
0.5
I I
0 seconds 1 Reduced time (t- x/6.8 km/s)
Figure 6. Stacked waveform section from north group swarm. Polarity picks at each seismic station (station number shown in black circle) shown for down (D), and up (U).
control the temperature and chemistry of hydrothermal exit fluids, and a sudden permeability increase in this region could generate an exit fluid temperature anomaly by exposing fresh, hot rock to circulating fluids. The north group swarm that triggered the Bio9 temperature anomaly was located 0.8-1.1 km beneath the seafloor (Figure 5b), placing it within the range of possible reaction zone depths as determined by silica geobarometry during the time of our OBS deployment (K.L. Von Damm et al., manuscript in preparation, 1999)
Vigorous high-temperature venting at 9ø50'N has continued for >7 years following the eruptions of 1991 and 1992 [Fornari et al., 1998]. Sustained heat flow over this period requires either a thin (< 100 m) boundary layer between circulating fluids and the AMC or active heat extraction from hot rock overlying the AMC [Lister, 1974; Cann et al., 1985; Wilcock and Delaney, 1996]. The temperature anomaly associated with the seismic swarm we observed suggests that penetration of fluids into the thermal boundary layer is a viable mechanism for heat transfer within the high-temperature systems on the EPR.
The depth range of the microearthquakes we observed suggests that brittle material behavior on the EPR axis is restricted to the -1 km thick surficial layer that has been cooled by hydrothermal fluids, thereby precluding the generation of large earthquakes on the rise axis. This model is in marked contrast to earthquake data from the slow spreading (-40 mm/yr) Mid-Atlantic Ridge (MAR). On the MAR, hypocentral depths
extend to 6-8 km [e.g. Kong et al., 1992; Wolfe et al., 1995], indicating that brittle material behavior extends throughout the entire crustal layer on the rise axis. A thick column of brittle crust on the MAR also permits the generation of large, teleseismic events on the rise axis, many of which are caused by normal fault slip in response to amagmatic extension [e.g., Huang et al., 1986].
8.2. Microearthquake Sources
The shallow crust on the EPR is host to a number of dynamic processes that can generate microearthquakes. Each of these sources has defining characteristics that we use to assess their compatibility with our seismic data. In particular, we examine the possible roles that diking, tectonic faulting, and thermal strain might have in generating the microearthquake activity we observed.
8.2.1. Diking. Diking events in a rift zone can generate seismic events associated with the propagating dike tip [Rubin and Gillard, 1998] and the stress perturbation associated with the injection of a magma into host rock [Rubin, 1992]. These types of events are commonly observed in subaerial volcanic settings such as Kilauea and Iceland [e.g., Klein et al., 1987; Einarsson, 1991] and have recently been detected via hydroacoustic methods at oceanic spreading centers [e.g., Dziak et al., 1995].
Diking by itself is unlikely to generate shear failure in previously intact rock, but the tensile stress perturbation near the
25,374 SOHN ET AL.: EPR (9ø50'N) EARTHQUAKE SURVEY
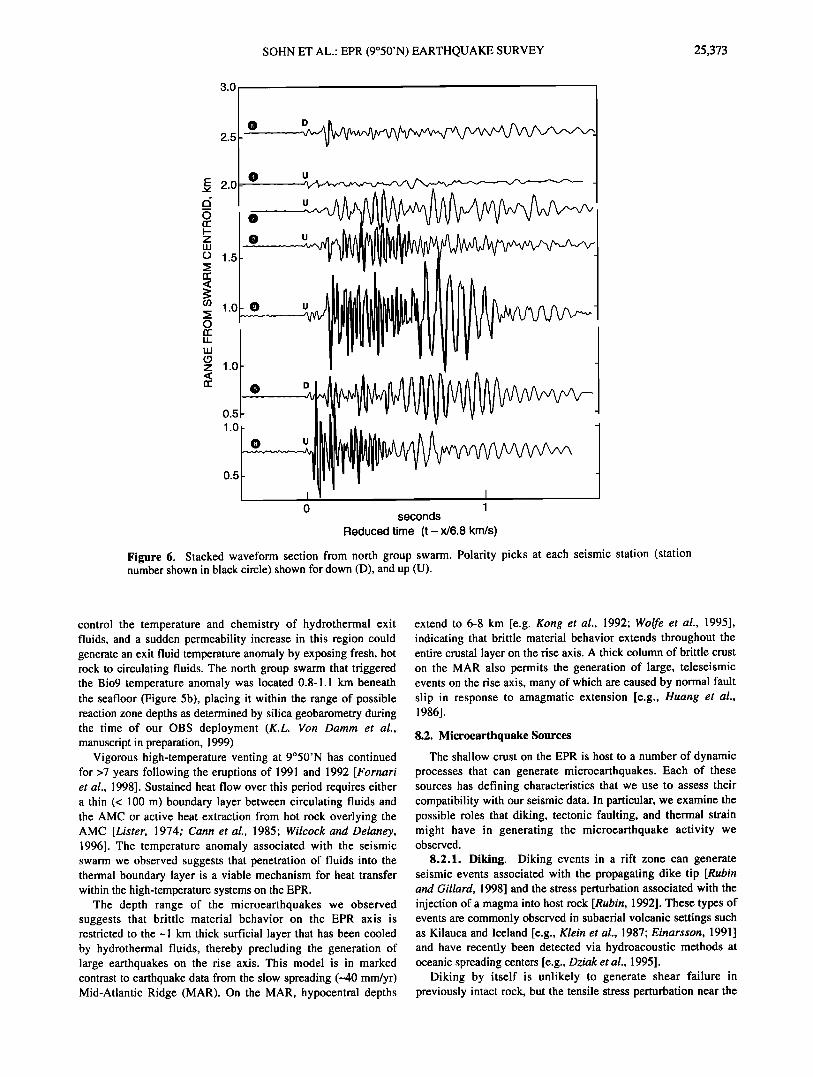
Figure 7. Focal plane solution for stacked waveforms shown in Figure 6. Individual polarity picks shown as (pluses) for up and (circles) for down. Location of compressional (P) and tensional (T) axes also shown.
dike tip can trigger slip on preexisting faults that are already near failure [Rubin and Gillard, 1998]. Thus seismic activity associated with diking is controlled by the distribution of preexisting faults and stresses in a rift zone, along with the geometry of the intruded magmatic body. The swarm-like nature of the north group events (Figure 3b) is compatible with dike- induced seismicity, but the hypocentral pattern is problematic. While the stress field on the EPR axis is no doubt heterogeneous, it is difficult to imagine dike-induced seismicity being limited to two vertical columns of seismicity such as those we imaged (Figure 5), even permitting a complex dike geometry. In addition,
diking temporarily shoals the hydrothermal reaction zone by injecting heat sources into the shallow crust, which imparts a distinct chemical signature to the vent fluids [Von Damm et al., 1995], but vent fluids show no evidence of diking during our deployment. Instead, fluid chemistries suggest the reaction zone deepened during this interval [Sohn et al., 1998a]. Thus it seems unlikely that a diking event generated the microearthquakes we observed.
8.2.2. Tectonism. Tectonic strain triggers seismicity when tensile stresses exceed the local strength of the host rock, and tectonic extension is generally accommodated via normal faulting at spreading centers. Normal fault scarps are not typically observed at fast spreading ridges until 5-10 km off axis [Lonsdale, 1977], but the frequent volcanic activity associated with fast spreading and magmatic extension may bury small faults within the neovolcanic zone. The ridge-parallel orientation of surface faults and fissures [e.g., Wright et al., 1995] demonstrates that tectonic strain accumulates in the shallow
crust, but the magnitude and seismogenic potential of tectonic strain on the rise axis is unknown.
Definitive observations of seismic events from normal
faulting, such as those made on the MAR [e.g. Huang et al., 1986], have not been made on the axis of the EPR. Indeed, low tectonic strain rates may result in mostly aseismic fault slip near the axis of the EPR [Cowie et al., 1993]. The accumulation and release of tectonic stress in a rift zone is cyclical and closely coupled to the magma budget. Diking events add compressive stresses to the shallow crust which can reset the rift zone stress
field to near hydrostatic or even deviatoric compression [Rubin, 1992], and tensile stresses in the shallow crust are therefore lowest immediately after a diking event. In between volcanic episodes, tensile stress accumulates as tectonic forces pull the new crust off the ridge axis, and if the interval between dike injections is long enough, tensile stresses can become large enough to initiate seismic fault slip.
The tension axis of our focal plane solution (Figure 7) is aligned normal to the ridge strike, suggesting that some level of
374
o 372
• 370
a:: 368
LU 366
364
IO0
>' 30
•- 10 z
LU 3
1 0
,r
)ATA ! ::::::::::::::::::::::::::::::::::::::::::::: :: :: ::::::::::::::::::::::::::: :: •::: :•:•: :•:::•: :•: :•: ::::•: :•:•:::• •:•:•:•:•:•:•:•:• • • • :•:::• • ::•:::
.......................................... :::: :!i::'-':•.-':•:??'":---':i-..::•..?':'•'-- •.....:'•iii :.:.:.•:.-:•-:-:--...'.--:...:-.'-:•....:"-:-.::•i :i:: :!:!:: :':'-"..../-'i..-'•:' .:.:..'.•::...•::.:•:-::•:->:•i i i •':':-'..::.•.•:.:::•i! !i! !i:.•i !:.-'..:!•
i:•:•:•:•:• ":5 ....... •:•:' ' '" '.'. "•' '::.::• .:•'. •:•!•:•::.:?.•:•:: :['"'"... :T•D:•:•::::::.::.::.:i:::. ::' •::•:S::
150 200 250 300
JULIAN DAY, 1995
Figure 8. Correlation between seismic swarm and Bio9 exit fluid temperatures. (a) Bio9 exit fluid temperature during the spring of 1995 [Fornari et al., 1998]. (b) Histogram of north group seismic activity. Note the logarithmic scale on the y axis. After ---1 year of stable values at 365øC, 4 days after the swarm, Bio9 temperatures increased by 1 øC/d for 7 days, then declined back to preswarm levels over the next 70 days.

SOHN ET AL.: EPR (9ø50'N) EARTHQUAKE SURVEY 25,375
tectonic strain had accumulated on the rise axis by the time of our study. However, relocated hypocenters for both the north and south group events form vertical seismic patterns (Figure 5) that are not easily explained by tectonic extension. In addition, we can not explain the spatial correlation between the event clusters and the seafloor black smoker systems (Figure 5a) in the context of a tectonic source mechanism. Tectonic effects are more difficult to
decouple from our data than diking and intrusion, but the earthquakes we observed are not compatible with simple tectonic extension and graben formation.
8.2.3. Thermal strain. Thermal stresses can trigger
microearthquakes via contraction as hot rock is cooled [e.g., Chouet, 1979] or via hydrofracturing when trapped pockets of fluid are heated [e.g., Knapp and Knight, 1977]. Thermal gradients in the reaction zone of a hydrothermal system on a fast spreading ridge are among the largest known in the Earth, with levels exceeding 1.5øC/m (based on a melt lens temperature of 1200øC, a reaction zone temperature of 450øC, and a boundary layer thickness < 500 m). The thermal strain rate from hydrothermal cooling can be written as [Archer et al., 1996]
o•H • =• , (•)
LhlpCp
where or is the crustal thermal expansion coefficient (8x10 '6/K), H is the hydrothermal heat flux (W/m2), Lhtis the thickness of the heat source layer (m), pis crustal density (2800 kg/m-•), and Cp is the specific heat capacity of the crust (1000 J/kg K). The dependence of thermal strain rate on heat flux is problematic since fluxes for rise crest hydrothermal systems are not well constrained. Estimates for individual black smokers range from 0.1to 100 MW [Ginster et al., 1994], but a large portion of the heat at rise crests may be advected by diffuse rather than focused flow [Schultz et al., 1992]. We can estimate a lower bound for heat flow in our area by assuming purely conductive heat flow across the thermal boundary layer. If we assume a 300 m thick boundary layer Lt, t above the AMC with a temperature difference of 750øC (1200øC magma minus 450øC reaction zone) then we estimate the conductive heat flow
KAT H = • (2)
Lbl
the hydrothermal system in between magmatic episodes. Our thermal strain rate estimates are 3-4 orders of magnitude larger than the seismic strain rate of 4 x 10 '9/yr estimated for the EPR rise axis by Cowie et al. [1993]. While Cowie's estimate is also based on simplifying assumptions, comparison of the thermal and seismic strain rate estimates suggests that thermal stresses may be dominant in our study area and on the axes of fast spreading ridges, in general.
The relocated events are clustered beneath high-temperature vent fields and appear to be located within the reaction zone of the local circulation systems. This places the earthquakes within the most thermally stressed portion of the crust. We note that the seismic moments of the microearthquakes are nearly identical to those observed as a magma body cooled at Kilauea [Chouet• 1979] and that the repeatable waveforms are compatible with the activation of a single source mechanism (e.g., the opening of tensile cracks as the crust is cooled past its rigidus).
The vertical alignment of the swarm above the edge of the AMC suggests the possibility that the swarm may have resulted from subsidence of the local magma chamber lid (Figure 9). Thermal contraction within the AMC would elevate normal
stresses across vertical faults above the AMC margins. Small microearthquake swarms such as we observed could then occur when the lid displacement was large enough to bring the normal stresses to the strength limit of the vertical faults. The strain induced by subsidence of the AMC lid would be greatest in the basal dikes where our swarm events are located. Vertical slip surfaces similar to those we envision for this scenario have been
observed in ophiolite sheeted dike sections [Rosencrantz, 1983]. Thermal effects appear to limit the size of earthquakes in our
study area in two ways. First, high crustal temperatures arising from large magmatic heat fluxes limit brittle material behavior to the upper kilometer of crust on the rise axis. The restriction of seismic activity to the shallowest crust precludes fault slip along large surfaces and hence the generation of teleseismic and even small size (M•, > 1) events. Second, even within the brittle crust the accumulation of significant tectonic strain is inhibited by frequent magmatic intrusions, and by the continual release of tectonic strain via small, thermally triggered events near the base of the circulation system. In this model the hydrothermal reaction zone is a seismogenic zone for small microearthquakes associated with the thermal contraction of basalt.
to be 7.25 W/m 2 (K is the thermal conductivity of basalt, equal to 2.9 W/m K). If the system is quasi steady state and all the heat flowing across the boundary layer originates from within the AMC, then the thickness of the heat source layer Lh• is the thickness of the melt lens (-100 m [e.g., Kent et al., 1993]). This scenario results in a thermal strain rate estimate of 6.35 x 10 '6/yr for the rise axis at 9ø50'N. If the thermal boundary layer is 100 m thick, then conductive heat flow is estimated to be 21.75 W/m 2, and the thermal strain rate is 1.96 x 10 '5/yr.
These calculations rely on the simplifying assumption that heat flow is purely conductive from a thin magma chamber. Since we are looking for a conservative (i.e., lower bound) estimate of thermal strain, we ignore active heat extraction resulting from fluid penetration into the boundary layer above the AMC [e.g., Lister 1974] because it is difficult to quantify and because it will only increase our heat flow estimate. The calculations assume a closed system such that heat does not enter the magma chamber from below, nor does heat escape laterally out the sides of the chamber. Despite these limitations, the calculations provide an estimate of thermal strain at the base of
9. Summary and Conclusions
At 9ø50'N on the EPR, a site of recent magmatic and vigorous hydrothermal activity, we located 147 microearthquakes with mean errors of 150-250 m. We relocated 65 of these events with
relative errors of a few tens of meters and found them to lie along two vertical columns beneath hydrothermal vent fields. These earthquakes are located above the AMC as imaged in 1987, and all of the relocated events are clustered between 0.7 and 1.1 km
depth. All of the earthquakes observed during our deployment are extremely small and of uniform size (M o = 10•4-10 •6 c[yne-cm). The primary swarm observed during our experiment triggered a 7øC thermal anomaly in the Bio9 exit fluid temperatures that lasted 70 days. Steady levels of seismic activity were observed beneath the Tube Worm Pillar and Y vent fields.
Microearthquake activity at 9ø50'N in the spring of 1995 appears to have been related to thermal stresses arising within the shallow crust near the base of the hydrothermal system. The microearthquakes appear to have been generated within the hydrothermal reaction zone, located at 0.7-1.1 km depth during

25,376 SOHN ET AL.: EPR (9ø50'N) EARTHQUAKE SURVEY
_
_
E v E
BRITTLE
HYDRO CIRCULATION
ß
•k HEAT TRANSFER TO FLUIDS
PLASTIC
GABBROS
a
EXTRUSIVES .f" •
..................
l• VERTICAL COLUMN BRITTLE • OF EARTHQUAKES
PLASTIC
GABBROS
b
W EXTRUSiVE'"-'--•• .i•i/' .•
GABBROS
Figure 9. Interpretation of seismic swarm beneath Bio9 high-temperature vent field. Sections in all plots are oriented across the rise axis from west to east. Location of brittle/plastic transition inferred from temperature profile of Figure 8. (a) Magma chamber cools and contracts (e.g. melt to mush) as hydrothermal convection removes heat. (b) Differential contraction generates slip along vertical fault over west margin of axial magma chamber (AMC). (c) Hydrothermal fluids rapidly penetrate new fractures and extract heat from fresh rock. Exit fluid temperatures in Bio9 vent temporarily increase.
E -0
-1
-2
this time. Our results suggest that thermal effects prevent the accumulation of large tectonic stresses within the brittle layer on the rise axis and that brittle deformation is restricted to the upper kilometer of crust.
Acknowledgments. The authors thank Jacques Lemire and Tom Deaton for engineering support on the experiment, Peter Shearer and Luciana Astiz for help with earthquake relocations, Justin Caballero for assistance screening the data, and Jo Griffith for artwork. The manuscript benefited from reviews provided by Margaret Tivey, Yang Shen, and Robert Detrick. This work was supported in part by the U.S. National Science Foundation.
References
Archer, S. D., W. S. D. Wilcock, and G. M. Purdy, Microearthquake activity associated with hydrothermal circulation on the Endeavour segment of the Juan de Fuca Ridge (abstract), Eos Trans. AGU, 77(46), Fall Meet. Suppl., 727, 1996.
Baker, E. T., G. J. Massoth, R. A. Feely, G. A. Cannon, and R. E. Thomson, The rise and fall of the CoAxial hydrothermal site, 1993- 1996, J. Geophys. Res., 103, 9791-9806, 1998.
Butterfield, D. A., I. R. Jonasson, G. J. Massoth, R. A. Feely, K. K. Roe, R. E. Embley, J. F. Holden, R. E. McDuff, M.D. Lilley, and J. R. Delaney, Seafloor eruptions and evolution of hydrothermal fluid chemistry, Philos. Trans. R. Soc. Lond., Ser. A, 355, 369-386, 1997.
Cann, J. R., M. R. Strens, and A. Rice, A simple magma-driven thermal balance model for the formation of volcanogenic massive sulfides, Earth Planet. Sci. Lett., 76, 123-134, 1985.
Chouet, B., Sources of seismic events in the cooling lava lake of Kilauea Iki, Hawaii, J. Geophys. Res., 84, 2315-2330, 1979. Cowie, P. A., C. H. Scholz, M. Edwards, and A. Malinverno, Fault strain and seismic coupling on mid-ocean ridges, J. Geophys. Res., 98, 17,911 - 17,920, 1993.
Crawford, W. C., S. C. Webb, and J. A. Hildebrand, Constraints on melt in the lower crust and Moho at the East Pacific Rise, 9ø48'N, using seafloor compliance measurements, J. Geophys. Res., 104, 2923-2940, 1999.
Creager, K. C., and L. M. Dorman, Location of instruments on the seafloor by joint adjustment of instrument and ship positions, J. Geophys. Res., 87, 8379-8387, 1982.
Detrick, R. S., P. Buhl, E. Vera, J. C. Mutter, J. Orcutt, J. Madsen, and T. Brocher, Multi-channel seismic imaging of a crustal magma chamber along the East Pacific Rise, Nature, 326, 35-41, 1987.
Dziak, R. P., C. G. Fox, and A. E. Schreiner, The June-July 1993 seismo- acoustic event at CoAxial segment, Juan de Fuca Ridge: Evidence for a lateral dike injection, Geophys. Res. Lett., 22, 135-138, 1995.
Einarsson, P., Earthquakes and present-day tectonism in Iceland, Tectonophysics, 189, 261-279, 1991.
Fornari, D. J., T. Shank, K. L. Von Damm, T. K. P. Gregg, M. Lilley, G. Levai, A. Bray, R. M. Haymon, M. R. Perfit, and R. Lutz, Time-series temperature measurements at high-temperature hydrothermal vents: East Pacific Rise 9ø49'N to 9ø51'N: Monitoring dike intrusion and crustal cracking events, Earth Planet. Sci. Lett., 160, 419-431, 1998.
Foulget, G. R., and R. E. Long, Anomalous focal mechanism solutions: Evidence for tensile crack formation on an accreting plate boundary, Nature, 310, 43-45, 1984.
Fremont, M. J., and S. D. Malone, High precision relative locations of earthquakes at Mount St. Helens, Washington, J. Geophys. Res., 92, 10,223-10,236, 1987.
Ginster, U., M. J. Mottl, and R. P. Von Herzen, Heat flux from black smokers on the Endeavour and Cleft segments, Juan de Fuca Ridge, J. Geophys. Res., 99, 4937-4950, 1994.
Got, J. L., J. Frechet, and F. Klein, Deep fault plane geometry inferred from multiplet relative relocation beneath the south flank of Kilauea, J. Geophys. Res., 99, 15,375-15,386, 1994.
Harding, A. J., G. M. Kent, and J. A. Orcutt, A multichannel seismic investigation of upper crustal structure at 9øN on the East Pacific Rise: Implications for crustal accretion, J. Geophys. Res., 98, 13,925- 13,944, 1993.
Haymon, R. M., D. J. Fornari, M. H. Edwards, S. Carbotte, D. Wright, and K. C. Macdonald, Hydrothermal vent distribution along the East Pacific Rise crest (9ø09'-54'N) and its relationship to magmatic and tectonic processes on fast-spreading mid-ocean ridges, Earth Planet. Sci. Lett., 104, 513-534, 1991.
Haymon, R. M., et al., Volcanic eruption of the mid-ocean ridge along the East Pacific Rise crest at 9ø45-52'N: Direct submersible observations
of seafloor phenomena associated with an eruption event in April, 1991, Earth Planet. Sci. Lett., 119, 85-101, 1993.
Herron, T. J., P. L. Stoffa, and P. Buhl, Magma chamber and mantle reflections: East Pacific Rise, Geophys. Res. Lett., 7, 989-992, 1980.
Hildebrand, J. A., S.C. Webb. L. M. Dorman, A. E. Schreiner, M. A. McDonald, and W. C. Crawford, Microseismicity of a mid-ocean

SOHN ET AL.: EPR (9ø50'N) EARTHQUAKE SURVEY 25,377
ridge volcanic eruption: The East Pacific Rise at 9ø50'N (abstract), Eos Trans. AGU, 73, Fall Meet. Suppl., 530, 1992.
Huang, P. Y., S. C. Solomon, E. A. Bergman, and J. L. Nabelek, Focal depths and mechanisms of Mid-Atlantic Ridge earthquakes from body waveform inversion, J. Geophys. Res., 91,579-598, 1986.
Kent, G. M., A. J. Harding, and J. A. Orcutt, Distribution of magma beneath the East Pacific Rise between the Clipperton Transform and 9 ø 17'N Deval from forward modeling of common depth point data, J. Geophys. Res., 98, 13,945-13,969, 1993.
Klein, F. W., R. Y. Koyanagi, J. S. Nakata, and W. R. Tanigawa, The seismicity of Kilauea's magma system, U.S. Geol. Surv. Pro. l'i Pap., 1350, 1019-1186, 1987.
Knapp, R. B., and J. E. Knight, Differential thermal expansion of pore fluids: Fracture propagation and microearthquake production in hot pluton environments, J. Geophys. Res., 82, 2515-2522, 1977.
Kong, L. S. L., S. C. Solomon, and G. M. Purdy, Microearthquake characteristics of a mid-ocean ridge along-axis high, J• Geophys. Res., 97, 1659-1685, 1992.
Lee, W. H. K., and S. W. Stewart, Principles and Applications of Mictvearthquake Networks, Academic, San Diego, Calif., 1981.
Lister, C. R. B., On the penetration of water into hot rock, Geophys. J. R. Astrono Sot.. 39, 465-509, 1974.
Lister, C. R. B., The basic physics of water penetration into hot rocks. in Hydrothermal Processes at Seafloor Spreading Centers, edited by P. A. Rona, et al., pp. 141-168, Plenum, New York, 1983.
Lonsdale, P., Structural geomorphology of a fast-spreading rise crest: The East Pacific Rise near 3025 'S, Mat'. Geophys. Res., 3, 251-293, 1977.
McClain, J. S., M. L. Begnaud, M. A. Wright, J. Fondrk, and G. K. Von Damm, Seismicity and tremor in a submarine hydrothermal field: The Northern Juan de Fuca Ridge, Geophys. Res. Lett., 20, 1883-1886, 1993.
Miller, A.D., B. R. Julian, and G. R. Foulger, Three-dimensional seismic structure and moment tensors of non-double-couple earthquakes at the Hengill-Grensdalur volcanic complex, Iceland, Geophys. J. lat., 133, 309-325, 1998.
Orcutt, J. A., B. L. N. Kennett, L. M. Dorman, and W. Prothero, A low velocity zone underlying a fast-spreading rise crest, Nature, 256, 475- 476, 1975.
Poupinet, G., W. L. Ellsworth, and J. Frechet, Monitoring velocity variations in the crust using earthquake doublets: An application to the Calaveras fault, California, J. Geophys. Res., 89, 5719-5731, 1984.
Riedesel, M., J. A. Orcutt, K. C. Macdonald, and J. S. McClain, Microearthquakes in the black smoker hydrothermal field, East Pacific Rise at 21 øN, J. Geophys. Res., 87, 10,613-10,623, 1982.
Rosencrantz, E., The structure of sheeted dikes and associated rocks in
North Arm Massif, Bay of Islands ophiolite complex, and the intrusive process at oceanic spreading centers, Can. J. Earth Sci., 20, 787-801, 1983.
Rosendahl, B. R., R. W. Raitt, L. M. Dorman, L. D. Bibee, D. M. Hussong, and G. H. Sutton, Evolution of oceanic crust, 1, A physical model of the East Pacific Rise crest derived from seismic refraction
data, J. Geophys. Res., 81, 5294-5304, 1976. Rubin, A.M., Dike-induced faulting and graben subsidence in volcanic
rift zones, J. Geophys. Res., 97, 1839-1858, 1992.
Rubin, A.M., and D. Gillard, Dike-induced earthquakes: Theoretical considerations, J. Geophys. Res., 103, 10,017-10,030, 1998.
Rubin, K. H., J. D. Macdougall, and M. R. Perfit, 2mpo-21øpb dating of recent volcanic eruptions on the seafloor, Nature, 368, 841-844, 1994.
Schultz, A., J. R. Delaney, and R. E. McDuff, On the partitioning of heat flux between diffuse and point source seafloor venting, J. Geophys. Res., 97, 12,299-12,314, 1992.
Shearer, P.M., Improving local earthquake locations usinig the L I norm and waveform cross correlation: Application to the Whittier Narrows. California, aftershock sequence, J. Geophys. Res., 102, 8269-8283, 1997.
Sohn, R. A., J. A. Hildebrand, S.C. Webb, and C. G. Fox, Hydrothermal microseismicity at the Megaplume site on the southern Juan de Fuca Ridge, Bull Seis. Soc. Atn.• 85, 775-786, 1995o
Sohn, R. A., D. J. Fornari, K. L. Von Damm, J. A. Hildebrand, and S. C. Webb. Seismic and hydrothermal evidence for a cracking event on the East Pacific Rise crest at 9ø50'N, Nature, 396, 159-161, 1998a.
Sohn, R. A., J. A. Hildebrand, and S.C. Webb, Postrifting seismicity and a model for the 1993 diking event on the CoAxial segment, Juan de Fuca Ridge, J. Geophys. Res., 103, 9867-9877, 1998b.
Vera, E. E., J. C. Mutter, P. Buhl, J. A. Orcutt, A. J. Harding, M. E. Kappus, R. S. Derrick, and T. M. Brocher, The structure of 0- to 0.2- m.y.-old oceanic crust at 9øN on the East Pacific Rise from expanded spread profiles, J. Geophys. Res., 95, 15,529-15,556, 1990.
Von Damm, K. L, S. E. Oosting, R. Kozlowski, L. G. Buttermore, D.C. Colodner, H. N. Edmonds, J. M. Edmond, and J. M. Grebmeier, Evolution of East Pacific Rise hydrothermal vent fluids following a volcanic eruption, Nature, 375, 47-50, 1995.
Wilcock, W. S. D., and J. R. Delaney, Mid-ocean ridge sulfide deposits: Evidence for heat extraction from magma chambers or cracking fronts?, Earth Planet. Sci. Lett., 145, 49-64, 1996.
Wilcock, W. S. D., and D. R. Toomey, Estimating hypocentral uncertainties for marine microearthquake surveys: A comparison of the generalized inverse and grid search methods, Mar. Geophys. Res., 13, 161-171, 1991.
Wilcock, W. S. D., G. M. Purdy, S. C. Solomon, D. L. Dubois, and D. R. Toomey, Microearthquakes on and near the East Pacific Rise, 9 ø- 10øN, Geophys. Res. Lett., 19, 2121-2134, 1992.
Wolfe, C. J., G. M. Purdy, D. R. Toomey, and S.C. Solomon, Microearthquake characteristics and crustal velocity structure at 29øN on the Mid-Atlantic Ridge: The architecture of a slow spreading segment, J. Geophys. Res., 100, 24,449-24,472, 1995.
Wright, D. J., R. M. Haymon, and K. C. MacDonald, Breaking new ground: Estimates of crack depth along the axial zone of the East Pacific Rise (9ø12'-54'N), Earth Planet. Sci. Lett., 134, 441-457, 1995.
J. A. Hildebrand, R. A. Sohn, and S.C. Webb, Scripps Institution of Oceanography, 8602 La Jolla Shores Drive, La Jolla, CA 92093. (rsohn @ucsd.edu)
(Received October 15, 1998; revised May 28, 1999; accepted July 30, 1999.)