A METHOD FOR EVALUATING EXTERNAL SHADING DEVICE INFLUENCES ON ZONE GAINS BY ENERGYPLUS SIMULATION...
8
A METHOD FOR EVALUATING EXTERNAL SHADING DEVICE INFLUENCES ON ZONE GAINS BY ENERGYPLUS SIMULATION PROGRAMME Neslihan Türkmenoğlu Bayraktar 1 , Vildan Ok 1 1Faculty of Architecture, Istanbul Technical University, Istanbul, Turkey ABSTRACT Shading devices used to protect from unwanted solar radiation acting on interior surfaces change air velocity and volume flow rates depending on their geometry and position on the building exterior. Changes in volume flow rates, interior velocities and the amount of solar radiation can be advantageous or disadvantageous depending on the time of day. The goal of this study was to determine the efficiency of different shading devices using the Energyplus programme by comparing their effect on zone gains and losses with convection, sensible gains in the zone, losses from ventilation and zone gains from windows through specific time intervals. INTRODUCTION Shading devices can be designed curved, slat-type egg crate in form and with a position of parallel or perpendicular to the wall. They can be made from glass, metal, concrete, wood or plastic materials. Their purpose is to obstruct the effects of direct solar radiation and reduce heat transfer between the environment and the building in which heat gain should avoided to ensure comfortable conditions during the hottest time of the year (Givoni, 1998; Guillemin and Molteni, 2002; Foster and Oreszczyn, 2001). Zone heat gains from windows and gains from surfaces due to convection differ according to the effect of different amounts of shaded areas created by the shading devices on opaque and transparent interior and outside surfaces, depending on the time of day. Zone heat gains from ventilation and heat gain from surfaces due to forced convection change depending on the effects of shading devices designed for building exteriors during the hours when natural ventilation is advantageous or disadvantageous in the summer. In addition to the effects of the aforementioned gain components, different amounts of cooling loads occur with different types of methods of attaching shading devices at different time intervals during the day. This paper presents findings regarding the determination of gain components and stages calculated with the Energyplus simulation programme whereby cooling load calculations had been made with various shading devices attached when the window was open or closed. METHODOLOGY This paper analyses the use of Energyplus simulation tools for evaluating the effects of different types of shading devices on specific zone heat gain components by comparing their solar radiation and airflow penetration with zone gains due to convection from surfaces, sensible gains due to ventilation and window gains. The Energyplus simulation evaluates the effectiveness of shading devices by means of the following stages: • Analyzing the limitations of Energyplus in cooling load calculations with consideration for the effects of shading devices on airflow and solar radiation. • Describing the building and types of shading devices, the position of the windows and when the shading device is attached. • Obtaining Energyplus input data for simulating zone ventilation and convection gains. This stage involves calculating volume flow rates from pressure and velocity measurements obtained by experimental work carried out in a wind tunnel, and calculating user defined convection coefficients with the expression given by Dreyfus (1960), in which velocity measurements obtained near the interior surface of the model are used (Ok, et al. 2008 1 , Ok, et al. 2008 2 , Bayraktar, 2008). • Obtaining reports for sensible heat gain in the zone due to ventilation, zone heat gain from windows and zone heat gain from interior surfaces by convection. • Comparing daily changes of sensible heat gain in the zone due to ventilation, zone heat gain from windows and zone heat gain from interior surfaces due to convection when the shading device is attached and the window is open or closed, or with no shading device attached when the window is open or closed. Eleventh International IBPSA Conference Glasgow, Scotland July 27-30, 2009 - 984 -
-
Upload
independent -
Category
Documents
-
view
0 -
download
0
Transcript of A METHOD FOR EVALUATING EXTERNAL SHADING DEVICE INFLUENCES ON ZONE GAINS BY ENERGYPLUS SIMULATION...
A METHOD FOR EVALUATING EXTERNAL SHADING DEVICE INFLUENCES
ON ZONE GAINS BY ENERGYPLUS SIMULATION PROGRAMME
Neslihan Türkmenoğlu Bayraktar1, Vildan Ok1
1Faculty of Architecture, Istanbul Technical University, Istanbul, Turkey
ABSTRACT
Shading devices used to protect from unwanted solar radiation acting on interior surfaces change air velocity and volume flow rates depending on their geometry and position on the building exterior. Changes in volume flow rates, interior velocities and the amount of solar radiation can be advantageous or disadvantageous depending on the time of day.
The goal of this study was to determine the efficiency of different shading devices using the Energyplus programme by comparing their effect on zone gains and losses with convection, sensible gains in the zone, losses from ventilation and zone gains from windows through specific time intervals.
INTRODUCTION Shading devices can be designed curved, slat-type egg crate in form and with a position of parallel or perpendicular to the wall. They can be made from glass, metal, concrete, wood or plastic materials. Their purpose is to obstruct the effects of direct solar radiation and reduce heat transfer between the environment and the building in which heat gain should avoided to ensure comfortable conditions during the hottest time of the year (Givoni, 1998; Guillemin and Molteni, 2002; Foster and Oreszczyn, 2001).
Zone heat gains from windows and gains from surfaces due to convection differ according to the effect of different amounts of shaded areas created by the shading devices on opaque and transparent interior and outside surfaces, depending on the time of day.
Zone heat gains from ventilation and heat gain from surfaces due to forced convection change depending on the effects of shading devices designed for building exteriors during the hours when natural ventilation is advantageous or disadvantageous in the summer. In addition to the effects of the aforementioned gain components, different amounts of cooling loads occur with different types of methods of attaching shading devices at different time intervals during the day. This paper presents findings regarding the determination of gain components and stages calculated with the Energyplus simulation programme whereby cooling
load calculations had been made with various shading devices attached when the window was open or closed.
METHODOLOGY This paper analyses the use of Energyplus simulation tools for evaluating the effects of different types of shading devices on specific zone heat gain components by comparing their solar radiation and airflow penetration with zone gains due to convection from surfaces, sensible gains due to ventilation and window gains. The Energyplus simulation evaluates the effectiveness of shading devices by means of the following stages:
• Analyzing the limitations of Energyplus in cooling load calculations with consideration for the effects of shading devices on airflow and solar radiation.
• Describing the building and types of shading devices, the position of the windows and when the shading device is attached.
• Obtaining Energyplus input data for simulating zone ventilation and convection gains. This stage involves calculating volume flow rates from pressure and velocity measurements obtained by experimental work carried out in a wind tunnel, and calculating user defined convection coefficients with the expression given by Dreyfus (1960), in which velocity measurements obtained near the interior surface of the model are used (Ok, et al. 20081 , Ok, et al. 20082, Bayraktar, 2008).
• Obtaining reports for sensible heat gain in the zone due to ventilation, zone heat gain from windows and zone heat gain from interior surfaces by convection.
• Comparing daily changes of sensible heat gain in the zone due to ventilation, zone heat gain from windows and zone heat gain from interior surfaces due to convection when the shading device is attached and the window is open or closed, or with no shading device attached when the window is open or closed.
Eleventh International IBPSA Conference Glasgow, Scotland
July 27-30, 2009
- 984 -
• Comparing all heat gain component changes during the hours 01:00-07:00, 08:00-18:00, 19:00-24:00 when the shading device is attached and the window is open or closed, and with no shading device attached when window is open and closed (Bayraktar, 2008).
Definition of the Simulation Tool − Energyplus
In the proposed simulation method, experiments including measurements of interior velocities, pressure measurements on back and front facade of models on wind tunnel were carried out to prepare inputs to the energy simulation program, EnergyPlus, for cooling load calculations with various shading devices. EnergyPlus is a energy simulation software developed by the U.S. Department of Energy for use on buildings which performs simulations of energy and thermal loads (Anon, Energyplus-getting started reference, 2006). The simulation manager includes surface heat balance and air heat balance modules that employ a heat balance cooling load calculation method (ASHRAE 2005). The program permits the definition of parameters necessary for the problem being dealt with and the exclusion of other parameters from the calculation.
Limits of Energyplus
EnergyPlus simulates building energy flow based on an input file containing a detailed description of building construction, solar radiation and airflow simulation. However, the effects of shading devices on air velocity occurring near openings and interiors are not considered during the calculation of zone gains. Therefore, experimental work in a wind tunnel was carried out to predict airflow velocity changes in front of the opening and on interior surfaces in order to compare the difference between when shading devices are attached or not attached when the south window is in an open or closed position. Interior surface convection coefficients, which represent the effects of interior velocities, and changes due to shading device geometries are calculated by using data from velocity measurements performed on an Eiffel type wind tunnel in which 1/12.5 scale office building models with 4 different types of shading devices attached and with no shading device attached. After being calculated, these convection coefficients were entered into the Energyplus programme in order to make the program account for the effects of shading devices on interior airflow velocities. Heat gains from opaque interior surfaces due to solar radiation and interior air movement, as defined by convection coefficients, are obtained when Energyplus provides an output of ‘heat gain to air by convection’. Results from simulations of situations where a shading device is attached are compared with situations where a shading device is not attached.
Volume flow rates of openings with and without various shading devices, which were calculated with velocities measured near openings, pressure differences in front of and behind the model and reference wind velocities are entered into the programme for the calculation of zone gains due to ventilation.
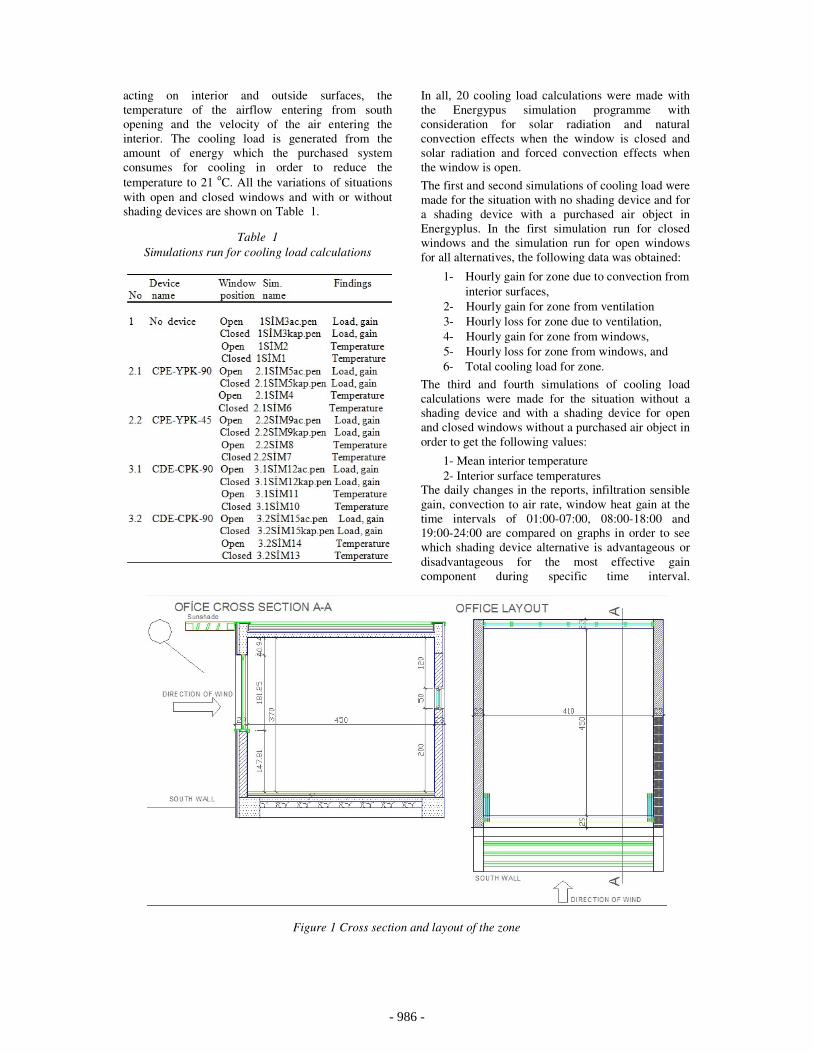
Description of the Building
Few studies have been carried out regarding the effects of shading devices on zone cooling loads for a ground level, single storey office building with interior dimensions of 4.50 x 4.10 m. The building is located in Istanbul on level ground. There are windows on the south and north sides of the building providing natural ventilation with dimensions of 4.10 x 1.80 m on the front and 4.10 x 0.5 m on the rear opening (Figure 1). The front wall of the zone faces south and the 8.6 m/s reference wind blows toward this surface at a 90ο angle. It was assumed that there is no lighting, furniture, office equipment or occupants in the zone. The surface layer materials of south, north, east and west walls, the construction of the floor and roof and their sequences were determined so that these values could be used during the calculation of heat transfer due to conduction in Energyplus programme. At this stage, it was assumed that heat transfer occurs only on the front surface.
Description of the Various Shading Devices
Consideration is only made for the geometrical effects of shading devices on total cooling loads aside from their optical and thermophysical effects with a total of 10 alternate situations with open and closed window positions. An analysis was carried out on an empty office with 4 different shading devices situated in parallel and perpendicular positions on the exterior wall and with varying slat angles of 45ο and 90o
(Figure 2).
APPLICATION Cooling load calculations were processed with Energyplus, an energy analysis simulation program. Four simulations of cooling load calculations were carried out for situations with open and closed windows with and without shading devices in order to determine the effects of airflow and solar radiation on interior zone gains. This was done over specific times that change the effects of shading device geometries. The effects of the shading devices on 3 zone heat gain components were evaluated on reference design day, 21 August. Because the highest temperatures occur generally on August in İstanbul.
The ‘purchased air’ object is defined in Energyplus in order to obtain cooling load values during the hours when interior temperature exceeds 21 oC, which was assumed to be a comfortable temperature value for the zone, which was cross ventilated with openings on opposite walls with and without shading device alternatives. Interior temperature varies depending on the combined effect of solar radiation
- 985 -
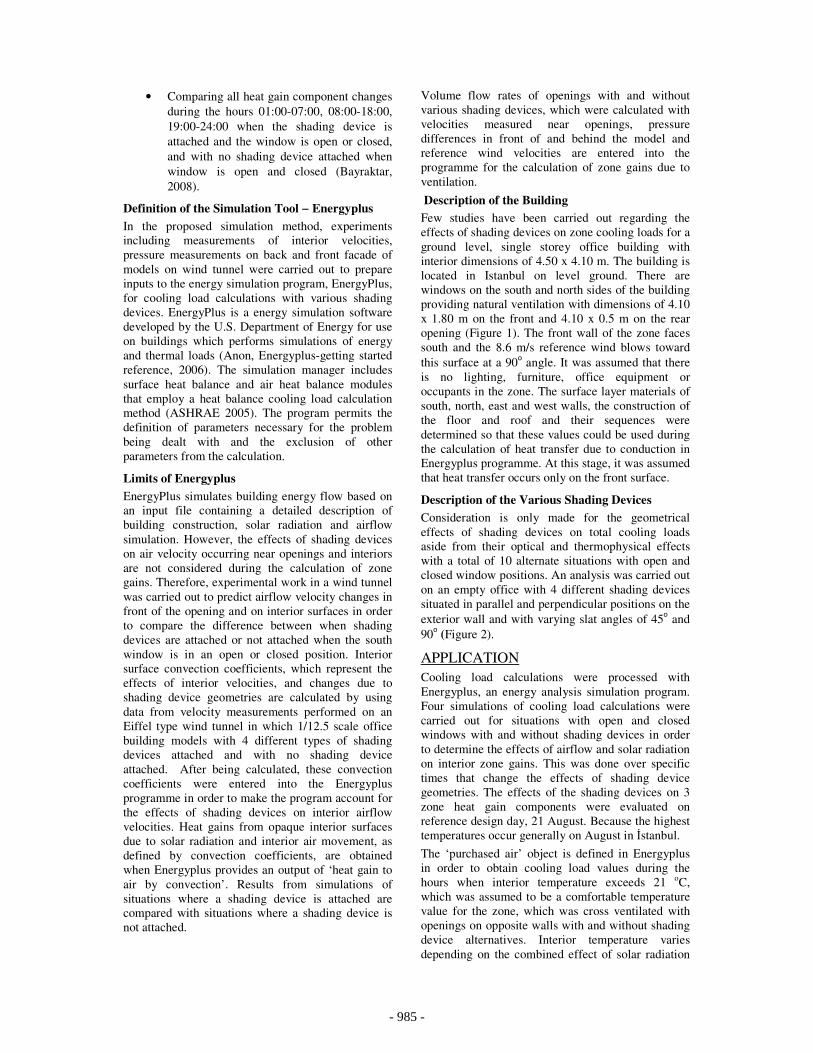
acting on interior and outside surfaces, the temperature of the airflow entering from south opening and the velocity of the air entering the interior. The cooling load is generated from the amount of energy which the purchased system consumes for cooling in order to reduce the temperature to 21 oC. All the variations of situations with open and closed windows and with or without shading devices are shown on Table 1.
Table 1
Simulations run for cooling load calculations
In all, 20 cooling load calculations were made with the Energypus simulation programme with
consideration for solar radiation and natural convection effects when the window is closed and solar radiation and forced convection effects when the window is open.
The first and second simulations of cooling load were made for the situation with no shading device and for a shading device with a purchased air object in Energyplus. In the first simulation run for closed windows and the simulation run for open windows for all alternatives, the following data was obtained:
1- Hourly gain for zone due to convection from interior surfaces,
2- Hourly gain for zone from ventilation 3- Hourly loss for zone due to ventilation, 4- Hourly gain for zone from windows, 5- Hourly loss for zone from windows, and 6- Total cooling load for zone.
The third and fourth simulations of cooling load calculations were made for the situation without a shading device and with a shading device for open and closed windows without a purchased air object in order to get the following values:
1- Mean interior temperature 2- Interior surface temperatures
The daily changes in the reports, infiltration sensible gain, convection to air rate, window heat gain at the time intervals of 01:00-07:00, 08:00-18:00 and 19:00-24:00 are compared on graphs in order to see which shading device alternative is advantageous or disadvantageous for the most effective gain component during specific time interval.
Figure 1 Cross section and layout of the zone
- 986 -
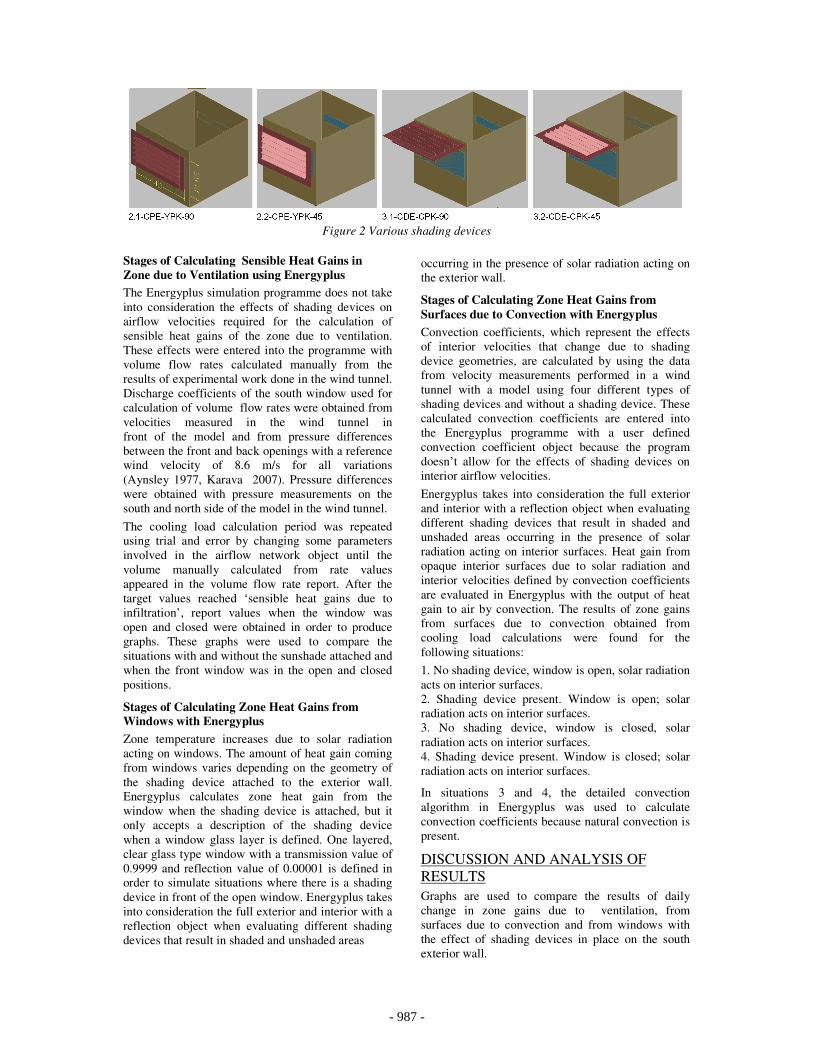
Figure 2 Various shading devices
Stages of Calculating Sensible Heat Gains in
Zone due to Ventilation using Energyplus
The Energyplus simulation programme does not take into consideration the effects of shading devices on airflow velocities required for the calculation of sensible heat gains of the zone due to ventilation. These effects were entered into the programme with volume flow rates calculated manually from the results of experimental work done in the wind tunnel. Discharge coefficients of the south window used for calculation of volume flow rates were obtained from velocities measured in the wind tunnel in front of the model and from pressure differences between the front and back openings with a reference wind velocity of 8.6 m/s for all variations (Aynsley 1977, Karava 2007). Pressure differences were obtained with pressure measurements on the south and north side of the model in the wind tunnel.
The cooling load calculation period was repeated using trial and error by changing some parameters involved in the airflow network object until the volume manually calculated from rate values appeared in the volume flow rate report. After the target values reached ‘sensible heat gains due to infiltration’, report values when the window was open and closed were obtained in order to produce graphs. These graphs were used to compare the situations with and without the sunshade attached and when the front window was in the open and closed positions.
Stages of Calculating Zone Heat Gains from
Windows with Energyplus
Zone temperature increases due to solar radiation acting on windows. The amount of heat gain coming from windows varies depending on the geometry of the shading device attached to the exterior wall. Energyplus calculates zone heat gain from the window when the shading device is attached, but it only accepts a description of the shading device when a window glass layer is defined. One layered, clear glass type window with a transmission value of 0.9999 and reflection value of 0.00001 is defined in order to simulate situations where there is a shading device in front of the open window. Energyplus takes into consideration the full exterior and interior with a reflection object when evaluating different shading devices that result in shaded and unshaded areas
occurring in the presence of solar radiation acting on the exterior wall.
Stages of Calculating Zone Heat Gains from
Surfaces due to Convection with Energyplus
Convection coefficients, which represent the effects of interior velocities that change due to shading device geometries, are calculated by using the data from velocity measurements performed in a wind tunnel with a model using four different types of shading devices and without a shading device. These calculated convection coefficients are entered into the Energyplus programme with a user defined convection coefficient object because the program doesn’t allow for the effects of shading devices on interior airflow velocities.
Energyplus takes into consideration the full exterior and interior with a reflection object when evaluating different shading devices that result in shaded and unshaded areas occurring in the presence of solar radiation acting on interior surfaces. Heat gain from opaque interior surfaces due to solar radiation and interior velocities defined by convection coefficients are evaluated in Energyplus with the output of heat gain to air by convection. The results of zone gains from surfaces due to convection obtained from cooling load calculations were found for the following situations:
1. No shading device, window is open, solar radiation acts on interior surfaces. 2. Shading device present. Window is open; solar radiation acts on interior surfaces. 3. No shading device, window is closed, solar radiation acts on interior surfaces. 4. Shading device present. Window is closed; solar radiation acts on interior surfaces.
In situations 3 and 4, the detailed convection algorithm in Energyplus was used to calculate convection coefficients because natural convection is present.
DISCUSSION AND ANALYSIS OF RESULTS Graphs are used to compare the results of daily change in zone gains due to ventilation, from surfaces due to convection and from windows with the effect of shading devices in place on the south exterior wall.
- 987 -
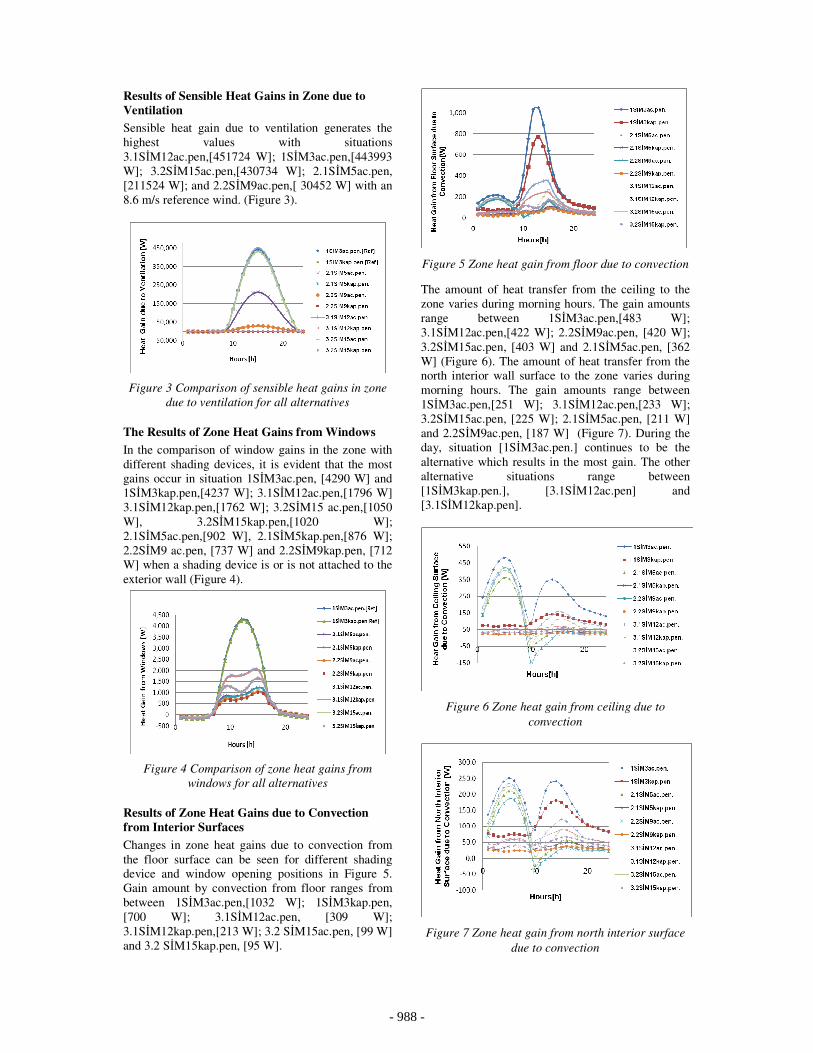
Results of Sensible Heat Gains in Zone due to
Ventilation
Sensible heat gain due to ventilation generates the highest values with situations 3.1SİM12ac.pen,[451724 W]; 1SİM3ac.pen,[443993 W]; 3.2SİM15ac.pen,[430734 W]; 2.1SİM5ac.pen, [211524 W]; and 2.2SİM9ac.pen,[ 30452 W] with an 8.6 m/s reference wind. (Figure 3).
Figure 3 Comparison of sensible heat gains in zone
due to ventilation for all alternatives
The Results of Zone Heat Gains from Windows
In the comparison of window gains in the zone with different shading devices, it is evident that the most gains occur in situation 1SİM3ac.pen, [4290 W] and 1SİM3kap.pen,[4237 W]; 3.1SİM12ac.pen,[1796 W] 3.1SİM12kap.pen,[1762 W]; 3.2SİM15 ac.pen,[1050 W], 3.2SİM15kap.pen,[1020 W]; 2.1SİM5ac.pen,[902 W], 2.1SİM5kap.pen,[876 W]; 2.2SİM9 ac.pen, [737 W] and 2.2SİM9kap.pen, [712 W] when a shading device is or is not attached to the exterior wall (Figure 4).
Figure 4 Comparison of zone heat gains from
windows for all alternatives
Results of Zone Heat Gains due to Convection
from Interior Surfaces
Changes in zone heat gains due to convection from the floor surface can be seen for different shading device and window opening positions in Figure 5. Gain amount by convection from floor ranges from between 1SİM3ac.pen,[1032 W]; 1SİM3kap.pen, [700 W]; 3.1SİM12ac.pen, [309 W]; 3.1SİM12kap.pen,[213 W]; 3.2 SİM15ac.pen, [99 W] and 3.2 SİM15kap.pen, [95 W].
Figure 5 Zone heat gain from floor due to convection
The amount of heat transfer from the ceiling to the zone varies during morning hours. The gain amounts range between 1SİM3ac.pen,[483 W]; 3.1SİM12ac.pen,[422 W]; 2.2SİM9ac.pen, [420 W]; 3.2SİM15ac.pen, [403 W] and 2.1SİM5ac.pen, [362 W] (Figure 6). The amount of heat transfer from the north interior wall surface to the zone varies during morning hours. The gain amounts range between 1SİM3ac.pen,[251 W]; 3.1SİM12ac.pen,[233 W]; 3.2SİM15ac.pen, [225 W]; 2.1SİM5ac.pen, [211 W] and 2.2SİM9ac.pen, [187 W] (Figure 7). During the day, situation [1SİM3ac.pen.] continues to be the alternative which results in the most gain. The other alternative situations range between [1SİM3kap.pen.], [3.1SİM12ac.pen] and [3.1SİM12kap.pen].
Figure 6 Zone heat gain from ceiling due to
convection
Figure 7 Zone heat gain from north interior surface
due to convection
- 988 -
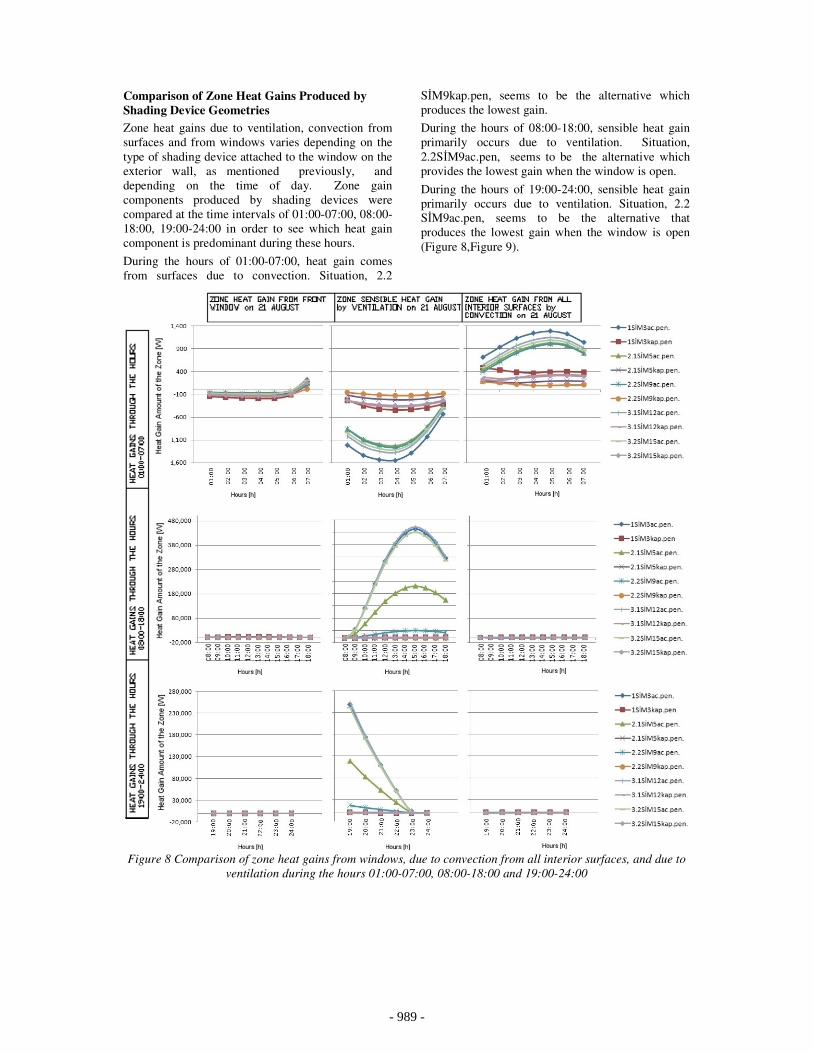
Comparison of Zone Heat Gains Produced by
Shading Device Geometries
Zone heat gains due to ventilation, convection from surfaces and from windows varies depending on the type of shading device attached to the window on the exterior wall, as mentioned previously, and depending on the time of day. Zone gain components produced by shading devices were compared at the time intervals of 01:00-07:00, 08:00-18:00, 19:00-24:00 in order to see which heat gain component is predominant during these hours.
During the hours of 01:00-07:00, heat gain comes from surfaces due to convection. Situation, 2.2
SİM9kap.pen, seems to be the alternative which produces the lowest gain.
During the hours of 08:00-18:00, sensible heat gain primarily occurs due to ventilation. Situation, 2.2SİM9ac.pen, seems to be the alternative which provides the lowest gain when the window is open.
During the hours of 19:00-24:00, sensible heat gain primarily occurs due to ventilation. Situation, 2.2 SİM9ac.pen, seems to be the alternative that produces the lowest gain when the window is open (Figure 8,Figure 9).
Figure 8 Comparison of zone heat gains from windows, due to convection from all interior surfaces, and due to
ventilation during the hours 01:00-07:00, 08:00-18:00 and 19:00-24:00
- 989 -

TIME
1SİM3ac.p
en.
1SİM3kap.
pen
2.1SİM5ac
.pen.
2.1SİM5k
ap.pen.
2.2SİM9ac
.pen.
2.2SİM9k
ap.pen.
3.1SİM12a
c.pen.
3.1SİM12k
ap.pen.
3.2SİM15a
c.pen.
3.2SİM15k
ap.pen.
01:00 -07:00 1,084 407 816 179 787 123 931 299 880 267
08:00-18:00 1,346 1,192 278 312 204 266 621 573 426 419
19:00-24:00 572 669 205 278 173 249 334 404 262 330
TIME
1SİM3ac.p
en.
1SİM3kap.
pen
2.1SİM5ac
.pen.
2.1SİM5k
ap.pen.
2.2SİM9ac
.pen.
2.2SİM9k
ap.pen.
3.1SİM12a
c.pen.
3.1SİM12k
ap.pen.
3.2SİM15a
c.pen.
3.2SİM15k
ap.pen.
01:00 -07:00 -55 -120 -38 -83 -40 -84 -37 -86 -34 -79
08:00-18:00 2,727 2,670 875 845 723 694 1,511 1,472 1,172 1,138
19:00-24:00 -12 -53 36 14 54 33 20 -9 25 1
TIME
1SİM3ac.p
en.
1SİM3kap.
pen
2.1SİM5ac
.pen.
2.1SİM5k
ap.pen.
2.2SİM9ac
.pen.
2.2SİM9k
ap.pen.
3.1SİM12a
c.pen.
3.1SİM12k
ap.pen.
3.2SİM15a
c.pen.
3.2SİM15k
ap.pen.
01:00 -07:00 -1,240 -370 -954 -183 -966 -102 -1,080 -318 -1,026 -292
08:00-18:00 279,639 1,058 133,282 553 19,187 276 284,521 1,081 271,314 1,040
19:00-24:00 97,536 354 46,490 185 6,582 92 99,275 361 94,680 303
Zone average heat gain from windows, [W]
Zone average heat gain by ventilation, [W]
Zone average heat gain by convection[W]
Figure 9 Average values of zone heat gains from windows, due to convection from all interior surfaces, and
due to ventilation during the hours 01:00-07:00, 08:00-18:00 and 19:00-24:00 As a result, during most hot periods it is possible to obtain passive cooling by decreasing the surface temperatures with airflow velocities caused by wind entering the interior through the windows due to a pressure difference during the time intervals when the outside air is cooler than the interior. This situation occurs during the night. This effect reverses during the day when the outside air temperature is higher than the interior temperature. Shading devices used as barrier to protect from unwanted solar radiation acting on interior surfaces change the velocity and volume flow rates depending on their geometry and position on the exterior wall.
In this study, ventilation heat gains seem to be the most dominant heat gain component as the reference wind is assumed to be stable during all hours with a velocity of 8.6 m/s in the simulation. In reality, wind velocity intensity increases or decreases depending on the time.
Therefore, in order to design the optimum shading device, it is necessary to determine the combined effect of shading devices with regard to protection from solar radiation and natural ventilation based on changing wind velocities and solar radiation during the day.
CONCLUSION This study presented the results of using the Energyplus simulation programme to determine the effects of different shading devices on zone gains and losses with convection, sensible gain in the zone and losses with ventilation and zone gains from windows, all of which change according to the effect of the shading device geometries during specific time intervals. During the preparation of this study, plug-in programs used to draw building geometries were not available. Since then, it has become possible to create buildings with other drawing programs, which can then be imported to Energyplus. With regard to the positions of windows when open and closed, the effects of shading devices are determined by
comparing the results computed by Energyplus with zone gains due to convection from surfaces, sensible gains due to ventilation and gains from windows. All of these situations change depending on the location and geometries of shading devices or if no shading device is present.
The Energyplus programme is useful for evaluating the effects of shading devices on interior gains by means of manually defined values for interior convection coefficients and discharge coefficients. A new module that makes it possible to enter user-defined volume flow rates could be added to the programme interface. Adding a new field in the design day object that would facilitate the entry of an hourly definition for reference wind velocity changes would make it possible to achieve more realistic results when calculating daily cooling loads and gains.
REFERENCES Guillemin, A. and Molteni, S., 2002. An energy-
efficient controller for shading devices self-adapting to the user wishes, Building and Environment, Vol. 37, no. 11, pp. 1091-1097.
Givoni, B., 1998. Climate considerations in building and urban design, Wiley, New York.
Foster, M. and Oreszczyn, T., 2001. Occupant control of passive systems: the use of Venetian blinds. Building and Environment, Vol. 36, no. 2, pp. 149-155.
Dreyfus,J., 1960. Le confort dans L’habitat-En pays tropical. Paris; Eyrolles edutour.
Ok, V., Çakan, M., Özgünler, M., Kavurmacıoğlu, L., Bayraktar, T. N. ve Yaşa,E., 2008. Güneş kontrol elemanlarının, bina yüzeyinde rüzgar etkisi ile oluşacak ısı taşınım ve basınç katsayılarına etkisinin deneysel olarak incelenmesi(Effect of Shading devices on external pressure coefficients and convection coefficients which occur due to wind effects on
- 990 -
windvard surfaces of buildings) Report, İ.T.Ü. ARAŞTIRMA FONU, Proje No: 11_00_180.
Ok, V., Bayraktar, T. N. Özgünler, M., 2008. Güneş kontrol elemanlarının bina iç hava hareketi hızına etkileri (The effects of shading devices to interior air velocities). Report, İ.T.Ü. ARAŞTIRMA FONU, Proje No: 11_04_182.
Bayraktar, N.T., 2008. Gölgeleme araçlarının mekanın toplam soğutma yükleri açısından etkinliklerinin değerlendirilmesinde geliştirilen yöntem, PhD Thesis, İstanbul Technical University.
Anon., 2006. ENERGYPLUS- Engineering Reference, The Board of The University of
Illinois and the University of California through the Ernest Orlando Lawrence Berkeley National Laboratory.
ASHRAE., 2005. Handbook Fundamentals American Society of heating, Refrigerating and air conditioning engineer, Inc.
Aynsley, R. M., Melbourne, W. and Vickery, B.J., 1977. Architectural Aerodynamics, Wind Tunnel Testing Techniques, Applied Science Pub., London.
Karava, P., Stathopoulos, T. and Athienitis, A. K., 2007. Wind Induced Natural Ventilation Analysis, Solar Energy, 81, 1, 20-30.
- 991 -