Protecting Children's Nutritional Gains during a Pandemic
138
Department of Economics Florida International University Working Paper 2207 May 2022 11200 SW 8th Street, Miami, Florida 33199 https://economics.fiu.edu/ Protecting Children’s Nutritional Gains during a Pandemic: A Study Using Matching Sample Design under a Randomized Controlled Trial in Urban Pakistan Abu S. Shonchoy Agha A. Akram Mahrukh Khan Hina Khalid Sidra Mazhar Akib Khan Takashi Kurosaki
-
Upload
khangminh22 -
Category
Documents
-
view
4 -
download
0
Transcript of Protecting Children's Nutritional Gains during a Pandemic
Department of Economics
Florida International University
Working Paper 2207
May 2022
11200 SW 8th Street, Miami, Florida 33199
https://economics.fiu.edu/
Protecting Children’s Nutritional Gains during a
Pandemic: A Study Using Matching Sample Design
under a Randomized Controlled Trial in Urban Pakistan
Abu S. Shonchoy
Agha A. Akram
Mahrukh Khan
Hina Khalid
Sidra Mazhar
Akib Khan
Takashi Kurosaki

Protecting Children’s Nutritional Gains during a Pandemic:
A Study Using Matching Sample Design under a Randomized
Controlled Trial in Urban Pakistan
Abu S. Shonchoy,* PhD,
Florida International University
11200 SW 8th Street, Miami, Florida 33199, USA
Email: [email protected]
ORCID: 0000-0001-9999-2326
Agha A. Akram, PhD,
Lahore University of Management Sciences,
Lahore, Pakistan
Email: [email protected]
ORCID: 0000-0002-9475-043X
Mahrukh Khan, BSc,
Centre for Economic Research in Pakistan
Lahore, Pakistan
Email: [email protected]
Hina Khalid, PhD,
Information Technology University
Lahore, Pakistan
Email: [email protected]
ORCID: 0000-0002-3673-7237
Sidra Mazhar, MSc,
Center for Economic Research in Pakistan,
Lahore, Pakistan
Email: [email protected]
Akib Khan, MS,
Uppsala University, Sweden.
Email: [email protected]
Takashi Kurosaki, PhD,
Hitotsubashi University, Japan
Email: [email protected]
ORCID: 0000-0002-9762-0067
* Corresponding Author
2
Research in Context
Evidence before this study
Most physical growth monitoring initiatives for children are community based, requiring subjects and caregivers to visit a designated facility. Existing evidence on home-based physical growth monitoring for children to tackle malnutrition is limited. We searched existing literature (all published studies in English, from January 1990 to March 2022) using the phrases “Home-based Child Growth Monitoring”, “Community Worker Based Growth Monitoring”, “In-home Growth Surveillance”, “Child Growth Monitoring in COVID-19” on PubMed. Only one study measured child height in-home, none provided in-home growth monitoring for both child height and weight, and none had an interactive process engaging caregivers in the measurement process. Additionally, no study documented the impact-persistence of home-based growth monitoring during the COVID-19 pandemic and none in the urban informal settlement settings of resource-constrained countries.
Added value of this study Existing community health worker (CHW) driven public health delivery programs have shown promise in immunization, nutrition, family planning, maternal health, but rarely on child physical growth monitoring. This study provides new evidence of a CHW based nutrition program that directly engages primary caregivers in high-frequency in-home growth monitoring coupled with nutrition counselling. We documented large gains in height-for-age Z-scores (HAZ) for children, an important finding given that the intervention was completed just before the beginning of COVID-19 pandemic and the endline survey was conducted seven months after the intervention. Also, this trial is one of the very few studies done in informal urban settlements areas in resource poor countries.
Implications of this study Our findings offer an effective option for policymakers within Pakistan and beyond to address the challenge of stunting and undernutrition, especially in light of the COVID-19 pandemic. We found large positive impacts of high-frequency in-home growth monitoring coupled with nutrition counselling on child anthropometrics. Our in-home procedures were relatively simple, low-cost, compact, and well-documented. Moreover, we trained health workers who were locally recruited, demonstrating that our procedures can be implemented in a low-capacity setting. Given the nutritional consequences of this ongoing pandemic due to the economic shock and disruptions in accessing health facilities, government COVID-19 policy response should prioritize such scalable interventions particularly for vulnerable mothers and children from disadvantaged and marginalized communities.
Total Words in the Manuscript: 4,387
Total number of tables and figures: 5
Total number supplementary appendices: 8

3
Summary
Background
Globally, 24% of children under five are stunted, rising to 38% in Pakistan. Caregivers are crucial to
ensure adequate development of children and most community health worker (CHW) programs
encourage health-care-facility utilization. The impact of in-home physical growth monitoring and
nutrition counseling (IHGMC) is relatively understudied.
Methods
We measured the efficacy of high-frequency IHGMC. Baseline data was collected in July 2019, and
the intervention was implemented for six months. An endline survey was administered seven months
later (September-October 2020). We randomly allocated 1,188 households with children aged 3-21
months, located in an urban informal settlement in Pakistan, to three intervention groups (1:1:1):
monthly IHGMC (T1); T1 coupled with a poster-sized height-for-age Z-score (HAZ) based growth-
monitoring chart (T2); T2 complemented with an unconditional monthly cash transfer (T3). CHWs
visited homes to record anthropometric measures, and counseled caregivers on age-specific nutrition.
Control households (451) that received no input were recruited at end-line. Analysis is based on
intention-to-treat estimation using coarsened exact matching method for sample selection – matched
on household size, child's age, father's education, mother's education, ethnicity, and neighborhood.
The matched sample used for analysis was 1,046 (636 and 410 from treatments and control,
respectively). The trial was registered with AER-RCT registry (AEARCTR-0003248).
Findings
Compared to the control group, HAZ in the T1 group increased by 0.58 SD (95% CI 0.33 to 0.83;
p=0.0019) and weight-for-age Z-score by 0.43 SD (95% CI 0.20 to 0.67, p<0.01). Treatment-specific
component analysis confirmed IHGMC had the largest impact while supplementary components
(growth chart and cash transfer) conferred no significant additional benefit on primary outcome
measures.
Interpretation
CHWs can substantially improve child anthropometric outcomes in disadvantaged localities through
regular IHGMC, and this impact persisted during the pandemic. The use of growth charts and cash
transfers did not appear effective in this setting.
Funding
World Bank.

4
Introduction Globally, one in four children under the age of five suffers from linear growth faltering,1 with the
highest prevalence in South Asia and Sub-Saharan Africa.2 Stunting (low height-for-age Z-score or
HAZ<−2) remains a critical public health challenge as it reduces lifetime earnings, hinders cognitive
development, and leads to high mortality rates.3 The COVID-19 pandemic has raised concerns about
reversals to improvements in childhood nutrition.4 These concerns have been met with a renewed
emphasis on the importance of mobilizing resources for nutrition,5 and an urgency to increase
resilience to malnutrition during times of crises,6 such as a pandemic.
Research suggests that primary caregivers play a key role in child development.7 Caregivers are
the first point of contact for children, and their engagement is crucial to ensure adequate physical,
cognitive, social, and emotional development. Consequently, community health worker (CHW)
programs globally,8 and in Pakistan,9 leverage regular contact with primary caregivers to improve
health outcomes in general and child health outcomes in particular. Existing CHW-based public health
delivery programs have shown promise in immunization, maternal and child health, and family
planning.10 Such programs usually encourage health-care-facility utilization by caregivers, showing
modest gains in child health (typically lower than a 0.25 SD gain in HAZ).11-13
Several limitations remain in existing approaches involving CHWs, as these programs
predominantly focus on resource and knowledge constraints but provide little attention to behavioral
interventions such as engaging caregivers with continuous feedback on the growth measures of their
children.14,15 While many programs use cash transfers as a way to address resource constraints, they
show limited impact.16 Physical growth promotion programs mostly operate through facility-based
growth monitoring,17and rarely focus on regular home-based growth surveillance by CHWs, with the
exception of a handful of small sample studies.12, 18 Programs that simply integrate growth charts into
the community-based interventions—without regular growth monitoring—do not see any impact
since caregivers often fail to comprehend growth trajectories.19 The complementarity of regular
growth monitoring and counseling for caregivers is essential, improving the understanding of childcare
inputs and physical development, particularly in marginalized communities.
A few studies do explore behavioral interventions, with limited effect on child growth
measures. One of the first rigorous studies on regular growth monitoring with a growth chart, the
South Indian trial,18 did not find any additional benefit of growth monitoring. Their study setting was
small (12 villages in Tamil Nadu), focused on weight measures, and executed by one selected mother
in the village. Their impact measures also did not isolate the impact of growth monitoring from that
of the growth chart. A related study conducted in Zambia,20 focused on home-based growth
monitoring (life-sized posters installed in homes to demonstrate children's age-appropriate height) and
community-based growth monitoring along with nutritional supplements. The study found modest
positive effects on growth among previously malnourished children; however, the study suffered from
a lack of professionally measured anthropometrics at regular intervals and did not assess
complementarities between monitoring and counseling. Thus far, the existing literature is mixed,
inconclusive, and lacks sufficient evidence in evaluating the impact of regular in-home anthropometric
monitoring and counseling executed by trained CHWs.
Motivated by this concern, we tested in-home growth monitoring coupled with nutrition
counseling in Pakistan, a lower-middle-income country in South Asia with high levels of childhood
stunting: 38% of all children under five are stunted, though this is lower in urban areas (31%) and for
children aged 6-8 months (18%).21 We chose to study the intervention in an informal urban settlement,

5
a setting that hosts marginalized populations but rarely receives health or nutritional aid. Additionally,
our study was conducted during a global pandemic which – as many experts fear – threatens child
nutritional development, especially in areas where health facilities are being closed or partially
functional due to this pandemic.22
Therefore, in this study, we aim to 1) provide new evidence on the impact of regular in-home
growth measurement by CHWs coupled with nutrition counseling; 2) contribute to the evidence base
for studying slum dweller populations which present unique research challenges but received limited
attention in public health literature and policies; and, 3) estimate the nutritional consequences of the
COVID-19 on young children, as the pandemic occurred right after our intervention activities ceased.
Methods
Study Design
Our main sample for the impact analysis came from a randomized controlled trial (RCT), which was
conducted in Gulshan-e-Sikandarabad, an urban informal-settlement located in Karachi, Pakistan.
Households with at least one child between the age of 3-21 months were eligible for this trial. An
independent survey team listed 4,166 households and administered a baseline survey (July 2019) to
the biological mother and caregiver of the child capturing demographics, socioeconomics, and child
anthropometrics. In case more than one eligible child was present in the household, the youngest one
was chosen. This process continued until 1,188 eligible households completed baseline survey and
were randomly allocated to one of three treatment arms (1:1:1): (T1) monthly in-home growth
monitoring with counseling (IHGMC); (T2) IHGMC with a poster-sized height-for-age Z-score
(HAZ) based growth monitoring interactive chart; and (T3) IHGMC plus growth charts (as T2)
complemented with a monthly unconditional cash transfer with a suggestion to use the amount for
children’s food. This intervention continued for 6 months (September 2019 to February 2020) and
ended just before the COVID-19 outbreak.
An endline survey was administered a year after the start of intervention activities (September-
October 2020), with a no-contact period of seven months. The endline survey was timed this way to
allow better understanding on the persistence of gains in child health, especially as measured during
the pandemic. At this time, we added a pure control group (C) by surveying an additional 451
households, recruited from the original 4,166 household listing generated during our initial community
census, utilizing the same eligibility criteria of having a child between 3-21 months and presence in
the community at the time of the baseline.
We added this pure control group, who received no input from us, at the endline for a few
reasons. The original RCT was designed and budgeted to understand the impact of adding a growth
chart and unconditional cash transfer on top of IHGMC. Moreover, our implementation partner was
initially reluctant to proceed with a study that did not actively serve all participants. With the onset of
the COVID-19 pandemic, we reconsidered the potential of our intervention, given fears that the
pandemic could reverse gains made in child health and nutrition. Hence, adding this pure control
group allowed us to compare the treatment impact with a no-intervention scenario for the children
from the same community with same treatment eligibility, both assessed during the pandemic.
We used coarsened exact matching (CEM) method to select our sample for analysis among
the treatments and control groups, since we added the control group to an ongoing randomized

6
controlled trial (RCT) with three actively treated arms. Major financing for this study came from the
World Bank (Strategic Impact Evaluation Fund), with co-financing from Hitotsubashi University,
Lahore University of Management Sciences, and Shahid Hussain Foundation. All data used in the
study were collected by the Center for Economic Research in Pakistan (CERP), an independent survey
firm. A detailed timeline is given in the Appendix B.
Ethical approval to conduct this study was obtained from the Institutional Review Board at
Interactive Research and Development (IRD), Karachi. Oral consent was taken from all caregivers
before administering the survey.
Randomization, matching, and masking
Original RCT sample households were allocated equally across three treatment arms using stratified
randomization. Stratification was done based on the mother's literacy, neighborhood block, child's
gender, and stunting and underweight status. The package 'randtreat' in STATA 14 was utilized for
the randomization. A sample size of 400 households per intervention group was initially designed to
detect a standardized effect size of 0·3 SD in HAZ between any of the three treatment arms with
power of 0·8 and 0·05 alpha level, unconditional on covariates.
Among the treatments and control sample surveyed at the endline, we generated a matched
subsample using the CEM procedure, matching on household size, child's age at baseline, father's
education, mother's education, ethnicity, and neighborhood block.23 We believe our CEM based
procedure resulted in a high-quality match among the treatments and control. We selected control
households within the same neighborhoods using the same eligibility criteria applied to recruit
treatment households. We also improved the L1 distance (an objective measure of how different the
raw, unmatched control and treatment samples are from each other) from 0.94 to 0.57 (detailed CEM
procedure is described in Appendix D).
The nature of our intervention did not allow full masking of participants to the CHWs. While
the team of investigators was masked, the data collection team was not strictly blinded to intervention
group assignment since the endline survey asked about some of the treatment-related activities, which
allowed them to predict individual treatment allocation (Appendix E).
Procedures
A total of 14 locally recruited CHWs, with at least 10 years of education (matriculation), were trained
by an expert from our research team for four days (two days of in-office training and two days dry-
run in the field with 50 households). The field team also comprised of one field supervisor and one
field manager who coordinated day-to-day work and conducted quality assurance (Appendix H).
CHWs visited households, monthly, for a total of six months.
Standard operating procedures were shared with each team that included procedures for daily
calibration of equipment, cleaning of equipment before taking measures, placing the child on the
equipment, and recording the measurements (Appendix G).
Once the caregiver agreed to participate, for T1, CHWs began with 24-hour dietary recall
followed by height and weight measurements. During the visit, lasting no more than 20 minutes, one
CHW measured the child with direct assistance from the caregiver while the other CHW recorded the
measurements in the tablet-based electronic survey. This procedure was followed by age-specific
nutrition counseling on infant and young child feeding (IYCF) practices along with other childcare
inputs such as WASH practices (Appendix E). Counseling included modules on exclusive
7
breastfeeding for the first six months after birth, complementary feeding for children in the age groups
of 6-8 months, 9-11 months, and 12-24 months, and modules on overall hygiene for the mother, child,
and on severe acute malnutrition.
In addition to the activities listed in T1, in T2 monthly height measurements were recorded
on the HAZ-based growth chart installed inside the house and explained to the caregiver during the
first visit. In T3, our CHWs physically handed over a fixed amount of Rs. 400 ($11·91 in PPP) in cash
directly to the caregiver in each visit, with a suggestion on purchasing nutritious food for their child;
hence, we termed it an unconditional "labeled cash transfer" since we did not enforce who and how
it was used. The amount is approximately 5% of monthly consumption expenditure for a household
of seven, living on less than $2 PPP a day, enabling purchases of 1-month's supply of eggs along with
half-a-month’s supply of milk for one eligible child. These monthly interventions in the treated
households continued for six months. We had no contact with the pure control group during this
period.
Outcomes
The primary outcome measures were height-for-age z-score (HAZ) where height was measured using
infantometers and stadiometers (as relevant) and weight-for-age z-score (WAZ) where weight was
measured using weighing scales (for detailed procedures see Appendix G). Our secondary outcomes
were binary indicators for stunted and severely stunted (i.e., 2 SD and 3 SD below the median HAZ
score of the reference population underlying the WHO child growth standards, respectively) as well
as binary indicators for underweight and severe underweight (i.e., 2 SD and 3 SD, respectively, below
the median WAZ score from the WHO child growth standards).24 Another secondary outcome was
weight-for-height z-score (WHZ), which captured the weight of the child in comparison to their height
(and binary variables, wasting i.e., WHZ < -2 SD, and severely wasted i.e., WHZ < -3 SD). Height
and weight were measured in duplicates, following the WHO Multicenter Growth Reference Study
method.25 Additional variables analyzed include caregiver knowledge, quality of diet, and the home
environment (Appendix F).
Statistical Analysis
All our analysis followed an intention-to-treat (ITT) estimation on the CEM sample. Statistical
matching yielded a total analyzable sample of 1,046 households across all control and treatments (198
in T1, 208 in T2, 230 in T3, and 410 in C). Our ITT estimation generated causal effects of treatment
on outcome variables. ITT estimates minimize bias due to selective take-up of the intervention,
providing lower bound impact estimates. We employed ITT regression analysis using binary variables
to designate treatment status (along with individual/household level controls and sampling strata) to
evaluate the impact of the three treatments, using STATA 14 with Huber-White robust standard errors
(SEs). The same strategy was utilized for the treatment-component specific analysis (termed as “re-
classification”), where we estimated the ITT impacts using binary indicators for components: growth
monitoring and counseling C1=T1+T2+T3; growth chart C2 = T2+T3; and cash transfer C3 = T3.
We presented ITT coefficient estimates (means) with 95% confidence interval (CIs) and p-values using
outcomes measured at endline. Heterogeneous treatment effects were estimated by interacting
treatment status with child sex, membership in a marginalized ethnicity and age at baseline (Appendix
C). The trial was registered with the American Economic Association's registry for randomized
controlled trials: AEARCTR-0003248.

8
Role of the funding source
The funder of the study had no role in study design, data collection, data analysis, data interpretation,
or writing of the report. All authors had full access to all the data in the study and had final
responsibility for submitting it for publication.
Results Of the 4,166 households assessed for eligibility at baseline, 1,188 were eligible (Figure 1). Of these,
five households witnessed a death or injury of the child (<1%) and 202 households (17%) could not
be recontacted for program implementation due to a combination of weak address systems typical of
informal urban settlements and migration out of the neighborhood. Thus, our program
implementation sample was 981 households (83% of baseline sample). Of this, we successfully
reinterviewed 790 households at endline (80% of implementation sample): 58 households refused to
be reinterviewed (5%), 11 exceeded our interview rescheduling threshold of three attempts (1%), nine
were located but were absent despite multiple attempts (1%) and 113 had moved out of the community
(10%).
Our total available endline sample was 1,241 households: 790 households from the original
RCT sample and 451 recruited to serve as control. Using the matching procedure described earlier,
our final sample for analysis was 1,046 households. The distributional property and demographical
characteristics between these two groups were similar; control arm had 55% male and 45% female
children whereas the corresponding numbers in the treatment arms were 52% male and 48% female.
Mother's literacy rate in this community was low, with 74% of mothers who have not attended at least
one year of schooling in the control and treatment samples. Households in treatment and control were
balanced across all five neighborhood categories. In terms of ethnicity, the proportion of historically
marginalized groups was balanced across control and treatments at 25% and 24%, respectively (Table
1). Treatment adherence was 71% in month-1 (T1: 72%, 69% in T2: 69%, T3: 71%) and 75% month-
6 of intervention (T1: 74%, T2: 74%, T3: 78%).
The first set of results compared the matched control with any treatment to quantify the
impact of treatment at the time of the COVID-19 pandemic (Table 2). Our aggregate treatment
estimates showed an increase in HAZ by 0.42 SDs (95% CI 0.23 to 0.61; p<0.001) compared to the
control mean of -1.86 SD. The prevalence of stunting was reduced by 10 percentage points (pp), (95%
CI -0.17 to -0.03; p<0.001) and the prevalence of severe stunting was reduced by 5-pp (95% CI -0.10
to 0.00; p=0.04) in the treated group compared to the control (Table 3). We also found improvements
in weight related measures: a 0.25 SD (95% CI 0.07 to 0.44; p=0.01) increase in WAZ, a 6-pp (95%
CI -0.12 to 0.01; p=0.07) reduction in cases of underweight and a 5-pp (95% CI -0.10 to -0.01; p=0.02)
reduction in cases of severely underweight. To put these results in perspective, our baseline suggested
that 19.7% of our sample were stunted, 26.6% were wasted and 26.9% were underweight.
Next, we observed that T1 showed the largest improvements, with a statistically significant
gain in HAZ of 0.58 SD (95% CI 0.33 to 0.83; p<0.001), reductions in stunting (-10 pp, 95% CI -0.19
to -0.01; p=0.02) and severe stunting (-7 pp, 95% CI -0.13 to -0.01, p=0.03). We also saw gains in
WAZ (0.43 SDs, 95% CI 0.20 to 0.67, p<0.001), reductions in underweight (-9 pp, 95% CI -0.16 to -
0.01; p=0.03) and severely underweight (-7 pp, 95% CI -0.12 to -0.02, p=0.01). Compared to the
control, T2 and T3 also largely followed the same direction as T1 though the magnitude of gains in

9
HAZ and WAZ, and the reductions in stunting, severe stunting, underweight and severe underweight
are not as large as T1. None of our treatments had statistically discernible impact at the conventional
level on WHZ, wasted and severely wasted compared to control.
Next, we presented reclassified treatment component specific estimates. Reclassification maps
IHGMC directly to T1 and has the same impact estimates, e.g., the impact on child HAZ is the same
increase of 0.58 SD (95% CI 0.33 to 0.83; p<0.001) as for T1. However, this analysis enabled useful
new insights for the add-on components, i.e., the growth-chart, and unconditional cash transfer. We
found that the growth-chart resulted in a small and marginally significant penalty on HAZ (-0.23 SD,
95% CI -0.49 to 0.04; p=0.09), though there were no impacts on other measures of child health.
However, for secondary outcomes, the cash transfer negatively impacted WHZ (-0.30 SD, 95% CI -
0.59 to -0.01; p=0.05) with an associated 7-pp increase in cases of wasting and underweight (95% CI
0.00 to 0.15, p=0.06, and 95% CI -0.01 to 0.16, p=0.08, respectively).
Gender-specific treatment interactions (Table 4) showed that relative to girls, boys in T3
tended to have a higher HAZ (0.46 SD, 95% CI -0.01 to 0.94; p=0.05) with an associated reduction
in severe stunting (-13pp, 95% CI -0.25 to -0.02; p=0.03). Additionally, male children in T3 saw
increased WAZ (0.63 SD, 95% CI 0.17 to 1.09; p=0.01), reduced cases of being underweight (-14 pp,
95% CI -0.30 to 0.02; p=0.08) and severely underweight (-19 pp, 95% CI -0.29 to -0.08; p=0.00).
Finally, boys in T3 also saw increase WHZ (0.60 SD, 95% CI 0.10 to 1.11; p=0.02) and a reduction in
cases of severe wasting (-14 pp, 95% CI -0.23 to -0.04; p=0.00). We found broadly similar results in
reclassified treatment component estimates: male children in households that received a cash transfer
had higher WAZ (0.61 SD, 95% CI 0.12 to 1.09; p=.01), along with a lower probability of being
severely underweight (-16 pp, 95% CI -0.26 to -0.05; p<0.001), and higher WHZ (0.61 SD, 95% CI
0.04 to 1.19; p=0.04) along with a lower probability of being severely wasted (-13 pp, 95% CI -0.23 to
-0.03; p=0.01); we did not see a statistically significant increase in HAZ and related decreases in
probability of stunting. The other program components (IHGMC and growth chart) did not suggest
any statistically significant difference by gender. Heterogeneity effects by child age and caste were
inconclusive (Appendix A).
Finally, we investigated the measures of caregiver knowledge, quality of diet and the home
environment that might have contributed to our findings (Appendix B: Table 2). There were two
results of note. First, we found that children in T1 were given a 0.09 SD (95% CI 0.01 to 0.18; p=0.04)
larger quantity of dairy products compared to the control, measured as a standardized difference of
an index for consuming multiple dairy food (index creation process detailed in Appendix F). Second,
we found that caregivers in T2 reported improved gender-related attitudes toward care, an increase of
0.17 SD (95% CI 0.01 to 0.32; p=0.04) in a standardized index for multiple categories of childcare
related questions, a larger quantity of fish and meat (0.10 SD, 95% CI 0.02 to 0.19; p=0.02) and a
greater dietary diversity score (0.35 SD, 95% CI -0.01 to 0.72; p=0.06). However, we did note that
caregivers in this arm also demonstrated a 0.22 SD decrease (95% CI -0.38 to -0.05; p=0.01) in general
healthcare knowledge.
Discussion We found three major results from our study. First, our study is one of the first studies demonstrating
the impact of regular IHGMC by CHWs on young children and we found a 0.42 SD gain in HAZ. To
put this estimate into perspective, a range of comparable studies found increases in HAZ that did not
exceed 0.25 SDs with time horizons ranging from a few months to two years.20,26-28 This is an important

10
finding because gains in height are harder to achieve and represent a relatively permanent positive
change in health, unlike weight which tends to respond quicker to a range of inputs. The gains in
height we documented are especially significant because these were realized during the COVID-19
pandemic, when income shocks resulted in severe nutritional deficiency in poor countries.4 Our
sample suffered aggregate welfare and health shocks; 75% of our sample reported that a member of
the household lost work and 76% reported a loss in income due to the pandemic.
Second, we found that the simple IHGMC intervention contributed the most to child
anthropometric outcomes. Specifically, we found that having IHGMC alone (T1) resulted in a 0.58
SD gain in HAZ but layering a growth chart and unconditional cash transfer on top of IHGMC yielded
positive albeit lower gains in child health. This suggests that there is some complexity that results in
these relatively lower gains. In our endline survey – seven months post-intervention – we specifically
asked whether the growth chart was still in use and whether they understood the primary function of
the chart. Use of growth chart was not universal in the treatment groups; households reported limited
use (14%) of the growth chart in the post intervention period. Moreover, they had questionable
understating of the chart; 60% failed to explain the main feature of the chart i.e., the red zone
indicating a stunted child. These facts suggest that more effort may be needed from CHWs in
explaining the growth charts to primary caregivers for greater understanding and usability.
Third, we found that the cash arm has a gendered effect: male-children in the cash transfer
arm differentially benefited on almost all anthropometric measures. Male-children in T3 had higher
HAZ, WAZ and WHZ scores; and lower probability of being severely stunted, severely wasted,
underweight or severely underweight. The simple IHGMC and IHGMC with growth chart, however,
did not show a gendered effect. These facts suggest that simplest intervention of IHGMC tends to
work equally well for children, irrespective of gender. Moreover, any program that chooses to add
cash transfers must carefully consider gender dynamics in their respective settings. Our study showed
that the cash transfer differentially benefited male children; this may be a consequence of local cultural
preferences, including son bias.29 If we plan cash transfers to equally benefit male and female children,
we may need to consider additional programming and counseling to encourage more equal allocation
of resources.
Our results have several implications. First, we have demonstrated the effectiveness of a
relatively simple intervention to induce gains in child height and weight by providing monthly nutrition
counseling and in-home growth monitoring through direct engagement of caregivers by CHWs.
Second, we effectively served households in an informal urban settlement. These communities are
typically underserved, having few formal high quality health facilities – which was exacerbated during
the COVID-19 pandemic. Third, our program has the potential for scale in dense urban settings where
homes are close to each other and CHWs do not need to carry equipment for long distances. We
followed the established CHW model that orients it for the possibility of scaling-up with other CHW
programs, which abound across the developing world. Our program proved to be relatively cost-
effective compared to similar interventions undertaken in Pakistan and elsewhere. The total monthly
cost of implementation per child in the IHGMC arm (T1) was $18 (including intervention,
implementation and administrative costs) and the cost per case of stunting averted by the intervention
was $360. To put these figures in perspective: a similar intervention in Pakistan involving responsive
stimulation and nutrition interventions that reported a monthly cost of $21 per child visited;30 and, an
experiment for reducing stunting and wasting undertaken in Pakistan estimated the minimum cost per
11
case of stunting averted at $1,107.31 Similar nutritional interventions in Latin America32 and Africa33
show a cost per case of stunting averted ranging from $202 to $536.
Out study has three limitations. First, we noticed sizable attrition of our sample. This is a
consequence of working in informal settlement areas which challenged our logistical capability.
Working in an urban informal settlement is difficult34,28 since there are no formal addresses and a large
proportion of the dwellers tend to out-migrate. Based on information from key informants, we
understood that this high rate of outmigration from the community is reasonable in our study site; as
the community is predominantly Pashtun immigrants from Khyber-Pakhtunkhwa, who are highly
mobile and frequently change address. This is not unusual for urban informal settings, where average
annual turnovers of 25% have been documented.34 Second, this reduced sample likely impacted our
ability to detect statistically significant differences in subgroup analysis. Finally, our treatment
assignment was at the household level. Despite the highly idiosyncratic nature of our program which
delivered household specific counseling and made child-specific measurements, households in our
treatment group may have shared some insights from their experiences with households in their
network. This has the potential to have positive spillover effect by contaminating the control group
making the impact estimates lower bounds.
Taken together, we have demonstrated a simple, low-cost and scalable intervention – home-
based regular growth monitoring and nutrition counseling by CHWs – to have substantial and sizable
impact on child HAZ and associated reduction in severe stunting, measured during the COVID-19
pandemic. Our findings suggest that regular IHGMC can increase resilience to malnutrition. These are
compelling findings, both to tackle the long-term challenge of child stunting and the short-term impact
during this global pandemic, providing an important and potential policy intervention for the low and
middle-income countries.

12
Contribution AS, AA and AK contributed to the conceptualization of the study design. MK was responsible for the
data curation. SM was responsible for the trial management and administration with supervision from
AS, AA, AK, MK, HK and AK. MK was responsible for data analysis with inputs from AS, AA, HK,
AK and TK. AS led the manuscript writing with critical inputs from AK, MK, HK and TK. All authors
discussed, critically revised, and approved the final version of the report for publication.
Declaration of interests We declare no competing interests.
Data sharing De-identified data and a data dictionary will be made available for individual patient data meta-analyses
with publication of the trial after approval of a proposal and signed data access agreement
Acknowledgements We are grateful to the Center for Economic Research in Pakistan for research support and Sukoon
Water for implementation support. Our sincere gratitude goes to our funders for funding our research:
World Bank, Shahid Hussain Foundation, Lahore University of Management Sciences, Hitotsubashi
University. We received useful feedback on our manuscript from Nathan Congdon, Jocelyn Finley,
Ashley Fox, Alaka Holla, Ghazala Mansuri, Atonu Rabbani, Kanako Yamashita-Allen, Aisha
Yousufzai, and Mazvita Zanamwe.

13
References
1. de Onis M, Blössner M, Borghi E. Prevalence and trends of stunting among pre-school
children, 1990–2020. Public Health Nutrition. 2011;15(1):142-148.
2. Vaivada T, Akseer N, Akseer S, Somaskandan A, Stefopulos M, Bhutta Z. Stunting in
childhood: an overview of global burden, trends, determinants, and drivers of decline. The
American Journal of Clinical Nutrition. 2020;112(Supplement_2):777S-791S.
3. Prendergast A, Humphrey J. The stunting syndrome in developing countries. Paediatrics and
International Child Health. 2014;34(4):250-265.
4. Egger D, Miguel E, Warren S, Shenoy A, Collins E, Karlan D et al. Falling living standards
during the COVID-19 crisis: Quantitative evidence from nine developing countries. Science
Advances. 2021;7(6).
5. Headey D, Heidkamp R, Osendarp S, Ruel M, Scott N, Black R et al. Impacts of COVID-19
on childhood malnutrition and nutrition-related mortality. The Lancet. 2020;396(10250):519-
521.
6. Fore H, Dongyu Q, Beasley D, Ghebreyesus T. Child malnutrition and COVID-19: the time
to act is now. The Lancet. 2020;396(10250):517-518.
7. Department of Child and Adolescent Health and Development (CAH) World Health
Organization. The importance of caregiver-child interactions for the survival and healthy
development of young children. Geneva, Switzerland; 2004.
8. Mistry S, Hossain M, Arora A. Maternal nutrition counselling is associated with reduced
stunting prevalence and improved feeding practices in early childhood: a post-program
comparison study. Nutrition Journal. 2019;18(1).
9. Yousafzai A, Obradović J, Rasheed M, Rizvi A, Portilla X, Tirado-Strayer N et al. Effects of
responsive stimulation and nutrition interventions on children's development and growth at
age 4 years in a disadvantaged population in Pakistan: a longitudinal follow-up of a cluster-
randomised factorial effectiveness trial. The Lancet Global Health. 2016;4(8):e548-e558.
10. Perry HB, Hodgins S. Health for the people: past, current, and future contributions of
national community health worker programs to achieving global health goals. Global Health:
Science and Practice. 2021 Mar 31;9(1):1-9.
11. Vaivada T, Akseer N, Akseer S, Somaskandan A, Stefopulos M, Bhutta Z. Stunting in
childhood: an overview of global burden, trends, determinants, and drivers of decline. The
American Journal of Clinical Nutrition. 2020;112(Supplement_2):777S-791S.
12. Ashworth A, Shrimpton R, Jamil K. Growth monitoring and promotion: review of evidence
of impact. Maternal & Child Nutrition. 2008;4(s1):86-117.
13. Galasso E, Weber A, Stewart C, Ratsifandrihamanana L, Fernald L. Effects of nutritional
supplementation and home visiting on growth and development in young children in
Madagascar: a cluster-randomised controlled trial. The Lancet Global Health. 2019;7(9):e1257-
e1268.
14. Swarthout J, Ram P, Arnold C, Dentz H, Arnold B, Kalungu S et al. Effects of Individual and
Combined Water, Sanitation, Handwashing, and Nutritional Interventions on Child
Respiratory Infections in Rural Kenya: A Cluster-Randomized Controlled Trial. The American
Journal of Tropical Medicine and Hygiene. 2020;102(6):1286-1295.

14
15. Kim K, Choi J, Choi E, Nieman C, Joo J, Lin F et al. Effects of Community-Based Health
Worker Interventions to Improve Chronic Disease Management and Care Among Vulnerable
Populations: A Systematic Review. American Journal of Public Health. 2016;106(4):e3-e28.
16. Manley J, Balarajan Y, Malm S, Harman L, Owens J, Murthy S, Stewart D, Winder-Rossi NE,
Khurshid A. Cash transfers and child nutritional outcomes: a systematic review and meta-
analysis. BMJ global health. 2020 Dec 1;5(12):e003621.
17. Ruel M, Alderman H. Nutrition-sensitive interventions and programmes: how can they help
to accelerate progress in improving maternal and child nutrition?. The Lancet.
2013;382(9891):536-551.
18. George S, Latham M, Frongillo E, Abel R, Ethirajan N. Evaluation of effectiveness of good
growth monitoring in south Indian villages. The Lancet. 1993;342(8867):348-352.
19. Shekar M, Latham M. Growth monitoring can and does work! An example from the Tamil
Nadu integrated nutrition Project in rural South India. The Indian Journal of Pediatrics.
1992;59(1):5-15.
20. Fink G, Levenson R, Tembo S, Rockers P. Home- and community-based growth monitoring
to reduce early life growth faltering: an open-label, cluster-randomized controlled trial. The
American Journal of Clinical Nutrition. 2017;106(4):1070-1077.
21. National Institute of Population Studies (NIPS) [Pakistan] and ICF. Pakistan Demographic
and Health Survey 2017-18. Islamabad, Pakistan and Rockville, Maryland, USA: NIPS and
IPS; 2019.
22. Child nutrition and COVID-19 - UNICEF DATA [Internet]. UNICEF DATA. 2021 [cited
24 December 2021]. Available from: https://data.unicef.org/topic/nutrition/child-nutrition-
and-covid-19/
23. Iacus S, King G, Porro G. Causal Inference without Balance Checking: Coarsened Exact
Matching. Political Analysis. 2012;20(1):1-24.
24. The WHO Child Growth Standards [Internet]. Who.int. 2021 [cited 24 December 2021].
Available from: https://www.who.int/tools/child-growth-standards
25. de Onis M. Development of a WHO growth reference for school-aged children and
adolescents. Bulletin of the World Health Organization. 2007;85(09):660-667.
26. Roy, S. K., Fuchs, G. J., Mahmud, Z., Ara, G., Islam, S., Shafique, S., Chakraborty, B. Intensive
nutrition education with or without supplementary feeding improves the nutritional status of
moderately-malnourished children in Bangladesh. Journal of Health, Population and
Nutrition. 2005, 320-330
27. Zaman, S., Ashraf, R. N., Martines, J. Training in complementary feeding counselling of
healthcare workers and its influence on maternal behaviours and child growth: a cluster-
randomized controlled trial in Lahore, Pakistan. Journal of health, population, and nutrition.
2008, 26(2), 210.
28. Rains, E., Krishna, A., & Webbels, E. Urbanisation and India’s Slum Continuum: Evidence
on the range of policy needs and scope of mobility. London: International Growth Center.
2018; Retrieved from https://www.theigc.org/wp-content/uploads/2018/02/Rains-et-
al_Working-paper_cover.pdf
29. Jayachandran S, Pande R. Why are Indian children so short? The role of birth order and son
preference. American Economic Review. 2017 Sep;107(9):2600-29.
15
30. Gowani S, Yousafzai A, Armstrong R, Bhutta Z. Cost effectiveness of responsive stimulation
and nutrition interventions on early child development outcomes in Pakistan. Annals of the
New York Academy of Sciences. 2014;1308(1):149-161.
31. Trenouth L, Colbourn T, Fenn B, Pietzsch S, Myatt M, Puett C. The cost of preventing
undernutrition: cost, cost-efficiency and cost-effectiveness of three cash-based interventions
on nutrition outcomes in Dadu, Pakistan. Health Policy and Planning. 2018;33(6):743-754.
32. Waters, H. R., Penny, M. E., Creed-Kanashiro, H. M., Robert, R. C., Narro, R., Willis, J., Black,
R. E. The cost-effectiveness of a child nutrition education programme in Peru. Health Policy
and Planning. 2006;21(4):257-264.
33. Shekar M, Dayton Eberwein J, Kakietek J. The costs of stunting in South Asia and the benefits
of public investments in nutrition. Maternal & Child Nutrition. 2016;12:186-195.
34. Krishna A, Sriram M, Prakash P. Slum types and adaptation strategies: identifying policy-
relevant differences in Bangalore. Environment and Urbanization. 2014;26(2):568-585.

16
Figure 1: Trial Profile
Assessed for eligibility (n=4,166)
Excluded (n=2,978):
- Ineligible and/or refused
Randomised 1:1:1 (n=1,188)
T1 (n=396):
- Received at least one-cycle (n=301)
- Unable to contact
(informal settlement with migration and weak
address system) (n=95)
T2 (n=396):
- Received at least one-cycle (n=303)
- Unable to contact
(informal settlement with migration and weak
address system) (n=93)
T3 (n=396):
- Received at least one-cycle (n=318)
- Unable to contact
(informal settlement with migration and weak
address system) (n=78)
C (n=451)
Recruited at endline
Analyzed (n=198):
- Excluded from analysis (not
matched) (n=49)
Analyzed (n=208):
- Excluded from analysis (not
matched) (n=35)
Analyzed (n=230):
- Excluded from analysis (not
matched) (n=65)
Analyzed (n=410):
- Excluded from analysis (not
matched) (n=48)
Lost to follow up (unable to
recontact because of
migration) (n=147)
Lost to follow up (unable to
recontact because of
migration) (n=138)
Lost to follow up (unable to
recontact because of
migration) (n=113)

17

18
Table 1: Demographic Characteristics
(1) (2) (3) (4) Control Treatment-1 (T1) Treatment-2 (T2) Treatment-3 (T3)
Household Size 7·846 8·737 9·091 8·496
(4·320) (4·443) (4·551) (4·151) Child's Age 25·70 26·11 25·48 25·53
(6·802) (5·730) (5·684) (5·808) Father's Education No Education 223 91 104 103
(54·52) (46·19) (50·24) (44·98) Primary 51 37 21 29
(12·47) (18·78) (10·14) (12·66) Middle 37 22 31 37
(9·046) (11·17) (14·98) (16·16) Matric 45 30 41 38
(11·00) (15·23) (19·81) (16·59) Intermediate 23 12 5 14
(5·623) (6·091) (2·415) (6·114) Undergraduate 11 5 2 7
(2·689) (2·538) (0·966) (3·057) Master's/PhD 19 0 3 1
(4·645) (0·0) (1·449) (0·437) Mother's Education No Education 278 135 144 153
(67·80) (68·18) (69·23) (66·52) Primary 36 25 32 30
(8·780) (12·63) (15·38) (13·04) Middle 21 20 17 19
(5·122) (10·10) (8·173) (8·261) Matric 33 13 12 22
(8·049) (6·566) (5·769) (9·565) Intermediate 14 2 2 3
(3·415) (1·010) (0·962) (1·304) Undergraduate 9 3 1 1
(2·195) (1·515) (0·481) (0·435) Master's/PhD 19 0 0 2
(4·634) (0·0) (0·0) (0·870) Neighborhood Neighborhood 1 158 70 77 73
(38·73) (35·35) (37·02) (31·74) Neighborhood 2 66 31 42 55
(16·18) (15·66) (20·19) (23·91) Neighborhood 3 32 25 19 23
(7·843) (12·63) (9·135) (10) Neighborhood 4 77 36 40 43
(18·87) (18·18) (19·23) (18·70) Neighborhood 5 75 36 30 36
(18·38) (18·18) (14·42) (15·65) Language Urdu 3 2 2 2
(0·732) (1·010) (0·962) (0·870) Sindhi 6 3 2 1
(1·463) (1·515) (0·962) (0·435) Punjabi 56 16 19 18
(13·66) (8·081) (9·135) (7·826) Pushto 278 146 166 179
(67·80) (73·74) (79·81) (77·83)

19
Siraki 64 30 19 29
(15·61) (15·15) (9·135) (12·61) Balochi 3 0 0 0
(0·732) (0·0) (0·0) (0·0) Persian 0 1 0 1
(0·0) (0·505) (0·0) (0·435) Child's Gender Female 184 104 87 112
(44·88) (52·53) (41·83) (48·70) Male 226 94 121 118
(55·12) (47·47) (58·17) (51·30) Ethnicity Other 307 146 162 170
(74·88) (73·74) (77·88) (73·91) Marginalized Caste 103 52 46 60
(25·12) (26·26) (22·12) (26·09)
Observations 410 198 208 230
Continuous variables are presented as mean (SD). Categorical variables are presented as N (%). *No
Education is a category for no schooling or incomplete schooling; if the parent has not completed at
least one year of schooling i.e. illiterate, did not complete Grade-1, attended vocational training or
madarassa education.

20
Table 2: Primary Outcomes: Aggregated, Disaggregated & Reclassified Treatment Effects
Panel A: Aggregated Estimate SE t-stat p-value 95% CI (LB) 95% CI (UB) N
Height-for-Age Treated 0·42 0·1 4·34 0 0·23 0·61 636 Control Mean -1·86 410 Weight-for-Age Treated 0·25 0·1 2·66 0·01 0·07 0·44 790 Control Mean -1·55 410 Panel B: Disaggregated Estimate SE t-stat p-value 95% CI (LB) 95% CI (UB) N
Height-for-Age T1 0·58 0·13 4·52 0 0·33 0·83 198 T2 0·35 0·12 2·85 0 0·11 0·59 208 T3 0·36 0·12 2·95 0 0·12 0·59 230 Control Mean -1·86 410 Weight-for-Age T1 0·43 0·12 3·58 0 0·2 0·67 198 T2 0·26 0·12 2·13 0·03 0·02 0·49 208 T3 0·1 0·12 0·8 0·42 -0·14 0·33 230 Control Mean -1·55 410 Panel C: Reclassified Estimate SE t-stat p-value 95% CI (LB) 95% CI (UB) N
Height-for-Age Counseling 0·58 0·13 4·52 0 0·33 0·83 636 Growth chart -0·23 0·13 -1·67 0·09 -0·49 0·04 438 Cash transfer 0·01 0·13 0·04 0·97 -0·25 0·26 230 Control Mean -1·86 410 Weight-for-Age Counseling 0·43 0·12 3·58 0 0·2 0·67 636 Growth chart -0·18 0·13 -1·39 0·17 -0·43 0·07 438 Cash transfer -0·16 0·13 -1·29 0·2 -0·41 0·08 230 Control Mean -1·55 410
Results for primary outcomes of height-for-age z-scores (HAZ) and weight-for-age z-scores (WAZ) at endline. Three
panels show results for aggregated treatment (panel A), disaggregated treatments (panel B) and reclassified treatments
(panel C). Estimates column shows mean difference compared to control, estimated using an OLS regression. Mean value
in control is shown for both outcomes.
21
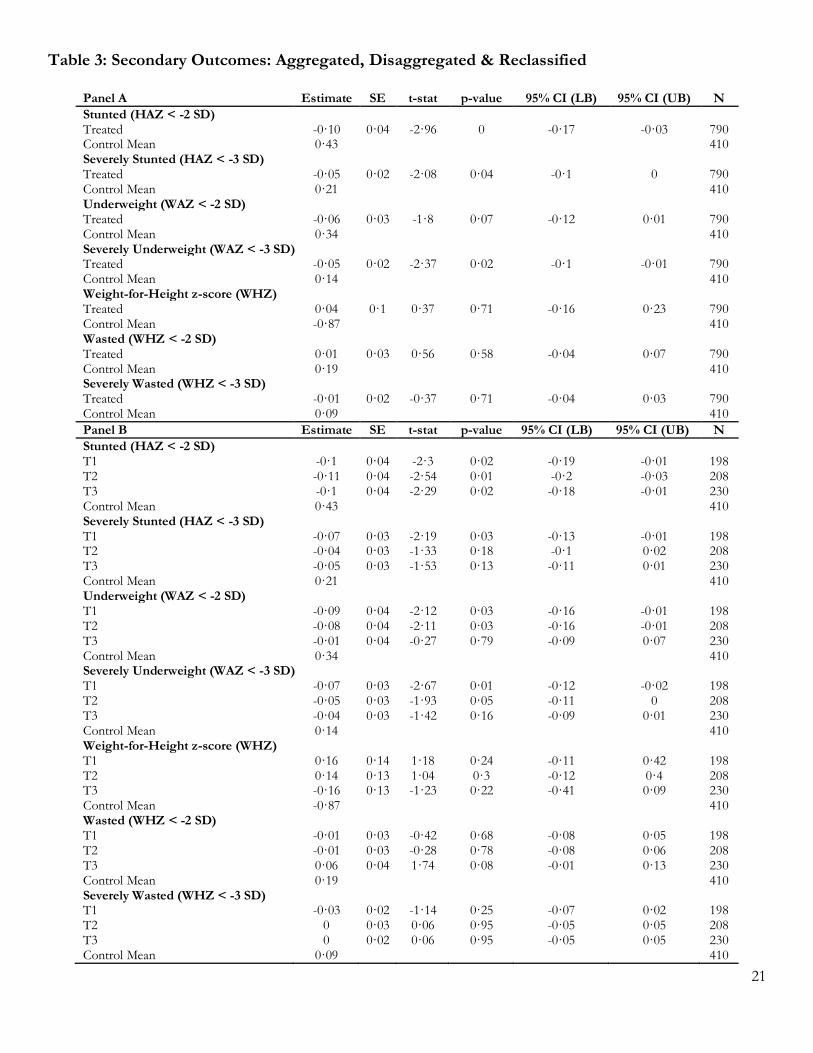
Table 3: Secondary Outcomes: Aggregated, Disaggregated & Reclassified
Panel A Estimate SE t-stat p-value 95% CI (LB) 95% CI (UB) N
Stunted (HAZ < -2 SD) Treated -0·10 0·04 -2·96 0 -0·17 -0·03 790 Control Mean 0·43 410 Severely Stunted (HAZ < -3 SD)
Treated -0·05 0·02 -2·08 0·04 -0·1 0 790 Control Mean 0·21 410 Underweight (WAZ < -2 SD)
Treated -0·06 0·03 -1·8 0·07 -0·12 0·01 790 Control Mean 0·34 410 Severely Underweight (WAZ < -3 SD) Treated -0·05 0·02 -2·37 0·02 -0·1 -0·01 790 Control Mean 0·14 410 Weight-for-Height z-score (WHZ) Treated 0·04 0·1 0·37 0·71 -0·16 0·23 790 Control Mean -0·87 410 Wasted (WHZ < -2 SD)
Treated 0·01 0·03 0·56 0·58 -0·04 0·07 790 Control Mean 0·19 410 Severely Wasted (WHZ < -3 SD)
Treated -0·01 0·02 -0·37 0·71 -0·04 0·03 790 Control Mean 0·09 410
Panel B Estimate SE t-stat p-value 95% CI (LB) 95% CI (UB) N
Stunted (HAZ < -2 SD)
T1 -0·1 0·04 -2·3 0·02 -0·19 -0·01 198 T2 -0·11 0·04 -2·54 0·01 -0·2 -0·03 208 T3 -0·1 0·04 -2·29 0·02 -0·18 -0·01 230 Control Mean 0·43 410 Severely Stunted (HAZ < -3 SD)
T1 -0·07 0·03 -2·19 0·03 -0·13 -0·01 198 T2 -0·04 0·03 -1·33 0·18 -0·1 0·02 208 T3 -0·05 0·03 -1·53 0·13 -0·11 0·01 230 Control Mean 0·21 410 Underweight (WAZ < -2 SD)
T1 -0·09 0·04 -2·12 0·03 -0·16 -0·01 198 T2 -0·08 0·04 -2·11 0·03 -0·16 -0·01 208 T3 -0·01 0·04 -0·27 0·79 -0·09 0·07 230 Control Mean 0·34 410 Severely Underweight (WAZ < -3 SD)
T1 -0·07 0·03 -2·67 0·01 -0·12 -0·02 198 T2 -0·05 0·03 -1·93 0·05 -0·11 0 208 T3 -0·04 0·03 -1·42 0·16 -0·09 0·01 230 Control Mean 0·14 410 Weight-for-Height z-score (WHZ)
T1 0·16 0·14 1·18 0·24 -0·11 0·42 198 T2 0·14 0·13 1·04 0·3 -0·12 0·4 208 T3 -0·16 0·13 -1·23 0·22 -0·41 0·09 230 Control Mean -0·87 410 Wasted (WHZ < -2 SD)
T1 -0·01 0·03 -0·42 0·68 -0·08 0·05 198 T2 -0·01 0·03 -0·28 0·78 -0·08 0·06 208 T3 0·06 0·04 1·74 0·08 -0·01 0·13 230 Control Mean 0·19 410 Severely Wasted (WHZ < -3 SD)
T1 -0·03 0·02 -1·14 0·25 -0·07 0·02 198 T2 0 0·03 0·06 0·95 -0·05 0·05 208 T3 0 0·02 0·06 0·95 -0·05 0·05 230 Control Mean 0·09 410

22
Panel C Estimate SE t-stat p-value 95% CI (LB) 95% CI (UB) N
Stunted (HAZ < -2 SD)
Counseling -0·1 0·04 -2·3 0·02 -0·19 -0·01 636 Growth chart -0·01 0·05 -0·19 0·85 -0·1 0·08 438 Cash transfer 0·01 0·04 0·29 0·77 -0·07 0·1 230 Control Mean 0·43 410 Severely Stunted (HAZ < -3 SD)
Counseling -0·07 0·03 -2·19 0·03 -0·13 -0·01 636 Growth chart 0·02 0·03 0·76 0·45 -0·04 0·09 438 Cash transfer 0 0·03 -0·14 0·89 -0·07 0·06 230 Control Mean 0·21 410 Underweight (WAZ < -2 SD)
Counseling -0·09 0·04 -2·12 0·03 -0·16 -0·01 636 Growth chart 0 0·04 0·03 0·98 -0·08 0·08 438 Cash transfer 0·07 0·04 1·74 0·08 -0·01 0·16 230 Control Mean 0·34 410 Severely Underweight (WAZ < -3 SD)
Counseling -0·07 0·03 -2·67 0·01 -0·12 -0·02 636 Growth chart 0·02 0·03 0·67 0·5 -0·03 0·07 438 Cash transfer 0·01 0·03 0·51 0·61 -0·04 0·07 230 Control Mean 0·14 410 Weight-for-Height z-score (WHZ)
Counseling 0·16 0·14 1·18 0·24 -0·11 0·42 636 Growth chart -0·02 0·15 -0·14 0·89 -0·32 0·28 438 Cash transfer -0·3 0·15 -2·01 0·05 -0·59 -0·01 230 Control Mean -0·87 410 Wasted (WHZ < -2 SD)
Counseling -0·01 0·03 -0·42 0·68 -0·08 0·05 636 Growth chart 0 0·04 0·13 0·9 -0·07 0·08 438 Cash transfer 0·07 0·04 1·88 0·06 0 0·15 230 Control Mean 0·19 410 Severely Wasted (WHZ < -3 SD)
Counseling -0·03 0·02 -1·14 0·25 -0·07 0·02 636 Growth chart 0·03 0·03 1·08 0·28 -0·02 0·08 438 Cash transfer 0 0·03 0 1 -0·05 0·05 230 Control Mean 0·09 410
Results for secondary outcomes at endline. Three panels show results for aggregated treatment (panel A), disaggregated treatments
(panel B) and reclassified treatments (panel C). Estimates column shows mean difference compared to control, estimated using
an OLS regression. Mean value in control is shown for all outcomes.

23
Table 4: Gender Analysis Estimate SE t-stat p-value LB UB N Estimate SE t-stat p-value LB UB N
HAZ HAZ
T1 0·55 0·18 3·06 0 0·2 0·9 198 Counseling 0·55 0·18 3·06 0 0·2 0·9 636 T2 0·17 0·17 1·01 0·31 -0·16 0·49 208 Growth chart -0·38 0·19 -2·05 0·04 -0·74 -0·02 438 T3 0·12 0·17 0·69 0·49 -0·21 0·45 230 Cash transfer -0·05 0·17 -0·3 0·77 -0·4 0·29 230 Male -0·2 0·16 -1·21 0·23 -0·51 0·12 559 Male -0·2 0·16 -1·21 0·23 -0·51 0·12 559 T1 x Male 0·04 0·25 0·16 0·87 -0·46 0·54 94 Counseling x Male 0·04 0·25 0·16 0·87 -0·46 0·54 333 T2 x Male 0·34 0·24 1·39 0·17 -0·14 0·81 121 Growth chart x Male 0·3 0·27 1·11 0·27 -0·23 0·82 239 T3 x Male 0·46 0·24 1·94 0·05 -0·01 0·94 118 Cash transfer x Male 0·13 0·25 0·51 0·61 -0·37 0·63 118 Control Mean -1·86 410 Control Mean -1·86 410 WAZ
WAZ T1 0·43 0·16 2·63 0·01 0·11 0·75 198 Counseling 0·43 0·16 2·63 0·01 0·11 0·75 636 T2 0·26 0·16 1·57 0·12 -0·06 0·58 208 Growth chart -0·18 0·18 -0·98 0·33 -0·53 0·18 438 T3 -0·23 0·16 -1·45 0·15 -0·54 0·08 230 Cash transfer -0·48 0·17 -2·79 0·01 -0·83 -0·14 230 Male -0·19 0·16 -1·18 0·24 -0·5 0·12 559 Male -0·19 0·16 -1·18 0·24 -0·5 0·12 559 T1 x Male -0·01 0·24 -0·04 0·97 -0·48 0·47 94 Counseling x Male -0·01 0·24 -0·04 0·97 -0·48 0·47 333 T2 x Male 0·02 0·24 0·1 0·92 -0·44 0·49 121 Growth chart x Male 0·03 0·25 0·13 0·89 -0·47 0·53 239 T3 x Male 0·63 0·23 2·69 0·01 0·17 1·09 118 Cash transfer x Male 0·61 0·25 2·44 0·01 0·12 1·09 118 Control Mean -1·55 410 Control Mean -1·55 410 WHZ
WHZ T1 0·16 0·19 0·83 0·41 -0·21 0·53 198 Counseling 0·16 0·19 0·83 0·41 -0·21 0·53 636 T2 0·16 0·18 0·92 0·36 -0·19 0·51 208 Growth chart 0 0·21 0·02 0·98 -0·41 0·42 438 T3 -0·47 0·18 -2·58 0·01 -0·82 -0·11 230 Cash transfer -0·63 0·2 -3·08 0 -1·03 -0·23 230 Male -0·3 0·16 -1·94 0·05 -0·61 0 559 Male -0·3 0·16 -1·94 0·05 -0·61 0 559 T1 x Male -0·02 0·27 -0·09 0·93 -0·55 0·5 94 Counseling x Male -0·02 0·27 -0·09 0·93 -0·55 0·5 333 T2 x Male -0·01 0·26 -0·04 0·97 -0·52 0·5 121 Growth chart x Male 0·01 0·3 0·05 0·96 -0·58 0·61 239 T3 x Male 0·6 0·26 2·35 0·02 0·1 1·11 118 Cash transfer x Male 0·61 0·29 2·11 0·04 0·04 1·19 118 Control Mean -0·87 410 Control Mean -0·87 410 Stunted (HAZ < -2 SD)
Stunted (HAZ < -2 SD)
T1 -0·09 0·06 -1·44 0·15 -0·22 0·03 198 Counseling -0·09 0·06 -1·44 0·15 -0·22 0·03 636 T2 -0·09 0·07 -1·34 0·18 -0·22 0·04 208 Growth chart 0 0·07 0·04 0·97 -0·13 0·13 438 T3 -0·04 0·06 -0·68 0·5 -0·17 0·08 230 Cash transfer 0·05 0·07 0·69 0·49 -0·09 0·18 230 Male 0·03 0·06 0·47 0·64 -0·09 0·15 559 Male 0·03 0·06 0·47 0·64 -0·09 0·15 559 T1 x Male -0·02 0·09 -0·19 0·85 -0·19 0·16 94 Counseling x Male -0·02 0·09 -0·19 0·85 -0·19 0·16 333 T2 x Male -0·04 0·09 -0·43 0·66 -0·21 0·14 121 Growth chart x Male -0·02 0·09 -0·23 0·81 -0·2 0·16 239 T3 x Male -0·11 0·09 -1·23 0·22 -0·27 0·06 118 Cash transfer x Male -0·07 0·09 -0·75 0·45 -0·24 0·11 118 Control Mean 0·43 410 Control Mean 0·43 410 Severely Stunted (HAZ < -3 SD)
Severely Stunted (HAZ < -3 SD)
T1 0 0·04 -0·11 0·91 -0·08 0·07 198 Counseling 0 0·04 -0·11 0·91 -0·08 0·07 636 T2 0·01 0·04 0·15 0·88 -0·08 0·09 208 Growth chart 0·01 0·05 0·23 0·82 -0·08 0·1 438 T3 0·02 0·04 0·56 0·58 -0·06 0·1 230 Cash transfer 0·02 0·05 0·34 0·74 -0·08 0·11 230 Male 0·1 0·04 2·5 0·01 0·02 0·18 559 Male 0·1 0·04 2·5 0·01 0·02 0·18 559 T1 x Male -0·12 0·06 -2·03 0·04 -0·24 0 94 Counseling x Male -0·12 0·06 -2·03 0·04 -0·24 0 333

24
T2 x Male -0·09 0·06 -1·51 0·13 -0·22 0·03 121 Growth chart x Male 0·03 0·06 0·41 0·68 -0·1 0·15 239 T3 x Male -0·13 0·06 -2·24 0·03 -0·25 -0·02 118 Cash transfer x Male -0·04 0·06 -0·61 0·54 -0·17 0·09 118 Control Mean 0·21 410 Control Mean 0·21 410 Wasted (WHZ < -2 SD)
Wasted (WHZ < -2 SD)
T1 0 0·05 -0·02 0·98 -0·09 0·09 198 Counseling 0 0·05 -0·02 0·98 -0·09 0·09 636 T2 -0·04 0·05 -0·87 0·38 -0·13 0·05 208 Growth chart -0·04 0·05 -0·83 0·41 -0·13 0·05 438 T3 0·08 0·05 1·53 0·13 -0·02 0·18 230 Cash transfer 0·12 0·05 2·3 0·02 0·02 0·22 230 Male 0·04 0·04 0·98 0·33 -0·04 0·13 559 Male 0·04 0·04 0·98 0·33 -0·04 0·13 559 T1 x Male -0·02 0·07 -0·36 0·72 -0·16 0·11 94 Counseling x Male -0·02 0·07 -0·36 0·72 -0·16 0·11 333 T2 x Male 0·05 0·07 0·74 0·46 -0·08 0·18 121 Growth chart x Male 0·07 0·07 1·02 0·31 -0·07 0·21 239 T3 x Male -0·03 0·07 -0·44 0·66 -0·17 0·11 118 Cash transfer x Male -0·08 0·07 -1·07 0·28 -0·23 0·07 118 Control Mean 0·19 410 Control Mean 0·19 410 Severely Wasted (WHZ < -3 SD)
Severely Wasted (WHZ < -3 SD)
T1 0·02 0·03 0·73 0·47 -0·04 0·08 198 Counseling 0·02 0·03 0·73 0·47 -0·04 0·08 636 T2 0 0·03 0·05 0·96 -0·06 0·06 208 Growth chart -0·02 0·03 -0·62 0·54 -0·09 0·05 438 T3 0·07 0·04 2·02 0·04 0 0·14 230 Cash transfer 0·07 0·04 1·83 0·07 0 0·14 230 Male 0·07 0·03 2·33 0·02 0·01 0·13 559 Male 0·07 0·03 2·33 0·02 0·01 0·13 559 T1 x Male -0·1 0·05 -2·13 0·03 -0·18 -0·01 94 Counseling x Male -0·1 0·05 -2·13 0·03 -0·18 -0·01 333 T2 x Male -0·01 0·05 -0·16 0·87 -0·1 0·09 121 Growth chart x Male 0·09 0·05 1·79 0·07 -0·01 0·19 239 T3 x Male -0·14 0·05 -2·83 0 -0·23 -0·04 118 Cash transfer x Male -0·13 0·05 -2·46 0·01 -0·23 -0·03 118 Control Mean 0·09 410 Control Mean 0·09 410 Underweight (WAZ < -2 SD)
Underweight (WAZ < -2 SD)
T1 -0·05 0·05 -1 0·32 -0·16 0·05 198 Counseling -0·05 0·05 -1 0·32 -0·16 0·05 636 T2 -0·06 0·06 -1·06 0·29 -0·17 0·05 208 Growth chart -0·01 0·06 -0·1 0·92 -0·12 0·11 438 T3 0·06 0·06 1·04 0·3 -0·05 0·17 230 Cash transfer 0·12 0·06 1·97 0·05 0 0·24 230 Male 0·11 0·05 2·11 0·04 0·01 0·22 559 Male 0·11 0·05 2·11 0·04 0·01 0·22 559 T1 x Male -0·06 0·08 -0·71 0·48 -0·21 0·1 94 Counseling x Male -0·06 0·08 -0·71 0·48 -0·21 0·1 333 T2 x Male -0·06 0·08 -0·7 0·49 -0·21 0·1 121 Growth chart x Male 0 0·08 0·02 0·98 -0·16 0·17 239 T3 x Male -0·14 0·08 -1·73 0·08 -0·3 0·02 118 Cash transfer x Male -0·08 0·08 -1 0·32 -0·25 0·08 118 Control Mean 0·34 410 Control Mean 0·34 410 Severely Underweight (WAZ < -3 SD)
Severely Underweight (WAZ < -3 SD) T1 -0·01 0·04 -0·34 0·73 -0·08 0·06 198 Counseling -0·01 0·04 -0·34 0·73 -0·08 0·06 636 T2 -0·04 0·03 -1·29 0·2 -0·11 0·02 208 Growth chart -0·03 0·04 -0·87 0·38 -0·1 0·04 438 T3 0·06 0·04 1·35 0·18 -0·03 0·14 230 Cash transfer 0·1 0·04 2·41 0·02 0·02 0·18 230 Male 0·08 0·04 2·12 0·03 0·01 0·16 559 Male 0·08 0·04 2·12 0·03 0·01 0·16 559 T1 x Male -0·12 0·05 -2·26 0·02 -0·22 -0·02 94 Counseling x Male -0·12 0·05 -2·26 0·02 -0·22 -0·02 333 T2 x Male -0·03 0·05 -0·52 0·6 -0·13 0·08 121 Growth chart x Male 0·09 0·05 1·79 0·07 -0·01 0·19 239 T3 x Male -0·19 0·05 -3·38 0 -0·29 -0·08 118 Cash transfer x Male -0·16 0·05 -2·97 0 -0·26 -0·05 118 Control Mean 0·14 410 Control Mean 0·14 410
Results for primary and secondary outcomes at endline showing interaction with dummy for male child. Two panels show results for disaggregated treatments (LHS panel) and
reclassified treatments (RHS panel). Estimates column shows mean difference compared to control, estimated using an OLS regression. Interaction term shows estimates for
male children in treatment conditions. Mean value in control is shown for all outcomes.

Appendix A: Additional Tables and Figures for Main Results
In this appendix, nine figures and nine tables regarding main results reported in the text are shown. Their numbering shows
the correspondence between the figures and tables. For example please see Table 1 of Appendix A for the coefficients plotted
in Figure 1 of Appendix A.

Figures:

Figure 1: Aggregated Treatment Effect
Figure 2: Disaggregated Treatment Effect
-.2
0
.2
.4
.6
Treated Treated Treated Treated Treated Treated Treated Treated Treated
HAZ StuntedSeverelyStunted
WHZ WastedSeverelyWasted
WAZ UnderweightSeverely
Underweight
Outcomes: Treatments vs Matched Control
-.5
0
.5
1
T1 T2 T3 T1 T2 T3 T1 T2 T3 T1 T2 T3 T1 T2 T3 T1 T2 T3 T1 T2 T3 T1 T2 T3 T1 T2 T3
HAZ StuntedSeverelyStunted
WHZ WastedSeverelyWasted
WAZ UnderweightSeverely
Underweight
Outcomes: Treatments vs Matched Control

Figure 3: Reclassified Treatment Effect
Figure 4: Disaggregated Treatment Heterogeneity Analysis for Male Child
-.5
0
.5
1
Counselin
g
Gro
wth
chart
Cash
Counselin
g
Gro
wth
chart
Cash
Counselin
g
Gro
wth
chart
Cash
Counselin
g
Gro
wth
chart
Cash
Counselin
g
Gro
wth
chart
Cash
Counselin
g
Gro
wth
chart
Cash
Counselin
g
Gro
wth
chart
Cash
Counselin
g
Gro
wth
chart
Cash
Counselin
g
Gro
wth
chart
Cash
HAZ StuntedSeverelyStunted
WHZ WastedSeverelyWasted
WAZ UnderweightSeverely
Underweight
Outcomes: Reclassified Treatments vs Matched Control
-.5
0
.5
1
T1 T2 T3 T1 T2 T3 T1 T2 T3 T1 T2 T3 T1 T2 T3 T1 T2 T3 T1 T2 T3 T1 T2 T3 T1 T2 T3
HAZ StuntedSeverelyStunted
WHZ WastedSeverelyWasted
WAZ UnderweightSeverely
Underweight
Outcomes: Treatments vs Matched Control by Child Gender

Figure 5: Reclassified Treatment Heterogeneity Analysis for Male Child
Figure 6: Disaggregated Treatment Heterogeneity Analysis for Marginalized Ethnicity
-.5
0
.5
1
Counselin
g
Gro
wth
chart
Cash
Counselin
g
Gro
wth
chart
Cash
Counselin
g
Gro
wth
chart
Cash
Counselin
g
Gro
wth
chart
Cash
Counselin
g
Gro
wth
chart
Cash
Counselin
g
Gro
wth
chart
Cash
Counselin
g
Gro
wth
chart
Cash
Counselin
g
Gro
wth
chart
Cash
Counselin
g
Gro
wth
chart
Cash
HAZ StuntedSeverelyStunted
WHZ WastedSeverelyWasted
WAZ UnderweightSeverely
Underweight
Outcomes: Reclassified Treatments vs Matched Control by Child Gender
-1.5
-1
-.5
0
.5
T1 T2 T3 T1 T2 T3 T1 T2 T3 T1 T2 T3 T1 T2 T3 T1 T2 T3 T1 T2 T3 T1 T2 T3 T1 T2 T3
HAZ StuntedSeverelyStunted
WHZ WastedSeverelyWasted
WAZ UnderweightSeverely
Underweight
Outcomes: Treatments vs Matched Control by Marginalized Ethnicity

Figure 7: Reclassified Treatment Heterogeneity Analysis for Marginalized Ethnicity
Figure 8: Disaggregated Treatment Heterogeneity Analysis for Young Children
-1
0
1
Counselin
g
Gro
wth
chart
Cash
Counselin
g
Gro
wth
chart
Cash
Counselin
g
Gro
wth
chart
Cash
Counselin
g
Gro
wth
chart
Cash
Counselin
g
Gro
wth
chart
Cash
Counselin
g
Gro
wth
chart
Cash
Counselin
g
Gro
wth
chart
Cash
Counselin
g
Gro
wth
chart
Cash
Counselin
g
Gro
wth
chart
Cash
HAZ StuntedSeverelyStunted
WHZ WastedSeverelyWasted
WAZ UnderweightSeverely
Underweight
Outcomes: Reclassified Treatments vs Matched Control by Marginalized Ethnicity
-1
-.5
0
.5
T1 T2 T3 T1 T2 T3 T1 T2 T3 T1 T2 T3 T1 T2 T3 T1 T2 T3 T1 T2 T3 T1 T2 T3 T1 T2 T3
HAZ StuntedSeverelyStunted
WHZ WastedSeverelyWasted
WAZ UnderweightSeverely
Underweight
Outcomes: Treatments vs Matched Control by Baseline Age <= 8-months
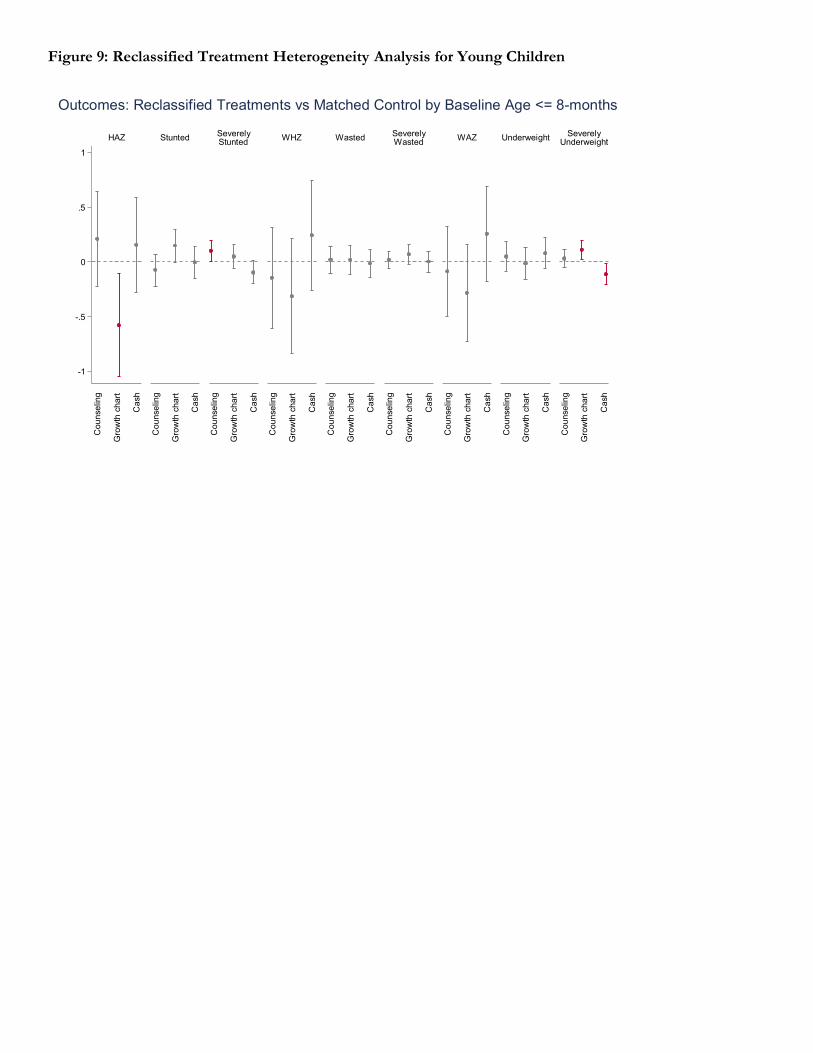
Figure 9: Reclassified Treatment Heterogeneity Analysis for Young Children
-1
-.5
0
.5
1
Counselin
g
Gro
wth
chart
Cash
Counselin
g
Gro
wth
chart
Cash
Counselin
g
Gro
wth
chart
Cash
Counselin
g
Gro
wth
chart
Cash
Counselin
g
Gro
wth
chart
Cash
Counselin
g
Gro
wth
chart
Cash
Counselin
g
Gro
wth
chart
Cash
Counselin
g
Gro
wth
chart
Cash
Counselin
g
Gro
wth
chart
Cash
HAZ StuntedSeverelyStunted
WHZ WastedSeverelyWasted
WAZ UnderweightSeverely
Underweight
Outcomes: Reclassified Treatments vs Matched Control by Baseline Age <= 8-months

Tables:

Table 1: Aggregated Treatment Effect
Estimate SE t-stat p-value 95% Confidence
Interval
Height-for-Age
All treatment conditions 0·42 0·10 4·34 0·00 0·23 0·61
Weight-for-Age
All treatment conditions 0·25 0·10 2·66 0·01 0·07 0·44
Weight-for-Height
All treatment conditions 0·04 0·10 0·37 0·71 -0·16 0·23
Stunted (Height-for-Age z-score < -2 SD)
All treatment conditions -0·10 0·04 -2·96 0·00 -0·17 -0·03
Severely Stunted (Height-for-Age z-score < -3 SD)
All treatment conditions -0·05 0·02 -2·08 0·04 -0·10 0·00
Wasted (Weight-for-Height z-score < -2 SD)
All treatment conditions 0·01 0·03 0·56 0·58 -0·04 0·07
Severely Wasted (Weight-for-Height z-score < -3 SD)
All treatment conditions -0·01 0·02 -0·37 0·71 -0·04 0·03
Underweight (Weight-for-Age z-score < -2 SD)
All treatment conditions -0·06 0·03 -1·80 0·07 -0·12 0·01
Severely Underweight (Weight-for-Age z-score < -3 SD)
All treatment conditions -0·05 0·02 -2·37 0·02 -0·10 -0·01
Note: Outcome variable regressed on aggregated treatment variable. Regressions are based on robust standard errors with 95% CI.
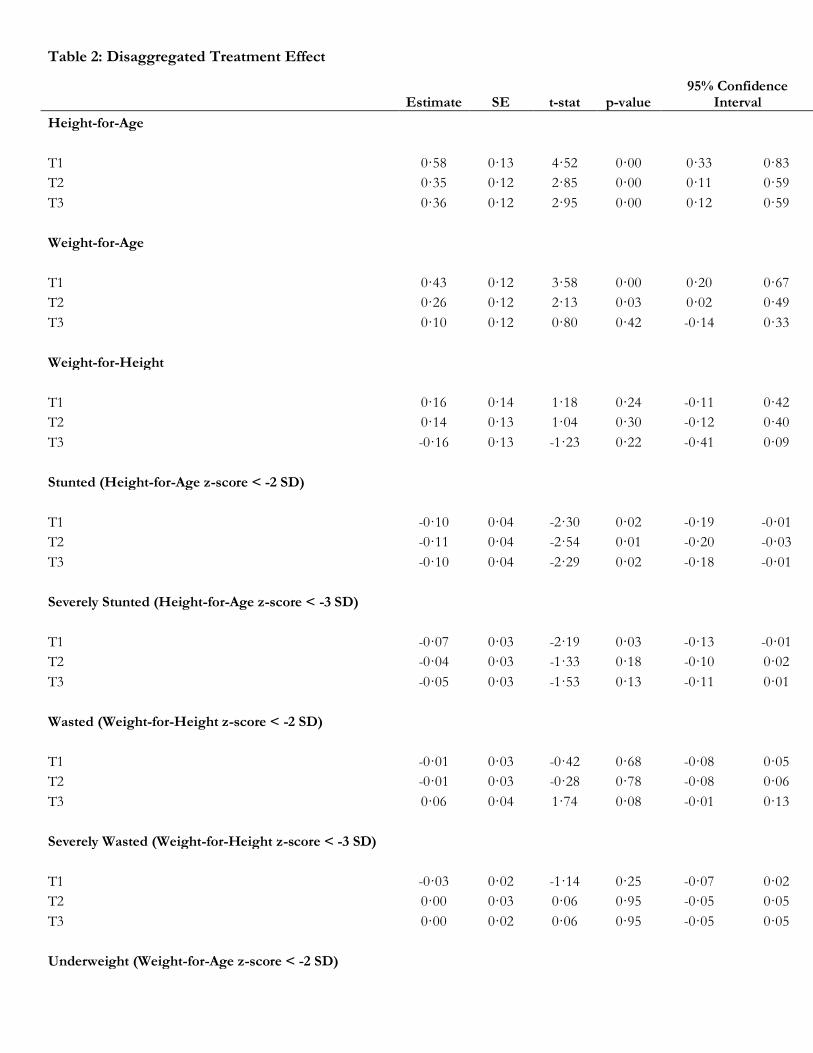
Table 2: Disaggregated Treatment Effect
Estimate SE t-stat p-value 95% Confidence
Interval
Height-for-Age
T1 0·58 0·13 4·52 0·00 0·33 0·83
T2 0·35 0·12 2·85 0·00 0·11 0·59
T3 0·36 0·12 2·95 0·00 0·12 0·59
Weight-for-Age
T1 0·43 0·12 3·58 0·00 0·20 0·67
T2 0·26 0·12 2·13 0·03 0·02 0·49
T3 0·10 0·12 0·80 0·42 -0·14 0·33
Weight-for-Height
T1 0·16 0·14 1·18 0·24 -0·11 0·42
T2 0·14 0·13 1·04 0·30 -0·12 0·40
T3 -0·16 0·13 -1·23 0·22 -0·41 0·09
Stunted (Height-for-Age z-score < -2 SD)
T1 -0·10 0·04 -2·30 0·02 -0·19 -0·01
T2 -0·11 0·04 -2·54 0·01 -0·20 -0·03
T3 -0·10 0·04 -2·29 0·02 -0·18 -0·01
Severely Stunted (Height-for-Age z-score < -3 SD)
T1 -0·07 0·03 -2·19 0·03 -0·13 -0·01
T2 -0·04 0·03 -1·33 0·18 -0·10 0·02
T3 -0·05 0·03 -1·53 0·13 -0·11 0·01
Wasted (Weight-for-Height z-score < -2 SD)
T1 -0·01 0·03 -0·42 0·68 -0·08 0·05
T2 -0·01 0·03 -0·28 0·78 -0·08 0·06
T3 0·06 0·04 1·74 0·08 -0·01 0·13
Severely Wasted (Weight-for-Height z-score < -3 SD)
T1 -0·03 0·02 -1·14 0·25 -0·07 0·02
T2 0·00 0·03 0·06 0·95 -0·05 0·05
T3 0·00 0·02 0·06 0·95 -0·05 0·05
Underweight (Weight-for-Age z-score < -2 SD)
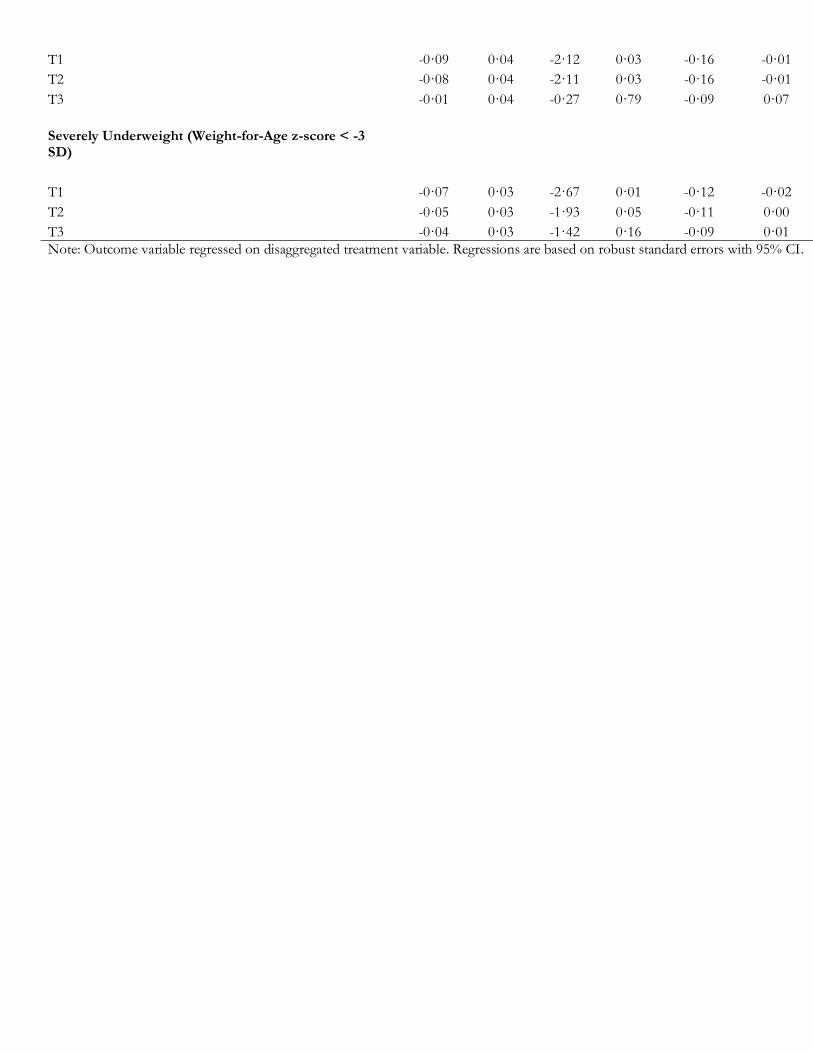
T1 -0·09 0·04 -2·12 0·03 -0·16 -0·01
T2 -0·08 0·04 -2·11 0·03 -0·16 -0·01
T3 -0·01 0·04 -0·27 0·79 -0·09 0·07
Severely Underweight (Weight-for-Age z-score < -3 SD)
T1 -0·07 0·03 -2·67 0·01 -0·12 -0·02
T2 -0·05 0·03 -1·93 0·05 -0·11 0·00
T3 -0·04 0·03 -1·42 0·16 -0·09 0·01
Note: Outcome variable regressed on disaggregated treatment variable. Regressions are based on robust standard errors with 95% CI.
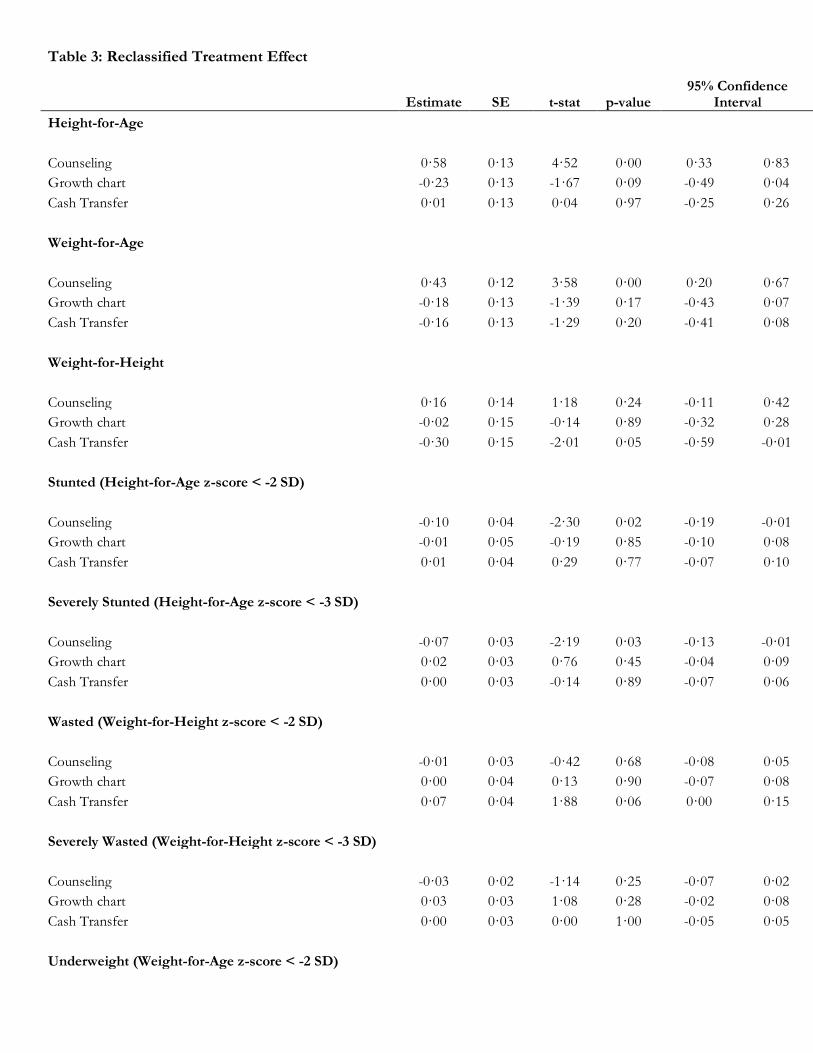
Table 3: Reclassified Treatment Effect
Estimate SE t-stat p-value 95% Confidence
Interval
Height-for-Age
Counseling 0·58 0·13 4·52 0·00 0·33 0·83
Growth chart -0·23 0·13 -1·67 0·09 -0·49 0·04
Cash Transfer 0·01 0·13 0·04 0·97 -0·25 0·26
Weight-for-Age
Counseling 0·43 0·12 3·58 0·00 0·20 0·67
Growth chart -0·18 0·13 -1·39 0·17 -0·43 0·07
Cash Transfer -0·16 0·13 -1·29 0·20 -0·41 0·08
Weight-for-Height
Counseling 0·16 0·14 1·18 0·24 -0·11 0·42
Growth chart -0·02 0·15 -0·14 0·89 -0·32 0·28
Cash Transfer -0·30 0·15 -2·01 0·05 -0·59 -0·01
Stunted (Height-for-Age z-score < -2 SD)
Counseling -0·10 0·04 -2·30 0·02 -0·19 -0·01
Growth chart -0·01 0·05 -0·19 0·85 -0·10 0·08
Cash Transfer 0·01 0·04 0·29 0·77 -0·07 0·10
Severely Stunted (Height-for-Age z-score < -3 SD)
Counseling -0·07 0·03 -2·19 0·03 -0·13 -0·01
Growth chart 0·02 0·03 0·76 0·45 -0·04 0·09
Cash Transfer 0·00 0·03 -0·14 0·89 -0·07 0·06
Wasted (Weight-for-Height z-score < -2 SD)
Counseling -0·01 0·03 -0·42 0·68 -0·08 0·05
Growth chart 0·00 0·04 0·13 0·90 -0·07 0·08
Cash Transfer 0·07 0·04 1·88 0·06 0·00 0·15
Severely Wasted (Weight-for-Height z-score < -3 SD)
Counseling -0·03 0·02 -1·14 0·25 -0·07 0·02
Growth chart 0·03 0·03 1·08 0·28 -0·02 0·08
Cash Transfer 0·00 0·03 0·00 1·00 -0·05 0·05
Underweight (Weight-for-Age z-score < -2 SD)

Counseling -0·09 0·04 -2·12 0·03 -0·16 -0·01
Growth chart 0·00 0·04 0·03 0·98 -0·08 0·08
Cash Transfer 0·07 0·04 1·74 0·08 -0·01 0·16
Severely Underweight (Weight-for-Age z-score < -3 SD)
Counseling -0·07 0·03 -2·67 0·01 -0·12 -0·02
Growth chart 0·02 0·03 0·67 0·50 -0·03 0·07
Cash Transfer 0·01 0·03 0·51 0·61 -0·04 0·07
Note: Outcome variable regressed on reclassified treatment variable. Regressions are based on robust standard errors with 95% CI.

Table 4: Disaggregated Treatment Heterogeneity Analysis for Male Children
Estimate SE t-stat p-value 95% Confidence
Interval
Height-for-Age
T1 0·55 0·18 3·06 0·00 0·20 0·90
T2 0·17 0·17 1·01 0·31 -0·16 0·49
T3 0·12 0·17 0·69 0·49 -0·21 0·45
Male -0·20 0·16 -1·21 0·23 -0·51 0·12
T1 x Male 0·04 0·25 0·16 0·87 -0·46 0·54
T2 x Male 0·34 0·24 1·39 0·17 -0·14 0·81
T3 x Male 0·46 0·24 1·94 0·05 -0·01 0·94
Weight-for-Age
T1 0·43 0·16 2·63 0·01 0·11 0·75
T2 0·26 0·16 1·57 0·12 -0·06 0·58
T3 -0·23 0·16 -1·45 0·15 -0·54 0·08
Male -0·19 0·16 -1·18 0·24 -0·50 0·12
T1 x Male -0·01 0·24 -0·04 0·97 -0·48 0·47
T2 x Male 0·02 0·24 0·10 0·92 -0·44 0·49
T3 x Male 0·63 0·23 2·69 0·01 0·17 1·09
Weight-for-Height
T1 0·16 0·19 0·83 0·41 -0·21 0·53
T2 0·16 0·18 0·92 0·36 -0·19 0·51
T3 -0·47 0·18 -2·58 0·01 -0·82 -0·11
Male -0·30 0·16 -1·94 0·05 -0·61 0·00
T1 x Male -0·02 0·27 -0·09 0·93 -0·55 0·50
T2 x Male -0·01 0·26 -0·04 0·97 -0·52 0·50
T3 x Male 0·60 0·26 2·35 0·02 0·10 1·11
Stunted (Height-for-Age z-score < -2 SD)
T1 -0·09 0·06 -1·44 0·15 -0·22 0·03
T2 -0·09 0·07 -1·34 0·18 -0·22 0·04
T3 -0·04 0·06 -0·68 0·50 -0·17 0·08
Male 0·03 0·06 0·47 0·64 -0·09 0·15
T1 x Male -0·02 0·09 -0·19 0·85 -0·19 0·16
T2 x Male -0·04 0·09 -0·43 0·66 -0·21 0·14
T3 x Male -0·11 0·09 -1·23 0·22 -0·27 0·06
Severely Stunted (Height-for-Age z-score < -3 SD)
T1 0·00 0·04 -0·11 0·91 -0·08 0·07
T2 0·01 0·04 0·15 0·88 -0·08 0·09

T3 0·02 0·04 0·56 0·58 -0·06 0·10
Male 0·10 0·04 2·50 0·01 0·02 0·18
T1 x Male -0·12 0·06 -2·03 0·04 -0·24 0·00
T2 x Male -0·09 0·06 -1·51 0·13 -0·22 0·03
T3 x Male -0·13 0·06 -2·24 0·03 -0·25 -0·02
Wasted (Weight-for-Height z-score < -2 SD)
T1 0·00 0·05 -0·02 0·98 -0·09 0·09
T2 -0·04 0·05 -0·87 0·38 -0·13 0·05
T3 0·08 0·05 1·53 0·13 -0·02 0·18
Male 0·04 0·04 0·98 0·33 -0·04 0·13
T1 x Male -0·02 0·07 -0·36 0·72 -0·16 0·11
T2 x Male 0·05 0·07 0·74 0·46 -0·08 0·18
T3 x Male -0·03 0·07 -0·44 0·66 -0·17 0·11
Severely Wasted (Weight-for-Height z-score < -3 SD)
T1 0·02 0·03 0·73 0·47 -0·04 0·08
T2 0·00 0·03 0·05 0·96 -0·06 0·06
T3 0·07 0·04 2·02 0·04 0·00 0·14
Male 0·07 0·03 2·33 0·02 0·01 0·13
T1 x Male -0·10 0·05 -2·13 0·03 -0·18 -0·01
T2 x Male -0·01 0·05 -0·16 0·87 -0·10 0·09
T3 x Male -0·14 0·05 -2·83 0·00 -0·23 -0·04
Underweight (Weight-for-Age z-score < -2 SD)
T1 -0·05 0·05 -1·00 0·32 -0·16 0·05
T2 -0·06 0·06 -1·06 0·29 -0·17 0·05
T3 0·06 0·06 1·04 0·30 -0·05 0·17
Male 0·11 0·05 2·11 0·04 0·01 0·22
T1 x Male -0·06 0·08 -0·71 0·48 -0·21 0·10
T2 x Male -0·06 0·08 -0·70 0·49 -0·21 0·10
T3 x Male -0·14 0·08 -1·73 0·08 -0·30 0·02
Severely Underweight (Weight-for-Age z-score < -3 SD)
T1 -0·01 0·04 -0·34 0·73 -0·08 0·06
T2 -0·04 0·03 -1·29 0·20 -0·11 0·02
T3 0·06 0·04 1·35 0·18 -0·03 0·14
Male 0·08 0·04 2·12 0·03 0·01 0·16
T1 x Male -0·12 0·05 -2·26 0·02 -0·22 -0·02
T2 x Male -0·03 0·05 -0·52 0·60 -0·13 0·08
T3 x Male -0·19 0·05 -3·38 0·00 -0·29 -0·08
Note: Heterogeneity analysis by gender. Regressions are based on robust standard errors with 95% CI.


Table 5: Reclassified Treatment Heterogeneity Analysis for Male Children
Estimate SE t-stat p-value 95% Confidence
Interval
Height-for-Age
Counseling 0·55 0·18 3·06 0·00 0·20 0·90
Growth chart -0·38 0·19 -2·05 0·04 -0·74 -0·02
Cash Transfer -0·05 0·17 -0·30 0·77 -0·40 0·29
Male -0·20 0·16 -1·21 0·23 -0·51 0·12
Counseling x Male 0·04 0·25 0·16 0·87 -0·46 0·54
Growth chart x Male 0·30 0·27 1·11 0·27 -0·23 0·82
Cash Transfer x Male 0·13 0·25 0·51 0·61 -0·37 0·63
Weight-for-Age
Counseling 0·43 0·16 2·63 0·01 0·11 0·75
Growth chart -0·18 0·18 -0·98 0·33 -0·53 0·18
Cash Transfer -0·48 0·17 -2·79 0·01 -0·83 -0·14
Male -0·19 0·16 -1·18 0·24 -0·50 0·12
Counseling x Male -0·01 0·24 -0·04 0·97 -0·48 0·47
Growth chart x Male 0·03 0·25 0·13 0·89 -0·47 0·53
Cash Transfer x Male 0·61 0·25 2·44 0·01 0·12 1·09
Weight-for-Height
Counseling 0·16 0·19 0·83 0·41 -0·21 0·53
Growth chart 0·00 0·21 0·02 0·98 -0·41 0·42
Cash Transfer -0·63 0·20 -3·08 0·00 -1·03 -0·23
Male -0·30 0·16 -1·94 0·05 -0·61 0·00
Counseling x Male -0·02 0·27 -0·09 0·93 -0·55 0·50
Growth chart x Male 0·01 0·30 0·05 0·96 -0·58 0·61
Cash Transfer x Male 0·61 0·29 2·11 0·04 0·04 1·19
Stunted (Height-for-Age z-score < -2 SD)
Counseling -0·09 0·06 -1·44 0·15 -0·22 0·03
Growth chart 0·00 0·07 0·04 0·97 -0·13 0·13
Cash Transfer 0·05 0·07 0·69 0·49 -0·09 0·18
Male 0·03 0·06 0·47 0·64 -0·09 0·15
Counseling x Male -0·02 0·09 -0·19 0·85 -0·19 0·16
Growth chart x Male -0·02 0·09 -0·23 0·81 -0·20 0·16
Cash Transfer x Male -0·07 0·09 -0·75 0·45 -0·24 0·11

Severely Stunted (Height-for-Age z-score < -3 SD)
Counseling 0·00 0·04 -0·11 0·91 -0·08 0·07
Growth chart 0·01 0·05 0·23 0·82 -0·08 0·10
Cash Transfer 0·02 0·05 0·34 0·74 -0·08 0·11
Male 0·10 0·04 2·50 0·01 0·02 0·18
Counseling x Male -0·12 0·06 -2·03 0·04 -0·24 0·00
Growth chart x Male 0·03 0·06 0·41 0·68 -0·10 0·15
Cash Transfer x Male -0·04 0·06 -0·61 0·54 -0·17 0·09
Wasted (Weight-for-Height z-score < -2 SD)
Counseling 0·00 0·05 -0·02 0·98 -0·09 0·09
Growth chart -0·04 0·05 -0·83 0·41 -0·13 0·05
Cash Transfer 0·12 0·05 2·30 0·02 0·02 0·22
Male 0·04 0·04 0·98 0·33 -0·04 0·13
Counseling x Male -0·02 0·07 -0·36 0·72 -0·16 0·11
Growth chart x Male 0·07 0·07 1·02 0·31 -0·07 0·21
Cash Transfer x Male -0·08 0·07 -1·07 0·28 -0·23 0·07
Severely Wasted (Weight-for-Height z-score < -3 SD)
Counseling 0·02 0·03 0·73 0·47 -0·04 0·08
Growth chart -0·02 0·03 -0·62 0·54 -0·09 0·05
Cash Transfer 0·07 0·04 1·83 0·07 0·00 0·14
Male 0·07 0·03 2·33 0·02 0·01 0·13
Counseling x Male -0·10 0·05 -2·13 0·03 -0·18 -0·01
Growth chart x Male 0·09 0·05 1·79 0·07 -0·01 0·19
Cash Transfer x Male -0·13 0·05 -2·46 0·01 -0·23 -0·03
Underweight (Weight-for-Age z-score < -2 SD)
Counseling -0·05 0·05 -1·00 0·32 -0·16 0·05
Growth chart -0·01 0·06 -0·10 0·92 -0·12 0·11
Cash Transfer 0·12 0·06 1·97 0·05 0·00 0·24
Male 0·11 0·05 2·11 0·04 0·01 0·22
Counseling x Male -0·06 0·08 -0·71 0·48 -0·21 0·10
Growth chart x Male 0·00 0·08 0·02 0·98 -0·16 0·17
Cash Transfer x Male -0·08 0·08 -1·00 0·32 -0·25 0·08
Severely Underweight (Weight-for-Age z-score < -3 SD)
Counseling -0·01 0·04 -0·34 0·73 -0·08 0·06

Growth chart -0·03 0·04 -0·87 0·38 -0·10 0·04
Cash Transfer 0·10 0·04 2·41 0·02 0·02 0·18
Male 0·08 0·04 2·12 0·03 0·01 0·16
Counseling x Male -0·12 0·05 -2·26 0·02 -0·22 -0·02
Growth chart x Male 0·09 0·05 1·79 0·07 -0·01 0·19
Cash Transfer x Male -0·16 0·05 -2·97 0·00 -0·26 -0·05
Note: Heterogeneity analysis by gender. Regressions are based on robust standard errors with 95% CI.
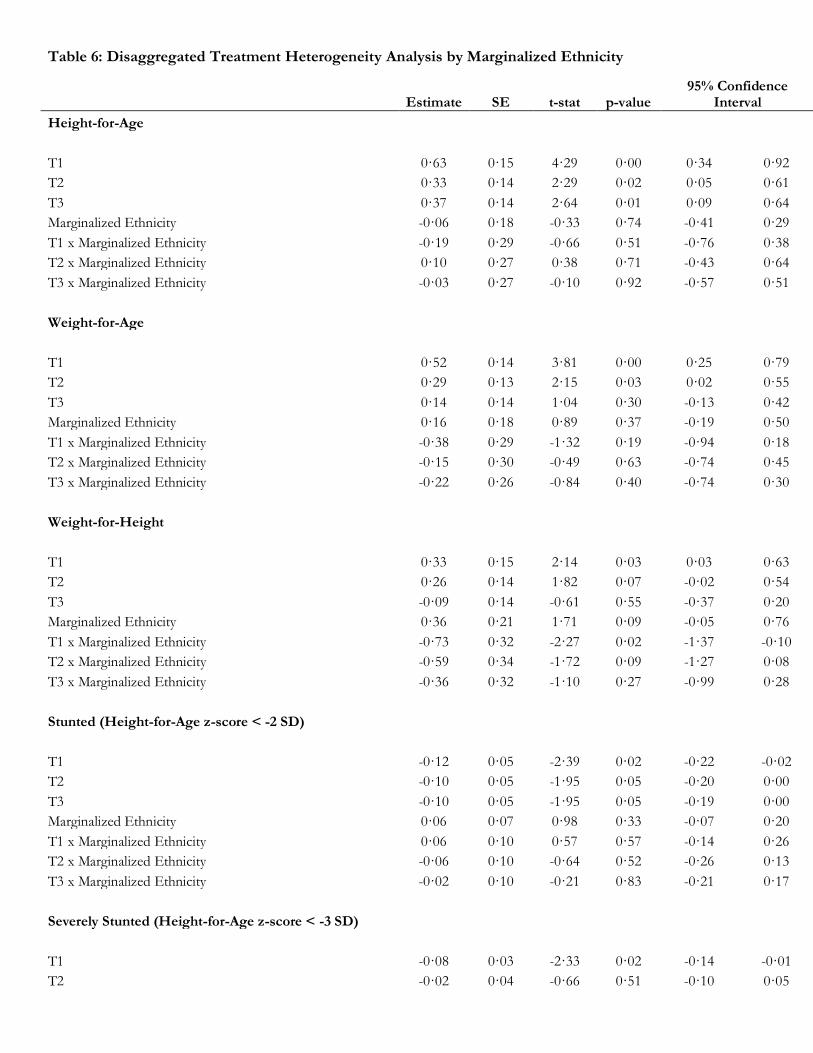
Table 6: Disaggregated Treatment Heterogeneity Analysis by Marginalized Ethnicity
Estimate SE t-stat p-value 95% Confidence
Interval
Height-for-Age
T1 0·63 0·15 4·29 0·00 0·34 0·92
T2 0·33 0·14 2·29 0·02 0·05 0·61
T3 0·37 0·14 2·64 0·01 0·09 0·64
Marginalized Ethnicity -0·06 0·18 -0·33 0·74 -0·41 0·29
T1 x Marginalized Ethnicity -0·19 0·29 -0·66 0·51 -0·76 0·38
T2 x Marginalized Ethnicity 0·10 0·27 0·38 0·71 -0·43 0·64
T3 x Marginalized Ethnicity -0·03 0·27 -0·10 0·92 -0·57 0·51
Weight-for-Age
T1 0·52 0·14 3·81 0·00 0·25 0·79
T2 0·29 0·13 2·15 0·03 0·02 0·55
T3 0·14 0·14 1·04 0·30 -0·13 0·42
Marginalized Ethnicity 0·16 0·18 0·89 0·37 -0·19 0·50
T1 x Marginalized Ethnicity -0·38 0·29 -1·32 0·19 -0·94 0·18
T2 x Marginalized Ethnicity -0·15 0·30 -0·49 0·63 -0·74 0·45
T3 x Marginalized Ethnicity -0·22 0·26 -0·84 0·40 -0·74 0·30
Weight-for-Height
T1 0·33 0·15 2·14 0·03 0·03 0·63
T2 0·26 0·14 1·82 0·07 -0·02 0·54
T3 -0·09 0·14 -0·61 0·55 -0·37 0·20
Marginalized Ethnicity 0·36 0·21 1·71 0·09 -0·05 0·76
T1 x Marginalized Ethnicity -0·73 0·32 -2·27 0·02 -1·37 -0·10
T2 x Marginalized Ethnicity -0·59 0·34 -1·72 0·09 -1·27 0·08
T3 x Marginalized Ethnicity -0·36 0·32 -1·10 0·27 -0·99 0·28
Stunted (Height-for-Age z-score < -2 SD)
T1 -0·12 0·05 -2·39 0·02 -0·22 -0·02
T2 -0·10 0·05 -1·95 0·05 -0·20 0·00
T3 -0·10 0·05 -1·95 0·05 -0·19 0·00
Marginalized Ethnicity 0·06 0·07 0·98 0·33 -0·07 0·20
T1 x Marginalized Ethnicity 0·06 0·10 0·57 0·57 -0·14 0·26
T2 x Marginalized Ethnicity -0·06 0·10 -0·64 0·52 -0·26 0·13
T3 x Marginalized Ethnicity -0·02 0·10 -0·21 0·83 -0·21 0·17
Severely Stunted (Height-for-Age z-score < -3 SD)
T1 -0·08 0·03 -2·33 0·02 -0·14 -0·01
T2 -0·02 0·04 -0·66 0·51 -0·10 0·05

T3 -0·04 0·03 -1·25 0·21 -0·11 0·02
Marginalized Ethnicity 0·03 0·05 0·56 0·58 -0·07 0·13
T1 x Marginalized Ethnicity 0·04 0·07 0·50 0·62 -0·11 0·18
T2 x Marginalized Ethnicity -0·08 0·07 -1·18 0·24 -0·22 0·05
T3 x Marginalized Ethnicity -0·02 0·07 -0·25 0·80 -0·16 0·12
Wasted (Weight-for-Height z-score < -2 SD)
T1 -0·02 0·04 -0·56 0·58 -0·10 0·05
T2 -0·04 0·04 -1·08 0·28 -0·11 0·03
T3 0·05 0·04 1·20 0·23 -0·03 0·13
Marginalized Ethnicity 0·00 0·05 0·06 0·95 -0·09 0·09
T1 x Marginalized Ethnicity 0·03 0·08 0·37 0·71 -0·12 0·18
T2 x Marginalized Ethnicity 0·14 0·09 1·61 0·11 -0·03 0·30
T3 x Marginalized Ethnicity 0·05 0·08 0·60 0·55 -0·11 0·21
Severely Wasted (Weight-for-Height z-score < -3 SD)
T1 -0·03 0·03 -1·19 0·24 -0·08 0·02
T2 -0·01 0·03 -0·33 0·74 -0·06 0·04
T3 0·01 0·03 0·18 0·86 -0·05 0·06
Marginalized Ethnicity 0·02 0·03 0·49 0·63 -0·05 0·09
T1 x Marginalized Ethnicity 0·01 0·05 0·24 0·81 -0·09 0·12
T2 x Marginalized Ethnicity 0·05 0·06 0·72 0·47 -0·08 0·17
T3 x Marginalized Ethnicity -0·02 0·05 -0·32 0·75 -0·12 0·09
Underweight (Weight-for-Age z-score < -2 SD)
T1 -0·13 0·05 -2·97 0·00 -0·22 -0·05
T2 -0·09 0·05 -2·00 0·05 -0·18 0·00
T3 -0·04 0·05 -0·75 0·45 -0·13 0·06
Marginalized Ethnicity -0·05 0·06 -0·79 0·43 -0·16 0·07
T1 x Marginalized Ethnicity 0·20 0·09 2·12 0·03 0·01 0·38
T2 x Marginalized Ethnicity 0·04 0·09 0·44 0·66 -0·14 0·22
T3 x Marginalized Ethnicity 0·10 0·09 1·15 0·25 -0·07 0·28
Severely Underweight (Weight-for-Age z-score < -3 SD)
T1 -0·09 0·03 -2·90 0·00 -0·14 -0·03
T2 -0·05 0·03 -1·60 0·11 -0·11 0·01
T3 -0·04 0·03 -1·39 0·16 -0·11 0·02
Marginalized Ethnicity -0·01 0·04 -0·25 0·80 -0·09 0·07
T1 x Marginalized Ethnicity 0·06 0·06 0·97 0·33 -0·06 0·18
T2 x Marginalized Ethnicity -0·01 0·06 -0·12 0·91 -0·12 0·11
T3 x Marginalized Ethnicity 0·02 0·06 0·37 0·71 -0·10 0·14
Note: Heterogeneity analysis by ethnicity. Regressions are based on robust standard errors with 95% CI.


Table 7: Reclassified Treatment Heterogeneity Analysis by Marginalized Ethnicity
Estimate SE t-stat p-value 95% Confidence
Interval
Height-for-Age
Counseling 0·63 0·15 4·29 0·00 0·34 0·92
Growth chart -0·30 0·16 -1·94 0·05 -0·61 0·00
Cash Transfer 0·04 0·15 0·25 0·80 -0·25 0·33
Marginalized Ethnicity -0·06 0·18 -0·33 0·74 -0·41 0·29
Counseling x Marginalized Ethnicity -0·19 0·29 -0·66 0·51 -0·76 0·38
Growth chart x Marginalized Ethnicity 0·29 0·31 0·95 0·34 -0·31 0·90
Cash Transfer x Marginalized Ethnicity -0·13 0·29 -0·44 0·66 -0·71 0·45
Weight-for-Age
Counseling 0·52 0·14 3·81 0·00 0·25 0·79
Growth chart -0·24 0·14 -1·71 0·09 -0·51 0·04
Cash Transfer -0·14 0·14 -1·02 0·31 -0·42 0·13
Marginalized Ethnicity 0·16 0·18 0·89 0·37 -0·19 0·50
Counseling x Marginalized Ethnicity -0·38 0·29 -1·32 0·19 -0·94 0·18
Growth chart x Marginalized Ethnicity 0·23 0·33 0·69 0·49 -0·43 0·89
Cash Transfer x Marginalized Ethnicity -0·08 0·32 -0·24 0·81 -0·70 0·55
Weight-for-Height
Counseling 0·33 0·15 2·14 0·03 0·03 0·63
Growth chart -0·07 0·17 -0·39 0·69 -0·41 0·27
Cash Transfer -0·35 0·16 -2·12 0·03 -0·67 -0·03
Marginalized Ethnicity 0·36 0·21 1·71 0·09 -0·05 0·76
Counseling x Marginalized Ethnicity -0·73 0·32 -2·27 0·02 -1·37 -0·10
Growth chart x Marginalized Ethnicity 0·14 0·37 0·39 0·70 -0·58 0·87
Cash Transfer x Marginalized Ethnicity 0·24 0·37 0·64 0·52 -0·49 0·96
Stunted (Height-for-Age z-score < -2 SD)
Counseling -0·12 0·05 -2·39 0·02 -0·22 -0·02
Growth chart 0·02 0·05 0·45 0·65 -0·08 0·13
Cash Transfer 0·00 0·05 0·03 0·98 -0·10 0·10
Marginalized Ethnicity 0·06 0·07 0·98 0·33 -0·07 0·20
Counseling x Marginalized Ethnicity 0·06 0·10 0·57 0·57 -0·14 0·26
Growth chart x Marginalized Ethnicity -0·12 0·11 -1·12 0·26 -0·34 0·09
Cash Transfer x Marginalized Ethnicity 0·04 0·11 0·42 0·67 -0·16 0·25

Severely Stunted (Height-for-Age z-score < -3 SD)
Counseling -0·08 0·03 -2·33 0·02 -0·14 -0·01
Growth chart 0·05 0·04 1·48 0·14 -0·02 0·13
Cash Transfer -0·02 0·04 -0·52 0·61 -0·09 0·05
Marginalized Ethnicity 0·03 0·05 0·56 0·58 -0·07 0·13
Counseling x Marginalized Ethnicity 0·04 0·07 0·50 0·62 -0·11 0·18
Growth chart x Marginalized Ethnicity -0·12 0·07 -1·61 0·11 -0·27 0·03
Cash Transfer x Marginalized Ethnicity 0·07 0·07 0·92 0·36 -0·07 0·21
Wasted (Weight-for-Height z-score < -2 SD)
Counseling -0·02 0·04 -0·56 0·58 -0·10 0·05
Growth chart -0·02 0·04 -0·46 0·64 -0·10 0·06
Cash Transfer 0·09 0·04 2·14 0·03 0·01 0·17
Marginalized Ethnicity 0·00 0·05 0·06 0·95 -0·09 0·09
Counseling x Marginalized Ethnicity 0·03 0·08 0·37 0·71 -0·12 0·18
Growth chart x Marginalized Ethnicity 0·11 0·09 1·15 0·25 -0·08 0·29
Cash Transfer x Marginalized Ethnicity -0·09 0·10 -0·92 0·36 -0·28 0·10
Severely Wasted (Weight-for-Height z-score < -3 SD)
Counseling -0·03 0·03 -1·19 0·24 -0·08 0·02
Growth chart 0·02 0·03 0·79 0·43 -0·03 0·07
Cash Transfer 0·01 0·03 0·48 0·63 -0·04 0·07
Marginalized Ethnicity 0·02 0·03 0·49 0·63 -0·05 0·09
Counseling x Marginalized Ethnicity 0·01 0·05 0·24 0·81 -0·09 0·12
Growth chart x Marginalized Ethnicity 0·03 0·07 0·49 0·63 -0·10 0·17
Cash Transfer x Marginalized Ethnicity -0·06 0·07 -0·93 0·35 -0·20 0·07
Underweight (Weight-for-Age z-score < -2 SD)
Counseling -0·13 0·05 -2·97 0·00 -0·22 -0·05
Growth chart 0·04 0·05 0·91 0·36 -0·05 0·13
Cash Transfer 0·06 0·05 1·18 0·24 -0·04 0·15
Marginalized Ethnicity -0·05 0·06 -0·79 0·43 -0·16 0·07
Counseling x Marginalized Ethnicity 0·20 0·09 2·12 0·03 0·01 0·38
Growth chart x Marginalized Ethnicity -0·16 0·10 -1·56 0·12 -0·36 0·04
Cash Transfer x Marginalized Ethnicity 0·06 0·10 0·65 0·51 -0·13 0·26
Severely Underweight (Weight-for-Age z-score < -3 SD)
Counseling -0·09 0·03 -2·90 0·00 -0·14 -0·03

Growth chart 0·03 0·03 1·20 0·23 -0·02 0·09
Cash Transfer 0·01 0·03 0·21 0·84 -0·05 0·07
Marginalized Ethnicity -0·01 0·04 -0·25 0·80 -0·09 0·07
Counseling x Marginalized Ethnicity 0·06 0·06 0·97 0·33 -0·06 0·18
Growth chart x Marginalized Ethnicity -0·07 0·06 -1·07 0·28 -0·19 0·06
Cash Transfer x Marginalized Ethnicity 0·03 0·06 0·48 0·63 -0·09 0·15
Note: Heterogeneity analysis by ethnicity. Regressions are based on robust standard errors with 95% CI.
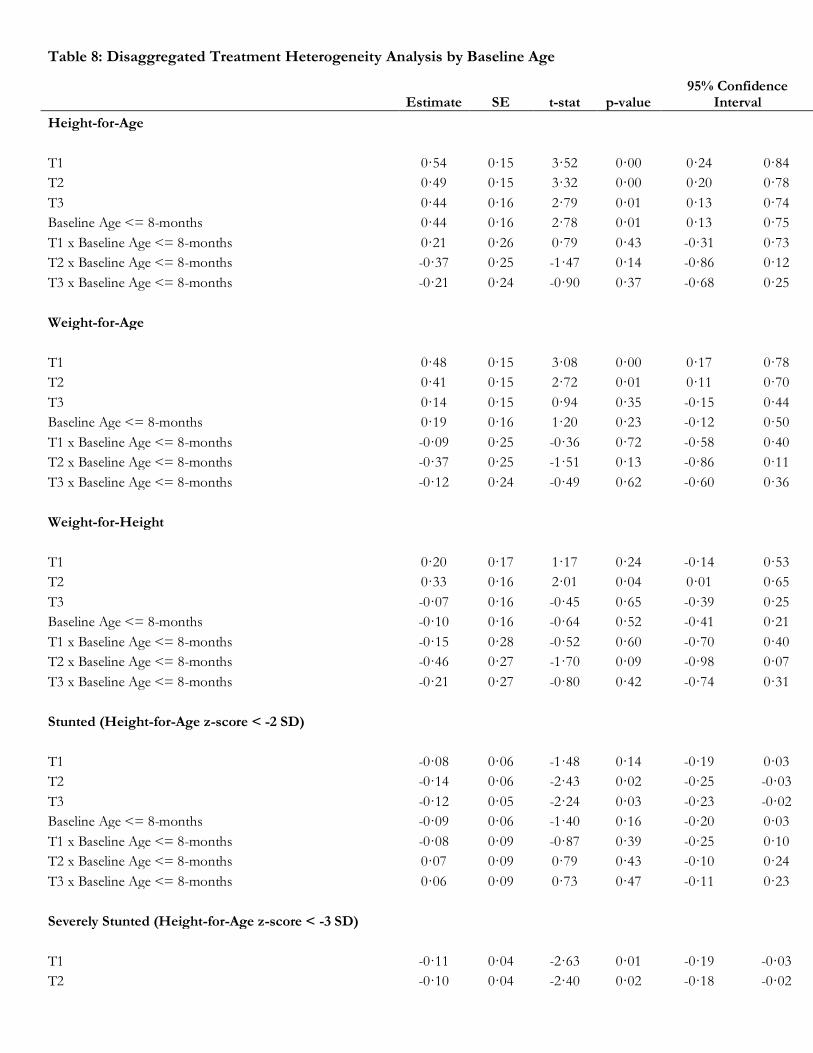
Table 8: Disaggregated Treatment Heterogeneity Analysis by Baseline Age
Estimate SE t-stat p-value 95% Confidence
Interval
Height-for-Age
T1 0·54 0·15 3·52 0·00 0·24 0·84
T2 0·49 0·15 3·32 0·00 0·20 0·78
T3 0·44 0·16 2·79 0·01 0·13 0·74
Baseline Age <= 8-months 0·44 0·16 2·78 0·01 0·13 0·75
T1 x Baseline Age <= 8-months 0·21 0·26 0·79 0·43 -0·31 0·73
T2 x Baseline Age <= 8-months -0·37 0·25 -1·47 0·14 -0·86 0·12
T3 x Baseline Age <= 8-months -0·21 0·24 -0·90 0·37 -0·68 0·25
Weight-for-Age
T1 0·48 0·15 3·08 0·00 0·17 0·78
T2 0·41 0·15 2·72 0·01 0·11 0·70
T3 0·14 0·15 0·94 0·35 -0·15 0·44
Baseline Age <= 8-months 0·19 0·16 1·20 0·23 -0·12 0·50
T1 x Baseline Age <= 8-months -0·09 0·25 -0·36 0·72 -0·58 0·40
T2 x Baseline Age <= 8-months -0·37 0·25 -1·51 0·13 -0·86 0·11
T3 x Baseline Age <= 8-months -0·12 0·24 -0·49 0·62 -0·60 0·36
Weight-for-Height
T1 0·20 0·17 1·17 0·24 -0·14 0·53
T2 0·33 0·16 2·01 0·04 0·01 0·65
T3 -0·07 0·16 -0·45 0·65 -0·39 0·25
Baseline Age <= 8-months -0·10 0·16 -0·64 0·52 -0·41 0·21
T1 x Baseline Age <= 8-months -0·15 0·28 -0·52 0·60 -0·70 0·40
T2 x Baseline Age <= 8-months -0·46 0·27 -1·70 0·09 -0·98 0·07
T3 x Baseline Age <= 8-months -0·21 0·27 -0·80 0·42 -0·74 0·31
Stunted (Height-for-Age z-score < -2 SD)
T1 -0·08 0·06 -1·48 0·14 -0·19 0·03
T2 -0·14 0·06 -2·43 0·02 -0·25 -0·03
T3 -0·12 0·05 -2·24 0·03 -0·23 -0·02
Baseline Age <= 8-months -0·09 0·06 -1·40 0·16 -0·20 0·03
T1 x Baseline Age <= 8-months -0·08 0·09 -0·87 0·39 -0·25 0·10
T2 x Baseline Age <= 8-months 0·07 0·09 0·79 0·43 -0·10 0·24
T3 x Baseline Age <= 8-months 0·06 0·09 0·73 0·47 -0·11 0·23
Severely Stunted (Height-for-Age z-score < -3 SD)
T1 -0·11 0·04 -2·63 0·01 -0·19 -0·03
T2 -0·10 0·04 -2·40 0·02 -0·18 -0·02

T3 -0·07 0·04 -1·54 0·12 -0·15 0·02
Baseline Age <= 8-months -0·12 0·04 -3·17 0·00 -0·19 -0·05
T1 x Baseline Age <= 8-months 0·10 0·06 1·70 0·09 -0·02 0·22
T2 x Baseline Age <= 8-months 0·15 0·06 2·44 0·02 0·03 0·27
T3 x Baseline Age <= 8-months 0·05 0·06 0·94 0·35 -0·06 0·16
Wasted (Weight-for-Height z-score < -2 SD)
T1 -0·02 0·04 -0·41 0·68 -0·09 0·06
T2 -0·03 0·04 -0·67 0·50 -0·10 0·05
T3 0·05 0·04 1·24 0·22 -0·03 0·14
Baseline Age <= 8-months 0·06 0·05 1·27 0·20 -0·03 0·15
T1 x Baseline Age <= 8-months 0·02 0·08 0·25 0·80 -0·13 0·17
T2 x Baseline Age <= 8-months 0·04 0·07 0·52 0·61 -0·10 0·18
T3 x Baseline Age <= 8-months 0·02 0·08 0·28 0·78 -0·13 0·17
Severely Wasted (Weight-for-Height z-score < -3 SD)
T1 -0·03 0·03 -1·11 0·27 -0·09 0·02
T2 -0·03 0·03 -1·17 0·24 -0·09 0·02
T3 -0·03 0·03 -1·18 0·24 -0·09 0·02
Baseline Age <= 8-months -0·01 0·03 -0·27 0·78 -0·07 0·05
T1 x Baseline Age <= 8-months 0·02 0·05 0·40 0·69 -0·07 0·11
T2 x Baseline Age <= 8-months 0·09 0·05 1·71 0·09 -0·01 0·19
T3 x Baseline Age <= 8-months 0·09 0·05 1·78 0·08 -0·01 0·19
Underweight (Weight-for-Age z-score < -2 SD)
T1 -0·10 0·05 -2·09 0·04 -0·20 -0·01
T2 -0·10 0·05 -1·88 0·06 -0·20 0·00
T3 -0·06 0·05 -1·09 0·27 -0·16 0·04
Baseline Age <= 8-months -0·05 0·06 -0·84 0·40 -0·16 0·06
T1 x Baseline Age <= 8-months 0·05 0·08 0·58 0·56 -0·12 0·22
T2 x Baseline Age <= 8-months 0·03 0·08 0·42 0·67 -0·13 0·19
T3 x Baseline Age <= 8-months 0·12 0·08 1·38 0·17 -0·05 0·28
Severely Underweight (Weight-for-Age z-score < -3 SD)
T1 -0·08 0·04 -2·35 0·02 -0·15 -0·01
T2 -0·11 0·03 -3·27 0·00 -0·18 -0·04
T3 -0·05 0·04 -1·32 0·19 -0·12 0·02
Baseline Age <= 8-months -0·05 0·04 -1·37 0·17 -0·12 0·02
T1 x Baseline Age <= 8-months 0·03 0·05 0·60 0·55 -0·07 0·13
T2 x Baseline Age <= 8-months 0·14 0·06 2·52 0·01 0·03 0·25
T3 x Baseline Age <= 8-months 0·03 0·05 0·53 0·59 -0·08 0·13
Note: Heterogeneity analysis by baseline age. Regressions are based on robust standard errors with 95% CI.


Table 9: Reclassified Treatment Heterogeneity Analysis by Baseline Age
Estimate SE t-stat p-value 95% Confidence
Interval
Height-for-Age
Counseling 0·54 0·15 3·52 0·00 0·24 0·84
Growth chart -0·05 0·16 -0·30 0·77 -0·35 0·26
Cash -0·05 0·16 -0·35 0·73 -0·37 0·26
Baseline Age <= 8-months 0·44 0·16 2·78 0·01 0·13 0·75
Counseling x Baseline Age <= 8-months 0·21 0·26 0·79 0·43 -0·31 0·73
Growth chart x Baseline Age <= 8-months -0·58 0·29 -2·01 0·05 -1·14 -0·01
Cash Transfer x Baseline Age <= 8-months 0·16 0·26 0·59 0·56 -0·36 0·67
Weight-for-Age
Counseling 0·48 0·15 3·08 0·00 0·17 0·78
Growth chart -0·07 0·15 -0·44 0·66 -0·37 0·23
Cash -0·27 0·15 -1·77 0·08 -0·56 0·03
Baseline Age <= 8-months 0·19 0·16 1·20 0·23 -0·12 0·50
Counseling x Baseline Age <= 8-months -0·09 0·25 -0·36 0·72 -0·58 0·40
Growth chart x Baseline Age <= 8-months -0·29 0·27 -1·06 0·29 -0·82 0·24
Cash Transfer x Baseline Age <= 8-months 0·25 0·26 0·96 0·34 -0·26 0·77
Weight-for-Height
Counseling 0·20 0·17 1·17 0·24 -0·14 0·53
Growth chart 0·13 0·19 0·69 0·49 -0·24 0·50
Cash -0·40 0·18 -2·24 0·03 -0·76 -0·05
Baseline Age <= 8-months -0·10 0·16 -0·64 0·52 -0·41 0·21
Counseling x Baseline Age <= 8-months -0·15 0·28 -0·52 0·60 -0·70 0·40
Growth chart x Baseline Age <= 8-months -0·31 0·32 -0·98 0·33 -0·93 0·31
Cash Transfer x Baseline Age <= 8-months 0·24 0·30 0·80 0·43 -0·36 0·84
Stunted (Height-for-Age z-score < -2 SD)
Counseling -0·08 0·06 -1·48 0·14 -0·19 0·03
Growth chart -0·05 0·06 -0·92 0·36 -0·17 0·06
Cash 0·02 0·06 0·26 0·80 -0·10 0·13
Baseline Age <= 8-months -0·09 0·06 -1·40 0·16 -0·20 0·03
Counseling x Baseline Age <= 8-months -0·08 0·09 -0·87 0·39 -0·25 0·10
Growth chart x Baseline Age <= 8-months 0·15 0·09 1·60 0·11 -0·03 0·33
Cash Transfer x Baseline Age <= 8-months -0·01 0·09 -0·07 0·94 -0·18 0·17

Severely Stunted (Height-for-Age z-score < -3 SD)
Counseling -0·11 0·04 -2·63 0·01 -0·19 -0·03
Growth chart 0·01 0·04 0·14 0·89 -0·07 0·08
Cash 0·03 0·04 0·81 0·42 -0·05 0·12
Baseline Age <= 8-months -0·12 0·04 -3·17 0·00 -0·19 -0·05
Counseling x Baseline Age <= 8-months 0·10 0·06 1·70 0·09 -0·02 0·22
Growth chart x Baseline Age <= 8-months 0·05 0·07 0·73 0·47 -0·08 0·18
Cash Transfer x Baseline Age <= 8-months -0·10 0·06 -1·48 0·14 -0·22 0·03
Wasted (Weight-for-Height z-score < -2 SD)
Counseling -0·02 0·04 -0·41 0·68 -0·09 0·06
Growth chart -0·01 0·04 -0·24 0·81 -0·09 0·07
Cash 0·08 0·05 1·76 0·08 -0·01 0·17
Baseline Age <= 8-months 0·06 0·05 1·27 0·20 -0·03 0·15
Counseling x Baseline Age <= 8-months 0·02 0·08 0·25 0·80 -0·13 0·17
Growth chart x Baseline Age <= 8-months 0·02 0·08 0·23 0·82 -0·14 0·17
Cash Transfer x Baseline Age <= 8-months -0·02 0·08 -0·20 0·84 -0·17 0·14
Severely Wasted (Weight-for-Height z-score < -3 SD)
Counseling -0·03 0·03 -1·11 0·27 -0·09 0·02
Growth chart 0·00 0·03 -0·08 0·94 -0·06 0·05
Cash 0·00 0·03 0·02 0·98 -0·05 0·05
Baseline Age <= 8-months -0·01 0·03 -0·27 0·78 -0·07 0·05
Counseling x Baseline Age <= 8-months 0·02 0·05 0·40 0·69 -0·07 0·11
Growth chart x Baseline Age <= 8-months 0·07 0·06 1·25 0·21 -0·04 0·18
Cash Transfer x Baseline Age <= 8-months 0·00 0·06 0·03 0·98 -0·11 0·12
Underweight (Weight-for-Age z-score < -2 SD)
Counseling -0·10 0·05 -2·09 0·04 -0·20 -0·01
Growth chart 0·01 0·05 0·14 0·89 -0·10 0·11
Cash 0·04 0·05 0·76 0·45 -0·06 0·15
Baseline Age <= 8-months -0·05 0·06 -0·84 0·40 -0·16 0·06
Counseling x Baseline Age <= 8-months 0·05 0·08 0·58 0·56 -0·12 0·22
Growth chart x Baseline Age <= 8-months -0·02 0·09 -0·17 0·86 -0·19 0·16
Cash Transfer x Baseline Age <= 8-months 0·08 0·09 0·94 0·35 -0·09 0·25
Severely Underweight (Weight-for-Age z-score < -3 SD)
Counseling -0·08 0·04 -2·35 0·02 -0·15 -0·01
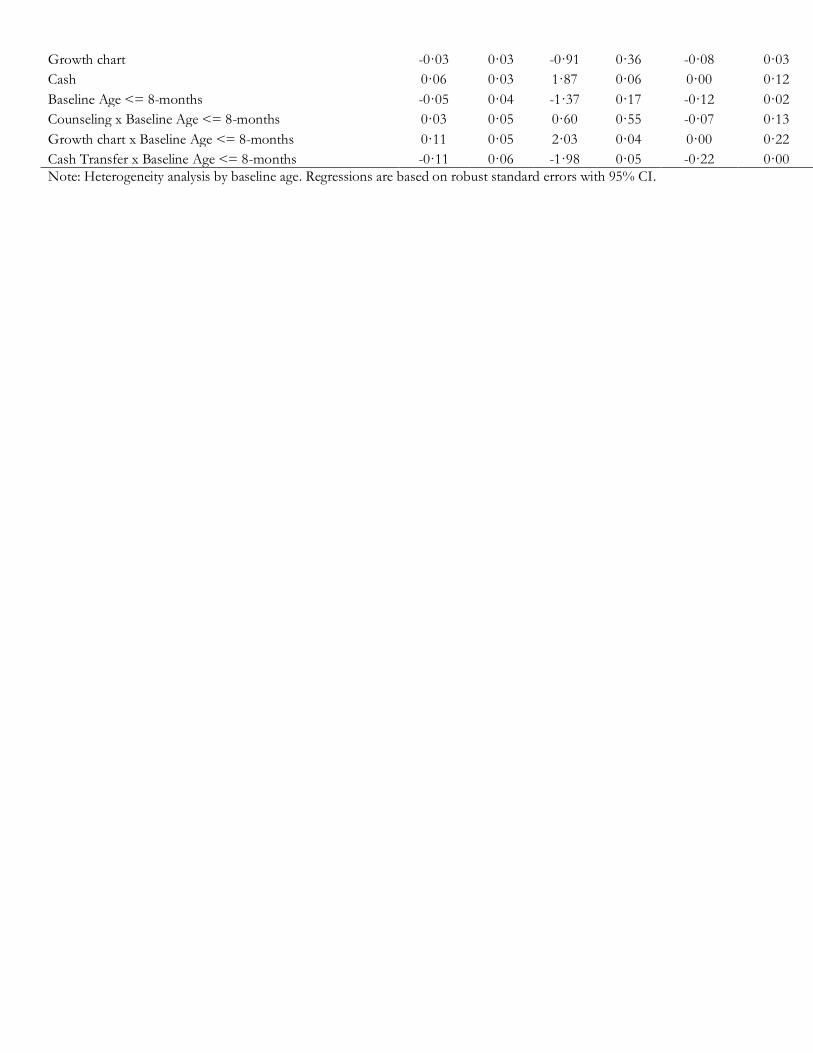
Growth chart -0·03 0·03 -0·91 0·36 -0·08 0·03
Cash 0·06 0·03 1·87 0·06 0·00 0·12
Baseline Age <= 8-months -0·05 0·04 -1·37 0·17 -0·12 0·02
Counseling x Baseline Age <= 8-months 0·03 0·05 0·60 0·55 -0·07 0·13
Growth chart x Baseline Age <= 8-months 0·11 0·05 2·03 0·04 0·00 0·22
Cash Transfer x Baseline Age <= 8-months -0·11 0·06 -1·98 0·05 -0·22 0·00
Note: Heterogeneity analysis by baseline age. Regressions are based on robust standard errors with 95% CI.

Appendix B: Figures and Tables of Supplementary Materials This appendix provides supplementary figures and tables that provide additional information on project objects including instrument development and event timing.

Figures

Figure 1: Growth Monitoring Chart Explainer

Figure 2: Project Timeline

Figure 3: Intervention components

Figure 4: Primary Outcomes by child’s age at baseline

Tables

Table 1: Summary of Focus Group Discussions
Group Objective Instruments Take Aways
FGD 1 Mothers Fathers Grandmothers
•Discuss the concept of growth monitoring with caregivers
•FGD Script •A simple stacked bar chart with a scale for height measurement
•Height measurement is not an alien concept •Most clinics have height measurement facilities •Caregivers understood the process of measuring and marking on a chart
FGD 2 Mothers
•Discuss the concept of stunting and wasting •Test the first version of Growth chart •Discuss meal preparation •Share recipes of low-cost nutritious meals
•FGD Script •Variations of bar charts pre-filled for children with different heights •A simple stacked bar chart with a scale for height measurement Recipe cards
•Stunting was not immediately understood •Caregivers mostly consider child's weight to assess health/growth •Not all households have access to a refrigerator and they cook small portions that last a day •Mostly children and adults share the same meal •Children consume junk food (crisps, processed juice etc.) from kiryana stores •Caregivers were aware of most of the recipes
FGD 3 Mothers
•Discuss meal preparation •Discuss concept of a 'healthy child' •Discuss other public health campaigns active in the neighborhood
•FGD Script
•Caregivers are more familiar with the concept of wasting •Cooking separate meals for children is not very common •Government-run campaigns on polio have been active in the past
FGD 4 Mothers
•Test final three variants of Growth chart (each variant had a different selection of food/baby pictures)
•FGD Script •Three variants of Growth chart each with a different selection of pictures.
•Caregivers could identify the difference between healthy and junk food •Caregivers were able to name all food items
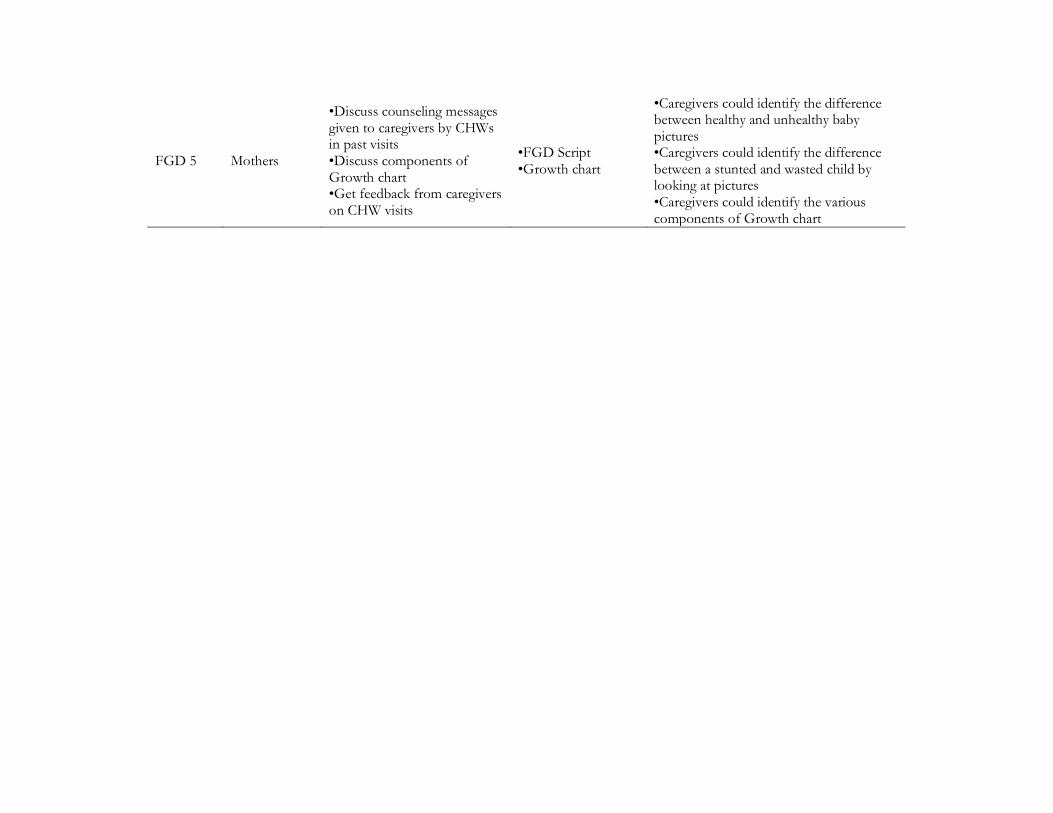
FGD 5 Mothers
•Discuss counseling messages given to caregivers by CHWs in past visits •Discuss components of Growth chart •Get feedback from caregivers on CHW visits
•FGD Script •Growth chart
•Caregivers could identify the difference between healthy and unhealthy baby pictures •Caregivers could identify the difference between a stunted and wasted child by looking at pictures •Caregivers could identify the various components of Growth chart
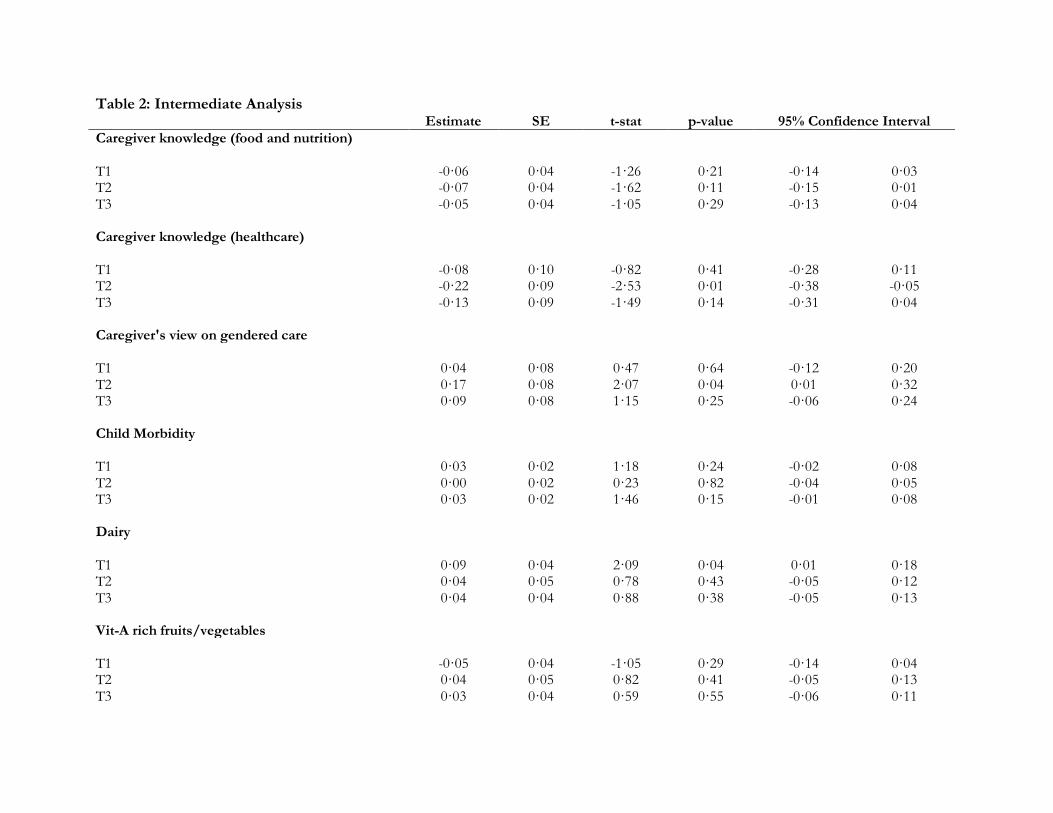
Table 2: Intermediate Analysis Estimate SE t-stat p-value 95% Confidence Interval
Caregiver knowledge (food and nutrition) T1 -0·06 0·04 -1·26 0·21 -0·14 0·03 T2 -0·07 0·04 -1·62 0·11 -0·15 0·01 T3 -0·05 0·04 -1·05 0·29 -0·13 0·04
Caregiver knowledge (healthcare) T1 -0·08 0·10 -0·82 0·41 -0·28 0·11 T2 -0·22 0·09 -2·53 0·01 -0·38 -0·05 T3 -0·13 0·09 -1·49 0·14 -0·31 0·04
Caregiver's view on gendered care T1 0·04 0·08 0·47 0·64 -0·12 0·20 T2 0·17 0·08 2·07 0·04 0·01 0·32 T3 0·09 0·08 1·15 0·25 -0·06 0·24
Child Morbidity T1 0·03 0·02 1·18 0·24 -0·02 0·08 T2 0·00 0·02 0·23 0·82 -0·04 0·05 T3 0·03 0·02 1·46 0·15 -0·01 0·08
Dairy T1 0·09 0·04 2·09 0·04 0·01 0·18 T2 0·04 0·05 0·78 0·43 -0·05 0·12 T3 0·04 0·04 0·88 0·38 -0·05 0·13
Vit-A rich fruits/vegetables T1 -0·05 0·04 -1·05 0·29 -0·14 0·04 T2 0·04 0·05 0·82 0·41 -0·05 0·13 T3 0·03 0·04 0·59 0·55 -0·06 0·11
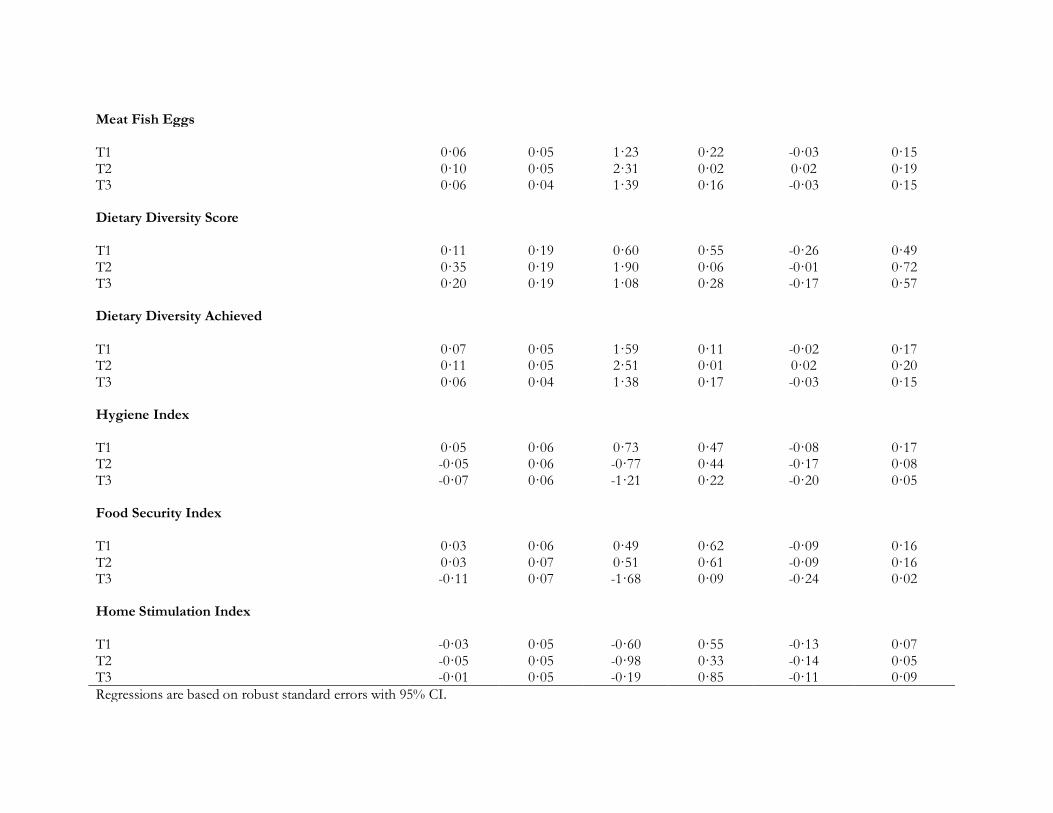
Meat Fish Eggs T1 0·06 0·05 1·23 0·22 -0·03 0·15 T2 0·10 0·05 2·31 0·02 0·02 0·19 T3 0·06 0·04 1·39 0·16 -0·03 0·15
Dietary Diversity Score T1 0·11 0·19 0·60 0·55 -0·26 0·49 T2 0·35 0·19 1·90 0·06 -0·01 0·72 T3 0·20 0·19 1·08 0·28 -0·17 0·57
Dietary Diversity Achieved T1 0·07 0·05 1·59 0·11 -0·02 0·17 T2 0·11 0·05 2·51 0·01 0·02 0·20 T3 0·06 0·04 1·38 0·17 -0·03 0·15
Hygiene Index T1 0·05 0·06 0·73 0·47 -0·08 0·17 T2 -0·05 0·06 -0·77 0·44 -0·17 0·08 T3 -0·07 0·06 -1·21 0·22 -0·20 0·05
Food Security Index T1 0·03 0·06 0·49 0·62 -0·09 0·16 T2 0·03 0·07 0·51 0·61 -0·09 0·16 T3 -0·11 0·07 -1·68 0·09 -0·24 0·02
Home Stimulation Index T1 -0·03 0·05 -0·60 0·55 -0·13 0·07 T2 -0·05 0·05 -0·98 0·33 -0·14 0·05 T3 -0·01 0·05 -0·19 0·85 -0·11 0·09
Regressions are based on robust standard errors with 95% CI.

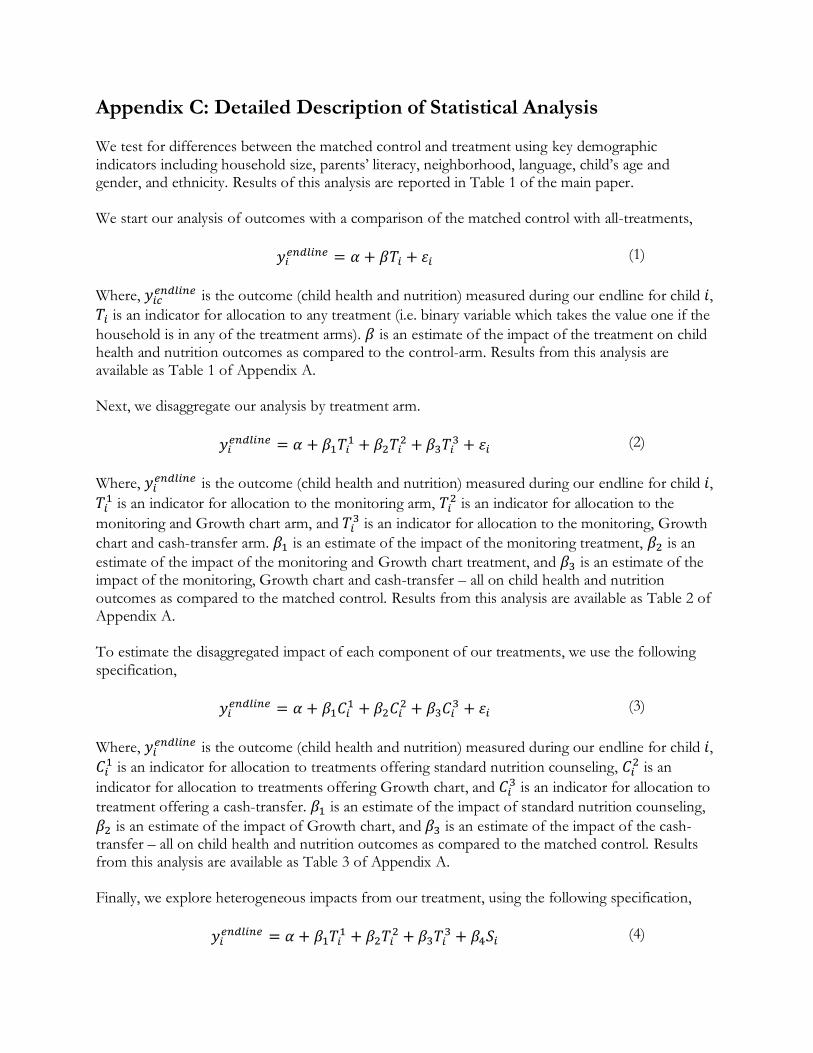
Appendix C: Detailed Description of Statistical Analysis We test for differences between the matched control and treatment using key demographic indicators including household size, parents’ literacy, neighborhood, language, child’s age and gender, and ethnicity. Results of this analysis are reported in Table 1 of the main paper. We start our analysis of outcomes with a comparison of the matched control with all-treatments,
𝑦𝑖𝑒𝑛𝑑𝑙𝑖𝑛𝑒 = 𝛼 + 𝛽𝑇𝑖 + 𝜀𝑖 (1)
Where, 𝑦𝑖𝑐𝑒𝑛𝑑𝑙𝑖𝑛𝑒 is the outcome (child health and nutrition) measured during our endline for child 𝑖,
𝑇𝑖 is an indicator for allocation to any treatment (i.e. binary variable which takes the value one if the
household is in any of the treatment arms). 𝛽 is an estimate of the impact of the treatment on child health and nutrition outcomes as compared to the control-arm. Results from this analysis are available as Table 1 of Appendix A. Next, we disaggregate our analysis by treatment arm.
𝑦𝑖𝑒𝑛𝑑𝑙𝑖𝑛𝑒 = 𝛼 + 𝛽1𝑇𝑖
1 + 𝛽2𝑇𝑖2 + 𝛽3𝑇𝑖
3 + 𝜀𝑖 (2)
Where, 𝑦𝑖𝑒𝑛𝑑𝑙𝑖𝑛𝑒 is the outcome (child health and nutrition) measured during our endline for child 𝑖,
𝑇𝑖1 is an indicator for allocation to the monitoring arm, 𝑇𝑖
2 is an indicator for allocation to the
monitoring and Growth chart arm, and 𝑇𝑖3 is an indicator for allocation to the monitoring, Growth
chart and cash-transfer arm. 𝛽1 is an estimate of the impact of the monitoring treatment, 𝛽2 is an
estimate of the impact of the monitoring and Growth chart treatment, and 𝛽3 is an estimate of the impact of the monitoring, Growth chart and cash-transfer – all on child health and nutrition outcomes as compared to the matched control. Results from this analysis are available as Table 2 of Appendix A. To estimate the disaggregated impact of each component of our treatments, we use the following specification,
𝑦𝑖𝑒𝑛𝑑𝑙𝑖𝑛𝑒 = 𝛼 + 𝛽1𝐶𝑖
1 + 𝛽2𝐶𝑖2 + 𝛽3𝐶𝑖
3 + 𝜀𝑖 (3)
Where, 𝑦𝑖𝑒𝑛𝑑𝑙𝑖𝑛𝑒 is the outcome (child health and nutrition) measured during our endline for child 𝑖,
𝐶𝑖1 is an indicator for allocation to treatments offering standard nutrition counseling, 𝐶𝑖
2 is an
indicator for allocation to treatments offering Growth chart, and 𝐶𝑖3 is an indicator for allocation to
treatment offering a cash-transfer. 𝛽1 is an estimate of the impact of standard nutrition counseling,
𝛽2 is an estimate of the impact of Growth chart, and 𝛽3 is an estimate of the impact of the cash-transfer – all on child health and nutrition outcomes as compared to the matched control. Results from this analysis are available as Table 3 of Appendix A. Finally, we explore heterogeneous impacts from our treatment, using the following specification,
𝑦𝑖𝑒𝑛𝑑𝑙𝑖𝑛𝑒 = 𝛼 + 𝛽1𝑇𝑖
1 + 𝛽2𝑇𝑖2 + 𝛽3𝑇𝑖
3 + 𝛽4𝑆𝑖 (4)
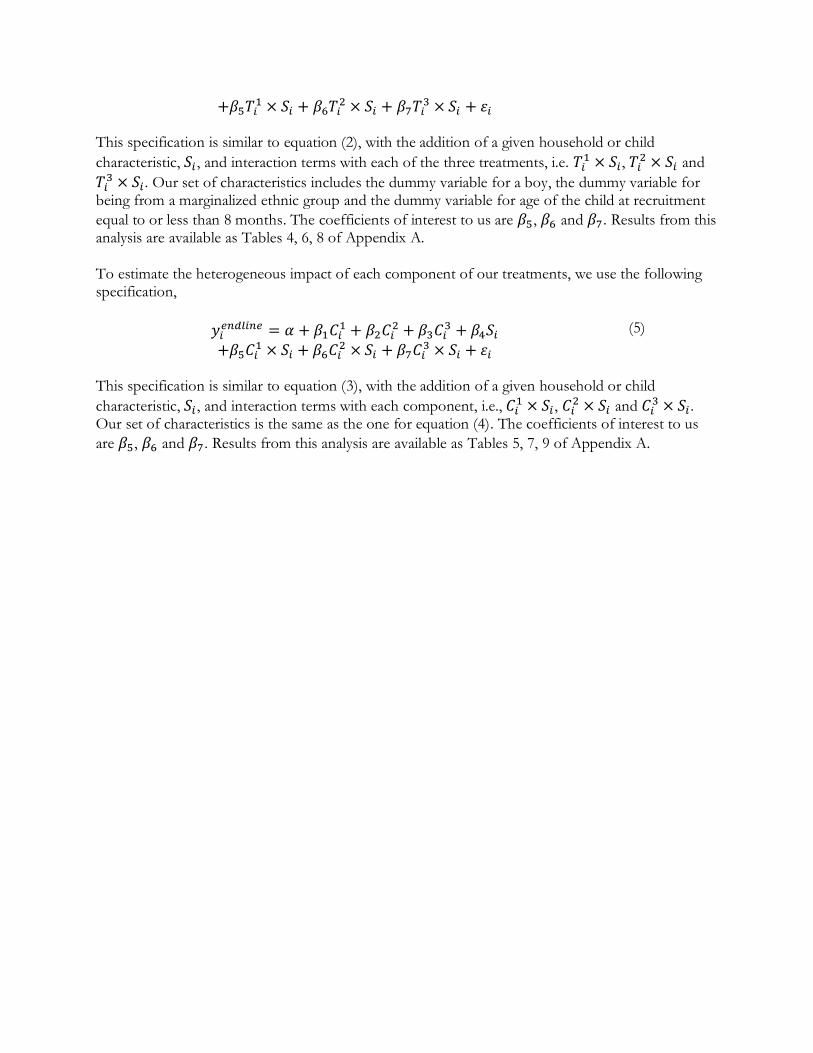
+𝛽5𝑇𝑖1 × 𝑆𝑖 + 𝛽6𝑇𝑖
2 × 𝑆𝑖 + 𝛽7𝑇𝑖3 × 𝑆𝑖 + 𝜀𝑖
This specification is similar to equation (2), with the addition of a given household or child
characteristic, 𝑆𝑖 , and interaction terms with each of the three treatments, i.e. 𝑇𝑖1 × 𝑆𝑖 , 𝑇𝑖
2 × 𝑆𝑖 and
𝑇𝑖3 × 𝑆𝑖 . Our set of characteristics includes the dummy variable for a boy, the dummy variable for
being from a marginalized ethnic group and the dummy variable for age of the child at recruitment
equal to or less than 8 months. The coefficients of interest to us are 𝛽5, 𝛽6 and 𝛽7. Results from this analysis are available as Tables 4, 6, 8 of Appendix A. To estimate the heterogeneous impact of each component of our treatments, we use the following specification,
𝑦𝑖𝑒𝑛𝑑𝑙𝑖𝑛𝑒 = 𝛼 + 𝛽1𝐶𝑖
1 + 𝛽2𝐶𝑖2 + 𝛽3𝐶𝑖
3 + 𝛽4𝑆𝑖 +𝛽5𝐶𝑖
1 × 𝑆𝑖 + 𝛽6𝐶𝑖2 × 𝑆𝑖 + 𝛽7𝐶𝑖
3 × 𝑆𝑖 + 𝜀𝑖
(5)
This specification is similar to equation (3), with the addition of a given household or child
characteristic, 𝑆𝑖 , and interaction terms with each component, i.e., 𝐶𝑖1 × 𝑆𝑖 , 𝐶𝑖
2 × 𝑆𝑖 and 𝐶𝑖3 × 𝑆𝑖 .
Our set of characteristics is the same as the one for equation (4). The coefficients of interest to us
are 𝛽5, 𝛽6 and 𝛽7. Results from this analysis are available as Tables 5, 7, 9 of Appendix A.

Page 1 of 3
Appendix D: Coarsened Exact Matching In addition to our original baseline sample, we sampled an additional 451-households to allow for a comparison with a pure control that had not received any interventions. These 451-households were matched with the original baseline sample. We selected this sample by retrospectively applying the same criteria used to recruit the original baseline sample. Next, we employed coarsened exact matching (CEM) to prune the sample to a matched subsample (Stefano et al 2012). We matched on
• Household Size
• Child Age
• Father's Education
• Mother's Education
• Marginalized Ethnicity
• Language
Ideally, we would have had our core outcomes in the set of matching variables. We do not have measurements of child anthropometrics at the time of baseline for this additional sample since they were recruited at endline. CEM is conceptually similar to exact matching. In exact matching, subjects across control and treatment samples are matched by finding the exact values of a given set of characteristics. The CEM procedure modifies in that the characteristics used for matching are coarsened: cut points are added to the distribution of a matching characteristic to create bins. Rather than match using an exact value of a characteristic, the bin (subrange) in which a specific observation’s characteristic value falls is used for matching. Cut points are added to all variables chosen for matching. The choice of cut points is based on substantive qualities of the matching characteristics. Thus, for instance, for education we split the distribution into illiterate, primary, secondary and tertiary. Each unique combination of the specific bin for all characteristics combines to form strata. The process of matching results in a pruned sample. First, we calculate the imbalance between key matching variables for treatment and control and get an L1 score of 0.9385. We then try versions of matching in order to reduce this L1 distance. The first matching includes household size (bins 5, 10, 15, 20), child’s age at baseline (bins 2, 6, 8, 11, 22), father’s education (bins Primary, Middle, Matric, Intermediate, Undergraduate, Masters/PhD), mother’s education (bins Primary, Middle, Matric, Intermediate, Undergraduate, Masters/PhD), and language (bins Urdu, Sindhi, Punjabi, Pushto, Siraiki, Hindko). This gives us an L1 score of 0.6314 and a matched sample of 836 households. In the second version, we use the same variables and cut-off points for all variables except parents’ education; we replace the continuous education variables with binary variables indicating father’s and mother’s literacy (a value of 1 indicates literate i.e. have received at least one year of schooling). This gives us a lower L1 score of 0.5700 and a higher matched sample of 1,046 households. We present results using both variants to ensure transparency.

Page 2 of 3
References Stefano M. Iacus, Gary King, and Giuseppe Porro. 2012. “Causal Inference Without Balance Checking: Coarsened Exact Matching.” Political Analysis, 20, 1, Pp. 1-24.

Page 3 of 3
Table D1: Coarsened Exact Matching
Imbalance First
iteration Second iteration
Household Size 0.1415 0.1485 0.1270
Child's Age at Baseline 0.2109 0.1877 0.2103
Father's Education 0.1520 0.0029 0.0000
Mother's Education 0.0990 0.0092 0.0000
Language 0.1166 0.0039 0.0047
Marginalized Ethnicity 0.0047 - -
Neighborhood 0.0499 - -
Treatment Households Matched 507 636
Control Households Matched 329 410
L1 Distance 0.9385 0.6314 0.5700

Appendix E: Instruments This appendix provides copies of the nutrition counseling manual we used, along with copies of the baseline and endline surveys we administered.

Nutrition Counseling Manual Feeding practices for children 3-24 months of age (10-minutes) A1: Exclusive Breastfeeding: 3-5 months During the first 6 months, only exclusively breastfeed your child. It means that no other liquid including water, semi-solid and solid food is given to the child. Until 6 months, the breastmilk fulfills all nutritional and water requirements of the baby. Even in extreme hot weather, breastmilk is enough to quench the thirst of your child. However, if the doctor prescribes some medicines, that can be given to your child. Please breastfeed your child at least 8-12 times each day or even more if the child demands. Giving only breastmilk during the first 6 months can save the child from diseases such as diarrhea and chest infections. The benefits of breastfeeding are that the breastmilk is always available, and it also helps create a strong bond between the mother and the child and it makes the child and the mother healthy. If you are unable to breastfeed the child at all times, e.g., if you are busy with other chores or work outside home, you can express breast milk beforehand, keep it in a safe place, and you or someone else can feed the child from the cup when required. Before you start expressing, make sure to wash your hands thoroughly with soap and warm water. Use clean cup to collect the expressed breast milk. Sit in a comfortable position and cup your breast with one hand. Then, with your other hand, form a "C" shape with your forefinger and thumb. Squeeze gently, keeping your finger and thumb near the darker area around your nipple but not on it - don't squeeze the nipple itself as you could make it sore. This shouldn't hurt. Drops should start to appear and your milk usually starts to flow. If no drops appear, try moving your finger and thumb slightly, but still avoid the darker area. When the flow slows down, move your fingers round to a different section of your breast and repeat. When the flow from one breast has slowed, swap to the other breast. A2: Complementary feeding: 6-8 months We hope you have exclusively breastfed your babies for 6 months. Please continue to breastfeed your child, at least 6-8 times each day, until two years to maintain his/her strength. During the first and second year, breast milk is an important source of nutrients for your child. The benefits of breastfeeding are that the breastmilk is always available, and it also helps create a strong bond between the mother and the child and it makes the child and the mother healthy. If you are unable to breastfeed the child at all times, e.g., if you are busy with other chores or work outside home, you can express breast milk beforehand, keep it in a safe place, and you or someone else can feed the child from the cup when required.

As the child completes 6 months, s/he needs complementary food in addition to breastmilk. Start with one food item, and give it for 3 to 4 days to make sure the child is receiving it well. Add one more item at a time till the child is eating 2-3 different items per day. Start with one meal a day and gradually add more meals and light snacks. Try to feed 2-3 meals a day and 1-2 snacks because babies have small stomachs and need to be fed frequently. For a 6 months old baby, start with 3 tablespoons of food per day i.e. one tablespoon per meal (show tablespoon). Increase the quantity if the child wants to eat more. The first food given to child can be mashed banana, sagoo dana, rice or potato. Wheat-based foods such as soft roti, dalia, sewji or siviaya may be added but please be aware that they sometimes can cause allergic reactions when introduced as first foods after 6 months. These foods should be thick enough to be fed by hand. Further thicken the complementary food as the baby grows older, making sure that s/he is still able to easily swallow without choking. Egg can be given to child at an early age and is very healthy for the child. One egg per day can be a very good source of animal-protein for them. Milk can be given to the babies in addition to breastfeeding. Milk-based products such as yogurt and lassi can also be given as milk is very important for the development of bones. You can introduce traditional khichri (mixture of rice and any dal) as this is very healthy for the child. If you do not have time to make separate food for the babies, you can give the child softened roti with ghee, softened rice with yogurt, mashed potatoes with yogurt. Mixing with ghee makes the food soft and mixing with yogurt makes it less spicy. Example of a 24-hour meal-plan for a child aged between 6 and 8 months: 1. Breakfast: Egg 2. Morning snack: Mashed banana/mango 3. Lunch: Softened roti with ghee 4. Dinner: Softened roti with yogurt/mashed potato A3: Complementary feeding: 9-11 months We hope you have exclusively breastfed your babies for 6 months. Please continue to breastfeed your child, at least 6-8 times each day, until two years to maintain his/her strength. During the first and second year, breast milk is an important source of nutrients for your child. The benefits of breastfeeding are that the breastmilk is always available, and it also helps create a strong bond between the mother and the child and it makes the child and the mother healthy. If you are unable to breastfeed the child at all times, e.g., if you are busy with other chores or work outside home, you can express breast milk beforehand, keep it in a safe place, and you or someone else can feed the child from the cup when required.

Give 3-4 types of food each day by this age. Try to feed 2-3 meals a day and 1-2 snacks because babies have small stomachs and need to be fed frequently. The baby should at least be eating 9 tablespoons of food each day i.e. 3 tablespoons per meal (show tablespoon). Foods such as mashed banana, sagoo dana, rice or potato can be given to child. Wheat based foods such as soft roti, dalia, sewji or siviaya can also be given. These foods should be thick enough to be fed by hand. Further thicken the complementary food as the baby grows older, making sure that it is still able to easily swallow without choking. Egg can be given to child at an early age and is very healthy for the child. One egg per day can be a very good source of animal-protein for them. Milk can be given to the babies in addition to breastfeeding. Milk-based products such as yogurt and lassi can also be given as milk is very important for the development of bones. Add flesh-food, even if it’s a little quantity, to child’s diet because children need animal protein such as chicken, mutton, beef, and fish. You can also start giving organ meat such as liver if the child likes it. Add pulses and lentils to child’s diet as children are generally fond of them. Also, add other seasonal fruits such as mango, papaya, apple, etc., and vegetables such as peas, spinach, and carrots. You can introduce traditional khichri (mixture of rice and any dal) as this is very healthy for the child. In khichri you can add meat and vegetables. If you do not have time to make separate food for the babies, you can give the child softened roti with ghee, softened rice with yogurt, mashed potatoes with yogurt. Mixing with ghee makes the food soft and mixing with yogurt makes it less spicy. Example of a 24-hour meal-plan for a child aged between 9 and 11 months: 1. Breakfast: Egg with toast 2. Morning snack: Banana/mango 3. Lunch: khichri 4. Evening snack: Boiled potatoes 5. Dinner: khichri A4: Complementary feeding: 12-24 months We hope you have exclusively breastfed your babies for 6 months. Please continue to breastfeed your child, at least 6-8 times each day, until two years to maintain his/her strength. During the first and second year, breast milk is an important source of nutrients for your child. The benefits of breastfeeding are that the breastmilk is always available, and it also helps create a strong bond between the mother and the child and it makes the child and the mother healthy.

If you are unable to breastfeed the child at all times, e.g., if you are busy with other chores or work outside home, you can express breast milk beforehand, keep it in a safe place, and you or someone else can feed the child from the cup when required. Give 3-4 types of food each day by this age. Try to feed 3-4 meals a day and 1-2 snacks because babies have small stomachs and need to be fed frequently. As the baby turns 12 months or one year, they should be eating around 18 tablespoons of food altogether i.e. 5-6 tablespoons per meal (show tablespoon). Egg can be given to child at an early age and is very healthy for the child. One egg per day can be a very good source of animal-protein for them. Milk can be given to the babies in addition to breastfeeding. Milk-based products such as yogurt and lassi can also be given as milk is very important for the development of bones. Add flesh-food, even if it’s a little quantity, to child’s diet because children need animal protein such as chicken, mutton, beef, and fish. You can also start giving organ meat such as liver if the child likes it. Add pulses and lentils to child’s diet as children are generally fond of them. Also, add other seasonal fruits such as mango, papaya, apple, etc., and vegetables such as peas, spinach, and carrots. You can give traditional khichri (mixture of rice and any dal) as this is very healthy for the child. In khichri you can add meat and vegetables. You can also introduce salans to the baby’s diet; salans can have chicken, fish, lentils, eggs or vegetables at the same time or separately. When the baby eats such salan with roti or rice, it is very healthy because it comprises different types of food.
If you do not have time to make salans separately for babies, you can give the food cooked for the family with more rice, roti or yogurt; mixing with yogurt makes the food less spicy. Example of a 24-hour meal-plan for a child between 12 and 24 months: 1. Breakfast: Egg with toast 2. Morning snack: Banana/mango 3. Lunch: Fish salan with roti/masoor daal with rice and yogurt 4. Evening snack: Boiled potatoes 5. Dinner: Fish salan with roti/ masoor daal with rice and yogurt

B: Hygiene in feeding (all ages) Cleanliness leads to good health for the babies. It is very important to properly wash hands before making food for the baby, before feeding them, after using the washroom and after cleaning your baby. Keep the hands of the baby clean at all times because they put their hands in their mouths frequently and specially wash their hands before they eat food. Use clean utensils and eat at a clean place. The left-over food must be kept in clean utensils and at a clean place to avoid diseases such as diarrhea. Before consuming left-over food, always make sure it has retained its freshness as stale food results in illnesses. Always use clean water for drinking and cooking. You can boil the water and let it cool before using it. Many diseases such as diarrhea are caused because of dirty water. If babies have diarrhea, give them ORS sachet. If proper care is not taken, diarrhea can prove to be very dangerous. C: Exceptional cases of Severe Acute Malnutrition (SAM) Your child needs special attention because s/he is extremely weak for his/her height. In your community, around 3 out if 10 children suffers from this severe weakness. You should pay attention to the health condition of your child because it can have effects on his mental and physical growth. Immediately see a doctor for treatment. You can visit Ziauddin Community Clinic or Sina Clinic nearby.

Statement on Surveys Baseline was conducted in July 2019. Endline data was collected in October 2020.
Survey teams followed procedures to ensure social distancing and protection using masks, gloves
and hand sanitizer. All data was recorded on electronic tablets. A detailed household questionnaire
was administered to the household head or, in their absence, to the most informed household
member. A mother (primary caregiver) questionnaire was administered to capture nutritional
knowledge, feeding recall, and WASH practices
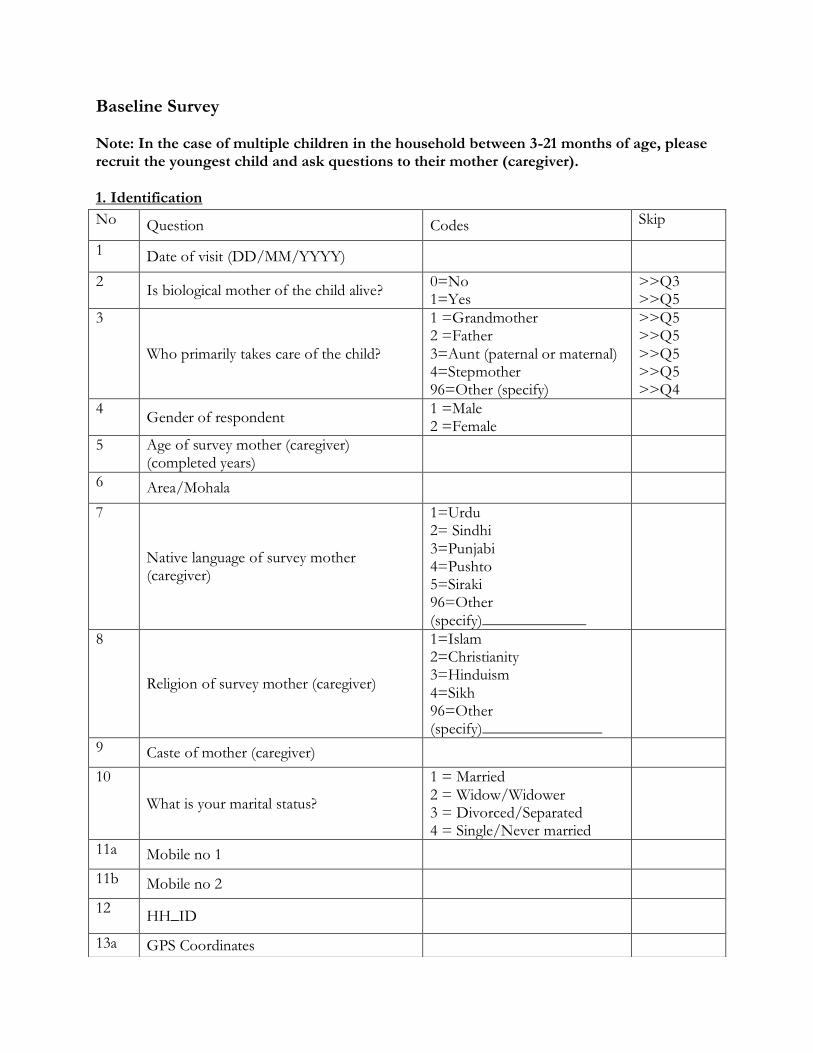
Baseline Survey Note: In the case of multiple children in the household between 3-21 months of age, please recruit the youngest child and ask questions to their mother (caregiver).
1. Identification
No Question Codes Skip
1 Date of visit (DD/MM/YYYY)
2 Is biological mother of the child alive?
0=No 1=Yes
>>Q3 >>Q5
3
Who primarily takes care of the child?
1 =Grandmother 2 =Father 3=Aunt (paternal or maternal) 4=Stepmother 96=Other (specify)
>>Q5 >>Q5 >>Q5 >>Q5 >>Q4
4 Gender of respondent
1 =Male 2 =Female
5 Age of survey mother (caregiver) (completed years)
6 Area/Mohala
7
Native language of survey mother (caregiver)
1=Urdu 2= Sindhi 3=Punjabi 4=Pushto 5=Siraki 96=Other (specify)_____________
8
Religion of survey mother (caregiver)
1=Islam 2=Christianity 3=Hinduism 4=Sikh 96=Other (specify)_______________
9 Caste of mother (caregiver)
10
What is your marital status?
1 = Married 2 = Widow/Widower 3 = Divorced/Separated 4 = Single/Never married
11a Mobile no 1
11b Mobile no 2
12 HH_ID
13a GPS Coordinates

2. Household Roster and Details
Read aloud: I am going to ask you some questions now about your household. A household is a group of people who live together and eat from a single kitchen.
No Question Response Skip
1 How many people live in the household
2 How many females above 18 years of age live in the household including yourself
Mother alive & married>>Q3 If mother not alive, divorced or widowed>>Q4
3 What is your husband’s highest level of education completed
1 = Started school but not completed Grade 1 2=Primary school (grades 1-5) 3=Middle school (grades 6-8) 4=Matric pass (9th and 10th grade) 5=Intermediate pass (11th and 12th grade) 6 = Undergraduate (Bsc/Bcom) 7= Masters/ PhD 8 =Vocational training 9=Adult literacy program 10=Madrassa 96 = Other (specify)
13b Address and directions from local headquarters (Sukoon water plant)
14 Do you intend to move from this address in the next 12 months?
0=No 1=Yes
>>Next section Q14a
14a Can you please share a tentative address?

4 What is your [survey mother/caregiver] highest level of education completed
1 = Started school but not completed Grade 1 2=Primary school (grades 1-5) 3=Middle school (grades 6-8) 4=Matric pass (9th and 10th grade) 5=Intermediate pass (11th and 12th grade) 6 = Undergraduate (Bsc/Bcom) 7= Masters/ PhD 8 =Vocational training 9=Adult literacy program 10=Madrassa 96 = Other (specify)
5 Have you [survey mother/caregiver] done any work in the last 12 months besides the housework like cooking, cleaning. This work could be done for cash, in kind or no payment
0=No 1=Yes
>>Next section >>Q6
6 What is your [survey mother/caregiver] main occupation?
1 = Government service 2 = Other salaried job in private sector 3 = Domestic servant 4=Teacher 5=Farm work 6=Raising livestock 7 =Other non-agricultural wage laborer 8 =Own shop/business 9=Cart keeper 10=Sewing/embroidery 11 =Fuel (wood/dung) selling 12 =Working abroad 96 = Other (specify)____________

3. Child feeding practices
Note: Please fill this out for above recruited youngest child in the household.
1 Did [child name] have had any of the following liquids/drink in the last 24-hours?
0=No 1=Yes
a Infant formula such as Meiji, BF, Lactogen 0 1 # of times:
If 1>># of times
b Animal milk such as cow, buffalo, goat, etc 0 1 # of times:
If 1>># of times
c Powdered milk such as nido 0 1 # of times:
If 1>># of times
d Yogurt 0 1 # of times:
If 1>># of times
e Juice 0 1
f ORS 0 1
2
During the past 24-hours did [child name ] drink anything from a bottle with a nipple?
0=No 1=Yes
3 Was [child name] breastfed in the last 24-hours?
0=No 1=Yes
>>Q4 >>Q3a
3a
How many times? # of time ____________
4 Yesterday during the day or night, did (name) eat any of the following items at home or outside home?
0=No 1=Yes
a Rice 0 1
b Roti 0 1
c Rusk/Bread 0 1
d Sooji 0 1
e Khichri 0 1
f Kheer 0 1
g Dalia 0 1
h Carrots, sweet potatoes that are yellow or orange inside
0 1
i White potatoes, sweet potatoes that are white or any other foods made from roots such as turnip
0 1
j Any dark green leafy vegetables like saag 0 1
k Ripe mangoes, ripe papayas, Apricot 0 1
l Any other fruits or vegetables in any form 0 1
m Liver, kidney, heart 0 1

n Any meat (beef, chicken, goat, etc.) 0 1
o Eggs 0 1
p Fish 0 1
q Any foods made from beans like lobia, red kidney beans
0 1
r Any foods made from nuts like almonds, walnuts, peanuts
0 1
s Any foods made from lentils 0 1
t Other milk product Read Aloud: Does not include ice cream
0 1
u French fries 0 1
v Any sugary foods such as chocolates, candies, pastries, cakes or biscuits, ice creams
0 1
w Salty snacks such as biscuits, packet chips 0 1
5 If not a single “Yes” in 4a – 4w, then ask 5a, otherwise ask 5c.
5a Did [child name] eat any solid, semi-solid, or soft foods yesterday during the day or night?
0 No 1 Yes
Q6 Q5b
5b What did the child [name] eat? ______________
5c Over the past 24-hours, how many times did [child name] eat solid, semi-solid, or soft foods other than liquids at home or outside home (exclude liquids)?
No of times _____________
6 In the last one month, did you hear OR see OR read any messages/suggestions about breastfeeding or complementary feeding?
0=No 1=Yes
>>Next section >>Q6a
6a Where or from whom did you hear /see/ read about it? Multiple answers are possible. Don’t read possible answers
1=Mother/mother in law 2=TV 3=Newspaper 4=Mobile phone 5=Doctor/LHW/CHW 6=Poster/leaflet 7=Neighbors 8=Other relative/household member 96=Other (specify)_______
4. Water, sanitation and hygiene
Subsection A: Water

No. Questions and filters Coding categories SKIP
1. What is the main source of drinking water for your household?
1 = Piped water 2 = Hand pump 3= Mineral water 4=Tanker truck/Water bearer 5=Filtration plant 96 = Other (specify)____________________ 98 = Don’t know
2. Do you treat your water in any way to make it safer to drink?
0 =No 1= Yes
Q4 Q3
3. What do you usually do to treat the water to make it safer to drink? Multiple answers possible. Don’t read possible answers.
1 = Boil 2 = Add bleach/chlorine 3 = Add alum 4 = Strain it through a cloth 5 = Use a water filter 6 = Let it stand and settle 96 = Other (specify) ____________________ 98 = Don’t know
4. Is the drinking water pot covered?
0 =No 1= Yes 2= N/A – Water not kept in water pot
Subsection B: Sanitation & hygiene
No. Questions and filters Coding categories SKIP
1. What kind of toilet facility do members of your household usually use?
1=Flush toilet 2=Pit latrine 3=Septic tank 4=No facility/open defecation/Bush/Field 96=Other (specify)_________
2 Observation only Is there any soap next to toilet/latrine?
0 =No 1= Yes 99=Not observed
3 Observation only Is the kitchen/cooking area clean?
0 =No 1= Yes 99=Not observed
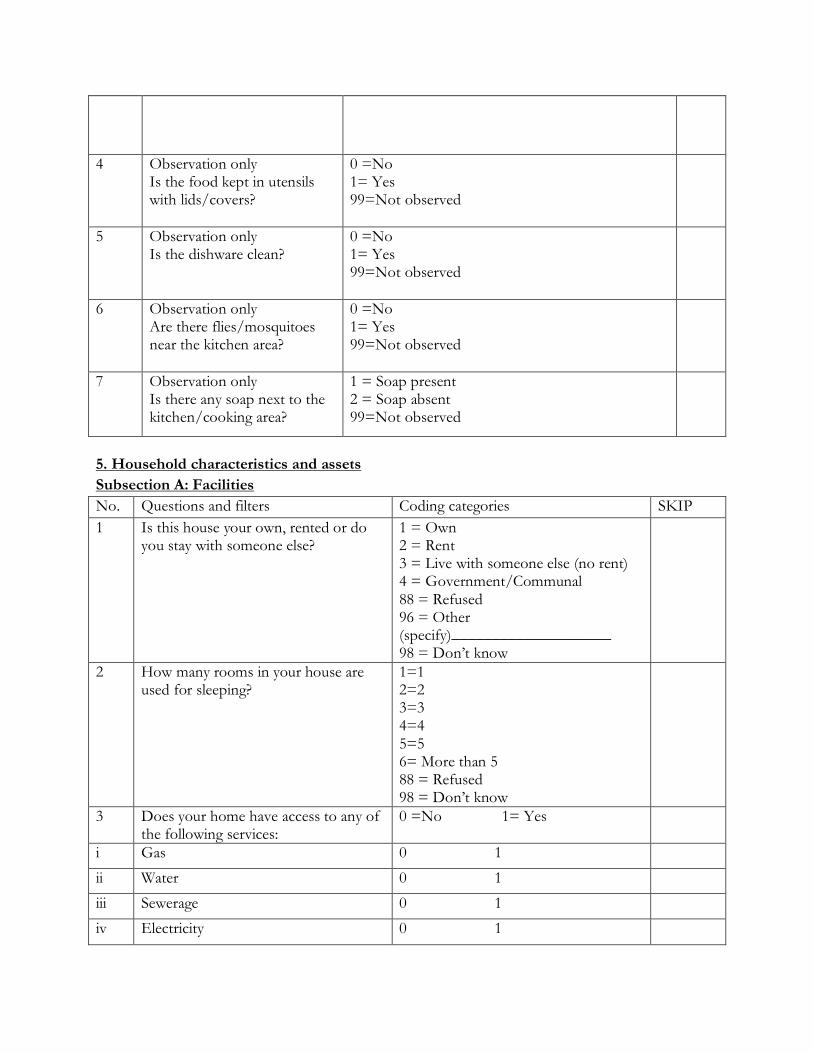
4 Observation only Is the food kept in utensils with lids/covers?
0 =No 1= Yes 99=Not observed
5 Observation only Is the dishware clean?
0 =No 1= Yes 99=Not observed
6 Observation only Are there flies/mosquitoes near the kitchen area?
0 =No 1= Yes 99=Not observed
7 Observation only Is there any soap next to the kitchen/cooking area?
1 = Soap present 2 = Soap absent 99=Not observed
5. Household characteristics and assets
Subsection A: Facilities
No. Questions and filters Coding categories SKIP
1 Is this house your own, rented or do you stay with someone else?
1 = Own 2 = Rent 3 = Live with someone else (no rent) 4 = Government/Communal 88 = Refused 96 = Other (specify)____________________ 98 = Don’t know
2 How many rooms in your house are used for sleeping?
1=1 2=2 3=3 4=4 5=5 6= More than 5 88 = Refused 98 = Don’t know
3 Does your home have access to any of the following services:
0 =No 1= Yes
i Gas 0 1
ii Water 0 1
iii Sewerage 0 1
iv Electricity 0 1

4 What is your main source of energy for cooking?
1 = Electricity 2 = Liquefied propane gas (LPG) 3 = Natural gas 4 = Biogas 5 = Firewood 6 = Kerosene 7 = Charcoal/coal/lignite 8 = Animal Dung 9 = Dried leaves/shrub/straw 96 = Other (Specify) ________
5.
What is the main material used to construct the floor of the house?
1 = Cement 2= Tile/marble 3 = Mud 4=Bricks 96 = Other (specify)____________________ 98 = Don’t know
6 What is the main material used to construct the ceiling/roof of the house?
1 = Reinforced Concrete(RCC )/Cement 2 = Iron sheets 3 = Bamboo/twigs 4 = T-Iron/Wood 5 = Tile beam 6 = Cardboard/plastic 7 = No ceiling 96 = Other (specify)_____________________ 98 = Don’t know
7. What (main) material has been used to construct most of the walls of the house?
1 = Cement blocks 2= Burned bricks 3 = Unbaked bricks 4 = Wood 5 = Stone 6 = Mud 7=Bamboo 96 = Other (specify)_____________________ 98 = Don’t know
Subsection B: Assets
Read Aloud: Now I would like to ask you some information regarding specific assets you may own in your household.
1 Do you have the following assets (Read one by one)
a. Air Conditioner 0=No 1=Yes

b. Refrigerator 0=No 1=Yes
c. Television 0=No 1=Yes
d. Smart mobile Phone (which has whats app, facebook, youtube) 0=No 1=Yes
e. Computer 0=No 1=Yes
f. UPS/Generator 0=No 1=Yes
g. Car/Datsun/Truck 0=No 1=Yes
h. Bicycle 0=No 1=Yes
i. Motorcycle/Scooter 0=No 1=Yes
j. Qingqi/rickshaw 0=No 1=Yes
k. Donkey/mule/horse/Ox 0=No 1=Yes
l. Sewing machine 0=No 1=Yes
Subsection C: Land
1. Does any household member own any land including the house you live in
0=No 1=Yes
>>Next section >>Q2
2 How much land do you own Note: Record in square feet
______ sq ft
6. Intergenerational transfer of beliefs
Subsection A : Survey mother 1
A1: Read aloud: Now I would read some general statements regarding your childrens’ health and nutrition. Please tell me, do you agree or disagree with the following statements’: Statement Response
Breastfeeding alone up-to 6 months does provide enough nutrition for the child
❑1. Agree
❑2. Neutral
❑3. Disagree
Children should be taken to a doctor when they fall sick ❑1. Agree
❑2. Neutral
❑3. Disagree
1 (If the mother is not alive, follow the training guidelines provided by senior supervisor to fill this
section )

Vaccinations like polio vaccine drops cause infertility and other harmful side effects
❑1. Agree
❑2. Neutral
❑3. Disagree
Malnutrition during the first two years of a child’s life will badly affect his/her learning ability at school
❑1. Agree
❑2. Neutral
❑3. Disagree
Infant boys should be breastfed longer than infant girls. ❑1. Agree
❑2. Neutral
❑3. Disagree
Infant boys need more food than infant girls - like eggs, milk and meat.
❑1. Agree
❑2. Neutral
❑3. Disagree
Vaccination is harmful for the girls, compared to boys because it causes infertility and other harmful side effects in them
❑1. Agree
❑2. Neutral
❑3. Disagree
Compared to girls, boys should be taken to doctors immediately when they fall sick
❑1. Agree
❑2. Neutral
❑3. Disagree
Education of girls is less important than education of boys ❑1. Agree
❑2. Neutral
❑3. Disagree
A2: Read aloud: Now I would like to ask some questions regarding the youngest recruited child’s [name] health and nutrition
1 Is your child [name] currently being breastfed?
0=No 1=Yes
>>Q2 >>Q3
2 At what age did you stop breastfeeding (Name)? Answer to be recorded in completed months
Months 98 =Don’t know
3 Until what age did you exclusively breastfeed the child? Read aloud: Not even water Answer to be recorded in completed months
Months 96=Still exclusively breastfeeding 98 =Don’t know
4 At what age did you introduce complementary foods to the child [name] Note: record in completed months
Months 96=Complementary food not introduced yet 98=Don’t know
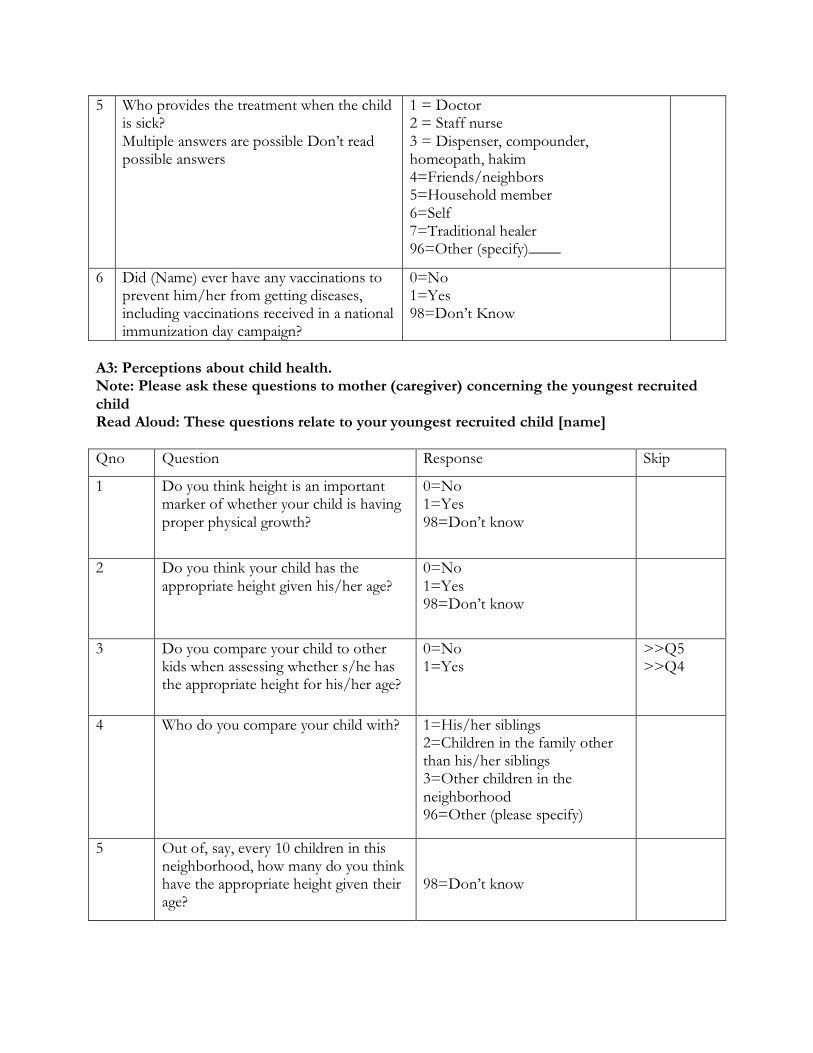
5 Who provides the treatment when the child is sick? Multiple answers are possible Don’t read possible answers
1 = Doctor 2 = Staff nurse 3 = Dispenser, compounder, homeopath, hakim 4=Friends/neighbors 5=Household member 6=Self 7=Traditional healer 96=Other (specify)____
6 Did (Name) ever have any vaccinations to prevent him/her from getting diseases, including vaccinations received in a national immunization day campaign?
0=No 1=Yes 98=Don’t Know
A3: Perceptions about child health. Note: Please ask these questions to mother (caregiver) concerning the youngest recruited child Read Aloud: These questions relate to your youngest recruited child [name]
Qno Question Response Skip
1 Do you think height is an important marker of whether your child is having proper physical growth?
0=No 1=Yes 98=Don’t know
2 Do you think your child has the appropriate height given his/her age?
0=No 1=Yes 98=Don’t know
3 Do you compare your child to other kids when assessing whether s/he has the appropriate height for his/her age?
0=No 1=Yes
>>Q5 >>Q4
4 Who do you compare your child with? 1=His/her siblings 2=Children in the family other than his/her siblings 3=Other children in the neighborhood 96=Other (please specify)
5 Out of, say, every 10 children in this neighborhood, how many do you think have the appropriate height given their age?
98=Don’t know

6 Do you think weight is an important marker of whether your child is having proper physical growth?
0=No 1=Yes 98=Don’t know
7 Do you think your child has the appropriate weight given his/her height?
0=No 1=Yes 98=Don’t know
8 Do you think your child has the appropriate weight given his/her age?
0=No 1=Yes 98=Don’t know
9 Do you compare your child to other kids when assessing whether s/he has the appropriate weight for his/her age and height?
0=No 1=Yes
>>Q11 >>Q10
10 Who do you compare your child with?
1=His/her siblings 2=Children in the family other than his/her siblings 3=Other children in the neighborhood 96=Other (please specify)
11 Out of, say, every 10 children in this neighborhood, how many do you think have the appropriate weight given their height?
98=Don’t know
12 Out of, say, every 10 children in this neighborhood, how many do you think have the appropriate weight given their age?
98=Don’t know
If ‘Yes’ to both 1 and 6
13 Which one is more important as a marker of your child’s physical growth – weight or height?
1=Weight 2=Height 3=Both are equally important

Subsection B: Mother in law:
B1: Read aloud: Now I would read some general statements regarding your childrens’ health and nutrition. Please tell me, do you agree or disagree with the following statements’: Statement Response
Breastfeeding alone up-to 6 months does provide enough nutrition for the child ❑1. Agree
❑2. Neutral
❑3. Disagree
Children should be taken to a doctor when they fall sick ❑1. Agree
❑2. Neutral
❑3. Disagree
Vaccinations like polio vaccine drops cause infertility and other harmful side effects ❑1. Agree
❑2. Neutral
❑3. Disagree
Malnutrition during the first two years of a child’s life will badly affect his/her learning ability at school.
❑1. Agree
❑2. Neutral
❑3. Disagree
Infant boys should be breastfed longer than infant girls. ❑1. Agree
❑2. Neutral
❑3. Disagree
Infant boys need more food than infant girls - like eggs, milk and meat. ❑1. Agree
❑2. Neutral
❑3. Disagree
Vaccination is harmful for the girls, compared to boys because it causes infertility and other harmful side effects in them
❑1. Agree
❑2. Neutral
❑3. Disagree
Compared to girls, boys should be taken to doctors immediately when they fall sick ❑1. Agree
❑2. Neutral
❑3. Disagree
Education of girls is less important than education of boys ❑1. Agree
❑2. Neutral
❑3. Disagree
B2: Read aloud: Now I would like to ask some questions about your youngest child’s health and nutrition back in the day.
1 At what age did you stop breastfeeding your youngest child Answer to be recorded in months
Months 98 =Don’t know

2 Until what age did you exclusively breastfeed your youngest child Read aloud: Not even water Answer to be recorded in months
Months 98 =Don’t know
3 At what age did you introduce complementary foods to the child [name] Note: record in completed months
Months 98=Don’t know
4 Who provided the treatment when your child was sick? Multiple answers are possible Don’t read possible answers
1 = Doctor 2 = Staff nurse 3 = Dispenser, compounder, homeopath, hakim 4=Friends/neighbors 5=Household member 6=Self 7=Traditional healer 96=Other (specify)____
5 Did your child ever have any vaccinations to prevent him/her from getting diseases, including vaccinations received in a national immunization day campaign?
0=No 1=Yes 98=Don’t Know
Subsection C: Household bargaining power [ask survey mother (caregiver)]

Autonomy: Who primarily makes the decision regarding these issues?
7. Anthropometric measurements
S_no
Issues Primary decision making power
1=Respondent
2=Husband
3=Respondent & husband jointly
4=Respondent’s mother in law
5=Respondent’s father in law
96=Someone else (specify)_______
1 Your healthcare
2 Major household purchases
3 Visits to your family and relatives
4 Routine purchase for household
5 Children Education
6 Whether you can work outside home
7 Family Planning
8 Giving money to your relatives
9 Meals
10 Expenditure on children

These measurements will be done for the youngest 3 children in the household under five years of age. Measure the youngest (recruited) child first and move upwards age wise until the three youngest children in the household have been measured.
Child Code CH1 (recruited child)
CH2 CH3
A Introduction
1 Name of mother(caregiver)
2 Name of child
3 Date of birth DD/MM/YY Copy from card if available, if not probe for date of birth from mother. If mother cannot remember the birth date, she can ask another person in the household
3a Please indicate how information was obtained 1 = Date of birth as in card 2 = Date of birth as per mother’s recall 3=Date of birth as per someone else’s recall 96=Other (specify)____________
4 Is infant male or female 1=Male 2=Female
5 Child’s birth order 98=Don’t know
B Measurements CH1 (recruited child)
CH2 CH3
1a Length 1 (cm)
1b Weight of mother 1 (kg)
1c Weight of mother & child 1 (kg)
2a Length 2 (cm)
2b Weight of mother 2 (kg)
2c Weight of mother & child 2 (kg)
3a Length 3 (cm)
3b Weight of mother 3 (kg)
3c Weight of mother & child 3 (kg)

4 Length Measured 1=Lying down 2=Standing
5 Result of measurements 1=Completed 2=Incomplete because child absent 3=Incomplete because child is sick/disabled 4=Incomplete because refusal 96=Other (specify)___________
Survey result: 1 = Completed 2 = Interview is partially completed (specify) ________

Endline Survey 1. Identification
No Question Codes Skip
A1 HH_ID
A2 Date of visit (DD/MM/YYYY)
A3 Name of the eligible child is ______________
0=No 1=Yes
A4 Name of the mother/caregiver is ______________
0=No 1=Yes
A5 Name of household head is ______________
0=No 1=Yes
1 Is the biological mother/caregiver of the child alive?
0=No 1=Yes
>>Q2 >>Q4
2
Who primarily takes care of the child?
1 =Grandmother 2 =Father 3=Aunt (paternal or maternal) 4=Stepmother 96=Other (specify)
>>Q4 >>Q4 >>Q4 >>Q4 >>Q3
3 Gender of respondent
1 =Male 2 =Female
4
What is your marital status?
1 = Married 2 = Widow/Widower 3 = Divorced/Separated 4 = Single/Never married
5 Do you intend to move from this address in the next 12 months?
0=No 1=Yes 98=Don’t Know
>>6 >>Q5a >>Q6
5a Can you please share a tentative address? 98=Don’t Know
6 Can you please share your mobile no? Note: In case the household member does not have a phone number, please ask for the number of any close relatives who we can contact to collect the new address should the HH move.
0=No 1=Yes
>>Next Section >>Q6a
6a Mobile no 1
6b Name of the owner or main user
6c Relationship with the mother/caregiver
6d
Mobile network
1=Jazz 2=Warid 3=Telenor 4=Zong 5=Ufone
7a Mobile no 2
7b Name of the owner or main user
7c Relationship with the mother/caregiver
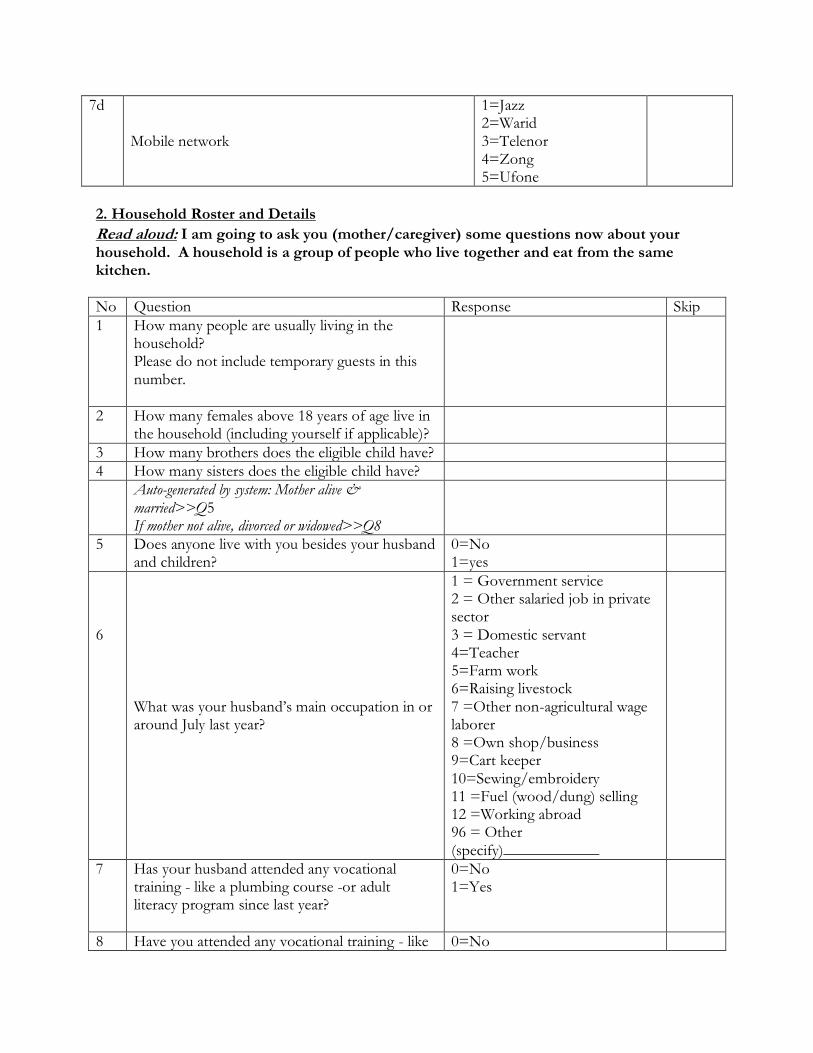
7d
Mobile network
1=Jazz 2=Warid 3=Telenor 4=Zong 5=Ufone
2. Household Roster and Details
Read aloud: I am going to ask you (mother/caregiver) some questions now about your household. A household is a group of people who live together and eat from the same kitchen.
No Question Response Skip
1 How many people are usually living in the household? Please do not include temporary guests in this number.
2 How many females above 18 years of age live in the household (including yourself if applicable)?
3 How many brothers does the eligible child have?
4 How many sisters does the eligible child have?
Auto-generated by system: Mother alive & married>>Q5 If mother not alive, divorced or widowed>>Q8
5 Does anyone live with you besides your husband and children?
0=No 1=yes
6
What was your husband’s main occupation in or around July last year?
1 = Government service 2 = Other salaried job in private sector 3 = Domestic servant 4=Teacher 5=Farm work 6=Raising livestock 7 =Other non-agricultural wage laborer 8 =Own shop/business 9=Cart keeper 10=Sewing/embroidery 11 =Fuel (wood/dung) selling 12 =Working abroad 96 = Other (specify)____________
7 Has your husband attended any vocational training - like a plumbing course -or adult literacy program since last year?
0=No 1=Yes
8 Have you attended any vocational training - like 0=No

a stitching course - or adult literacy program since last year?
1=Yes
4. Effects of the covid-19 crisis
Read aloud: I am going to ask you some questions now about how your household got affected by the coronavirus crisis, which started in May this year.
1 Did you, your husband or any other member in your household lose their job due to this crisis?
0=No 1=Yes
2 Did your household experience any loss in overall income after the outbreak?
0=No 1=Yes
3 For each of these particular items, can you please tell me if the price per unit has increased, decreased, or stayed the same since the outbreak of the virus?
3a Wheat 1=Increased 2=Decreased 3=Stayed the same 4=Item unavailable 98=Don't Know
3b Rice 1=Increased 2=Decreased 3=Stayed the same 4=Item unavailable 98=Don't Know
3c Oil 1=Increased 2=Decreased 3=Stayed the same 4=Item unavailable 98=Don't Know
3d Milk 1=Increased 2=Decreased 3=Stayed the same 4=Item unavailable 98=Don't Know
3e Onion
1=Increased 2=Decreased 3=Stayed the same 4=Item unavailable 98=Don't Know

3f Pulses 1=Increased 2=Decreased 3=Stayed the same 4=Item unavailable 98=Don't Know
3g Sugar 1=Increased 2=Decreased 3=Stayed the same 4=Item unavailable 98=Don't Know
3h Potatoes 1=Increased 2=Decreased 3=Stayed the same 4=Item unavailable 98=Don't Know
3i Tomatoes 1=Increased 2=Decreased 3=Stayed the same 4=Item unavailable 98=Don't Know
3j Eggs 1=Increased 2=Decreased 3=Stayed the same 4=Item unavailable 98=Don't Know
4 During the lockdown imposed by the Government between May and June, did anyone in your household do the following?
4a Borrowed food/bought on credit 0=No 1=Yes 98=Don't know
4b Stopped eating certain kinds of food 0=No 1=Yes 98=Don't know
4c Limited portion size or reduce number of meals 0=No 1=Yes 98=Don't know

4d Consumed less expensive food of the same type 0=No 1=Yes 98=Don't know
5 Is your health in general now better, worse, or about the same as it was before the coronavirus pandemic?
1=Better 2=Worse 3=Same
>>Q6 >>Q5a >>Q6
5a Why has your health worsened? Multiple options are possible. Do not read possible answers.
1= Not enough food because of high prices 2=Not enough food because of closed markets or restricted mobility 3=Not enough food because of low income 4=I feel weak and tired 5=I feel mentally stressed and agitated 6=I feel sick overall 96 = Other (Specify)______
6 Is your under-5 children’s health in general now better, worse, or about the same as it was before the coronavirus pandemic
1=Better 2=Worse 3=Same
>>Q7 >>Q6a >>Q7
6a Why has your child’s health worsened? Multiple options are possible. Do not read possible answers.
1= Not enough food because of high prices 2=Not enough food because of closed markets or restricted mobility 3=Not enough food because of low income 4=The child feels weak and tired 5= The child feels

mentally stressed and agitated 6= The child feels sick overall 96 = Other (Specify)______
7 Has someone in your household been tested positive for coronavirus?
0=No 1=Yes
>>Q10 >>Q8
8 Has s/he experienced serious illness, respiratory infection or been hospitalized because of the virus?
0=No 1=Yes
>>Q10 >>Q9
9 What is his/her current health status? 1= Has completely recovered 2= Has partially recovered 3= Died 96 = Other (Specify)______
10 Did you receive any assistance in the form of cash during this crisis?
0=No 1=Yes
>>Q11 >>Q10a
10a How much in total (PKR)?
0=1-500 1=500-5000 2=5001-10000 3=10001-15000 4=15001-20000 5=20001 & Above
10b How many times did you receive such cash assistance? # of times ____________
11 Did you receive any assistance in kind? 0=No 1=Yes
>>Next Section >>Q11a
11a What type of assistance? (multiple options possible. Please do not read the options.)
1=Food such as dairy items 2=Food such as fruits and vegetables 3=Food such as wheat and other staples 4=Prepared meal 5=Mask and hand-hygiene items (soap, sanitizer)

96=Other (specify)
11b How many times did you receive such in-kind assistance?
# of times ____________
5. Child diet and hygiene knowledge
Read aloud: I am going to ask you some questions now regarding child feeding and hygiene practices. Please answer to the best of your knowledge.
1 Until what age is it recommended that a mother feeds her child breastmilk only? Read aloud: not even water. Enter age in months
98=Don’t Know
2 Until what age is it recommended that a mother continues breastfeeding? Enter age in months
98=Don’t Know
3 At what age is it recommended that babies start eating solid, semi-solid, or soft foods in addition to breastmilk (e.g., mashed banana or potato, soft roti)? Enter age in months
98=Don’t Know
4 When the child starts eating solid, semi-solid, or soft foods, should s/he be given one type of food or different types of food like fish, potatoes, vegetables, etc.?
1=One type of food 2=Diverse/different kinds of food 98=Don’t Know
5 Is giving eggs at an early age, say, after 6 months, healthy for the child?
0=No 1=Yes 98=Don’t Know
6 Do you agree with the following statement: food items - such as packet potato chips and fruit juice - that children like and you can easily buy at the local store at a cheap price, provide valuable nutrition for the children?
1=Agree 2=Neutral 3=Disagree
7 What are the key moments when you need to wash your hands to prevent germs from reaching food that may cause diarrhea? Multiple options are possible. Do not read the options to the mother.
1=After going to the toilet/latrine 2=After cleaning the baby’s bottom/changing a baby’s nappy 3=Before preparing/handling food 4=Before feeding a child/eating 5=After handling raw food

6=After handling garbage 96=Other (specify)_____ 98=Don’t Know
8 What are the key occasions to use clean water? Multiple options are possible. Do not read the options to the mother.
1=Drinking 2=Cooking (including washing vegetables, fish or meat) 3=Cleaning (wiping floors) and laundry 96=Other (specify)_____ 98=Don’t Know
6. Child health, feeding and hygiene practices
Subsection A: Dietary Recall
NOTE: Please fill this out for the above recruited child in the household. Read Aloud: Now I am going to ask you about the diet of [[child]] that s/he had yesterday during the day or at night.
1 Yesterday during the day or at night, did [child] have any of the following liquids/drink? I am interested in whether your child had the item I mention even if it was combined with other foods.
0=No 1=Yes
a Infant formula such as Meiji, BF, Lactogen 0 1 # of times:
If 1>># of times
b Animal milk such as cow, buffalo, goat, etc 0 1 # of times:
If 1>># of times
c Powdered milk such as Nido 0 1 # of times:
If 1>># of times
d Yogurt 0 1 # of times:
If 1>># of times
e Juice 0 1 # of times:
If 1>># of times
f ORS 0 1 # of times:
If 1>># of times
2
Yesterday during the day or at night, did [child] drink anything from a bottle with a nipple?
0=No 1=Yes
3 Was [child] breastfed yesterday during the day or at night?
0=No 1=Yes
>>Q4 >>Q3a
3a
How many times? # of times ____________
4 Yesterday during the day or at night, did (name) eat any of the following items at
0=No 1=Yes

home or outside home? I am interested in whether your child had the item I mention even if it was combined with other foods.
a Rice 0 1
b Roti 0 1
c Rusk/Bread 0 1
d Sooji 0 1
e Khichri 0 1
f Kheer 0 1
g Dalia 0 1
h Carrots, sweet potatoes that are yellow or orange inside
0 1
i White potatoes, sweet potatoes that are white or any other foods made from roots such as turnip
0 1
j Any dark green leafy vegetables like saag 0 1
k Ripe mangoes, ripe papayas, Apricot 0 1
l Any other fruits or vegetables in any form 0 1
m Liver, kidney, heart 0 1
n Any meat (beef, chicken, goat, etc.) 0 1
o Eggs 0 1
p Fish 0 1
q Any foods made from beans like lobia, red kidney beans
0 1
r Any foods made from nuts like almonds, walnuts, peanuts
0 1
s Any foods made from lentils 0 1
t Other milk product Read Aloud: Does not include ice cream
0 1
u French fries 0 1
v Any sugary foods such as chocolates, candies, pastries, cakes or biscuits, ice creams
0 1
w Salty snacks such as biscuits, packet chips 0 1
5a Yesterday during the day or at night, did [child] eat any other solid, semi-solid, or soft foods? (other than liquids)
0 No 1 Yes
Q6 Q5b
5b What did the child [name] eat? ______________
6 Yesterday during the day or at night, how many times did [[child]] eat solid, semi-solid, or soft foods other than liquids at home or outside home (exclude liquids)?
No of times _____________
7 In the last one month, did you hear OR see OR read any messages/suggestions about breastfeeding or complementary feeding?
0=No 1=Yes
>>Next section >>Q7a
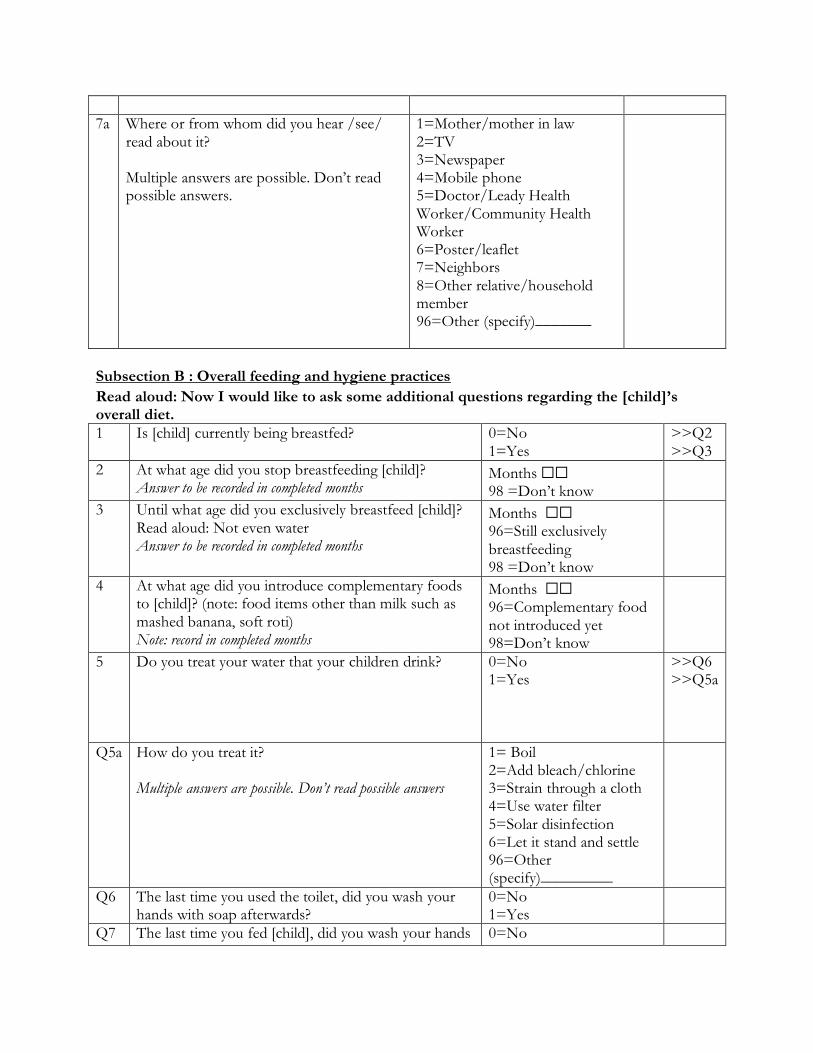
7a Where or from whom did you hear /see/ read about it? Multiple answers are possible. Don’t read possible answers.
1=Mother/mother in law 2=TV 3=Newspaper 4=Mobile phone 5=Doctor/Leady Health Worker/Community Health Worker 6=Poster/leaflet 7=Neighbors 8=Other relative/household member 96=Other (specify)_______
Subsection B : Overall feeding and hygiene practices
Read aloud: Now I would like to ask some additional questions regarding the [child]’s overall diet.
1 Is [child] currently being breastfed? 0=No 1=Yes
>>Q2 >>Q3
2 At what age did you stop breastfeeding [child]? Answer to be recorded in completed months
Months ⬜⬜ 98 =Don’t know
3 Until what age did you exclusively breastfeed [child]? Read aloud: Not even water Answer to be recorded in completed months
Months ⬜⬜ 96=Still exclusively breastfeeding 98 =Don’t know
4 At what age did you introduce complementary foods to [child]? (note: food items other than milk such as mashed banana, soft roti) Note: record in completed months
Months ⬜⬜ 96=Complementary food not introduced yet 98=Don’t know
5 Do you treat your water that your children drink?
0=No 1=Yes
>>Q6 >>Q5a
Q5a How do you treat it? Multiple answers are possible. Don’t read possible answers
1= Boil 2=Add bleach/chlorine 3=Strain through a cloth 4=Use water filter 5=Solar disinfection 6=Let it stand and settle 96=Other (specify)_________
Q6 The last time you used the toilet, did you wash your hands with soap afterwards?
0=No 1=Yes
Q7 The last time you fed [child], did you wash your hands 0=No

with soap beforehand? 1=Yes
Subsection C: Disease Recall
Read aloud: Now I would like to ask some questions regarding the [child]’s health conditions in the last two weeks.
Has (Name) had diarrhea in the last 2 weeks, meaning loose or watery stools at least 4 times in a 24-hour period? 0=No>>Next Disease 1=Yes>>Q1
Has (Name) been ill with a fever at any time in the last 2 weeks? 0=No>>Next Disease 1=Yes>>Q1
Has (Name) been ill with a cough at any time in the last 2 weeks? 0=No>>Next Section 1=Yes>>Q1
1 For how many days in the last 2 weeks did this (Name) have this condition?
Number of days Number of days Number of days
2 Seriousness of condition
Was there blood in stools? 0=No 1=Yes 98=Don’t Know
Was the temperature high (over 100 F)? 0=No 1=Yes 98=Don’t Know
When (Name) was ill with a cough, did he/she breathe faster than usual with short, rapid breaths or have difficulty breathing? 0=No 1=Yes 98=Don’t Know
3 Was treatment provided?
0=No>>Q3a, Next section 1=Yes>>Q4
0=No>>Q3a, Next section 1=Yes>>Q4
0=No>>Q3a, Next section 1=Yes>>Q4
3a Why was treatment not given? Multiple answers are possible. Don’t read possible
1=Lack of knowledge 2=Lack of finance 3=Lack of nearby medical facility/doctor 4=No one at home to take the child to doctor
1=Lack of knowledge 2=Lack of finance 3=Lack of nearby medical facility/doctor 4=No one at home
1=Lack of knowledge 2=Lack of finance 3=Lack of nearby medical facility/doctor 4=No one at home to take the child to doctor 96=Other (Specify)____
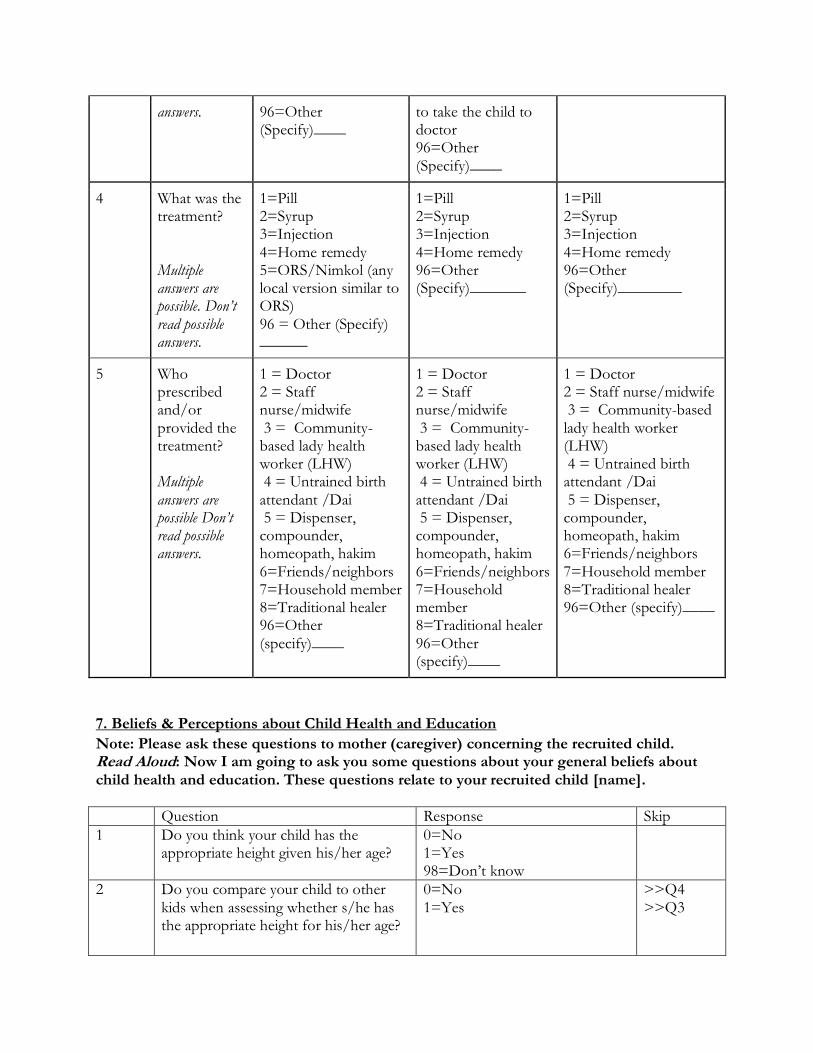
answers. 96=Other (Specify)____
to take the child to doctor 96=Other (Specify)____
4 What was the treatment? Multiple answers are possible. Don’t read possible answers.
1=Pill 2=Syrup 3=Injection 4=Home remedy 5=ORS/Nimkol (any local version similar to ORS) 96 = Other (Specify) ______
1=Pill 2=Syrup 3=Injection 4=Home remedy 96=Other (Specify)_______
1=Pill 2=Syrup 3=Injection 4=Home remedy 96=Other (Specify)________
5 Who prescribed and/or provided the treatment? Multiple answers are possible Don’t read possible answers.
1 = Doctor 2 = Staff nurse/midwife 3 = Community-based lady health worker (LHW) 4 = Untrained birth attendant /Dai 5 = Dispenser, compounder, homeopath, hakim 6=Friends/neighbors 7=Household member 8=Traditional healer 96=Other (specify)____
1 = Doctor 2 = Staff nurse/midwife 3 = Community-based lady health worker (LHW) 4 = Untrained birth attendant /Dai 5 = Dispenser, compounder, homeopath, hakim 6=Friends/neighbors 7=Household member 8=Traditional healer 96=Other (specify)____
1 = Doctor 2 = Staff nurse/midwife 3 = Community-based lady health worker (LHW) 4 = Untrained birth attendant /Dai 5 = Dispenser, compounder, homeopath, hakim 6=Friends/neighbors 7=Household member 8=Traditional healer 96=Other (specify)____
7. Beliefs & Perceptions about Child Health and Education
Note: Please ask these questions to mother (caregiver) concerning the recruited child. Read Aloud: Now I am going to ask you some questions about your general beliefs about child health and education. These questions relate to your recruited child [name].
Question Response Skip
1 Do you think your child has the appropriate height given his/her age?
0=No 1=Yes 98=Don’t know
2 Do you compare your child to other kids when assessing whether s/he has the appropriate height for his/her age?
0=No 1=Yes
>>Q4 >>Q3

3 Who do you compare your child with? Multiple options are possible
1=His/her siblings 2=Children in the family other than his/her siblings 3=Other children in the neighborhood 96=Other (please specify)
4 Do you think your child has the appropriate weight given his/her height?
0=No 1=Yes 98=Don’t know
5 Do you think your child has the appropriate weight given his/her age?
0=No 1=Yes 98=Don’t know
6 Do you compare your child to other kids when assessing whether s/he has the appropriate weight for his/her age and height?
0=No 1=Yes
>>Q8 >>Q7
7 Who do you compare your child with? Multiple options are possible
1=His/her siblings 2=Children in the family other than his/her siblings 3=Other children in the neighborhood 96=Other (please specify)
8 Do you intend to send your child to preschool?
0=No 1=Yes 98=Don’t Know
9 What level of schooling do you expect (child) to complete?
1 = No education or less than grade 1 2=Primary school (grades 1-5) 3=Middle school (grades 6-8) 4=Matric pass (9th and 10th grade) 5=Intermediate pass (11th and 12th grade) 6 = Undergraduate (Bsc/Bcom) 7= Masters/ PhD 96=Other (Specify)
10 Up to what grade/education level do you think a boy should continue education?
1 = No education or less than grade 1 2=Primary school (grades 1-5) 3=Middle school (grades 6-8) 4=Matric pass (9th and 10th grade) 5=Intermediate pass (11th and 12th grade) 6 = Undergraduate (Bsc/Bcom)

7= Masters/ PhD 96=Other (Specify)
11 Up to what grade/education level do you think a girl should continue education?
1 = No education or less than grade 1 2=Primary school (grades 1-5) 3=Middle school (grades 6-8)4=Matric pass (9th and 10th grade) 5=Intermediate pass (11th and 12th grade) 6 = Undergraduate (Bsc/Bcom) 7= Masters/ PhD 96=Other (Specify)
8. Home environment (play and learning materials and activities)
Read Aloud: I am interested in learning about the toys that [CHILD] plays with at home. The toys may be: a) home-made (like clay toys, dolls made of cloths, etc.), b) household materials (like pots and pans, crockeries, pillow, school bag, mobile phone etc.), c) bought toys, d) children books/ picture books (can be bought/received from school or someone free of charge) and the child should have access to play with at home during the last month.
1 In the past 30 days, has [CHILD] played with toys that make or play music (e.g. Instrument, stuffed animals that play melodies or any other toy that make noise, but it should be given to [CHILD] to play)?
0=No 1=Yes
2 In the past 30 days, has [CHILD] played with materials for drawing and writing (e.g. coloring picture books, crayons, pencils, pens etc.)?
0=No 1=Yes
3 In the past 30 days, has [CHILD] played at being something or someone else, such as a mommy, doctor, teacher, or a hero using toys or objects (e.g. dolls, tea-set/ cups, toy kitchen set and plates for eating)?
0=No 1=Yes
4 In the past 30 days, has [CHILD] played with toys that encourage (Gross Motor) movement (e.g. balls, small car, skipping rope, bats, rope for swinging, pull-along, push along etc.)?
0=No 1=Yes

5 In the past 30 days, has [CHILD] played with homemade toys such as dolls, cars, or other toys made at home?
0=No 1=Yes
6 In the past 30 days, has [CHILD] played with household objects (such as bowls or pots) or objects found outside (such as sticks, rocks, animal shells or leaves)?
0=No 1=Yes
7 How many pictured books are there which are suitable for [CHILD]? Prompt: Please do not include school books.
_____No of books
8 How many books are there in the house? Prompt: Please include school books but do not include the pictured books of the children
_____No of books
9 How many magazines and newspaper are in the house? Record # here
Read Aloud: "In the past 3 days did you or any household member (over 15 years of age) engage in any of the following activities with [CHILD]”:
10 Have you read books, including poem books to the child or showed pictured books to him or her?
0=No 1=Yes 98=Don’t know
>>Q11 >>Q10a >>Q11
10a Who engaged in this activity? 1=Mother 2=Father 3=Any other household member 4=Any other non-household member
>>Q11 >>Q11 >>Q10b >>Q10b
10b Is the member who engaged in this activity above 15 years of age?
0=No 1=Yes
11 Have you told stories or nursery rhymes to the child? 0=No 1=Yes 98=Don’t know
>>Q12 >>Q11a >>Q12
11a Who engaged in this activity? 1=Mother 2=Father 3=Any other household member 4=Any other non-household member
>>Q12 >Q12 >>Q11b >>Q11b
11b Is the member who engaged in this activity above 15 years of age?
0=No 1=Yes
12 Have you sung songs (including lullabies) to the child? 0=No 1=Yes 98=Don’t know
>>Q13 >>Q12a >>Q13
12a Who engaged in this activity? 1=Mother 2=Father 3=Any other household member
>>Q13 >>Q13 >>Q12b

4=Any other non-household member
>>Q12b
12b Is the member who engaged in this activity above 15 years of age?
0=No 1=Yes
13 Have you played with toys with the child? 0=No 1=Yes 98=Don’t know
>>Q14 >>Q13a >>Q14
13a Who engaged in this activity?
1=Mother 2=Father 3=Any other household member 4=Any other non-household member
>>Q14 >>Q14 >>Q13b >>Q13b
13b Is the member who engaged in this activity above 15 years of age?
0=No 1=Yes
14 Have you spent time with the child naming, counting, and/or drawing things?
0=No 1=Yes 98=Don’t know
>>End section >>Q14a >> End section
14a Who engaged in this activity? 1=Mother 2=Father 3=Any other household member 4=Any other non-household member
>>End section >>End section >>Q14b >>Q14b
14b Is the member who engaged in this activity above 15 years of age?
0=No 1=Yes
9. Mother/caregiver autonomy, and beliefs about child health, nutrition and education
Subsection A: Mother’s beliefs
Read aloud: Now I would read some general statements regarding your child’s health and nutrition. Please tell me whether you agree or disagree with the following statements:
Statement Response
Breastfeeding alone up to 6 months provides enough nutrition for the child.
❑1. Agree
❑2. Neutral
❑3. Disagree

Children should be taken to a doctor when they fall sick. ❑1. Agree
❑2. Neutral
❑3. Disagree
Vaccinations like polio vaccine drops cause infertility and other harmful side effects.
❑1. Agree
❑2. Neutral
❑3. Disagree
Malnutrition during the first two years of a child’s life will badly affect his/her learning ability at school.
❑1. Agree
❑2. Neutral
❑3. Disagree
Infant boys should be breastfed longer than infant girls. ❑1. Agree
❑2. Neutral
❑3. Disagree
Infant boys need more food than infant girls - like eggs, milk and meat.
❑1. Agree
❑2. Neutral
❑3. Disagree
Vaccination is harmful for the girls, compared to boys because it causes infertility and other harmful side effects in them
❑1. Agree
❑2. Neutral
❑3. Disagree
Compared to girls, boys should be taken to doctors immediately when they fall sick
❑1. Agree
❑2. Neutral
❑3. Disagree
Education of girls is less important than education of boys ❑1. Agree
❑2. Neutral
❑3. Disagree
Subsection B: Intra-household decision-making [ask survey mother (caregiver)]
Read aloud: Now I would like to know who in your household primarily manages the money regarding the following issues?
s_no
Issues Primary decision-making power
1=Respondent
2=Husband
3=Respondent & husband jointly
4=Respondent’s mother in law
5=Respondent’s father in law
96=Someone else (specify)_
1 Money related to major household purchase

s (like TV/Fridge)
2 Money related to routine purchase for household (such as buying food items & groceries)
3 Giving money to your relatives
11. Engagement with the program
Subsection A: Counseling and growth monitoring
1 (Ask Q1 to all households) Was your household part of a program between Aug last year and February this year where health workers would come, measure your child, and discuss child nutrition? Probe by reminding them about the nature of the program.
0=No 1=Yes
>> Automated: Probe (for all households); if still no, then skip to Q1, Subsection C. >>Q1a
1a How many months did the program span or how many times did the health workers visit your household? (record in months/times)
2 Did these workers hang a chart on your wall and plot the measurements on it? Probe by reminding them about the nature of the program again to make sure they can recall in case they had actually received the program. If they then remember, change the above option from No to Yes and proceed.
0=No 1=Yes
>> Automated: Probe if household belongs to T1 and T2; if still no, then skip to Q1, Subsection C. >>Q2a

2a How many months did the program span or how many times did the health workers visit your household to take measurements of your child? (record in months/times)
2b Do you still have the chart? 0=No 1=Yes
>>Q8 >>Q3
3 Can you please show it? 0=No 1=Yes
>>Q7 >>Q3a,4, 5, 6 and then skip to Q9
3a Take a picture of the chart
4 Enumerator observation only: Is it still on the wall?
0=No 1=Yes
>>Q5, 6 and then skip to Q9 >>Q6 and then skip to Q9
5 Why is the chart not on the wall? 1= It fell off 2=Someone tore it apart 3=Didn’t feel the need anymore 4=Other family members did not like it 96=Other (specify)_____
6a Enumerator observation only: What’s the condition? Multiple options are possible.
1=Food pictures clearly visible 2=Not torn/Intact 3=Neither
6b How many dots are there on the chart? ______________
7 Why can't you show the chart? 1=I forgot where I kept it 2=Right now the place is inaccessible 3=Someone took it from us 96=Other (specify)______
8 What happened to the chart? 1= It fell off 2=Someone tore it

apart 3=Didn’t feel the need anymore 4=Someone took it from us 96=Other (specify)______
9 Since the health-workers stopped coming, did you see the growth chart again after that?
0=No 1=Yes
>>Q11 >>Q10 then go to Q12 after this
10 How often did you see it? 1=Once a day 2=Once a week 3=Once a month 4=Other (specify)
11 Why not? 1= Not useful 2= Did not find time 3= Lost it soon after 96=Other (specify)
12 Which aspect of health does the growth chart cover - length/height or weight?
1=Length/height 2=Weight 3=Both
13 If your child is in the red zone of the chart, is his/her length fine according to his/her age? (please show the chart if the mother/caregiver finds it hard to understand or recall)
1=Fine according to age 2=Not fine according to age 98=Don’t Know
14 If one month, a child is in the green zone and the next month he/she is in the red zone, has his/her length improved according to his age or not? (please show the chart if the mother/caregiver finds it hard to understand or recall)
1=Height improved 2=Height did not improve 98=Don’t know
Subsection B: Cash Transfer
1 (Ask to T1 & T2) Did you receive any cash support from
0=No
>>Automated: Probe if T2; skip

the program? Probe by reminding them about the nature of the program again to make sure they can recall in case they had actually received the program. If they then remember, change the above option from No to Yes and proceed.
1=Yes
otherwise to Q1, Subsection C. >>Q2
2 How much did you receive each time/round? (record in PKR)
3 How many times did you receive this support?
4 Did you receive any suggestion from the health worker about how to spend the money?
0=No 1=Yes
>>Q6 >>Q5
5 What was the suggestion? (multiple options possible. Please do not read the options to the mother.)
1=Spend on healthy food for children 2=Spend on children’s toys 3=Spend on children clothing 4=Spend on treatment if child gets sick 5=Spend on other household needs 96=Other (specify)
6 What did you primarily spend the money on? (multiple options possible. Please do not read the options to the mother.)
1=Spent on food for the children 2 = Bought non-food items for children 3 = Bought food for household consumption 4 = Bought non-food items for others or for the household 5 = Bought non-food items for myself 6 = Spent on healthcare needs for the children

7= Spent on healthcare needs for others in the household 96=Other (Specify)______
7 Did you share the cash with anyone outside the household?
0=No 1=Yes
>>Next Section >>Q8
8 With whom? (multiple options possible. Please do not read the options to the mother.)
1=Neighbors 2=Relatives (on the husband’s side) 3=Relatives (on the mother or caregiver’s side) 4=Friends other than neighbors/relatives 96=Other (specify) _____________
Subsection C: Program Awareness
1 Are you aware of any households in this community receiving a program between Aug last year and February this year where health workers would come, measure your child, and discuss child nutrition?
0=No 1=Yes
>>Sub-Section D >>Q2
2 Are you aware of any households in this community who received a chart where the health workers would plot the child’s measurements? (please show the chart if necessary)
0=No 1=Yes
3 Are you aware of any households in this community who received cash support from health workers during that period?
0=No 1=Yes
Subsection D : Knowledge Spillover (All households)
1. In the last month, have you talked with your neighbors or anyone besides those living in your household about child health, feeding & hygiene practices?
0=No 1=Yes
>>Next Section >>Q2

2 Who did you discuss these topics with? Multiple answers are possible. Do not read possible answers.
1=Neighbors 2=Relatives (on the husband’s side) 3=Relatives (on the mother or caregiver’s side) 4=Friends other than neighbors/relatives 96=Other (specify) _____________
3 (If Yes to Subsection A, Q1) During or after the program, did you talk with your neighbors or anyone besides those living in your household about child health, feeding & hygiene practices as discussed by the health workers?
0=No 1=Yes
>>Next Section >>Q4
4 Who did you discuss these topics with? Multiple answers are possible. Do not read possible answers
1=Neighbors 2=Relatives (on the husband’s side) 3=Relatives (on the mother’s side) 4=Friends other than neighbors/relatives 96=Other (specify) _________
5 Can you please give us names of 1 or 2 persons and their phone numbers whom you talked to?
0=No 1=Yes
>>Next Section >>Q6a
6a Name 1
6b Phone Number 1
7a Name 2
7b Phone Number 2
12. Anthropometric measurements
These measurements will be done for the youngest 3 children in the household under five years of age. Measure the recruited child first and then the other 2 children starting with the smallest in age moving to the elder ones.
Child Code Introduction
CH1 (recruited child)
CH2 CH3
1 Name of mother (caregiver)
2 Name of child

3 Date of birth DD/MM/YY Copy from card if available, if not probe for date of birth from mother. If mother cannot remember the birth date, she can ask another person in the household.
3a Please indicate how information was obtained 1 = Date of birth as in card 2 = Date of birth as per mother’s recall 3= Date of birth as per someone else’s recall 96=Other (specify)____________
4 Is infant male or female? 1=Male 2=Female
5 Child’s birth order 98=Don’t know
B Measurements CH1 (recruited child)
CH2 CH3
1a Length 1 (cm)
1b Weight of mother 1 (kg)
1c Weight of mother & child 1 (kg)
2a Length 2 (cm)
2b Weight of mother 2 (kg)
2c Weight of mother & child 2 (kg)
3a Length 3 (cm)
3b Weight of mother 3 (kg)
3c Weight of mother & child 3 (kg)
4 Length Measured 1=Lying down 2=Standing
5 Result of measurements 1=Completed 2=Incomplete because child is absent 3=Incomplete because child is sick/disabled 4=Incomplete because refusal 96=Other (specify)___________
Survey result: 1 = Completed 2 = Interview is partially completed (specify) ________
Appendix E5 Regular back-checks (to check for the discrepancy in responses) and spot-checks (to ensure implementation of WHO-defined SOP s for anthropometric measurements) were conducted every week by a quality assurance team for six months. In addition, to ensure the quality of anthropometric data, the research team conducted daily quality checks using three measures; the number of third measurements of height/weight, number of equal first and second measurements, and number of measurements less than the previous month's measurements. The back checks included asking a sub set of the main questionnaire from the primary caregiver to see the level of consistency of the responses.

Appendix F: Additional Intermediate Variables We generated indices for caregiver knowledge, hygiene, home stimulation, child morbidity, and food security during covid. All indices were created using the procedure in Anderson (2008). 1. Caregiver knowledge on food and nutrition - Until what age is it recommended that a mother feeds her child breastmilk only? (new variable: absolute difference from the correct answer i.e. 6-months) - Until what age is it recommended that a mother continues breastfeeding? (new variable: absolute difference from the correct answer i.e. 24-months) - At what age is it recommended that babies start eating solid, semi-solid food? (new variable: absolute difference from the correct answer i.e. 6-months) - When the child starts eating solid, semi-solid food, he/she should be given the same or different kinds of food? (new variable: binary for the correct answer) - Is giving eggs at an early age, 6-months, healthy for the child? (new variable: binary for the correct answer) - Breastfeeding alone up to 6-months provides enough nutrition to the child (new variable: binary for the correct answer) 2. Caregiver knowledge on healthcare - Children should be taken to a doctor when they fall sick (new variable: binary for the correct answer) - Vaccinations like polio cause infertility and other harmful side effects (new variable: binary for the correct answer) - Malnutrition during the first 2-years badly affects child's health (new variable: binary for the correct answer) 3. Caregiver's view on gendered care - Infant boys should be breastfed longer than infant girls (new variable: binary for the correct answer) - Infant boys need more food than infant girls (new variable: binary for the correct answer) - Vaccinations are harmful for girls, as compared to boys. (new variable: binary for the correct answer) - Compared to girls, boys should be taken to a hospital when they fall sick (new variable: binary for the correct answer) - Education of girls is less important than education of boys (new variable: binary for the correct answer) 4. Home Stimulation Index: - In the past 30 days, has your child played with toys (new variable: binary for 'yes') - In the past 30 days, has your child played with materials for drawing (new variable: binary for 'yes') - In the past 30 days, has your child played at being something or someone else (new variable: binary for 'yes') - In the past 30 days, has your child played with toys that encourage movement (new variable: binary for 'yes')
- In the past 30 days, has your child played with homemade toys (new variable: binary for 'yes') - In the past 30 days, has your child played with household objects (new variable: binary for 'yes') - Have you read books, including poem books to the child or showed pictured books (new variable: binary for 'yes') - Have you told stories or nursery rhymes to the child (new variable: binary for 'yes') - Have you sung songs (including lullabies) to the child (new variable: binary for 'yes') - Have you played with toys with the child (new variable: binary for 'yes') - Have you spent time with the child naming, counting, and/or drawing things? (new variable: binary for 'yes') 5. Child Morbidity Variable (binary indicating at least one illness): - Fever in the last 2-weeks - Cough in the last 2-weeks - Diarrhea in the last 2-weeks 6. Household Food Security Index: - Borrowed food/bought on credit (new variable: binary for 'yes') - Stopped eating certain kinds of food (new variable: binary for 'yes') - Limited portion size or reduced number of meals (new variable: binary for 'yes') - Consumed less expensive food of the same type (new variable: binary for 'yes') 7.Dietary Diversity Variables: - Dairy (milk and yogurt) - Meat, Fish or Eggs - Vitamin-A rich foods - Continuous score of dietary diversity - Binary variable for dietary diversity achieved References Anderson ML. Multiple inference and gender differences in the effects of early intervention: A reevaluation of the Abecedarian, Perry Preschool, and Early Training Projects. Journal of the American statistical Association. 2008 Dec 1;103(484):1481-95.

Appendix G: Anthropometric Manual

Table of Contents
1. Equipment for Anthropometric Measurements ............................................................ 2
1.1 Handling the Equipment ......................................................................................... 2
1.2 Calibration of the Equipment .................................................................................. 2
1.2.1 Calibrating the Infantometer ............................................................................ 2
1.2.2 Calibrating the stadiometer .............................................................................. 2
1.2.3 Calibrating the weighing scales ........................................................................ 3
2. How to do the Anthropometric Measurements .............................................................. 3
2.1 Infant Length .......................................................................................................... 3
2.1.1 Preparation for measuring length: .................................................................... 4
2.1.2 Procedure for measuring length ....................................................................... 4
2.2 Infant’s height (standing) for ≥2 years or > 85 cm .................................................. 5
2.2.1 Preparation for the measurements .................................................................... 5
2.2.2 Procedure for measuring height ....................................................................... 6
2.3 Infant’s weight ....................................................................................................... 8
2.3.1 Preparing the baby ........................................................................................... 8
2.3.2 Procedure for measuring weight ....................................................................... 8
2.4 Repeat Measurements-- .......................................................................................... 9
3. Points for an Anthropometric Survey........................................................................... 9
3.1 General Points ............................................................................................................ 9
4. Standard Operating Procedures (SOPs) ..................................................................... 10
4.1 Check List before you leave for the field: ............................................................. 10
4.2. Process in the field: ............................................................................................. 10
4.2.1 Setting-up Equipment .................................................................................... 10
4.2.2 Making the Measurements ............................................................................. 10
References ..................................................................................................................... 12

2
1. Equipment for Anthropometric Measurements
The Equipment
➢ Infantometer for measuring length of babies and small children ≤2 years
➢ Stadiometer for measuring height of children >2 years
➢ Digital bathroom scale
➢ Calibration rod-small
➢ Calibration rod-big
➢ Calibration weights-3kgs
➢ Spirit level
➢ Extra batteries
1.1 Handling the Equipment ➢ To clean the equipment, wipe surfaces with a damp cloth. Never put the scale or tablet into
water.
➢ Do not store the equipment in direct sunlight or other hot places
➢ If calibration rods are damaged and chipped off, report to your supervisor. The rod will be
replaced by the supervisor if needed.
➢ If the calibration weights appear damaged, report to the supervisor. The supervisor will replace
the weights if needed.
1.2 Calibration of the Equipment ➢ Initial calibration will be done before going in the field under the supervision of field supervisor
every day.
1.2.1 Calibrating the Infantometer (World Health Organization 2008)
➢ Place the length board on a flat, stable surface such as a table ➢ Use spirit level to check whether the scale is placed on flat and even surface ➢ Calibrate the length board using the short calibration rod.
➢ Slide the foot piece as far as it will go toward the head board of the Infantometer till it touches
the calibration rod.
➢ If the length board calibration shows the length differs by more than 0.2 cm (2mm) from the
expected length , then reposition the infant length board and recalibrate
➢ If the length board cannot be calibrated and the length board calibration shows the length
differs by more than 0.2 cm (2mm) from the expected, then then enter the calibration values
and continue.
1.2.2 Calibrating the stadiometer ➢ Set-up the stadiometer for measuring maternal height. Use spirit level to check whether the
scale is placed on flat and even surface
➢ Calibrate the stadiometer using the long calibration rod.
➢ Lower the stadiometer head piece to rest firmly against the top end of the calibration rod.
Ensure that the rod stands perpendicular to the base.

3
➢ If the stadiometer calibration shows the length differs by more than 0.2 cm (2mm) from the
expected length , then reposition the stadiometer and recalibrate
➢ If the stadiometer cannot be calibrated and the stadiometer calibration shows the length differs
by more than 0.2 cm (2mm) from the expected, then then enter the calibration values and
continue.
1.2.3 Calibrating the weighing scales ➢ Place the scale on a hard, level surface (concrete or firm earth). Soft or uneven surfaces may
cause small errors in weighing.
➢ Use spirit level to check whether the scale is placed on flat and even surface
➢ If the battery needs to be replaced, carefully turn over the scale so that the base is accessible.
Press the closure of the battery compartment in the direction of the cover itself and open the
battery compartment. Insert the supplied batteries into the battery compartment. Check that
the polarity is correct. Close the cover and then turn the scale back up the right way.
➢ To activate the power supply, push the power switch
➢ Zero the scale. Check the scale reads zero before every measurement – most scales can be
adjusted easily to read zero. Check the unit of measurement; it should be set to “kilograms”
always.
➢ Check with standard weights of 3 kgs daily. Check the scales by weighing the 3kg weight to
make sure the scale gives the correct weight. Carefully place a 3 kgs weight on the scale. To
ensure an accurate measurement reading, the weights must be placed evenly distributed over
the centre area of the scale.
➢ If the scale calibration shows that the weight differs by more than 0.5 kg for weighing machine,
from the expected weight then reposition the scale and recalibrate.
➢ If the weighing scales cannot be calibrated and re-calibration shows the weight differs by more
than 0.5 kg for weighing machine, from the expected weight, then then enter the calibration
values and continue.
2. How to do the Anthropometric Measurements
2.1 Infant Length Recumbent length of infants and children < 2 years of age or ≤ 85cm is measured using a wooden or
Perspex measuring board.

4
Graphics from Principals of Nutrition Asssessment, Gibson RS, 2005
2.1.1 Preparation for measuring length: Before measuring length:
➢ Explain all procedures to the mother and enlist her help.
➢ Remove infant’s shoes, hat, extra heavy clothing and hair ornaments
➢ If the room is cool and there is any delay, keep the child warm in a blanket until length
can be measured.
➢ If a baby is weighed naked, a dry diaper/cloth nappy/plastic sheet can be put back on to
avoid getting wet while measuring length.
2.1.2 Procedure for measuring length
Cover the length board with a thin disposable dignitary sheet for hygiene and for the baby’s
comfort. Explain to the mother that she will need to place the baby on the length board herself.
Show her where to stand when placing the baby down, i.e. opposite you, on the side of the
length board away from the tape. Also show her where to place the baby’s head (against the
fixed headboard) so that she can move quickly and surely without distressing the baby.
➢ Rub the headboard with a disposable wipe before starting.
➢ Sanitize your hands with hand sanitizer.
➢ Lay the child on his back with his head against the fixed headboard, compressing the
hair.
➢ Quickly position the head so that an imaginary vertical line from the ear canal to the
lower border of the eye socket is perpendicular to the board. (The child’s eyes should be
looking straight up.)
➢ Ask the mother to remain in eye contact and talking to her baby, while holding him/her
on the board
➢ The other anthropometrist will stand on the side of the length board where she can see
the measurement reading and move the footboard:
➢ Check that the child lies straight along the board and does not change position.
Shoulders should touch the board, and the spine should not be arched.
➢ Since it can sometimes be difficult to use both legs to measure length, use only one leg if
using two legs is not possible.

5
➢ Hold down the child’s leg/s with one hand and move the footboard with the other.
Apply gentle pressure to the knees to straighten the leg as far as they can go without
causing injury.
➢ While holding the knees, pull the footboard against the child’s feet. The soles of the feet
should be flat against the footboard, toes pointing upwards. If the child bends the toes
and prevents the footboard from touching the soles, scratch the soles slightly and slide
in the footboard quickly when the child straightens the toes.
➢ Read the measurement and record the child’s length in centimetres to the last
completed 0.1 cm. This is the last line that you can actually see. (0.1 cm = 1 mm) e.g.
between 2.3 and 2.4 cm, record as 2.3 cm.
NOTE: ➢ Positioner
o Position the baby’s head o Frankfurt plane o Position baby’s body and make sure baby is straight
➢ Measurer: o Position baby’s one/two legs so that it is straight o Read and record the length
Note: For a child aged 2 years or older , measure recumbent length and subtract 0.7 cm to convert it to height.
2.2 Infant’s height (standing) for ≥2 years or > 85 cm Height is usually measured in the standing position using a stadiometer. Subject stands straight with head in the Frankfurt plane, feet together, knees straight and heels, buttocks and shoulder blades in contact with the vertical surface of the stadiometer. Arms should hang loosely at the sides with palms facing the thighs. Shoulders should be relaxed. Movable headboard is lowered until it touches the crown of the head and reading taken at maximum inspiration. Remember the error of parallax when you’re taking the reading i.e., you must be at eye level!
2.2.1 Preparation for the measurements Before measuring length:
➢ Explain all procedures to the mother and enlist her help.
➢ Remove infant’s shoes, hat, extra heavy clothing and hair ornaments
➢ If the room is cool and there is any delay, keep the child warm in a blanket until length can be
measured.
➢ If a baby is weighed naked, a dry diaper/cloth nappy/plastic sheet can be put back on to avoid
getting wet while measuring length.
➢ Rub the headboard with a wet wipe before starting.
➢ Sanitize your hands.
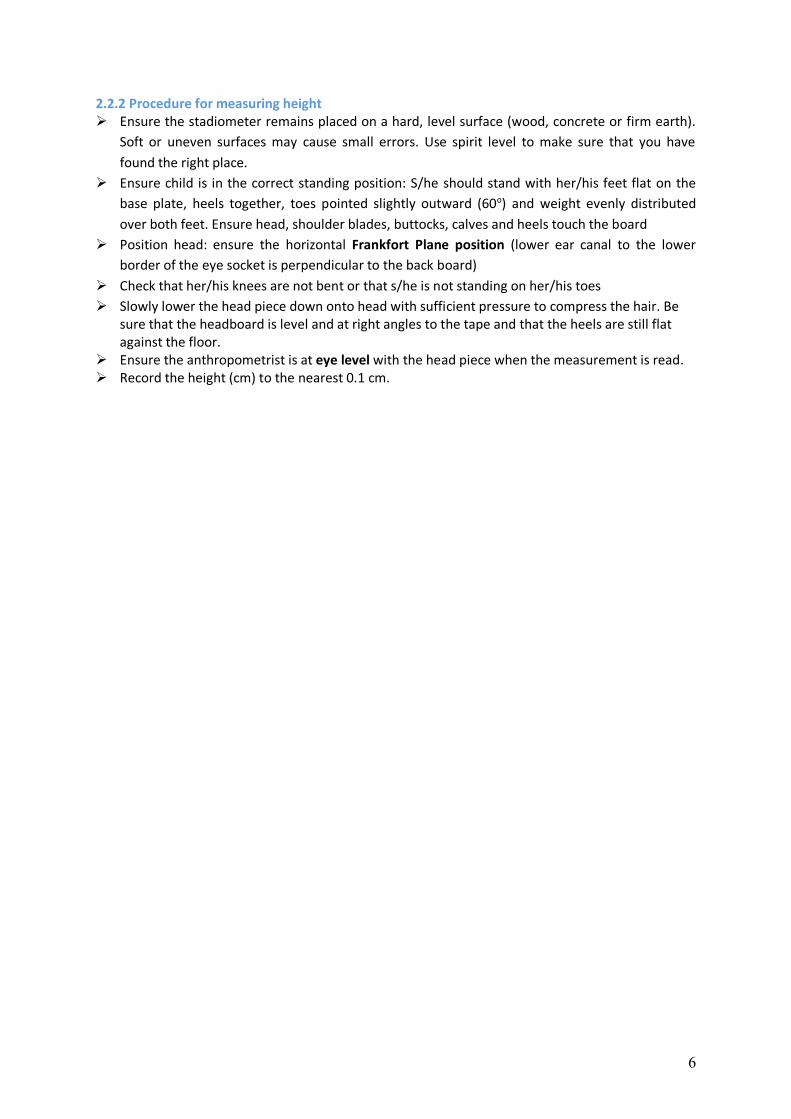
6
2.2.2 Procedure for measuring height ➢ Ensure the stadiometer remains placed on a hard, level surface (wood, concrete or firm earth).
Soft or uneven surfaces may cause small errors. Use spirit level to make sure that you have
found the right place.
➢ Ensure child is in the correct standing position: S/he should stand with her/his feet flat on the
base plate, heels together, toes pointed slightly outward (60o) and weight evenly distributed
over both feet. Ensure head, shoulder blades, buttocks, calves and heels touch the board
➢ Position head: ensure the horizontal Frankfort Plane position (lower ear canal to the lower
border of the eye socket is perpendicular to the back board)
➢ Check that her/his knees are not bent or that s/he is not standing on her/his toes
➢ Slowly lower the head piece down onto head with sufficient pressure to compress the hair. Be sure that the headboard is level and at right angles to the tape and that the heels are still flat against the floor.
➢ Ensure the anthropometrist is at eye level with the head piece when the measurement is read. ➢ Record the height (cm) to the nearest 0.1 cm.

7
From: National Health & Nutrition Examination Survey (NHANES): Anthropometry
Procedures manual
http://www.cdc.gov/nchs/data/nhanes/nhanes_07_08/manual_an.pdf
NOTE:
➢ Assistant
o Position the adult
➢ Lead anthropometrist:
o Frankfurt plane
o Lower the headpiece
o Read and record the height
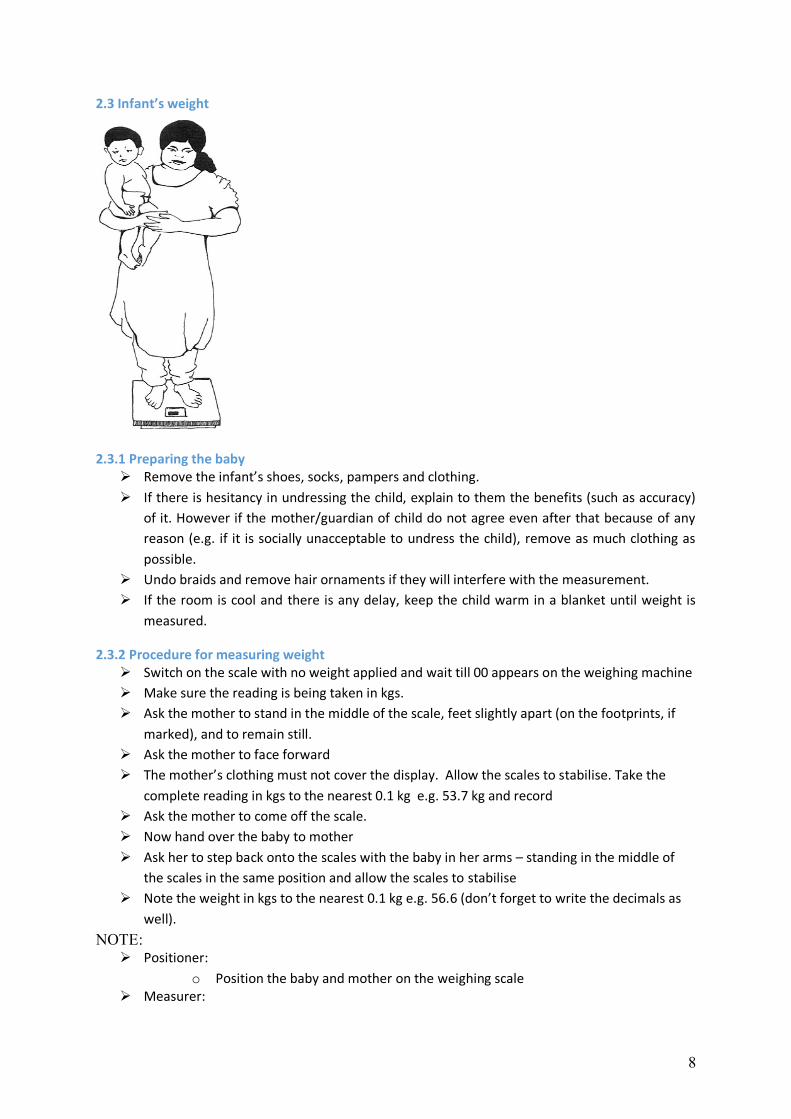
8
2.3 Infant’s weight
2.3.1 Preparing the baby ➢ Remove the infant’s shoes, socks, pampers and clothing.
➢ If there is hesitancy in undressing the child, explain to them the benefits (such as accuracy)
of it. However if the mother/guardian of child do not agree even after that because of any
reason (e.g. if it is socially unacceptable to undress the child), remove as much clothing as
possible.
➢ Undo braids and remove hair ornaments if they will interfere with the measurement.
➢ If the room is cool and there is any delay, keep the child warm in a blanket until weight is
measured.
2.3.2 Procedure for measuring weight ➢ Switch on the scale with no weight applied and wait till 00 appears on the weighing machine
➢ Make sure the reading is being taken in kgs.
➢ Ask the mother to stand in the middle of the scale, feet slightly apart (on the footprints, if
marked), and to remain still.
➢ Ask the mother to face forward
➢ The mother’s clothing must not cover the display. Allow the scales to stabilise. Take the
complete reading in kgs to the nearest 0.1 kg e.g. 53.7 kg and record
➢ Ask the mother to come off the scale.
➢ Now hand over the baby to mother
➢ Ask her to step back onto the scales with the baby in her arms – standing in the middle of
the scales in the same position and allow the scales to stabilise
➢ Note the weight in kgs to the nearest 0.1 kg e.g. 56.6 (don’t forget to write the decimals as
well).
NOTE: ➢ Positioner:
o Position the baby and mother on the weighing scale ➢ Measurer:

9
o Read and record the weight
2.4 Repeat Measurements-- • After doing both measurements once. Repeat all the measurements a second time.
• At the end of the second set of measurements, the tablet will calculate whether the first and
second measurements differ by more than a specified amount. It will show you which
measurements have to be done a third time.
3. Points for an Anthropometric Survey
3.1 General Points 1. Height and length will be measured in cm and weight in kg.
2. Before starting the measurements always introduce yourself to the participants and explain to
them what will be done before it is done and why for at least initial visits. Always act in a
professional manner - refraining from making personal comments about the participant’s body
size.
3. Two anthropometrist should always be involved in taking each measurement: one to position
the participant and one to take the reading.
4. Avoid parallax when taking readings. Parallax describes a phenomenon where the reading
differs depending on the angle from which it is viewed. It is a common cause of data error. Thus
measurements should always be made at eye level i.e., directly in front of the value not off to
the side or at an angle above or below it.
5. The results should be recorded immediately before any other action is performed.
6. Measurements should be done serially (i.e., all measurements once and then all measurements
done again) to avoid the recorded value of the first measurement influencing the recorded value
of the second measurement. Serial measurements provide a more accurate estimate of
precision than if the two measurements were done together; and it also reduces the chances of
measurement error.
7. Be selective about where you place the measuring board and electronic scale. Make sure there
is adequate light; and there are not too many people watching/ crowding around. Also make
sure the equipment is placed on a flat and hard surface.
8. When you weigh and measure, you must control the child. Be firm yet gentle. Your own sense of calm and self-confidence will be felt by the mother and the child. Never leave a child alone with a piece of equipment.
9. Do not weigh or measure a child if:
• The mother refuses.
• The child is too sick or too distressed.
• The child is physically deformed, which will interfere with or give an incorrect measurement. To be kind, you may want to measure such a child and make note of the deformity on the questionnaire.
10. Make sure you do not have long fingernails. Remove rings and watches before you weigh and measure to prevent them from getting in the way.
.

10
4. Standard Operating Procedures (SOPs)
4.1 Check List before you leave for the field: Check you have all of the equipment
o infant length board
o stadiometer
o weighing scale
o spirit leveller
o extra batteries for the scales
4.2. Process in the field:
• Introduce yourselves and explain the nature of the study to the mother, the process of
taking the measurements and obtain her permission to do the measurements for the first
couple of visits. Once the mother is comfortable, you can skip the introduction part but it is
helpful to seek permission.
• Check whether the child has oedema
#Oedema 1: The build-up of fluid causes affected tissue to become swollen. The swelling can
occur in one particular part of the body.
Visible signs of Oedema
1. Swelling or puffiness of the skin
2. Skin discoloration
3. Areas of skin that temporarily hold the imprint of your finger when pressed (known as pitting
oedema)
4. Aching, tender limbs
5. Stiff joints
6. Weight gain or weight loss
4.2.1 Setting-up Equipment
• Set-up the infant length board on a table or on a hard, flat surface that is not carpeted. Use
spirit level to check.
• Set up the stadiometer on a hard, flat surface.Use spirit level to check.
• Place the weighing scale on a hard, flat surface that is not carpeted. Use spirit level to check
if the surface of the weighing scale is flat.
• Check the reading is in kgs.
4.2.2 Making the Measurements Make the 1st series of measurements:
• Measure and record the infant’s length (1st measurement)
o Cover the length board with a thin disposable dignitary sheet
o Remove infant’s shoes, hat and hair ornaments
o Ask the mother to stand over the infant keeping eye contact
1 Nhs.uk,. 'Oedema - Definition - NHS Choices', 2015. http://www.nhs.uk/conditions/Oedema/Pages/Introduction.aspx.
11
o Position and hold the infant’s head and ensure the vertical Frankfurt Plane position
(lower canal to the lower border of the eye socket is perpendicular to the horizontal
board)
o Take mother’s help to hold the infant’s chest so that he/she doesn’t move
o Use one leg of the infant if using both legs is not possible
o Ensure the head is in the right position, the trunk is straight and knees are held flat
o Hold the knee, tickle the under soul to keep the leg flat on the surface
o Move the footboard up
o The tip of the infant’s toe should touch the board
o Remove the infant’s leg and keep pressing the board,
o Ensure the anthropometrist is at eye level with the footboard when the
measurement is read
o Record length (cm) to last completed 1mm
• Measure and record the infant’s height first time (1st measurement) for ≥2 years or > 85 cm
o Remove shoes, hats and hair ornaments.
o If hair is done up on top of the head ask if they are willing to undo it.
o Ensure child is in the correct standing position
▪ His/her feet flat on the base plate
▪ Heels together
▪ Toes pointed slightly outward (60o) and weight evenly distributed over both
feet.
▪ Ensure head, shoulder blades, buttocks, calves and heels touch the board.
▪ Ensure the horizontal Frankfort Plane position (lower ear canal to the lower
border of the eye socket is perpendicular to the back board)
o Check that her/his knees are not bent or that s/he is not standing on her/his toes
o Slowly lower the head piece down onto head with sufficient pressure to compress
the hair.
o Ensure the anthropometrist is at eye level with the head piece when the
measurement is read
o Record the height (cm) to the nearest 0.1 cm
• Measure and record the infant’s weight (1st measurement)
o Remove the infant’s shoes, hats, and any heavy clothing
o Turn on the scale and wait until it reads zero o Make sure that the weight is displayed in kgs o Ask the mother to stand in the middle of the scale
o Ask the mother to look forward
o Ask the mother to come off the scale.
o Now hand over the baby to mother
o Ask her to step back onto the scales with the baby in her arms
o Note the weight in kgs to the nearest 0.1 kg
Make the 2nd series of measurement:
• Measure and record the infant’s length/height (2nd measurement)
• Measure and record the infant’s weight (2nd measurement)

12
References2
Centers for Disease Control and Prevention. (2007). National Health and Nutrition Examination
Survey (NHANES) Anthropometry Procedures Manual. Hyattsville, MD: National Center for Health
Statistics.
Cogill, B. (2003). Anthropometric Indicators Measurement Guide. Washington, DC: Food and
Nutrition Technical Assistance (FANTA) Project, FHI 360.
Division of Women, Infants and Children. (2010). Anthropometric Training Manual. Harrisburg, PA:
Pennsylvania Health Department.
2 The anthropometric training manual developed by Collective for Social Science Research (CSSR) for their
project Leveraging Agriculture and Nutrition for South Asia (LANSA) was also used to develop this manual.
That manual is not available online however it was shared by their senior researcher Haris Gazdar.
Appendix H: Field teams CHWs visited households, monthly, for a total of six months. Before intervention roll-out CHWs were trained by an expert from our research team with prior experience with electronic data collection and anthropometric measurement. CHWs with at least 10 years of education (matriculation) were recruited from within the local community using a word-of-mouth recruitment drive for our project. 20 candidates were shortlisted, interviewed and tested to recruit our final set of 14 CHWs hired for the duration of the six-month intervention period. These 14 CHWs were paired and allocated to six primary teams and one back-up team. The field team also comprised of one field supervisor and one field manager who coordinated day-to-day work and conducted quality assurance. The field supervisor and manager had higher educational qualifications (MPhils in related fields) and had prior experience in the locality with reputed organizations.