A method for deriving displacement data during cyclical movement using an inertial sensor
12
2503 Biomechanical studies traditionally employ optical motion capture systems for the determination of the position of an object in a room-based coordinate system. This constrains experiments to the calibrated volume of the camera system (although the cameras may move). This is not ideal for many types of study in locomotion since only a few strides may be collected per ‘trial’, and outdoor experiments are difficult with some systems. This is especially problematic where maximal activity is involved or the subjects have limited exercise capacity. Whilst treadmills are often used to provide a solution, these are not ideal or feasible under all circumstances. It is also difficult to study stride-to-stride variability in movement, generate the large data sets required for processing using statistical pattern recognition techniques or investigate locomotion involving different surfaces, inclines and obstacles. Here, we report and evaluate a novel approach that enables the user to determine linear displacements of a proprietary orientation sensor during cyclical movement. This makes it possible to undertake some of the experiments outlined above outside the constraints of the laboratory. Examples of such experiments include mechanical energy fluctuations of the centre of mass, horse rider interaction, interaction of athletes with their equipment (for instance, racing cyclists) and stride kinematics in subjects with prosthetic limbs, high susceptibility to falling and in different environments (surface, obstacles, light levels). One important application of this approach is the quantification of external work. External work, the work that The Journal of Experimental Biology 208, 2503-2514 Published by The Company of Biologists 2005 doi:10.1242/jeb.01658 Biomechanical studies often employ optical motion capture systems for the determination of the position of an object in a room-based coordinate system. This is not ideal for many types of study in locomotion since only a few strides may be collected per ‘trial’, and outdoor experiments are difficult with some systems. Here, we report and evaluate a novel approach that enables the user to determine linear displacements of a proprietary orientation sensor during cyclical movement. This makes experiments outside the constraints of the laboratory possible, for example to measure mechanical energy fluctuations of the centre of mass during over-ground locomotion. Commercial orientation sensors based on inertial sensing are small and lightweight and provide a theoretical framework for determining position from acceleration. In practice, the integration process is difficult to implement because of integration errors, integration constants and the necessity to determine the orientation of the measured accelerations. Here, by working within the constraints of cyclical movements, we report and evaluate a method for determining orientation and relative position using a modified version of a commercial inertial orientation sensor that combines accelerometers, gyroscopes and magnetometers, thus giving a full set of movement parameters (displacement, velocity and acceleration in three dimensions). The 35·g sensor was attached over the spine of a horse exercising on a treadmill. During canter locomotion (9.0·m·s –1 ), the amplitudes of trunk movement in the x (craniocaudal), y (mediolateral) and z (dorsoventral) directions were 99.6, 57.9 and 140.2·mm, respectively. Comparing sensor displacement values with optical motion capture values for individual strides, the sensor had a median error (25th, 75th percentile) in the x, y and z directions of 0.1 (–9.7, +10.8), –3.8 (–15.5, +13.7) and –0.1 (–6.3, +7.1)·mm, respectively. High-pass filtering of the displacement data effectively separated non-cyclical from cyclical components of the movement and reduced the interquartile ranges of the errors considerably to (–3.6, 6.2), (–4.0, 3.8) and (–4.5, 5.1) for x, y and z displacement, respectively, during canter locomotion. This corresponds to (–3.2, 5.5)%, (–6.7, 6.3)% and (–3.3, 3.7)% of the range of motion. Key words: inertial sensor, accelerometer, motion analysis, gait, horse, kinematics. Summary Introduction A method for deriving displacement data during cyclical movement using an inertial sensor Thilo Pfau 1, *, Thomas H. Witte 1 and Alan M. Wilson 1,2 1 Structure and Motion Laboratory, The Royal Veterinary College, Hawkshead Lane, Hatfield, Hertfordshire, AL9 7TA, UK and 2 Structure and Motion Laboratory, Royal National Orthopaedic Hospital, Brockley Hill, Stanmore, Middlesex, HA7 4LP, UK *Author for correspondence (e-mail: [email protected]) Accepted 25 April 2005 THE JOURNAL OF EXPERIMENTAL BIOLOGY
Transcript of A method for deriving displacement data during cyclical movement using an inertial sensor

2503
Biomechanical studies traditionally employ optical motioncapture systems for the determination of the position of anobject in a room-based coordinate system. This constrainsexperiments to the calibrated volume of the camera system(although the cameras may move). This is not ideal for manytypes of study in locomotion since only a few strides may becollected per ‘trial’, and outdoor experiments are difficult withsome systems. This is especially problematic where maximalactivity is involved or the subjects have limited exercisecapacity. Whilst treadmills are often used to provide a solution,these are not ideal or feasible under all circumstances. It is alsodifficult to study stride-to-stride variability in movement,generate the large data sets required for processing usingstatistical pattern recognition techniques or investigate
locomotion involving different surfaces, inclines and obstacles.Here, we report and evaluate a novel approach that enables theuser to determine linear displacements of a proprietaryorientation sensor during cyclical movement. This makes itpossible to undertake some of the experiments outlined aboveoutside the constraints of the laboratory. Examples of suchexperiments include mechanical energy fluctuations of thecentre of mass, horse rider interaction, interaction of athleteswith their equipment (for instance, racing cyclists) and stridekinematics in subjects with prosthetic limbs, high susceptibilityto falling and in different environments (surface, obstacles,light levels).
One important application of this approach is thequantification of external work. External work, the work that
The Journal of Experimental Biology 208, 2503-2514Published by The Company of Biologists 2005doi:10.1242/jeb.01658
Biomechanical studies often employ optical motioncapture systems for the determination of the position of anobject in a room-based coordinate system. This is not idealfor many types of study in locomotion since only a fewstrides may be collected per ‘trial’, and outdoorexperiments are difficult with some systems. Here, wereport and evaluate a novel approach that enables the userto determine linear displacements of a proprietaryorientation sensor during cyclical movement. This makesexperiments outside the constraints of the laboratorypossible, for example to measure mechanical energyfluctuations of the centre of mass during over-groundlocomotion. Commercial orientation sensors based oninertial sensing are small and lightweight and provide atheoretical framework for determining position fromacceleration. In practice, the integration process isdifficult to implement because of integration errors,integration constants and the necessity to determine theorientation of the measured accelerations. Here, byworking within the constraints of cyclical movements, wereport and evaluate a method for determining orientationand relative position using a modified version of acommercial inertial orientation sensor that combines
accelerometers, gyroscopes and magnetometers, thusgiving a full set of movement parameters (displacement,velocity and acceleration in three dimensions). The 35·gsensor was attached over the spine of a horse exercising ona treadmill. During canter locomotion (9.0·m·s–1), theamplitudes of trunk movement in the x (craniocaudal), y(mediolateral) and z (dorsoventral) directions were 99.6,57.9 and 140.2·mm, respectively. Comparing sensordisplacement values with optical motion capture values forindividual strides, the sensor had a median error (25th,75th percentile) in the x, y and z directions of 0.1 (–9.7,+10.8), –3.8 (–15.5, +13.7) and –0.1 (–6.3, +7.1)·mm,respectively. High-pass filtering of the displacement dataeffectively separated non-cyclical from cyclicalcomponents of the movement and reduced theinterquartile ranges of the errors considerably to (–3.6,6.2), (–4.0, 3.8) and (–4.5, 5.1) for x, y and z displacement,respectively, during canter locomotion. This correspondsto (–3.2, 5.5)%, (–6.7, 6.3)% and (–3.3, 3.7)% of the rangeof motion.
Key words: inertial sensor, accelerometer, motion analysis, gait,horse, kinematics.
Summary
Introduction
A method for deriving displacement data during cyclical movement using aninertial sensor
Thilo Pfau1,*, Thomas H. Witte1 and Alan M. Wilson1,2
1Structure and Motion Laboratory, The Royal Veterinary College, Hawkshead Lane, Hatfield, Hertfordshire,AL9 7TA, UK and 2Structure and Motion Laboratory, Royal National Orthopaedic Hospital, Brockley Hill, Stanmore,
Middlesex, HA7 4LP, UK*Author for correspondence (e-mail: [email protected])
Accepted 25 April 2005
THE JOURNAL OF EXPERIMENTAL BIOLOGY

2504
an individual performs against the environment that results inchanges in the potential energy (Ep) and kinetic energy (Ek) ofthe centre of mass (CoM), represents a major component of themechanical work of locomotion (Cavagna, 1975) and is oftenevaluated as a measure of locomotor efficiency on differentsurfaces (Ferris et al., 1998), in locomotion with prostheticlimbs (Skinner and Effeney, 1985; Tesio et al., 1998) or tojustify gait choice (Minetti et al., 1999). Vertical displacementsand velocities in three dimensions are needed to calculatechanges in Ep and Ek. External work is traditionally calculatedeither from force plate data or by summing individual bodysegment Ek and Ep. Both are time-consuming approaches; theformer requires a force plate and knowledge of initialconditions, and the latter requires a large set of markercoordinates and knowledge of segmental inertial properties(Buchner et al., 2000; Minetti et al., 1999). These analyses aretherefore rarely undertaken and are usually confined totreadmill locomotion or low-speed locomotion over a forceplatform. Since the influences on external work of factors suchas incline, surface stiffness and gait are of interest, thisrepresents a major limitation. Another disadvantage is thedifferences between treadmill and over-ground locomotion thathave been reported for both horses and humans (Elliott andBlanksby, 1976; Nigg et al., 1995). In the horse, whencompared to over-ground locomotion, treadmill locomotiondisplays several key mechanical differences including reducedvertical trunk displacement and increased stride length (Barreyet al., 1993; Buchner et al., 1994b).
A good estimate of CoM displacement and velocity can begained from overall trunk movement since limb movement isout of phase in the majority of bipedal and quadrupedal gaitsand changes of potential energy of the limbs are small (datafrom Wilson et al., 2003). This is especially true for cursorialanimals due to their relatively low limb mass (e.g. 5.8% and5.5% of the total body mass for the hind limbs and forelimbsof the horse, respectively; Buchner et al., 1997). Althoughlimb, head and visceral movements cause the CoM to changelocation within the trunk, visceral movements can only bequantified by the use of force platforms as ergometers(Cavagna, 1975). If head movement is considered an importantfactor for CoM movement, it can easily be captured by anadditional marker (in case of optical motion capture) or anadditional sensor (this approach) and included in thecalculations of the CoM. However, if the CoM can beconsidered to lie in a fixed position, then the six degree offreedom (DoF) movement of that position can be determinedeither from the movement of at least three markers in threedimensions or the six DoF position of a single point that liesa known distance and orientation from the assumed CoM. Thissimplifies the measurement procedure; however, motionanalysis data are still required.
Here, we are interested in examining movement outside thelaboratory when collection of motion capture or force platedata is not feasible. The approach is to integrate accelerationdata to determine position. Through the advent of low-cost,miniature triaxial accelerometers, direct measurement of
acceleration has become feasible. However, the process ofdetermining velocity and position by integration fromacceleration is more problematic than the reverse. Errorsrapidly accumulate during the integration process andadditional knowledge in the form of initial conditions isrequired for determination of integration constants. Attemptsto track motion by integration of accelerometer signals aretherefore often unsuccessful unless low-pass filtering ispermitted at each integration or very high quality, expensiveand bulky equipment is used (Barrey et al., 2001; Barrey andGalloux, 1997; Leleu et al., 2002). The technique is thereforeusually the preserve of military engineering.
In the integration process, changes in accelerometerorientation must be accounted for since an accelerometermeasures acceleration relative to its orientation rather than tothe earth or global coordinate system. This underlies theapplication of accelerometers as inclinometers in electronicspirit levels, where they determine the component of gravitythat acts orthogonal to the level. Accelerometer orientation haspreviously been determined in two ways; by optical motioncapture systems (Hedrick et al., 2004), which encounter theinherent problems discussed above, and by angular rategyroscopes. The angular velocity output of a gyroscope can beintegrated to determine orientation, so three orthogonalgyroscopes can be used to sense the orientation of a triaxialaccelerometer. Again, integration errors will accumulate overtime, resulting in drift, and knowledge of initial orientation isrequired. One solution is to use the known orientation of theearth’s gravitational field, but this becomes difficult duringmovement and does not enable correction for the integrationerrors. It also does not allow for correction of heading.Alternatively, it is possible to obtain an absolute measure oforientation using the earth’s magnetic field, as in a compass,which uses the horizontal components for headingdetermination. The earth’s magnetic field also has a verticalcomponent (hence why an un-weighted compass needle willdip), and a triaxial magnetometer can therefore sense absolutetwo-dimensional (2D) orientation, since it is not possible tosense rotations about the axis of the earth’s magnetic field. Acombination of accelerometers and magnetometers willtherefore give absolute three-dimensional (3D) orientation,except at the magnetic North and South pole (where gravityand earth magnetic field are parallel).
Sub-miniature accelerometers, gyroscopes andmagnetometers, with a mass of 1·g or less and costing as littleas $10, are readily available. These MEMS (micro-electro-mechanical systems) accelerometers contain silicon beams,which deform during acceleration. Resultant changes incapacitance are processed within the chip, which outputs avoltage relative to the applied acceleration. Miniaturegyroscopes that sense Coriolis forces when rotations areapplied to a pair of oscillating tines have been developed forapplications such as movement compensation in hand-heldvideo cameras, and small magnetometers are widely employedin electronic compasses.
Several companies have developed inertial sensors
T. Pfau, T. H. Witte and A. M. Wilson
THE JOURNAL OF EXPERIMENTAL BIOLOGY

2505Inertial sensing of cyclical movement
combining all three technologies, which give orientation in aglobal coordinate system (relative to the earth’s magnetic andgravitational fields). These are used in a wide array ofapplications, such as virtual reality systems, where they sensethe orientation of the head mounted display of the subject.Since they give orientation information and can sense 3Dacceleration, these transducers provide the basis fordetermining position by integration of acceleration. However,as alluded to above, the integration process from accelerationto velocity and displacement remains challenging. Here, wefocus on the implementation of an appropriate integrationprocedure that, in combination with the available orientationestimates, allows us to track movements with six DoF. Thisprocess would allow the application of miniature inertialsensors for an enormous range of animal tracking andlocomotion studies, making studies of real-life activities undernon-laboratory conditions possible.
The approach proposed is based on the cyclical nature oflocomotion. This means that it is possible to mean subtract thedata, effectively meaning that the sensor path is constrained toreturn to its starting point over a cycle. The period used formean subtraction will represent a trade-off betweenminimising the accumulation of integration errors andcapturing features that extend over a longer period of time (forinstance, tripping and jumping).
For example, during steady-state, level locomotion it isreasonable to assume that changes in the Ek and Ep of the trunkbetween strides are either small or zero. This means that trunkdisplacement data should follow a closed loop (subtracting theeffect of forward motion). The average velocity over the stride(or several strides) should be zero, and the averageforward–backward and side-to-side acceleration should bezero. Furthermore, the measured average vertical accelerationshould equal g (the gravitational constant). Thus, stride-by-stride mean subtraction of acceleration and of the calculatedvelocity vectors before integration theoretically enablesdetermination of the integration constants. Applying meansubtraction over individual strides constrains the movementpattern to steady-state, level locomotion. However, relaxingthe mean subtraction to a series of strides (a standard techniquefor dealing with data drift) enables evaluation of inter-stridevariability with the cost of greater accumulation of integrationerrors.
Here, we develop an approach for deriving displacementdata from a commercial orientation sensor by integration andmean subtraction. The results and errors of our approach arecompared to the ‘gold standard’ of 3D optical motion analysis.
Materials and methodsInitial experiments with inertial tracking were undertaken
with a 2D sensor manufactured in-house using twoaccelerometers and one gyroscope. However, ensuring that theindividual components were mounted exactly orthogonal toeach other proved difficult and we moved to using acommercially available orientation sensor with a modified
sensor bandwidth (MT9; Xsens, Enschede, The Netherlands).This unit contained the nine sensors required, a temperaturesensor (to correct for temperature drift), low-pass filter circuitsand a microcontroller, which digitized the data and combinedthe 10 data streams into a single serial data stream. Thesesensors are designed for determining orientation but weresuitable for our application once the bandwidth was changed.The sensor fusion algorithm (Xsens) used accelerometer andmagnetometer data (at times of slow movements of the sensor)to sense gravity and magnetic North and to compensate forotherwise unlimited increasing errors from the integration ofrate of turn data. The sensor contained accelerometers with adynamic range of ±10·g and gyroscopes with a range of±900·deg.·s–1. Maximum accelerations measured in theexperiments were obtained at high-speed canter and were inthe region of 5·g. Peak angular velocities were in the range of250·deg.·s–1. All the sensors have a rapid response time, anddata were low-pass filtered in order to reduce measurementnoise. In our modified sensor, accelerometer and gyroscopelow-pass filter cut-off frequencies (6·dB per octaveButterworth filter) were adapted from 30·Hz to 50·Hz foraccelerometer and gyroscope data, and magnetometer datawere low-pass filtered at 10·Hz (as a comparison, a minimumstance time of ~80·ms, corresponding to a frequency of~12.5·Hz in horizontal acceleration and 6.25·Hz in verticalacceleration, can be observed for Thoroughbred race horses atracing speed). All data were then passed through a 14-bit ADconverter. Each sensor was sampled 250 times per second. Theoutput was an RS232 (serial) data stream at 115·200·bit·s–1.
Three experiments were undertaken:(1) confirmation of accuracy of optical motion capture
system;(2) accuracy of MT9 inertial sensor determined by direct
comparison to optical motion capture;(3) measurement of trunk movement of a Thoroughbred
horse during treadmill locomotion.
Experiment 1 – accuracy of optical motion capture system
The accuracy of the optical motion capture system under ourexperimental conditions was determined by attaching twospherical retro-reflective markers (diameter 30·mm) to theturntable of a record player, which was then spun at 33 and45·r.p.m. in the field of view of the two-camera 3D motioncapture system (MCU240; ProReflex, Qualisys Ltd,Gothenburg, Sweden).
The accuracy of the motion capture system was tested basedon the circularity of the path of the spherical markers on theturntable of the record player. A least-mean-square error-basedgradient descent method was used to find the best match of the3D marker positions to a circle in 3D space (Barker, 2004).
Experiment 2 – accuracy of MT9 inertial sensor comparedwith optical motion capture determined during treadmill
locomotion
Whilst not the envisaged application, treadmill locomotionis used to enable validation of many consecutive strides in a
THE JOURNAL OF EXPERIMENTAL BIOLOGY

2506
short period of time. An MT9 inertial sensor was mounted ina custom-made harness constructed of malleable castingmaterial (Dynacast, Smith and Nephew, Wound Management,Hull, UK) over the 4th thoracic vertebra (the withers) of aThoroughbred horse (Fig.·1). A cable ran from the sensor, viaan overhanging beam, to a laptop computer and battery locatedbeside the treadmill. Serial data were collected from the sensorvia custom software written in Microsoft Visual C++(Microsoft Corporation, Redmond, WA, USA) using thesensor’s software development kit (SDK; Xsens). A wand withthree orthogonal arms, each bearing a retro-reflective sphericalmotion capture marker, was fixed to the sensor (Fig.·2). Thepositions of these markers were recorded at 240·Hz using the3D optical motion capture system validated in experiment 1.The cameras were positioned 3·m to the left of the treadmill.The calibrated volume of the cameras was comparable to thecalibrated volume used in experiment 1. A treadmill-centredright-handed Cartesian coordinate system (global system) wasdefined with the following conventions: the positive x-axis waspointing towards the front of the treadmill, the positive y-axiswas pointing towards the left side of the treadmill and thepositive z-axis was pointing upwards. These directionscorrespond to craniocaudal, mediolateral and dorsoventralmovements of the withers of the horse. Three DoF tracking ofthe three real markers was performed using QTrac software(Qualisys Ltd) in the treadmill-centred system. Based on thepositions of these three markers, six DoF tracking of onevirtual marker located at the centre of the inertial sensor wascarried out using custom software in MATLAB (TheMathworks Inc., Natick, MA, USA).
The beginning of each stride was determined by measuringleft fore foot acceleration using asolid-state capacitive accelerometerwith a dynamic range of ±50·g(ADXL150; Analog devices,Norwood, MA, USA; sensitivity38·mV·g–1). It was protected byenclosure in epoxy-impregnatedKevlar fibres (total mass 2·g) andmounted in the dorsal midline of thehoof with the sensitive axis orientatedin a proximo-distal direction (Witte etal., 2004). Output signals weretelemetered via a narrow-bandanalogue FM radio telemetry deviceoperating at 458·MHz with an audioresponse of 9·Hz to 3·kHz at –3·dB(ST/SR500; Wood and Douglas Ltd,Baughurst, Hampshire, UK). Datawere logged at a sample rate of1000·Hz via a 12-bit AD converter ona PCMCIA card (DAQcard700;National Instruments, Austin, TX,USA) into a laptop computer runningcustom software in MATLAB. Thetelemetry transmitter and battery were
mounted within an elastic exercise bandage on the lateralaspect of the third metacarpal bone of the left fore limb. Themass of the telemetry unit and battery adds up to 140·g, which,together with the exercise boot, gives a total of 310·g (<1%total limb mass), a moderate additional mass in comparisonwith the mass of the leg. A short cable running along the lateralaspect of the digit linked the telemetry unit to theaccelerometer.
The horse was habituated to the high-speed treadmill (Sato,Upsala, Sweden) before the start of the study (Buchner et al.,1994a). After a warm-up period, the horse was exercised atincrements of speed between 1.4·m·s–1 and 9.0·m·s–1. At eachspeed increment, the horse was allowed to settle into a regulargait prior to simultaneous collection of 15·s of inertial sensor,optical motion capture and accelerometer data. Afterdiscarding the first 5·s of data to allow for initializing effectsof the inertial sensing to settle, this allowed us to capture asequence of strides at each gait (walk, trot and canter).
Audio transcription software (Transcriber;http://www.etca.fr/CTA/gip/Projets/Transcriber/) was used toidentify the times of foot-on from the accelerometer voltageoutput. A mean absolute error of 2·ms for foot-on has beendetermined for this system (Witte et al., 2004). Inertial sensorand optical motion capture data were processed using customsoftware written in MATLAB.
The position of a virtual marker created at the centre of theinertial sensor using the positions of the three optical motioncapture markers was used to compare the optical motioncapture data with inertial sensor data. The results weresubdivided into the accuracy of orientation determination andthe accuracy of measurement of linear displacements.
T. Pfau, T. H. Witte and A. M. Wilson
Treadmill
Motion analysiscamera
Laptop for capturingof inertial sensor data
Laptop formotion captureInertial sensor
with reflectivemarkers
0.3 m
0.3 m
Fig.·1. Schematic drawing of the data collection set-up. The inertial sensor is mounted over thethoracic spinous processes (the withers) of the horse with the motion analysis marker wandattached. Cables are run from the inertial sensor to a laptop computer (via the safety harness mast)as well as from the optical motion capture cameras to a second laptop computer.
THE JOURNAL OF EXPERIMENTAL BIOLOGY

2507Inertial sensing of cyclical movement
Orientation
First, we were interested in the accuracy of the inertialsensor for measurement of absolute orientation. Errors inabsolute orientation will propagate into the integrationprocess from acceleration to velocity and displacement sincesensor accelerations have to be projected into the globalcoordinate system based on absolute orientation derived fromthe sensor. However, small absolute errors in orientation willhave a minimal effect on the projection of the accelerationvalues.
The orientation algorithm of the inertial sensor providedorientation data in the earth reference frame inthe form of Euler angles, quaternions orrotation matrices. Euler angles were used forthe purposes of graphical display, whilst dataprocessing was carried out using rotationmatrices, which do not suffer the problem ofgimbal lock. Euler angles (roll, pitch andheading) represent rotations from the sensorsystem into the earth reference system(horizontal and magnetic North; Fig.·3). Theconventions used set the order of rotations toroll first (rotation around the sensor x-axis),then pitch (rotation around the sensor y-axis)and then heading (rotation around the sensorand then also the earth reference z-axis).
It was necessary to align the earth referencesystem (used to express inertial sensororientation) with the optical motion capturereference system (global system) (Fig.·3).Therefore, initial values for roll (rMT9,0), pitch(pMT9,0) and heading (hMT9,0) were recordedfrom the inertial sensor, while the inertialsensor was aligned with the optical motioncapture coordinate system. Mean valuesacross six positions around the expected
position on the horse were used. Inertial sensor Euler angles(rMT9, pMT9, hMT9) were aligned to the optical motion capturecoordinate system using the following equation:
Subsequently, a rotation matrix, Rsg, representing a rotationfrom the sensor system into the motion capture system (globalsystem) was derived using the following equation, with Eulerangles obtained from Eqn·1 (subscripts and time dependencieshave been omitted on the right-hand side of the equation inorder to improve readability):
In addition, minor misalignment between the motionanalysis marker wand and the inertial sensor was corrected for.A correction vector was determined from values of roll, pitchand heading for both methods recorded simultaneously whilethe inertial sensor was mounted in the harness equipped withthe optical motion capture wand. Euler angles of the optical
(t)
.
⎥⎥⎥
⎦
⎤
⎢⎢⎢
⎣
⎡
−
+
+
−
−
=
prhrhpr
hrhpr
prhrhpr
hrhpr
php
hp
coscos)cossinsinsin(cos
)sinsincossin(cos
cossin)coscossinsin(sin
)sincoscossin(sin
sinsincos
coscos
sgR
(2)
⎟⎟⎟
⎠
⎞
⎜⎜⎜
⎝
⎛−
⎟⎟⎟
⎠
⎞
⎜⎜⎜
⎝
⎛=
⎟⎟⎟
⎠
⎞
⎜⎜⎜
⎝
⎛=
(t)MT9 MT9,0
MT9,0
MT9,0
MT9
MT9
MT9,aligned
MT9,aligned (t)MT9,aligned
(t)
(t)
(t)
(t)MT9,aligned h
p
r
h
p
r
h
p
r
(t)euler (1).
Fig.·2. The harness employed for attachment of the inertial sensor tothe thoracic spinous processes of the subject animal. The wands andmarkers for 3D optical motion capture are also shown.
zMA=zglobal=zearth
Towards leftof treadmill
yMA=yglobal
yearth
Towards frontof treadmill
xMA=xglobal
xearth(magnetic North)
Roll
yMT9 Pitch
xMT9
Heading
zMT9
Fig.·3. Schematic drawing of the coordinate systems used. Orientation of the inertialsensor is expressed as a sequence of roll, pitch and heading from the ‘sensor’ into the‘earth’ system. In order to compare optical motion capture and inertial sensor output, the‘global’ coordinate system is used.
THE JOURNAL OF EXPERIMENTAL BIOLOGY
2508
motion capture system were then corrected using the followingequation:
The last two terms of Eqn·3 were used for correction of themisalignment between the optical motion capture and theinertial sensor coordinate system (compare also Eqn·1), and thelast three terms eliminated the misalignment between theoptical motion capture marker wand and the sensor.
High linear accelerations over a sustained period of timeduring trot and canter locomotion resulted in a malfunction ofthe sensor orientation output, which is designed to deal withcomparatively low accelerations observed in humanlocomotion. Therefore, sensor accelerations were low-passfiltered using a 100-sample moving average (effective 3·dBcut-off: 1.1·Hz). The exact realisation of the low-pass filter inthis processing step is uncritical, its only purpose being theelimination of acceleration peaks. An additional processingstep was required that simulated an initial fixed orientation ofthe sensor, since capturing was started in full motion of thehorse. Five seconds of simulated static data, consisting ofsensor acceleration and angular velocity means andmagnetometer first frame values, were added to the beginningof the sensor data. These modified data were fed into the sensororientation algorithm to give the final orientationestimates.
The quality of the orientation output of the inertialsensor was evaluated by means of median and interquartileranges of the differences between the aligned Euler anglesfor the two systems.
Linear displacement
The goal was to derive linear displacements in the globalcoordinate system from the linear accelerations in thesensor coordinate system. This required a projection of thesensor accelerations into the global coordinate systemfollowed by a double integration of the accelerations.
First, the accelerations were projected from the sensorcoordinate system into the global system based on thesensor orientation output using the following equation.
aglobal(t) = Rsg(t) aMT9(t). (4)
During the integration process, sensor drift resulted inaccumulation of integration errors (Euler integration), andsuitable integration constants were required. In the specialcase of steady-state locomotion, both of these challengeswere overcome by assuming cyclical sensor movement.This meant that differences in position (and velocity)
(t)MA,aligned
MA,harness
MA,harness
MA,harness
(t)MA,aligned
(t)
(t)
(t)(t)MA,aligned
.⎥⎥⎥
⎦
⎤
⎢⎢⎢
⎣
⎡
⎟⎟⎟
⎠
⎞
⎜⎜⎜
⎝
⎛−
⎟⎟⎟
⎠
⎞
⎜⎜⎜
⎝
⎛−
⎟⎟⎟
⎠
⎞
⎜⎜⎜
⎝
⎛
−⎟⎟⎟
⎠
⎞
⎜⎜⎜
⎝
⎛=
⎟⎟⎟
⎠
⎞
⎜⎜⎜
⎝
⎛=
,9
,9
,9
(t)
MT9,0
MT9,0
MT9,0harnessMT
harnessMT
harnessMT
MA
MA
MA
h
p
r
h
p
r
h
p
r
h
p
r
h
p
r
MAeuler
(3)
⎧⎪⎨⎪⎩
⎫⎪⎬⎪⎭
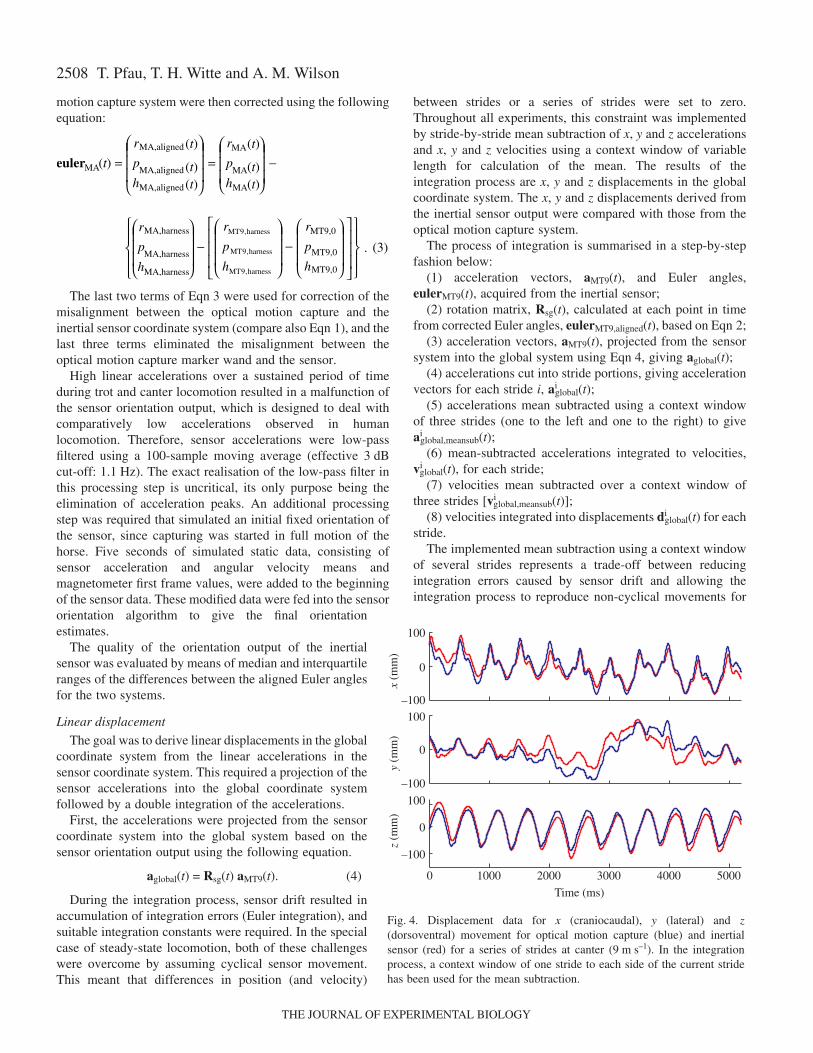
between strides or a series of strides were set to zero.Throughout all experiments, this constraint was implementedby stride-by-stride mean subtraction of x, y and z accelerationsand x, y and z velocities using a context window of variablelength for calculation of the mean. The results of theintegration process are x, y and z displacements in the globalcoordinate system. The x, y and z displacements derived fromthe inertial sensor output were compared with those from theoptical motion capture system.
The process of integration is summarised in a step-by-stepfashion below:
(1) acceleration vectors, aMT9(t), and Euler angles,eulerMT9(t), acquired from the inertial sensor;
(2) rotation matrix, Rsg(t), calculated at each point in timefrom corrected Euler angles, eulerMT9,aligned(t), based on Eqn·2;
(3) acceleration vectors, aMT9(t), projected from the sensorsystem into the global system using Eqn·4, giving aglobal(t);
(4) accelerations cut into stride portions, giving accelerationvectors for each stride i, ai
global(t);(5) accelerations mean subtracted using a context window
of three strides (one to the left and one to the right) to giveai
global,meansub(t);(6) mean-subtracted accelerations integrated to velocities,
viglobal(t), for each stride;
(7) velocities mean subtracted over a context window ofthree strides [vi
global,meansub(t)];(8) velocities integrated into displacements di
global(t) for eachstride.
The implemented mean subtraction using a context windowof several strides represents a trade-off between reducingintegration errors caused by sensor drift and allowing theintegration process to reproduce non-cyclical movements for
T. Pfau, T. H. Witte and A. M. Wilson
0 1000 2000 3000 4000 5000
–100
0
100
z (m
m)
–100
0
100
x (m
m)
Time (ms)
–100
0
100
y (m
m)
Fig.·4. Displacement data for x (craniocaudal), y (lateral) and z(dorsoventral) movement for optical motion capture (blue) and inertialsensor (red) for a series of strides at canter (9·m·s–1). In the integrationprocess, a context window of one stride to each side of the current stridehas been used for the mean subtraction.
THE JOURNAL OF EXPERIMENTAL BIOLOGY
2509Inertial sensing of cyclical movement
individual strides. Whereas the use of longer context windows(more strides) will increase drift-related errors, it will enableobservation of changes over several strides.
In order to separate slow, non-cyclical components of thelinear movements, i.e. those components caused by the subjectdrifting from side to side over a series of strides, from fastwithin-stride cyclical components, displacements derived forboth inertial sensor and optical motion analysis were high-passfiltered (6th-order Butterworth high pass, 3·dB cut-off at 1·Hz).Since the observed stride frequency values of 1–2·Hz were inthe range of this cut-off value, this effectively removed thenon-cyclical stride-to-stride differences and allowed us toquantify the ability of the sensor to capture the cyclicalcomponents. The individual stride displacement curves wereconcatenated after the integration, and the entire trace washigh-pass filtered. The filtered displacements were then re-segmented into strides and compared in the same way as theunfiltered displacements.
Original and filtered linear displacements derived from theinertial sensor and optical motion capture were compared, andmedian and interquartile ranges of the differences evaluated.
Experiment 3 – trunk movement of a Thoroughbred horseduring treadmill locomotion
The inertial sensor was attached to the horse with the samecustom-made harness used in experiment 2 and was used tomeasure the x, y and z displacements and the roll, pitch andheading angles of the 4th thoracic vertebra while the horseperformed a range of speeds and gaits on a high-speedtreadmill. The experimental set-up and initial data processingwere as described for experiment 2. For each speed increment,inertial sensor data were derived and, in addition to theprocessing described for experiment 2, data were interpolatedto percentage of stride and the mean stride was calculated (sixlast strides at walk, 12 last strides at trot and 17 last strides atcanter). Displacement and orientation amplitudes werecalculated.
ResultsExperiment 1 – accuracy of optical motion analysis system
The radii of the paths of the two motion analysis markerswere 126.1·mm and 127.7·mm, and the mean least-mean-square error calculated over all trials for both markers was0.58·mm, corresponding to 0.5–3% of the range of motion forthe conditions of experiments 2 and 3. Changing the rotationspeed of the record player as well as changing the camerapositions (around the estimated experimental set-up forexperiments 2 and 3) had no measurable effect upon theaccuracy with which the system was able to track the 3Dposition of the two markers and reproduce the circular path.
Experiment 2 – accuracy of MT9 inertial sensor determinedby direct comparison with optical motion capture
A total of 35 strides were analysed (6 strides at walk, 12strides at trot and 17 strides at canter). Displacement data from
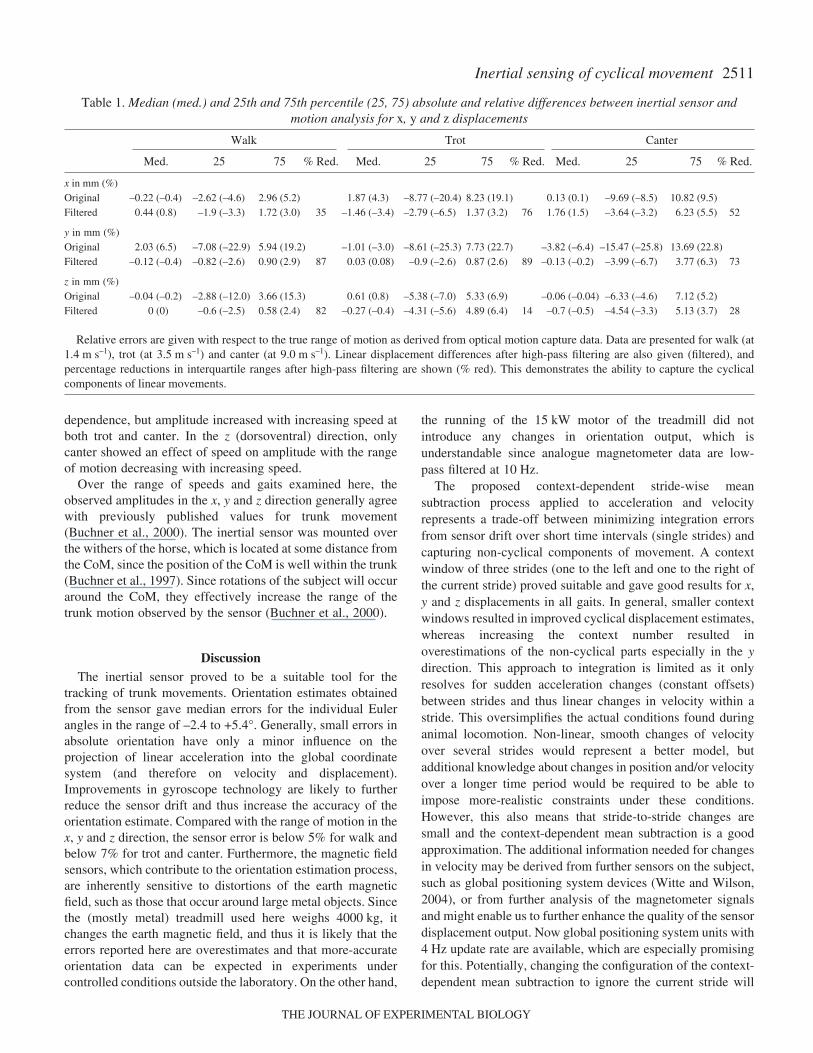
the inertial sensor integration process (using a context windowof one stride to each side of the current stride) followed theoptical motion capture data nicely over a series of strides(Fig.·4). Mean x, y and z displacement and roll, pitch andheading traces obtained using the inertial sensor were virtuallyindistinguishable from those obtained using optical motioncapture (Fig.·5; Table·1). There was, however, a small offsetbetween the inertial sensor and optical motion capture roll andpitch angles. The inertial sensor tended to underestimate theabsolute value of roll and overestimate the absolute value ofpitch in all gaits, with the magnitude of the offset increasingthrough the gaits from walk to trot and canter. These errorswere gait dependent (Table·1). After high-pass filtering, meanoutputs for x, y and z displacements for both methods were stillalmost identical (Fig.·6; Table·1) and, in addition, decreasedstandard deviations confirmed the efficacy of the procedure toremove inter-stride differences for both optical motion captureand inertial sensor outputs. Compared with the optical motioncapture system, 50% of the values for the x, y and zdisplacement obtained from the inertial sensor were foundwithin (–1.9, +1.7)·mm, (–0.8, +0.9)·mm, (–0.6, +0.6)·mm forwalk, (–2.8, +1.4)·mm, (–0.9, +0.9)·mm, (–4.3, +4.9)·mm fortrot and (–3.6, +6.2)·mm, (–4, +3.8)·mm, (–4.5, +5.1)·mm forcanter (Table·1). Compared with the range of motion (truevalues derived from optical motion capture data), these valuescorrespond to a relative error of (–3.3, +3.0)%, (–2.6, +2.9)%,(–2.5, +2.4)% for walk, (–6.5, +3.2)%, (–2.6, +2.6)%, (–5.6,+6.4)% for trot and (–3.2, +5.5)%, (–6.7, +6.3)%, (–3.3,+3.7)% for canter locomotion (Table·1).
The difference (error) between the inertial sensor and theoptical motion capture was calculated for each sample acrossall strides. Error histograms as well as median and interquartileranges for x, y and z displacements and roll, pitch and headingangles are given to qualitatively and quantitatively demonstratethe ability of the inertial sensor to reproduce the six DoFposition of the sensor. For the original data, x, y and zdisplacements and roll, pitch and heading angles showed errordistributions with increasing spread from walk to trot andcanter (Fig.·7). With the exception of roll and pitch angles, theerrors were distributed around the origin. Roll error data weredistributed around median values of 1.4°, 2.6° and 5.4° (witha range of motion of 8.0°, 7.7° and 12.5°), and pitch error datawere distributed around median values of –1.0°, –1.7° and–2.4° (with a range of motion of 9.1°, 8.0° and 18.5°) for walk,trot and canter, respectively. After high-pass filtering, the errorhistograms for linear displacements showed narrowerdistributions, as confirmed by lower interquartile ranges(Fig.·8; Table·1). Interquartile ranges were reduced by between14 and 89% by high-pass filtering. For each gait, the highesterror reduction was found for the y direction, in which the non-cyclical components were most prominent.
Experiment 3 – trunk movement of a Thoroughbred horseduring treadmill locomotion
Each variable showed characteristic gait-dependent features(Fig.·5). Whereas walk and trot show typical double-peaked
THE JOURNAL OF EXPERIMENTAL BIOLOGY

2510
vertical (z) displacement curves corresponding to the stance ofthe left and right leg, the z displacement at canter shows asingle peak (Minetti et al., 1999).
Ranges of displacement (maximum – minimum value within
a stride) for x, y and z displacement were calculated at eachspeed (Fig.·9). The range of displacement in the x(craniocaudal) direction was independent of speed for all gaits.In the y (mediolateral) direction, walk showed no speed
T. Pfau, T. H. Witte and A. M. Wilson
–40–20
02040
–20–10
01020
0 200 400 600 800 1000 1200–20–10
01020
–15–10–5
0
–30–25–20–15
0 200 400 600 800 1000 1200–10–5
05
10
–40–20
02040
–40–20
02040
0 80 160 240 320 400 480 560 640 720–50
0
50
–15–10–5
0
–30–25–20–15
0 80 160 240 320 400 480 560 640 720–5
0
5
0 80 160 240 320 400 480 560
–100–50
050
100 x
–50
050
100 y
–100–50
050
100 z
Canter at 9.0 m s–1
Time (ms)0 80 160 240 320 400 480 560
–20–10
010 Roll
–40–30–20–10 Pitch
Dis
plac
emen
t (de
g.)
Dis
plac
emen
t (m
m)
–10–5
05
Heading
E F
x
y
z
Trot at 3.5 m s–1
Roll
PitchD
ispl
acem
ent (
deg.
)
Dis
plac
emen
t (m
m)
Heading
C D
x
y
z
Walk at 1.4 m s–1
Roll
Pitch
Dis
plac
emen
t (de
g.)
Dis
plac
emen
t (m
m)
Heading
A B
Fig.·5. Optical motion capture (blue) and inertial sensor (red) outputs for x, y and z displacements and roll, pitch and heading angles of thesensor mounted over the thoracic spinous processes of a horse during treadmill locomotion (mean ± S.D.). Data are shown for the mean gaitcycle (stride) at (A,B) walk (1.4·m·s–1), (C,D) trot (3.5·m·s–1) and (E,F) left lead canter (9.0·m·s–1). For the x, y and z displacements and for theheading angle, the stride-to-stride differences, as indicated by the standard deviations, are bigger than the differences between the two methods(difference between the mean traces). For roll and pitch orientation, however, there is a small offset between the mean traces of the two methods,which increases from walk to trot and canter. The biggest inter-stride variability can be found in the y direction for both methods and acrossall gaits. This demonstrates the tendency of the horse to drift from side to side while performing on the treadmill.
THE JOURNAL OF EXPERIMENTAL BIOLOGY
2511Inertial sensing of cyclical movement
dependence, but amplitude increased with increasing speed atboth trot and canter. In the z (dorsoventral) direction, onlycanter showed an effect of speed on amplitude with the rangeof motion decreasing with increasing speed.
Over the range of speeds and gaits examined here, theobserved amplitudes in the x, y and z direction generally agreewith previously published values for trunk movement(Buchner et al., 2000). The inertial sensor was mounted overthe withers of the horse, which is located at some distance fromthe CoM, since the position of the CoM is well within the trunk(Buchner et al., 1997). Since rotations of the subject will occuraround the CoM, they effectively increase the range of thetrunk motion observed by the sensor (Buchner et al., 2000).
DiscussionThe inertial sensor proved to be a suitable tool for the
tracking of trunk movements. Orientation estimates obtainedfrom the sensor gave median errors for the individual Eulerangles in the range of –2.4 to +5.4°. Generally, small errors inabsolute orientation have only a minor influence on theprojection of linear acceleration into the global coordinatesystem (and therefore on velocity and displacement).Improvements in gyroscope technology are likely to furtherreduce the sensor drift and thus increase the accuracy of theorientation estimate. Compared with the range of motion in thex, y and z direction, the sensor error is below 5% for walk andbelow 7% for trot and canter. Furthermore, the magnetic fieldsensors, which contribute to the orientation estimation process,are inherently sensitive to distortions of the earth magneticfield, such as those that occur around large metal objects. Sincethe (mostly metal) treadmill used here weighs 4000·kg, itchanges the earth magnetic field, and thus it is likely that theerrors reported here are overestimates and that more-accurateorientation data can be expected in experiments undercontrolled conditions outside the laboratory. On the other hand,
the running of the 15·kW motor of the treadmill did notintroduce any changes in orientation output, which isunderstandable since analogue magnetometer data are low-pass filtered at 10·Hz.
The proposed context-dependent stride-wise meansubtraction process applied to acceleration and velocityrepresents a trade-off between minimizing integration errorsfrom sensor drift over short time intervals (single strides) andcapturing non-cyclical components of movement. A contextwindow of three strides (one to the left and one to the right ofthe current stride) proved suitable and gave good results for x,y and z displacements in all gaits. In general, smaller contextwindows resulted in improved cyclical displacement estimates,whereas increasing the context number resulted inoverestimations of the non-cyclical parts especially in the ydirection. This approach to integration is limited as it onlyresolves for sudden acceleration changes (constant offsets)between strides and thus linear changes in velocity within astride. This oversimplifies the actual conditions found duringanimal locomotion. Non-linear, smooth changes of velocityover several strides would represent a better model, butadditional knowledge about changes in position and/or velocityover a longer time period would be required to be able toimpose more-realistic constraints under these conditions.However, this also means that stride-to-stride changes aresmall and the context-dependent mean subtraction is a goodapproximation. The additional information needed for changesin velocity may be derived from further sensors on the subject,such as global positioning system devices (Witte and Wilson,2004), or from further analysis of the magnetometer signalsand might enable us to further enhance the quality of the sensordisplacement output. Now global positioning system units with4·Hz update rate are available, which are especially promisingfor this. Potentially, changing the configuration of the context-dependent mean subtraction to ignore the current stride will
Table·1. Median (med.) and 25th and 75th percentile (25, 75) absolute and relative differences between inertial sensor andmotion analysis for x, y and z displacements
Walk Trot Canter
Med. 25 75 % Red. Med. 25 75 % Red. Med. 25 75 % Red.
x in mm (%)Original –0.22 (–0.4) –2.62 (–4.6) 2.96 (5.2) 1.87 (4.3) –8.77 (–20.4) 8.23 (19.1) 0.13 (0.1) –9.69 (–8.5) 10.82 (9.5)Filtered 0.44 (0.8) –1.9 (–3.3) 1.72 (3.0) 35 –1.46 (–3.4) –2.79 (–6.5) 1.37 (3.2) 76 1.76 (1.5) –3.64 (–3.2) 6.23 (5.5) 52
y in mm (%)Original 2.03 (6.5) –7.08 (–22.9) 5.94 (19.2) –1.01 (–3.0) –8.61 (–25.3) 7.73 (22.7) –3.82 (–6.4) –15.47 (–25.8) 13.69 (22.8)Filtered –0.12 (–0.4) –0.82 (–2.6) 0.90 (2.9) 87 0.03 (0.08) –0.9 (–2.6) 0.87 (2.6) 89 –0.13 (–0.2) –3.99 (–6.7) 3.77 (6.3) 73
z in mm (%)Original –0.04 (–0.2) –2.88 (–12.0) 3.66 (15.3) 0.61 (0.8) –5.38 (–7.0) 5.33 (6.9) –0.06 (–0.04) –6.33 (–4.6) 7.12 (5.2)Filtered 0 (0) –0.6 (–2.5) 0.58 (2.4) 82 –0.27 (–0.4) –4.31 (–5.6) 4.89 (6.4) 14 –0.7 (–0.5) –4.54 (–3.3) 5.13 (3.7) 28
Relative errors are given with respect to the true range of motion as derived from optical motion capture data. Data are presented for walk (at1.4·m·s–1), trot (at 3.5·m·s–1) and canter (at 9.0·m·s–1). Linear displacement differences after high-pass filtering are also given (filtered), andpercentage reductions in interquartile ranges after high-pass filtering are shown (% red). This demonstrates the ability to capture the cyclicalcomponents of linear movements.
THE JOURNAL OF EXPERIMENTAL BIOLOGY

2512
enable us to capture short time deviations from the steady-statepattern.
High-pass filtering proved suitable for separating cyclicaland non-cyclical components of the movement across all gaits.At a filter cut-off of 1·Hz, most of the stride-to-stride variations
were eliminated successfully with the biggest improvementsfound in the y direction. This reflects the fact, that the y
T. Pfau, T. H. Witte and A. M. Wilson
–40–20
02040
–20–10
010
0 200 400 600 800 1000 1200–20–10
01020
–200
20
–20–10
01020
0 80 160 240 320 400 480 560 640 720–50
0
50
–100–50
050
100
–50
0
50
0 80 160 240 320 400 480 560–100–50
050
100
x
y
z
Canter at 9.0 m s–1
Time (ms)
Dis
plac
emen
t (m
m)
C
B x
y
z
Trot at 3.5 m s–1
Dis
plac
emen
t (m
m)
x
y
z
Walk at 1.4 m s–1
Dis
plac
emen
t (m
m)
A
Fig.·6. Motion analysis (blue) and inertial sensor (red) outputs for x,y and z displacements after high-pass filtering (mean ± S.D.). Data areshown for a stride at (A) walk (1.4·m·s–1), (B) trot (3.5·m·s–1) and (C)left lead canter (9.0·m·s–1). Smaller standard deviations (comparedwith the unfiltered displacements in Fig.·5), especially in the ydirection, show that high-pass filtering is a valid means of eliminatingnon-cyclical inter-stride differences of the displacements.
5
10
Rel
ativ
e fr
eque
ncy
(%)
51015
10203040
10203040
10203040
51015
0 0
00
0 0
Canter at 9.0 m s–1
Trot at 3.5 m s–1
C
x
y
z
Walk at 1.4 m s–1
Roll
Pitch
Difference (deg.)Difference (mm)
Heading
A
B
42
6
Rel
ativ
e fr
eque
ncy
(%)
246
10203040
10203040
204060
246
0 0
00
0 0
x
y
z
Roll
Pitch
Difference (deg.)Difference (mm)
Heading
Rel
ativ
e fr
eque
ncy
(%)
246
5101520
102030
–10 –5 0 5 10
–10 –5 0 5 10
–10 –5 0 5 10
5101520
234
10
0
0
0
234
10
0
x
y
z
Roll
Pitch
Difference (deg.)Difference (mm)
Heading
–50 –25 0 25 50
–50 –25 0 25 50
–50 –25 0 25 50
Fig.·7. Histograms of frame-wise difference between motion analysisand inertial sensor for roll, pitch and heading angles and x, y and zdisplacements for the whole data set. Histograms are shown for (A)walk (1.4·m·s–1), (B) trot (3.5·m·s–1) and (C) left lead canter(9.0·m·s–1). The spread of the histograms is generally increasing fromwalk to trot and canter. In addition, there is an offset in roll and pitchorientation, which increased with speed.
THE JOURNAL OF EXPERIMENTAL BIOLOGY

2513Inertial sensing of cyclical movement
direction, which corresponds to a lateral movement of thehorse, showed the highest inter-stride variability beforefiltering, which is caused by both sudden and gradual lateraldrift, i.e. big changes between two strides or a series of smallchanges for a number of strides. For different applications, adifferent cut-off frequency might be more suitable. The
average improvement over all directions was68% for walk, 60% for trot and 51% for canter.Although a period of 1·s represented a differentnumber of cycles for each gait (with stridefrequencies varying from ~1·Hz for walk to 2·Hzfor canter), changing the cut-off frequency toreflect this did not change the resultsconsiderably.
Accurate knowledge of the timing of the strideis crucial for the integration process (step 4 inthe integration procedure), since a cyclicalmovement (over a series of strides) is assumedfor the mean subtraction. In this study, a limb-mounted accelerometer was used to directlymeasure the timing of each left front leg footfall.This system is accurate to within 2·ms (less thanan inertial sensor sample) across all speeds andgaits on a hard surface (Witte et al., 2004). Errorsintroduced into the integration can therefore beregarded as negligible. Theoretically, it would bepossible to characterise features of the inertialsensor output corresponding to foot placement.However, the indirect and gait-dependent natureof the linkage between the foot and the trunk willinevitably result in reduced accuracy. Whenpossible, the direct method used here ispreferable given the importance of appropriate
stride segmentation.The sensor is adequately small and lightweight to be used in
field studies (35·g; 39�54�28·mm, width � length � height).Several sensors can easily be mounted on a single subject,allowing relative movements of body segments to be tracked.Since each sensor gives six DoF position information, there isno need to assume rigid links between the segments, and alimited set of sensors is sufficient to capture whole limbmovements. However, the experimental conditions have to beevaluated carefully when interpreting the results. The currenttechnique is designed for steady-state movements and givesgood results for individual strides (see results without high-pass filtering). In addition, high-pass filtering is an appropriatemethod for averaging over strides. Whereas experimental set-ups with considerable variations in, for example, slope orsurface are still difficult to interpret, field experiments onconstant slopes, or comparing different surfaces (with constantor slowly changing surface characteristics), are well within thescope of the technique. In addition, compared with force plateanalysis, this technique enables us to capture a series of stridesand is cheap in comparison to a multiple-camera motioncapture system under field conditions.
In the study described here, data were acquired into a laptopcomputer alongside the treadmill via a serial connection.However, the versatility of the sensor is enhanced because thedata stream can be easily logged on the animal into a hand-held computer (depending on the size of the animal) or can betransmitted via a high-speed telemetry link to a stationarycomputer. Links capable of a sufficiently high bandwidth and
y
–50 –25 0 25 50
z
xx
y
–50 –25 0 25 50
Difference (mm)
z
0
5
10
15
20 x
0
10
20
30
40
Rel
ativ
e fr
eque
ncy
(%)
y
–50 –25 0 250
20
40
60z
50
Canter at 9.0 m s–1CB Trot at 3.5 m s–1Walk at 1.4 m s–1A
Fig.·8. Histograms of frame-wise difference between motion analysis and inertialsensor x, y and z displacements after high-pass filtering. Histograms are shown for (A)walk (1.4·m·s–1), (B) trot (3.5·m·s–1) and (C) left lead canter (9.0·m·s–1). The reducedspread of the histograms (compared with the unfiltered displacement error histogramsin Fig.·7) demonstrates the ability of the inertial sensor integration process to capturethe cyclical components of the displacements.
0
40
80
120
020406080
0 1 2 3 4 5 6 7 8 9 10 11 120
4080
120160
x
y
zRan
ge o
f m
otio
n (m
m)
6 18171613121176
Speed (m s–1)
Fig.·9. Ranges of x, y and z displacements are shown as a function ofspeed and gait for a horse exercising on a treadmill. Ranges arecalculated as the difference between maximum and minimum valueswithin the mean stride. Error bars represent ±1 S.D., and the numberof strides in each category is given. Walk is represented by opencircles, trot by triangles and canter by diamonds.
THE JOURNAL OF EXPERIMENTAL BIOLOGY

2514
range include Bluetooth®, DECT (digital enhanced cordlesstelecommunications) or wireless networking technology(802.11a-h). When logging is started during locomotion andorientation data are required, the described post-processingstep has to be implemented in order to simulate an initial fixedorientation of the sensor. Here, we used a simple movingaverage filter (effective low pass cut-off of 1.1·Hz) forsmoothing the acceleration and gyroscope data. Although thedesign of this filter is not critical, its only purpose being tosimulate fixed orientation (around the mean acceleration), thepost-processing step might have to be adapted to theexperimental conditions.
Rigid mounting of the sensor on the subject was veryimportant in order to capture accurately overall trunkmovement. This was achieved here using the custom-madeharness (Fig.·2). There was minimal movement of the sensorrelative to the subject, although this was difficult to quantify.
Conclusion
Inertial sensors make it possible to capture cyclicalmovements with comparable accuracy to optical motioncapture systems. This enables the study of (quasi) steady-statefield locomotion. The extraction of non-cyclical componentsof movement is a future goal.
List of symbols and abbreviations2D two dimensional3D three dimensionala accelerationAD analogue to digitalCoM centre of massd displacementDoF degree of freedomEk kinetic energyEp potential energyg gravityh headingMA motion analysisMEMS micro-electro-mechanical systemsMT9 inertial sensorp pitchr rollRsg rotation matrix sensor to globalv velocityx craniocaudaly lateralz vertical
We thank the BBSRC for funding T.P. and the project and
the Horserace Betting Levy Board, London, for fundingT.H.W. We acknowledge James Usherwood and Anton vanden Bogert for providing feedback on the manuscript duringpreparation. The authors declare that they have no competingfinancial interests.
ReferencesBarker, R. M. (2004). Software Support For Metrology Best Practice Guide
No. 5, Guide To Eurometros: A Guide For Users, Contributors, And Testers.Teddington, UK: National Physical Laboratory.
Barrey, E. and Galloux, P. (1997). Analysis of the equine jumping techniqueby accelerometry. Equine Vet. J. Suppl. 23, 45-49.
Barrey, E., Galloux, P., Valette, J. P., Auvinet, B. and Wolter, R. (1993).Stride characteristics of overground versus treadmill locomotion in thesaddle horse. Acta Anat. (Basel) 146, 90-94.
Barrey, E., Evans, S. E., Evans, D. L., Curtis, R. A., Quinton, R. and Rose,R. J. (2001). Locomotion evaluation for racing in thoroughbreds. EquineVet. J. Suppl. 33, 99-103.
Buchner, H. H., Savelberg, H. H., Schamhardt, H. C., Merkens, H. W. andBarneveld, A. (1994a). Habituation of horses to treadmill locomotion.Equine Vet. J. Suppl. 17, 13-15.
Buchner, H. H., Savelberg, H. H., Schamhardt, H. C., Merkens, H. W. andBarneveld, A. (1994b). Kinematics of treadmill versus overgroundlocomotion in horses. Vet. Q. Suppl. 16, 2, S87-S90.
Buchner, H. H., Savelberg, H. H., Schamhardt, H. C. and Barneveld, A.(1997). Inertial properties of Dutch Warmblood horses. J. Biomech. 30, 653-658.
Buchner, H. H., Obermuller, S. and Scheidl, M. (2000). Body centre of massmovement in the sound horse. Vet. J. 160, 225-234.
Cavagna, G. A. (1975). Force platforms as ergometers. J. Appl. Physiol 39,174-179.
Elliott, B. C. and Blanksby, B. A. (1976). A cinematographic analysis ofoverground and treadmill running by males and females. Med. Sci. Sport.Exer. 8, 84-87.
Ferris, D. P., Louie, M. and Farley, C. T. (1998). Running in the real world:adjusting leg stiffness for different surfaces. Proc. R. Soc. London Ser. B265, 989-994.
Hedrick, T. L., Usherwood, J. R. and Biewener, A. A. (2004). Wing inertiaand whole-body acceleration: an analysis of instantaneous aerodynamicforce production in cockatiels (Nymphicus hollandicus) flying across arange of speeds. J. Exp. Biol. 207, 1689-1702.
Leleu, C., Gloria, E., Renault, G. and Barrey, E. (2002). Analysis of trottergait on the track by accelerometry and image analysis. Equine Vet. J. Suppl.34, 344-348.
Minetti, A. E., Ardigo, L. P., Reinach, E. and Saibene, F. (1999). Therelationship between mechanical work and energy expenditure oflocomotion in horses. J. Exp. Biol. 202, 2329-2338.
Nigg, B. M., De Boer, R. W. and Fisher, V. (1995). A kinematic comparisonof overground and treadmill running. Med. Sci. Sport. Exer. 27, 98-105.
Skinner, H. B. and Effeney, D. J. (1985). Gait analysis in amputees. Am. J.Phys. Med. 64, 82-89.
Tesio, L., Lanzi, D. and Detrembleur, C. (1998). The 3-D motion of thecentre of gravity of the human body during level walking. II. Lower limbamputees. Clin. Biomech. 13, 83-90.
Wilson, A. M., Watson, J. C. and Lichtwark, G. A. (2003). Biomechanics:A catapult action for rapid limb protraction. Nature 421, 35-36.
Witte, T. H. and Wilson, A. M. (2004). Accuracy of non-differential GPSfor the determination of speed over ground. J. Biomech. 37, 1891-1898.
Witte, T. H., Knill, K. and Wilson, A. M. (2004). Determination of peakvertical ground reaction force from duty factor in the horse (Equuscaballus). J. Exp. Biol. 207, 3639-3648.
T. Pfau, T. H. Witte and A. M. Wilson
THE JOURNAL OF EXPERIMENTAL BIOLOGY