A Meta-Methodology for the Design and Modeling of Patient ...
372
© Joanne Curry 2008 University of Western Sydney School of Computing and Mathematics A Meta-Methodology for the Design and Modeling of Patient Journeys By Joanne Marie Curry Student Number: 96076604 A dissertation submitted in fulfillment of the requirements for the degree of Doctor of Philosophy. February 2008
-
Upload
khangminh22 -
Category
Documents
-
view
1 -
download
0
Transcript of A Meta-Methodology for the Design and Modeling of Patient ...

© Joanne Curry 2008
University of Western Sydney School of Computing and Mathematics
A Meta-Methodology for the Design
and Modeling of Patient Journeys
By Joanne Marie Curry Student Number: 96076604
A dissertation submitted in fulfillment of the requirements for the degree of Doctor of Philosophy.
February 2008
Dedication I would like to thank my family and close friends for their support and patience over
the last 5 years. They have at times had to deal with someone who was completely
consumed with this thesis and they were always there with an encouraging word or a
hug.
Special thanks needs to go to my wonderful sons, Nicholas and Daniel, who over the
last year started many sentences with “When you finish your thesis, can we….?”
There will now be plenty of time to do all the things we put on hold. I adore you for
the amazing people you are becoming and the incredible understanding that this was
something I needed to do not only for me but for the long term future of our family
as well.
I also received great support from Allan, who in the darkest most doubtful days kept
telling me that ‘I had come too far to let it go now’. Your caring is always
appreciated.
My grandparents also deserve special mention for their quiet encouragement. Their
pride in what I was doing was worn proudly on their sleeve for all to see and they
can’t wait till my graduation. Of particular note is my grandmother Daphne, who
moved in for a number of months to help mind children, clean house and cook
meals. What a great help!
And finally to my two dogs, Sascha and Bella, who sat with me for many hours, just
resting their head on my knee or foot. They were always ready with a wagging tail
that never failed to bring a smile to my face. Animal therapy should never be
underestimated!

Acknowledgements My fellow research candidates and colleagues were always ready to talk through
ideas and approaches and suggest alternative viewpoints. This fostered an
encouraging research environment and opportunities to stretch my thoughts and
approach in many ways. I hope I can assist them in the same way as they continue
on their own research journeys.
The staff and management at Ryde Hospital Maternity Department provided a great
case study environment and the midwives involved contributed to the patient journey
modeling sessions with fantastic vigour and passion. The results have been
beneficial for us all.
And last but not least I would like to thank my research supervisors: Associate
Professor Carolyn McGregor and Professor Sally Tracy. Their ongoing commitment
to expanding my research mindset and writing style was fantastic. There were times
when the enormity of the project almost overcame me but Associate Professor
McGregor in particular was always there with an encouraging word and healthy push
to keep moving forward. Our relationship has many dimensions, including teacher,
mentor and friend and for this I will be eternally grateful. I know our research
collaborations will also continue for a long time to come. Thankyou Carolyn and
Sally, for everything.

Statement of Authentication
The work presented in this thesis is, to the best of my knowledge and belief, original
except as acknowledged in the text. I hereby declare that I have not submitted this
material, either in full or in part, for a degree at this or any other institution.
…………………………………………… (Signature of Candidate)
Publications Relate d to Dissertation • Curry, J.M. , McGregor, C. and Tracy, S., (2007), A Systems Development Lifecycle
Approach to Patient Journey Modeling Projects, MEDINFO2007, August 20-24, Brisbane, Australia, pp.905-909. • Curry, J.M. , McGregor, C. and Tracy, S., (2006), A Communication Tool to Improve the Patient Journey Modeling Process, EMBC2006, August 30 -September 3 2006, New York, USA, pp.4726-4730.
• Curry, J.M. , McGregor, C. and Tracy, S., (2006), Incorporating Balanced Scorecards into the Patient Journey Modelling Process, HIC2006, 20-22/8/2006, Sydney, Australia, pp.11/1-11/7. • Curry, J.M. and McGregor, C., (2005), The Current State of Patient Journey Redesign in Australia, HIC2005, 31/7-2/8/2005, Melbourne, Australia. • Curry, J.M. , (2005), Deficiencies Of Process Reengineering In Its Support For Healthcare Redesign, University of Western Sydney, CSTE Innovation Conference, 8-9 June 2005, Penrith, Australia, pp.19-20. (Awarded Joint Best Paper)

Research Grants Related to Dissertation
2007 – Australian Government National Health and Medical Research Council
(NHMRC) as part of the Healthy Start to Life Grants scheme.
Grant Value: $528,000- (AUD)
Project Title: “1 + 1 = A Healthy Start to Life”
Partner Organisation: Charles Darwin University, Northern Territory, Australia.
My Role: Chief Investigator
The research project is a 5 year, 3 stage, baseline, intervention and post-intervention
study which is designed to improve maternal and infant health for remote dwelling
Aboriginal families in the Top End of the NT. It is based around initial scoping work
with women from our field sites Maningrida and Wadeye, health workers and policy
makers who confirmed the feasibility and importance of the study. The project will
use the Patient Journey Modeling Meta-Methodology (PJM3) and the PaJMa Patient
Journey Modeling tool, developed as part of this thesis, along with participatory
action research to research and introduce change simultaneously. Consultation has
suggested and evidence confirms that health service re-design, our intervention, will
be based on ‘women centred’ continuity of care, and proactive, intensive and focused
support for mothers, infants and families. Further consultation, baseline data and
evidence will be used to design the specifics of service improvement. This will be
evaluated post-intervention against baseline data from our two field sites and
aggregated data already routinely collected from across the NT. Data collected will
include organisational data for example costing and workforce utilisation, outcomes
data such as measures of health and wellbeing in women and infants and the
experiences of women, their families and practitioners with the health system pre
and post intervention generated using ethnographic methods.

Human Ethics Clearance Human Ethics approval for the project entitled “A patient journey model through
primary care in a midwifery group practice" was received from the Northern Sydney
Central Coast Area Health Service Human Research Ethics Committee on the 16th
August 2006.
The Protocol No. is 0608-128M.
The University of Western Sydney Human Research Ethic Committee recognised
this external approval on the 15th March 2007. The UWS Registration Number is
HREC 07/034.

i
Table of Contents
ABBREVIATIONS ........................................................................................................................... VIII
ABSTRACT ...........................................................................................................................................IX
CHAPTER 1 INTRODUCTION......................................................................................................1
1.1 LIMITATIONS OF PROCESS MODELING METHODS FOR PATIENT JOURNEY REDESIGN...........7 1.2 RESEARCH MOTIVATION ......................................................................................................11 1.3 RESEARCH HYPOTHESES......................................................................................................17
1.3.1 Specific Scope Exclusions...............................................................................................18 1.4 RESEARCH CONTRIBUTIONS.................................................................................................19 1.5 RESEARCH APPROACH..........................................................................................................24 1.6 THESIS OVERVIEW................................................................................................................29
CHAPTER 2 LITERATURE REVIEW - PART A.....................................................................31
2.1 INTRODUCTION.....................................................................................................................31 2.2 BUSINESS PROCESS IMPROVEMENT......................................................................................33
2.2.1 Origins and Methodology ...............................................................................................33 2.2.2 Process Modeling............................................................................................................34 2.2.3 Conclusions and Implications for Patient Journey Modeling Research .......................36
2.3 PROCESS IMPROVEMENT IN HEALTHCARE ...........................................................................38 2.3.1 Drivers for Change .........................................................................................................40
2.3.1.1 U.S. Institute of Medicine ...................................................................................................40 2.3.1.2 Improving Patient Safety and Reduced Care Variability....................................................43 2.3.1.3 Patient-centered Care...........................................................................................................44
2.3.2 Dominant Change Agents ...............................................................................................46 2.3.2.1 Institute for Healthcare Improvement (IHI)........................................................................46 2.3.2.2 National Health Service (NHS)...........................................................................................49
2.3.3 Patient Journey Modeling...............................................................................................52 2.3.3.1 Lean Thinking......................................................................................................................54 2.3.3.2 Six Sigma.............................................................................................................................59 2.3.3.3 ARIS ....................................................................................................................................61 2.3.3.4 Unified Modeling Language ...............................................................................................65
2.3.4 Conclusions and Implications for Patient Journey Modeling Research .......................67 2.4 HEALTHCARE STRATEGY .....................................................................................................71
2.4.1 Strategy Analysis.............................................................................................................71 2.4.2 Balanced Scorecards ......................................................................................................72 2.4.3 Balanced Scorecards in Healthcare...............................................................................75 2.4.4 Conclusions and Implications for Patient Journey Modeling Research .......................78
CHAPTER 3 LITERATURE REVIEW - PART B .....................................................................80
3.1 INTRODUCTION.....................................................................................................................80 3.2 WORKFLOW AND WORKFLOW MANAGEMENT SYSTEMS ....................................................81
3.2.1 Workflow .........................................................................................................................82 3.2.2 Workflow Management Systems .....................................................................................83 3.2.3 Workflow Management Coalition...................................................................................85 3.2.4 Conclusions and Implications for Patient Journey Modeling Research .......................87
3.3 DECISION SUPPORT...............................................................................................................88 3.3.1 Decision Making Process ...............................................................................................89 3.3.2 Decision Support Systems...............................................................................................90 3.3.3 Decision Support System Architecture ...........................................................................92 3.3.4 Modeling the Data Warehouse.......................................................................................95 3.3.5 Implementing the Data Warehouse ................................................................................97 3.3.6 Decision Support in Healthcare .....................................................................................98 3.3.7 Conclusions and Implications for Patient Journey Modeling Research .....................105
3.4 INTEGRATION AND TRANSFER OF INFORMATION BETWEEN SYSTEMS..............................108 3.4.1 eXtensible Markup Language (XML) ...........................................................................108 3.4.2 Balanced Scorecard XML Standard (BSC XML).........................................................112
ii
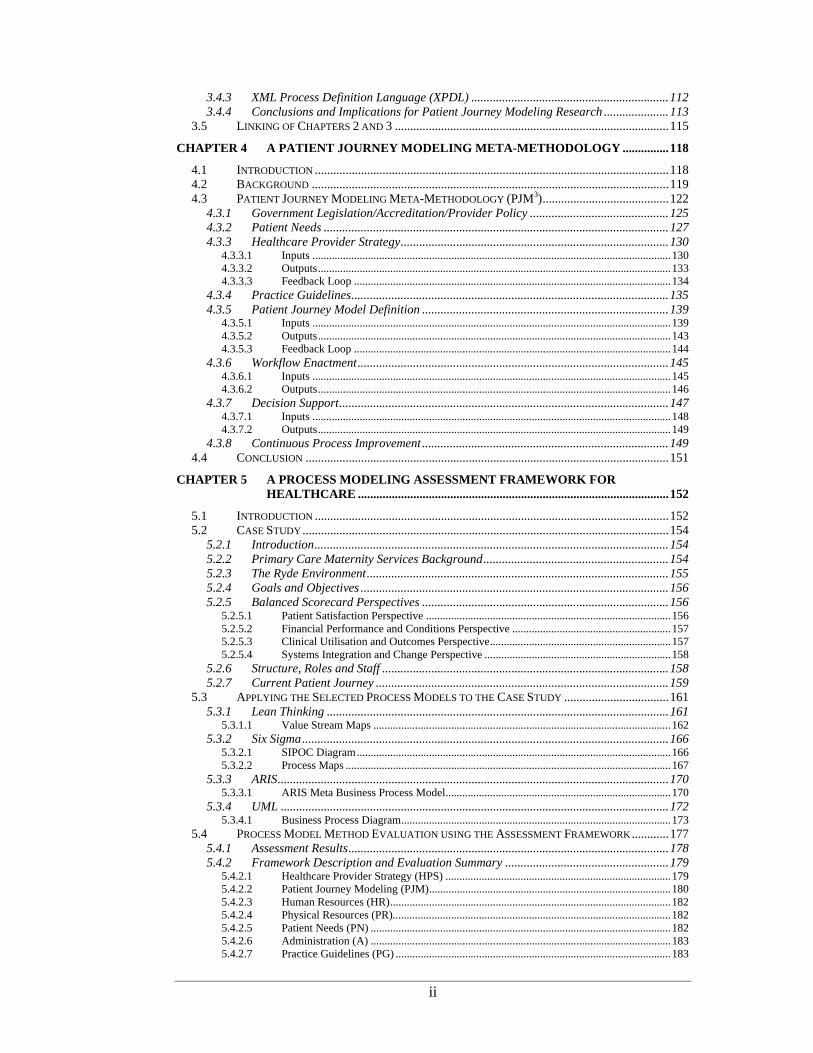
3.4.3 XML Process Definition Language (XPDL) ................................................................112 3.4.4 Conclusions and Implications for Patient Journey Modeling Research .....................113
3.5 LINKING OF CHAPTERS 2 AND 3 .........................................................................................115
CHAPTER 4 A PATIENT JOURNEY MODELING META-METHODOLOGY ...............118
4.1 INTRODUCTION...................................................................................................................118 4.2 BACKGROUND ....................................................................................................................119 4.3 PATIENT JOURNEY MODELING META-METHODOLOGY (PJM3).........................................122
4.3.1 Government Legislation/Accreditation/Provider Policy .............................................125 4.3.2 Patient Needs ................................................................................................................127 4.3.3 Healthcare Provider Strategy.......................................................................................130
4.3.3.1 Inputs .................................................................................................................................130 4.3.3.2 Outputs...............................................................................................................................133 4.3.3.3 Feedback Loop ..................................................................................................................134
4.3.4 Practice Guidelines.......................................................................................................135 4.3.5 Patient Journey Model Definition ................................................................................139
4.3.5.1 Inputs .................................................................................................................................139 4.3.5.2 Outputs...............................................................................................................................143 4.3.5.3 Feedback Loop ..................................................................................................................144
4.3.6 Workflow Enactment.....................................................................................................145 4.3.6.1 Inputs .................................................................................................................................145 4.3.6.2 Outputs...............................................................................................................................146
4.3.7 Decision Support...........................................................................................................147 4.3.7.1 Inputs .................................................................................................................................148 4.3.7.2 Outputs...............................................................................................................................149
4.3.8 Continuous Process Improvement................................................................................149 4.4 CONCLUSION ......................................................................................................................151
CHAPTER 5 A PROCESS MODELING ASSESSMENT FRAMEWORK FOR HEALTHCARE .....................................................................................................152
5.1 INTRODUCTION...................................................................................................................152 5.2 CASE STUDY .......................................................................................................................154
5.2.1 Introduction...................................................................................................................154 5.2.2 Primary Care Maternity Services Background............................................................154 5.2.3 The Ryde Environment..................................................................................................155 5.2.4 Goals and Objectives ....................................................................................................156 5.2.5 Balanced Scorecard Perspectives ................................................................................156
5.2.5.1 Patient Satisfaction Perspective ........................................................................................156 5.2.5.2 Financial Performance and Conditions Perspective .........................................................157 5.2.5.3 Clinical Utilisation and Outcomes Perspective.................................................................157 5.2.5.4 Systems Integration and Change Perspective ...................................................................158
5.2.6 Structure, Roles and Staff .............................................................................................158 5.2.7 Current Patient Journey ...............................................................................................159
5.3 APPLYING THE SELECTED PROCESS MODELS TO THE CASE STUDY ..................................161 5.3.1 Lean Thinking ...............................................................................................................161
5.3.1.1 Value Stream Maps ...........................................................................................................162 5.3.2 Six Sigma.......................................................................................................................166
5.3.2.1 SIPOC Diagram.................................................................................................................166 5.3.2.2 Process Maps .....................................................................................................................167
5.3.3 ARIS...............................................................................................................................170 5.3.3.1 ARIS Meta Business Process Model.................................................................................170
5.3.4 UML ..............................................................................................................................172 5.3.4.1 Business Process Diagram.................................................................................................173
5.4 PROCESS MODEL METHOD EVALUATION USING THE ASSESSMENT FRAMEWORK............177 5.4.1 Assessment Results........................................................................................................178 5.4.2 Framework Description and Evaluation Summary .....................................................179
5.4.2.1 Healthcare Provider Strategy (HPS) .................................................................................179 5.4.2.2 Patient Journey Modeling (PJM).......................................................................................180 5.4.2.3 Human Resources (HR).....................................................................................................182 5.4.2.4 Physical Resources (PR)....................................................................................................182 5.4.2.5 Patient Needs (PN) ............................................................................................................182 5.4.2.6 Administration (A) ............................................................................................................183 5.4.2.7 Practice Guidelines (PG) ...................................................................................................183
iii
5.4.2.8 Systems Data (SD).............................................................................................................183 5.4.2.9 Measurements (M).............................................................................................................184 5.4.2.10 Technology Support (TS) ..................................................................................................184
5.5 CONCLUSION ......................................................................................................................185
CHAPTER 6 PJM2 – A MULTI-DIMENSIONAL PATIENT JOURNEY MODELING CONCEPTUAL DESIGN .....................................................................................187
6.1 INTRODUCTION...................................................................................................................187 6.2 MULTI-DIMENSIONAL PATIENT JOURNEY MODELING - A CONCEPTUAL DESIGN (PJM2)...188
6.2.1 The Patient Journey Model...........................................................................................192 6.2.2 Strategic Objectives Dimension....................................................................................193 6.2.3 Human Resources Dimension.......................................................................................194 6.2.4 Physical Resources Dimension.....................................................................................194 6.2.5 Patient Needs Dimension..............................................................................................194 6.2.6 Practice Guidelines.......................................................................................................195 6.2.7 Administration Dimension............................................................................................196 6.2.8 Technology Support Dimension....................................................................................196 6.2.9 Measurements Dimension.............................................................................................197 6.2.10 Organisational Structure Dimension.......................................................................199
6.3 CONCLUSION ......................................................................................................................199
CHAPTER 7 PAJMA - A HEALTHCARE SPECIFIC PATIENT JOURNEY MODELING TOOL ......................................................................................................................201
7.1 INTRODUCTION...................................................................................................................201 7.2 PAJMA TOOL BACKGROUND .............................................................................................202
7.2.1 Contributing Domains ..................................................................................................204 7.2.2 Project Activities...........................................................................................................206
7.3 THE PAJMA ARCHITECTURE..............................................................................................207 7.3.1 Patient Movement and Staff Roles layer ......................................................................210 7.3.2 Process layer.................................................................................................................211 7.3.3 Information Creation/Update Layer.............................................................................213 7.3.4 Patient Needs/Practice Guidelines/Policy layer..........................................................214 7.3.5 Measurements layer......................................................................................................214 7.3.6 Modeling Complex Processes.......................................................................................219 7.3.7 Modeling Care Handovers and Discontinuities of Care .............................................222 7.3.8 Slicing and Dicing the Model .......................................................................................225
7.4 APPLICATION OF PAJMA TO THE CASE STUDY ..................................................................227 7.4.1 Project Startup ..............................................................................................................228 7.4.2 The Current Patient Journey ........................................................................................231
7.4.2.1 PaJMa Current Patient Journey .........................................................................................232 7.4.2.2 Issues Identified.................................................................................................................239
7.4.3 The Future Patient Journey..........................................................................................241 7.4.3.1 Impact of Improvements on Patients and Staff.................................................................241 7.4.3.2 PaJMa Future Patient Journey...........................................................................................244 7.4.3.3 New Measurements ...........................................................................................................250
7.4.4 Stakeholder Experience with the PaJMa Tool .............................................................251 7.5 ASSESSING THE PAJMA TOOL............................................................................................252 7.6 CONCLUSION ......................................................................................................................253
CHAPTER 8 TECHNOLOGY SUPPORT.................................................................................255
8.1 INTRODUCTION...................................................................................................................255 8.2 PJM3
AND ITS IMPACT ON THE TECHNOLOGY SOLUTION SPACE.......................................256 8.2.1 The Relationship of Logical to Physical Patient Journey Models...............................258
8.3 PATIENT JOURNEY MODEL DEVELOPMENT .......................................................................259 8.4 WORKFLOW ENGINE...........................................................................................................259 8.5 DATA INTEGRATION AND TRANSFER.................................................................................260
8.5.1 Healthcare Provider Balanced Scorecards..................................................................260 8.5.2 Process Definitions .......................................................................................................262 8.5.3 Workflow Enactment Audit Log Data...........................................................................265
8.6 DATABASE SUPPORT..........................................................................................................267 8.6.1 The Patient Journey Model...........................................................................................268

iv
8.6.2 Strategic Objectives Dimension....................................................................................270 8.6.3 Human Resources Dimension.......................................................................................272 8.6.4 Physical Resources Dimension.....................................................................................273 8.6.5 Patient Needs Dimension..............................................................................................274 8.6.6 Practice Guidelines Dimension ....................................................................................275 8.6.7 Administration Dimension............................................................................................277 8.6.8 Technology Support Dimension....................................................................................278 8.6.9 Measurements Dimension.............................................................................................278 8.6.10 Organisational Structure Dimension.......................................................................281 8.6.11 Multidimensional Database Design ........................................................................282
8.6.11.1 Dimension Tables..............................................................................................................286 8.6.11.2 Fact Table ..........................................................................................................................290 8.6.11.3 SQL Query and Report Example ......................................................................................293
8.7 CONCLUSION ......................................................................................................................294
CHAPTER 9 THESIS CONCLUSION AND FUTURE WORK.............................................296
9.1 SUMMARY AND RESEARCH HYPOTHESES SOLUTIONS.......................................................296 9.2 MAJOR CONTRIBUTIONS.....................................................................................................298 9.3 RESEARCH IMPACTS...........................................................................................................305 9.4 LIMITATIONS OF PJM3........................................................................................................307 9.5 FUTURE WORK ...................................................................................................................308 9.6 FINAL CONCLUSION............................................................................................................312
REFERENCES....................................................................................................................................314
APPENDIX A - PMAF4HC– DETAILED QUESTIONS BY CATEGORY...............................336
APPENDIX B - BSC XML FOR EVALUATE PATIENT SUITABILITY................................340
APPENDIX C - XPDL FOR EVALUATE PATIENT SUITABILITY........................................345
v
Figures FIGURE 1.1. QUALITY IMPROVEMENT, INFORMATION TECHNOLOGY AND CLINICAL MEDICINE (JENSEN
ET AL. 2006)....................................................................................................................................15 FIGURE 1.2. ELEMENTS OF CONSTRUCTIVE RESEARCH (LUKKA 2003) ..................................................24 FIGURE 2.1. DIFFERING LEVELS OF PROCESS ABSTRACTION (ROLLAND 1993) .....................................35 FIGURE 2.2. ‘CORE GOALS AND PRIORITIES FOR PERFORMANCE IMPROVEMENT’ FROM A FRAMEWORK
FOR A HIGH PERFORMANCE HEALTH SYSTEM FOR THE UNITED STATES (THE COMMONWEALTH
FUND COMMISSION ON A HIGH PERFORMANCE HEALTH SYSTEM 2006)......................................42 FIGURE 2.3. THE BREAKTHROUGH SERIES - MODEL FOR IMPROVEMENT (DEMING 1993; LANGLEY ET
AL. 1996; IHI 2003) ........................................................................................................................47 FIGURE 2.4. THE INITIAL VALUE STREAM MAPPING STEPS (ROTHER AND SHOOK 2003)......................56 FIGURE 2.5. THE RELATIONSHIP OF PATIENT JOURNEY MODELING TO THE MODEL FOR IMPROVEMENT
........................................................................................................................................................58 FIGURE 2.6 THE ARIS HOUSE VIEWS (SCHEER 1998) ............................................................................62 FIGURE 2.7 ARIS HOUSE WITH DEVELOPMENT PHASES (SCHEER 1998)................................................64 FIGURE 2.8 THE ORIGINAL BALANCED SCORECARD PERSPECTIVES (KAPLAN AND NORTON 1992) .....73 FIGURE 2.9 THE BALANCED SCORECARD PERSPECTIVES IN HEALTHCARE AS ADAPTED BY THE
ONTARIO HOSPITAL ASSOCIATION (ONTARIO HOSPITAL ASSOCIATION 1999) ............................77 FIGURE 3.1. WORKFLOW SYSTEM CHARACTERISTICS AS ADAPTED FROM (WFMC 1995) .....................84 FIGURE 3.2. THE WFMC REFERENCE MODEL (WFMC 1995) ................................................................85 FIGURE 3.3. SIMON'S ORIGINAL DECISION MAKING PROCESS (SIMON 1960, AS IN GORRY AND SCOTT
MORTON 1977)...............................................................................................................................89 FIGURE 3.4. A GENERAL MODEL OF THE DECISION MAKING PROCESS (MINTZBERG ET AL. 1976)........90 FIGURE 3.5. INFORMATION SYSTEMS: A FRAMEWORK (GORRY AND SCOTT MORTON 1971)................91 FIGURE 3.6. THE DDM PARADIGM (SPRAGUE JR AND WATSON 1996) ..................................................92 FIGURE 3.7. THE GENERAL DATA WAREHOUSE ARCHITECTURE (ADAPTED FROM (SPRAGUE JR AND
WATSON 1996)) .............................................................................................................................94 FIGURE 3.8. AN EXAMPLE OF A STAR SCHEMA (KIMBALL 1996) ...........................................................96 FIGURE 3.9. AN EXAMPLE OF A SNOWFLAKE SCHEMA (KIMBALL 1996) ...............................................97 FIGURE 3.10. FOUR TYPES OF ORGANISATIONAL RESOURCES (HOLSAPPLE AND WHINSTON 2001) ...104 FIGURE 3.11. AN EXAMPLE XML DOCUMENT......................................................................................110 FIGURE 3.12. RELATIONSHIP OF THE DIFFERING LAYERS OF ABSTRACTION INVOLVED IN THE
DELIVERY OF PATIENT JOURNEY IMPROVEMENTS IN HEALTHCARE ...........................................115 FIGURE 4.1. THE PATIENT JOURNEY MODELING META-METHODOLOGY (PJM3).................................123 FIGURE 4.2. GOVERNMENT LEGISLATION/ACCREDITATION/PROVIDER POLICY RELATIONSHIP TO
HEALTHCARE PROVIDER STRATEGY............................................................................................126 FIGURE 4.3. INTEGRATED SCIENCES MODEL (SAHLER AND CARR 2003) .............................................128 FIGURE 4.4. PJM3
AND PATIENT NEEDS................................................................................................129 FIGURE 4.5. HEALTHCARE PROVIDER STRATEGY - INPUTS...................................................................131 FIGURE 4.6. HEALTHCARE PROVIDER STRATEGY OUTPUTS.................................................................134 FIGURE 4.7. FEEDBACK LOOP TO HEALTHCARE PROVIDER STRATEGY ................................................135 FIGURE 4.8. PRACTICE GUIDELINES INPUTS AND OUTPUTS..................................................................137 FIGURE 4.9. PATIENT JOURNEY MODEL INPUTS....................................................................................140 FIGURE 4.10. PATIENT JOURNEY MODEL OUTPUTS..............................................................................143 FIGURE 4.11. PATIENT JOURNEY MODEL FEEDBACK LOOP..................................................................145 FIGURE 4.12. WORKFLOW INPUTS AND OUTPUTS.................................................................................147 FIGURE 4.13. DECISION SUPPORT SYSTEM RELATIONSHIPS..................................................................148 FIGURE 4.14. DECISION SUPPORT SYSTEM OUTPUTS SUPPORTING CONTINUOUS PROCESS
IMPROVEMENT..............................................................................................................................150 FIGURE 5.1. LEAN VALUE STREAM MAP LAYERS.................................................................................162 FIGURE 5.2. EXAMPLE VALUE STREAM MAP ICONS AND ASSOCIATED LAYER POSITIONING..............163 FIGURE 5.3 LEAN VALUE STREAM MAP – RMGP SUITABILITY ASSESSMENT - PAGE 1.......................164 FIGURE 5.4 LEAN VALUE STREAM MAP – RMGP SUITABILITY ASSESSMENT - PAGE 2.......................164 FIGURE 5.5 LEAN VALUE STREAM MAP – RMGP SUITABILITY ASSESSMENT - PAGE 3.......................165 FIGURE 5.6. TEMPLATE FOR A HIGH-LEVEL SIPOC DIAGRAM (ISIX SIGMA HEALTHCARE 2005).......167 FIGURE 5.7. TYPICAL SIX SIGMA PROCESS MAP SYMBOLS (BRUE AND HOWES 2006)........................168 FIGURE 5.8. SIPOC DIAGRAM OF RMGP SUITABILITY ASSESSMENT..................................................168
vi
FIGURE 5.9 SIX SIGMA PROCESS MODEL – RMGP SUITABILITY ASSESSMENT P.1 ..............................169 FIGURE 5.10 SIX SIGMA PROCESS MODEL – RMGP SUITABILITY ASSESSMENT P.2 ............................169 FIGURE 5.11 ARIS BUSINESS PROCESS MODEL NOTATION (SCHEER 1998) ........................................171 FIGURE 5.12 ARIS BUSINESS PROCESS MODEL – RMGP SUITABILITY ASSESSMENT.........................171 FIGURE 5.13. AN EXAMPLE OF THE NOTATION FOR A BUSINESS PROCESS DIAGRAM (OBJECT
MANAGEMENT GROUP 2006).......................................................................................................174 FIGURE 5.14 BPMN – RMGP SUITABILITY ASSESSMENT - PAGE 1......................................................175 FIGURE 5.15 BPMN – RMGP SUITABILITY ASSESSMENT - PAGE 2......................................................176 FIGURE 5.16 BPMN – RMGP SUITABILITY ASSESSMENT - PAGE 3......................................................176 FIGURE 6.1. A MULTIDIMENSIONAL PATIENT JOURNEY MODELING CONCEPTUAL DESIGN (PJM2) ....189 FIGURE 7.1. PAJMA LAYERS AND DESCRIPTION....................................................................................209 FIGURE 7.2. PATIENT AND STAFF ROLE LAYER OBJECTS.....................................................................210 FIGURE 7.3. PATIENT MOVEMENT AND STAFF ROLE LAYER EXAMPLE FROM MIDWIFERY CASE STUDY
......................................................................................................................................................211 FIGURE 7.4. PATIENT JOURNEY MODELING TOOL – BASIC PROCESS ICONS.........................................212 FIGURE 7.5. EXAMPLE OF INFORMATION CREATION/UPDATE LAYER ICONS.......................................213 FIGURE 7.6. PATIENT NEEDS/CLINICAL GUIDELINES/POLICY LAYER OBJECTS...................................214 FIGURE 7.7. MEASUREMENT ICONS WITHIN PAJMA..............................................................................216 FIGURE 7.8. MEASUREMENT EXAMPLES FROM MIDWIFERY CASE STUDY ...........................................218 FIGURE 7.9. EXAMPLE OF MEASUREMENT ROW TOTALS......................................................................218 FIGURE 7.10. PARALLEL PROCESS EXECUTION (CONVERGING TO SAME EXIT PROCESS) ......................219 FIGURE 7.11. PARALLEL PROCESS EXECUTION (DIFFERENT EXIT PROCESSES) .....................................220 FIGURE 7.12. PARALLEL PROCESS MODEL DEFINITION DELINEATED WITH A VERTICAL BOLD BLACK
LINE..............................................................................................................................................221 FIGURE 7.13. CONDITIONAL PROCESS EXECUTION (WITH SOME PARALLELISM) ..................................222 FIGURE 7.14. CONVERGENCE OF CONDITIONAL PROCESSES.................................................................222 FIGURE 7.15. PJM SHOWING A RECOGNISED CARE HANDOVER...........................................................223 FIGURE 7.16. PJM SHOWING A DISCONTINUITY OF CARE.....................................................................224 FIGURE 7.17. HORIZONTAL SLICE OF CURRENT PATIENT JOURNEY (SHOWING ONLY 3 LAYERS).......225 FIGURE 7.18 VERTICAL SLICE OF CURRENT PATIENT JOURNEY MODEL ..............................................226 FIGURE 7.19. BASIC CONTEXT DIAGRAM NOTATION (CONSTANTINE AND YOURDON 1979)..............229 FIGURE 7.20. CONTEXT DIAGRAM SHOWING SCOPE OF PATIENT JOURNEY MODELING ACTIVITY .....229 FIGURE 7.21. RMGP CURRENT PATIENT JOURNEY MODEL - P.1..........................................................232 FIGURE 7.22. RMGP CURRENT PATIENT JOURNEY MODEL - P.2..........................................................233 FIGURE 7.23. RMGP CURRENT PATIENT JOURNEY MODEL - P.3..........................................................234 FIGURE 7.24. RMGP FUTURE PATIENT JOURNEY MODEL - P.1 ............................................................244 FIGURE 7.25. RMGP FUTURE PATIENT JOURNEY MODEL - P.2 ............................................................245 FIGURE 7.26. RMGP FUTURE PATIENT JOURNEY MODEL - P.3 ............................................................246 FIGURE 8.1. THE PATIENT JOURNEY MODELING META-METHODOLOGY (PJM3).................................257 FIGURE 8.2. LOGICAL TO PHYSICAL MODEL RELATIONSHIP.................................................................258 FIGURE 8.3. A MULTIDIMENSIONAL PATIENT JOURNEY MODELING CONCEPTUAL DESIGN (PJM2)....267 FIGURE 8.4. STAR SCHEMA FOR A MANAGEMENT DECISION SUPPORT SYSTEM FOR HEALTHCARE
IMPROVEMENT MONITORING.......................................................................................................283 FIGURE 8.5. MULTI-DIMENSIONAL DATABASE DESIGN FOR MDSS - DIMENSION TABLE ATTRIBUTES
......................................................................................................................................................287 FIGURE 8.6. PATIENT JOURNEY PROCESS ENACTMENT FACT TABLE ATTRIBUTES..............................291 FIGURE 8.7. EXAMPLE SQL QUERY.......................................................................................................293
vii
Tables TABLE 1.1. DESIGN AND PROCESS MODELING METHODOLOGIES INCLUDED IN THIS RESEARCH..........28 TABLE 5.1. PROCESS MODELING ASSESSMENT RESULTS......................................................................178 TABLE 7.1. EXAMPLE PATIENT JOURNEY MEASUREMENT TYPES.........................................................217 TABLE 7.2. UNIQUE IDENTIFIERS FOR MEASUREMENTS WITHIN THE SAME CATEGORY ......................217 TABLE 7.3. CASE STUDY MEASUREMENT TYPES..................................................................................231 TABLE 7.4. CASE STUDY MEASUREMENT CODES AND STAFF ROLES...................................................231 TABLE 7.5. FUTURE PATIENT JOURNEY MEASUREMENT SUMMARY ....................................................250 TABLE 7.6. PAJMA ASSESSMENT RESULTS...........................................................................................253 TABLE 8.1. BALANCED SCORECARD MEASUREMENT DETAILS FOR 'EVALUATE PATIENT SUITABILITY '
......................................................................................................................................................261 TABLE 8.2. WFMC INTERFACE 5 XML VERSION - INITIAL PATIENT SUITABILITY ASSESSMENT
(ADAPTED FROM (MCGREGOR 2002))..........................................................................................266 TABLE 8.3. PATIENT JOURNEY DIMENSION MINIMUM DATA ELEMENT SET AND EXAMPLE................269 TABLE 8.4. PROCESSES WITHIN A PATIENT JOURNEY MINIMUM DATA ELEMENT SET AND EXAMPLE270 TABLE 8.5. STRATEGIC OBJECTIVES DIMENSION MINIMUM DATA ELEMENT SET AND EXAMPLE.......272 TABLE 8.6. HUMAN RESOURCES DIMENSION MINIMUM DATA ELEMENT SET AND EXAMPLE.............273 TABLE 8.7. PHYSICAL RESOURCES DIMENSION MINIMUM DATA ELEMENT SET AND EXAMPLE .........274 TABLE 8.8. PATIENT NEEDS DIMENSION MINIMUM DATA ELEMENT SET AND EXAMPLE....................275 TABLE 8.9. PRACTICE GUIDELINES DIMENSION MINIMUM DATA ELEMENT SET AND EXAMPLE.........277 TABLE 8.10. ADMINISTRATION DIMENSION MINIMUM DATA ELEMENT SET AND EXAMPLE ...............277 TABLE 8.11. TECHNOLOGY SUPPORT DIMENSION MINIMUM DATA ELEMENT SET AND EXAMPLE .....278 TABLE 8.12 EXAMPLES OF GENERIC PATIENT JOURNEY METRICS.......................................................280 TABLE 8.13. MEASUREMENT DIMENSION MINIMUM DATA ELEMENT SET AND EXAMPLE ..................281 TABLE 8.14. ORGANISATIONAL STRUCTURE DIMENSION MINIMUM DATA ELEMENT SET AND EXAMPLE
......................................................................................................................................................281 TABLE 8.15. ORGANISATIONAL STRUCTURE REFERENCE TABLE .........................................................286 TABLE 8.16. DATA ELEMENTS IN THE FACT TABLE ..............................................................................293
Abbreviations
viii
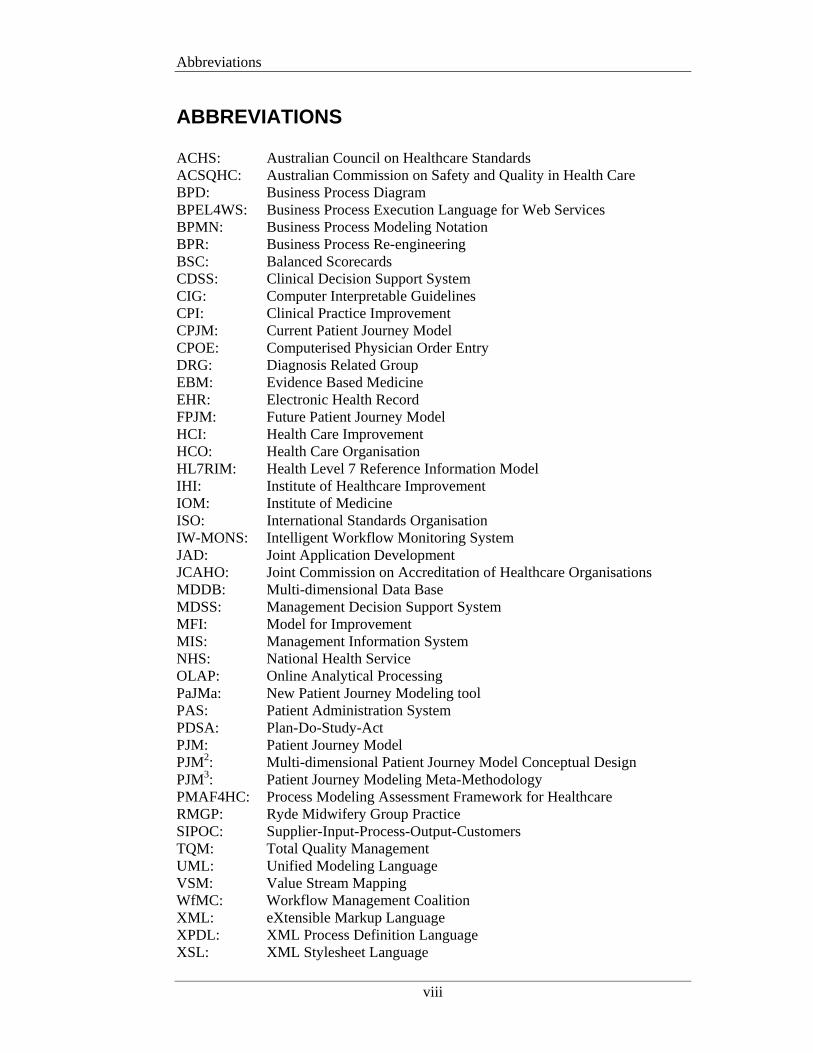
ABBREVIATIONS ACHS: Australian Council on Healthcare Standards ACSQHC: Australian Commission on Safety and Quality in Health Care BPD: Business Process Diagram BPEL4WS: Business Process Execution Language for Web Services BPMN: Business Process Modeling Notation BPR: Business Process Re-engineering BSC: Balanced Scorecards CDSS: Clinical Decision Support System CIG: Computer Interpretable Guidelines CPI: Clinical Practice Improvement CPJM: Current Patient Journey Model CPOE: Computerised Physician Order Entry DRG: Diagnosis Related Group EBM: Evidence Based Medicine EHR: Electronic Health Record FPJM: Future Patient Journey Model HCI: Health Care Improvement HCO: Health Care Organisation HL7RIM: Health Level 7 Reference Information Model IHI: Institute of Healthcare Improvement IOM: Institute of Medicine ISO: International Standards Organisation IW-MONS: Intelligent Workflow Monitoring System JAD: Joint Application Development JCAHO: Joint Commission on Accreditation of Healthcare Organisations MDDB: Multi-dimensional Data Base MDSS: Management Decision Support System MFI: Model for Improvement MIS: Management Information System NHS: National Health Service OLAP: Online Analytical Processing PaJMa: New Patient Journey Modeling tool PAS: Patient Administration System PDSA: Plan-Do-Study-Act PJM: Patient Journey Model PJM2: Multi-dimensional Patient Journey Model Conceptual Design PJM3: Patient Journey Modeling Meta-Methodology PMAF4HC: Process Modeling Assessment Framework for Healthcare RMGP: Ryde Midwifery Group Practice SIPOC: Supplier-Input-Process-Output-Customers TQM: Total Quality Management UML: Unified Modeling Language VSM: Value Stream Mapping WfMC: Workflow Management Coalition XML: eXtensible Markup Language XPDL: XML Process Definition Language XSL: XML Stylesheet Language

Abstract
ix
ABSTRACT The 1999 United States Institute of Medicine (IOM) report ‘To err is human:
Building a safer health system’ resulted in huge public attention on the crisis in the
US health care system and the apparent lack of patient safety. The IOM’s
subsequent report, ‘Crossing the quality chasm: A new health system for the 21st
century’ was released in 2001 and outlined six (6) overarching ‘Aims for
Improvement’. It stated healthcare must be redesigned to be: Safe; Effective;
Patient-Centered; Timely; Efficient and Equitable.
These six aims have formed the basis for change programs not only in the US but
healthcare delivery systems worldwide. This is demonstrated by the number of
countries that have nominated healthcare improvement (HCI) as a priority issue and
the allocation of substantial federal budgets for quality improvement initiatives in
countries such as Australia, the United Kingdom, Canada and the United States.
The focus on patient safety and the delivery of improved health care has seen many
organisations initiating improvement projects aimed at redesigning the delivery of
healthcare and in particular, the patient’s journey. Patient Journey Modeling is a
patient-centric activity that details a patient’s progress through a healthcare system
for a given service. The goal of Patient Journey Modeling (PJM) is to improve
health care quality by eliminating unproductive work and reducing variability within
the care process.
The original contributions of this thesis enhance the field of healthcare improvement
by providing new constructs for the conduct of patient journey modeling projects.
More importantly the major contributions of this research provide practical tools that
can be used by healthcare staff with little or no previous process improvement
experience to improve the consistency and quality of outcomes for patient journey
redesign initiatives. Significant research contributions are made in five areas:
1. Provision of a domain specific improvement architecture;
2. An assessment framework for process modelling tools;
3. A Multi-dimensional Patient Journey Modeling Conceptual Design;
Abstract
x
4. A new healthcare specific patient journey modelling tool;
5. Improved technology support for patient journey modelling.
The Patient Journey Modeling Meta-Methodology (PJM3) delivers an overarching
architecture on which to base healthcare improvement initiatives well beyond any
currently in existence. PJM3 allows for the definition of the healthcare provider
strategy, in the form of Balanced Scorecards, and for these to be explicitly linked
with operational process changes. PJM3 also accommodates the inclusion of relevant
legislation/policies and accreditation requirements, practice guidelines and patient
needs into the process modeling activities.
PJM3 and the Assessment Framework provided a foundation for the development of
a new patient journey modeling tool designed specifically for the healthcare domain.
The original patient journey modeling tool, PaJMa (pronounced ‘pajama’), explicitly
includes a number of new dimensions not previously catered for, namely the
inclusion of practice guidelines and patient needs. These dimensions are
accommodated in PaJMa through the use of an innovative multi-layered modeling
approach.
The research concepts and tools presented in this work are demonstrated via their
application in an Australian primary care maternity service.
Case study results show that the new tools and techniques:
• allow for the rapid development of patient journey models that are easy to
understand,
• enable ready recognition of areas of potential care variability,
• encourage disparate stakeholder communication,
• promote ownership of problems and their solutions, and
• allow for simple identification of required action plans.
Keywords: patient journey, patient journey model, patient flow, healthcare
improvement, healthcare redesign, process modelling.
Introduction
1
CHAPTER 1 INTRODUCTION
Health care is a highly complex system with many broken parts. The good news
is that for every broken part in our system, there are remarkable examples of
excellence — organizations that have overcome enormous obstacles to
redesign the way patient care is delivered (IHI 2004, p.1).
Currently all healthcare process improvement initiatives are using patient journey
modeling techniques from non-healthcare domains such as manufacturing,
computing or business. In many cases healthcare improvement projects are using the
constructs of these techniques as they were originally proposed and are faced with
being unable to capture all of the design features required to deliver high quality
patient-centric journeys that are safe, effective, timely and efficient.
This thesis presents an improvement architecture, in the form of a meta-
methodology, aimed at addressing this significant issue – the lack of a patient
journey modeling framework, designed specifically for healthcare. The architecture
accommodates the particular nuances and inherent complexities associated with the
redesign of patient-centric healthcare processes including performance measurement
and feedback to management, thus promoting a culture of continuous process
improvement.
The thesis will demonstrate the development of an original patient journey modeling
meta-methodology supported by an innovative patient-centric patient journey
modeling tool and an accompanying performance measurement database design for
management decision support, all expressly designed for the healthcare domain.

Introduction
2
Specifically this work is about the improvement of work practices to achieve reduced
care variability and higher quality outcomes thus delivering better results to patients
at lower costs. This includes using best-practice guidelines, eliminating unnecessary
bureaucracy, streamlining and minimising handovers between and across caregivers,
improving IT support for workflows and information storage and retrieval, providing
the right information to the right people at the right time, eliminating unnecessary
work, reducing superfluous controls, empowering employees and getting it right the
first time.
This research deals primarily with modeling the manner in which healthcare is
delivered, that is ‘the system of care’. The underlying premise is that each aspect of
clinical care is made up of multiple processes and combining these processes creates
the ‘system of care’ for that particular task. Therefore unless one changes and
improves the system there will not be an improvement in results, that is, outcomes.
Berwick’s (1996) Central Law of Improvement states that “every system is perfectly
designed to achieve the results it achieves”. This law implies that improvement in
performance is not a matter of effort or just trying harder, but rather requires changes
to the system of care (Berwick 1996; Wilson and Harrison 2002). Models based on
these principles provide a framework to reduce the variability of care by helping to
understand the relative significance of any one or related group of variables
contributing to patient outcomes. Models also assist in building consensus among
healthcare workers, as well as in the planning of interventions and improvements
(Camann 2001).
Modeling of the multiple dimensions that contribute to the entire journey
experienced by a patient within and across Health Care Organisation/s (HCOs) and
the inherent complexity of their inter-relationship influences three specific aspects of
the health care system (Donabedian 2005; Friedman and Wyatt 2006):
1. Structure of the health care system, including its environment, available
equipment, required budgets and the number, skills and inter-relationships of
staff.
2. Processes that take place during healthcare activity including clinical,
administrative and management activities.
Introduction
3
3. Outcomes of health care for both individual patients and the community and
the ongoing reputation and quality of care delivered by the health care
provider and its staff.
The goal of patient journey modeling therefore is not the improvement of only one of
these aspects at the expense of the others but the delivery of quality improvements in
all three areas. This is achieved by taking a holistic approach to the patient journey
modeling exercise via the consideration of multiple layers of information as included
in the new patient journey modeling suite of tools developed as part of this research.
Several terms are used in the literature to refer to the concept of patient journey
modeling (PJM) including: clinical pathways, optimising patient flow, clinical
practice improvement and redesigning healthcare (NSW Department of Health 2002;
IHI 2003; Haraden and Resar 2004; Szwarcbord 2005; UK Department of Health
2005; Jensen et al. 2006). This research uses the term ‘patient journey’ to include
not only the flow or implementation of improved clinical practice but to encompass
the complete spectrum of a patient’s experience for a given service.
Patient Journey Modeling is a patient-centric activity that details a patient’s progress
through a healthcare system for a given service (NHS Modernisation Agency 2005;
NHS Modernisation Agency 2005). Patient Journey Modeling (PJM) aims to
improve patient safety and overall health care quality by reducing variability in the
care process. It involves the analysis of the overall processes involved with the
movement of a patient through a healthcare system, typically a hospital, and then
analysing how this journey can be improved via:
• the removal of unproductive and excessive activities,
• the removal of process duplication,
• the introduction of evidence-based best practice,
• collecting required information only once,
• reducing the number of times a patient is moved,
• the application of integrated information technology and
Introduction
4
• improved communications between the patient, their carers and the clinicians
involved with the journey itself.
(Sackett et al. 1996; IHI 2003; Curry and McGregor 2005; NHS Modernisation
Agency 2005; NHS Modernisation Agency 2005).
All of this information is bought together in the form of a graphical process model or
in healthcare terms a ‘Patient Journey Model’.
Patient Journey Models focus on the processes that a patient is involved with as they
move through the HCO. A process is a continuous series of tasks, undertaken for the
purposes of creating a specific output. The starting point and final output of the
process should be as requested and used by either internal or external customers.
Processes are the enabler of the organisations value chain and should focus on the
customers output needs (Scheer 1998).
The Workflow Management Coalition defines a business process as:
A set of one or more linked procedures or activities which collectively realize
a business objective or policy goal, normally within the context of an
organizational structure defining functional roles and relationships (WfMC
1999, p.10).
It goes onto define business process definition as:
The representation of a business process in a form which supports automated
manipulation, such as modeling or enactment by a workflow management
system. The process definition consists of a network of activities and their
relationships, criteria to indicate the start and termination of the process,
and information about the individual activities, such as participants,
associated IT applications and data (WfMC 1999, p.11).
It follows that Business Process Re-design is the alignment of a company’s processes
to the needs and requirements of the market and includes the design, analysis and
optimisation of processes as part of the continuous improvement loop (Hammer and
Champy 1993; Scheer 1998).

Introduction
5
This indicates that modeling the patient’s journey through a HCO cannot be
conducted in a vacuum. Several contributing dimensions must also be considered
and incorporated into the final workflow.
This is never more so important than in healthcare where ‘success’ depends mostly
on the skills of the healthcare workers and their application of these skills in the
given environment. The identification and inter-relationship of the tangible and
intangible assets (contributing dimensions) of a given HCO must be captured and
incorporated into the development of the overall patient journey modeling
framework.
Dimensions identified as impacting the patient journey include:
• The healthcare provider strategy as affected by Government
legislation/Accreditation/Provider Policy;
• The human and physical resource availability/needs;
• The Patient’s needs;
• Best practice guidelines;
• Administration requirements and procedures;
• Technological support;
• Organisational structure and;
• The metrics associated with measuring change in each of the above.
Seila (2005) suggests that developing health care models requires health system
managers and care givers to collaborate with modelers. However he points out that
this can be difficult due to the different cultures and values held by both groups.
This necessitates a cross-discipline approach as employed by this research. The
proposed work brings together several complimentary domains including
information technology, organisational management and social science.
Research investigations focused on strategic objective development and balanced
scorecards, process reengineering and modeling, workflow and workflow
management systems, decision support systems, and socio/cultural assessment
systems.
Introduction
6
The innovative meta-methodology presented in this research is known as PJM3 (the
Patient Journey Modeling Meta-Methodology). The implementation of this new
construct is supported by PJM2 (the Multi-dimensional Patient Journey Modeling
Conceptual Design) and PaJMa (a healthcare specific Patient Journey Modeling
tool).
This suite of healthcare improvement tools uses Balanced Scorecards, as adapted by
the Ontario Hospital Association, to define the Health Care provider strategy.
Patient Needs assessments are used to highlight and analyse the patient population’s
particular needs and circumstances. Relevant Practice Guidelines are identified and
used as input to reducing care variability. These inputs are considered during the
development of the patient journey models, which are built using ‘best-of-breed’
process reengineering and modeling techniques. Workflow systems are used to
enact and monitor the defined patient journey, the movement of information within
the organisational structure and the adherence to legislation, policy and professional
body guidelines. Performance to targets is monitored and evaluated by decision
support systems incorporating a feedback loop to the healthcare provider strategy.
More specifically contributions are made via the use of innovative techniques that
help to visualise how a patient moves through the entire system (not just one
department), bringing together the multiple dimensions required to improve patient
flow at a holistic level and highlighting areas of waste and duplication at their
source. In addition the new techniques provide a common base for all stakeholders
thus encouraging interaction from all levels and types of stakeholders including
patients and clinicians, promoting action plan ownership and supporting the
definition of specifications for integrated information systems. The research also
provides for the definition of the performance monitoring and evaluation criteria
required for the development of the decision support systems that will provide
feedback to management thus promoting a continuous process improvement culture.
The combination of these items within the meta-methodology enables links between
the contributing areas to be established and the impact of their relationship and inter-
action to be monitored, evaluated and (if needed) further improved.
Introduction
7
The framework that forms part of the meta-methodology’s patient journey modeling
component provides explicit dimensions that must be analysed and evaluated for
their impact on the current and future patient journey. This provides succinct
direction to the model creators and concrete justification of recommended changes to
the current patient journey for management.
The remainder of this introductory chapter will highlight the issues and limitations
relating to current healthcare process improvement methods and modeling
techniques. These limitations lead to a discussion on the motivations for this
research resulting in the definition of the research aims. Contributions to the
knowledge domain follow along with an outline of the overall thesis structure.
1.1 Limitations of Process Modeling Methods for Patient Journey Redesign
Taking a holistic view of the patient journey shifts the improvement focus from the
individual healthcare worker to all involved stakeholders and the system of care
itself. Therefore improvement methods based on overall process improvement have
a higher chance of success than those based on the ‘exhortation of individuals to try
harder or to avoid error’ (Wilson and Harrison 2002).
Business Process Re-design and Modeling is the alignment of a company’s processes
to the needs and requirements of the market and includes the design, analysis and
optimisation of those processes as part of a continuous improvement loop. This
involves three primary tasks:
• The capture of target customer requirements and critical success factors.
• The definition of the ‘warts-and-all’ current process flow.
• The re-alignment of existing business processes to the current demands of the
market.
For all tasks, a method-based approach and a unified description language are
essential. Questions such as “Who does what, in what sequence, what services are
provided and which software systems are used in the process?” are critical.
Introduction
8
As part of the process analysis, organisational, structural and technological weak
points in the processes are revealed and improvement potential is identified.
The results of the analysis, combined with the corporate goals, are used to derive
target processes, i.e. those processes that will in future help the company to create
value (Hammer and Champy 1993; Scheer 1998).
Additional reasons for using process models are wide and varied and include (Scheer
1998):
• Optimisation of organisational change
• Capture and storage of corporate knowledge
• Production and utilisation of process documentation for ISO standard and
other quality certifications
• Calculation of the cost of business processes
• Leverage of process information to implement and customise standard
software solutions for workflow systems.
Such research indicates that a comprehensive process modeling method must
consider not only the operational processes but also their link to the organisational
strategy, workflow automation, integrated technology support and communication
mechanisms for evaluating improvements. This is compounded in healthcare by
further requirements to incorporate patient needs, practice guidelines and high levels
of specialist knowledge into the mix.
To date the Healthcare domain lacks a design and modelling methodology
specifically designed to support the requirements for redesigning patient journey
practices from a patient-centric perspective. In addition, most of the current methods
lack the facilities to align changes with the healthcare provider strategy or produce
new process outputs that are appropriate for automated workflows or performance
measurement by decision support systems.
During the 1990’s process modeling techniques began to emerge in the
manufacturing, business and computing fields (Womack et al. 1990; Booch 1994;
Leymann and Altenhuber 1994; Scheer 1999).
Introduction
9
Today there are numerous process modeling methods/techniques available but only a
limited number are being endorsed for healthcare redesign and none have been
designed specifically for the healthcare domain. In fact all projects thus far have
adopted methodologies from other disciplines namely: business, manufacturing and
computing (Heyamoto 2002; Browne et al. 2003; Wysocki Jr 2004; Young et al.
2004; Bassham 2005; Ben-Tovim 2005; Gospodarevskaya et al. 2005; Gowland
2005; Schweiger et al. 2005) as an example. The four most commonly used process
modeling methods/techniques used in the projects referenced above were:
• Lean Thinking;
• Six Sigma;
• Flowcharts in the form of Swimlanes; and
• ARIS.
Of these the primary method employed in redesigning care processes is Lean
Thinking, a method developed to improve car manufacturing processes in Japan after
WWII (Womack et al. 1990; Womack and Jones 2003; IHI 2005; NHS
Modernisation Agency 2005). Lean Thinking is the tool of choice for the Institute of
Healthcare Improvement, the leader in the improvement of health care throughout
the world, and is promoted for use with their ‘Model for Improvement’ (MFI). The
MFI provides a framework for developing, testing and implementing changes that
lead to improvement and is the dominant healthcare improvement method in the
United States (IHI 2003; IHI 2005). The MFI is also the method of choice for the
UK’s NHS Institute for Innovation and Improvement, with this program also
supporting Lean Thinking as well as process maps in the form of flowcharts (NHS
Modernisation Agency 2005; NHS Modernisation Agency 2005). Lean Thinking
does not consider the organisation’s strategy or provide mechanisms for producing
workflow automation specifications. It also lacks the facility to relate identified
measurement criteria to appropriate database designs for performance evaluation.
Introduction
10
Such approaches mean that methods/techniques from non-medical fields have been
driving the majority of healthcare redesign activities and little new work has been
conducted on the development of new techniques or how the existing methodologies
being used can be enhanced to provide better support for the quality improvements
demanded of Healthcare systems worldwide.
Although process modeling techniques such as Lean Thinking and ARIS have
enhanced their process modeling software to include healthcare relevant icon
libraries, the basic constructs of the methods supporting the tools are unchanged.
This often sees the models becoming confused and sometimes very difficult to read.
Such issues reduce the chances of radical improvements as stakeholders become
bogged down with trying to understand the models themselves instead of being able
to concentrate on the real issue of redesigning the system of care.
Notwithstanding the software enhancements above, Lean Thinking and ARIS both
fail to incorporate patient needs, discontinuities of care or patient handovers. All
identified as critical to the delivery of safe, high quality healthcare (Committee on
Quality of Health Care in America 2001).
Introduction
11
1.2 Research Motivation
“Improved management of organizational processes can reduce the risk of
negative patient outcomes resulting from delays in the delivery of care,
treatment and services” (JCAHO 2004, p.1).
The focus on patient safety and the delivery of improved health care came to the fore
in 1999, when the United States Institute of Medicine (IOM) produced ‘To err is
human: Building a safer health system’. This report resulted in huge public attention
on the crisis in the US health care system and the apparent lack of patient safety.
The report suggested that as many as 98,000 people were dying each year in US
hospitals due to medical injuries, that is, injuries incurred during the patient’s
hospital stay (Kohn et al. 1999).
However, as early as 1995, a study into 14,000 hospital admissions in two Australian
States found that up to 16% of patients were killed or injured as a result of their
treatment rather than their original medical condition (Wilson et al. 1995). The then
Federal Health Minister stated in Parliament that if these figures were extrapolated to
a national level, that as many as 230,000 patients could be involved in preventable
adverse events with up to 14,000 of these being fatal (Goddard 2003).
Further work carried out by the IOM produced a second report, ‘Crossing the quality
chasm: A new health system for the 21st century’ which was released in 2001
(Committee on Quality of Health Care in America).
This report outlined a way forward for the US health system and outlined six (6)
overarching ‘Aims for Improvement’:
• SAFE: Avoid injuries to patients from the care that is intended to help them.
• EFFECTIVE : Match care to science; avoid overuse of ineffective care and
underuse of effective care.
• PATIENT-CENTERED: Honor the individual and respect choice.
• TIMELY: Reduce waiting for both patients and those who give care.
• EFFICIENT: Reduce waste.
• EQUITABLE: Close racial and ethnic gaps in health status.
Introduction
12
These six aims have formed the basis for change programs throughout the US health
system and the impetus for healthcare delivery reviews worldwide.
As an example in point, the Australian Federal Government spent in excess of $40
billion on the improvement of Health and Aged Care during the 2003-2004 financial
year. This equals 20% of the total Federal budget and equates to approximately
$2000- for every man, woman and child in this country (Abbott 2004). In addition
to Federal health funding, each State has allocated its own substantial Healthcare
budget to improve the quality of healthcare delivery (NSW Department of Health
2004; Queensland Department of Health 2004; South Australian Department of
Human Services 2004; Victorian Department of Human Services 2004; Western
Australia Department of Health 2005).
The significance of this issue is also acknowledged on the world stage as
demonstrated by countries such as the United Kingdom (HM Treasury 2004) and
Canada (Canadian Department of Finance 2004) who have nominated healthcare
improvement as a priority issue along with the allocation of substantial federal
budgets for quality improvement initiatives.
Unfortunately even with the increased professional and public awareness of this
problem, radical improvements do not abound. In fact recent studies by the Institute
for Healthcare Improvement (IHI) estimate that up to 15 million incidents of medical
harm still occur in U.S. hospitals each year (IHI 2006).
The Institute for Healthcare Improvement is a not-for-profit organisation leading the
improvement of health care throughout the world. Founded in 1991, IHI is a ‘catalyst
for change, cultivating innovative concepts for improving patient care and
implementing programs for putting those ideas into action’. Thousands of health care
providers, including many of the finest hospitals in the world, participate in IHI’s
groundbreaking work (IHI 2006).

Introduction
13
In December 2004, the IHI launched the 100,000 lives campaign. This campaign
sought to actively reduce the number of adverse deaths in U.S. hospitals. Using six
evidence-based interventions, healthcare professionals at more than 3000 care sites
in the U.S. averted over 122,000 patient deaths in an 18-month period. This
initiative represented the largest improvement effort ever undertaken by the health
care industry in recent history and indicates that removing process variability for a
given patient journey is an important activity that will assist in improving outcomes
(IHI 2004; Mitka 2006).
Continuing on from the 100,000 lives initiative and in a bid to further increase the
impetus for healthcare providers to improve services, the IHI announced, with the
support of prominent leaders in American health care, a new national campaign to
dramatically reduce incidents of medical harm in U.S. hospitals. Launched in
December 2006, “the ‘5 Million Lives Campaign’ asks hospitals to improve more
rapidly than before the care they provide in order to protect patients from five
million incidents of medical harm over a 24-month period, ending December 9,
2008” (IHI 2006, p.1). It is proposed that these targets will be met through the
introduction of 12 standardised care improvements in the participating hospitals (IHI
2006).
Such initiatives not only improve patient outcomes but also improve patient flow
through the system, as the correct treatment is being delivered the first time and ‘re-
work’ is being eliminated. This is supported by another IHI report: ‘Optimising
Patient Flow’, that states that “the key to improving flow lies in reducing process
variation that impacts flow”. It goes onto say that “while some variability is
normal, other variation is not and should be eliminated” (IHI 2003, p.1).
The focus on Patient Flow as a significant contributing factor to healthcare
improvement success reached critical mass on January 1 2005. On this date a new
Joint Commission “Leadership” Standard, LD.3.10.10, became effective for all
accredited hospitals in the U.S. This standard calls on “leaders to develop and
implement plans to identify and mitigate impediments to efficient patient flow
throughout the hospital”.

Introduction
14
Accompanying rationale states that “managing the flow of patients through their
(leaders) care is essential to the prevention of patient crowding, a problem that can
lead to lapses in patient safety and quality of care” and that “to understand the
system implications of the issues, leadership should identify all of the processes
critical to patient flow through the hospital system” (JCAHO 2004, p.14).
However, Resar (2006) suggests that the playing fields are not equal when
evaluating improvements in healthcare and non-healthcare domains. For example he
states that the focus on failure and the analysis of defects in industries such as
manufacturing is at a different level due to the fact that these types of industries are
already working with core processes that operate correctly more than 90% of the
time. Whereas in healthcare the baseline starting point for defective core processes
could be as high as 50%. This indicates that improvements will be possible using a
variety of process improvement methods and this is why we have seen some
successes with methods such as Lean Thinking and Six Sigma. It does not support
the premise however that the methods currently being employed provide the required
level of support for ongoing and all encompassing, healthcare system improvement.
Jensen et al. (2006) state that opportunities for healthcare improvement lie in taking
a “leadership approach that involves quality control and quality improvement and
incorporating it into the design, production, and operations of the healthcare
system” (p.67). They suggest that the top strategies for improving flow are derived
from the areas of quality improvement, information technology and clinical medicine
and that innovations with the highest impact are likely to occur where these three
domains overlap as shown in Figure 1.1.
The research addressed in this thesis accommodates each of these domains and one
of the key foci is the relationship and interactions between these and other identified
dimensions seen as critical success factors for patient journey modelling
improvement.
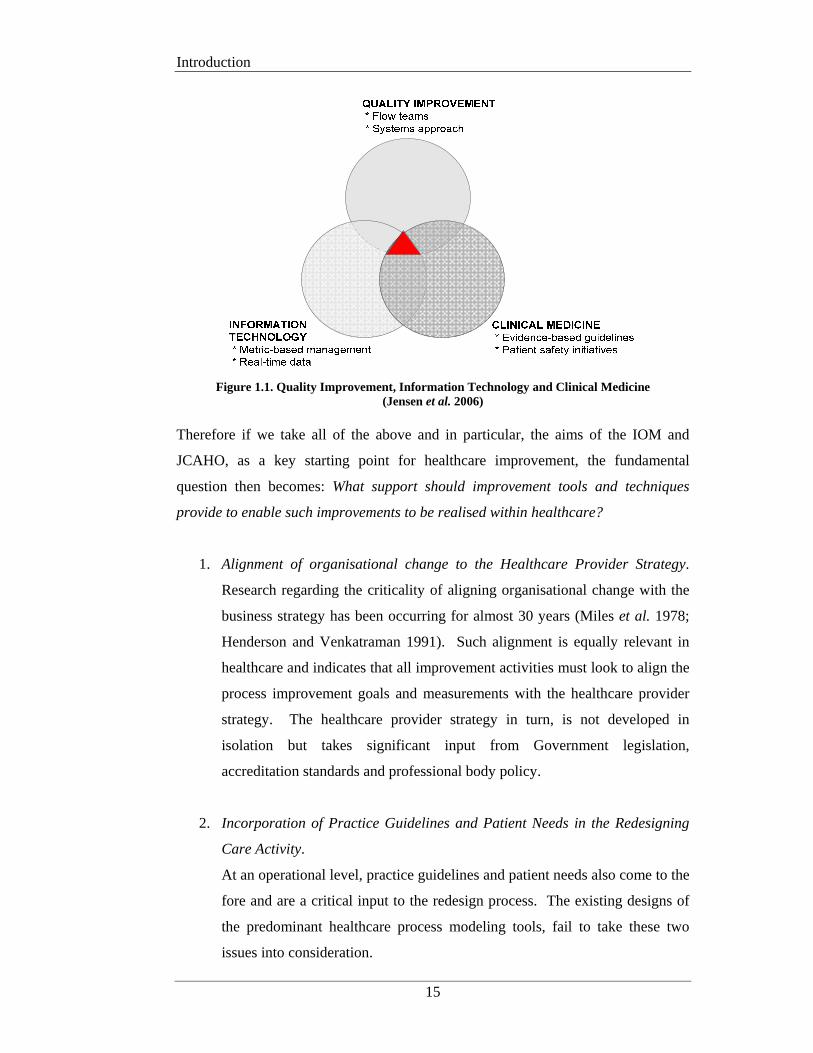
Introduction
15
Figure 1.1. Quality Improvement, Information Technology and Clinical Medicine
(Jensen et al. 2006)
Therefore if we take all of the above and in particular, the aims of the IOM and
JCAHO, as a key starting point for healthcare improvement, the fundamental
question then becomes: What support should improvement tools and techniques
provide to enable such improvements to be realised within healthcare?
1. Alignment of organisational change to the Healthcare Provider Strategy.
Research regarding the criticality of aligning organisational change with the
business strategy has been occurring for almost 30 years (Miles et al. 1978;
Henderson and Venkatraman 1991). Such alignment is equally relevant in
healthcare and indicates that all improvement activities must look to align the
process improvement goals and measurements with the healthcare provider
strategy. The healthcare provider strategy in turn, is not developed in
isolation but takes significant input from Government legislation,
accreditation standards and professional body policy.
2. Incorporation of Practice Guidelines and Patient Needs in the Redesigning
Care Activity.
At an operational level, practice guidelines and patient needs also come to the
fore and are a critical input to the redesign process. The existing designs of
the predominant healthcare process modeling tools, fail to take these two
issues into consideration.
Introduction
16
3. Provision of Appropriate System Support using Readily Available
Technology.
Process model outputs must also be cognisant of the requirements for
technological support for the automation of new workflows and performance
measurement and evaluation systems. Technology is a key enabler of
organisational change and existing process modeling tools used in healthcare
are deficient in their ability to develop flexible process output specifications.
This situation forms the foundation for this research work and has led to the
development of an original patient journey modeling meta-methodology that can be
used to assess the support provided by the tools and techniques chosen by healthcare
improvement teams or to develop new tools designed explicitly for the healthcare
domain. The meta-methodology is complimented by an accompanying tool suite,
which includes a new healthcare specific patient journey modeling tool. The research
further enhances the meta-methodology’s application through the provision of a
supporting database design for organisational learning and ongoing performance
monitoring and evaluation.
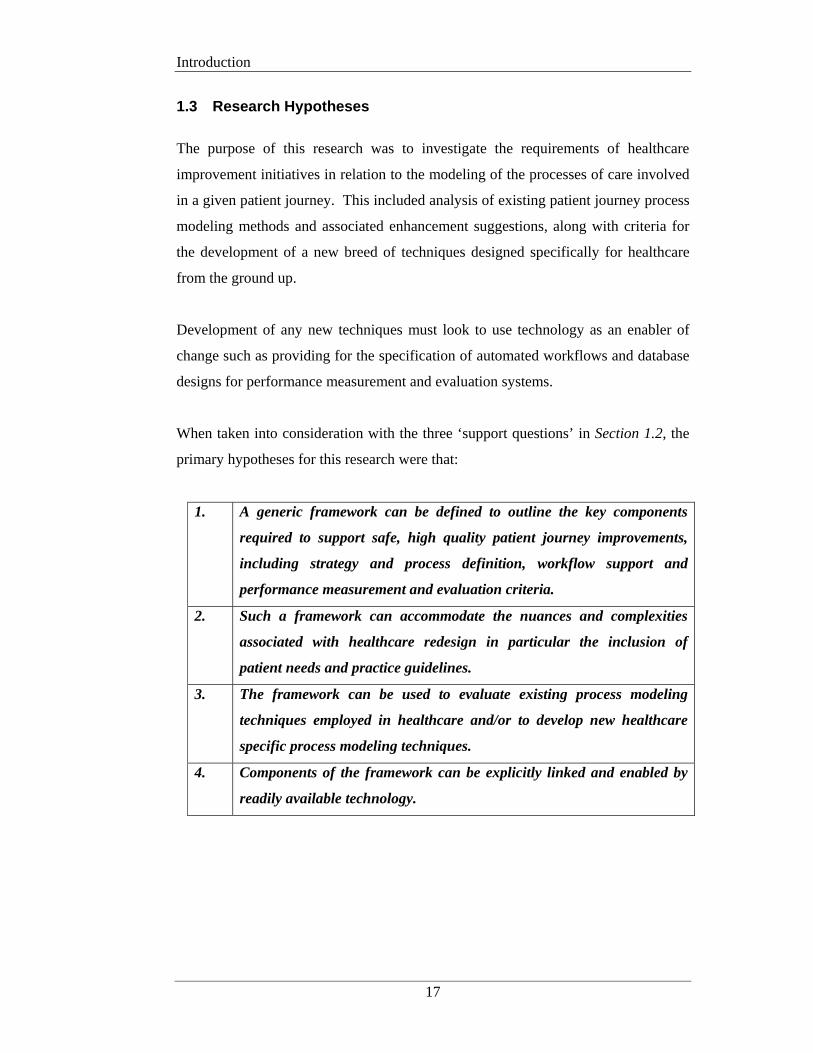
Introduction
17
1.3 Research Hypotheses
The purpose of this research was to investigate the requirements of healthcare
improvement initiatives in relation to the modeling of the processes of care involved
in a given patient journey. This included analysis of existing patient journey process
modeling methods and associated enhancement suggestions, along with criteria for
the development of a new breed of techniques designed specifically for healthcare
from the ground up.
Development of any new techniques must look to use technology as an enabler of
change such as providing for the specification of automated workflows and database
designs for performance measurement and evaluation systems.
When taken into consideration with the three ‘support questions’ in Section 1.2, the
primary hypotheses for this research were that:
1. A generic framework can be defined to outline the key components
required to support safe, high quality patient journey improvements,
including strategy and process definition, workflow support and
performance measurement and evaluation criteria.
2. Such a framework can accommodate the nuances and complexities
associated with healthcare redesign in particular the inclusion of
patient needs and practice guidelines.
3. The framework can be used to evaluate existing process modeling
techniques employed in healthcare and/or to develop new healthcare
specific process modeling techniques.
4. Components of the framework can be explicitly linked and enabled by
readily available technology.

Introduction
18
1.3.1 Specific Scope Exclusions
Simulation Modeling
The two main reasons for undertaking a process modeling project are to describe a
process flow or optimise an implementation solution. Optimised implementation
solutions require the process analysis to be supported by formal evaluation tools such
as simulation. This requires unambiguous parsable process descriptions that are far
too detailed for projects of a descriptive nature. This research focuses on process
modeling for descriptive purposes and as such process modeling for simulation
purposes (ie: Simul8) are outside the research scope.
Research on simulation modeling in healthcare is well covered in publications by
Brailsford (2005), Klein et al. and Harper and Gamlin (2003) as a small example.
Patient Volume Variability Analysis
Within the Healthcare Improvement domain there is a growing body of knowledge
concerning the statistical analysis of variations in patient traffic/volumes. These
works are focused on measuring and understanding peaks and troughs in patient
numbers over time. Techniques such as forecasting, demand-capacity management,
queuing theory and theory of constraints are well established in the service industry
and over recent years a number of healthcare improvement researchers have been
applying these techniques to patient flow problems with some good results. As this
research is focused on process modeling for the purposes of improving the system of
care, the statistical analysis of patient volumes and traffic variations is not within the
scope of this research.
Further information on smoothing patient traffic including the forecasting and
prediction of patient volume variations is well covered by leading Healthcare
Improvement researchers such as Litvak et al. (2005; 2005), Harper and Gamlin
(2003) and Jensen et al. (2006).
References to where this material can supplement the contributions of this research
will be made as appropriate.

Introduction
19
1.4 Research Contributions
The original contributions of this thesis enhance the field of healthcare improvement
by providing new theoretical constructs for the conduct of patient journey modeling
projects. More importantly the major contributions of this research provide practical
tools that can be used by healthcare staff with little or no previous process
improvement experience to improve the consistency and quality of outcomes for
patient journey redesign initiatives.
Contributions are made in the following areas:
PROVISION OF A DOMAIN SPECIFIC IMPROVEMENT
ARCHITECTURE:
Significantly the Patient Journey Modeling Meta-Methodology (PJM3) delivers an
overarching architecture on which to base healthcare improvement initiatives well
beyond any currently in existence. PJM3 allows for the definition of the healthcare
provider strategy, in the form of Balanced Scorecards, and for these to be explicitly
linked with operational process changes. PJM3 also accommodates the inclusion of
relevant legislation/policies and accreditation requirements, practice guidelines and
patient needs into the process modeling activities. Resulting process specifications
can be output to workflow management systems for automated workflow support.
Performance measurement criteria can be defined for inclusion in Decision Support
Systems thus providing facilities to evaluate process change and feedback results to
management for ongoing process improvement. The development of PJM3 provides
a solution to research hypotheses 1 and 2.
AN ASSESSMENT FRAMEWORK FOR PROCESS MODELING TOOLS:
PJM3 also establishes the basis for the development of a ‘Process Modeling
Assessment Framework for Healthcare’ (PMAF4HC or simply the Assessment
Framework) as required by research hypothesis 3. This allows healthcare
improvement managers to understand the limitations of the tools they are using so
that contingencies can be developed or new tools sourced.
Introduction
20
This framework was used to assess four process modeling techniques currently being
used for healthcare improvement and to suggest enhancements to those tools. The
Assessment Framework was also a significant contributor to the development of a
new patient journey modeling tool as discussed in a later point.
A MULTI-DIMENSIONAL CONCEPTUAL DESIGN FOR HEALTHCARE
IMPROVEMENT:
Using the core concepts of the improvement architecture above as a foundation, a
generic patient journey model design was developed. The Multi-Dimensional
Patient Journey Modeling Conceptual Design or PJM2 is abstracted directly from
PJM3, and provides a portal through which to view the complex environment of
healthcare improvement. PJM2 takes the multiple facets involved in redesign
projects and segments them into logical subject areas. Such a conceptualisation can
be used in a variety of areas either as a standalone tool or in combination with other
tools such as the Assessment Framework. Potential uses include evaluating existing
patient journey modeling tools, constructing new domain specific patient journey
modeling tools, developing models of the current and future patient journey and/or
selecting supporting technology. For example, when developing the future patient
journey model, each subject area can be considered as a single entity or combined
with another, depending on the audience involved and the processes being analysed.
This prevents those developing the models becoming overwhelmed with information
thus allowing them to focus on specific parts of the problem domain. In this way the
overall patient journey model is built up gradually over time therefore facilitating
progressive understanding of the entire journey continuum.
The development of PJM2 provides additional support for the resolution of research
hypotheses 1, 2 and 3.
A NEW HEALTHCARE SPECIFIC PATIENT JOURNEY MODELING
TOOL:
This research contribution used PJM3, the Assessment Framework and PJM2 as the
benchmark for the development of a new patient journey modeling tool designed
specifically for the healthcare domain.
Introduction
21
The new patient journey modeling tool, PaJMa (pronounced ‘pajama’), explicitly
accommodates a number of new dimensions not previously catered for, namely the
inclusion of practice guidelines and patient needs. Patient needs and practice
guidelines are included in PaJMa through the use of a multi-layered process
modeling approach. Colour-coding is used to differentiate the contributing layers,
allowing stakeholders to readily identify the myriad of different components
associated with redesigning the patient journey at a holistic level.
The tool also introduces innovative techniques for visualising patient flow problems
from a multi-dimensional perspective, allowing the patient journey to be ‘sliced and
diced’, that is developed and viewed from a variety of perspectives, thus providing
for diverse stakeholder input and discussion.
The development of the PaJMa tool addresses research hypotheses 2 and 3.
IMPROVED TECHNOLOGY SUPPORT FOR PATIENT JOURNEY
MODELING:
In response to hypothesis 4, the healthcare provider strategy can be defined using
Balanced Scorecards with each Scorecard perspective being specified using the
Balanced Scorecard XML standard (Balanced Scorecard Collaborative 2001). XML
is a widely available markup language used for information delivery across disparate
applications and can remove many of the technology and software barriers that
currently exist when transferring performance management and strategy related
information between applications and across enterprises. XML in the form of the
Workflow Management Coalition’s (WfMC) XML process definition language
(XPDL) (WfMC 2005) can also be used to specify workflow requirements as
identified during new patient journey analysis activities. This facilitates the
automation of required workflows in any XML compatible workflow management
system. To accommodate all of the dimensions included in PaJMa, extensions to the
BSC XML and WfMC XPDL were required. Proposed extensions were developed
and are described, along with relevant examples from the case study, in Appendices
B and C respectively.
Introduction
22
PJM2 also provides the foundation for the development of an original multi-
dimensional database design supporting the capture of performance measurement
and evaluation criteria. Such criteria can be implemented as part of a Management
Decision Support System (MDSS) to assist organisational learning and to assess the
degree of improvement that can be attributed to process changes made as a result of
new patient journey model implementations. MDSS outputs can also be used by
management as justification for ongoing process improvements and provide a
feedback loop to the healthcare provider strategy.
In summary the new meta-methodology (PJM3) presents an innovative
multidimensional healthcare improvement architecture that allows for the inclusion
of the healthcare provider strategy in the form of Balanced Scorecards, along with
the ability to accommodate relevant legislation/accreditation requirements, practice
guidelines and patient needs. The meta-methodology formed the foundation for the
development of a new Assessment Framework that can be used to evaluate existing
process modeling tools or to develop new patient journey modeling tools. PJM3 was
also used as the benchmark for the abstraction of a patient journey modeling
conceptual design. This conceptual design known as PJM2, provides a
straightforward technique for dividing the complexities of patient journey modeling
projects into manageable dimensions that can be integrated over time. These
contributions led to the development of a new healthcare specific patient journey
modeling tool, PaJMa. The PaJMa tool provides an innovative approach to the
graphical representation of the system of care and is supported by an original
database design that facilitates performance measurement of implemented changes in
the form of a Management Decision Support System. Outputs from the patient
journey modeling tool also provide process definitions that can be used as direct
input to workflow automation activities that are explicitly linked and enabled by
readily available technology.

Introduction
23
The above contributions provide solutions to the research hypotheses posed in
section 1.3 as follows:
1. A meta-methodology (PJM3) facilitating the definition of safe, high quality
patient journey improvements can be developed. The meta-methodology can
specifically accommodate the healthcare provider strategy, practice
guidelines, patient needs, patient journey processes, related workflows and
performance measurement criteria.
2. An assessment framework for the purposes of evaluating the effectiveness of
existing process modeling techniques can be developed. The meta-
methodology and assessment framework can also be used to develop new
healthcare specific process modeling tools.
3. A multi-dimensional conceptual design (PJM2) can be abstracted from the
meta-methodology thus providing a straightforward technique for
segmenting the complexities associated with the definition of high quality
future patient journeys.
4. Practice guidelines and patient needs can be explicitly included in patient
journey models through the introduction of a multi-layered modeling
approach as in PaJMa.
5. Components of the meta-methodology, in particular ‘healthcare provider
strategy’ to ‘process’ and ‘process’ to ‘workflow’ and ‘performance
measurement’ can be explicitly linked using readily available technology
such as XML.
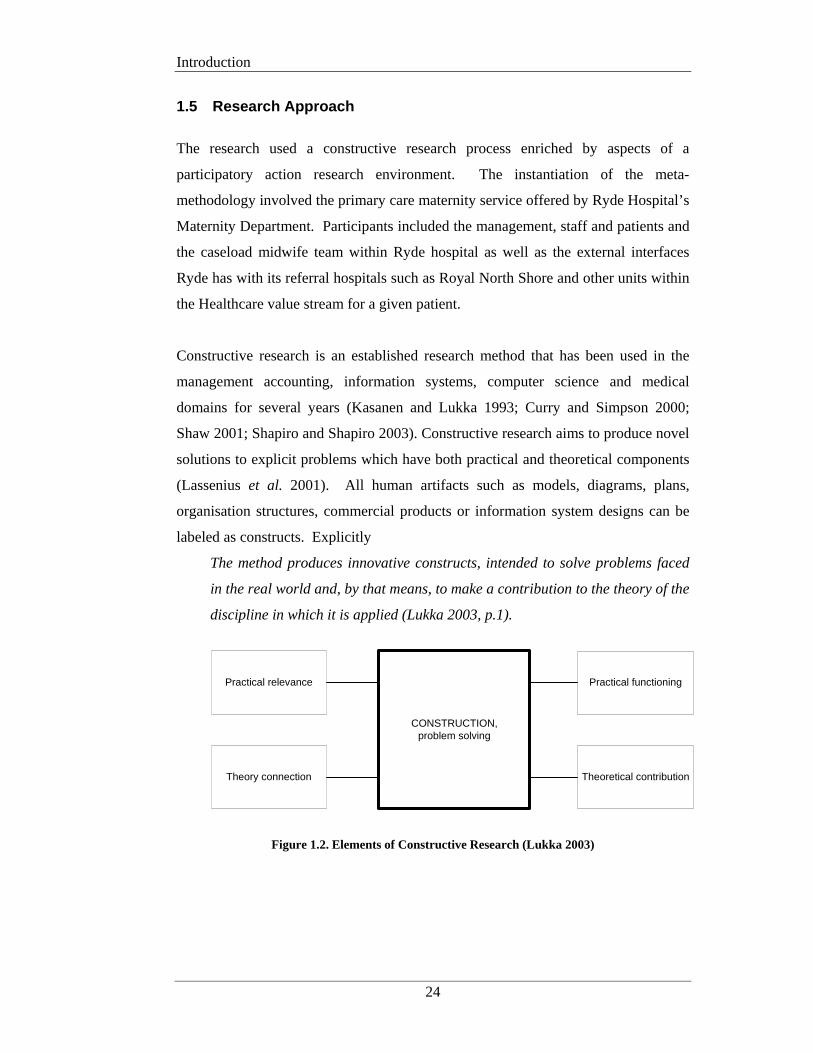
Introduction
24
1.5 Research Approach
The research used a constructive research process enriched by aspects of a
participatory action research environment. The instantiation of the meta-
methodology involved the primary care maternity service offered by Ryde Hospital’s
Maternity Department. Participants included the management, staff and patients and
the caseload midwife team within Ryde hospital as well as the external interfaces
Ryde has with its referral hospitals such as Royal North Shore and other units within
the Healthcare value stream for a given patient.
Constructive research is an established research method that has been used in the
management accounting, information systems, computer science and medical
domains for several years (Kasanen and Lukka 1993; Curry and Simpson 2000;
Shaw 2001; Shapiro and Shapiro 2003). Constructive research aims to produce novel
solutions to explicit problems which have both practical and theoretical components
(Lassenius et al. 2001). All human artifacts such as models, diagrams, plans,
organisation structures, commercial products or information system designs can be
labeled as constructs. Explicitly
The method produces innovative constructs, intended to solve problems faced
in the real world and, by that means, to make a contribution to the theory of the
discipline in which it is applied (Lukka 2003, p.1).
CONSTRUCTION,problem solving
Practical relevance
Theory connection
Practical functioning
Theoretical contribution
Figure 1.2. Elements of Constructive Research (Lukka 2003)
Introduction
25
The primary objectives of constructive research are to produce a construct that:
1. has practical application and is functionally correct (of a quality standard)
2. is cost effective during its development and use
3. is timely in its delivery
The constructive research process is characterised by six phases, which may be
iterative and vary in order depending on the case under review:
1. Find a practically relevant problem
The problem of using a non-industry standard design and modeling
methodology for patient journeys is becoming increasingly relevant and the
push for quality improvements in healthcare is consistently increasing.
Measurement of the multiple dimensions associated with healthcare process
improvement also requires attention.
2. Obtain a general and comprehensive understanding of the topic area
and problem
Literature review and empirical analysis provided the main basis for
understanding of the problem domain. This was further enhanced by
collaborative workshops with the Ryde midwifery staff, management and
patients.
3. Innovate, ie: construct a solution idea
Design of the meta-methodology, new patient journey modeling tool and
accompanying efficacy and efficiency criteria created a novel construct for
patient journey redesign initiatives
4. Demonstrate the solution works
The resulting construct is demonstrated via its application to the design and
modelling of the midwifery practices of the obstetric unit at Ryde hospital
5. Show the theoretical connections and the research contribution of the
solution concept
The case study outputs clearly demonstrate the research contributions made
by the meta-methodology and measurement framework to the areas of health
informatics and information systems.
6. Examine the scope of the applicability of the solution
Investigate the relevance of the new construct in other areas of healthcare.
Introduction
26
Aspects of a participatory action research environment enriched the above
constructive research process to the extent that research domain users were included
in phases 2, 3 and 4. The research team involved in the case study project included
myself as the primary researcher, senior management and the midwifery staff of
Ryde hospital, as well as a number of women (patients) involved in the Ryde
Midwifery Group Practice (both pre and post introduction). External Healthcare
workers and professional bodies contributed to the analysis and interpretation of the
findings and the ensuing ‘future patient journey’ model.
This introduced an idiographic line of enquiry by collaborating with the actual
subjects who are at the core of the research and including them in the analysis
process as well as the actual change experiences of the case study environment. The
variety of data sources ensures triangulation of the results and provided cross-
referenced justification for the introduction of changes to improve the consistency
and quality of the obstetric patient journeys at Ryde.
Baskerville (1999) also states that systems development methodologies are a key
area of importance for the application of action research (Baskerville 1999). As this
research assessed the degree of support provided by several development
methodologies currently employed in healthcare process modeling, it was possible to
highlight potential changes to these methods to enhance their overall levels of
support for the healthcare domain. Baskerville and Wood-Harper (1996) claim that
action research is one of the few valid research approaches that can be legitimately
employed to study the effects of specific alterations in systems development
methodologies in human organisations (Baskerville and Wood-Harper 1996).
It should also be noted that as this research deals with complex social environments,
all interactions amongst the participants must be considered as a complete whole. If
the research area was broken down into its various sub-components and they were
studied individually, little benefit would accrue to the healthcare and information
systems domains as it is the interaction between the individual components that will
yield the greatest insights. It is also appropriate as changes were suggested and
introduced during the case study project and it is the observation of the effect of
these interventions that produced meaning and justification to the development of the
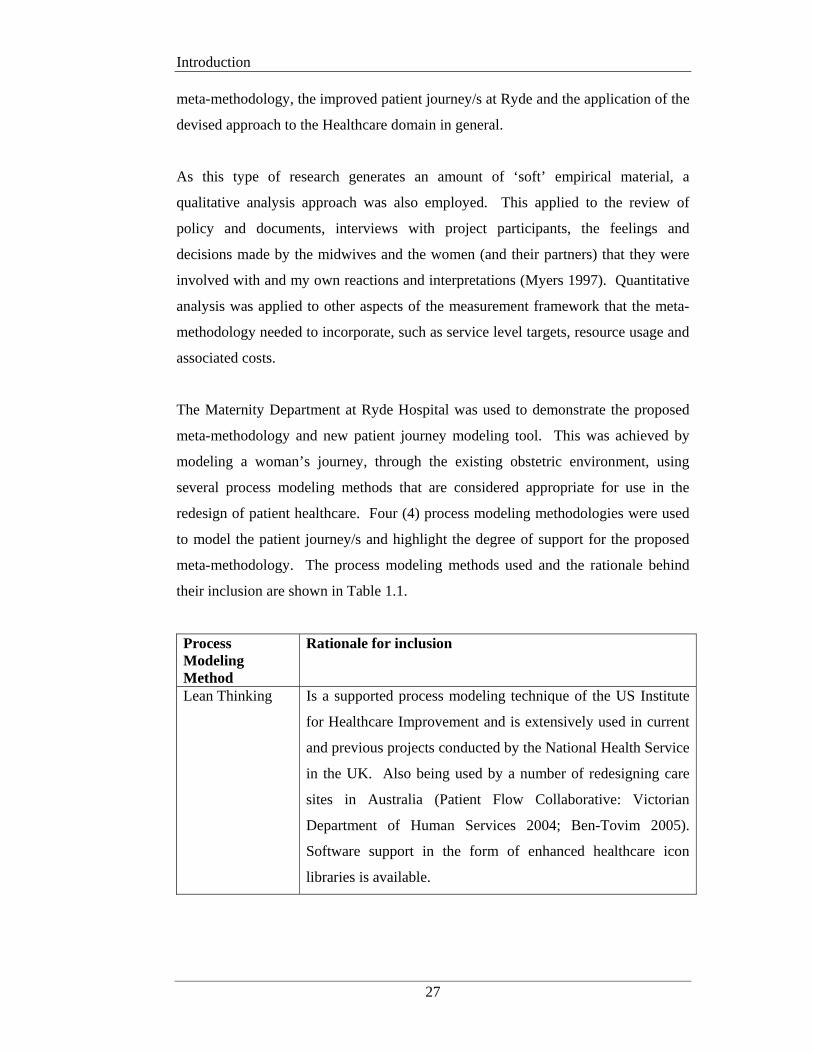
Introduction
27
meta-methodology, the improved patient journey/s at Ryde and the application of the
devised approach to the Healthcare domain in general.
As this type of research generates an amount of ‘soft’ empirical material, a
qualitative analysis approach was also employed. This applied to the review of
policy and documents, interviews with project participants, the feelings and
decisions made by the midwives and the women (and their partners) that they were
involved with and my own reactions and interpretations (Myers 1997). Quantitative
analysis was applied to other aspects of the measurement framework that the meta-
methodology needed to incorporate, such as service level targets, resource usage and
associated costs.
The Maternity Department at Ryde Hospital was used to demonstrate the proposed
meta-methodology and new patient journey modeling tool. This was achieved by
modeling a woman’s journey, through the existing obstetric environment, using
several process modeling methods that are considered appropriate for use in the
redesign of patient healthcare. Four (4) process modeling methodologies were used
to model the patient journey/s and highlight the degree of support for the proposed
meta-methodology. The process modeling methods used and the rationale behind
their inclusion are shown in Table 1.1.
Process Modeling Method
Rationale for inclusion
Lean Thinking Is a supported process modeling technique of the US Institute
for Healthcare Improvement and is extensively used in current
and previous projects conducted by the National Health Service
in the UK. Also being used by a number of redesigning care
sites in Australia (Patient Flow Collaborative: Victorian
Department of Human Services 2004; Ben-Tovim 2005).
Software support in the form of enhanced healthcare icon
libraries is available.
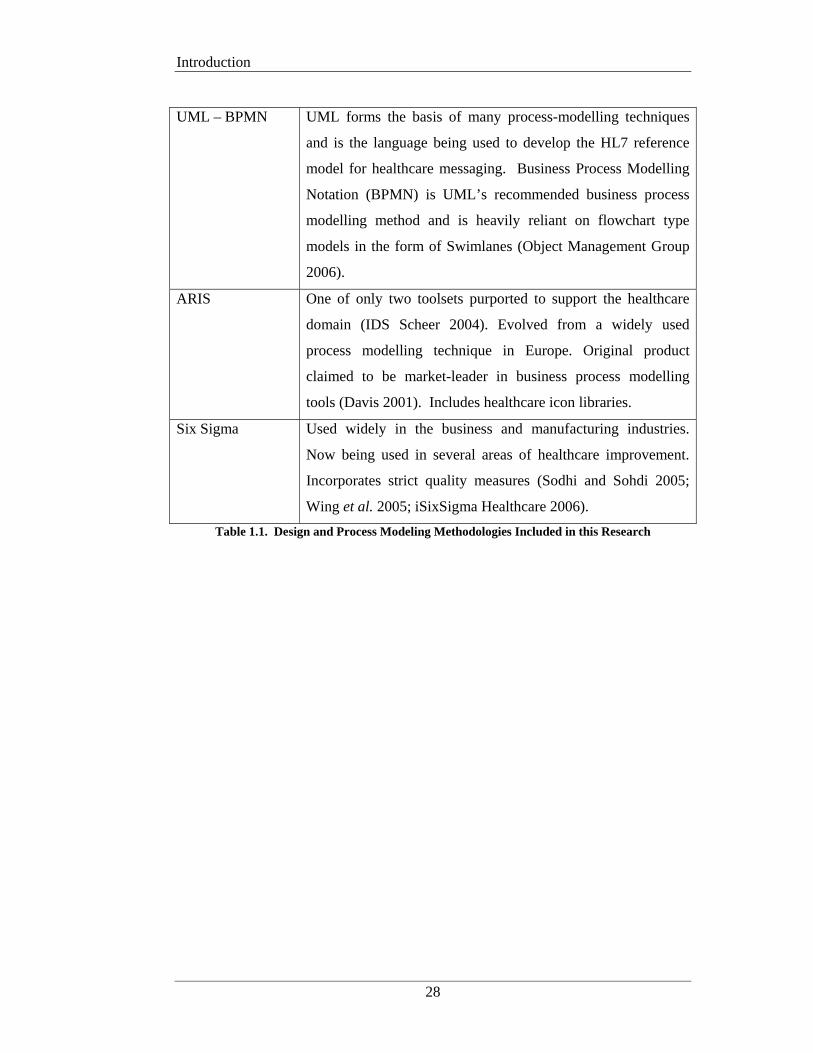
Introduction
28
UML – BPMN UML forms the basis of many process-modelling techniques
and is the language being used to develop the HL7 reference
model for healthcare messaging. Business Process Modelling
Notation (BPMN) is UML’s recommended business process
modelling method and is heavily reliant on flowchart type
models in the form of Swimlanes (Object Management Group
2006).
ARIS One of only two toolsets purported to support the healthcare
domain (IDS Scheer 2004). Evolved from a widely used
process modelling technique in Europe. Original product
claimed to be market-leader in business process modelling
tools (Davis 2001). Includes healthcare icon libraries.
Six Sigma Used widely in the business and manufacturing industries.
Now being used in several areas of healthcare improvement.
Incorporates strict quality measures (Sodhi and Sohdi 2005;
Wing et al. 2005; iSixSigma Healthcare 2006).
Table 1.1. Design and Process Modeling Methodologies Included in this Research
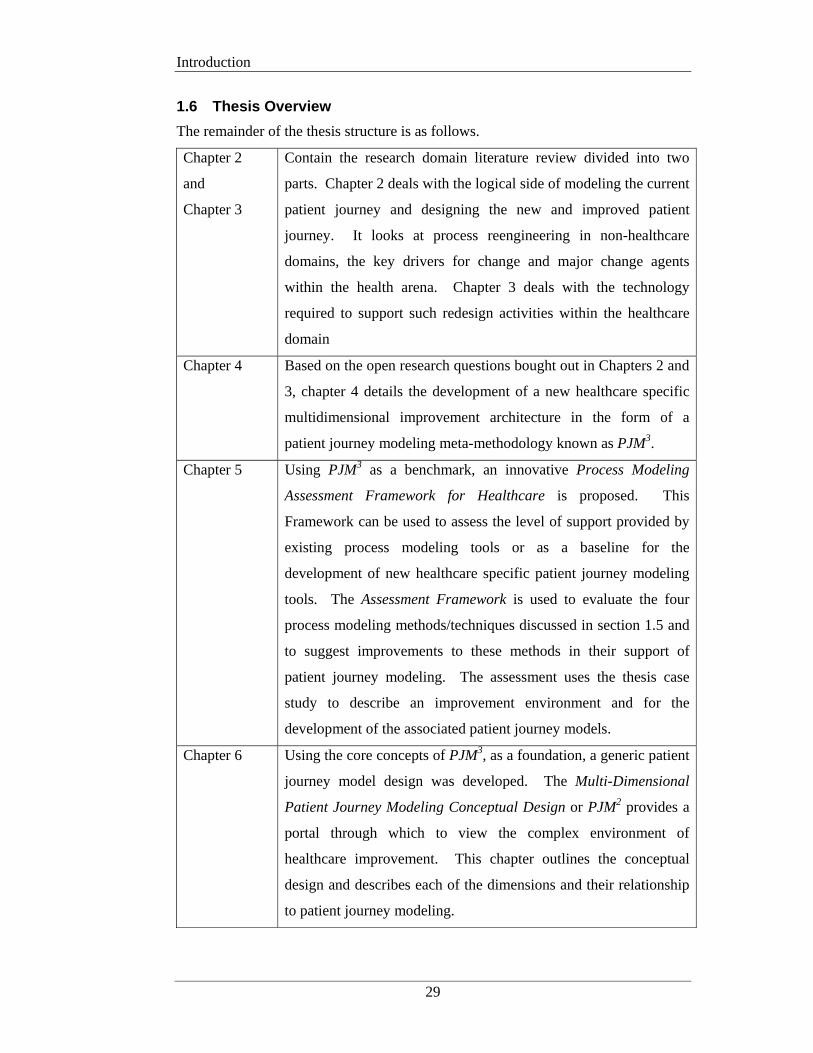
Introduction
29
1.6 Thesis Overview
The remainder of the thesis structure is as follows.
Chapter 2
and
Chapter 3
Contain the research domain literature review divided into two
parts. Chapter 2 deals with the logical side of modeling the current
patient journey and designing the new and improved patient
journey. It looks at process reengineering in non-healthcare
domains, the key drivers for change and major change agents
within the health arena. Chapter 3 deals with the technology
required to support such redesign activities within the healthcare
domain
Chapter 4 Based on the open research questions bought out in Chapters 2 and
3, chapter 4 details the development of a new healthcare specific
multidimensional improvement architecture in the form of a
patient journey modeling meta-methodology known as PJM3.
Chapter 5 Using PJM3 as a benchmark, an innovative Process Modeling
Assessment Framework for Healthcare is proposed. This
Framework can be used to assess the level of support provided by
existing process modeling tools or as a baseline for the
development of new healthcare specific patient journey modeling
tools. The Assessment Framework is used to evaluate the four
process modeling methods/techniques discussed in section 1.5 and
to suggest improvements to these methods in their support of
patient journey modeling. The assessment uses the thesis case
study to describe an improvement environment and for the
development of the associated patient journey models.
Chapter 6 Using the core concepts of PJM3, as a foundation, a generic patient
journey model design was developed. The Multi-Dimensional
Patient Journey Modeling Conceptual Design or PJM2 provides a
portal through which to view the complex environment of
healthcare improvement. This chapter outlines the conceptual
design and describes each of the dimensions and their relationship
to patient journey modeling.
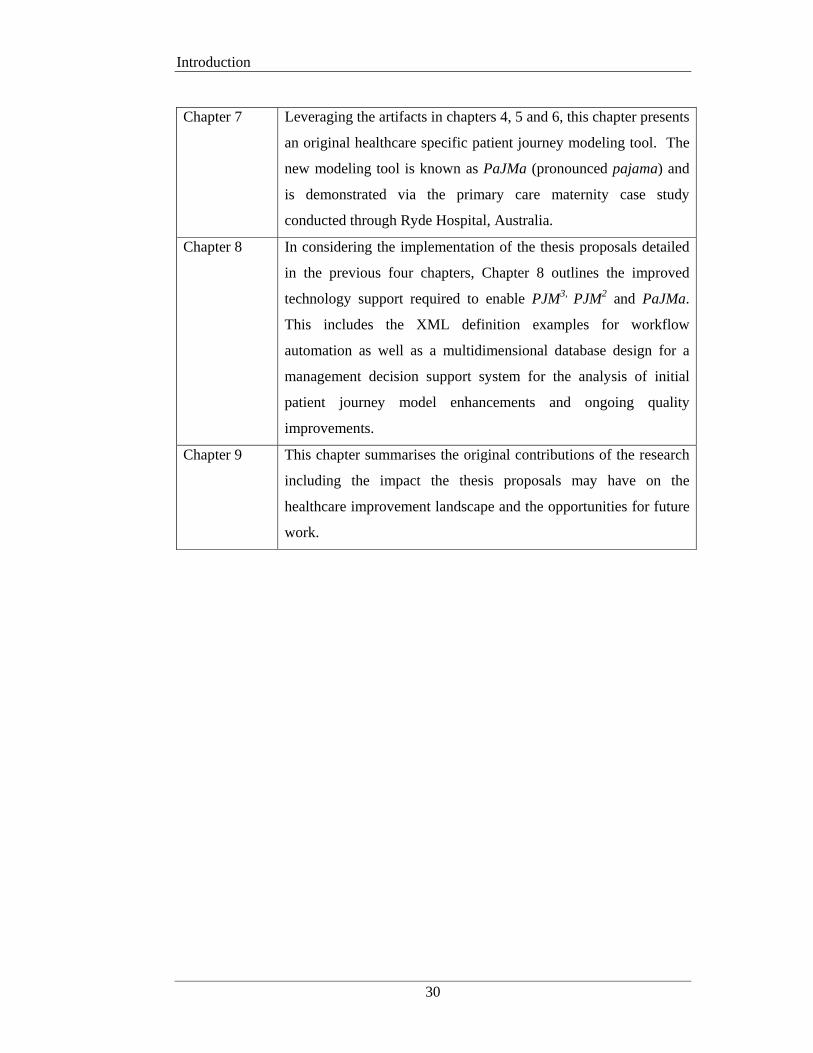
Introduction
30
Chapter 7 Leveraging the artifacts in chapters 4, 5 and 6, this chapter presents
an original healthcare specific patient journey modeling tool. The
new modeling tool is known as PaJMa (pronounced pajama) and
is demonstrated via the primary care maternity case study
conducted through Ryde Hospital, Australia.
Chapter 8 In considering the implementation of the thesis proposals detailed
in the previous four chapters, Chapter 8 outlines the improved
technology support required to enable PJM3, PJM2 and PaJMa.
This includes the XML definition examples for workflow
automation as well as a multidimensional database design for a
management decision support system for the analysis of initial
patient journey model enhancements and ongoing quality
improvements.
Chapter 9 This chapter summarises the original contributions of the research
including the impact the thesis proposals may have on the
healthcare improvement landscape and the opportunities for future
work.
Literature Review – Part A
31
CHAPTER 2 LITERATURE REVIEW - PART A
2.1 Introduction
Chapters 2 and Chapter 3 take the form of a literature review on the key areas of
research relevant to the Thesis topic. This research deals primarily with modeling
the manner in which healthcare is delivered, that is ‘the system of care’. The
underlying premise being that each aspect of clinical care is made up of multiple
processes and combining these processes creates the ‘system of care’ for a particular
task. Therefore unless you change and improve the system there will not be an
improvement in results, aka, outcomes (Berwick 1996; Wilson and Harrison 2002).
The subject areas discussed are relevant to improving the ‘system of care’ and
include process improvement in non-healthcare domains, process improvement in
healthcare, linking change to healthcare strategy and the technology support required
for healthcare process improvements. The review of each research area concludes
with an assessment of the impact that the research area has had, or is having, on the
design of the thesis outcomes.
This chapter (Chapter 2) will consider process improvement in relation to the patient
journey and linking such changes to the healthcare strategy. Chapter 3 will
supplement this with a further review on how technology can be used to support
patient journey redesign implementations. The remainder of this introduction will
deal with the contents of Chapter 2 only.
Literature Review – Part A
32
Chapter 2 is relevant to research hypotheses 1, 2 and 3, through the review and
critique of current literature involving techniques presently used to develop patient
journey models in healthcare. This review also considers if such techniques
adequately accommodate the complexities associated with the provision of safe, high
quality patient journeys that explicitly link provider strategy, process definition,
workflow support and performance measurement and evaluation criteria and that are
cognisant of patient needs and acknowledged practice guidelines.
These issues are open research questions as the constructs and methods developed
for process improvement in a number of non-healthcare domains such as business,
computing and manufacturing are the key drivers in the healthcare process
improvement arena at the current time. To this end it is pertinent to review the
origins of such other work and position its influence on today’s activities within the
healthcare domain.
The Chapter begins with a review of the origins of process modeling and its use
within non-healthcare domains. The Chapter then moves onto examining the current
environment surrounding process improvement in healthcare and analysing some of
the key historical events that have shaped that environment. The concepts of process
modeling in the form of patient journey models are discussed and influential
improvement initiatives are situated.
The Healthcare Strategy section discusses a key contributing factor of this research:
the ability to align the healthcare provider’s strategy with patient journey
improvements through the use of Balanced Scorecards. The origins of Strategy
Analysis and the development of the Balanced Scorecard approach are discussed and
positioned in the context of this research.
Literature Review – Part A
33
2.2 Business Process Improvement
2.2.1 Origins and Methodology
The principles of business process quality improvement, redesign, innovation, or
reengineering have existed for over 30 years (Juran 1974; Hammer 1990; Davenport
1993; Hall et al. 1993; Caron et al. 1994). Acknowledged ‘fathers’ of the quality
movement, Jospeh Juran and W.E. Deming started their work shortly after WWII,
mainly in Japan, and their philosophies are still taught as core topics in many
business and management courses worldwide. Another significant contributor to the
quality initiative was Malcolm Baldridge and organisations still strive to win the
prestigious namesake awards of Deming and Baldridge to this day (Juran 1974;
Deming 1986; NIST 2001).
The primary focus of these and other works is that by improving quality across the
organisation, increased market leadership and thus profits will ensue. There is
significant agreement that to achieve such redesign outcomes process improvement
projects must incorporate:(Davenport et al. 2003)
• “Radical redesign and improvement of work practices,
• Attacking broad, cross-functional business processes,
• Stretch goals of order-of magnitude improvement,
• The use of IT as an enabler of new ways of working.”
A number of business projects have indeed recorded significant improvement
outcomes (Hammer 1990; Hall et al. 1993; Hammer and Champy 1993; Caron et al.
1994) and thus raised the profile of business process redesign in research circles
promoting the introduction of variations and new quality improvement techniques
and methods. Several quality improvements movements have taken centre stage
over the last quarter century including Total Quality Management (TQM), ISO
certification, Business Process Reengineering (BPR), Lean Manufacturing and Six
Sigma (Womack et al. 1990; Hammer and Champy 1993; Motorola University 1994;
Smith 1999; ISO 2007).
Literature Review – Part A
34
2.2.2 Process Modeling
A process is a continuous series of tasks, undertaken for the purposes of creating a
specific output. The starting point and final output of the process should be as
requested and used by either internal or external customers (Scheer 1998).
The Workflow Management Coalition defines a business process as:
A set of one or more linked procedures or activities which collectively realise
a business objective or policy goal, normally within the context of an
organisational structure defining functional roles and relationships (WfMC
1999, p.10).
It goes onto define business process definition as:
The representation of a business process in a form which supports automated
manipulation, such as modeling or enactment by a workflow management
system. The process definition consists of a network of activities and their
relationships, criteria to indicate the start and termination of the process,
and information about the individual activities, such as participants,
associated IT applications and data (WfMC 1999, p.11).
Business Process Re-Design is the alignment of a company’s processes to the needs
and requirements of the market and includes the design, analysis and optimisation of
processes as part of the continuous improvement loop (Hammer and Champy 1993;
Scheer 1998). This involves three primary tasks:
• The capture of target customer requirements and critical success factors.
• The definition of the ‘warts-and-all’ current process flow.
• The re-alignment of existing business processes to the current demands of the
market.
As part of the process analysis, organisational, structural and technological weak
points in the processes are revealed and improvement potential is identified. The
results of the analysis, combined with the corporate goals, are used to derive target
processes, i.e. those processes that will in future help the company to create value
(Hammer and Champy 1993; Scheer 1998).
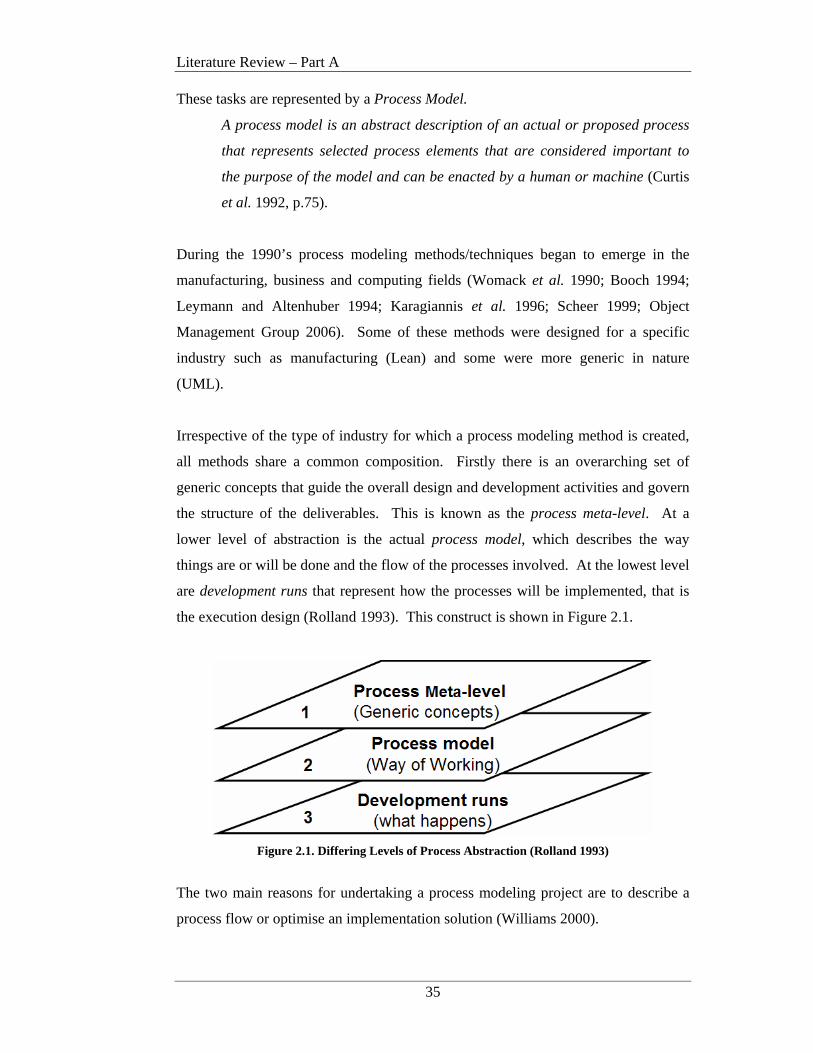
Literature Review – Part A
35
These tasks are represented by a Process Model.
A process model is an abstract description of an actual or proposed process
that represents selected process elements that are considered important to
the purpose of the model and can be enacted by a human or machine (Curtis
et al. 1992, p.75).
During the 1990’s process modeling methods/techniques began to emerge in the
manufacturing, business and computing fields (Womack et al. 1990; Booch 1994;
Leymann and Altenhuber 1994; Karagiannis et al. 1996; Scheer 1999; Object
Management Group 2006). Some of these methods were designed for a specific
industry such as manufacturing (Lean) and some were more generic in nature
(UML).
Irrespective of the type of industry for which a process modeling method is created,
all methods share a common composition. Firstly there is an overarching set of
generic concepts that guide the overall design and development activities and govern
the structure of the deliverables. This is known as the process meta-level. At a
lower level of abstraction is the actual process model, which describes the way
things are or will be done and the flow of the processes involved. At the lowest level
are development runs that represent how the processes will be implemented, that is
the execution design (Rolland 1993). This construct is shown in Figure 2.1.
Figure 2.1. Differing Levels of Process Abstraction (Rolland 1993)
The two main reasons for undertaking a process modeling project are to describe a
process flow or optimise an implementation solution (Williams 2000).
Literature Review – Part A
36
Optimised implementation solutions require the process analysis to be supported by
formal evaluation tools such as simulation. This requires unambiguous parsable
process descriptions that are far too detailed for projects of a descriptive nature. This
research focuses on process modeling for descriptive purposes and as such process
modeling for simulation purposes (ie: Simul8) are outside the research scope.
McGregor (2002) and McGregor and Edwards (2005) evaluated several process
modeling methods in light of their ability to capture and represent the business
strategy through business performance indicators. McGregor’s earlier work went on
to develop a technique for supplying this information to both workflow management
software and the decision support system. McGregor’s work provides the foundation
of the workflow architecture component being used in this research and aided in the
development of some of the evaluation questions used in the Assessment Framework.
Other comparisons of business improvement methods have been conducted but these
have primarily focused on the workflow aspect of the products. These works have
provided evaluation frameworks for workflow management systems and have not
primarily considered the representation of business requirements on the process
model (Berger et al. 1997; Rosemann and zur Muehlen 1998; Shi et al. 1998; zur
Muehlen 1999).
None of the above work deals with comparing process models within the healthcare
domain.
2.2.3 Conclusions and Implications for Patient Journey Modeling Research
Process modeling for the purposes of business reengineering has been used
successfully in business, computing and manufacturing environments for many
years. Interest in the use of such techniques in the healthcare improvement domain
has been growing steadily in the recent past. Key questions exist however on how
well these techniques apply to healthcare improvement or if they provide an
adequate level of support for the complex issues associated with the delivery of safe
high quality healthcare.

Literature Review – Part A
37
This has meant that methods/techniques from non-medical fields have been driving
the majority of healthcare redesign activities and little new work has been conducted
on the development of new techniques or how the existing methodologies being used
can be enhanced to provide better support for the quality improvements demanded of
Healthcare systems worldwide.
Initial analysis of the methods that have made the transition into the healthcare
improvement domain suggest that although many of the techniques cater adequately
for operational process improvement, they lack support for: linking processes to the
organisational strategy, workflow automation, integrated technology support and
communication mechanisms for evaluating improvements. This is compounded in
healthcare by further requirements to incorporate patient needs, practice guidelines
and high levels of specialist knowledge into the mix.
Further details on the analysis of the predominant process models used in healthcare
are discussed in the following section.
Literature Review – Part A
38
2.3 Process Improvement in Healthcare
Healthcare organisations are complex structures whose peak performance is
measured in quality of patient care. Each new day requires the integration
and coordination of professional, support and administrative staffs,
sophisticated clinical and information technology, critical processes and
inventories and facility resources (HIMSS 2006, webpage).
As outlined in Section 2.2 process improvement techniques have been used
extensively in other domains for many years but it is only in the relatively recent past
that the healthcare domain has recognised that process improvements in healthcare
may be achieved through the use of similar reengineering approaches. Methods such
as Lean Thinking, Six Sigma, Unified Modeling Language (UML) and Business
Process Reengineering (BPR) have been used for process reengineering initiatives
within the Healthcare domain both in Australia and overseas (Hammer and Champy
1993; Motorola University 1994; Womack and Jones 2003; Health Level 7 2005;
iSixSigma Healthcare 2006).
Batalden and Splaine (2002) discussed how continual improvement and innovation
within healthcare can be supported into the 21st Century. This work suggests that
there are eight knowledge domains that must be present to lead the continual
improvement of the quality and value of healthcare. They are:
• Healthcare as a process or system • Variation and measurement
• Customer/beneficiary knowledge • Professional subject matter
• Developing new, locally useful
knowledge
• Social context and
accountability
• Leading, following and making
changes in healthcare
• Collaboration
Although this work is not specific to the evaluation of process models it provides key
areas of concentration that must be addressed when undertaking healthcare process
improvement activities. These knowledge domains provided valuable background to
the development of the improvement architecture and related process modeling
assessment framework presented in Chapters 4 and 5 respectively.
Literature Review – Part A
39
Several works discuss the relevance of process improvement and modeling in the
healthcare domain including Mills and Tanik (1995), Nemeth et al. (1998), Horn
(2001), Browne and Warren (2002), Naduthur (2002), Wilson and Harrison (2002),
Resar (2006) and Jensen et al. (2006). NB: Some of these works use the term
‘patient flow’.
In addition an increasing number of publications discuss individual healthcare
process improvement experiences (Nemeth et al. 1998; Bushell and Shelest 2002;
Kerr et al. 2002; Anzbock and Dustdar; ARCHI Net News 2004; Bassham 2005;
Bernstein et al. 2005; Bolch 2005; Gospodarevskaya et al. 2005; IHI 2005;
Szwarcbord 2005) as a small example. However, relatively few discuss whether the
methods employed were adequate or supported the quality improvement exercise
well enough.
Works that do discuss barriers and implementation issues are aimed at differing
levels of abstraction to this research. For example Sehwail highlights cultural
change and correct metric identification as some issues experienced when
implementing Six Sigma (Sehwail and DeYong 2003). Mortimer (2002) also
discusses issues with organisational culture as well as management problems, misuse
of the theory and practice and team creation and cost as general barriers to clinical
practice improvement. Horn’s (2001) Clinical Practice Improvement (CPI) method
discusses the ‘process of care’ but the use of this terminology in the CPI context
refers to treatment processes such as which drugs are dispensed at what dose and rate
as an example.
Scale and complexity of change, lack of data availability, conflicting objectives and
lack of buy-in are cited by Harper and Pitt (2004) as challenges in healthcare
modelling. Laursen (2003) states that ‘using methods from industry’ led to
considerable initial resistance from staff. This work also discussed organisational
communication complexities and the difficulties in bringing together the ‘right
players’ with the appropriate degree of power to implement change as project
challenges.

Literature Review – Part A
40
Seila presented seven rules for modelling healthcare processes but these rules were
aimed at simulation modelling, not descriptive modelling, the focus of this research
(Seila 2005).
Curry et al. (2005) highlighted several areas in which current process modeling
techniques failed to provide adequate support for the healthcare domain. These
included the inability to explicitly link healthcare strategy to the modeling and
design process, poor modeling constructs for the representation of the complex
process and information flows involved in clinical pathways, the lack of consistency
in the provision of computer-interpretable guidelines for workflow automation and
inadequate procedures for the provision of information for decision support system
reporting. This work was performed in the early stages of the thesis development
and as such provided a foundation for the construct of the research hypotheses.
To understand the current landscape relating to process improvement in the
healthcare domain, a review of the drivers for change and the dominant change
agents follows. This will include a review of how patient journey modelling is
positioned within the healthcare improvement arena.
2.3.1 Drivers for Change
In 1995, an Australian study into 14,000 hospital admissions in two Australian States
found that up to 16% of patients were killed or injured as a result of their treatment
rather than their original medical condition (Wilson et al. 1995). The then Federal
Health Minister stated in Parliament that if these figures were extrapolated to a
national level, that as many as 230,000 patient could be involved in preventable
adverse events with up to 14,000 of these being fatal (Goddard 2003).
2.3.1.1 U.S. Institute of Medicine
Similar findings on a much larger scale were driven home in 1999 with the release of
the United States Institute of Medicine (IOM) report ‘To err is human: Building a
safer health system’. The report suggested that as many as 98,000 people were dying
each year in US hospitals due to medical injuries, that is, injuries incurred during the
patient’s hospital stay (Kohn et al. 1999). Although data reported was between 5-8
Literature Review – Part A
41
years old, the media and the public was up in arms over the fact that being sick and
receiving poor quality health care could be more damaging to a person’s overall
well-being than the original condition for which the patient was being treated. The
report reframed ‘Medical Error’ as a chronic threat to public health (Kohn et al.
1999). This report resulted in huge public attention on the crisis in the US health
care system and demanded overall improvements to the delivery of U.S. healthcare
and in particular significant attention to increased patient safety.
Further work carried out by the IOM produced a second report, ‘Crossing the quality
chasm: A new health system for the 21st century’ which was released in 2001
(Committee on Quality of Health Care in America). This report analysed the need
for change at four different levels, with level A being the driver for change at all
other levels:
a) the experience of patients,
b) the functioning of small units of care delivery (microsystems),
c) the functioning of the organisations that house or otherwise support the
Microsystems and
d) the environment of policy, payment, regulation, accreditation and other such
factors, which shape the behaviour, interests and opportunities of the
organisations at Level c).
These key quality areas set a way forward for the US health system and resulted in
the definition of the IOM’s six (6) overarching ‘Aims for Improvement’ as described
in Chapter 1 (Committee on Quality of Health Care in America 2001).
As highlighted by Berwick in his ‘User's manual for the IOM's 'Quality Chasm'
report’ the IOM committee minced no words in its assessment of the capacity of the
current health care system to achieve these six aims when stating: “In its current
form, habits, and environment, American health care is incapable of providing the
public with the quality health care it expects and deserves" and concluded “that
current rates of injury from care are inherent properties of current system designs
and that safer care will require new designs” (Berwick 2002, p.83/84).
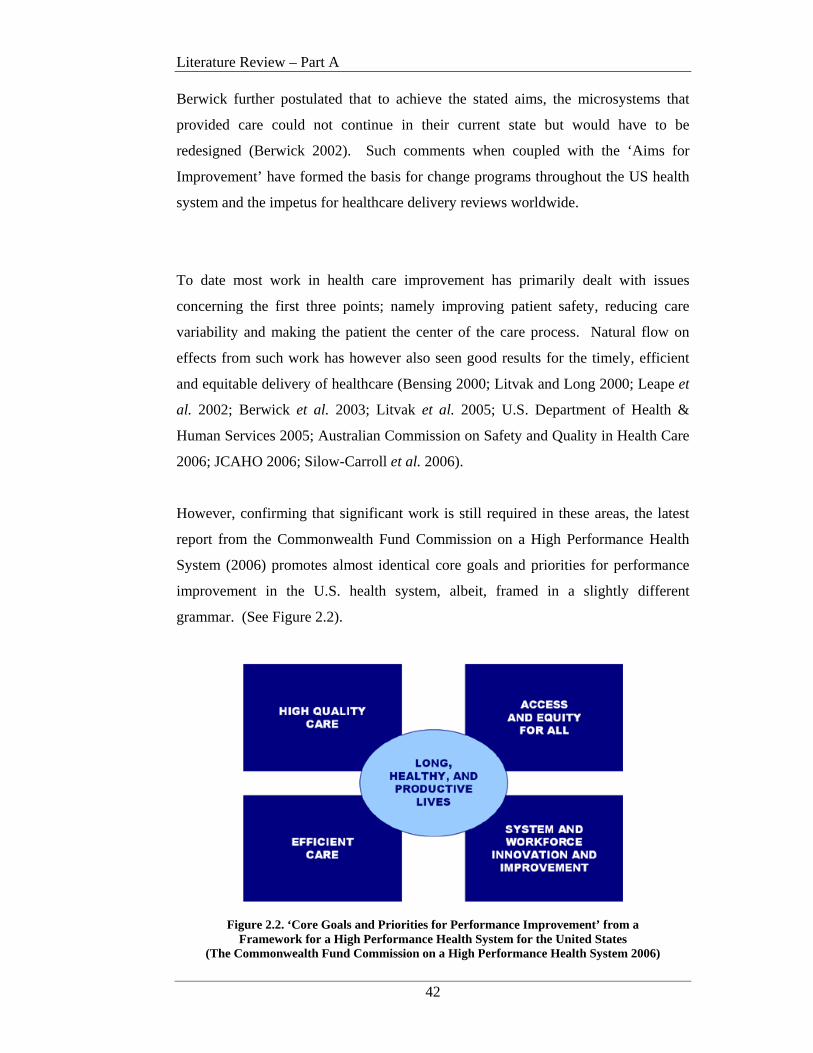
Literature Review – Part A
42
Berwick further postulated that to achieve the stated aims, the microsystems that
provided care could not continue in their current state but would have to be
redesigned (Berwick 2002). Such comments when coupled with the ‘Aims for
Improvement’ have formed the basis for change programs throughout the US health
system and the impetus for healthcare delivery reviews worldwide.
To date most work in health care improvement has primarily dealt with issues
concerning the first three points; namely improving patient safety, reducing care
variability and making the patient the center of the care process. Natural flow on
effects from such work has however also seen good results for the timely, efficient
and equitable delivery of healthcare (Bensing 2000; Litvak and Long 2000; Leape et
al. 2002; Berwick et al. 2003; Litvak et al. 2005; U.S. Department of Health &
Human Services 2005; Australian Commission on Safety and Quality in Health Care
2006; JCAHO 2006; Silow-Carroll et al. 2006).
However, confirming that significant work is still required in these areas, the latest
report from the Commonwealth Fund Commission on a High Performance Health
System (2006) promotes almost identical core goals and priorities for performance
improvement in the U.S. health system, albeit, framed in a slightly different
grammar. (See Figure 2.2).
Figure 2.2. ‘Core Goals and Priorities for Performance Improvement’ from a
Framework for a High Performance Health System for the United States (The Commonwealth Fund Commission on a High Performance Health System 2006)
Literature Review – Part A
43
The core focus areas for improving healthcare delivery to date are presented in the
following sections.
2.3.1.2 Improving Patient Safety and Reduced Care Variability
Despite such significant interest and efforts to increase patient safety, recent studies
by the Institute for Healthcare Improvement (IHI) estimate that up to 15 million
incidents of medical harm still occur in U.S. hospitals each year (IHI 2006).
However continuing research suggests that there is a strong link between patient
safety and the degree of variability in the care process. To date significant studies
are showing that the more consistent, that is, less variable, the process of care, the
higher the levels of patient safety (Bensing 2000; Browne and Warren 2002;
Henderson et al. 2004; IHI 2004; Berwick et al. 2006; IHI 2006; Jensen et al. 2006;
Mitka 2006).
In 2002, Leape et al. (2002) highlighted the correlation between the delivery of
evidence-based medicine and improved patient safety. This work discussed Shojania
et al’s. (2001) report on the evidence of effectiveness of certain treatments in
preventing complications. The project’s aim was to collect and critically review the
existing evidence on practices relevant to improving patient safety. It found that the
main focus to date had been on epidemiology errors and adverse events, rather than
on practices that reduced such events. Report results suggested that in terms of
strength of evidence, there were 11 practices that had been proven to decrease patient
risk and this evidence supported widespread implementation.
Such work has led to significant campaigns to reduce the variability of care
delivered, for the purposes of improved patient safety. Two cases in point are the
Institute of Healthcare Improvement (IHI) 100,000 lives and 5 million lives
campaigns. Launched in December 2004 and December 2006 respectively both of
these campaigns are aimed at actively reducing the number of adverse deaths in U.S.
hospitals through the introduction of a number of standard evidence-based
interventions. The 100,000 lives campaign introduced six such interventions at more
than 3000 care sites in the U.S., averting over 122,000 patient deaths over an 18-
month period (IHI 2004; Berwick et al. 2006; Mitka 2006).
Literature Review – Part A
44
Continuing on from the 100,000 lives initiative, “the ‘5 Million Lives Campaign’
asks hospitals to improve more rapidly than before the care they provide in order to
protect patients from five million incidents of medical harm over a 24-month period,
ending December 9, 2008” (IHI 2006). It is proposed that these targets will be met
through the introduction of 12 standardised care improvements in the participating
hospitals (IHI 2006).
Together these initiatives represent the largest improvement efforts ever undertaken
by the health care industry in recent history and indicate that removing process
variability for a given patient journey is an important activity that will increase
patient safety and assist in improving outcomes.
2.3.1.3 Patient-centered Care
The doctor of the future will give no medicine, but will interest his patients in
the care of the human body, in diet, and in the cause and prevention of disease
(Edison 1847-1931)
The above quote by Thomas Edison points to empowering the patient to control their
own health and well-being, by taking an active interest in how they live their lives,
what they eat and how best to take care of themselves holistically.
This patient-centered approach is being echoed some 75 years later as the answer to
reducing Healthcare costs across the board (Prochaska et al. 2005; Queensland
Department of Health 2005).
The IOM’s “Crossing the Quality Chasm” report clearly stated that ‘Patient-
centeredness’ was one of its six over-arching Improvement Aims. The report
challenged the U.S. Health System to honor the individual patient, respecting the
patient’s choices, culture, social context and specific needs. It suggested that this
could be achieved via redesign of the microsystems that deliver care, but that the
redesign activities would need to adhere to three redesign principles:
1) knowledge-based care,
2) patient-centered care and
3) systems-minded care.
Literature Review – Part A
45
These redesign principles require: the use of the best science and clinical information
available in the service of the patient, putting each patient in control of his or her
own care and the coordination, integration and efficiency of care across
organisational boundaries, disciplines and roles (Berwick 2002).
There are two sides to this approach: 1) Provide readily available information to the
public on lifestyle and general health issues and 2) Involving patients in the redesign
of the care processes they participate in.
By arming individuals with appropriate information about their immediate healthcare
concerns, visits to local GPs can be reduced for low to medium-risk health issues or
fast-tracked for confirmed high-risk conditions. Decision Support and Expert
Systems are being used to deliver primary care information via telephone Help-
Lines, staffed by Healthcare workers, in areas such as sun-cancer prevention, quit-
smoking programs, diet improvements and mammogram follow-ups (Prochaska et
al. 2005). The USA’s Blue Cross Blue Shield Association actively encourages their
members to build relationships with primary healthcare providers and take an active
part in their own well-being, thus controlling their personal health care costs and
longer term insurance premiums (BlueCross BlueShield Association 2005).
Although still not commonplace, the inclusion of patients in the redesign of care
project, can provide valuable insights into the way patients perceive the system and
can assist in producing better care processes at a holistic level. Good results from
several healthcare process improvement projects can be found in (Nemeth et al.
1998; Bensing 2000; Homer et al. 2001; Bushell and Shelest 2002; Johnson 2002;
Coiera 2003; Bate et al. 2004; Bassham 2005; Gospodarevskaya et al. 2005;
Szwarcbord 2005; Curry et al. 2006).
A patient-centric approach is also supported by the UK’s National Health Service
(NHS), where the final footnote in the NHS Step-by-step guide to developing
Integrated Care Pathways is headed ‘How to increase your chances of success’ and
makes only one statement: Remember To Keep The Patient At The Centre Of The
Process! (National Health Service 2005).
Literature Review – Part A
46
2.3.2 Dominant Change Agents
The two most dominant change agents in the healthcare improvement arena are the
U.S. Institute for Healthcare Improvement (IHI) and the UK’s National Health
Service (NHS) Institute for Innovation and Improvement (formerly NHS
Modernisation Agency). Both of these organisations have implemented significant
healthcare improvement programs and initiatives that are driving results not only in
their own countries but on the worldwide stage as well.
2.3.2.1 Institute for Healthcare Improvement (IHI)
The Institute for Healthcare Improvement (www.ihi.org) is a not-for-profit
organisation leading the improvement of health care throughout the world. Founded
in 1991, led by eminent researcher Donald Berwick and based in Cambridge, MA,
IHI is a catalyst for change, cultivating innovative concepts for improving patient
care and implementing programs for putting those ideas into action. Thousands of
health care providers, including many of the finest hospitals in the world, participate
in IHI’s groundbreaking work (IHI 2006).
IHI developed the Breakthrough Series to help health care organisations make
“breakthrough” improvements in quality while reducing costs. Since 1995, IHI has
sponsored over 50 Collaborative projects on several dozen topics involving over
2,000 teams from 1,000 health care organisations. Collaborative teams from the
U.S., Canada and Europe have achieved dramatic results, including reducing waiting
times by 50 percent, reducing worker absenteeism by 25 percent, reducing ICU costs
by 25 percent, and reducing hospitalisations for patients with congestive heart failure
by 50 percent (IHI 2003).
An analysis of the major healthcare reviews occurring in Australia indicated that the
Breakthrough Series was also a key resource employed in these projects (Curry and
McGregor 2005).
The primary enabler of the Breakthrough Series is the Model for Improvement (MFI)
as shown in Figure 2.3. The MFI identifies four key elements of successful process
improvement:
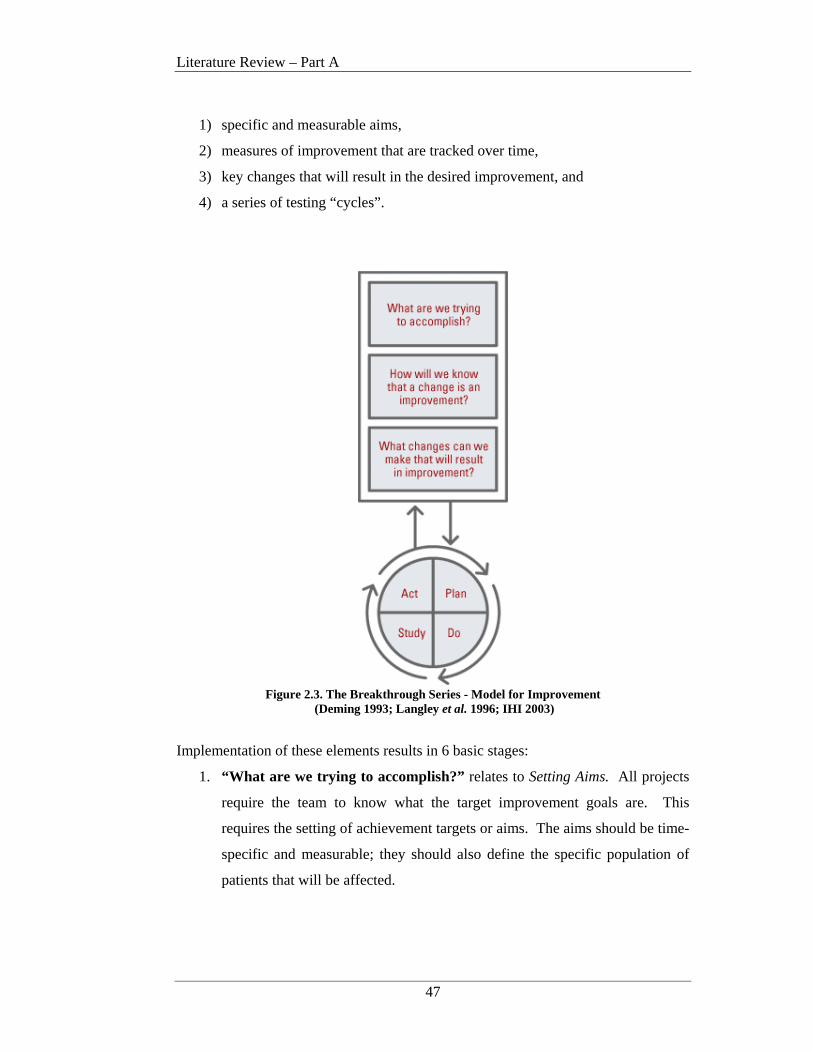
Literature Review – Part A
47
1) specific and measurable aims,
2) measures of improvement that are tracked over time,
3) key changes that will result in the desired improvement, and
4) a series of testing “cycles”.
Figure 2.3. The Breakthrough Series - Model for Improvement
(Deming 1993; Langley et al. 1996; IHI 2003)
Implementation of these elements results in 6 basic stages:
1. “What are we trying to accomplish?” relates to Setting Aims. All projects
require the team to know what the target improvement goals are. This
requires the setting of achievement targets or aims. The aims should be time-
specific and measurable; they should also define the specific population of
patients that will be affected.
Literature Review – Part A
48
2. “How will we know that a change is an improvement?” is about
Establishing Measures. Following implementation, quantitative measures
are used to determine if a specific change actually led to an improvement.
3. “What changes can we make that will result in an improvement?”
concerns Selecting Changes. All improvement requires making changes, but
not all changes result in improvement. Organisations therefore must identify
the changes that are most likely to result in improvement.
4. Testing Changes involves the use of ‘Plan-Do-Study-Act cycles (PDSA).
The PDSA cycle is shorthand for testing a change in the real work setting on
a small scale — by planning it, trying it, observing the results, and acting on
what is learned. This is the scientific method used for action-oriented
learning.
5. Following testing, comes Implementing Changes. After testing a change on a
small scale, learning from each test, and refining the change through several
PDSA cycles, the team can implement the change on a broader scale — for
example, for an entire pilot population or on an entire unit.
6. Spreading Changes then occurs. After successful implementation of a
change or package of changes for a pilot population or an entire unit, the
team can spread the changes to other parts of the organisation or to other
organisations.
(IHI 2003)
Lacking from the Breakthrough Series methodology is any form of healthcare
specific modeling representation of the patient journey/s under review. The majority
of documentation is in textual format and any graphical notations are at the
discretion of the redesign team. Standard flowcharts and Lean value stream maps
are discussed although they do not form a core component of the method. Integration
of strategic objectives, patient input and organisational structure into the definition of
the patient journey is also variable.
Literature Review – Part A
49
2.3.2.2 National Health Service (NHS)
The UK’s National Health Service (NHS) Institute for Innovation and Improvement
(formerly the Modernisation Agency) is recognised as a leader in healthcare quality
improvement and has conducted major process reengineering projects over several
years. As an individual organisation, the NHS modernisation programme is the
largest and most systematic quality improvement effort anywhere in the world (NHS
Modernisation Agency 2005).
The NHS began their first attempt at patient-focused process improvement in the
early 1990’s. This project was instigated after a visit to the U.S. to learn about the
‘Anticipated Recovery Pathways’ program. The resulting NHS Integrated Care
Pathway (ICP) initiative was clinician led and driven and had patients and locally
agreed, best practice at its’ core (National Health Service 2005).
In 1997 the UK Department of Health released a white paper entitled ‘The New
NHS- Modern, Dependable’. This initiative was designed to reinvigorate the NHS
and move it to a model of integrated care that “combined efficiency and quality with
a belief in fairness and partnership”. The significance of this program was
highlighted with the allocation of £1.5 billion in the first two years of operation and
the instigation of a strategic Healthcare Improvement Program (UK Department of
Health 1997).
Just three years later another new initiative, ‘The NHS Plan’ was launched by the
UK Department of Health. The report stated that despite many achievements, the
NHS had failed to keep pace with changes in society and outlined a vision of a health
service designed around the patient (UK Department of Health 2000). Two
significant bodies were established as part of ‘The Plan’: The National Primary Care
Collaborative and the Modernisation Agency.
The NHS National Primary Care Collaborative launched in 2000 was originally
described as the world's largest health care improvement project. It now
encompasses nearly 2,000 practices nationwide covering almost 11.5 million
patients. To date the Collaborative has helped to reduce by an average of 60% the
waiting time for an appointment with a general practitioner (IHI 2003).
Literature Review – Part A
50
The NHS Modernisation Agency was established in April 2001. This Agency was
designed to support the NHS and its partner organisations in the task of modernising
services and improving experiences and outcomes for patients. Since 2001 over
150,000 NHS staff have been engaged in redesigning healthcare projects via the
NHS Modernisation Agency (NHS Modernisation Agency 2005).
The Modernisation Agency was superceded on 1st July 2005 by the NHS Institute
for Innovation and Improvement. The Institute heralds a new era of improvement
and change for the NHS. Established as a Special Health Authority, and based on
the campus of the University of Warwick, the mission of The Institute is to support
the NHS and its workforce in accelerating the delivery of world-class healthcare for
patients and the public by encouraging innovation and developing capability at the
frontline. As an ‘arms-length-body’ of the NHS, The Institute (as a single entity)
operates with an annual budget of £80 million (NHS Modernisation Agency 2005).
The NHS Institute main aims are to:
• work closely with clinicians, NHS organisations, patients, the public,
academia and industry in the UK and world-wide to identify best practice
• develop the NHS’ capability for service transformation, technology and
product innovation, leadership development and learning
• support the rapid adoption and spread of new ideas by providing guidance on
practical change ideas and ways to facilitate local, safe implementation
• promote a culture of innovation and life long learning for all NHS staff
(NHS Modernisation Agency 2005).
In support of these aims The Institute has developed extensive material concerning
improvement methods, techniques and clinical standards. A key category is
available for ‘Improvement Leaders’ on patient journey redesign and outlines what
steps should be followed during such collaborative sessions. The redesign
methodology discussed is largely based on the IHI Breakthrough Series method
(NHS Modernisation Agency 2005; NHS Modernisation Agency 2005).

Literature Review – Part A
51
Process models are suggested as part of the ‘Improvement Leaders Guides’, with
flowcharting and Lean Thinking Models supported. Inititally much of the design
work utilises ‘post-it’ notes stuck on butchers paper or a whiteboard. Formal patient
journey process models are only constructed after agreement by all session
participants on the ‘post-it’ note flow. Although this system appears archaic, results
reported by the NHS indicate that this system has delivered better access to A&E
treatment, major reductions in both inpatient and outpatient waiting times, and
significantly improved services in cancer, coronary heart disease and radiology
(NHS Modernisation Agency 2005).
Literature Review – Part A
52
2.3.3 Patient Journey Modeling
One aspect that is critical to overall healthcare improvement is Patient Journey
Modeling (PJM) and as the thesis title suggests PJM is the core focus of this research
activity.
PJM is a patient-centric activity that details a patient’s interaction with and progress
through a healthcare system for a given service (NHS Modernisation Agency 2005;
NHS Modernisation Agency 2005) and deals primarily with modeling the manner in
which healthcare is delivered, that is ‘the system of care’. It involves analysis of
each aspect of clinical care delivery including the multiple processes required to
deliver the care for a given task. Models based on these principles provide a
framework to reduce the variability of care by helping to understand the relative
significance of any one or related group of variables contributing to patient
outcomes. Models also assist in building consensus among healthcare workers, as
well as in the planning of interventions and improvements (Camann 2001).
One of the goals of PJM is to improve patient safety and health care quality by
reducing variability in the care process. This involves the analysis of the overall
processes involved with the movement of a patient through a healthcare system, and
then analysing how this journey can be improved via the removal of unproductive,
duplicated and excessive activities and improved communications between the
patient, their carers and the clinicians involved with the journey itself (IHI 2003;
Curry and McGregor 2005; NHS Modernisation Agency 2005; NHS Modernisation
Agency 2005)
Several terms are used in the literature to refer to the concept of patient journey
modeling (PJM) including: clinical pathways improvement, optimising patient flow,
clinical practice improvement and redesigning healthcare (Horn 2001; NSW
Department of Health 2002; IHI 2003; Haraden and Resar 2004; Szwarcbord 2005;
UK Department of Health 2005; Jensen et al. 2006).
This research uses the term ‘patient journey’ to include not only the flow or
implementation of improved clinical practice but to encompass the complete
spectrum of a patient’s experience for a given service.

Literature Review – Part A
53
PJM falls into the domain of “Medical/Health informatics (MI/HI) which is an
evolving scientific discipline that deals with the collection, storage, retrieval,
communication and optimal use of health related data, information and knowledge.
The discipline utilises the methods and technologies of the information, social and
technology sciences for the purposes of problem solving and decision-making thus
assuring quality healthcare in all basic and applied areas of medical, biomedical
and health science” (Shortliffe et al. 2001; International Medical Informatics
Association 2006)
The concepts of Patient Journey Modeling have been used to redesign patient-centric
healthcare processes for almost 15 years. The Institute of Healthcare Improvement
(USA) and NHS Institute for Innovation and Improvement (UK) have used various
forms of this approach since the 1990’s (IHI 2003; UK Department of Health 2005).
Programs that have included patient journey modeling have achieved dramatic
results in traditional hospital settings, including reducing waiting times by 50
percent, reducing worker absenteeism by 25 percent, reducing ICU costs by 25
percent, and reducing hospitalisations for patients with congestive heart failure by 50
percent (IHI 2003). Key publications discussing this issue under the banner of
‘patient flow’ include Haraden and Resar (2004), Brideau (2004), Henderson et al.
(2004), IHI (2003), JCAHO (2004; 2005) and Jensen et al. (2006).
Australia has also conducted several such projects with similar leaps in
improvement. An example in case is the Flinders Medical Centre in South Australia
which has introduced improved processes in the Emergency Department (ED).
These improvements now see 90% of (non-admittance) patients attending the ED,
being seen, treated and out within 4 hours (Szwarcbord 2005).
Notwithstanding these achievements, PJM is still not considered a core component
of many healthcare improvement (HCI) initiatives.
Literature Review – Part A
54
The reasons for this may be many including the inability of current process modeling
techniques to capture all of the nuances and complexities of healthcare
environments; the lack of understanding, by healthcare workers, of process modeling
and the benefits it can deliver; and the lack of a healthcare specific PJM approach.
The lack of a healthcare specific PJM approach is evidenced in the following four
sub-sections which describe the predominant PJM approaches currently used in
healthcare:
• Lean Thinking;
• Process Maps (flowcharts) as used in Six Sigma;
• ARIS ; and
• Unified Modeling Language (UML).
2.3.3.1 Lean Thinking
A process modeling approach that is receiving increased interest in the healthcare
domain is Lean Thinking and value stream maps. This is primarily due to the fact
that Lean Thinking is a supported modeling technique for the Institute for Healthcare
Improvement and the NHS (IHI 2005; NHS Modernisation Agency 2005).
The principles of Lean Thinking Management have been used successfully in the car
manufacturing industry, starting with Henry Ford, since the early 1900’s. After
WWII the techniques were polarised by Toyota in the form of the ‘Toyota
Production System’ which continues to this day (Womack and Jones 2003). The
Lean philosophy, techniques and tools became the focus of landmark books: ‘The
Machine that Changed the World’ (1990) and ‘Lean Thinking’ (2003) by Womack et
al following in-depth studies of the Japanese car manufacturing industry by
American researchers in the International Motor Vehicle Program (IMVP) at
Massachusetts Institute of Technology. These books exposed other industries to the
possibilities of improving production ‘flow’ through the removal of non-value-
adding activities. Removal of this production ‘fat’ leads to a ‘lean’ enterprise and
will result in more being done with less.
Literature Review – Part A
55
The Lean Thinking method has been used to improve processes in aeronautics,
software engineering, the military and healthcare (Bushell and Shelest 2002;
Womack and Jones 2003; LAI 2004; Sloane et al. 2006).
Every organisation is made up of a series of processes, or sets of actions, the purpose
of which is to create value for the customer. The core principles of the technique
involve defining the value each step in a process adds to the end product or service.
Any step that does not add value as defined by the customer, is considered a ‘waste’
(muda) and is eliminated from the process flow, thus leaving only those steps that
create value in the production of the end product/service (Womack and Jones 2003).
This approach is seen as valid to healthcare improvement as it allows the provider to
evaluate process flows (value streams in ‘lean’ speak) in relation to the value placed
on particular steps in a process as specified by the patient (customer). Steps that do
not add value then become a target for elimination and improved flow. Such an
approach in healthcare can lead to increased patient satisfaction, improved
productivity and outcome quality and reduced costs (IHI 2005).
In 2006 the native Lean Thinking Value Steam Mapping software was enhanced to
provide a limited number of healthcare specific icon libraries. These allow some
distinction between patient types, process activities and staff roles. Apart from these
enhancements the basic modeling method remain unchanged (GumshoeKI Inc 2006).
Lean Thinking’s value stream mapping technique has been used to model healthcare
processes in several countries with varying degrees of success (Bushell and Shelest
2002; Heyamoto 2002; Bassham 2005; Bolch 2005; IHI 2005). NB: As these
projects were prior to 2006 they used the native Lean Thinking models with no
healthcare specific icon library enhancements.
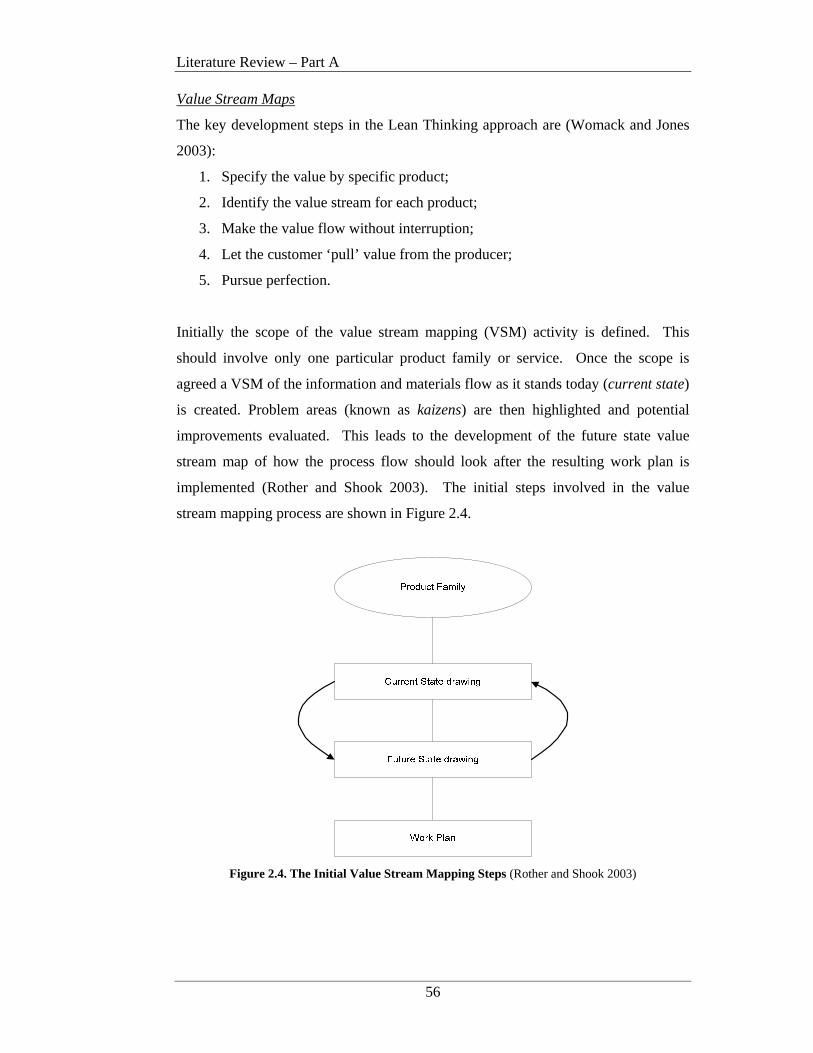
Literature Review – Part A
56
Value Stream Maps
The key development steps in the Lean Thinking approach are (Womack and Jones
2003):
1. Specify the value by specific product;
2. Identify the value stream for each product;
3. Make the value flow without interruption;
4. Let the customer ‘pull’ value from the producer;
5. Pursue perfection.
Initially the scope of the value stream mapping (VSM) activity is defined. This
should involve only one particular product family or service. Once the scope is
agreed a VSM of the information and materials flow as it stands today (current state)
is created. Problem areas (known as kaizens) are then highlighted and potential
improvements evaluated. This leads to the development of the future state value
stream map of how the process flow should look after the resulting work plan is
implemented (Rother and Shook 2003). The initial steps involved in the value
stream mapping process are shown in Figure 2.4.
Figure 2.4. The Initial Value Stream Mapping Steps (Rother and Shook 2003)
Literature Review – Part A
57
Only value-added and non-value-added cycle times are recorded on the process
model. All other measurements are recorded in a separate artifact, ‘a current state
box score’. Womack and Jones (2003) suggest 7 key metrics: total lead time, value
creating time, changeover time, uptime, scrap/rework, inventory and every part
made every; although others can be added based on model development needs.
Following implementation of the work plan a future state box score should be
produced so that process change improvements can be validated and verified.
In relation to patient journeys, Step 2 in the Lean Thinking method is where the first
patient journey model is produced. It describes the existing process activities
required to deliver the patient service under review.
This results in a current patient journey value stream map. Step 3 identifies the areas
of waste (muda) or non-value-adding activities and prioritises those that will even
the flow most significantly. A future patient journey value stream map is produced
showing the new and improved patient and process flow.
In relation to healthcare patient journey modeling this technique graphically depicts
the movement of an object, in this case a patient, through a selected workflow and
highlights duplication and wastage. However this technique takes time to understand
and lacks the ability to include/overlay relevant policies/guidelines, patient needs,
staff roles and IS system usage as an integral part of the patient’s journey through the
Health Care Organisation (HCO). Value stream mapping provides a measurement
construct for actual and elapsed process time and process defects. However
deficiencies exist in relation to a supplementary and thorough technique for richer
model representations that combine strategic objectives, patient input, organisational
structure and consistent measurement and evaluation frameworks specifically geared
to healthcare process improvement.
A case in point regarding the lack of understanding of healthcare workers of such
process modeling techniques and how they are applied can in fact be found in the
IHI’s own literature. The IHI’s Model for Improvement (MFI) details the stages
involved in a healthcare improvement project but does not discuss the use of lean
thinking process models within any of these stages (IHI 2003).
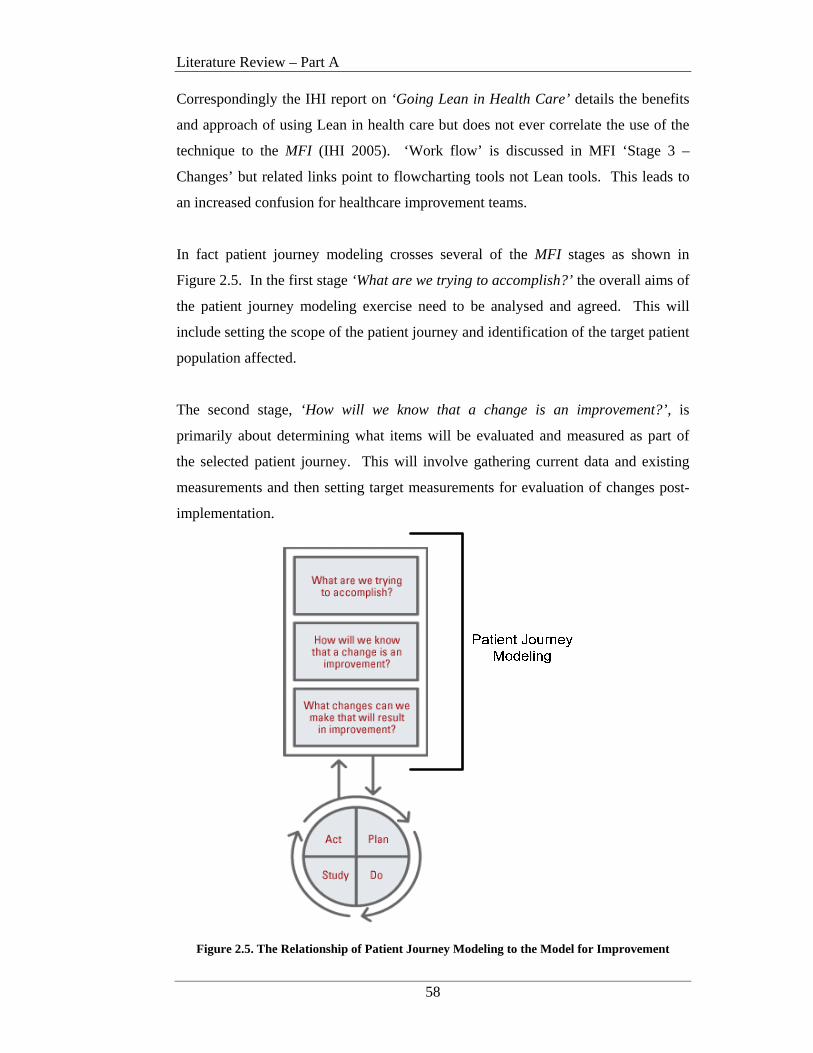
Literature Review – Part A
58
Correspondingly the IHI report on ‘Going Lean in Health Care’ details the benefits
and approach of using Lean in health care but does not ever correlate the use of the
technique to the MFI (IHI 2005). ‘Work flow’ is discussed in MFI ‘Stage 3 –
Changes’ but related links point to flowcharting tools not Lean tools. This leads to
an increased confusion for healthcare improvement teams.
In fact patient journey modeling crosses several of the MFI stages as shown in
Figure 2.5. In the first stage ‘What are we trying to accomplish?’ the overall aims of
the patient journey modeling exercise need to be analysed and agreed. This will
include setting the scope of the patient journey and identification of the target patient
population affected.
The second stage, ‘How will we know that a change is an improvement?’, is
primarily about determining what items will be evaluated and measured as part of
the selected patient journey. This will involve gathering current data and existing
measurements and then setting target measurements for evaluation of changes post-
implementation.
Figure 2.5. The Relationship of Patient Journey Modeling to the Model for Improvement
Literature Review – Part A
59
In the third stage, ‘What changes can we make that will result in improvement?’,
changes that need to be made to improve the current situation are identified. It is at
this point that the MFI mentions eliminating waste, improving ‘workflow’ processes,
error proofing, variation and changes to work environment. As mentioned earlier
these are the primary areas of concern in patient journey modeling and it is at this
point that the visual representation of the patient’s journey in the form of a model
should be produced. This will involve modeling the current journey, identifying
problem areas, suggesting and analysing potential changes and then deciding which
changes will made, by who and when.
A future patient journey model should then be developed (using the same process
modeling technique) showing how the improved journey will operate. Process
models in the form of flowcharts are discussed in this stage on the IHI website but
are ‘buried’ four levels down from the MFI entry point. There is no mention of Lean
Thinking process models in this hierarchy at all.
Once the current and future patient journey models are developed and the change
priority confirmed, changes can begin to be implemented on a ‘pilot’ basis. This is
the goal of the Plan-Do-Study-Act (PDSA) cycles. Output from the PDSA cycles
are fed back into the preceding stage to determine the effectiveness of the changes
made and to evaluate if the changes have met the measurement targets previously
set. If changes are found to have the desired improvement results they are gradually
implemented on a wider scale. If anomalies are still present, the redesign team
reviews the patient journey models for further improvement opportunities.
2.3.3.2 Six Sigma
Six Sigma has been used in healthcare improvement projects to varying degrees and
uses Process Maps in the form of Flowcharts to model the patient journey (Sehwail
and DeYong 2003; IHI 2004; iSix Sigma Healthcare 2005). Six Sigma is a method
for improving productivity and profitability and uses the disciplined application of
statistical problem-solving tools to identify and quantify waste and indicate steps for
improvement (Motorola University 1994).
Literature Review – Part A
60
Sigma (the Greek letter σ) is used in statistics to denote the standard deviation, a
statistical measure of variation.
True Six Sigma demands no more than 6 standard deviations from the mean or not
more than 3.4 defects per million parts produced (Motorola University 1994; Keller
2005; Brue and Howes 2006).
Originally used for improving manufacturing processes, Six Sigma is now used in a
wide variety of areas including services provision, business processing and
healthcare (Sehwail and DeYong 2003; Brue 2005; iSixSigma Healthcare 2006).
The first significant Six Sigma initiative was implemented by Motorola in the 1980’s
with Motorola claiming to have generated savings of $15 billion during the first 10
years of use. Other success stories include GE, Allied Signal , DuPont and Mount
Carmel Health System, with savings of $12 billion, $1.4 billion, $1.6 billion and
$35.8 million respectively (Brussee 2005; Brue and Howes 2006).
The Six Sigma methodology uses a specific problem-solving approach supported by
selected Six Sigma tools, to improve processes and production. The methodology is
data-driven and customer focused with the main goal being to reduce unacceptable
products or events. Strong emphasis is given to the use of statistics as tools for
interpreting and clarifying data with focus primarily on improving measurable
financial results. Other target areas include improvements to customers, employees
and process quality (Brussee 2005; Brue and Howes 2006).
Some projects actually combine Six Sigma with Lean Management to leverage the
benefits of both techniques. Examples of combining these techniques can be found
in both books and electronic source (George 2003; iSixSigma Healthcare 2006).
Literature Review – Part A
61
DMAIC is the problem solving methodology used in Six Sigma. The methodology
generally consists of five phases (iSix Sigma Healthcare 2005).
Define the problem, along with the project scope, goals and expected
deliverables.
Measure the ‘as-is’ process, through development of detailed process-level maps
and cost, quality and schedule metrics.
Analyse the current process flow and metrics to determine sources of variation and
non-value added activities. Determine possible solutions.
Improve the ‘as-is’ situation by eliminating identified defects and implementing
new process flows.
Control involves standardising implemented changes and monitoring the actual
impact of the improvements against expectations.
High level processes are outlined in the Define phase and can take the form of a
SIPOC diagram. Process Maps or Flowcharts are used in the Measure, Analyse
and Improve phases to construct a detailed picture of the ‘as-is’ and ‘improved’
process flows respectively.
Even though Six Sigma in its entirety is a complex improvement method, the patient
journey models produced using process maps are very basic and as such are unable
to capture the complexities associated with the processes, people and systems
involved in healthcare improvement. In fact the notation set does not contain a
symbol to represent a person, be it a patient or healthcare worker or the information
involved in their interactions. It is also not possible to explicitly relate process
measurements to a process on the model. All measurements are calculated using a
separate tool that has no symbolic relationship to a process on the model.
2.3.3.3 ARIS
The ARIS Business Process Modeling Toolset was first published in 1994 by Prof.
August-Wilhelm Scheer (Scheer 1994). Reportedly servicing over 6,000 customers
in over 70 countries, ARIS is considered a leader in the business process modeling
domain (IDS Scheer 2004).

Literature Review – Part A
62
ARIS presents a method for analysing processes and takes a holistic view of process
design, management, workflow and application processes. The framework is
presented as the ‘ARIS House’ and is a concept for describing business processes at
three main levels: Enterprise, Business Process and Information Systems (Scheer
1998). ARIS provides modeling methods for a number of different views that when
combined form a complete picture of the required information system. Modeling is
supported by the ARIS Toolset software system (Scheer 1994).
The ARIS House
In a bid to reduce the complexity of the relationships amongst the classes in the
business process model, as they exist at differing levels of abstraction, Scheer groups
classes with similar semantic relationships into ARIS views. The introduction of the
ARIS House views aid in structuring and streamlining business process models and
reducing redundancy (see Figure 2.6).
Figure 2.6 The ARIS House Views (Scheer 1998)
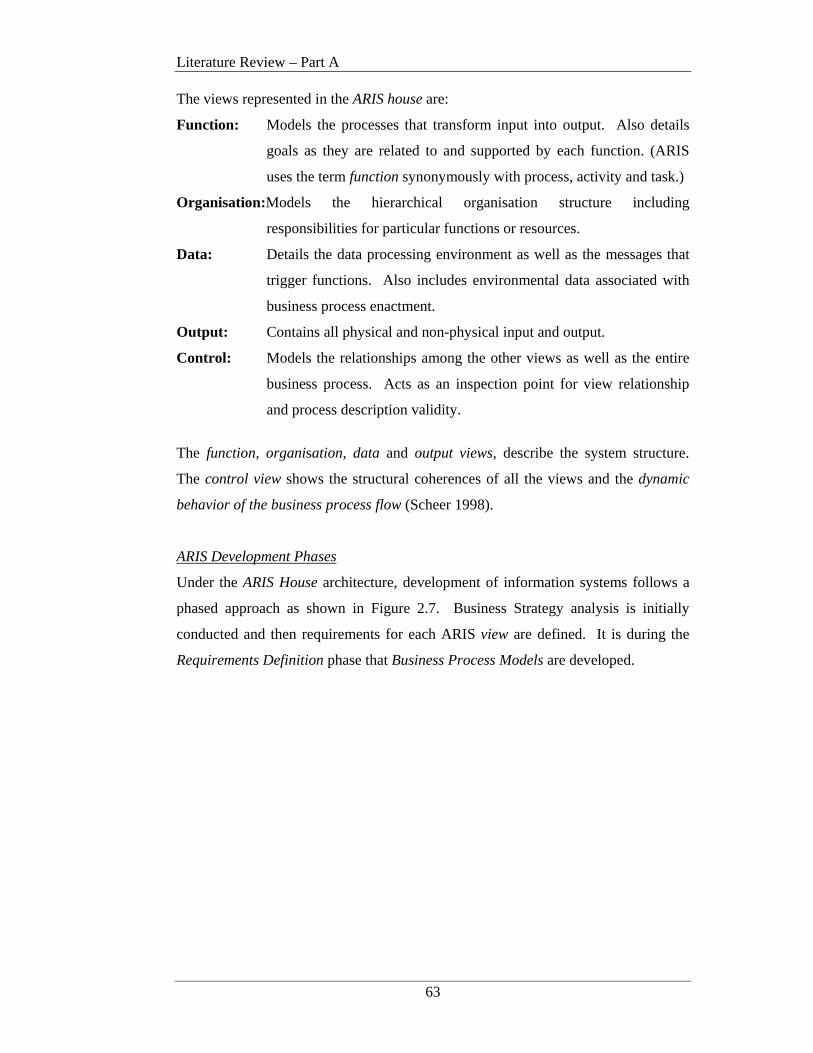
Literature Review – Part A
63
The views represented in the ARIS house are:
Function: Models the processes that transform input into output. Also details
goals as they are related to and supported by each function. (ARIS
uses the term function synonymously with process, activity and task.)
Organisation:Models the hierarchical organisation structure including
responsibilities for particular functions or resources.
Data: Details the data processing environment as well as the messages that
trigger functions. Also includes environmental data associated with
business process enactment.
Output: Contains all physical and non-physical input and output.
Control: Models the relationships among the other views as well as the entire
business process. Acts as an inspection point for view relationship
and process description validity.
The function, organisation, data and output views, describe the system structure.
The control view shows the structural coherences of all the views and the dynamic
behavior of the business process flow (Scheer 1998).
ARIS Development Phases
Under the ARIS House architecture, development of information systems follows a
phased approach as shown in Figure 2.7. Business Strategy analysis is initially
conducted and then requirements for each ARIS view are defined. It is during the
Requirements Definition phase that Business Process Models are developed.
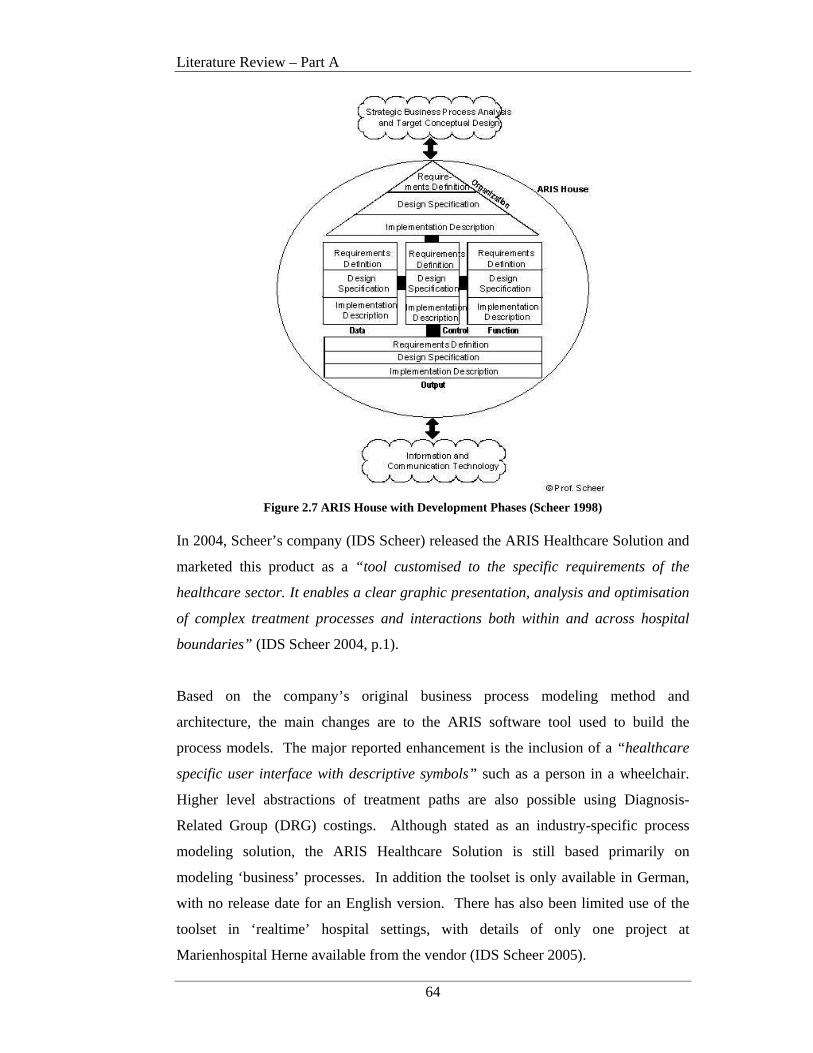
Literature Review – Part A
64
Figure 2.7 ARIS House with Development Phases (Scheer 1998)
In 2004, Scheer’s company (IDS Scheer) released the ARIS Healthcare Solution and
marketed this product as a “tool customised to the specific requirements of the
healthcare sector. It enables a clear graphic presentation, analysis and optimisation
of complex treatment processes and interactions both within and across hospital
boundaries” (IDS Scheer 2004, p.1).
Based on the company’s original business process modeling method and
architecture, the main changes are to the ARIS software tool used to build the
process models. The major reported enhancement is the inclusion of a “healthcare
specific user interface with descriptive symbols” such as a person in a wheelchair.
Higher level abstractions of treatment paths are also possible using Diagnosis-
Related Group (DRG) costings. Although stated as an industry-specific process
modeling solution, the ARIS Healthcare Solution is still based primarily on
modeling ‘business’ processes. In addition the toolset is only available in German,
with no release date for an English version. There has also been limited use of the
toolset in ‘realtime’ hospital settings, with details of only one project at
Marienhospital Herne available from the vendor (IDS Scheer 2005).
Literature Review – Part A
65
Green and Rosemann (2000) evaluated the ARIS process modeling method using the
Bunge-Wand-Weber representation model. This representation model provides an
ontology that can be applied to the evaluation of the grammar used to develop
information system models. The ARIS evaluation concluded that the use of the
process view alone is not sufficient to model all the real-world constructs required.
This suggests that in the complex arena of healthcare improvement, additional views
are needed to adequately represent the entire problem domain.
2.3.3.4 Unified Modeling Language
Unified Modeling Language (UML) is the notation used to develop object-oriented
artifacts including diagrams and textual specifications. UML is not a method itself
but provides a variety of models and diagrams to support any type of object-oriented
development methodology (Beeler et al. 1999; Health Level 7 2003; Object
Management Group 2006).
Numerous object-oriented (OO) approaches abounded in the early 1990’s and it was
during this period that Rational Software began attempts to bring the most popular of
these approaches together. By 1995 Rational had employed three leading OO
developers: Jim Rumbaugh, Grady Booch and Ivor Jacobson and this team began to
look at ways to unite their complimentary approaches. The Unified Modeling
Language (UML) we know today evolved from this work with the draft specification
for version 1.0 proposed to the Object Management Group (OMG) in 1997 (Object
Management Group 1997). The latest version, UML 2.0 was formalised in 2005
(Object Management Group 2005).
The key benefits of the UML approach relate to the fact that the language and its
tools (diagrams) can be used throughout the systems development process from
gathering systems requirements to implementation of the final system. As a general
purpose modeling language UML bridges the communication gaps that often exist
between analysts, designers and developers (Unhelkar 2005). UML can be used to
model a myriad of system types including software systems, hardware systems and
real-world organisations.
Literature Review – Part A
66
UML’s main contribution to the healthcare domain is its use in the development of
the Health Level 7 (HL7) Reference Information Model (RIM). The RIM model is
part of “a comprehensive framework and related standards for the exchange,
integration, sharing and retrieval of electronic health information that supports
clinical practice and the management, delivery and evaluation of health services”
(Health Level 7 2005). The HL7 suite of standards is developed by Health Level
Seven Inc in collaboration with a wide variety of HL7 ‘member’ institutions. Health
Level Seven Inc is a Standards Developing Organisation that is accredited by the
American National Standards Institute. Founded in 1987 to produce a standard for
hospital information systems, HL7 is currently the predominate standard for the
interfacing of clinical data in most institutions (Health Level 7 2005).
Major projects using HL7 standards to support Electronic Health Records (EHR) and
clinical data exchange are underway in the U.S., UK, the Netherlands, Canada,
Germany and Croatia (Health Level 7 2005).
A major issue with HL7 in relation to this research is the fact that the RIM deals
mainly with modeling of the data required to pass information between information
systems (Health Level 7 2005). Modeling of the processes involved is only
conducted for the purposes of capturing the data a process needs to communicate
with other processes.
Therefore if process modeling for descriptive purposes is required, another HL7
compatible (that is, UML based) modeling tool needs to be used. Use of such a
UML-based model allows for relatively seamless translation from analysis-to-
design-to-system specification and implementation in HL7 compliant environments.
A HL7 compatible tool that is appropriate is UML’s Business Process Modeling
Notation (BPMN). BPMN addresses the issue of modeling real-world organisations
and was developed by the Business Process Management Initiative (BPMI) Domain
Task Force (Object Management Group 2006). This work focus’ on all aspects of
business process management and has been adopted as an official Object
Management Group (OMG) specification (2006).

Literature Review – Part A
67
The primary goal of BPMN is to provide a notation that is readily understood by the
complete range of stakeholders involved in business system development. Many
users refer to this technique as the ‘swimlane’ model. In addition the notation
ensures “that XML languages designed for the execution of business processes, such
as BPEL4WS (Business Process Execution Language for Web Services), can be
visualised with a business-oriented notation” (Object Management Group 2006).
OMG states that this approach represents the amalgamation of best practices within
the business process modeling community (Object Management Group 2006).
BPMN however fails to accommodate the provider strategy, patient needs or
decision support system requirements. In addition the models are not patient-centric
and do not clearly identify care handovers. The ability to define a role type and skill
level or organisational responsibility for resources is also absent.
NB: A full and detailed description of the modeling notation and semantics used by
these methods/techniques along with a case study example of the models ‘in action’
will be presented in Chapter 5 as part of the assessment of these methods/techniques
and their degree of support for modeling process improvement within the healthcare
domain.
2.3.4 Conclusions and Implications for Patient Journey Modeling Research
Much of the recent research into improving healthcare has centered on reducing
variability, improving patient safety and enabling change through the use of
technology. These concentrations are a direct result of the Institute of Medicine
(IOM) two keystone reports into the American healthcare system; “To Err is
Human: Building a Safer Health System” and “Crossing the Quality Chasm and the
UK’s NHS healthcare crisis.
Leadership in healthcare quality improvement is currently being provided by the
Institute for Healthcare Improvement and England’s NHS, although many papers can
be found on individual process improvement initiatives worldwide. Although
process modeling is acknowledged as an important aspect of healthcare
improvement, all of the methods and techniques adopted to date have been taken
from other fields such as manufacturing, management and computing. However
Literature Review – Part A
68
very few publications question the validity of this situation and none of these works
actually formally evaluate the level of support afforded to healthcare process
improvement by these methods (Young et al. 2004; Ben-Tovim 2005; IHI 2005;
NHS Modernisation Agency 2005).
At a generic level Ivari et al (2001) proposed a comprehensive framework for
classifying IS methodologies and approaches but this work does not assess the
effectiveness of the modeling techniques that a method or approach may employ.
To date the Healthcare domain lacks a design and modeling methodology and
associated tools adequately tailored to support the specific requirements involved
with redesigning the patient journey from a patient-centric perspective. A reason for
this was eluded to in a recent publication by Jensen et al. (2006) when they
suggested that “a complex concept such as patient flow in healthcare must always
involve elements of seeming incongruity that ultimately come together as a
meaningful whole” ( p.1). They went on to state that improving patient flow
involved looking at the problem from a series of different perspectives or ‘lenses’
and that such an approach permitted a more acute view of the problem that was
applicable to any initiative designed to improve flow. This supports the multi-
dimensional approach for patient journey modeling as presented in Chapter 4 and
relates to research hypotheses 1 and 2 from Chapter 1.
The dominant change agents within the healthcare domain, the IHI and NHS,
promote the use of the Model for Improvement for healthcare redesign but this
method lacks a robust healthcare specific modeling technique for capturing the
multiple dimensions associated with delivering safe, high quality patient journeys.
Although the IHI and NHS suggest using Lean Thinking and flowcharts to analyse
work flow, these techniques are not a core component of the overall improvement
approaches in either organisation’s literature.
Apart from Lean Thinking and flowcharts, other process modeling techniques are
also used to varying degrees within the domain including ARIS and UML. However
none of these methods cover ALL of the critical areas such as the capture of
organisational goals, the socio/economic and cultural needs of patients, information
Literature Review – Part A
69
systems requirements or support for automated workflows and ongoing decision
support. In addition none of the methods are patient centric or identify
discontinuities of care or patient handovers or explicitly link evidence-based best
practice to processes on the model. The ability to define the role type and skill level
required to deliver a particular clinical treatment and who is responsible for a given
physical resource is also lacking.
Although many works dealing with healthcare improvement and process modelling
have been published, all with the exception of Curry et al. (2005), discuss either
individual project implementations or problems with improvement at a higher level
of abstraction to this research. They do not discuss the level of support provided by
the process modelling techniques employed.
When comparing process reliability and the need for improvement, with other
industries, Resar claims that health care clinicians successfully apply proven medical
evidence less than 80% of the time. Such a “low level of reliability at the basic
process level means that health care’s efforts to improve reliability start from a
different baseline (to other industries), and therefore may require a different
approach” (Resar 2006, p.1678). He suggests that part of this difference may be due
to the fact that healthcare settings vary from other types of industries in four key
areas:
a) extreme dependence on hard work and personal vigilance;
b) a focus on mediocre benchmark outcomes rather than process;
c) great tolerance of provider autonomy; and
d) a failure to create systems that are specifically designed to reach articulated
reliability goals (Resar 2006).
When combined with the deficiencies outlined above this confirms that open
research questions still exist concerning the appropriateness of applying non-
healthcare specific process modeling techniques to healthcare process improvement
projects.
Literature Review – Part A
70
In addition many initiatives to date have focused on improving the way patients
move through the Emergency Department (ED) as this is the public-face that the
community interacts with in times of crisis. But attempts to improve patient flow
that focus only on the ED miss the larger picture: effective patient flow is a property
of the entire system and can only be optimised at the system level (IHI 2007). This
suggests that any new work must not only consider clinical improvements or flow
but must take a holistic view of the entire healthcare continuum including the people
patients interact with, information created/transformed and improvement
measurement criteria as an example.
Due to the huge worldwide interest in improving healthcare delivery and therefore
the fundamental processes enacted in the provision of high quality care, accurate and
comprehensive modelling of the patient’s journey is of critical importance. This
suggests that focussed attention needs to be given to the development of a domain
specific improvement architecture, that is, a patient journey modelling meta-
methodology that can be used to:
1. Assess the levels of support provided by current modelling tools and techniques
and
2. Develop new multi-dimensional healthcare specific patient journey modeling
tools and techniques.
Development of such a construct presents a solution to research hypotheses 1, 2 and
3.
Literature Review – Part A
71
2.4 Healthcare Strategy
Strategy is defined as “a detailed plan for achieving success in situations such as
war, politics, business, industry or sport” (Cambridge University Press 2006). The
strategy of an organisation is derived from the Vision and or Mission statements as
defined by the Board or Executive Committee. To ensure that healthcare redesign
activities have a solid direction and purpose, the strategy of the healthcare provider
must be documented and well understood by management and the redesign team. A
key strategic management system widely used in many domains including health is
the Balanced Scorecard.
The major works in the area of Balanced Scorecard are Kaplan and Norton in the
Harvard Business Review (1992; 1993; 1996; 2000). Many books have also been
written in this area with key publications by Kaplan and Norton (1996), Olve (2000)
and Nair (2004).
2.4.1 Strategy Analysis
The strategy of a Healthcare Organisation (HCO) will determine the overall direction
the organisation’s leadership has set, including services to be offered, quality of care
targets, human resources policy and financial objectives.
Healthcare strategy setting and performance measurement has seen increased interest
in the last 10 years. This has resulted from key reports into improving the quality of
healthcare and patient safety such as “To Err is Human: Building a Safer Health
System” (Kohn et al. 1999) and “Crossing the Quality Chasm” (Committee on
Quality of Health Care in America 2001). The UK’s National Health Service (NHS)
Institute for Innovation and Improvement program is also strongly grounded in the
development of a sound strategy, as demonstrated in the “NHS Plan: a plan for
investment, a plan for reform” (UK Department of Health 2000). Many countries
have also developed measurement frameworks or toolkits to guide standardised
measurement within their organisations (Ontario Hospital Association 1999;
Australian Commission on Safety and Quality in Health Care 2006; JCAHO 2006).
Inamdar and Kaplan (2002) suggest that HCOs driven by a strategy of improving
consumerism demonstrate the greatest performance improvements.

Literature Review – Part A
72
This research proposes the use of a Balanced Scorecard approach to Healthcare
Strategy implementation as part of the patient journey modeling initiative.
2.4.2 Balanced Scorecards
The Balanced Scorecard is (BSC) is an instrument that translates the mission and
strategy of an organisation into a broad collection of action metrics and indicators
that subsequently provide the structure necessary to serve as a control and strategic
measurement system (Kaplan and Norton 1992; Kaplan and Norton 1996).
Robert Kaplan and David Norton developed the Balanced Scorecard in the early
1990s. It arose from extensive research work conducted with 12 leading edge
performance measurement companies in the United States. The study concluded that
financial measures alone are insufficient for managing complex and ever-changing
business environments, especially as organisations become more customer-driven
and look to leverage their intellectual capital and knowledge-based assets (Kaplan
and Norton 1992).
Kaplan and Norton’s work found that:
executives understand that traditional financial measures alone, such as
return-on-investment and earnings-per-share can give misleading signals for
continuous improvement and innovation (1992).
Their work demonstrates that financial measures are not the only area that managers
should consider when assessing the ‘health’ of the business. The major outcome of
the original year-long project was the proposal that an organisation’s mission and
strategy should be translated into strategic objectives with four (4) broad categories
of measurement focus namely: Customer Perspective, Internal Business Perspective,
Innovation and Learning Perspective and Financial Perspective. Inclusion of these
perspectives provide a balance between short and long-term objectives, financial and
non-financial measures and external and internal performance indicators (Inamdar
and Kaplan 2002). Figure 2.8 presents Kaplan and Norton’s original BSC
perspectives.

Literature Review – Part A
73
FINANCIAL PERSPECTIVE
Goals Measures
How Do We Look ToOur Shareholders?
CUSTOMER PERSPECTIVE
Goals Measures
How Do CustomersSee Us?
What Must We ExcelAt?
INTERNAL BUSINESSPERSPECTIVE
Goals Measures
INNOVATION ANDLEARNING PERSPECTIVEGoals Measures Can We Continue To
Improve and CreateValue?
Figure 2.8 The Original Balanced Scorecard Perspectives (Kaplan and Norton 1992)
Customer Perspective
The central question in this perspective: “How do our customers see us?”, looks at
how the organisation is performing from the viewpoint of the customer. Customers
are most concerned with time, quality, performance and service and cost. The
understanding of what constitutes ‘value’ in these areas for the organisations specific
target customers is the primary focus. To put the BSC into practice for this
perspective, organisations should define objectives for time, quality, performance
and service and cost and then translate these objectives into specific measures at the
operational level (Kaplan and Norton 1992).
Internal Business Perspective
Definition of the Customer Perspective points to what internal processes the business
must excel at to meet the set objectives. Managers must concentrate on the critical
internal operations that will enable them to satisfy customer needs. Organisations
should decide what processes and operations they must excel at and specify
measures for each (Kaplan and Norton 1992).
Literature Review – Part A
74
Innovation and Learning Perspective
Unfortunately customers needs and business environments are not stagnant and
therefore organisations must continually improve current products and look to
introduce new and innovative products and services just in time for market
requirements. Objectives here are set around working smarter with not only existing
technology and staff but also efficient adoption of new technology and training
(Kaplan and Norton 1992). This perspective defines the core competencies and
skills, the technologies and the corporate culture required to support the overall
strategy. These objectives enable an organisation to align its human and IT
resources with its strategy (Kaplan and Norton 2000).
Financial Perspective
“How do our shareholders/stakeholders see us?” is the key question in this
perspective and typically involves financial goals for profitability, growth and
shareholder value. Measures here indicate if the organisation’s strategy
implementation is contributing and improving the bottom-line (Kaplan and Norton
1992). In cost containment environments such as public healthcare, stakeholders
include the Federal and State governments as well as Local Area Health Services,
patients and health care workers and these are at the forefront of objective setting in
this perspective.
Fiscal benefits from improved business processes are typically realised in stages.
Short-term benefits are created from cost savings in increased operational
efficiencies and process improvements. Revenue growth or cost containment from
improved customer relationships accrues in the medium-term. Long-term fiscal
improvements result from increased innovation and use of new technologies and
systems.
Literature Review – Part A
75
2.4.3 Balanced Scorecards in Healthcare
Several researchers have suggested that the Balanced Scorecard strategic planning
methodology and performance measurement framework can be directly and
successfully applied to the healthcare sector. Results include improved market
position, financial results and customer satisfaction (Forgione 1997; Voelker et al.
2001; Inamdar and Kaplan 2002; Urrutia and Eriksen 2005).
In 1997 a forum involving prominent researchers from Australia, Belgium, Canada,
Finland, France, Germany, Hungary, Italy, Japan, The Netherlands, Norway, Poland,
Spain, Sweden, the United Kingdom, and the United States resulted in an
International call for the use of "balanced-scorecard" reporting by health care
providers. This was to include ‘both financial and quality performance measures-
both for internal use and for external disclosures to the purchasing public' (Forgione
1997).
Evidence of the adoption of the Balanced Scorecard within the healthcare sector is
found in write-ups of implementation experiences of several prominent healthcare
organisations such the Mayo Clinic, Duke University Medical Centre, John Hopkin’s
hospital, the Henry Ford Health System, the Burn Center of the University of
Colorado Health Sciences Center and the U.S. Army Medical Department (Wachtel
et al. 1999; Curtright et al. 2000; Holt 2001; Meliones 2001; Voelker et al. 2001).
Performance measurement became commonplace in healthcare in the 1990s. In the
U.S., the Joint Commission on Accreditation of Healthcare Organisations (JCAHO)
accredits over 18,000 healthcare organisations through the use of performance
measures (JCAHO 2006; JCAHO 2006). In a project conducted by Inmadar and
Kaplan (2002) involving nine American healthcare organisations they found that
healthcare executives viewed BSC as being advantageous over other performance
measurement systems due to the fact that it:

Literature Review – Part A
76
• Did not focus on narrow regulatory, clinical or diagnostic operations.
• Offered better timeliness and forward-looking indicators.
• Captured the complexity and interrelationships of strategy and operational
alignment including tradeoffs among quality and costs.
• Complemented existing measurement systems by guiding process
improvement at the operational level.
More recently Health Care Organisations (HCOs) have been adapting Kaplan and
Norton’s initial four perspectives to more clearly define and measure those
objectives and indicators that are most relevant to them (Ontario Hospital
Association 1999; Urrutia and Eriksen 2005).
Since 1998, the Hospital Report Research Collaborative (HRRC) have developed
methods and reports on hospital performance in Ontario, using the balanced
scorecard format, resulting in one of the most comprehensive sets of internationally
available performance measurement reports in the public domain (Ontario Hospital
Association 1999).
In the 1999 Hospital Report (Ontario Hospital Association 1999), the Ontario
Hospital Association introduced and subsequently enhanced balanced scorecards for
Ontario hospitals. The original perspectives were adapted to describe four broad
areas (quadrants) of activities and outcomes considered more relevant to healthcare
evaluation. The adapted perspectives cover assessment in the areas of Patient
Satisfaction, Financial Performance, Clinical Utilisation and Outcomes and System
Integration and Change (see Figure 2.9).
• Patient Satisfaction: Examines patients' perceptions of their hospital
experience including their perceptions of overall quality of care, outcomes of
care, and unit-based care.
• Financial Performance and Conditions: Describes how hospitals manage
their financial and human resources. It refers to a hospital's financial health,
efficiency, management practices, and human resource allocations.
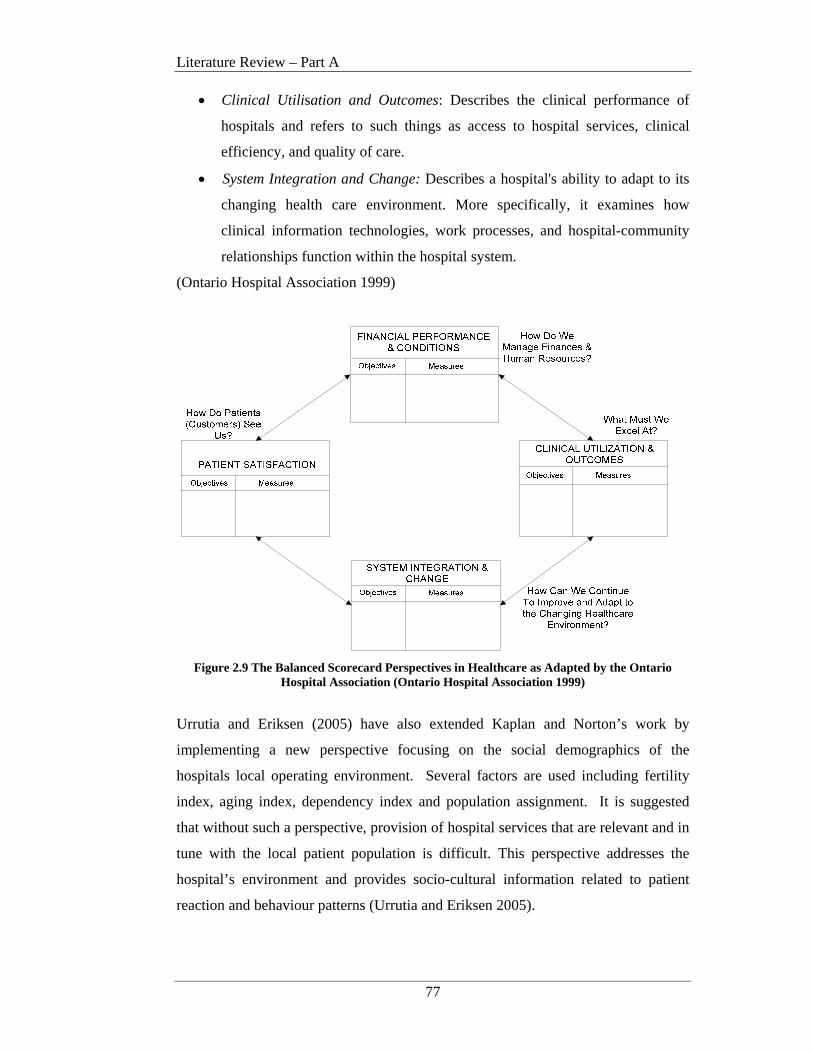
Literature Review – Part A
77
• Clinical Utilisation and Outcomes: Describes the clinical performance of
hospitals and refers to such things as access to hospital services, clinical
efficiency, and quality of care.
• System Integration and Change: Describes a hospital's ability to adapt to its
changing health care environment. More specifically, it examines how
clinical information technologies, work processes, and hospital-community
relationships function within the hospital system.
(Ontario Hospital Association 1999)
Figure 2.9 The Balanced Scorecard Perspectives in Healthcare as Adapted by the Ontario
Hospital Association (Ontario Hospital Association 1999)
Urrutia and Eriksen (2005) have also extended Kaplan and Norton’s work by
implementing a new perspective focusing on the social demographics of the
hospitals local operating environment. Several factors are used including fertility
index, aging index, dependency index and population assignment. It is suggested
that without such a perspective, provision of hospital services that are relevant and in
tune with the local patient population is difficult. This perspective addresses the
hospital’s environment and provides socio-cultural information related to patient
reaction and behaviour patterns (Urrutia and Eriksen 2005).
Literature Review – Part A
78
Such extensions to the original BSC work now see a growing number of HCOs
adopting the Balanced Scorecard technique as a way of managing their human and
physical resources and the resulting quality of patient care. This is due in part to the
increasing public scrutiny that HCO’s are being subjected to and has led to the
development of new corporate-wide indicators that better reflect the healthcare
environment (Ontario Hospital Association 1999; Lemieux-Charles et al. 2003;
Urrutia and Eriksen 2005). This research will use the OHA BSC adaptations.
2.4.4 Conclusions and Implications for Patient Journey Modeling Research
High level objectives and targets outlined in the HCO strategy become the driver for
process improvement measurement criteria at the operational level. The analysis of
variances to these expected targets help executive management to determine if the
strategy is being or will be met. Use of the Balanced Scorecard Perspectives drive
the definition of a clear and concise HCO strategy and operationalisation of the high
level targets are at the grass roots level of process redesign activities.
In the complex environment of healthcare reporting, alignment of operational
activities and measurements to the strategic direction of the organisation is critical.
When structures, processes and culture aren't closely and carefully aligned with
strategy, the organisation almost invariably suffers and struggles to meet strategic
targets. Alignment is the creation and development of the structures, processes and
culture that stimulate the people inside an organisation to make the right choices in
the thousands of actions and decisions they confront each day (Koopman 1999).
The research within this section demonstrates that (adapted) Balanced Scorecards
(BSCs) are helping healthcare organisations to define and operationalise their
strategy in a more concise manner. This suggests that improvement architectures
that represent the healthcare provider strategy using a BSC approach can be of
benefit to healthcare improvement programs. It is also critical however that the
measures defined in the BSC perspectives are explicitly linked to the redesigned
operational processes. That is, each and every metric that is set for a process that is
to be enacted as part of a patient’s journey must be able to be traced back to a
strategic BSC.
Literature Review – Part A
79
However in the main, current healthcare process modeling techniques fail to
accommodate this. Value stream maps (Lean Thinking), flowcharts and swimlane
models (BPMN) do not consider the organisation’s strategy or how the measurement
of operational activities can be linked to the strategy. ARIS does consider the
analysis of the business strategy but does not have any mechanism for explicitly
linking the strategy to a process, its enactment or its performance evaluation metrics,
at the operational level.
This indicates that the structures, processes and culture resulting from healthcare
redesign efforts may not be fully aligned with the healthcare provider strategy,
leading to a failure to meet pre-defined strategic targets.
Chapter 3 now considers the use of readily available technologies as an enabler of
the concepts described in this chapter.
Literature Review – Part B
80
CHAPTER 3 LITERATURE REVIEW - PART B
3.1 Introduction
Chapter 3 forms the second part of the literature review for this research and
addresses with the key areas of study in relation to technology’s role in supporting
healthcare redesign. Whereas Chapter 2 dealt with process improvement in relation
to modeling the improved patient journey and linking this to the organisation’s
strategy, this chapter is concerned with the role technology can play as a key enabler
in the march towards improved healthcare services.
The review of readily available technology for the purposes of supporting patient
journey modeling activities speaks to research hypothesis 4.
Jensen et al. (2006) state that “technology should always be marshaled in the service
of a simple but important goal – quality, safety and service.” (p.122) This statement
supports the goals of this research and indicates that valid areas of investigation still
exist in the bid to deliver such technology support goals.
From Chapter 2 it can be seen that the push for healthcare reform has necessitated a
review of the incumbent patient journey/s and the processes being followed to
deliver safe, high quality care. A key related focus area has been the use of
information technology and systems to enable efficiency improvements for
individual or groups of redesigned processes resulting from patient journey modeling
exercises.
Literature Review – Part B
81
This Chapter will investigate the impact of a number of current technologies, the role
these technologies need to play and the technological deficiencies being experienced
by healthcare improvement initiatives . Several key areas are applicable in the
discussion concerning technology support for patient journey modeling (PJM)
including:
• Automated workflow and workflow management systems;
• Decision support for clinical decisions and performance evaluation and
monitoring;
• Database design and storage; and
• Integration and transferability of information between disparate systems.
The relationship of these areas is as follows. Once the future patient journey model
(FPJM) is designed, increased efficiencies may be realised through the automation of
appropriate workflows in the form of workflow management systems.
Complimentary benefits may also be realised by linking workflow systems to up-to-
date clinical knowledge databases that are readily accessible by those delivering
frontline patient care. In addition as part of workflow enactment, actual performance
measurements, as identified in the FPJM exercise should be captured and made
available to management to aid in ongoing decision support regarding resource
allocation and utilisation. Capture and analysis of such data will be supported by
advanced database designs. Consideration must also be given to how information
that is applicable across information systems can be integrated and transferred when
required.
Each of the above areas will be defined and their roles within the PJM landscape
positioned. Open research questions concerning how well these technologies
support and enable healthcare process improvement will also be addressed.
3.2 Workflow and Workflow Management Systems
As part of the redesigned patient journey, certain processes may become targets for
automation. Automation of these workflows through the implementation of
workflow management systems can increase efficiency, enable better process control
and improve customer service (Adams et al. 2003).
Literature Review – Part B
82
The Workflow Management Coalition (WfMC) (www.wfmc.org) is a primary driver
of research in the workflow standards development domain. Much of the research in
this arena has been significantly influenced by past and continuing development
work conducted by the WfMC.
3.2.1 Workflow
Workflow initiatives grew out of the office automation movement in the 1970’s,
with the earliest implementation being recorded as part of a PhD thesis by Zisman in
1977. A significant contribution was made by Clarence Ellis and his ‘OfficeTalk’
software in 1980, with industry adopting the term ‘workflow’ around 1984 (Swenson
1995).
The Workflow Management Coalition (WfMC) defines workflow as:
The automation of a business process, in whole or part, during which
documents, information or tasks are passed from one participant to another
for action, according to a set of procedural rules. (WfMC 1999, p.8)
This includes the analysis and subsequent definition and redesign of the processes
involved. Acknowledging the relationship and support provided by technology, or
the lack thereof, is important to the overall quality improvement effort.
Automated workflow is not meant to replace existing applications, but is a means of
integrating various contributing applications and therefore people, together, for the
purposes of achieving a particular goal (Swenson 1995).
Not all business processes are appropriate candidates for workflow automation.
Those that are best suited for consideration include processes:
• That involve a number of people;
• That require a large number of instances to be tracked;
• That take a long time to complete;
• Where mistakes are expensive;
• That involve people who are geographically dispersed.
(Swenson 1995)

Literature Review – Part B
83
3.2.2 Workflow Management Systems
The re-engineering, sequencing and automation of workflow processes can be
facilitated by the introduction of workflow management systems (WfMC 1995).
A workflow management system (WfMS) is defined as:
A system that defines, creates and manages the execution of workflows
through the use of software, running on one or more workflow engines,
which is able to interpret the process definition, interact with workflow
participants and, where required, invoke the use of IT tools and applications.
(WfMC 1999, p.9)
The key benefits of WfMS include improved efficiency, better process control,
improved customer service, higher maintainability and business process evolution
(Adams et al. 2003). Such systems can provide automated support for enterprise-
wide processing including clinical, management and administrative tasks.
A WfMS is characterised by:
a) the integration of processes and tools to describe and implement the
workflow;
b) the analysis of information flows to detect bottlenecks and discover
anomalies to standard practice; and
c) the description of the workflows and the steps within them, relationships
between the steps, required pre and post-conditions and the rules for
transition between flows (Bricon-Souf et al. 1999).
Figure 3.1 depicts the characteristics of the basic workflow system. Initially
processes are analysed and models developed (PJMs in the case of this research).
Processes that are to be automated are described using machine interpretable
languages such as XML.
These definitions are fed to the WfMS for implementation and enactment. Users
interact with the WfMS and other applications during the conduct of their work.
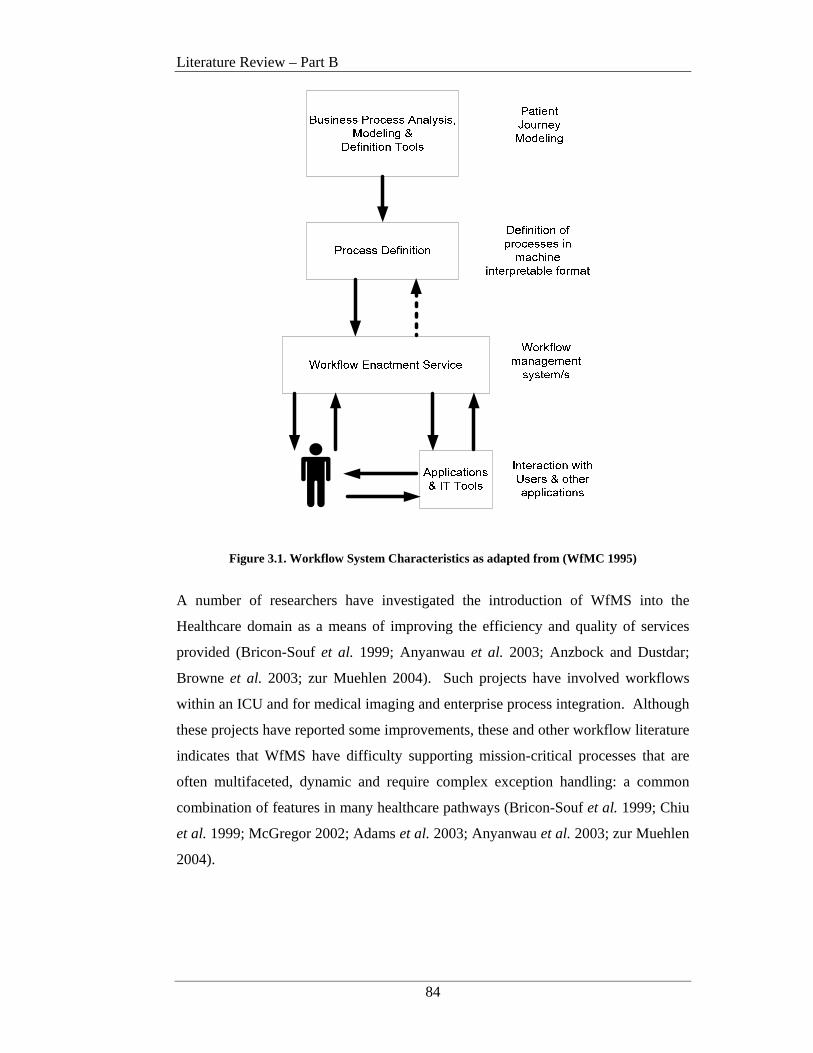
Literature Review – Part B
84
Figure 3.1. Workflow System Characteristics as adapted from (WfMC 1995)
A number of researchers have investigated the introduction of WfMS into the
Healthcare domain as a means of improving the efficiency and quality of services
provided (Bricon-Souf et al. 1999; Anyanwau et al. 2003; Anzbock and Dustdar;
Browne et al. 2003; zur Muehlen 2004). Such projects have involved workflows
within an ICU and for medical imaging and enterprise process integration. Although
these projects have reported some improvements, these and other workflow literature
indicates that WfMS have difficulty supporting mission-critical processes that are
often multifaceted, dynamic and require complex exception handling: a common
combination of features in many healthcare pathways (Bricon-Souf et al. 1999; Chiu
et al. 1999; McGregor 2002; Adams et al. 2003; Anyanwau et al. 2003; zur Muehlen
2004).

Literature Review – Part B
85
3.2.3 Workflow Management Coalition
The Workflow Management Coalition (WfMC) was founded in 1993 for the
purposes of creating and contributing to process related standards and educating the
market on related issues. It is the only standards organisation that concentrates
purely on processes. The WfMC is a global organisation of adopters, developers,
consultants, analysts, as well as university and research groups engaged in workflow
and Business Process Management (BPM) (www.wfmc.org).
The WfMC created XML Process Definition Language (XPDL), the leading process
definition language used to describe, store and exchange process models. The WfMC
has over 300 member organisations worldwide, representing all facets of workflow,
from vendors to users, and from academics to consultants (www.wfmc.org).
A key development of the WfMC is the Workflow Reference Model as shown in
Figure 3.2. The Reference Model identifies the common characteristics of workflow
systems and defines 5 discrete functional interfaces through which a workflow
management system interacts with its environment (WfMC 1995).
Figure 3.2. The WfMC Reference Model (WfMC 1995)

Literature Review – Part B
86
The key to the Reference Model is its approach to interoperability. In short any type
of tool can be used for the conduct of the outer most boxes (ie: process definition,
administration and monitoring, workflow engines etc…), the only requirement is that
they ‘communicate’ with the workflow enactment service via a standard pre-defined
‘interface’ (WfMC 1995). There are five standard interfaces defined, each
addressing a particular component of the Reference Model.
Interface 1 supports the exchange of process definitions between external business
process modeling tools and the workflow enactment service. The interface includes
a common Meta-Model for describing the process definition and also an XML
schema to facilitate the interchange of process definitions between separate products.
The specific language used to define the processes exchanged is known as XML
Process Definition Language or XPDL (WfMC 2005). XML is a common language
for exchanging information amongst disparate systems and will be further discussed
in Section 3.4.
Interface 2 facilitates client application integration with different workflow systems.
It particularly supports the principle of portability and reuse within different
workflow management systems. The interface is specified as a series of workflow
Application Programme Interfaces (APIs) that allow the control of process, activity
and worklist handling functions (Hollingsworth 2004).
Interface 3 was designed to provide a common framework for 3rd party vendors to
integrate other industry applications and services with the Workflow Engine and
Workflow Enactment Services. This interface is a set of standard API’s similar to
Interface 2 (WfMC 1998).
Interface 4 supports process automation across multiple disparate application
implementation platforms. This interface provides for interoperability of the same
business processes in different operating environments (WfMC 1995).
Interface 5 allows consistent audit and administration of workflow cases across
various systems. It defines a common model for audit data and recording which is
output to workflow administration and monitoring tools (WfMC 1995).
Literature Review – Part B
87
3.2.4 Conclusions and Implications for Patient Journe y Modeling Research
One of the goals of patient journey redesign is to consider what workflow processes
should be automated and how these automated processes will be integrated with the
remaining manual processes. In this environment it is apparent that Workflow
Management Systems (WfMS) may offer some of the benefits required by healthcare
redesign projects including opportunities to automate appropriate workflows to
improve efficiencies, increase process control and improve patient services.
However further investigation of how WfMS can be effectively introduced to the
patient journey modeling and design process is needed and should be viewed as an
integral component of proposed process improvement methods.
Consideration needs to be given to the definition of the processes identified as part of
the future patient journey model and how these definitions will be fed/transferred to
an implementation environment. In addition although there is a general push to
automate wherever possible, designers and developers must remain cognisant of the
fact that some workflow literature indicates that WfMS have difficulty supporting
mission-critical processes that are often multifaceted, dynamic and require complex
exception handling: a common combination of features in many healthcare pathways
(Bricon-Souf et al. 1999; Chiu et al. 1999; McGregor 2002; Adams et al. 2003;
Anyanwau et al. 2003; zur Muehlen 2004).
As discussed above, the Workflow Management Coalition (WfMC) has defined the
standards for a Workflow Reference Model and associated XML Process Definition
Language (XPDL) and these will be used to define the patient journey processes
within the context of this research, specifically Interfaces 1 and 5 (WfMC 1995;
WfMC 2005).
The Workflow Reference Model Interface 1 will be used to define those processes
that have been identified as candidates for automation as part of the future patient
journey model. Definition of the XPDL documents will allow the processes being
automated, to be described in machine interpretable language and input directly to a
workflow management system for implementation. An example of the XPDL
process definition relating to the case study used in this research is included in
Appendix C.
Literature Review – Part B
88
As part of the enactment of the workflow processes, specific measurements, as
identified as part of the FPJM, will need to be captured and transmitted to a decision
support system for management analysis and evaluation. This will necessitate the
use of Interface 5. Extensions to the XPDL as reported by McGregor (2002) will be
utilised for this purpose along with additional enhancements as required for PJM.
The case study example of the Interface 5 XML as adapted for this research can be
found in Chapter 8.
Additional extensions are required to both Interface 1 and 5 to accommodate the
definition of specific patient journey metrics and to relate these back to the
healthcare strategy and associated balanced scorecards. Consideration is also given
to categorising processes by treatment stream and type (ie: initial admittance or re-
admittance) and explicitly linking relevant policies and guidelines to the processes
involved in the workflow.
3.3 Decision Support
Management is a process by which organizational goals are achieved using
resources. (Turban et al. 2005, p.7)
Decision making is an integral part of the management of any kind of organisation
(Harrison 1999) and using Turban’s perspective, decision making forms a facet of
almost every activity a manager is required to perform in their daily operations.
Management in healthcare is no exception. In the context of this research we are
considering decisions made regarding the effectiveness and impact on outcomes of
changes made as a result of redesigning a particular patient journey.
To understand the support technology can provide for healthcare decision makers, it
is first relevant to describe the types of decisions that are made and the decision
making process typically undertaken. It is then possible to identify where
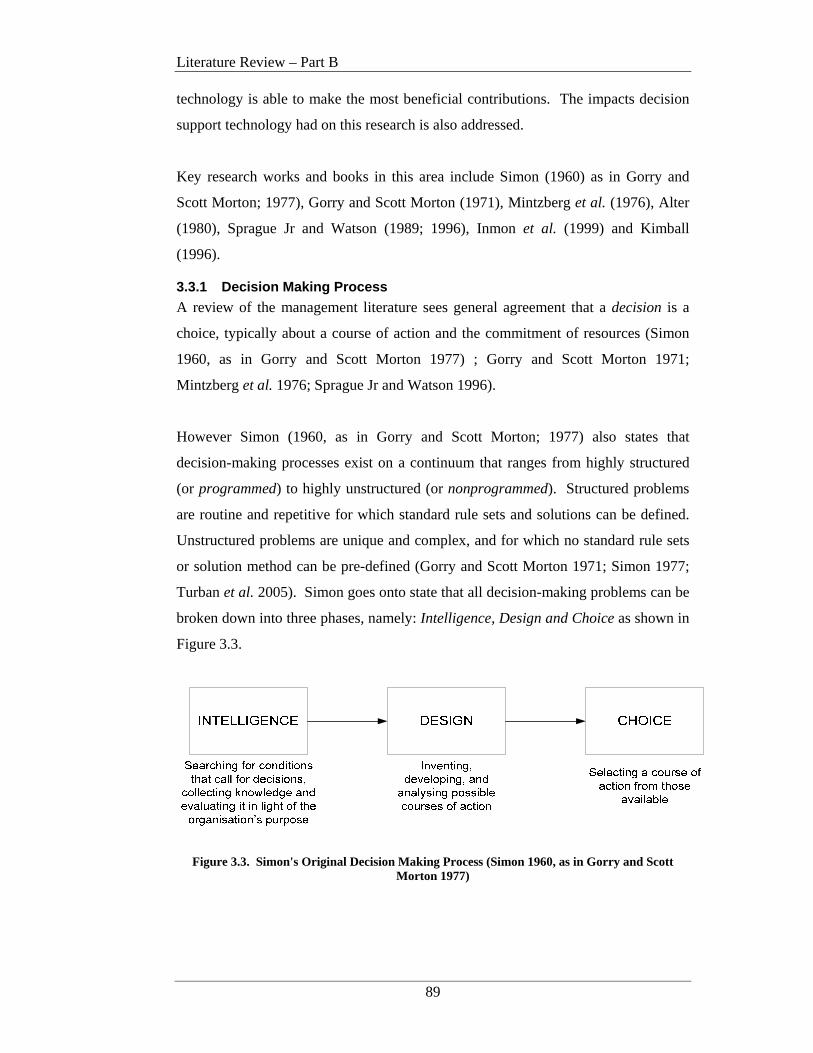
Literature Review – Part B
89
technology is able to make the most beneficial contributions. The impacts decision
support technology had on this research is also addressed.
Key research works and books in this area include Simon (1960) as in Gorry and
Scott Morton; 1977), Gorry and Scott Morton (1971), Mintzberg et al. (1976), Alter
(1980), Sprague Jr and Watson (1989; 1996), Inmon et al. (1999) and Kimball
(1996).
3.3.1 Decision Making Process
A review of the management literature sees general agreement that a decision is a
choice, typically about a course of action and the commitment of resources (Simon
1960, as in Gorry and Scott Morton 1977) ; Gorry and Scott Morton 1971;
Mintzberg et al. 1976; Sprague Jr and Watson 1996).
However Simon (1960, as in Gorry and Scott Morton; 1977) also states that
decision-making processes exist on a continuum that ranges from highly structured
(or programmed) to highly unstructured (or nonprogrammed). Structured problems
are routine and repetitive for which standard rule sets and solutions can be defined.
Unstructured problems are unique and complex, and for which no standard rule sets
or solution method can be pre-defined (Gorry and Scott Morton 1971; Simon 1977;
Turban et al. 2005). Simon goes onto state that all decision-making problems can be
broken down into three phases, namely: Intelligence, Design and Choice as shown in
Figure 3.3.
Figure 3.3. Simon's Original Decision Making Process (Simon 1960, as in Gorry and Scott Morton 1977)
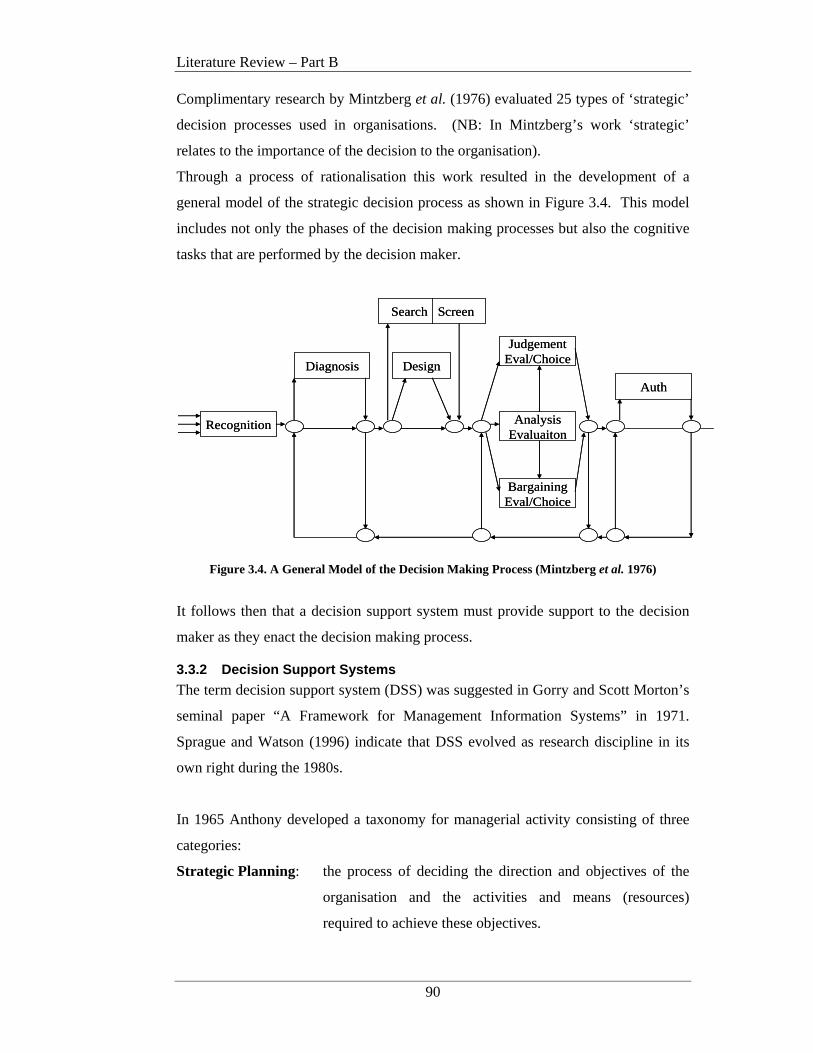
Literature Review – Part B
90
Complimentary research by Mintzberg et al. (1976) evaluated 25 types of ‘strategic’
decision processes used in organisations. (NB: In Mintzberg’s work ‘strategic’
relates to the importance of the decision to the organisation).
Through a process of rationalisation this work resulted in the development of a
general model of the strategic decision process as shown in Figure 3.4. This model
includes not only the phases of the decision making processes but also the cognitive
tasks that are performed by the decision maker.
Recognition
Diagnosis Design
JudgementEval/Choice
AnalysisEvaluaiton
BargainingEval/Choice
Auth
Search Screen
Recognition
Diagnosis Design
JudgementEval/Choice
AnalysisEvaluaiton
BargainingEval/Choice
Auth
Search Screen
Figure 3.4. A General Model of the Decision Making Process (Mintzberg et al. 1976)
It follows then that a decision support system must provide support to the decision
maker as they enact the decision making process.
3.3.2 Decision Support Systems
The term decision support system (DSS) was suggested in Gorry and Scott Morton’s
seminal paper “A Framework for Management Information Systems” in 1971.
Sprague and Watson (1996) indicate that DSS evolved as research discipline in its
own right during the 1980s.
In 1965 Anthony developed a taxonomy for managerial activity consisting of three
categories:
Strategic Planning: the process of deciding the direction and objectives of the
organisation and the activities and means (resources)
required to achieve these objectives.
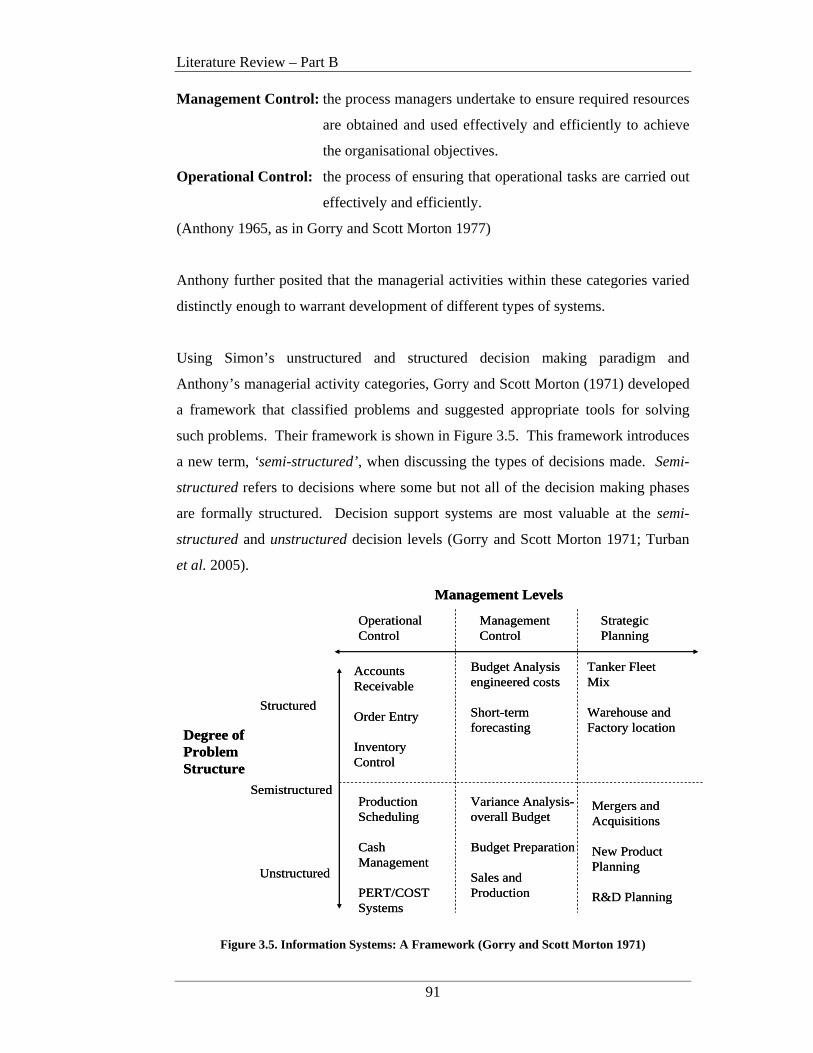
Literature Review – Part B
91
Management Control: the process managers undertake to ensure required resources
are obtained and used effectively and efficiently to achieve
the organisational objectives.
Operational Control: the process of ensuring that operational tasks are carried out
effectively and efficiently.
(Anthony 1965, as in Gorry and Scott Morton 1977)
Anthony further posited that the managerial activities within these categories varied
distinctly enough to warrant development of different types of systems.
Using Simon’s unstructured and structured decision making paradigm and
Anthony’s managerial activity categories, Gorry and Scott Morton (1971) developed
a framework that classified problems and suggested appropriate tools for solving
such problems. Their framework is shown in Figure 3.5. This framework introduces
a new term, ‘semi-structured’, when discussing the types of decisions made. Semi-
structured refers to decisions where some but not all of the decision making phases
are formally structured. Decision support systems are most valuable at the semi-
structured and unstructured decision levels (Gorry and Scott Morton 1971; Turban
et al. 2005).
OperationalControl
ManagementControl
StrategicPlanning
Management Levels
Degree ofProblemStructure
Structured
Semistructured
Unstructured
Accounts Receivable
Order Entry
InventoryControl
Budget Analysisengineered costs
Short-termforecasting
Tanker Fleet Mix
Warehouse andFactory location
ProductionScheduling
CashManagement
PERT/COSTSystems
Variance Analysis-overall Budget
Budget Preparation
Sales andProduction
Mergers andAcquisitions
New Product Planning
R&D Planning
Figure 3.5. Information Systems: A Framework (Gorry and Scott Morton 1971)

Literature Review – Part B
92
A variety of definitions abound for DSS (Sprague Jr and Watson 1989; Holsapple
and Whinston 2001; Turban et al. 2005) although all centre around a number of key
items that are summarised in Keen and Scott Morton’s three objectives for a DSS:
• To assist managers in making decisions to solve semi-structured problems.
• To support manager’s judgement as opposed to replacing it.
• To improve a manager’s decision making effectiveness rather than its
efficiency.
The main difference between a Management Information System (MIS) and a
Decision Support System (DSS) is the degree of structure of the problem to be
solved (Keen and Scott Morton 1978; Sprague Jr and Watson 1996).
3.3.3 Decision Support System Architecture
Now that a general understanding of the purpose and use of DSS is available, it is
appropriate to discuss the structure and makeup, that is, the architecture, of the
systems themselves.
Sprague Jr and Watson (1996) state that the technology required in a DSS must
support three distinct functions: Dialog, Data and Modeling. This is known as the
DDM paradigm and the architecture for this is shown in Figure 3.6. Turban et al.
(2005) include a ‘knowledge’ component between the Dialog and Data/Modeling
levels. This represents the organisation’s existing knowledge base or repository.
Figure 3.6. The DDM Paradigm (Sprague Jr and Watson 1996)

Literature Review – Part B
93
For the purposes of this research, the DSS architecture will be discussed using the
DDM Paradigm of Sprague Jr and Watson (1996).
Data subsystem
The data required by decision makers typically comes from a variety of sources, both
internal and external to the organisation. It is also not uncommon that decisions
require some sort of summarisation and/or analysis during the decision making
process. The collection and aggregation of this information necessitates special
procedures and data storage mechanisms. This suggests that a DSS requires a
dedicated database separate to that used to process everyday transactions Such
dedicated databases take the form of a Data Warehouse (Sprague Jr and Watson
1989; Turban et al. 2005).
Bill Inmon is recognised as the ‘father’ of the data warehouse movement (Gill and
Rao 1996; Kimball 1996) and defines the data warehouse as a:
“ Subject oriented, integrated, non-volatile, and time variant collection of
data in support of management’s decisions.” (Inmon 1996, p.31)
The key aspects of this definition are: subject oriented, integrated, non-volatile and
time variant and these require further explanation in a bid to differentiate them from
everyday transaction processing systems, such as an insurance company claims
system.
Subject Oriented: Typically data warehouses are grouped around the major subject
areas of organisational interest such as customer, policy,
premium, and claim.
Integrated: Probably the most important aspect of the data warehouse,
integration refers to the process of extracting data from a variety
of operational systems and translating it into the same
format/language. For example, consider how a customer’s sex
may be stored. In one system it may be coded as ‘m’ or ‘f’, in
another ‘0’ or ‘1’, and in another ‘male’ or ‘female’. The data
warehouse integration process converts all of these variations
into an agreed format for storage in the data warehouse. This is
also known as data ‘cleansing’.

Literature Review – Part B
94
Non-volatile: Whereas data in transactional systems are updated frequently,
information stored in the data warehouse is typically read only.
Following extraction, integration and upload of data, en masse
from a number of transaction systems, users of the data
warehouse are usually most interested in querying and analysing
the information for management decision purposes: not for
adding new or updating existing records.
Time variant: The time periods of interest are considerably longer in the data
warehouse environment than that of transactional systems. In
transactional systems we may be interested in this year’s data,
transaction by transaction. Whereas in a data warehouse
managers are interested in data up to 10 years old, usually at a
summarised or aggregated level of some type. Transactional
databases also contain up-to-date data as at the time of enquiry.
Data warehouse data is not much more than a series of
snapshots, taken at particular points in time. The key structure
of data warehouse data will always contain some element of
time, indicating the period of aggregation such as week, month
and/or year. This is not always the case in transactional systems
(Inmon 1996)
Figure 3.7. The General Data Warehouse Architecture (adapted from (Sprague Jr and Watson 1996))
Literature Review – Part B
95
Figure 3.7 illustrates the general principles of the data warehouse architecture as
adapted from Sprague and Watson (1996). In the first instance, systems containing
information of managerial interest are identified. Programs are written to extract the
required data from the transactional systems and the data is cleansed and integrated.
The integrated data is then loaded into the data warehouse. The data warehouse
information is then made available for query and analysis in managerial decision
making. Specific subsets of the data warehouse can also be created for specialised
areas or functions. These subsets are known as data marts. (Inmon 1996; Kimball
1996)
Model subsystem
The model subsystem contains routine and specialised statistical, financial,
forecasting, management science and other quantitative models that provide the
analysis capabilities within the DSS. Turban et al. (2005) suggest that models stored
in the Model subsystem can be categorised as strategic, tactical, operational or
analytical, thus supporting Anthony’s (1965) management levels. Models in the
Model subsystem are linked with the data in the data subsystem. Models can extract
parameters, coefficients and variables from the data subsystem and enter results of
the model’s analysis and computation into the data subsystem.
These results can then be used by other models later in the decision making process
(Sprague Jr and Watson 1996).
Dialog subsystem
The Dialog function is also known as the user system interface and is how the user
interacts with the DSS. The Dialog function is made up of three components: the
data base management system (DBMS), the model base management system
(MBMS) and the dialog generation and management system (DGMS). The DBMS
and MBMS manage the administration of the data and models required as part of the
decision making process. The DGMS manages the interface between the user and
the rest of the system (Sprague Jr and Watson 1989).
3.3.4 Modeling the Data Warehouse
Due to the multiplicity of data dimensions that need to be accommodated in a data
warehouse, traditional entity relationship modeling of the data warehouse database is
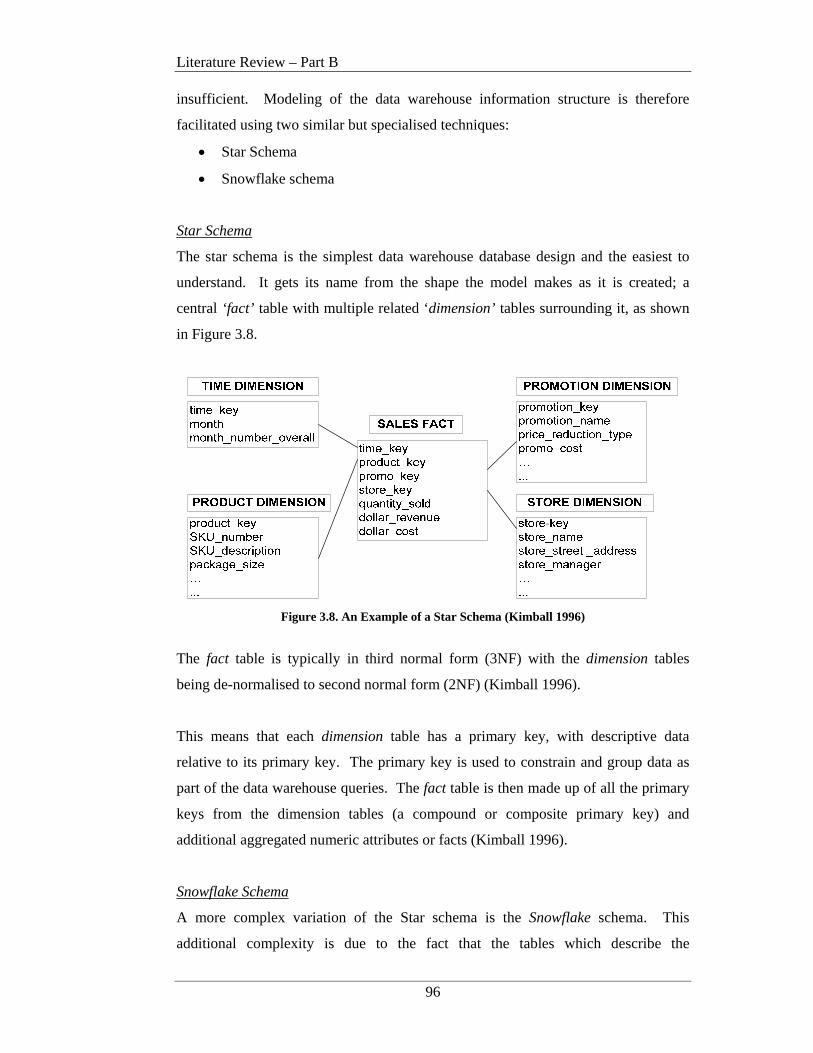
Literature Review – Part B
96
insufficient. Modeling of the data warehouse information structure is therefore
facilitated using two similar but specialised techniques:
• Star Schema
• Snowflake schema
Star Schema
The star schema is the simplest data warehouse database design and the easiest to
understand. It gets its name from the shape the model makes as it is created; a
central ‘fact’ table with multiple related ‘dimension’ tables surrounding it, as shown
in Figure 3.8.
Figure 3.8. An Example of a Star Schema (Kimball 1996)
The fact table is typically in third normal form (3NF) with the dimension tables
being de-normalised to second normal form (2NF) (Kimball 1996).
This means that each dimension table has a primary key, with descriptive data
relative to its primary key. The primary key is used to constrain and group data as
part of the data warehouse queries. The fact table is then made up of all the primary
keys from the dimension tables (a compound or composite primary key) and
additional aggregated numeric attributes or facts (Kimball 1996).
Snowflake Schema
A more complex variation of the Star schema is the Snowflake schema. This
additional complexity is due to the fact that the tables which describe the
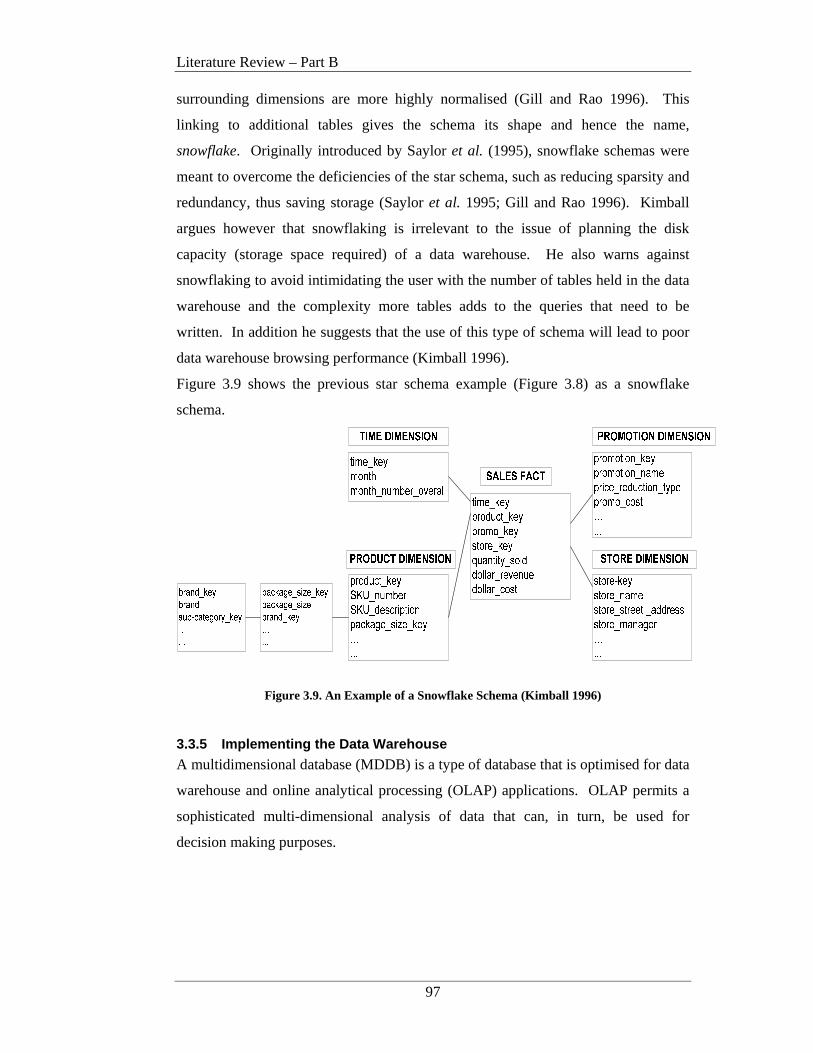
Literature Review – Part B
97
surrounding dimensions are more highly normalised (Gill and Rao 1996). This
linking to additional tables gives the schema its shape and hence the name,
snowflake. Originally introduced by Saylor et al. (1995), snowflake schemas were
meant to overcome the deficiencies of the star schema, such as reducing sparsity and
redundancy, thus saving storage (Saylor et al. 1995; Gill and Rao 1996). Kimball
argues however that snowflaking is irrelevant to the issue of planning the disk
capacity (storage space required) of a data warehouse. He also warns against
snowflaking to avoid intimidating the user with the number of tables held in the data
warehouse and the complexity more tables adds to the queries that need to be
written. In addition he suggests that the use of this type of schema will lead to poor
data warehouse browsing performance (Kimball 1996).
Figure 3.9 shows the previous star schema example (Figure 3.8) as a snowflake
schema.
Figure 3.9. An Example of a Snowflake Schema (Kimball 1996)
3.3.5 Implementing the Data Warehouse
A multidimensional database (MDDB) is a type of database that is optimised for data
warehouse and online analytical processing (OLAP) applications. OLAP permits a
sophisticated multi-dimensional analysis of data that can, in turn, be used for
decision making purposes.
Literature Review – Part B
98
Key characteristics of an OLAP application include (Oracle 2005):
• trend analysis over sequential time periods
• slicing subsets for on-screen viewing
• drill-down to deeper levels of consolidation
• reach-through to underlying detail data
• rotation to new dimensional comparisons in the viewing area.
Conceptually, a MDDB uses the idea of a data cube to represent the various
dimensions of data available, thus allowing a user to view aggregated data from a
number of perspectives (Oracle 2005).
MDDBs are typically designed using a Star or Snowflake schema (Kimball 1996;
Inmon et al. 1999). Both techniques make multi-dimensional database (MDDB)
functionality possible using traditional relational database tools. This is required due
to the large investment organisations already have in relational technology.
3.3.6 Decision Support in Healthcare
Within the healthcare domain two main types of Decision Support Systems exist:
1. Clinical Decision Support Systems (CDSS) and
2. Managerial Decision Support Systems (MDSS).
An emerging area is also decision support systems for patients to aid in simple self-
diagnosis and ‘where-to-seek’ care advice as well as in more sensitive areas such as
end-of-life decisions.
This research is primarily concerned with DSS used within the physical healthcare
provider organisation and as such will deal with the first two types of DSS
mentioned above, namely CDSS and MDSS. These systems serve two different
populations. CDSSs serve the clinician and healthcare worker delivering patient care
on the frontline and MDSSs serve those responsible for performance monitoring and
the overall running of the healthcare unit and the allocation and monitoring of
organisational resources including staff, equipment and budgets.
Literature Review – Part B
99
Clinical Decision Support Systems
Clinical Decision Support Systems (CDSS) can be used to deliver information
required in the diagnosis and treatment of patients including “evidence-based best
practice” standards at the point of care (Hanson 2006). CDSS can be used in a wide
variety of activities including generation of reminders, prompts and alerts of possible
allergies and/or lab tests needed, drug prescription and contraindications, diagnosis,
disease management, education and knowledge currency (Coiera 2003). Research
studies have shown that the benefits of using CDSS include improved clinician
performance, improved compliance with clinical pathways and guidelines, positive
effects on patient outcomes, reduced costs of medical care and reductions in
medication errors and adverse events (NSW Department of Health 1997; NEDST
2002; Coiera 2003; Westbrook et al. 2004; Kawamoto et al. 2005; Ahamed et al.
2006; Hanson 2006).
The earliest clinical decision support systems were developed in the 1970’s and
1980’s in the U.S. In 1974, Myers and Miller from the University of Pittsburgh
developed INTERNIST-1. This system was designed to address diagnostic issues in
the fields of internal medicine and neurology. Based on observations about a patient,
the system deduced a possible set of compatible diseases. By prioritising the
possibilities and asking more questions the system narrowed the set or suggested a
single best choice. When compared to experts using cases from the New England
Journal, the system performed competently. INTERNIST-1 was eventually
commercialised as Quick Medical Reference (QMR) (Hanson 2006).
The next notable CDSS was designed by Dr Edward Shortliffe at Stanford
University in the mid-1970’s. Known as MYCIN, the system simulated an
infectious disease specialist and used sets of IF-THEN rule pairs and associated
weightings to determine the most likely diagnosis. MYCIN was designed to be used
by internists to assist in knowledge extension and currency (Hanson 2006).
In the 1980’s, the Massachusetts General Hospital developed Dxplain. This system
stores approximately 2200 diseases and 5000 symptoms and is now a commercially
available product (Coiera 2003).

Literature Review – Part B
100
In the late 1990’s the New South Wales (NSW) Department of Health initiated the
Clinical Information Access Program (CIAP). CIAP “provides information and
resources to support evidence-based practice at the point of care”. It is available
online to all staff working in the NSW public health system 24 hours a day. This
system provides access to information to support care processes, enables clinicians to
consult with clinical colleagues online, shares clinical pathways statewide and
improves clinician-clinician and clinician-patient communication and collaboration
(NSW Department of Health 1997).
A CDSS can act in one of three modes: Passive, Semi-active and Active. Passive
CDSS are provided with input with an implicit request for a response. An example
could be where a new intern inputs patient symptoms and asks for possible
diagnoses. Semi-active CDSS sit in the background and prompts the care deliverer
with reminders to act. An example may be a reminder that an inoculation is due or
the management of alarm levels for physiological variables such as heart rate and
blood pressure. An Active CDSS intervenes automatically without the need for
human confirmation. An example includes managing the weaning off mechanical
ventilation (Hanson 2006).
Computer Interpretable Guidelines
An emerging area of interest associated with CDSS is the implementation of
machine-readable clinical practice guidelines or computer-interpretable guidelines
(CIGs). The Institute of Medicine defines practice guidelines as “systematically
developed statements to assist practitioner and patient decisions about appropriate
healthcare for specific clinical circumstances” (Field and Lohr 1990). Clinical
practice guidelines have been developed to reduce unjustified variations in clinical
practice, with the goal to improve quality and contain costs (Field and Lohr 1992).
De Clercq et al. (2004) state that implementing guidelines in computer-based
decision support systems (ie: CDSS) promises to improve acceptance and application
of guidelines in daily practice because the actions and observations of health care
workers are monitored and advice is generated whenever a guideline is not followed.
Wang et al. (2002) also report on several studies that have shown that when CDSSs
are developed to provide case-specific assistance in decision making and are
integrated with clinical workflow, they can improve clinicians’ compliance with
Literature Review – Part B
101
clinical practice guidelines. The key research question in this area is how to create
computer interpretable representations of clinical knowledge contained in clinical
guidelines. Several research groups are attempting to develop guideline
representation languages with most approaches taking a ‘task-based paradigm’ in
which guidelines are decomposed into a hierarchy of tasks (Coiera 2003).
The more significant guideline representation languages include:
• Arden Syntax;
• The Guideline Interchange Format (GLIF);
• PROforma;
• Asbru;
• Prodigy;
• Protégé.
(NEDST 2002; Wang et al. 2002; Coiera 2003; de Clercq et al. 2004)
The domain of CIG research is primarily concerned with the outputs of the logical
model of the new patient journey as it relates to the physical design of an automated
support system. It looks at ways to implement a formal structure to the process
outputs and is not overly concerned with the development method for the logical
models themselves. As part of this research, a review of several guideline languages,
found that in some instances flowcharts, state transition diagrams and uni-directional
graphs are used to model the logical process flow but that the use of a formal
modeling structure was absent. Peleg (2003) and Wang (2002) suggest this is a
major restriction in the mainstream computerisation of clinical guidelines (Wang et
al. 2002; Peleg et al. 2003).
However despite almost 30 years of work on clinical decision support systems,
Hanson (2006) and Westbrook et al. (2004) suggest that they have still not been
widely integrated into medical practice. Many reasons have been surmised for this
slow uptake, including the relatively slow penetration of computers into medical
practice, compared to other industries and the lack of integration with workflows.
Literature Review – Part B
102
Where DSS successes have been reported the critical success factors include:
• Integration with other key technologies such as Electronic Health Records
(EHR) and Computerised Physician Order Entry (CPOE);
• Integration with workflows to support not only the processes but
organisational structure as well;
• Inclusion of clinicians in the development process prior to deployment to
reduce local cultural issues and increase the feelings of system ownership;
• Integration of decision support tools into hand-held devices and familiar web
browsers to facilitate point-of-care delivery;
• Justification of suggested courses of action based on evidence.
(Kawamoto et al. 2005; Ahamed et al. 2006; Conrick 2006; Hanson 2006)
Management Decision Support Systems
In business management circle these types of decision support systems are known
simply as Decision Support Systems (DSS). They have been named Management
Decision Support Systems (MDSS) here purely for the reasons of differentiating
them from clinical decision support systems as discussed above.
Management is a process by which organisational goals are achieved using
resources. The resources are the inputs and the attainment of goals is the output of
the processes performed. Fayol (1916) identified five functions of a manager:
planning, organising, commanding, coordinating and controlling (POCCC) (as in
Holsapple and Whinston 2001). Urwick (1943) enhanced these function with two
additional functions, that of forecasting and investigation (as in Holsapple and
Whinston 2001).
Planning: Is the formulation of the things that need to be done and the methods
to accomplish those things. Planning is conducted in respect to the
organisation’s resources, in light of the organisational goals to be
achieved.
Organising: Is concerned with the structure and attainment of human and physical
resources as per the plan.
Literature Review – Part B
103
Commanding:Involves issuing specific or general instructions that cause the plans
to be put into action. It implies the transference of knowledge from
the manager to other elements (people or computers) within the
organisation.
Coordinating: Is concerned with the manager’s efforts at interrelating and
harmonising planned activities as they are carried out.
Controlling: Is the function of ensuring that the plans are carried out as required.
Forecasting: Although often used as part of planning, forecasting can be
considered and conducted as a separate activity. It involves
estimations or predictions of what may occur in the future based on
past and current conditions or performance. It may also consider
events that are known to be occurring in the future and their impact.
Investigation: Involves conducting research for the purposes of acquiring increased
knowledge. This may pertain to industry trends, competitors,
technology or similar.
(Holsapple and Whinston 2001; Turban et al. 2005)
Management Decision Support Systems must then support those responsible for
conducting the managerial functions above. In real terms this translates to
‘POCCCing’ the performance and productivity of the organisation resources over
time and using Forecasting and Investigation to support these functions. All
activities equally relevant in Healthcare.
Such activities typically have a great deal of focus on the organisation’s resources.
Holsapple and Whinston (2001) suggest that there are four type of organisational
resources, namely: money, materials, humans and knowledge. This is represented in
Figure 3.10 along with the transformation of inputs to outputs.

Literature Review – Part B
104
Figure 3.10. Four Types of Organisational Resources (Holsapple and Whinston 2001) In the healthcare environment these relate to budgets, physical resources such as x-
ray machines and the resulting x-rays, human resources such as clinicians, nurses,
midwives, administration assistants and educators and knowledge such as patient
safety levels and outcomes. It is important to note that within the healthcare setting
these resources are associated with a wide variety of activities including patient
administration, patient care delivery, inter-department/service transfers, internal and
external service/product providers and staff, as an example.
Therefore MDSS within healthcare must accommodate the capture, storage and
analysis of the measurement information required to support the managerial
functions associated with these resource types. Jensen et al. (2006) define a measure
as “an indicator of change” and state that “a measure is used to track the delivery of
proven interventions to patients and to monitor progress over time”. (Jensen et al.
2006, p.176). Berwick (1996) further suggests that measurement is also about
learning and can be used to gain more knowledge about required changes.
As part of the design of the MDSS a measurement framework must be defined. This
will involve identification of the data required to be extracted from the operational
systems such as time to complete patient processes, number of patient days, types of
cases serviced etc. This information will then need to be cleansed and summarised as
required and loaded into the data warehouse. The MDSS must then provide facilities
for the query, analysis, what-if scenario forecasting and reporting needed by
healthcare managers for organisational management and ongoing goal attainment.
Literature Review – Part B
105
A key source of measurement data are derived from standards bodies such as
JCAHO’s ‘Specification Manual for National Hospital Quality Measures” and the
ACHS’s ‘Clinical Indicator Information 2007’ (JCAHO 2006; ACHS 2007). Other
recognised examples can be found in Jensen et al. (2006).
Following population of the MDSS database, management can begin to monitor and
analyse the stored data. Such analysis can be enhanced through the provision of
‘Dashboards’. Dashboards highlight where unacceptable variations are occurring
typically through the use of colour-coded cells or graphs. This can bring immediate
attention to problem areas without the need for a human to traverse the data. More
sophisticated systems can capture data in ‘real-time’ with variations alerted
instantaneously with either colour and/or sound (Jensen et al. 2006).
3.3.7 Conclusions and Implications for Patient Journey Modeling Research
This section looked at the extensive field of technology support for decision making
within organisations. It covered a number of related areas including the decision
support system architecture, data warehouses and decision support in healthcare.
Two classifications of Decision Support Systems are relevant in the context of
redesigning healthcare and will be included in the patient journey modeling meta-
methodology: Clinical Decision Support Systems (CDSS) and Management
Decision Support Systems (MDSS).
Clinical Decision Support Systems (CDSS) - When redesigning processes involved
in a given patient journey the redesign team must consider the application of clinical
guidelines and evidence-based best practice where appropriate. CDSS provide
current knowledge about diseases, treatments, drug interactions and risk profiles.
When efficiently integrated into other components of patient care such as EHR and
CPOE, CDSS represent a huge opportunity for the delivery of safe, cost-effective,
evidenced-based medicine to patients.
The patient journey modeling meta-methodology presented in this research will
include the input of practice guidelines to the patient journey modeling activity and
the linking of relevant guidelines to specific processes within the patient journey.
Literature Review – Part B
106
CDSS are used as the implementation vehicle for the capture and storage of clinical
guidelines and to assist with compliance to same, thus further improving outcomes in
the new patient journey.
Computer Interpretable Guidelines (CIGs)- Studies in the development of strategies
to implement Computer Interpretable Guidelines (CIGs) have shown that computer-
based clinical decision support systems (CDSSs), when developed to provide
patient-specific assistances in decision-making and integrated with clinical
workflow, can improve clinicians’ compliance with CIGs and improve patient
outcomes (Wang et al. 2002).
As work into CIGs is mainly concerned with the physical design, construction and
implementation issues associated with patient journeys and their related clinical
guidelines, CIG research does not form a core component of the current research.
Management Decision Support Systems (MDSS) - MDSSs must support those
responsible for conducting the managerial functions of Planning, Organising,
Commanding, Coordinating, Controlling, Forecasting and Investigating. In real
terms this translates to management of the performance and productivity of the
organisation resources over time.
During development of the future patient journey and its associated processes, items
to be measured are identified and targets for these items determined. Each and every
measurement is aligned with the healthcare strategy. This forms the organisation’s
measurement framework and is translated from the future patient journey model into
the MDSS. As part of workflow enactment, actual item measurements are captured
and fed into the MDSS for comparison to the targets. Management then analyse if
the redesigned patient journey is performing as expected or if additional
enhancements are required.
Automation of measurement frameworks and their evaluation (via Decision Support
Systems) has been discussed by McGregor (McGregor 2002; McGregor 2003) but
only in relation to process measurement within a business context. Options for
automated measurement and evaluation of process improvements within a healthcare
Literature Review – Part B
107
context is lacking and needs attention if care redesign initiatives are to survive the
scrutiny of senior healthcare management.
Inclusion of automated measurement frameworks and evaluation in the meta-
methodology assists in measuring the degree of effect of any changes made to the
patient journey/s under review. Such justification is invaluable if the new and
improved patient journey/s are to be proposed as a benchmark practice within a
service or across the healthcare industry.
Within this research modeling of the MDSS database is done using the Star Schema
approach. This ensures that the multi-dimensional nature of the patient journey is
appropriately captured and presented for management analysis.

Literature Review – Part B
108
3.4 Integration and Transfer of Information Between Systems
As part of the design of the improved patient journey, opportunities to share and
move data between existing and possibly new applications will become apparent.
The eXtensible Markup Language (XML) is a widely used technology for facilitating
such data transportation between applications. More recently, enhanced versions of
XML have been specified as a method to transport information concerning Balanced
Scorecards, Business Processes and Workflows. The following will explore the
origins of XML and its associated components and investigate their relationship to
the research areas.
3.4.1 eXtensible Markup Language (XML)
The fundamental concepts of the eXtensible Markup Language (XML) and its related
languages/specifications is to enable the data description to be separated from the
way the data is presented and to provide a standard self-describing format that is
readable by both computers and people (Mercer 2001). Originally designed to meet
the challenges of large-scale electronic publishing, XML is now playing an
increasingly important role in the exchange of a wide variety of data between Web
applications (W3C 1996; Young 2000).
Known as a markup language specification, the first draft XML standard was
released by the World Wide Web Consortium (W3C) in November 1996 (W3C
1996). The current version is 1.0 – fourth edition (W3C 2006). A markup language
is a set of commands that tell a program how to display content. Content may
consist of words, pictures or other digitised data. Markup language commands use
plain text that people can read and write quite easily (Mercer 2001).
XML is based on an earlier markup language specification, Standard Generalised
Markup Language (SGML) (W3C 1996). A common SGML application used on the
Web, is HTML. HTML provides a fixed set of predefined elements that you can use
to markup the components of a typical, general-purpose Web page. Some element
examples include headings, paragraphs, lists, tables, images and links.
Literature Review – Part B
109
Each element begins with a start tag, with most elements finishing with an end tag
such as:
<H2>My Home Page</H2>
This indicates that the words “My Home Page” will appear as a level 2 heading in
the Web page browser. Although the set of predefined elements has expanded
considerably, HTML is still unsuitable for defining many types of documents such as
a database or music score (Young 2000).
XML overcomes such limitations due to the fact that the XML definition consists of
minimal standard syntax that allows users to create their own elements and assign
names that are meaningful to them. Hence the term extensible in eXtensible Markup
Language (Young 2000). XML can therefore be used to describe any type of
document and can then be used to exchange this information between applications on
the Web.
Contents in XML are presented in an XML Document. An XML Processor then
interprets the XML Document to another application. Presentation of the XML
Document at the receiver end can be done using an associated style sheet and/or
schema. A style sheet is a separate file that contains instructions for formatting the
individual XML elements using technologies such as eXtensible Stylesheet Language
(XSL).
An XML Schema can be considered as a written representation of the model to be
followed by the data in the XML document and is a more advanced type of
Document Type Definition (DTD) (Young 2000; Mercer 2001).
A sample XML Document is shown in Figure 3.11. The first line is the XML
declaration, which identifies it as an XML document and gives the XML version
number being used. Following this is the root element <AdmittedPatients>. The
root element contains a number of additional elements that hold information content.
Each element is made up of a series of markup tags in the form:
<tag>information content</tag>
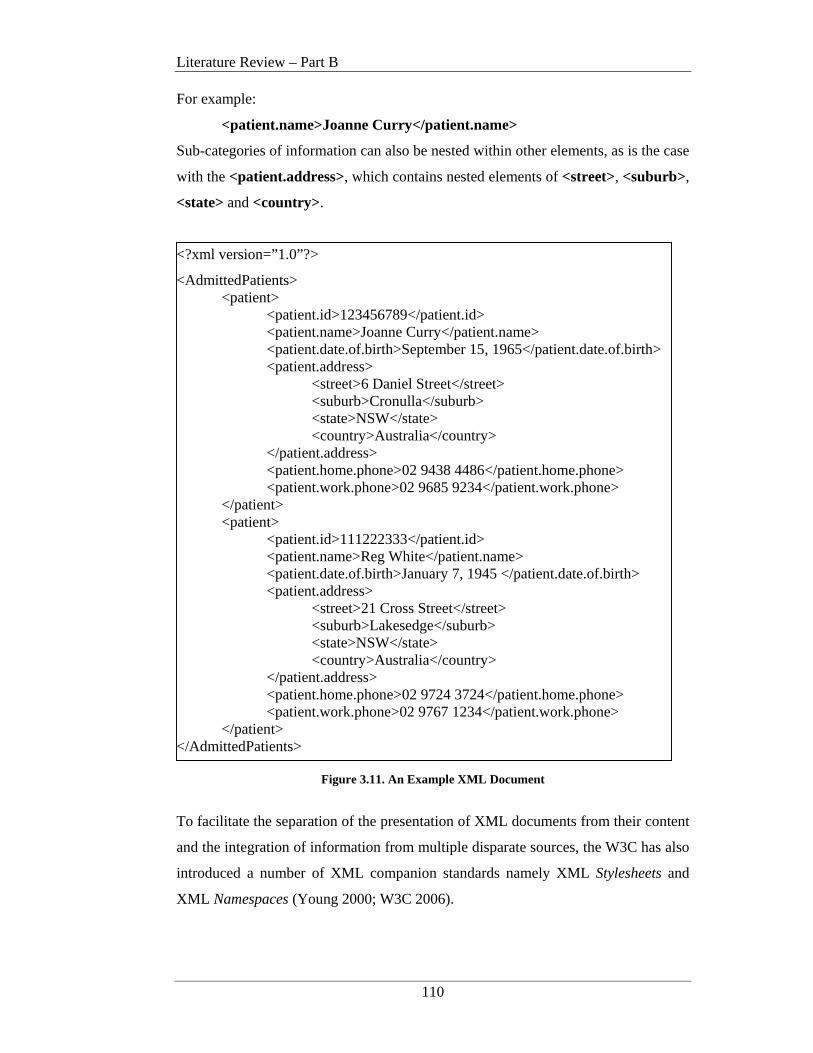
Literature Review – Part B
110
For example:
<patient.name>Joanne Curry</patient.name>
Sub-categories of information can also be nested within other elements, as is the case
with the <patient.address>, which contains nested elements of <street>, <suburb>,
<state> and <country>.
<?xml version=”1.0”?>
<AdmittedPatients> <patient>
<patient.id>123456789</patient.id> <patient.name>Joanne Curry</patient.name> <patient.date.of.birth>September 15, 1965</patient.date.of.birth> <patient.address>
<street>6 Daniel Street</street> <suburb>Cronulla</suburb> <state>NSW</state> <country>Australia</country>
</patient.address> <patient.home.phone>02 9438 4486</patient.home.phone> <patient.work.phone>02 9685 9234</patient.work.phone>
</patient> <patient>
<patient.id>111222333</patient.id> <patient.name>Reg White</patient.name> <patient.date.of.birth>January 7, 1945 </patient.date.of.birth> <patient.address>
<street>21 Cross Street</street> <suburb>Lakesedge</suburb> <state>NSW</state> <country>Australia</country>
</patient.address> <patient.home.phone>02 9724 3724</patient.home.phone> <patient.work.phone>02 9767 1234</patient.work.phone>
</patient> </AdmittedPatients>
Figure 3.11. An Example XML Document
To facilitate the separation of the presentation of XML documents from their content
and the integration of information from multiple disparate sources, the W3C has also
introduced a number of XML companion standards namely XML Stylesheets and
XML Namespaces (Young 2000; W3C 2006).
Literature Review – Part B
111
XML Stylesheets
As mentioned above one of the original goals of XML was to separate the definition
of data to be transferred across and between systems from its presentation at the
receiver’s end. While XML data is defined in an XML document, presentation of
the data requires a presentation language and transformation mechanism. The
eXtensible Stylesheet Language (XSL) provides such a resource.
XSL is the XML-based language used to describe how the data in the XML
document can be presented. XSL then uses eXtensible Stylesheet Language
Transformation (XSLT) for the transformation process and for formatting the data at
the end device. In this way multiple stylesheets can be used to present the same data
in different ways for different devices or as a common tool for bringing together data
from disparate systems (Young 2000; Mercer 2001).
XML Namespaces
As one of the strengths of XML, data from multiple disparate sources can be bought
together as one legible group; however this brings with it some problems. For
example, when data from different systems share the same name, XML recognises a
naming conflict and is unable to determine which data item should be used. This can
be solved through the use of XML Namespaces.
An XML Namespace provides a mechanism for identifying the location (owner) of a
schema for a given set of XML data tags and by including the XML Namespace with
the data tag, all naming conflicts can be resolved. Namespaces are declared using
the reserved attribute xmlns with a reference to it’s ‘unified resource identifier’
(URI) location of the relevant unique data tags to be used in a given instance (W3C
2006). Once the XML Namespace is declared, data tags referring to that particular
schema need to be prefixed with the XML Namespace nickname. For example if a
hospital drug list used a schema named ‘dl99’, the XML Namespace declaration
would be:
xmlns:dl99=”http://www.nmsdrglst.com”
Then whenever an attribute from the hospital drug list schema was used in an XML
document, it would be prefixed with the Namespace nickname ‘dl99’. This could be
used to distinguish the drugs used from a specific manufacturer’s list.

Literature Review – Part B
112
XML Namespaces also allow standards bodies and specific disciplines to define sets
of data tags reflective of their explicit environment. This is in fact the case with the
World Wide Web Consortium (W3C), Balanced Scorecard Collaborative and the
Workflow Management Coalition (WfMC) (Balanced Scorecard Collaborative 2001;
WfMC 2005).
3.4.2 Balanced Scorecard XML Standard (BSC XML)
To facilitate the definition and seamless transfer of Balanced Scorecards between
applications, the Balanced Scorecard Collaborative joined with a number of partner
organisations to develop the Balanced Scorecard XML Standard (BSC XML).
Released in draft mode in 2001, BSC XML
“will remove many of the technology and software barriers that currently
exist when transferring performance management and strategy related
information between some applications and across enterprises” (Balanced
Scorecard Collaborative 2001, p.3)
This means that once the Balanced Scorecards are developed as part of the
organisational strategy setting activity, they can be defined in BSC XML and
transferred to and across operational systems. This will allow each and every metric
set at the operational level to be explicitly linked to a specific BSC and thus ensure
operational activities are aligned with strategic goals.
An example of the use of BSC XML and relevant extensions for business
performance management can be found in McGregor’s work on Intelligent
Workflow Monitoring (IW-MONS) (McGregor 2003).
3.4.3 XML Process Definition Language (XPDL)
The goal of the XML Process Definition Language (XPDL) is to provide a standard
syntax for the definition, storage and exchange of business process diagrams. XPDL
is not an executable programming language but a process design format for storing
the visual diagram and process syntax of business process models (WfMC 2005).

Literature Review – Part B
113
In the context of this research XPDL is used to define a generic description of the
processes identified as part of the redesigned patient journey (future patient journey
model). These process descriptions can then be translated to an executable language
such as Business Process Execution Language (BPEL) for use as workflow
definitions in a variety of workflow engines (WfMC 2005; Palmer 2006). This
means that the efforts put into defining and designing the new patient journey
processes can be used explicitly for workflow automation without the need to
introduce additional technologies.
It also means that if new workflow technologies are introduced in the future, little or
no additional process specification work would be required as the XPDL and BPEL
would readily support process migration to other workflow engines (Palmer 2006).
3.4.4 Conclusions and Implications for Patient Journey Modeling Research
This section assessed the pivotal research works in relation to XML Documents,
Stylesheets and Namespaces. An additional review concerning the use of XML for
defining Balanced Scorecards and Workflows was also undertaken.
There is general agreement within the computing community that XML is one of the
preferred techniques for data interchange amongst disparate systems. This is
confirmed with the development of new XML standards relating to other disciplines
such as Balanced Scorecards and Workflows as discussed in the previous section
(Balanced Scorecard Collaborative 2001; WfMC 2005). With this in mind XML
will used as the definition medium for all data interchange requirements identified as
part of the new patient journey model within this research. Existing standards will
be used, with new extensions proposed as required.
In relation to required extensions, a new ‘patient journey model’ element is added to
the BSC XML draft standard to permit the grouping of objectives based on a
particular treatment stream. With reference to McGregor’s extension of the BSC
XML draft (McGregor 2002), the ‘type’ element is extended to include measurement
recording types relevant to the healthcare domain, such as, ‘initial admission’ or ‘re-
admission’.

Literature Review – Part B
114
Similar extensions are made to the WfMC XPDL standard to accommodate the new
BSC XML enhancements to ensure particular treatment streams and measurement
types can be tracked as part of workflow enactment. This allows the MDSS to
compare target measurements as set during BSC development to actual
measurements achieved, thus helping to meet the research goal of aligning the
redesign activities to the organisational strategy.
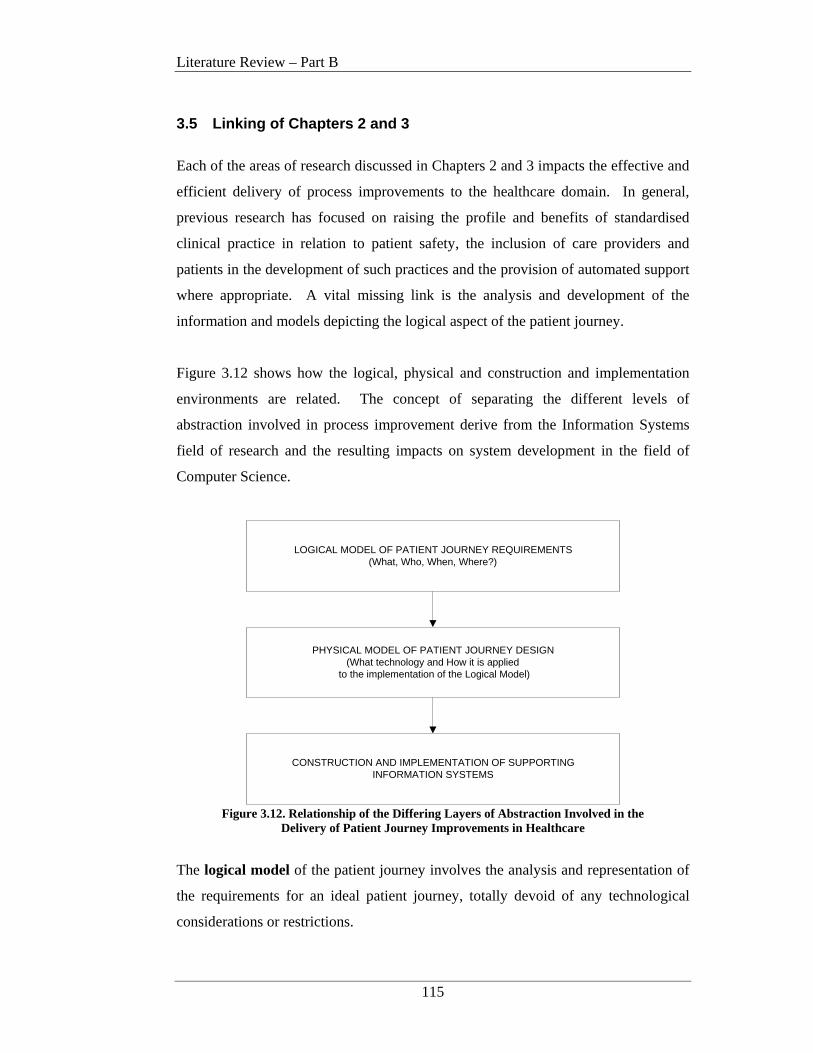
Literature Review – Part B
115
3.5 Linking of Chapters 2 and 3
Each of the areas of research discussed in Chapters 2 and 3 impacts the effective and
efficient delivery of process improvements to the healthcare domain. In general,
previous research has focused on raising the profile and benefits of standardised
clinical practice in relation to patient safety, the inclusion of care providers and
patients in the development of such practices and the provision of automated support
where appropriate. A vital missing link is the analysis and development of the
information and models depicting the logical aspect of the patient journey.
Figure 3.12 shows how the logical, physical and construction and implementation
environments are related. The concept of separating the different levels of
abstraction involved in process improvement derive from the Information Systems
field of research and the resulting impacts on system development in the field of
Computer Science.
LOGICAL MODEL OF PATIENT JOURNEY REQUIREMENTS(What, Who, When, Where?)
PHYSICAL MODEL OF PATIENT JOURNEY DESIGN(What technology and How it is applied
to the implementation of the Logical Model)
CONSTRUCTION AND IMPLEMENTATION OF SUPPORTINGINFORMATION SYSTEMS
Figure 3.12. Relationship of the Differing Layers of Abstraction Involved in the
Delivery of Patient Journey Improvements in Healthcare
The logical model of the patient journey involves the analysis and representation of
the requirements for an ideal patient journey, totally devoid of any technological
considerations or restrictions.
Literature Review – Part B
116
Logical requirements gathering looks at the questions of what is done, who is
involved, when the activity occurs and in what location it is performed. The
resulting future patient journey model (the ideal situation) should be patient-centric,
increase patient safety, be free from duplication of effort and excessive patient
movements, reduce overall usage of resources and eliminate time wastages wherever
possible.
The physical model of the patient journey design (middle layer) deals with what
technology should be considered and how it is best applied to the delivery of the
patient journey requirements outlined in the Logical Model. This can relate to the
selection of a particular computer-interpretable guideline model, use of XML and
HL7 as a data exchange protocol, the provision of automated workflow support and
the communication techniques for process output to a particular decision support tool
for variance analysis.
The construction and implementation of supporting information systems (bottom
layer) relates to the actual building and delivery of appropriate technological
solutions, based on the physical designs, to the care provider and patient community.
Chapter 2 dealt mainly with the Logical Model layer and Chapter 3 with the Physical
Model layer. The construction and implementation layers are beyond the scope of
this research.
The key deficiency in the above areas of research and their impact on the healthcare
domain to-date, lies in the lack of standardisation of the logical model definitions in
relation to the specificities associated with the complex and dynamic nature of safe
and high quality healthcare delivery. The major contribution of this research
addresses these deficiencies by investigating the introduction of a meta-methodology
for the design and modeling of patient journeys. Such a meta-methodology provides
support for:
• the inclusion of relevant healthcare provider strategies and objectives,
• linking of operational measurement criteria to the strategy,
• healthcare specific modeling tools,

Literature Review – Part B
117
• requirements for automated support in areas such as workflow and decision
support and
• the identification of applicable measurement and evaluation procedures.
Coverage of these items provides solutions to research hypotheses 1, 2 and 3 as
discussed in Chapter 1.
A Patient Journey Modeling Meta-Methodology
118
CHAPTER 4 A PATIENT JOURNEY MODELING
META-METHODOLOGY
4.1 Introduction
This chapter describes an original domain specific improvement architecture in the
form of a Patient Journey Modeling Meta-Methodology. The Patient Journey
Modeling Meta-Methodology is known as PJM3 and is expressly designed to support
patient journeys in the context of process redesign within the healthcare domain for
the purposes of increased patient safety, reduced variations of care and overall
outcome improvement.
The main motivation for the development of the new Meta-Methodology is the lack
of a domain specific process redesign technique for patient journey modeling
initiatives. Chapter 2 outlined the current modeling techniques being used within the
healthcare arena and the fact that all of these techniques are from other industries
such as manufacturing, business and computing. This has led to some frustration for
healthcare improvement teams as they are unable to capture the nuances associated
with the complex nature of holistic healthcare redesign (Laursen 2003).
Development of PJM3 involved aspects of method reconciliation and consolidation
as well as the addition of specific dimensions unique to healthcare such as patient
needs and practice guidelines. Initially a number of patient journey modeling subject
area were defined and tested as part of the thesis case study. Following validation,
the subject areas were then abstracted to form the Patient Journey Modeling Meta-
Methodology.
A Patient Journey Modeling Meta-Methodology
119
The Patient Journey Modeling Meta-Methodology (PJM3) provides a solution to
research hypotheses 1 and 2 from the first Chapter. Specifically it provides a generic
framework that outlines the key components required to support safe, high quality
patient journey improvements, including strategy and process definition, workflow
support and performance measurement and evaluation criteria. Key contributions
also include an architectural design that accommodates the specificities and
complexities associated with healthcare redesign in particular the inclusion of patient
needs and practice guidelines.
The chapter begins with an outline of the PJM3 architecture and then goes on to
more fully describe each of the architectural components. The inter-relationships of
the components to the actual processes involved with the patient journey are
discussed. A description of the flow of information supporting the meta-
methodology is presented and the underlying role of information technology support
within the meta-methodology is positioned.
4.2 Background
As outlined in Chapter 2, the present process modeling methods being used to model
a patient’s journey and redesign the associated processes do not support all of the
requirements of healthcare improvement projects. In many cases healthcare
improvement projects are using the business, manufacturing and computing process
redesign approaches as they were originally proposed (Young et al. 2004; Bassham
2005; Ben-Tovim 2005; IHI 2005; UK Department of Health 2005) and they are
faced with being unable to capture all of the design features required to ensure a
quality healthcare journey.
This has led to one-off internal enhancements to particular techniques (ARCHI Net
News 2004; Bassham 2005; Bolch 2005; Australian Resource Centre for Healthcare
Innovation 2006) and these enhancements are not being proliferated throughout the
industry. This will ultimately lead to a miscellany of non-standardised design and
process modeling techniques being used, potentially inhibiting the promulgation of
new and improved patient journeys across the Healthcare domain.

A Patient Journey Modeling Meta-Methodology
120
Williams (2000) suggests that methodological deficiencies- particularly in regard to
the capture of complex process logic and dynamics- are major obstacles for
successful reengineering of business processes. Such complexities and dynamism
are at the very core of healthcare improvement and thus it is not surprising that not
all improvement projects are performing as expected. The large variety of process
modeling approaches can cause some confusion for the inexperienced process
redesigner. Such a range of approaches has evolved due to the purpose for which the
final models are intended and the subject domain (manufacturing, computing etc.)
for which the models are developed.
In addition Coiera (2003) states that:
There is no such thing as a truly general purpose model and no one model is
the most ‘correct’. Models are simply better or worse suited to
accomplishing a particular task. (p.6)
This aligns with the general consensus in the research community that there is a need
to:
reconcile different approaches, identify commonalities and consolidate
various modeling methodologies and frameworks (Williams 2000, p.1).
The purpose of the PJM3 is two-fold. Primarily the meta-methodology provides an
improvement architecture to support the development of new healthcare specific
process redesign tools and techniques. In addition, the architecture also serves as a
benchmark for identifying deficiencies of existing non-healthcare domain process
redesign methods so that they can be enhanced to better support process redesign
within a healthcare environment. By incorporating the specific design features of the
meta-methodology into both new and existing process modeling techniques,
healthcare improvement efforts will better align with the IOM’s Aims for
Improvement.
A Patient Journey Modeling Meta-Methodology
121
Specifically patient journeys will be produced that:
• Reduce the variability of the care process thus increasing patient safety
• Are more effective and efficient
• Are patient-centered and more equitable
• Improve the timeliness of service delivery
• Incorporate the multiple contributing dimensions involved in high quality
service delivery
• Are more intuitive to develop and enhance
• Improve the overall quality of the patient’s outcomes and experience.
The Meta-Methodology also provides a foundation for discussion and comparison of
patient journey modeling initiatives across the healthcare domain and thus supports
the reuse of patient journey models across similar patient flows. This is possible by
using PJM3 as the basis for the development of a ‘healthcare process modeling’
assessment framework. Such a framework is detailed in Chapter 5 and is used to
assess the level of healthcare redesign support provided by the four process modeling
techniques discussed in Chapter 2 and to suggest enhancements to those tools.
This allows healthcare improvement managers to understand the limitations of the
tools they are using so that contingencies can be developed or new tools sourced thus
further supporting research hypothesis 3.
A Patient Journey Modeling Meta-Methodology
122
4.3 Patient Journey Modeling Meta-Methodology (PJM3)
Primarily healthcare improvement is about redesigning processes and improving
safety and services although one cannot be achieved at the expense of the other.
This involves defining clear outcomes, connecting the processes and systems that
produce the required result and maintaining the improvement through integration
with other operational activities and development of a culture of continuous process
improvement (Berwick 1996; Batalden and Splaine 2002).
Such an approach requires an architecture that not only addresses process
improvement but that is also cognisant of the multiple dimensions contributing to the
development of high-quality patient-centered journeys.
Figure 4.1 presents such an improvement architecture, in the form of a Patient
Journey Modeling Meta-Methodology (PJM3).
PJM3 draws on aspects of a number of methodologies from other research domains
including Business Strategy Management, Process Reengineering, Workflow
Management and Decision Support Systems. It also includes additional facets from
the Socio/cultural, Integrated Sciences and Clinical Guidelines arenas. The
amalgamation of such complimentary components leads to the creation of an original
healthcare domain specific patient journey modeling meta-method. Development of
this meta-method serves two key purposes:
1. To provide the foundation for the development of a healthcare domain
specific patient journey modeling tool (as detailed in Chapter 7); and
2. To provide a basis for evaluation and comparison of existing process
reengineering methods that are already being used to develop patient journey
models (such as those discussed in Chapters 2 and 5).
Each purpose is intent on providing a more comprehensive picture of the patient’s
journey from not only the patient’s perspective but also from a management,
clinician and carer perspective as well. Inclusion of the meta-method components
will also address the 6 ‘Aims for Improvement’ as detailed by the IOM’s ‘Crossing
the Quality Chasm’ report. This will ultimately lead to safer and higher quality
models of care being delivered across the healthcare domain.
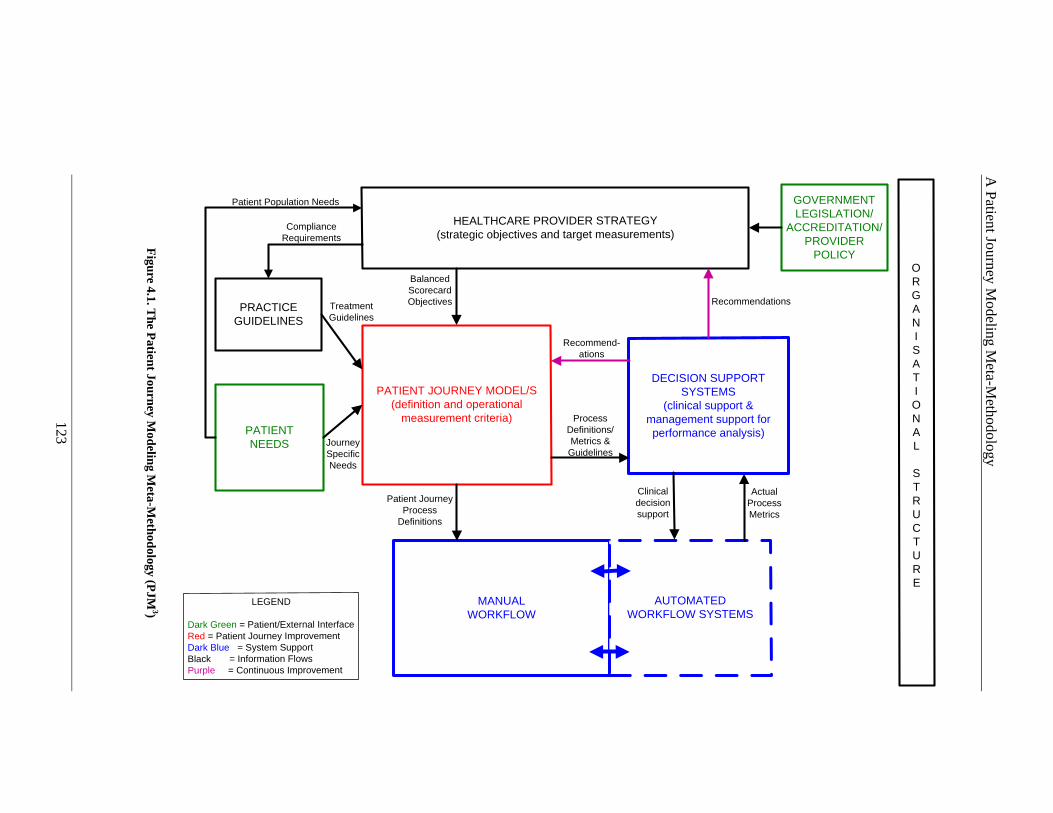
A P
atient Jo
urney M
odeling M
eta-Methodo
logy
123
HEALTHCARE PROVIDER STRATEGY (strategic objectives and target measurements)
DECISION SUPPORT SYSTEMS
(clinical support & management support for performance analysis)
MANUAL WORKFLOW
PATIENT NEEDS
LEGEND
Dark Green = Patient/External InterfaceRed = Patient Journey ImprovementDark Blue = System SupportBlack = Information FlowsPurple = Continuous Improvement
PRACTICE GUIDELINES
ORGANISATIONAL
STRUCTURE
PATIENT JOURNEY MODEL/S(definition and operational
measurement criteria)
AUTOMATEDWORKFLOW SYSTEMS
GOVERNMENT LEGISLATION/
ACCREDITATION/PROVIDER
POLICY
Process Definitions/Metrics & Guidelines
Balanced Scorecard Objectives
Patient Journey Process
Definitions
Actual Process Metrics
Recommendations
Recommend-ations
Patient Population Needs
ComplianceRequirements
JourneySpecificNeeds
TreatmentGuidelines
Clinical decision support
Figure 4.1. T
he Patient Journey M
odeling Meta-M
ethodology (PJM 3)
A Patient Journey Modeling Meta-Methodology
124
Components within the meta-method are differentiated by colour as defined in the
legend. Patient/External Interfaces are shown in dark green and indicate where
input from patients, the community and environment should be included. Activities
that relate to the development of the patient journey models are shown in red and
depict components that are central to the outcomes of the redesign project. System
Support is shown in blue and indicates where automated technology support should
be considered or integration of manual and automated procedures can provide
support. Continuous Process Improvement feedback loops are highlighted in purple.
Finally Information Flows such as Provider Strategy and Practice Guidelines are
depicted in black with the flow of information indicated by a directional arrow head.
The Providers Organisational Structure provides the underlying foundation for
definition of responsibility for all resources and the organisation’s reporting
structure.
Attention is firstly focused on ensuring that the Healthcare Provider’s Strategy is
clearly defined and understood by affected parties. Relevant Government legislation,
Accreditation Requirements and Provider Policy provide input to the definition of
strategic objectives and governance goals. Strategic objective definitions in the form
of Balanced Scorecard Objectives are output to the patient journey modeling
component. The meta-method considers the patient’s needs as an essential
component through the inclusion of environmental and socio/cultural needs analysis.
These provide input to both the development of the Healthcare Provider Strategy
and the operational definition of the processes involved in the Patient Journey.
Practice Guidelines are also a vital input to the development of the patient journey
model. A key aspect of this component is the inclusion of evidence-based best
practice. The creation of the Patient Journey Model is central to the overall method
with model outputs being applied to new workflow definitions and requirements for
Decision Support Systems for both clinical and managerial support. Clinical support
deals with decisions relating to patient care and management support deals with
variance analysis of resource performance. Treatment guidelines to be followed as
part of workflow enactment are also passed to the workflow component. Feedback
loops to both the Healthcare Provider Strategy and the patient journey model
definition exist to provide a mechanism for continuous process improvement.
A Patient Journey Modeling Meta-Methodology
125
All meta-methodology components and activities must also be cognisant of the
organisational structure so that relevant responsibilities and cross-checks can be
applied to redesigned outcomes.
The Meta-Methodology and Multi-Dimensional Patient Journey Modeling
Conceptual Design (discussed in chapter 6) provide the foundation for the
development of the new Patient Journey Modeling technique (PaJMa) as described
in Chapter 7. Through the definition of ‘multiple dimensions’, the Patient Journey
Models developed will better represent the complex stakeholder interactions and
clinical streams that occur within Healthcare. This will lead to more comprehensive,
robust and specific models that will increase patient safety, reduce process variability
and be reusable across clinical environments. Inclusion of IT support, in the form of
automated workflows and Decision Support Systems, will also provide increased
efficiencies and allow feedback loops to be established so that continuous quality
improvement becomes part of daily operational activities.
The remainder of this chapter will detail the definition, purpose, inter-relationships
and inputs and outputs of each of the PJM3 components. It will begin with two key
components; namely Government Legislation/Accreditation/Provider Policy and
Patient Needs. These two components are central drivers of the overall process and
underpin all patient journey model activities.
4.3.1 Government Legislation/A ccreditation/Provider Policy
All Healthcare Providers are governed by a variety of policies, accreditation
requirements, guidelines and legislation. These include legal requirements and
policies for patient administration. As part of the Healthcare Provider Strategy
review, all relevant documentation must be taken into consideration including:
• Local, State and Federal Government legislation
• Accreditation Standards
• Hospital/Provider Policies
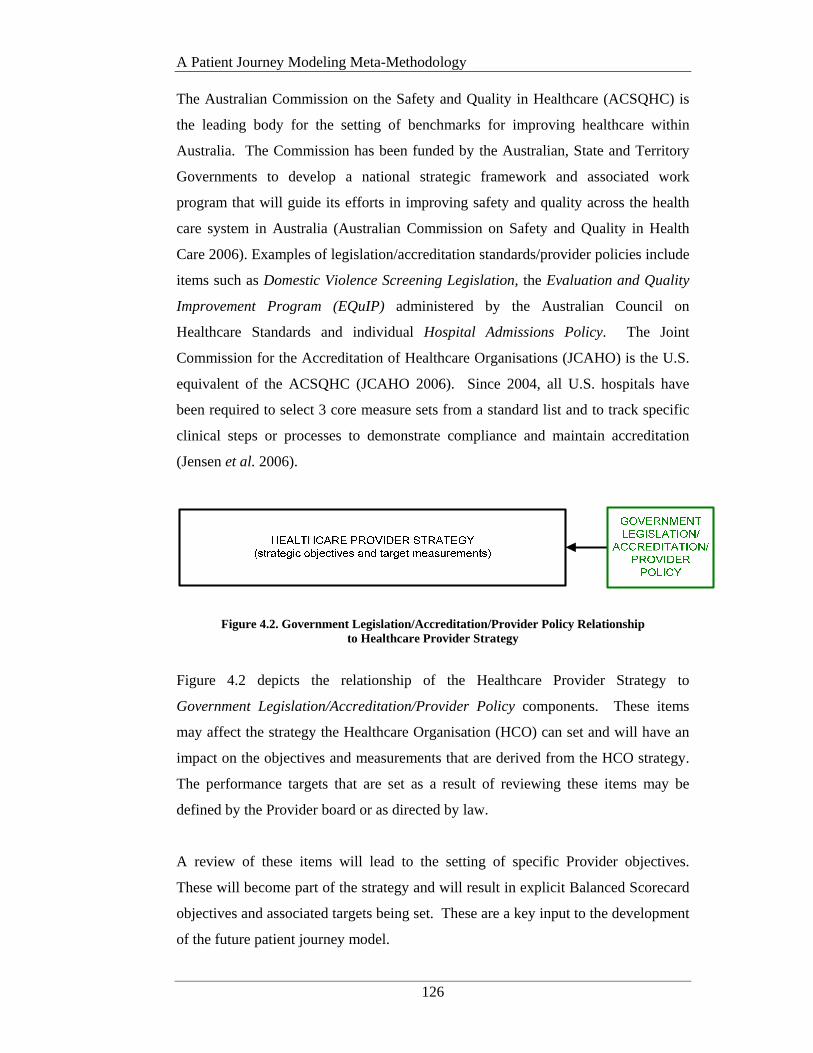
A Patient Journey Modeling Meta-Methodology
126
The Australian Commission on the Safety and Quality in Healthcare (ACSQHC) is
the leading body for the setting of benchmarks for improving healthcare within
Australia. The Commission has been funded by the Australian, State and Territory
Governments to develop a national strategic framework and associated work
program that will guide its efforts in improving safety and quality across the health
care system in Australia (Australian Commission on Safety and Quality in Health
Care 2006). Examples of legislation/accreditation standards/provider policies include
items such as Domestic Violence Screening Legislation, the Evaluation and Quality
Improvement Program (EQuIP) administered by the Australian Council on
Healthcare Standards and individual Hospital Admissions Policy. The Joint
Commission for the Accreditation of Healthcare Organisations (JCAHO) is the U.S.
equivalent of the ACSQHC (JCAHO 2006). Since 2004, all U.S. hospitals have
been required to select 3 core measure sets from a standard list and to track specific
clinical steps or processes to demonstrate compliance and maintain accreditation
(Jensen et al. 2006).
Figure 4.2. Government Legislation/Accreditation/Provider Policy Relationship to Healthcare Provider Strategy
Figure 4.2 depicts the relationship of the Healthcare Provider Strategy to
Government Legislation/Accreditation/Provider Policy components. These items
may affect the strategy the Healthcare Organisation (HCO) can set and will have an
impact on the objectives and measurements that are derived from the HCO strategy.
The performance targets that are set as a result of reviewing these items may be
defined by the Provider board or as directed by law.
A review of these items will lead to the setting of specific Provider objectives.
These will become part of the strategy and will result in explicit Balanced Scorecard
objectives and associated targets being set. These are a key input to the development
of the future patient journey model.
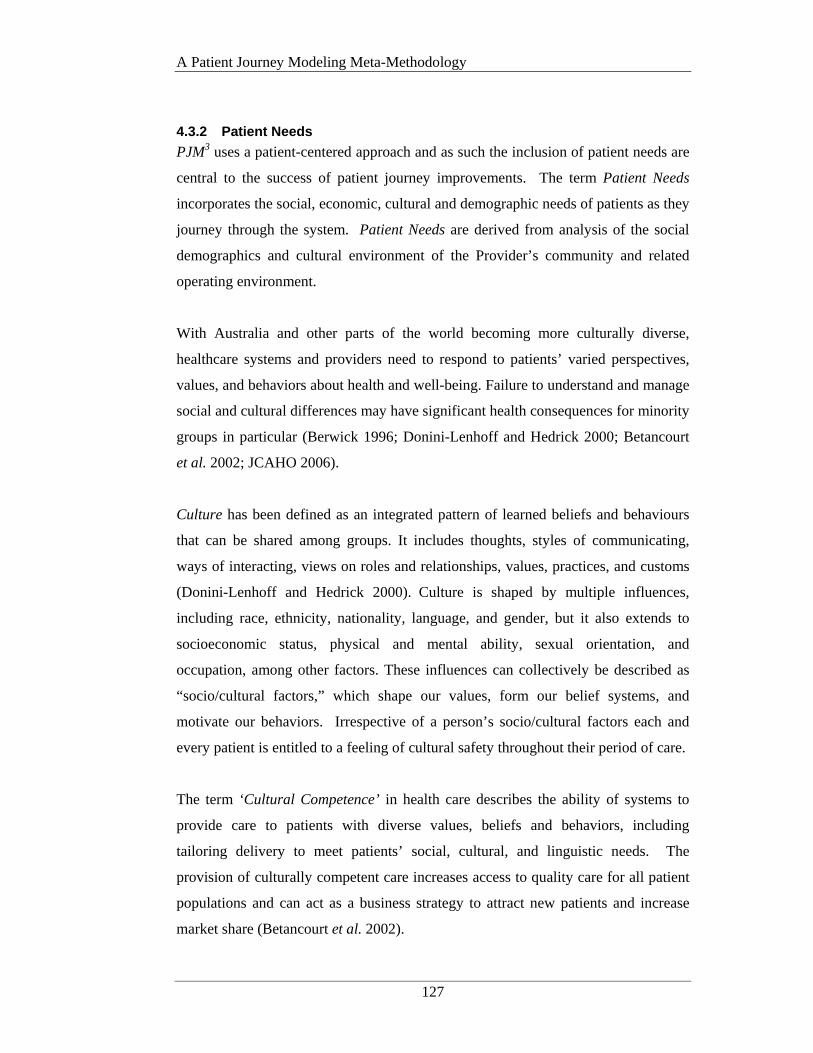
A Patient Journey Modeling Meta-Methodology
127
4.3.2 Patient Needs
PJM3 uses a patient-centered approach and as such the inclusion of patient needs are
central to the success of patient journey improvements. The term Patient Needs
incorporates the social, economic, cultural and demographic needs of patients as they
journey through the system. Patient Needs are derived from analysis of the social
demographics and cultural environment of the Provider’s community and related
operating environment.
With Australia and other parts of the world becoming more culturally diverse,
healthcare systems and providers need to respond to patients’ varied perspectives,
values, and behaviors about health and well-being. Failure to understand and manage
social and cultural differences may have significant health consequences for minority
groups in particular (Berwick 1996; Donini-Lenhoff and Hedrick 2000; Betancourt
et al. 2002; JCAHO 2006).
Culture has been defined as an integrated pattern of learned beliefs and behaviours
that can be shared among groups. It includes thoughts, styles of communicating,
ways of interacting, views on roles and relationships, values, practices, and customs
(Donini-Lenhoff and Hedrick 2000). Culture is shaped by multiple influences,
including race, ethnicity, nationality, language, and gender, but it also extends to
socioeconomic status, physical and mental ability, sexual orientation, and
occupation, among other factors. These influences can collectively be described as
“socio/cultural factors,” which shape our values, form our belief systems, and
motivate our behaviors. Irrespective of a person’s socio/cultural factors each and
every patient is entitled to a feeling of cultural safety throughout their period of care.
The term ‘Cultural Competence’ in health care describes the ability of systems to
provide care to patients with diverse values, beliefs and behaviors, including
tailoring delivery to meet patients’ social, cultural, and linguistic needs. The
provision of culturally competent care increases access to quality care for all patient
populations and can act as a business strategy to attract new patients and increase
market share (Betancourt et al. 2002).
A Patient Journey Modeling Meta-Methodology
128
The JCAHO supports culturally safe and competent care as part of the accreditation
process via the publication of their ‘Requirements Related to the Provision of
Culturally and Linguistically Appropriate Health Care’ standards and elements of
performance (JCAHO 2005).
Initiatives such as community assessments, development of community and patient
feedback mechanisms, multi-lingual education, support and advice, quality measures
for diverse populations and hiring of physicians ‘native’ to the local population, lead
to the provision of culturally appropriate care models. Such an approach leads to
systemic social and cultural competence within the healthcare provider structure.
Figure 4.3. Integrated Sciences Model (Sahler and Carr 2003)
Carr’s Integrated Sciences Model (1999) suggested that a patient is a complex, but
integrated system of many variables that can be categorised under five (5) broad
areas: biological, behavioural, cognitive, sociocultural and environmental. The
variables within each domain are constantly interacting with variables in all other
domains such that a change in one effects a change in all others. Therefore to reduce
stress across all 5 areas and thus stress to the patient, patient care must strive to
maintain a balance between the variables at all times (Sahler and Carr 2003). This
indicates that high quality clinical care alone will not provide the patient with total
satisfaction.

A Patient Journey Modeling Meta-Methodology
129
Figure 4.4. PJM3 and Patient Needs
The Meta-methodology supports a culturally competent approach by including an
explicit component relating to the analysis, definition and input of patient needs to
the Healthcare Provider Strategy and at an operational level, the Patient Journey
Model (see Figure 4.4).
High level socio-cultural needs of the target patient population provide input into the
Healthcare Provider Strategy development activity and then flow onto definition of
objectives in the Patient Satisfaction Perspective of the Balanced Scorecards. These
objectives are used to derive target measurements for patient journey enactment.
Operational patient needs, relating to the actual models of care to be delivered, are
input to the patient journey model analysis and design activities. Patient needs input
may be in the form of patient satisfaction survey results, community reports,
academic research articles and/or personal representations from patients or patient
groups. Inclusion in the redesign team, of physicians ‘native’ to the local patient
population also provides an excellent insight when developing culturally appropriate
models of care (Silow-Carroll et al. 2006).
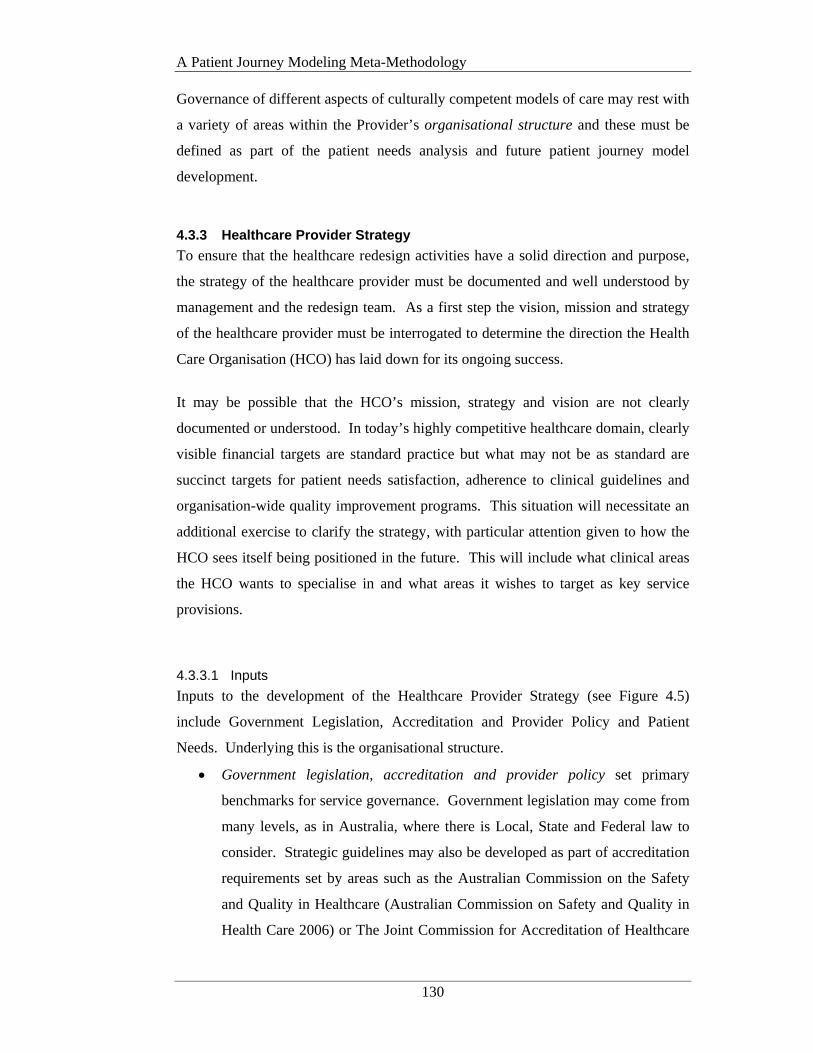
A Patient Journey Modeling Meta-Methodology
130
Governance of different aspects of culturally competent models of care may rest with
a variety of areas within the Provider’s organisational structure and these must be
defined as part of the patient needs analysis and future patient journey model
development.
4.3.3 Healthcare Provider Strategy
To ensure that the healthcare redesign activities have a solid direction and purpose,
the strategy of the healthcare provider must be documented and well understood by
management and the redesign team. As a first step the vision, mission and strategy
of the healthcare provider must be interrogated to determine the direction the Health
Care Organisation (HCO) has laid down for its ongoing success.
It may be possible that the HCO’s mission, strategy and vision are not clearly
documented or understood. In today’s highly competitive healthcare domain, clearly
visible financial targets are standard practice but what may not be as standard are
succinct targets for patient needs satisfaction, adherence to clinical guidelines and
organisation-wide quality improvement programs. This situation will necessitate an
additional exercise to clarify the strategy, with particular attention given to how the
HCO sees itself being positioned in the future. This will include what clinical areas
the HCO wants to specialise in and what areas it wishes to target as key service
provisions.
4.3.3.1 Inputs
Inputs to the development of the Healthcare Provider Strategy (see Figure 4.5)
include Government Legislation, Accreditation and Provider Policy and Patient
Needs. Underlying this is the organisational structure.
• Government legislation, accreditation and provider policy set primary
benchmarks for service governance. Government legislation may come from
many levels, as in Australia, where there is Local, State and Federal law to
consider. Strategic guidelines may also be developed as part of accreditation
requirements set by areas such as the Australian Commission on the Safety
and Quality in Healthcare (Australian Commission on Safety and Quality in
Health Care 2006) or The Joint Commission for Accreditation of Healthcare
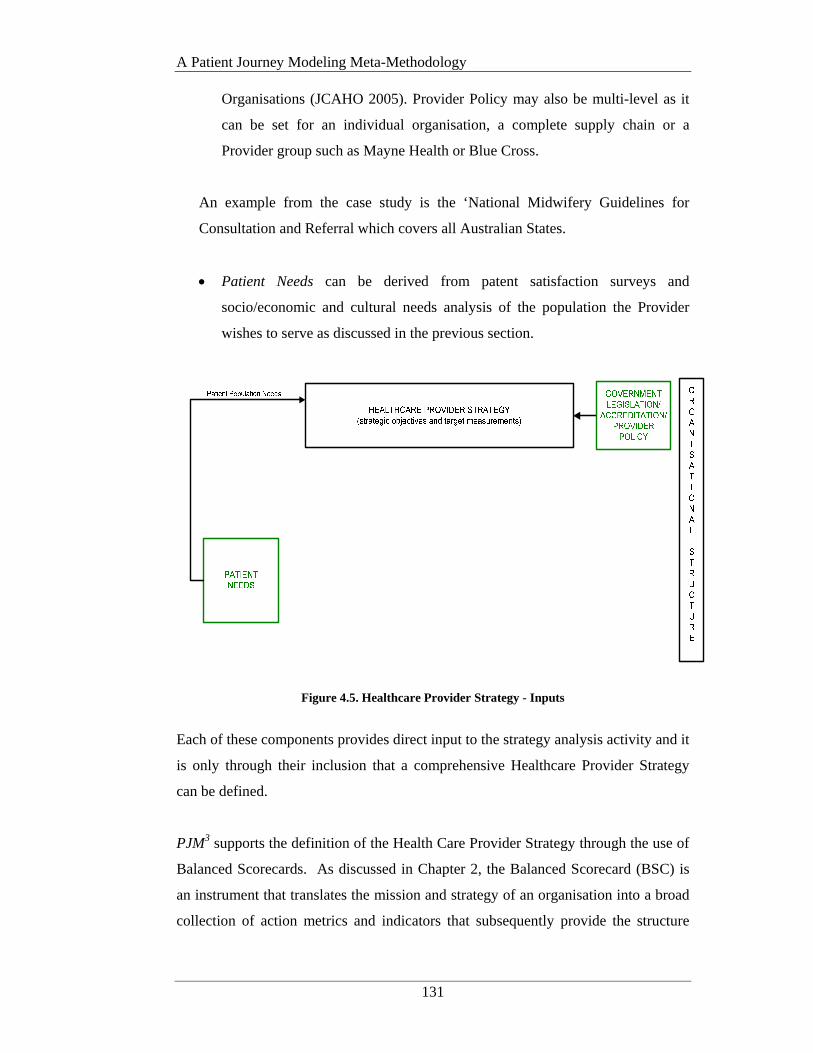
A Patient Journey Modeling Meta-Methodology
131
Organisations (JCAHO 2005). Provider Policy may also be multi-level as it
can be set for an individual organisation, a complete supply chain or a
Provider group such as Mayne Health or Blue Cross.
An example from the case study is the ‘National Midwifery Guidelines for
Consultation and Referral which covers all Australian States.
• Patient Needs can be derived from patent satisfaction surveys and
socio/economic and cultural needs analysis of the population the Provider
wishes to serve as discussed in the previous section.
Figure 4.5. Healthcare Provider Strategy - Inputs
Each of these components provides direct input to the strategy analysis activity and it
is only through their inclusion that a comprehensive Healthcare Provider Strategy
can be defined.
PJM3 supports the definition of the Health Care Provider Strategy through the use of
Balanced Scorecards. As discussed in Chapter 2, the Balanced Scorecard (BSC) is
an instrument that translates the mission and strategy of an organisation into a broad
collection of action metrics and indicators that subsequently provide the structure

A Patient Journey Modeling Meta-Methodology
132
necessary to serve as a control and strategic measurement system (Kaplan and
Norton 1992; Kaplan and Norton 1996).
Once the strategy is clearly defined and understood, strategic objectives can be set.
Strategic objectives are high level goals and measurements that will ultimately be
further dissected at the operational level. The Ontario Hospital Association
Balanced Scorecards as adapted from Kaplan and Norton’s original Balanced
Scorecard approach is the vehicle for the definition of the HCO’s strategic objectives
and measurement targets within PJM3 and it is the ongoing monitoring and control
of these targets that will determine the level of adherence to the organisation’s
overall direction and strategy.
More explicitly an objective is a statement of strategic intent. An objective states
how a strategy will be made operational. Generally, the objectives form the building
blocks for the overall strategy of the organisation. A measure is a performance
metric that will reflect progress against an objective. A measure must be
quantifiable. The measures communicate the specific behavior required to achieve
the objective and become the actionable statement of how the strategic objective will
be accomplished. A target is a quantifiable goal for each measure. Targets create
opportunity to succeed, help the organisation monitor progress toward strategic
goals, and communicate expectations. Initiatives are those action programs that
drive strategic performance. These are the activities that groups will focus on to
ensure attainment of strategic results. All initiatives underway in an organisation
should be aligned with the strategy in the Balanced Scorecard. An initiative should
be explicitly linked or mapped to achieving one or more strategic objective
(Balanced Scorecard Collaborative 2000).
In short Balanced Scorecards define the knowledge, skills and systems that
employees will need (system integration and change perspective) to innovate and
build the correct strategic capability and efficiency mix (the clinical utilisation and
outcomes perspective) to deliver specific value to the selected market (the patient
satisfaction perspective) that will eventually lead to improved stakeholder value (the
financial perspective) (Ontario Hospital Association 1999; Inamdar and Kaplan
2002).
A Patient Journey Modeling Meta-Methodology
133
In the complex environment of healthcare reporting, alignment of operational
activities and measurements to the strategic direction of the organisation is critical.
When structures, processes and culture aren't closely and carefully aligned with
strategy, the organisation almost invariably suffers.
The primary contributor to process improvement success is active, strong and visible
executive sponsorship throughout the project (Kotter 1996; Change Management
Learning Centre 2005). Such support will not be forthcoming if the goals of the
redesigning care project do not align with the HCO vision and strategy. Failure to
align redesign activities to the HCO strategy will also severely weaken the
justification for change and ongoing support for process improvements.
Some of the strategic objectives developed will be dictated by relevant professional
standards and accreditation requirements and some will be specific to the socio-
cultural needs of the affected patient population, the individual Area health service
and government bodies at the State and Federal levels.
4.3.3.2 Outputs
Once the definitions of the Provider BSC perspectives and measurements have been
finalised, the resulting objective measurement standards are integrated into the
patient journey modeling analysis and design activities. As discussed in Chapter 3
within this research this is facilitated through the use of the Balanced Scorecard
Collaborative BSC XML standard (Balanced Scorecard Collaborative 2001).
Selection of certain strategies (including decisions regarding accreditation) may
dictate how certain treatments will be delivered. To facilitate adherence to such
programs the Healthcare Provider Strategy provides output to the Practice
Guidelines component in the form of compliance requirements.
The relationship of the Healthcare Provider Strategy outputs to other meta-
methodology components is shown in Figure 4.6.
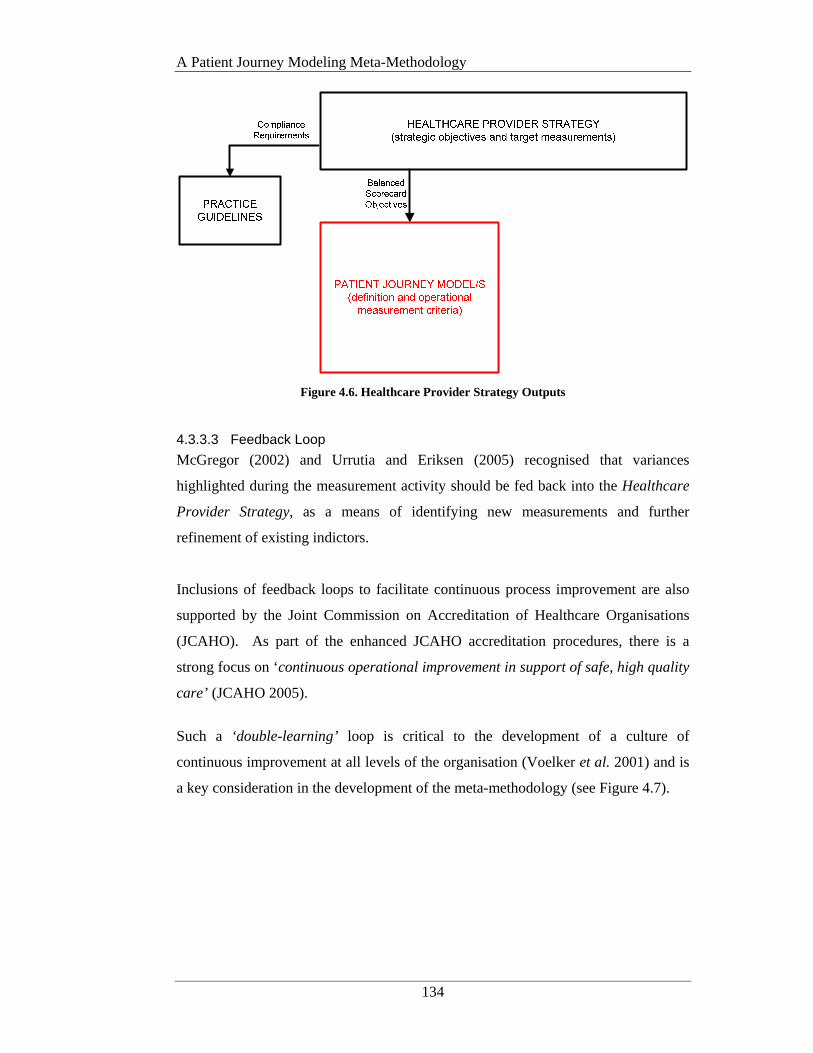
A Patient Journey Modeling Meta-Methodology
134
Figure 4.6. Healthcare Provider Strategy Outputs
4.3.3.3 Feedback Loop
McGregor (2002) and Urrutia and Eriksen (2005) recognised that variances
highlighted during the measurement activity should be fed back into the Healthcare
Provider Strategy, as a means of identifying new measurements and further
refinement of existing indictors.
Inclusions of feedback loops to facilitate continuous process improvement are also
supported by the Joint Commission on Accreditation of Healthcare Organisations
(JCAHO). As part of the enhanced JCAHO accreditation procedures, there is a
strong focus on ‘continuous operational improvement in support of safe, high quality
care’ (JCAHO 2005).
Such a ‘double-learning’ loop is critical to the development of a culture of
continuous improvement at all levels of the organisation (Voelker et al. 2001) and is
a key consideration in the development of the meta-methodology (see Figure 4.7).
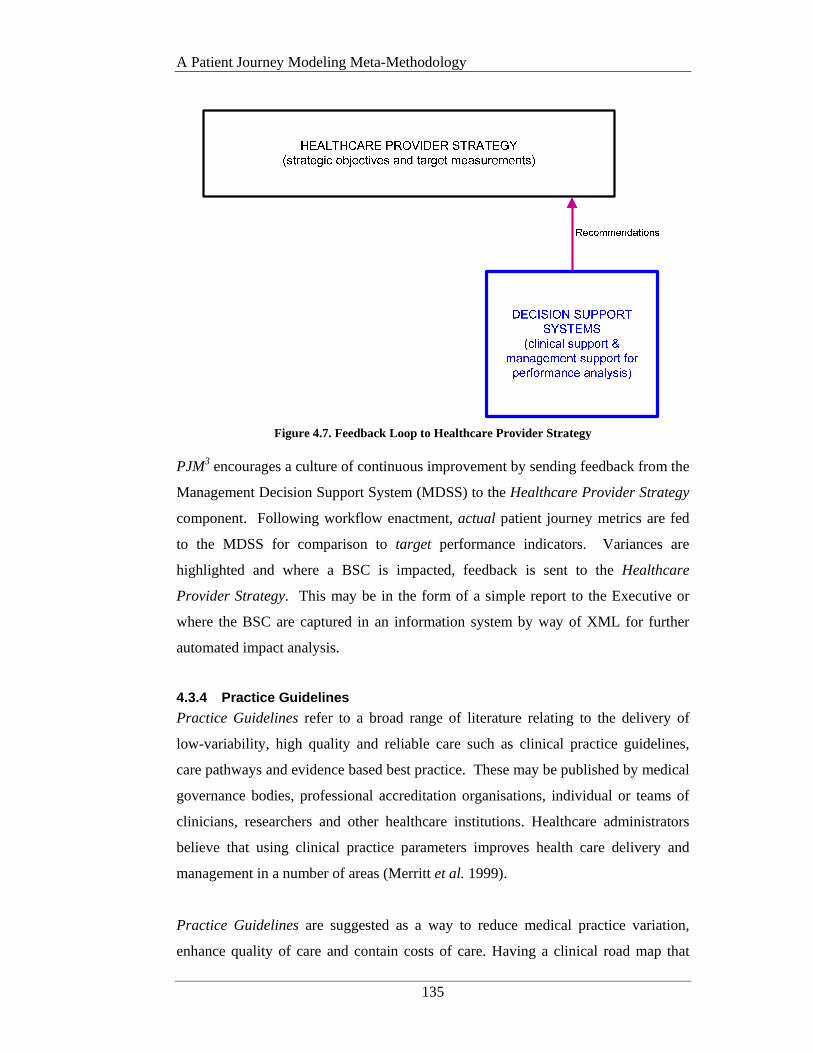
A Patient Journey Modeling Meta-Methodology
135
Figure 4.7. Feedback Loop to Healthcare Provider Strategy
PJM3 encourages a culture of continuous improvement by sending feedback from the
Management Decision Support System (MDSS) to the Healthcare Provider Strategy
component. Following workflow enactment, actual patient journey metrics are fed
to the MDSS for comparison to target performance indicators. Variances are
highlighted and where a BSC is impacted, feedback is sent to the Healthcare
Provider Strategy. This may be in the form of a simple report to the Executive or
where the BSC are captured in an information system by way of XML for further
automated impact analysis.
4.3.4 Practice Guidelines
Practice Guidelines refer to a broad range of literature relating to the delivery of
low-variability, high quality and reliable care such as clinical practice guidelines,
care pathways and evidence based best practice. These may be published by medical
governance bodies, professional accreditation organisations, individual or teams of
clinicians, researchers and other healthcare institutions. Healthcare administrators
believe that using clinical practice parameters improves health care delivery and
management in a number of areas (Merritt et al. 1999).
Practice Guidelines are suggested as a way to reduce medical practice variation,
enhance quality of care and contain costs of care. Having a clinical road map that
A Patient Journey Modeling Meta-Methodology
136
guides clinical decision making, thus minimising variation in treatment for `standard'
patients, should result in improved outcomes assuming the treatment `standardised'
by the guideline has been subjected to clinical trials demonstrating superior
outcomes. Health care administrators and insurers have also promoted guidelines as
a means to reduce the possibility of malpractice claims against clinicians and
providers (Merritt et al. 1999; Leeder and Rychetnik 2001; National Electronic
Decision Support Taskforce. 2002).
A key area for the identification of practice guidelines is ‘evidence-based best
practice’ or ‘evidence based medicine’ (EBM). An editorial in the British Medical
Journal (Sackett et al. 1996) defines EBM as:
The conscientious, explicit, and judicious use of current best evidence in
making decisions about the care of individual patients (p.1).
The practice of EBM means integrating individual clinical expertise with the best
available external clinical evidence from systematic research. Individual clinical
expertise is the proficiency and judgement that individual clinicians acquire through
clinical experience and practice.
External clinical evidence involves clinically relevant research relating to the
improvement of the diagnosis, treatment and outcomes for a given condition. The
main aim of external clinical evidence is to invalidate previously accepted diagnostic
treatments and replace them with newer treatments that are more powerful, more
accurate, more efficient and safer (Sackett et al. 1996). Originally designed to
improve the quality of medical education, EBM is now mainstream in many
Healthcare Organisations (HCOs).
Some argue that EBM can inform, but never replace, individual clinical expertise, as
it is the clinician’s expertise that decides whether the external evidence applies to the
individual patient in question, and if so, how it should be integrated into a clinical
decision (Farquhar et al. 2002). Notwithstanding this viewpoint, many insurers and
providers are moving to implement EBM practices in a bid to increase the reliability
of care, improve patient safety and reduce the opportunities for allegations of
malpractice.
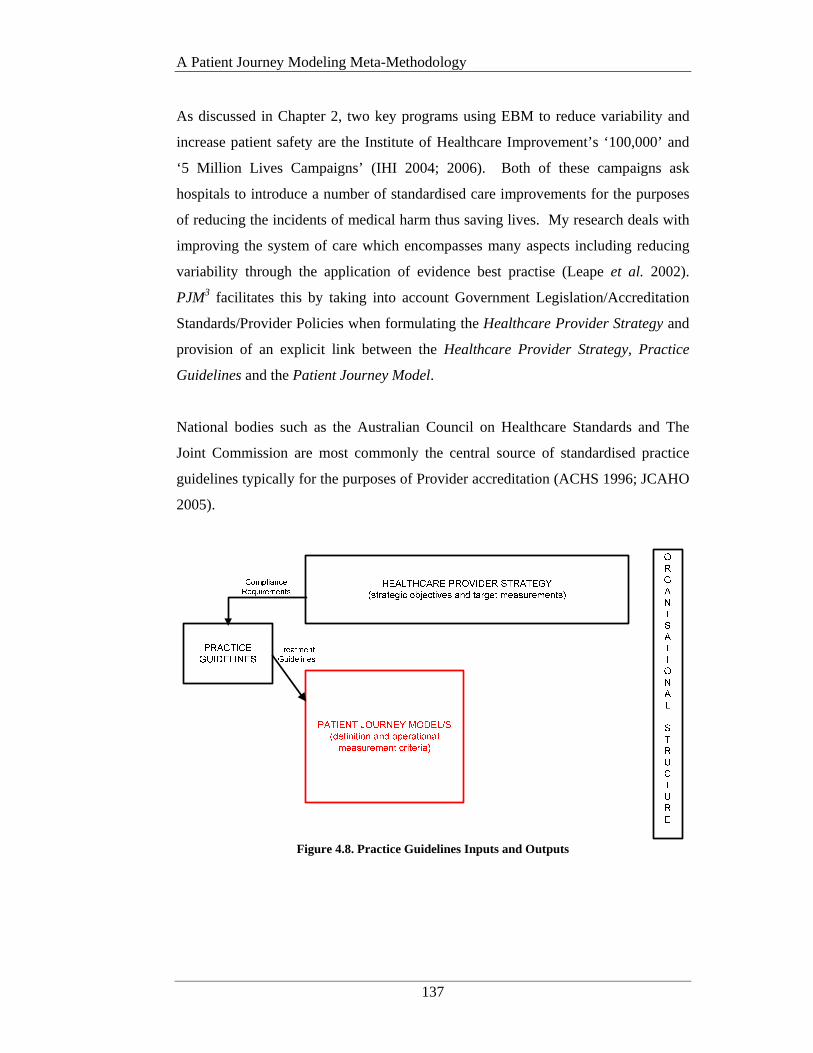
A Patient Journey Modeling Meta-Methodology
137
As discussed in Chapter 2, two key programs using EBM to reduce variability and
increase patient safety are the Institute of Healthcare Improvement’s ‘100,000’ and
‘5 Million Lives Campaigns’ (IHI 2004; 2006). Both of these campaigns ask
hospitals to introduce a number of standardised care improvements for the purposes
of reducing the incidents of medical harm thus saving lives. My research deals with
improving the system of care which encompasses many aspects including reducing
variability through the application of evidence best practise (Leape et al. 2002).
PJM3 facilitates this by taking into account Government Legislation/Accreditation
Standards/Provider Policies when formulating the Healthcare Provider Strategy and
provision of an explicit link between the Healthcare Provider Strategy, Practice
Guidelines and the Patient Journey Model.
National bodies such as the Australian Council on Healthcare Standards and The
Joint Commission are most commonly the central source of standardised practice
guidelines typically for the purposes of Provider accreditation (ACHS 1996; JCAHO
2005).
Figure 4.8. Practice Guidelines Inputs and Outputs
A Patient Journey Modeling Meta-Methodology
138
Figure 4.8 highlights the relationship of Practice Guidelines to both the Healthcare
Provider Strategy and the development of Patient Journey Models. Strategy related
to the granting of accreditation by the relevant HCO’s governing body and ongoing
compliance to the accreditation program is a key area to the input of Practice
Guidelines. Although different countries have differing accreditation programs each
have a strong focus on the provision of clinically proven and safe care. Compliance
to relevant legislation and Provider policy also provide key inputs. Such objectives
form a sound basis for the derivation of operational measurement targets as part of
the analysis and development of the patient journey models. At a lower level of
abstraction Practice Guidelines in the form of specific treatment guidelines also
provide input to the actual processes that should be conducted as part of a particular
patient journey. Practice Guidelines also promote efficient allocation of resources
and better overall delivery systems as part of the patient journey redesign (Farquhar
et al. 2002).
To overcome the bias of an individual clinician’s practices, a number of experienced
clinicians from within the affected clinical area should be included in the redesign
team. In this way even though an individual may work slightly differently with a
given guideline, consensus on an agreed modus operandi can be reached and used
when designing the new patient journey. This ‘team’ approach also helps to ensure
clinician ‘buy-in’ for the implementation of the new procedures.
Ensuring compliance to Practice Guidelines may currently rest with a variety of
different areas within the HCO’s organisational structure. Ideally as part of the new
patient journey design, responsibility for a given practice guideline should be
assigned to a single primary stakeholder. Although this may not be possible when a
patient journey transverses multiple departments or providers, the number of
positions sharing responsibility must be minimised. This negates the possibility of
‘handing-off’ responsibility when problems or errors arise.
A Patient Journey Modeling Meta-Methodology
139
4.3.5 Patient Journey Model Definition
The primary focus of the new meta-methodology (PJM3) is the facilitation of the
development of high-quality patient-centered patient journey models that lead to
reduced care variations and increased patient safety. It allows for the analysis of the
current patient journey and the improved future patient journey using the same
artifacts and input and outputs.
Definition of the Patient Journey Model can be performed using a variety of process
modeling techniques from the Process Reengineering domain. Chapter 5 discusses
the process modeling techniques most commonly used within the Healthcare domain
and evaluates them for their support of process improvement in healthcare. Chapter
7 presents a new Patient Journey Modeling technique known as PaJMa.
4.3.5.1 Inputs
Development of Patient Journey Models (PJM) should be conducted by a team of
stakeholders, involved in the actual delivery of care, for the journey under review.
This team includes members from all levels of the organisation such as clinicians
and other health workers, clerical and lab staff, management, IT support, patient
representatives and if applicable external suppliers such as paramedics or GPs.
Collectively these stakeholders make up the redesign team.
In the first instance a model of the current patient journey is developed. This deals
exclusively with the processes, people and systems involved in the ‘as-is’ journey
and leads to the identification of problem areas that will become targets for
improvement in the development of the future patient journey. Development of
patient journey models involves face-to-face sessions with members of the redesign
team. These face-to-face sessions should be led by an experienced facilitator whose
role it is to guide the process and structure of the sessions whilst encouraging the
participants to share their knowledge and expertise to arrive at an accurate picture of
the present situation - the current patient journey. The aims of such facilitated
workgroups are to achieve a shared understanding of the issues facing the group, a
sense of common purpose and a mutual commitment to action (Phillips and Phillips
1993).
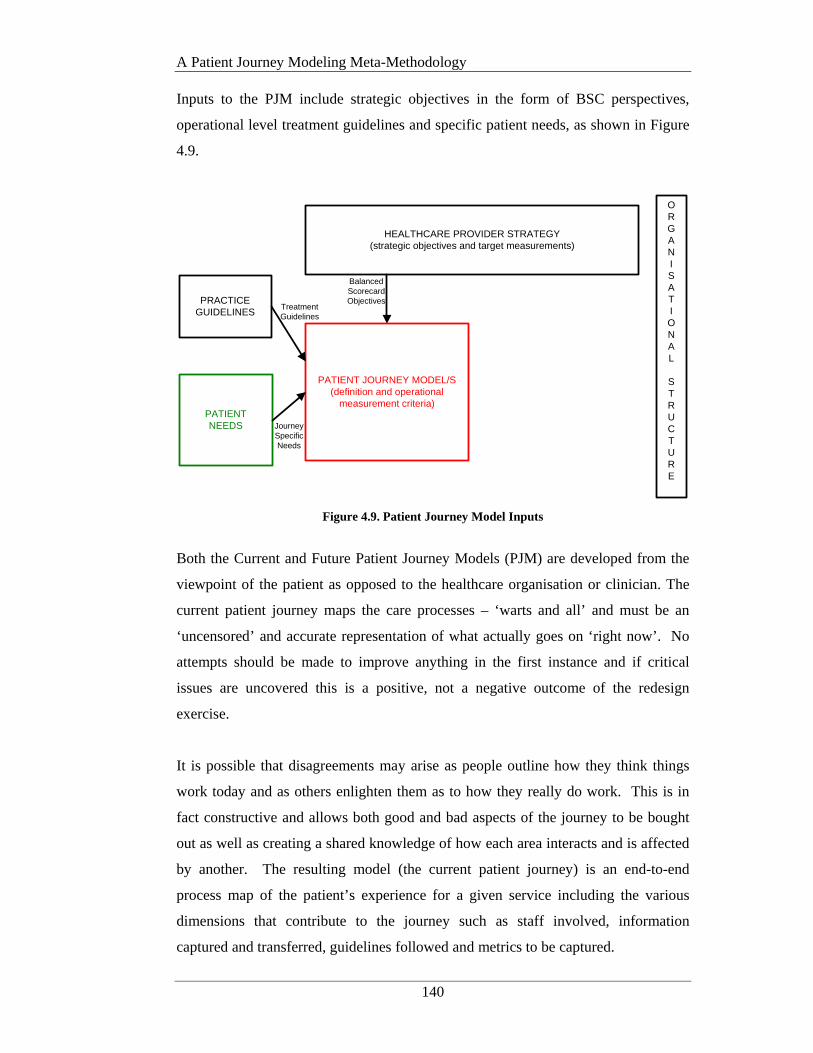
A Patient Journey Modeling Meta-Methodology
140
Inputs to the PJM include strategic objectives in the form of BSC perspectives,
operational level treatment guidelines and specific patient needs, as shown in Figure
4.9.
HEALTHCARE PROVIDER STRATEGY (strategic objectives and target measurements)
PATIENT NEEDS
PRACTICE GUIDELINES
PATIENT JOURNEY MODEL/S(definition and operational
measurement criteria)
ORGANISATIONAL
STRUCTURE
Balanced Scorecard Objectives
Treatment Guidelines
Journey Specific Needs
Figure 4.9. Patient Journey Model Inputs
Both the Current and Future Patient Journey Models (PJM) are developed from the
viewpoint of the patient as opposed to the healthcare organisation or clinician. The
current patient journey maps the care processes – ‘warts and all’ and must be an
‘uncensored’ and accurate representation of what actually goes on ‘right now’. No
attempts should be made to improve anything in the first instance and if critical
issues are uncovered this is a positive, not a negative outcome of the redesign
exercise.
It is possible that disagreements may arise as people outline how they think things
work today and as others enlighten them as to how they really do work. This is in
fact constructive and allows both good and bad aspects of the journey to be bought
out as well as creating a shared knowledge of how each area interacts and is affected
by another. The resulting model (the current patient journey) is an end-to-end
process map of the patient’s experience for a given service including the various
dimensions that contribute to the journey such as staff involved, information
captured and transferred, guidelines followed and metrics to be captured.
A Patient Journey Modeling Meta-Methodology
141
Once complete the current PJM is interrogated for improvement opportunities.
Areas such as information duplication, excessive patient movement or care
handovers, unsafe procedures or non-compliance to set guidelines are key targets.
Some of these may be very obvious and will have surfaced during current PJM
model development. Others will be more subtle and may require some in depth
analysis. Improvement targets are simply highlighted on the model itself and form
the starting point for the development of the improved or ‘future’ patient journey.
The purpose of the future PJM is to develop a comprehensive and accurate picture of
how the ‘ideal’ journey, once improved, will be enacted and how improvements will
be evaluated. The future PJM is developed using exactly the same inputs as the
current PJM. Additional activities may be required however to more clearly define
or enhance existing Healthcare Provider Strategy and objectives and to identify
patient needs relevant to the local population. A decision may also need to be made
regarding the implementation time frame of future PJM iterations. For example, the
redesign team may highlight that there is a need for a new (or integrated) information
system that is used as a single point of data capture. Depending on the development
backlog of the IT section this may take a good deal of time and therefore other
interim processes may need to be considered to overcome the problem in the short
term. In this way there may be several iterations of the future PJM, each introducing
increased improvements to the patient journey over time until the ‘ideal’ journey is
reached. This is similar to the Model For Improvement’s PDSA cycles (IHI 2003).
Possible time frames are immediate, short (within 4 weeks), medium (within 3
months) and long (within 6 months). Irrespective of how many implementation
iterations may be necessary, the ‘ideal’ future patient journey model must always be
developed in full as a starting point. This is then used as the benchmark against
which all improvements can be assessed.
Input of BSC objectives to the future PJM is facilitated via the use of the Balanced
Scorecard Collaborative’s BSC XML standard (Balanced Scorecard Collaborative
2001) The BSC objectives drive the definition of operational measurements for
specific processes enacted as part of the journey.
A Patient Journey Modeling Meta-Methodology
142
For example
A Clinical Utilisation and Outcomes Perspective objective at the strategic level may
state that the HCO ‘will pursue and attain accreditation from the JCAHO within the
next 12 months’. One aspect of the operational targets at the patient journey level can
then focus on the definition of processes that facilitate targets relating to the
compliance to clinical practice guidelines as published by the JCAHO accreditation
board, for relevant patient journey processes (ie: ‘preventing ventilator-associated
pneumonia by following 4 steps including raising the patient’s bedhead) (Berwick et
al. 2006). It must be noted that all operational measurements defined as part of the
patient journey model must be able to be linked back to a strategic objective or the
value of the work being conducted must be questioned.
This example also provides an illustration of the role of practice guidelines as an
input into the definition of the future PJM. As part of the definition of each process
within the journey, specific practice guidelines, that must be included as a part of the
process enactment, are detailed along with adherence measurements and patient
safety improvement targets. The ideal approach is to develop XML schemas or
ontologies to define practice guidelines to enable explicit links to the PJM. Aspects
of the HL7 Reference Information Model (RIM) also provide standards for the
transmission of relevant messages in relation to procedures to be delivered.
Patient Needs inputs incorporate the social, economic, cultural and demographic
needs of patients as they journey through the system. Patient Needs are derived
from analysis of the social demographics and cultural environment of the Provider’s
community and related operating environment via socio/cultural needs analysis or
similar as discussed in section 4.3.2. At an operational level items such as
appropriateness of environment, inclusion of ‘native’ staff resources and patient
education are key target areas for improvement. However other more personal areas
must also be considered such as end-of-life care and birth rituals. Ideally input
should come from patient’s who have recently undergone this patient journey and
members of the community who can represent cultural patient needs. Future patient
journey models must ensure culturally safe and competent care environments. Input
of patient needs to the Future PJM may be in the form of XML schemas or specific

A Patient Journey Modeling Meta-Methodology
143
metrics that will be used to measure the quality of patient journey post-
implementation.
Responsibility for the new patient journey should ideally rest with one position
within the HCO’s organisational structure. If this is not plausible then each process
must be assigned an ‘owner’ whose role it will be to ensure all resources comply
with the process requirements and to liaise with other process owners if issues arise.
This will entail deciding whether the process should be changed or whether
associated inputs and/or outputs will need to be altered. The performance of a
process owner, will in part, be measured by the increased quality outcomes of the
processes under their control.
4.3.5.2 Outputs
The process definitions resulting from the development of the future PJM are fed
into the Workflow component. New workflows may take the form of improved
manual procedures or systems automation. The decision on what processes will be
manual and which will be automated will depend on issues such as available budget
and IT development backlogs.
Figure 4.10. Patient Journey Model Outputs
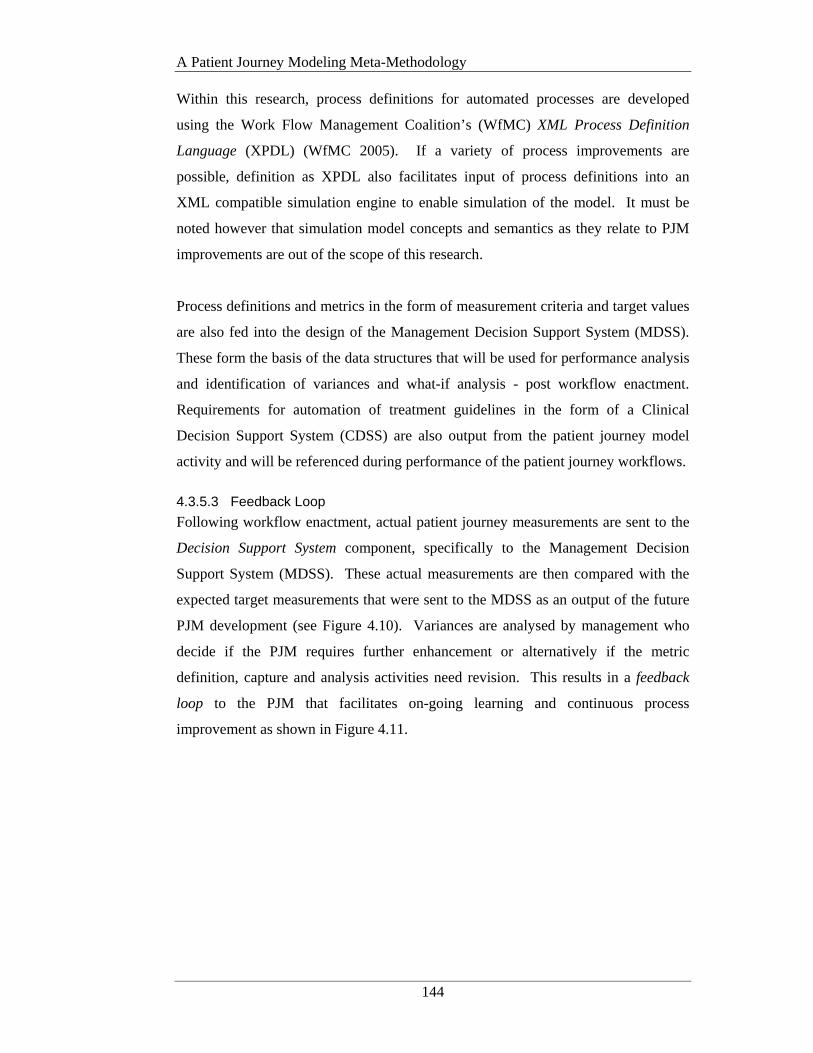
A Patient Journey Modeling Meta-Methodology
144
Within this research, process definitions for automated processes are developed
using the Work Flow Management Coalition’s (WfMC) XML Process Definition
Language (XPDL) (WfMC 2005). If a variety of process improvements are
possible, definition as XPDL also facilitates input of process definitions into an
XML compatible simulation engine to enable simulation of the model. It must be
noted however that simulation model concepts and semantics as they relate to PJM
improvements are out of the scope of this research.
Process definitions and metrics in the form of measurement criteria and target values
are also fed into the design of the Management Decision Support System (MDSS).
These form the basis of the data structures that will be used for performance analysis
and identification of variances and what-if analysis - post workflow enactment.
Requirements for automation of treatment guidelines in the form of a Clinical
Decision Support System (CDSS) are also output from the patient journey model
activity and will be referenced during performance of the patient journey workflows.
4.3.5.3 Feedback Loop
Following workflow enactment, actual patient journey measurements are sent to the
Decision Support System component, specifically to the Management Decision
Support System (MDSS). These actual measurements are then compared with the
expected target measurements that were sent to the MDSS as an output of the future
PJM development (see Figure 4.10). Variances are analysed by management who
decide if the PJM requires further enhancement or alternatively if the metric
definition, capture and analysis activities need revision. This results in a feedback
loop to the PJM that facilitates on-going learning and continuous process
improvement as shown in Figure 4.11.

A Patient Journey Modeling Meta-Methodology
145
ORGANISATIONAL
STRUCTURE
PATIENT JOURNEY MODEL/S(definition and operational
measurement criteria)
Recommend-ations
MANUAL WORKFLOW
AUTOMATEDWORKFLOW SYSTEMS
Actual Process Metrics
DECISION SUPPORT SYSTEMS
(clinical support & management support for performance analysis)
Figure 4.11. Patient Journey Model Feedback Loop
Chapter 7 presents a new and innovative patient journey modeling tool designed
specifically for the healthcare domain. An original Systems Development Life Cycle
(SDLC) detailing in full how PJM projects are conducted can be found in Curry et
al. (2007). The work discussed in this paper was developed as part of the conduct of
the research case study described in Chapter 5.
4.3.6 Workflow Enactment
The process definitions received from the Patient Journey Model Definition stage are
analysed to determine the actual degree of workflow automation that is
available/possible. Workflow enactment may actually be a combination of manual
and automated processes but both are driven by the process definitions output from
PJM redesign activities.
4.3.6.1 Inputs
Definitions of the processes within the future PJM, that will be automated, are
developed using the WfMC XML Process Definition Language (XPDL) (WfMC
2005). This will include allocation of role responsibility for individual processes as
defined by the organisational structure.
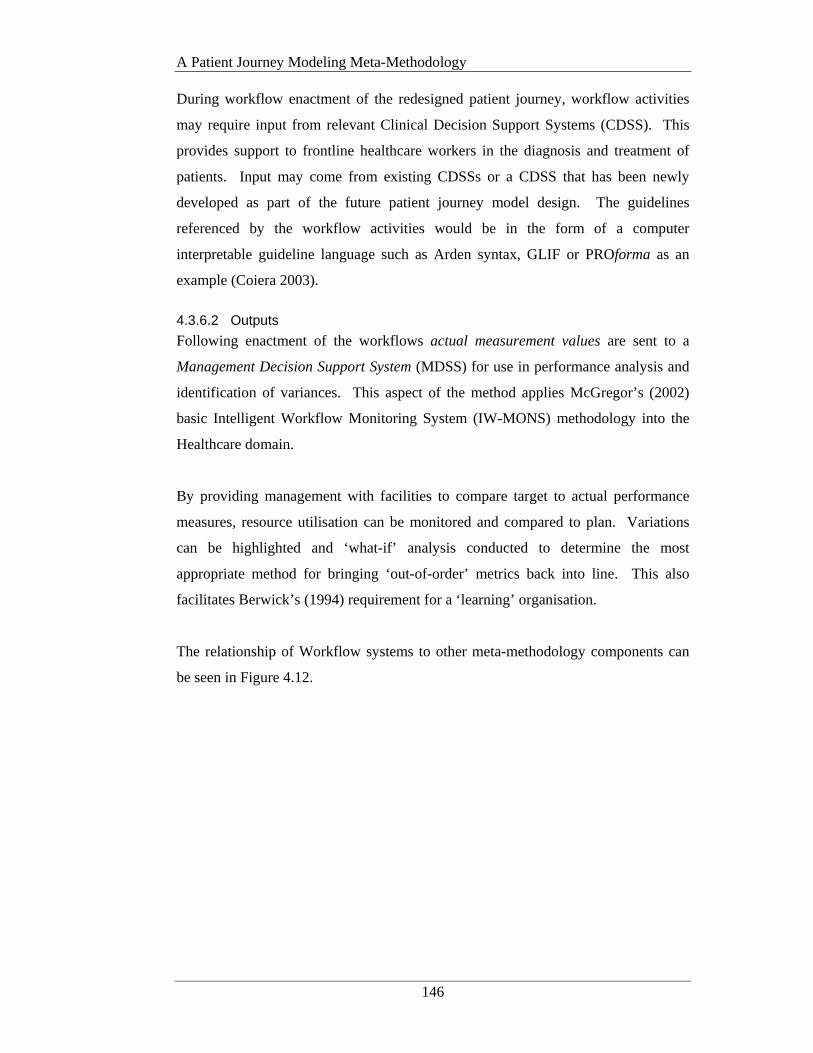
A Patient Journey Modeling Meta-Methodology
146
During workflow enactment of the redesigned patient journey, workflow activities
may require input from relevant Clinical Decision Support Systems (CDSS). This
provides support to frontline healthcare workers in the diagnosis and treatment of
patients. Input may come from existing CDSSs or a CDSS that has been newly
developed as part of the future patient journey model design. The guidelines
referenced by the workflow activities would be in the form of a computer
interpretable guideline language such as Arden syntax, GLIF or PROforma as an
example (Coiera 2003).
4.3.6.2 Outputs
Following enactment of the workflows actual measurement values are sent to a
Management Decision Support System (MDSS) for use in performance analysis and
identification of variances. This aspect of the method applies McGregor’s (2002)
basic Intelligent Workflow Monitoring System (IW-MONS) methodology into the
Healthcare domain.
By providing management with facilities to compare target to actual performance
measures, resource utilisation can be monitored and compared to plan. Variations
can be highlighted and ‘what-if’ analysis conducted to determine the most
appropriate method for bringing ‘out-of-order’ metrics back into line. This also
facilitates Berwick’s (1994) requirement for a ‘learning’ organisation.
The relationship of Workflow systems to other meta-methodology components can
be seen in Figure 4.12.
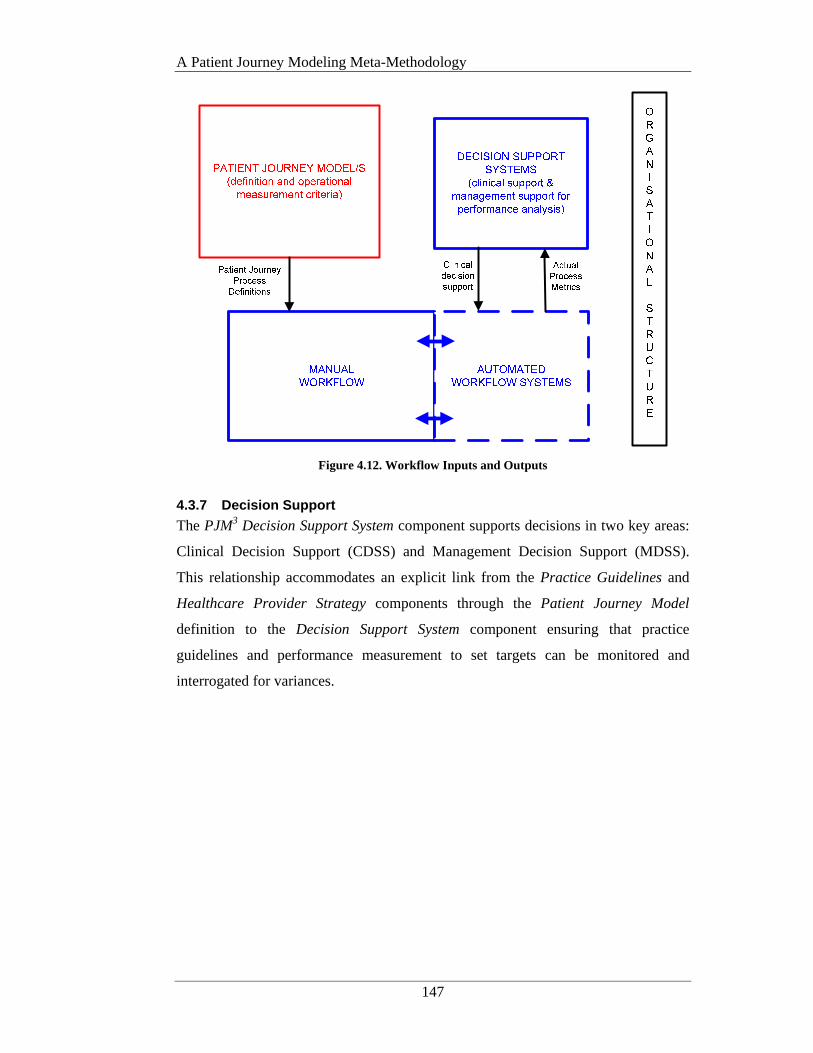
A Patient Journey Modeling Meta-Methodology
147
Figure 4.12. Workflow Inputs and Outputs
4.3.7 Decision Support
The PJM3 Decision Support System component supports decisions in two key areas:
Clinical Decision Support (CDSS) and Management Decision Support (MDSS).
This relationship accommodates an explicit link from the Practice Guidelines and
Healthcare Provider Strategy components through the Patient Journey Model
definition to the Decision Support System component ensuring that practice
guidelines and performance measurement to set targets can be monitored and
interrogated for variances.
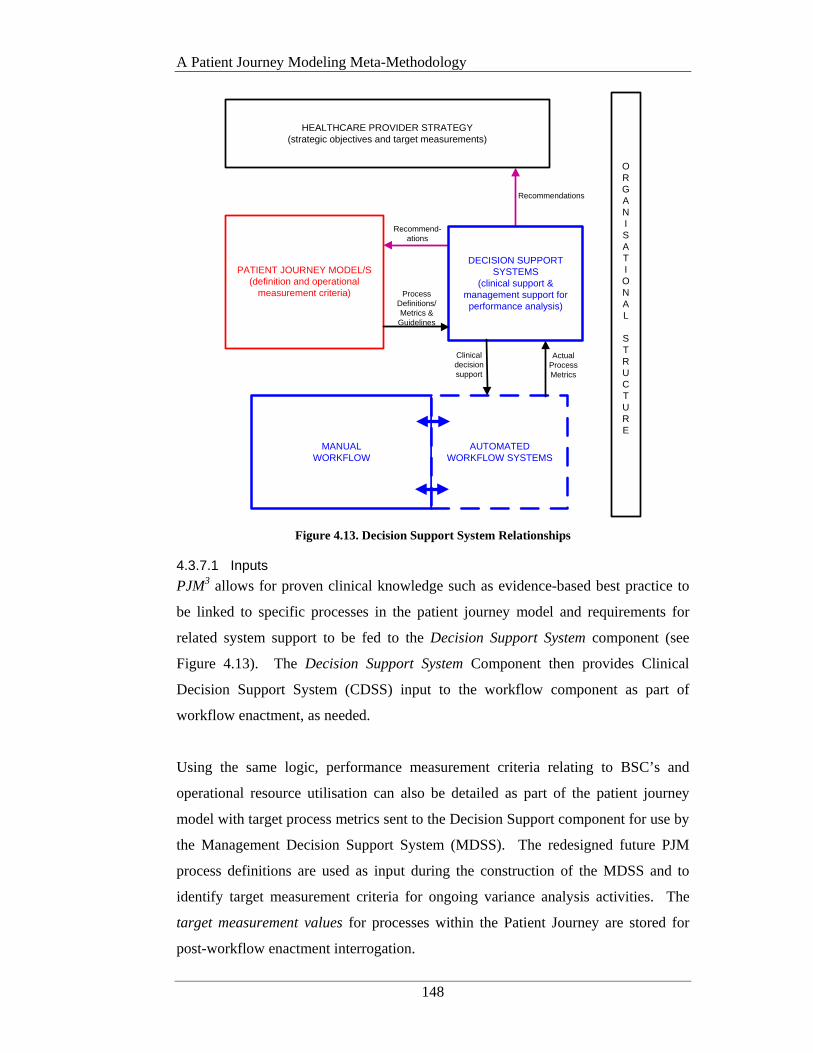
A Patient Journey Modeling Meta-Methodology
148
HEALTHCARE PROVIDER STRATEGY (strategic objectives and target measurements)
MANUAL WORKFLOW
PATIENT JOURNEY MODEL/S(definition and operational
measurement criteria)
AUTOMATEDWORKFLOW SYSTEMS
Recommendations
Recommend-ations
ORGANISATIONAL
STRUCTURE
DECISION SUPPORT SYSTEMS
(clinical support & management support for performance analysis)
Process Definitions/Metrics &
Guidelines
Actual Process Metrics
Clinical decision support
Figure 4.13. Decision Support System Relationships
4.3.7.1 Inputs
PJM3 allows for proven clinical knowledge such as evidence-based best practice to
be linked to specific processes in the patient journey model and requirements for
related system support to be fed to the Decision Support System component (see
Figure 4.13). The Decision Support System Component then provides Clinical
Decision Support System (CDSS) input to the workflow component as part of
workflow enactment, as needed.
Using the same logic, performance measurement criteria relating to BSC’s and
operational resource utilisation can also be detailed as part of the patient journey
model with target process metrics sent to the Decision Support component for use by
the Management Decision Support System (MDSS). The redesigned future PJM
process definitions are used as input during the construction of the MDSS and to
identify target measurement criteria for ongoing variance analysis activities. The
target measurement values for processes within the Patient Journey are stored for
post-workflow enactment interrogation.
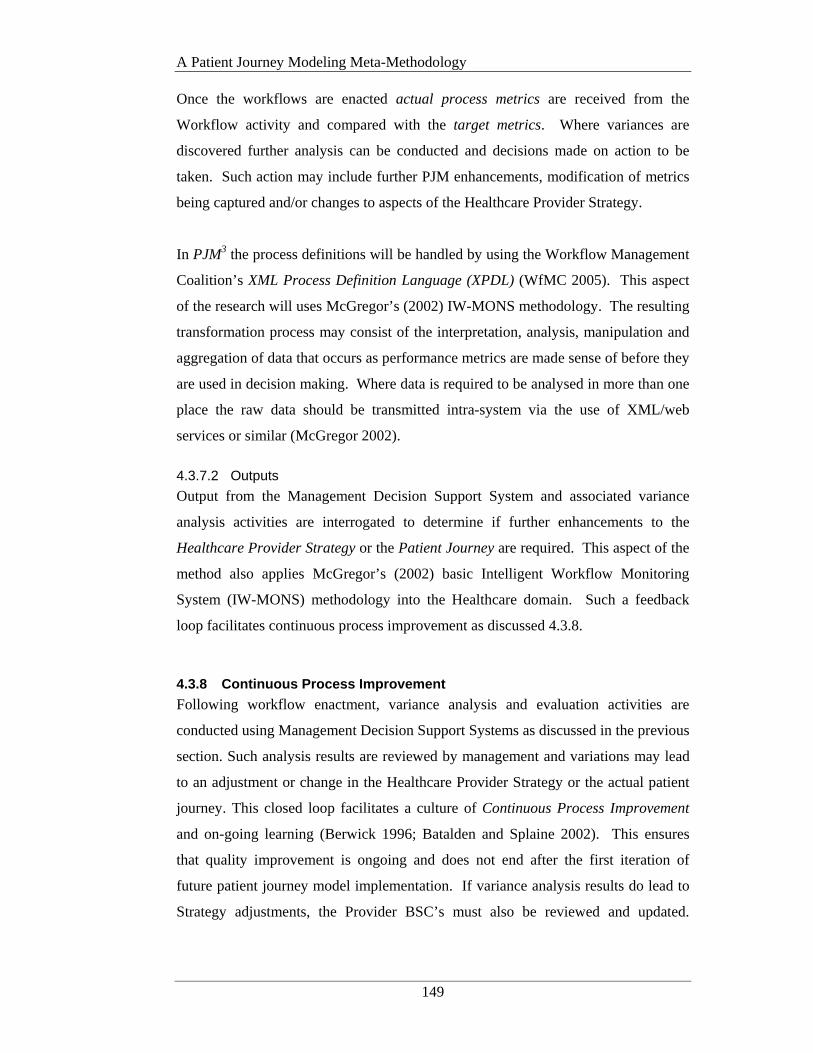
A Patient Journey Modeling Meta-Methodology
149
Once the workflows are enacted actual process metrics are received from the
Workflow activity and compared with the target metrics. Where variances are
discovered further analysis can be conducted and decisions made on action to be
taken. Such action may include further PJM enhancements, modification of metrics
being captured and/or changes to aspects of the Healthcare Provider Strategy.
In PJM3 the process definitions will be handled by using the Workflow Management
Coalition’s XML Process Definition Language (XPDL) (WfMC 2005). This aspect
of the research will uses McGregor’s (2002) IW-MONS methodology. The resulting
transformation process may consist of the interpretation, analysis, manipulation and
aggregation of data that occurs as performance metrics are made sense of before they
are used in decision making. Where data is required to be analysed in more than one
place the raw data should be transmitted intra-system via the use of XML/web
services or similar (McGregor 2002).
4.3.7.2 Outputs
Output from the Management Decision Support System and associated variance
analysis activities are interrogated to determine if further enhancements to the
Healthcare Provider Strategy or the Patient Journey are required. This aspect of the
method also applies McGregor’s (2002) basic Intelligent Workflow Monitoring
System (IW-MONS) methodology into the Healthcare domain. Such a feedback
loop facilitates continuous process improvement as discussed 4.3.8.
4.3.8 Continuous Process Improvement
Following workflow enactment, variance analysis and evaluation activities are
conducted using Management Decision Support Systems as discussed in the previous
section. Such analysis results are reviewed by management and variations may lead
to an adjustment or change in the Healthcare Provider Strategy or the actual patient
journey. This closed loop facilitates a culture of Continuous Process Improvement
and on-going learning (Berwick 1996; Batalden and Splaine 2002). This ensures
that quality improvement is ongoing and does not end after the first iteration of
future patient journey model implementation. If variance analysis results do lead to
Strategy adjustments, the Provider BSC’s must also be reviewed and updated.
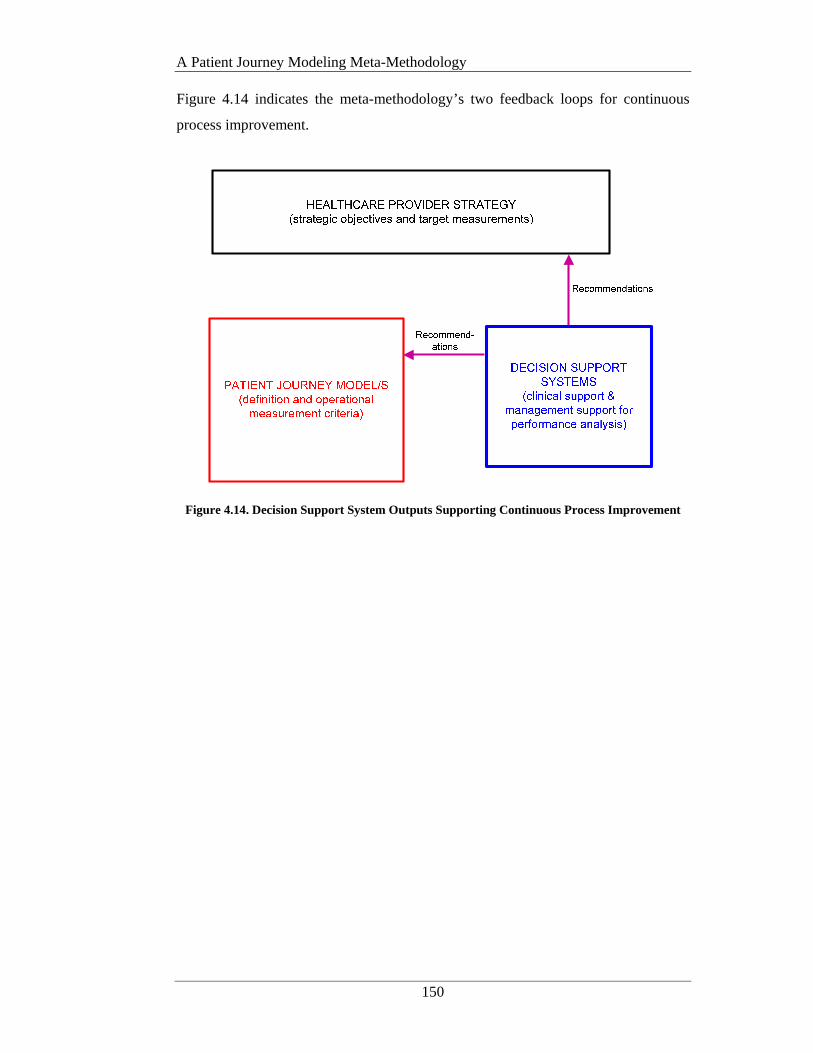
A Patient Journey Modeling Meta-Methodology
150
Figure 4.14 indicates the meta-methodology’s two feedback loops for continuous
process improvement.
Figure 4.14. Decision Support System Outputs Supporting Continuous Process Improvement
A Patient Journey Modeling Meta-Methodology
151
4.4 Conclusion
This chapter described an original healthcare domain specific improvement
architecture in the form of a patient journey modeling meta-methodology known as
PJM3. The PJM3 combines a number of complimentary method components from
several other domains including Business Strategy Management, Process
Reengineering, Workflow Management, Decision Support Systems, Socio/cultural,
Integrated Sciences and Clinical Guidelines.
The amalgamation of a range of approaches better serves to address the IOM’s
‘Aims for Improvement’ (Committee on Quality of Health Care in America 2001)
and the complexity of healthcare quality improvements in general. More explicitly it
provides a solution to hypotheses 1 and 2 from Chapter 1. Specifically PJM3
provides a generic framework that outlines the key components required to support
safe, high quality patient journey improvements, including strategy and process
definition, workflow support and performance measurement and evaluation criteria.
Key contributions also include an architectural design that accommodates the
nuances and complexities associated with healthcare redesign in particular the
inclusion of patient needs and practice guidelines.
Chapter 5 uses PJM3 as the basis for the development of a ‘healthcare process
modeling’ assessment framework. The purpose of the assessment framework will be
to determine the level of support provided for healthcare redesign and in particular
patient journey modeling, using PJM3 as the benchmark. Chapter 5 will use the
thesis case study to apply the assessment framework to the four process modeling
techniques/methods discussed in Chapter 2, namely; Lean Thinking, ARIS, Six
Sigma and Unified Modeling Language (UML).

A Process Modeling Assessment Framework for Healthcare
152
CHAPTER 5 A PROCESS MODELING ASSESSMENT
FRAMEWORK FOR HEALTHCARE
5.1 Introduction
This chapter provides a fresh approach to assessing the level of support provided by
process modeling techniques/methods for the purposes of modeling and redesigning
patient journeys. The Process Modeling Assessment Framework for Healthcare,
known as PMAF4HC or simply the Assessment Framework, presents a standard
skeleton that can be used to evaluate any process modeling technique/method that is
being considered for use within a healthcare improvement project encompassing
patient journey modeling.
The main motivation for the development of the Assessment Framework lies with the
fact that all patient journey improvement projects conducted to date have used
‘foreign’ process modeling techniques/methods from non-healthcare domains. When
combined with the fact that only scant research has been conducted on how well
these techniques accommodate the particular nuances and inherent complexities
associated with the redesign of patient-centric healthcare processes, this topic
remains an open research area.
Chapter 4 outlined an innovative healthcare improvement architecture in the form of
a patient journey modeling meta-methodology known as PJM3. PJM3 provides the
basis for the development of a healthcare process modeling Assessment Framework
that serves two key functions.
1) To evaluate the degree of support afforded to healthcare process redesign
projects by existing process modeling techniques/methods,
A Process Modeling Assessment Framework for Healthcare
153
2) To provide a benchmark for the development for new patient journey
modeling tools.
Development of the Process Modeling Assessment Framework for Healthcare
provides a solution to research hypothesis 3.
This chapter begins with a brief background of the thesis case study area, a primary-
care maternity service at Ryde Hospital, New South Wales, Australia. A detailed
description of the current service and the associated improvement goals are included.
A review of the graphical notations and method semantics used by the four process
modeling techniques/methods discussed in Chapter 2 is then conducted.
Subsequently each process model is used to graphically describe the patient journey
associated with the midwifery case study. The Assessment Framework and each
assessment area are outlined. The modeling techniques/methods are then evaluated
using the Framework and strengths and weaknesses discussed. The chapter
concludes with a range of suggested enhancements that each process model notation
requires to improve the level of support currently provided for healthcare redesign
projects involving patient journey modeling.
The selection of methods is based on the current degree of use of each method within
the healthcare improvement arena and/or the relationship of the selected methods to
other healthcare developments such as HL7. The methods selected are Lean
Thinking, Six Sigma, ARIS and UML-Business Process Modeling Notation.
A Process Modeling Assessment Framework for Healthcare
154
5.2 Case Study
5.2.1 Introduction
In this section the case study environment – a midwife-led primary care maternity
service at a suburban Australian hospital, is described. The scope of the case study
involves an assessment of the flow of a woman through the Ryde Midwifery Group
Practice (RMGP) Model (Tracy 2004; Tracy and Hartz 2005). The goals and
objectives of the Service are reviewed and a detailed description of the current
patient journey is provided.
5.2.2 Primary Care Maternity Services Background
The thesis case study involves a primary care maternity services model delivered by
certified midwives, to low risk women. The service is offered in a suburban public
hospital in Ryde, New South Wales (NSW), Australia.
In the main Maternity services in Australia are currently hospital-based and provided
by a range of different health professionals. Across Area Health Services there are
systemic differences in style, philosophy and resource intensity of care provided by
certified midwives, obstetricians and general practitioners to similar groups of
women. There is a growing awareness of the need for a greater focus on equity of
access to ensure that the services provided to women from marginalised groups, who
have the poorest outcomes, are more appropriate and better utilised (NSW
Department of Health 2000).
Some institutions offer team midwifery with differing levels of continuity of
midwifery carer. A small number of midwife-led primary care models (caseload
midwifery) are available in Australia but these are generally limited to rural and
remote areas such as Western Australia and South Australia (Church and Nixon
2002). In other western countries, particularly in the United Kingdom, New Zealand
and Canada, caseload midwifery is promoted and funded as a public health strategy
(Tracy 2002). Community based care from midwives can be responsive to local
needs, particularly with regard to health inequalities and social exclusion (Schmidt et
al. 2002; New Zealand Health Information Service. 2003).

A Process Modeling Assessment Framework for Healthcare
155
In NSW there have been three randomised controlled trials of continuity of
midwifery care that have demonstrated a capacity to reduce costs and benefit
organisations and improve the birth outcomes for women and babies (Kenny et al.
1994; Rowley et al. 1995; Homer et al. 2001; Homer et al. 2001). A recently
published systematic review confirms that continuity of midwifery care when
compared to standard care reduces costs and increases effectiveness of resource
utilisation (Henderson et al. 2001). In addition a study undertaken on the cost of
obstetric interventions in NSW (Tracy and Tracy 2003) demonstrates the escalation
of costs incurred by the introduction of obstetric intervention for low risk women.
5.2.3 The Ryde Environment
Ryde Hospital is a 170 bed acute facility just under 20 kilometers from the city of
Sydney. The Hospital is affiliated with the University of Sydney and provides acute
medical, surgical, orthopaedic, intensive care, maternity and aged care services.
There are extensive community health services including child and family health,
dental health, aged care and mental health.
Just over 12 months ago the Maternity Department at Ryde hospital was thrown into
crisis-mode. The one and only anesthetist had left and a replacement could not be
found. The NSW government felt it had no option but to close the obstetric unit at
Ryde and make the women who would normally attend Ryde’s obstetric unit travel a
further 15 kilometres to Royal North Shore hospital at North Sydney. Senior
management and the midwifery staff at Ryde did not feel that they could remove
their services from the local community without putting them at a severe
disadvantage so the staff sought to overcome the crisis through the implementation
of a new approach to obstetric and midwifery care for the local area. A midwife-led
primary-care service known as the Ryde Midwifery Group Practice (RMGP) Model
was introduced in January 2004 (Tracy 2004). The RMGP model is specifically for
identified ‘low-risk’ women and each woman must be individually assessed for her
suitability for the service. Each woman is allocated to dedicated midwife, who
delivers care to her allocated women throughout the pregnancy, thus providing
individualized antenatal, intra-partum and postnatal care.

A Process Modeling Assessment Framework for Healthcare
156
5.2.4 Goals and Objectives
The strategy of the Ryde Midwifery Group Practice (RMGP) Model is focused on
the delivery of high quality primary-care maternity services to identified low-risk
women through a public healthcare facility in a timely manner (Tracy 2004).
Rapid access and high responsiveness are among the major quality characteristics
desired by patients in health care (Berwick 1994). This is achieved at Ryde by the
allocation of a dedicated midwife to each woman. The woman then interacts with
her single point of contact and receives personalised care from a qualified and
trusted person who is aware of her personal situation and past obstetric and medical
history.
Objectives relating to achievement of the RMGP strategy were discussed. These
objectives related to how the redesign team saw the overall strategy being met and
the realisation that such objectives were not being measured or adequately analysed
in the current workflows. Documenting objectives as part of the modelling process
provides a framework for assessment of the patient journey as individual instances of
the process are enacted.
5.2.5 Balanced Scorecard Perspectives
As discussed in Chapters 2 and 4 this research will use the BSC perspectives as
proposed by the Ontario Hospital Association (1999) namely: Patient Satisfaction,
Financial Performance and Conditions, Clinical Utilisation and Outcomes, Systems
Integration and Change. The service level objectives that the Ryde Midwifery
Group Practice Model have chosen to measure and analyse as part of the future
patient journey are depicted using these four Balanced Scorecard perspectives as
follows.
5.2.5.1 Patient Satisfaction Perspective
The central questions in this perspective, “How do our customers (patients) see us?”
and “How does the organisation become its targeted patients most valued supplier?”
look at how the organisation is performing from the viewpoint of the patient. This
perspective provides information regarding the quality of, and satisfaction with the
services delivered, as well as how the health service is perceived in its community.
A Process Modeling Assessment Framework for Healthcare
157
Specific target areas may centre on indicators for timeliness, quality of service and
patient complaints.
The case study service level objectives for the Patient Satisfaction Perspective are as
follows.
PSG1: It should take no longer than 24 hours from the time an Assessment
Questionnaire is requested to the time it is dispatched.
PSG2: It should take no longer than 48 hours from the time of the completion of the
Suitability Decision until a phone call to the woman advising her of the
decision outcome is made.
PSG3: A Booking Interview appointment is required within two (2) weeks of
making initial contact with the woman.
PSG4: Each woman will have the opportunity to complete a Patient satisfaction
survey.
5.2.5.2 Financial Performance and Conditions Perspective
Describes how HCO’s manage their financial and human resources. It refers to the
HCO’s financial health, efficiency, management practices and human resource
allocations. The contribution to the bottom-line in the case of public hospitals relates
to the containment of costs and the ability to operate within assigned budgets.
Financial Performance and Conditions Perspective goals are as follows.
FPG1: Ratio of staff to patients is not less than 90% of budget.
FPG2: Provision of services and facilities should be +/- 5% of budget.
FPG3: All patients accepted for care must have a valid Medicare card.
5.2.5.3 Clinical Utilisation and Outcomes Perspective
Information in this perspective relates to the efficiency and clinical performance of
the healthcare organisation’s (HCO’s) processes, specifically relating to the delivery
of the objectives as defined in the Patient Satisfaction and Financial perspectives.
Refers to items such as hospital services, clinical efficiency and quality of care.
Clinical Utilisation and Outcomes Perspective goals follow.
CUOG1: 100% of suitability assessments will be conducted in accordance with the
National Midwifery Guidelines for Consultation and Referral and the
RMGP Model.
CUOG2: Completed Assessment Questionnaires, will be assessed within 1 working
day of receipt.

A Process Modeling Assessment Framework for Healthcare
158
CUOG3: If an Assessment passes the suitability check, it will take no longer than 1
working day to assign the patient to a nominated Caseload midwife.
CUOG4: It will take no longer than 4 hours from the time a woman is assigned to a
Caseload midwife until the first attempt, to contact the woman to make a
booking interview appointment, is made.
5.2.5.4 Systems Integration and Change Perspective
Describes a HCO’s ability to adapt to its changing healthcare environment and
defines the core competencies and skills, the technologies and the corporate culture
required to support the overall strategy. These objectives enable an organisation to
align its human and IT resources with its strategy. Provides information on
innovation and improvement measures for new services. Includes development of
new technology support and development of staff. Systems Integration and Change
Perspective objectives include:
SICG1: Provision of an online Assessment Questionnaire facility will be
delivered within 9 months.
SICG2: Initial Suitability decisions will have a confidence level of at least 90%.
SICG3: Each midwife must attend 2 in-service training sessions on the National
Midwifery Guidelines for Consultation and Referral and the questionnaire
assessment process each year.
SICG4: Management and midwife staff will conduct bi-annual reviews of the
patient journey based on feedback from the patient satisfaction surveys.
5.2.6 Structure, Roles and Staff
The organisation structure, roles and staff are as follows. There are three distinct
teams within the case study area: management, clerical and administrative support
and caseload midwives.
The roles within each team include:
Management – Nurse Unit Manager is responsible for ensuring all women are
assigned to a midwife correctly, staff absences are covered and
clinical and administrative policy are followed.
Clerical and administrative support – The Ward Clerk is responsible for completion
of clerical duties including paperwork, data entry and file
management.
A Process Modeling Assessment Framework for Healthcare
159
Caseload midwives – A Primary-care midwife is responsible for individual care of a
woman during the ante-natal, intra-partum and post-partum periods.
Within organisations staff are assigned to roles. Role assignment at Ryde is as
follows:
• Nurse Unit Manager 1 is assigned the role of Nurse Unit Manager
• Ward Clerk 1 is assigned the role of Ward Clerk
• Caseload Midwife 1-6 are assigned the role of Caseload Midwife
5.2.7 Current Patient Journey
The current patient journey discussed below, represents the movement of a woman
and the processes involved in the woman’s flow through the RMGP model up to the
completion of the Booking Interview. The journey also depicts staff roles,
information created and transformed, patient needs, legislation and policies involved
and the metrics required to measure and assess the patient’s journey. The steps
involved in the current patient journey are:
1. A woman phones or attends Maternity and requests to birth at Ryde
2. The ward clerk checks to see if the woman has a valid Medicare card, if so an
appointment is made for a clerical booking. If the woman has personally
attended Maternity and the ward clerk is available at the time, the clerical
booking can be done straight away. If not the woman must return at another
time.
3. The clerical booking takes approximately 20 minutes and uses 3 forms:
U2AA, Inpatient Election and the MRN sheet. The ward clerk enters the
relevant information into the Patient Administration System (PAS) and prints
the rest of the MRN sheet and a number of patient ‘sticky’ labels. The
paperwork is placed in the Bookings Folder for allocation of the woman to a
caseload midwife.
4. At the next Allocation Meeting, held each Wednesday, the clerical bookings
and any known previous pregnancy records for each woman are reviewed by
the Nurse Unit Manager and the Caseload midwifery team. Each woman is
then allocated to a dedicated midwife based on existing midwife workloads
and specific requests of the woman (ie: she may have given birth previously
at Ryde and wishes to have the same midwife).

A Process Modeling Assessment Framework for Healthcare
160
5. The allocation information is written in 4 places. A whiteboard showing
details of each caseload midwife’s current allocations and expected absences,
the Bookings Book (black) kept on the ward, Bookings Folder (purple) kept
in the clinic and the allocated midwife’s personal diary.
6. The woman is rung by her allocated midwife to make a Booking Interview
Appointment. The appointment time is recorded in the midwife’s personal
diary, the Clinic Diary and the Bookings Folder (purple).
7. The woman arrives at Ryde for her Booking Interview.
8. The woman gives/receives general information and advice about her
pregnancy and is asked if she has any initial concerns. Any existing
pathology reports or ultrasounds are also reviewed.
9. The RMGP model is outlined and discussed. Based on her history and this
new information, the woman and midwife discuss if the Ryde model is the
best option for the woman. If not, the woman is advised of other birthing
options. If yes, continue.
10. If the woman continues a full medical history is collected and relevant details
are entered into OBSTET and the woman’s antenatal notes are updated.
11. Following collection of a full medical history the woman’s suitability for the
RMGP model is assessed. If the woman is unsuitable she is advised to book
elsewhere, a referral is completed and her notes are collated. If she is
assessed as suitable - continue.
12. If the woman requires referrals for pathology, Nuchal Translucency
Screening or dating ultrasounds etc.., these are now prepared.
13. A Domestic Violence screening is conducted. This can be delayed to the
next visit under certain conditions. a) the woman is not alone (interpreter and
children under 3 are permitted; b) the woman’s partner gets upset when asked
to leave.
14. A physical examination of the woman is conducted. This includes blood
pressure readings, fundal height palpitation and breast examination.
15. The booking is then finalised by finishing and printing OBSTET input. The
midwife then makes the next antenatal appointment time and records it in the
clinic diary, the midwife’s personal diary and on the woman’s Yellow Card.
The woman’s antenatal notes are then collated along with the H35 and any
previous medical record details. Place a sticker on the notes and file them.
A Process Modeling Assessment Framework for Healthcare
161
5.3 Applying the Selected Process Models to the Case Study
There are a great number of process modeling methods that can be used to redesign
process flows. Selection of those process modeling methods that will be applied to
the case study and then assessed for their level of support for healthcare redesign is
based on the degree of use within the industry. As discussed in Chapter 2 the four
process modeling methods used in the evaluation are:
• Lean Thinking
• Six Sigma
• ARIS
• Unified Modeling Language (UML) – Business Process Modeling Notation
(BPMN)
It should be noted that although there may be many artifacts used by the above
methods during the analysis and design of process improvements, this research is
primarily concerned with those artifacts used to diagrammatically represent the
movement of patients across the organisation and between the organisation and its
partners. This will see focus directed only towards the graphical ‘process models’
employed by the above methods and will include definition of the modeling
representations and associated semantics.
5.3.1 Lean Thinking
The Lean Thinking method uses Value Stream Maps (VSM) to model the process
flow for a given product or service through an organisation and its between partner
orgranisations. The Institute of Healthcare Improvement promotes the development
of value stream maps (VSM) as part of the Breakthrough Series-Model for
Improvement (IHI 2003; IHI 2005) for redesigning patient flow. The Improvement
Leaders Guides developed for NHS healthcare improvement projects also support
VSM development when redesigning the patient journey (NHS Modernisation
Agency 2005).
Examples of Lean Thinking in healthcare include (Bushell and Shelest 2002;
Heyamoto 2002; Laursen 2003; Bassham 2005; IHI 2005; NHS Institute: Service
Transformation Team. and University of Warwick. 2007).
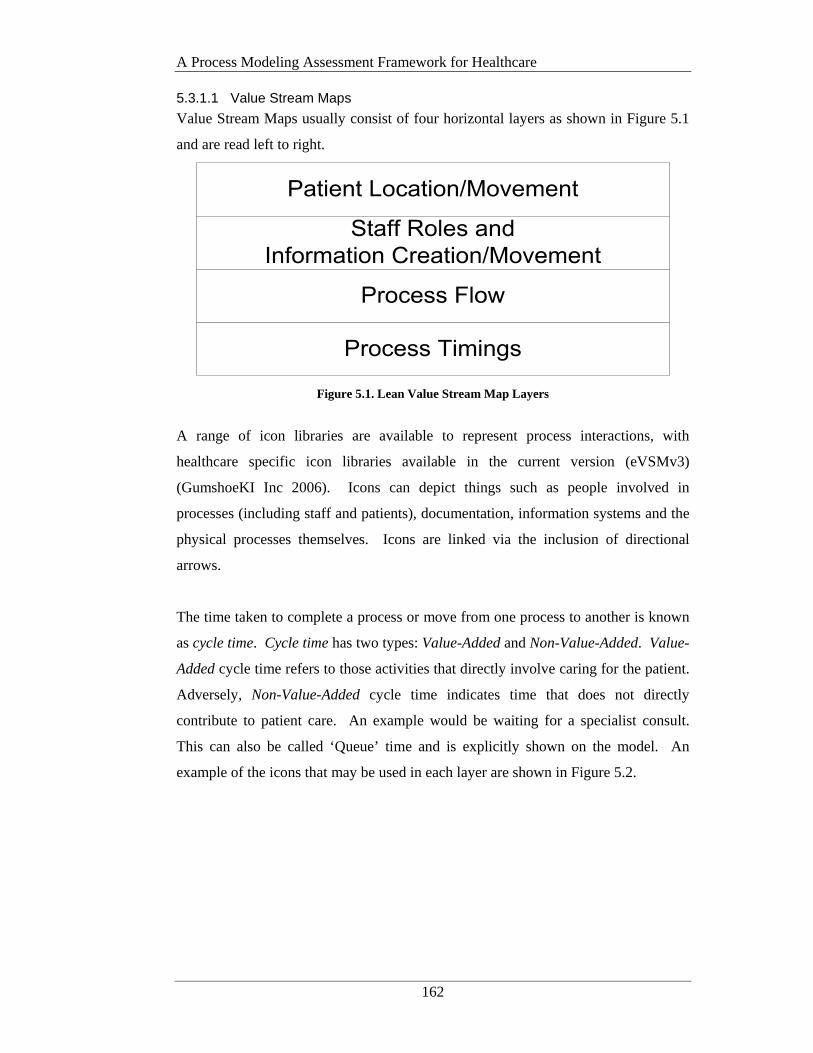
A Process Modeling Assessment Framework for Healthcare
162
5.3.1.1 Value Stream Maps
Value Stream Maps usually consist of four horizontal layers as shown in Figure 5.1
and are read left to right.
Figure 5.1. Lean Value Stream Map Layers
A range of icon libraries are available to represent process interactions, with
healthcare specific icon libraries available in the current version (eVSMv3)
(GumshoeKI Inc 2006). Icons can depict things such as people involved in
processes (including staff and patients), documentation, information systems and the
physical processes themselves. Icons are linked via the inclusion of directional
arrows.
The time taken to complete a process or move from one process to another is known
as cycle time. Cycle time has two types: Value-Added and Non-Value-Added. Value-
Added cycle time refers to those activities that directly involve caring for the patient.
Adversely, Non-Value-Added cycle time indicates time that does not directly
contribute to patient care. An example would be waiting for a specialist consult.
This can also be called ‘Queue’ time and is explicitly shown on the model. An
example of the icons that may be used in each layer are shown in Figure 5.2.
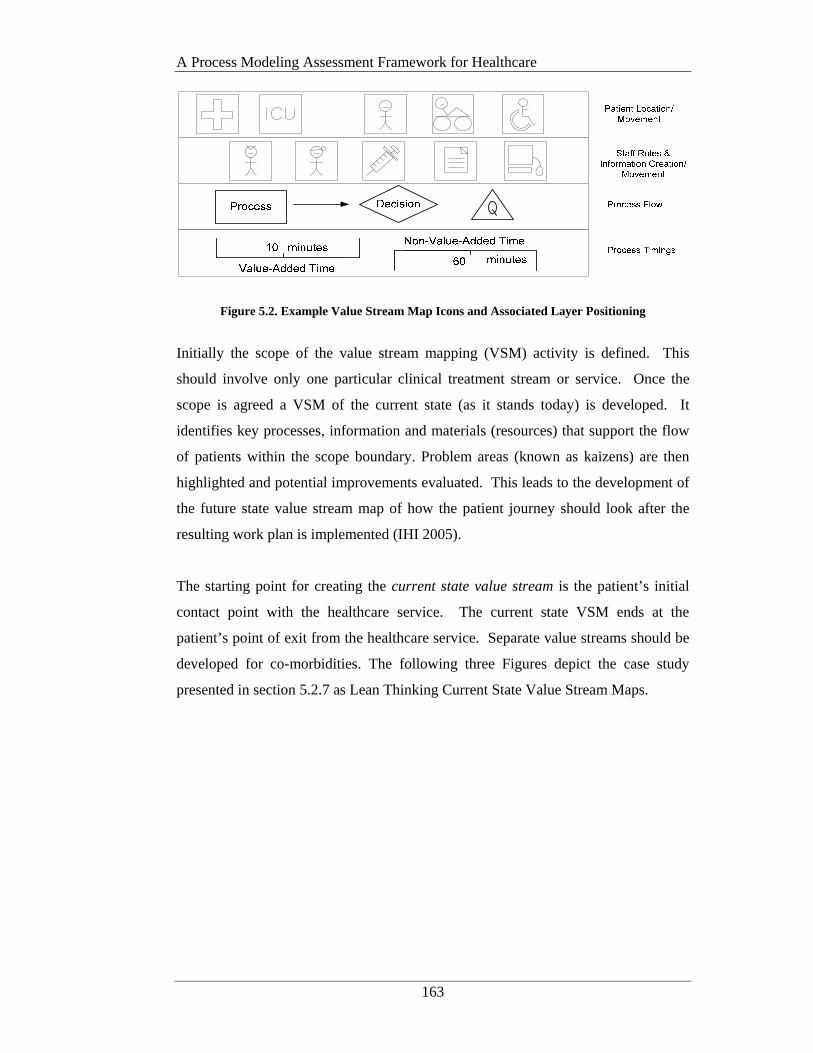
A Process Modeling Assessment Framework for Healthcare
163
Figure 5.2. Example Value Stream Map Icons and Associated Layer Positioning
Initially the scope of the value stream mapping (VSM) activity is defined. This
should involve only one particular clinical treatment stream or service. Once the
scope is agreed a VSM of the current state (as it stands today) is developed. It
identifies key processes, information and materials (resources) that support the flow
of patients within the scope boundary. Problem areas (known as kaizens) are then
highlighted and potential improvements evaluated. This leads to the development of
the future state value stream map of how the patient journey should look after the
resulting work plan is implemented (IHI 2005).
The starting point for creating the current state value stream is the patient’s initial
contact point with the healthcare service. The current state VSM ends at the
patient’s point of exit from the healthcare service. Separate value streams should be
developed for co-morbidities. The following three Figures depict the case study
presented in section 5.2.7 as Lean Thinking Current State Value Stream Maps.
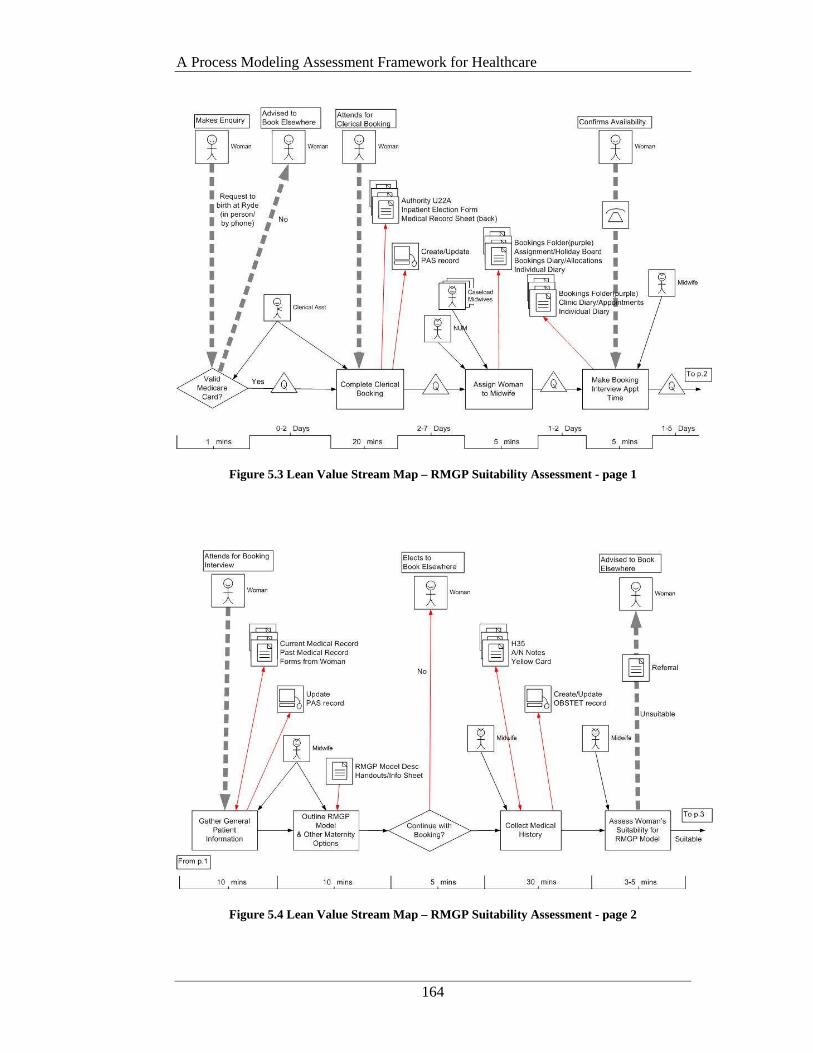
A Process Modeling Assessment Framework for Healthcare
164
Figure 5.3 Lean Value Stream Map – RMGP Suitability Assessment - page 1
Figure 5.4 Lean Value Stream Map – RMGP Suitability Assessment - page 2
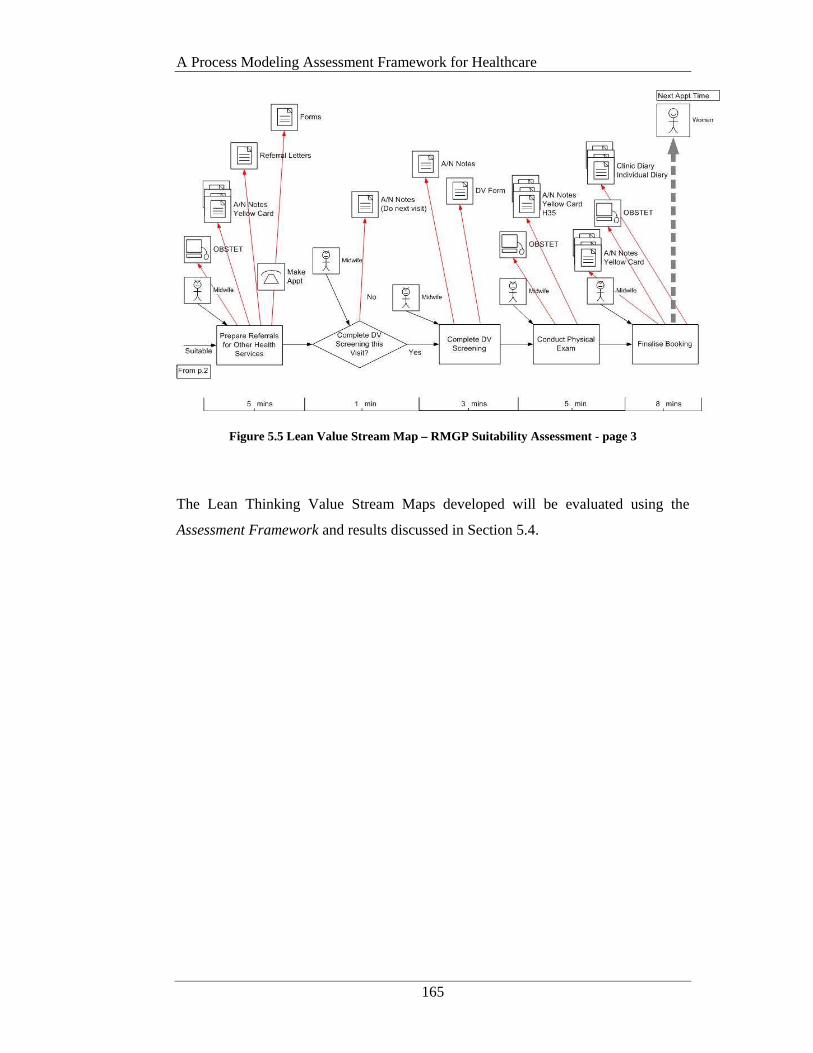
A Process Modeling Assessment Framework for Healthcare
165
Figure 5.5 Lean Value Stream Map – RMGP Suitability Assessment - page 3
The Lean Thinking Value Stream Maps developed will be evaluated using the
Assessment Framework and results discussed in Section 5.4.
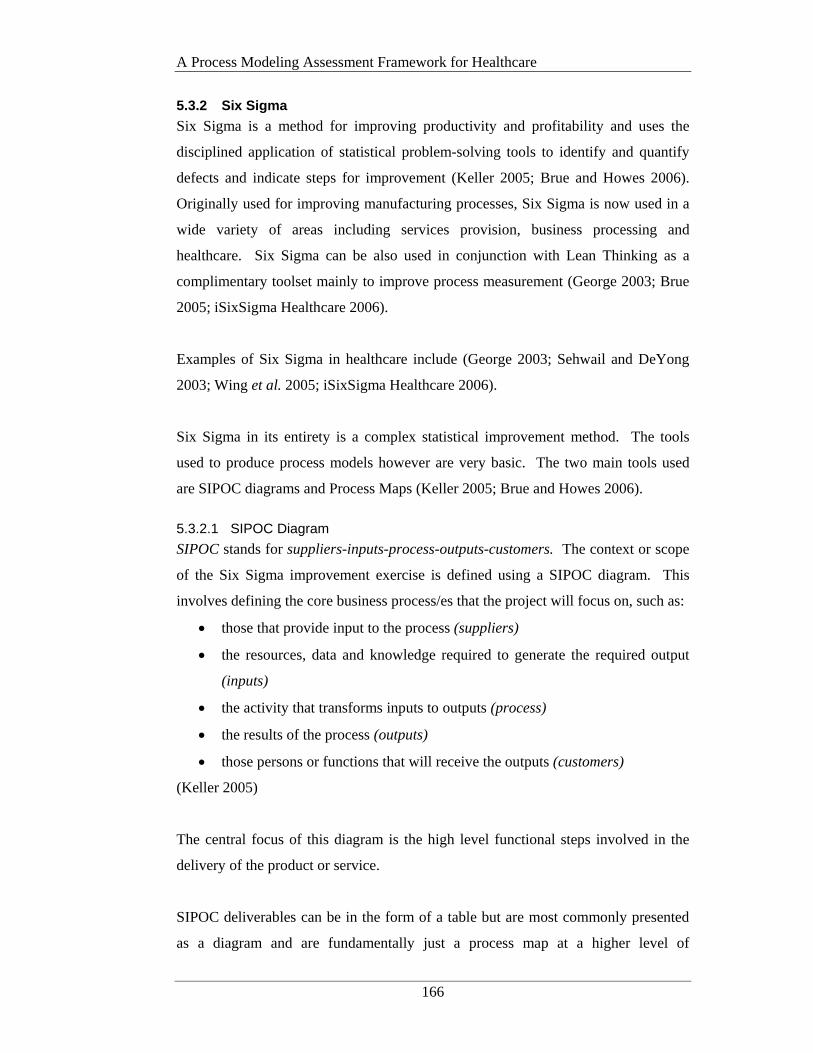
A Process Modeling Assessment Framework for Healthcare
166
5.3.2 Six Sigma
Six Sigma is a method for improving productivity and profitability and uses the
disciplined application of statistical problem-solving tools to identify and quantify
defects and indicate steps for improvement (Keller 2005; Brue and Howes 2006).
Originally used for improving manufacturing processes, Six Sigma is now used in a
wide variety of areas including services provision, business processing and
healthcare. Six Sigma can be also used in conjunction with Lean Thinking as a
complimentary toolset mainly to improve process measurement (George 2003; Brue
2005; iSixSigma Healthcare 2006).
Examples of Six Sigma in healthcare include (George 2003; Sehwail and DeYong
2003; Wing et al. 2005; iSixSigma Healthcare 2006).
Six Sigma in its entirety is a complex statistical improvement method. The tools
used to produce process models however are very basic. The two main tools used
are SIPOC diagrams and Process Maps (Keller 2005; Brue and Howes 2006).
5.3.2.1 SIPOC Diagram
SIPOC stands for suppliers-inputs-process-outputs-customers. The context or scope
of the Six Sigma improvement exercise is defined using a SIPOC diagram. This
involves defining the core business process/es that the project will focus on, such as:
• those that provide input to the process (suppliers)
• the resources, data and knowledge required to generate the required output
(inputs)
• the activity that transforms inputs to outputs (process)
• the results of the process (outputs)
• those persons or functions that will receive the outputs (customers)
(Keller 2005)
The central focus of this diagram is the high level functional steps involved in the
delivery of the product or service.
SIPOC deliverables can be in the form of a table but are most commonly presented
as a diagram and are fundamentally just a process map at a higher level of
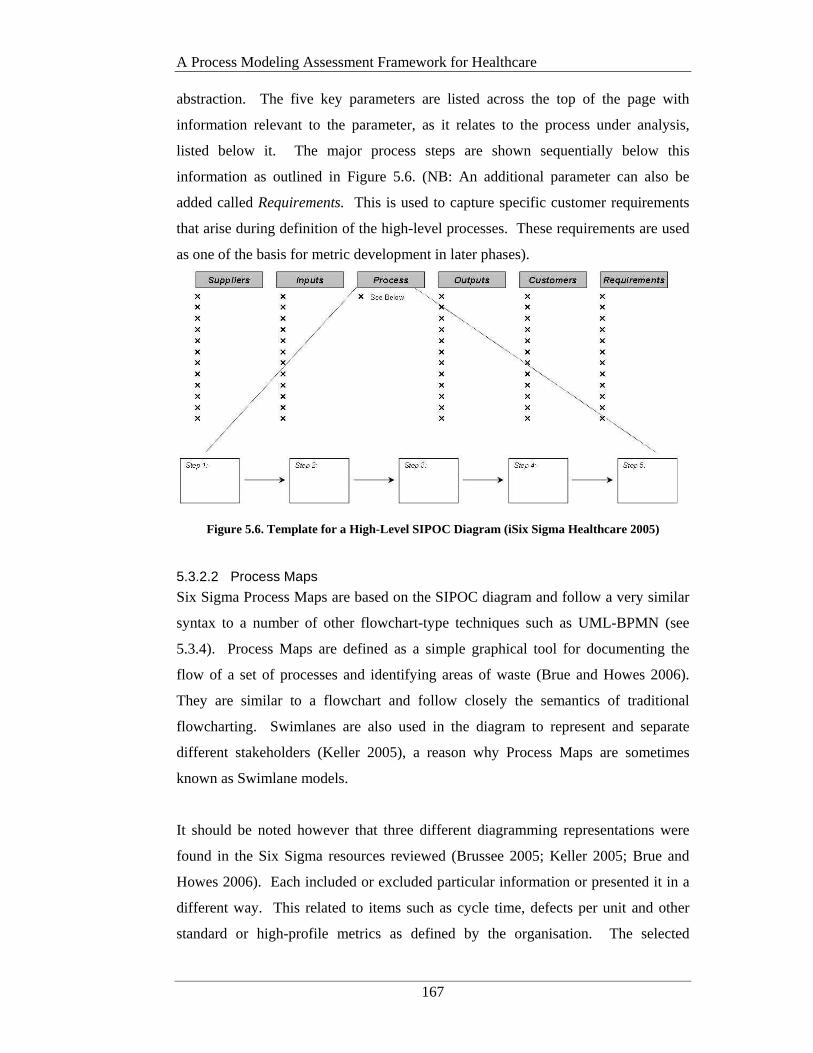
A Process Modeling Assessment Framework for Healthcare
167
abstraction. The five key parameters are listed across the top of the page with
information relevant to the parameter, as it relates to the process under analysis,
listed below it. The major process steps are shown sequentially below this
information as outlined in Figure 5.6. (NB: An additional parameter can also be
added called Requirements. This is used to capture specific customer requirements
that arise during definition of the high-level processes. These requirements are used
as one of the basis for metric development in later phases).
Figure 5.6. Template for a High-Level SIPOC Diagram (iSix Sigma Healthcare 2005)
5.3.2.2 Process Maps
Six Sigma Process Maps are based on the SIPOC diagram and follow a very similar
syntax to a number of other flowchart-type techniques such as UML-BPMN (see
5.3.4). Process Maps are defined as a simple graphical tool for documenting the
flow of a set of processes and identifying areas of waste (Brue and Howes 2006).
They are similar to a flowchart and follow closely the semantics of traditional
flowcharting. Swimlanes are also used in the diagram to represent and separate
different stakeholders (Keller 2005), a reason why Process Maps are sometimes
known as Swimlane models.
It should be noted however that three different diagramming representations were
found in the Six Sigma resources reviewed (Brussee 2005; Keller 2005; Brue and
Howes 2006). Each included or excluded particular information or presented it in a
different way. This related to items such as cycle time, defects per unit and other
standard or high-profile metrics as defined by the organisation. The selected
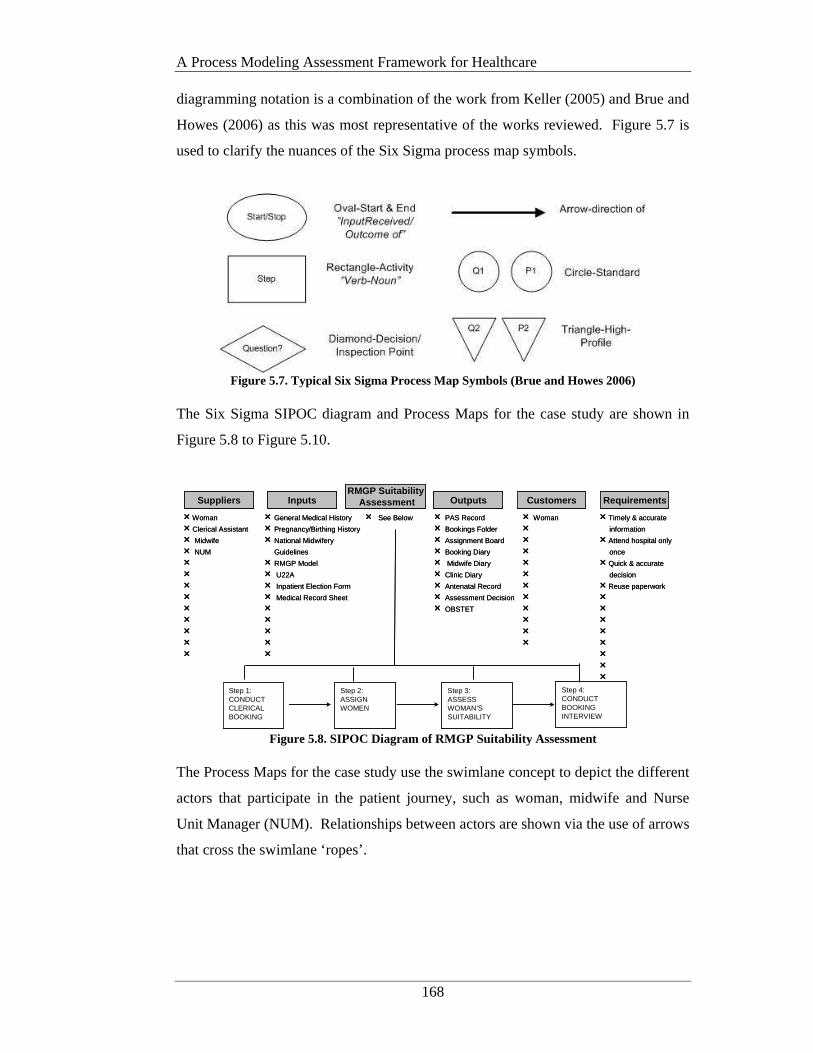
A Process Modeling Assessment Framework for Healthcare
168
diagramming notation is a combination of the work from Keller (2005) and Brue and
Howes (2006) as this was most representative of the works reviewed. Figure 5.7 is
used to clarify the nuances of the Six Sigma process map symbols.
Figure 5.7. Typical Six Sigma Process Map Symbols (Brue and Howes 2006)
The Six Sigma SIPOC diagram and Process Maps for the case study are shown in
Figure 5.8 to Figure 5.10.
r Timely & accurate
information
r Attend hospital only
once
r Quick & accurate
decision
r Reuse paperwork
rrrrrrrr
Suppliers InputsRMGP Suitability
Assessment Customers Requirements
rWoman
r Clerical Assistant
r Midwife
r NUM
rrrrrrrrr
Step 1:CONDUCT CLERICAL BOOKING
Outputs
Step 2: ASSIGN WOMEN
Step 3: ASSESS WOMAN’S SUITABILITY
r See Below r PAS Record
r Bookings Folder
r Assignment Board
r Booking Diary
r Midwife Diary
r Clinic Diary
r Antenatal Record
r Assessment Decision
r OBSTET
r Woman
rrrrrrrrrrr
r General Medical History
r Pregnancy/Birthing History
r National Midwifery
Guidelines
r RMGP Model
r U22A
r Inpatient Election Form
r Medical Record Sheet
rrrrr
Step 4: CONDUCT BOOKING INTERVIEW
Figure 5.8. SIPOC Diagram of RMGP Suitability Assessment
The Process Maps for the case study use the swimlane concept to depict the different
actors that participate in the patient journey, such as woman, midwife and Nurse
Unit Manager (NUM). Relationships between actors are shown via the use of arrows
that cross the swimlane ‘ropes’.
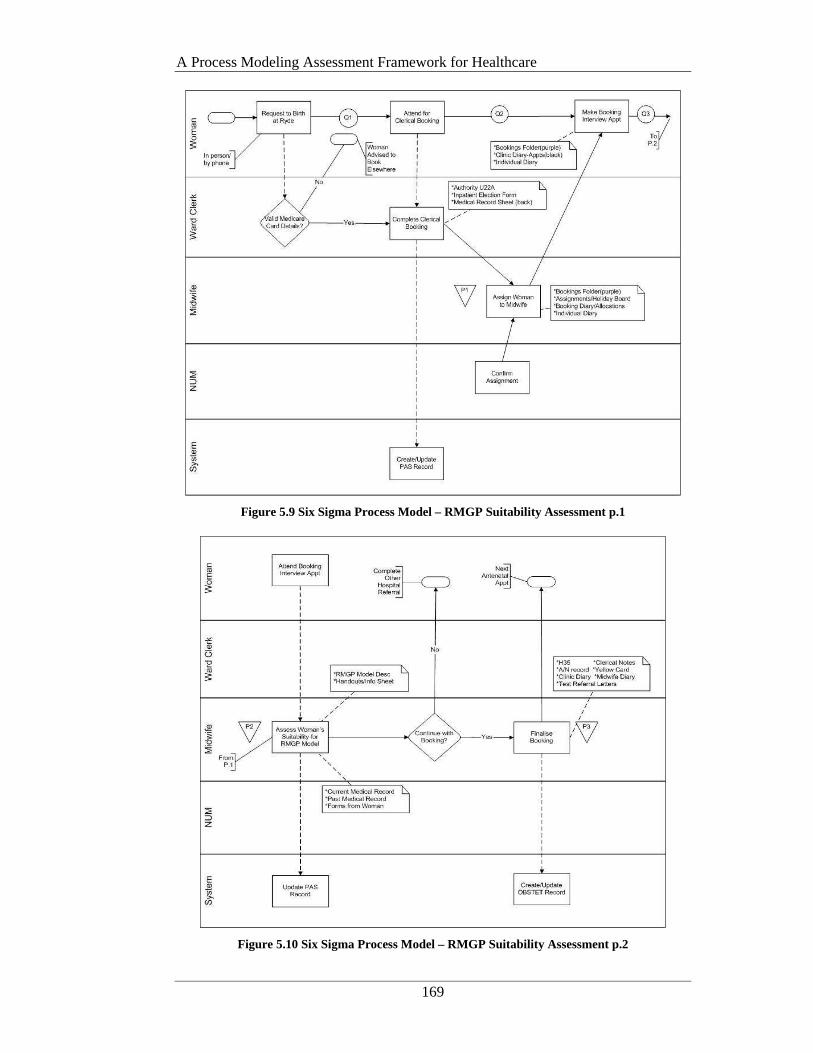
A Process Modeling Assessment Framework for Healthcare
169
Figure 5.9 Six Sigma Process Model – RMGP Suitability Assessment p.1
Figure 5.10 Six Sigma Process Model – RMGP Suitability Assessment p.2
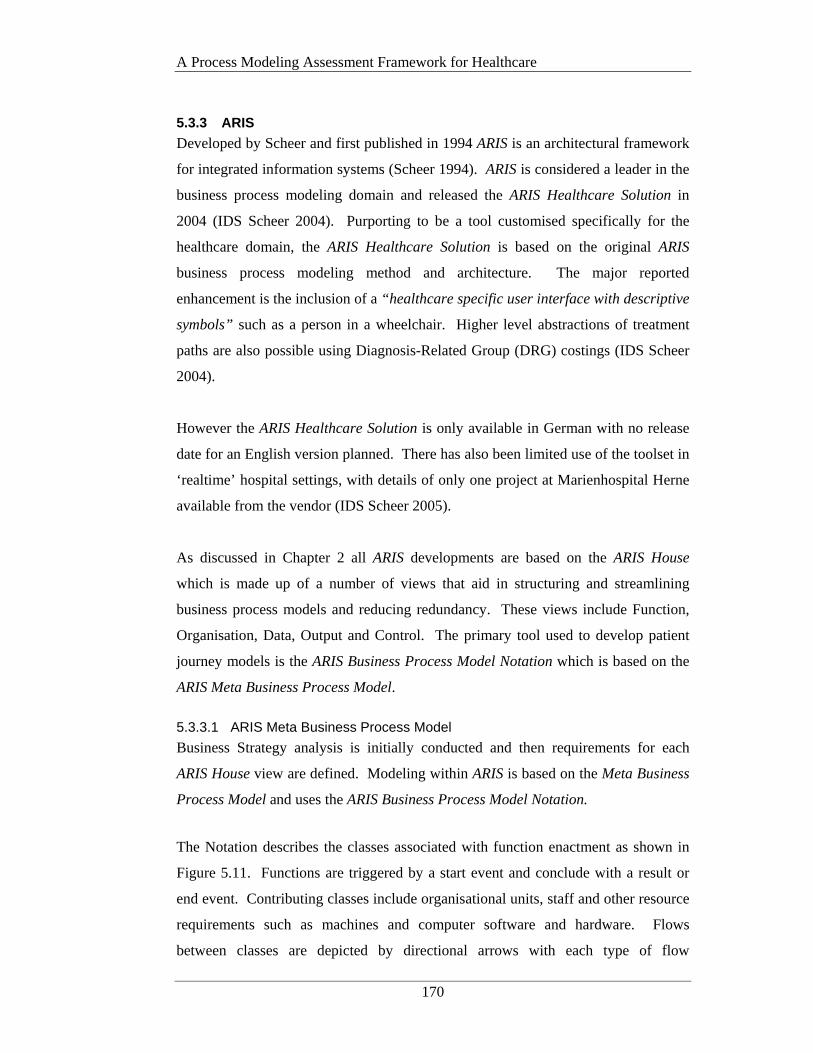
A Process Modeling Assessment Framework for Healthcare
170
5.3.3 ARIS
Developed by Scheer and first published in 1994 ARIS is an architectural framework
for integrated information systems (Scheer 1994). ARIS is considered a leader in the
business process modeling domain and released the ARIS Healthcare Solution in
2004 (IDS Scheer 2004). Purporting to be a tool customised specifically for the
healthcare domain, the ARIS Healthcare Solution is based on the original ARIS
business process modeling method and architecture. The major reported
enhancement is the inclusion of a “healthcare specific user interface with descriptive
symbols” such as a person in a wheelchair. Higher level abstractions of treatment
paths are also possible using Diagnosis-Related Group (DRG) costings (IDS Scheer
2004).
However the ARIS Healthcare Solution is only available in German with no release
date for an English version planned. There has also been limited use of the toolset in
‘realtime’ hospital settings, with details of only one project at Marienhospital Herne
available from the vendor (IDS Scheer 2005).
As discussed in Chapter 2 all ARIS developments are based on the ARIS House
which is made up of a number of views that aid in structuring and streamlining
business process models and reducing redundancy. These views include Function,
Organisation, Data, Output and Control. The primary tool used to develop patient
journey models is the ARIS Business Process Model Notation which is based on the
ARIS Meta Business Process Model.
5.3.3.1 ARIS Meta Business Process Model
Business Strategy analysis is initially conducted and then requirements for each
ARIS House view are defined. Modeling within ARIS is based on the Meta Business
Process Model and uses the ARIS Business Process Model Notation.
The Notation describes the classes associated with function enactment as shown in
Figure 5.11. Functions are triggered by a start event and conclude with a result or
end event. Contributing classes include organisational units, staff and other resource
requirements such as machines and computer software and hardware. Flows
between classes are depicted by directional arrows with each type of flow
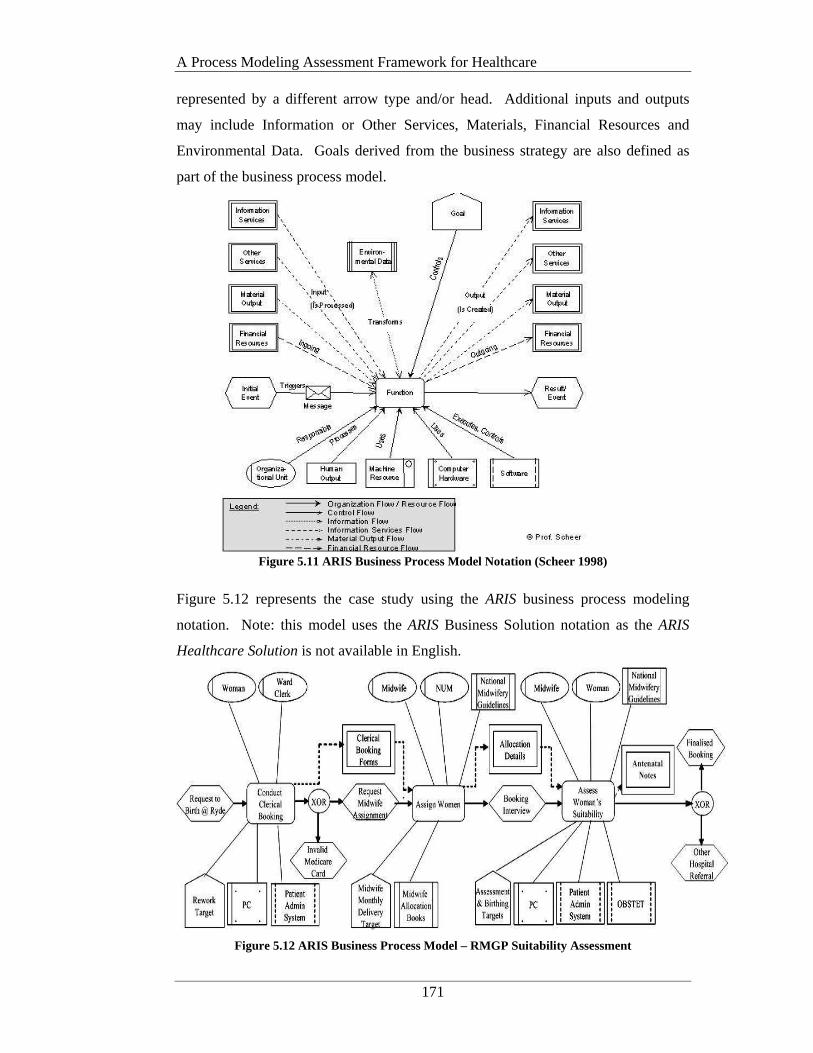
A Process Modeling Assessment Framework for Healthcare
171
represented by a different arrow type and/or head. Additional inputs and outputs
may include Information or Other Services, Materials, Financial Resources and
Environmental Data. Goals derived from the business strategy are also defined as
part of the business process model.
Figure 5.11 ARIS Business Process Model Notation (Scheer 1998)
Figure 5.12 represents the case study using the ARIS business process modeling
notation. Note: this model uses the ARIS Business Solution notation as the ARIS
Healthcare Solution is not available in English.
Figure 5.12 ARIS Business Process Model – RMGP Suitability Assessment
A Process Modeling Assessment Framework for Healthcare
172
The function Assess Woman’s Suitability can be further exploded to show the sub-
processes involved using the same semantic process modeling structure, although no
notation is available to indicate the existence of such sub-processes. Additional
details such as what forms are completed as part of the clerical booking cannot
captured on the graphical model.
5.3.4 UML
Unified Modeling Language (UML) is an object-oriented approach to systems
development. First released in 1997 by the Object Management Group, UML is one
of the most widely used modeling languages available (Object Management Group
1997; Unhelkar 2005).
The key benefits of the UML approach relate to the fact that the language and its
tools (diagrams) can be used throughout the systems development process from
gathering systems requirements to implementation of the final system (Unhelkar
2005).
UML’s main contribution to the Healthcare domain is its use in the development of
the HL7 Reference Information Model (RIM). The HL7 RIM is a “comprehensive
framework for the exchange, integration, sharing and retrieval of electronic health
information that supports clinical practice and the management, delivery and
evaluation of health services” (Health Level 7 2005, p.3). HL7 is currently the
predominate standard for the interfacing of clinical data in most institutions (Health
Level 7 2005).
HL7 as a standard does not deal with the modeling of patient journeys but rather the
data that needs to be passed between systems. Not withstanding this, it is important
to consider a HL7 compliant modeling method for review. This ensures that the
transfer of the UML models to HL7 compatible environments can be facilitated.
The UML tool selected for review is the UML Business Process Modeling Notation
(BPMN) as discussed in Chapter 2. The specification for the UML BPMN states
that “BPMN will be constrained to support only the concepts of modeling that are
A Process Modeling Assessment Framework for Healthcare
173
applicable to business processes” (Object Management Group 2006, p.34). The
BPMN specification defines the notation and semantics of a Business Process
Diagram (BPD).
5.3.4.1 Business Process Diagram
Business Process Diagrams (BPDs) are intended for use by the people who design
and manage business processes. BPD’s can then be used by technical developers to
formally map the process specifications to an execution language for the
implementation of a Business Process Management System (Object Management
Group 2006). A BPD is based on traditional flowcharting conventions but also
includes formalisms for the creation of executable constructs.
A basic BPD is made up of four core categories of elements (Object Management
Group 2006):
• Flow Objects – key graphical elements used to define the behaviour of
business processes;
• Connecting Objects – connect the flow objects to each other and other
information;
• Swimlanes – used to organise activities into separate visual groups to show
different functional responsibilities;
• Artifacts – provide additional information about processes.
Key concepts within the BPD are Processes, Activities and Events. A Process is
depicted as a graph of Flow Objects. Processes may be defined at any level from
enterprise-wide processes to processes performed by a single person. Low-level
processes may be grouped together to achieve a common business goal. Processes
can be categorised as three basic types:
• Private (internal) business processes – only relate to and affect the internal
running of the business
• Abstract (public) processes – includes those private processes that
communicate with the outside world
• Collaboration (global) processes – depicts the interaction of two or more
individual business entities.
(Object Management Group 2006)

A Process Modeling Assessment Framework for Healthcare
174
An activity is work that is performed within a business process. An activity can be
atomic or non-atomic (compound). An Event is a ‘trigger’ that occurs as a part of a
Process and affects the flow of the process stream (Object Management Group
2006).
Organisational structures and Resources, Functional breakdowns, Data and
information models, Strategy and Business Rules are not currently represented in
BPMN (Object Management Group 2006).
The use of swimlanes in BPMN is optional although many BPMN examples do
utilise them. Each participant (including systems) is allocated to a separate swimlane
and the processes relating to a particular participant can only be shown within that
participants specific horizontal lane. Interactions amongst participants are depicted
by arrows. Arrows may cross lanes in a multi-directional manner. Decision points
are shown as diamonds and entry and exit points as terminators. Notes associated
with processes are also permitted but are not mandatory.
An example of the notation for a Business Process Diagram is shown in Figure 5.13
Figure 5.13. An Example of the Notation for a Business Process Diagram
(Object Management Group 2006)

A Process Modeling Assessment Framework for Healthcare
175
Definition of the business process diagrams using BPMN allows the resulting
models to be mapped to a number of lower-level execution languages. Business
Process Execution Language for Web Services (BPEL4WS) is the primary execution
language used under the current specification with each private business process
requiring a separate BPEL4WS mapping. BPEL4WS is an XML based language
and as such is transportable across disparate systems.
The next three figures show the case study problem using the BPMN syntax.
Figure 5.14 BPMN – RMGP Suitability Assessment - page 1
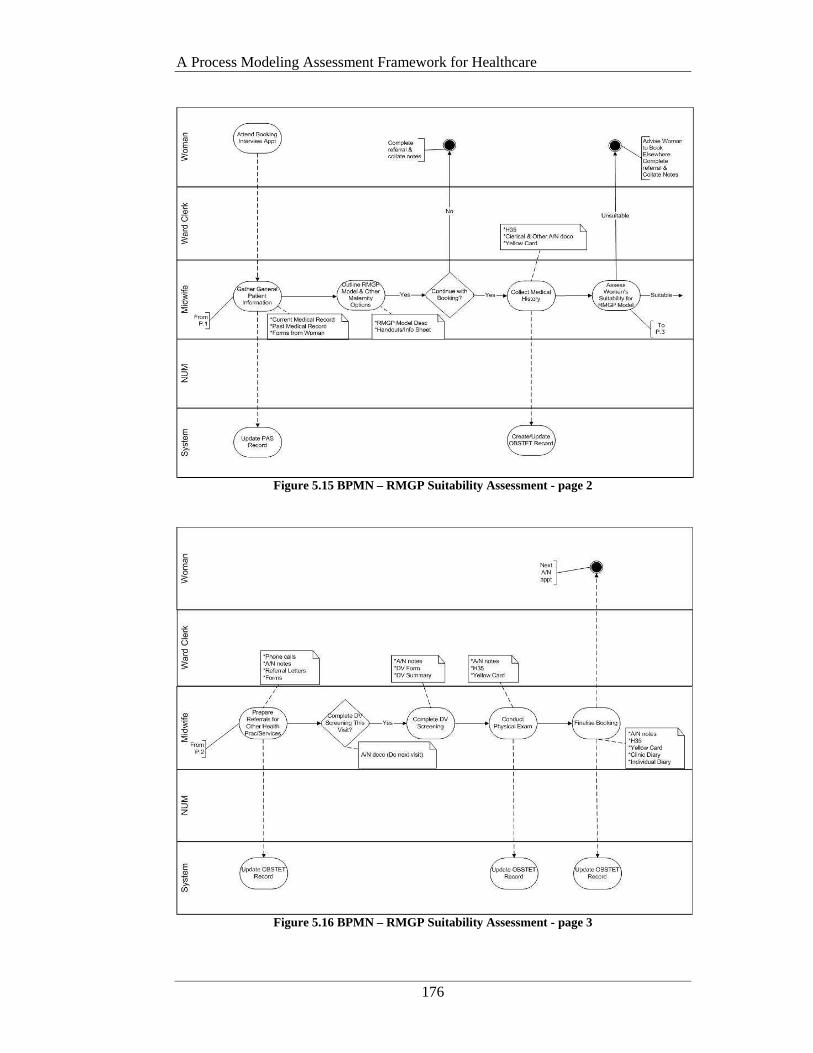
A Process Modeling Assessment Framework for Healthcare
176
Figure 5.15 BPMN – RMGP Suitability Assessment - page 2
Figure 5.16 BPMN – RMGP Suitability Assessment - page 3

A Process Modeling Assessment Framework for Healthcare
177
The following section evaluates the selected modeling methods/techniques using the
new Process Modeling Assessment Framework for Healthcare.
5.4 Process Model Method Evaluation using the Assessment Framework
The Process Modeling Assessment Framework for Healthcare (PMAF4HC or simply
the Assessment Framework) has been designed to assess the applicability and level
of support provided for healthcare improvement activities, specifically incorporating
Patient Journey Modeling.
The design of the questions is based on the Patient Journey Modeling Meta-
Methodology (PJM3) presented in Chapter 4. Another key input is the business
process modeling review conducted by McGregor (2002) as part of the development
of the Intelligent Workflow Monitoring System (IW-MONS) and discussed in
McGregor and Edwards (2005). Subsequently the Assessment Framework also
formed a cornerstone for the development of an innovative multi-dimensional patient
journey modeling tool (PaJMa) as described in Chapter 7.
The construct of the questions is based on the above as well as an extensive literature
review, discussions with research colleagues and experiences of the author during
the case study improvement project. As such the Assessment Framework has three
main foci:
1) The intuitiveness of the process model development activity to healthcare
workers involved in patient journey improvement projects
2) The alignment of process improvement initiatives to the Provider’s strategy
and
3) Basic semantic issues associated with model completeness, validity and
formalism.
Section 5.3 saw the development of process models for the primary-care maternity
service case study using four different process modeling methods/techniques. These
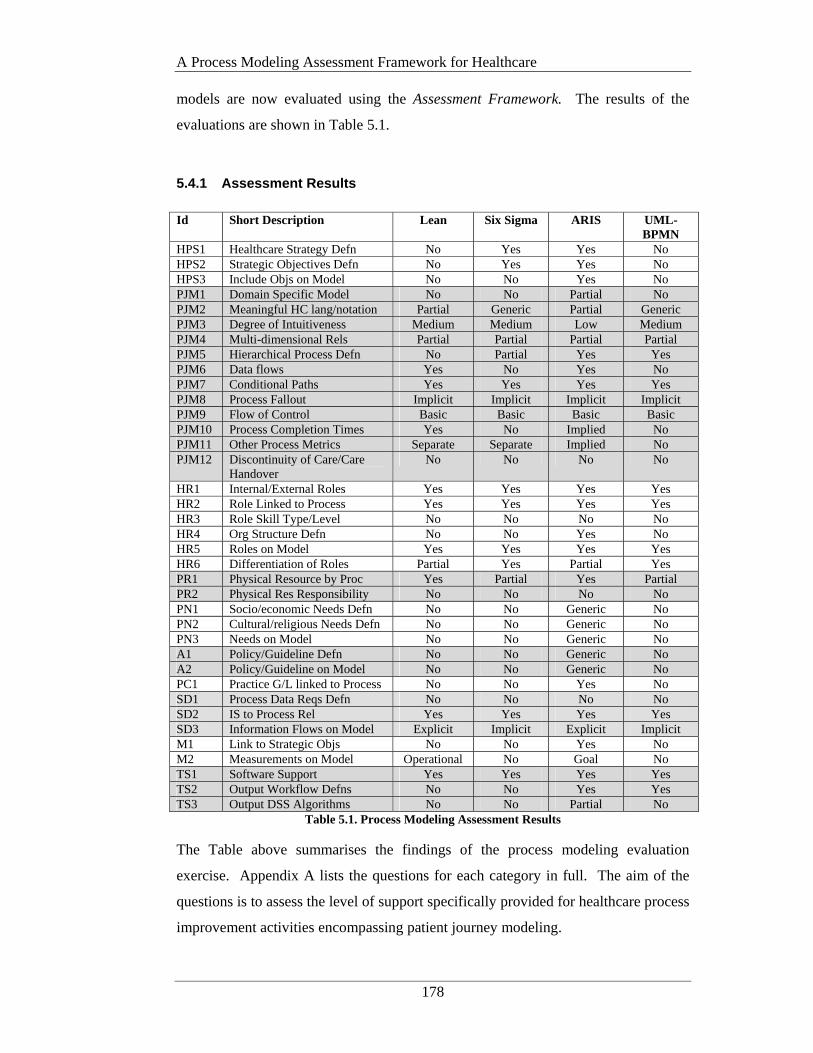
A Process Modeling Assessment Framework for Healthcare
178
models are now evaluated using the Assessment Framework. The results of the
evaluations are shown in Table 5.1.
5.4.1 Assessment Results
Id Short Description Lean Six Sigma ARIS UML-
BPMN HPS1 Healthcare Strategy Defn No Yes Yes No HPS2 Strategic Objectives Defn No Yes Yes No HPS3 Include Objs on Model No No Yes No PJM1 Domain Specific Model No No Partial No PJM2 Meaningful HC lang/notation Partial Generic Partial Generic PJM3 Degree of Intuitiveness Medium Medium Low Medium PJM4 Multi-dimensional Rels Partial Partial Partial Partial PJM5 Hierarchical Process Defn No Partial Yes Yes PJM6 Data flows Yes No Yes No PJM7 Conditional Paths Yes Yes Yes Yes PJM8 Process Fallout Implicit Implicit Implicit Implicit PJM9 Flow of Control Basic Basic Basic Basic PJM10 Process Completion Times Yes No Implied No PJM11 Other Process Metrics Separate Separate Implied No PJM12 Discontinuity of Care/Care
Handover No No No No
HR1 Internal/External Roles Yes Yes Yes Yes HR2 Role Linked to Process Yes Yes Yes Yes HR3 Role Skill Type/Level No No No No HR4 Org Structure Defn No No Yes No HR5 Roles on Model Yes Yes Yes Yes HR6 Differentiation of Roles Partial Yes Partial Yes PR1 Physical Resource by Proc Yes Partial Yes Partial PR2 Physical Res Responsibility No No No No PN1 Socio/economic Needs Defn No No Generic No PN2 Cultural/religious Needs Defn No No Generic No PN3 Needs on Model No No Generic No A1 Policy/Guideline Defn No No Generic No A2 Policy/Guideline on Model No No Generic No PC1 Practice G/L linked to Process No No Yes No SD1 Process Data Reqs Defn No No No No SD2 IS to Process Rel Yes Yes Yes Yes SD3 Information Flows on Model Explicit Implicit Explicit Implicit M1 Link to Strategic Objs No No Yes No M2 Measurements on Model Operational No Goal No TS1 Software Support Yes Yes Yes Yes TS2 Output Workflow Defns No No Yes Yes TS3 Output DSS Algorithms No No Partial No
Table 5.1. Process Modeling Assessment Results
The Table above summarises the findings of the process modeling evaluation
exercise. Appendix A lists the questions for each category in full. The aim of the
questions is to assess the level of support specifically provided for healthcare process
improvement activities encompassing patient journey modeling.
A Process Modeling Assessment Framework for Healthcare
179
Discussion regarding the structure of the Assessment Framework and the evaluation
results follows.
5.4.2 Framework Description and Evaluation Summary
The Framework is presented in tabular format. Reading from left to right, the
Framework starts with two main columns on the left, with additional columns added
for each process modeling technique/method being assessed.
Column 1 is headed ‘Id’ and lists the assessment category code and question
number. For example the first entry in the ‘Id’ column is ‘HPS1’ which identifies
question number 1 in the Healthcare Provider Strategy category. Column 2 is headed
‘Short Description’ and as the name suggests provides a brief description of the
actual question being assessed. Additional columns are then added as needed for
each process model being evaluated. The different categories of questions are
delineated via the inclusion or exclusion of grey shading.
The following sections firstly describe each question category and then discuss the
results of the assessment in more detail with specific references to the level of
support provided by the individual methods evaluated.
5.4.2.1 Healthcare Provider Strategy (HPS)
This category of assessment deals with the ability of each process modeling
technique to capture the healthcare provider’s strategy and objectives and flow this
information through to the patient journey model. Process improvements that align
with strategy will go unconfirmed if organisational metrics cannot be tracked at an
operational workflow level.
Of the methods reviewed only Six Sigma and ARIS catered for the analysis of the
business strategy. In Six Sigma, business objectives and needs are captured in the
Define phase and are mainly focused on financial benefits and defects per million
opportunities. Although these are not explicitly linked to the business strategy, the
method implies that project objectives are derived from the business case which
should be developed prior to the commencement of the Six Sigma project. ARIS
addresses strategy as part of the Strategic Business Process Analysis phase which is
A Process Modeling Assessment Framework for Healthcare
180
conducted prior to definition of the individual ARIS views. This flows through to
the Business Process Model in the form of goals attached to each function.
The specification for the UML Business Process Modeling Notation explicitly states
that items such as Strategy, Organisational structures and Resources, Functional
breakdowns, Data and information models and Business Rules are not supported in
the current version. It is acknowledged however that these types of high-level
modeling concepts either directly or indirectly affects business processes. The
relationships between BPMN and other high-level business modeling items will be
defined more formally as BPMN and other specifications are advanced (Object
Management Group 2006). Lean Thinking discusses the identification of a
‘problem’ product family but does not link this to business strategy as part of the
method (Rother and Shook 2003).
5.4.2.2 Patient Journey Modeling (PJM)
The applicability and degree of support provided by particular techniques to the
healthcare domain for the actual development of the patient journey model is the
main focus of this group of questions. As a domain specific process modeling
method is unavailable, it is vital to determine whether current techniques satisfy the
requirements for patient journey modeling. The level of intuitiveness, healthcare
concept expression and understandability by stakeholders are firstly assessed. More
technical modeling concepts relating to the capture of metrics, control of process
flow and process fallout are then addressed.
The comparison of items in this category falls into two main areas: 1) look, use and
intuitiveness of the process models to healthcare staff involved in healthcare process
improvement 2) basic semantic issues associated with model completeness, validity
and formalism.
Only ARIS purports to offer a healthcare specific solution, although modeling within
this toolset is still based on the native ARIS method with the addition of a number of
healthcare specific libraries. Although Lean Thinking is the most widely used
patient journey modeling method it is still a non-healthcare specific process

A Process Modeling Assessment Framework for Healthcare
181
improvement technique notwithstanding that the current tool support does provide
some healthcare specific modeling icons (see next comment).
Lean Thinking and ARIS Healthcare Solution provide limited icon libraries and
associated modeling language that users would find useful when describing
healthcare processes. Although ARIS Healthcare Solution provides a domain
specific modeling grammar, the development of the ARIS business process model is
the least intuitive as the patient cannot be differentiated from other process
participants except by name. All of the methods provide links to a limited number of
other dimensions associated with the patient journey, primarily staff and information
systems. Lean is the only method that does not provide an explicit link to
hierarchical process definitions. Six Sigma uses a SIPOC diagram to denote high
level functions and Process Maps to define lower level processes. There is no ability
to indicate sub-processes on the Six Sigma, Lean Thinking or ARIS Models. BPMN
indicates sub-processes via the inclusion of a ’+’ in the parent process symbol.
Six Sigma and BPMN lack a notation for representing the flow of information and
data and these can only be represented as a note on the model. All methods allow
conditional paths to be depicted. Process fallout is explicit in all methods except
ARIS where fallout is implied only via the woman’s association with a process. Lean
Thinking is the only method that explicitly shows the process completion times on
the model. ARIS supports the definition of goal metrics (including time) but
specification of actual process measurements is supported only through the ARIS
software toolset and is not shown on the graphical model. Six Sigma supports metric
definition also but this is only through the inclusion of an additional and separate Six
Sigma artifact. None of the methods explicitly show discontinuities of care and/or
care handovers. Care handovers are only implied via the inclusion or exclusion of a
healthcare worker role or the relationship between healthcare workers as depicted by
directional arrows.
It should be noted that three different notation sets and modeling representations
were found in the Six Sigma resources reviewed. This type of conflict adds an
unnecessary and confusing overhead for those inexperienced in model development.
A Process Modeling Assessment Framework for Healthcare
182
5.4.2.3 Human Resources (HR)
This series of questions looks at how well human resource requirements are catered
for. Specifically the skill levels and types that different processes require are
considered along with the ability to overlay an organisational structure that includes
internal and external roles.
All methods permit internal and external roles to be shown on the process model and
linked to a process, although none of the methods allow skill type/level to be linked
to a role. Only ARIS provides a mechanism for defining the organisational structure.
Roles are differentiated via the use of swimlanes in Six Sigma and BPMN. Lean
Thinking provides a number of icons representing a limited number of different
healthcare workers and ARIS distinguishes roles only by role name.
5.4.2.4 Physical Resources (PR)
Along similar lines to the human resource questions, this category assesses the
models ability to define physical resource requirements for each process and what
area is responsible for them.
None of the methods show who or what section/department/organisation is
responsible for a physical resource used by a process. Physical resources are
implicitly related via directional arrows in Lean Thinking and ARIS. Six Sigma and
BPMN have no notation for depicting physical resource usage on the process model.
5.4.2.5 Patient Needs (PN)
The critical focus of a patient-centered approach to healthcare improvement is the
ability of models to define the needs of the patient as they flow through the ‘system’.
Areas such as socio/economic and cultural needs are considered along with the
ability to highlight these on the model.
Only ARIS provides a mechanism for defining socio-economic or cultural patient
needs on the process model although this is only through the inclusion of an
‘environmental data’ or ‘input/output’ symbol attached to a process. This notation is
however generic to any type of ‘environmental data’ or ‘input/output’ associated
with process enactment and is not specific to patient needs.
A Process Modeling Assessment Framework for Healthcare
183
5.4.2.6 Administration (A)
Safe and reliable healthcare cannot be delivered without consideration to hospital
policies and guidelines relating to the administration of patients (Practice Guidelines
are dealt with separately; See 5.4.2.7). Such documentation will affect how patients
make their journey and what paperwork is required to be completed. This category
of questions deals with the relationship of required policies and administration
guidelines to the flow of processes and their representation on the process model.
In a similar manner to Patient Needs, ARIS permits Administration and Policy
Guidelines to be attached to a process via generic ‘environmental data’ or
‘input/output’ notation only. Inclusion of a note in Six Sigma and BPMN may denote
that Administration and/or Policy Guidelines are associated with a process although
this is not mandatory in either of these methods.
5.4.2.7 Practice Guidelines (PG)
Delivery of high quality healthcare primarily affects patient outcomes which in turn
contribute to patient satisfaction levels and ultimately the reputation of the HCO. By
linking processes to clinical best-practice guidelines, process improvements will be
inherently linked with higher care standards and definitive measurement data on
improved patient outcomes.
The ARIS Healthcare Solution provides the only specific tool adaptation that permits
treatment path mapping and higher level concepts such as DRG costings. Any
reference to practice guidelines within the other methods is via the inclusion of a
process ‘note’ and this is not a mandatory method notation for these items.
5.4.2.8 Systems Data (SD)
This group of questions assesses how data required for process enactment is
depicted. This may be at the information system level or for an individual data
group. This is important in eliminating duplication of data capture and storage and
improving communication of patient data as patients move between healthcare
workers.
None of the methods accommodate the capture of process data attributes.
Information systems can be related to a process in all methods but only at the macro

A Process Modeling Assessment Framework for Healthcare
184
application system level and not at the micro data level. Within BPMN and Six
Sigma information flows are implied only through the inclusion of a process ‘note’.
Specific information icons exist within Lean Thinking and ARIS.
5.4.2.9 Measurements (M)
Any improvements to process flow must be measured against previous situations to
assess if the change has been successful. This will include being able to capture a
wide variety of measurements including process timings, costs and satisfaction levels
and linking these to the Provider’s strategy. These are the areas considered by this
category of questions.
Only ARIS provides for the explicit linking of strategic objective goals on the
process model. Lean Thinking provides for the capture of completion time
measurements on the model but these are at the operational level only and there are
no explicit links to the strategic objectives. Other measurements can be defined in
Lean but these are a separate artefact and are not explicitly linked back to the process
model. Six Sigma also provides for the definition of metrics associated with a
process but again these are captured in a separate Six Sigma artefact and do not have
any explicit links back to the process model. Any links to strategic objectives within
Six Sigma are implied only.
5.4.2.10 Technology Support (TS)
This series of questions assesses the level of technical support provided for the
process modeling method. It considers the degree of support at a range of levels
including design, implementation and post-implementation performance monitoring.
All of the reviewed methods are supported by software technology. BPMN and Six
Sigma software notation are the simplest to use and most intuitive, followed by Lean
Thinking and ARIS respectively.
ARIS and BPMN provide for the output of process workflow definitions in an XML-
based execution language. ARIS also considers decision support system outputs
through the inclusion of the ARIS Controlling Platform, a separate, but related
module, to that used for business process modeling.
A Process Modeling Assessment Framework for Healthcare
185
5.5 Conclusion
To date the Healthcare domain lacks a design and modeling methodology adequately
tailored to support the specific requirements involved with redesigning patient
journey practices from a patient-centric perspective. Projects thus far have adopted
methodologies from other non-healthcare disciplines.
This chapter provided a solution to research hypothesis 3 through the demonstration
of a Process Modeling Assessment Framework for Healthcare (PMAF4HC). This
tool can be used by healthcare improvement teams to evaluate the level of support
being afforded to them by the process modeling method/technique selected for
development of the nominated patient journey models.
Identification of low levels or complete lack of support in particular areas alerts the
team to areas of weakness and the fact that other tools/techniques may be required to
augment the patient journey modeling activity to improve the chances of high quality
results.
The Assessment Framework can also be used as a benchmark for the development of
new patient journey modeling tools as presented in Chapter 7.
Four process modeling methods/techniques used within the healthcare domain for
process improvement were described along with the graphical notations used to
develop each of the particular process models. The methods/techniques were chosen
due to their frequency of use and/or their relationship to other significant healthcare
domain initiatives such as HL7. Each method/technique was applied to the case
study involving midwife-led primary-care maternity services in an Australian
hospital. Each of the methods was evaluated in regards to their level of support for
patient journey modeling using the Assessment Framework. The Assessment
summary outlined the strengths and weaknesses of each resulting model.
Highlighted weaknesses need to be addressed for the purposes of increasing the level
of support currently provided to the healthcare environment for patient journey
modeling.

A Process Modeling Assessment Framework for Healthcare
186
Of the methods evaluated only ARIS partially covered some of the more critical areas
such as the capture of organisational goals and the socio/economic and cultural needs
of patients, although this is in the form of a generic ‘environmental data’ object only.
Although the ARIS method covered more of the given assessment areas than other
methods it was the least intuitive to use and this is seen as a major disadvantage for
healthcare workers involved in process improvement initiatives. None of the
methods are patient centric or identify discontinuities of care or patient handovers.
The ability to define the role type and skill level required to deliver a particular
clinical treatment and who is responsible for a given physical resource is also
lacking.
Due to the huge interest in improving healthcare delivery and therefore the
fundamental processes enacted in the provision of safe, high quality care, the
accurate and comprehensive modelling of the patient’s journey is of critical
importance. This suggests that more focussed attention needs to be given to the
enhancement of existing process modelling methods/techniques and/or the
development of healthcare domain specific patient journey modelling tools.
PJM2 – A Multi-Dimensional Patient Journey Modeling Conceptual Design
187
CHAPTER 6 PJM2 – A MULTI-DIMENSIONAL PATIENT
JOURNEY MODELING CONCEPTUAL DESIGN
6.1 Introduction
This chapter describes an original conceptual design of the multiple dimensions
required to support the development of comprehensive high quality patient journey
models. The conceptual design is abstracted from the Patient Journey Modeling
Meta-Methodology (PJM3) presented in chapter 4 and is known as the Multi-
Dimensional Patient Journey Modeling Conceptual Design or PJM2.
PJM2 sets the foundation for the development of solutions to research hypotheses 3
and 4 as discussed in Chapter 1. Specifically it provides a basic design of the
components required in the development of two key patient journey improvement
instruments:
1) Healthcare specific patient journey modeling tools
When combined with the Assessment Framework discussed in Chapter 5,
the conceptual design forms a robust blueprint for the construction of
patient journey modeling tools purpose built for the healthcare domain.
This can assist healthcare redesign teams to breakdown the complexities
associated with modeling patient journeys into manageable ‘segments’ or
dimensions.
2) Database designs to support healthcare specific patient journey models
Purpose built healthcare domain patient journey models necessitate the
consideration of complimentary supporting technology. This includes
databases that will enable management to assess performance of the new
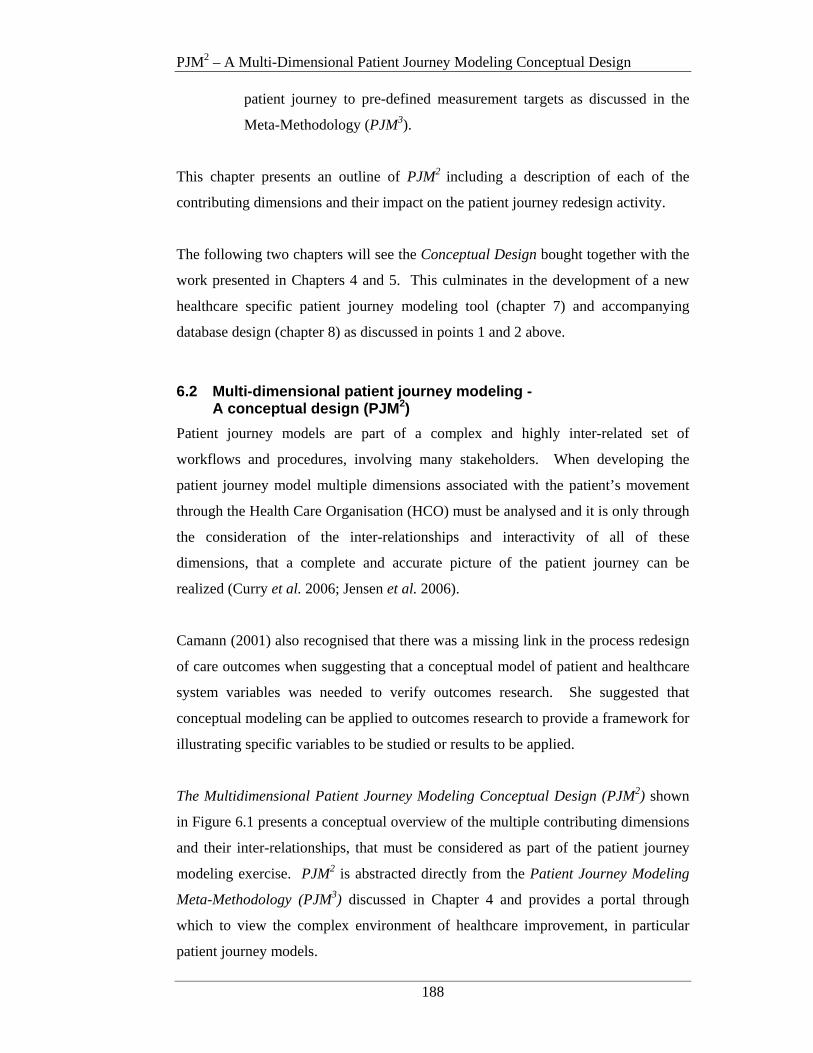
PJM2 – A Multi-Dimensional Patient Journey Modeling Conceptual Design
188
patient journey to pre-defined measurement targets as discussed in the
Meta-Methodology (PJM3).
This chapter presents an outline of PJM2 including a description of each of the
contributing dimensions and their impact on the patient journey redesign activity.
The following two chapters will see the Conceptual Design bought together with the
work presented in Chapters 4 and 5. This culminates in the development of a new
healthcare specific patient journey modeling tool (chapter 7) and accompanying
database design (chapter 8) as discussed in points 1 and 2 above.
6.2 Multi-dimensional patient journey modeling - A conceptual design (PJM2)
Patient journey models are part of a complex and highly inter-related set of
workflows and procedures, involving many stakeholders. When developing the
patient journey model multiple dimensions associated with the patient’s movement
through the Health Care Organisation (HCO) must be analysed and it is only through
the consideration of the inter-relationships and interactivity of all of these
dimensions, that a complete and accurate picture of the patient journey can be
realized (Curry et al. 2006; Jensen et al. 2006).
Camann (2001) also recognised that there was a missing link in the process redesign
of care outcomes when suggesting that a conceptual model of patient and healthcare
system variables was needed to verify outcomes research. She suggested that
conceptual modeling can be applied to outcomes research to provide a framework for
illustrating specific variables to be studied or results to be applied.
The Multidimensional Patient Journey Modeling Conceptual Design (PJM2) shown
in Figure 6.1 presents a conceptual overview of the multiple contributing dimensions
and their inter-relationships, that must be considered as part of the patient journey
modeling exercise. PJM2 is abstracted directly from the Patient Journey Modeling
Meta-Methodology (PJM3) discussed in Chapter 4 and provides a portal through
which to view the complex environment of healthcare improvement, in particular
patient journey models.
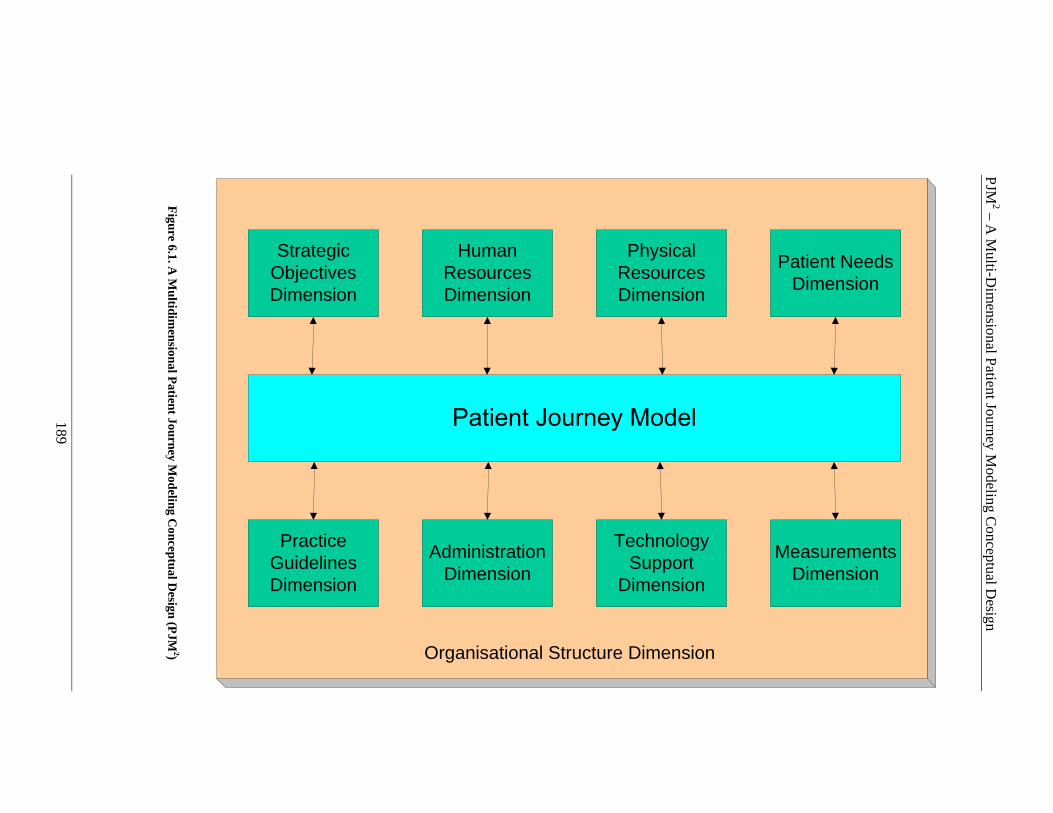
PJM
2 – A M
ulti-Dim
ensional P
atient Journey M
odeling Co
nceptu
al Desig
n
189
Strategic Objectives Dimension
Human Resources Dimension
Physical Resources Dimension
Patient Needs Dimension
Practice Guidelines Dimension
Administration Dimension
Technology Support
Dimension
Measurements Dimension
Organisational Structure Dimension
Figure 6.1. A
Multidim
ensional Patient Journey M
odeling Conceptual D
esign (PJM 2)
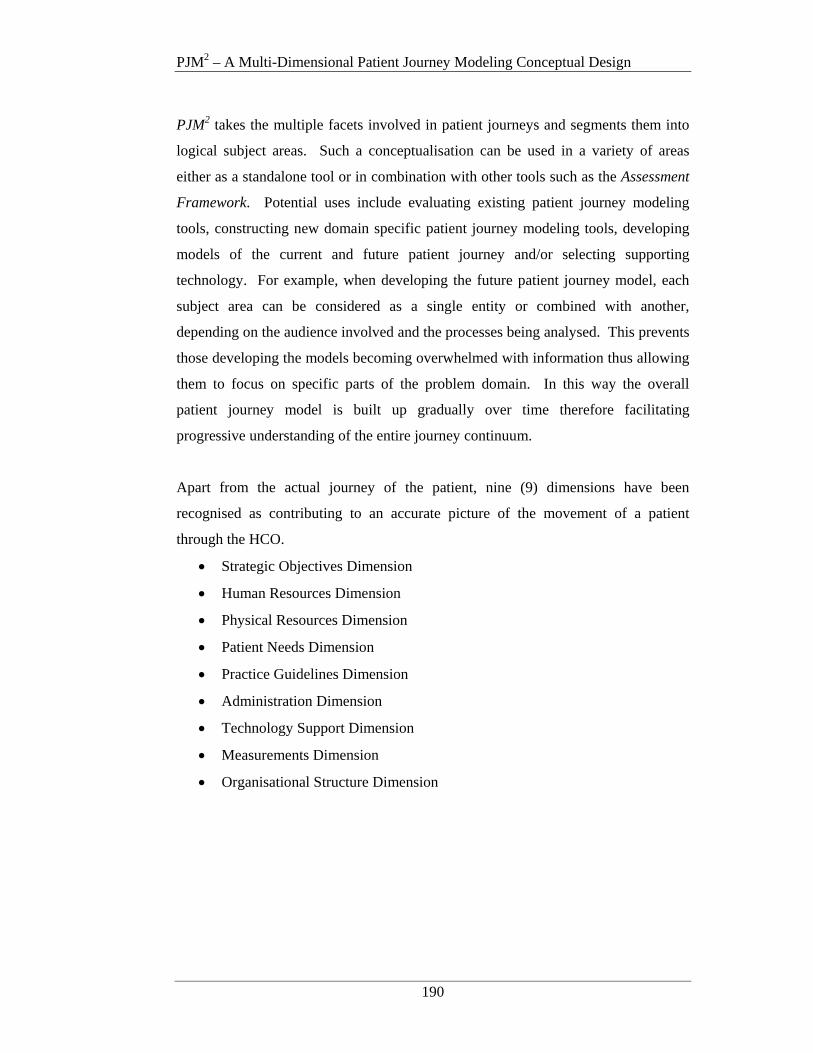
PJM2 – A Multi-Dimensional Patient Journey Modeling Conceptual Design
190
PJM2 takes the multiple facets involved in patient journeys and segments them into
logical subject areas. Such a conceptualisation can be used in a variety of areas
either as a standalone tool or in combination with other tools such as the Assessment
Framework. Potential uses include evaluating existing patient journey modeling
tools, constructing new domain specific patient journey modeling tools, developing
models of the current and future patient journey and/or selecting supporting
technology. For example, when developing the future patient journey model, each
subject area can be considered as a single entity or combined with another,
depending on the audience involved and the processes being analysed. This prevents
those developing the models becoming overwhelmed with information thus allowing
them to focus on specific parts of the problem domain. In this way the overall
patient journey model is built up gradually over time therefore facilitating
progressive understanding of the entire journey continuum.
Apart from the actual journey of the patient, nine (9) dimensions have been
recognised as contributing to an accurate picture of the movement of a patient
through the HCO.
• Strategic Objectives Dimension
• Human Resources Dimension
• Physical Resources Dimension
• Patient Needs Dimension
• Practice Guidelines Dimension
• Administration Dimension
• Technology Support Dimension
• Measurements Dimension
• Organisational Structure Dimension

PJM2 – A Multi-Dimensional Patient Journey Modeling Conceptual Design
191
Each of these dimensions may model an aspect of the HCO in its own right but only
contributes to improving a situation when applied in the context of a particular
patient journey. It must be highlighted that although the patient journey model is the
‘hub’ of this type of process redesign activity, each and every dimension can interact
with and impact other dimensions. This suggests that each and every dimension
must be fully analysed and understood in relation to its impact on the safe and
efficient journey of a patient to ensure a comprehensive and accurate future patient
journey model is developed.
It is suggested that the exclusion of one or more of the PJM2 dimensions will reduce
the effectiveness of the patient journey modeling exercise and negatively impact
overall patient safety and improved outcomes goals.
Multidimensional approaches have been recognised as being of significance to other
types of organisations such as manufacturing, insurance, banking and travel (Inmon
1996; Kimball 1996) and can be implemented using multi-dimensional database
structures. Such database designs are seen most commonly in data warehouse
architectures that support executive and management information systems and
decision support systems. As discussed in Chapter 4, Decision Support Systems
form a core component of the PJM3 improvement architecture.
The following sections describe the PJM2 framework starting with the core
component; the patient journey model. Each of the contributing dimensions are then
outlined and their interrelationship to other components discussed.

PJM2 – A Multi-Dimensional Patient Journey Modeling Conceptual Design
192
6.2.1 The Patient Journey Model
Development of the patient journey models (current and future) requires input from a
broad range of stakeholders, each of whom contribute to the patient’s experience as
they move through the HCO. Seila (2005) suggests that developing health care
models requires health system managers and care givers to collaborate with
modelers. However he points out that this can be difficult due to the different
cultures and values held by both groups.
Notwithstanding such issues, patient journey models cannot be developed in
isolation by only one section of the organisation. All of the stakeholders must
contribute to the development of the model if it is to accurately represent the
patient’s journey. In addition to the professional stakeholders involved, it is a
standard requirement that patient’s who have recently experienced the journey under
review be included in the analysis and redesign process.
A recognised method for eliciting requirements from diverse groups is a technique
known as Joint Application Development (JAD). JAD was a process originally
developed for designing computer-based business systems in the early 1980’s.
However JAD has evolved to be used in a wider variety of situations, not just
systems development, and is now described as a joint venture among people who
need to make decisions affecting multiple areas of an organisation (Wood and Silver
1995). JAD sessions are run by an experienced facilitator whose role it is to guide
the process and structure of the sessions whilst encouraging the participants to share
their knowledge and expertise to arrive at a problem solution design. The aims of
such facilitated workgroups are to achieve a shared understanding of the issues
facing the group, a sense of common purpose and a mutual commitment to action
(Phillips and Phillips 1993).
As part of the JAD sessions, patient journey stakeholders are bought together and
through the use a trained facilitator, their diverse contributions outlining the journey
of patients and the processes involved in their care are extracted and represented as a
graphical patient journey model (PJM). As discussed above this is far too complex
an exercise to attack as a single mass and must be broken down into manageable
segments. In PJM2, each segment is known as a dimension. By using individual
PJM2 – A Multi-Dimensional Patient Journey Modeling Conceptual Design
193
dimensions, JAD participants are able to understand and categorise the different
items that contribute to the overall development of the PJM. Initially they can work
with one or two dimensions and then bring the dimensions together as their group
understanding increases. This allows for more comprehensive analysis and design of
current journey deficiencies and potential improvements.
A new diagrammatic approach to patient journey modeling is presented in Chapter 7
and it is in this chapter that comprehensive details regarding the graphical
representation of each of the PJM2 dimensions are presented.
6.2.2 Strategic Objectives Dimension
The Strategic Objectives Dimension defines the specific mission, strategic directions
and related objectives that guide the organisation and how it delivers its services to
its specified clients. Aspects of the Strategic Objectives Dimension may be
applicable across different patient journey models or only to a nominated patient
journey (viz: diabetes, cardiac, renal) and must include consideration of applicable
legislation, accreditation requirements, government/hospital policies and patient
population needs. In saying that each Strategic Objectives Dimension is specific to
the Patient Journey Model under review it must be acknowledged that although
objectives can be set at multiple levels of the organisation, viz, strategic,
management and operational (Lemieux-Charles et al. 2003), certain HCO mission-
based objectives will be present in all models (ie: patient satisfaction). All Strategic
Objective measurements are linked to the Measurements Dimension for the purposes
of analysis of target to actual figures, once the redesigned patient journey is enacted.
Key sources of strategic objectives are Government and accreditation bodies that set
policy for the industry as a whole. Examples include the national agenda of the
Australian Council on Safety and Quality in Healthcare as supported by the
Australian Council on Healthcare Standards (ACHS) Evaluation and Quality
Improvement Program (EQuIP) (ACHS 1996; ACSQH 2006) and the National
Patient Safety Goals as defined by The Joint Commission (JCAHO 2006).
Definition of the contents of this dimension involves describing the HCO strategic
objectives in the form of the OHA adapted Balanced Scorecards as outlined in
PJM2 – A Multi-Dimensional Patient Journey Modeling Conceptual Design
194
Chapters 2 and 4 (Ontario Hospital Association 1999). Initially the mission and
vision of the HCO are reviewed along with existing strategic objectives. Definition
of the strategic objectives is then categorised into one of the four BSC perspectives.
Starting with the definition of the actual objectives for a given perspective, the
variables that will be used to measure to what degree the objectives are being
achieved are listed. Target or planned variable values are then set for each
measurement. Initiatives that can lead to the realisation of the set targets are also
included.
6.2.3 Human Resources Dimension
The Human Resources Dimension describes the staffing structure required to
adequately support the flow of the patient through the patient journey under review.
It defines actual positions and numbers required, skills/roles and section or
department responsible for a specified resource within the patient journey model.
Costs of supplying the required human resources are also captured as part of the
Human Resources Dimension along with figures regarding target human resource
numbers required by a process.
6.2.4 Physical Resources Dimension
The Physical Resources Dimension describes what and how many of each associated
physical resource such as, space and equipment, (excluding human resources), are
required to support the activities described for each process in the Patient Journey
Model. Financials for each physical resource must also be calculated. This includes
purchase costs and on-going maintenance fees for equipment. When describing a
process as part of the patient journey not only must the space requirements (ie: room
size and type) be specified but also the physical equipment needed to complete the
process (ie: ultrasound machine, blood pressure machine).
6.2.5 Patient Needs Dimension
The Patient Needs Dimension defines the unique socio and cultural requirements of
specific patient groups that flow through a nominated patient journey. This
Dimension is of particular concern in low socio-economic or indigenous areas.
PJM2 – A Multi-Dimensional Patient Journey Modeling Conceptual Design
195
Other categories of patient needs can also be classified in this Dimension based on
specific co-morbidity groups or carer requirements. Measurements relating to the
provision of a ‘culturally safe’ care plan are linked to the Measurement Dimensions
for variance analysis following the enactment of the patient journey workflows to
determine the degree of compliance and/or the need for greater vigilance.
For example one traditional Australian Aboriginal custom involves a ‘smoking
ceremony’ for the placenta of new born babies. In days gone by the placenta was
placed in a grass mound, the grass was lit and the resulting smoke served to cleanse
the placenta of bad spirits and bring good luck to the new life. The option of storing
and transporting the placenta of newborn babies is no longer offered to indigenous
women who birth at public hospitals in Australia and can cause disharmony within
the woman and her tribe once she has returned to her ‘local’ land.
6.2.6 Practice Guidelines
Output from the HCO Strategy analysis will include practice guidelines that are
required to comply with or attain accreditation. This will include items such as
evidence-based best practice and clinical indicators. The goal is to remove
variability in the process of care where possible thus increasing the quality of the
care delivered and the overall outcomes. Practice guidelines may apply to different
types of staff (nurses, doctors etc..) or for any type of healthcare worker delivering a
specific type of care (ventilator support). These may form part of an overall quality
improvement program such as the Evaluation and Quality Improvement Program
(EQuIP) administered by The Australian Council on Healthcare Standards (ACHS
1996) or be published by a particular professional body such as the National
Midwifery Guidelines for Consultation and Referral by the Australian College of
Midwives (Australian College of Midwives 2004).
At the operational level benchmark clinical indicators may also be required to
support measurement of the use and effectiveness of certain practice guidelines. A
clinical indicator is defined as a measure of the clinical management and/or outcome
of care. Indicators are best seen as measures that screen for a particular event.
These are typically developed in conjunction with medical colleges, associations and
societies. Examples include the Sentinel Event Alerts from the Joint Commission for
PJM2 – A Multi-Dimensional Patient Journey Modeling Conceptual Design
196
Accreditation of Healthcare Organisations (JCAHO 2005) and the Performance and
Outcomes Service Clinical Indicators from The Australian Council on Healthcare
Standards (ACHS 1996).
Clinical indicators will be linked to the Measurements Dimension using Clinical
indicator identifiers and targets. These will be used for future variance analysis post
workflow enactment.
6.2.7 Administration Dimension
The Administration Dimension describes the type, source and movement of any
paperwork (including forms) associated with the management of a patient and their
journey and the manual or system administration tasks required to support the
completion of these activities. Such data can be used to analyse problems relating to
the smooth flow of patients within the system and to other external care providers
and to provide pointers to potential problems in the clinical, financial and
management areas (Diers and Bozzo 1999).
Also includes definition of responsibilities and approvals required via links to the
Human Resources Dimensions. Specifications for system requirements for support
for data capture, storage, retrieval and reporting as part of the Administration
Dimension are linked to the Technology Support Dimension.
6.2.8 Technology Support Dimension
Technology may play a role in each of the Dimensions described above but we are
particularly interested in the support provided for the patient journey under review.
The Technology Support Dimension defines the systems required to support all of the
activities associated with the flow of the patient through the nominated healthcare
system and the analysis of the ongoing effectiveness of the journey itself. A key
item of consideration here is the opportunity to automate workflows and provide
clinical decision support at the point of care.
PJM2 – A Multi-Dimensional Patient Journey Modeling Conceptual Design
197
Technology support may be in the form of Hospital-wide systems or specialised
systems catering for unique departmental needs. Examples of technology support for
a patient journey may include electronic transfer of lab test or x-ray requests,
integration of systems related to the overall patient journey or automation of existing
manual processes. This is supported by Grotevant (1998) who suggested that
Information Technology provides the infrastructure and tools, which fundamentally
change organisations, but management provides the strategic vision that transforms
technology into competitive advantage.
Analysis of the patient journey may lead to a realisation that technology support is
lacking and this may initiate requests for new systems or enhancements to existing
systems. The required data may actually already exist in another system and this
may necessitate integration of a number of systems to provide a more comprehensive
database that reduces the need for duplicate data entry and reporting.
Such findings may also require the purchase of new computing equipment (ie: data
servers or handheld computers) and any new budget needs must be fed back into the
Physical Resources Dimension as discussed above.
6.2.9 Measurements Dimension
NB: The terms measurement and metric are used synonymously in this thesis to
represent the value assigned to a given variable that has been selected as an
improvement indicator.
Measurement of healthcare improvement is the area of most interest to healthcare
managers. Measurements provide the tangible values that assist in determining if
there has been an improvement in productivity and/or quality. Measures of the
current ‘as-is’ patient journey may provide the current benchmark or other
recognised high performing service providers performance results may also be
utilised, if available.
In general three types of measurement values are needed (as a minimum): ‘original’
(or pre-intervention), ‘target’ and ‘actual’. ‘Original’ values represent the journey
as it was before the improvement exercise was undertaken. ‘Target’ values are those
PJM2 – A Multi-Dimensional Patient Journey Modeling Conceptual Design
198
that the HCO wants to achieve as part of the future patient journey implementation.
‘Actual’ values represent the results that are physically attained as a particular patient
moves through the redesigned patient journey. Comparison of ‘original’ to ‘actual’
process measures represent the degree of improvement that can be attributed to the
implemented changes. Comparison of ‘target’ to ‘actual’ results allow required
performance levels to be highlighted for the purposes of variance analysis and on-
going process improvement.
The primary focus on measurement definition is usually clinical type indicators but it
should be recognised that these are just one type of measurement. Metrics can be
classified according to the aspects of care they address and can measure either
(ACHS 2007):
• Structure (what is needed)
• Process (what is done)
• Outcome (what is achieved or expected).
The PJM2 conceptual design caters for these measurement types through the use of
multiple dimensions such as the Technology Support, Patient Journey and Strategic
Objectives dimensions.
Metrics are used to assess, compare and determine the potential to improve care.
Measurements should therefore be used as a tool to assist in assessing whether or not
a standard is being met. The metrics provide evidence of performance and can be
linked to Quality Improvement programs where applicable.
The previous discussion relates to the setting of healthcare improvement
measurements in general but metrics for clinical indicators are typically high on the
HCO agenda as they are most commonly used to gauge compliance to standards and
prove accreditation criteria attainment.
Measuring improvement is acknowledged as an intricate activity and some of this
complexity stems from approaches that attempt to define measurements for all areas
at the same time. Such an approach leads to confusion as the number and
PJM2 – A Multi-Dimensional Patient Journey Modeling Conceptual Design
199
complexity of the areas to be considered is too great. The development of the
multiple dimensions discussed above, helps to overcome such complexities by
defining measurements for each specific part of the patient journey individually and
then linking all of the measurements within the Measurements dimension.
6.2.10 Organisational Structure Dimension
The Organisational Structure Dimension defines the hierarchical reporting structure
and lines of responsibility that exist within a given HCO. The Organisational
Structure Dimension helps to identify which departments are responsible for
particular aspects of the patient journey. This includes responsibility for human and
physical resources, information systems etc….In PJM2, the organisational structure
is shown as a supporting dimension for all of the others. This is because all other
dimensions have the organisational structure as a common aspect of their makeup.
Ideally the information for this dimension would already be in place in some other
form (ie: paper based, accounting system etc…). If the organisational structure
already exists and a paper report can be produced it can be used as is for the
purposes of the patient journey modeling exercise. If the organisational structure
data is not easily accessible it will need to be documented as an integral part of the
overall PJM activity.
6.3 Conclusion
This chapter presented an original conceptual design describing the multiple
dimensions contributing to the development of comprehensive patient journey
improvements. The Multi-Dimensional Patient Journey Modeling Conceptual
Design (PJM2) is abstracted directly from the Patient Journey Modeling Meta-
Methodology (PJM3) presented in chapter 4.
PJM2 provides a working blueprint of the multiple dimensions associated with a
patient’s movement through the Healthcare Organisation and the inter-relationship
and interactivity of these contributing dimensions. Nine contributing dimensions
were discussed: Strategic Objectives, Human Resources, Physical Resources, Patient
Needs, Practice Guidelines, Administration, Technology Support, Measurements and
PJM2 – A Multi-Dimensional Patient Journey Modeling Conceptual Design
200
Organisational Structure. The approach supports research hypotheses 3 and 4 as
described in Chapter 1.
Effective patient journey modeling projects must consider all of the PJM2
dimensions or risk negatively impacting patient safety and improvement outcomes.
Chapters 4, 5 and 6 have presented and discussed the environment required to
redesign patient journeys for the purposes of improving patient safety, reducing care
variability and keeping the patient at the centre of the care process. Chapters 7 and 8
consolidate this work and use it as the foundation for the development of two
purpose built healthcare improvement instruments. Chapter 7 presents an innovative
patient journey modeling tool that is cognisant of the requirements of PJM3, the
Assessment Framework and PJM2 and incorporates these pre-requisites into the
overall design of the new tool. Chapter 8 uses the same approach to underpin the
development of an original multi-dimensional database design for a Management
Decision Support System. This system is used by management to evaluate the
changes made as a result of the redesigned patient journey and to determine if such
changes are meeting the pre-defined project targets or if further changes are required
as part of ongoing quality improvement efforts.
PaJMa – A Healthcare Specific Patient Journey Modeling Tool
201
CHAPTER 7 PAJMA - A HEALTHCARE SPECIFIC
PATIENT JOURNEY MODELING TOOL
7.1 Introduction
This chapter presents an innovative patient journey modeling tool that has been
purpose built for the healthcare domain. The new graphically-based patient journey
modeling tool is known as PaJMa (pronounced ‘pajama’) and supports the design of
safe, high quality patient journeys.
PaJMa is the first patient journey modeling tool built specifically for healthcare from
the ground up. The design is based on the Patient Journey Modeling Meta-
Methodology (PJM3) and the Process Modeling Assessment Framework for
Healthcare (PMAF4HC), discussed in Chapters 4 and 5 respectively. The multi-
dimensional approach used in the model was derived directly from the Patient
Journey Modeling Conceptual Design (PJM2) presented in Chapter 6 and allows
redesign teams to breakdown the complexities associated with modeling patient
journeys into manageable segments.
The development of the PaJMa tool provides a solution to research hypotheses 2 and
3 from Chapter 1. A key contribution lies in the fact that the tool can be used as a
primary driver of healthcare improvement initiatives particularly in areas such as the
promotion of stakeholder involvement, commitment and ownership, as well as
highlighting the relationship of a range of relevant variables that impact the overall
patient journey.
PaJMa – A Healthcare Specific Patient Journey Modeling Tool
202
As discussed throughout this research work, quality improvement is high on the
agenda of Health Care Organisations (HCO) worldwide. Patient Journey Modeling is
a relatively recent innovation in healthcare quality improvement that models the
patient’s movement through the HCO by viewing it from a patient centric
perspective. Critical to the success of the redesigning care process is the
involvement of all stakeholders and their commitment to actively participate in the
process. Tools which promote this type of communication are a critical enabler that
can significantly affect the overall process redesign outcomes. Such a tool must also
be able to incorporate additional factors such as relevant policies and procedures,
staff roles, patient needs, system usage and measurements such as process time and
cost.
This chapter begins with a recap of the major deficiencies with the selected process
modeling methods/techniques, in relation to the healthcare domain as highlighted by
the Process Modeling Assessment conducted in Chapter 5. Following this is a
discussion concerning the contributing domains impacting the development of the
PaJMa tool. The overall architecture including the notation used to develop the
PaJMa patient journey models is then presented.
The application of PaJMa is demonstrated via the midwife-led primary care case
study previously described in Chapter 5. The case study will use the new PaJMa
tool to develop a Current Patient Journey Model. The issues associated with the
current patient flow will be discussed and improvements suggested. The same tool
will then be used to develop an improved or Future Patient Journey Model, designed
to overcome the highlighted issues and improve not only how the patient moves
through the system but the overall quality and safety of the primary-care midwifery
services offered.
7.2 PaJMa Tool Background
Chapter 5 evaluated the dominant process modeling methods/tools that are being
used to redesign healthcare in the current climate of change. Each process modeling
technique was assessed against a set of key criteria (PMAF4HC) considered
PaJMa – A Healthcare Specific Patient Journey Modeling Tool
203
necessary to adequately support high quality healthcare improvement initiatives.
Some of the specific areas which were identified as being deficient include:
• Definition of Roles and skill types
• Definition and linking of resources to the organisational structure
• Highlighting of care handovers
• Definition of patient needs
• Definition of practice guidelines and policies and the linking of these to
processes
• Definition of explicit multiple measurements (other than time)
• Definition of strategic objectives and linking of these to operational process
measurements.
In addition, none of the modeling techniques evaluated are healthcare domain
specific and therefore lack the ability to define the multiple dimensions associated
with healthcare change thus making them highly unintuitive to healthcare workers
involved in the redesigning care activity.
This indicates that any new patient journey modeling tool must aim to overcome
these deficiencies if process modeling in the healthcare arena is to be improved. In
addition the modelling technique must:
• Be consistent and simple to use
• Be understandable by a diverse range of stakeholders
• Enable ready recognition of patient journey issues
• Provide for automated process guidance and execution support.
(Curtis et al. 1992; Seila 2005)
Such aims necessitate the use of a cross-discipline approach such as that employed
by the PaJMa tool. The PaJMa design brings together constructs from several
complimentary disciplines. These include Process reengineering, Flowchart and
Workflow modeling and Joint Application Development (JAD). By combining these
approaches the stated aims can be achieved in a straightforward manner providing
realistic and implementable solutions.

PaJMa – A Healthcare Specific Patient Journey Modeling Tool
204
The PaJMa tool presented in this chapter provides such a foundation and can be used
as a graphically based communication tool to develop patient journey models,
analyse highlighted problems and redesign the overall journey, leading to reduced
variations in the care pathway thus increasing the quality of care and improving
patient outcomes.
7.2.1 Contributing Domains
Process reengineering
Process reengineering techniques have been used extensively in the business,
manufacturing and computing domains (Hammer 1990; Womack et al. 1990;
Davenport 1994) for many years but it is only in the recent past that process
improvements in healthcare have been achieved through the use of similar
reengineering approaches. Process reengineering activities invariably involve
modeling of the business process flows.
Process reengineering supports (Davenport et al. 2003):
• Revolutionary process redesign and work improvements
• Across broad, cross-functional work processes
• Introducing stretch goals of order-of magnitude improvement
• Using IT as an enabler of new ways of working
This suggests that healthcare improvement initiatives that utilise process
reengineering are looking to substantially change the ways things are currently done,
with an end goal of significant improvements in quality of care and outcomes.
Process reengineering through patient journey modeling has at its centre the needs
and wants of the patient in relation to their progress through a healthcare system for
a given service (NHS Modernisation Agency 2005; NHS Modernisation Agency
2005). This is typically in the context of a hospital but applies equally to general
practice medicine and specialist services. Each time a patient interacts with a
healthcare worker (including administration staff, management and clinicians) or is
moved around the hospital the interaction is tracked and described.
PaJMa – A Healthcare Specific Patient Journey Modeling Tool
205
The goal is to collect required information only once, reduce the number of times a
patient is moved, eliminate excessive activities, remove duplicate communications,
promote compliance to recognised practice guidelines and provide clear and concise
information to the patient. This may mean substantial changes to the way people
work at the present time, although due care should be given to ensuring that
processes that are already performing well are not changed purely for the sake of it.
Flowchart and Workflow modeling
PaJMa has at its centre the visual representation of the processes involved with the
patient’s journey overlaid with the different dimensions contributing to that journey
including staff roles, information creation/movement, patient needs, practice
guidelines/policies and metrics. The approach allows dimensions to be swapped in
and out of the conversation depending on the context being discussed at the time.
The architecture uses a number of flowcharting symbols as the platform for the
graphical definition of the multiple layers (dimensions) involved in the complex
arena of healthcare redesign.
Joint Application Development
Joint Application Development (JAD) is a recognised method for eliciting
requirements from diverse groups and was a process originally developed in the
early 1980’s for designing computer-based business systems. However JAD has
evolved to be used in a wider variety of situations, not just systems development, and
is now described as a joint venture among people who need to make decisions
affecting multiple areas of an organisation (Wood and Silver 1995). The PaJMa
development activity uses the techniques of Joint Application Development to bring
stakeholders together for the purposes of patient journey modeling requirements
gathering.
The key enabler to the success of this technique is the use of a facilitator whose role
it is to guide the process and structure of the sessions whilst encouraging the
participants to share their knowledge and expertise to arrive at a problem solution
design. The aims of such facilitated workgroups are to achieve a shared
understanding of the issues facing the group, a sense of common purpose and a
mutual commitment to action (Phillips and Phillips 1993). The aims of JAD are very
PaJMa – A Healthcare Specific Patient Journey Modeling Tool
206
relevant to healthcare quality improvement initiatives, however JAD as a practice
does not provide any specific diagrammatic techniques to aid in the overall redesign
of the patient’s journey.
As part of the JAD sessions, patient journey stakeholders, including patients, are
bought together and through the use a trained facilitator, their diverse contributions
outlining patient movements and interaction with service providers and the processes
involved in their care, are extracted. The contributions of all stakeholder groups are
bought together by the facilitator and represented as a graphical patient journey
model (PJM).
7.2.2 Project Activities
Patient Journey Modeling projects are typically undertaken via a number of
sequential stages as follows:
1. Firstly the scope of the patient journey model is discussed, agreed and
documented;
2. Balanced Scorecard perspectives relevant to the journey being analysed are
then reviewed. Goals for the improvement initiative must be clearly stated
and agreed. Goals must also be able to be linked back to the Healthcare
Provider’s strategy to ensure they are adding value to the organisation’s
overall direction;
3. Next the patient journey as it currently exists is modeled. This should be
focused clearly on the patient and the effect processes have on their
experience and outcomes, with each of the PJM2 dimensions being explicitly
considered. NB: A separate patient journey model is required for each co-
morbidity;
4. Analysis of journey problem areas is then conducted and possible
improvements highlighted. Each improvement must be considered for the
effect it has on the project goals in relation to the patient, health care staff and
the Healthcare Organisation. Evaluation of alternatives can be done using
manual tools such as the ’Flow Master Matrix’ by Jensen et al. (2006) or
more advanced automated Simulation Modeling tools (Brailsford 2005).
Ideally the alternatives that will have the greatest impact on the patient’s
journey are selected for inclusion in the future PJM;
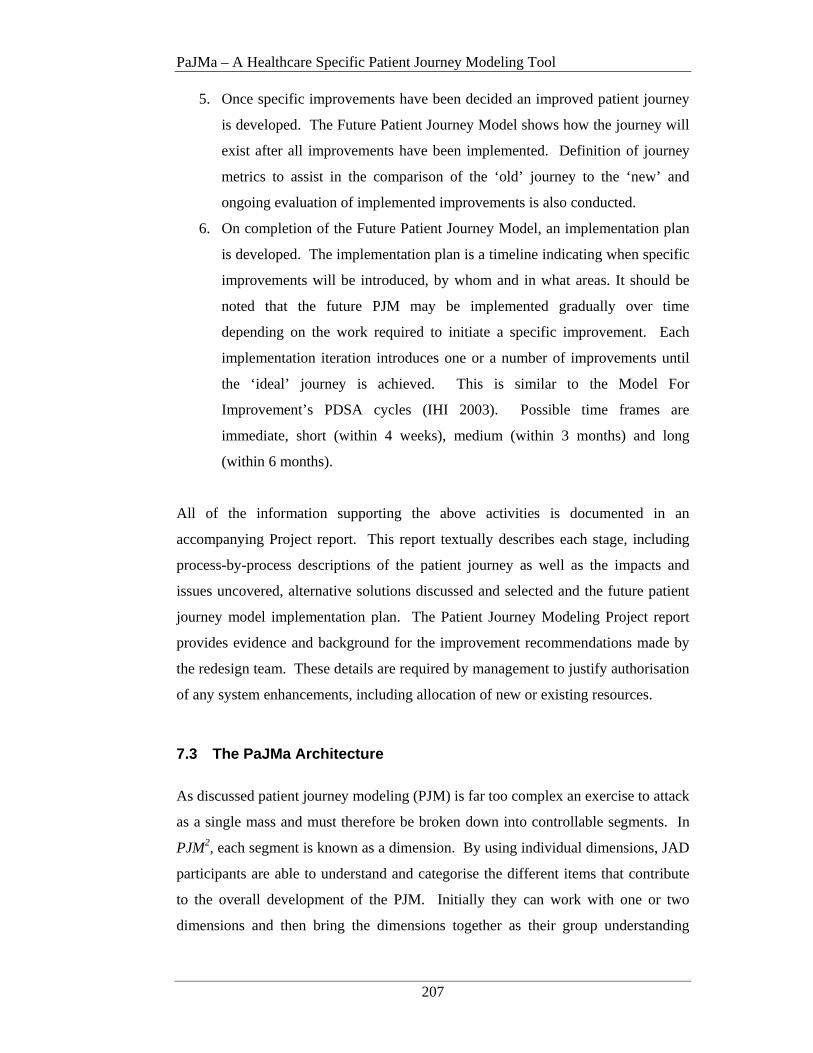
PaJMa – A Healthcare Specific Patient Journey Modeling Tool
207
5. Once specific improvements have been decided an improved patient journey
is developed. The Future Patient Journey Model shows how the journey will
exist after all improvements have been implemented. Definition of journey
metrics to assist in the comparison of the ‘old’ journey to the ‘new’ and
ongoing evaluation of implemented improvements is also conducted.
6. On completion of the Future Patient Journey Model, an implementation plan
is developed. The implementation plan is a timeline indicating when specific
improvements will be introduced, by whom and in what areas. It should be
noted that the future PJM may be implemented gradually over time
depending on the work required to initiate a specific improvement. Each
implementation iteration introduces one or a number of improvements until
the ‘ideal’ journey is achieved. This is similar to the Model For
Improvement’s PDSA cycles (IHI 2003). Possible time frames are
immediate, short (within 4 weeks), medium (within 3 months) and long
(within 6 months).
All of the information supporting the above activities is documented in an
accompanying Project report. This report textually describes each stage, including
process-by-process descriptions of the patient journey as well as the impacts and
issues uncovered, alternative solutions discussed and selected and the future patient
journey model implementation plan. The Patient Journey Modeling Project report
provides evidence and background for the improvement recommendations made by
the redesign team. These details are required by management to justify authorisation
of any system enhancements, including allocation of new or existing resources.
7.3 The PaJMa Architecture
As discussed patient journey modeling (PJM) is far too complex an exercise to attack
as a single mass and must therefore be broken down into controllable segments. In
PJM2, each segment is known as a dimension. By using individual dimensions, JAD
participants are able to understand and categorise the different items that contribute
to the overall development of the PJM. Initially they can work with one or two
dimensions and then bring the dimensions together as their group understanding
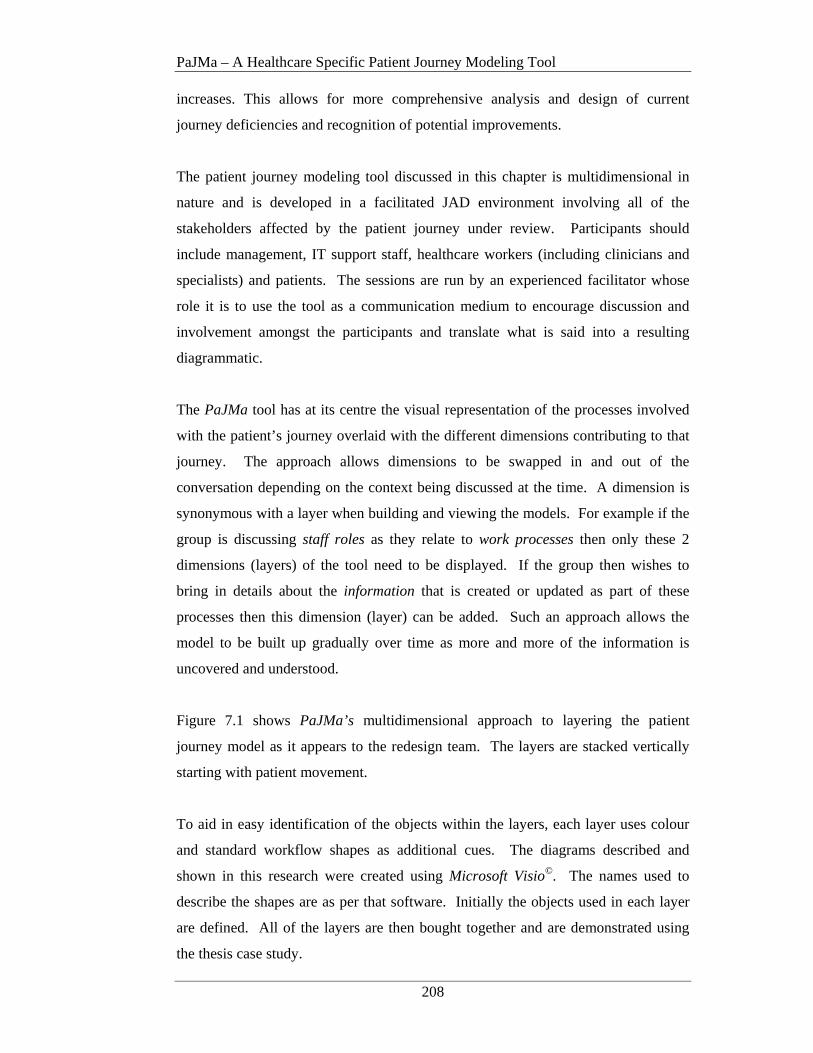
PaJMa – A Healthcare Specific Patient Journey Modeling Tool
208
increases. This allows for more comprehensive analysis and design of current
journey deficiencies and recognition of potential improvements.
The patient journey modeling tool discussed in this chapter is multidimensional in
nature and is developed in a facilitated JAD environment involving all of the
stakeholders affected by the patient journey under review. Participants should
include management, IT support staff, healthcare workers (including clinicians and
specialists) and patients. The sessions are run by an experienced facilitator whose
role it is to use the tool as a communication medium to encourage discussion and
involvement amongst the participants and translate what is said into a resulting
diagrammatic.
The PaJMa tool has at its centre the visual representation of the processes involved
with the patient’s journey overlaid with the different dimensions contributing to that
journey. The approach allows dimensions to be swapped in and out of the
conversation depending on the context being discussed at the time. A dimension is
synonymous with a layer when building and viewing the models. For example if the
group is discussing staff roles as they relate to work processes then only these 2
dimensions (layers) of the tool need to be displayed. If the group then wishes to
bring in details about the information that is created or updated as part of these
processes then this dimension (layer) can be added. Such an approach allows the
model to be built up gradually over time as more and more of the information is
uncovered and understood.
Figure 7.1 shows PaJMa’s multidimensional approach to layering the patient
journey model as it appears to the redesign team. The layers are stacked vertically
starting with patient movement.
To aid in easy identification of the objects within the layers, each layer uses colour
and standard workflow shapes as additional cues. The diagrams described and
shown in this research were created using Microsoft Visio©. The names used to
describe the shapes are as per that software. Initially the objects used in each layer
are defined. All of the layers are then bought together and are demonstrated using
the thesis case study.
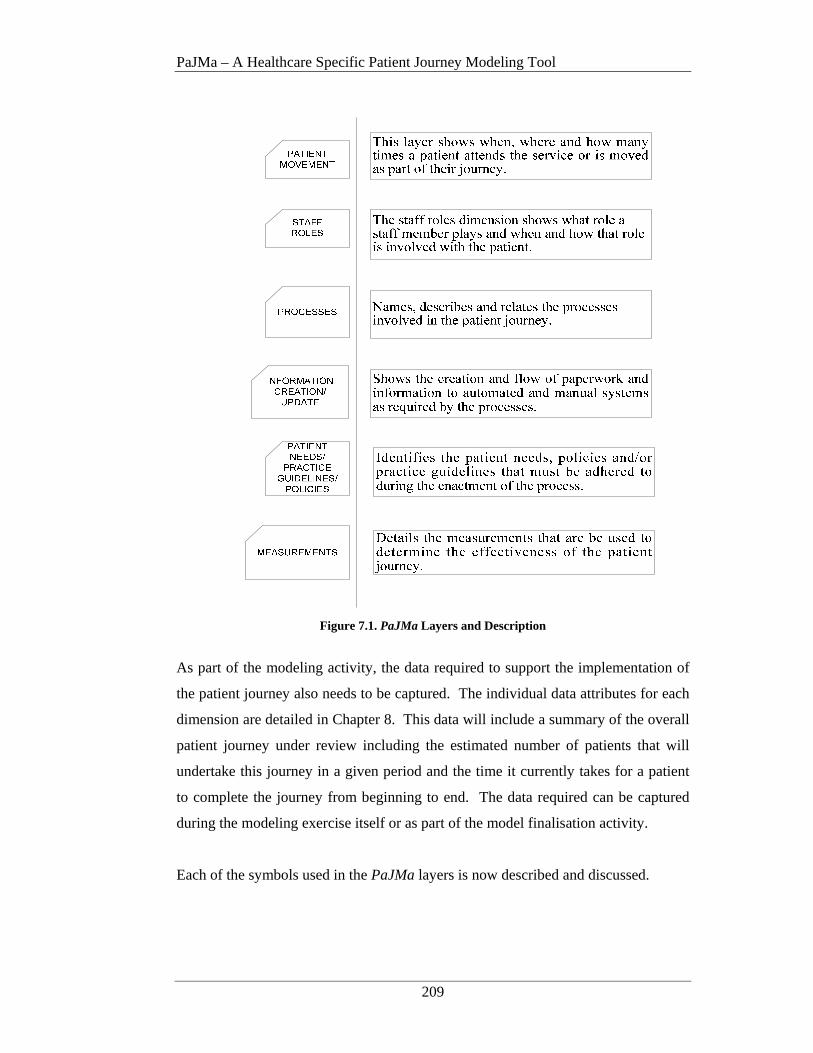
PaJMa – A Healthcare Specific Patient Journey Modeling Tool
209
Figure 7.1. PaJMa Layers and Description
As part of the modeling activity, the data required to support the implementation of
the patient journey also needs to be captured. The individual data attributes for each
dimension are detailed in Chapter 8. This data will include a summary of the overall
patient journey under review including the estimated number of patients that will
undertake this journey in a given period and the time it currently takes for a patient
to complete the journey from beginning to end. The data required can be captured
during the modeling exercise itself or as part of the model finalisation activity.
Each of the symbols used in the PaJMa layers is now described and discussed.
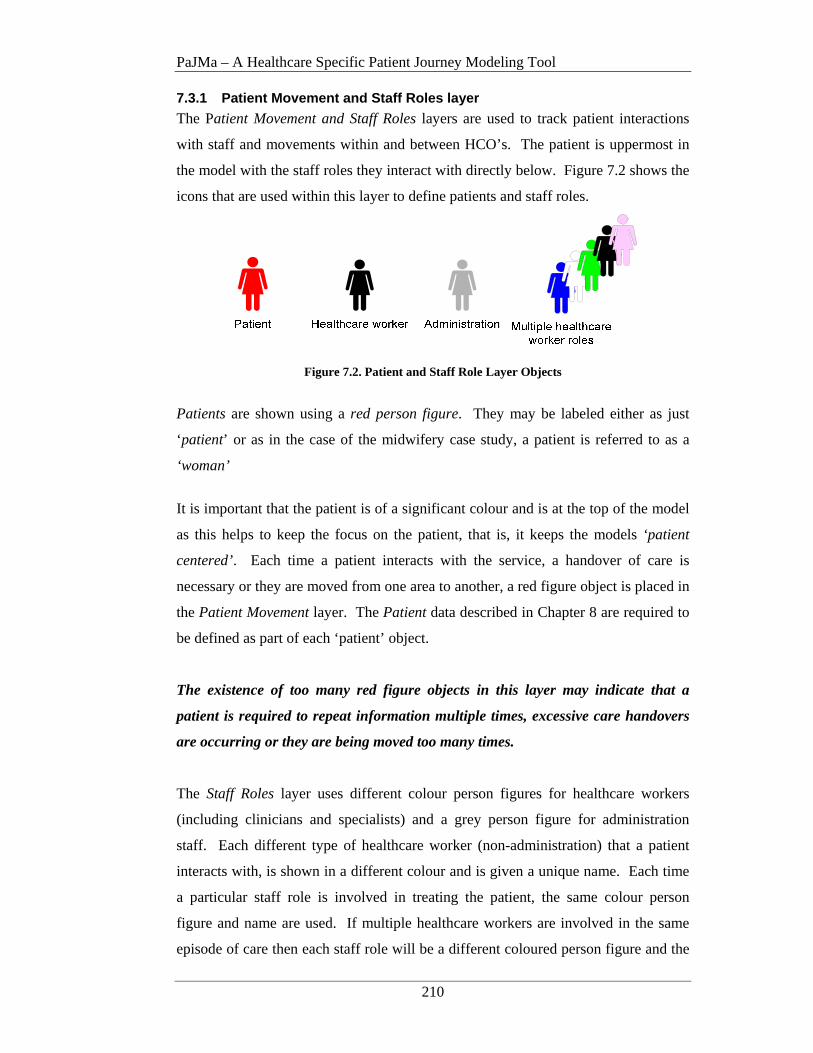
PaJMa – A Healthcare Specific Patient Journey Modeling Tool
210
7.3.1 Patient Movement and Staff Roles layer
The Patient Movement and Staff Roles layers are used to track patient interactions
with staff and movements within and between HCO’s. The patient is uppermost in
the model with the staff roles they interact with directly below. Figure 7.2 shows the
icons that are used within this layer to define patients and staff roles.
Figure 7.2. Patient and Staff Role Layer Objects
Patients are shown using a red person figure. They may be labeled either as just
‘patient’ or as in the case of the midwifery case study, a patient is referred to as a
‘woman’
It is important that the patient is of a significant colour and is at the top of the model
as this helps to keep the focus on the patient, that is, it keeps the models ‘patient
centered’. Each time a patient interacts with the service, a handover of care is
necessary or they are moved from one area to another, a red figure object is placed in
the Patient Movement layer. The Patient data described in Chapter 8 are required to
be defined as part of each ‘patient’ object.
The existence of too many red figure objects in this layer may indicate that a
patient is required to repeat information multiple times, excessive care handovers
are occurring or they are being moved too many times.
The Staff Roles layer uses different colour person figures for healthcare workers
(including clinicians and specialists) and a grey person figure for administration
staff. Each different type of healthcare worker (non-administration) that a patient
interacts with, is shown in a different colour and is given a unique name. Each time
a particular staff role is involved in treating the patient, the same colour person
figure and name are used. If multiple healthcare workers are involved in the same
episode of care then each staff role will be a different coloured person figure and the
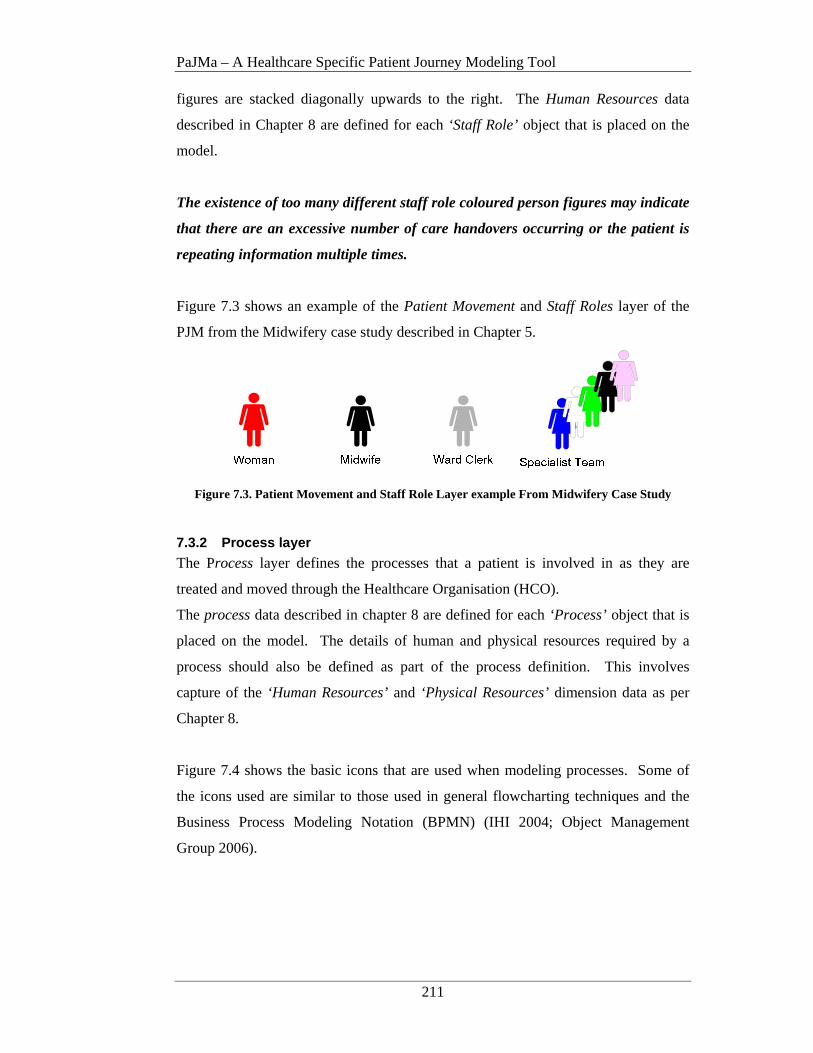
PaJMa – A Healthcare Specific Patient Journey Modeling Tool
211
figures are stacked diagonally upwards to the right. The Human Resources data
described in Chapter 8 are defined for each ‘Staff Role’ object that is placed on the
model.
The existence of too many different staff role coloured person figures may indicate
that there are an excessive number of care handovers occurring or the patient is
repeating information multiple times.
Figure 7.3 shows an example of the Patient Movement and Staff Roles layer of the
PJM from the Midwifery case study described in Chapter 5.
Figure 7.3. Patient Movement and Staff Role Layer example From Midwifery Case Study
7.3.2 Process layer
The Process layer defines the processes that a patient is involved in as they are
treated and moved through the Healthcare Organisation (HCO).
The process data described in chapter 8 are defined for each ‘Process’ object that is
placed on the model. The details of human and physical resources required by a
process should also be defined as part of the process definition. This involves
capture of the ‘Human Resources’ and ‘Physical Resources’ dimension data as per
Chapter 8.
Figure 7.4 shows the basic icons that are used when modeling processes. Some of
the icons used are similar to those used in general flowcharting techniques and the
Business Process Modeling Notation (BPMN) (IHI 2004; Object Management
Group 2006).
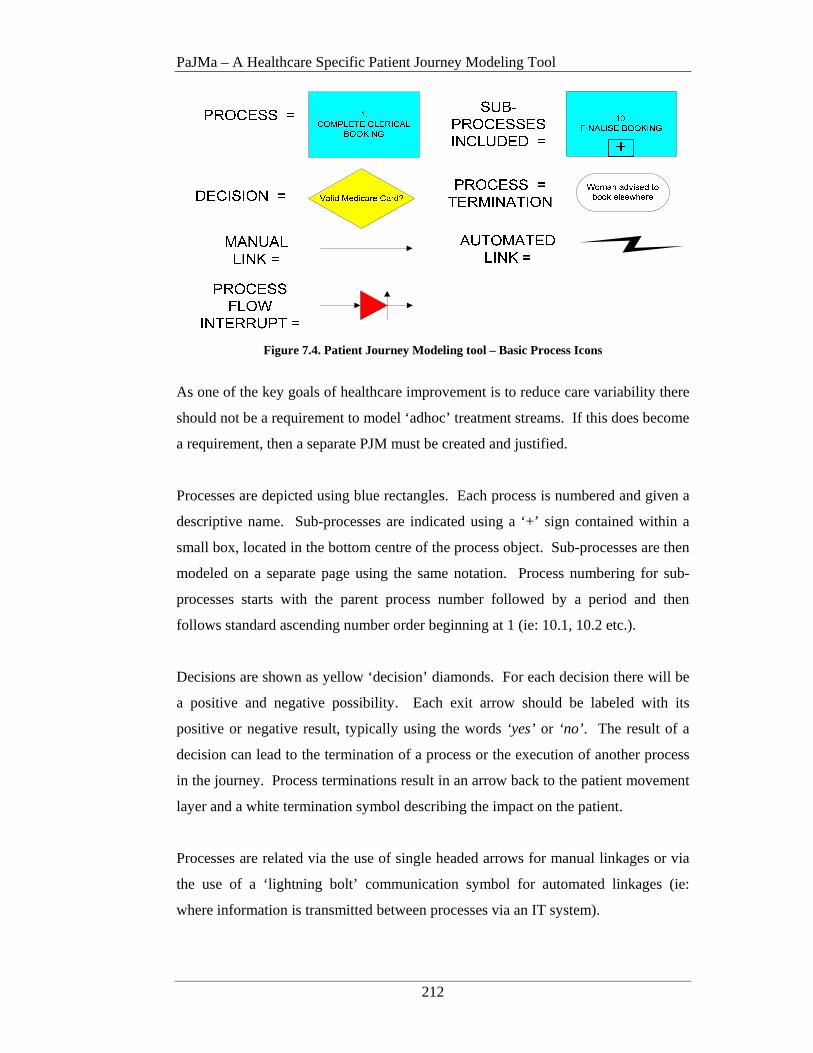
PaJMa – A Healthcare Specific Patient Journey Modeling Tool
212
Figure 7.4. Patient Journey Modeling tool – Basic Process Icons
As one of the key goals of healthcare improvement is to reduce care variability there
should not be a requirement to model ‘adhoc’ treatment streams. If this does become
a requirement, then a separate PJM must be created and justified.
Processes are depicted using blue rectangles. Each process is numbered and given a
descriptive name. Sub-processes are indicated using a ‘+’ sign contained within a
small box, located in the bottom centre of the process object. Sub-processes are then
modeled on a separate page using the same notation. Process numbering for sub-
processes starts with the parent process number followed by a period and then
follows standard ascending number order beginning at 1 (ie: 10.1, 10.2 etc.).
Decisions are shown as yellow ‘decision’ diamonds. For each decision there will be
a positive and negative possibility. Each exit arrow should be labeled with its
positive or negative result, typically using the words ‘yes’ or ‘no’ . The result of a
decision can lead to the termination of a process or the execution of another process
in the journey. Process terminations result in an arrow back to the patient movement
layer and a white termination symbol describing the impact on the patient.
Processes are related via the use of single headed arrows for manual linkages or via
the use of a ‘lightning bolt’ communication symbol for automated linkages (ie:
where information is transmitted between processes via an IT system).
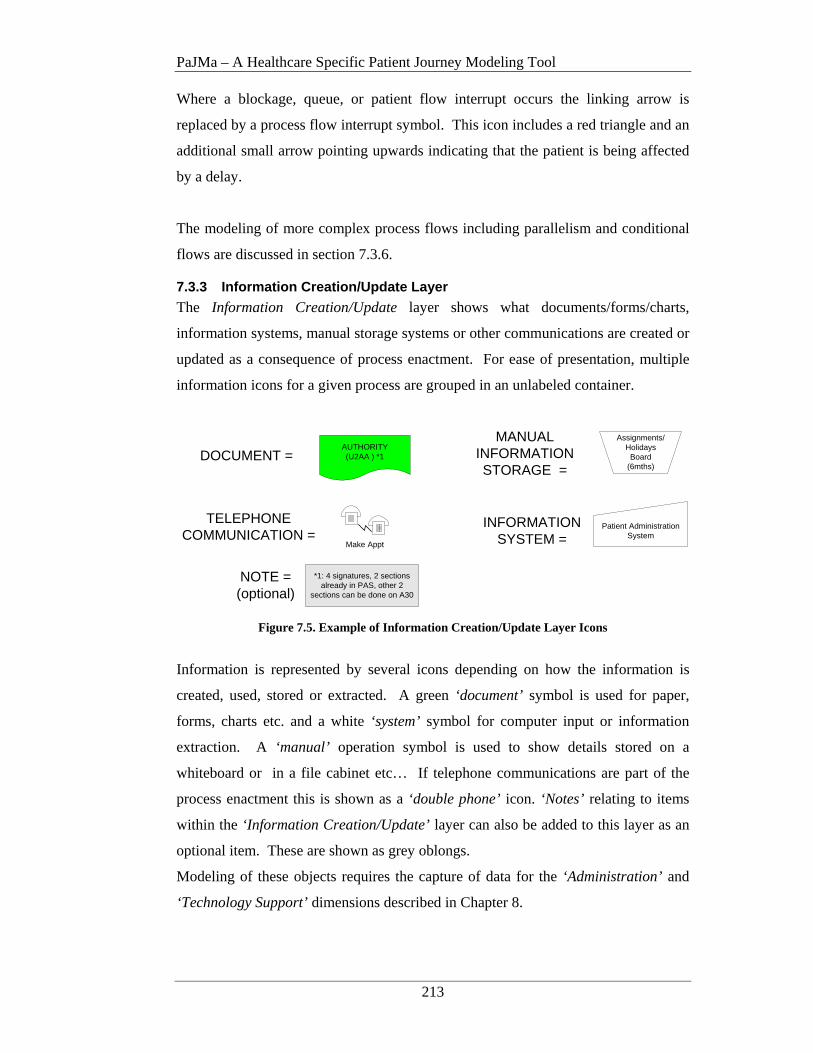
PaJMa – A Healthcare Specific Patient Journey Modeling Tool
213
Where a blockage, queue, or patient flow interrupt occurs the linking arrow is
replaced by a process flow interrupt symbol. This icon includes a red triangle and an
additional small arrow pointing upwards indicating that the patient is being affected
by a delay.
The modeling of more complex process flows including parallelism and conditional
flows are discussed in section 7.3.6.
7.3.3 Information Creation/Update Layer
The Information Creation/Update layer shows what documents/forms/charts,
information systems, manual storage systems or other communications are created or
updated as a consequence of process enactment. For ease of presentation, multiple
information icons for a given process are grouped in an unlabeled container.
NOTE =(optional)
AUTHORITY(U2AA ) *1
Patient Administration System
DOCUMENT =
INFORMATION SYSTEM =
Assignments/Holidays
Board (6mths)
MANUAL INFORMATION STORAGE =
Make Appt
TELEPHONE COMMUNICATION =
*1: 4 signatures, 2 sections already in PAS, other 2
sections can be done on A30
Figure 7.5. Example of Information Creation/Update Layer Icons
Information is represented by several icons depending on how the information is
created, used, stored or extracted. A green ‘document’ symbol is used for paper,
forms, charts etc. and a white ‘system’ symbol for computer input or information
extraction. A ‘manual’ operation symbol is used to show details stored on a
whiteboard or in a file cabinet etc… If telephone communications are part of the
process enactment this is shown as a ‘double phone’ icon. ‘Notes’ relating to items
within the ‘Information Creation/Update’ layer can also be added to this layer as an
optional item. These are shown as grey oblongs.
Modeling of these objects requires the capture of data for the ‘Administration’ and
‘Technology Support’ dimensions described in Chapter 8.
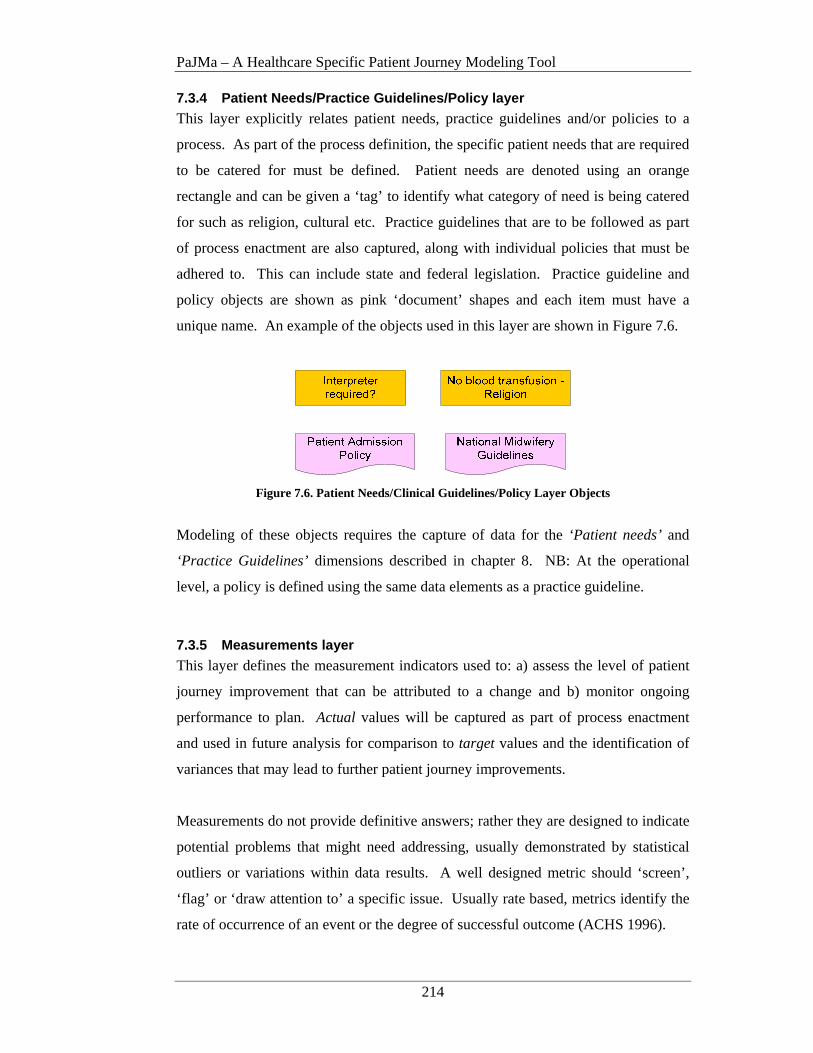
PaJMa – A Healthcare Specific Patient Journey Modeling Tool
214
7.3.4 Patient Needs/Practice Guidelines/Policy layer
This layer explicitly relates patient needs, practice guidelines and/or policies to a
process. As part of the process definition, the specific patient needs that are required
to be catered for must be defined. Patient needs are denoted using an orange
rectangle and can be given a ‘tag’ to identify what category of need is being catered
for such as religion, cultural etc. Practice guidelines that are to be followed as part
of process enactment are also captured, along with individual policies that must be
adhered to. This can include state and federal legislation. Practice guideline and
policy objects are shown as pink ‘document’ shapes and each item must have a
unique name. An example of the objects used in this layer are shown in Figure 7.6.
Figure 7.6. Patient Needs/Clinical Guidelines/Policy Layer Objects
Modeling of these objects requires the capture of data for the ‘Patient needs’ and
‘Practice Guidelines’ dimensions described in chapter 8. NB: At the operational
level, a policy is defined using the same data elements as a practice guideline.
7.3.5 Measurements layer
This layer defines the measurement indicators used to: a) assess the level of patient
journey improvement that can be attributed to a change and b) monitor ongoing
performance to plan. Actual values will be captured as part of process enactment
and used in future analysis for comparison to target values and the identification of
variances that may lead to further patient journey improvements.
Measurements do not provide definitive answers; rather they are designed to indicate
potential problems that might need addressing, usually demonstrated by statistical
outliers or variations within data results. A well designed metric should ‘screen’,
‘flag’ or ‘draw attention to’ a specific issue. Usually rate based, metrics identify the
rate of occurrence of an event or the degree of successful outcome (ACHS 1996).
PaJMa – A Healthcare Specific Patient Journey Modeling Tool
215
Many types of measurements may be applicable for a given patient journey with
clinical indicators being of critical importance.
A clinical indicator is a measure of the clinical management and/or outcome of care.
Clinical Indicators are best seen as measures that screen for a particular event. The
ACHS (2007) states that the aim of clinical indicators is to:
• Increase the involvement of clinicians in evaluation and quality improvement
activities.
• Create and provide useful tools to screen, flag or draw attention to potential
problems and/or areas for improvement in health care.
• Facilitate the collection of national data on the processes and outcomes of
patient care.
The greatest benefit of clinical indicators is derived from their analysis and use at the
clinical level to reduce care variability thus improving clinical unit practices and
patient safety. The ability to effect improvements in patient care will largely depend
on the relevance of the indicators being monitored. To identify those clinical
indicators, which are potentially relevant and appropriate, the following points
should be considered (ACHS 2007):
• Does the indicator measure an important aspect of clinical practice eg
surgical site infection rates or deaths under particular circumstance?
• Will the data collected on this indicator assist in improving clinical care?
• Will the information potentially be useful to clinician’s in demonstrating how
the service is performing and ways that it may be improved?
• Do the indicators relate to and support the strategic intent of an organisation?
• Does the organisation provide the service eg. obstetrics, mental health,
oncology?
• Does the organisation treat patients within these categories eg. patients
presenting with acute myocardial infarction, neonatal transfers to intensive
care?
• Are there sufficient numbers of patients within these categories for
meaningful data to be obtained?
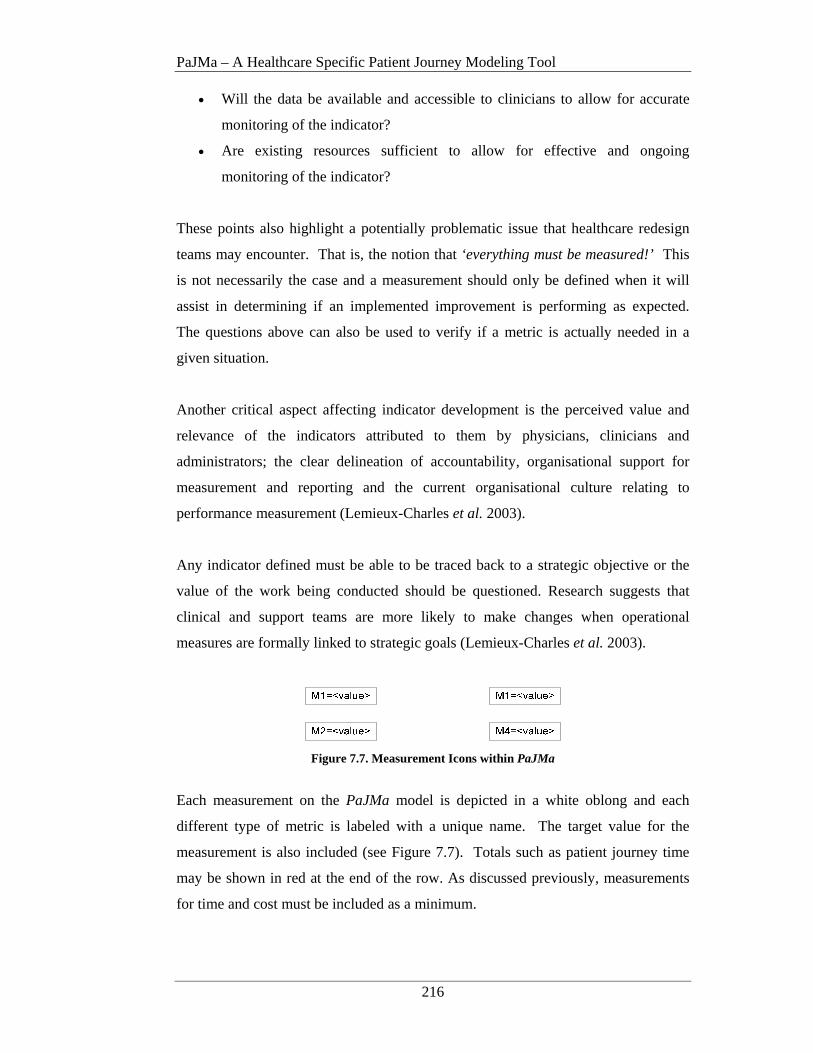
PaJMa – A Healthcare Specific Patient Journey Modeling Tool
216
• Will the data be available and accessible to clinicians to allow for accurate
monitoring of the indicator?
• Are existing resources sufficient to allow for effective and ongoing
monitoring of the indicator?
These points also highlight a potentially problematic issue that healthcare redesign
teams may encounter. That is, the notion that ‘everything must be measured!’ This
is not necessarily the case and a measurement should only be defined when it will
assist in determining if an implemented improvement is performing as expected.
The questions above can also be used to verify if a metric is actually needed in a
given situation.
Another critical aspect affecting indicator development is the perceived value and
relevance of the indicators attributed to them by physicians, clinicians and
administrators; the clear delineation of accountability, organisational support for
measurement and reporting and the current organisational culture relating to
performance measurement (Lemieux-Charles et al. 2003).
Any indicator defined must be able to be traced back to a strategic objective or the
value of the work being conducted should be questioned. Research suggests that
clinical and support teams are more likely to make changes when operational
measures are formally linked to strategic goals (Lemieux-Charles et al. 2003).
Figure 7.7. Measurement Icons within PaJMa
Each measurement on the PaJMa model is depicted in a white oblong and each
different type of metric is labeled with a unique name. The target value for the
measurement is also included (see Figure 7.7). Totals such as patient journey time
may be shown in red at the end of the row. As discussed previously, measurements
for time and cost must be included as a minimum.

PaJMa – A Healthcare Specific Patient Journey Modeling Tool
217
A legend of the basic measurements that would be included on most models is
shown in Table 7.1. Others can be defined by the HCO as needed. During
development of the Future Patient Journey Model it is highly likely that new metrics
will be identified and added to the model. These can be numbered (m1, m2,….mN)
in the first instance and are fully described as part of the Measurement Dimension
data element definition as per Chapter 8.
Key Description Key Decription
tpt Target process time jt Total journey time #pr Number of physical
resources required (*) #hr Number of human
resources required (*) $pr Cost of physical resources $hr Cost of human resources
cr Compliance rate cfl Confidence level
Table 7.1. Example Patient Journey Measurement Types Where multiple items of the same category need to be measured, each is given a
unique number. (*) If only one human or physical resource of a particular type is
required the ‘#hr/pr’ does not need to be shown. If no ‘#’ is shown the number
required is assumed to be one. Where there is more than one human or physical
resource required for a process, the codes for the individual items would be shown as
per the Table below.
Measurement Code
Description Cost
Hr1 Human resource role 1
$15.00/hour
Hr2 Human resource role 2
$30.00/hour
Hr3 Human resource role 3
$40.00/hour
Pr1 Physical resource type 1
$48.00/day
Pr2 Physical resource type 2
$0.20/page
Table 7.2. Unique Identifiers for Measurements within the Same Category Measurement examples from the Primary Care Midwifery case study are shown in
Figure 7.8 and Figure 7.9.
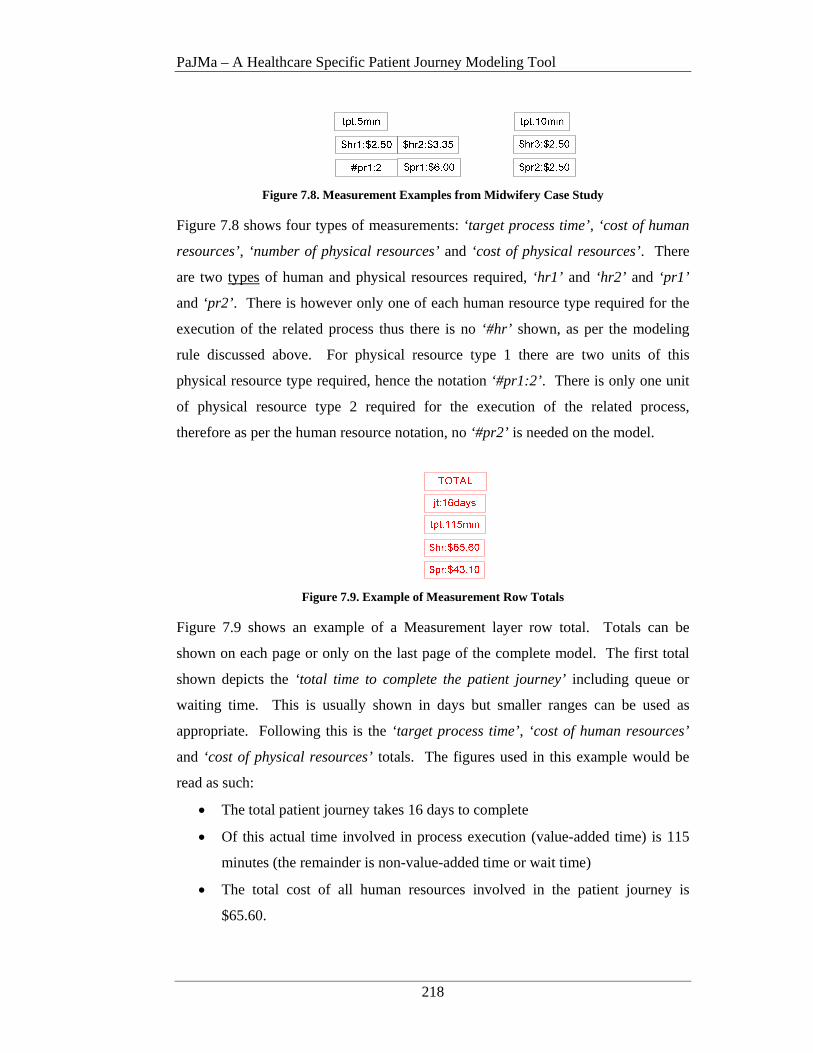
PaJMa – A Healthcare Specific Patient Journey Modeling Tool
218
Figure 7.8. Measurement Examples from Midwifery Case Study
Figure 7.8 shows four types of measurements: ‘target process time’, ‘cost of human
resources’, ‘number of physical resources’ and ‘cost of physical resources’. There
are two types of human and physical resources required, ‘hr1’ and ‘hr2’ and ‘pr1’
and ‘pr2’ . There is however only one of each human resource type required for the
execution of the related process thus there is no ‘#hr’ shown, as per the modeling
rule discussed above. For physical resource type 1 there are two units of this
physical resource type required, hence the notation ‘#pr1:2’ . There is only one unit
of physical resource type 2 required for the execution of the related process,
therefore as per the human resource notation, no ‘#pr2’ is needed on the model.
Figure 7.9. Example of Measurement Row Totals
Figure 7.9 shows an example of a Measurement layer row total. Totals can be
shown on each page or only on the last page of the complete model. The first total
shown depicts the ‘total time to complete the patient journey’ including queue or
waiting time. This is usually shown in days but smaller ranges can be used as
appropriate. Following this is the ‘target process time’, ‘cost of human resources’
and ‘cost of physical resources’ totals. The figures used in this example would be
read as such:
• The total patient journey takes 16 days to complete
• Of this actual time involved in process execution (value-added time) is 115
minutes (the remainder is non-value-added time or wait time)
• The total cost of all human resources involved in the patient journey is
$65.60.
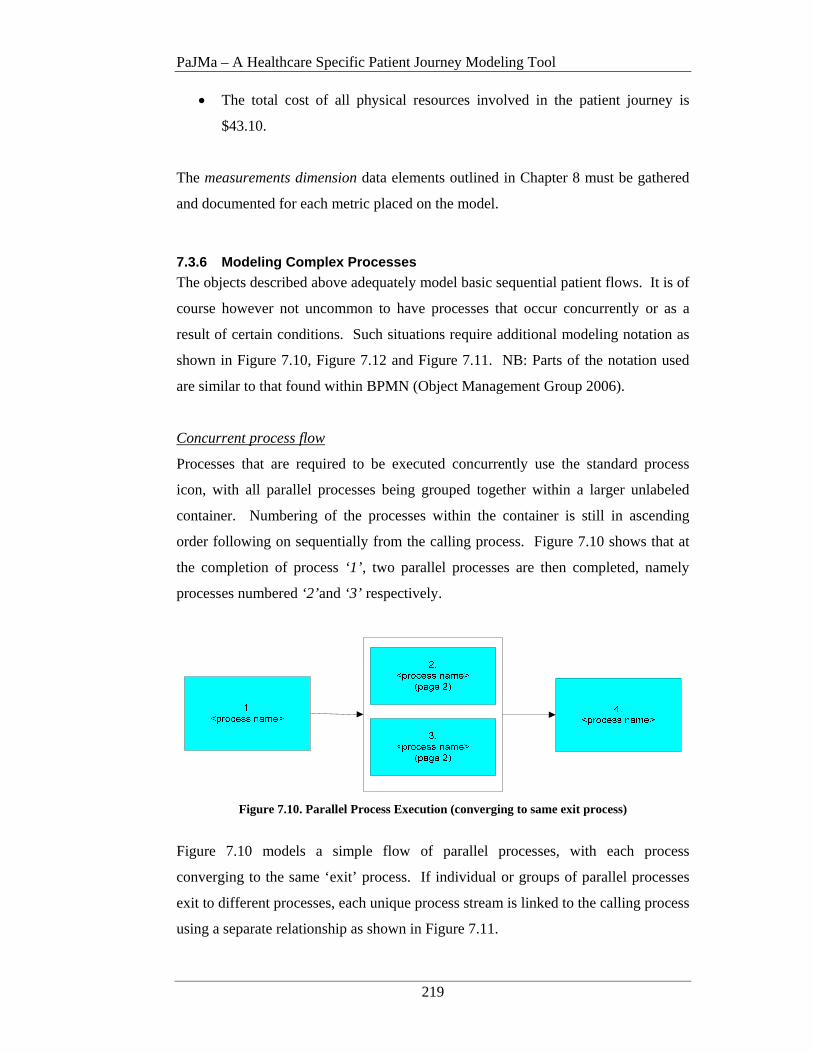
PaJMa – A Healthcare Specific Patient Journey Modeling Tool
219
• The total cost of all physical resources involved in the patient journey is
$43.10.
The measurements dimension data elements outlined in Chapter 8 must be gathered
and documented for each metric placed on the model.
7.3.6 Modeling Complex Processes
The objects described above adequately model basic sequential patient flows. It is of
course however not uncommon to have processes that occur concurrently or as a
result of certain conditions. Such situations require additional modeling notation as
shown in Figure 7.10, Figure 7.12 and Figure 7.11. NB: Parts of the notation used
are similar to that found within BPMN (Object Management Group 2006).
Concurrent process flow
Processes that are required to be executed concurrently use the standard process
icon, with all parallel processes being grouped together within a larger unlabeled
container. Numbering of the processes within the container is still in ascending
order following on sequentially from the calling process. Figure 7.10 shows that at
the completion of process ‘1’ , two parallel processes are then completed, namely
processes numbered ‘2’ and ‘3’ respectively.
Figure 7.10. Parallel Process Execution (converging to same exit process)
Figure 7.10 models a simple flow of parallel processes, with each process
converging to the same ‘exit’ process. If individual or groups of parallel processes
exit to different processes, each unique process stream is linked to the calling process
using a separate relationship as shown in Figure 7.11.

PaJMa – A Healthcare Specific Patient Journey Modeling Tool
220
Figure 7.11. Parallel Process Execution (different exit processes)
In this scenario, at the completion of process ‘1’ , three parallel processes, namely
process ‘2’, ‘3’ and ‘4’ need to be completed. However not all of these parallel
processes exit to the same process. Process ‘2’ leads to process ‘5’ , with processes
‘3’ and ‘4’ converging to process ‘6’ . Thus each patient flow (or stream) is linked to
the calling process by a separate arrow. A separate page is used to model each
‘stream’ of parallel processes. For example, process ‘2’ (stream a) will be modeled
on page 2, but processes ‘3’ and ‘4’ (stream b) will both be modeled on page 3. If at
some point these individual streams converge back to the same flow, they will be
related back to the calling page number.
Modeling of parallel processes is done on a new page, separate to the ‘parent’ or
‘calling’ page, using the standard six layers (as in Figure 7.1). The related page
number (sequential) is shown beneath the process name. Multiple parallel processes
can be shown on the same (but separate) page/screen with each vertical slice, relating
to an individual process, being delineated from another using a vertical bold black
line. Figure 7.12 demonstrates the modelling and page separation for the parallel
process structure from Figure 7.10. A cross reference back to the calling page/screen
is included below each parallel process name.

PaJMa – A Healthcare Specific Patient Journey Modeling Tool
221
Figure 7.12. Parallel Process Model Definition Delineated with a Vertical Bold Black Line
Conditional process flow
Modeling of conditional flows uses a similar modeling notation to that above but
with the addition of a conditional decision point. This scenario is shown in Figure
7.13. An arrow exits the ‘calling’ process and is attached to a conditional decision
icon. Each branch leading from the decision icon indicates the execution of a
particular process or set of processes based on the meeting of certain conditions. If
no specific conditions are met then the ‘default’ process is completed. A ‘default’
condition is indicated using a diagonal line across the appropriate branch at the end
nearest the decision point. Conditional branches can lead to the execution of single
sequential processes or groups of parallel processes. The completion of each
condition may result in all possible options converging to the same or different exit
processes.
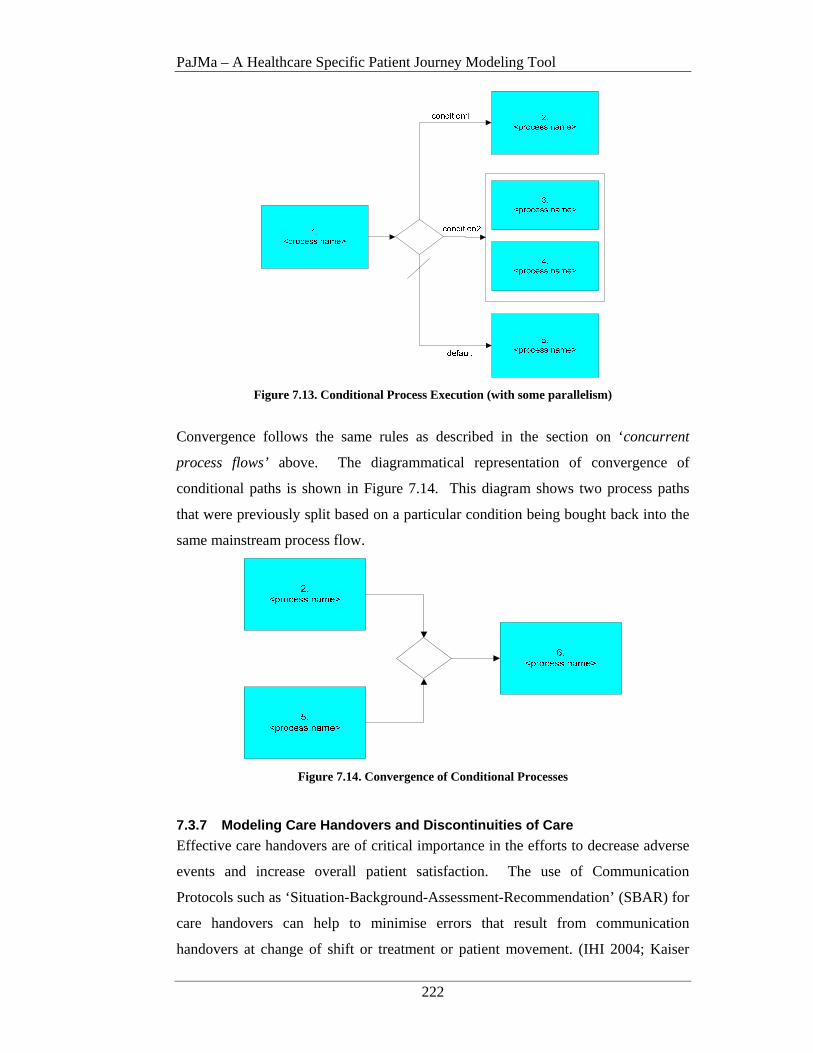
PaJMa – A Healthcare Specific Patient Journey Modeling Tool
222
Figure 7.13. Conditional Process Execution (with some parallelism)
Convergence follows the same rules as described in the section on ‘concurrent
process flows’ above. The diagrammatical representation of convergence of
conditional paths is shown in Figure 7.14. This diagram shows two process paths
that were previously split based on a particular condition being bought back into the
same mainstream process flow.
Figure 7.14. Convergence of Conditional Processes
7.3.7 Modeling Care Handovers and Discontinuities of Care
Effective care handovers are of critical importance in the efforts to decrease adverse
events and increase overall patient satisfaction. The use of Communication
Protocols such as ‘Situation-Background-Assessment-Recommendation’ (SBAR) for
care handovers can help to minimise errors that result from communication
handovers at change of shift or treatment or patient movement. (IHI 2004; Kaiser
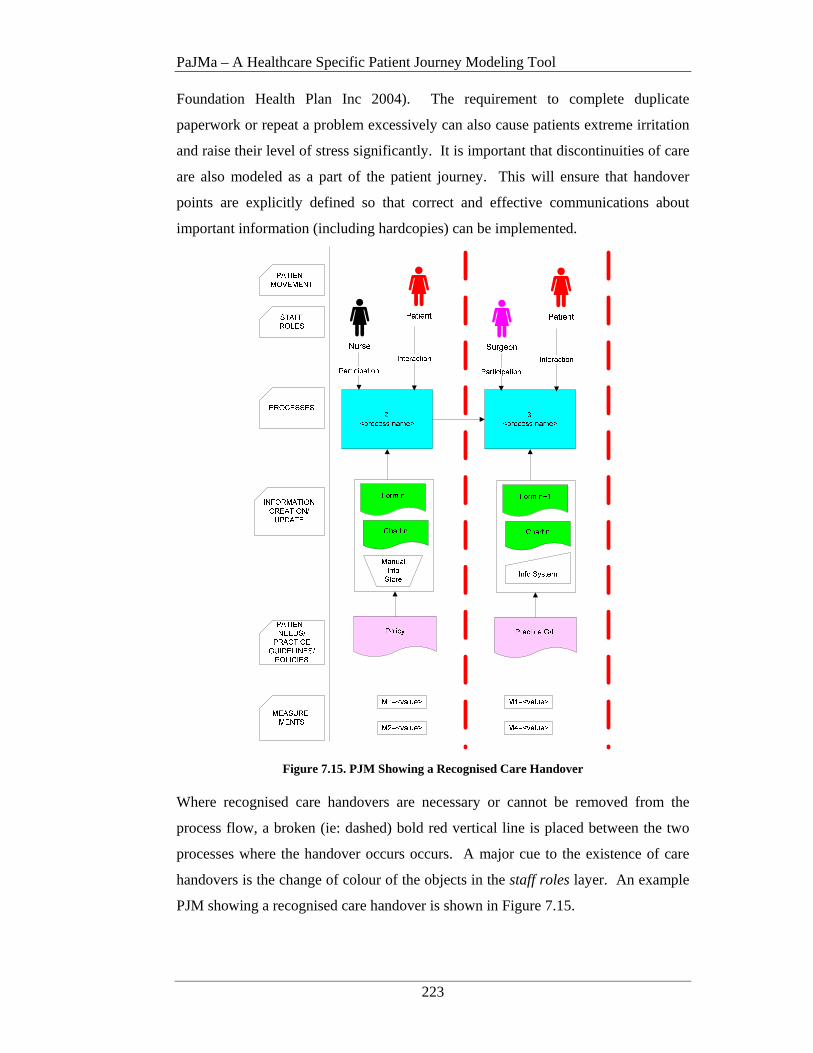
PaJMa – A Healthcare Specific Patient Journey Modeling Tool
223
Foundation Health Plan Inc 2004). The requirement to complete duplicate
paperwork or repeat a problem excessively can also cause patients extreme irritation
and raise their level of stress significantly. It is important that discontinuities of care
are also modeled as a part of the patient journey. This will ensure that handover
points are explicitly defined so that correct and effective communications about
important information (including hardcopies) can be implemented.
Figure 7.15. PJM Showing a Recognised Care Handover
Where recognised care handovers are necessary or cannot be removed from the
process flow, a broken (ie: dashed) bold red vertical line is placed between the two
processes where the handover occurs occurs. A major cue to the existence of care
handovers is the change of colour of the objects in the staff roles layer. An example
PJM showing a recognised care handover is shown in Figure 7.15.
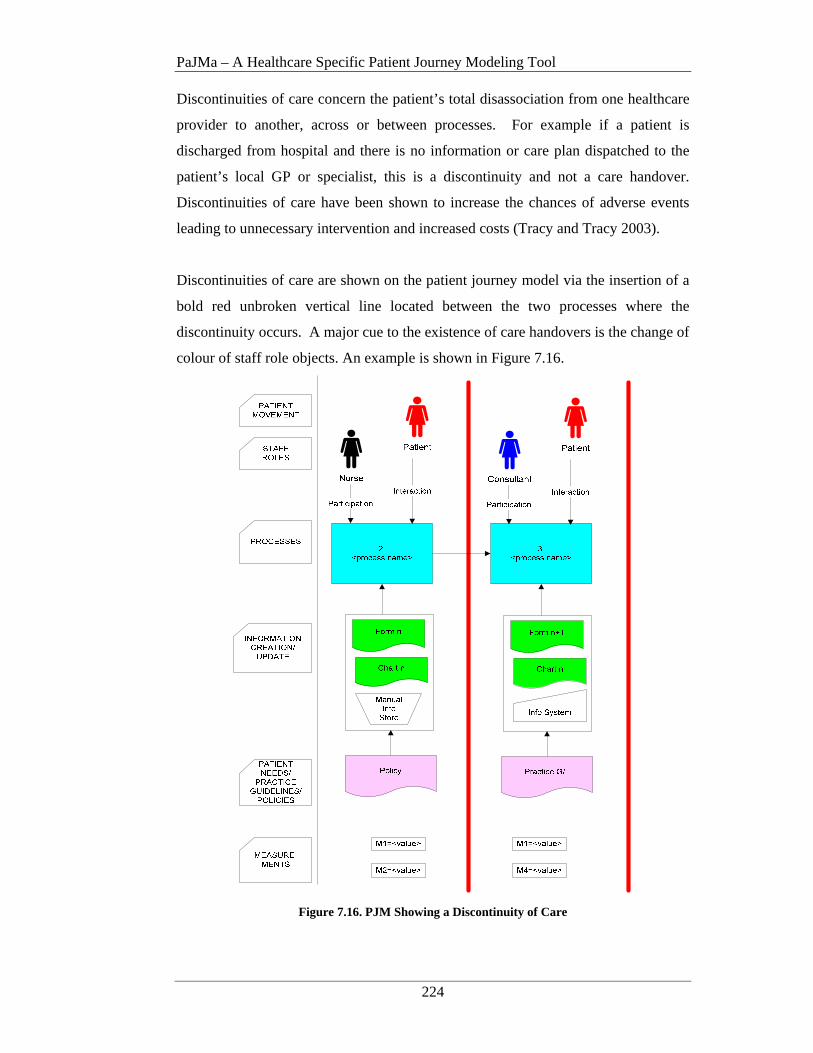
PaJMa – A Healthcare Specific Patient Journey Modeling Tool
224
Discontinuities of care concern the patient’s total disassociation from one healthcare
provider to another, across or between processes. For example if a patient is
discharged from hospital and there is no information or care plan dispatched to the
patient’s local GP or specialist, this is a discontinuity and not a care handover.
Discontinuities of care have been shown to increase the chances of adverse events
leading to unnecessary intervention and increased costs (Tracy and Tracy 2003).
Discontinuities of care are shown on the patient journey model via the insertion of a
bold red unbroken vertical line located between the two processes where the
discontinuity occurs. A major cue to the existence of care handovers is the change of
colour of staff role objects. An example is shown in Figure 7.16.
Figure 7.16. PJM Showing a Discontinuity of Care
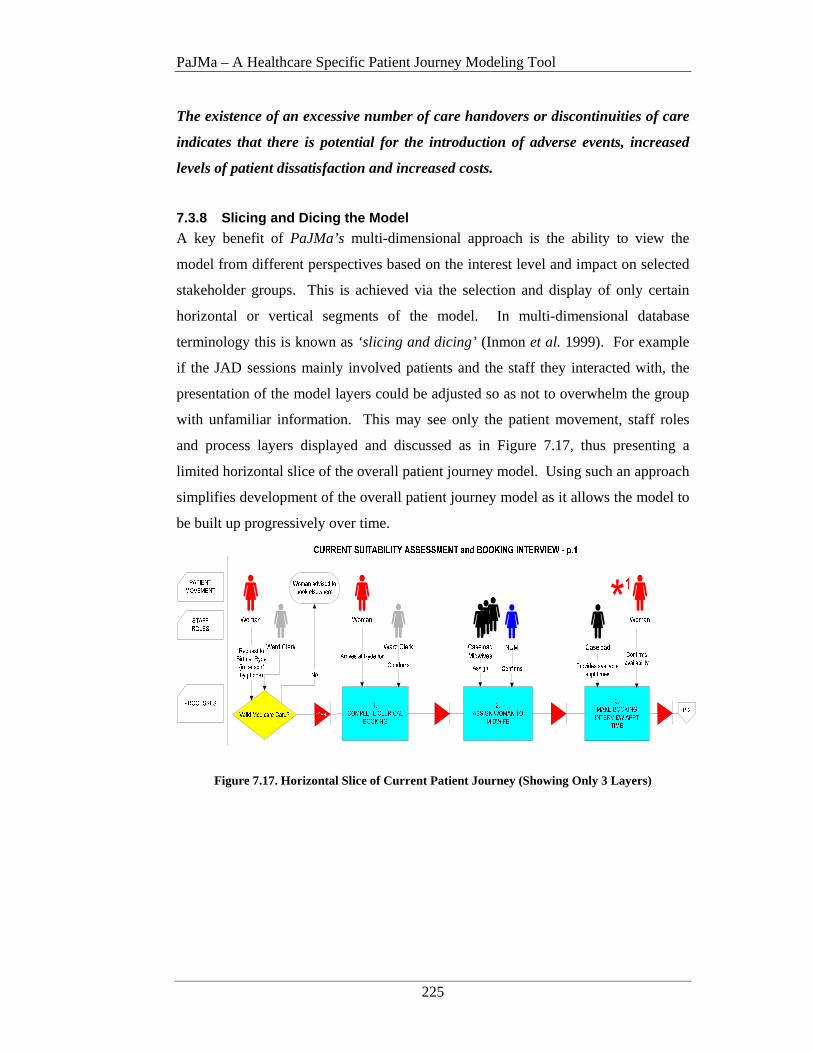
PaJMa – A Healthcare Specific Patient Journey Modeling Tool
225
The existence of an excessive number of care handovers or discontinuities of care
indicates that there is potential for the introduction of adverse events, increased
levels of patient dissatisfaction and increased costs.
7.3.8 Slicing and Dicing the Model
A key benefit of PaJMa’s multi-dimensional approach is the ability to view the
model from different perspectives based on the interest level and impact on selected
stakeholder groups. This is achieved via the selection and display of only certain
horizontal or vertical segments of the model. In multi-dimensional database
terminology this is known as ‘slicing and dicing’ (Inmon et al. 1999). For example
if the JAD sessions mainly involved patients and the staff they interacted with, the
presentation of the model layers could be adjusted so as not to overwhelm the group
with unfamiliar information. This may see only the patient movement, staff roles
and process layers displayed and discussed as in Figure 7.17, thus presenting a
limited horizontal slice of the overall patient journey model. Using such an approach
simplifies development of the overall patient journey model as it allows the model to
be built up progressively over time.
Figure 7.17. Horizontal Slice of Current Patient Journey (Showing Only 3 Layers)
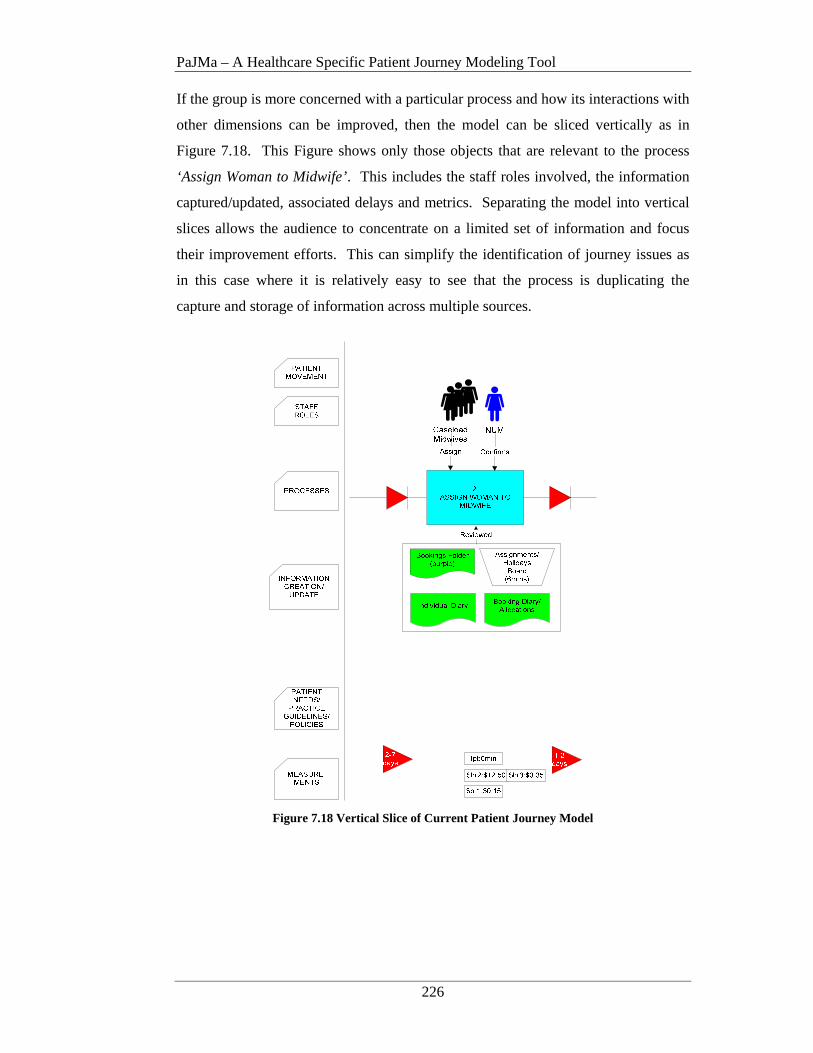
PaJMa – A Healthcare Specific Patient Journey Modeling Tool
226
If the group is more concerned with a particular process and how its interactions with
other dimensions can be improved, then the model can be sliced vertically as in
Figure 7.18. This Figure shows only those objects that are relevant to the process
‘Assign Woman to Midwife’. This includes the staff roles involved, the information
captured/updated, associated delays and metrics. Separating the model into vertical
slices allows the audience to concentrate on a limited set of information and focus
their improvement efforts. This can simplify the identification of journey issues as
in this case where it is relatively easy to see that the process is duplicating the
capture and storage of information across multiple sources.
Figure 7.18 Vertical Slice of Current Patient Journey Model
PaJMa – A Healthcare Specific Patient Journey Modeling Tool
227
7.4 Application of PaJMa to the Case Study
The use of PaJMa is now demonstrated via the Case Study environment as described
in Chapter 5. The case study example details the first stage of a woman’s interaction
with the primary care midwifery service at Ryde hospital. The general workflow for
determining if a woman is a candidate for the Ryde Midwifery Group Practice
(RMGP) model is currently manual (Australian College of Midwives 2004; Tracy
2004).
Patient Journey Model development was conducted via facilitated group sessions
with the caseload midwives and the maternity management team during the audit
process of the Ryde Midwifery Group Practice (Tracy and Hartz 2005). Patient
input was in the form of patient satisfaction surveys. Participation in this study by
the midwives was totally voluntary and approximately 16 staff participated in the
sessions. The sessions discussed the current processes being used and looked to
streamlining the patient’s journey by identifying bottlenecks, inefficient use of
resources, potential and actual communication breakdowns and unnecessary
paperwork. Metrics relating to suggested process improvements were also
investigated and documented for on-going measurement and assessment.
The facilitated group sessions occurred on-site at Ryde Hospital once a week for 5
weeks alongside a mandatory audit process. Documentation of the findings and
results relating to the current and improved processes were collated and documented
off-site at the University of Western Sydney in between group sessions. Ethics
approval for theses sessions was obtained from the Northern Sydney Health Human
Research Ethics Committee (protocol no. 0608-128M). Project outcomes were
presented to the Midwifery team, Hospital management and the Associate Professor
of Midwifery who led the initial evaluation process of the Ryde Midwifery Group
Practice at Northern Sydney and Central Coast Area Health Service (NSCCAHS)
(Tracy and Hartz 2005).
Specific outcomes included:
• The first accurate model of the current journey of a woman through the Ryde
Midwifery Group Practice (RMGP);

PaJMa – A Healthcare Specific Patient Journey Modeling Tool
228
• A suggested new model describing how the patient flow could be improved;
• A suggested plan of action for implementation of the highlighted
improvements;
• Increased awareness, for the involved participants, of the techniques that can
be used to redesign patient-centric healthcare processes;
• Dissemination of project experiences and results through publication in
leading Health Informatics forums.
7.4.1 Project Startup
As part of the project startup activity, the Healthcare Provider Strategy was
reviewed. Strategic objectives relevant to the patient journey under review were
extracted and the Balanced Scorecards perspectives and measures confirmed. As
part of the Healthcare Improvement project, targets to be met and initiatives to meet
the set targets, were defined. If not all of this information is available, the omitted
information must be created and confirmed with Executive, as discussed in Chapter
4, prior to development of the patient journey model.
Once the project team understood what goals, measures, targets and initiatives were
required, a high level Context Diagram, as used in Constantine and Yourdon’s Data
Flow Diagramming technique, (1979) was constructed. A Context Diagram is a high
level view of the required system. It shows the system as a whole, along with the
interactions to and from these external entities. Context diagrams are used as an aid
to gain consensus on the scope of the patient journey modeling exercise and what
stakeholders should be involved. Figure 7.19 shows the basic notation used in the
development of the context diagram.

PaJMa – A Healthcare Specific Patient Journey Modeling Tool
229
Figure 7.19. Basic Context Diagram Notation
(Constantine and Yourdon 1979)
The Context Diagram starts with a central named bubble, representing the ‘system’
to be developed. External entities that will interact with the new ‘system’ are drawn
as named boxes but outside the ‘system’ bubble. Directional interaction lines
connect the ‘system’ to the external entities. Labeling of the interaction lines is
optional (Constantine and Yourdon 1979).
The context diagram showing the scope and external entities involved in the case
study patient journey modeling activity is shown in Figure 7.20.
Figure 7.20. Context Diagram Showing Scope of Patient Journey Modeling Activity
PaJMa – A Healthcare Specific Patient Journey Modeling Tool
230
As part of the scoping exercise, discussion on patient volumes, involved in the
journey under review, are required. It is not unusual that patient traffic will vary
over parts of the week or month, creating peaks and troughs in resource usage. This
is known as patient variation or variation in patient flow levels (Litvak et al. 2005;
Jensen et al. 2006). Although it is accepted that patients will arrive in no known
pattern, patient flow is more about looking at how ‘internal organisational jams’ or
‘artificial variation’ can be eliminated. A good example of artificial variation is
given in ‘Leadership for Smooth Patient Flow’ (Jensen et al. 2006):
A cardiac surgeon schedules all of his heart surgeries on Tuesdays and
Thursdays, usually about 8 cases per day. On each of these days the staff who
care for these patients in the ICU post-operatively, are in chaos. This has two
key effects: a) the cardiac patients may not get the maximum attention they
require and b) other surgical cases requiring ICU care are cancelled or diverted
to other facilities. This happens week in and week out but is treated as a crisis
each time. Following the ‘peak’ in cardiac patient care, ICU staff are sometimes
under-utilised thus creating a ‘trough’ in resource usage.
However if the cardiac surgeon scheduled the same volume of surgeries over
four days the surgical flow would be ‘smoothed’ and the ICU staff and resources
consistently employed. This would allow more time per patient and leave space
for other surgical cases that arrive. This not only smooths the flow of patients
but reduces the stress on the staff caring for them.
Research in methods for ‘smoothing’ variation in patient traffic is gaining
momentum with key work in statistical analysis techniques being conducted by
Litvak et al. (2005; 2005) and the Institute of Healthcare Improvement (IHI 2003;
2007). A number of the techniques being researched are from other service
industries and include: Forecasting, Demand-capacity Management, Queuing Theory
and the Theory of Constraints (Jensen et al. 2006).
Artificial variation, is a related but separate activity to Patient Journey redesign and
should be addressed prior to development of the Patient Journey Models. As
discussed in Chapter 1, statistical analysis of patient traffic is outside the scope of
this research but it is vital that the redesign team deal with such issues as part of the
overall Improvement project.

PaJMa – A Healthcare Specific Patient Journey Modeling Tool
231
Once the scope of the patient journey modeling activity is agreed by all stakeholders,
development of the current patient journey model can commence.
7.4.2 The Current Patient Journey
Figure 7.21, Figure 7.22 and Figure 7.23 show an example of the PaJMa tool in
action. These figures detail the Ryde Midwifery Group Practice (RMGP) patient
journey from the point of first contact by the woman up to the finalisation of the
booking interview between a named midwife and an allocated woman. The
‘current’ model represents the patient journey as it existed at the commencement of
the Ryde Audit project. The list describing the measurements types used in the
model is shown in Table 7.3.
Key Description Key Decription
tpt Target process time hr Human resource
pr Physical Resource jt Total journey Time
Table 7.3. Case Study Measurement Types
The legend for specific measurement items, by code, is contained in the table below.
Measurement Code
Description Cost
hr1 Ward clerk $15.00/hour
hr2 Midwife $30.00/hour
hr3 NUM $40.00/hour
pr1 Std Office w/PC $48.00/day
pr2 Phone call $0.20/call
pr3 Exam room $72.00/day
Table 7.4. Case Study Measurement Codes and Staff Roles

PaJMa – A Healthcare Specific Patient Journey Modeling Tool
232
7.4.2.1 PaJMa Current Patient Journey
Figure 7.21. RMGP Current Patient Journey Model - p.1
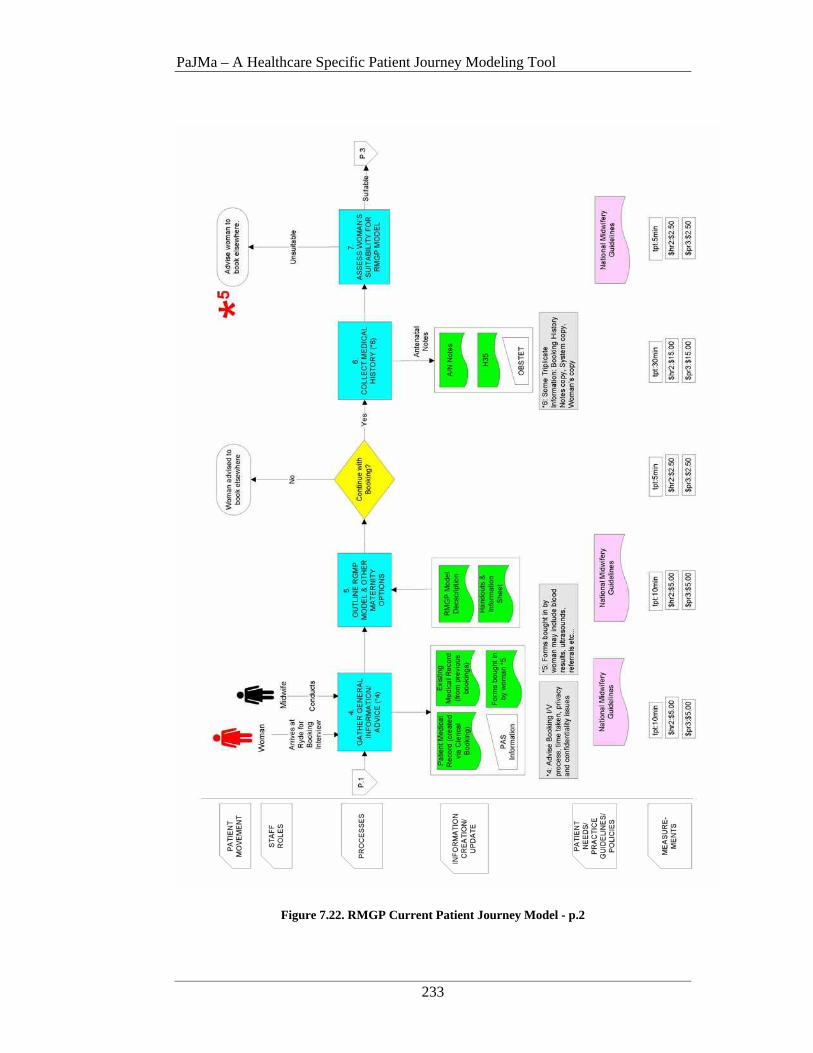
PaJMa – A Healthcare Specific Patient Journey Modeling Tool
233
Figure 7.22. RMGP Current Patient Journey Model - p.2

PaJMa – A Healthcare Specific Patient Journey Modeling Tool
234
Figure 7.23. RMGP Current Patient Journey Model - p.3
PaJMa – A Healthcare Specific Patient Journey Modeling Tool
235
Model Description The diagrams show several contributing dimensions as outlined in chapter 6. In
general the model is read top-down from left to right. The model can also be read as
a number of related vertical slices or it can be sliced and diced horizontally to
highlight combinations of different parts of a patient’s journey, for example, how
many different types of staff, a patient has to interact with.
The following is a brief outline of how the model is read. In descriptive terms it is
like role-playing a patient’s experience whilst they are within a service. Starting
with the patient, the reader moves vertically down the page, progressively building
up the relationships between the layers. Once a vertical ‘slice’ is understood, the
reader moves onto the next vertical slice, with consideration of how the current
process is linked to its predecessor.
The reading of the current patient journey model of the Ryde Midwifery Group
Practice (RMGP) depicted on the previous three pages is as follows:
• A woman phones or attends Maternity to gather information about birthing at
Ryde
Process 1:
If she wishes to proceed and has a valid Medicare card, an appointment is made
for a clerical booking. If the woman has come into Maternity and the ward clerk
is available at the time, the clerical booking can be done straight away. If not the
woman must come in at another time. This may lead to a delay of up to 2 days
depending on the ward clerk’s next available appointment time (and the woman’s
availability). The clerical booking involves completion of three (3) forms and
creation of a Patient Administration System (PAS) record.
Notes on the PJM highlight that the clerical booking uses 3 forms that are in the
main unsuitable to patients entering the RMGP model. The U2AA requires 4
signatures, 2 sections are already in PAS and 2 other sections can be done on
form A30. The Inpatient Election form requires 2 signatures, 1 section is not
used and other information is already in the Patient Administration System
(PAS). The MRN sheet requires 2 signatures, 6 sections are not used and the
wording is not suitable for a RMGP patient.
PaJMa – A Healthcare Specific Patient Journey Modeling Tool
236
The clerical booking follows the ‘NSCCAH Policy for Patient Admission’. The
process takes 20 minutes and requires one Ward Clerk @ $15.00/hour and the
use of a standard office with PC @ $40.00/hour.
Process 2:
At the next Allocation Meeting, held each Wednesday, the caseload midwives
review the paperwork from the clerical bookings to determine which dedicated
midwife a woman is to be allocated to. The Nurse Unit Manager (NUM) verifies
the allocations and makes adjustments if necessary. The allocation information
is written in 4 places. A whiteboard showing details of each caseload midwife’s
current allocations and expected absences, the Bookings Book (black) kept on
the ward, Bookings Folder (purple) kept in the clinic and the allocated midwife’s
personal diary. This process takes 5 minutes to complete for each woman and
requires the use of two types of human resources namely 5 midwives and 1
NUM. A standard office space is also required. The total Human and Physical
Resource cost per allocation is $15.85 and $0.15 respectively.
Process 3:
The dedicated midwife rings her allocated woman to make a Booking Interview
Appointment. The appointment time is recorded in the midwife’s personal diary,
the Clinic Diary and the Bookings Folder (purple). This process takes 5 minutes
to complete for each woman and requires a telephone and standard office space.
Process 3 costs $2.50 and $0.30 in Human and Physical Resources. NB: (The
remaining processes are all completed by the woman’s dedicated midwife and
require the use of an examination room).
Process 4:
The woman arrives at Ryde for the Booking Interview with her dedicated
midwife. The woman gives/receives general information and advice about her
pregnancy. Any existing pathology or ultrasounds are also reviewed and the
woman’s PAS record details confirmed. The process follows the National
Midwifery Guidelines, takes 10 minutes to complete and costs a total of $10.00
per Booking Interview.
PaJMa – A Healthcare Specific Patient Journey Modeling Tool
237
Process 5:
The RMGP model is outlined and various care options discussed. This includes
providing the woman with relevant literature and available handouts. The process
follows the National Midwifery Guidelines and takes 10 minutes to complete at a
cost of $10.00.
• The woman is asked if she understands the scope of the services offered and
if she wishes to continue with the booking. If she does not wish to continue
she is advised to book elsewhere and the journey terminates.
Process 6:
Continuation requires the collection and recording of a full medical history. This
information is collected and entered into OBSTET, details are added to a H35
and the woman’s antenatal notes. The process takes 30 minutes to complete at a
total cost of $20.00.
Process 7:
Following collection of a full medical history, the woman’s suitability for the
RMGP model is assessed. The process follows the National Midwifery
Guidelines and takes 5 minutes to complete. Process cost is $5.00. If the woman
is unsuitable she is advised to book elsewhere and the journey terminates.
Process 8:
If the woman is suitable, referrals for pathology, Nuchal Translucency Screening
or dating ultrasounds are now prepared (if needed). The process takes 5 minutes
and costs $5.00.
• The midwife now decides if a Domestic Violence screening can be conducted
at this visit. Under the Domestic Violence (DV) policy, a woman can only be
screened if she is alone (children under 3/interpreter permitted) If the
woman’s is not alone or her partner gets upset when asked to leave the room
the midwife may decide to postpone the screening until the next visit and
annotates the antenatal notes accordingly.

PaJMa – A Healthcare Specific Patient Journey Modeling Tool
238
Process 9:
If a DV screening is completed details are recorded in the antenatal notes and on
the relevant DV forms. An Area Statistics Policy also applies to aspects of the
DV Screening data. This process takes 3 minutes to complete at a cost of $3.00.
Process 10:
A physical exam of the woman is conducted. This includes blood pressure
readings, fundal height palpitation and breast examination. The timings for
pregnancy progress and antenatal visits are outlined. This follows the National
Midwifery Guidelines, takes 5 minutes and costs $5.00.
Process 11:
Finalising the booking involves a number of sub-processes.
o Making the next antenatal appointment, recording the appointment on
the woman’s yellow card, adding the appointment to the clinic diary
and the midwife’s personal diary. Contact information is also added
to the woman’s Yellow Card at this time.
o Completing and printing OBSTET input.
o Collating the clerical notes, H35 and any previous medical record
details to create an antenatal notes file. Placing a sticker on the notes
and filing them.
The combination of sub-processes takes 10 minutes to complete and costs
$10.00.
The total value added time is 115 minutes but elapsed time may extend to 16 days
depending on when the woman attends the service and if staff are available. The
costs of human and physical resources consumed for the complete patient journey
are $65.60 and $43.10 respectively. It must be highlighted that these figures
represent only one woman’s journey through the RMGP model. Ultimately these
figures would need to be extrapolated to cover the total number of woman expected
to use the service over a given time period, for example, 240 woman birthing per
year.
PaJMa – A Healthcare Specific Patient Journey Modeling Tool
239
7.4.2.2 Issues Identified
The description of the model clearly depicts where wastage, duplication and time
delays are occurring and sets the scene for clear plans of action to be put in place.
The issues below have been highlighted in
Figure 7.21, Figure 7.22 and Figure 7.23 respectively using a red asterisk with a
corresponding number.
1. The woman may not be assessed as to her suitability for the RMGP model
until her 3rd visit to Ryde. *1
2. Three (3) forms are used for the current clerical booking; 8 signatures are
required, 7 sections on these forms are unused or worded incorrectly for the
Ryde model, 4 sections are duplicated across the PAS and other forms. *2
3. Booking information is duplicated across several mediums (ie: booking
books/whiteboard). *3
4. It may be over 1 week after the women has completed her clerical booking
before she is contacted by a midwife to make a booking interview. *4
5. The midwife’s and the woman’s time is wasted and redundant paperwork is
completed if the woman is assessed as being unsuitable for the RMGP model
at the Booking Interview. *5
6. Domestic Violence screenings are not always completed as per Policy. *6
7. The total actual patient processing time is 115 minutes. Elapsed time
however is variable and may extend to 16 days depending on when the
woman actually attends Ryde for her clerical booking and her details are
placed in the Booking Book for allocation. *7
Impact on Patients and Staff
As a result of the above issues, there are several impacts on both the women and
staff treating them. These include:
• If the woman has attended Maternity to make a clerical booking, completed
the clerical booking and then during the booking interview is assessed as
being unsuitable for the RMGP model she may get quite upset and frustrated.
This will give her a negative attitude of the service and she may pass this
perception onto others. A potential reason for birthing numbers and patient
satisfaction levels to decrease.
PaJMa – A Healthcare Specific Patient Journey Modeling Tool
240
• This situation may also have necessitated in the woman taking time off work
on three separate occasions. She will now have to take more time off to
complete another booking process at the new hospital, another negative effect
on the patient and their satisfaction levels.
• If the woman is assessed as being unsuitable for the RMGP model, all
paperwork prepared in the first stage of the Booking Interview becomes
redundant. Other hospitals have different booking procedures or would prefer
to complete the paperwork from scratch during their own interview process.
• Allocation details are replicated across 4 mediums. This increases the
amount paperwork and time required of the midwives. A review of how
these details can be stored more economically is required.
• Some midwives complete OBSTET input during the Booking Interview
which interrupts the face-to-face contact with the woman.
• Domestic Violence screenings are sometimes not completed if the midwife
feels uncomfortable asking the partner to leave or if she feels he may become
upset if asked to leave. It has been confirmed that the Domestic Violence
(DV) Policy states it is mandatory for the DV screening to be completed on
the first visit and the woman must be alone (children under 3 and/or an
interpreter are permitted to be present). If the DV screening cannot be
completed a separate section of the form must state the reasons why the
screening was not conducted and it must be noted that the screening is
required at the next visit. Failure to conduct the DV screening leaves Ryde
open to potential litigation if the woman does have domestic violence issues
and she and/or the unborn baby are harmed during the pregnancy.
Based on the above issues and impacts, highlighted by the development of the
current patient journey model, an improved patient journey was designed. This is
known as the Future Patient Journey and uses the same PJM development principles
and notation as the Current Patient Journey.
PaJMa – A Healthcare Specific Patient Journey Modeling Tool
241
7.4.3 The Future Patient Journey
The Future Patient Journey Model represents a view of how the current patient
journey can be enhanced to provide reduced care variations thus delivering higher
levels of quality care, increased patient safety and satisfaction, maximising the value
of the resources involved and the of capture metrics for on-going monitoring and
analysis.
Initially the issues and impacts identified in the Current Patient Journey Model are
interrogated and the involved stakeholders determine how these areas are to be
redesigned. The redesigned flow is then modeled using the same PaJMa
architecture. Further reviews and changes may follow as the model is verified and
validated.
It is at this point that Simulation Modeling tools may be of benefit. Such tools can
be used to evaluate problem solution alternatives and to assess the impact each
alternative may have on the Future Patient Journey. As discussed in Chapter 1
Simulation Modeling is however outside the scope of this thesis. Research on
Simulation Modeling in healthcare is well covered by publications by Brailsford
(2005), Klein et al. and Harper and Gamlin (2003) as a small example.
The Future Patient Journey Model for the case study is presented in Figure 7.24,
Figure 7.25 and Figure 7.26. Details regarding specific improvements and their
impact on women and staff are discussed first. The full model will then be described.
7.4.3.1 Impact of Improvements on Patients and Staff
• A new Assessment Questionnaire (A.Q.) was designed by the midwives and
NUM to capture details pertinent to a woman’s assessment for the service,
including individual and family medical history and pregnancy history. This
can be sent to the woman, as part of the Information Pack (see below), for
completion at home in her own time or she can complete it online via the new
Ryde Maternity website (see below).
• A new Ryde Maternity Information Pack was created. The pack can be
mailed to a woman who is interested in booking at Ryde negating the need

PaJMa – A Healthcare Specific Patient Journey Modeling Tool
242
for the woman to attend the hospital for a clerical booking. The information
pack contains a covering letter, an Easy Hang Reference Guide, a ‘Giving
Birth at Ryde’ brochure and a new Assessment Questionnaire (with a pre-
stamped return envelope).
• As a complimentary patient service to the Information Pack above, a new
Ryde Maternity website will also be created. The website will contain the
same information as the Information Pack with the ability to complete and
submit the new Assessment Questionnaire online (see below).
• A new Ryde Maternity Data Base (RMDB) will be developed. This database
will hold all maternity patient information and thus serve as a single source
of data input, extraction and reporting. The system will be integrated with
PAS and OBSTET to allow electronic transfer of data between the systems as
required. With the introduction of the Assessment Questionnaire, the
majority of the women’s medical history will already be captured and input
to the new Ryde Maternity database prior to the woman attending her
Booking Interview (if she is suitable). This means that very little data input
is needed during the Booking Interview itself, giving more quality time for
face-to-face service delivery.
• Once the questionnaire is returned (via a pre-stamped envelope or submitted
online), the woman’s responses are used to assess the woman’s suitability for
the RMGP model. This means that a woman does not need to attend Ryde at
all if she is assessed as being unsuitable.
• The woman no longer needs to attend Ryde for a clerical booking. Based on
the uniqueness of the RMGP model, Hospital Administration were
approached to redesign the admission procedure for Ryde maternity patients.
This has resulted in a total redesign of the admission form down to one page
(with one signature) and wording now appropriate for the primary care
maternity service offered. The new admission form is completed when the
woman presents to give birth (and therefore to be admitted) at Ryde. NB:
The woman’s name and DOB will be entered into the Database and an MRN
generated for the woman’s file, as part of the Assessment process (see
below).
PaJMa – A Healthcare Specific Patient Journey Modeling Tool
243
• This change also contributed in part to the position of the maternity ward
clerk being made redundant. This is mainly due to other administrative
changes that will occur as part of ongoing hospital wide changes but due to
the significant redesign of these processes, the need for this position as part
of this journey could not be justified on an on-going basis.
• The proposed Assessment Questionnaire reduces the amount of redundant
paperwork completed. This is due to the fact that the woman’s suitability is
assessed much earlier. It is also a valuable resource for any future booking
hospital as all information contained is relevant to any maternity booking
procedure.
• New strategies for improving compliance with the Domestic Violence policy
will be introduced. This includes setting up a separate area for height and
weight checks. When the woman and midwife have left the room to do these
checks, the midwife will then run through the Domestic Violence (DV)
questions with the woman. This presents a perfectly valid reason for leaving
the room and allows increased compliance with the DV policy. This strategy
should alleviate any suspicion from an abusive partner as if the woman’s
partner asks her what went on whilst she was out of the room, she can be
quite truthful about having her height and weight checked. It also allows the
hospital to reduce their risk of litigation from policy non-conformance.
• Fourteen new metrics will be introduced to allow better tracking of
performance and to permit the RMGP model to be benchmarked and
measured against similar primary-care maternity models.
• It is anticipated that patient satisfaction levels will increase due to ready
availability of more patient friendly information. In addition with the new
Assessment Questionnaire, suitability decisions can be made much earlier in
the patient’s journey and women deemed as unsuitable (too high a risk) can
seek alternative care before unnecessary absences from work are taken.
• The total journey time has been halved to 8 days, with processing time
reduced to 72 minutes, down by 42 minutes. The majority of this time is now
value-added time with the woman during the actual booking interview.
Human resource costs have been reduced by 53%, with physical resource
costs down by 31%
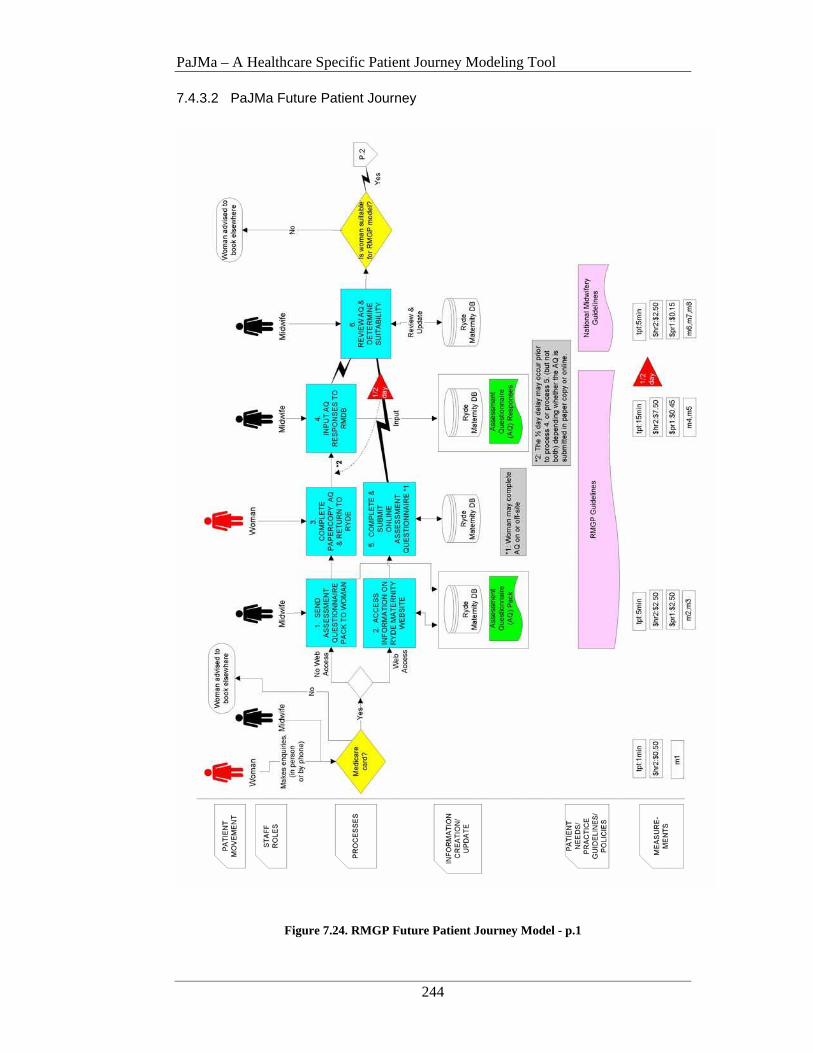
PaJMa – A Healthcare Specific Patient Journey Modeling Tool
244
7.4.3.2 PaJMa Future Patient Journey
Figure 7.24. RMGP Future Patient Journey Model - p.1
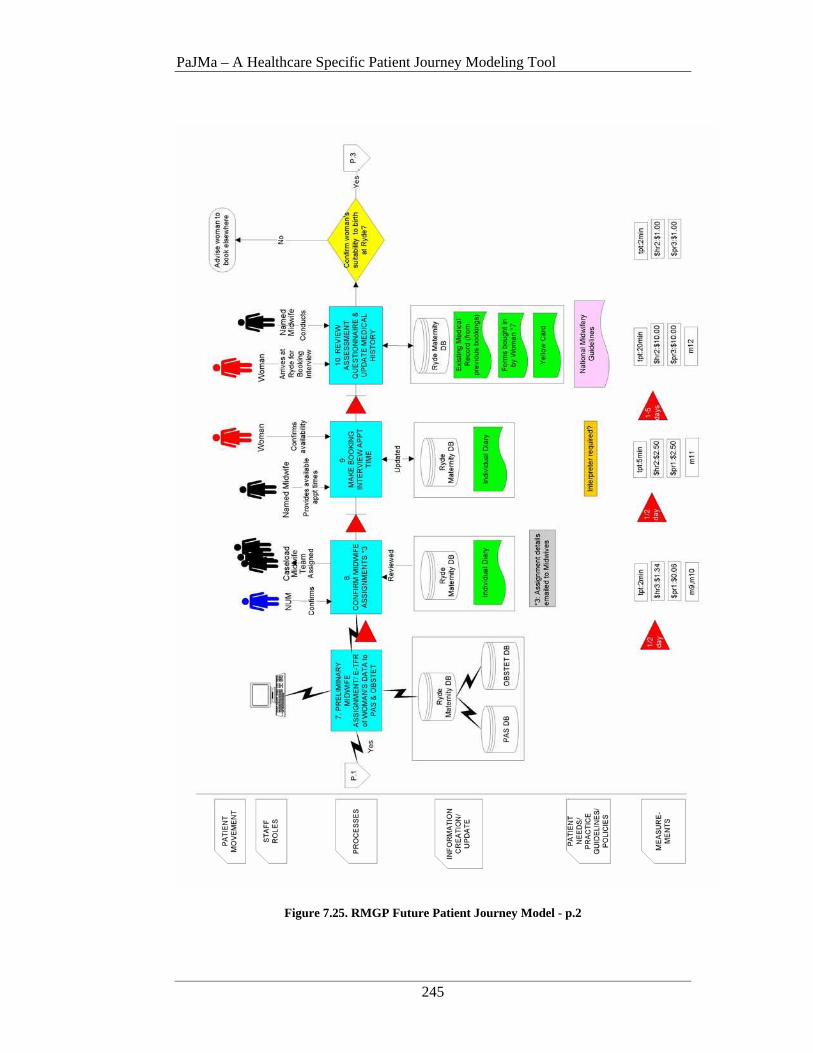
PaJMa – A Healthcare Specific Patient Journey Modeling Tool
245
Figure 7.25. RMGP Future Patient Journey Model - p.2
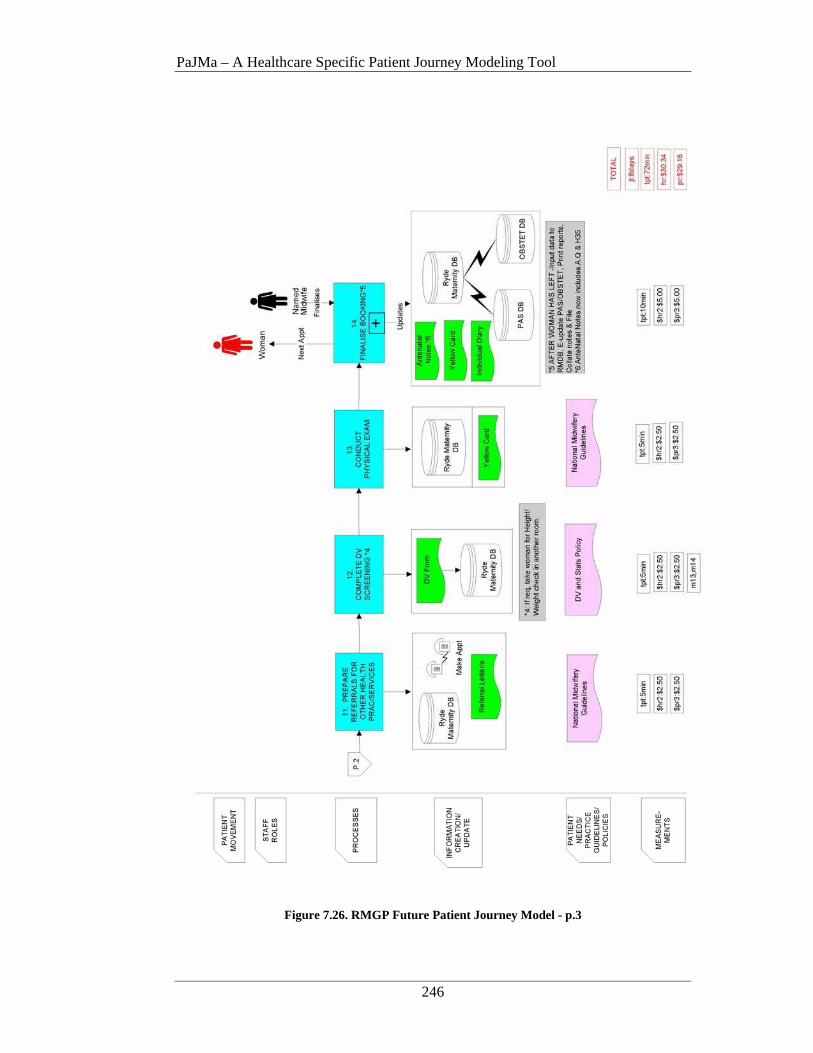
PaJMa – A Healthcare Specific Patient Journey Modeling Tool
246
Figure 7.26. RMGP Future Patient Journey Model - p.3

PaJMa – A Healthcare Specific Patient Journey Modeling Tool
247
Model Description
A woman makes an enquiry about maternity services at Ryde. This can be
via phone or in person with the ward midwife. A check is done to determine
if the woman has a valid Medicare card. If no, exit the journey and advise
the woman that she is unable to participate in this service. If the woman does
have a valid Medicare card and wants more information, she is either
given/sent an Information Pack (processes 1, 3 & 4) or directed to a new
Ryde Maternity website (processes 2 & 5).
A new metric capturing how many enquiries are made (m1) is established.
Process 1, 3 & 4:
If the woman does not have Internet access, she is given or sent an
Information Pack, containing brochures about the RMGP model and an
Assessment Questionnaire.
If after reviewing the information, the woman wishes to make a booking at
Ryde, she completes an Assessment Questionnaire (A.Q.), detailing her
demographics and personal and family medical history, at her convenience.
The paper copy A.Q. is mailed back to Ryde in the pre-stamped envelope and
the woman’s responses are entered into the new Ryde Maternity Data Base
(RMDB). There may be a delay of up to ½ day from the time the paper copy
A.Q. is received and the time it is input by a midwife. This will depend on
the midwife’s availability.
New metrics capturing how many Information Packs are sent out (m2) and
how many paper copy A.Q.’s are submitted (m5) are introduced.
Process 2 & 5:
If the woman has internet access she is directed to the Ryde Maternity
website. The website contains the same information as the above information
pack. An internet connected PC is available onsite at Maternity or the
woman can view the website from another Internet connected PC (ie: at
home), at her convenience. If after reviewing the information, the woman
wishes to make a booking at Ryde, she enters her Medicare Card details and
completes the online A.Q. It is then electronically transmitted to the RMDB
and an alert is posted to the online Midwife message board advising an
assessment is required. The next available midwife logs on and makes the

PaJMa – A Healthcare Specific Patient Journey Modeling Tool
248
assessment. There may be a delay of up to ½ day from the time an A.Q. is
submitted online and the time it is reviewed by a midwife. This will depend
on the availability of a midwife. NB: The ½ day delay can only exist in one
conditional stream per patient journey. The woman can also print a copy for
her records.
New metrics capturing how many website hits (m3) and how many online
submissions are received (m4) are established.
Process 6:
New A.Q. submissions are reviewed by a midwife and a decision on the
woman’s suitability is made. If the woman is unsuitable, a reason is placed
on her record and she is contacted by phone. The reasons for her exclusion
are discussed and she is advised of her other birthing options. She is also
advised to take her completed A.Q. with her as a good source of information
for the next hospital. Additional metrics for the total number of assessments
received (m6) and how many suitable (m7) or unsuitable (m8) decisions are
made, are also recorded.
Process 7:
If suitable the woman’s record is noted as such and her details are
electronically transferred to PAS and OBSTET (an MRN is generated as part
of this process). The system also makes a preliminary allocation of the
woman to a dedicated midwife. This allocation is based on pre-determined
business rules and existing midwife bookings recorded in the RMDB. The
preliminary midwife allocations are emailed to the NUM for review and
approval.
Process 8:
The NUM reviews the preliminary allocation sent via email and amends or
confirms midwife allocations. There may be up to a ½ day delay between the
email arriving and approvals being conducted. This is only due to the
NUM’s availability, if she is free at the time the email arrives, approvals can
be conducted straight away. Final approved allocations are emailed to the
relevant midwives for entry into their individual diaries. Final approved
allocations are stored in the RMDB. Metrics capturing the number of woman
per midwife (m9) and the estimated number of births (m10) are automatically
recorded.
PaJMa – A Healthcare Specific Patient Journey Modeling Tool
249
Process 9:
The allocated midwife contacts the woman for a Booking Interview. There
may be a delay of between 1-5 days before the Booking Interview takes place
due to the woman and/or midwife’s availability. The appointment is
recorded in the RMDB and the midwife’s personal diary. If an interpreter is
required appropriate arrangements are also made. A metric capturing the
number and type of interpreters required is introduced (m11).
Process 10:
When the woman attends for her Booking Interview, her assessment
questionnaire is reviewed and additional medical history is gathered (if
needed).
Following collection of any additional medical history, the woman’s
suitability for the RMGP model is confirmed. If previously undisclosed
information comes to light that impacts the woman’s suitability, she may be
advised to book elsewhere at this point. The midwives have set a confidence
rate of 90% on original assessments. A metric capturing the number of
woman rejected at Booking Interview time is introduced (m12).
Process 11:
If the woman requires referrals for pathology, Nuchal Translucency
Screening or dating ultrasounds etc.., these are now prepared and details
recorded in the RMDB.
Process 12:
A Domestic Violence (DV) screening should now be conducted. New
procedures (see ‘improvement and impact’ section above) have been
introduced to increase compliance to the DV policy. Metrics capturing the
number of DV screenings completed and the number not completed at the
first visit are introduced (m13, m14).
Process 13:
A physical exam of the woman is conducted. This includes blood pressure
readings, fundal height palpitation and breast examination. Details are
recorded on the woman’s yellow card and in the RMDB.
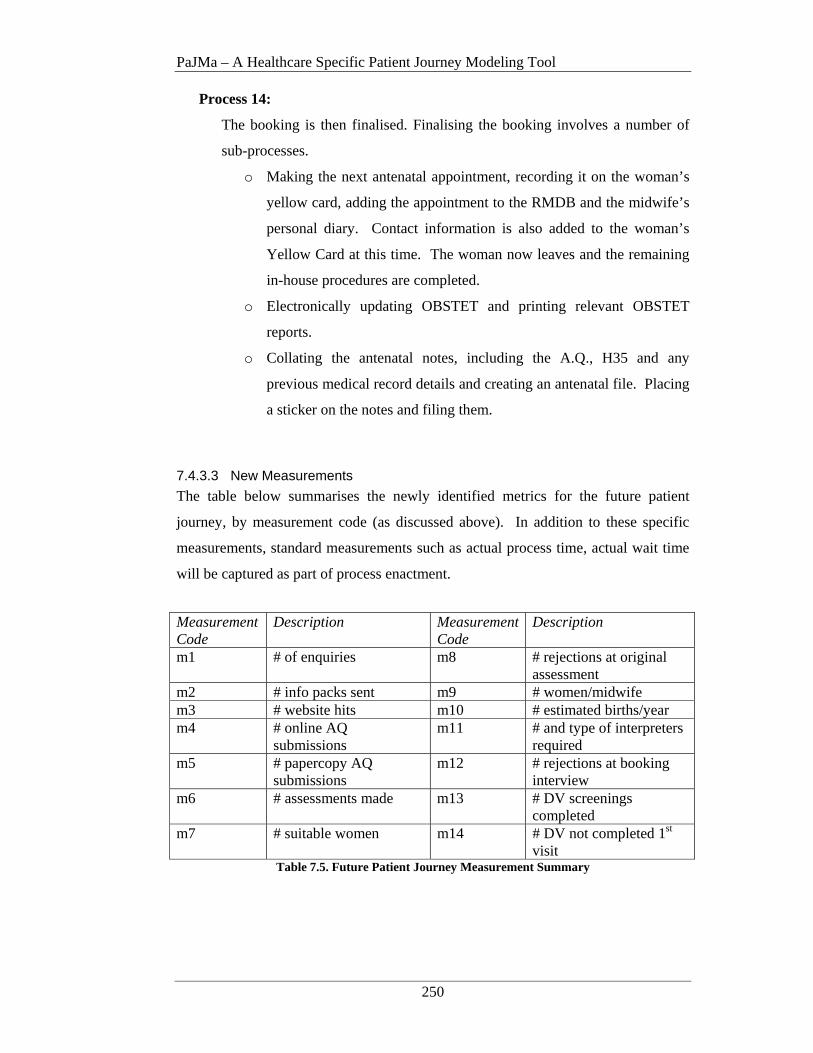
PaJMa – A Healthcare Specific Patient Journey Modeling Tool
250
Process 14:
The booking is then finalised. Finalising the booking involves a number of
sub-processes.
o Making the next antenatal appointment, recording it on the woman’s
yellow card, adding the appointment to the RMDB and the midwife’s
personal diary. Contact information is also added to the woman’s
Yellow Card at this time. The woman now leaves and the remaining
in-house procedures are completed.
o Electronically updating OBSTET and printing relevant OBSTET
reports.
o Collating the antenatal notes, including the A.Q., H35 and any
previous medical record details and creating an antenatal file. Placing
a sticker on the notes and filing them.
7.4.3.3 New Measurements
The table below summarises the newly identified metrics for the future patient
journey, by measurement code (as discussed above). In addition to these specific
measurements, standard measurements such as actual process time, actual wait time
will be captured as part of process enactment.
Measurement Code
Description Measurement Code
Description
m1 # of enquiries m8 # rejections at original assessment
m2 # info packs sent m9 # women/midwife m3 # website hits m10 # estimated births/year m4 # online AQ
submissions m11 # and type of interpreters
required m5 # papercopy AQ
submissions m12 # rejections at booking
interview m6 # assessments made m13 # DV screenings
completed m7 # suitable women m14 # DV not completed 1st
visit Table 7.5. Future Patient Journey Measurement Summary
PaJMa – A Healthcare Specific Patient Journey Modeling Tool
251
7.4.4 Stakeholder Experience with the PaJMa Tool
Following completion of the Patient Journey Modeling activity a debriefing session
was held with the project stakeholders. This session highlighted a number of
interesting issues regarding the use of PaJMa as a Healthcare Improvement tool.
• Several iterations of the future patient journey model (FPJM) were required
until the Redesign Team were satisfied with the FPJM. On at least 2
occasions the group felt as if the processes had been defined correctly but it
was only when they could see the picture of the complete journey was it clear
that some changes were not in the best interests of the woman or were
impractical at an operational level.
• Although it was not a primary goal of this exercise to reduce the time taken
for a booking interview, by improving the efficiency of the patient’s journey
it has been possible to reduce the patient journey by 42 minutes. The
majority of the remaining time is now value added face-to-face time with the
woman during the Booking Interview.
• The new Information Pack and Website were designed by the Midwives with
patient feedback.
• The Midwives also designed the new Assessment Questionnaire (A.Q.). It
enables the woman to complete details about herself, her past medical history
and the current pregnancy at home without the need to come into Maternity.
The midwives have set a 90% confidence rate on assessment decisions made
at original assessment using the A.Q. It is also suggested that the A.Q. be
printed double-sided and replicated in the most common foreign languages of
the RMGP’s catchment area. NB: The Questionnaire may require further
enhancements following implementation based on information provided by
the woman and accuracy of the assessments made.
• The proposed assessment questionnaire allows OBSTET to be completed
prior to the woman attending her Booking Interview thus increasing the face-
to-face contact during the booking interview itself. This was seen by the
midwives as a key quality of service improvement.
• The stakeholder team exhibited strong stakeholder buy-in during the
Improvement project, in particular the Midwives. Significant enhancements
to the current patient journey were actively designed by the whole team and it
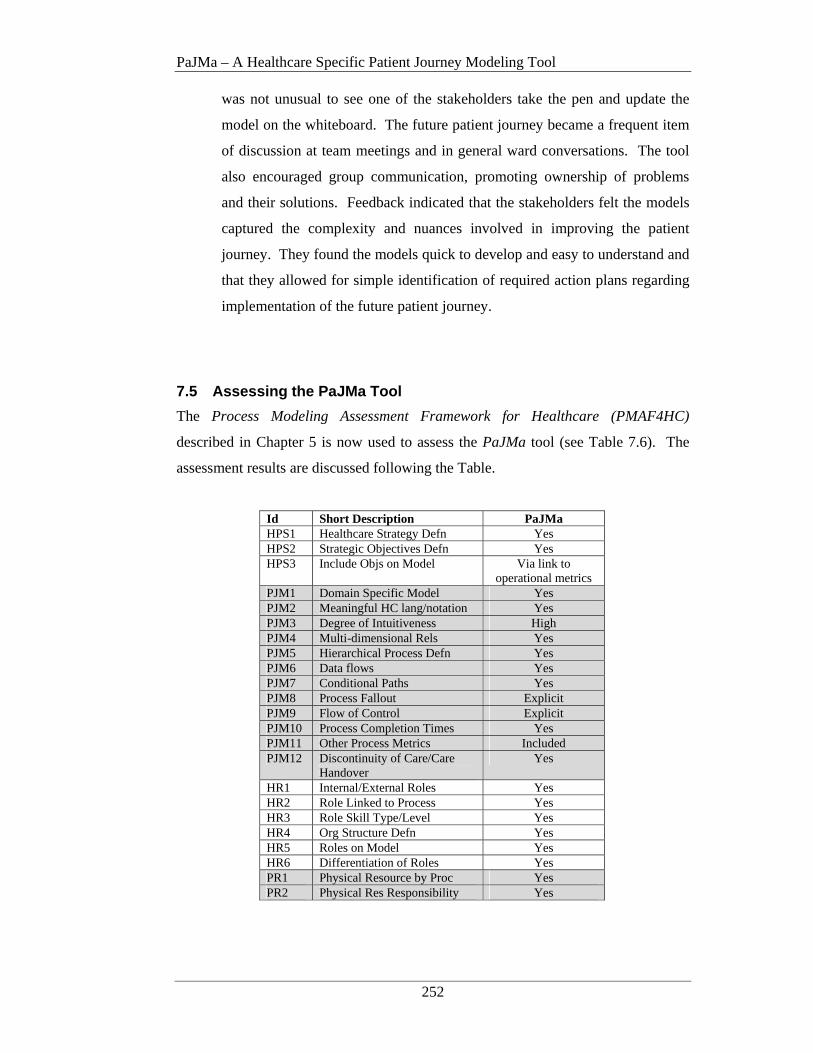
PaJMa – A Healthcare Specific Patient Journey Modeling Tool
252
was not unusual to see one of the stakeholders take the pen and update the
model on the whiteboard. The future patient journey became a frequent item
of discussion at team meetings and in general ward conversations. The tool
also encouraged group communication, promoting ownership of problems
and their solutions. Feedback indicated that the stakeholders felt the models
captured the complexity and nuances involved in improving the patient
journey. They found the models quick to develop and easy to understand and
that they allowed for simple identification of required action plans regarding
implementation of the future patient journey.
7.5 Assessing the PaJMa Tool
The Process Modeling Assessment Framework for Healthcare (PMAF4HC)
described in Chapter 5 is now used to assess the PaJMa tool (see Table 7.6). The
assessment results are discussed following the Table.
Id Short Description PaJMa HPS1 Healthcare Strategy Defn Yes HPS2 Strategic Objectives Defn Yes HPS3 Include Objs on Model Via link to
operational metrics PJM1 Domain Specific Model Yes PJM2 Meaningful HC lang/notation Yes PJM3 Degree of Intuitiveness High PJM4 Multi-dimensional Rels Yes PJM5 Hierarchical Process Defn Yes PJM6 Data flows Yes PJM7 Conditional Paths Yes PJM8 Process Fallout Explicit PJM9 Flow of Control Explicit PJM10 Process Completion Times Yes PJM11 Other Process Metrics Included PJM12 Discontinuity of Care/Care
Handover Yes
HR1 Internal/External Roles Yes HR2 Role Linked to Process Yes HR3 Role Skill Type/Level Yes HR4 Org Structure Defn Yes HR5 Roles on Model Yes HR6 Differentiation of Roles Yes PR1 Physical Resource by Proc Yes PR2 Physical Res Responsibility Yes
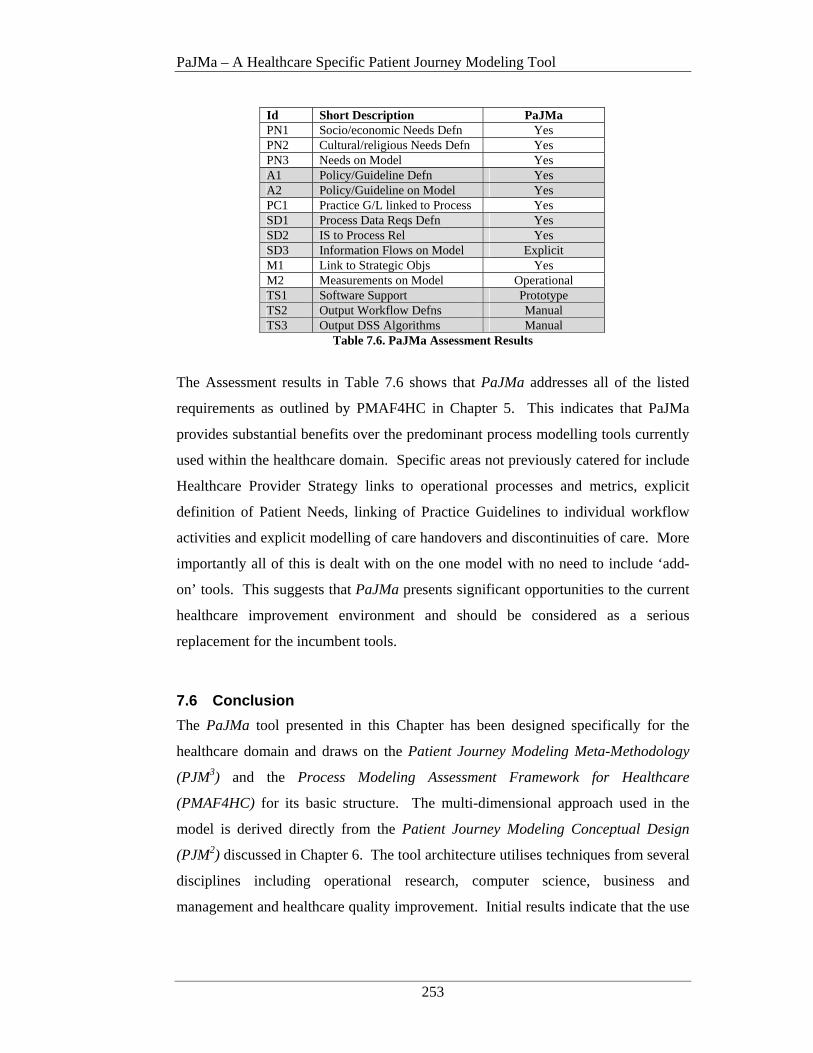
PaJMa – A Healthcare Specific Patient Journey Modeling Tool
253
Id Short Description PaJMa PN1 Socio/economic Needs Defn Yes PN2 Cultural/religious Needs Defn Yes PN3 Needs on Model Yes A1 Policy/Guideline Defn Yes A2 Policy/Guideline on Model Yes PC1 Practice G/L linked to Process Yes SD1 Process Data Reqs Defn Yes SD2 IS to Process Rel Yes SD3 Information Flows on Model Explicit M1 Link to Strategic Objs Yes M2 Measurements on Model Operational TS1 Software Support Prototype TS2 Output Workflow Defns Manual TS3 Output DSS Algorithms Manual
Table 7.6. PaJMa Assessment Results
The Assessment results in Table 7.6 shows that PaJMa addresses all of the listed
requirements as outlined by PMAF4HC in Chapter 5. This indicates that PaJMa
provides substantial benefits over the predominant process modelling tools currently
used within the healthcare domain. Specific areas not previously catered for include
Healthcare Provider Strategy links to operational processes and metrics, explicit
definition of Patient Needs, linking of Practice Guidelines to individual workflow
activities and explicit modelling of care handovers and discontinuities of care. More
importantly all of this is dealt with on the one model with no need to include ‘add-
on’ tools. This suggests that PaJMa presents significant opportunities to the current
healthcare improvement environment and should be considered as a serious
replacement for the incumbent tools.
7.6 Conclusion
The PaJMa tool presented in this Chapter has been designed specifically for the
healthcare domain and draws on the Patient Journey Modeling Meta-Methodology
(PJM3) and the Process Modeling Assessment Framework for Healthcare
(PMAF4HC) for its basic structure. The multi-dimensional approach used in the
model is derived directly from the Patient Journey Modeling Conceptual Design
(PJM2) discussed in Chapter 6. The tool architecture utilises techniques from several
disciplines including operational research, computer science, business and
management and healthcare quality improvement. Initial results indicate that the use
PaJMa – A Healthcare Specific Patient Journey Modeling Tool
254
of the tool can improve the patient journey modeling process and the overall quality
improvement outcomes.
The key benefits of PaJMa are that it contains information relevant to improving
patient journeys across a range of dimensions including staff roles involved,
processes enacted, information created and updated, patient needs, practice
guidelines and policies, and measurement of all required items. These features
provide a solution to research hypotheses 2 and 3.
In addition the model can be developed and read in a number of ways depending on
the stakeholder audience. This includes developing and reading the model as a
number of vertical slices, each showing how the patient is affected by all of the
dimensions at one point in time. Alternatively the model can be developed and read
as horizontal slices showing the involvement of (for example) patients with staff and
the processes they interact with across a time continuum.
Use of the tool in the case study environment demonstrated that the tool copes with
the complexities involved in healthcare improvement. It also encourages group
communication, is quickly developed and easy to understand, promotes ownership of
problems and their solutions and allows for simple identification of required action
plans. These are all critical factors in the actualisation of healthcare quality
improvements.
Benefits of the new tool are also confirmed via its evaluation using the Process
Modeling Assessment Framework for Healthcare as discussed in Chapter 5. The
evaluation showed that PaJMa is a significant improvement on the incumbent
process modelling tools being used in healthcare and this provides increased support
for its urgent adoption within the healthcare improvement arena.
Technology Support
255
CHAPTER 8 TECHNOLOGY SUPPORT
8.1 Introduction
“In the Information Age, businesses must increasingly create and deploy intangible assets – for instance, customer relationships, employee skills and knowledge, information technologies; and a corporate culture that encourages innovation, problem solving and general organisational improvements (Kaplan and Norton 2000, p.168).”
In addition to the observation provided by Kaplan and Norton, it is important to note
that value does not exist in any one intangible asset. It arises from the entire
spectrum of assets and the strategy that is developed to inter-relate them (Kaplan and
Norton 2000). The recognition that both tangible and intangible assets are of value
is of significance to healthcare, where ‘success’ regularly depends on the skills of the
healthcare workers and their application of these skills in a given environment. The
identification and inter-relationship of the tangible and intangible assets of a Health
Care Organisation (HCO) are highlighted in the development of the patient journey
model (PJM). Finalisation of the future PJM (the ‘to-be’ model), leads to an
investigation of opportunities to enable the new workflows via the use of supporting
technology.
This chapter describes a number of readily available technologies that can be
leveraged to provide implementation support for different aspects of the redesigned
patient journey. Adaptation of these technologies to the patient journey modeling
problem domain provides a solution to research hypothesis 4 as in Chapter 1.

Technology Support
256
Initially the Patient Journey Modeling Meta-Methodology (PJM3) is revisited to
position it within the context of the technical solution space. The relationship
between the logical and physical Patient Journey Model environments is then
established. Following this the first of a range of enabling technologies, XML, is
introduced. This includes definition of the explicit links between the core
components of the Patient Journey Modeling Meta-Methodology (PJM3) required to
track and automate identified work flows.
Next a supporting multi-dimensional database structure is introduced for the
purposes of management decision support in relation to variance analysis and
performance and effectiveness monitoring of the redesigned patient journey. This
will encompass the minimum data element sets that must be collected as part of the
patient journey modeling exercise to support database implementation. An example
SQL query and resulting variance report are also presented.
8.2 PJM3 and its Impact on the Technology Solution Space
Patient journey models are part of a complex and highly inter-related set of
workflows and procedures, involving many stakeholders. When developing the
patient journey model multiple dimensions associated with the patient’s movement
through the Health Care Organisation (HCO) must be analysed and it is only through
the consideration of the inter-relationships and interactivity of all of these
dimensions, that a complete and accurate picture of the patient journey can be
realised.
The inter-relationships and interactivity of these relationships were discussed in
Chapter 4 as part of PJM3. Chapter 6 then discussed a Multi-Dimensional Patient
Journey Modeling Conceptual Design that is directly abstracted from PJM3. This
conceptual design, PJM2 was then used as the foundation for the development of a
new purpose-built multi-dimensional patient journey modeling tool, PaJMa. Such
an approach indicates that when assessing the use of technology to support the
implementation of new patient journeys, developers must be cognisant of not only
the operational patient journey requirements but also the relationships between the
high level components represented in PJM3.

Technology Support
257
Figure 8.1 re-presents PJM3 for the purposes of outlining the components that must
be supported and linked by the technology being considered as part of patient
journey implementation and execution.
HEALTHCARE PROVIDER STRATEGY (strategic objectives and target measurements)
DECISION SUPPORT SYSTEMS
(clinical support & management support for performance analysis)
MANUAL WORKFLOW
PATIENT NEEDS
LEGEND
Dark Green = Patient/External InterfaceRed = Patient Journey ImprovementDark Blue = System SupportBlack = Information FlowsPurple = Continuous Improvement
PRACTICE GUIDELINES
ORGANISATIONAL
STRUCTURE
PATIENT JOURNEY MODEL/S(definition and operational
measurement criteria)
AUTOMATEDWORKFLOW SYSTEMS
GOVERNMENT LEGISLATION/
ACCREDITATION/PROVIDER
POLICY
Process Definitions/Metrics & Guidelines
Balanced Scorecard Objectives
Patient Journey Process
Definitions
Actual Process Metrics
Recommendations
Recommend-ations
Patient Population Needs
ComplianceRequirements
JourneySpecificNeeds
TreatmentGuidelines
Clinical decision support
Figure 8.1. The Patient Journey Modeling Meta-Methodology (PJM3)
Specifically support is required to capture the strategy details of the healthcare
provider. These must be able to be explicitly linked to the ensuing patient journey
model, particularly in relation to the linking of target process measurements at the
operational level. As part of workflow enactment, actual performance measurements
must be gathered. These are then relayed to a management decision support system
for comparison to the original targets. Variances are analysed and management
decisions made as to the need for additional patient journey model improvements or
strategic variations.

Technology Support
258
8.2.1 The Relationship of Logical to Physical Patient Journey Models
Development of patient journey models and the decisions regarding implementation
of the models is conducted in two distinct activities. Firstly the details of what needs
to occur, who is involved in these activities and when and where they should happen
are captured. This is known as a logical model as it describes the logical occurrence
of items without any restrictions regarding how they will be implemented or with
what technology.
Following development of a logical model, details of how the logical model will be
implemented are added. This includes what programming languages, database
systems and overall architectures will be used. This more comprehensive model is
known as the physical model. Primary input to the logical models is provided by the
people who understand the system requirements and who will ultimately use the
system. Primary input to the physical model comes from the IT staff that will
construct, implement and maintain the required systems. Figure 8.2 shows the
relationship of the logical to physical model development.
LOGICAL MODEL OF PATIENT JOURNEY REQUIREMENTS(What, Who, When, Where?)
PHYSICAL MODEL OF PATIENT JOURNEY DESIGN(What technology and How it is applied
to the implementation of the Logical Model)
CONSTRUCTION AND IMPLEMENTATION OF SUPPORTINGINFORMATION SYSTEMS
Figure 8.2. Logical to Physical Model Relationship
As discussed in Chapter 3, PJM3, PJM2 and PaJMa all deal with the logical model of
the patient journey rather than the physical solution aspects. Physical model
requirements are added by IT professionals at a later date as part of the
implementation design of the future patient journey model workflows and supporting
systems.
Technology Support
259
The remainder of this chapter discusses aspects relating to the development of the
Physical Model, in particular the technology to be used to communicate data
between core components and the structure of a multi-dimensional management
decision support system database.
8.3 Patient Journey Model Development
The PaJMa models presented in Chapter 7 were created using Microsoft Visio©
which was an ideal medium for prototyping the PaJMa architecture concepts and
notation sets. Further analysis is required to determine Visio’s© capabilities for
explicitly linking the individual components of PJM3 and the transfer of selected
data items between components (ie: Balanced Scorecards from the Healthcare
Provider Strategy to Patient Journey Model). Such features should also be able to
generate the XML as described in section 8.5, directly from the process definitions
developed as part of the Patient Journey Model. An additional requirement would
include the generation of executable language programs such as Business Process
Execution Language (BPEL) directly from the XML for implementation of
automated workflows.
An example of a tool in the business process modeling environment is the Rational
Rose suite from IBM (2007).
Further analysis regarding extending Microsoft Visio© or the development of a new
tool to accommodate all aspects of PJM3 and PaJMa are discussed in the Future
Work section of the thesis conclusion.
8.4 Workflow Engine
In this research automation of selected workflows will be via implementation on a
workflow management system. Workflows are initially defined in XML (as
discussed in section 8.5.2). They can then be implemented using an executable
language via the workflow engine. Workflow enactment will be conducted by the
workflow engine and other system interactions are managed by the workflow
management system.

Technology Support
260
Selection of a workflow management system and execution engine is outside the
scope of this research and should be decided in consultation with the Providers IT
Support.
8.5 Data Integration and Transfer
As discussed in Chapter 4 this research requires explicit links to integrate and
transfer data between the Healthcare Provider Strategy, Patient Journey Model,
Workflow and Decision Support System components of the Patient Journey Modeling
Meta-Methodology (PJM3). The eXtensible Markup Language (XML) is a widely
used technology for facilitating such data transportation and more recently enhanced
versions of XML have been specifically defined to transport information concerning
Balanced Scorecards, Business Processes and Workflows (Balanced Scorecard
Collaborative 2001; McGregor 2002; WfMC 2005; W3C 2006).
McGregor’s (2002) IW-MONS Methodology laid solid foundations for a framework
for data transfer and integration within a business process modeling environment.
My research looks to apply several of the IW-MONS concepts to the healthcare
domain via the PJM3 architecture. A number of enhancements were required to the
IW-MONS concepts to accommodate the demands of the healthcare environment
and these are discussed in the following sections.
8.5.1 Healthcare Provider Balanced Scorecards
This research uses the BSC XML Draft Standard, as developed by the Balanced
Scorecard Collaborative (2001), to facilitate the link between the Healthcare
Provider Strategy and the Patient Journey Model components. Additional
augmentations as defined by McGregor (2002) have also been used as part of the
BSC XML within this research. The specification of the Healthcare Provider Strategy
in BSC XML allows the particular objectives for a given perspective and section of
the patient journey model to be defined. Explicit measurements for each objective
are also included, along with the ‘type’ of measurement, ‘unit’ and ‘target value’.
For example, the objectives involved in the conduct of an ‘Initial Patient Suitability
Assessment’ for the Ryde Midwifery Group Practice (RMGP) model of care, cover
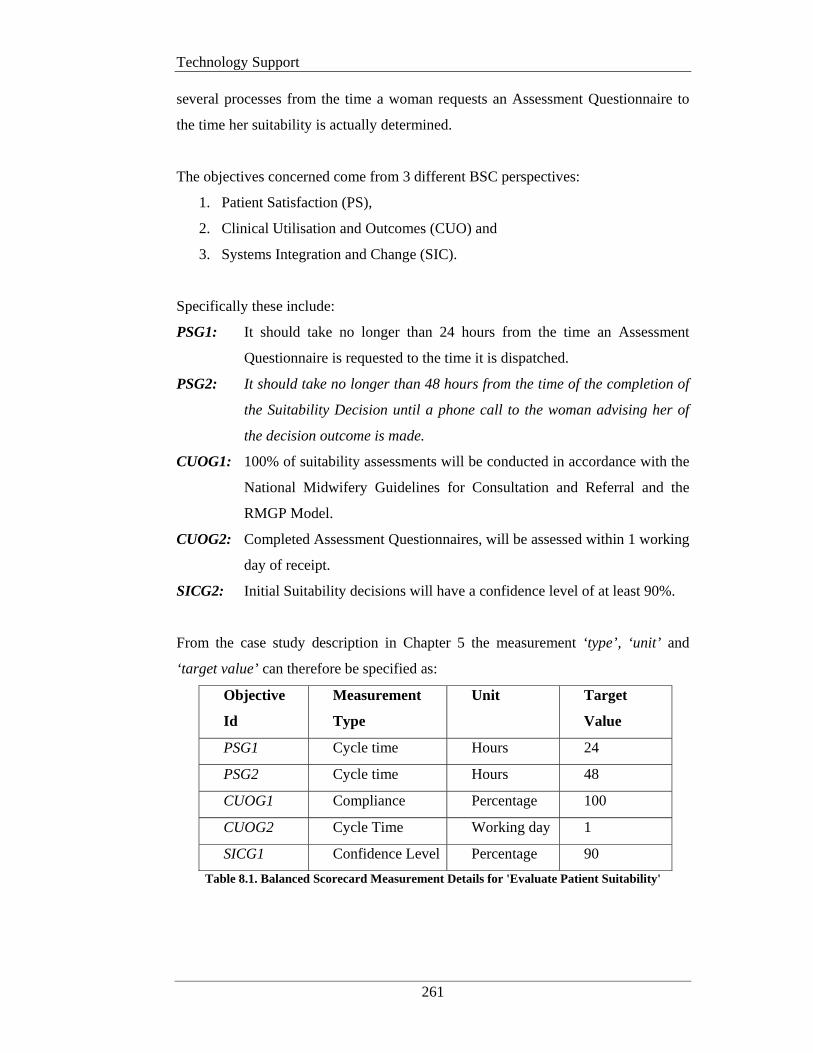
Technology Support
261
several processes from the time a woman requests an Assessment Questionnaire to
the time her suitability is actually determined.
The objectives concerned come from 3 different BSC perspectives:
1. Patient Satisfaction (PS),
2. Clinical Utilisation and Outcomes (CUO) and
3. Systems Integration and Change (SIC).
Specifically these include:
PSG1: It should take no longer than 24 hours from the time an Assessment
Questionnaire is requested to the time it is dispatched.
PSG2: It should take no longer than 48 hours from the time of the completion of
the Suitability Decision until a phone call to the woman advising her of
the decision outcome is made.
CUOG1: 100% of suitability assessments will be conducted in accordance with the
National Midwifery Guidelines for Consultation and Referral and the
RMGP Model.
CUOG2: Completed Assessment Questionnaires, will be assessed within 1 working
day of receipt.
SICG2: Initial Suitability decisions will have a confidence level of at least 90%.
From the case study description in Chapter 5 the measurement ‘type’, ‘unit’ and
‘target value’ can therefore be specified as:
Objective
Id
Measurement
Type
Unit Target
Value
PSG1 Cycle time Hours 24
PSG2 Cycle time Hours 48
CUOG1 Compliance Percentage 100
CUOG2 Cycle Time Working day 1
SICG1 Confidence Level Percentage 90
Table 8.1. Balanced Scorecard Measurement Details for 'Evaluate Patient Suitability'
Technology Support
262
Capture of these details necessitated extensions to the BSC XML Draft Standard
(2001) and McGregor’s (2002) work as follows:
1. A 'patientjourneymodel id' data element has been added to provide the ability
to uniquely identify the treatment stream being modeled. This enables
measures for a particular treatment stream to be explicitly linked to a specific
Balanced Scorecard.
2. The 'type' data element within the ‘measure’ construct ' (as added by
McGregor (2002)) has been extended to provide the ability to identify
additional types of measures to be recorded. This includes ‘confidence level’
and ‘compliance’.
3. The 'unit' data element (as added by McGregor, 2002) within the ‘measure’
construct has also been extended to accommodate for the new ‘types’ in point
2. This required the addition of a ‘percentage’ value.
4. Due to the individual working patterns associated with the Ryde Midwifery
Group Practice model an additional extension was also required to the 'unit'
data element within the ‘measure’ construct. This necessitated the addition
of a ‘working day’ value.
An example of the BSC XML for the ‘Evaluate Patient Suitability’ section of the
‘RMGP Future Patient Journey Model’ is shown in Appendix B.
8.5.2 Process Definitions
Process definition output is required by both the Decision Support System and
Workflow components of PJM3. The Decision Support System component requires
target process measurements for each process and the Workflow component requires
details of the workflow activities to be automated.
The Decision Support System component uses the process definitions and their
associated target measurement to initially populate the Management Decision
Support System tables within the data warehouse (see section 8.6.11). These will
later be compared to the actual measurements extracted from the audit log data
output from the workflow enactment engine for the purposes of variance analysis
and feedback (McGregor 2002). This is further discussed in Section 8.5.3.
Technology Support
263
Processes defined as part of the future patient journey are analysed to determine if
opportunities exist to automate all or parts of the workflow involved. Consideration
of integration with other processes both manual and automatic is also required.
Once the decision has been made on what parts of the workflow will be automated,
specification of those processes in a machine interpretable format is required. As
discussed in Chapter 3, Interface 1 of the Workflow Management Coalition’s
(WfMC) Workflow Reference Model (1995) supports the exchange of process
definitions between external business process modeling tools and the workflow
enactment service. This research will use the WfMC XML Process Definition
Language (XPDL) V2.0 (2005) as the specification tool for the definition, storage
and exchange of processes between the future patient journey model and the
workflow automation tools.
XPDL provides a standard process design format for storing the visual diagram and
process syntax of business process models and as such facilitates the development of
generic process descriptions that can be read by a variety of executable languages
such as the Business Process Execution Language (BPEL) (WfMC 2005; Palmer
2006). This provides the added benefit of not being forced into using a proprietary
workflow engine and allows for migration to different workflow management
systems in the future should a change in IT strategy occur. NB: The executable
language selected to implement the process definition and the implementation and
enactment of the processes is outside the scope of this work.
The XPDL for the ‘Evaluate Patient Suitability’ section of the RMGP Future Patient
Journey is shown in Appendix C. The following amendments are included in this
standard to facilitate the modeling constructs of PaJMa.

Technology Support
264
1. Extended attributes have been defined within the 'activity' construct to denote a
system activity for sending the Assessment Questionnaire URL address to the
patient’s nominated email address. For example:
<ExtendedAttributes> <ExtendedAttribute name="System Activity" value="Email"/> <ExtendedAttribute name="Email">
<xyz:Email to="emailAddress" subject="Having your Baby at Ryde">
<xyz:Attachments> <xyz:Attachment>%%docURI</xyz:Attachment>
</xyz:Attachments> <xyz:MessageText>Thankyou for your enquiry about
…….
</xyz:MessageText> </xyz:Email>
</Extended Attribute> </ExtendedAttributes>
2. Within the 'activity' construct, extended attributes, as originally defined by
McGregor (2002), have also been enhanced to provide links from the
previously defined target Balanced Scorecard measurements to individual
activities. For example:
<ExtendedAttribute> <Name>CUOGoal1</Name> <Value>CUOG1</Value>
</ExtendedAttribute> <ExtendedAttribute>
<Name>CUOCompliance</Name> <Value>100</Value>
</ExtendedAttribute> <ExtendedAttribute>
<Name>CUOComplianceType</Name> <Value>Percentage</Value>
</ExtendedAttribute> </ExtendedAttribute> <ExtendedAttribute>
<Name>CUOGoal2</Name> <Value>CUOG2</Value>
</ExtendedAttribute> <ExtendedAttribute>
<Name>CUOCycleTime</Name> <Value>1</Value>
</ExtendedAttribute>
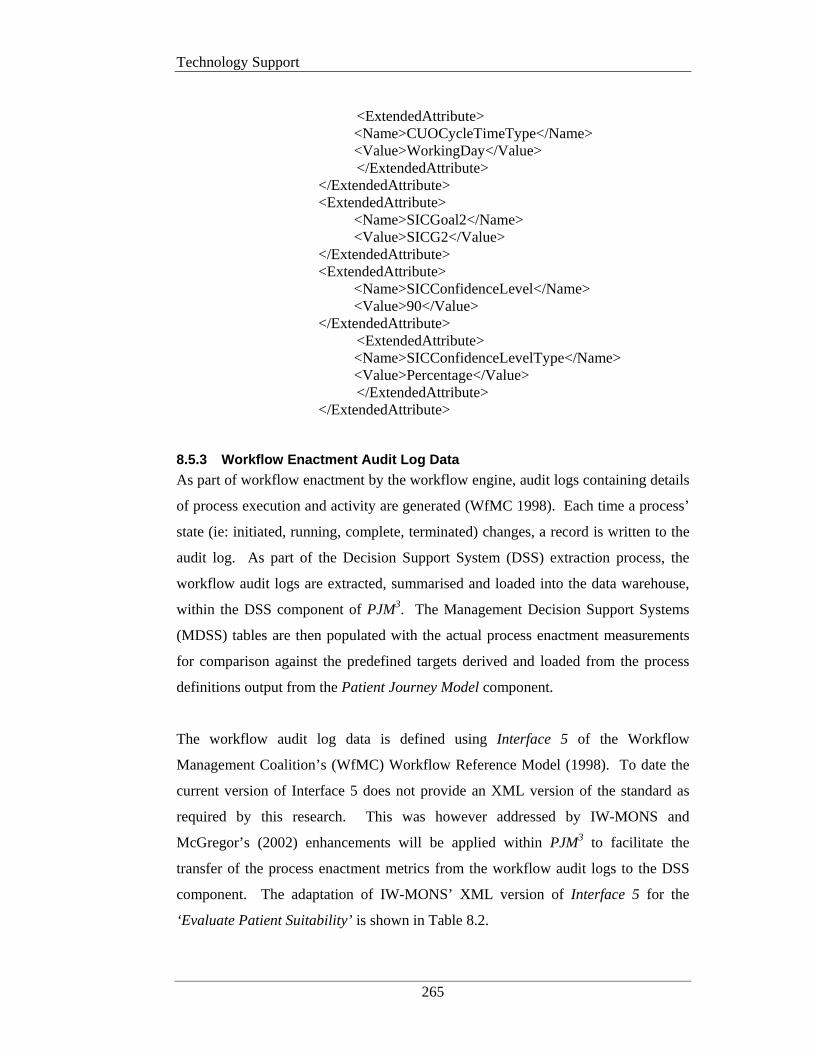
Technology Support
265
<ExtendedAttribute>
<Name>CUOCycleTimeType</Name> <Value>WorkingDay</Value>
</ExtendedAttribute> </ExtendedAttribute> <ExtendedAttribute>
<Name>SICGoal2</Name> <Value>SICG2</Value>
</ExtendedAttribute> <ExtendedAttribute>
<Name>SICConfidenceLevel</Name> <Value>90</Value>
</ExtendedAttribute> <ExtendedAttribute>
<Name>SICConfidenceLevelType</Name> <Value>Percentage</Value>
</ExtendedAttribute> </ExtendedAttribute>
8.5.3 Workflow Enactment Audit Log Data
As part of workflow enactment by the workflow engine, audit logs containing details
of process execution and activity are generated (WfMC 1998). Each time a process’
state (ie: initiated, running, complete, terminated) changes, a record is written to the
audit log. As part of the Decision Support System (DSS) extraction process, the
workflow audit logs are extracted, summarised and loaded into the data warehouse,
within the DSS component of PJM3. The Management Decision Support Systems
(MDSS) tables are then populated with the actual process enactment measurements
for comparison against the predefined targets derived and loaded from the process
definitions output from the Patient Journey Model component.
The workflow audit log data is defined using Interface 5 of the Workflow
Management Coalition’s (WfMC) Workflow Reference Model (1998). To date the
current version of Interface 5 does not provide an XML version of the standard as
required by this research. This was however addressed by IW-MONS and
McGregor’s (2002) enhancements will be applied within PJM3 to facilitate the
transfer of the process enactment metrics from the workflow audit logs to the DSS
component. The adaptation of IW-MONS’ XML version of Interface 5 for the
‘Evaluate Patient Suitability’ is shown in Table 8.2.
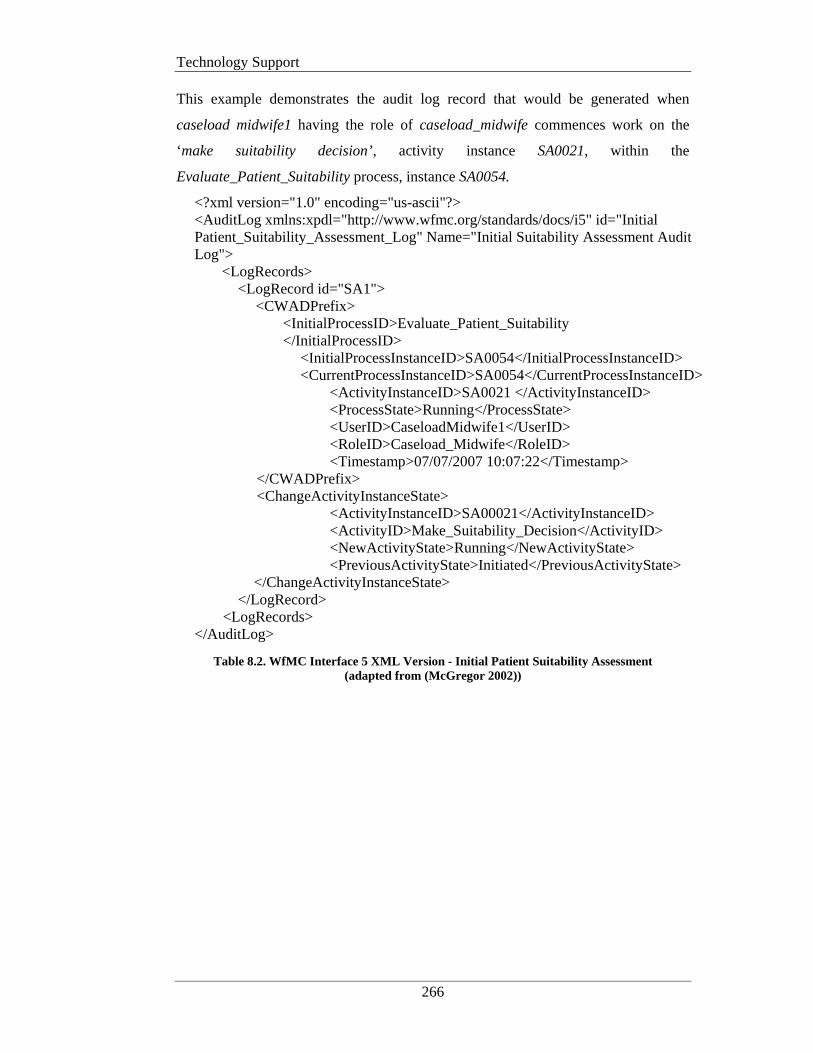
Technology Support
266
This example demonstrates the audit log record that would be generated when
caseload midwife1 having the role of caseload_midwife commences work on the
‘make suitability decision’, activity instance SA0021, within the
Evaluate_Patient_Suitability process, instance SA0054.
<?xml version="1.0" encoding="us-ascii"?> <AuditLog xmlns:xpdl="http://www.wfmc.org/standards/docs/i5" id="Initial Patient_Suitability_Assessment_Log" Name="Initial Suitability Assessment Audit Log"> <LogRecords> <LogRecord id="SA1"> <CWADPrefix> <InitialProcessID>Evaluate_Patient_Suitability </InitialProcessID> <InitialProcessInstanceID>SA0054</InitialProcessInstanceID> <CurrentProcessInstanceID>SA0054</CurrentProcessInstanceID> <ActivityInstanceID>SA0021 </ActivityInstanceID> <ProcessState>Running</ProcessState> <UserID>CaseloadMidwife1</UserID> <RoleID>Caseload_Midwife</RoleID> <Timestamp>07/07/2007 10:07:22</Timestamp> </CWADPrefix> <ChangeActivityInstanceState> <ActivityInstanceID>SA00021</ActivityInstanceID> <ActivityID>Make_Suitability_Decision</ActivityID> <NewActivityState>Running</NewActivityState> <PreviousActivityState>Initiated</PreviousActivityState> </ChangeActivityInstanceState> </LogRecord> <LogRecords> </AuditLog>
Table 8.2. WfMC Interface 5 XML Version - Initial Patient Suitability Assessment (adapted from (McGregor 2002))
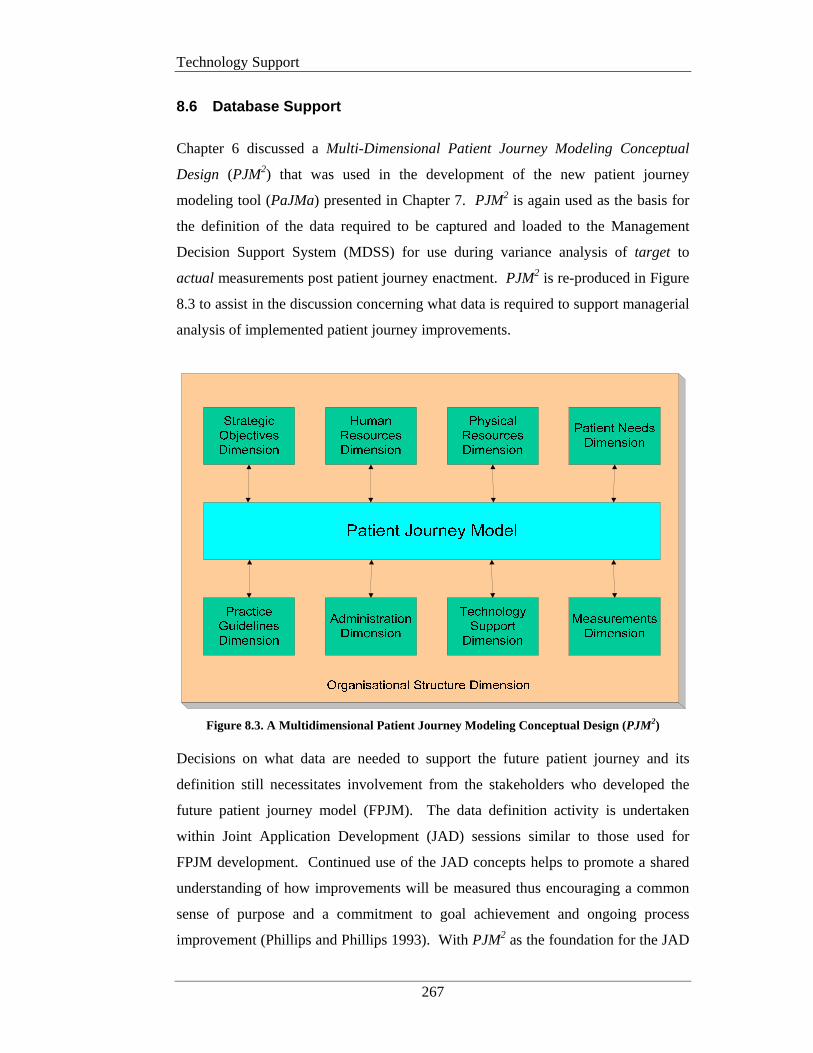
Technology Support
267
8.6 Database Support
Chapter 6 discussed a Multi-Dimensional Patient Journey Modeling Conceptual
Design (PJM2) that was used in the development of the new patient journey
modeling tool (PaJMa) presented in Chapter 7. PJM2 is again used as the basis for
the definition of the data required to be captured and loaded to the Management
Decision Support System (MDSS) for use during variance analysis of target to
actual measurements post patient journey enactment. PJM2 is re-produced in Figure
8.3 to assist in the discussion concerning what data is required to support managerial
analysis of implemented patient journey improvements.
Figure 8.3. A Multidimensional Patient Journey Modeling Conceptual Design (PJM2)
Decisions on what data are needed to support the future patient journey and its
definition still necessitates involvement from the stakeholders who developed the
future patient journey model (FPJM). The data definition activity is undertaken
within Joint Application Development (JAD) sessions similar to those used for
FPJM development. Continued use of the JAD concepts helps to promote a shared
understanding of how improvements will be measured thus encouraging a common
sense of purpose and a commitment to goal achievement and ongoing process
improvement (Phillips and Phillips 1993). With PJM2 as the foundation for the JAD
Technology Support
268
sessions the myriad of data needed to support the FPJM can again be divided into
manageable segments (individual dimensions) that can be easily understood and
discussed by all stakeholders concerned.
As the majority of stakeholders are most comfortable talking about the patient
journey and the processes involved, this is a logical place to begin the data definition
activity. The data collected during this exercise supports the overall definition of the
FPJM. At this stage the data elements are not normalised, we are only capturing the
supporting data. The design of the actual database that will support managerial
decision making will take any normalisation requirements into consideration later in
the project (Codd 1970).
8.6.1 The Patient Journey Model
As a result of breaking the future patient journey down into individual dimensions
the data elements required to be captured for the patient journey itself are at a
summary level only. All of the micro-level details that comprise the overall journey
are captured in the individual dimensions themselves and then queried as needed.
Each table used in the following section is made up of the following columns:
Data element name: Common name by which the data element is known
Description: Plain English description of the contents of the data element
Example value: Provides an example of the contents of a particular data
element. (NB: All example values are taken from the RMGP
case study outlined in Chapter 5).
The data element sets that follow are not normalised. They are for the purposes of
data description only. Therefore if more than one value exists for a given item (ie:
multiple sub-processes for a given parent process) then record an individual row for
each and every value.
Table 8.3 lists the minimum set of data elements to be defined for a given patient
journey. The data captured is mainly concerned with summary level metrics relating
to the overall patient numbers and the time the journey previously took and the new
target journey time. This data is used in variance analysis conducted by management
following enactment of the redesigned patient journey.
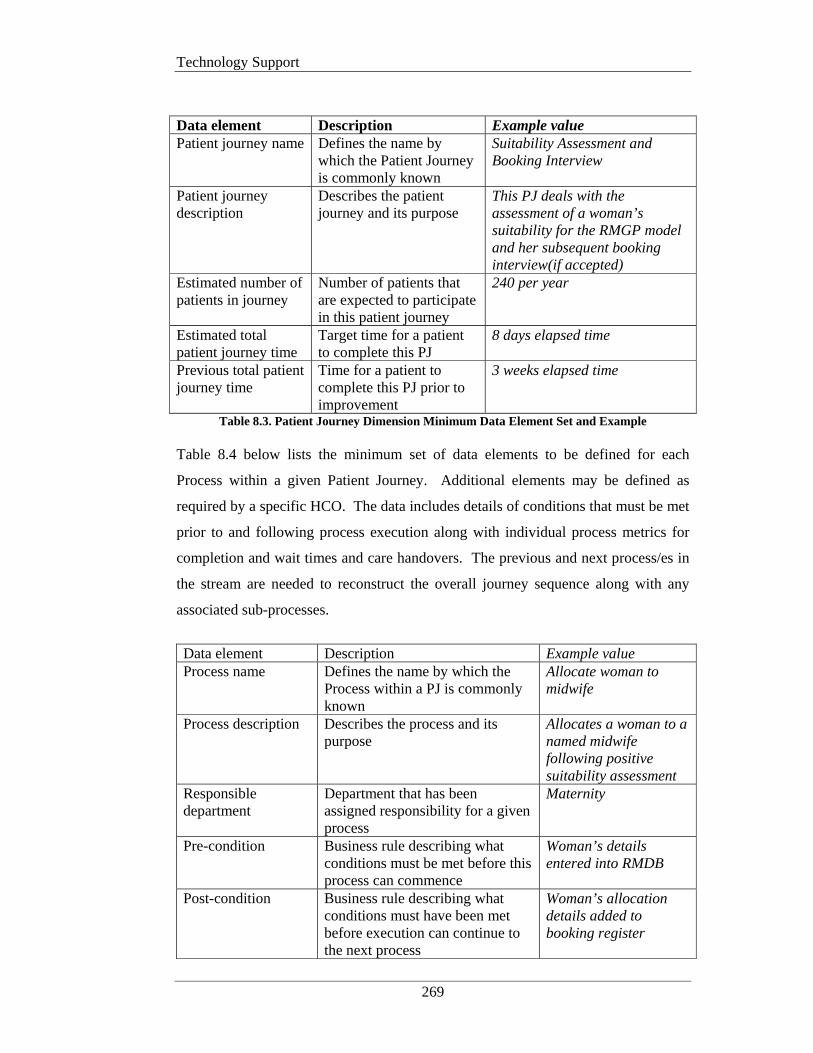
Technology Support
269
Data element Description Example value Patient journey name Defines the name by
which the Patient Journey is commonly known
Suitability Assessment and Booking Interview
Patient journey description
Describes the patient journey and its purpose
This PJ deals with the assessment of a woman’s suitability for the RMGP model and her subsequent booking interview(if accepted)
Estimated number of patients in journey
Number of patients that are expected to participate in this patient journey
240 per year
Estimated total patient journey time
Target time for a patient to complete this PJ
8 days elapsed time
Previous total patient journey time
Time for a patient to complete this PJ prior to improvement
3 weeks elapsed time
Table 8.3. Patient Journey Dimension Minimum Data Element Set and Example Table 8.4 below lists the minimum set of data elements to be defined for each
Process within a given Patient Journey. Additional elements may be defined as
required by a specific HCO. The data includes details of conditions that must be met
prior to and following process execution along with individual process metrics for
completion and wait times and care handovers. The previous and next process/es in
the stream are needed to reconstruct the overall journey sequence along with any
associated sub-processes.
Data element Description Example value Process name Defines the name by which the
Process within a PJ is commonly known
Allocate woman to midwife
Process description Describes the process and its purpose
Allocates a woman to a named midwife following positive suitability assessment
Responsible department
Department that has been assigned responsibility for a given process
Maternity
Pre-condition Business rule describing what conditions must be met before this process can commence
Woman’s details entered into RMDB
Post-condition Business rule describing what conditions must have been met before execution can continue to the next process
Woman’s allocation details added to booking register
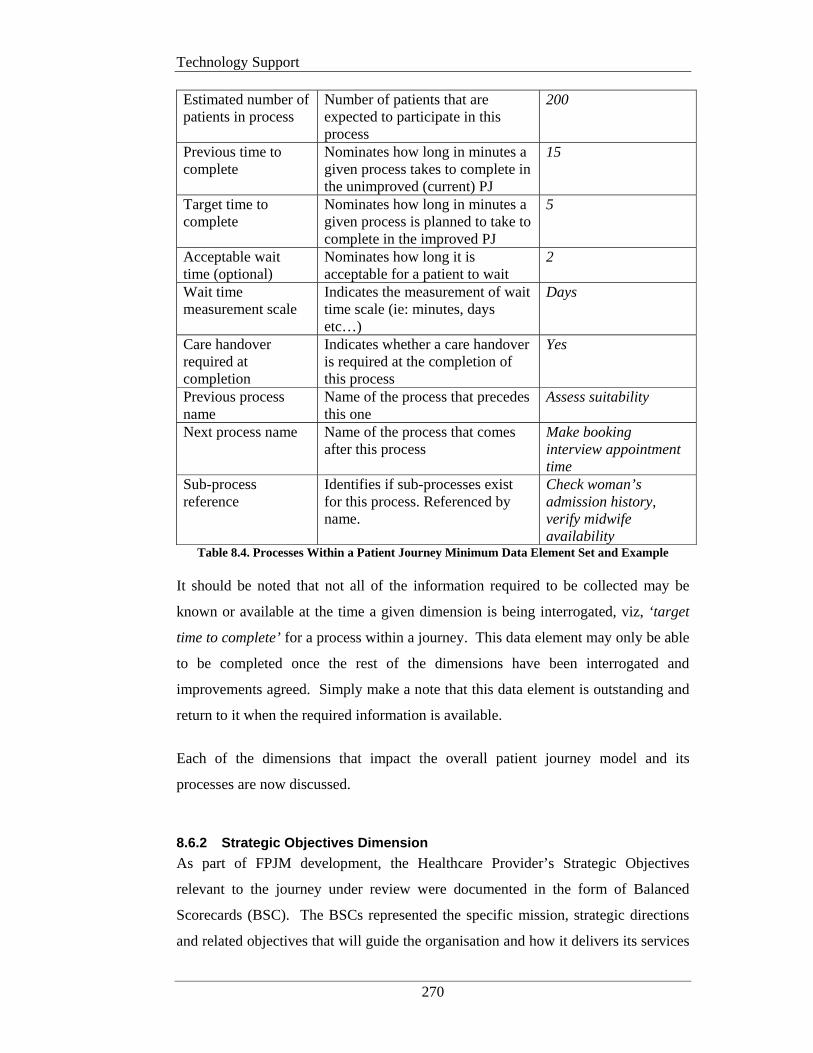
Technology Support
270
Estimated number of patients in process
Number of patients that are expected to participate in this process
200
Previous time to complete
Nominates how long in minutes a given process takes to complete in the unimproved (current) PJ
15
Target time to complete
Nominates how long in minutes a given process is planned to take to complete in the improved PJ
5
Acceptable wait time (optional)
Nominates how long it is acceptable for a patient to wait
2
Wait time measurement scale
Indicates the measurement of wait time scale (ie: minutes, days etc…)
Days
Care handover required at completion
Indicates whether a care handover is required at the completion of this process
Yes
Previous process name
Name of the process that precedes this one
Assess suitability
Next process name Name of the process that comes after this process
Make booking interview appointment time
Sub-process reference
Identifies if sub-processes exist for this process. Referenced by name.
Check woman’s admission history, verify midwife availability
Table 8.4. Processes Within a Patient Journey Minimum Data Element Set and Example It should be noted that not all of the information required to be collected may be
known or available at the time a given dimension is being interrogated, viz, ‘target
time to complete’ for a process within a journey. This data element may only be able
to be completed once the rest of the dimensions have been interrogated and
improvements agreed. Simply make a note that this data element is outstanding and
return to it when the required information is available.
Each of the dimensions that impact the overall patient journey model and its
processes are now discussed.
8.6.2 Strategic Objectives Dimension
As part of FPJM development, the Healthcare Provider’s Strategic Objectives
relevant to the journey under review were documented in the form of Balanced
Scorecards (BSC). The BSCs represented the specific mission, strategic directions
and related objectives that will guide the organisation and how it delivers its services
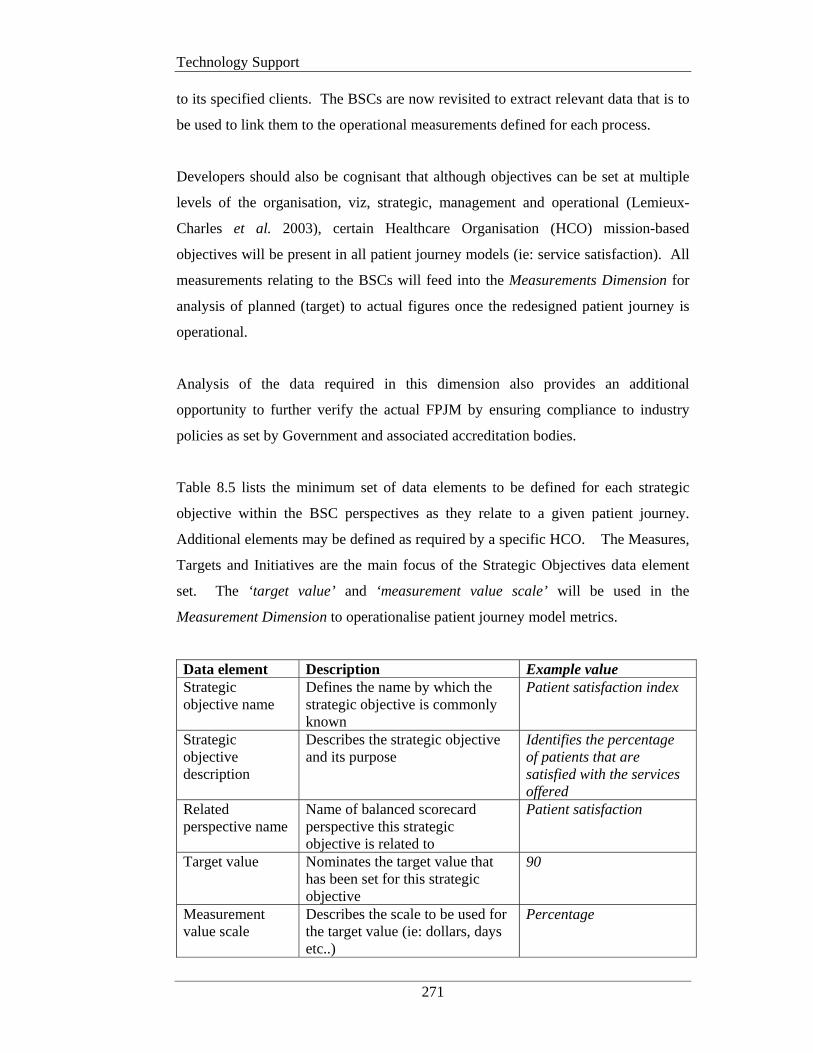
Technology Support
271
to its specified clients. The BSCs are now revisited to extract relevant data that is to
be used to link them to the operational measurements defined for each process.
Developers should also be cognisant that although objectives can be set at multiple
levels of the organisation, viz, strategic, management and operational (Lemieux-
Charles et al. 2003), certain Healthcare Organisation (HCO) mission-based
objectives will be present in all patient journey models (ie: service satisfaction). All
measurements relating to the BSCs will feed into the Measurements Dimension for
analysis of planned (target) to actual figures once the redesigned patient journey is
operational.
Analysis of the data required in this dimension also provides an additional
opportunity to further verify the actual FPJM by ensuring compliance to industry
policies as set by Government and associated accreditation bodies.
Table 8.5 lists the minimum set of data elements to be defined for each strategic
objective within the BSC perspectives as they relate to a given patient journey.
Additional elements may be defined as required by a specific HCO. The Measures,
Targets and Initiatives are the main focus of the Strategic Objectives data element
set. The ‘target value’ and ‘measurement value scale’ will be used in the
Measurement Dimension to operationalise patient journey model metrics.
Data element Description Example value Strategic objective name
Defines the name by which the strategic objective is commonly known
Patient satisfaction index
Strategic objective description
Describes the strategic objective and its purpose
Identifies the percentage of patients that are satisfied with the services offered
Related perspective name
Name of balanced scorecard perspective this strategic objective is related to
Patient satisfaction
Target value Nominates the target value that has been set for this strategic objective
90
Measurement value scale
Describes the scale to be used for the target value (ie: dollars, days etc..)
Percentage
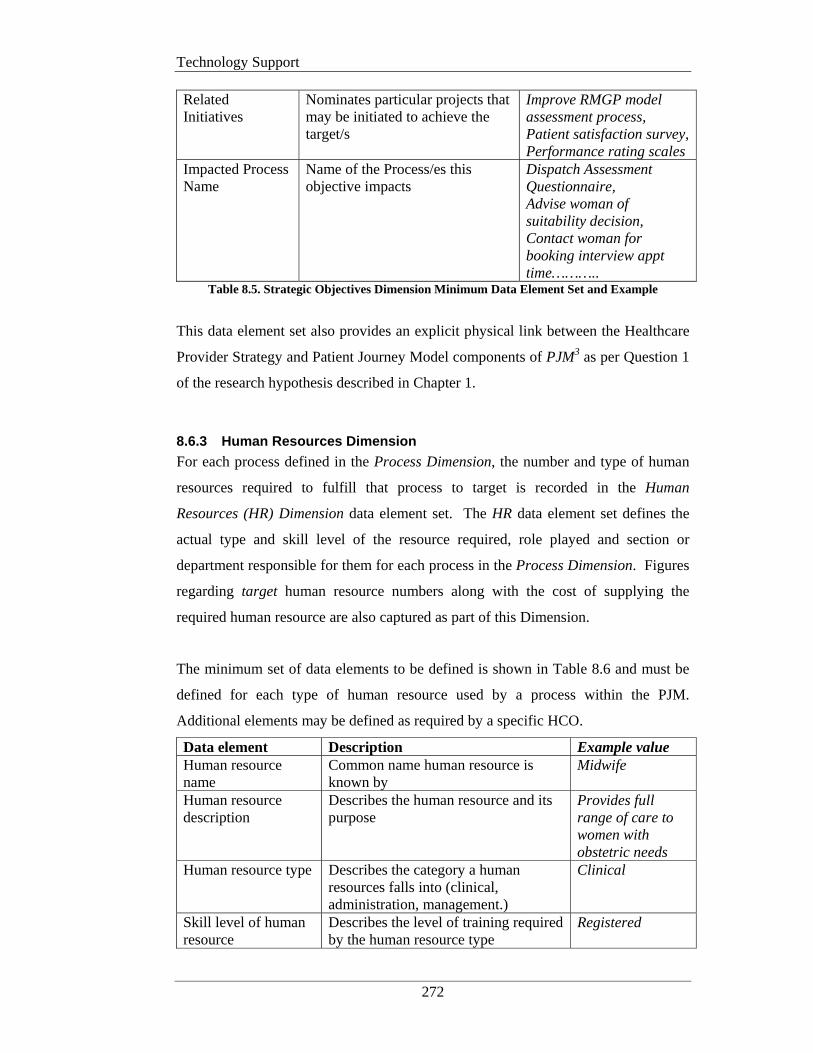
Technology Support
272
Related Initiatives
Nominates particular projects that may be initiated to achieve the target/s
Improve RMGP model assessment process, Patient satisfaction survey, Performance rating scales
Impacted Process Name
Name of the Process/es this objective impacts
Dispatch Assessment Questionnaire, Advise woman of suitability decision, Contact woman for booking interview appt time………..
Table 8.5. Strategic Objectives Dimension Minimum Data Element Set and Example
This data element set also provides an explicit physical link between the Healthcare
Provider Strategy and Patient Journey Model components of PJM3 as per Question 1
of the research hypothesis described in Chapter 1.
8.6.3 Human Resources Dimension
For each process defined in the Process Dimension, the number and type of human
resources required to fulfill that process to target is recorded in the Human
Resources (HR) Dimension data element set. The HR data element set defines the
actual type and skill level of the resource required, role played and section or
department responsible for them for each process in the Process Dimension. Figures
regarding target human resource numbers along with the cost of supplying the
required human resource are also captured as part of this Dimension.
The minimum set of data elements to be defined is shown in Table 8.6 and must be
defined for each type of human resource used by a process within the PJM.
Additional elements may be defined as required by a specific HCO.
Data element Description Example value Human resource name
Common name human resource is known by
Midwife
Human resource description
Describes the human resource and its purpose
Provides full range of care to women with obstetric needs
Human resource type Describes the category a human resources falls into (clinical, administration, management.)
Clinical
Skill level of human resource
Describes the level of training required by the human resource type
Registered

Technology Support
273
Role Describes the role this human resource plays in this process
Assessing Midwife
Cost per hour Dollar cost per hour for the human resource
$30.00
Reports to department
Name of department human resource reports to
Maternity
Process name Process within a PJ that the human resource participates in
Allocate woman to midwife
Number required for process
Nominates how many of the given human resource is required for this process
1
Table 8.6. Human Resources Dimension Minimum Data Element Set and Example NB: A row is required for each role played by a human resource in a particular process.
8.6.4 Physical Resources Dimension
The Physical Resources Dimension describes what and how many of each physical
resource such as, space and equipment, (excluding human resources), are required to
support the activities described for each process in the Process Dimension. The size
(if applicable), number available, number required and responsible department are
also defined. Financials for each physical resource must also be calculated. The
calculated cost per hour must take into account the initial purchase cost and any on-
going maintenance fees for required equipment.
The minimum set of data elements to be defined is shown in Table 8.7 and must be
defined for each type of physical resource used by a process within the PJM.
Additional elements may be defined as required by a specific HCO.
Data element Description Example Physical resource name
Name physical resource is known by Ultrasound machine
Physical resource description
Describes physical resource and its purpose
Provides ultrasonic pictures of human body
Physical resource type Describes type of physical resource (room, equipment etc..)
Equipment
Physical resource size (optional)
Denotes size of physical resource required (ie: 3m x 3m [room])
NA
Cost per hour Dollar cost of using physical resource per hour
$25.00
Responsible department
Name of department responsible for physical resource
Maternity
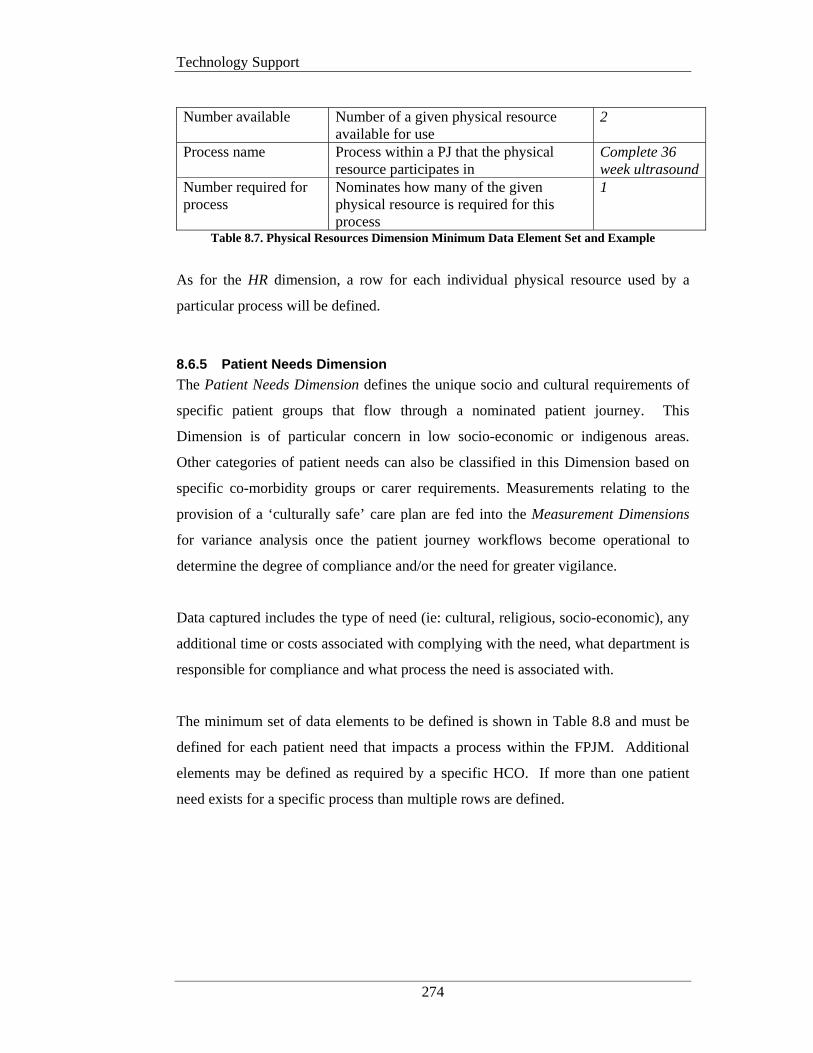
Technology Support
274
Number available Number of a given physical resource
available for use 2
Process name Process within a PJ that the physical resource participates in
Complete 36 week ultrasound
Number required for process
Nominates how many of the given physical resource is required for this process
1
Table 8.7. Physical Resources Dimension Minimum Data Element Set and Example
As for the HR dimension, a row for each individual physical resource used by a
particular process will be defined.
8.6.5 Patient Needs Dimension
The Patient Needs Dimension defines the unique socio and cultural requirements of
specific patient groups that flow through a nominated patient journey. This
Dimension is of particular concern in low socio-economic or indigenous areas.
Other categories of patient needs can also be classified in this Dimension based on
specific co-morbidity groups or carer requirements. Measurements relating to the
provision of a ‘culturally safe’ care plan are fed into the Measurement Dimensions
for variance analysis once the patient journey workflows become operational to
determine the degree of compliance and/or the need for greater vigilance.
Data captured includes the type of need (ie: cultural, religious, socio-economic), any
additional time or costs associated with complying with the need, what department is
responsible for compliance and what process the need is associated with.
The minimum set of data elements to be defined is shown in Table 8.8 and must be
defined for each patient need that impacts a process within the FPJM. Additional
elements may be defined as required by a specific HCO. If more than one patient
need exists for a specific process than multiple rows are defined.
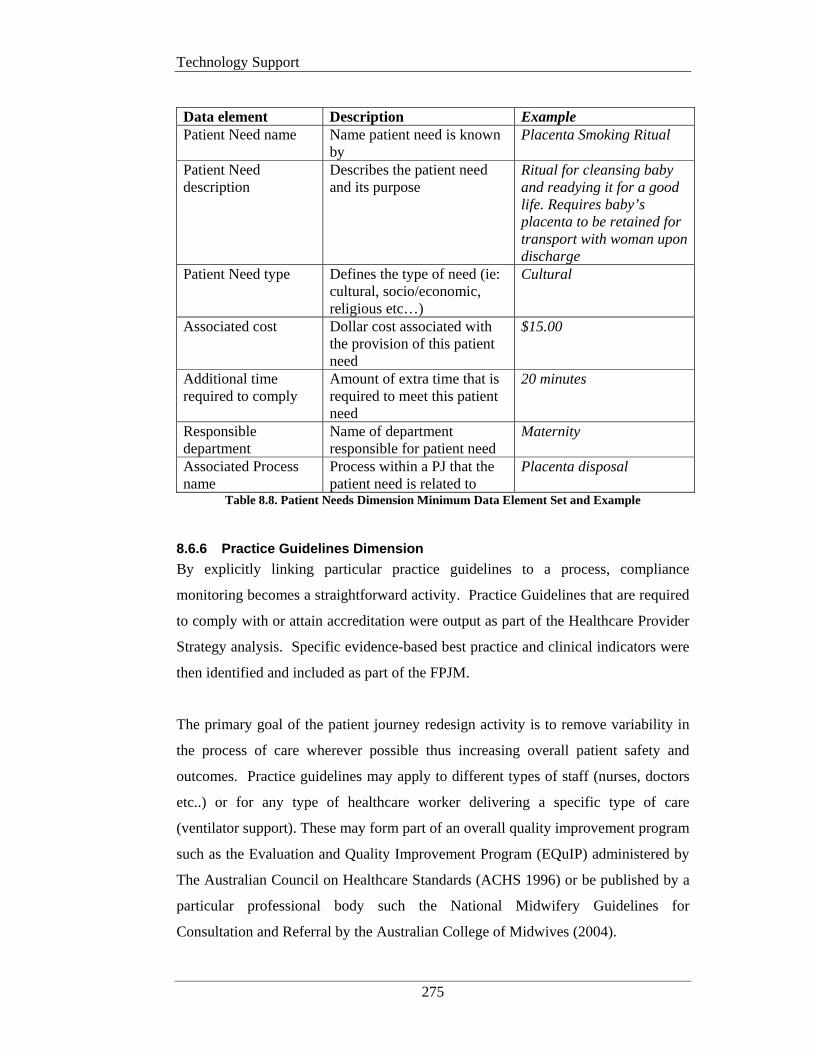
Technology Support
275
Data element Description Example Patient Need name Name patient need is known
by Placenta Smoking Ritual
Patient Need description
Describes the patient need and its purpose
Ritual for cleansing baby and readying it for a good life. Requires baby’s placenta to be retained for transport with woman upon discharge
Patient Need type Defines the type of need (ie: cultural, socio/economic, religious etc…)
Cultural
Associated cost Dollar cost associated with the provision of this patient need
$15.00
Additional time required to comply
Amount of extra time that is required to meet this patient need
20 minutes
Responsible department
Name of department responsible for patient need
Maternity
Associated Process name
Process within a PJ that the patient need is related to
Placenta disposal
Table 8.8. Patient Needs Dimension Minimum Data Element Set and Example
8.6.6 Practice Guidelines Dimension
By explicitly linking particular practice guidelines to a process, compliance
monitoring becomes a straightforward activity. Practice Guidelines that are required
to comply with or attain accreditation were output as part of the Healthcare Provider
Strategy analysis. Specific evidence-based best practice and clinical indicators were
then identified and included as part of the FPJM.
The primary goal of the patient journey redesign activity is to remove variability in
the process of care wherever possible thus increasing overall patient safety and
outcomes. Practice guidelines may apply to different types of staff (nurses, doctors
etc..) or for any type of healthcare worker delivering a specific type of care
(ventilator support). These may form part of an overall quality improvement program
such as the Evaluation and Quality Improvement Program (EQuIP) administered by
The Australian Council on Healthcare Standards (ACHS 1996) or be published by a
particular professional body such the National Midwifery Guidelines for
Consultation and Referral by the Australian College of Midwives (2004).
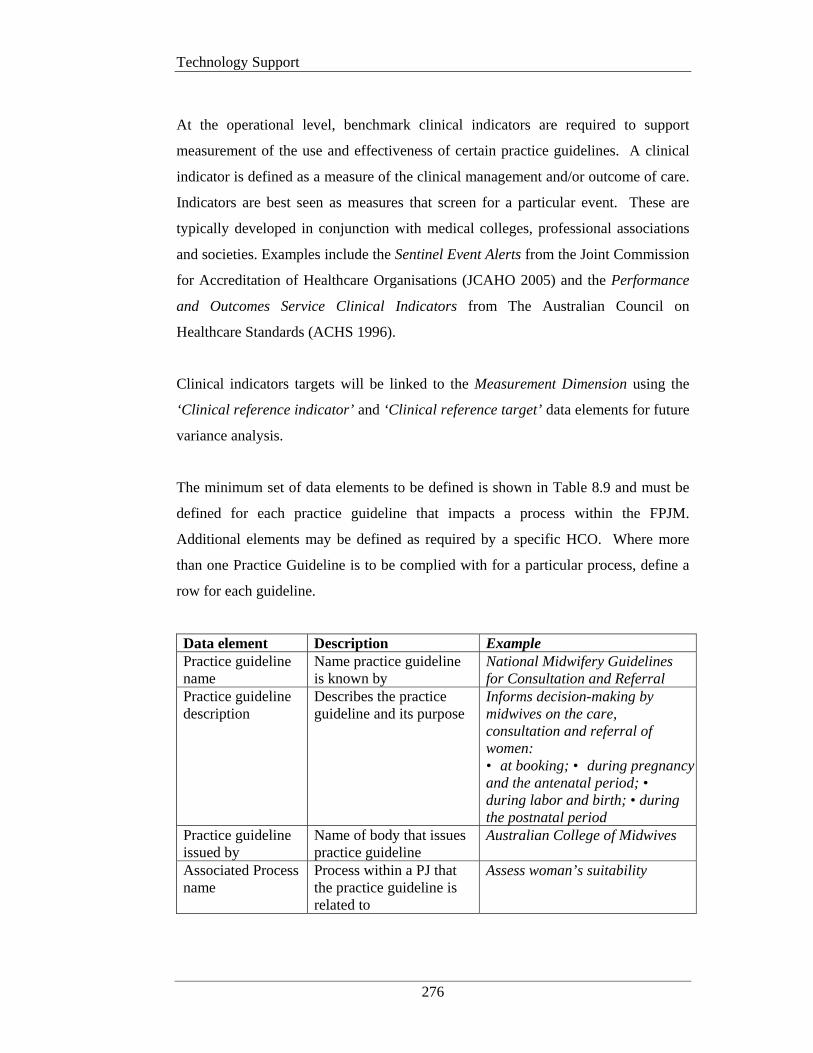
Technology Support
276
At the operational level, benchmark clinical indicators are required to support
measurement of the use and effectiveness of certain practice guidelines. A clinical
indicator is defined as a measure of the clinical management and/or outcome of care.
Indicators are best seen as measures that screen for a particular event. These are
typically developed in conjunction with medical colleges, professional associations
and societies. Examples include the Sentinel Event Alerts from the Joint Commission
for Accreditation of Healthcare Organisations (JCAHO 2005) and the Performance
and Outcomes Service Clinical Indicators from The Australian Council on
Healthcare Standards (ACHS 1996).
Clinical indicators targets will be linked to the Measurement Dimension using the
‘Clinical reference indicator’ and ‘Clinical reference target’ data elements for future
variance analysis.
The minimum set of data elements to be defined is shown in Table 8.9 and must be
defined for each practice guideline that impacts a process within the FPJM.
Additional elements may be defined as required by a specific HCO. Where more
than one Practice Guideline is to be complied with for a particular process, define a
row for each guideline.
Data element Description Example Practice guideline name
Name practice guideline is known by
National Midwifery Guidelines for Consultation and Referral
Practice guideline description
Describes the practice guideline and its purpose
Informs decision-making by midwives on the care, consultation and referral of women: • at booking; • during pregnancy and the antenatal period; • during labor and birth; • during the postnatal period
Practice guideline issued by
Name of body that issues practice guideline
Australian College of Midwives
Associated Process name
Process within a PJ that the practice guideline is related to
Assess woman’s suitability
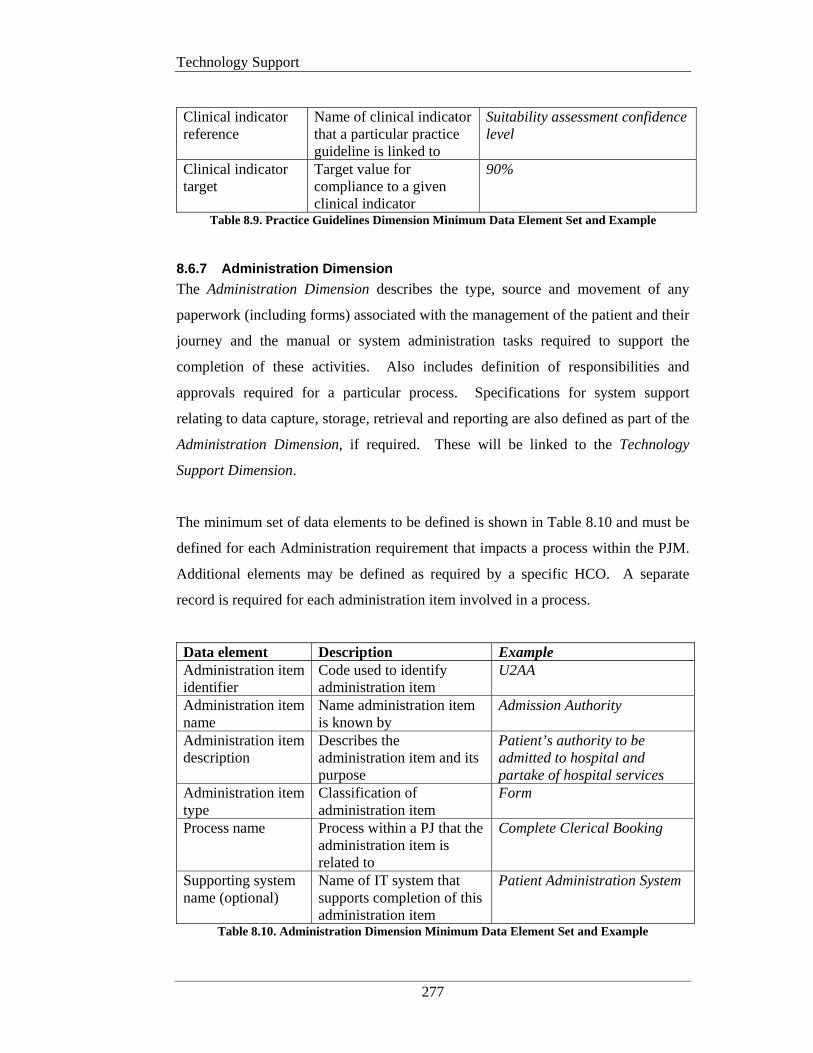
Technology Support
277
Clinical indicator reference
Name of clinical indicator that a particular practice guideline is linked to
Suitability assessment confidence level
Clinical indicator target
Target value for compliance to a given clinical indicator
90%
Table 8.9. Practice Guidelines Dimension Minimum Data Element Set and Example
8.6.7 Administration Dimension
The Administration Dimension describes the type, source and movement of any
paperwork (including forms) associated with the management of the patient and their
journey and the manual or system administration tasks required to support the
completion of these activities. Also includes definition of responsibilities and
approvals required for a particular process. Specifications for system support
relating to data capture, storage, retrieval and reporting are also defined as part of the
Administration Dimension, if required. These will be linked to the Technology
Support Dimension.
The minimum set of data elements to be defined is shown in Table 8.10 and must be
defined for each Administration requirement that impacts a process within the PJM.
Additional elements may be defined as required by a specific HCO. A separate
record is required for each administration item involved in a process.
Data element Description Example Administration item identifier
Code used to identify administration item
U2AA
Administration item name
Name administration item is known by
Admission Authority
Administration item description
Describes the administration item and its purpose
Patient’s authority to be admitted to hospital and partake of hospital services
Administration item type
Classification of administration item
Form
Process name Process within a PJ that the administration item is related to
Complete Clerical Booking
Supporting system name (optional)
Name of IT system that supports completion of this administration item
Patient Administration System
Table 8.10. Administration Dimension Minimum Data Element Set and Example
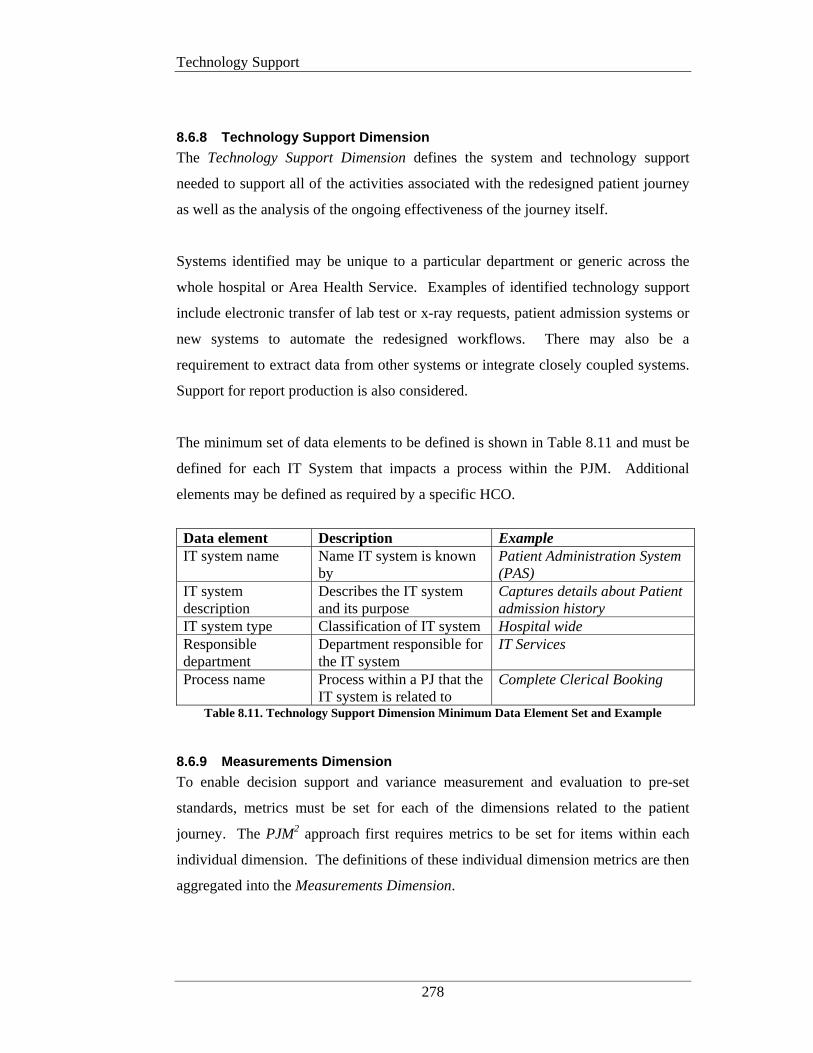
Technology Support
278
8.6.8 Technology Support Dimension
The Technology Support Dimension defines the system and technology support
needed to support all of the activities associated with the redesigned patient journey
as well as the analysis of the ongoing effectiveness of the journey itself.
Systems identified may be unique to a particular department or generic across the
whole hospital or Area Health Service. Examples of identified technology support
include electronic transfer of lab test or x-ray requests, patient admission systems or
new systems to automate the redesigned workflows. There may also be a
requirement to extract data from other systems or integrate closely coupled systems.
Support for report production is also considered.
The minimum set of data elements to be defined is shown in Table 8.11 and must be
defined for each IT System that impacts a process within the PJM. Additional
elements may be defined as required by a specific HCO.
Data element Description Example IT system name Name IT system is known
by Patient Administration System (PAS)
IT system description
Describes the IT system and its purpose
Captures details about Patient admission history
IT system type Classification of IT system Hospital wide Responsible department
Department responsible for the IT system
IT Services
Process name Process within a PJ that the IT system is related to
Complete Clerical Booking
Table 8.11. Technology Support Dimension Minimum Data Element Set and Example
8.6.9 Measurements Dimension
To enable decision support and variance measurement and evaluation to pre-set
standards, metrics must be set for each of the dimensions related to the patient
journey. The PJM2 approach first requires metrics to be set for items within each
individual dimension. The definitions of these individual dimension metrics are then
aggregated into the Measurements Dimension.
Technology Support
279
The strategic objectives outlined in the Strategic Objectives Dimension and
benchmark targets from accreditation bodies and other acknowledged high quality
similar services drive the definition of the metrics in the Measurements Dimensions.
There are no maximum limits to the number of metrics (measurements) that can be
set but there must be at least one measurement set, for each of the dimensions
previously discussed.
Lemieux_Charles et al (2003) suggested that there are in fact multiple levels to be
considered when developing performance measures within health care organisations
(HCO).
This work built on the three levels identified by Parsons in 1960 and were described
as:
• Technical – transforms production inputs into outputs;
• Managerial – administers and procures essential resources for the technical
production system; and
• Institutional – relates the organisation to its environment and attempts to
secure legitimacy.
Also impacting the development of performance indicators in HCOs are the
constraints of a variety of occupational and professional standards that operational
procedures and human resources must subscribe to (Scott et al. 2000). All of these
issues see differing levels of importance placed on different performance indicators
by staff at each level. Institutional indicators typically look at efficiency and cost
containment whereas Technical and Managerial indicators are more concerned with
items such as quality of patient care and up-to-date training.
The PJM2 conceptual design caters for differing measurement levels through the use
of multiple dimensions such as the Technology Support, Patient Journey and
Strategic Objectives dimensions. In Chapter 7, PaJMa demonstrated how the actual
patient journey model is layered, further supporting a multi-level approach to
measurement definition.

Technology Support
280
Table 8.12 gives some examples of generic areas that should be considered when
defining measurements for the processes within a patient journey.
Measurement Indicator Description # Patient Movements The number of times a patient is physically
moved/transferred between locations, either within the hospital or externally
Target Process Time The amount of time in minutes a process in the patient journey should take to complete
Actual Process Time The amount of time in minutes a process in the patient journey actually took to complete
# of Adverse Events Type of Adverse Event
The type and number of adverse events that were recorded in a given time period
Length of Stay (LOS) How long the patient spent in the healthcare organisation
Laboratory Turnaround Time
The time from the placement of a lab test request until the test results are returned
Entity Responsible The actual position, role, section or department responsible for a patient’s movement, treatment stream or information initiation and/or flow
Service Level Targets Pre-defined measurements and targets for a given activity. Derived from strategic objectives
Resource Usage What and how many of each associated resource including staff, space and equipment are being used by the activity
Activity Cost Actual financial cost associated with the execution of a given activity
Table 8.12 Examples of Generic Patient Journey Metrics
The minimum set of data elements to be defined for the measurement dimension is
shown in Table 8.13. Additional elements may be defined as required by a specific
HCO. A separate record is required for each individual measurement that is
associated with a process.
Data element Description Example Measurement name Name measurement is
known by Process Time
Measurement description
Long description of measurement
Estimated time process will take to complete
Measurement type Describes type of measurement (original, target, actual)
Target
Measurement value scale
Scale used to describe measurement value
Minutes
Measurement target value
Value expected to be achieved
7
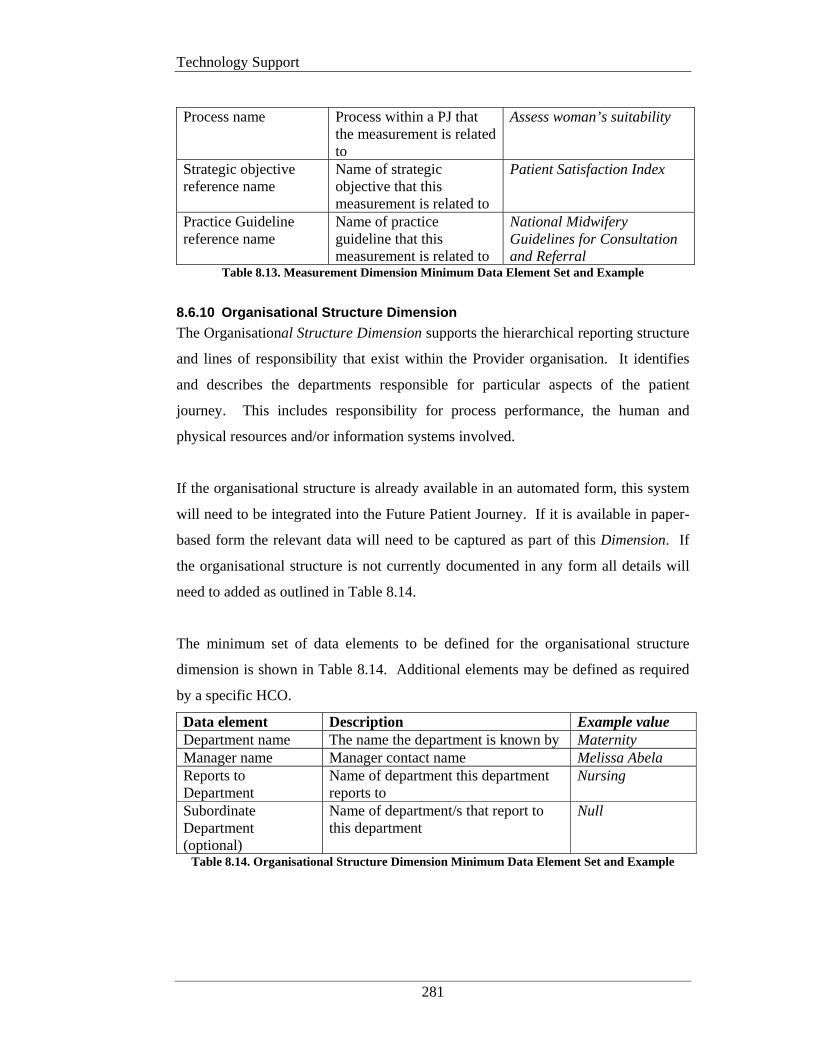
Technology Support
281
Process name Process within a PJ that
the measurement is related to
Assess woman’s suitability
Strategic objective reference name
Name of strategic objective that this measurement is related to
Patient Satisfaction Index
Practice Guideline reference name
Name of practice guideline that this measurement is related to
National Midwifery Guidelines for Consultation and Referral
Table 8.13. Measurement Dimension Minimum Data Element Set and Example
8.6.10 Organisational Structure Dimension
The Organisational Structure Dimension supports the hierarchical reporting structure
and lines of responsibility that exist within the Provider organisation. It identifies
and describes the departments responsible for particular aspects of the patient
journey. This includes responsibility for process performance, the human and
physical resources and/or information systems involved.
If the organisational structure is already available in an automated form, this system
will need to be integrated into the Future Patient Journey. If it is available in paper-
based form the relevant data will need to be captured as part of this Dimension. If
the organisational structure is not currently documented in any form all details will
need to added as outlined in Table 8.14.
The minimum set of data elements to be defined for the organisational structure
dimension is shown in Table 8.14. Additional elements may be defined as required
by a specific HCO.
Data element Description Example value Department name The name the department is known by Maternity Manager name Manager contact name Melissa Abela Reports to Department
Name of department this department reports to
Nursing
Subordinate Department (optional)
Name of department/s that report to this department
Null
Table 8.14. Organisational Structure Dimension Minimum Data Element Set and Example

Technology Support
282
8.6.11 Multidimensional Database Design
Multidimensional approaches as conceptualised in PJM2 have been recognised as
being of significance to other types of organisations such as manufacturing,
insurance, banking and travel (Inmon 1996; Kimball 1996) and can be implemented
using multi-dimensional database structures. Such database designs are seen most
commonly in data warehouse architectures that support executive and management
information systems and decision support systems (DSS) as discussed in Chapter 3.
The use of DSS within the PJM3 meta-methodology was discussed in Chapter 4.
As can be seen from the preceding sections, development of a patient journey model
using the PJM2 framework involves the collection of a considerable amount of data.
How then will this data be used as part of implementing the Future Patient Journey
Model? The data collected serves two critical roles:
1) Definition of the strategic objectives dimension and integration with the other
dimensions provides the basis for operational alignment of the healthcare
improvement outcomes to the long term strategic directions of the HCO and
the benchmark for ongoing performance measurement.
2) Definition of the Patient Journey Model and other dimensions provides the
operational measurement data for managerial monitoring and control of
implemented improvements.
It is only through the rigorous definition of the required data that management will
be able to ascertain whether implemented improvements are actually making things
better or if further improvements are still necessary to reach the required targets.
Part of the physical model development includes designing the multi-dimensional
database structure that will support variance analysis and management reporting for
the purposes of monitoring the performance of the new patient journey. Use of a
multi-dimensional approach allows the data to be sliced and diced in a variety of
ways accommodating complex management querying of identified variances.
Analysis of causal relationships of acknowledged variances is provided via a ‘drill-
down’ facility to the contributing dimensional data.

Technology Support
283
In the arena of healthcare improvement any implemented change to the existing
patient journey must be assessed to determine if the change has made a difference
and is actually enhancing the delivery of care and outcomes.
Due to the complexity and number of the items involved in healthcare improvement,
navigation of the data elements required for variance analysis and reporting can be
extremely complex. This is not conducive to efficient management activity and
where possible database structures should be simplified to allow for increased
understanding of the data and more effective analysis by the user (Kimball 1996).
This suggests that a multidimensional database approach would provide the best
support for a MDSS for healthcare improvement monitoring.
Figure 8.4 shows the basic design of the star schema for the purposes of a MDSS for
healthcare improvement monitoring. It is based on the PJM2 framework and the data
collected during the development of the Future Patient Journey Model, as discussed
in the previous sections.
Figure 8.4. Star Schema for a Management Decision Support System for
Healthcare Improvement Monitoring
The fact table (center) is where the numerical measurements for the Patient Journey
are stored. This table allows for succinct variance analysis and provides the
Technology Support
284
justification for continuance of implemented improvements or further changes. In
this star schema, the fact table is called the Patient Journey Process Enactment fact
table. This table represents the summarised results of the movement of a patient
through each process in the Journey. These results (actuals) are then compared with
the target (planned) values to determine if an improved process is under or over
performing.
The dimension tables are where the textual description of the dimensions for the
Journey are stored. Each textual description helps to describe a particular value in
the respective dimension table (ie: each record in the patient dimension represents a
specific patient that has been involved with a specific process in a patient journey.
Most of the dimension tables that are joined to the fact table are the same as those
discussed in Sections 6.2.1 to 6.2.10. Those dimensional tables that are new or that
have been combined into other tables require a brief explanation.
Time Dimension: When a process is enacted, it occurs at a certain point in time,
hence the need to add a time characteristic when moving from design to
implementation. The Time dimension represents a new group of attributes that
facilitate the grouping of data values into various time periods. Invariably when
management are analysing the Patient Journey, they will be interested in this data
over a period of time such as a week, month, season etc… Definition of these time
series is recorded in the time dimension and the relevant key that identifies a
required time series is the joining attribute in the fact table. For example, the month
of September is represented as ‘9’ in the ‘month_number_overall’ attribute in the
‘time dimension’. This means that each day in the month of September can be
summarised by the database and presented as a monthly slice of data.
Thus if the analyst wishes to query the volume or type of patients in a journey for the
month of September, they would only have to specify the ‘month_number_overall =
9’ and the database would understand that it was required to return a summary value
representing all of the individual days values for the month of September. Storing
the data using a time series allows analysts to summarise data at varying levels and
to compare equivalent time series (ie: months) over time.

Technology Support
285
Patient Dimension: The Patient dimension represents a new group of attributes that
facilitate deeper analysis of an identified variance for a particular patient. If
management identifies an unexpected variance they usually want to find out more
about why and under what circumstances the variance occurred. Typically they will
try to ascertain if there were certain circumstances about a patient that led to the
variability. By linking to the Patient dimension through the patient_key, analysts
can drill down to the individual patient information. Further analysis by nationality,
age or sex etc… is then possible and can assist in determining if the same variability
is occurring consistently for a given group. If this is case, further enhancements
must be made to the patient journey for the affected population.
Each dimensional table provides the fact table with a key to more detailed data in
that dimension and through the navigation of the dimensional keys, the analyst can
drill down to discover additional information about a particular variance occurrence.
Strategic Objectives dimension: The Strategic Objectives dimension discussed in
section 6.2.2 has been normalised into the Measurement dimension table in the star
schema (Codd 1970). In real terms a strategic objective target is the combination of
a number of operational measurements at a higher level of summarisation. To this
end, the data elements previously defined are similar to those already defined for the
Measurement dimension. By adding a reference to the Strategic Objective that a
given measurement relates to we can navigate this link as required.
Organisational Structure dimension: The data elements discussed in section
6.2.10 are actually only a reference table that serves to define the hierarchical
reporting structure of the organisation. A benefit of the MDSS database is the ability
to identify responsible departments and lines of reporting. This necessitated the
inclusion of a responsible department attribute in the relevant dimension tables.
Linking to the reference table for hierarchical reasons is achieved through the use of
an additional ‘outer join’ statement as part of an SQL query. Reference table
attributes are as shown in Table 8.15. NB: A row would exist for each subordinate
department.

Technology Support
286
Organisational Structure department_key
department_name
manager_name
reports_to_department_key
subordinate_department_key
Table 8.15. Organisational Structure Reference Table
8.6.11.1 Dimension Tables
Figure 8.5 shows the data attributes for each dimension table defined in the new
multi-dimensional database design. In general the base data attributes shown in the
database design are the same as those discussed in the relevant data element sections
above. Where changes have been required, explanation as to what the changes are
and why they have been made are included after the diagram. In all cases a system
generated key to assist with query response performance has been added to each
table. Other modification relate predominately to changes regarding database
normalisation (Codd 1970).

Technology Support
287
Figure 8.5. Multi-dimensional Database Design for MDSS - Dimension Table Attributes
Technology Support
288
Patient Journey Dimension Table
The patient journey dimension table is unchanged from the data element set defined
in section 6.2.1 except for the addition of a system generated key to assist with query
response performance.
Process Dimension Table
The Process Dimension table contains the same attributes as those described in
section 6.2.1 except for the addition of a process_key for performance reasons.
Other changes include:
• Data element normalisation of the ‘target time to complete’ and ‘acceptable
wait time’ value fields to the Patient Journey Process Enactment Fact Table
(as target_process_time and target_wait_time respectively).
• Addition of the name, description and scale for the above ‘time’ attributes to
the Measurement dimension table.
• Addition of ‘previous process name’ and ‘next process name’ fields to the
Patient Journey Process Enactment Fact Table (as process_predessor_key
and process_successor_key respectively).
Time Dimension Table
As mentioned above the Time Dimension table is a new table that is used to identify
time periods for the purposes of measurement summarisation. The data attributes
within the time dimension permit the rolling up of days into weeks, weeks into
months and months into quarters, seasons and fiscal years. It also aids in the
identification of specific holidays and special events.
Patient Dimension Table
The Patient Dimension table is a new table that is required to support investigation
of process variances within a patient’s journey. It facilitates categorisation of
patients according to their presentation date, sex, age, socio/economic group or
location and nationality.

Technology Support
289
Human Resource Dimension table
The only changes in this table relate to the addition of the ‘HR_req_key’ attribute
and the data normalisation of the ‘number required for process’ attribute (as
target_number_HR_req) to the Patient Journey Process Enactment fact table.
Physical Resource Dimension table
The only changes in this table relate to the addition of the ‘phys_res_req_key’
attribute and the data normalisation of the ‘number required for process’ attribute (as
target_number_PhysRes_req) to the Patient Journey Process Enactment fact table.
Patient Need dimension table
The physical design of this table is unchanged from that discussed in section 6.2.5.
Practice Guideline dimension table
A new data attribute, ‘practice_GL_type’ has been added to this table. This attribute
indicates whether the practice guideline is required for accreditation purposes (ie: is
a clinical indicator) or has been set down as a legislative requirement, for example.
Other types can be defined by the HCO. The clinical indicator data elements have
been normalised to the measurement dimension table.
Administration and IT System dimension tables
No changes have been made to Administration data element set. The IT System data
elements are also the same except for the addition of the ‘IT_system_key’ attribute, a
system generated key to assist with query response performance.
Measurement dimension table
The Measurement Dimension table stores the descriptive attributes for each
measurement associated with a process. The value for the measurement as it relates
to a specific patient in a process is stored in the patient journey process enactment
fact table. It should be noted that each and every performance measure must be:
1. Linked explicitly to at least one strategic objective and
2. Be described and captured only once at the source of the actual activity
performance
Technology Support
290
The majority of attributes are the same as those described in section 6.2.9 except for
the addition of the ‘measurement_key’, ‘strategic_obj_perspective’ and
‘practice_GL_reference’ attributes.
The ‘strategic_obj_perspective’ attribute when combined with the
‘strategic_objective_reference’ attribute facilitates the linking of a measurement to a
specific strategic objective and balanced scorecard perspective. The importance of
linking each and every measurement to a strategic objective has been discussed
previously and provides a solution to hypothesis 1.
The ‘practice_GL_reference’ attribute supports the linking of measurements
associated with a specific practice guideline (ie: a clinical indicator). This attribute
is a foreign key to the ‘practice_GL_key’ in the Practice Guideline dimension table.
8.6.11.2 Fact Table
Patient Journey Process Enactment fact table
The Patient Journey Process Enactment Fact Table represents the summarised
results of the flow of a patient through each process in the journey. The fact table is
made up of the key from each and every related dimension table as well as additional
summarised information. Once a patient has passed through a particular journey,
actual details of their journey are transmitted to the data warehouse for variance
analysis and decision support. The actual results are then compared with the target
(planned) values to determine if an improved process is performing as expected or if
further patient journey enhancements are required.
The fact table is made up of a number of keys and associated summary data. The
data attributes contained in the Patient Journey Process Enactment Fact Table are
shown in Figure 8.6.
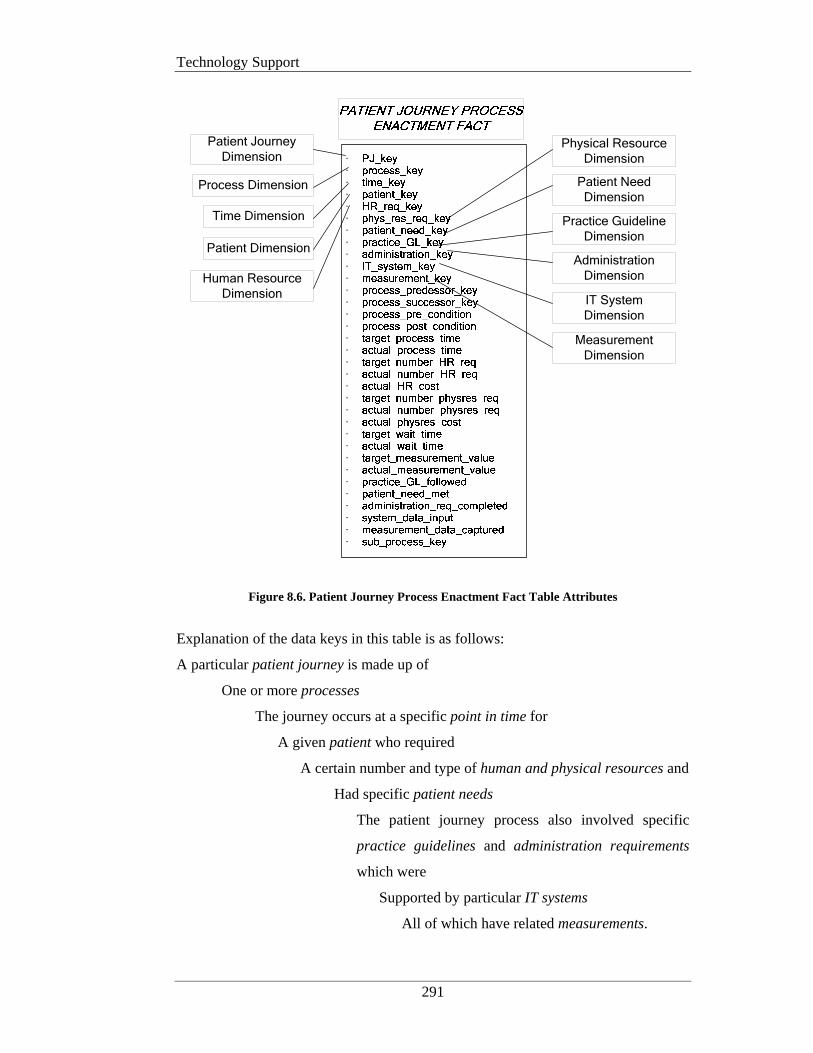
Technology Support
291
Time Dimension
Process Dimension
Patient Journey
Dimension
Patient Dimension
Human Resource
Dimension
Physical Resource
Dimension
Patient Need
Dimension
Practice Guideline
Dimension
Administration
Dimension
IT System
Dimension
Measurement
Dimension
·································
Figure 8.6. Patient Journey Process Enactment Fact Table Attributes
Explanation of the data keys in this table is as follows:
A particular patient journey is made up of
One or more processes
The journey occurs at a specific point in time for
A given patient who required
A certain number and type of human and physical resources and
Had specific patient needs
The patient journey process also involved specific
practice guidelines and administration requirements
which were
Supported by particular IT systems
All of which have related measurements.
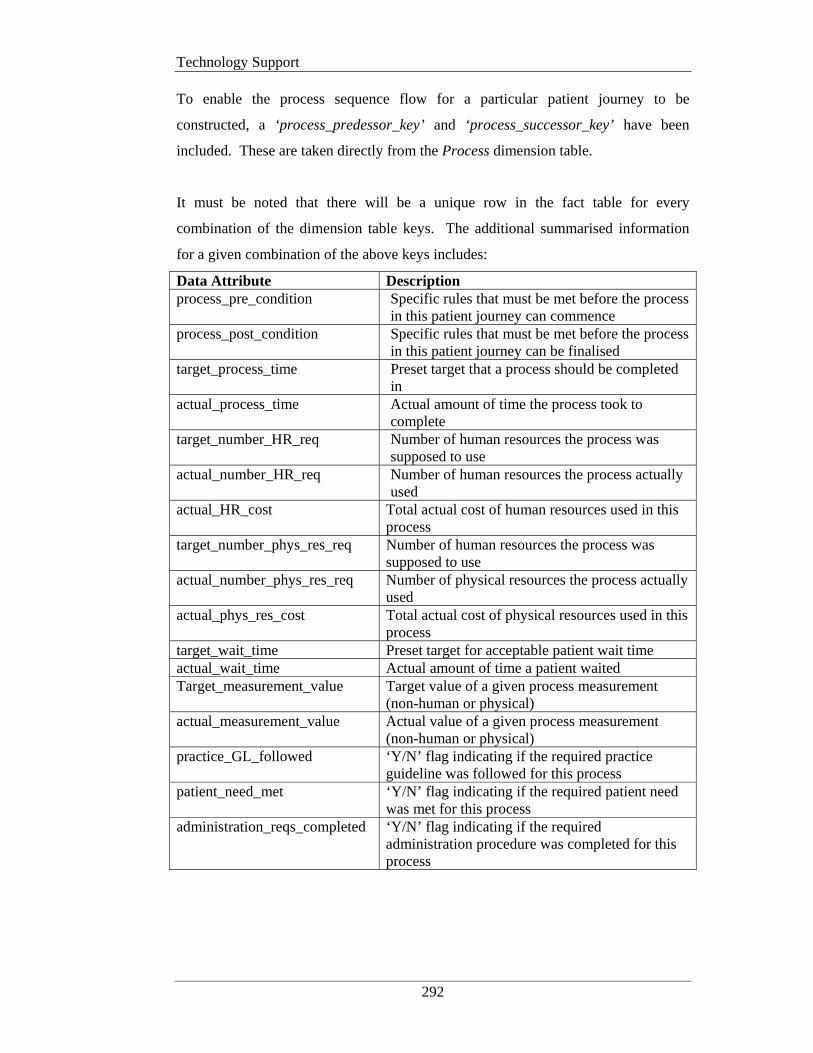
Technology Support
292
To enable the process sequence flow for a particular patient journey to be
constructed, a ‘process_predessor_key’ and ‘process_successor_key’ have been
included. These are taken directly from the Process dimension table.
It must be noted that there will be a unique row in the fact table for every
combination of the dimension table keys. The additional summarised information
for a given combination of the above keys includes:
Data Attribute Description process_pre_condition Specific rules that must be met before the process
in this patient journey can commence process_post_condition Specific rules that must be met before the process
in this patient journey can be finalised target_process_time Preset target that a process should be completed
in actual_process_time Actual amount of time the process took to
complete target_number_HR_req Number of human resources the process was
supposed to use actual_number_HR_req Number of human resources the process actually
used actual_HR_cost Total actual cost of human resources used in this
process target_number_phys_res_req Number of human resources the process was
supposed to use actual_number_phys_res_req Number of physical resources the process actually
used actual_phys_res_cost Total actual cost of physical resources used in this
process target_wait_time Preset target for acceptable patient wait time actual_wait_time Actual amount of time a patient waited Target_measurement_value Target value of a given process measurement
(non-human or physical) actual_measurement_value Actual value of a given process measurement
(non-human or physical) practice_GL_followed ‘Y/N’ flag indicating if the required practice
guideline was followed for this process patient_need_met ‘Y/N’ flag indicating if the required patient need
was met for this process administration_reqs_completed ‘Y/N’ flag indicating if the required
administration procedure was completed for this process

Technology Support
293
system_data_input ‘Y/N’ flag indicating if the required IT system
data was input for this process measurement_data_captured ‘Y/N’ flag indicating if all required measurements
for this process were captured sub_process_key Specifies the identifier of a sub-process (child)
relating to the patient journey process (parent) Table 8.16. Data Elements in the Fact Table
One of the attractions of using a multidimensional database approach is that it can be
implemented using a standard relational database product such as SQL Server. This
eliminates the need to purchase specialised software to store and manage the data
warehouse that supports the decision support system.
8.6.11.3 SQL Query and Report Example
Once the above data has been loaded into the data warehouse, a wide variety of
analysis is available. All analysis is conducted using standard Structured Query
Language (SQL). The following SQL example produces a report detailing which
processes within a patient journey are exceeding their ‘target_process_time’ by more
than 10 minutes for the month of January.
select j.PJ_name, p.process_name, f.target_process_time, f.actual_process_time,
(actual_process_time – target_process_time)
from patient_journey j, process p, patient_journey_process_enactment_fact f,
time t
where f.PJ_key = j.PJ_key
and f.process_key = p.process_key
and f.time_key = t.time_key
and t.month = ‘january’
and f.actual_process_time – f.target_process_time > 10
group by t.month, j.patient_journey_name
Figure 8.7. Example SQL query
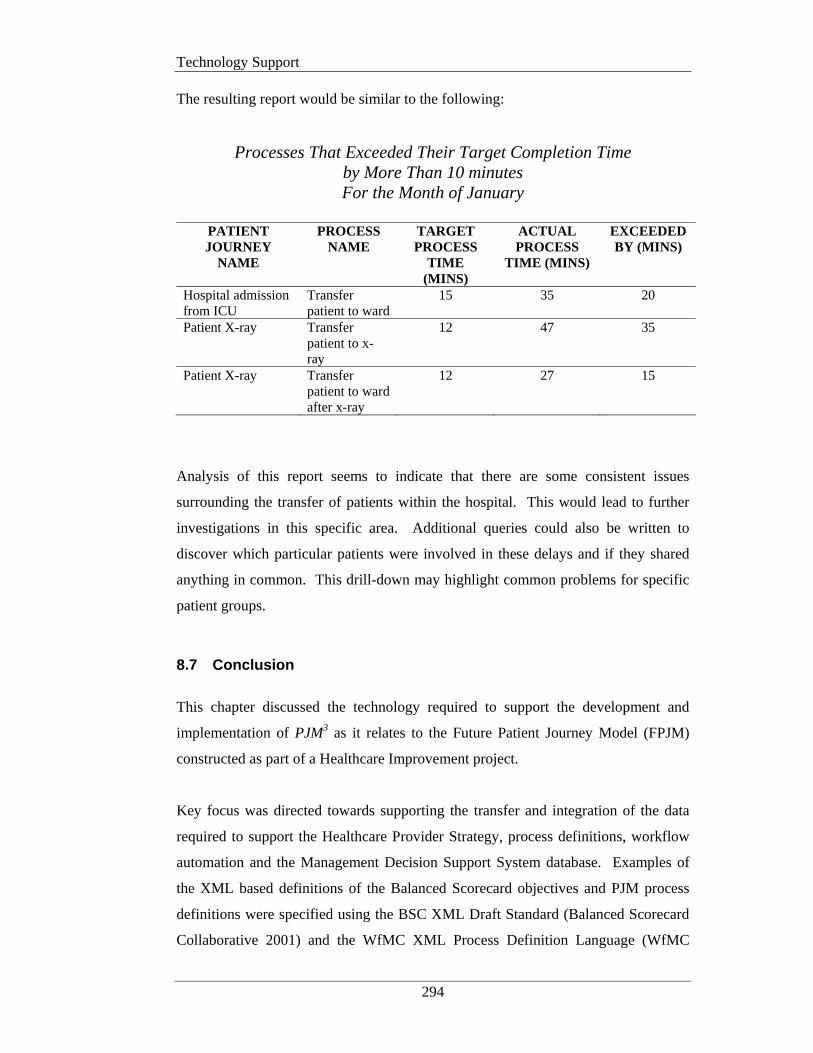
Technology Support
294
The resulting report would be similar to the following:
Processes That Exceeded Their Target Completion Time by More Than 10 minutes For the Month of January
PATIENT JOURNEY
NAME
PROCESS NAME
TARGET PROCESS
TIME (MINS)
ACTUAL PROCESS
TIME (MINS)
EXCEEDED BY (MINS)
Hospital admission from ICU
Transfer patient to ward
15 35 20
Patient X-ray Transfer patient to x-ray
12 47 35
Patient X-ray Transfer patient to ward after x-ray
12 27 15
Analysis of this report seems to indicate that there are some consistent issues
surrounding the transfer of patients within the hospital. This would lead to further
investigations in this specific area. Additional queries could also be written to
discover which particular patients were involved in these delays and if they shared
anything in common. This drill-down may highlight common problems for specific
patient groups.
8.7 Conclusion
This chapter discussed the technology required to support the development and
implementation of PJM3 as it relates to the Future Patient Journey Model (FPJM)
constructed as part of a Healthcare Improvement project.
Key focus was directed towards supporting the transfer and integration of the data
required to support the Healthcare Provider Strategy, process definitions, workflow
automation and the Management Decision Support System database. Examples of
the XML based definitions of the Balanced Scorecard objectives and PJM process
definitions were specified using the BSC XML Draft Standard (Balanced Scorecard
Collaborative 2001) and the WfMC XML Process Definition Language (WfMC
Technology Support
295
2005) respectively. To facilitate the requirements of the Healthcare domain and
PJM3 in particular, a number of enhancements to the XML standards were made.
The XML examples are included in Appendix B and C. These specifications provide
explicit linking of the core components of PJM3, namely the Healthcare Provider
Strategy to the Patient Journey Model and from the Patient Journey Model to the
Workflow and Decision Support System components as per research hypothesis 1.
The conceptual design of PJM2, provides a foundation for the specification of the
data needed to describe the multiple dimensions associated with a patient’s
movement through the Healthcare Organisation and the inter-relationship and
interactivity of these contributing dimensions.
This approach resulted in the development of a minimum set of data elements for
each dimension. The contents of the suggested data elements would be built up as
the patient journey model development progressed, leading to the collection of a
broad and significant dataset of patient journey information.
The information collected during the patient journey modeling activity was then
translated into a physical database design. This multidimensional database design
forms the basis for a Management Decision Support System (MDSS). The MDSS
provides the information required for ongoing monitoring and control of
implemented healthcare improvements and the identification and analysis of process
variance.
The examples of the technology described in this Chapter support research
hypothesis 4 as in Chapter 1; specifically that components of the framework can be
explicitly linked and enabled by readily available technology.
Thesis Conclusion and Future Work
296
CHAPTER 9 THESIS CONCLUSION AND FUTURE WORK
9.1 Summary and Research Hypotheses Solutions
This thesis addressed a significant issue within the healthcare domain - the lack of a
patient journey modeling framework, designed specifically for healthcare.
The research dealt primarily with modeling the manner in which healthcare is
delivered, that is ‘the system of care’. The underlying premise is that each aspect of
clinical care is made up of multiple processes and combining these processes creates
the ‘system of care’ for that particular task. Therefore unless you change and
improve the system there will not be an improvement in results, that is, outcomes. In
this research, analysis and redesign of the ‘system of care’ is represented via a
graphical process model or in healthcare terms a ‘Patient Journey Model’.
Patient Journey Modeling is a patient-centric activity that details a patient’s progress
through a healthcare system for a given service (NHS Modernisation Agency 2005;
NHS Modernisation Agency 2005). The goal of Patient Journey Modeling (PJM) is
to improve patient safety and overall health care quality by reducing variability in
the care process. It involves the analysis of the overall processes involved with the
movement of a patient through a healthcare system, typically a hospital, and then
analysing how this journey can be improved via:
• the removal of unproductive and excessive activities,
• the removal of process duplication,
• the introduction of evidence-based best practice,
• collecting required information only once,
Thesis Conclusion and Future Work
297
• reducing the number of times a patient is moved,
• the application of integrated information technology and
• improved communications between the patient, their carers and the clinicians
involved with the journey itself.
(IHI 2003; Curry and McGregor 2005; NHS Modernisation Agency 2005; NHS
Modernisation Agency 2005).
To support the IOM’s ‘Aims for Improvement’ and to overcome the existing patient
journey modeling deficiencies, the thesis suggested three key research directions:
1. Alignment of organisational change to the Healthcare Provider Strategy;
Research regarding the criticality of aligning organisational change with the
business strategy has been occurring for almost 30 years (Miles et al. 1978;
Henderson and Venkatraman 1991). This indicates that the Provider
Strategy sets the course for organisational change and that all
improvements must be aligned to the established strategic objectives.
2. Incorporation of Practice Guidelines and Patient Needs in the Redesigning
Care Activity.
At the operational level, practice guidelines and patient needs are a critical
input to the redesign process. Inclusion of these items keeps the models
patient-centered and ensures a focus on patient safety.
3. Provision of Appropriate System Support using Readily Available
Technology.
Technology is a key enabler of organisational change and system support
for workflow automation and performance measurement and evaluation is a
standard requirement.
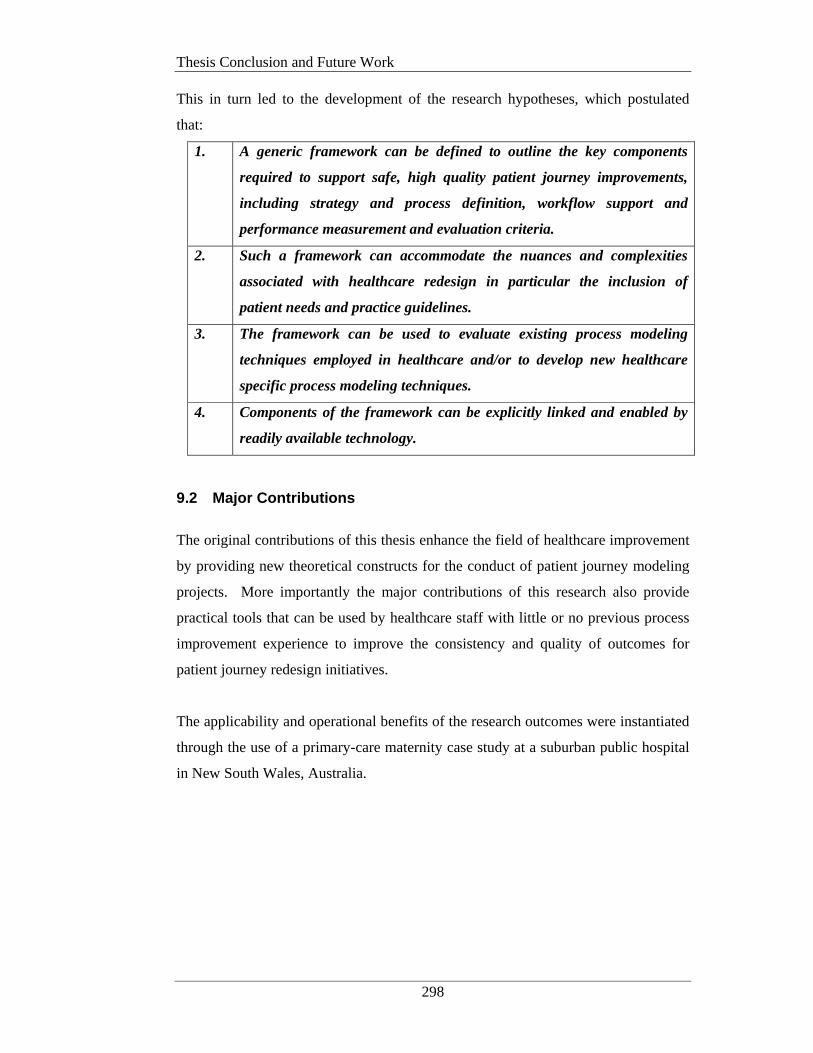
Thesis Conclusion and Future Work
298
This in turn led to the development of the research hypotheses, which postulated
that:
1. A generic framework can be defined to outline the key components
required to support safe, high quality patient journey improvements,
including strategy and process definition, workflow support and
performance measurement and evaluation criteria.
2. Such a framework can accommodate the nuances and complexities
associated with healthcare redesign in particular the inclusion of
patient needs and practice guidelines.
3. The framework can be used to evaluate existing process modeling
techniques employed in healthcare and/or to develop new healthcare
specific process modeling techniques.
4. Components of the framework can be explicitly linked and enabled by
readily available technology.
9.2 Major Contributions
The original contributions of this thesis enhance the field of healthcare improvement
by providing new theoretical constructs for the conduct of patient journey modeling
projects. More importantly the major contributions of this research also provide
practical tools that can be used by healthcare staff with little or no previous process
improvement experience to improve the consistency and quality of outcomes for
patient journey redesign initiatives.
The applicability and operational benefits of the research outcomes were instantiated
through the use of a primary-care maternity case study at a suburban public hospital
in New South Wales, Australia.

Thesis Conclusion and Future Work
299
To address the research hypotheses, this thesis demonstrated the following
contributions:
• PJM3 - A PATIENT JOURNEY MODELING META-METHODOLOGY.
PJM3, as described in Chapter 4, is an original domain specific
improvement architecture that is expressly designed to support patient
journeys in the context of process redesign within the healthcare domain
for the purposes of increased patient safety, reduced variations of care
and overall outcome improvement.
The Meta-Methodology allows for the definition of the healthcare
provider strategy, in the form of Balanced Scorecards, and for these to be
explicitly linked with operational process changes. PJM3 also
accommodates the inclusion of relevant legislation/policies and
accreditation requirements, practice guidelines and patient needs into the
process modeling activities. Resulting process specifications can be
output to workflow management systems for automated workflow
support. Performance measurement criteria can be defined for inclusion
in Decision Support Systems thus providing facilities to evaluate process
change and feedback results to management for ongoing process
improvement.
Development of PJM3 involved aspects of method reconciliation and
consolidation as well as the addition of specific dimensions unique to
healthcare such as patient needs and practice guidelines.
The Meta-Methodology construct acts as a backbone for the solution of the
research hypotheses, specifically hypotheses 1 and 2 and is instantiated
through the development of the following suite of complimentary patient
journey modeling constructs.
Thesis Conclusion and Future Work
300
• A PROCESS MODELING ASSESSMENT FRAMEWORK FOR
HEALTHCARE (PMAF4HC).
The Assessment Framework is derived from PJM3 and serves two key
purposes:
1. To evaluate the degree of support afforded to healthcare process
redesign projects by existing process modeling techniques/methods,
2. To provide a benchmark for the development for new patient journey
modeling tools.
Such a Framework allows healthcare improvement managers to
understand the limitations of the tools they are using so that contingencies
can be developed or new tools sourced.
The Assessment Framework was demonstrated via the evaluation of the
four predominant process modeling techniques currently being used for
healthcare improvement: Lean Thinking, Six Sigma, ARIS and Unified
Modeling Language.
The evaluation led to the identification of a range of deficiencies relating
to the level of support provided by these tools. Specifically the
evaluation revealed that only ARIS partially covered some of the more
critical areas such as the capture of organisational goals and the
socio/economic and cultural needs of patients, although this is in the form
of a generic ‘environmental data’ object only. Although the ARIS method
covered more of the given assessment areas than other methods it was the
least intuitive to use and this is seen as a major disadvantage for
healthcare workers involved in process improvement initiatives. None of
the methods are patient centric or identify discontinuities of care or
patient handovers. The ability to define the role type and skill level
required, to deliver a particular clinical treatment and who is responsible
for a given physical resource is also lacking.
Development of the Process Modeling Assessment Framework for
Healthcare provides a solution to research hypothesis 3.
Thesis Conclusion and Future Work
301
• PJM2 - A MULTI-DIMENSIONAL PATIENT JOURNEY MODELING
CONCEPTUAL DESIGN.
This artifact is derived directly from PJM3 and presents a high level
abstraction of the multiple contributing dimensions that must be
considered when analysing a patient journey. Apart from the actual
journey of the patient, nine (9) dimensions have been recognised as
contributing to an accurate picture of the movement of a patient through
the HCO.
X Strategic Objectives Dimension
X Human Resources Dimension
X Physical Resources Dimension
X Patient Needs Dimension
X Practice Guidelines Dimension
X Administration Dimension
X Technology Support Dimension
X Measurements Dimension
X Organisational Structure Dimension
Specifically these Dimensions provide a portal through which to view the
complex environment of patient journey model development and
supporting database designs.
This construct provides additional support for the resolution of research
hypotheses 1, 2 and 3.
• PaJMa – A PATIENT-CENTRIC PATIENT JOURNEY MODELING
TOOL.
PaJMa is a new graphically-based patient journey modeling tool that has
been purpose built for the healthcare domain to support the design of
safe, high quality patient journeys. This innovative patient journey
modeling tool, explicitly accommodates a number of new dimensions not
previously catered for, specifically the inclusion of practice guidelines
and patient needs. Patient needs and practice guidelines are included in
Thesis Conclusion and Future Work
302
PaJMa through the use of a multi-layered process modeling approach.
Development of the patient journey model is carried out via definition of
six (6) contributing layers, namely:
X Patient Movement
X Staff Roles
X Processes
X Information Creation/Update
X Patient Needs/Practice Guidelines/Policies
X Measurements
Colour-coding is used to differentiate the contributing layers, allowing
stakeholders to readily identify the myriad of different components
associated with redesigning a holistic patient journey.
The tool also introduces innovative techniques for visualising patient
flow problems from a multi-dimensional perspective, allowing the patient
journey to be ‘sliced and diced’, that is developed and viewed from a
variety of perspectives, thus providing for diverse stakeholder input and
discussion.
Benefits of the new tool were also confirmed via its evaluation using the
Process Modeling Assessment Framework for Healthcare as discussed
above. It was shown that PaJMa covered specific areas not previously
catered for including Healthcare Provider Strategy links to operational
processes and metrics, explicit definition of Patient Needs, linking of
Practice Guidelines to individual workflow activities and explicit
modelling of care handovers and discontinuities of care. More
importantly all of this is dealt with on the one model with no need to
include ‘add-on’ tools. This suggests that PaJMa presents significant
opportunities to the current healthcare improvement environment and
should be considered as a serious replacement for the incumbent tools.
The development of the PaJMa tool provides a solution to research
hypotheses 2 and 3.
Thesis Conclusion and Future Work
303
• IMPROVED TECHNOLOGY SUPPORT FOR PATIENT JOURNEY
MODELING.
Technology is a key enabler of healthcare improvement. This research
provided specifications for explicit linking of the key components of the
Meta-Methodology using XML (and its variant standards), a readily
available data transfer and integration language.
Specifically the healthcare provider strategy can be defined using
Balanced Scorecards with each Scorecard perspective being specified
using the Balanced Scorecard XML standard (Balanced Scorecard
Collaborative 2001). Implementation of PJM3 necessitated extensions to
the BSC XML Draft Standard (2001) and McGregor’s (2002) work as
follows:
1. A 'patientjourneymodel id' data element was added to provide the
ability to uniquely identify the treatment stream being modeled. This
enables measures for a particular treatment stream to be explicitly
linked to a specific Balanced Scorecard.
2. The 'type' data element within the ‘measure’ construct ' (as added by
McGregor (2002)) has been extended to provide the ability to identify
additional types of measures to be recorded. This includes
‘confidence level’ and ‘compliance’.
3. The 'unit' data element (as added by McGregor, 2002) within the
‘measure’ construct has also been extended to accommodate for the
new ‘types’ in point 2. This required the addition of a ‘percentage’
value.
4. Due to the individual working patterns associated with the Ryde
Midwifery Group Practice model an additional extension was also
made to the 'unit' data element within the ‘measure’ construct. This
necessitated the addition of a ‘working day’ value.
Detailed examples of these extensions are included in Appendix B.
Thesis Conclusion and Future Work
304
XML in the form of the Workflow Management Coalition’s (WfMC)
XML process definition language (XPDL) (WfMC 2005) was also used to
specify workflow requirements as identified during new patient journey
analysis activities. This facilitates the automation of required workflows
in any XML compatible workflow management system.
To facilitate the modeling constructs of PaJMa the following
amendments to the XPDL standard were required:
1. Extended attributes have been defined within the 'activity' construct to
denote a system activity for sending the Assessment Questionnaire
URL address to the patient’s nominated email address.
2. Within the 'activity' construct, extended attributes, as originally
defined by McGregor (2002), have also been enhanced to provide
links from the previously defined target Balanced Scorecard
measurements to individual activities.
Detailed examples of these extensions are included in Appendix C.
Technology support for the evaluation of implemented patient journey
improvements was also enabled via the development of a Multi-
dimensional database design. The original database design consists of a
central fact table providing summary details of each and every patient
that is involved in a given patient journey. Additional details for each
part of the journey are captured in the associated dimension tables. Drill
down to individual Processes enacted at a specific point in Time using
Human and Physical Resources, for a particular Patient with individual
Patient Needs is facilitated. Along with details on the Administration and
IT Support required and the entire spectrum of Measurements that aid
management decision making.
Using PJM3 and PJM2 as the design foundation; this database facilitates
the capture of performance measurement and evaluation criteria. Such
criteria can be implemented as part of a Management Decision Support
System (MDSS) to assist organisational learning and to assess the degree
Thesis Conclusion and Future Work
305
of improvement that can be attributed to process changes made as a result
of new patient journey model implementations.
MDSS outputs can also be used by management as justification for
ongoing process improvements and provide a feedback loop to the
healthcare provider strategy.
The XML extensions and new multi-dimensional database design
discussed above provide solutions to research hypothesis 4.
All of these constructs are expressly designed for the healthcare domain for the
purposes of improved support for the design and modeling of patient journeys.
9.3 Research Impacts
The innovative techniques described help stakeholders to visualise how a patient
moves through the entire system (not just one department), bringing together the
multiple dimensions required to improve the patient journey at a holistic level and
highlighting areas of patient risk, resource wastage and process duplication at their
source. In addition the new techniques provide a common communication base for
all involved parties thus encouraging interaction from all levels and types of
stakeholders including patients and clinicians, promoting action plan ownership and
supporting the definition of specifications for integrated information systems. The
research also provides for the definition of the performance monitoring and
evaluation criteria required for the development of decision support systems that will
provide feedback to management, promoting a continuous process improvement
culture.
The combination of these items within PJM3 enables links between these
contributing areas to be established and the impact of their relationship and inter-
action to be monitored, evaluated and (if needed) further improved. The conceptual
design (PJM2) that forms part of the Meta-Methodology’s Patient Journey Modeling
component provides explicit dimensions that must be analysed and evaluated for
Thesis Conclusion and Future Work
306
their impact on the current and future patient journey. This provides succinct
direction to the model creators and concrete justification of recommended changes to
the current patient journey, for management.
The Assessment Framework also presents a standard skeleton that can be used to
evaluate any process modeling technique/method that is being considered for use
within a healthcare improvement project encompassing patient journey modeling as
per the PJM3 components. Identification of low levels or complete lack of support in
particular areas alerts Management to areas of weakness and the fact that other
tools/techniques may be required to augment the patient journey modeling activity to
improve the chances of high quality results. The Assessment Framework can also be
used as a benchmark for the development of new patient journey modeling tools
such as PaJMa, as presented in Chapter 7.
The new and innovative constructs produced as part of this research were
demonstrated in the evaluation of the primary care maternity services model at Ryde
Hospital, Australia. The issues highlighted as part of the patient journey model have
been addressed and progressive implementation of the future patient journey model
is ongoing. Several immediate improvements were made as a direct result of the
patient journey modeling project including streamlining of the Suitability
Assessment process through the creation of a Suitability Assessment Questionnaire
as discussed in Chapter 7. This artefact was developed by the midwives and is
already available in paper copy for inclusion as part of the Information Pack
provided to prospective patients. A Suitability Assessment Questionnaire website
has also been developed and is currently being assessed for implementation into the
Area Health Service architecture. Use of the PaJMa tool, as part of the case study
confirmed that the tool encourages group communication, is quickly developed and
easy to understand, promotes ownership of problems and their solutions and allows
for simple identification of required action plans.
Also of significance are the impacts in relation to the IOM’s Six ‘Aims for
Improvement’ (Committee on Quality of Health Care in America 2001) as discussed
in Chapters 1 and 2. By providing Practice Guidelines and Patient Needs as inputs
Thesis Conclusion and Future Work
307
to the Healthcare Provider Strategy, Points 2, 3 and 6 of the IOM’s ‘Aims for
Improvement’ are addressed. Additional abstractions described in these components
are also included in the analysis of the current patient journey and the design of the
future patient journey. This supports the IOM’s Points 1 through 6. Technology
support for workflow and decision support also facilitates a Continuous Improvement
Loop. This ensures ongoing attention to each of the ‘Aims for Improvement’
providing a solid foundation for the delivery of safe, high quality patient journeys.
9.4 Limitations of PJM3
As discussed throughout this thesis PJM3 relies on a number of different components
to fully describe the patient journey. If the selected patient journey modeling tool
cannot accommodate all of these components then the maximum benefits of the
Meta-Methodology will not be realised. Examples of this can be seen in Chapter 5
which described a number of tools that lack support for several of the PJM3
components such as Practice Guidelines and Patient Needs.
Currently PJM3 and PaJMa are predominantly theoretical constructs with limited
software support. Microsoft Visio© is used for the development of the graphical
Patient Journey Models but there are currently no automated facilities within this
tool for the creation and/or capture of the Healthcare Provider Strategy perspectives
and related objectives in Balanced Scorecard XML (BSC XML) (Balanced Scorecard
Collaborative 2001) and the linking of these to the Patient Journey Model, as
described in Chapter 8 and Appendix B. This is also the case for the creation of the
XML Process Definition Language (XPDL) (WfMC 2005) specifications for transfer
of the process definitions from the Patient Journey Model component to the
Workflow and Decision Support System components. Automated support for the
capture of the workflow management system audit logs (WfMC Reference Model -
Interface 5) (WfMC 1995) for the purposes of transferring the actual patient journey
metrics to the Decision Support System for variance analysis is also not available
within Microsoft Visio©. The full potential of the PJM3 approach will not be
realised without further attention to this area of software support (see Future Work
section).
Thesis Conclusion and Future Work
308
9.5 Future Work
The contributions of this thesis set the scene for additional research work to further
the domain of healthcare improvement in the following areas.
• In Chapter 7, the PaJMa patient journey models were developed using
Microsoft Visio©. As discussed above ‘Visio©’ can recreate the graphical
model representations but lacks complex support for the definition of each of
the objects placed on the model and explicit linking of the PJM3 components.
For example the data supporting the definition of a specific patient need (ie: the
need category, religion, cultural etc,…) cannot be captured. Development of
such software support would also involve facilities for the automatic generation
of Balanced Scorecard XML to explicitly link the Healthcare Provider
Strategy and Patient Journey Model components of PJM3. Additional facilities
are also required for the automated definition of patient journey model process
definitions from the Patient Journey Model component to the Decision Support
System and Workflow Management components. This would be in the form of
XPDL as per the WfMC Interface 1 and discussed in Chapter 8.
The PaJMa software tool would also need additional functionality to support
other components of PJM3 such as practice guidelines, simulation modeling
and statistical analysis tools as outlined in the following points.
a) Further research is needed into how existing clinical guideline software
can be integrated into the PaJMa tool to facilitate the automated inclusion
of practice guidelines into the Patient Journey Model component of
PJM3. It is anticipated that these tools could be integrated into the
proposed environment with minimal new development and that XML
should be investigated as the primary integration medium. XML could be
further leveraged within this environment for the development of XML
schemas or ontologies for the standard definition of practice guidelines
that can be explicitly linked to the Patient Journey Model. This would
facilitate the seamless integration of new or amended practice guidelines
without the need for additional software development.
Thesis Conclusion and Future Work
309
b) The PaJMa tool should also include linkages to existing Simulation
Modeling tools such as Simul8 (Klein et al. 1993; Harper and Gamlin
2003; Brailsford 2005). This would allow solution alternatives, as
suggested by various stakeholders, to be assessed as they arise. The
selected alternative should then provide direct input to the development
of the resulting process definitions. If following implementation of the
future patient journey, performance monitoring and evaluation by the
MDSS highlights that further journey enhancements are still needed to
achieve the pre-defined targets, then additional simulation modeling
could be performed using the same tool.
c) The PaJMa software tool would also benefit from linkages to Statistical
Analysis Tools for the purposes of Patient Flow analysis as discussed by
Litvak et al.(2005) and Jensen et al. (2006). Details of how patient flow
analysis relates to patient journey modeling were presented in Chapter 7.
• At present the design of the Management Decision Support System database
discussed in Chapter 8 has been completed. Actual construction,
implementation and ‘live’ data runs are still required. Notwithstanding
development of the PJM3 architecture, construction of the actual
multidimensional database system within a data warehouse environment along
with the accompanying extraction and summary programs and graphical user
interface would be of significant benefit to Patient Journey Modeling initiatives
in its own right. This initiative would also require integration with existing
operational systems so that individual data relating to a patient’s journey could
be collected as required. Such as system would allow management to assess
improvements in relation to expected targets and to learn from identified
variances. Variances also highlight opportunities to make additional patient
journey enhancements, encouraging a culture of continuous process
improvement as outlined in Chapter 4.
Thesis Conclusion and Future Work
310
• Investigation of the applicability of adding intelligent agents to the PJM3
architecture is also an open research question deserving attention. Such
investigations could look to incorporate automation of the MDSS table
generation and extraction of the workflow audit logs as per McGregor’s IW-
MONS for business process modeling (McGregor 2002).
• Notwithstanding the application of the new research tools within the Maternity
(both metropolitan and remote) and renal failure arenas, further research is
required to test the tools in additional and potentially more complex healthcare
environs. As much attention has already been given to Emergency
presentations and in-hospital patient journeys, by other researchers and
consultants, these may be an ideal starting point. This would allow direct
comparisons to be made between existing techniques and PaJMa and
demonstrate the richness of the PJM3 approach. Issues of particular note may
include integration of practice and professional guidelines for medication
orders and administration, shiftwork handovers and accommodation of inter-
organisational and cross-discipline politics.
• As part of the physical implementation of the Management Decision Support
system database discussed in Chapter 8 and to better facilitate information
sharing amongst users, consideration also needs to be given to compliance to
an ontology (existing or newly developed) inclusive of standard naming
conventions and data types. Analysis of topical research in these areas should
include a review of current work by the National Health Data Management
Committee (Australian Institute of Health and Welfare 2003) and the
Australian Institute of Health and Welfare’s meta data online registry,
METeOR. METeOR provides national data standards for health, housing and
community services in Australia (Australian Institute of Health and Welfare
2003). Such a review should consider what data should be collected, who’s
responsibility this would be and at what time intervals the data is collected.
Consideration should also be given to whether enhancements to the minimum
national dataset are also required.
Thesis Conclusion and Future Work
311
• Finally the fact still remains that there is no standard patient journey modeling
technique accepted and used by the healthcare industry as a whole. Further
testing of PJM3 and the accompanying thesis constructs in other healthcare
improvement environs is therefore required. The constructs presented as part
of this research are applicable in all parts of the healthcare domain for any type
of patient journey. If further testing of the model showed consistently good
results, consideration of the PaJMa technique as an industry standard could be
proposed. This would provide several benefits including common
understanding of patient journeys across providers, identification of best
practice patient journeys for particular treatments, and new opportunities for
model reuse across similar providers.
In addition to the thesis case study herein, additional testing of the presented
constructs has already been conducted by this researcher, and results to date
have been very encouraging. In the very early stages of the development of
PJM3 and PaJMa these tools were utilised as part of a scoping workshop in
collaboration with Charles Darwin University in the Northern Territory of
Australia. The scoping workshop dealt with how the journey of indigenous
women living in remote communities differed from those women living in
more metropolitan communities. The results of the scoping workshop led to
the development of a National Health and Medical Research Council
(NHMRC) grant application in partnership with Charles Darwin University, the
Northern Territory Department of Health and two indigenous communities in
the far North of Australia. I was named a Chief Investigator on this
application. In May 2007 the team was notified that the NHMRC grant
application had been successful and funds from this project will total over
AUD$500,000-. I will lead the patient journey modeling component of the
project which will utilise the now finalised PJM3 and the PaJMa patient
journey modeling tool.
Discussion have also commenced with the Menzies Research Centre in the
Northern Territory of Australia to work with them on the development of the
Thesis Conclusion and Future Work
312
patient journey models relating to indigenous patients in stages 4 and 5 of renal
failure. This project is expected to commence in November 2007.
9.6 Final Conclusion
In summary the new patient journey modeling meta-methodology (PJM3) presents an
innovative multidimensional healthcare improvement architecture that allows for the
inclusion of the healthcare provider strategy in the form of Balanced Scorecards,
along with the ability to accommodate relevant legislation/accreditation
requirements, practice guidelines and patient needs. The meta-methodology formed
the foundation for the development of a new Assessment Framework that can be
used to evaluate existing process modeling tools or to develop new patient journey
modeling tools. PJM3 was also used as the benchmark for the abstraction of a
patient journey model conceptual design. This conceptual design, known as PJM2,
provides a straightforward technique for dividing the complexities of patient journey
models into manageable segments that can be developed and integrated over time.
These contributions led to the development of a new healthcare specific patient
journey modeling tool, known as PaJMa. The PaJMa tool provides an innovative
approach to the graphical representation of the system of care. It is the first patient
journey modeling tool designed specifically for the healthcare domain. PaJMa is
supported by an original database design that facilitates performance measurement of
implemented changes in the form of a Management Decision Support System.
Outputs from the patient journey modeling tool also provide process definitions that
can be used as direct input to workflow automation activities that are explicitly
linked and enabled by readily available technology.
In addition the new techniques provide a common foundation for everyone involved
in the patient journey modeling project thus encouraging interaction from all levels
and types of stakeholders including patients and clinicians. This promotes cross-
discipline communication, strong stakeholder buy-in, ownership of problems and
their solutions and allows for simple identification of required action plans.
Thesis Conclusion and Future Work
313
Footnote: How ironic that I am writing the conclusion to this thesis from my
hospital bed! I have been a victim of one of the very types of issues my research
work is trying to overcome – poor patient safety.
I had been admitted to a local hospital for day surgery for a minor gyneacological
complaint. I left hospital feeling tired but quite well. Three days later I was
readmitted to Emergency with a bowel infection know as clostridium, contracted
whilst in hospital for the day surgery. It was thought that I may need further surgery
but this thank goodness was ruled out. I have however been in serious pain and
hooked up to an antibiotic drip for 5 days with the Doctors thinking I will be here for
another couple of days yet.
A prime example of poor patient safety leading to a medical injury unrelated to the
patient’s original medical complaint!
References
314
REFERENCES Abbott, T. (2004). "The Australian Financial Review Congresses, 6th Annual Health
Congress 2004, Speech made Tuesday 24th February 2004." Media Release, Department of Health and Ageing , Australian Government. Retrieved 10/3/2005, 2005, from http://www.health.gov.au/internet/wcms/Publishing.nsf/Content/2004-2005-1.
ACHS. (1996). "ACHS Evaluation and Quality Improvement Program." The Australian Council on Healthcare Standards. 2006, from http://www.achs.org.au/accreditstandar/.
ACHS (2007). ACHS Clinical Indicator Information 2007. The Australian Council on Healthcare Standards. Sydney: 30, Information report.
ACSQH. (2006). "Home page." Australian Commission on Safety and Quality in Healthcare. 2006, from http://www.safetyandquality.org/internet/safety/publishing.nsf/Content/home.
Adams, M., Edmond, D. and ter Hofstede, A. H. M. (2003). The Application of Activity Theory to Dynamic Workflow Adaptation Issues. 7th Pacific Asia Conference on Information Systems, Adelaide, SA, 10-13 July 2003,
Ahamed, T., Gogler, J., Hullin, C. and Morrison, I. (2006). Nursing Decision Support 'Needs' for Better Patient Management. 14th Annual HISA Health Informatics Conference (HIC2006), Sydney, Australia, 20-22 August 2006, HISA
Alter, S. L., (1980), Decision Support Systems:Current Practice and Continuing Challenges, Addison-Wesley, Reading, Mass.
Anthony, R. N., (1965), Planning and Control Systems: A Framework for Analysis, Harvard University Graduate School of Business Administration, Boston.
Anyanwau, K., Sheth, A., Cardoso, J., Miller, J. and Kochut, K., (2003), "Healthcare Enterprise Process Development and Integration," Journal of Research and Practice in Information Technology, 35(2): pp.83-98.
Anzbock, R. and Dustdar, S. (2003). Interorganizational Workflow in the Medical Imaging Domain. 5th International Conference on Enterprise Information Systems (ICEIS 2003). Kluwer Academic Publishers. Angers-France
ARCHI Net News. (2004). "Project to Reduce Access Block Improves Patient Flow at Nepean Hospital, 20th October 2004." ARCHI Net News. Retrieved 10/3/2005, 2005, from http://www.archi.net.au/content/index.phtml/itemId/166067/fromItemId/164234.
References
315
Australian College of Midwives (2004). National Midwifery Guidelines for Consultation and Referral. Australian College of Midwives. Canberra, Guideline.
Australian Commission on Safety and Quality in Health Care. (2006). "Measurement for Improvement Toolkit." ACSQHC. 2006, from http://www.safetyandquality.org/internet/safety/publishing.nsf/Content/703C98BF37524DFDCA25729600128BD2/$File/Toolkit_PartA.pdf.
Australian Institute of Health and Welfare. (2003). "Health Data Standards Committee (HDSC)." Australian Government. 2007, from http://www.aihw.gov.au/committees/hdsc/index.cfm.
Australian Institute of Health and Welfare. (2003). "METeOR Metadata Online Registry." Australian Government. 2007, from http://meteor.aihw.gov.au/content/index.phtml/itemId/181162.
Australian Resource Centre for Healthcare Innovation. (2006). "Models of Care." ARCHI/NSW Health Clinical Services Redesign Program. Retrieved 2/4/2006, 2006, from http://www.archi.net.au/e-library/build/moc.
Balanced Scorecard Collaborative (2000). Balanced Scorecard Functional Standards. Balanced Scorecard Collaborative. Lincoln, MA
Balanced Scorecard Collaborative (2001). BSC XML Draft Standard. Balanced Scorecard Collaborative. Lincoln, MA, Standard.
Baskerville, R. L., (1999), "Investigating Information Systems with Action Research," Communications of the AIS, 2(3es): pp.1-32.
Baskerville, R. L. and Wood-Harper, A. T., (1996), "A Critical Perspective on Action Research as a Method for Information Systems Research," Journal of Information Technology, 11(3): pp.235-246.
Bassham, J. (2005). Applying Lean Thinking Principles to a Clinical 'Production Cell'. 1st Australasian Redesigning Health Care Summit, Glenelg South Australia, 8-9 March 2005. Glenelg SA, Conference Presentation.
Batalden, P. and Splaine, M., (2002), "What Will it Take to Lead the Continual Improvement and Innovation of Health Care in the Twenty-First Century?," Quality Management in Health Care, 11(1): pp.45-54.
Bate, P., Robert, G. and Bevan, H., (2004), "The next phase of healthcare improvement: what can we learn from social movements?," Quality and Safety in Health Care, 13(1): pp.62-66.
Beeler, G., Huff, S., Rishel, W., Shakir, A.-M., Walker, M., Mead, C. and Schadow, G. (1999). HL7 v3 - Message Development Framework. HL7 Modeling and Methodology Committee, Standard.
Ben-Tovim, D. (2005). Can Health Care use 'Lean'? 1st Australasian Redesigning Health Care Summit, Glenelg South Australia, 8-9 March 2005. Glenelg SA, Conference Presentation.

References
316
Ben-Tovim, D. (2005). Value Streams in Healthcare? 1st Australasian Redesigning Health Care Summit, Glenelg South Australia, 8-9 March 2005. Glenelg SA, Conference Presentation.
Bensing, J., (2000), "Bridging the Gap. The Seperate Worlds of Evidence-Based Medicine and Patient-Centered Medicine," Patient Education and Counseling, 39(1): pp.17-25.
Berger, M., Ellmer, E., Quirchmayr, G. and Zeitlinger, A. (1997). Evaluating Workflow Management Systems. 8th International Workshop on Database and Expert Systems Applications, Toulouse, FranceDEXA'97
Bernstein, K., Bruun-Rasmussen, M., Vingtoft, S., Andersen, S. K. and Nohr, C., (2005), "Modelling and implementing electronic health records in Denmark," International Journal of Medical Informatics, 74(2-4): pp.213-220.
Berwick, D., (1996), "A Primer on Leading the Improvement of Systems," British Medical Journal, 312(7031): pp.619-622.
Berwick, D. M., (1994), "Eleven worthy aims for clinical leadership of health system reform," JAMA, 272(10): pp.797-783.
Berwick, D. M., (2002), "A user's manual for the IOM's 'Quality Chasm' report," Health Aff, 21(3): pp.80-90.
Berwick, D. M., Calkins, D. R., McCannon, C. J. and Hackbarth, A. D., (2006), "The 100 000 Lives Campaign: Setting a Goal and a Deadline for Improving Health Care Quality," JAMA, 295(3): pp.324-327.
Berwick, D. M., James, B. and Coye, M. J., (2003), "Connections Between Quality Measurement and Improvement," Medical Care, 41(1 (supplement)): pp.I-30-I-38.
Betancourt, J. R., Green, A. R. and Carrillo, J. E. (2002). Cultural Competence in Healthcare: Emerging Frameworks and Practical Approaches. Massachusetts General Hospital. Massachusetts: p.40, Field Report.
BlueCross BlueShield Association. (2005). "Keeping Quality Health Care Affordable." BlueCross BlueShield Association. Retrieved 31/5/2005, 2005, from http://www.bcbs.com/cost/index.html.
Bolch, D. (2005). Focus on Flow: at all levels. 1st Australasian Redesigning Health Care Summit, Glenelg South Australia, 8-9 March 2005. Glenelg SA, Conference Presentation.
Booch, G., (1994), Object-oriented analysis and design with applications, Benjamin/Cummings, Redwood CA.
Brailsford, S., (2005), "Overcoming the Barriers to Implementation of OR Simulation Models in Healthcare," Journal of Clinical and Investigative Medicine, 28(6): pp.312-315.
References
317
Bricon-Souf, N., Renard, J. M. and Beuscart, R., (1999), "Dynamic workflow model for complex activity in intensive care unit," International Journal of Medical Informatics, 53: pp.143-150.
Brideau, L. P., (2004), "Flow: Why Does It Matter?," Frontiers of Health Service Management, 20(4): pp.47-50.
Browne, E., Barretto, S., Schrefl, M. and Warren, J. (2003). Goal-oriented workflow systems can help in chronic disease management. HIC 2003 RACGP 12CC Combined Conferences, Sydney, 10-12 August 2003,
Browne, E. and Warren, J. (2002). Guidelines, Care Plans and Workflow - How do they relate? 10th Health Informatics Conference, Melbourne, VIC, 4-6 August 2002,
Brue, G., (2005), Six Sigma for Managers, McGraw-Hill, New York.
Brue, G. and Howes, R., (2006), Six Sigma-The McGraw-Hill 36-hour course, McGraw-Hills, New York.
Brussee, W., (2005), All About Six Sigma, McGraw-Hill, New York.
Bushell, S. and Shelest, B., (2002), "Discovering lean thinking at Progressive Healthcare," The Journal for Quality and Participation, 25(2): p.20.
Camann, M. A., (2001), "Outcomes of care: the use of conceptual models to 'see the forest and the trees' in planning outcomes studies," Topics in Health Information Management [NLM - MEDLINE]. 22(2): p.10.
Cambridge University Press, (2006), Cambridge Advanced Learner's Dictionary, Cambridge University Press, Cambridge, UK.
Canadian Department of Finance (2004). Budget 2004: Health Care, Learning and Communities. Department of Finance, Canada. Ottawa, Budget Media Release.
Caron, R. J., Jarvenpaa, S. L. and Stoddard, D. B., (1994), "Business reengineering at CIGNA Corporation: Experiences and lessons learned from the first five..." MIS Quarterly, 18(3): pp.233-51.
Carr, J., (1999), "Proposal for an Integrated Sciences Curriculum in Medical Education," Teaching and Learning in Medicine, 10: pp.3-7.
Change Management Learning Centre (2005). 2005 Best Practices in Change Management. Prosci. Loveland, CO: 51, Benchmark Report.
Chiu, D. K. W., Li, Q. and Karlapalem, K., (1999), "A meta-modeling approach to workflow management systems supporting exception handling.," Information Systems, 24(2): pp.159-184.
Church, A. and Nixon, A. (2002). An Evaluation of the Northern Rivers Community Midwifery Program. Department of Human Services. Adelaide
References
318
Codd, E. F., (1970), "A Relational Model of Data for Large Shared Data Banks," Communications of the ACM, 13(6): pp.377-387.
Coiera, E., (2003), Guide to Health Informatics, Arnold, London.
Committee on Quality of Health Care in America (2001). Crossing the Quality Chasm: A New Health System for the 21st Century. US Institute of Medicine. Washington, DC: p.364
Conrick, M., (2006), Health Informatics: transforming healthcare with technology, Thomson/Social Science Press, Melbourne.
Constantine, L. and Yourdon, E., (1979), Structured Design, Prentice Hall, Englewood Cliffs, N.J.
Curry, J. M. and McGregor, C. (2005). The Current State of Patient Journey Redesign in Australia. HIC2005, Melbourne, Australia, 31st July - 2nd August 2005, HISA
Curry, J. M., McGregor, C. and Tracy, S. (2005). Deficiencies of Process Reengineering in its Support for Healthcare Redesign. 2nd CSTE Innovation Conference, Sydney, Australia, 7-8 June 2005, University of Western Sydney. pp.19-20.
Curry, J. M., McGregor, C. and Tracy, S. (2006). A Communication Tool to Improve the Patient Journey Modeling Process. 28th IEEE International Conference of the Engineering in Medicine and Biology Society (EMBC2006), New York, USA, August 30-September 3 2006. pp.4726-4730.
Curry, J. M., McGregor, C. and Tracy, S. B. (2007). A Systems Development Lifecycle Approach to Patient Journey Modeling Projects. Medinfo 2007, Brisbane, Qld, 20-24 August 2007, IOS Press/HISA Ltd. pp.905-909.
Curry, M. and Simpson, D., (2000), " Supporting not punishing. A constructive approach to managing clinical errors," Pract Midwife, 3(4).
Curtis, B., Kellner, M. I. and Over J., (1992), "Process Modeling," Communications of the ACM, 35(9): pp.75-90.
Curtright, J. W., Stolp-Smith, S. and Edell, E., (2000), "Strategic Performance Management: Development of a Performance Measurement System at the Mayo Clinic," Journal of Health Care Management, 45(1): pp.58-68.
Davenport, T. H., (1993), Process Innovation: Reengineering Work through Information Technology, Harvard Business School Press, Boston.
Davenport, T. H., (1994), "Reengineering: Business change of mythic proportions?," MIS Quarterly, 18(2): pp.121-128.
Davenport, T. H., Prusak, L. and Wilson, H. J. (2003). Reengineering Revisited. Computerworld, 37
Davis, R., (2001), Business Process Modelling with ARIS - A Practical Guide, Springer, New York.
References
319
de Clercq, P. A., Blom, J. A., Korsten, H. H. M. and Hasman, A., (2004), "Approaches for creating computer-interpretable guidelines that facilitate decision support," Artificial Intelligence in Medicine, 31(1): pp.1-27.
Deming, W. E., (1986), Out of the crisis, Massachusetts Institute of Technology, Cambridge, Mass.
Deming, W. E., (1993), The New Economics for Industry, Government, Education, Massachusetts Institute of Technology, Center for Advanced Engineering Study, Cambridge, MA.
Diers, D. and Bozzo, J., (1999), "Using administrative data for practice and management," Nursing Economics, 17(4): pp.233-7.
Donabedian, A., (2005), "Evaluating the Quality of Medical Care," The Milbank Quarterly, 83(4): pp.691-729.
Donini-Lenhoff, F. and Hedrick, H., (2000), "Increasing Awareness and Implementation of Cultural Competence Principles in Health Profession Education," Journal of Allied Health, 29: pp.241-245.
Edison, T. A. (1847-1931). Quote, Source Unknown, Internet.
Farquhar, C. M., Kofa, E. W. and Slutsky, J. R., (2002), "Clinicians' attitudes to clinical practice guidelines: a systematic review," Medical Journal of Australia, 9(177): pp.502-506.
Field, M. and Lohr, K., Eds. (1990). Clinical Practice Guidelines: Directions for a New Program, National Academy Press, Washington, DC.
Field, M. and Lohr, K., Eds. (1992). Guidelines for Clinical Practice, National Acadamy Press, Washington, DC.
Forgione, D. A., (1997), "Health care financial and quality measures: International call for a 'balanced scorecard' approach," Journal of Health Care Finance, 24(1): pp.55-59.
Friedman, C. P. and Wyatt, J. C., (2006), Evaluation Methods in Biomedical Informatics, Springer, New York.
George, M. L., (2003), Lean Six Sigma for Service, McGraw-Hill, New York.
Gill, H. and Rao, P., (1996), The Official Client/Server Computing Guide to Data Warehousing, Que Corporation, Indianapolis, IN.
Goddard, M. (2003). "Fatal Errors." CHOICE. 2005, from http://www.choice.com.au/viewArticle.aspx?id=103717&catId=100501&tid=100008&p=1&title=Fatal+error+(archived).
Gorry, G. and Scott Morton, M., (1971), "A Framework for Management Information Systems," Sloan Management Review, 13(1): pp.55-70.
References
320
Gospodarevskaya, E., Churilov, L. and Wallace, L. (2005). Modeling the Patient Care Process of an Acute Care Ward in a Public Hospital: A Methodological Perspective. 38th Hawaii Conference on System Sciences, Hawaii
Gowland, B. (2005). Applying redesign principles to the NHS: Improving flow across a health system. 1st Australasian Redesigning Health Care Summit, Glenelg South Australia, 8-9 March 2005. Glenelg, SA, Conference presentation.
Green, P. and Rosemann, M., (2000), "Integrated Process Modeling: An Ontologial Evaluation," Information Systems, 25(2): pp.73-87.
Grotevant, S. (1998). Business Engineering and Process Redesign in Higher Education: Art or Science? CAUSE 98, Seattle, Washington, December 8, 1998. 18.
GumshoeKI Inc. (2006). "eVSM - What's new in eVSM v3." 2006, from http://www.evsm.com/index.htm.
Hall, G., Rosenthal, J. and Wade, J., (1993), "How to make reengineering really work," Harvard Business Review, 71(6): pp.119-142.
Hammer, M., (1990), "Reengineering Work: Don't Automate, Obliterate," Harvard Business Review, 68(4): pp. 104-113.
Hammer, M. and Champy, J., (1993), Reengineering the corporation: a manifesto for business, Harper Business, New York.
Hanson, C. W., (2006), Healthcare Informatics, McGraw-Hill, New York.
Haraden, C. and Resar, R. K., (2004), "Patient Flow in Hospitals: Understanding and Controlling It Better," Frontiers of Health Services Management, 20(4): pp.3-15.
Harper, P. R. and Gamlin, H. M., (2003), "Reduced outpatient waiting times with improved appointment scheduling: a simulation modelling approach," OR Spectrum, 25(2): pp.207-222.
Harper, P. R. and Pitt, M. A., (2004), "On the Challenges of healthcare modelling and proposed project lifecylce for successful implementation," Journal of the Operational Research Society, 55(6): pp.657-661.
Harrison, E. F., (1999), The Managerial Decision Making Process, Houghton Mifflin Company, Boston, MA.
Health Level 7. (2003). "HL7 Version 2.5." Health Level 7. Retrieved 2/4/2005, 2005, from http://www.hl7.org/.
Health Level 7. (2005). "HL7 Version 3 Normative Edition 2005." Health Level 7 Inc. 2005, from http://www.hl7.org/.
Health Level 7 (2005). HL7 Version 3: It's Live, It's Real. HL7. Ann Arbor, MI, Press Release.

References
321
Henderson, D., Dempsey, C. and Appleby, D., (2004), "A Case Study of successful Patient Flow Methods: St John’s Hospital," Frontiers of Health Service Management, 20(4): pp.25-30.
Henderson, J., McCandlish, R., Kumiega, L. and Petrou, S., (2001), "Systematic Review of Economic Aspects of Alternative Models of Delivery," British Journal of Obstetrics and Gynaecology, 108: pp.149-157.
Henderson, J. C. and Venkatraman, N., (1991), "Understanding Strategic Alignment," Business Quarterly, 55(3): pp.72-78.
Heyamoto, L. (2002). Seattle-Based Hospital Thinks Lean by Sending 30 Executives to Japan. Knight Ridder Tribune Business News: 1
HIMSS. (2006). "Management Engineering and Process Improvement." Healthcare Information and Management Systems Society. Retrieved 19/6/2006, 2006, from http://www.himss.org/asp/topics_managementProcess.asp.
HM Treasury (2004). Budget 2005 Summary Investing for our future: Fairness and opportunity for Britain's hard-working families. London
Hollingsworth, D. (2004). The Workflow Reference Model: 10 Years On. Workflow Handbook 2004. L. Fischer, Futures Strategies Inc, Lighthouse Point, FL: p.55.
Holsapple, C. W. and Whinston, A. B., (2001), Decision Support Systems: A Knowledge-Based Approach, Thomson Learning Custom Publishing, Cincinnati, Ohio.
Holt, T., (2001), "Developing an Activity Based Management System for the Army Medical Department," Journal of Health Care Finance, 27(3): pp.41-46.
Homer, C., Davies, G., Brodie, P., Sheehan, A., Barclay, L., Wills, J. and Chapman, M., (2001), "Collaboration in Maternity Care: A Randomised Controlled Trial Comparing Community-based Continuity of Care with Standard Care," British Journal of Obstetrics and Gynaecology, 108(1): pp.16-22.
Homer, C., Matha, D., Jordan, L., Wills, J. and Davis, G., (2001), "Community-based Continuity of Modwifery Care Versus Standard Hospital Care: A Cost Analysis," Australian Health Review., 24(1): pp.85-93.
Horn, S. D., (2001), "Quality, clinical practice improvement, and the episode of care," Managed Care Quarterly, 9(3): pp.10-25.
IBM. (2007, 2007). "Rational Rose Market-leading Modeling Environment." IBM. 2007, from http://www-306.ibm.com/software/awdtools/developer/rose/.
IDS Scheer. (2004). "IDS Scheer Presents Industry-Specific ARIS Solution for the Healthcare Sector." 2004, from http://www2.ids-scheer.com/international/english/press/pressreleases/28855.
IDS Scheer (2005). ARIS Industry Solutions: ARIS Healthcare Solution. Business Process Excellence. IDS Scheer. Saabrucken, Product Presentation.
References
322
IHI (2003). The Breakthrough Series: IHI’s Collaborative Model for Achieving Breakthrough Improvement. Institute of Healthcare Improvement. Boston: 20, White Paper.
IHI. (2003). "Case for Improvement:Reducing Appointment Wait Times." National Primary Care Development Team. 2004, from http://www.ihi.org/IHI/Topics/Improvement/caseforimprovement.htm.
IHI. (2003). "How to Improve." Institute of Healthcare Improvement. 2004, from http://www.ihi.org/IHI/Topics/Improvement/ImprovementMethods/HowToImprove/.
IHI (2003). Optimizing Patient Flow: Moving Patients Smoothly Through Acute Care Settings. Institute for Healthcare Improvement. Boston, MA: p.8, Innovation Series.
IHI. (2004). "Effective teamwork as a care strategy - SBAR and other tools for improving communication between caregivers." Institute for Healthcare Improvements. 2006, from http://www.ihi.org/IHI/Programs/AudioAndWebPrograms/Effective+Teamwork+as+a+Care+Strategy+SBAR+and+Other+Tools+for+Improving+Communication+Between+Careg.htm.
IHI. (2004). "Overview of the 100,000 Lives Campaign." Institute of Healthcare Improvement. 2005, from http://www.ihi.org/IHI/Programs/Campaign/100kCampaignOverviewArchive.htm.
IHI. (2004). "Process Analysis Tools: Flowchart." Institute for Health Care Improvement. 2005, from http://www.ihi.org/NR/rdonlyres/9844A3FD-9F2F-44D7-A423-81F81891F19E/651/Flowcharts1.pdf.
IHI (2005). Going Lean in Health Care. Institute of Healthcare Improvement. Cambridge, MA: p.24, Innovation Series Report.
IHI. (2006). "IHI Launches National Campaign to Reduce Medical Harm in U.S. Hospitals." IHI. 2007, from http://www.ihi.org/NR/rdonlyres/A96E0639-A979-44F6-A0FF-20329E492F44/4230/5MillionLivespressreleaseupdatedDec26FINALFINAL.pdf.
IHI. (2007). "Cracking the Code to Hospital-Wide Patient Flow." Institute of Healthcare Improvement. 2007, from http://www.ihi.org/IHI/Programs/ConferencesAndSeminars/CrackingtheCodetoHospitalWidePatientFlowJune2007.htm.
Iivari, J., Hirschheim, R. and Klein, H., (2001), "A Dynamic Framework for Classifying Information Systems Development Methodologies and Approaches," Journal of Management Information Systems., 17(3): pp.179-218.
References
323
Inamdar, N. and Kaplan, R. S., (2002), "Applying the Balanced Scorecard in Healthcare Provider Organisations," Journal of Healthcare Management, 47(3): pp.179-96.
Inmon, W., (1996), Building the Data Warehouse, Wiley Computer Publishing, New York, N.Y.
Inmon, W., Rudin, K., Buss, C. and Sousa, R., (1999), Data Warehouse Performance, John Wiley & Sons, New York, N.Y.
International Medical Informatics Association. (2006). "What is Medical/Health Informatics?" IMIA. Retrieved 30/9/2005, 2005, from http://www.imia.org/about.html.
iSix Sigma Healthcare. (2005). "Six Sigma DMAIC Roadmap." Six Sigma Healthcare. Retrieved 5/12/2006, 2006, from http://healthcare.isixsigma.com/library/content/c020617a.asp.
iSixSigma Healthcare. (2006). "Healthcare Channel." from http://healthcare.isixsigma.com/.
ISO. (2007, 20/7/2007). "International Organisation for Standardization-Home Page." International Organisation for Standardization. 2007, from http://www.iso.org/iso/en/ISOOnline.frontpage.
JCAHO (2004). EC Strategies to Help Improve Patient Flow. Environment of Care News, 7: pp.1-3
JCAHO (2004). New Leadership Standard on Managing Patient Flow for Hospitals. Joint Commission Perspectives, 24: pp.13-14
JCAHO. (2005). "JCAHO Requirements." Joint Commission for the Accreditation of Healthcare Organizations. Retrieved 3 August, 2005, from http://www.jointcommission.org/Standards/Requirements/.
JCAHO (2005). Strategies for Implementing the Patient Flow Standard. Joint Commission Perspectives on Patient Safety, 5: p.11
JCAHO (2006). Joint Commission 2006 Requirements Related to the Provision of Culturally and Linguistically Appropriate Health Care. Joint Commission on Accreditation of Healthcare Organisations. Washington, D.C.: p.19
JCAHO. (2006). "National Patient Safety Goals." The Joint Commission on the Accreditation of Healthcare Organizations. Retrieved 2nd February, 2006, from http://www.jointcommission.org/PatientSafety/NationalPatientSafetyGoals/.
JCAHO. (2006, 21/12/2006). "Specification Manual for National Hospital Quality Measures." The Joint Commission. from http://www.jointcommission.org/PerformanceMeasurement/PerformanceMeasurement/Current+NHQM+Manual.htm.
Jensen, K., Haraden, C., Mayer, T. and Welch, S., (2006), Leadership for Smooth Patient Flow, Health Administration Press, Chicago, IL.
References
324
Johnson, B., (2002), "Why do we need clinical practice improvement? A consumer perspective," Intern Med J, 32(12): pp.593-594.
Juran, J. M., (1974), Quality Control Handbook, McGraw-Hill, New York.
Kaiser Foundation Health Plan Inc. (2004). "SBAR Communication Tool." 2007, from http://www.ihi.org/IHI/Topics/PatientSafety/SafetyGeneral/Tools/SBARToolkit.htm.
Kaplan, R. S. and Norton, D. P., (1992), "The Balanced Scorecard - Measures that drive performance," Harvard Business Review, Jan-Feb: pp.71-79.
Kaplan, R. S. and Norton, D. P., (1993), "Putting the Balanced Scorecard to Work," Harvard Business Review(Sep-Oct): pp.134-147.
Kaplan, R. S. and Norton, D. P., (1996), The Balanced Scorecard: Transforming Strategy into Action, HBS Press, Boston, MA.
Kaplan, R. S. and Norton, D. P., (1996), "Using the Balanced Scorecard as a Strategic Management System," Harvard Business Review, 74(1): pp75-85.
Kaplan, R. S. and Norton, D. P., (2000), "Having Trouble with your Strategy? Then Map It," Harvard Business Review, 78(5): pp.167-176.
Karagiannis, D., Junginger, S. and Strobl, R., (1996), Introduction to Business Process Management Systems Concepts, Springer, Berlin.
Kasanen, E. and Lukka, K., (1993), "The Constructive Approach in Management Accounting Research," Journal of Management Accounting Research, 5: pp.243-265.
Kawamoto, K., Houlihan, C., Balas, E. A. and Lobach, D., (2005), "Improving clinical practice using clinical decision support systems: a systematic review of trials to identify features critical to success," BMJ, 330(7494).
Keen, P. G. and Scott Morton, M. S., (1978), Decision Support Systems: An Organisational Perspective, Addison-Wesley, Reading, MA.
Keller, P., (2005), Six Sigma Demystified, McGraw-Hill, New York.
Kenny, P., Brodie, P., Eckermann, S. and Hall, J. (1994). Westmead Hospital Team Midwifery Project Evaluation: Final Report. Westmead Hospital, Sydney, NSW
Kerr, D., Bevan, H., Gowland, B., Penny, J. and Berwick, D., (2002), "Redesigning cancer care," BMJ, 324(7330): pp.164-166.
Kimball, R., (1996), The Data Warehouse Toolkit, John Wiley & Sons Inc, New York.
References
325
Klein, R. W., Dittus, R. S., Roberts, S. D. and Wilson, J. R., (1993), "Simulation Modeling and Health-care Decision Making," Med Decis Making, 13(4): pp.347-354.
Kohn, K., Corrigan, J. M., Donaldson, M. S. and (eds) (1999). To Err is Human: Building a Safer Health System. Committee on Quality of Health Care in America, US Institute of Medicine. Washington, D.C., Report.
Koopman, J. C. (1999). "Effective Alignment: Strategy Cannot Succeed Without It." AllBusiness.com. from http://www.allbusiness.com/management/change-management/359383-1.html.
Kotter, J. P., (1996), Leading Change, Harvard Business School Press, Boston, MA.
LAI. (2004). "Lean Aerospace Initiative." 2006, from http://lean.mit.edu/index.php.
Langley, G. J., Nolan, K. M., Norman, C. L., Provost, L. P. and Nolan, T. W., (1996), The Improvement Guide: A Practical Approach to Ehhancing Organizational Performance, Jossey-Bass, San Francisco, CA.
Lassenius, C., Soininen, T. and Vanhanen, J. (2001). Constructive Research - a methodology workshop. Helsinki University of Technology. Helsinki, methodology workshop.
Laursen, M. (2003). Applying Lean Thinking in Hospitals - Exploring Implementation Difficulties. Aalborg University, Denmark: pp.1-15, Project Report.
Leape, L. L., Berwick, D. M. and Bates, D. W., (2002), "What Practices Will Most Improve Safety?: Evidence-Based Medicine Meets Patient Safety," JAMA, 288(4): pp.501-507.
Leeder, S. R. and Rychetnik, L., (2001), "Ethics and Evidence-based Medicine," Medical Journal of Australia, 175: pp.161-64.
Lemieux-Charles, L., McGuire, W., Champagne, F., Barnsley, J., Cole, D. and Sicotte, C., (2003), "The use of multilevel performance indicators in managing performance in health care organisations," Management Decision, 41(8): pp.760-770.
Leymann, F. and Altenhuber, W., (1994), "Managing Business Processes as an Information Resource," IBM Systems Journal, 33(2): pp.326-348.
Litvak, E., Buerhaus, P. I. and Davidoff, F., (2005), "Managing Unnecessary Variation," Journal of Quality and Patient Safety, 31(6): pp.330-339.
Litvak, E., Buerhaus, P. I., Davidoff, F., Long, M. C., McManus, M. L. and Berwick, D. M., (2005), "Managing Unnecessary Variability in Patient Demand to Reduce Nursing Stress and Improve Patient Safety," Joint Commission Journal on Quality and Patient Safety, 31(6): 330-338.
Litvak, E. and Long, M. C., (2000), "Cost and Quality Under Managed Care: Irreconcilable Differences?," American Journal of Managed Care, 6(3): pp.305-312.
References
326
Lukka, K., Ed. (2003). The constructive research approach. Case study research in logistics, Turku School of Economics and Business Administration
McGregor, C. (2002). IW-MONS: A Methodology for the Design of Intelligent Workflow Monitoring Systems. Computing Department. University of Technology. Sydney: p.303, Doctoral Dissertation.
McGregor, C. (2003). Balance scorecard driven business process definition using XML . 36th Annual Hawaii International Conference on System Sciences, Big Island, Hawaii, 6-9 January 2003, IEEE Computer Society
McGregor, C. and Edwards, J. (2005). A Framework for and Comparison of Business Process Modelling Methodologies' Support for Business Performance Management. Health Informatics Research Group, University of Western Sydney. Penrith, NSW, Technical Report.
Meliones, J. N. E. A., (2001), "No Mission ≠ No Margin: It's that Simple," Journal of Health Care Finance, 27(3): pp.21-29.
Mercer, D., (2001), XML: A Beginner's Guide, Osborne/McGraw-Hill, Berkeley, CA.
Merritt, T. A., Gold, M. and Holland, J., (1999), "A critical evaluation of clinical practice guidelines in neonatal medicine: does their use improve quality and lower costs?," J Eval Clin Pract, 5(2): pp.169-177.
Miles, R. E., Snow, C. C., Meyer, A. D. and Coleman Jr, H. J., (1978), "Organizational Strategy, Structure, and Process," Academy of Management Review, 3(3): pp.546-563.
Mills, S. and Tanik, M. (1995). Process Models as Templates for Healthcare Standardization and Management. IMAC'95, IEEE. 226-233.
Mintzberg, H., Raisinghani, D. and Theoret, A., (1976), "The Structure of "Unstructured" Decision Processess," Administrative Science Quarterly, 21: pp.246-275.
Mitka, M., (2006), "Initiative to Implement 6 Key Measures in Hospital Care Called Lifesaving," JAMA, 296(3): pp.269-270.
Mortimer, R. and Ward, M., (2002), "What are the barriers to clinical practice improvement?," Intern Med J, 32(7): pp.322-324.
Motorola University. (1994). "The Inventors of Six Sigma." 2007, from http://www.motorola.com/content.jsp?globalObjectId=3079.
Myers, M. D., (1997), "Qualitative Research in Information Systems," MIS Quarterly, 21(2): pp. 241-242.
Nadathur, S. (2002). Evidence, Care Processes and Information Systems - Can a modelling approach provide the link? 10th Health Informatics Conference, Melbourne, 4-6 August 2002,
References
327
Nair, M., (2004), Essentials of Balanced Scorecard, John Wiley & Sons, Hoboken, N.J.
National Electronic Decision Support Taskforce. (2002). Electronic decision support for Australia’s health sector. Commonwealth of Australia. Canberra
National Health Service. (2005, 2005). "Protocols and Care Pathways." National Electronic Library for Health. Retrieved 20/3/2005, 2005, from http://libraries.nelh.nhs.uk/Pathways/aboutICPs.asp.
National Health Service. (2005, 2005). "A Step-By-Step Guide to Developing ICPs." National Electronic Library for Health. Retrieved 20/3/2005, 2005, from http://libraries.nelh.nhs.uk/Pathways/icpDevelop.asp.
NEDST (2002). Electronic Decision Support for Australia's Health Sector. National Electronci Decision Support Taskforce. Canberra, ACT, Report to Health Ministers.
Nemeth, L., Hendricks, H., Salaway, T. and Garcia, C., (1998), "Integrating the patient's perspective: Patient pathway development across the enerprise," Topics in Health Information, 19(2): 79-87.
New Zealand Health Information Service. (2003). Report on Maternity 2000 and 2001. http://www.moh.govt.nz/moh.nsf
NHS Institute: Service Transformation Team. and University of Warwick. (2007). Going Lean in the NHS. Healthcare Finance Magazine
NHS Modernisation Agency (2005). Improvement Leaders' Guide: Improving flow. Department of Health. London: 22, Best Practice Guidelines.
NHS Modernisation Agency (2005). Improvement Leaders' Guide: Process mapping, analysis and redesign. Department of Health. London: 22, Best Practice Guidelines.
NHS Modernisation Agency. (2005). "NHS Institute for Innovation and Improvement supersedes the NHS Modernisation Agency." 2005, from http://www.wise.nhs.uk/cmsWISE/aboutUs/AboutMA.htm.
NHS Modernisation Agency. (2005). "NHS Modernisation Agency Home Page." NHS Modernisation Agency. Retrieved 1/5/2005, 2005, from http://www.modern.nhs.uk/home/default.asp?site_id=58.
NIST. (2001, 23/7/2007). "Baldridge National Quality Program." National Institute of Standards adn Technology. 2007, from http://www.quality.nist.gov/.
NSW Department of Health. (1997). "The Clinical Information Access Program (CIAP)." NSW Health, Sydney. from http://www.ciap.health.nsw.gov.au/.
NSW Department of Health (2000). Framework for Maternity Services: providing structure and direction for the future development of maternity services. NSW Health. Sydney
References
328
NSW Department of Health (2002). Easy Guide to Clinical Practice Improvement - A Guide for Healthcare Professionals. Sydney: p.45
NSW Department of Health (2004). $10 billion Health Budget for NSW. NSW Health. Sydney, Media Release.
Object Management Group. (1997, 13th January, 1997). "UML Notation Guide v1.0." Rational Software Corporation. from http://193.174.33.104:7776/UMT/notation_guide.html.
Object Management Group. (2005). "UML 2.0: Infrastructure." Rational Software Corporation. from http://www.omg.org/docs/formal/05-07-05.pdf.
Object Management Group (2006). Business Process Modeling Notation (BPMN) Specification. OMG: 308, OMG Adopted Specification.
Olve, N.-G., (2000), Performance Drivers: A Practical Guide to Using Balanced Scorecards, Wiley, Chichester.
Ontario Hospital Association (1999). A Balanced Scorecard for Ontario Acute Care Hospitals. Toronto: p.403
Oracle. (2005, 04 Apr 2005). "Multidimensional Database." Oracle.com. 2006, from http://searchoracle.techtarget.com/sDefinition/0,,sid41_gci214585,00.html.
Palmer, N., (2006), "Understanding the BPMN-XPDL-BPEL Value Chain," Business Integration Journal: pp.54-55.
Patient Flow Collaborative: Victorian Department of Human Services (2004). Improving management systems: Moving towards a 'pull' system through improved bed management. Royal Children's Hospital. Melbourne, Good News Story.
Peleg, M., Tu, S., Bury, J., Ciccaresr, P., Fox, J., Greenes, R. A., Hall, R., Johnson, P. D., Jones, N., Kumar, A., Miksch, S., Quaglini, S., Seyfang, A., Shortliffe, E. H. and Stefanelli, M., (2003), "Comparing Computer-interpretable Guideline Models: A Case-study Approach," Journal of the Amercian Medical Information Association, 10: pp.52-68.
Phillips, L. D. and Phillips, M. C., (1993), "Facilitated Work groups: Theory and Practice," Journal of Operational Research Society, 44(6): pp.533-549.
Prochaska, J. O., Velicer, W. F., Redding, C., Rossi, J. S., Goldstein, M., Depue, J., Greene, G. W., Rossi, S. R., Sun, X., Fava, J. L., Laforge, R., Rakowski, W. and Plummer, B. A., (2005), "Stage-based expert systems to guide a population of primary care patients to quit smoking, eat healthier, prevent skin cancer, and receive regular mammograms," Preventative Medicine, 41(2): pp.406-422.
Queensland Department of Health (2004). Budget Highlights 2003-2004: p.6, State Budget report.

References
329
Queensland Department of Health (2005). Request for Offer - Clinical Decision Support System. Information Directorate, Queensland Health. Bowen Hill: p.68, Request for Tender (Offer).
Resar, R. K., (2006), "Making Noncatastrophic Health Care Processes Reliable: Learning to Walk before Running in Creating High-Reliability Organizations," Health Services Research, 41(4p2): pp.1677-1689.
Rolland, C. (1993). Modeling the Requirements Engineering Process. 3rd European-Japanese Seminar on Information Modeling and Knowledge Bases, Budapest, Hungary, June, 1993,
Rosemann, M. and zur Muehlen, M., (1998), "Evaluation of Workflow Management Systems - A Meta Model Approach," Australian Journal of Information Systems, 6(1): pp.103-116.
Rother, M. and Shook, J., (2003), Learning to See, The Lean Enterprise Institute, Brookline.
Rowley, M., Hensley, M., Brinsmead. M. and Wlodarczyk, J., (1995), "Continuity of Care by a Midwife Team Versus Routine Care During Pregnancy and Birth: A Randomised Trial," Medical Journal of Australia, 163(6): pp.289-293.
Sackett, D., Rosenberg, W., Muir Gray, J., Haynes, R. and Richardson, W., (1996), "Evidence Based Medicine: What it is and What it isn't," BMJ(312): pp.71-72.
Sahler, O. J. and Carr, J. E., (2003), Behavioral Sciences and Health Care, Hogrefe & Huber, Cambridge, MA.
Saylor, M., Acharya, M. and Trenkamp, R., (1995), "True Relational OLAP: The Future of Decision Support," Database Journal(Nov-Dec).
Scheer, A.-W., (1994), "ARIS Toolset: A Software Product is Born," Information Systems, 19(8): 607-624.
Scheer, A.-W., (1998), ARIS - Business Process Frameworks, Springer-Verlag, Berlin.
Scheer, A.-W., (1999), ARIS - Business Process Modeling, Springer-Verlag, Berlin.
Schmidt, N., Abelson, B. and Oian, P., (2002), "Deliveries in Maternity Homes in Norway: Results from a 2-year Prospective Study," Acta Obstet.Gynecol.Scand.Suppl., 81: pp.231-237.
Schweiger, R., Brumhard, M., Hoelzer, S. and Dudeck, J., (2005), "Implementing health care systems using XML standards," International Journal of Medical Informatics, 74(2-4): 267-277.
Scott, W. R., Ruef, M., Mendel, P. J. and Caronna, C. A., (2000), Institutional Change and Healthcare Organisations: From Professional Dominance to Managed Care, The University of Chicago Press, Chicago, IL.
References
330
Sehwail, L. and DeYong, C., (2003), "Six Sigma in health care," Leadership in Health Services, 16(4): pp.1-5.
Seila, A. (2005). Seven Rules for Modeling Health Care Systems. Modeling Health Care Systems: Linking Operations and Health Services Research, Vancouver, Canada, 31 August - 4 September 2005,
Shapiro, J. and Shapiro, R., (2003), "Towards an improved collaboration model for the national healthcare system in England and Wales: a critical and constructive approach using operational research," Logistics Information Management, 16(3/4): pp.246-259.
Shaw, M. (2001). The coming-of-age of software architecture research. ICSE2001, Los Alamitos, CaliforniaIEEE Computer Society Press. pp.657-664.
Shi, M., Yang, G., Xiang, Y. and Wu, S. (1998). Workflow Management Systems: A Survey. International Conference on Communication Technology, Beijing, ChinaICCT'98
Shojania, K., Duncan, B., McDonald, K. and Watcher, R., eds. (2001). Making Health Care Safer: A Critical Analysis of Patient Safety Practices. Agency for Healthcare Research and Quality. Rockville, MD: 672, Evidence Report/Technology Assessment No. 43,AHRQ Publication No. 01-E058.
Shortliffe, E. H., Perreault, L. E., Wiederhold, G. and Fagan, L. M. e., (2001), Medical Informatics: computer applications in health care and biomedicine, Springer-Verlag, New York.
Sicotte, C., Champagne, F., Contandriopoulos, A. P., Beland, F. D. J. L., Bilodeau, H., Langley, A., Bremond, M., Lemieux-Charles, L., Barnsley, J., Leggart, S. G. and Baker, G. R., (1998), "A conceptual framework for the analysis of health care organisations' performance," Health Services Management Research, 11(1): pp24-48.
Silow-Carroll, S., Alteras, T. and Stepnick, L. (2006). Patient-Centered Care for Underserved Populations: Definition and Best Practices. Economic and Social Research Institute. Washington, D.C.: p.43, Research Report.
Simon, H. A., (1960), The New Science of Management Decision, Harper & Row, New York.
Simon, H. A., (1977), The New Science of Management Decision, Prentice Hall, Englewood Cliffs, N.J.
Sloane, E., Rosow, E., Adam, J. and Shine, D. (2006). JEDI- An Executive Dashboard and Decision Support System for Lean Global Military Medical Resource and Logistics Management. 28th IEEE EMBS Annual International Conference, New York City, USA, 30/8-3/9/2006, IEEE
Smith, C. V. J., (1999), "Total Quality Management," Global Journal of Engineering Education, 3(1): pp.61-64.
References
331
Sodhi, M. S. and Sohdi, N. S., (2005), "Six Sigma Pricing," Harvard Business Review, 83(5): p.135.
South Australian Department of Human Services (2004). Annual Report 2003-2004: p.123, Annual Report.
Sprague Jr, R. H. and Watson, H. J., (1989), Decision Support Systems: Putting Theory into Practice, Prentice Hall, Englewood Cliffs, N.J.
Sprague Jr, R. H. and Watson, H. J., (1996), Decision Support for Management, Prentice Hall, Upper Saddle River, N.J.
Swenson, K. (1995). The Difference Between Workflow and BPR. Fujitsu OSSI: p.92, Education Session Handout.
Szwarcbord, M. (2005). Redesigning care: improving flow across the hospital. 1st Australasian Redesigning Health Care Summit, Glenelg South Australia, 8-9 March 2005. Glenelg, SA, Conference Presentation.
The Commonwealth Fund Commission on a High Performance Health System (2006). Framework for a High Performance Health System for the United States. The Commonwealth Fund. New York: p.20
Tracy, S. (2004). Proposal for a primary health care model of maternity services at Ryde Hospital - Introduction of the Ryde Midwifery Group Practice. Midwifery Research & Practice Development Unit. Sydney: p.44, Unpublished Report.
Tracy, S. and Hartz, D. (2005). Final Report: The Quality Review of Ryde Midwifery Group Practice, September 2004 to October 2005. Northern Sydney and Central Coast Area Health Service. Sydney: p.68, First evaluation of the safety and effectiveness of the Ryde Midwifery Group Practice.
Tracy, S. K. (2002). Counting Maternity: The measure of midwifery in Australia 2002. UTS. Sydney, Australia: Part 7, Professional Doctorate in Midwifery (DMid).
Tracy, S. K. and Tracy, M. B., (2003), "Costing the cascade: estimating the cost of increased obstetric intervention in childbirth using population data," BJOG, 110: pp.717-724.
Turban, E., Aronson, J. and Liang, T.-P., (2005), Decision Support Systems and Intelligent Systems, Pearson Education Inc, Upper Saddle River, NJ.
U.S. Department of Health & Human Services. (2005, 31/3/2004). "FY 2006 Budget in Brief: Advancing the Health, Safety, and Well-Being of our People." United States Department of Health & Human Services. Retrieved 20/4/2005, 2005, from http://www.os.dhhs.gov/budget/06budget/overview.html.
UK Department of Health (1997). The New NHS: Modern, Dependable. UK Department of Health. London, White Paper: Cm 3807.
References
332
UK Department of Health. (2000). "The NHS Plan: a plan for investment, a plan for reform." Department of Health - England. Retrieved 3/4/2006, 2006, from http://www.dh.gov.uk/PublicationsAndStatistics/Publications/PublicationsPolicyAndGuidance/PublicationsPolicyAndGuidanceArticle/fs/en?CONTENT_ID=4002960&chk=07GL5R.
UK Department of Health (2005). Patient Pathways. UK Department of Health. London, Organisation Policy.
Unhelkar, B., (2005), Practical object-oriented analysis, Thomson Social Science Press, Southbank, QLD.
Urrutia, I. and Eriksen, S. D., (2005), "Application of the Balanced Scorecard in Spanish private health-care management," Measuring Business Excellence, 9(4): pp.16-26.
Victorian Department of Human Services (2004). More Than $2 Billion to Strengthen Health System. Victoria Health. Melbourne, VIC, Media Release.
Voelker, K. E., Rakich, J. S. and French, G. R., (2001), "The Balanced Scorecard in Healthcare Organisations: A Performance Measurement and Strategic Planning Methodology," Hospital Topics, 79(3): pp.13-25.
W3C. (1996, 14-Nov-1996). "Extensible Markup Language (XML): W3C Working Draft." W3C. 2006, from http://www.w3.org/TR/WD-xml-961114.html.
W3C. (1996, 08/05/2007). "XML Activity Statement." W3C. 2007, from http://www.w3.org/XML/.
W3C. (2006, 16 August 2006). "Extensible Markup Language (XML) 1.0 (Fourth Edition)." W3C. 2007, from http://www.w3.org/TR/2006/REC-xml-20060816/.
W3C. (2006, 16 August 2006). "Namespaces in XML 1.0 (second edition)." W3C. 2007, from http://www.w3.org/TR/REC-xml-names/.
Wachtel, T. L., Hartford, C. E. and Hughes, J. A., (1999), "Building a Balanced Scorecard for a burn center," Burns, 25(5): pp.431-37.
Wang, D., Peleg, M., Tu, S. W., Boxwala, A. A., Greenes, R. A., Patel, V. L. and Shortliffe, E. H., (2002), "Representation primitives, process models and patient data in computer-interpretable clinical practice guidelines: A literature review of guideline representation models," International Journal of Medical Informatics, 68: pp.59-70.
Westbrook, J. I., Gosling, A. S. and Coiera, E., (2004), "Do Clinicians Use Online Evidence to Support Patient Care? A Study of 55,000 Clinicians," Journal of the Amercian Medical Informatics Association, 11(2): 113-120.
Western Australia Department of Health (2005). Health Reform Implementation Taskforce Work Plan. WA Health. Perth, WA: p.130, Work Plan.
WfMC (1995). The Workflow Reference Model. Workflow Management Coalition. Winchester, UK: p.55, Technical Report.
References
333
WfMC (1998). Audit Data Specification V1.1. Workflow Management Coalition. Florida: p.51, Workflow Standard.
WfMC (1998). Workflow Management Application Programming Interface (Interface 2 & 3) Specification v2.0. Workflow Management Coalition. Winchester, UK: p.171, WFMC-TC-1009.
WfMC. (1999). "Workflow Management Coalition Terminology and Glossary WfMC-TC-1011." Workflow Management Coalition. from http://www.wfmc.org/standards/docs/TC-1011_term_glossary_v3.pdf.
WfMC (2005). Process Defintion Interface - XML Process Definition Language (V2.0). The Workflow Management Coalition. Florida: p.164, Workflow Standard.
Williams, T. (2000, 18th August 2000). "Workflow Management within the ARIS Framework." PERA. Retrieved 19th December 2006, Acess Year 2006, from http://pera.net/Methodologies/ARIS/ARIS_Paper_by_Ted_Williams.html.
Wilson, R. M. and Harrison, B. T., (2002), "What is clinical practice improvement?," Intern Med J, 32(9-10): pp.460-464.
Wilson, R. M., Runciman, W. B., Gibberd, R. W., Harrison, B. T., Newby, L. and Hamilton, J. D., (1995), "The Quality in Australian Health Care Study," Medical Journal of Australia, 163(9): pp.458-71.
Wing, C., Chui, W. T., Chen, W. M., Lin, M. F. and Chu, B., (2005), "Applying Six Sigma methodology to maximise magnetic resonance imaging capacity in a hospital," International Journal of Healthcare Technology & Management, 6(3): pp.321-330.
Womack, J. P., Jones, D., T., and Roos, D., (1990), The Machine That Changed The World, Rawson Associates, New York.
Womack, J. P. and Jones, D. T., (2003), Lean Thinking:banish waste and create wealth in your corporation, Free Press, New York.
Wood, J. and Silver, D., (1995), Joint Application Development, John Wiley & Sons Inc, New York.
Wysocki Jr, B. (2004). Industrial Strength: To Fix Health Care, Hospitals Take Tips From Factory Floor. Wall Street Journal: A.1
Young, M., (2000), XML: Step-by-Step, Microsoft Press, Redmond, WA.
Young, T., Brailsford, S., Conneli, C., Davies, R., Harper, P. and Klein, J. H., (2004), "Using Industrial processes to improve patient care," British Medical Journal, 328: pp. 162-164.
zur Muehlen, M. (1999). Evaluation of Workflow Management Systems Using Meta Models. 32nd Hawaii International Conference on System Sciences, Hawaii, USAHICSS32

References
334
zur Muehlen, M., (2004), "Organizational Management in Workflow Applications - Issues and Perspectives," Information Technology and Management, 5: pp.271-291.

335
Appendix A PMAF4HC – Detailed Questions
by Category
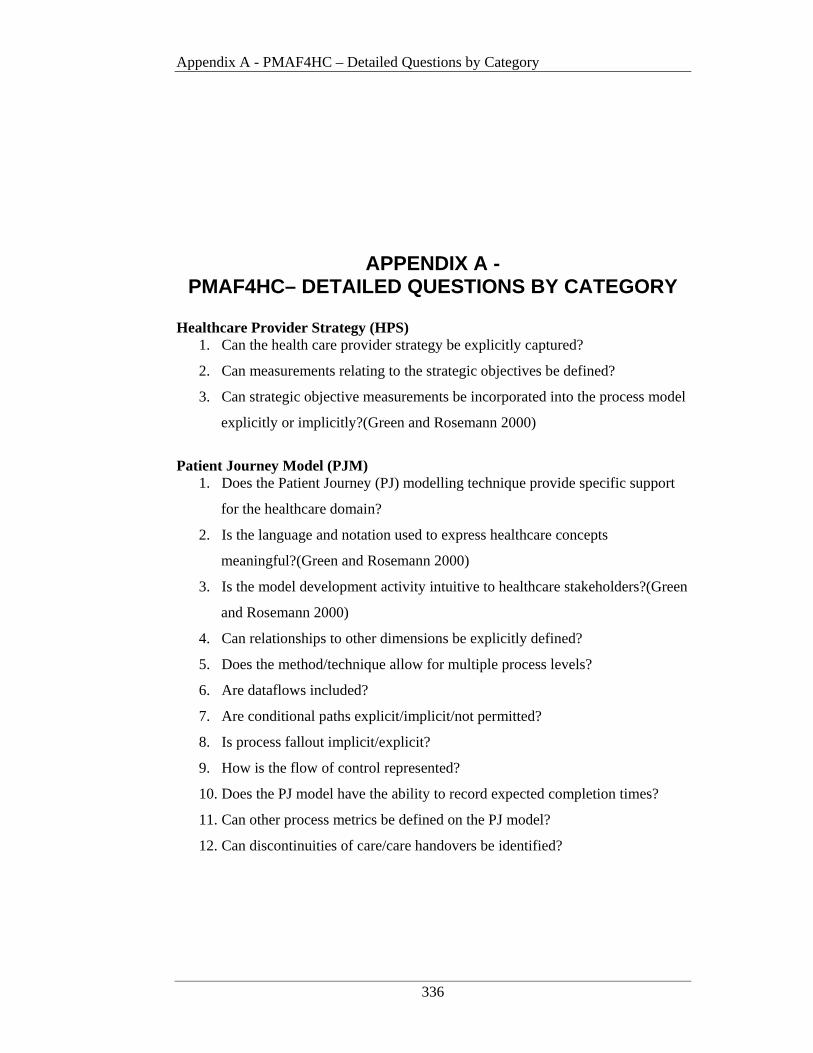
Appendix A - PMAF4HC – Detailed Questions by Category
336
APPENDIX A - PMAF4HC– DETAILED QUESTIONS BY CATEGORY
Healthcare Provider Strategy (HPS)
1. Can the health care provider strategy be explicitly captured?
2. Can measurements relating to the strategic objectives be defined?
3. Can strategic objective measurements be incorporated into the process model
explicitly or implicitly?(Green and Rosemann 2000)
Patient Journey Model (PJM)
1. Does the Patient Journey (PJ) modelling technique provide specific support
for the healthcare domain?
2. Is the language and notation used to express healthcare concepts
meaningful?(Green and Rosemann 2000)
3. Is the model development activity intuitive to healthcare stakeholders?(Green
and Rosemann 2000)
4. Can relationships to other dimensions be explicitly defined?
5. Does the method/technique allow for multiple process levels?
6. Are dataflows included?
7. Are conditional paths explicit/implicit/not permitted?
8. Is process fallout implicit/explicit?
9. How is the flow of control represented?
10. Does the PJ model have the ability to record expected completion times?
11. Can other process metrics be defined on the PJ model?
12. Can discontinuities of care/care handovers be identified?
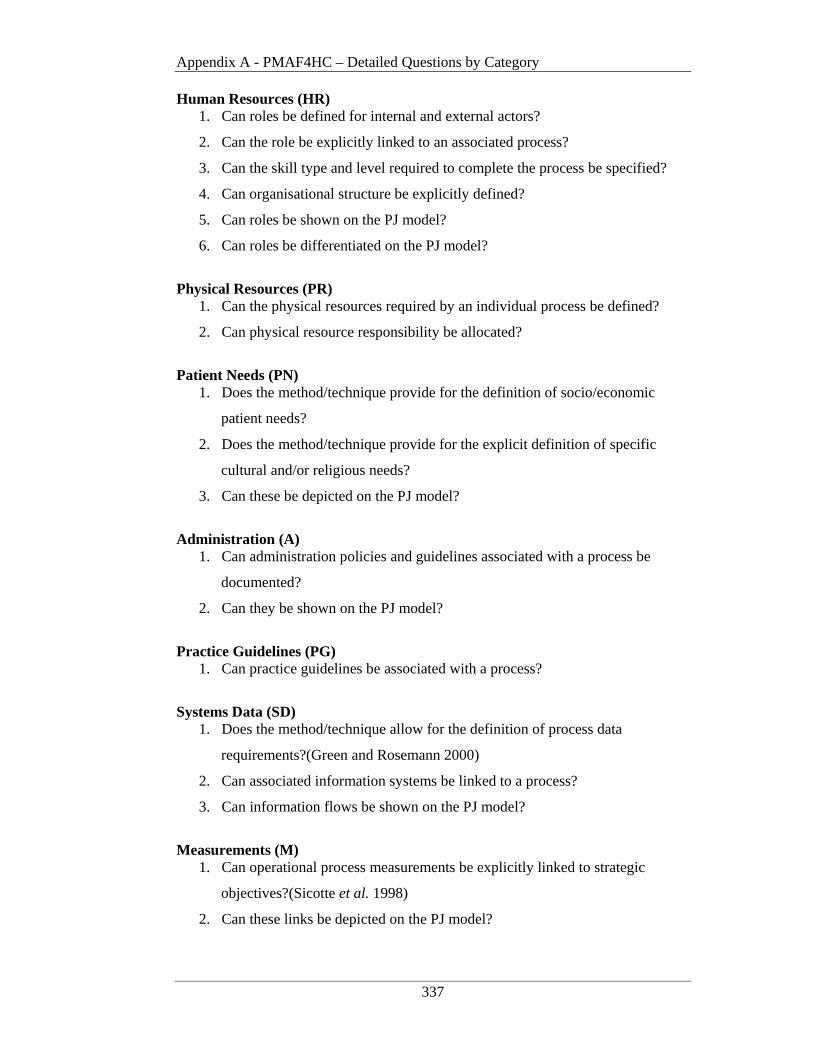
Appendix A - PMAF4HC – Detailed Questions by Category
337
Human Resources (HR) 1. Can roles be defined for internal and external actors?
2. Can the role be explicitly linked to an associated process?
3. Can the skill type and level required to complete the process be specified?
4. Can organisational structure be explicitly defined?
5. Can roles be shown on the PJ model?
6. Can roles be differentiated on the PJ model?
Physical Resources (PR)
1. Can the physical resources required by an individual process be defined?
2. Can physical resource responsibility be allocated?
Patient Needs (PN)
1. Does the method/technique provide for the definition of socio/economic
patient needs?
2. Does the method/technique provide for the explicit definition of specific
cultural and/or religious needs?
3. Can these be depicted on the PJ model?
Administration (A)
1. Can administration policies and guidelines associated with a process be
documented?
2. Can they be shown on the PJ model?
Practice Guidelines (PG)
1. Can practice guidelines be associated with a process?
Systems Data (SD)
1. Does the method/technique allow for the definition of process data
requirements?(Green and Rosemann 2000)
2. Can associated information systems be linked to a process?
3. Can information flows be shown on the PJ model?
Measurements (M)
1. Can operational process measurements be explicitly linked to strategic
objectives?(Sicotte et al. 1998)
2. Can these links be depicted on the PJ model?
Appendix A - PMAF4HC – Detailed Questions by Category
338
Technology Support (TS)
1. Has software been developed to support the method/technique?
2. Can the software provide output for the definition of operational
workflows?(Swenson 1995)
3. Can the software provide output for the definition of variance analysis
algorithms for decision support?
339
Appendix B BSC XML Output –
Evaluate Patient Suitability
Appendix B - BSC XML for Evaluate Patient Suitability
340
APPENDIX B - BSC XML FOR EVALUATE PATIENT SUITABILITY
The format for the Balanced Scorecard Perspective output is based on the Balanced
Scorecard Collaborative XML Draft Standard (Balanced Scorecard Collaborative
2001). The BSC perspectives used for the case study are based on the Ontario
Hospital Association enhancements discussed in Chapter 2; namely Patient
Satisfaction, Clinical Utilsation and Outcomes, Systems Integration and Change and
Financial Performance and Conditions (Ontario Hospital Association 1999). The
particular objectives used in this example relate to the initial evaluation of a Patient’s
suitability for the Ryde Midwifery Group Practice model of care from the time a
woman requests an Assessment Questionnaire to the time her suitability is
determined.
The following amendments have been made to this standard to facilitate its
incorporation with PJM3.
1. A 'patientjourneymodel id' data element has been added to provide the ability to
identify the treatment stream being modelled. This enables measures for a particular treatment stream to be explicitly linked to a specific Balanced Scorecard.
2. The 'type' data element within the ‘measure’ construct ' (as added by McGregor (2002)) has been extended to provide the ability to identify additional types of measures to be recorded. This includes ‘confidence level’ and ‘compliance’.
3. The 'unit' data element within the ‘measure’ construct has also been extended to accommodate for the new ‘types’ in point 2. This required the addition of a ‘percentage’ value.
4. Due to the individual working patterns associated with the Ryde Midwifery Group Practice model an additional extension was also required to the 'unit' data element within the ‘measure’ construct. This necessitated the addition of a ‘working day’ value.
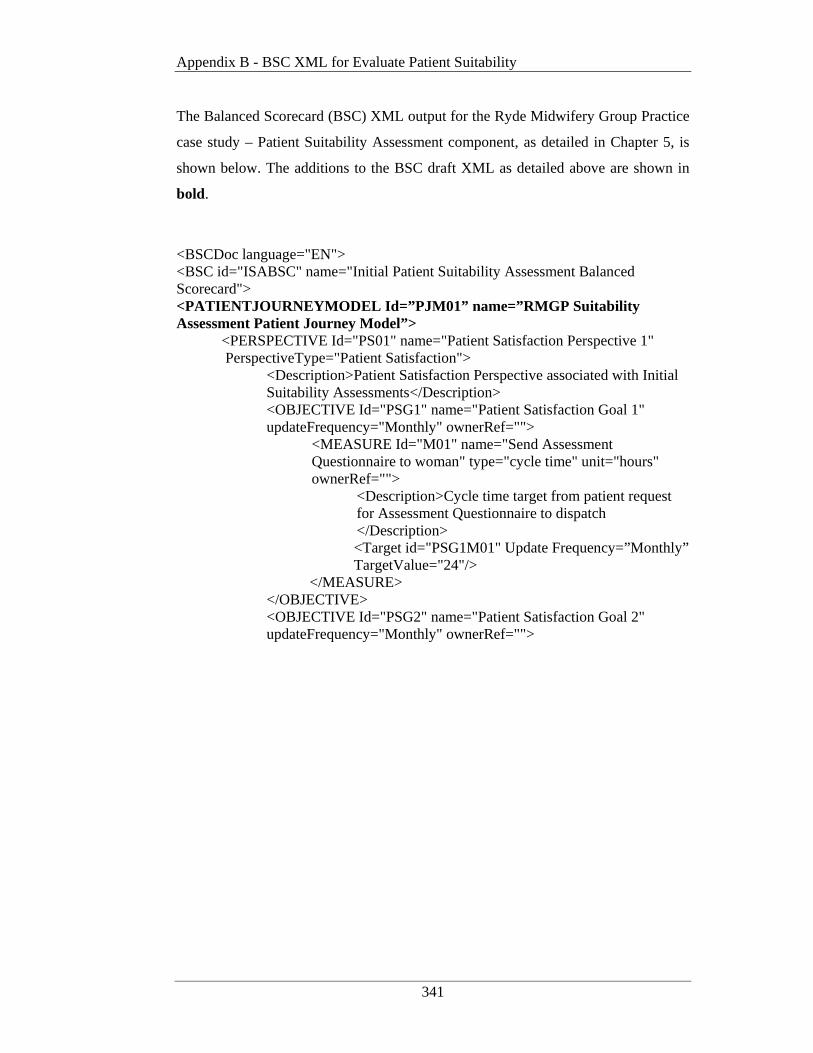
Appendix B - BSC XML for Evaluate Patient Suitability
341
The Balanced Scorecard (BSC) XML output for the Ryde Midwifery Group Practice
case study – Patient Suitability Assessment component, as detailed in Chapter 5, is
shown below. The additions to the BSC draft XML as detailed above are shown in
bold.
<BSCDoc language="EN"> <BSC id="ISABSC" name="Initial Patient Suitability Assessment Balanced Scorecard"> <PATIENTJOURNEYMODEL Id=”PJM01” name=”RMGP Suitability Assessment Patient Journey Model”>
<PERSPECTIVE Id="PS01" name="Patient Satisfaction Perspective 1" PerspectiveType="Patient Satisfaction">
<Description>Patient Satisfaction Perspective associated with Initial Suitability Assessments</Description> <OBJECTIVE Id="PSG1" name="Patient Satisfaction Goal 1" updateFrequency="Monthly" ownerRef="">
<MEASURE Id="M01" name="Send Assessment Questionnaire to woman" type="cycle time" unit="hours" ownerRef="">
<Description>Cycle time target from patient request for Assessment Questionnaire to dispatch </Description> <Target id="PSG1M01" Update Frequency=”Monthly” TargetValue="24"/>
</MEASURE> </OBJECTIVE> <OBJECTIVE Id="PSG2" name="Patient Satisfaction Goal 2" updateFrequency="Monthly" ownerRef="">
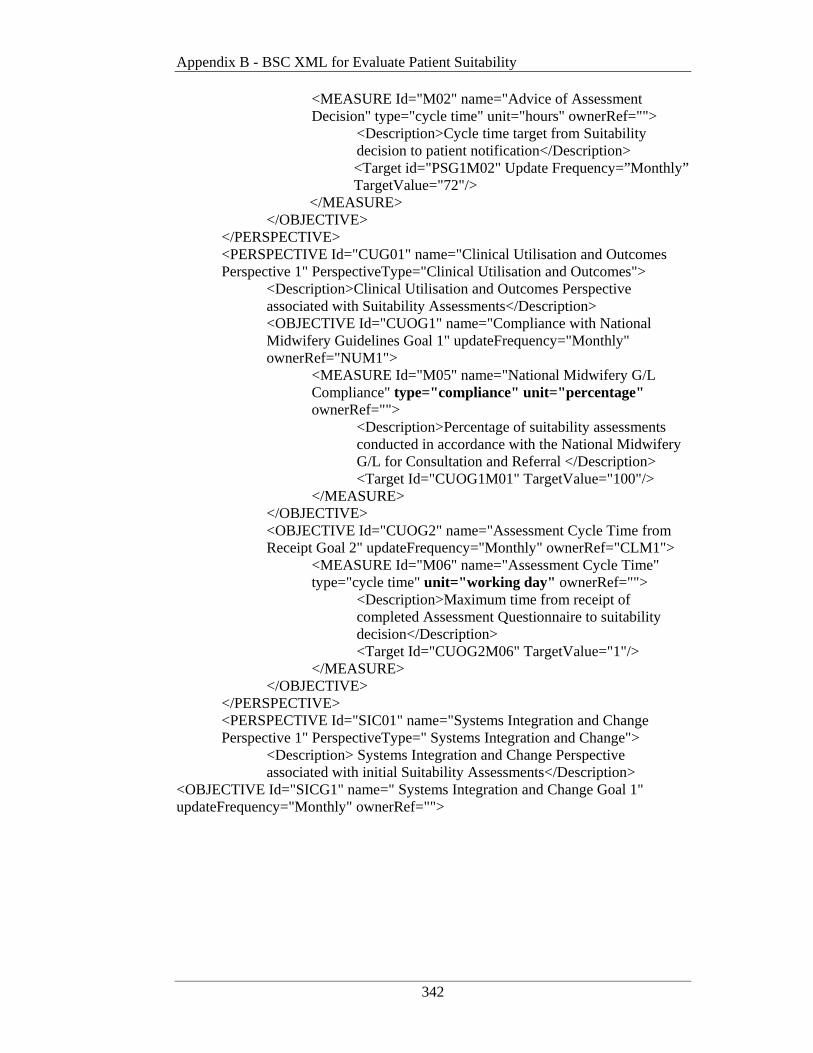
Appendix B - BSC XML for Evaluate Patient Suitability
342
<MEASURE Id="M02" name="Advice of Assessment Decision" type="cycle time" unit="hours" ownerRef="">
<Description>Cycle time target from Suitability decision to patient notification</Description> <Target id="PSG1M02" Update Frequency=”Monthly” TargetValue="72"/>
</MEASURE> </OBJECTIVE>
</PERSPECTIVE> <PERSPECTIVE Id="CUG01" name="Clinical Utilisation and Outcomes Perspective 1" PerspectiveType="Clinical Utilisation and Outcomes">
<Description>Clinical Utilisation and Outcomes Perspective associated with Suitability Assessments</Description> <OBJECTIVE Id="CUOG1" name="Compliance with National Midwifery Guidelines Goal 1" updateFrequency="Monthly" ownerRef="NUM1">
<MEASURE Id="M05" name="National Midwifery G/L Compliance" type="compliance" unit="percentage" ownerRef="">
<Description>Percentage of suitability assessments conducted in accordance with the National Midwifery G/L for Consultation and Referral </Description>
<Target Id="CUOG1M01" TargetValue="100"/> </MEASURE>
</OBJECTIVE> <OBJECTIVE Id="CUOG2" name="Assessment Cycle Time from Receipt Goal 2" updateFrequency="Monthly" ownerRef="CLM1">
<MEASURE Id="M06" name="Assessment Cycle Time" type="cycle time" unit="working day" ownerRef="">
<Description>Maximum time from receipt of completed Assessment Questionnaire to suitability decision</Description>
<Target Id="CUOG2M06" TargetValue="1"/> </MEASURE>
</OBJECTIVE> </PERSPECTIVE> <PERSPECTIVE Id="SIC01" name="Systems Integration and Change Perspective 1" PerspectiveType=" Systems Integration and Change">
<Description> Systems Integration and Change Perspective associated with initial Suitability Assessments</Description>
<OBJECTIVE Id="SICG1" name=" Systems Integration and Change Goal 1" updateFrequency="Monthly" ownerRef="">
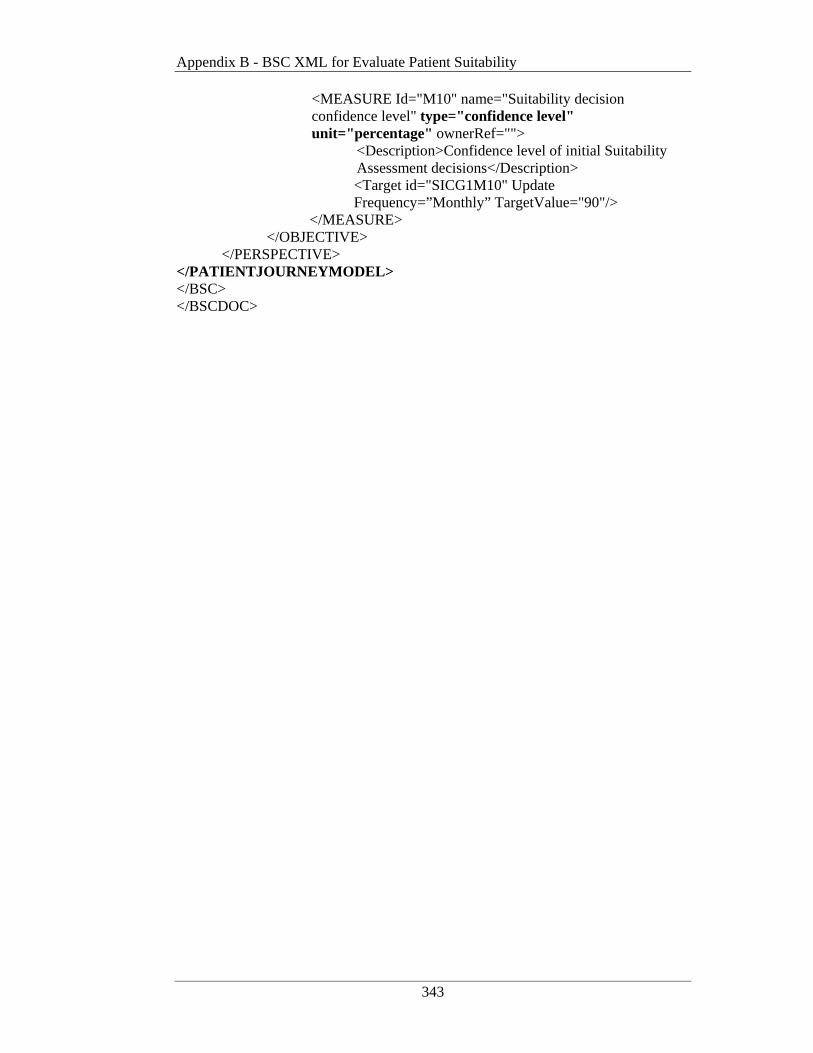
Appendix B - BSC XML for Evaluate Patient Suitability
343
<MEASURE Id="M10" name="Suitability decision confidence level" type="confidence level" unit="percentage" ownerRef="">
<Description>Confidence level of initial Suitability Assessment decisions</Description> <Target id="SICG1M10" Update Frequency=”Monthly” TargetValue="90"/>
</MEASURE> </OBJECTIVE>
</PERSPECTIVE> </PATIENTJOURNEYMODEL> </BSC> </BSCDOC>

344
Appendix C XPDL for Evaluate Patient Suitability
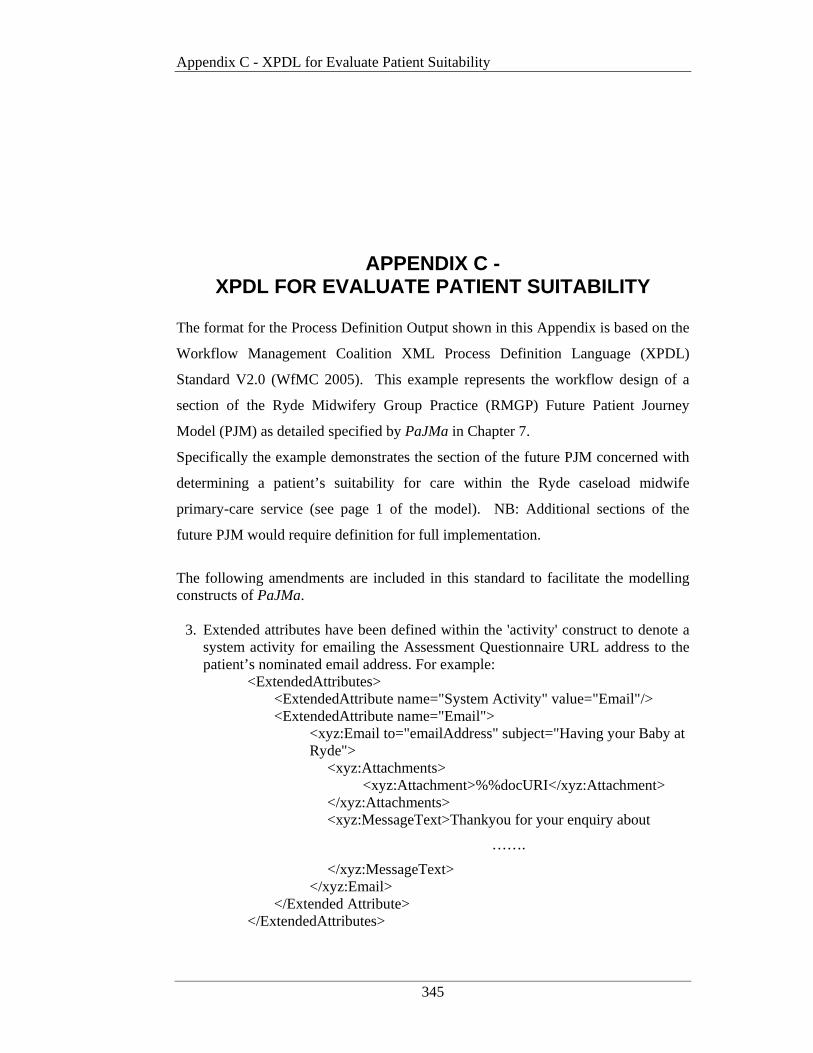
Appendix C - XPDL for Evaluate Patient Suitability
345
APPENDIX C - XPDL FOR EVALUATE PA TIENT SUITABILITY
The format for the Process Definition Output shown in this Appendix is based on the
Workflow Management Coalition XML Process Definition Language (XPDL)
Standard V2.0 (WfMC 2005). This example represents the workflow design of a
section of the Ryde Midwifery Group Practice (RMGP) Future Patient Journey
Model (PJM) as detailed specified by PaJMa in Chapter 7.
Specifically the example demonstrates the section of the future PJM concerned with
determining a patient’s suitability for care within the Ryde caseload midwife
primary-care service (see page 1 of the model). NB: Additional sections of the
future PJM would require definition for full implementation.
The following amendments are included in this standard to facilitate the modelling constructs of PaJMa.
3. Extended attributes have been defined within the 'activity' construct to denote a system activity for emailing the Assessment Questionnaire URL address to the patient’s nominated email address. For example:
<ExtendedAttributes> <ExtendedAttribute name="System Activity" value="Email"/> <ExtendedAttribute name="Email">
<xyz:Email to="emailAddress" subject="Having your Baby at Ryde">
<xyz:Attachments> <xyz:Attachment>%%docURI</xyz:Attachment>
</xyz:Attachments> <xyz:MessageText>Thankyou for your enquiry about
…….
</xyz:MessageText> </xyz:Email>
</Extended Attribute> </ExtendedAttributes>

Appendix C - XPDL for Evaluate Patient Suitability
346
4. Within the 'activity' construct, extended attributes, as originally defined by
McGregor (2002), have also been enhanced to provide links from the
previously defined target Balanced Scorecard measurements to individual
activities. For example:
<ExtendedAttribute> <Name>CUOGoal1</Name> <Value>CUOG1</Value>
</ExtendedAttribute> <ExtendedAttribute>
<Name>CUOCompliance</Name> <Value>100</Value>
</ExtendedAttribute> <ExtendedAttribute>
<Name>CUOComplianceType</Name> <Value>Percentage</Value>
</ExtendedAttribute> <ExtendedAttribute>
<Name>CUOGoal2</Name> <Value>CUOG2</Value>
</ExtendedAttribute> <ExtendedAttribute>
<Name>CUOCycleTime</Name> <Value>1</Value>
</ExtendedAttribute> <ExtendedAttribute>
<Name>CUOCycleTimeType</Name> <Value>WorkingDay</Value>
</ExtendedAttribute> <ExtendedAttribute>
<Name>SICGoal2</Name> <Value>SICG2</Value>
</ExtendedAttribute> <ExtendedAttribute>
<Name>SICConfidenceLevel</Name> <Value>90</Value>
</ExtendedAttribute> <ExtendedAttribute>
<Name>SICConfidenceLevelType</Name> <Value>Percentage</Value>
</ExtendedAttribute>
The additions to the XPDL standard made for PaJMa are shown in bold. The use of
McGregor’s original additions is shown in italics. Where McGregor’s (2002)
original additions have been coupled with the enhancements made by this research, it
is shown in bold italics.

Appendix C - XPDL for Evaluate Patient Suitability
347
<?xml version="1.0" encoding="us-ascii"?> <Package xmlns:xpdl="http://www.wfmc.org/standards/docs/xpdl" id="Initial _Patient_Suitability_Assessment" Name="Evaluate Patient Suitability XPDL">
<TypeDeclarations> <TypeDeclaration Id="Assessment_Questionnaire" Name="Assessment Questionnaire">
<ExternalReference location=http://uws.edu.au/hir/docs/xpdl_sample/assessmentquestionnaireschema.xsd/>
</TypeDeclaration> </TypeDeclarations>
<Participants> <Participant id="Manager1" name="Manager-1">
<ParticipantType>HUMAN</ParticipantType> <Description>NurseUnitManager</Description> </Participant> <Participant id="WardClerk1" name="Ward Clerk-1">
<ParticipantType>HUMAN</ParticipantType> <Description>Administration Clerk</Description> </Participant> <Participant id="CaseloadMidwife1" name="Caseload Midwife-1">
<ParticipantType>HUMAN</ParticipantType> <Description>Named Midwife</Description> </Participant> <Participant id="CaseloadMidwife2" name="Caseload Midwife-2">
<ParticipantType>HUMAN</ParticipantType> <Description>Named Midwife</Description> </Participant> <Participant id="CaseloadMidwife3" name="Caseload Midwife-3">
<ParticipantType>HUMAN</ParticipantType> <Description>Named Midiwfe</Description> </Participant> <Participant id="CaseloadMidwife4" name="Caseload Midwife-4">
<ParticipantType>HUMAN</ParticipantType> <Description>Named Midwife</Description> </Participant> <Participant id="CaseloadMidwife5" name=" Caseload Midwife-5">
<ParticipantType>HUMAN</ParticipantType> <Description>Named Midwife</Description> </Participant> <Participant id="NUM" name="Nurse Unit Mgr">
<ParticipantType>ROLE</ParticipantType> <Description>manages maternity unit staff</Description> </Participant>

Appendix C - XPDL for Evaluate Patient Suitability
348
<Participant id="Ward_Clerk" name="Ward Clerk"> <ParticipantType>ROLE</ParticipantType>
<Description>performs initial patient contact </Description> </Participant>
<Participant id="Caseload_Midwife" name="'Caseload Midwife"> <ParticipantType>ROLE</ParticipantType>
<Description>performs suitability assessments </Description> </Participant> <Participant id="Maternity Unit" name="Maternity">
<ParticipantType>ORGANISATIONAL_UNIT </ParticipantType> <Description>provides physical clinical care and birthing
space</Description> </Participant> <Participant id="Caseload_Team" name="Caseload Team">
<ParticipantType>ORGANISATIONAL_UNIT </ParticipantType> <Description>provides actual clinical care and advice
</Description> </Participant>
<Participant id="Ryde_Maternity_DB" name="Ryde Maternity Database">
<ParticipantType>SYSTEM</ParticipantType> <Description>integrated Ryde maternity database</Description>
</Participant> <Participant id="Online_Assessment_Questionnaire_Application" name="Online Assessment Questionnaire">
<ParticipantType>SYSTEM</ParticipantType> <Description>provides web-based assessment questionnaire for
online completion and return</Description> </Participant> </Participants> <Applications>
<Application id="Ryde_Maternity_DB" name="Ryde Maternity Database">
<Description> integrated Ryde maternity database</Description> <FormalParameters>
<FormalParameter id="suitability_decision" mode="OUT">
<DataType>String</DataType> <Description>identifies outcome of patient suitability evaluation</Description>
</FormalParameter> </FormalParameters> </Application>
</Applications>
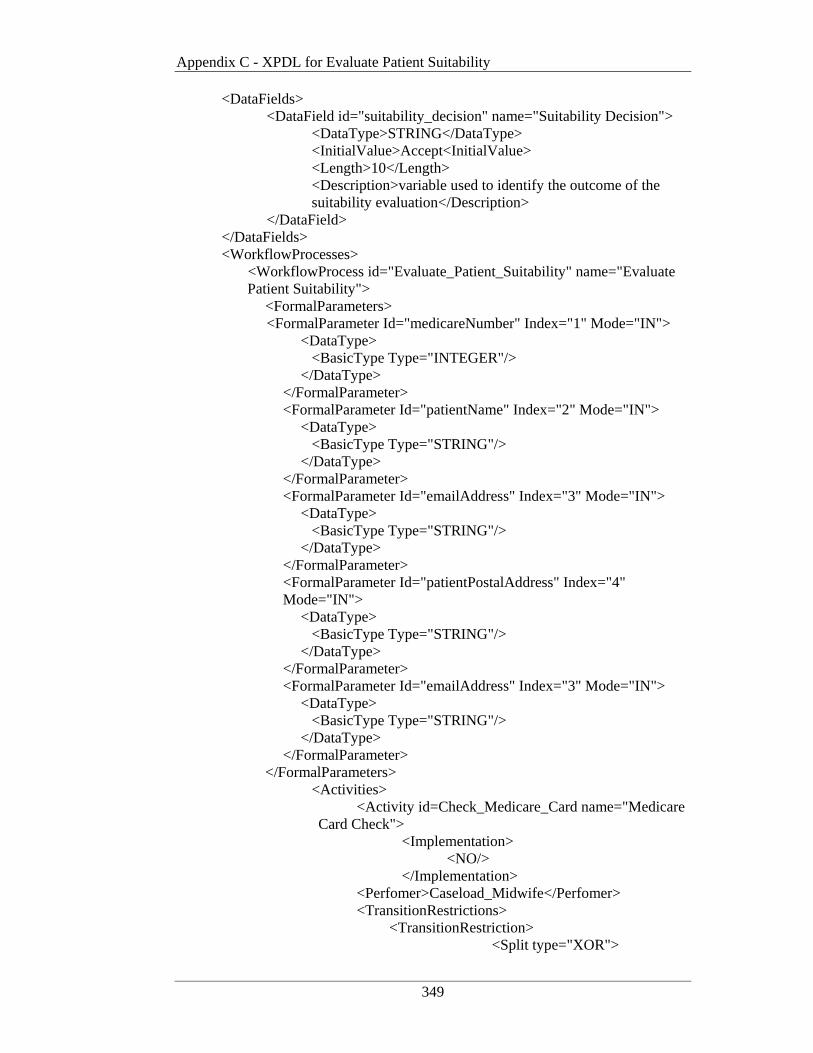
Appendix C - XPDL for Evaluate Patient Suitability
349
<DataFields> <DataField id="suitability_decision" name="Suitability Decision">
<DataType>STRING</DataType> <InitialValue>Accept<InitialValue> <Length>10</Length>
<Description>variable used to identify the outcome of the suitability evaluation</Description>
</DataField> </DataFields> <WorkflowProcesses>
<WorkflowProcess id="Evaluate_Patient_Suitability" name="Evaluate Patient Suitability">
<FormalParameters> <FormalParameter Id="medicareNumber" Index="1" Mode="IN">
<DataType> <BasicType Type="INTEGER"/> </DataType>
</FormalParameter> <FormalParameter Id="patientName" Index="2" Mode="IN">
<DataType> <BasicType Type="STRING"/> </DataType>
</FormalParameter> <FormalParameter Id="emailAddress" Index="3" Mode="IN">
<DataType> <BasicType Type="STRING"/> </DataType>
</FormalParameter> <FormalParameter Id="patientPostalAddress" Index="4" Mode="IN">
<DataType> <BasicType Type="STRING"/> </DataType>
</FormalParameter> <FormalParameter Id="emailAddress" Index="3" Mode="IN">
<DataType> <BasicType Type="STRING"/> </DataType>
</FormalParameter> </FormalParameters> <Activities>
<Activity id=Check_Medicare_Card name="Medicare Card Check">
<Implementation> <NO/> </Implementation>
<Perfomer>Caseload_Midwife</Perfomer> <TransitionRestrictions>
<TransitionRestriction> <Split type="XOR">
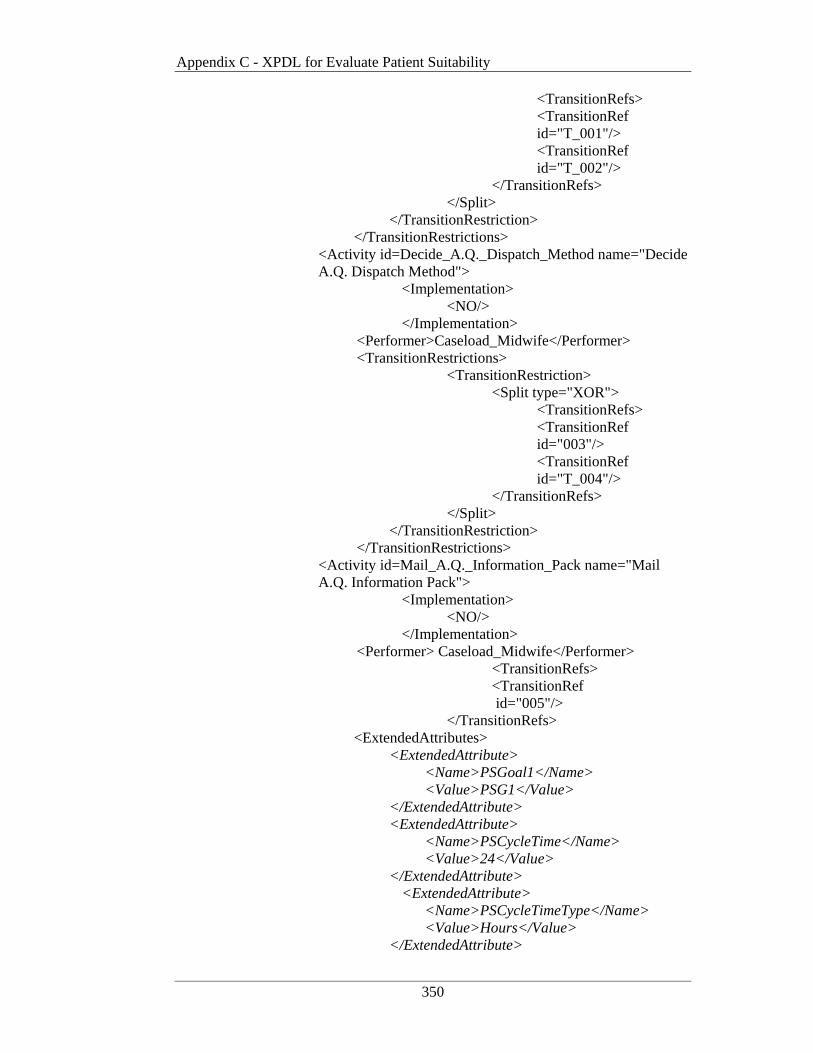
Appendix C - XPDL for Evaluate Patient Suitability
350
<TransitionRefs> <TransitionRef
id="T_001"/> <TransitionRef
id="T_002"/> </TransitionRefs> </Split>
</TransitionRestriction> </TransitionRestrictions>
<Activity id=Decide_A.Q._Dispatch_Method name="Decide A.Q. Dispatch Method">
<Implementation> <NO/> </Implementation>
<Performer>Caseload_Midwife</Performer> <TransitionRestrictions>
<TransitionRestriction> <Split type="XOR"> <TransitionRefs>
<TransitionRef id="003"/>
<TransitionRef id="T_004"/>
</TransitionRefs> </Split>
</TransitionRestriction> </TransitionRestrictions>
<Activity id=Mail_A.Q._Information_Pack name="Mail A.Q. Information Pack">
<Implementation> <NO/> </Implementation>
<Performer> Caseload_Midwife</Performer> <TransitionRefs>
<TransitionRef id="005"/>
</TransitionRefs> <ExtendedAttributes>
<ExtendedAttribute> <Name>PSGoal1</Name> <Value>PSG1</Value>
</ExtendedAttribute> <ExtendedAttribute>
<Name>PSCycleTime</Name> <Value>24</Value>
</ExtendedAttribute> <ExtendedAttribute>
<Name>PSCycleTimeType</Name> <Value>Hours</Value>
</ExtendedAttribute>
Appendix C - XPDL for Evaluate Patient Suitability
351
<ExtendedAttribute> <Name>PSCycleTimeStartDate</Name> <Value>10/07/2007</Value>
</ExtendedAttribute> </ExtendedAttributes>
<Activity id=Email_A.Q._URL_Address name="Email A.Q. URL Address">
<Implementation> <NO/> </Implementation> <ExtendedAttributes>
<ExtendedAttribute name="System Activity" value="Email"/> <ExtendedAttribute name="Email">
<xyz:Email to="emailAddress" subject="Having Your Baby at Ryde">
<xyz:Attachments> <xyz:Attachment>%%docURI</xyz:Atta
chment> </xyz:Attachments> <xyz:MessageText>Thankyou for your
enquiry about birthing with the Midwives at Ryde Maternity. Please find attached an information pack outlining the care practices and services provided by our Midwives. To determine if you are a candidate for this service, please complete out Assessment Questionnaire at http://rydehosptial/gov.au/maternity/assessment.html. When you are finished “click” the “submit” button and your responses will be sent to Ryde for evaluation. A midwife will contact you within 48 hours to discuss the results. Regards The Ryde Maternity Team</xyz:MessageText>
</xyz:Email> </Extended Attribute>
</ExtendedAttributes> <Performer> Caseload_Midwife</Performer>
<TransitionRefs> <TransitionRef
id="006"/> </TransitionRefs>
<ExtendedAttributes> <ExtendedAttribute>
<Name>PSGoal1</Name> <Value>PSG1</Value>
</ExtendedAttribute>

Appendix C - XPDL for Evaluate Patient Suitability
352
<ExtendedAttribute> <Name>PSCycleTime</Name> <Value>24</Value>
</ExtendedAttribute> <ExtendedAttribute>
<Name>PSCycleTimeType</Name> <Value>Hours</Value>
</ExtendedAttribute> <ExtendedAttribute>
<Name>PSCycleTimeStartDate</Name> <Value>10/07/2007</Value>
</ExtendedAttribute> </ExtendedAttributes>
</Activity> <Activity id=Capture_Paper_Responses name="Paper Response Data Entry">
<Implementation> <Task>
<TaskApplication id="Capture Patient A.Q. Responses"> <ActualParameters>
<ActualParameter>patientName</ActualParameter> <ActualParameter>patientPostalAddress</ActualParameter> <ActualParameter>patientContactDetails</ActualParameter> <ActualParameter>patientPregnancyHistory</ActualParameter> <ActualParameter>patientMedicalHistory</ActualParameter> <ActualParameter>patientMedications</ActualParameter>
</TaskApplication> </Task>
</Implementation> <Performers>
<Performer>Ryde_Maternity_DB_Application </Performer> <Performer>Caseload_Midwife</Performer>
</Performers> <TransitionRestrictions>
<TransitionRestriction> <TransitionRefs>
<TransitionRef id="T_007"/>
</TransitionRefs> </TransitionRestriction>
</TransitionRestrictions> </Activity>
Appendix C - XPDL for Evaluate Patient Suitability
353
<Activity id=Make_Suitability_Decision name="Patient Suitability Decision">
<Implementation> <NO/> </Implementation>
<Performer>Caseload_Midwife</Performer> <TransitionRestrictions>
<TransitionRestriction> <Split type="XOR"> <TransitionRefs>
<TransitionRef id="T_009"/>
<TransitionRef id="T_010"/>
</TransitionRefs> </Split>
</TransitionRestriction> </TransitionRestrictions> <ExtendedAttributes>
<ExtendedAttribute> <Name>CUOGoal1</Name> <Value>CUOG1</Value>
</ExtendedAttribute> <ExtendedAttribute>
<Name>CUOCompliance</Name> <Value>100</Value>
</ExtendedAttribute> <ExtendedAttribute>
<Name>CUOComplianceType</Name> <Value>Percentage</Value>
</ExtendedAttribute> <ExtendedAttribute>
<Name>CUOGoal2</Name> <Value>CUOG2</Value>
</ExtendedAttribute> <ExtendedAttribute>
<Name>CUOCycleTime</Name> <Value>1</Value>
</ExtendedAttribute> <ExtendedAttribute>
<Name>CUOCycleTimeType</Name> <Value>WorkingDay</Value>
</ExtendedAttribute> <ExtendedAttribute>
<Name>SICGoal2</Name> <Value>SICG2</Value>
</ExtendedAttribute> <ExtendedAttribute>
<Name>SICConfidenceLevel</Name> <Value>90</Value>
Appendix C - XPDL for Evaluate Patient Suitability
354
</ExtendedAttribute> <ExtendedAttribute>
<Name>SICConfidenceLevelType</Name>
<Value>Percentage</Value> </ExtendedAttribute>
</ExtendedAttributes> <Activity id=Cature_Suitability_Decision name="Capture Suitability Decision">
<Implementation> <Task>
<TaskApplication id="Capture Suitability Decision">
<ActualParameters> <ActualParameter>Suitability Decision</ActualParameter>
</TaskApplication> </Task>
</Implementation> <Performers>
<Performer>Ryde_Maternity_DB_Application</Performer>
<Performer>Caseload_Midwife</Performer> </Performers>
<TransitionRestrictions> <TransitionRestriction>
<Join type="XOR"/> </TransitionRestriction>
</TransitionRestrictions> <Transitions>
<Transition id="T_001" From="Medicare Card Check" To="Decide_A.Q._Dispatch_Method"/>
<Condition type="CONDITION"> <Expression 'Medicare_card_no'="True"/>
</Condition> </Transition> <Transition id="T_002" From="Medicare Card Check" To="TERMINATE"/>
<Condition type="CONDITION"> <Expression 'Medicare_card_no'="False"/>
</Condition> </Transition> <Transition id="T_003" From="Decide A.Q. Dispatch Method" To="Mail_A.Q._Information_Pack"/>
<Condition type="CONDITION"> <Expression 'email_address'="False"/>
</Condition> </Transition> <Transition id="T_004" From="Decide A.Q. Dispatch Method" To="Email_A.Q._URL_Address"/>
Appendix C - XPDL for Evaluate Patient Suitability
355
<Condition type="CONDITION"> <Expression 'email_address'="True"/>
</Condition> </Transition> <Transition id="T_005" From="Mail A.Q. Information Pack" To="Input_Paper_Responses"/> </Transition> <Transition id="T_006" From="Email A.Q. URL Address" To="Make_Suitability_Decision"/> </Transition> <Transition id="T_007" From="Paper Response Data Entry" To="Make_Suitability_Decision"/> </Transition> <Transition id="T_008" From="Patient Suitability Decision" To="Capture_Suitability_Decision"/> </Transition> <Transition id="T_009" From="Patient Suitability Decision" To="Preliminary_Midwife_Assignment"/>
<Condition type="CONDITION"> <Expression 'suitability_decision'="Accept"/>
</Condition> </Transition> <Transition id="T_010" From="Patient Suitability Decision" To="TERMINATE"/>
<Condition type="CONDITION"> <Expression 'suitability_decision'="Reject"/>
</Condition> </Transition>
</Transitions> </WorkflowProcess>
</WorkflowProcesses> </Package>