A Macroeconomic (Simultaneous Equation) Model Of The Estonian Dairy Sector
8
IAALD AFITA WCCA2008 WORLD CONFERENCE ON AGRICULTURAL INFORMATION AND IT A macroeconomic (simultaneous equation) model of the Estonian livestock sector Reet Põldaru 1 , Jüri Roots 1 , Ants-Hannes Viira 1 , and Rando Värnik 1 1 Estonian University of Life Sciences, Estonia, [email protected] Abstract The primary objective of the present study was creation of a macroeconomic (simultaneous equation) model of Estonian livestock sector. Simultaneous equation modeling provides a new approach to the economic analysis. A macroeconomic model of Estonian livestock sector was created using the approach pioneered by FAPRI. The FAPRI GOLD is a dynamic, partial equilibrium, multi-commodity, global econometric model. This paper outlines the linkage between the livestock sector and input sectors. The stochastic equations are estimated by two stage least squares (2SLS) and three stage least squares (3SLS). The equations were estimated using data from 1992 to 2007 inclusive. Most of the parameters of all structural equations are significant and theoretically consistent. Projections for the main endogenous variables are made for a six-year period. The projections of beef and veal, pig meat and broiler production and domestic use are presented and analyzed. Perspective implementation of Estonian livestock sector model as a decision making instrument for projection and analysis purposes is considered. Keywords: Econometric modeling, Simultaneous equations, Partial equilibrium modeling, Estonian agriculture, Livestock sector Introduction Throughout last decades, the use of economic models in relation to agricultural policy issues has increased substantially and a huge amount of literature exists on these issues. A number of different modeling approaches have been applied (Binfield, et al., 2000, Donnelan, et al., 2002; Leeuwen, et al., 2005, Balkhausen, et al., 2008). The models are also an essential component of decision support systems (DSS), especially Model-Driven DSS (Power and Sharda, 2007). Models in agriculture have been used for many different purposes of decision making, related to e.g. projections of the agricultural production, discussions of trade negotiations, effects of the EU CAP reforms etc. Model-Driven DSS include data and parameters provided by decision makers in order to help decision makers in analyzing situations, but usually they are not data intensive, i.e. very large data bases are usually not needed for Model-Driven DSS. Model-Driven DSS need to be distributed more widely in organizations and they can be used by managers and staff for planning and analysis. Model-driven DSS developers have much more to learn about the management of models and there is a need for new development environments to advance the state of the art in building visual interactive DSS. Estonia became a member of the European Union in 2004. The EU enlargement implicates for East European countries a lot of changes in their agriculture. Changes take place at many 67
Transcript of A Macroeconomic (Simultaneous Equation) Model Of The Estonian Dairy Sector
IAALD AFITA WCCA2008 WORLD CONFERENCE ON AGRICULTURAL INFORMATION AND IT
A macroeconomic (simultaneous equation) model of the Estonian livestock sector Reet Põldaru1, Jüri Roots1, Ants-Hannes Viira1, and Rando Värnik1 1 Estonian University of Life Sciences, Estonia, [email protected] Abstract The primary objective of the present study was creation of a macroeconomic (simultaneous equation) model of Estonian livestock sector. Simultaneous equation modeling provides a new approach to the economic analysis. A macroeconomic model of Estonian livestock sector was created using the approach pioneered by FAPRI. The FAPRI GOLD is a dynamic, partial equilibrium, multi-commodity, global econometric model. This paper outlines the linkage between the livestock sector and input sectors. The stochastic equations are estimated by two stage least squares (2SLS) and three stage least squares (3SLS). The equations were estimated using data from 1992 to 2007 inclusive. Most of the parameters of all structural equations are significant and theoretically consistent. Projections for the main endogenous variables are made for a six-year period. The projections of beef and veal, pig meat and broiler production and domestic use are presented and analyzed. Perspective implementation of Estonian livestock sector model as a decision making instrument for projection and analysis purposes is considered. Keywords: Econometric modeling, Simultaneous equations, Partial equilibrium modeling, Estonian agriculture, Livestock sector Introduction Throughout last decades, the use of economic models in relation to agricultural policy issues has increased substantially and a huge amount of literature exists on these issues. A number of different modeling approaches have been applied (Binfield, et al., 2000, Donnelan, et al., 2002; Leeuwen, et al., 2005, Balkhausen, et al., 2008). The models are also an essential component of decision support systems (DSS), especially Model-Driven DSS (Power and Sharda, 2007). Models in agriculture have been used for many different purposes of decision making, related to e.g. projections of the agricultural production, discussions of trade negotiations, effects of the EU CAP reforms etc.
Model-Driven DSS include data and parameters provided by decision makers in order to help decision makers in analyzing situations, but usually they are not data intensive, i.e. very large data bases are usually not needed for Model-Driven DSS. Model-Driven DSS need to be distributed more widely in organizations and they can be used by managers and staff for planning and analysis. Model-driven DSS developers have much more to learn about the management of models and there is a need for new development environments to advance the state of the art in building visual interactive DSS.
Estonia became a member of the European Union in 2004. The EU enlargement implicates for East European countries a lot of changes in their agriculture. Changes take place at many
67
IAALD AFITA WCCA2008 WORLD CONFERENCE ON AGRICULTURAL INFORMATION AND IT
levels, e.g. political, economical and technical level etc. Therefore the information systems on agriculture (databases, models etc) have to move along with and support these changes. Consequently, economic models in Estonia have either to be created, developed or renewed, and must be harmonized with the European modeling traditions.
The guiding principle in constructing national level commodity models is that models are first and foremost economic models, and as such economic theory is our first guide in specifying the models. The economic relationships in the national commodity models are based, in so far as is practicable, on time series econometric estimates of these relationships. Theory and expert judgement is also used in the verification and, if necessary, adjustment of econometrically estimated equations, particularly when used to generate projections.
Improving the competitiveness of Estonian agriculture is the priority objective of the Estonian agricultural policy. The outcome and impacts of respective policy measures will strongly depend on developments of agricultural world markets. Livestock sector is one of the most fundamental sectors of Estonian agriculture. Consequently, the need to make Estonian livestock sector more competitive is obvious.
The modeling methodology employed in this paper follows closely that which has been used by FAPRI for many years with great success (Hanrahan, 2001). The specification of the model is also inspired by the structure in FAPRI Ireland Livestock Model (Binfield, at al., 1999, Hanrahan, 2001) and AG-MEMOD model (Leeuwen, et al., 2005). This also facilitates the use of the world and the EU projections in the Estonian model.
At the Estonian University of Life Sciences we have some experience in implementing FAPRI approach in macroeconomic modeling in agriculture (Põldaru and Roots, 2003, Põldaru, et al., 2006, Põldaru, et al., 2007).
The FAPRI system is a dynamic, partial equilibrium, multi-commodity, global model (Hanrahan, 2001). As a partial equilibrium model, macroeconomic factors such as population, real GDP per capita, GDP deflator, GDP growth, and growth rates for the general economy, and various producer price indices are exogenous to the system. The objective of this study is creation of the macroeconomic (simultaneous equations) livestock sector model for Estonian agriculture at the national aggregate level, estimation of the model parameters and analysis of results. Model description and results Next a brief description of the national level macroeconomic model of Estonian livestock sector is presented.
The Estonian livestock model consists of 43 equations – 26 stochastic equations and 17 identities. Stochastic equations are estimated from the historical data. Identities are equations that hold by definition; they are always true. The total number of estimated coefficients is 145.
There are 43 endogenous variables, 53 exogenous variables, many lagged endogenous and lagged exogenous variables. The stochastic equations are estimated by two stage least squares (2SLS) and three stage least squares (3SLS).
There are four livestock sub-models in Estonian model. The cattle and beef, pig and pig meat, and sheep meat models share a similar structure. The poultry model is considerably less complicated than the other livestock models. Except in the poultry models, the key supply-side variables in each of the livestock models is the stock of female breeding animals (cows, sows, and ewes). This stock determines the number of young animals available for fattening and/or slaughter, which in turn determine meat production. The various livestock models are linked primarily through their demand side specifications. The demand side specifications are simple
68

IAALD AFITA WCCA2008 WORLD CONFERENCE ON AGRICULTURAL INFORMATION AND IT
ad hoc specifications of per capita demand. Meat demand per capita is modelled as a function of real prices of the meat in question and of other meats, all of which are assumed to be gross and net substitutes in consumption. The beef production model is linked with the dairy models via slaughter and the calf production from the dairy herd. The grain and oilseed models are linked to the livestock models by means of livestock production cost indices that are functions of the prices of the model’s grains and oilseed meals. Total domestic supply is equal to domestic production plus beginning stocks and imports.
The stochastic equations are estimated by two stage least squares (2SLS). The equations were estimated using data from 1992 to 2007 inclusive, using the Fair-Parke program (Fair, 2003).
Summary statistics of key structural equations are reported in Table 1. Because of the small number of observations, there is a limit on the number of variables that can be included in the equations. Systems estimators are used where economic theory suggests they are necessary or advantageous.
Table 1 shows that despite of relatively short time series the values of standard index used to indicate goodness of fit – the coefficients of determination – are very high because lagged variables were used in structural equations. The Durbin-Watson statistic values are also acceptable. Consequently, the livestock sector model may be used for projection and analysis purposes.
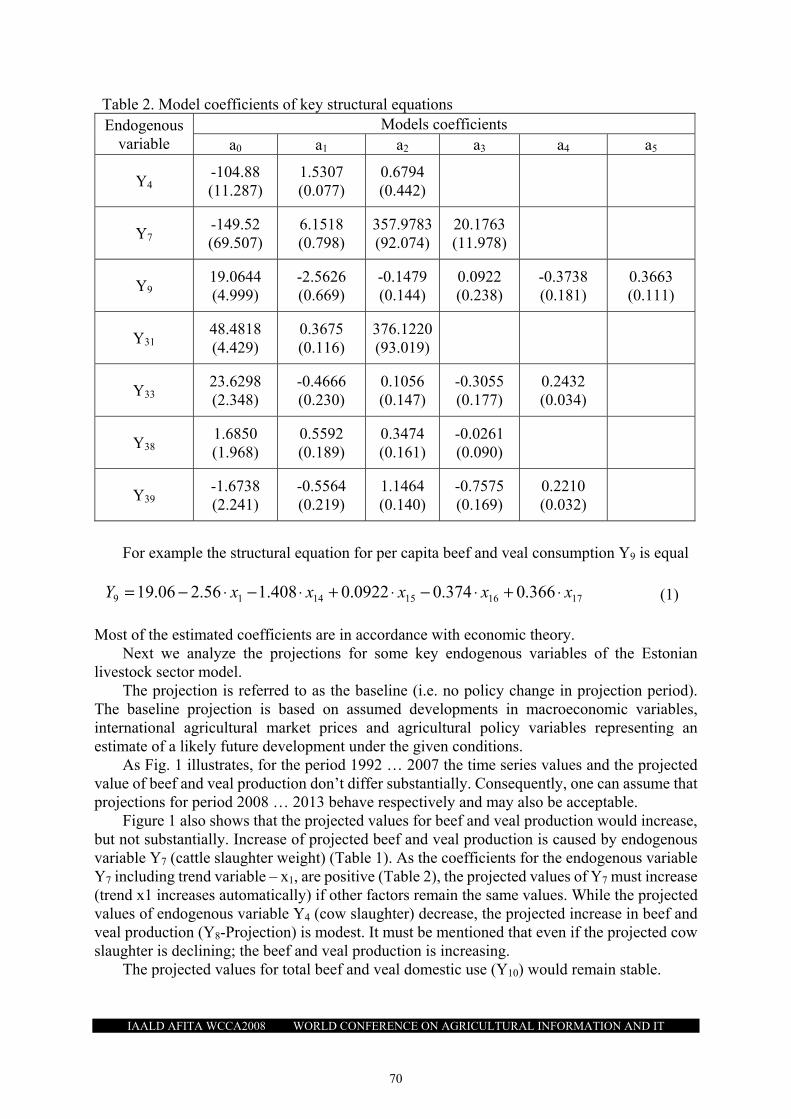
The model coefficients of key structural equations are reported in Table 2. Standard errors of model coefficients are presented in parentheses. The definitions of coefficients are presented in Table 1.
Table 1. Summary characteristics and statistics of key equations Endo- genous variab-le
Definitions of endogenous variables
Explanatory variables *
Coef. of determi-nation R2
DW
Y4 Cow slaughter x6, x7 0.970 1.30 Y7 Cattle slaughter weight x1, x12, x13 0.812 2.67 Y8 Beef and veal production Identity Y8=Y4*Y7 0.990 2.42 Y9 Per capita beef and veal consumption x1, x14, x15, x16, x17 0.949 2.06 Y10 Total beef and veal domestic use Identity Y10=Y9*x35 0.962 2.06 Y31 Pig slaughter weight x24, x28 0.627 1.06 Y32 Pig meat production Identity Y32=Y31*x29 0.912 1.44 Y33 Per capita consumption of pig meat x14, x15, x16, x17 0.841 2.62 Y34 Total domestic pig meat use Identity Y34=Y33*x35 0.773 2.67 Y38 Broiler production Y38(-1), x1, x34 0.794 1.98 Y39 Per capita consumption of broiler meat x14, x15, x16, x17 0.913 1.57 Y40 Total domestic broiler meat use Identity Y40=Y39*x35 0.905 1.65 *) x1 – trend, x6 – Beginning of dairy cows - beef cows, x7 – Ending cows - beginning cows, x12 – Cow slaughter/total bovine animal slaughtered, x13 – Cattle price index, x14 – Real cattle reference price, x15 – Real pig meat reference price, x16 –Real chicken price, x17 – Real per capita GDP, x24 – Pig meat price/pig input cost index, x28 – Sow slaughter/total, x29 – Sow slaughter plus other pig slaughter, x34 – Chicken price/poultry input cost, x35 – Total population.
69
IAALD AFITA WCCA2008 WORLD CONFERENCE ON AGRICULTURAL INFORMATION AND IT
For example the structural equation for per capita beef and veal consumption Y9 is equal
1716151419 366.0374.00922.0408.156.206.19 xxxxxY ⋅+⋅−⋅+⋅−⋅−= (1) Most of the estimated coefficients are in accordance with economic theory.
Next we analyze the projections for some key endogenous variables of the Estonian livestock sector model.
The projection is referred to as the baseline (i.e. no policy change in projection period). The baseline projection is based on assumed developments in macroeconomic variables, international agricultural market prices and agricultural policy variables representing an estimate of a likely future development under the given conditions.
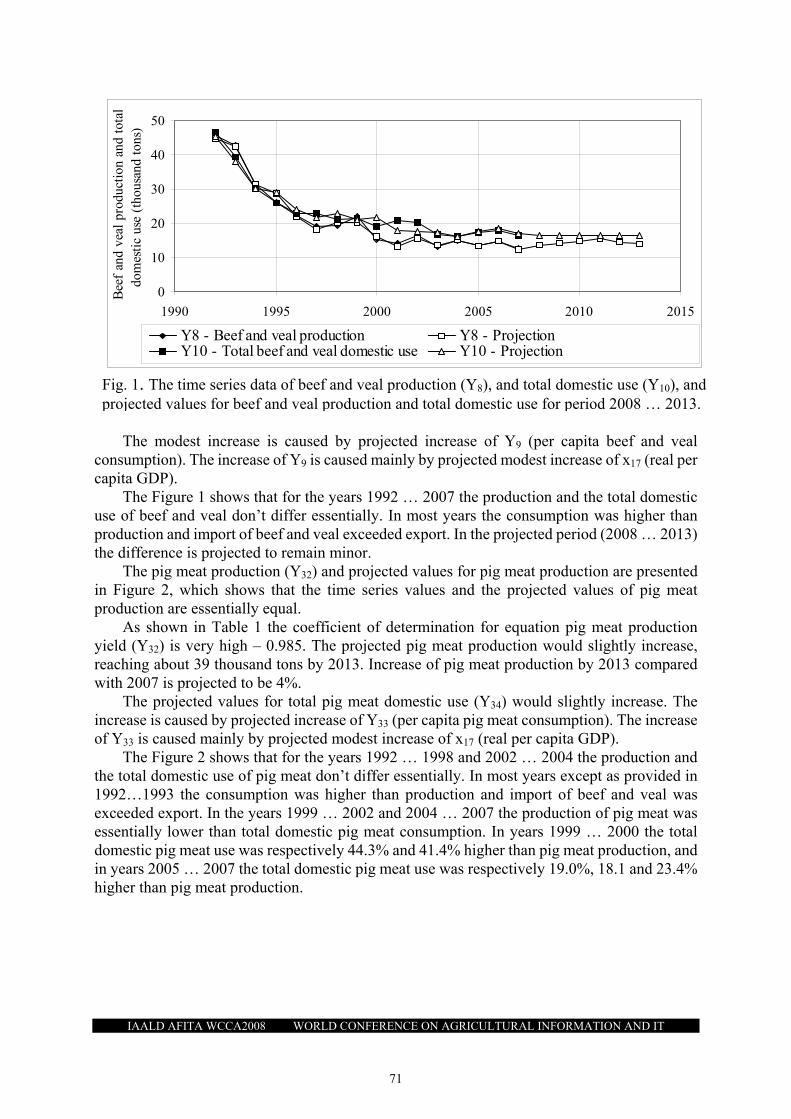
As Fig. 1 illustrates, for the period 1992 … 2007 the time series values and the projected value of beef and veal production don’t differ substantially. Consequently, one can assume that projections for period 2008 … 2013 behave respectively and may also be acceptable.
Figure 1 also shows that the projected values for beef and veal production would increase, but not substantially. Increase of projected beef and veal production is caused by endogenous variable Y7 (cattle slaughter weight) (Table 1). As the coefficients for the endogenous variable Y7 including trend variable – x1, are positive (Table 2), the projected values of Y7 must increase (trend x1 increases automatically) if other factors remain the same values. While the projected values of endogenous variable Y4 (cow slaughter) decrease, the projected increase in beef and veal production (Y8-Projection) is modest. It must be mentioned that even if the projected cow slaughter is declining; the beef and veal production is increasing.
The projected values for total beef and veal domestic use (Y10) would remain stable.
Table 2. Model coefficients of key structural equations Endogenous
variable Models coefficients
a0 a1 a2 a3 a4 a5
Y4 -104.88 (11.287)
1.5307 (0.077)
0.6794 (0.442)
Y7 -149.52 (69.507)
6.1518 (0.798)
357.9783(92.074)
20.1763 (11.978)
Y9 19.0644 (4.999)
-2.5626 (0.669)
-0.1479 (0.144)
0.0922 (0.238)
-0.3738 (0.181)
0.3663 (0.111)
Y31 48.4818 (4.429)
0.3675 (0.116)
376.1220(93.019)
Y33 23.6298 (2.348)
-0.4666 (0.230)
0.1056 (0.147)
-0.3055 (0.177)
0.2432 (0.034)
Y38 1.6850 (1.968)
0.5592 (0.189)
0.3474 (0.161)
-0.0261 (0.090)
Y39 -1.6738 (2.241)
-0.5564 (0.219)
1.1464 (0.140)
-0.7575 (0.169)
0.2210 (0.032)
70
IAALD AFITA WCCA2008 WORLD CONFERENCE ON AGRICULTURAL INFORMATION AND IT
The modest increase is caused by projected increase of Y9 (per capita beef and veal consumption). The increase of Y9 is caused mainly by projected modest increase of x17 (real per capita GDP).
The Figure 1 shows that for the years 1992 … 2007 the production and the total domestic use of beef and veal don’t differ essentially. In most years the consumption was higher than production and import of beef and veal exceeded export. In the projected period (2008 … 2013) the difference is projected to remain minor.
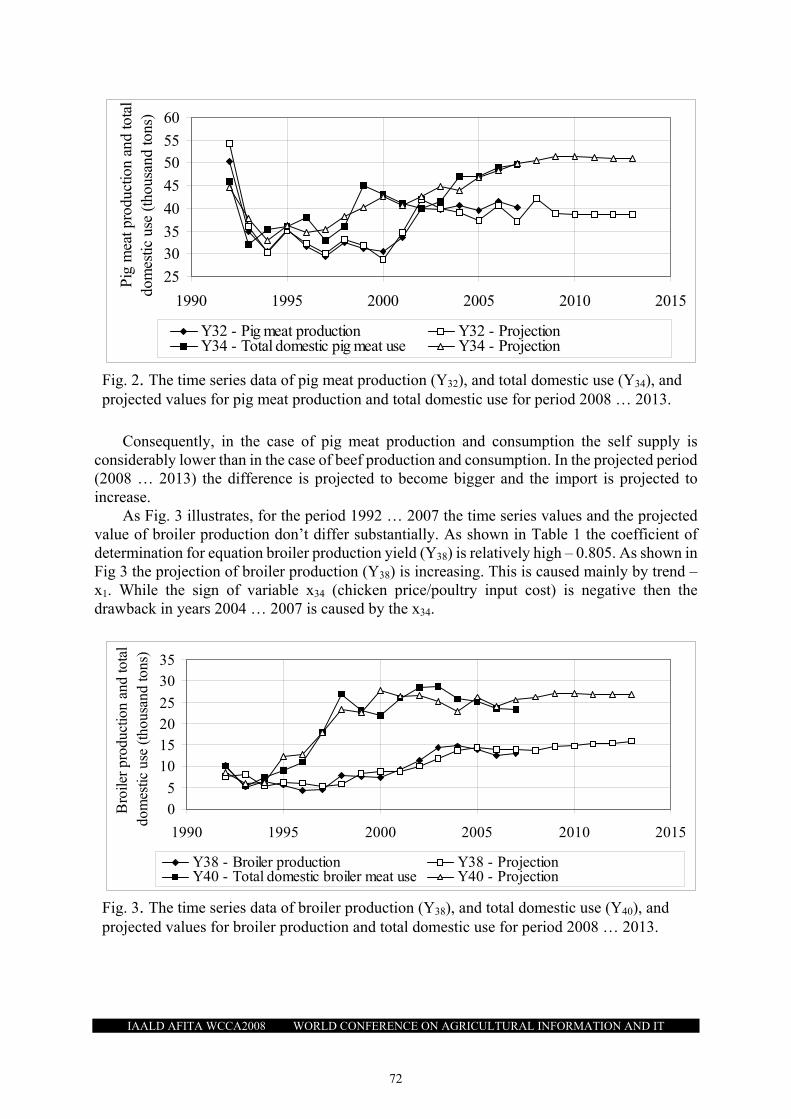
The pig meat production (Y32) and projected values for pig meat production are presented in Figure 2, which shows that the time series values and the projected values of pig meat production are essentially equal.
As shown in Table 1 the coefficient of determination for equation pig meat production yield (Y32) is very high – 0.985. The projected pig meat production would slightly increase, reaching about 39 thousand tons by 2013. Increase of pig meat production by 2013 compared with 2007 is projected to be 4%.
The projected values for total pig meat domestic use (Y34) would slightly increase. The increase is caused by projected increase of Y33 (per capita pig meat consumption). The increase of Y33 is caused mainly by projected modest increase of x17 (real per capita GDP).
The Figure 2 shows that for the years 1992 … 1998 and 2002 … 2004 the production and the total domestic use of pig meat don’t differ essentially. In most years except as provided in 1992…1993 the consumption was higher than production and import of beef and veal was exceeded export. In the years 1999 … 2002 and 2004 … 2007 the production of pig meat was essentially lower than total domestic pig meat consumption. In years 1999 … 2000 the total domestic pig meat use was respectively 44.3% and 41.4% higher than pig meat production, and in years 2005 … 2007 the total domestic pig meat use was respectively 19.0%, 18.1 and 23.4% higher than pig meat production.
0
10
20
30
40
50
1990 1995 2000 2005 2010 2015
Bee
f an
d ve
al p
rodu
ctio
n an
d to
tal
dom
esti
c us
e (t
hous
and
tons
)
Y8 - Beef and veal production Y8 - ProjectionY10 - Total beef and veal domestic use Y10 - Projection
Fig. 1. The time series data of beef and veal production (Y8), and total domestic use (Y10), and projected values for beef and veal production and total domestic use for period 2008 … 2013.
71
IAALD AFITA WCCA2008 WORLD CONFERENCE ON AGRICULTURAL INFORMATION AND IT
Consequently, in the case of pig meat production and consumption the self supply is considerably lower than in the case of beef production and consumption. In the projected period (2008 … 2013) the difference is projected to become bigger and the import is projected to increase.
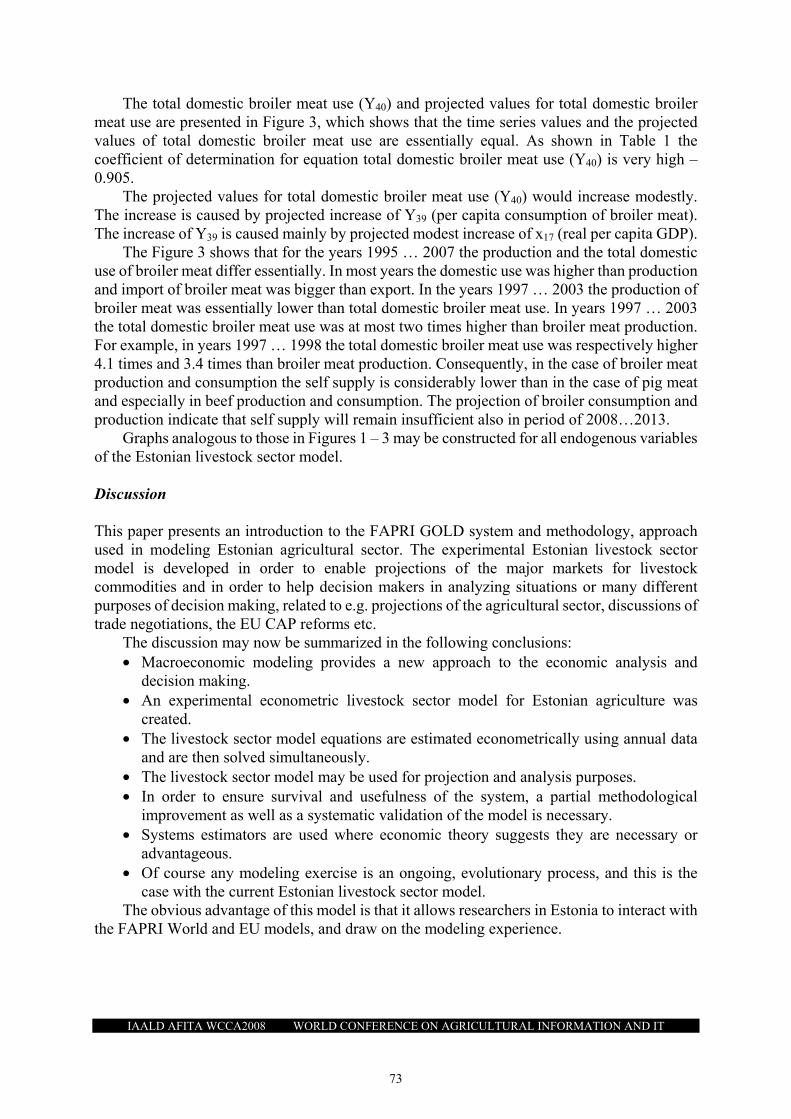
As Fig. 3 illustrates, for the period 1992 … 2007 the time series values and the projected value of broiler production don’t differ substantially. As shown in Table 1 the coefficient of determination for equation broiler production yield (Y38) is relatively high – 0.805. As shown in Fig 3 the projection of broiler production (Y38) is increasing. This is caused mainly by trend – x1. While the sign of variable x34 (chicken price/poultry input cost) is negative then the drawback in years 2004 … 2007 is caused by the x34.
05
10152025
3035
1990 1995 2000 2005 2010 2015
Bro
iler
prod
uctio
n an
d to
tal
dom
estic
use
(th
ousa
nd to
ns)
Y38 - Broiler production Y38 - ProjectionY40 - Total domestic broiler meat use Y40 - Projection
Fig. 3. The time series data of broiler production (Y38), and total domestic use (Y40), and projected values for broiler production and total domestic use for period 2008 … 2013.
25
3035
40
45
5055
60
1990 1995 2000 2005 2010 2015
Pig
mea
t pro
duct
ion
and
tota
l do
mes
tic u
se (
thou
sand
tons
)
Y32 - Pig meat production Y32 - ProjectionY34 - Total domestic pig meat use Y34 - Projection
Fig. 2. The time series data of pig meat production (Y32), and total domestic use (Y34), and projected values for pig meat production and total domestic use for period 2008 … 2013.
72
IAALD AFITA WCCA2008 WORLD CONFERENCE ON AGRICULTURAL INFORMATION AND IT
The total domestic broiler meat use (Y40) and projected values for total domestic broiler meat use are presented in Figure 3, which shows that the time series values and the projected values of total domestic broiler meat use are essentially equal. As shown in Table 1 the coefficient of determination for equation total domestic broiler meat use (Y40) is very high – 0.905.
The projected values for total domestic broiler meat use (Y40) would increase modestly. The increase is caused by projected increase of Y39 (per capita consumption of broiler meat). The increase of Y39 is caused mainly by projected modest increase of x17 (real per capita GDP).
The Figure 3 shows that for the years 1995 … 2007 the production and the total domestic use of broiler meat differ essentially. In most years the domestic use was higher than production and import of broiler meat was bigger than export. In the years 1997 … 2003 the production of broiler meat was essentially lower than total domestic broiler meat use. In years 1997 … 2003 the total domestic broiler meat use was at most two times higher than broiler meat production. For example, in years 1997 … 1998 the total domestic broiler meat use was respectively higher 4.1 times and 3.4 times than broiler meat production. Consequently, in the case of broiler meat production and consumption the self supply is considerably lower than in the case of pig meat and especially in beef production and consumption. The projection of broiler consumption and production indicate that self supply will remain insufficient also in period of 2008…2013.
Graphs analogous to those in Figures 1 – 3 may be constructed for all endogenous variables of the Estonian livestock sector model. Discussion This paper presents an introduction to the FAPRI GOLD system and methodology, approach used in modeling Estonian agricultural sector. The experimental Estonian livestock sector model is developed in order to enable projections of the major markets for livestock commodities and in order to help decision makers in analyzing situations or many different purposes of decision making, related to e.g. projections of the agricultural sector, discussions of trade negotiations, the EU CAP reforms etc.
The discussion may now be summarized in the following conclusions: • Macroeconomic modeling provides a new approach to the economic analysis and
decision making. • An experimental econometric livestock sector model for Estonian agriculture was
created. • The livestock sector model equations are estimated econometrically using annual data
and are then solved simultaneously. • The livestock sector model may be used for projection and analysis purposes. • In order to ensure survival and usefulness of the system, a partial methodological
improvement as well as a systematic validation of the model is necessary. • Systems estimators are used where economic theory suggests they are necessary or
advantageous. • Of course any modeling exercise is an ongoing, evolutionary process, and this is the
case with the current Estonian livestock sector model. The obvious advantage of this model is that it allows researchers in Estonia to interact with
the FAPRI World and EU models, and draw on the modeling experience.
73

IAALD AFITA WCCA2008 WORLD CONFERENCE ON AGRICULTURAL INFORMATION AND IT
References Balkhausen, O., M. Banse, and H. Grethe (2008). Modelling CAP Decoupling in the EU: A
Comparison of Selected Simulation Models and Results. Journal of Agricultural Economics 59:57-71.
Binfield, J., T. Donnellan, and K. McQuinn (1999a). Modelling Agriculture in the Republic of Ireland: Agenda 2000 Impacts. Paper presented at the Agricultural Economics Society 1999. Belfast, Northern Ireland. March 26 - 29.
Binfield, J., T. Donnellan and K. McQuinn (1999b). Towards an Econometric Model of Irish Agriculture. Paper presented at the Irish Economics Association. Westport, Ireland. April 23 - 25.
Binfield, J., T. Donnellan and K. McQuinn(2002a) The Econometric Modelling of Agricultural Policy: An Irish Example (2000). Paper presented at the 65th EAAE Seminar, Bonn, Germany.
Binfield, J., T. Donnellan and K. McQuinn (2000b). The Econometric Modelling of Irish Agriculture. Paper presented at the AES Annual Conference, University of Manchester, UK.
Binfield, J., T. Donnellan, K. Hanrahan, T. Hennessy, K. McQuinn, and P. Westhoff (2002). The Baseline outlook for the agricultural sector in the EU and Ireland., Paper in Outlook 2002: Medium Term Analysis for the Agri-Food Sector. April 2002. Teagasc, Dublin.
Donnellan, T., K. Hanrahan, K. McQuinn, and B. Riordan (2002). Analysis with the AG-MEMOD Model: Dealing with diversity in the EU Agri-Food Sector, EAAE Congress Zaragosa, Spain, August 28th-31st, 2002, RERC, Teagasc, Dublin.
Fair, R.C., and W.R. Parke (2003). The Fair-Parke Program for the Estimation and Analysis of Nonlinear Econometric Models. User’s Guide [Online]. Available at http://fairmodel.econ.yale.edu/fp/fp.htm (verified May 20, 2005).
Hanrahan, Kevin F. (2001). The EU GOLD MODEL 2.1. An introductory manual [Online]. Available at http://www.tnet.teagasc.ie/agmemod/downloads/goldmanualdft.pdf (verified January 23, 2002). Rural Economy Research Centre, Teagasc.
Leeuwen, M. van and A. Tabeau, (2005), Dutch AG-MEMOD model; A tool to analyze the agri-food sector, The Hague, Agricultural Economics Research Institute (LEI), 2005 Report 8.05.03. 128p.
Power, D. J., and R. Sharda (2007). Model-driven decision support systems: Concepts and research directions. Decision Support Systems, 43:1044-1061.
Põldaru, R., and J. Roots (2003). An Econometric Model of the Estonian Dairy Sector. Proceedings of the International Conference: Economic Science for Rural Development.. Jelgava, Latvia:110-115.
Põldaru, R., J. Roots, A-H. Viira, and R. Värnik (2006). A Macroeconomic (Simultaneous Equation) Model Of The Estonian Dairy Sector. In: Zazueta, F., Xin, J., Ninomiya, S., Schiefer, G. (Eds.), Proceedings of the 4th World Congress on Computers in Agriculture and Natural Resources, July 24-26, 2006, Orlando, Florida USA:775-780.
Põldaru, R., J. Roots, A-H. Viira, and R. Värnik (2007). A Macroeconomic (Simultaneous Equation) Model Of The Estonian Grain Sector. In: Parker, C., Skerratt, S., Park, C., J. Shields, J. (Eds.), Proceedings of the 6th Biennial Conference of the European Federation of IT in Agriculture: EFITA/ WCCA 2007 "Environmental and Rural Sustainability through ICT", July 2-5, 2007, Glasgow Caledonian University, Glasgow GB.
74