
A human vision based computational model for chromatic texture segregation
13
428 IEEE TRANSACTIONS ON SYSTEMS, MAN, AND CYBERNETICS—PART B: CYBERNETICS, VOL. 27, NO. 3, JUNE 1997 A Human Vision Based Computational Model for Chromatic Texture Segregation Thomas V. Papathomas, Member, IEEE, Ramanujan S. Kashi, and Andrei Gorea Abstract—We have developed a computational model for tex- ture perception which has physiological relevance and correlates well with human performance. The model attempts to simulate the visual processing characteristics by incorporating mecha- nisms tuned to detect luminance-polarity, orientation, spatial frequency and color, which are characteristic features of any textural image. We obtained a very good correlation between the model’s simulation results and data from psychophysical experiments with a systematically selected set of visual stimuli with texture patterns defined by spatial variations in color, luminance, and orientation. In addition, the model predicts cor- rectly texture segregation performance with key benchmarks and natural textures. This represents a first effort to incorporate chromatic signals in texture segregation models of psychophysical relevance, most of which have treated grey-level images so far. Another novel feature of the model is the extension of the concept of spatial double opponency to domains beyond color, such as orientation and spatial frequency. The model has potential applications in the areas of image processing, machine vision and pattern recognition, and scientific visualization. I. BACKGROUND AND SIGNIFICANCE T EXTURE perception is a very important task for early visual information processing and it has been receiving increasing attention in recent years. In psychophysics, sys- tematic work on texture began rather late [3], [32], [33], as compared to work on other low-level visual processes, such as color, motion, and stereo. Computational modeling efforts in texture also lagged behind those in motion or in stereopsis (for a critical survey see Bergen [6]). Julesz [32] pioneered a quantitative approach, based on the statistical properties of the texture images. His conjecture that textures with identical first- and second-order correlation functions do not segregate [35] was eventually disproved [36]; nevertheless, it motivated further quantitative work and pointed to the importance of local differences. Beck’s conceptual model [4], [5] relied on feature detectors and “similarity grouping,” but lacked a computational implementation. Quantitative attempts at modeling began with textures formed by sums of sinusoidal gratings [29], [47], in an effort to relate texture discrimination Manuscript received March 18, 1995; revised March 19, 1996. This work was supported by the National Science Foundation under Grant BNS-9109384 and the Theodore N. Garbis Research Fund of the Fight for Sight Research Division of Prevent Blindness America. T. V. Papathomas is with the Laboratory of Vision Research and Department of Biomedical Engineering, Rutgers University, Piscataway, NJ 08854 USA (e-mail: [email protected]). R. S. Kashi is with Bell Laboratories, Murray Hill, NJ 07974 USA. A. Gorea is with the Laboratoire de Psychologie Exp´ erimentale, Universit´ e Ren´ e Descartes and Centre National de la Recerche Scientifique, 75006 Paris, France. Publisher Item Identifier S 1083-4419(97)02920-8. to differences in activity of channels that possess only spatial frequency selectivity. With respect to relevance with biological vision, auto- mated texture segregation efforts have resulted in two broad categories: human-vision-related and “pure” machine vision texture segregation models. In the first belong models that are designed to produce results that correlate well with human performance, when tested with the same classes of stimuli. Typically, the structure, signal pathways, and processing stages of models in this category are based on neurophysiological correspondences (see Bergen [6]). The algorithms and models in the second category perform texture segregation on in- put images without necessarily employing neurophysiological principles. More often than not, such models do not attempt to duplicate human performance because there are no apparent advantages for such correlation. Caelli [14]–[15] provides a comprehensive review for this class of models. The model presented in this paper belongs to the first category. Accord- ingly, in the rest of the paper the problems are discussed mainly from the human vision point of view. Nevertheless, by extending the concept of double opponency, the model introduces a new research direction in both categories, machine and human visual texture modeling. In what follows, we give a brief but comprehensive survey of earlier models. Since the only major extension of our model is to process the chromatic signal, in addition to the luminance signal that most early models deal with, we do not attempt a critical analysis of existing models. Caelli [12] developed filters that were tuned to orientation and to spatial frequencies, and used them to predict texture discrimination performances. Caelli’s [13] model set the trend for a wide class of later models and uses three stages. i) Convolution by oriented filters, which essentially model the response properties of cells in mammalian striate cortex; this is followed by one or more nonlinear operations. ii) “Impletion,” to spread of activity of similar proximal filters (the term “spatial pooling” is currently used in the literature). iii) Grouping, to locate texture boundaries, by attempting to maximize the correlation between activity levels within regions and minimize it between regions. Zucker [62] studied the interactions of the outputs of simple-cell-like filters in spatially varying oriented textures and applied a minimization scheme to obtain segmentation. A neural network approach was developed by Grossberg and Mingolla [28]. In the line of Caelli’s approach, Turner [56] uses a bank of Gabor filters to a variety of pre-attentively discriminable textures and shows that the differently textured regions are distinguished by first-order differences in the values measured by the filters. 1083–4419/97$10.00 1997 IEEE
-
Upload
independent -
Category
Documents
-
view
0 -
download
0
Transcript of A human vision based computational model for chromatic texture segregation

428 IEEE TRANSACTIONS ON SYSTEMS, MAN, AND CYBERNETICS—PART B: CYBERNETICS, VOL. 27, NO. 3, JUNE 1997
A Human Vision Based ComputationalModel for Chromatic Texture Segregation
Thomas V. Papathomas,Member, IEEE, Ramanujan S. Kashi, and Andrei Gorea
Abstract—We have developed a computational model for tex-ture perception which has physiological relevance and correlateswell with human performance. The model attempts to simulatethe visual processing characteristics by incorporating mecha-nisms tuned to detect luminance-polarity, orientation, spatialfrequency and color, which are characteristic features of anytextural image. We obtained a very good correlation betweenthe model’s simulation results and data from psychophysicalexperiments with a systematically selected set of visual stimuliwith texture patterns defined by spatial variations in color,luminance, and orientation. In addition, the model predicts cor-rectly texture segregation performance with key benchmarks andnatural textures. This represents a first effort to incorporatechromatic signals in texture segregation models of psychophysicalrelevance, most of which have treated grey-level images so far.Another novel feature of the model is the extension of the conceptof spatial double opponency to domains beyond color, suchas orientation and spatial frequency. The model has potentialapplications in the areas of image processing, machine vision andpattern recognition, and scientific visualization.
I. BACKGROUND AND SIGNIFICANCE
T EXTURE perception is a very important task for earlyvisual information processing and it has been receiving
increasing attention in recent years. In psychophysics, sys-tematic work on texture began rather late [3], [32], [33],as compared to work on other low-level visual processes,such as color, motion, and stereo. Computational modelingefforts in texture also lagged behind those in motion or instereopsis (for a critical survey see Bergen [6]). Julesz [32]pioneered a quantitative approach, based on the statisticalproperties of the texture images. His conjecture that textureswith identical first- and second-order correlation functions donot segregate [35] was eventually disproved [36]; nevertheless,it motivated further quantitative work and pointed to theimportance of local differences. Beck’s conceptual model [4],[5] relied on feature detectors and “similarity grouping,” butlacked a computational implementation. Quantitative attemptsat modeling began with textures formed by sums of sinusoidalgratings [29], [47], in an effort to relate texture discrimination
Manuscript received March 18, 1995; revised March 19, 1996. This workwas supported by the National Science Foundation under Grant BNS-9109384and the Theodore N. Garbis Research Fund of the Fight for Sight ResearchDivision of Prevent Blindness America.
T. V. Papathomas is with the Laboratory of Vision Research and Departmentof Biomedical Engineering, Rutgers University, Piscataway, NJ 08854 USA(e-mail: [email protected]).
R. S. Kashi is with Bell Laboratories, Murray Hill, NJ 07974 USA.A. Gorea is with the Laboratoire de Psychologie Experimentale, Universite
Rene Descartes and Centre National de la Recerche Scientifique, 75006 Paris,France.
Publisher Item Identifier S 1083-4419(97)02920-8.
to differences in activity of channels that possess only spatialfrequency selectivity.
With respect to relevance with biological vision, auto-mated texture segregation efforts have resulted in two broadcategories: human-vision-related and “pure” machine visiontexture segregation models. In the first belong models that aredesigned to produce results that correlate well with humanperformance, when tested with the same classes of stimuli.Typically, the structure, signal pathways, and processing stagesof models in this category are based on neurophysiologicalcorrespondences (see Bergen [6]). The algorithms and modelsin the second category perform texture segregation on in-put images without necessarily employing neurophysiologicalprinciples. More often than not, such models do not attemptto duplicate human performance because there are no apparentadvantages for such correlation. Caelli [14]–[15] provides acomprehensive review for this class of models. The modelpresented in this paper belongs to the first category. Accord-ingly, in the rest of the paper the problems are discussedmainly from the human vision point of view. Nevertheless,by extending the concept of double opponency, the modelintroduces a new research direction in both categories, machineand human visual texture modeling.
In what follows, we give a brief but comprehensive surveyof earlier models. Since the only major extension of our modelis to process the chromatic signal, in addition to the luminancesignal that most early models deal with, we do not attempta critical analysis of existing models. Caelli [12] developedfilters that were tuned to orientation and to spatial frequencies,and used them to predict texture discrimination performances.Caelli’s [13] model set the trend for a wide class of latermodels and uses three stages. i) Convolution by orientedfilters, which essentially model the response properties ofcells in mammalian striate cortex; this is followed by oneor more nonlinear operations. ii) “Impletion,” to spread ofactivity of similar proximal filters (the term “spatial pooling”is currently used in the literature). iii) Grouping, to locatetexture boundaries, by attempting to maximize the correlationbetween activity levels within regions and minimize it betweenregions. Zucker [62] studied the interactions of the outputs ofsimple-cell-like filters in spatially varying oriented texturesand applied a minimization scheme to obtain segmentation.A neural network approach was developed by Grossberg andMingolla [28]. In the line of Caelli’s approach, Turner [56]uses a bank of Gabor filters to a variety of pre-attentivelydiscriminable textures and shows that the differently texturedregions are distinguished by first-order differences in thevalues measured by the filters.
1083–4419/97$10.00 1997 IEEE
PAPATHOMAS et al.: CHROMATIC TEXTURE SEGREGATION 429
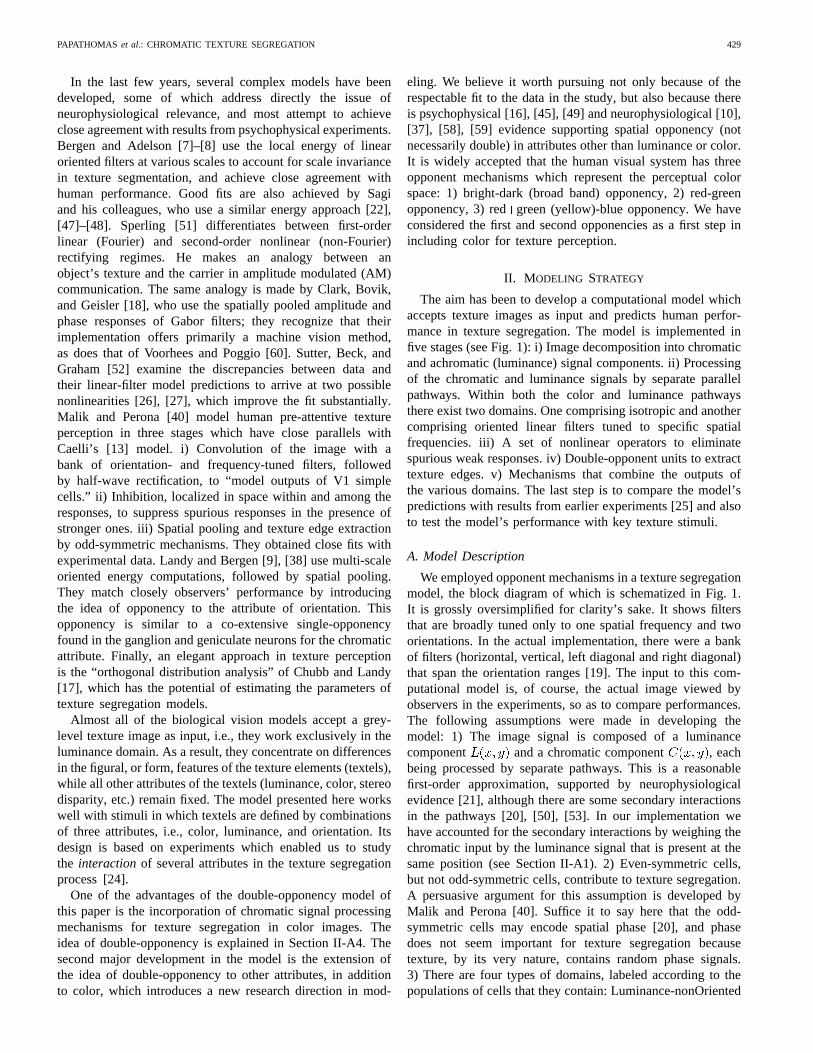
In the last few years, several complex models have beendeveloped, some of which address directly the issue ofneurophysiological relevance, and most attempt to achieveclose agreement with results from psychophysical experiments.Bergen and Adelson [7]–[8] use the local energy of linearoriented filters at various scales to account for scale invariancein texture segmentation, and achieve close agreement withhuman performance. Good fits are also achieved by Sagiand his colleagues, who use a similar energy approach [22],[47]–[48]. Sperling [51] differentiates between first-orderlinear (Fourier) and second-order nonlinear (non-Fourier)rectifying regimes. He makes an analogy between anobject’s texture and the carrier in amplitude modulated (AM)communication. The same analogy is made by Clark, Bovik,and Geisler [18], who use the spatially pooled amplitude andphase responses of Gabor filters; they recognize that theirimplementation offers primarily a machine vision method,as does that of Voorhees and Poggio [60]. Sutter, Beck, andGraham [52] examine the discrepancies between data andtheir linear-filter model predictions to arrive at two possiblenonlinearities [26], [27], which improve the fit substantially.Malik and Perona [40] model human pre-attentive textureperception in three stages which have close parallels withCaelli’s [13] model. i) Convolution of the image with abank of orientation- and frequency-tuned filters, followedby half-wave rectification, to “model outputs of V1 simplecells.” ii) Inhibition, localized in space within and among theresponses, to suppress spurious responses in the presence ofstronger ones. iii) Spatial pooling and texture edge extractionby odd-symmetric mechanisms. They obtained close fits withexperimental data. Landy and Bergen [9], [38] use multi-scaleoriented energy computations, followed by spatial pooling.They match closely observers’ performance by introducingthe idea of opponency to the attribute of orientation. Thisopponency is similar to a co-extensive single-opponencyfound in the ganglion and geniculate neurons for the chromaticattribute. Finally, an elegant approach in texture perceptionis the “orthogonal distribution analysis” of Chubb and Landy[17], which has the potential of estimating the parameters oftexture segregation models.
Almost all of the biological vision models accept a grey-level texture image as input, i.e., they work exclusively in theluminance domain. As a result, they concentrate on differencesin the figural, or form, features of the texture elements (textels),while all other attributes of the textels (luminance, color, stereodisparity, etc.) remain fixed. The model presented here workswell with stimuli in which textels are defined by combinationsof three attributes, i.e., color, luminance, and orientation. Itsdesign is based on experiments which enabled us to studythe interaction of several attributes in the texture segregationprocess [24].
One of the advantages of the double-opponency model ofthis paper is the incorporation of chromatic signal processingmechanisms for texture segregation in color images. Theidea of double-opponency is explained in Section II-A4. Thesecond major development in the model is the extension ofthe idea of double-opponency to other attributes, in additionto color, which introduces a new research direction in mod-
eling. We believe it worth pursuing not only because of therespectable fit to the data in the study, but also because thereis psychophysical [16], [45], [49] and neurophysiological [10],[37], [58], [59] evidence supporting spatial opponency (notnecessarily double) in attributes other than luminance or color.It is widely accepted that the human visual system has threeopponent mechanisms which represent the perceptual colorspace: 1) bright-dark (broad band) opponency, 2) red-greenopponency, 3) redgreen (yellow)-blue opponency. We haveconsidered the first and second opponencies as a first step inincluding color for texture perception.
II. M ODELING STRATEGY
The aim has been to develop a computational model whichaccepts texture images as input and predicts human perfor-mance in texture segregation. The model is implemented infive stages (see Fig. 1): i) Image decomposition into chromaticand achromatic (luminance) signal components. ii) Processingof the chromatic and luminance signals by separate parallelpathways. Within both the color and luminance pathwaysthere exist two domains. One comprising isotropic and anothercomprising oriented linear filters tuned to specific spatialfrequencies. iii) A set of nonlinear operators to eliminatespurious weak responses. iv) Double-opponent units to extracttexture edges. v) Mechanisms that combine the outputs ofthe various domains. The last step is to compare the model’spredictions with results from earlier experiments [25] and alsoto test the model’s performance with key texture stimuli.
A. Model Description
We employed opponent mechanisms in a texture segregationmodel, the block diagram of which is schematized in Fig. 1.It is grossly oversimplified for clarity’s sake. It shows filtersthat are broadly tuned only to one spatial frequency and twoorientations. In the actual implementation, there were a bankof filters (horizontal, vertical, left diagonal and right diagonal)that span the orientation ranges [19]. The input to this com-putational model is, of course, the actual image viewed byobservers in the experiments, so as to compare performances.The following assumptions were made in developing themodel: 1) The image signal is composed of a luminancecomponent and a chromatic component , eachbeing processed by separate pathways. This is a reasonablefirst-order approximation, supported by neurophysiologicalevidence [21], although there are some secondary interactionsin the pathways [20], [50], [53]. In our implementation wehave accounted for the secondary interactions by weighing thechromatic input by the luminance signal that is present at thesame position (see Section II-A1). 2) Even-symmetric cells,but not odd-symmetric cells, contribute to texture segregation.A persuasive argument for this assumption is developed byMalik and Perona [40]. Suffice it to say here that the odd-symmetric cells may encode spatial phase [20], and phasedoes not seem important for texture segregation becausetexture, by its very nature, contains random phase signals.3) There are four types of domains, labeled according to thepopulations of cells that they contain: Luminance-nonOriented

430 IEEE TRANSACTIONS ON SYSTEMS, MAN, AND CYBERNETICS—PART B: CYBERNETICS, VOL. 27, NO. 3, JUNE 1997
Fig. 1. Block diagram showing the five stages of the model for texture segregation. In the first stage, the input image is decomposed into chromatic,C(x; y)and luminance,L(x; y) components. The decomposed image is convolved in stage 2 with a set of oriented and non-oriented filters, and then, in stage 3,half-wave rectified and squared. The texture edges are computed across selected pairs of activity maps in stage 4, by convolving with double-opponentfiltercell responses. Finally, in stage 5, the texture edges across pairs are combined through probability summation to obtain the final texture gradient.
(LnO), Luminance-Oriented (LO), Color-nonOriented (CnO),and Color-Oriented (CO). The first two types of domains areessentially color-blind and operate entirely in the achromaticdomain. The last two types of domains are luminance-blindand care only about wavelengths, but are influenced to somedegree by the luminance mechanisms at the same location.The LnO domain contains luminance driven spatial frequency-tuned isotropic filters of the opponent center/surround type;the center lobe of their respective field is excitatory, andthe surrounding disk is inhibitory (center-ON) or vice versa(center-OFF). The LO domain comprises luminance-driven
filters that are simultaneously tuned to orientation and spatialfrequency. The CnO and CO domains contain similar oppo-nent center/surround and oriented filters, respectively, that arecolor-driven. The first three domains (LnO, LO, and CnO) arewell documented in the physiological literature [39], [54]; theevidence for color oriented cells is mostly psychophysical [11],[24], but there are similar findings in physiology as well [55].
The model has five major stages, and its architecture fol-lows the archetypal structure of Caelli [13], which has beenfollowed by most recent biological models. These stages arepresented below in reference to Fig. 1. Our rationale is given

PAPATHOMAS et al.: CHROMATIC TEXTURE SEGREGATION 431
for our approach, whenever possible, and alternatives areexamined.
1) Input Image Decomposition:Each input image was de-composed into two maps: The luminance and chromatic maps.Each pixel at location in the original input imageis characterized by two values and , whichrepresent the intensities of the red and green components,respectively; in our implementation; .The luminance map was obtained from the input image bysumming the red and green values at each point in the image
. The chromatic map was obtainedby finding the arc-tangent of the ratio of the green valueto the red value at each point in the image
. This angle was linearly mappedto a scale between 0 and 255 where the values 0, 127, and255 represent a pure red, a yellow and a pure green signal,respectively, i.e., a linear color scale representation. Thus,if we map and onto the horizontal and vertical axes,respectively, of a Cartesian coordinate system, then contoursof constant map on straight lines of slope 45 withincreasing as we move away from the origin, and contours ofconstant map on straight lines passing through the origin,following standard notational practice in color psychophysics.It is important for the color value to change linearly as wetraverse from any point on the horizontal axis to a point onthe vertical axis. This is achieved by makinga function ofthe angle that a point with coordinates forms with thehorizontal axis, and satisfies this criterion. Thechromatic map was further modulated by a nonlinear functionof the luminance at the same location. Among nonlinearfunctions with sigmoid profiles, we selected the inverse tangentfunction. This is needed to account for secondary interactionsof luminance and chromatic pathways. The luminance mapis supplied to the luminance oriented (LO) and non-oriented(LnO) mechanisms and the chromatic map is supplied to thechromatic oriented (CO) and non-oriented mechanisms (CnO)of the model.
2) Linear Mechanisms:The luminance and colorsignals are first convolved by linear filters, belong-
ing in the four domains. In this stage we are essentiallymodeling the spatial processing characteristics of the earlyvisual cortical areas. The LnO domain comprises the centerON (A in Fig. 1 stands as a mnemonic for “Above”) andcenter-OFF (B for “Below” in Fig. 1) kernels. These areisotropic filters which model non-oriented opponent center-surround simple cells. The LO domain has the center-ONvertical (AV) and horizontal (AH) filters and the correspondingcenter-OFF (BV and BH) oriented filters. These directionallytuned filters, which have even-symmetric profiles, model theclassical Hubel–Wiesel [31] type bar-sensitive detectors. Thechromatic domains CnO and CO have corresponding ker-nels, with OFF and ON substituted by red and green
, respectively. The chromatic non-oriented filters modelthe concentric single-opponent filters. Filters tuned to otherorientations (not shown here for simplicity) were used in thefinal model. The spatial frequency of these filters was chosento match the stimuli used in the psychophysical experiments.Thus, our approach is similar to that of Fogel and Sagi [22],
Fig. 2. Oriented filters shown with their frequency responses. These weredesigned by the steerable filters described in the text. The oriented filters,designed as second derivative of Gaussians, model units in the LO andCO domains. From the frequency responses, it can be noted that they areessentially band-pass filters.
i.e., to use the scale that provides the strongest texture edge; weexperimented with smaller and larger scales and, as expected,the edge strength was significantly reduced relative to thenear-optimal scale. These filters essentially model the point-spread function of simple cells and subunits of complex cells.The choice of filters is not very crucial. We have used thesecond derivative of Gaussians since they yield frequency andorientation bandwidths that are in reasonable agreement withphysiological and psychophysical estimates.
We used “steerable filters” as described by Freeman andAdelson [23], to design our oriented filters. By this techniqueone can obtain the response of a filter of arbitrary orientationas a linear combination of the responses of a set of “basisfilters.” These basis filters were all- separable filters, whichallowed steerable filters to be applied with high computationalefficiency. In our case we used three- separable basis filtersto design all the orientations. Two orientations of filters usedand their corresponding frequency responses are shown inFig. 2. However, with the same basis filters one could enhancethe orientation selectivity by choosing an arbitrary number oforientations.
3) Nonlinear Mechanisms:The outputs of the linear filtersare transformed with what Heeger [30] termed “half-squaring,”i.e., they are first half-wave rectified and then squared. Sim-ulation results with this kind of nonlinearity correlate wellwith a large body of neurophysiological data. Heeger [30]used this transformation for modeling units in the cat’s visualcortex. In addition to being a good physiological model, half-squaring also makes sense for texture segregation. Let usconsider a specific activity map, say the center-ON vertical(AV). Ideally, AV should produce a strong positive signalwhen it is centered on a bright vertical textel (texture element).However, there will be negative values in the output at certainoff-center locations. Half-wave rectification will convenientlyeliminate these negative responses. At the same time, we must

432 IEEE TRANSACTIONS ON SYSTEMS, MAN, AND CYBERNETICS—PART B: CYBERNETICS, VOL. 27, NO. 3, JUNE 1997
Fig. 3. Double opponency illustrated for color and orientation. In the colorcase there is chromatic opponency at the centers (R+ andG�) and surround(G+ andR�). The second opponency is of the spatial kind between the centerand surround (R+ andR�; G� andG+). The orientation case is analogousto the chromatic case, withR replaced by vertical andG by horizontal.
minimize the undesired responses of the AV filter to a darkvertical textel. The strong negative response produced whensuch a textel is centered on the AV filter’s receptive field iseliminated by half-wave rectification. However, the AV filterwill also produce some weaker positive response, say, forsome off-center locations. Ideally, we would like the ratioto be as large as possible. Squaring has a beneficial effectin that it enhances this ratio. Another way of increasing thisratio would be to use a nonlinear contrast response function
. Typically has a sigmoidal shape with neurons that exhibita threshold effect for low contrast and a saturation effect forhigh contrast [2].
Notice that after half-squaring, the units in each domain firespecifically for one polarity or one color and orientation. Thusthe units in the CO domain are simultaneously tuned to color
and orientation. For example the RV units fire for red verticalelements and not for green vertical or red horizontal elements.
4) Generalized Double-Opponency (GDO) Mechanisms:Once the signal is processed by the half-square operator, thenext task is to extract the texture edge. How will the textureedge be extracted using GDO so as to produce results that arecompatible with human performance? Nothdurft’s experiments[41] are relevant in this endeavor. His results indicate thatedge strength i) improves as the textel density increases andii) depends on local differences. Thus, a reasonable idea is toperform a local gradient computation of the spatially smoothed(or “pooled”) output of the pathways, since the smoothing willproduce stronger signals for denser textures. This is equivalentto convolving the outputs with derivatives of smoothingkernels. One possibility is to convolve the image with thesecond derivative of the Gaussian, (center-surroundLaplacian “Mexican hat”). This is shown schematically onthe bottom of Fig. 1, which depicts, in one dimension forsimplicity, how GDO is implemented for a pair of inputsignals and to produce the double-opponent output
. Double-opponency is produced by convolvingandby and , respectively, and adding the results. The
shape of and the phase difference of 180ensure thatand have an excitatory and inhibitory effect, respectively,in the center of and that their roles reverse in the surround.This construction enables it to have an opponency both withina region and across regions in an image. The classical colordouble opponent receptive field, as well as the proposedorientation double opponent field, both shown as center-surround Mexican hats are illustrated in Fig. 3. Consider thecolor double opponent receptive field in Fig. 3: The centralportion of the receptive field is excitatory to red and inhibitoryto green. However, the surround portion behaves exactly thereverse, i.e., inhibitory to red and excitatory to green. Thisis a case of chromatic opponency and is present both in thecenter and surround. The second opponency is of the spatialkind, i.e., red is excitatory in the center and is inhibitory inthe surround. The opposite is true for green. The chromaticopponency coupled with the spatial opponency make theseunits double opponent. Such receptive fields are prevalent inthe visual cortex. Looking at such a cell, one can concludethat the best response would be for a stimulus having a redcenter and a green surround, i.e., a red-green texture edge.Analogously, the best response for our orientation doubleopponent cells in Fig. 3 would be a stimulus with verticallyoriented units in the center and horizontally oriented units inthe periphery. Thus such a GDO operation produces a weaksignal in regions populated by the same textel types, sincethe inhibitory and excitatory contributions of each filter tendto cancel each other over space. On the contrary, it producesa strong signal at texture edges, as desired. As a result, thedouble opponent filters used in the fourth stage of our modelare appropriate for detecting texture edges. Such a GDO filterwas designed as an isotropic band-pass “Mexican-hat” filterwith very low cut-off frequencies. The spatial frequency ofthe GDO filters were 3 cycles/degree compared to those ofthe linear filters which were around 12 cycles/degree. Asmentioned earlier the spatial frequency of the linear filters

PAPATHOMAS et al.: CHROMATIC TEXTURE SEGREGATION 433
were matched to the size of the individual elements in Fig. 2which measured 5 arcmin in length and 1.5 arcmin in width.The entire image (one of the 18 stimuli shown in Fig. 4 )measured 2 in length and 1 in width.
The next issue is to form the pairs of maps which will beprocessed by the double-opponency (GDO) operator withineach domain [25]. Obviously, within the LnO domain a GDOpair is formed by the and pathways (Fig. 1), resultingin the LnO GDO output , where the operator isshown at the bottom of Fig. 1, as explained in the beginningof this section. The CnO output is similarly derived in theCnO domain. We next consider the CO domain. Within CO,opponency is obtained in two possible ways: Orientationopponency is obtained by combining the pathways GV withGH to produce as well as RV withRH for . Color opponency within COis implemented by applying the GDO operator to RV andGV as well as RH and GH to obtainand respectively. In the LO domainthe GDO outputs and
implement orientation opponency, whileand produce polarity opponency.
The pairs (GV, RH) and (GH, RV) involve simultaneousopponency in color and orientation and are thus unlikely tobe implemented. In essence, one may reasonably argue thata horizontal unit would interact with a vertical unit in theorientation domain and similarly a horizontal-red unit wouldinteract with a horizontal-green unit in the color domain.However, an interaction between a horizontal-red unit witha vertical-green unit would be highly unlikely. We haveassigned zero weights for such interactions in our model;psychophysical evidence corroborates this conjecture [25]. Thecombination of two activity maps and into a singleGDO map allows the texture edge to beextracted separately within each GDO map. We used imagesthat contained a vertically oriented texture edge (see Fig. 4).The strength of the edge was estimated by first locating themaximum value of and then subtracting from it the space-averaged value of on both sides of the maximum.
5) Combination of Edge Information:After the signalswithin each pathway are processed by the GDO transfor-mation, the signals must be combined somehow, first withineach domain, and then across all domains. This will producethe final activity map from which global texture edges willbe extracted. We have selected to use-summation [61]because it allows the signals to be weighted and summedprobabilistically, to account for the degree of independenceof the operators. The weights’ values will indicate therelative contributions of the different operators in the texturesegregation process. To obtain appropriate weights for thiscombination, we compared the model’s responses to resultsfrom psychophysical experiments with a carefully chosen setof 18 texture pairs, shown in Fig. 4. We selected those weightswhich produced the best fit with the psychophysical data. Thisis explained in detail in Section III-A.
The next task is to combine the outputs within the LOand CO domains, since we have multiple GDO signals inthese two domains. Let us consider the CO domain in detail,
since the LO domain is quite similar. The edge strengths oforientation-opponent outputs and and the color-opponent outputs and are weighted by and
respectively, and combined through-summation [61] toproduce the total signal for the CO domain
(1a)
Since and are relative strengths for the two possiblemechanisms in the CO domain they can be normalized byrequiring that
(1b)
Similarly, we have
(2a)
with
(2b)
The final edge strength is obtained through -summationacross all four domains with appropriate weights
(3a)where weights and can also benormalized
(3b)
From (1b), (2b), and (3b) it follows that there are five freeparameters (degrees of freedom) in the model. The sizes ofthe linear and GDO filters were held fixed. Strictly speaking,they are also free parameters, but we selected their size tomatch that of the textels in the images. The value ofwas matched to that of the observers, obtained from theslopes of their psychometric curves, i.e., from the plots of% correct as a function of stimulus duration, SD, as explainedin Section III-A.
III. RESULTS
In addition to testing our model with data from the psy-chophysics literature, a variety of other strategic images wereselected to test the performance of our model. The entire modelwas implemented in a highly distributed environment. TenSun Sparc 10’s sharing the same file system were utilizedconcurrently to compute efficiently the various filter activitymaps of the model. A typical simulation of detecting a textureedge in a 128 128 pixel image took about 10 s under normalnetworking load.
A. Psychophysical Results and Parameter Estimation
We tested the model against the three sets of stimuli ofFig. 4 [25], each consisting of six texture pairs, to investigatethe interactions of color, luminance-polarity and orientation intexture segregation. These stimuli are schematized in Fig. 4,with texture elements (textels) composed of elongated bars,characterized by combinations of three attributes: 1)Color
, using only the red and green guns of the monitor; three
434 IEEE TRANSACTIONS ON SYSTEMS, MAN, AND CYBERNETICS—PART B: CYBERNETICS, VOL. 27, NO. 3, JUNE 1997
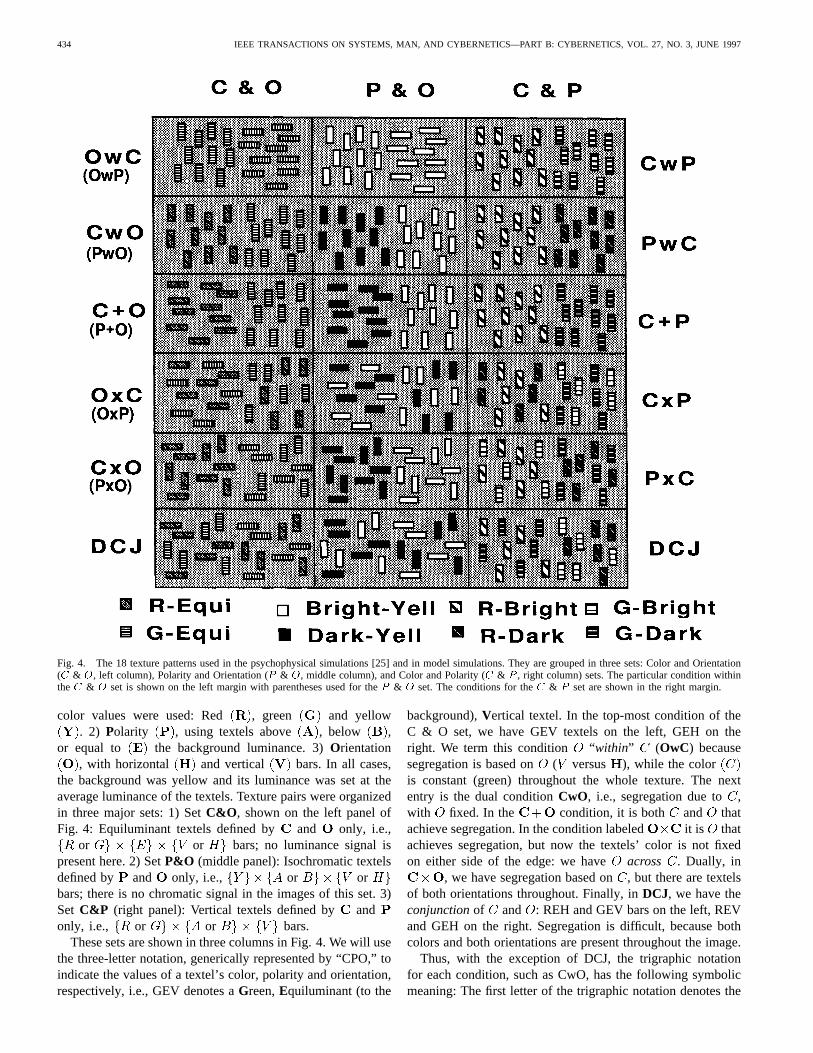
Fig. 4. The 18 texture patterns used in the psychophysical simulations [25] and in model simulations. They are grouped in three sets: Color and Orientation(C & O, left column), Polarity and Orientation (P & O, middle column), and Color and Polarity (C & P , right column) sets. The particular condition withintheC & O set is shown on the left margin with parentheses used for theP & O set. The conditions for theC & P set are shown in the right margin.
color values were used: Red , green and yellow. 2) Polarity , using textels above , below ,
or equal to the background luminance. 3)Orientation, with horizontal and vertical bars. In all cases,
the background was yellow and its luminance was set at theaverage luminance of the textels. Texture pairs were organizedin three major sets: 1) SetC&O , shown on the left panel ofFig. 4: Equiluminant textels defined by and only, i.e.,
or or bars; no luminance signal ispresent here. 2) SetP&O (middle panel): Isochromatic textelsdefined by and only, i.e., or orbars; there is no chromatic signal in the images of this set. 3)Set C&P (right panel): Vertical textels defined by andonly, i.e., or or bars.
These sets are shown in three columns in Fig. 4. We will usethe three-letter notation, generically represented by “CPO,” toindicate the values of a textel’s color, polarity and orientation,respectively, i.e., GEV denotes aGreen,Equiluminant (to the
background),Vertical textel. In the top-most condition of theC & O set, we have GEV textels on the left, GEH on theright. We term this condition “within” (OwC) becausesegregation is based on ( versus ), while the coloris constant (green) throughout the whole texture. The nextentry is the dual conditionCwO, i.e., segregation due to ,with fixed. In the condition, it is both and thatachieve segregation. In the condition labeled it is thatachieves segregation, but now the textels’ color is not fixedon either side of the edge: we have across . Dually, in
, we have segregation based on, but there are textelsof both orientations throughout. Finally, inDCJ, we have theconjunctionof and : REH and GEV bars on the left, REVand GEH on the right. Segregation is difficult, because bothcolors and both orientations are present throughout the image.
Thus, with the exception of DCJ, the trigraphic notationfor each condition, such as CwO, has the following symbolicmeaning: The first letter of the trigraphic notation denotes the
PAPATHOMAS et al.: CHROMATIC TEXTURE SEGREGATION 435
(a)
(b)
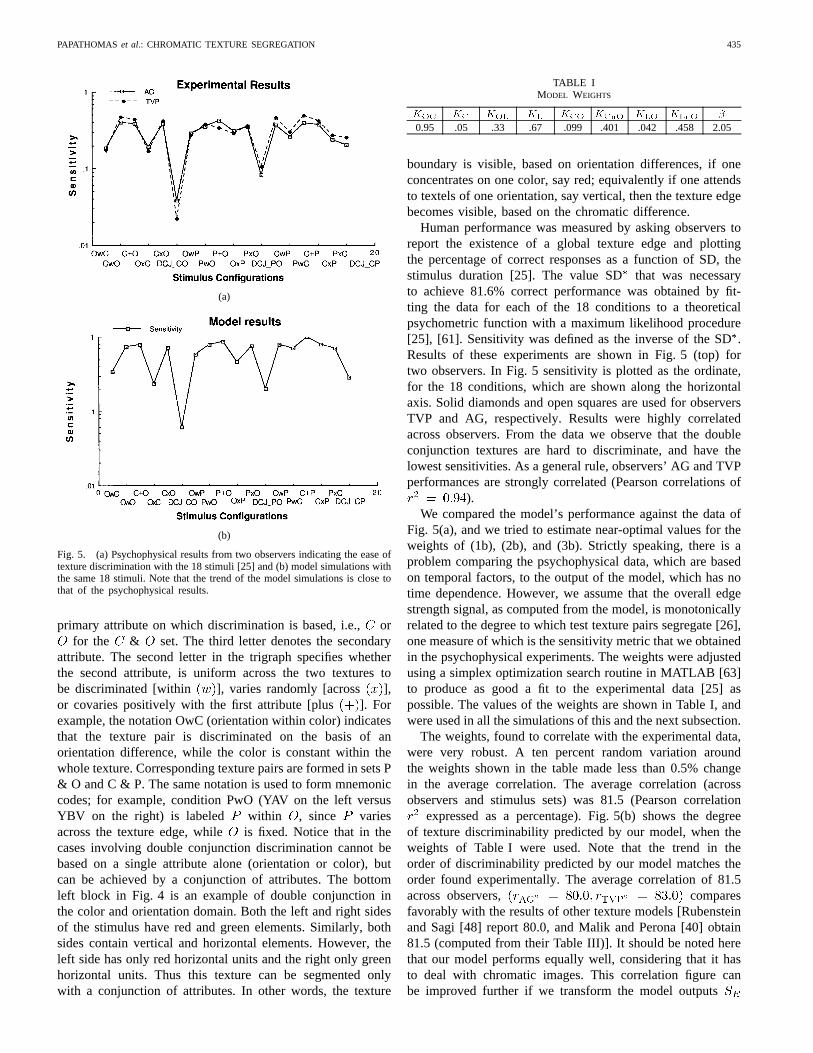
Fig. 5. (a) Psychophysical results from two observers indicating the ease oftexture discrimination with the 18 stimuli [25] and (b) model simulations withthe same 18 stimuli. Note that the trend of the model simulations is close tothat of the psychophysical results.
primary attribute on which discrimination is based, i.e.,orfor the & set. The third letter denotes the secondary
attribute. The second letter in the trigraph specifies whetherthe second attribute, is uniform across the two textures tobe discriminated [within ], varies randomly [across ],or covaries positively with the first attribute [plus ]. Forexample, the notation OwC (orientation within color) indicatesthat the texture pair is discriminated on the basis of anorientation difference, while the color is constant within thewhole texture. Corresponding texture pairs are formed in sets P& O and C & P. The same notation is used to form mnemoniccodes; for example, condition PwO (YAV on the left versusYBV on the right) is labeled within , since variesacross the texture edge, while is fixed. Notice that in thecases involving double conjunction discrimination cannot bebased on a single attribute alone (orientation or color), butcan be achieved by a conjunction of attributes. The bottomleft block in Fig. 4 is an example of double conjunction inthe color and orientation domain. Both the left and right sidesof the stimulus have red and green elements. Similarly, bothsides contain vertical and horizontal elements. However, theleft side has only red horizontal units and the right only greenhorizontal units. Thus this texture can be segmented onlywith a conjunction of attributes. In other words, the texture
TABLE IMODEL WEIGHTS
KOC KC KOL KL KCO KCnO KLO KLnO �
0.95 .05 .33 .67 .099 .401 .042 .458 2.05
boundary is visible, based on orientation differences, if oneconcentrates on one color, say red; equivalently if one attendsto textels of one orientation, say vertical, then the texture edgebecomes visible, based on the chromatic difference.
Human performance was measured by asking observers toreport the existence of a global texture edge and plottingthe percentage of correct responses as a function of SD, thestimulus duration [25]. The value SDthat was necessaryto achieve 81.6% correct performance was obtained by fit-ting the data for each of the 18 conditions to a theoreticalpsychometric function with a maximum likelihood procedure[25], [61]. Sensitivity was defined as the inverse of the SD.Results of these experiments are shown in Fig. 5 (top) fortwo observers. In Fig. 5 sensitivity is plotted as the ordinate,for the 18 conditions, which are shown along the horizontalaxis. Solid diamonds and open squares are used for observersTVP and AG, respectively. Results were highly correlatedacross observers. From the data we observe that the doubleconjunction textures are hard to discriminate, and have thelowest sensitivities. As a general rule, observers’ AG and TVPperformances are strongly correlated (Pearson correlations of
).We compared the model’s performance against the data of
Fig. 5(a), and we tried to estimate near-optimal values for theweights of (1b), (2b), and (3b). Strictly speaking, there is aproblem comparing the psychophysical data, which are basedon temporal factors, to the output of the model, which has notime dependence. However, we assume that the overall edgestrength signal, as computed from the model, is monotonicallyrelated to the degree to which test texture pairs segregate [26],one measure of which is the sensitivity metric that we obtainedin the psychophysical experiments. The weights were adjustedusing a simplex optimization search routine in MATLAB [63]to produce as good a fit to the experimental data [25] aspossible. The values of the weights are shown in Table I, andwere used in all the simulations of this and the next subsection.
The weights, found to correlate with the experimental data,were very robust. A ten percent random variation aroundthe weights shown in the table made less than 0.5% changein the average correlation. The average correlation (acrossobservers and stimulus sets) was 81.5 (Pearson correlation
expressed as a percentage). Fig. 5(b) shows the degreeof texture discriminability predicted by our model, when theweights of Table I were used. Note that the trend in theorder of discriminability predicted by our model matches theorder found experimentally. The average correlation of 81.5across observers, comparesfavorably with the results of other texture models [Rubensteinand Sagi [48] report 80.0, and Malik and Perona [40] obtain81.5 (computed from their Table III)]. It should be noted herethat our model performs equally well, considering that it hasto deal with chromatic images. This correlation figure canbe improved further if we transform the model outputs
436 IEEE TRANSACTIONS ON SYSTEMS, MAN, AND CYBERNETICS—PART B: CYBERNETICS, VOL. 27, NO. 3, JUNE 1997
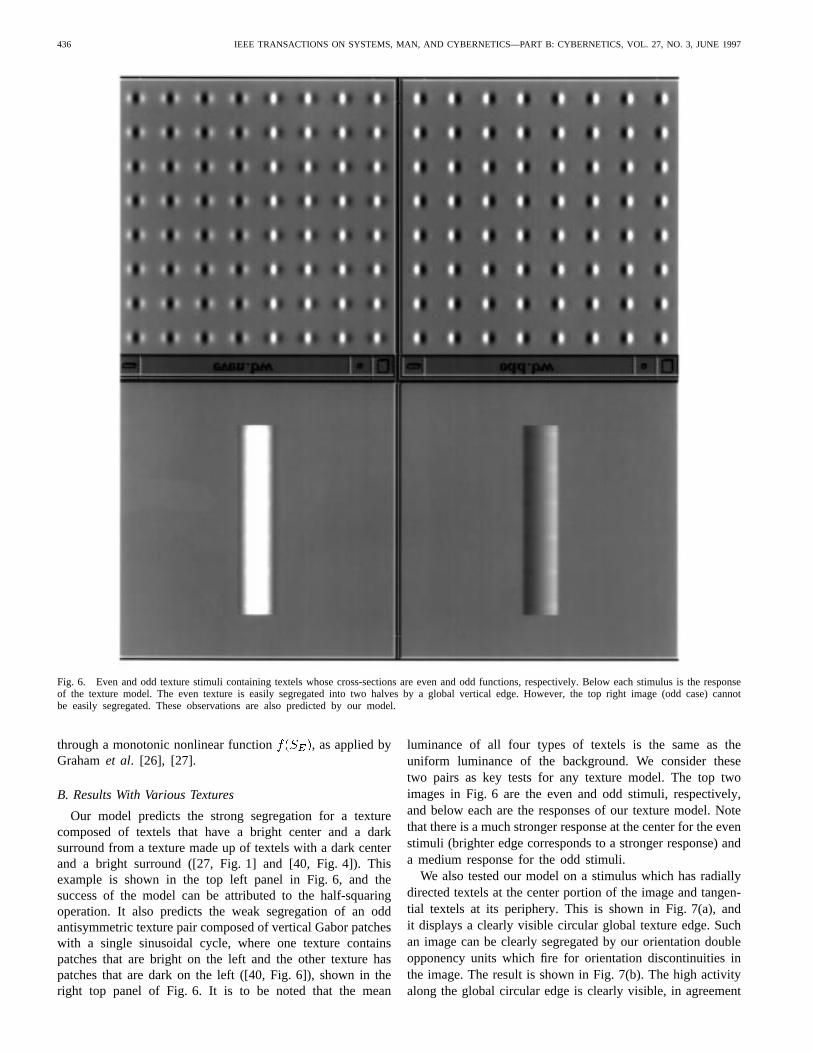
Fig. 6. Even and odd texture stimuli containing textels whose cross-sections are even and odd functions, respectively. Below each stimulus is the responseof the texture model. The even texture is easily segregated into two halves by a global vertical edge. However, the top right image (odd case) cannotbe easily segregated. These observations are also predicted by our model.
through a monotonic nonlinear function , as applied byGrahamet al. [26], [27].
B. Results With Various Textures
Our model predicts the strong segregation for a texturecomposed of textels that have a bright center and a darksurround from a texture made up of textels with a dark centerand a bright surround ([27, Fig. 1] and [40, Fig. 4]). Thisexample is shown in the top left panel in Fig. 6, and thesuccess of the model can be attributed to the half-squaringoperation. It also predicts the weak segregation of an oddantisymmetric texture pair composed of vertical Gabor patcheswith a single sinusoidal cycle, where one texture containspatches that are bright on the left and the other texture haspatches that are dark on the left ([40, Fig. 6]), shown in theright top panel of Fig. 6. It is to be noted that the mean
luminance of all four types of textels is the same as theuniform luminance of the background. We consider thesetwo pairs as key tests for any texture model. The top twoimages in Fig. 6 are the even and odd stimuli, respectively,and below each are the responses of our texture model. Notethat there is a much stronger response at the center for the evenstimuli (brighter edge corresponds to a stronger response) anda medium response for the odd stimuli.
We also tested our model on a stimulus which has radiallydirected textels at the center portion of the image and tangen-tial textels at its periphery. This is shown in Fig. 7(a), andit displays a clearly visible circular global texture edge. Suchan image can be clearly segregated by our orientation doubleopponency units which fire for orientation discontinuities inthe image. The result is shown in Fig. 7(b). The high activityalong the global circular edge is clearly visible, in agreement
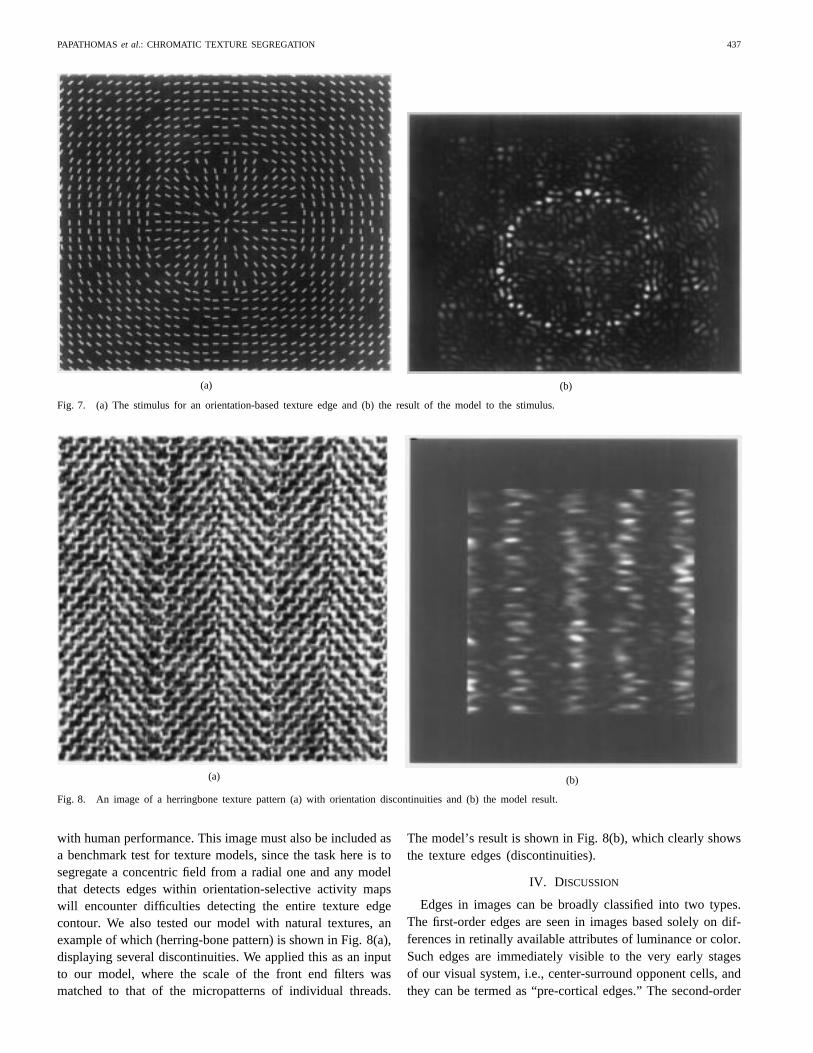
PAPATHOMAS et al.: CHROMATIC TEXTURE SEGREGATION 437
(a) (b)
Fig. 7. (a) The stimulus for an orientation-based texture edge and (b) the result of the model to the stimulus.
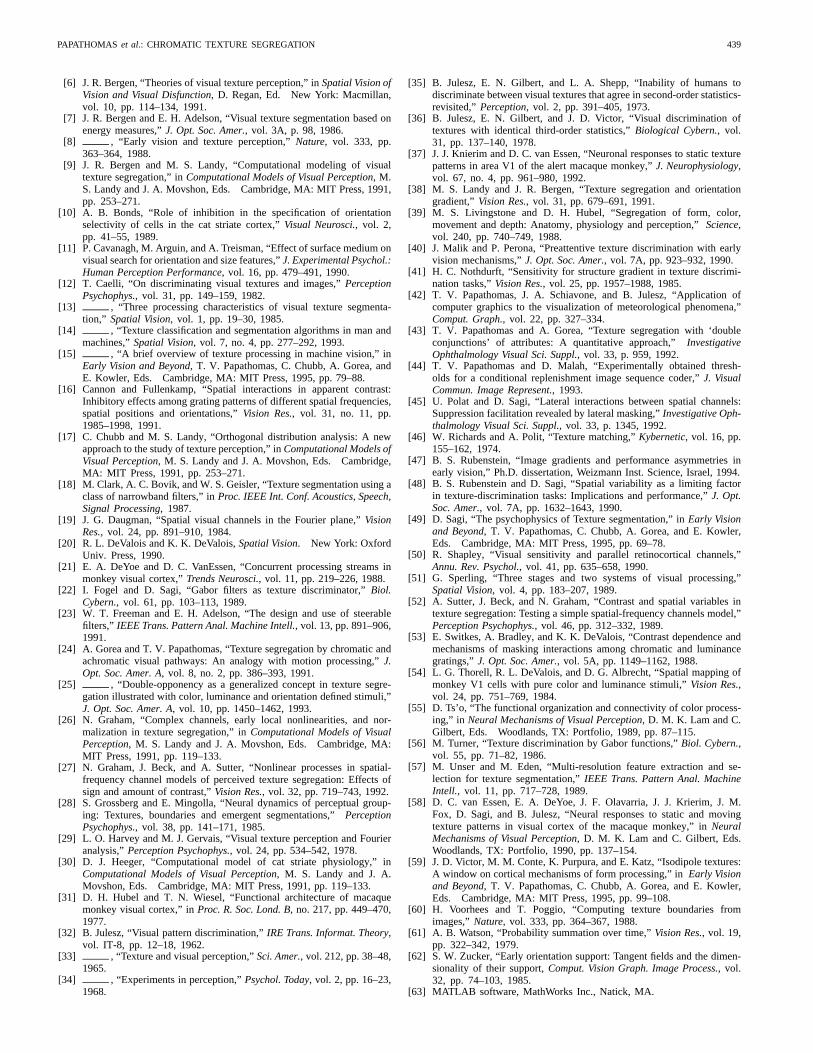
(a) (b)
Fig. 8. An image of a herringbone texture pattern (a) with orientation discontinuities and (b) the model result.
with human performance. This image must also be included asa benchmark test for texture models, since the task here is tosegregate a concentric field from a radial one and any modelthat detects edges within orientation-selective activity mapswill encounter difficulties detecting the entire texture edgecontour. We also tested our model with natural textures, anexample of which (herring-bone pattern) is shown in Fig. 8(a),displaying several discontinuities. We applied this as an inputto our model, where the scale of the front end filters wasmatched to that of the micropatterns of individual threads.
The model’s result is shown in Fig. 8(b), which clearly showsthe texture edges (discontinuities).
IV. DISCUSSION
Edges in images can be broadly classified into two types.The first-order edges are seen in images based solely on dif-ferences in retinally available attributes of luminance or color.Such edges are immediately visible to the very early stagesof our visual system, i.e., center-surround opponent cells, andthey can be termed as “pre-cortical edges.” The second-order

438 IEEE TRANSACTIONS ON SYSTEMS, MAN, AND CYBERNETICS—PART B: CYBERNETICS, VOL. 27, NO. 3, JUNE 1997
edges, or the “cortical edges” are due to derived attributes suchas orientation, contrast, spatial frequency, binocular disparityor flicker-rate differences. Essentially our texture model, likemany others, transforms the second-order edges to activitymaps by convolving the input image with various spatialfrequency and orientation tuned filters, which are then putthrough some nonlinear stages and further smoothed to obtaintexture edges. This model illustrates that the concept behinddouble-opponency can be implemented as a possible mech-anism in texture edge extraction. As noticed from the colordomain, these double-opponent cells in the cortex fire for red-green edges or blue-yellow edges. An analogous mechanismis detailed in our model to extract orientation edges.
At first glance, our model’s orientation opponency is verysimilar to that of Landy and Bergen [38]. However, thereare two important differences: Landy and Bergen’s energyunits respond strongly to bars of their preferred orientationirrespective of the bars’ polarity (this is also true of Fogeland Sagi’s model [22]). Our proposed units respond stronglyto bars of their preferred orientation only if the bars alsomatch the units’ preferred polarity. The second difference isthat we incorporate a double-opponency mechanism for ori-entation, thereby interacting with nearby cells for orientationdifferences. Such a mechanism would be more effective inextracting orientation contrasts. Thus these double-opponentcells tend to be optimized for seeking texture discontinuitiesor texture contrasts in a visual field.
There is clear evidence of spatial opponency in attributesother than luminance or color. For example, in the neuro-physiology literature, van Essen and his colleagues [37], [58]have recorded from cells in area of monkeys with anexcitatory surround for orthogonally oriented bars, pointing toorientation opponency, which they believe may play a role intexture segregation. Similar physiological evidence is given byBonds [10]. In psychophysics, Cannon and Fullenkamp [16]presented evidence of lateral inhibition among mechanismstuned to different spatial frequencies and orientations bystudying how surrounding gratings suppress the contrast ofa center grating. Polat and Sagi [45] present evidence ofspatial opponency in spatial frequency. Surround patches raiseor lower the sensitivity in detecting a patch in the center,depending on whether their spatial frequency is different orthe same as that of the center patch.
One approach to finding texture edges is to extract the edgewithin each activity map using spatial opponency. However,this fails miserably when it comes to comparing casesand DCJ of our C & O stimuli in Fig. 4; both these stimuliwould produce equally strong edges for each of the RV, RH,GV and GH operators of the CO domain. However, we knowthat DCJ, the conjunction case, is far more difficult than
. This is one of the reasons for introducing the conceptof generalized double-opponency (GDO) between pairs ofactivity maps, rather than extracting the edge within eachmap, and GDO does quite well at predicting the differencein performance.
Another concern of our modeling efforts is the interactionof luminance and chromatic pathways. This can be bestunderstood with our texture stimuli. Consider the double-
conjunction of color and polarity (DCJ) (the texture patternin the bottom right of Fig. 4, in the C & P set). The lefthalf of the field contains red-bright elements and green-darkelements. The right half of the field contains green-brightelements and red-dark elements. The luminance component
of this image contains bright and dark elements onboth sides of the field, which makes segregation extremelydifficult, if not impossible. The chromatic componentcontains red and green elements on both sides of the field, andthis map too does not make it any easier to find a textureedge. Now, if the human visual system did have separatenoninteracting luminance and chromatic mechanisms, such astimulus would not give rise to any texture edge. However,from the experimental data in Fig. 5(a), observers could finda texture boundary in such stimuli. This clearly argues forinteracting pathways for color and luminance, and this is thereason for incorporating such an interaction in our model.
The model proposed above is based on the generalizationof the concept of double opponency to attributes other thancolor, such as luminance-polarity and orientation. This is thefirst successful attempt, to our knowledge, to model humantexture segregation performance with textels defined by color,in addition to orientation and luminance (which have beenused by other researchers); furthermore, this model has someneurophysiological relevance and its results agree closely withexperimental data. However, the limitations of the modelmust also be noted. First, this model only deals with twoopponent mechanisms (i.e., broad-band and red-green), andnot with the third one (yellow-blue). The introduction of thethird mechanism would allow the model to deal with full-color images. Second, multiple scales must be incorporated todeal with arbitrary inputs automatically, without adjusting thefilters’ sizes. Third, the issue of asymmetry [49] was not ad-dressed explicitly in this model, but additional psychophysicalexperiments are necessary to modify the model appropriately.
The model could be utilized in the following areas: a) imageprocessing for the purposes of image segmentation and coding,taking full advantage of the characteristics of the human visualsystem which, after all, is the “final judge” of image qualityand fidelity [44], [57]; b) pattern recognition and machinevision for improving shape-from-texture algorithms which, sofar, have been applied to gray-level images [1]; c) scientificvisualization for effectively employing visual attributes inorder to portray large data sets by coupling them effectivelyto the human visual system [42]. The model can be extendedto other attributes, such as spatial frequency, by constructingGDO operators between adjacent frequency bands that sharethe same orientation tuning. It remains to be seen whether suchGDO units can be isolated in neurophysiological experiments.
REFERENCES
[1] J. Aloimonos, “Shape from texture,”Biol. Cybern., vol. 58, pp. 345–360,1988.
[2] D. Albrecht and D. Hamilton, “Striate cortex of monkey and cat:Contrast response function,”J. Neurophys., vol. 48, pp. 217–237, 1982.
[3] J. Beck, “Effect of orientation and of shape similarity on perceptualgrouping,” Perception Psychophys., vol. 1, pp. 300–302, 1966.
[4] , “Textural segmentation,” inOrganization and Representationin Perception, J. Beck, Ed. Hillsdale, NJ: Erlbaum, 1982.
[5] J. Beck, K. Prazdny, and A. Rosenfeld,Human and Machine Vision.New York: Academic, 1983.
PAPATHOMAS et al.: CHROMATIC TEXTURE SEGREGATION 439
[6] J. R. Bergen, “Theories of visual texture perception,” inSpatial Vision ofVision and Visual Disfunction, D. Regan, Ed. New York: Macmillan,vol. 10, pp. 114–134, 1991.
[7] J. R. Bergen and E. H. Adelson, “Visual texture segmentation based onenergy measures,”J. Opt. Soc. Amer., vol. 3A, p. 98, 1986.
[8] , “Early vision and texture perception,”Nature, vol. 333, pp.363–364, 1988.
[9] J. R. Bergen and M. S. Landy, “Computational modeling of visualtexture segregation,” inComputational Models of Visual Perception, M.S. Landy and J. A. Movshon, Eds. Cambridge, MA: MIT Press, 1991,pp. 253–271.
[10] A. B. Bonds, “Role of inhibition in the specification of orientationselectivity of cells in the cat striate cortex,”Visual Neurosci., vol. 2,pp. 41–55, 1989.
[11] P. Cavanagh, M. Arguin, and A. Treisman, “Effect of surface medium onvisual search for orientation and size features,”J. Experimental Psychol.:Human Perception Performance, vol. 16, pp. 479–491, 1990.
[12] T. Caelli, “On discriminating visual textures and images,”PerceptionPsychophys., vol. 31, pp. 149–159, 1982.
[13] , “Three processing characteristics of visual texture segmenta-tion,” Spatial Vision, vol. 1, pp. 19–30, 1985.
[14] , “Texture classification and segmentation algorithms in man andmachines,”Spatial Vision, vol. 7, no. 4, pp. 277–292, 1993.
[15] , “A brief overview of texture processing in machine vision,” inEarly Vision and Beyond, T. V. Papathomas, C. Chubb, A. Gorea, andE. Kowler, Eds. Cambridge, MA: MIT Press, 1995, pp. 79–88.
[16] Cannon and Fullenkamp, “Spatial interactions in apparent contrast:Inhibitory effects among grating patterns of different spatial frequencies,spatial positions and orientations,”Vision Res., vol. 31, no. 11, pp.1985–1998, 1991.
[17] C. Chubb and M. S. Landy, “Orthogonal distribution analysis: A newapproach to the study of texture perception,” inComputational Models ofVisual Perception, M. S. Landy and J. A. Movshon, Eds. Cambridge,MA: MIT Press, 1991, pp. 253–271.
[18] M. Clark, A. C. Bovik, and W. S. Geisler, “Texture segmentation using aclass of narrowband filters,” inProc. IEEE Int. Conf. Acoustics, Speech,Signal Processing, 1987.
[19] J. G. Daugman, “Spatial visual channels in the Fourier plane,”VisionRes., vol. 24, pp. 891–910, 1984.
[20] R. L. DeValois and K. K. DeValois,Spatial Vision. New York: OxfordUniv. Press, 1990.
[21] E. A. DeYoe and D. C. VanEssen, “Concurrent processing streams inmonkey visual cortex,”Trends Neurosci., vol. 11, pp. 219–226, 1988.
[22] I. Fogel and D. Sagi, “Gabor filters as texture discriminator,”Biol.Cybern., vol. 61, pp. 103–113, 1989.
[23] W. T. Freeman and E. H. Adelson, “The design and use of steerablefilters,” IEEE Trans. Pattern Anal. Machine Intell., vol. 13, pp. 891–906,1991.
[24] A. Gorea and T. V. Papathomas, “Texture segregation by chromatic andachromatic visual pathways: An analogy with motion processing,”J.Opt. Soc. Amer. A, vol. 8, no. 2, pp. 386–393, 1991.
[25] , “Double-opponency as a generalized concept in texture segre-gation illustrated with color, luminance and orientation defined stimuli,”J. Opt. Soc. Amer. A, vol. 10, pp. 1450–1462, 1993.
[26] N. Graham, “Complex channels, early local nonlinearities, and nor-malization in texture segregation,” inComputational Models of VisualPerception, M. S. Landy and J. A. Movshon, Eds. Cambridge, MA:MIT Press, 1991, pp. 119–133.
[27] N. Graham, J. Beck, and A. Sutter, “Nonlinear processes in spatial-frequency channel models of perceived texture segregation: Effects ofsign and amount of contrast,”Vision Res., vol. 32, pp. 719–743, 1992.
[28] S. Grossberg and E. Mingolla, “Neural dynamics of perceptual group-ing: Textures, boundaries and emergent segmentations,”PerceptionPsychophys., vol. 38, pp. 141–171, 1985.
[29] L. O. Harvey and M. J. Gervais, “Visual texture perception and Fourieranalysis,”Perception Psychophys., vol. 24, pp. 534–542, 1978.
[30] D. J. Heeger, “Computational model of cat striate physiology,” inComputational Models of Visual Perception, M. S. Landy and J. A.Movshon, Eds. Cambridge, MA: MIT Press, 1991, pp. 119–133.
[31] D. H. Hubel and T. N. Wiesel, “Functional architecture of macaquemonkey visual cortex,” inProc. R. Soc. Lond. B, no. 217, pp. 449–470,1977.
[32] B. Julesz, “Visual pattern discrimination,”IRE Trans. Informat. Theory,vol. IT-8, pp. 12–18, 1962.
[33] , “Texture and visual perception,”Sci. Amer., vol. 212, pp. 38–48,1965.
[34] , “Experiments in perception,”Psychol. Today, vol. 2, pp. 16–23,1968.
[35] B. Julesz, E. N. Gilbert, and L. A. Shepp, “Inability of humans todiscriminate between visual textures that agree in second-order statistics-revisited,” Perception, vol. 2, pp. 391–405, 1973.
[36] B. Julesz, E. N. Gilbert, and J. D. Victor, “Visual discrimination oftextures with identical third-order statistics,”Biological Cybern., vol.31, pp. 137–140, 1978.
[37] J. J. Knierim and D. C. van Essen, “Neuronal responses to static texturepatterns in area V1 of the alert macaque monkey,”J. Neurophysiology,vol. 67, no. 4, pp. 961–980, 1992.
[38] M. S. Landy and J. R. Bergen, “Texture segregation and orientationgradient,” Vision Res., vol. 31, pp. 679–691, 1991.
[39] M. S. Livingstone and D. H. Hubel, “Segregation of form, color,movement and depth: Anatomy, physiology and perception,”Science,vol. 240, pp. 740–749, 1988.
[40] J. Malik and P. Perona, “Preattentive texture discrimination with earlyvision mechanisms,”J. Opt. Soc. Amer., vol. 7A, pp. 923–932, 1990.
[41] H. C. Nothdurft, “Sensitivity for structure gradient in texture discrimi-nation tasks,”Vision Res., vol. 25, pp. 1957–1988, 1985.
[42] T. V. Papathomas, J. A. Schiavone, and B. Julesz, “Application ofcomputer graphics to the visualization of meteorological phenomena,”Comput. Graph., vol. 22, pp. 327–334.
[43] T. V. Papathomas and A. Gorea, “Texture segregation with ‘doubleconjunctions’ of attributes: A quantitative approach,”InvestigativeOphthalmology Visual Sci. Suppl., vol. 33, p. 959, 1992.
[44] T. V. Papathomas and D. Malah, “Experimentally obtained thresh-olds for a conditional replenishment image sequence coder,”J. VisualCommun. Image Represent., 1993.
[45] U. Polat and D. Sagi, “Lateral interactions between spatial channels:Suppression facilitation revealed by lateral masking,”Investigative Oph-thalmology Visual Sci. Suppl., vol. 33, p. 1345, 1992.
[46] W. Richards and A. Polit, “Texture matching,”Kybernetic, vol. 16, pp.155–162, 1974.
[47] B. S. Rubenstein, “Image gradients and performance asymmetries inearly vision,” Ph.D. dissertation, Weizmann Inst. Science, Israel, 1994.
[48] B. S. Rubenstein and D. Sagi, “Spatial variability as a limiting factorin texture-discrimination tasks: Implications and performance,”J. Opt.Soc. Amer., vol. 7A, pp. 1632–1643, 1990.
[49] D. Sagi, “The psychophysics of Texture segmentation,” inEarly Visionand Beyond, T. V. Papathomas, C. Chubb, A. Gorea, and E. Kowler,Eds. Cambridge, MA: MIT Press, 1995, pp. 69–78.
[50] R. Shapley, “Visual sensitivity and parallel retinocortical channels,”Annu. Rev. Psychol., vol. 41, pp. 635–658, 1990.
[51] G. Sperling, “Three stages and two systems of visual processing,”Spatial Vision, vol. 4, pp. 183–207, 1989.
[52] A. Sutter, J. Beck, and N. Graham, “Contrast and spatial variables intexture segregation: Testing a simple spatial-frequency channels model,”Perception Psychophys., vol. 46, pp. 312–332, 1989.
[53] E. Switkes, A. Bradley, and K. K. DeValois, “Contrast dependence andmechanisms of masking interactions among chromatic and luminancegratings,”J. Opt. Soc. Amer., vol. 5A, pp. 1149–1162, 1988.
[54] L. G. Thorell, R. L. DeValois, and D. G. Albrecht, “Spatial mapping ofmonkey V1 cells with pure color and luminance stimuli,”Vision Res.,vol. 24, pp. 751–769, 1984.
[55] D. Ts’o, “The functional organization and connectivity of color process-ing,” in Neural Mechanisms of Visual Perception, D. M. K. Lam and C.Gilbert, Eds. Woodlands, TX: Portfolio, 1989, pp. 87–115.
[56] M. Turner, “Texture discrimination by Gabor functions,”Biol. Cybern.,vol. 55, pp. 71–82, 1986.
[57] M. Unser and M. Eden, “Multi-resolution feature extraction and se-lection for texture segmentation,”IEEE Trans. Pattern Anal. MachineIntell., vol. 11, pp. 717–728, 1989.
[58] D. C. van Essen, E. A. DeYoe, J. F. Olavarria, J. J. Krierim, J. M.Fox, D. Sagi, and B. Julesz, “Neural responses to static and movingtexture patterns in visual cortex of the macaque monkey,” inNeuralMechanisms of Visual Perception, D. M. K. Lam and C. Gilbert, Eds.Woodlands, TX: Portfolio, 1990, pp. 137–154.
[59] J. D. Victor, M. M. Conte, K. Purpura, and E. Katz, “Isodipole textures:A window on cortical mechanisms of form processing,” inEarly Visionand Beyond, T. V. Papathomas, C. Chubb, A. Gorea, and E. Kowler,Eds. Cambridge, MA: MIT Press, 1995, pp. 99–108.
[60] H. Voorhees and T. Poggio, “Computing texture boundaries fromimages,”Nature, vol. 333, pp. 364–367, 1988.
[61] A. B. Watson, “Probability summation over time,”Vision Res., vol. 19,pp. 322–342, 1979.
[62] S. W. Zucker, “Early orientation support: Tangent fields and the dimen-sionality of their support,Comput. Vision Graph. Image Process., vol.32, pp. 74–103, 1985.
[63] MATLAB software, MathWorks Inc., Natick, MA.

440 IEEE TRANSACTIONS ON SYSTEMS, MAN, AND CYBERNETICS—PART B: CYBERNETICS, VOL. 27, NO. 3, JUNE 1997
Thomas V. Papathomas(S’75–M’76) was born inKastoria, Macedonia, Greece in 1949. He receivedthe B.S., M.S., and Ph.D. degrees from ColumbiaUniversity, New York, in 1971, 1972, and 1977,respectively, all from the Department of ElectricalEngineering and Computer Science.
He was a Member of the Technical Staff in theElectronic Power Systems Laboratory from 1977to 1982, a supervisor of the AC Control SystemsGroup from 1982 to 1983, and a Member of theResearch Staff in the Visual Perception Research
Department from 1983 to 1989, all at AT&T Bell Laboratories, MurrayHill, NJ. Since 1989 he is an Associate Professor in the Department ofBiomedical Engineering and the Associate Director of the Laboratory ofVision Research, Rutgers University, Piscataway, NJ. His research interestsare in human and machine vision, image processing, imaging systems,and scientific visualization techniques. He has designed several exhibits onstereopsis in science museums, and is the editor-in-chief ofEarly Vision andBeyond(Cambridge, MA: MIT Press, 1995), a volume of interdisciplinaryresearch in psychophysics, neurophysiology, and computational vision.
Dr. Papathomas is a member of Eta Kappa Nu, Tau Beta Pi, Sigma Xi,ACM, OSA (Optical Society of America), SPIE (Society of Photo-OpticalInstrumentation Engineers), ARVO (Association for Research in Vision andOphthalmology), and LIA (Laser Institute of America). Since 1993, he isserving as a member of the editorial board of theInternational Journal ofImaging Systems and Technology.
Ramanujan S. Kashiwas born in Bangalore, India,on April 26, 1966. He received the B.E. degreein instrumentation technology from the Universityof Mysore, India in 1988, and the M.S. and Ph.D.degrees in biomedical engineering from RutgersUniversity, Piscataway, NJ, in 1991 and 1994, re-spectively.
Following a year of postdoctoral study fundedby the Fight for Sight (research division of PreventBlindness America) with T. V. Papathomas, at theLaboratory of Vision Research, Rutgers University,
he joined Bell Laboratories, Murray Hill, NJ, as a Member of the TechnicalStaff. His research interests are in human and computational vision, visualperception and pattern recognition problems as related to handwriting recog-nition.
Dr. Kashi is a member of ARVO (Association for Research in Vision andOphthalmology).
Andrei Gorea was born in 1952 in Bucharest, Romania. He receivedthe Master of clinical psychology degree and the Diploma of the ‘‘EcolePratique des Hautes Etudes’’ in experimental psychology, both from ParisVII University, France, in 1975. He received the Ph.D. degree in experimentalpsychology and the ‘‘These d’Etar’’ in neurosciences from the Rene DescartesUniversity, Paris, in 1978 and 1986, respectively.
He has been with the National Center for Scientific Research (CNRS),Paris, France, since 1978 and is now Director of Research. He is alsoan Adjunct Associate Professor at the Pierre and Marie Curie Universityand Rene Descartes University. His scientific experience mainly coversthe psychophysics of spatio-temporal aspects of vision perception, motionperception, grouping and segregation of moving and textured multi-attributestimuli, dynamic stereo, 3-D from 2-D stimuli and bistable perception, andvisual attention. He was an Associate Editor ofSpatial Visionand organizer ofthe 13th ‘‘European Conference on Visual Research’’ (ECVP) in Paris, 1990.
Dr. Gorea is a member of the Optical Society of America (OSA), theEuropean Brain and Behavior Society (EBBS), and Association for Researchin Vision and Ophthalmology (ARVO).