
A High-Throughput Study in Melanoma Identifies Epithelial Mesenchymal Transition as a Major...
12
2007;67:3450-3460. Cancer Res Soledad R. Alonso, Lorraine Tracey, Pablo Ortiz, et al. Metastasis of Epithelial-Mesenchymal Transition as a Major Determinant A High-Throughput Study in Melanoma Identifies Updated version http://cancerres.aacrjournals.org/content/67/7/3450 Access the most recent version of this article at: Material Supplementary http://cancerres.aacrjournals.org/content/suppl/2009/03/27/67.7.3450.DC1.html Access the most recent supplemental material at: Cited Articles http://cancerres.aacrjournals.org/content/67/7/3450.full.html#ref-list-1 This article cites by 50 articles, 13 of which you can access for free at: Citing articles http://cancerres.aacrjournals.org/content/67/7/3450.full.html#related-urls This article has been cited by 24 HighWire-hosted articles. Access the articles at: E-mail alerts related to this article or journal. Sign up to receive free email-alerts Subscriptions Reprints and . [email protected] Department at To order reprints of this article or to subscribe to the journal, contact the AACR Publications Permissions . [email protected] Department at To request permission to re-use all or part of this article, contact the AACR Publications Research. on March 5, 2014. © 2007 American Association for Cancer cancerres.aacrjournals.org Downloaded from Research. on March 5, 2014. © 2007 American Association for Cancer cancerres.aacrjournals.org Downloaded from
-
Upload
independent -
Category
Documents
-
view
0 -
download
0
Transcript of A High-Throughput Study in Melanoma Identifies Epithelial Mesenchymal Transition as a Major...

2007;67:3450-3460. Cancer Res Soledad R. Alonso, Lorraine Tracey, Pablo Ortiz, et al. Metastasis
ofEpithelial-Mesenchymal Transition as a Major Determinant A High-Throughput Study in Melanoma Identifies
Updated version
http://cancerres.aacrjournals.org/content/67/7/3450
Access the most recent version of this article at:
Material
Supplementary
http://cancerres.aacrjournals.org/content/suppl/2009/03/27/67.7.3450.DC1.html
Access the most recent supplemental material at:
Cited Articles
http://cancerres.aacrjournals.org/content/67/7/3450.full.html#ref-list-1
This article cites by 50 articles, 13 of which you can access for free at:
Citing articles
http://cancerres.aacrjournals.org/content/67/7/3450.full.html#related-urls
This article has been cited by 24 HighWire-hosted articles. Access the articles at:
E-mail alerts related to this article or journal.Sign up to receive free email-alerts
Subscriptions
Reprints and
To order reprints of this article or to subscribe to the journal, contact the AACR Publications
Permissions
To request permission to re-use all or part of this article, contact the AACR Publications
Research. on March 5, 2014. © 2007 American Association for Cancercancerres.aacrjournals.org Downloaded from
Research. on March 5, 2014. © 2007 American Association for Cancercancerres.aacrjournals.org Downloaded from
A High-Throughput Study in Melanoma Identifies Epithelial-
Mesenchymal Transition as a Major Determinant of Metastasis
Soledad R. Alonso,1Lorraine Tracey,
1Pablo Ortiz,
4Beatriz Perez-Gomez,
5Jose Palacios,
1
Marina Pollan,5Juan Linares,
6Salvio Serrano,
7Ana I. Saez-Castillo,
6Lydia Sanchez,
2
Raquel Pajares,2Abel Sanchez-Aguilera,
1Maria J. Artiga,
1Miguel A. Piris,
1
and Jose L. Rodrıguez-Peralto3
1Molecular Pathology Programme and 2Histology and Immunohistochemistry Unit, Centro Nacional de Investigaciones Oncologicas;Departments of 3Pathology and 4Dermatology, Hospital Universitario 12 de Octubre; 5Centro Nacional de Epidemiologıa, Instituto de SaludCarlos III, Madrid, Spain; and Departments of 6Pathology and 7Dermatology, Hospital Universitario San Cecilio, Granada, Spain
Abstract
Metastatic disease is the primary cause of death in cutaneousmalignant melanoma (CMM) patients. To understand themechanisms of CMM metastasis and identify potentialpredictive markers, we analyzed gene-expression profiles of34 vertical growth phase melanoma cases using cDNA micro-arrays. All patients had a minimum follow-up of 36 months.Twenty-one cases developed nodal metastatic disease and 13did not. Comparison of gene expression profiling of metastaticand nonmetastatic melanoma cases identified 243 genes witha >2-fold differential expression ratio and a false discoveryrate of <0.2 (206 up-regulated and 37 down-regulated). Thisset of genes included molecules involved in cell cycle andapoptosis regulation, epithelial-mesenchymal transition(EMT), signal transduction, nucleic acid binding and tran-scription, protein synthesis and degradation, metabolism, anda specific group of melanoma- and neural-related proteins.Validation of these expression data in an independent seriesof melanomas using tissue microarrays confirmed that theexpression of a set of proteins included in the EMT group(N-cadherin, osteopontin, and SPARC/osteonectin) were sig-nificantly associated with metastasis development. Our resultssuggest that EMT-related genes contribute to the promotionof the metastatic phenotype in primary CMM by supportingspecific adhesive, invasive, and migratory properties. Thesedata give a better understanding of the biology of thisaggressive tumor and may provide new prognostic and patientstratification markers in addition to potential therapeutictargets. [Cancer Res 2007;67(7):3450–60]
Introduction
In primary cutaneous malignant melanoma (CMM) patients, itis essential to determine the molecular changes associated withmetastasis and to apply this knowledge to the fields of outcomeprediction and targeted treatment. This information will lead to abetter understanding of the biology of this tumor, and will probablyprovide prognostic information for defining subgroups of patients
with a less favorable prognosis as potential candidates for adjuvantor novel therapies.Currently, the prognosis of primary CMM is mainly based
on histopathologic criteria. The most important of these is theBreslow index, although it is merely a measure of tumor depth.New molecular markers that correlate with melanoma genesisand/or progression are continuously being identified but, to date,most of them have been obtained in experimental models andhave not yet been confirmed in series of human samples.The development of high-throughput screening techniques in
genomics and proteomics has enabled the analysis of theexpression of multiple genes and proteins in large seriesof tumor samples (1) and may contribute to the resolution ofsome specific issues of clinical relevance, such as identifying thesteps for melanoma progression and metastasis. Until now, moststudies characterizing CMM have been done using cell lines (2, 3),mouse models (4), or metastatic tumor samples (2, 5). However,data obtained from primary CMM samples are difficult to obtain,due in part to the lack of retrospective collections of frozenprimary melanomas samples or adequate follow-up (5–7).Molecular changes associated with the acquisition of metastatic
capacity in vertical growth phase melanoma are still to be fullydescribed. We might expect a repertoire of differentially expressedgenes defining the metastatic phenotype for primary CMM cases.The present study aimed to investigate the metastasis signaturein primary CMM. To this end, we compared the gene expressionprofile in a series of vertical growth phase primary CMMs that haddeveloped metastatic disease with vertical growth phase CMMwithout metastatic disease by the end of follow-up. Our resultsconfirm the multifactorial genesis of melanoma metastasis andidentify the epithelial-mesenchymal transition (EMT) and therelation with the extracellular matrix as key steps in melanomaprogression.
Materials and Methods
Patients and tissue samples. This study featured a series of 34 primaryCMMs provided by the Hospital San Cecilio (Granada, Spain) and the
Hospital 12 de Octubre (Madrid, Spain). Patients were recruited between
1990 and 2002 to ensure a minimum follow-up of 36 months. Samples were
collected and frozen according to standard protocols, and their histologywas reviewed by two pathologists (S.R.A. and J.L.R-P.) to confirm that they
contained at least 50% tumor cells. All selected cases corresponded to
consecutive melanoma tumors with potential metastatic capacity (i.e.,vertical growth phase cases with a Breslow index >1 mm). The cutoff was
selected taking into account the criteria of the American Joint Committee
on Cancer by which thin melanomas (V1 mm) have an excellent prognosis
Note: Supplementary data for this article are available at Cancer Research Online(http://cancerres.aacrjournals.org/).
Requests for reprints: Miguel A. Piris, Programa de Patologıa Molecular, CentroNacional de Investigaciones Oncologicas, C/Melchor Fernandez Almagro 3, Madrid28029, Spain. Phone: 34-91-224-69-00; Fax: 34-91-224-69-23; E-mail: [email protected].
I2007 American Association for Cancer Research.doi:10.1158/0008-5472.CAN-06-3481
Cancer Res 2007; 67: (7). April 1, 2007 3450 www.aacrjournals.org
Research Article
Research. on March 5, 2014. © 2007 American Association for Cancercancerres.aacrjournals.org Downloaded from
(>90% survival at 5 years) compared with melanomas with a penetration
depth of >1 mm (8). Histologic review of the cases was done on paraffin-
embedded tissue, whereas frozen sections were examined for assessing the
proportion of the tumoral cells and the character of the neoplasticinfiltrate.
For tissue microarray (TMA) analysis, we used a retrospective cohort
of patients representing 127 primary vertical growth phase melanoma
cases ( formalin-fixed and paraffin-embedded tissue) collected from 1980
to 2000. These cases were obtained from the Hospital 12 de Octubre
(Madrid) and were included in six separate TMAs (1.5-mm core
diameter), with two representative duplicate cores for each case (9),
and constructed with a manual tissue arrayer (Beecher Instruments, Sun
Prairie, WI) using a standard method (10). Patient medical records were
reviewed to gather information on age, gender, localization, tumor
thickness, distant invasion (lymph node or skin), and follow-up of at
least 36 months. Patients were not treated before the development of
metastasis. The work was conducted in accordance with the Declaration
of Helsinki Principles and under the supervision of the Hospital 12 de
Octubre Ethics Committee.
RNA isolation and amplification. Total RNA was extracted from
frozen samples of primary CMM using TRIzol reagent (Invitrogen,
Carlsbad, CA) followed by purification with the RNeasy Mini kit (Qiagen
Inc., Valencia, CA) and digestion with RNase free DNase I according to
the manufacturer’s instructions. RNA quality and integrity were verified
using the Bioanalyzer system (Agilent Technologies, Palo Alto, CA).
Double-stranded cDNA was synthesized from 5 Ag of total RNA using
the Superscript Choice System for cDNA synthesis (Invitrogen) with an
oligo-dT primer containing a T7 RNA polymerase promoter. In vitro
transcription was carried out using the T7 Megascript in vitro trans-
cription kit (Ambion, Austin, TX) as previously described (11, 12). The
quality of the amplified RNA produced was checked by electrophoresis
and its concentration was measured.
Microarray procedures: preparation/synthesis of fluorescent cDNAand hybridization. For each melanoma sample, 5 Ag of amplified RNA
(aRNA) were directly labeled with cyanine 3-conjugated dUTP (Cy3),
whereas 5 Ag of aRNA from the Universal Human Reference RNA
(Stratagene, La Jolla, CA) were labeled with cyanine 5–conjugated dUTP
(Cy5). The Centro Nacional de Investigaciones Oncologicas (CNIO)
OncoChip platform (v.1.4) was used in all cases to perform the cDNA
microarray procedure. Basically, the CNIO OncoChip is a cDNA microarray
especially designed for the analysis of genes involved in cancer. It includes
2,489 cancer-relevant genes in addition to genes involved in drug response,
tissue-specific genes, and control genes. The platform used has a total
of 6,386 genes represented by 7,237 human clones purchased from
Research Genetics (Huntsville, AL). A list of these genes can be found
online.8 Sample hybridizations were done as described elsewhere (12).
After washing, the two fluorescent signals on the slides were scanned with
a standard two-color microarray scanner (Scanarray 5000XL, GSI
Lumonics, Kanata, Ontario, Canada). Images were analyzed with the
GenePix 4.1 software (Axon Instruments, Inc., Union City, CA). The clone
sequences of all the genes included in the OncoChip and the repro-
ducibility of the expression data of multiple genes have been previously
verified (12).
Data extraction and analysis. Data from each hybridization were
maintained in a database for analysis. Fluorescence intensity measurements
were subjected to automatic background subtraction. The Cy3/Cy5 ratioswere normalized to the value of the median ratio of all spots in the array.
The sum of the median background for each channel was calculated,
and spots with total intensities less than the calculated sum of median
backgrounds were discarded. Additionally, spots with background-subtracted signal intensities <500 fluorescence units (sum of the two
channels) and bad spots were excluded from the analysis. All ratio values
were log-transformed (base 2), and duplicated spots in the array wereaveraged. Inconsistent duplicates were discarded and all consistent
duplicate spots and genes were averaged. In addition, genes for which
fewer than 70% of the potential data were available were excluded from
further analysis. The median expression of each gene was calculated foreach patient group (metastatic and nonmetastatic primary CMM). Differ-
ences in expression between the two groups were analyzed by the Wilcoxon
test. To account for the effect of multiple hypothesis testing on the iden-
tification of significance, adjusted P values were also computed using themethod proposed by Hochberg and Benjamini (13) for controlling the false-
discovery rate (FDR). A single value for each gene was obtained. For our
purposes, a gene was deemed to be up-regulated or down-regulated if there
was an at least 2-fold difference in expression and if the FDR value was <0.2.The regulated genes were functionally classified manually on the basis of
exhaustive searches in PubMed, the Genecards database, and Gene
Ontology.TMA immunohistochemistry. We undertook immunohistochemical
analysis to identify at the protein level a selection of the statistically and
biologically significant genes obtained in the cDNA microarray study. This
was done in a TMA series of 127 vertical growth phase melanoma caseswith known follow-up. The proteins selected for validation featured the
group that proved to be biologically relevant in melanoma metastasis
development, including glypican 3 (polyclonal, Santa Cruz Biotechnology,
Santa Cruz, CA), N-cadherin (3B9, Zymed, San Francisco, CA), osteonectin/
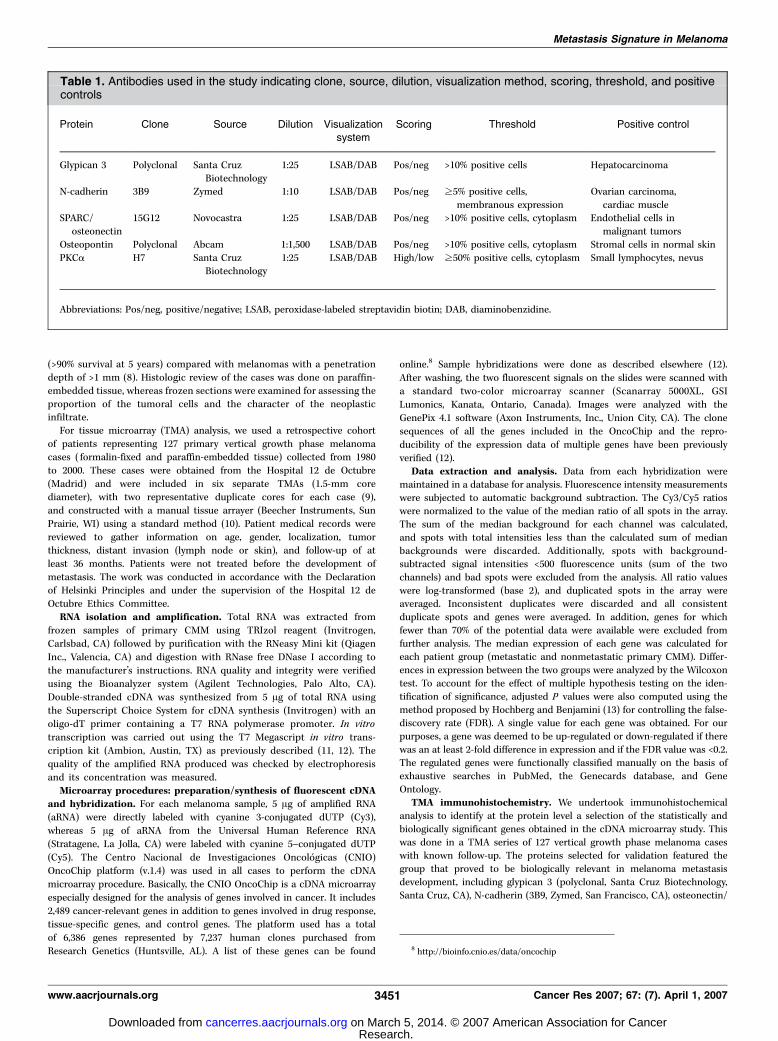
Table 1. Antibodies used in the study indicating clone, source, dilution, visualization method, scoring, threshold, and positivecontrols
Protein Clone Source Dilution Visualizationsystem
Scoring Threshold Positive control
Glypican 3 Polyclonal Santa CruzBiotechnology
1:25 LSAB/DAB Pos/neg >10% positive cells Hepatocarcinoma
N-cadherin 3B9 Zymed 1:10 LSAB/DAB Pos/neg z5% positive cells,
membranous expression
Ovarian carcinoma,
cardiac muscleSPARC/
osteonectin
15G12 Novocastra 1:25 LSAB/DAB Pos/neg >10% positive cells, cytoplasm Endothelial cells in
malignant tumors
Osteopontin Polyclonal Abcam 1:1,500 LSAB/DAB Pos/neg >10% positive cells, cytoplasm Stromal cells in normal skin
PKCa H7 Santa CruzBiotechnology
1:25 LSAB/DAB High/low z50% positive cells, cytoplasm Small lymphocytes, nevus
Abbreviations: Pos/neg, positive/negative; LSAB, peroxidase-labeled streptavidin biotin; DAB, diaminobenzidine.
8 http://bioinfo.cnio.es/data/oncochip
Metastasis Signature in Melanoma
www.aacrjournals.org 3451 Cancer Res 2007; 67: (7). April 1, 2007
Research. on March 5, 2014. © 2007 American Association for Cancercancerres.aacrjournals.org Downloaded from
SPARC (15G12, Novocastra, Newcastle, United Kingdom), osteopontin(polyclonal, Abcam, Novus Biologicals, Littleton, CO), and protein kinase
Ca (PKCa; H7, Santa Cruz Biotechnology, Santa Cruz, CA). A heat-induced,
epitope-retrieval step was done in a solution of sodium citrate buffer
(pH 6.5) in the case of osteonectin/SPARC, osteopontin, and PKCa, and withEDTA buffer in the case of glypican 3 and N-cadherin. The slides were then
heated for 2 min in a conventional pressure cooker and rinsed in cool
running water for 5 min. They were then quickly washed in TBS (pH 7.4),
and incubated with the selected primary antibodies glypican 3 (1:25),N-cadherin (1:10), osteonectin/SPARC (1:25), osteopontin (1:1500), and
PKCa (1:25). Immunodetection was done with biotinylated secondary
antibodies, followed by peroxidase-labeled streptavidin biotin (Dakocyto-
mation, Glostrup, Denmark) visualization in the case of glypican,osteopontin, and PKCa and Envision (Dakocytomation) for N-cadherin
and SPARC. Diaminobenzidine chromogen was used as peroxidase
substrate. All immunostaining was done in a TechMate 500 automaticimmunostaining device (DAKO, Glostrup, Denmark). Incubations omitting
the specific antibody were used as a control of the technique. Scoring of the
results and selection of the thresholds, internal controls for the antibodyreactivity, and tissue controls for the series were done according previously
published methods (9).
Scoring systems. Immunostaining results were evaluated by two
different pathologists (S.R.A. and J.L.R-P.) and scored using clear cutoffcriteria to facilitate the reproducibility of the method. Discrepancies were
resolved by simultaneous reevaluation. Briefly, the result was recorded as
positive or negative and high versus low expression, taking into account
the expression in tumoral cells and the specific cutoff for each marker(see Table 1 for description of thresholds). As a general criterion, the cutoffs
were selected to facilitate reproducibility and, when possible, to translate
biological events. Scoring for the sample replicates was highly reproducible
in this series (96%).Statistical analysis. To validate protein expression in the series analyzed
by TMA, the relationship between marker expression in the patient samples
and disease-free survival (DFS) curves were derived by the Kaplan-Meier method. Statistical significance of associations between individual
variables and DFS was determined using the log-rank test. Cox univariate
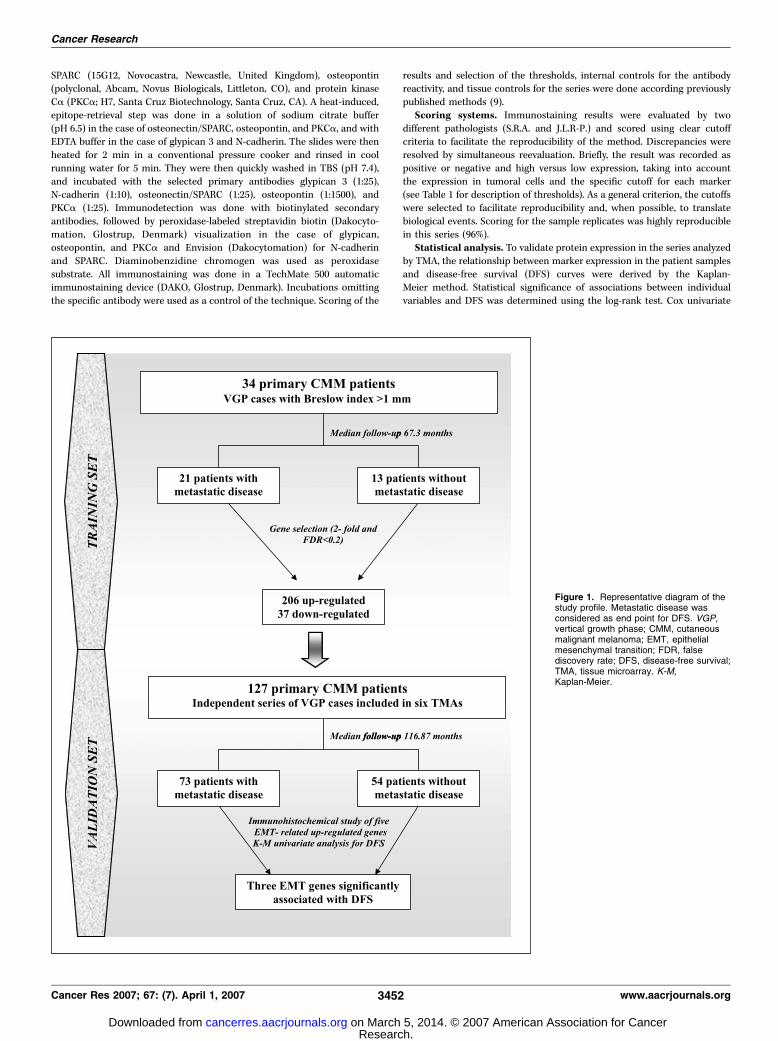
Figure 1. Representative diagram of thestudy profile. Metastatic disease wasconsidered as end point for DFS. VGP,vertical growth phase; CMM, cutaneousmalignant melanoma; EMT, epithelialmesenchymal transition; FDR, falsediscovery rate; DFS, disease-free survival;TMA, tissue microarray. K-M,Kaplan-Meier.
Cancer Research
Cancer Res 2007; 67: (7). April 1, 2007 3452 www.aacrjournals.org
Research. on March 5, 2014. © 2007 American Association for Cancercancerres.aacrjournals.org Downloaded from
proportional hazard analysis was also done independently for each variable.Significance was concluded for values of P < 0.05. All statistical tests were
two-sided. A multivariate model including the Breslow index as a
continuous variable was also developed by backward elimination. All
statistical analyses were carried out using the Stata statistical program(StataCorp 2001, release 9.0).
Results
Clinical features. The study included two sets of patients.The training set was composed of 34 patients (14 males and 20females) with primary vertical growth phase CMM and >1 mm(Breslow index). After a median follow-up of 67.3 months (range16–166 months), 21 developed metastasis (median 9.4 months,range 0.73–139).The validation set of patients, analyzed by TMAs, included 127
patients (57 males and 70 females) with primary vertical growthphase CMM and a median age at diagnosis of 60 years (range 21–91years). The median follow-up was 116.8 months (range 1–276.5months), during which 73 patients developed metastatic diseaseand 54 did not (median 52.7 months, range 1–222). Figure 1 showsan outline of the study.Global changes in gene expression between metastatic and
nonmetastatic primary vertical growth phase CMM cases. Toidentify genes that might be potential markers for melanomametastases, cDNA microarray studies were done to compareprimary invasive CMM cases with and without metastatic disease.
From the 5,253 clones, corresponding to 2,945 known genesand 1,984 expressed-sequence tags that were suitable for analysisafter filtering steps, 243 genes were differentially expressed(>2-fold, FDR<0.2) in primary vertical growth phase melanomaswith metastases compared with primary nonmetastatic verticalgrowth phase melanomas. Of these, 206 genes were up-regulatedand 37 genes were down-regulated (see Supplementary Table S1for details). These genes were categorized according to theirmain biological function and/or mechanism of action. As seen inTable 2, six biological process classes (cell cycle and apoptosis,EMT, immune modulation, metabolism, nucleic acid binding andtranscription, protein synthesis and degradation, and signaltransduction) were identified as relevant in our metastatic genesignature. A group of genes with unknown function was alsoidentified (see Supplementary Data for details). Figure 2 shows theexpression profile of the significant genes in the training seriesclassified by these gene-functional categories.Interestingly, one of the most important functional clusters
recognized here as markers of metastatic melanoma includedgenes involved in EMT, a category that includes genes associatedwith cell adhesion, cell motility, migration, and extracellular matrixinteraction and organization (Table 3). This cDNA microarrayscreening identified several genes involved in the EMT phenom-enon (N-cadherin, SPARC , and WNT receptor frizzled) and thephysical link between the actin cytoskeleton, the extracellularmatrix (mainly mediated by receptors of the integrin family, suchas integrin aV), and supporting vessels (endothelin receptor B).
Table 2. Functional categories of differentially expressed genes
Functional categories Gene name
Cell cycle and apoptosis MAPRE1, SKP1A, FAIM, PMP22, SET, CDKN1A, CDC5L, WEE1,
CASP5, DAD1, APEX1, VDAC1, BCCIP, CKS1B, CYC1, HBXIP,TP53I3, KIF11, BCL2L10, TOB2
EMT LUM, SDCBP, MFAP1, CTSB, PRKCA, RAB1A, H2-ALPHA, RRAGA,
TUBB3, CLIC4, SPARC, ANLN, RAN, ENC1, EMP1, DSG2, SEPP1,
ITGAV, TUBA2, HMMR, MASA, TUBA3, CX3CR1, CDH2, EDNRB,CSPG2, CD63, SMARCA1, KIT, KRT8, ANXA5, FGG, PFN1, SPA17,
FZD1, APLP2, SERPINA3, SEMA3B, MMP2, TUBA1, EDN2, PCDH9,
CDH10, WNT2, PAPPA
Immune modulation CXCL12, MAGEA6, IFITM2, CCBP2Metabolism PRDX5,VKORC1, ACADM, ALDH1A2, GLO1, HIBADH, PMM1, NDUFAB1,
NDUFB11, ENO1, MDH1, ACSL3, ATP6V0B, MGC4172, OSBP, PFKM,
SLC39A1, ATP6V0D1, YWHAQ, LRPAP1, ADK, SLC30A6, GGH, GSTA4,DCK, ATP5L2, LIPA, COX8A, CA9, AKR7A2, SCD, AK3L1, TXNRD1,
SLC25A17, NPC2, NDUFB3, PAICS, COX6B1, ADSL, CYP7B1, CYP19A1, IDS
Nucleic acid binding and transcription factors NCOA4, HIST1H4C, RBM4, MAP4K3, NOLA2, BZW1, ARID5B, CBFB,
POLR3K, TRIP3, RDBP, ASH2L, CDYL, XRCC5, HIST1H4B, KLF10,TCEB1, HIST1H3D, GTF2H2, FOXO1A, REST, OLIG2
Protein synthesis and degradation HSPA8, MRPL15, CCT5, EIF5, UBE2D2, MRPL37, MRPS10, RPL10A,
VBP1, RPS22, UBL5, CCT6A, GC20, EIF3S3, RPL35A, SECISBP2
Signal transduction CAV1, NME2, SRI, PPP1R3C, S100A10, WBP5, GABARAP, IGFBP1, PPP1R8,C11orf15, PRKAR1A, PGR1_GPR153, SEC5L1, CGI-141, MYB, SPRY2,
PPP2CB, STK24, GNG12, GRB2, MAL, SHB, DUSP12, TGFBR2, PC4,
IDE, CGA, IL1RL1, PPP2R5C, TIMM10, PDE5A, RABAC1, GIMAP6,
TXK, EPS15, NTF5, AKAP13
NOTE: Categories are based on Gene Cards, National Center for Biotechnology Information, HUGO gene nomenclature committee, and PubMed. EMT is
a category that includes genes associated with cell adhesion, cell motility, migration, and extracellular matrix organization.
Metastasis Signature in Melanoma
www.aacrjournals.org 3453 Cancer Res 2007; 67: (7). April 1, 2007
Research. on March 5, 2014. © 2007 American Association for Cancercancerres.aacrjournals.org Downloaded from
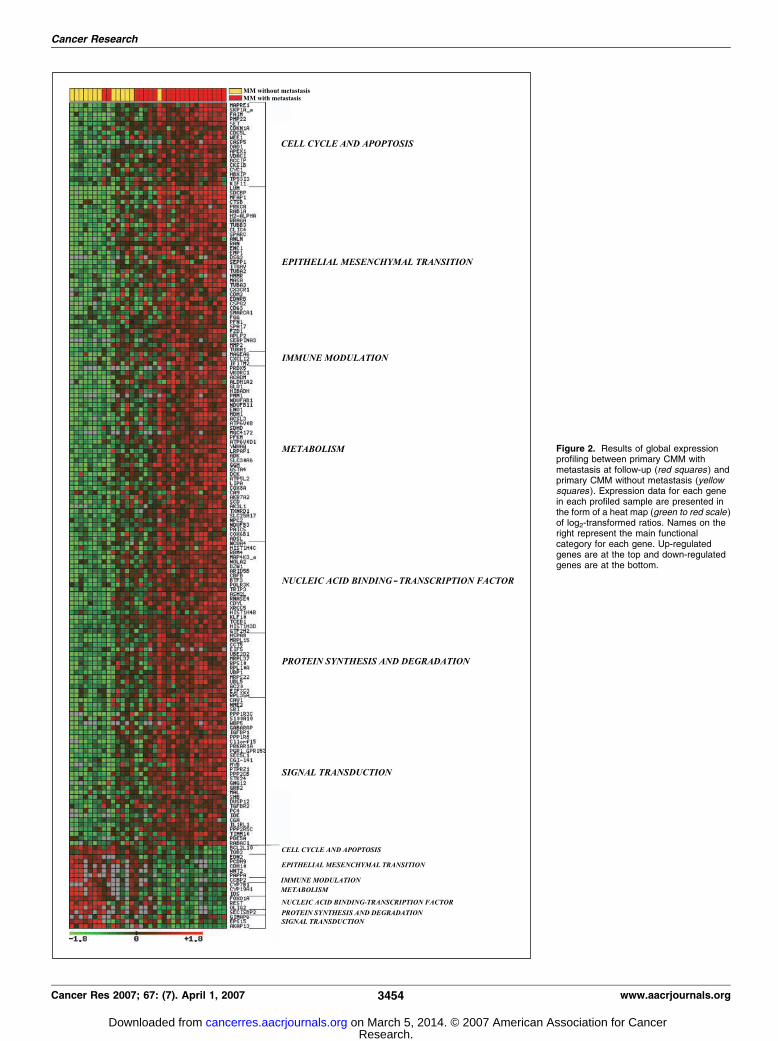
Figure 2. Results of global expressionprofiling between primary CMM withmetastasis at follow-up (red squares ) andprimary CMM without metastasis (yellowsquares ). Expression data for each genein each profiled sample are presented inthe form of a heat map (green to red scale )of log2-transformed ratios. Names on theright represent the main functionalcategory for each gene. Up-regulatedgenes are at the top and down-regulatedgenes are at the bottom.
Cancer Research
Cancer Res 2007; 67: (7). April 1, 2007 3454 www.aacrjournals.org
Research. on March 5, 2014. © 2007 American Association for Cancercancerres.aacrjournals.org Downloaded from
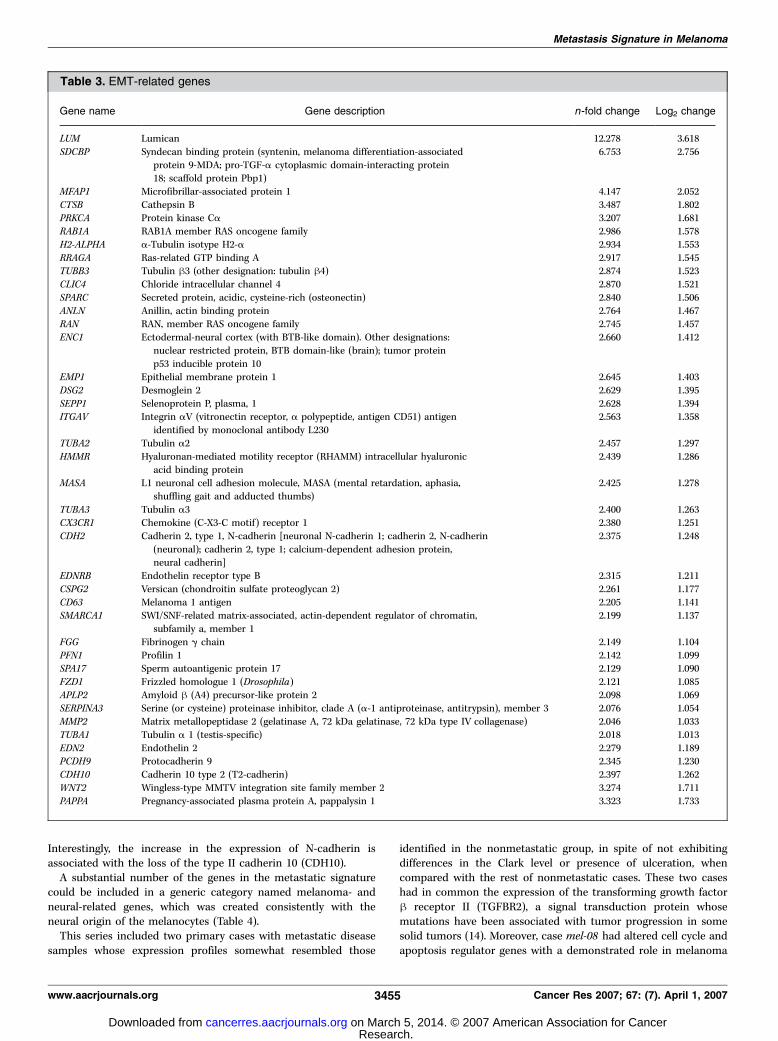
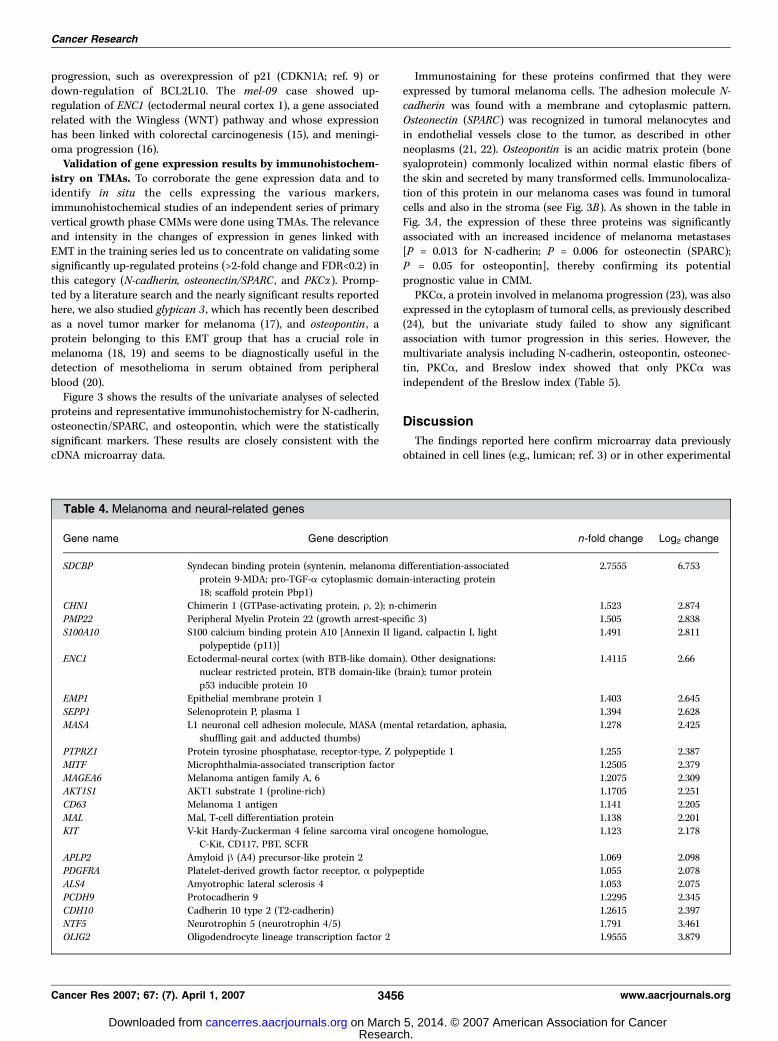
Interestingly, the increase in the expression of N-cadherin isassociated with the loss of the type II cadherin 10 (CDH10).A substantial number of the genes in the metastatic signature
could be included in a generic category named melanoma- andneural-related genes, which was created consistently with theneural origin of the melanocytes (Table 4).This series included two primary cases with metastatic disease
samples whose expression profiles somewhat resembled those
identified in the nonmetastatic group, in spite of not exhibitingdifferences in the Clark level or presence of ulceration, whencompared with the rest of nonmetastatic cases. These two caseshad in common the expression of the transforming growth factorh receptor II (TGFBR2), a signal transduction protein whosemutations have been associated with tumor progression in somesolid tumors (14). Moreover, case mel-08 had altered cell cycle andapoptosis regulator genes with a demonstrated role in melanoma
Table 3. EMT-related genes
Gene name Gene description n-fold change Log2 change
LUM Lumican 12.278 3.618
SDCBP Syndecan binding protein (syntenin, melanoma differentiation-associated
protein 9-MDA; pro-TGF-a cytoplasmic domain-interacting protein18; scaffold protein Pbp1)
6.753 2.756
MFAP1 Microfibrillar-associated protein 1 4.147 2.052
CTSB Cathepsin B 3.487 1.802PRKCA Protein kinase Ca 3.207 1.681
RAB1A RAB1A member RAS oncogene family 2.986 1.578
H2-ALPHA a-Tubulin isotype H2-a 2.934 1.553
RRAGA Ras-related GTP binding A 2.917 1.545TUBB3 Tubulin h3 (other designation: tubulin h4) 2.874 1.523
CLIC4 Chloride intracellular channel 4 2.870 1.521
SPARC Secreted protein, acidic, cysteine-rich (osteonectin) 2.840 1.506
ANLN Anillin, actin binding protein 2.764 1.467RAN RAN, member RAS oncogene family 2.745 1.457
ENC1 Ectodermal-neural cortex (with BTB-like domain). Other designations:
nuclear restricted protein, BTB domain-like (brain); tumor protein
p53 inducible protein 10
2.660 1.412
EMP1 Epithelial membrane protein 1 2.645 1.403
DSG2 Desmoglein 2 2.629 1.395
SEPP1 Selenoprotein P, plasma, 1 2.628 1.394ITGAV Integrin aV (vitronectin receptor, a polypeptide, antigen CD51) antigen
identified by monoclonal antibody L230
2.563 1.358
TUBA2 Tubulin a2 2.457 1.297
HMMR Hyaluronan-mediated motility receptor (RHAMM) intracellular hyaluronicacid binding protein
2.439 1.286
MASA L1 neuronal cell adhesion molecule, MASA (mental retardation, aphasia,
shuffling gait and adducted thumbs)
2.425 1.278
TUBA3 Tubulin a3 2.400 1.263CX3CR1 Chemokine (C-X3-C motif) receptor 1 2.380 1.251
CDH2 Cadherin 2, type 1, N-cadherin [neuronal N-cadherin 1; cadherin 2, N-cadherin
(neuronal); cadherin 2, type 1; calcium-dependent adhesion protein,neural cadherin]
2.375 1.248
EDNRB Endothelin receptor type B 2.315 1.211
CSPG2 Versican (chondroitin sulfate proteoglycan 2) 2.261 1.177
CD63 Melanoma 1 antigen 2.205 1.141SMARCA1 SWI/SNF-related matrix-associated, actin-dependent regulator of chromatin,
subfamily a, member 1
2.199 1.137
FGG Fibrinogen g chain 2.149 1.104
PFN1 Profilin 1 2.142 1.099SPA17 Sperm autoantigenic protein 17 2.129 1.090
FZD1 Frizzled homologue 1 (Drosophila) 2.121 1.085
APLP2 Amyloid h (A4) precursor-like protein 2 2.098 1.069SERPINA3 Serine (or cysteine) proteinase inhibitor, clade A (a-1 antiproteinase, antitrypsin), member 3 2.076 1.054
MMP2 Matrix metallopeptidase 2 (gelatinase A, 72 kDa gelatinase, 72 kDa type IV collagenase) 2.046 1.033
TUBA1 Tubulin a 1 (testis-specific) 2.018 1.013
EDN2 Endothelin 2 �2.279 �1.189PCDH9 Protocadherin 9 �2.345 �1.230CDH10 Cadherin 10 type 2 (T2-cadherin) �2.397 �1.262WNT2 Wingless-type MMTV integration site family member 2 �3.274 �1.711PAPPA Pregnancy-associated plasma protein A, pappalysin 1 �3.323 �1.733
Metastasis Signature in Melanoma
www.aacrjournals.org 3455 Cancer Res 2007; 67: (7). April 1, 2007
Research. on March 5, 2014. © 2007 American Association for Cancercancerres.aacrjournals.org Downloaded from
progression, such as overexpression of p21 (CDKN1A; ref. 9) ordown-regulation of BCL2L10. The mel-09 case showed up-regulation of ENC1 (ectodermal neural cortex 1), a gene associatedrelated with the Wingless (WNT) pathway and whose expressionhas been linked with colorectal carcinogenesis (15), and meningi-oma progression (16).Validation of gene expression results by immunohistochem-
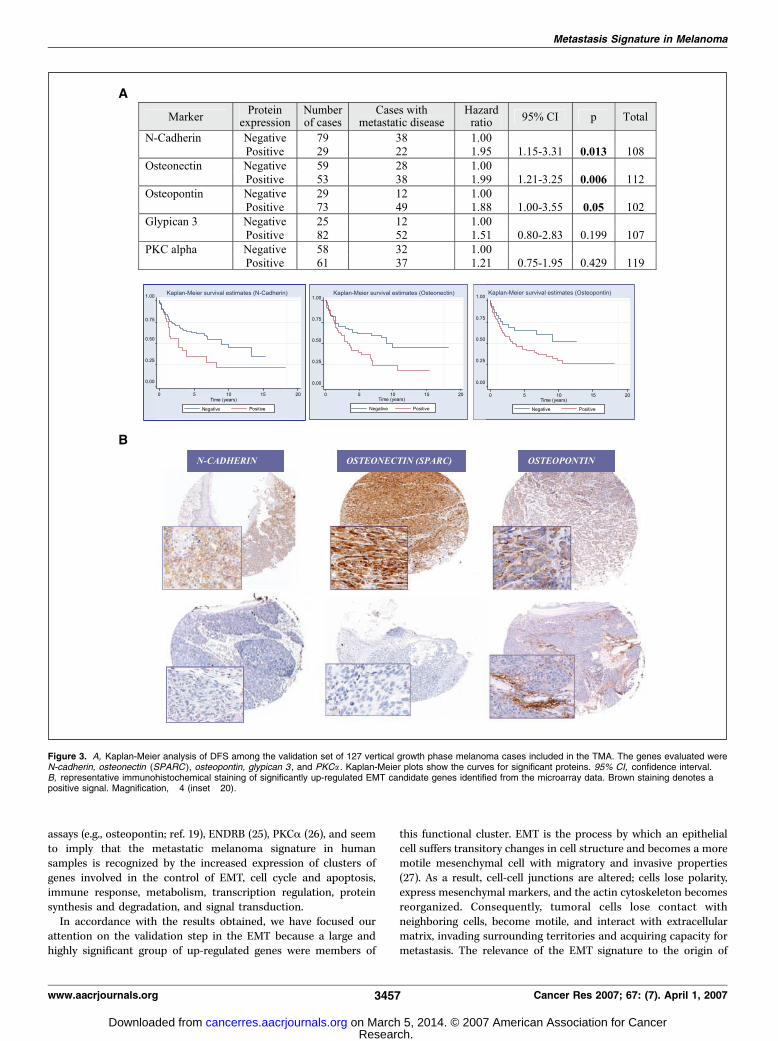
istry on TMAs. To corroborate the gene expression data and toidentify in situ the cells expressing the various markers,immunohistochemical studies of an independent series of primaryvertical growth phase CMMs were done using TMAs. The relevanceand intensity in the changes of expression in genes linked withEMT in the training series led us to concentrate on validating somesignificantly up-regulated proteins (>2-fold change and FDR<0.2) inthis category (N-cadherin, osteonectin/SPARC , and PKCa). Promp-ted by a literature search and the nearly significant results reportedhere, we also studied glypican 3 , which has recently been describedas a novel tumor marker for melanoma (17), and osteopontin , aprotein belonging to this EMT group that has a crucial role inmelanoma (18, 19) and seems to be diagnostically useful in thedetection of mesothelioma in serum obtained from peripheralblood (20).Figure 3 shows the results of the univariate analyses of selected
proteins and representative immunohistochemistry for N-cadherin,osteonectin/SPARC, and osteopontin, which were the statisticallysignificant markers. These results are closely consistent with thecDNA microarray data.
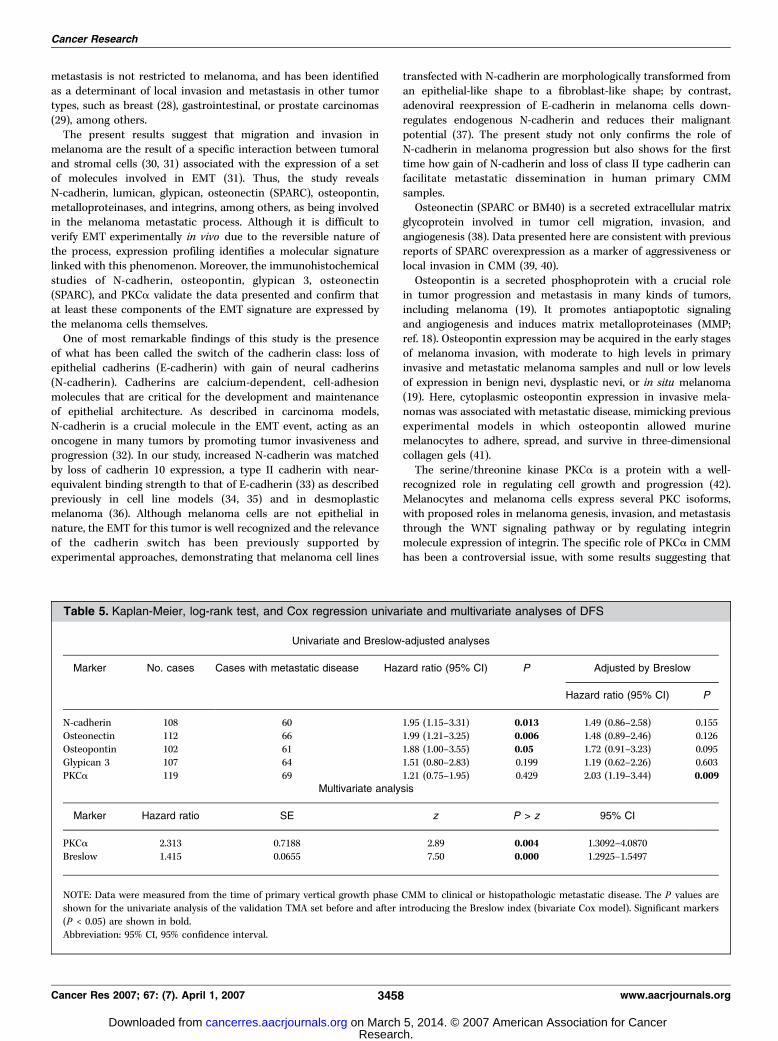
Immunostaining for these proteins confirmed that they wereexpressed by tumoral melanoma cells. The adhesion molecule N-cadherin was found with a membrane and cytoplasmic pattern.Osteonectin (SPARC) was recognized in tumoral melanocytes andin endothelial vessels close to the tumor, as described in otherneoplasms (21, 22). Osteopontin is an acidic matrix protein (bonesyaloprotein) commonly localized within normal elastic fibers ofthe skin and secreted by many transformed cells. Immunolocaliza-tion of this protein in our melanoma cases was found in tumoralcells and also in the stroma (see Fig. 3B). As shown in the table inFig. 3A , the expression of these three proteins was significantlyassociated with an increased incidence of melanoma metastases[P = 0.013 for N-cadherin; P = 0.006 for osteonectin (SPARC);P = 0.05 for osteopontin], thereby confirming its potentialprognostic value in CMM.PKCa, a protein involved in melanoma progression (23), was also
expressed in the cytoplasm of tumoral cells, as previously described(24), but the univariate study failed to show any significantassociation with tumor progression in this series. However, themultivariate analysis including N-cadherin, osteopontin, osteonec-tin, PKCa, and Breslow index showed that only PKCa wasindependent of the Breslow index (Table 5).
Discussion
The findings reported here confirm microarray data previouslyobtained in cell lines (e.g., lumican; ref. 3) or in other experimental
Table 4. Melanoma and neural-related genes
Gene name Gene description n-fold change Log2 change
SDCBP Syndecan binding protein (syntenin, melanoma differentiation-associated
protein 9-MDA; pro-TGF-a cytoplasmic domain-interacting protein
18; scaffold protein Pbp1)
2.7555 6.753
CHN1 Chimerin 1 (GTPase-activating protein, U, 2); n-chimerin 1.523 2.874
PMP22 Peripheral Myelin Protein 22 (growth arrest-specific 3) 1.505 2.838
S100A10 S100 calcium binding protein A10 [Annexin II ligand, calpactin I, lightpolypeptide (p11)]
1.491 2.811
ENC1 Ectodermal-neural cortex (with BTB-like domain). Other designations:
nuclear restricted protein, BTB domain-like (brain); tumor protein
p53 inducible protein 10
1.4115 2.66
EMP1 Epithelial membrane protein 1 1.403 2.645
SEPP1 Selenoprotein P, plasma 1 1.394 2.628
MASA L1 neuronal cell adhesion molecule, MASA (mental retardation, aphasia,
shuffling gait and adducted thumbs)
1.278 2.425
PTPRZ1 Protein tyrosine phosphatase, receptor-type, Z polypeptide 1 1.255 2.387
MITF Microphthalmia-associated transcription factor 1.2505 2.379
MAGEA6 Melanoma antigen family A, 6 1.2075 2.309AKT1S1 AKT1 substrate 1 (proline-rich) 1.1705 2.251
CD63 Melanoma 1 antigen 1.141 2.205
MAL Mal, T-cell differentiation protein 1.138 2.201
KIT V-kit Hardy-Zuckerman 4 feline sarcoma viral oncogene homologue,C-Kit, CD117, PBT, SCFR
1.123 2.178
APLP2 Amyloid h (A4) precursor-like protein 2 1.069 2.098
PDGFRA Platelet-derived growth factor receptor, a polypeptide 1.055 2.078
ALS4 Amyotrophic lateral sclerosis 4 1.053 2.075PCDH9 Protocadherin 9 �1.2295 �2.345CDH10 Cadherin 10 type 2 (T2-cadherin) �1.2615 �2.397NTF5 Neurotrophin 5 (neurotrophin 4/5) �1.791 �3.461OLIG2 Oligodendrocyte lineage transcription factor 2 �1.9555 �3.879
Cancer Research
Cancer Res 2007; 67: (7). April 1, 2007 3456 www.aacrjournals.org
Research. on March 5, 2014. © 2007 American Association for Cancercancerres.aacrjournals.org Downloaded from
assays (e.g., osteopontin; ref. 19), ENDRB (25), PKCa (26), and seemto imply that the metastatic melanoma signature in humansamples is recognized by the increased expression of clusters ofgenes involved in the control of EMT, cell cycle and apoptosis,immune response, metabolism, transcription regulation, proteinsynthesis and degradation, and signal transduction.In accordance with the results obtained, we have focused our
attention on the validation step in the EMT because a large andhighly significant group of up-regulated genes were members of
this functional cluster. EMT is the process by which an epithelialcell suffers transitory changes in cell structure and becomes a moremotile mesenchymal cell with migratory and invasive properties(27). As a result, cell-cell junctions are altered; cells lose polarity,express mesenchymal markers, and the actin cytoskeleton becomesreorganized. Consequently, tumoral cells lose contact withneighboring cells, become motile, and interact with extracellularmatrix, invading surrounding territories and acquiring capacity formetastasis. The relevance of the EMT signature to the origin of
Figure 3. A, Kaplan-Meier analysis of DFS among the validation set of 127 vertical growth phase melanoma cases included in the TMA. The genes evaluated wereN-cadherin, osteonectin (SPARC ), osteopontin, glypican 3 , and PKCa . Kaplan-Meier plots show the curves for significant proteins. 95% CI, confidence interval.B, representative immunohistochemical staining of significantly up-regulated EMT candidate genes identified from the microarray data. Brown staining denotes apositive signal. Magnification, �4 (inset �20).
Metastasis Signature in Melanoma
www.aacrjournals.org 3457 Cancer Res 2007; 67: (7). April 1, 2007
Research. on March 5, 2014. © 2007 American Association for Cancercancerres.aacrjournals.org Downloaded from
metastasis is not restricted to melanoma, and has been identifiedas a determinant of local invasion and metastasis in other tumortypes, such as breast (28), gastrointestinal, or prostate carcinomas(29), among others.The present results suggest that migration and invasion in
melanoma are the result of a specific interaction between tumoraland stromal cells (30, 31) associated with the expression of a setof molecules involved in EMT (31). Thus, the study revealsN-cadherin, lumican, glypican, osteonectin (SPARC), osteopontin,metalloproteinases, and integrins, among others, as being involvedin the melanoma metastatic process. Although it is difficult toverify EMT experimentally in vivo due to the reversible nature ofthe process, expression profiling identifies a molecular signaturelinked with this phenomenon. Moreover, the immunohistochemicalstudies of N-cadherin, osteopontin, glypican 3, osteonectin(SPARC), and PKCa validate the data presented and confirm thatat least these components of the EMT signature are expressed bythe melanoma cells themselves.One of most remarkable findings of this study is the presence
of what has been called the switch of the cadherin class: loss ofepithelial cadherins (E-cadherin) with gain of neural cadherins(N-cadherin). Cadherins are calcium-dependent, cell-adhesionmolecules that are critical for the development and maintenanceof epithelial architecture. As described in carcinoma models,N-cadherin is a crucial molecule in the EMT event, acting as anoncogene in many tumors by promoting tumor invasiveness andprogression (32). In our study, increased N-cadherin was matchedby loss of cadherin 10 expression, a type II cadherin with near-equivalent binding strength to that of E-cadherin (33) as describedpreviously in cell line models (34, 35) and in desmoplasticmelanoma (36). Although melanoma cells are not epithelial innature, the EMT for this tumor is well recognized and the relevanceof the cadherin switch has been previously supported byexperimental approaches, demonstrating that melanoma cell lines
transfected with N-cadherin are morphologically transformed froman epithelial-like shape to a fibroblast-like shape; by contrast,adenoviral reexpression of E-cadherin in melanoma cells down-regulates endogenous N-cadherin and reduces their malignantpotential (37). The present study not only confirms the role ofN-cadherin in melanoma progression but also shows for the firsttime how gain of N-cadherin and loss of class II type cadherin canfacilitate metastatic dissemination in human primary CMMsamples.Osteonectin (SPARC or BM40) is a secreted extracellular matrix
glycoprotein involved in tumor cell migration, invasion, andangiogenesis (38). Data presented here are consistent with previousreports of SPARC overexpression as a marker of aggressiveness orlocal invasion in CMM (39, 40).Osteopontin is a secreted phosphoprotein with a crucial role
in tumor progression and metastasis in many kinds of tumors,including melanoma (19). It promotes antiapoptotic signalingand angiogenesis and induces matrix metalloproteinases (MMP;ref. 18). Osteopontin expression may be acquired in the early stagesof melanoma invasion, with moderate to high levels in primaryinvasive and metastatic melanoma samples and null or low levelsof expression in benign nevi, dysplastic nevi, or in situ melanoma(19). Here, cytoplasmic osteopontin expression in invasive mela-nomas was associated with metastatic disease, mimicking previousexperimental models in which osteopontin allowed murinemelanocytes to adhere, spread, and survive in three-dimensionalcollagen gels (41).The serine/threonine kinase PKCa is a protein with a well-
recognized role in regulating cell growth and progression (42).Melanocytes and melanoma cells express several PKC isoforms,with proposed roles in melanoma genesis, invasion, and metastasisthrough the WNT signaling pathway or by regulating integrinmolecule expression of integrin. The specific role of PKCa in CMMhas been a controversial issue, with some results suggesting that
Table 5. Kaplan-Meier, log-rank test, and Cox regression univariate and multivariate analyses of DFS
Univariate and Breslow-adjusted analyses
Marker No. cases Cases with metastatic disease Hazard ratio (95% CI) P Adjusted by Breslow
Hazard ratio (95% CI) P
N-cadherin 108 60 1.95 (1.15–3.31) 0.013 1.49 (0.86–2.58) 0.155
Osteonectin 112 66 1.99 (1.21–3.25) 0.006 1.48 (0.89–2.46) 0.126
Osteopontin 102 61 1.88 (1.00–3.55) 0.05 1.72 (0.91–3.23) 0.095Glypican 3 107 64 1.51 (0.80–2.83) 0.199 1.19 (0.62–2.26) 0.603
PKCa 119 69 1.21 (0.75–1.95) 0.429 2.03 (1.19–3.44) 0.009Multivariate analysis
Marker Hazard ratio SE z P > z 95% CI
PKCa 2.313 0.7188 2.89 0.004 1.3092–4.0870
Breslow 1.415 0.0655 7.50 0.000 1.2925–1.5497
NOTE: Data were measured from the time of primary vertical growth phase CMM to clinical or histopathologic metastatic disease. The P values areshown for the univariate analysis of the validation TMA set before and after introducing the Breslow index (bivariate Cox model). Significant markers
(P < 0.05) are shown in bold.
Abbreviation: 95% CI, 95% confidence interval.
Cancer Research
Cancer Res 2007; 67: (7). April 1, 2007 3458 www.aacrjournals.org
Research. on March 5, 2014. © 2007 American Association for Cancercancerres.aacrjournals.org Downloaded from
PKCa and PKCy isoforms suppress cell growth, whereas othersimply its involvement in cell motility (42, 43) or in metastasispromotion (44). Expression profiling data in this series identifiesPKCa as one of the genes up-regulated in melanoma withmetastasis, and the multivariate analysis showed that it is Breslowindependent, implying that there is a relationship between tumorgrowth and proliferation. This awaits further investigation.
Lumican , the most highly up-regulated gene in melanoma caseswith metastasis, is a proteoglycan of the extracellular matrixinvolved in collagen-fiber organization, epithelial-cell migration,and tissue repair. Lumican is an established EMT marker (45)whose protein expression level is associated with tumorigenesisand progression in a variety of tumors (46, 47). Data presented hereare also consistent with those obtained from the comparison ofnormal melanocytes with melanoma cell strains from advancedlesions (3).Cell-matrix interactions are closely related to EMT category. The
integrins are a family of cell surface adhesion molecules thatcoordinate cell-cell and cell-matrix interactions. This studyidentified up-regulation of integrin aV (ITGAV ) as a marker ofmelanoma metastases, confirming a previous report (48). Closelyrelated are the MMP family of proteins, which are involved in thebreakdown of the extracellular matrix in normal physiologicprocesses and in cancer invasion and metastasis. Here, MMP2(which degrades type IV collagen) and ADAM9 (disintegrin andmetalloproteinase domain 9) are associated with melanomaprogression, confirming previous findings regarding invasion (49).Two of the metastatic cases analyzed here (mel-08 and mel-09)
displayed a nonmetastatic phenotype, with the exception of theincreased expression of TGFBR2, p21 (CDKN1A), or ENC1. It isknown that melanoma and endothelial cells express type 2 TGF-hreceptor (50), which can enhance adhesion of melanoma cells toendothelium and favor invasion through activation of the TGF-hpathway. In the same way, p21 overexpression has been proposedas a marker of melanoma progression (9). The specific relevance of
each functional cluster of genes, as identified here, requires furtherstudy, both in human samples and experimental models.Interestingly, the multivariate study showed that three of the
protein markers analyzed in TMA were associated with localinvasion and metastasis, thereby linking the two phenomena.Overall, our results lead us to propose that metastasis in melanomais determined by the interaction of sets of molecules involved inthe regulation of EMT immune response, cell metabolism, nucleicacid binding and transcription, protein synthesis and degradation,and signal transduction. Moreover, validation of protein expressionin TMA confirms how some of the up-regulated genes arepredictors of metastasis development. Taking all our results intoconsideration, it seems that the control of the EMT plays a pivotalrole in the metastatic process in melanoma. This confirms andbuilds on findings linking EMT genes with melanoma progressionobtained in experimental models and human samples studies, suchas cadherins, MMPs, integrins, lumican, osteopontin, EDNRB, Snail,and others (6, 49).
Acknowledgments
Received 9/19/2006; revised 1/17/2007; accepted 1/31/2007.Grant support: FIS grant PI 040641, MMA 2005-085, and European Commission
(Translational and Functional Onco-Genomics) grant LSHC-CT-2004-503438. S.R.Alonso was supported in part by FIS grant CM03/00034 and by the CNIO (Madrid,Spain). L. Tracey received support though grants from the CNIO and the HigherEducation Authority of Ireland through the Department of Haematology/Institute ofMolecular Medicine, St. James Hospital, Dublin, Ireland.
The costs of publication of this article were defrayed in part by the payment of pagecharges. This article must therefore be hereby marked advertisement in accordancewith 18 U.S.C. Section 1734 solely to indicate this fact.
We thank the Tumour Bank of the Hospital San Cecilio; the Spanish NationalTumour Bank Network, CNIO; Laura Cereceda (CNIO) and Alicia Maroto (CNIO,Hospital 12 de Octubre) for their valuable help in providing specific tissue samples forthis study; Pilar Sandoval (CNIO, Hospital Gregorio Maranon) for her time withgridding; Dr. David Hardisson and Raquel Marcos (CNIO, Hospital Universitario LaPaz) for helping with the SPARC immunostaining; Ramon Diaz for helping with theWilcoxon test; Amancio Carnero for their valuable guidance with gene classification;and Phil Mason for his help with the English edition of the final version of themanuscript.
References1. Zhang L, Zhou W, Velculescu VE, et al. Geneexpression profiles in normal and cancer cells. Science1997;276:1268–72.
2. Bittner M, Meltzer P, Chen Y, et al. Molecularclassification of cutaneous malignant melanoma bygene expression profiling. Nature 2000;406:536–40.
3. Hoek K, Rimm DL, Williams KR, et al. Expressionprofiling reveals novel pathways in the transformationof melanocytes to melanomas. Cancer Res 2004;64:5270–82.
4. McGill GG, Horstmann M, Widlund HR, et al. Bcl2regulation by the melanocyte master regulator Mitfmodulates lineage survival and melanoma cell viability.Cell 2002;109:707–18.
5. Haqq C, Nosrati M, Sudilovsky D, et al. The geneexpression signatures of melanoma progression. ProcNatl Acad Sci U S A 2005;102:6092–7.
6. Winnepenninckx V, Lazar V, Michiels S, et al. Geneexpression profiling of primary cutaneous melanomaand clinical outcome. J Natl Cancer Inst 2006;98:472–82.
7. Talantov D, Mazumder A, Yu JX, et al. Novel genesassociated with malignant melanoma but not benignmelanocytic lesions. Clin Cancer Res 2005;11:7234–42.
8. Retsas S, Henry K, Mohammed MQ, et al. Prognosticfactors of cutaneous melanoma and a new stagingsystem proposed by the American Joint Committee onCancer (AJCC): validation in a cohort of 1284 patients.Eur J Cancer 2002;38:511–6.
9. Alonso SR, Ortiz P, Pollan M, et al. Progression incutaneous malignant melanoma is associated withdistinct expression profiles: a tissue microarray-basedstudy. Am J Pathol 2004;164:193–203.
10. Rimm DL, Camp RL, Charette LA, et al. Tissuemicroarray: a new technology for amplification of tissueresources. Cancer J 2001;7:24–31.
11. Eberwine J. Amplification of mRNA populationsusing aRNA generated from immobilized oligo(dT)-T7primed cDNA. Biotechniques 1996;20:584–91.
12. Tracey L, Villuendas R, Ortiz P, et al. Identification ofgenes involved in resistance to interferon-a in cutane-ous T-cell lymphoma. Am J Pathol 2002;161:1825–37.
13. Benjamini Y, Yekutieli D. Quantitative trait Locianalysis using the false discovery rate. Genetics 2005;171:783–90.
14. Fernandez-Peralta AM, Nejda N, Oliart S, et al.Significance of mutations in TGFBR2 and BAX inneoplastic progression and patient outcome in sporadiccolorectal tumors with high-frequency microsatelliteinstability. Cancer Genet Cytogenet 2005;157:18–24.
15. Fujita M, Furukawa Y, Tsunoda T, et al. Up-regulationof the ectodermal-neural cortex 1 (ENC1) gene, adownstream target of the h-catenin/T-cell factorcomplex, in colorectal carcinomas. Cancer Res 2001;61:7722–6.
16. Wrobel G, Roerig P, Kokocinski F, et al. Microarray-based gene expression profiling of benign, atypical andanaplastic meningiomas identifies novel genes associ-ated with meningioma progression. Int J Cancer 2005;114:249–56.
17. Nakatsura T, Kageshita T, Ito S, et al. Identification ofglypican-3 as a novel tumor marker for melanoma. ClinCancer Res 2004;10:6612–21.
18. Samanna V, Wei H, Ego-Osuala D, et al. a-V-dependent outside-in signaling is required for theregulation of CD44 surface expression, MMP-2 secre-tion, and cell migration by osteopontin in humanmelanoma cells. Exp Cell Res 2006;312:2214–30.
19. Zhou Y, Dai DL, Martinka M, et al. Osteopontinexpression correlates with melanoma invasion. J InvestDermatol 2005;124:1044–52.
20. Pass HI, Lott D, Lonardo F, et al. Asbestos exposure,pleural mesothelioma, and serum osteopontin levels.N Engl J Med 2005;353:1564–73.
21. Chen X, Higgins J, Cheung ST, et al. Novel endothelialcell markers in hepatocellular carcinoma. Mod Pathol2004;17:1198–210.
22. Kato Y, Lewalle JM, Baba Y, et al. Induction of SPARCby VEGF in human vascular endothelial cells. BiochemBiophys Res Commun 2001;287:422–6.
23. Gruber JR, Desai S, Blusztajn JK, et al. Retinoic acidspecifically increases nuclear PKC a and stimulatesAP-1 transcriptional activity in B16 mouse melanomacells. Exp Cell Res 1995;221:377–84.
24. Timar J, Liu B, Bazaz R, et al. Association of proteinkinase-C-a with cytoplasmic vesicles in melanoma cells.J Histochem Cytochem 1996;44:177–82.
25. Lahav R, Endothelin receptor B is required for theexpansion of melanocyte precursors and malignantmelanoma. Int J Dev Biol 2005;49:173–80.
26. Lahn MM, Sundell KL. The role of protein kinase
Metastasis Signature in Melanoma
www.aacrjournals.org 3459 Cancer Res 2007; 67: (7). April 1, 2007
Research. on March 5, 2014. © 2007 American Association for Cancercancerres.aacrjournals.org Downloaded from

C-a (PKC-a) in melanoma. Melanoma Res 2004;14:85–9.
27. Grunert S, Jechlinger M, Beug H. Diverse cellular andmolecular mechanisms contribute to epithelial plasticityand metastasis. Nat Rev Mol Cell Biol 2003;4:657–65.
28. Blanco MJ, Moreno-Bueno G, Sarrio D, et al.Correlation of Snail expression with histological gradeand lymph node status in breast carcinomas. Oncogene2002;21:3241–6.
29. Tomita K, van Bokhoven A, van Leenders GJ, et al.Cadherin switching in human prostate cancer progres-sion. Cancer Res 2000;60:3650–4.
30. Hendrix MJ, Seftor EA, Kirschmann DA, et al.Remodeling of the microenvironment by aggressivemelanoma tumor cells. Ann N Y Acad Sci 2003;995:151–61.
31. Johnson JP. Cell adhesion molecules in the develop-ment and progression of malignant melanoma. CancerMetastasis Rev 1999;18:345–57.
32. Hazan RB, Phillips GR, Qiao RF, et al. Exogenousexpression of N-cadherin in breast cancer cells inducescell migration, invasion, and metastasis. J Cell Biol 2000;148:779–90.
33. Shimoyama Y, Tsujimoto G, Kitajima M, et al.Identification of three human type-II classic cadherinsand frequent heterophilic interactions between differentsubclasses of type-II classic cadherins. Biochem J 2000;349:159–67.
34. Hsu MY, Meier FE, Nesbit M, et al. E-cadherinexpression in melanoma cells restores keratinocyte-mediated growth control and down-regulates expres-
sion of invasion-related adhesion receptors. Am J Pathol2000;156:1515–25.
35. Hsu MY, Wheelock MJ, Johnson KR, et al. Shifts incadherin profiles between human normal melanocytesand melanomas. J Investig Dermatol Symp Proc 1996;1:188–94.
36. Gallego Attis M, Burchette JL, Angelica Selim M, et al.Differential expression of N-cadherin distinguishesaggressive spindle cell melanomas from desmoplasticmelanomas. Am J Dermatopathol 2006;28:232.
37. Krengel S, Groteluschen F, Bartsch S, et al. Cadherinexpression pattern in melanocytic tumors more likelydepends on the melanocyte environment than on tumorcell progression. J Cutan Pathol 2004;31:1–7.
38. Jendraschak E, Sage EH. Regulation of angiogenesisby SPARC and angiostatin: implications for tumor cellbiology. Semin Cancer Biol 1996;7:139–46.
39. Rumpler G, Becker B, Hafner C, et al. Identification ofdifferentially expressed genes in models of melanomaprogression by cDNA array analysis: SPARC, MIF and anovel cathepsin protease characterize aggressive phe-notypes. Exp Dermatol 2003;12:761–71.
40. Ledda F, Bravo AI, Adris S, et al. The expressionof the secreted protein acidic and rich in cysteine(SPARC) is associated with the neoplastic progres-sion of human melanoma. J Invest Dermatol 1997;108:210–4.
41. Geissinger E, Weisser C, Fischer P, et al. Autocrinestimulation by osteopontin contributes to antiapoptoticsignalling of melanocytes in dermal collagen. CancerRes 2002;62:4820–8.
42. Oka M, Kikkawa U. Protein kinase C in melanoma.Cancer Metastasis Rev 2005;24:287–300.
43. Szalay J, Bruno P, Bhati R, et al. Associations of PKCisoforms with the cytoskeleton of B16F10 melanomacells. J Histochem Cytochem 2001;49:49–66.
44. Dennis JU, Dean NM, Bennett CF, et al. Humanmelanoma metastasis is inhibited following ex vivotreatment with an antisense oligonucleotide to proteinkinase C-a. Cancer Lett 1998;128:65–70.
45. Saika S, Kono-Saika S, Ohnishi Y, et al. Smad3signaling is required for epithelial-mesenchymal transi-tion of lens epithelium after injury. Am J Pathol 2004;164:651–63.
46. Ping Lu Y, Ishiwata T, Asano G. Lumican expressionin a cells of islets in pancreas and pancreatic cancercells. J Pathol 2002;196:324–30.
47. Naito Z, Ishiwata T, Kurban G, et al. Expression andaccumulation of lumican protein in uterine cervicalcancer cells at the periphery of cancer nests. Int J Oncol2002;20:943–8.
48. Kageshita T, Hamby CV, Hirai S, et al. a(v)h3 expres-sion on blood vessels and melanoma cells in primarylesions: differential association with tumor progressionand clinical prognosis. Cancer Immunol Immunother2000;49:314–8.
49. Redondo P, Lloret P, Idoate M, et al. Expression andserum levels of MMP-2 and MMP-9 during humanmelanoma progression. Clin Exp Dermatol 2005;30:541–5.
50. Teti A, De Giorgi A, Spinella MT, et al. Transforminggrowth factor-h enhances adhesion of melanoma cells tothe endothelium in vitro . Int J Cancer 1997;72:1013–20.
Cancer Research
Cancer Res 2007; 67: (7). April 1, 2007 3460 www.aacrjournals.org
Research. on March 5, 2014. © 2007 American Association for Cancercancerres.aacrjournals.org Downloaded from