THE DETERMINANT FACTORS OF SCHOOL CHOICE AND ...
140
Bachelor Thesis Spring Semester 2007 Supervisor: Per Nilsson Author: Fabian Wrede THE DETERMINANT FACTORS OF SCHOOL CHOICE AND STUDENTS’ PERCEPTION(S) OF USBE – Finding Out What Really Counts for Prospective Students
-
Upload
khangminh22 -
Category
Documents
-
view
0 -
download
0
Transcript of THE DETERMINANT FACTORS OF SCHOOL CHOICE AND ...

Bachelor ThesisSpring Semester 2007Supervisor: Per Nilsson
Author: Fabian Wrede
THE DETERMINANTFACTORS OF SCHOOLCHOICE AND STUDENTS’PERCEPTION(S) OF USBE
– Finding Out What Really Counts for Prospective Students


Acknowledgements
This Bachelor thesis got way out of hand… what started out simply as an interesting study endedup being a somewhat too large, sometimes complex, but at all times interesting project. I havedone my best to provide the management of USBE with an insight into how USBE is perceived,both from the inside and from the outside. This would not have been possible to do without thepatience of my supervisor Per Nilsson who let me do it my way, Niklas Wahlström who spenthours helping me put the survey online, Vladimir Vanyushyn who always helped me out when thestatistics got too complicated, and Calle Fredriksson and Agneta Marell who both providedvaluable advices and feedback.
Moreover, the survey could never have been distributed without the help of Inger Granberg atUSBE’s student administration, Anneli Eriksson and Karin Magnusson at the School of Business,Economics and Law at Göteborg University, Anders Parment and Staffan Hård af Segerstad atLinköping University, Leena Avotie and her colleagues at Uppsala University, Peter Langlott atÖrebro University, Mike Danilovic at Jönköping International Business School, Gerd Bucht andIngrid Thell at Lund University School of Economics and Management, Martin Stensen atStockholm School of Economics, and Joa Silver at the School of Business MälardalenUniversity.
Many thanks to all of you!
Umeå January 2007
Fabian Wrede0


Abstract
Prompted by increased competition, universities around Sweden are beginning to recognize thatmarketing and branding are strategic key components. This recognition is of great importance forUmeå School of Business (USBE) given that it is often perceived as both geographically andpsychologically distant for many prospective students. A committed brand management initiativeby the management of USBE could therefore serve to strengthen the school’s competitive abilityand increase its brand equity in the long run, making it more attractive to prospective students.
In order to create a foundation for this work, this study sets out to answer; what are the relevantbrand equity dimensions of a business school, and what is the general perception(s) of them with
regards to USBE? The study is limited to prospective and present students making it possible tointerpret these relevant brand equity dimensions as determinant factors of school choice giventhat it is the most obvious use prospective students will make of them.
In the study, existing brand equity theories are used to construct a conceptual brand equityframework applicable to a business school’s brand and organization. A quantitative survey is thenperformed to collect empirical data from over 450 students at nine Swedish universities includingUSBE.
After performing a series of factor analyses on the empirical data, the study shows that therelevant brand equity dimensions for prospective business students are awareness and loyalty inaddition to associations in the form of the Outcome & Prestige of the education, its Versatility,Performance, and Expertise as well as its ability to instigate Assurance.
The study also indicates that there are considerable differences between the general perception(s)of these dimensions with regards to USBE between USBE’s present students and prospectivestudents – implying that strategic actions are necessary to correct for this. Toward the end of thestudy, the author therefore provides the management of USBE with brief suggestions of howthese actions could be undertaken.


TABLE OF CONTENTS
1 INTRODUCTION.........................................................................................................................................................1
1.1 Background of the Study ...............................................................................................................................11.2 Research Question..........................................................................................................................................31.3 Aim of the Study ..............................................................................................................................................31.4 Limitations and Demarcations of the Study ...............................................................................................41.5 Definitions..........................................................................................................................................................4
2 RESEARCH CONSIDERATIONS.................................................................................................................................6
2.1 Information About the Author and Choice of Subject ............................................................................62.2 Theoretical Preconceptions ..........................................................................................................................62.3 Perspective(s) of the Study............................................................................................................................72.4 Theory of Knowledge......................................................................................................................................72.5 Scientific Approach ........................................................................................................................................82.6 Choice of Theories ..........................................................................................................................................82.7 Collection of Theories and Secondary Sources.........................................................................................92.8 Criticism of Literature and Secondary Sources..........................................................................................92.9 Choice of Research Method ......................................................................................................................10
3 THEORY REVIEW ......................................................................................................................................................11
3.1 Knowledge and Memory Principles in the Brain of the Consumer.......................................................113.1.1 Associative Networks – Models of Memory ......................................................................................113.1.2 The Formation of Categories ..............................................................................................................123.1.3 The Formation of Consideration Sets .................................................................................................12
3.2 Where Brands Fit into Company Strategies ..............................................................................................133.3 The Basic Components of a Brand ............................................................................................................143.4 Definitions of a Brand....................................................................................................................................143.4.1 Brands and Services..............................................................................................................................153.4.2 Brands as Places and Destinations ....................................................................................................153.4.3 Definition of a Business School’s Brand .............................................................................................16
3.5 A Brief Look at the Meaning of Brands in Modern Times........................................................................163.6 The Concept of Brand Equity and its Underlying Assets.........................................................................173.6.1 Aaker’s Conceptualization of Brand Equity .....................................................................................173.6.2 Keller’s Conceptualization of Brand Equity ......................................................................................183.6.3 Choice of Conceptualization .............................................................................................................19
3.7 Brand Awareness – Recall and Recognition ............................................................................................203.8 Brand Image – Made up of Associations..................................................................................................223.8.1 Types of Associations – Attributes.......................................................................................................223.8.2 Types of Associations – Benefits ..........................................................................................................233.8.3 Types of Associations – Attitudes ........................................................................................................243.8.4 Variations of Associations – Favorability, Strength, and Uniqueness ...........................................253.8.5 Positioning...............................................................................................................................................26
3.9 Perceived Quality..........................................................................................................................................263.9.1 Perceived Quality Generates Value .................................................................................................27
3.10 Dimensions of Service Quality ...................................................................................................................283.10.1 Interaction Quality ..............................................................................................................................283.10.2 Physical Environment Quality............................................................................................................293.10.3 Outcome Quality ................................................................................................................................303.10.4 Modifiers of Subdimensions ...............................................................................................................30
3.11 Dimensions of Product Quality..................................................................................................................313.11.1 Abstract Product Quality Dimensions and their Influencers ........................................................31
3.12 Brand Loyalty ...............................................................................................................................................333.12.1 Proposed Antecedents of Loyalty ...................................................................................................333.12.2 The Attitudinal- and Behavioral Aspects of Loyalty ......................................................................333.12.3 Loyalty and Services...........................................................................................................................34

4 CONCEPTUAL FRAMEWORK, OPERATIONALIZATION OF CONCEPTS, AND SURVEY DESIGN ......................36
4.1 Conceptual Framework Development.....................................................................................................364.2 Brand Knowledge in the Conceptual Framework ..................................................................................364.2.1 Brand Awareness ..................................................................................................................................364.2.2 Brand Image..........................................................................................................................................37
4.3 Quality in the Conceptual Framework......................................................................................................374.4 Brand Loyalty in the Conceptual Framework ..........................................................................................374.5 The Conceptual Framework .......................................................................................................................374.6 Operationalization of Concepts and Survey Design..............................................................................384.6.1 Operationalization of Brand Knowledge – Awareness ..................................................................394.6.2 Operationalization of Brand Knowledge – Image..........................................................................394.6.3 Operationalization of Quality .............................................................................................................404.6.4 Operationalization of Brand Loyalty..................................................................................................40
4.7 Choice of Scales ...........................................................................................................................................41
5 DATA COLLECTION ................................................................................................................................................42
5.1 Sampling Procedure.....................................................................................................................................425.1.1Description of Sample O.......................................................................................................................425.1.2 Description of Sample U ......................................................................................................................435.1.3 Access to the Samples and Distribution of Survey Invitation ........................................................43
5.2 Potential Biases..............................................................................................................................................435.2.1 Cognitive Dissonance ..........................................................................................................................435.2.2 Response and Response Style Bias ....................................................................................................445.2.3 Nonresponse Bias ..................................................................................................................................44
5.3 Data Collection.............................................................................................................................................45
6 DATA PREPARATION ..............................................................................................................................................46
6.1 Assessment of Response and Nonresponse Rate ...................................................................................466.2 Missing Data Analysis....................................................................................................................................466.2.1 Identification of the Type of Missing Data........................................................................................466.2.2 The Extent of Missing Data...................................................................................................................476.2.3 The Randomness of Missing Data Processes....................................................................................486.2.4 Selection of Imputation Method........................................................................................................48
6.3 Identification of Outliers...............................................................................................................................496.4 Test of Underlying Statistical Assumptions of Multivariate Techniques ................................................506.4.1 Assumption of Normality ......................................................................................................................506.4.2 Homoscedasticity .................................................................................................................................51
7 RESULTS ....................................................................................................................................................................52
7.1 Descriptive Statistics......................................................................................................................................527.1.1 Overall Demographic Descriptive Statistics .....................................................................................527.1.2 The Basics of Factor Analysis ...............................................................................................................52
7.2 Results from Group 1 – Determinant Factors of School Choice ...........................................................537.2.1 Identification of the Determinant Factors of School Choice........................................................53
7.3 Results from Group 2 – Determinant Factors of Overall School Quality ..............................................547.3.1 Identification of the Determinant Factors of Overall School Quality ..........................................54
7.4 Results from Group 3 – Sample O’s Perception(s) of USBE.....................................................................557.5 Results from Group 4 – Sample U’s Perception(s) of USBE .....................................................................56
8 DATA ANALYSIS AND DISCUSSION......................................................................................................................58
8.1 Outline of the Chapter.................................................................................................................................588.2 Analysis of Data From Group 1 – Determinant Factors of School Choice..........................................598.2.1 Labeling the Determinant Factors of School Choice.....................................................................61
8.3 Analysis of Data From Group 2 – Determinant Factors of Overall School Quality ............................628.3.1 Labeling the Determinant Factors of Overall School Quality .......................................................64
8.4 Analysis of Data From Group 3 – Sample O’s Perception(s) of USBE...................................................658.4.1 Sample O’s Prior Knowledge of USBE and Umeå, and Other Background Statistics ...............65

8.4.2 Sample O’s Perception(s) of the Determinant Factors of School Choice..................................668.5 Analysis of Data From Group 4 – Sample U’s Perception(s) of USBE....................................................678.5.1 Sample U’s Satisfaction and Loyalty..................................................................................................678.5.2 Sample U’s Perception(s) of the Determinant Factors of School Choice...................................67
8.6 Differences in Perception(s) of USBE Between the Samples..................................................................68
9 CONCLUSIONS AND IMPLICATIONS....................................................................................................................71
9.1 Research Question and Aim of the Study ................................................................................................719.2 The Relevant Brand Equity Dimensions of a Business School.................................................................719.3 The General Perception(s) of the Relevant Brand Equity Dimensions With Regards to USBE..........729.4 Managerial Implications and Suggestions ...............................................................................................729.5 Future Research Priorities .............................................................................................................................739.5.1 Future Research and the Relevant Brand Equity Dimensions of a Business School ..................739.5.2 Future Research and the Perception(s) of USBE..............................................................................74
10 CREDIBILITY CRITERIAS.........................................................................................................................................75
10.1 Validity and Reliability ................................................................................................................................7510.1.1 Construct Validity................................................................................................................................7510.1.2 External Validity ...................................................................................................................................7510.1.3 Reliability ...............................................................................................................................................75
10.2 Practical Usefulness.....................................................................................................................................76
REFERENCES AND FURTHER READING .....................................................................................................................77
LIST OF FIGURES
Figure 3.1 – An Associative Network Depicting the Target Concept “Business School” ...................................... 11Figure 3.2 – Aaker’s Conceptualization of Brand Equity ............................................................................................ 18Figure 3.3 – Keller’s Conceptualization of Customer Based-Brand Equity .............................................................. 19Figure 3.4 – Keller’s Conceptualization of Brand Knowledge – the Source of Brand Equity................................ 20Figure 3.5 – Brady and Cronin’s Research Model of Service Quality ....................................................................... 29Figure 3.6 – Brucks, Zeithaml, and Naylor ’s Model of Product Quality.................................................................... 32Figure 4.1 – The Conceptual Framework of the Study................................................................................................ 38Figure 8.1 – Determinant Factors of School Choice.................................................................................................... 61Figure 8.2 – Determinant Factors of Overall School Quality ...................................................................................... 65
LIST OF TABLES
Table 6.1 – Types of Missing Data, Methods of Imputation, and n Replaced Values ........................................... 49Table 6.2 – Outlier Identification ..................................................................................................................................... 50Table 7.1 – Compositions of Groups, and Their Associated Question Sections...................................................... 52Table 8.1 – Perception(s) of USBE, and Associated Determinant Factors of School Choice............................... 69
APPENDIXES AND LIST OF TABLES IN APPENDIXES
APPENDIX A – RANKING AND SURVEY DESCRIPTIVE STATISTICS
Table A1 – Veckans Affärer’s Ranking of Swedish Business Schools 2003Invitation A2a – Survey Invitation Sent to Sample OInvitation A2b – Survey Invitation Sent to Sample UTable A3 – Descriptive Statistics of Survey Distribution for Sample O and U
APPENDIX B – OVERALL DEMOGRAPHIC DESCRIPTIVE STATISTICS FOR INDIVIDUAL GROUPS
Table B1a-c – Demographic Descriptive Statistics GROUP 1 (Sample O, and U1)Table B2a-c – Demographic Descriptive Statistics GROUP 2 (Sample O, and U1)

Table B3a-c – Demographic Descriptive Statistics GROUP 3 (Sample O)Table B4a-c – Demographic Descriptive Statistics GROUP 4 (Sample U1, and U2)
APPENDIX C – GROUP 1 – DETERMINANT FACTORS OF SCHOOL CHOICE
Table C1 – Determinant Items of School ChoiceTable C2a – Rotated Component Matrix of Determinant Items of School ChoiceTable C2b – Total Variance ExplainedTable C2c – Individual Factor Reliability CoefficientsTable C2d – Summated Scale Values of Determinant Factors of School Choice
APPENDIX D – GROUP 2 – DETERMINANT FACTORS OF OVERALL SCHOOL QUALITY
Table D1a – Determinant Items of Expected School QualityTable D1b – Determinant Items of Perceived School QualityTable D2a – Rotated Component Matrix of Determinant Items of Overall School QualityTable D2b – Total Variance ExplainedTable D2c – Individual Factor Reliability CoefficientsTable D2d – Summated Scale Values of Determinant Factors of Overall School Quality
APPENDIX E – GROUP 3 – SAMPLE O’S PERCEPTION(S) OF USBE
Table E1 – Sample O’s Perception(s) of USBETables E2a-l – Additional Descriptive Statistics of Sample O
APPENDIX F – GROUP 4 – SAMPLE U’S PERCEPTION(S) OF USBE
Table F1 – Sample U’s Perception(s) of USBETable and Bar Chart F2a – USBE Students’ SatisfactionTable F2b – Considered Changing SchoolTable F2c – Alternative Schools For USBE StudentsTable F2d – USBE Students’ LoyaltyTable F2e – USBE students’ Self Perception
APPENDIX G – DIFFERENCES IN PERCEPTION(S) OF USBE BETWEEN SAMPLE O AND U
Table G1a – The Determinant Factors of School Choice and Sample O’s Perception ItemsTable G1b – The Determinant Factors of School Choice and Sample U’s Perception ItemsTable G2 – Differences in Mean Values of USBE Perception Items Between Sample O and U
APPENDIX H – SAMPLE O’S SURVEY
APPENDIX I – SAMPLE U’S SURVEY


1
1 INTRODUCTION
The purpose of the first chapter is to familiarize the reader with the competitive situation for
Swedish universities, and to formulate a research question. In addition, the aim of the study, its
limitations, and a selection of definitions that will be used throughout the study will also be
provided.
1.1 Background of the Study
In May 1931 Procter & Gamble set up what is to be considered the world’s first brandmanagement team responsible for marketing programs and coordination between sales andmanufacturing departments1. Today, more than 70 years later, universities around Sweden arebeginning to realize what Procter & Gamble realized back then – that marketing and branding arekey components in the strategies of successful businesses.
The Swedish higher educational system could be considered as “heterogeneous and centralized”before a reform took place in 19772. The reform brought on an expansion of universities all overthe country as well as a less centralized organization. As a consequence of the larger number ofuniversities, a new situation of increased competition arose between the different seats oflearning. In 1993, yet another reform of the system initiated a true shift toward more marketorientation. With the second reform came a larger freedom of operations for the individual seatsof learning and a notion of the importance of marketing, fueled by the increased competition.3
In 2006, prospective business students could choose from more than 25 universities anduniversity colleges in Sweden offering business educations4. Consequently, the competitionbetween these seats of learning for recruiting new students is very strong. The studentsthemselves also face an increased competition for employment after graduation with a surplus ofgraduates within most, but not all, fields of business and economics5. This surplus has its sourcein a fivefold increase in graduated business students since 1978, which is more than today's labormarket can handle6. In addition to this surplus, it also seems as if the students’ choice of businessschool affects their chances of employment. Even though managers argue that the applicants'personality and talent are the determinant factors, statistics show that students with degrees fromthe most popular universities are in more favorable positions for finding employment and goodfinancial compensation7. Both the future chances of employment and the level of financialcompensation are most likely important determinants of where prospective business studentschose to apply and study.
1 Aaker, D.A. (1991), Managing Brand Equity, New York, NY: The Free Press, p. 52 Johnson, J.M. (2000), Graduate Education Reform in Europe, Asia and the Americas and International Mobility ofScientists and Engineers: Proceedings of an NSF Workshop, Arlington: National Science Foundation, p. 155
3 Larsson, A. & Wood, A. (2005), Marknadsföring & Varumärkesbyggande – Universitet & Högskolor iKonkurrens, Stockholm: National Agency for Higher Education, p. 9
4 Beck, A.(2006), Nordiska Akademiska Ekonomutbildningar 2006, Stockholm: SERO & Civilekonomerna, p. 325 Edberg, U. (2005), Utbildas det för många ekonomer?, Civilekonomen, No. 1, p. 5 andGustavsson, B., Israelsson, T. & Strannefors, T. (2005), Var finns jobben år 2005?, Gnesta:Arbetsmarknadsstyrelsen Närservice, p. 44-45
6 Ekelund, Å. (2003), Ekonomerna svämmar över, Veckans Affärer, No. 15, p. 207 Stenshamn, C. (2003), Talang går före skola, Veckans Affärer, no. 15, p. 26

2
In addition to these more functional determinants for applying to a certain seat of learning,prospective students, as well as the industry, are also likely to evaluate the different schools withregards to their brand images. The image of a brand can be controlled for to a certain extent bybrand management, but it has traditionally been looked upon with a degree of aversion by theeducational institutions. But as competition increases, the concept is gaining ground, or as TerryFlannery executive director for marketing and communications at the University of Marylandchooses to put it; “branding, is not a dirty word anymore”.8 The result of this development is thateducation has become yet another global business and institutions are therefore forced to becomemore commercially minded in order to survive9.
In Veckans Affärer's ranking of all 25 universities and university colleges in Sweden that offeredbusiness educations in 2003, Umeå School of Business (USBE) ranked seventh (see Appendix A:Table A1). The ranking was based on three variables; the university's attractiveness amongstudents, the university's attractiveness in the industry, and the amount of resources allocated foreach student.10 With a wide variety of business programs and courses at Undergraduate, Master,as well as Ph.D. level, USBE has the potential to be one of the more popular alternatives for thistype of education in Sweden. However, USBE is situated in the north of Sweden and is oftenperceived as both geographically and psychologically distant. It is lesser known than many of itssouthern counterparts and therefore not often the first choice for southern students when applyingto a business school. Moreover, all six universities with higher ranking are situated in southernSweden, and are thus perceived as closer.
In fall 2006, the average number of applicants for every offered position at the foremost sixuniversities in the raking was 3.66 students, while the corresponding number for USBE was 1.2students11. This equals more than three times as many applicants for every offered position at theforemost six universities compared to USBE (see Appendix A: Table A1). Even if the highnumber of applicants to Stockholm School of Economics raises the average number, there is stilla significant difference when they are excluded. Nonetheless, USBE has approximately 1,500enrolled students12. After graduation, many of them will look for employment in southernSweden, e.g. 62 percent of the 2001 graduates from USBE worked south of the counties ofGävleborg and Dalarna in 200413. These USBE graduates will therefore have to compete withmany of the students who have graduated from the more known southern universities. If USBEhad a stronger and more unique brand image, and industry recruiters were more aware of theschool’s quality, as well as the quality of its graduates, the graduates’ chances of employmentcould be improved, as could their chances of good financial compensation. As argued above, bothimproved chances of employment and the level of financial compensation are likely determinantsof where prospective business students chose to apply, so it would benefit both the graduatedstudents and USBE. This reasoning highlights the important fact that USBE’s market, orstakeholders, are not only prospective students, but also these students’ prospective employersand many others. Therefore, the nourishment of corporate and community relations should be a
8 Pulley, J.L. (2003), Romancing the Brand, Chronicle of Higher Education, Vol. 50, Issue 9, p. 309 Lewis, E. (2003), It’s a University Challenge, Brand Strategy, Issue 171, May, p. 2010 Ekelund, Å. (2003), p. 22-2511Hetaste skolorna bland studenter (2006), Civilekonomen, No. 6, p.7 & No. 7, p. 23
12 Umeå School of Business, Information booklet13Ekonomer i yrkeslivet, examensår 2001, enkät 2004, CD-ROM, Stockholm: Civilekonomerna, 2004

3
key priority since it is likely to pay off financially as well as image wise for both USBE and thestudents.
Nevertheless, the management of USBE appears to be aware of the situation given that DeanAgneta Marell in a presentation of USBE writes; “there is a need for constant change andrenewal even if we do know that our educational programs and research are of high quality. This
is not in the least important in order to meet the increasing competition from domestic and
international universities”14. The efforts done in recent years to attain the EQUIS (EuropeanQuality Improvement System) accreditation for USBE confirm the sincerity of these words.However, more work has to be done as indicated by a recently conducted nationwide study forUmeå University, which shows that the university as a whole is perceived as geographicallydistant and that the overall profile of the university is weak and has to be strengthened15.
A part of a long-term strategy to face this competition should be to strengthen USBE’s brandprofile by a committed brand management initiative. This could strengthen the school’scompetitive ability and increase its brand equity in the long run, making it more attractive toprospective students. Brand equity is commonly defined in terms of the “marketing effectsuniquely attributable to the brand”, i.e. the extra leverage of marketing efforts that the brandgives rise to16. It is composed out of several underlying dimensions. By breaking down the brandinto these dimensions and study them individually as well as collectively, a more comprehensiblerepresentation of the brand will result. The brand will also become more manageable since onecan leverage the dimensions individually, and through that control the profile to a certain extent.
In order to enhance the brand equity, one must first assess the current position of the brand, i.e.one must examine the perception(s) of different brand equity dimensions among selectedstakeholders.
The above reasoning has led to the following research question:
1.2 Research Question
What are the relevant brand equity dimensions of a business school, and what is the general
perception(s) of them with regards to USBE?
1.3 Aim of the Study
The aim of the study is to construct a conceptual brand equity framework applicable to a businessschool’s brand and organization. Based on this framework, a survey will be conducted in order togain understanding of both the dimensions that are considered relevant, as well as theperception(s) of these dimensions with regards to the USBE brand. This will provide the
14 Marell, A. (2005), Välkommen till Handelshögskolan!, Homepage of USBE, Updated 2005-12-13, Retrieved2006-03-09: http://www.usbe.umu.se/
15 Garback, M., Holst Westin, K. & Mitteregger, A. (2006), Identitets- och imageundersökning avseende Umeåuniversitet, Stockholm: Augur Marknadsanalys, p. 34
16 Keller, K.L. (1993), Conceptualizing, Measuring, and Managing Customer-Based Brand Equity, Journal ofMarketing, Vol. 57, Issue 1, p. 1

4
management of USBE with a foundation upon which they can continue to develop the USBEbrand.
1.4 Limitations and Demarcations of the Study
As touched upon in section 1.1, the market of USBE is made up of several stakeholders, e.g.employees, prospective- and present students, alumni, research communities, corporations (i.e.students’ prospective employers, and USBE’s prospective partners) and local as well as nationalgovernments. In order for the management of USBE to really assess the perception(s) ofapplicable brand equity dimensions, they must take all these stakeholders into consideration. Thiswould require the identification of applicable dimensions for each stakeholder group, whichwould require considerable amounts of time and resources not available for this study.
Given the above reason, the stakeholders considered in this study are limited to prospective andpresent students. In order to be able to practically conduct the study, first year students have beenconsidered as good enough representatives of prospective students since they have recently madean active choice of where to study. Hence, this study will only consider the perception(s) of firstyear students at selected business schools in Sweden including USBE, as well as the
perception(s) of senior students at USBE. These stakeholders will be able to provide bothinformation of which dimensions should be considered relevant, as well as information of howthey perceive them.
Note that the more general denotation of the relevant brand equity dimensions of a businessschool found in the research question is in the context of this study interpreted as the determinantfactors of school choice given that it is the most obvious use prospective students will make of it.
Further, given economical- and time constraints, this study will solely be conducted in Sweden.As a consequence, the perception(s) of international students will not be considered.
1.5 Definitions
Even if many of the following concepts will be thoroughly explained in the study, this sectionserves as a quick reference to some of the more commonly used concepts.
Brand associations come in several forms (attributes, benefits, and attitudes) and contain the“meaning of the brand for consumers”17.
Brand attitude is the “buyer’s overall evaluation of the brand with respect to its perceived abilityto meet a currently relevant motivation”18.
Brand awareness in defined in a purchase situation as “the buyer’s ability to identify (recognizeor recall) the brand within the category in sufficient detail to make a purchase”, or in non-
17 Keller, K.L. (1993), p. 318 Rossiter, J.R. & Percy, L. (1987), Advertising and Promotion Management, New York, NY: McGraw Hill, p. 132

5
purchase situation as the buyer’s ability to identify the brand and “to propose, recommend,choose, or use the brand, respectively”19.
Brand image is composed out of the associations held in consumers’ memories about the brand20.
Brand knowledge is composed out of brand awareness and brand image.
Brand recall is a part of brand awareness.
Brand recognition is a part of brand awareness.
Business school, or school in this study refers to the universities or university colleges that offereducations within the field of business and economics.
Dimension/construct is something not “adequately described by a single measure”21.
Factor is a linear combination of several items with which an underlying dimension/construct canbe represented22.
Item or variable is an indicator of an underlying dimension/construct.
19 Rossiter, J.R. & Percy, L. (1987), p. 14020 Keller, K.L. (1993), p. 221 Hair, Jr., J.F., Black, W.C., Babin, B.J., Anderson, R.E. & Tatham, R.L. (2005), Multivariate Data Analysis, 6th
ED, Upper Saddle River: Pearson Prentice-Hall, p. 10422Ibid., p. 102

6
2 RESEARCH CONSIDERATIONS
This chapter includes selected background information about the author in order to facilitate the
reader’s understanding for the choice of subject and some of the methodological choices. A
presentation of the research considerations that have been made as well as an account of the
course of action chosen to approach the problem will also be provided.
2.1 Information About the Author and Choice of Subject
I, the author of this study, come from the southwestern part of Sweden and had no realconnection to the northern part before I did my military service there. During this time, I becamevery fond of the nature and the people of the north. This fact in combination with the fact that theInternational Business Program at USBE fitted my educational preferences well made me moveto Umeå. From the onset of my education, USBE has proven to me to be a very able school and itis my personal opinion that more people, i.e. stakeholders, should be made aware of this. Afterfive semesters in Umeå, during a sabbatical year from my studies, I looked for employment or atrainee-position at several advertising agencies in Stockholm and Gothenburg City. At some ofthe job interviews, I was struck by the non-existent knowledge of Umeå University and USBE.Logically, one could assume that the level of knowledge of USBE will vary between differentfields of business. The chances of meeting someone with more knowledge are probably greaterwithin the typically larger fields such as accounting or finance and dimmer within a field such asmarketing where I encountered this lack of knowledge. However, this event in combination withmy positive impression of USBE sparked a thought of exploring the problem later on in a study.It should also be added that I have a natural interest in the very subject of this study given that Iplan to pursue a carrier within the field of marketing(research) and branding once I havecompleted my education at USBE.
2.2 Theoretical Preconceptions
Brand equity and strategic branding are topics often touched upon but not thoroughly studied inbasic marketing courses even though they are very present in modern marketing literature. I havealways found them interesting and been eager to develop a better knowledge of them, and Iexpect this study to help me do that. My theoretical knowledge in marketing is so far the result ofboth basic and more advanced marketing courses dealing with topics such as; services- andinternational marketing, consumer behavior and market analysis, etc. All these courses haveprovided me with a theoretical foundation of marketing knowledge that I will continue to buildon by conducting this study.
The fact that I had not studied theories of brand equity before I initiate this study allowed me toapproach the subject in a more objective way than would have been the case otherwise. Since Ihad not been indoctrinated through lectures to use certain theories, I had to “read it all” before Icould decide on which theories to include. This meant that I did not settle for using only theoriesfound in marketing textbooks and articles, but instead sought out a wide variety of sources fromseveral fields of study, e.g. psychology and advertising.

7
2.3 Perspective(s) of the Study
As a researcher, I have to choose a perspective from which I will observe the particular problem.This is important since the same problem can be perceived as very different through the eyes ofdifferent beholders23. Melin mentions two perspectives when studying brands, the external- andinternal perspective. The external perspective focuses on the consumer, and the accompaniedresearch deals with consumer behavior whereas the internal perspective focuses on the brandowner, and the accompanied research deals with brand management. Both these perspectivescome together in the models of brand equity where they complement each other since brandowners have to understand consumers’ behaviors and perception(s) of brands in order to managetheir brands.24
I will conduct this study partly from a brand owner’s perspective given that it is my intention toprovide the management of USBE (i.e. the brand owner) with results that they can make use ofwhen developing future strategies. But in order to obtain this information, I will also need to takea consumer ‘s perspective (in this study; a student’s perspective) in order to really understandhow the USBE brand is perceived. Therefore, both perspectives will be used interchangeablythroughout the study.
2.4 Theory of Knowledge
The observant reader may have noticed that I already have declared my hermeneutic position inthe aim of this study when I wrote that I want to gain understanding of both the dimensions thatare considered relevant, as well as the perception(s) of these dimensions with regards to the
USBE brand. Since consumer-based brand equity has its source in the minds of human beings, alldifferent from one another, a hermeneutic epistemology that tries to “grasp the subjectivemeaning of social action” seems appropriate25. The dynamic nature of the studied phenomenondoes also contribute to this position since it would be futile to strive for an objective truth forsomething that is constantly evolving. Moreover, a hermeneutic position is in a way inherent inthe chosen perspectives of this study since both perspectives involve the ability to understand andinterpret.
Quantitative research methods are more common within brand equity research than qualitativemethods26. A classical assumption is then that the researcher should take a positivistic position27.But given the above mentioned source of brand equity and its multidimensionality, a strict
23 Eliasson, R. (1995), Forskningsetik och perspektivval, Lund: Studentlitteratur, p. 28-3024 Melin, F. (1997), Varumärket som strategiskt konkurrensmedel: Om konsten att bygga upp starka varumärken,Lund: Lund University Press, p. 32-33
25 Bryman, A. & Bell, E. (2003), Business research methods, Oxford: Oxford University Press, p. 1626 See; Park, C.S. & Srinivasan, V. (1994), A Survey-Based Method for Measuring and Understanding Brand Equityand Its Extendibility, Journal of Marketing Research, Vol. 31, Issue 2; Yoo, B. & Donthu, N. (2001), Developingand Validating a Multidimensional Consumer-Based Brand Equity Scale, Journal of Business Research, Vol. 52Issue 1; and Pappu, R., Quester, P.G. & Cooksey, R.W. (2005), Consumer-Based Brand Equity: Improving theMeasurement – Empirical Evidence, Journal of Product and Brand Management, Vol. 14, Issue 3
27 Bryman, A. & Bell, E. (2003), p. 466

8
positivistic position should not be a viable alternative since it would most likely impede theresearcher’s way to knowledge.
2.5 Scientific Approach
In order for me to be able to construct a conceptual brand equity framework applicable to abusiness school’s brand and organization, I have to expand my knowledge of brand equitytheories by initially perform a thorough theory review. Based on this review, applicabletheoretical concepts will be selected and included in the conceptual framework. This course ofaction, where conclusions are drawn on the basis of logical reasoning is referred to as a deductiveapproach28. It stands to reason that my general marketing knowledge would not have gotten mefar within the field of brand equity if I instead would have chosen an inductive approach andstarted out by performing empirical observations and then based on their results attempted todraw general conclusions29.
2.6 Choice of Theories
Given the multidimensionality and scope of the brand equity concept, an account of the choice oftheories that I have done seems appropriate before proceeding. Each dimension of brand equity isin itself a separate area of research, consequently the number and variety of theories arepractically infinite. In this study, the intention has been to include enough theories to provideample theoretical knowledge for the construction of the conceptual framework that will help meunderstand, analyze, and answer the research question in a satisfactory way. Therefore, mycollection of theories has had its source in the more general theories that encompass the wholebrand equity concept. In order to improve my understanding from there, I have proceeded tomore specific theories, which have dealt with the individual dimensions on a deeper level. Inevery case, the collection has been brought to an end when I have reached a level of theoreticalsaturation with respect to the problem at hand. Nevertheless, it should be noted that if thedimensions were to be further explored individually, a deeper level of theoretical knowledgecould prove valuable.
The reader will notice that the authors Aaker and Keller are rather omnipresent within this study.The reason for this is that their body of work is so fundamental for the general brand equityconcept that an exclusion of their work from a study dealing with brand equity would be mostquestionable.
I have not succeeded – although efforts have been made – to find theories written especially forthe context of this study. However, I have found several articles describing how other businessschools have proceeded with their brand management initiatives but none of them have been ableto provide any substance to this study.
28 Ghauri, P. & Grønhaug, K. (2002), Research Methods in Business Studies – A Practical Guide, 2nd ED, Harlow:Prentice Hall, p. 14
29 Ibid., p. 13

9
2.7 Collection of Theories and Secondary Sources
All literature and secondary sources used in this study have been found through the ALBUMsearch engine at Umeå University Library and its databases, e.g. Business Source Premier andEmerald Fulltext. Keyword searches of individual brand equity dimensions and concepts incombination with keywords of higher education, as well as authors’ names found in thereferences of books and articles have been used, e.g. brand management, -associations, -loyalty,-image, quality dimensions, business school+branding, etc. This procedure has provided me witha good overview of the brand equity literature as well as an insight into more specializedliterature dealing with individual dimensions of brand equity.
The Internet search engine Google Scholar has also proven valuable in the search of articles.Even though the results many times referred back to articles found in one of the many databasesthat could be accessed from Umeå University Library.
2.8 Criticism of Literature and Secondary Sources
The fundamental theories of brand equity have not evolved significantly since they werepresented in the end of the ‘80s/beginning of the ‘90s. One reason for this might be that brandequity is an interdisciplinary field of research – comprising for example social psychology,cognitive science, economics, and management – and it therefore includes individual theories thatare all established within their respective field of research.
One could therefore question the use of some of these borrowed theories in the “commercial”setting which brand equity operates in. Nonetheless, most theories are now being retested inappropriate settings, which might explain the slow pace of evolvement within the field.
Moreover, there seems to be a divide between the academic brand equity literature and the morepractically oriented. Where the academics seek to test theories in controlled settings, practitionersmany times seem to act more on intuition and if the outcome is lucky, they will share it with themin a book. I have therefore almost exclusively relied on academic secondary sources, but I havenot fully rejected the more practically oriented versions since they many times provide aninteresting and colorful insight into the “reality”. An additional reason to rely more on academicsources is that they are more likely to account for possible ties to corporations and organization,which means that it is easier to evaluate their independence and neutrality. Overall, the secondarysources used in this study have shown acceptable levels of neutrality and independence.
Throughout the study, I have made great efforts to only refer to original secondary sources andnot to the work of authors within other authors’ work. This has not been an easy task at all timesgiven the complexity and manifold of the brand equity research field. It is fair to say that I havesucceeded in most cases but not all. The cases that I have not succeeded in have been consideredtoo complex, and in order to keep a somewhat pragmatic approach I have therefore decided torefer to the author(s) of the actual source that I have used. By doing this, the interested reader canlook it up and derive the original source from there.

10
2.9 Choice of Research Method
At present, it appears to be a lack of consensus in the research community concerning anappropriate way to measure brand equity30. Nonetheless, there are basically two ways to measurebrand equity. One way is to measure the behavioral outcomes of brand equity and the other is tomeasure the psychological components of brand equity.31 For this study, the focus is on thepsychological components of brand equity, e.g. brand awareness and attitude, since thebehavioral outcomes are of less importance with regards to the context of the study. It would forexample be rather useless to measure how frequently former students revisit USBE, and then usethat as a measure of brand loyalty.
The research problem and the aim of the study will determine the most appropriate researchmethod and techniques. With the research question and aim of the study in mind, a descriptiveresearch method, which utilizes a quantitative survey to collect empirical data, seemsappropriate. A descriptive survey is appropriate since it is an effective method to monitorattitudes, opinions, and descriptions of a specific population of subjects/respondents.32 Aquantitative method is appropriate since it enables “a more definitive portrait of the brand”,which is not the least important if the data will serve as a basis for strategic and tacticaldecisions33. Another reason for using quantitative methods is that they allow generalizationsbeyond the studied cases, e.g. beyond the respondents of a survey34. Finally, a survey isappropriate since possible effects of interviewer errors are minimized, it allows a large sample inrelation to cost and time, and it can easily be used to sample a large geographic area, as in thecase of this study.35
30 Pappu, R., Quester, P.G. & Cooksey, R.W. (2005), p. 15131 Earl, P.E. & Kemp, S. (Eds) (1999), The Elgar Companion to Consumer Research and Economic Psychology,Glos: Edward Elgar Publishing, p. 50-51
32 Ghauri, P. & Grønhaug, K. (2002), p. 85-9533 Keller, K.L. (1998), p. 32334 Bryman, A. & Bell, E. (2003), p. 81-8235 Ejlertsson. G. (2005), Enkäten i praktiken: en handbook i enkätmetodik. 2nd ED, Lund: Studentlitteratur, p. 12

11
3 THEORY REVIEW
This chapter provides the reader with a selection of theoretical concepts. The opening part will
deal with memory principles used in the human brain to process market information. The basics
of brands will then be discussed before continuing to an exposition of the brand equity concept
and its underlying dimensions.
3.1 Knowledge and Memory Principles in the Brain of the Consumer
In order to understand consumers’ responses of market stimuli and how these responses relate tosome of the dimensions of brand equity that will be discussed further on, a basic understanding ofthe knowledge principles used by the human brain to memorize things are necessary.
3.1.1 Associative Networks – Models of Memory
Memory is a person’s power to remember something, it is an ongoing process that encodesinformation so that it can be stored in the brain until it is needed and retrieved36. Generallyaccepted models of memory in a consumer behavior context are so-called associative networks37.These networks originate from a target concept/node that is “a product or consumption relatedactivity” to which associated nodes are linked in various manners38. Figure 3.1 illustrates anassociative network depicting the target concept “Business School” and a selection of possibleassociations that prospective students might have to it.
Figure 3.1 – An Associative Network Depicting the Target Concept “Business School”39
The number and strength of the connected links determine the strength of association between thedifferent nodes40. The network lacks a formal structure, and can therefore be expanded in all
36 Solomon, M.R. (2004), Consumer Behavior: Buying, Having, and Being, 6th ED, New Jersey: Pearson Education,p. 95
37 See; Lawson, R. (2002), Consumer Knowledge Structures: Background Issues and Introduction, Psychology andMarketing, Vol. 19, Issue 6, p. 447; Keller, K.L. (1993), p. 2; and Lerman, D. & Garbarino, E. (2002), Recall andRecognition of Brand Names: A Comparison of Word and Nonword Name Types, Psychology and Marketing, Vol.19, Issue 7-8, p. 624
38 Lawson, R. (2002), p. 45139 Author’s Conceptualization40 Keller, K.L. (1998), Strategic Brand Management: Building, Measuring, and Managing Brand Equity, UpperSaddle River: Prentice-Hall, p. 46

12
directions through the links originating from the target concept/node41. In order to recall andretrieve information, something called spreading activation occurs. A node is then activatedthrough external stimuli (experienced with any of the sensory receptors) or internal stimuli(cognitive activity such as thinking about something). When the activation in the node reaches acertain strength, the content will be recalled. The activation will then continue to spread in anydirections through the activation of linked nodes. Stronger links will activate nodes more easilywhile weaker links require stronger activation in the node in order to spread activation.42
Consequently, there is a positive relationship between the strength of associations and how easilyinformation can be retrieved whereas it appears to be a negative relationship between the size ofthe association set, i.e. all associations linked to a node, and how easily the information can beretrieved43.
Even though associative networks are accepted models of memory in a consumer behaviorcontext should it be noted that recent advances within the field of conceptual cognition havebegun to question their validity in favor of more elaborate models, but these have yet to enter thefield of consumer behavior44.
3.1.2 The Formation of Categories
When the memory treats two or more concepts in a similar manner are they considered toconstitute a category45. Depending on situational and contextual factors, consumers tend tocategorize similar products differently46. One way to explain this could be Viswanathan andChilders’ conceptualization of categories as so called fuzzy sets in which the degree of categorymembership is determined along a continuum of specific attributes47. For example, cereals andbeef have the necessary attributes to categorize as food, while at the same time having certainattributes which categorize them into the breakfast respectively dinner category.
3.1.3 The Formation of Consideration Sets
The above mentioned processes of categorization are central in consumer behavior since theyallow consumers to process information relating to objects (e.g. products, services, and brands),evaluate objects, and form so-called consideration sets48. A consideration set can be defined as
41 Novick, L.R. & Hurley, S.M. (2001), To Matrix, Network, or Hierarchy: That is the Question, CognitivePsychology, Vol. 42, Issue 2, p. 163
42 Keller, K.L. (1998), p. 46-4843 Lerman, D. & Garbarino, E. (2002), p. 62444 Lawson, R. (2002), p. 447-44845 Paulssen, M. & Bagozzi, R.P. (2005), A Self-Regulatory Model of Consideration Set Formation, Psychology andMarketing, Vol. 22, Issue 10, p. 787
46 Rosa, J.A. & Porac, J.F. (2002), Categorization Bases and Their Influence on Product Category KnowledgeStructures, Psychology and Marketing, Vol. 19, Issue 6, p. 505
47 Viswanathan, M. & Childers, T.L. (1999), Understanding How Product Attributes Influence ProductCategorization: Development and Validation of Fuzzy Set-Based Measures of Gradedness in Product Categories,Journal of Marketing Research, Vol. 36, Issue 1, p. 91
48 Paulssen, M. & Bagozzi, R.P. (2005), p. 787

13
“the set of brands brought to mind on a particular choice occasion” 49. In addition to categorymembership, the level of brand awareness, which will be discussed in section 3.7, affects theprobability for a brand to be included in a consideration set50. For example, when a prospectivebusiness student is about to choose where to study, a handful of business schools will come tomind in the “higher business education category”, these schools will constitute the considerationset on this specific choice occasion. The consideration set will thus be made up of severalassociative networks with individual schools as target concepts/nodes. Every network will haveits own association set, but all will be enough similar to be included in the consideration set. On agiven choice occasion, once a consideration set has been formed, the consumer evaluates theincluded target concepts/nodes, e.g. brands, with the help of various decision rules in order tomake a final choice51. Different decision rules will thus narrow down the consideration set until afinal choice can be made.
We will now proceed by discussing the basics of brands, but we will extend the theoriespresented above and continue to elaborate on them in section 3.7 when dealing with the conceptof brand awareness and in section 3.8.4 when dealing with the variations of associations.
3.2 Where Brands Fit into Company Strategies
The core strategy of a company involves the identification of a target segment to which it canprovide a competitive advantage, and the positioning of a unique offer among the segment’scustomers. The competitive advantage should differentiate the company from competitors andprovide the targeted customers with superior value.52 Based on this reasoning, it is implicitlystated that a company cannot serve all consumers. It should rather match a unique offer to thedemand of a fitting target segment. It has to dare to be exclusive in its offer, and selective whenchoosing its target segment, or in the words of Al Ries and Jack Trout; “you must be willing togive up something in order to establish that unique position”53.
A brand is one such competitive advantage that can contribute to differentiate a company from itscompetitors. Melin argues that today, when products and services are becoming increasinglysimilar, brands can offer an enduring mean of competition that adds value to otherwise similarproducts and services.54 The concept of positioning is applicable in the higher educational sectoras well, given that many of the established seats of learning in Sweden have rather similarprofiles55. The similarity of these profiles implies that there should be opportunities for other lessestablished schools to use their brands in alternative creative ways, which could help them todifferentiate and establish unique positions.
49 Nedungadi, P. (1990), Recall and Consumer Consideration Sets: Influencing Choice without Altering BrandEvaluations, Journal of Consumer Research, Vol. 17, Issue 3, p. 264
50 Keller, K.L. (1993), p. 351 Nedungadi, P. (1990), p. 26452 Kotler, P. (2003),Marketing Management, 11th ED, Upper Saddle River: Pearson Education, p. 30853 Ries, A. & Trout, J. in Wiklander C. & Hansen, J. (2004), Reklambibeln, Stockholm: Redaktionen, p. 20554 Melin, F. (1997), p. 855 Collberg, B. (2001), Klonade Universitetsprofiler, LUM - Lunds universitet Meddelar, Issue 6, p. XIII

14
3.3 The Basic Components of a Brand
The components of a brand adhere to different phases in a infinite development process. Thisprocess begins with a name and logotype that preferably differ from others already being used.The next phase involves the registration of the name and logotype at the responsible authority inorder for them to become registered trademarks. By doing this, the company attains exclusiverights of ownership and legal protection from infringement.56
The preceding prerequisites can be completed relatively easy and fast. It is however during thenext, and last, decisive phase that trademarks transform into brands. This can take time, oftenmany years, and not every company will be able to complete it. The company’s trademarks willnow be given a larger meaning or content through the use of communication and interaction,because it is first when people associate a trademark (i.e. the name or logotype) with a certaincontent or promise that it has reached the status of a true brand.57
All these steps are thus necessary to create a brand. In this study, it is assumed that the USBEbrand has gone through the initial phases and that the final brand-building phase has beeninitiated. As previously mentioned, this study aims to gain an “understanding of the dimensionsconsidered relevant, as well as the perception(s) of these dimensions with regards to the USBE
brand”, i.e. to evaluate or depict the current state of the last phase.
It should be made clear that there is only one word in the Swedish language – varumärke –corresponding to the two English words trademark and brand. The English language differentiatethus between the legal asset (trademark) and the mean of competition (brand). From this comesthat a trademark, registered or not, is a necessity for the development of a brand.58 In this study,the focus will be on the brand as a mean of competition.
3.4 Definitions of a Brand
There are myriads of definitions of a brand in the marketing literature. Kotler defines a brand as;”a name, term, sign, symbol, or design, or a combination of these, intended to identify the goods
or services of one seller or group of sellers and to differentiate them from those of competitors”59.Aaker defines a brand as; “a distinguishing name and/or symbol (such as a logo, trademark, orpackage design) intended to identify the goods or services of either one seller or a group of
sellers, and to differentiate those goods or services from those of competitors. A brand thus
signals to the customer the source of the product, and protects both the customer and the
producer from competitors who would attempt to provide products that appear to be identical”60.
According to me, both these definition is somewhat narrow, maybe even obsolete, in that they donot take the increasingly important emotional aspects of branding into account. Ambler and
56 Håkansson, B. (2004), Det missförstådda varumärket: Myt och sanning om ”företagets främsta tillgång”,Helsingborg: Liljedahl & Co, p. 27-29
57 Ibid., p. 27-2958 Melin, F. (1997), p. 2059 Kotler, P. (2003), p. 41860 Aaker, D.A. (1991), p. 7

15
Styles would call Kotler’s and Aaker’s approaches to define a brand product plus approaches inwhich the primary task of the brand is to be a product identifier. An alternative approach wouldbe the holistic view. This approach focuses on the brand itself, and considers it to be the sum ofall four marketing mix elements; product, price, promotion and distribution. A holistic approachdefinition would be that a brand is; “the promise of the bundles of attributes that someone buysand that provides satisfaction […] The attributes that make up a brand may be real or illusory,
rational or emotional, tangible or invisible”.61 The holistic approach definition is consequentlymore fit to today’s market situation since it acknowledges the emotional aspects of branding.
3.4.1 Brands and Services
Onkvisit and Shaw argue that “because of the intangible nature of services, the creation of aproper image is actually more critical for services marketing than for product marketing”62. Ifthis is the case, the brand should be an important part of the image creation process in a servicecontext. We will not venture into a discussion if this argument is valid in general, but based onthe reasoning in opening section 1.1, it could be argued that the importance of brands is greaterthan ever before in the very type of service sector this study deals with, i.e. higher education.
Given that the holistic approach definition touches upon one of the chief differences betweenproducts and services – intangibility – the definition might also be a more appropriate way ofdefining a brand in a service context. If, in accordance to the holistic view, a brand is the sum ofall marketing mix elements, then the additional marketing mix elements of services should beincluded as well. These additional elements, i.e. people, physical evidence, and processes, can allserve as tangible cues that facilitate consumers’ evaluation of the service experience63.
3.4.2 Brands as Places and Destinations
With regards to the aim of the study, it might also be of interest how a place or destination brandis defined given that one can expect people’s image of the region in which the business school issituated to affect their perception(s) about the business school’s brand.
Influenced by Aaker’s generic brand definition, Ritchie and Ritchie propose a destination branddefinition; “a destination brand is a name, symbol, logo, word mark or other graphic that bothidentifies and differentiates the destination; furthermore, it conveys the promise of a memorable
travel experience that is uniquely associated with the destination; it also serves to consolidate
and reinforce the recollection of pleasurable memories of the destination experience”64. Note theadded focus on the memorable travel experience, which according to the authors is the veryessence of leisure travel.
61 Ambler, T. & Styles, C. (1997), Brand Development Versus New Product Development: Toward a Process Modelof Extension Decisions, Product and Brand Management, Vol. 6, No. 4, p. 222-223
62 Onkvisit, S. & Shaw, J. (1989), Services Marketing: Image, Branding, and Competition, Business Horizons, Vol.32, Issue 1, p. 13
63 Zeithaml, V.A. & Bitner, M.J. (2003), Services Marketing: Integrating Customer Focus Across the Firm, 3rd ED,New York, NY: Mc Graw-Hill, p. 24
64 Ritchie, J.R.B. & Ritchie, R.J.B. (1998), The Branding of Tourist Destinations – Past Achievements and FutureChallenges, A Basic Report Prepared for Presentation to the 1998 Annual Congress of the InternationalAssociation of Scientific Experts in Tourism, p. 17

16
The management of USBE has to consider that USBE and Umeå City and region areinterconnected in the minds of consumers. This means that the destination as such should beincluded into a definition of the USBE brand and be visible in the communication. Judging fromUSBE’s current communication material, the management seems to be aware of this given thatUmeå City and region are often mentioned and described in the material.
3.4.3 Definition of a Business School’s Brand
For the sake of this study, a holistic approach definition that encompasses the additionalmarketing mix elements of services as well as the conveyed promise of a memorable experiencefrom a destination brand definition will serve as a definition of a business school’s brand;
A business school’s brand is the promise of the bundles of attributes that prospective students,
present students, and other internal and external stakeholders encounter and that serves to
identify and differentiate the school from competitors. The attributes that make up the school’s
brand may be real or illusory, rational or emotional, tangible or intangible and will all convey
the promise of a memorable experience that is uniquely associated with the school (and the city
in which it is situated).
When comparing this definition with the original holistic approach definition you may note thatsomeone has been removed and replaced by prospective students, present students, and otherinternal and external stakeholders in order to specify the stakeholder groups while at the sametime not excluding any. I have also added serves to identify and differentiate from Kotler’sdefinition since it is a fundamental function of a brand. Further, I have replaced buys byencounters since it will not be necessary to buy something in order to experience a businessschool’s bundles of attributes. Provides satisfaction was left out since it is not necessarily truethat the attributes will provide satisfaction, they may also provide dissatisfaction that will affectthe brand equity in a negative way. Finally, and will all convey the promise of a memorableexperience that is uniquely associated with the school (and the city in which it is situated) wasadded in order to include the destination aspect of a business school’s brand.
3.5 A Brief Look at the Meaning of Brands in Modern Times
In the twentieth century, the function of brands as means of competition increased. A brandprovided the producer or seller with great advantages if it could help him differentiate from therest of the market, and through that better withstand competition. As a consequence of this, a shiftfrom pure commodities to branded products took place. Through the use of brand associationscreated by the help of product attributes, packages, names, advertising, and distribution strategies,brands became a mean of competition.65 Gardner and Levy touched upon this in 1955 when theywrote; “a brand name is more than the label employed to differentiate among the manufacturersof a product. It is a complex symbol that represents a variety of ideas and attributes. It tells the
consumers many things, […] via the body of associations it has built up and acquired as a public
object over a period of time”66. The legendary advertising man David Ogilvy also touched upon itin 1963 when he wrote; “during the last few years the researchers have been able to tell us what
65 Aaker, D.A. (1991), p. 7-866 Gardner, B.B. & Levy, S.J. (1955), The Product and the Brand, Harvard Business Review, Vol. 33, Issue 2, p. 35

17
image old brands have acquired in the public mind”67. Both these quotes express a more holisticbrand view, and can in a way be seen as representative of the beginning of the thoughts thateventually were defined and popularized in the late ‘80s/early ‘90s under the name of brandequity.
3.6 The Concept of Brand Equity and its Underlying Assets
Since the late ‘80s and early ‘90s, the concept of brand equity has caught the attention of manyacademics and practitioners68. The interdisciplinary nature of brand equity makes it amultifaceted construct including a variety of theories found within the marketing academia butalso from nearby fields of research such as social psychology and economics. There are twobroad perspectives on the concept; a financial- and a consumer perspective. A financial
perspective focuses on the financial value provided by a brand to a firm, whereas a consumerperspective focuses on the perceived value a brand provides to consumers.69 It is obvious thatthese two perspectives are very interconnected with each other since perceived added value forconsumers most likely results in financial added value for the firm through higher sales andmargins. Some academics chose to refer to the concept as consumer-based brand equity andothers as brand equity, although both expressions take the consumer perspective if not explicitlystated that the financial perspective is being considered. This study will not deal with thefinancial perspective, and the expressions consumer-based brand equity and brand equity willtherefore be used interchangeably.
At a conceptual level, researchers have managed to propose somewhat comparable definitions ofbrand equity, and we will now look closer on two of the most cited and well known70.
3.6.1 Aaker’s Conceptualization of Brand Equity
Aaker defines brand equity as; “a set of brand assets and liabilities linked to a brand, its nameand symbol, that add to or subtract from the value provided by a product or service to a firm
and/or to that firm’s customers”71. The definition is very encompassing and makes clear that thebrand can also be a liability if not managed correctly. He conceptualizes brand equity in a model(see Figure 3.2) as composed of five dimensions representing the sources and outcomes of brandequity (brand loyalty, brand awareness, perceived quality, brand associations, and otherproprietary brand assets). The last dimension, other proprietary brand assets, refers to patents,trademarks, channel relationships, etc. that the firm holds.72 As Melin argues, this dimensioncreates no value for the consumers and we will therefore not discuss it any further in this study.73
Aaker’s primary focus is on the consumer, but as can be seen in the bottom right side of figure3.2 does he also argue for how brand equity can provide value to the firm.
67 Ogilvy, D. (1964), Confessions of an Advertising Man, New York, NY: Dell Publishing Co., p. 12668 See; Melin, F. (1999), Varumärkesstrategi: Om konsten att utveckla starka varumärken, Malmö: Liber Ekonomi,p. 45; and Keller, K.L. (1998), p. 42
69 Pappu, R., Quester, P.G. & Cooksey, R.W. (2005), p. 14470 Park, C.S. & Srinivasan, V. (1994), p. 27171 Aaker, D.A. (1991), p. 15-1672 Ibid., p. 1673 Melin, F. (1999), p. 48

18
Figure 3.2 – Aaker’s Conceptualization of Brand Equity74
3.6.2 Keller’s Conceptualization of Brand Equity
Keller defines consumer-based brand equity as; “the differential effect that brand knowledge hason consumer response to the marketing of that brand”75. He continues by explaining that equityis said to be positive (negative) if consumers react more positively (negatively) to a product andits marketing activities when they can identify the brand as to when they are unable to identifythe brand76.
Keller considers brand knowledge – consisting of brand awareness and -associations – to be “thekey to creating brand equity” (see the middle boxes in Figure 3.3)77. Both these dimensions canbe found in Aaker’s conceptualization as well, but they are not considered more central in it thanany other dimensions.
74 Aaker, D.A. (1991), p. 075 Keller, K.L. (1998), p. 4576 Ibid.77 Keller, K.L. (1998), p. 46

19
Figure 3.3 – Keller’s Conceptualization of Customer Based-Brand Equity78
Notice the similarities between the two conceptualizations; all of Aaker’s dimensions can befound in Keller’s model except from perceived quality and some of the other proprietary brandassets. However, one can argue in accordance with Melin that perceived quality is a type of brandassociation and through that included in Keller’s conceptualization as well79.
3.6.3 Choice of Conceptualization
There are more definitions, but the ones provided by Aaker and Keller are among the mostrecognized and are more than sufficient to illustrate the idea that brand equity is composed of aset of value creating or destroying dimensions that take shape in the minds of consumers and areclosely related to the marketing activities of a brand. In these conceptualizations, there is a greatdeal of causal interrelationships present between the dimensions, which sometimes mayconfound. For example, certain brands are known for their high quality – perceived quality couldtherefore have an effect on brand loyalty, which results in that quality affects brand equitythrough loyalty. These causal interrelationships should not constitute a problem for this study butit is important to be aware of their existence.
For the sake of this study, I have chosen to use Keller’s definition of brand equity since I believethat it captures the essence off the brand equity concept in a short comprehensible paragraphincluding the key dimension brand knowledge. Therefore, brand equity is; “the differential effectthat brand knowledge has on consumer response to the marketing of that brand”80. However, Iwill in accordance with Aaker chose to emphasize the quality dimension in the conceptualframework given its expected key importance in the context of this study.
It is important that no matter which way you choose to look at brand equity, in the end it willalways be the result of the consumers’ words and actions. The consumers have the power todecide which brands have high respectively low brand equity and they do so based on the factors
78 Keller, K.L. (1998), p. 6979 Melin, F. (1999), p. 4880 Keller, K.L. (1998), p. 45

20
that they find important. This means that in the end, as Hoeffler and Keller argue, all approachesto brand equity appear to share a common foundation in that they “either implicitly or explicitlyrely on brand knowledge structures in the mind of consumers – individuals or organizations – as
the source or foundation of brand equity”.81 It was for this reason that I chose to open this chapterin section 3.1 with an overview of these knowledge and memory principles.
As previously stated, Keller considers brand knowledge to be the source of brand equity, whichexplains its central position in his conceptualization. Brand knowledge is composed of brandawareness and -image (see Figure 3.4), and we will now proceed to a more in-depth review ofthese dimensions.
3.7 Brand Awareness – Recall and Recognition
The first dimension of brand knowledge is brand awareness. Brand awareness is defined in apurchase situation as “the buyer’s ability to identify (recognize or recall) the brand within thecategory in sufficient detail to make a purchase”, or in non-purchase situation as the buyer’sability to identify the brand and “to propose, recommend, choose, or use the brand,
respectively”82. As you recall, brand awareness is closely related to the associative networkmodel of consumers’ memory described in section 3.1.1. In that model, the strength ofassociations (i.e. the strength of the links) determines how easily information can be retrieved, i.e.strong links to a brand node equals high brand awareness83.
Figure 3.4 – Keller’s Conceptualization of Brand Knowledge – the Source of Brand Equity84
High brand awareness will increase the probability that the brand will be included in aconsumer’s consideration set85. It will also influence the creation of additional associations andstrengthen present ones, which in the long run will increase the probability that the brand will be
81 Hoeffler, S. & Keller, K.L. (2003), The Marketing advantage of Strong Brands, Brand Management, Vol. 10, No.6, p. 421
82 Rossiter, J.R. & Percy, L. (1987), p. 14083 Lerman, D. & Garbarino, E. (2002), p. 62484 Keller, K.L (1998), p. 9485 Nedungadi, P. (1990), p. 264

21
included even more.86 “Brand awareness must [therefore] precede brand attitude”, since aconsumer has to be aware of the brand before (s)he can form an attitude and image of it87.
Even though the importance of awareness varies across business sectors, a study conducted byAaker shows that name recognition/high profile (which can be translated into high awareness)was the third (out of 32) most common sustainable competitive advantage among the 248businesses included in the study88. It should therefore be a priority for most firms to create highbrand awareness among their stakeholders.
In order to classify how easily information can be retrieved, tests of recall and recognition areused. In an unaided recall test, the consumer is asked to mention all brands that come to mindwhen prompted by a certain product category. The first brand that comes to mind is said to be topof mind. Thus, the top of mind brand together with the other brands that the consumer recallsconstitutes the consumer’s consideration set for the specific product category. In an aidedrecognition test, the consumer is presented with several brand names in a certain product categoryand then asked to identify the ones heard of before.89 The identified brands will constitute theconsideration set in the same way as the recalled brands did and therefore have a greater chanceof being selected on a choice occasion. Recognition can also be assessed through more subtletests in which the brand has been “perceptually degraded”, e.g. certain letters can be left out in aselection of brand names, and the consumer is then asked to fill in the gaps in order to completethe names90.
Brand awareness will occur to various extents through recall or recognition depending on theproduct category and the most common type of choice occasion associated with it. Therefore,managers have much to gain if they can assess the most likely choice occasion consumers willface.91 Awareness through recognition may for example be more common in in-store decisionsituations such as for groceries92. For USBE’s part, the most common choice occasion forprospective students will most likely involve a rather conscious and mature choice based onrecall, given the importance of the decision.
Awareness can generate value in several ways. First and foremost, it can act as a base upon whichassociations can be built. This is the foundation of all marketing communication - allcommunicated attributes need a brand name to which they can be associated. Brand awarenesscan also give consumers the real or fictitious impression that the brand/company has a highmarket presence, is committed, and have substance. Increased brand awareness is also likely toraise consumers’ familiarity with a brand, which may strengthen the brand’s competitive
86 Keller, K.L. (1993), p. 387 Rossiter, J.R. & Percy, L. (1987), p. 14188 Aaker, D.A. (1989), Managing Assets and Skills: The Key to a Sustainable Competitive Advantage, CaliforniaManagement Review, Vol. 31, Issue 2, p. 93-95
89 Kapferer, J.-N. (1997), Strategic Brand Management – Creating and Sustaining Brand Equity Long Term, 2nd ED,London: Kogan Page, p. 137
90 Keller, K.L. (1998), p. 327-32891 Rossiter, J.R. & Percy, L. (1987), p. 14292 Keller, K.L. (1993), p. 3

22
advantage.93 Brand familiarity reflects a consumer’s level of experience, both direct and indirect,with a product/brand94. Kent and Allen argue that familiar brands have an advantage in thatconsumers seem to better remember new product information for these brands and thatconsumers’ memory for advertising of familiar brands is less prone to be affected by competitors’advertising95.
3.8 Brand Image – Made up of Associations
The second dimension of brand knowledge is brand image. In a marketing context, image can bedefined as; “perceptions about a brand as reflected by the brand associations held in consumermemory”96. A consistent and effective brand image that “communicates the needs satisfied by thebrand” can build and maintain brand equity as well as reduce brand parity97. Image isconceptualized by the type, favorability, strength, and uniqueness of associations linked to thetarget concept/node in the associative network98. We will now study these concepts morethoroughly, beginning with the types of associations (see Figure 3.4).
Three types of associations can be identified, attributes, benefits and attitudes. These threeassociations are of increasing level of abstraction, which means that attributes contain the leastinformation, benefits more, and attitudes the most information.99
3.8.1 Types of Associations – Attributes
Attributes refer to descriptive features used to characterize a brand, product or service, they canbe both product-related and non-product-related (see Figure 3.4). Product-related attributesdetermine “the nature and level of product performance” and are often indispensable for theproduct or service to function properly100. For a business school, these attributes could forexample be the school buildings, student housing, lecturers, etc. Non-product-related attributeson the other hand, are external aspects associated with the acquisition or utilization of the productor service. These non-product-related attributes can be categorized into four kinds. The first twoare price information, e.g. expensive or budget, and packaging or product appearanceinformation, e.g. information booklets or webpages.101 In the context of this study, priceinformation could be thought of as the level of financial compensation students receive at theirfirst employment after graduation, which is often a source of comparison between different seatsof learning. Both these attributes can be important indicators of quality for consumers and the
93 Aaker, D.A. (1991), p. 64-6994 Alba, J.W. & Hutchinson, J.W. (1987), Dimensions of Consumer Expertise, Journal of Consumer Research, Vol.13, Issue 4, p. 411
95 Kent, R.J. & Allen, C.T. (1994), Competitive Interference Effects in Consumer Memory for Advertising: The roleof Brand Familiarity, Journal of Marketing, Vol. 58, Issue 3, p. 103
96 Keller, K.L. (1993), p. 397 Roth, M. (1992), Depth Versus Breadth Strategies for Global Brand Image Management, Journal of Advertising,Vol. 21, Issue 2, p. 25
98 Keller, K.L. (1993), p. 3-499 Ibid., p. 3-4100 Ibid., p. 93101 Ibid., p. 4

23
firm should therefore not neglect them102. The remaining two non-product-related attributes areclosely related; user imagery refers to the type of person one could expect to utilize the productor service, e.g. intelligent people study at school X, and usage imagery refers to the typicalsituation in which the product or service is used, e.g. all people who have attended school X arelikely to have successful careers. Both these attributes are very influenced by word-of-mouth andother social influences which are hard to control, it is therefore important to monitor the targetsegments’ perception(s) of them.103
The identification and management of all the attributes that give rise to associations, bothproduct-related and non-product-related are vital for a business school since the attributes arelikely to play an important role in the categorization and evaluation process prospective studentsundergo before choosing where to study. If the attributes are important for students but neglectedon a managerial and operational level, chances are that the business school will not be included inprospective students’ consideration sets. Chances are also that prospective students’ perception(s)of a school’s attributes do not reflect their real or true state, e.g. a prospective student mightbelieve that it is impossible to find student housing in Umeå because (s)he heard this from afriend’s friend two years ago, even though there are now plenty of newly built student houses.With respect to both financial resources and areas of responsibility, it is obvious that all attributesof a business school cannot be fully controlled for. However, if significant or faulty ones can beidentified, the communication can be adjusted accordingly in order to strengthen the level ofassociation or correct for faulty attribute perceptions. This is important not just forcommunication targeted at prospective students, but also for communication targeted at otherexternal stakeholders such as corporate and community representatives.
3.8.2 Types of Associations – Benefits
The second type of associations are benefits. Benefits refer to the “subjective rewards soughtfrom attributes”, i.e. what the individual consumer wants from the product or service104. They canbe divided into functional benefits which are the intrinsic rewards associated with theconsumption of a product or service, e.g. to quench thirst with a bottle of mineral water. Thenext, experiential benefits refer to the feelings one gets from consuming or using the product orservice, e.g. the reward of feeling intelligent after passing a difficult exam. While the first twotypes of benefits are more associated to the product-related attributes, the third type – symbolicbenefits – are more associated with the non-product-related attributes and humans’ underlyingneed for social approval or expression. Symbolic benefits refer to the more extrinsic rewardsassociated with the consumption of a product or service, e.g. wearing luxury products makes youfeel luxurious.105
A similar reasoning as with the symbolic benefits will be discussed in section 3.11.1 where theabstract dimensions consumers use to evaluate product quality will be described. One of thesedimensions is prestige, which reflects the products ability to communicate superiority to the
102 Brucks, M., Zeithaml, V.A. & Naylor, G. (2000), Price and Brand Name as Indicator of Quality Dimensions forConsumer Durables, Journal of the Academy of Marketing Science, Vol. 28, No. 3, p. 364
103 Keller, K.L. (1993), p. 4-10104 Rossiter, J.R. & Percy, L. (1987), p. 151105 Keller, K.L. (1993), p. 4

24
owner as well as to relevant social groups for him or her. It is composed of a tangible componentsuch as the appearance or look of the product, and a “less tangible social component that isreflected in the product or brand’s image” and serves to fulfill a symbolic need, e.g. egoidentification or group membership.106
The self-image congruence model, which proposes that consumers through a process of cognitivematching will choose products with attributes that match their self-image, can be seen as anextension of the symbolic benefits and their association to the non-product-related attributes andhumans’ underlying need for social approval or expression107. With regards to this model andprospective students, a very important attribute in an educational setting should be the non-product-related attribute user imagery. For example, a prospective student may not even considerto apply to USBE because s(he) finds it unlikely that (s)he will find the kind of people withwhich (s)he likes to socialize. This reasoning highlights once again the importance of goodcommunication.
When communicating benefits, it is important to remember that they must always be linked tomotivation. Marketers must therefore find out what motivation(s) the target segment have for thebenefit in question.108 For example, the benefit of getting an education could be a first-classcareer, but the motivation for this could be several, e.g. to feel secure, to become financiallyindependent, etc. It is obvious that the communication cannot be adapted to all different types ofmotivations, but some will most likely be more salient in the target segment and therefore moresuitable to communicate.
3.8.3 Types of Associations – Attitudes
Brand or product attitudes are commonly used to “predict preferences among brands, buyingintentions, or actual choice behavior”109. In a broad marketing sense, an attitude is “a lasting,general evaluation of people (including oneself), objects, advertisements, or issues”110. Thespecific person, object or issue being considered is referred to as an attitude object111. Hence, abrand attitude reflects a consumer’s general evaluation of a brand. Brand attitudes are complexbut very important since “prospective buyers have to develop a favorable attitude toward thebrand before they will buy it”112. As stated previously, attitudes are the type of association withthe highest level of abstraction, i.e. they contain the most information. They can be related toindividual lower level associations (i.e. attributes and/or benefits) but also to the brand ingeneral.113 This means that consumers form attitudes based on a brand’s attributes and benefits aswell as on the brand as a whole.
106 Brucks, M., Zeithaml, V.A. & Naylor, G. (2000), p. 361107 Solomon, M.R. (2004), p. 156108 Rossiter, J.R. & Percy, L. (1987), p. 150-151109 Ajzen, I. & Fishbein, M. (1980), Understanding Attitudes and Predicting Social Behavior, Englewood Cliffs:Prentice Hall, p. 159
110 Solomon, M.R. (2004), p. 224111 Hewstone, M., Stroebe, W., Codol, J.P. & Stephenson, G.M. (1988), Introduction to Social Psychology, Oxford:Basil Blackwell, p. 445
112 Rossiter, J.R. & Percy, L. (1987), p. 134113 Keller, K.L. (1993), p. 5

25
The different theories of attitude formation are outside the scope of this study given theircomplexity and the fact that they will not provide much with regards to the research question114.Nevertheless, there is one key aspect of attitudes that deserve attention before proceeding.
Marketers have to remember that positive brand attitudes do not always imply a purchasebehavior. Ajzen and Fishbein showed that the there is not always a correlation between attitudestoward a certain brand and the attitude toward “performing a particular behavior with respect tothe brand”, e.g. buying the brand or using the product.115 This holds particularly true in the caseof rather large purchase decisions, such as for example the decision of where-to-study-for-four-years. A better way to predict behavior would instead be to asses the consumers’ attitudes towardbuying/utilizing the brand, or in the context of this study; prospective students’ attitudes towardattending USBE, and the so-called subjective norms with respect to do this, i.e. what theconsumer believes other people in his or her surrounding think (s)he should do with regards tobuying/utilizing the brand, i.e. a kind of social pressure.116 For example, a prospective studentwho considers studying at USBE may find the education and city of Umeå very good andtherefore develop a positive attitude toward USBE. But (s)he may at the same time realize that(s)he will have to leave all long-time friends back home if (s)he moves there (attitude towardbuying/utilizing the brand), and might also be afraid of what these friends will think if (s)he doesthat (subjective norm). This means that even if USBE is positively evaluated, there are otherselements that may hinder a prospective student from applying. It is beyond the scope of thisthesis to thoroughly explore the attitudes toward attending USBE and the subjective normsamong prospective students with a positive attitude toward USBE. Nevertheless, these conceptsshould preferably be given further attention in future studies given the importance to understandthe reasoning of prospective students who have formed positive attitudes toward USBE butdecided not to apply.
3.8.4 Variations of Associations – Favorability, Strength, and Uniqueness
Every person’s associations (i.e. attributes, benefits and attitudes) may vary as a result of theirstrength, favorability and uniqueness. Strength refers to how strong the links to the nodes thatcontain the associations are in the associative network. The links’ strength depends on thequantity and quality of processing the information receives, i.e. how much and in what way theconsumer thinks about the information. If the association is given much time and meaning, thelinks will become stronger and the information more easily recognized or recalled, i.e. theassociations will have a higher level of awareness. Favorability is highly related to attitudes sinceit refers to how the consumer evaluates attributes and benefits. In addition, the perceivedfavorability of attributes or benefit is related to the perceived importance, i.e. consumers will notform favorable associations to attributes and benefits that they consider unimportant. Finally,uniqueness refers to how exclusive the associations are, i.e. if there are competing brands,products or services that have similar associations. Most associations will be shared among anumber of other brands, products or services, which will facilitate the formation of categories
114 For a general overview of attitude formation see: Ajzen, I. & Fishbein, M. (1980), Understanding Attitudes andPredicting Social Behavior, Englewood Cliffs, NJ: Prentice Hall, and Albarracin, D., Johnson, B.T. & Zanna,M.P. (Eds.) (2005), The Handbook of Attitudes, Mahwah, NJ: Lawrence Erlbaum Associates
115 Ajzen, I. & Fishbein, M. (1980), p. 161116 Ibid., p. 160-165

26
discussed in section 3.1.2. Based on the categorization, consumers are likely to consider certainattributes or benefits as prototypical and essential for the category, which means that theseattributes have to be present in order for the brand, product, or service to be included in thespecific category. For example, in order to be included in the business school category, theschools might have to offer certain courses. It is obvious that in such a large category, certainattributes will be shared among the members and it will therefore be the strength of the uniqueassociations that determines the level of awareness for individual category members, e.g. amongall business schools in Sweden, only a few have strong and unique associations that make themstand out from the others.117
3.8.5 Positioning
The uniqueness of associations is closely related to the concepts of differentiation andpositioning, which were touched upon in section 3.2, and the creation of a unique position for thebrand, product, or service in the minds of consumers. When developing position strategies, Melinemphasizes the importance to first assess and identify a firm’s competitive advantages, and basedon these develop what he calls an “associative added value” that will help to establish a uniqueposition in the minds of consumers118. He also emphasizes the importance to initially establish aconsensus for the position within the own organization before it can be successfully establishedexternally among consumers119. An awkward but interesting definition of positioning is one usedby several large advertising agencies. They choose to define positioning as a statement in threesteps; 1- To (target audience) 2- X is the brand of (category need) 3- that offers (brand benefit orbenefits)120. If that position statement was to be applied on USBE, it could for example be; Toprospective business students (target audience), USBE is the brand of higher business education(category need) that offers high quality education in a modern and dynamic setting (brand benefitor benefits). Of course, USBE’s benefits, or associative added value, have to be identified andshould hopefully be a bit more creative than in the example.
3.9 Perceived Quality
Quality is considered a key determinant of customer satisfaction and the management of it ishence an important part of a firm’s business functions121. A confirmation of the significance isprovided by Aaker’s study previously mentioned, in which he found that the number onesustainable advantage among the 248 businesses was a reputation for quality122. Although endlessquality control initiatives and concepts have attempted to overcome the challenges associatedwith quality management, the concept’s multidimensional nature makes matters complicated.
117 Keller, K.L. (1993), p. 5-6118 Melin, F. (1999), p. 238119 Ibid., p. 236120 Rossiter, J.R. & Percy, L. (1987), p. 183121 Menon, A. & Chowdhury, J. (1995), Dimensions of Quality: Considerations in the Context of Consumer Goods,Journal of Marketing Management, Vol. 5, Issue 1, p. 1
122 Aaker, D.A. (1989), p. 93-95
27
Perceived quality is defined by Zeithaml as a “consumer’s judgment about a product’s overallexcellence or superiority”123. It is made up in the minds of consumers of selected dimensions andtherefore by definition different from actual or objective quality, which, if existent, shoulddemonstrate a “measurable and verifiable superiority” on certain attributes124. Themultidimensionality of the concept is reflected in the literature, which is full of accounts of theright number of dimensions to consider. Garvin, who himself propose eight dimensions, statesthat all companies cannot pursue all dimensions simultaneously without making trade-offs orcharging extreme price premiums. Rather, they should focus on selected dimensions and create aunique quality-niche, which will allow them to outperform competitors.125 This is supported byMenon and Chowdhury who conclude a study by saying that the dimensions’ “significance willvary depending upon the strategic characteristics of the firm and its products”126. As a result, andas Brucks, Zeithaml, and Naylor conclude, “it behooves the manager to determine whatdimensions of quality consumers believe are relevant for the product category”, as well as if theyperceive brand and price as relevant cues to judge these dimensions127.
3.9.1 Perceived Quality Generates Value
Perceived quality generates value in several ways for a firm. First and foremost, it can provide areason-to-buy for customers in purchase situations where they do not have the resources,competences and/or time to make an objective quality assessment. Moreover, an acknowledgeddifferentiated quality position on the market can generate value since a reputation for qualityprovides an opportunity for the firm to charge price premiums. Chances are also that a qualityreputation increases the effects of marketing programs, and as a result affects sales128. Not toosurprisingly can price premiums also strengthen the perceived quality, as demonstrated byBrucks, Zeithaml, and Naylor who found support for price being a strong cue to the (product)quality dimension prestige129. By extending the reasoning from 3.8.1 – in which the non-product-related attribute price information could be thought of as the level of financial compensation thatstudents receive at their first employment after graduation – it could be expected that this levelfunctions as a cue to the prestige connected to certain seats of learning.
In addition, the price cue might be of particular importance for an international school such asUSBE. When for example a prospective student in China chooses between studying at anexclusive Business School in the US, which commands considerable tuition fees, or USBE thatcommands no tuition fees apart from the student union’s fee. What will his or her qualityperception of USBE be, if (s)he perceives price to be a cue to quality? Even if USBE isprohibited to charge tuition fees, knowledge of this price-quality relationship is important inorder to adapt suitable communication strategies.
123 Zeithaml, V.A. (1988), Consumer Perceptions of Price, Quality, and Value: A Means-End Model and Synthesisof Evidence, Journal of Marketing, Vol. 52, Issue 3, p. 3
124 Ibid., p. 4125 Garvin, D.A. (1987), Competing on the Eight Dimensions of Quality, Harvard Business Review, Vol. 65, Issue 6,p. 108
126 Menon, A. & Chowdhury, J. (1995), p. 12127 Brucks, M., Zeithaml, V.A. & Naylor, G. (2000), p. 372128 Aaker, D.A. (1991), p. 86-88129 Brucks, M., Zeithaml, V.A. & Naylor, G. (2000), p. 370

28
Findings also indicate that potential brand extensions will stretch farther if the brand is perceivedas having high quality compared to average quality130. Even if USBE does not plan to extend theirbrand far, high perceived quality could provide credence to research conducted in their name andtheir EMBA Prague Program™ in the Czech Republic. High perceived quality could alsofacilitate relationships with channel members since their image can be improved if they deal withquality products and/or services131. This could for example translate into improved corporate andcommunity relations for USBE, which in turn could pay of financially as well as image wise forboth the institution and for graduates applying for their first job after graduation.
In order to better understand how quality perceptions take shape, we will now continue bystudying the concepts of service- and product quality, and their underlying dimensions.
3.10 Dimensions of Service Quality
There are several different perspectives on how service quality can be conceptualized. In an effortto integrate the main perspectives into one comprehensible model, Brady and Cronin present aresearch model of service quality that appears rather robust in describing service quality on aconceptual level. The model is a hierarchical conceptualization that comprises three primarydimensions, which in turn are composed of three subdimensions each, which are evaluated withregards to three underlying modifiers (see Figure 3.5). The overall assessment of service qualityis then based on the combined assessment of all dimensions.132
Let us examine the model more thoroughly beginning with each of the three primary dimensionsand their individual subdimensions that form customers’ quality perception of services. Keep inmind that the model is a general model, and some modifications will be necessary in order for itto fit specific industries better.
3.10.1 Interaction Quality
Interaction quality addresses the moment of truth or service encounter, which occurs when acustomer interacts with a service provider. Depending on the type of service, the number ofencounters will vary. A prospective student could for example have service encounters with abusiness school when (s)he meets a lecturer in class or buys a coup of coffee in the cafeteria.133
Given the intangible nature of services and the simultaneous production and consumption(prosumption), the perceived quality of the encounter during service delivery becomes a keydeterminant of the overall service quality perception. The underlying dimensions, whichdetermine the interaction quality, are the employees’ attitude, behavior, and/or expertise134. It isobvious that an optimistic lecturer (attitude) who patiently explains and encourage students
130 Keller, K.L. & Aaker, D.A. (1992) The Effects of Sequential Introduction of Brand Extensions, Journal ofMarketing Research, Vol. 29, Issue 1: p. 44
131 Aaker, D.A. (1991), p. 88132 Brady, M.K. & Cronin Jr., J.J. (2001), Some New Thoughts on Conceptualizing Perceived Service Quality: AHierarchical Approach, Journal of Marketing, Vol. 65, Issue 3, p. 34-46
133 Zeithaml, V.A. & Bitner, M.J. (2003), p. 99-100134 Ibid., p. 38

29
(behavior) when they run into challenges, and who knows the subject thoroughly (expertise) willhave a positive impact on the perceived interaction quality.
Figure 3.5 – Brady and Cronin’s Research Model of Service Quality135
(Modifiers of subdimensions: R: a reliability item, SP: a responsiveness item, E: an empathy item)
3.10.2 Physical Environment Quality
Physical environment quality refers to the quality of the tangible surroundings, which Bitnerrefers to as the servicescape, in which the service is performed136. The servicescape is filled withcues, which the customers use to assess the quality and capabilities of the firm. Moreover, it canalso have an impact on customers’ ultimate service satisfaction as well as the satisfaction,productivity and motivation of the firm’s employees.137 The underlying dimensions thatdetermine the quality of the physical environment are ambient conditions, facility design, andsocial factors. Ambient conditions refer to nonvisual aspects, e.g. the scent of newly groundedcoffee in the cafeteria or the indoor temperature. Facility design refers to the functional oraesthetic design of the environment, e.g. that the number of seats in the lecture hall cannotaccommodate all the students (functional) or the art on the walls are visually pleasing (aesthetic).The number and type of people that share the servicescape at the same time and their behaviorsmake up the third underlying dimension social factors, which addresses for example issues suchif a class is too big and noisy and therefore makes it difficult to concentrate.138
With regards to today’s technical advances and companies increasing presence on the Internet, Iwould like to propose the inclusion of an additional dimension in connection to the underlyingdimension facility design of physical environment quality. This dimension should consider thefunctional and aesthetic design of service providers’ websites. Hence, I choose to label itinteractive design. The reason for including this additional dimension is that the Internet hasbrought with it ways of delivering services in which customers are even more involved than in
135 Brady, M.K. & Cronin Jr., J.J. (2001), p. 37136 Bitner, M.J. (1992), Servicescapes: The Impact of Physical Surroundings on Customers and Employees, Journalof Marketing, Vol. 58, Issue 2, p. 58
137 Ibid., p. 57138 Brady, M.K. & Cronin Jr., J.J. (2001), p. 39

30
the case of face-to-face deliveries. This means that the interactive design of a company’s websitecan affect the service experience in much the same ways as the physical servicescape does.
3.10.3 Outcome Quality
Outcome quality refers to what Grönroos calls “technical quality”, which is what the serviceprovider actually does for the customer or what the customer has received when the service hasbeen provided139. For a student, the perceived outcome quality could for example depend on howsoon after graduation (s)he gets an employment or if (s)he feels that the courses in the programhave provided the knowledge and skills necessary for a successful career. The underlyingdimensions, which determine the outcome quality are waiting time, tangibles and valence.Waiting time refers to the customers’ perception of waiting time, e.g. if most students at school Xget a job offer before they have graduated, then the short waiting time has an positive effect onthe quality perception of that school.140 Tangibles refer to the physical evidences that customersuse to evaluate services prior to purchase and to “assess their satisfaction with the service duringand after consumption”141. Valence refers to the “essence of the service outcome above andbeyond waiting time and tangibles”142. As such, it takes attributes that determine if the customeris satisfied with the service outcome into consideration without considering the customer’sevaluation of other dimensions of the service experience. The reason Brady and Cronin includevalence into the model is that service quality in general is perceived as analogous to an attitude.As you remember from section 3.8.3, the summation and evaluation of the beliefs someone hastoward an object make up his or her attitude. The evaluation of beliefs will hence determine if theobject is regarded as favorable or unfavorable. Valence is analogous to this evaluation of beliefs.An example of this rather vague dimension could be that a student who does not pass an examjudge the service experience as unfavorable even if (s)he perceived the other dimensions ofservice quality to be positive. Research indicates that many valence shaping attributes cannot becontrolled for, but they are nonetheless important determinants of customers’ perceptions ofservice outcome quality.143
3.10.4 Modifiers of Subdimensions
In an attempt to capture how consumers evaluate each subdimension, Brady and Cronin positionselected items from Parasuraman, Zeithaml, and Berry’s SERVQUAL model as modifiers of thenine subdimensions. The selected items reliability, responsiveness and empathy are therefore notdirect determinants of service quality but descriptors of the nine subdimensions.144 Reliabilityassesses whether the service is performed in an accurate and dependable way. If for example alecturer has promised to correct and hand out an exam a certain date but fails to fulfill thepromise, then the subdimension waiting time could be perceived as being low on reliability.Responsiveness refers to the willingness or readiness of personnel to perform services. Theevaluation of a lecturer’s behavior or attitude (subdimensions) that cancels scheduled lecturers
139 Grönroos, C. (1996), Marknadsföring i tjänsteföretag, 3:3rd ED, Malmö: Liber Ekonomi, p. 56-57140 Brady, M.K. & Cronin Jr., J.J. (2001), p. 40141 Zeithaml, V.A. & Bitner, M.J. (2003), p. 282142 Brady, M.K. & Cronin Jr., J.J. (2001), p. 40143 Ibid.144 Ibid., p. 37-38

31
and is unavailable for his students will most likely be perceived as being low on responsiveness.The last modifier empathy, assesses the level of care and individualized attention customers aregiven. If a lecturer spends additional time in class explaining complex theories because (s)heunderstands the challenging nature of the subject, then the subdimensions behavior and attitudeare likely to be perceived as being high on empathy.145
One important aspect that I believe has been disregarded in Brandy and Cronins’sconceptualization is the comparison of customers’ expected service and perceived service thatcan be found in many other models of service quality. This comparison is for example central inGrönroos’s model of total perceived quality as well as in Parasuraman, Zeithaml, and Berry’sgap model of service quality and their SERVQUAL model146. One could argue that it is implicitlyincorporated into Brandy and Cronins’s model because the customer has to evaluate thedimensions and in doing that, (s)he is likely to make the comparison between expected andperceived service. Nonetheless, I believe the model would conceptualize service quality better ifthe comparison had been made more explicit in it.
3.11 Dimensions of Product Quality
It can be useful to briefly examine proposed dimensions of product quality even though USBE istypically considered a service provider. Brucks, Zeithaml, and Naylor propose a model of productquality in which perceived product quality results from the evaluation of selected abstract qualitydimensions, which in turn are influenced by marketing variables such as price, brand name, andproduct related attributes (see Figure 3.5).147
3.11.1 Abstract Product Quality Dimensions and their Influencers
The first abstract quality dimension ease of use refers to how easy or complicated users find it tooperate the product while versatility refers to the level and complexity of product features thatdistinguish it from other similar products. Durability refers to how long the product functions andhow robust its construction is, e.g. if it is reinforced. The dimension Serviceability assesses howcomplicated it is to get the product serviced as well as the responsiveness of service personneland reliability of the service as a whole. Notice that responsiveness and reliability areSERVQUAL items being used to evaluate the service dimension of product quality. Performanceassesses whether the product functions as it is supposed to and if it does it in a consistent/reliableway. The last abstract quality dimension prestige – which was already mentioned in 3.8.2 whendiscussing associations in the form of symbolic benefits – reflects the products ability tocommunicate superiority to the owner as well as to relevant social groups for him or her. It iscomposed of a tangible component such as the appearance or look of the product, and a “lesstangible social component that is reflected in the product or brand’s image” and serves to fulfill
145 Parasuraman, A., Zeithaml, V.A. & Berry, L.L. (1988), SERVQUAL: A Multi Item Scale for MeasuringConsumer Perceptions of Service Quality, Journal of Retailing, Vol. 64, No. 1, p. 23
146 See; Grönroos, C. (2000), Service Management and Marketing – A Customer Relationship ManagementApproach, 2nd ED, Chichester: John Wiley & Sons, p. 67; Zeithaml, V.A. & Bitner, M.J. (2003), p. 532; andParasuraman, A., Zeithaml, V.A. & Berry, L.L. (1985), p. 14
147 Brucks, M., Zeithaml, V.A. & Naylor, G. (2000), p. 359-374

32
a symbolic need, e.g. ego identification or group membership.148 Also Brucks, Zeithaml, andNaylor emphasize that it is the consumer who in the end chooses which dimensions to base theevaluation of quality on, and as a result the importance as well as the relevance of the individualdimensions will depend on the product or product category being evaluated149.
Figure 3.5 – Brucks, Zeithaml, and Naylor ’s Model of Product Quality150
The price and brand name influence on the abstract quality dimensions varies with regard todifferent factors. It is for example expected to be a weak correlation between price and perceivedquality when the performance dimension is considered important, and in contrast, it is expectedto be a strong correlation between price, brand name, and perceived quality when the prestigedimension is considered important.151
Notice that the notion of expectations in a way has been implicitly incorporated into the model,since consumers’ evaluation of the product performance dimension is partly based onexpectations.
In an educational service setting, the abstract dimension ease of use could for example refer tohow administrative matters are handled, how complicated it is to apply for new courses, to getaccess to computer labs, etc. Versatility could refer to something unique that the school has, e.g.an established network within the industry, or something else that distinguishes it from otherschools. Durability could be translated into the durability of the knowledge that the studentsacquire during their education. As always, knowledge is perishable, but the knowledge studentsacquire during their education can be more or less up-to-date. Serviceability is hard to translate toan educational setting and I have therefore chosen not to do so. The Performance dimensioncould assess if the education delivers what it has promised to deliver in its offer. Many times, thecommunication material from a school is full of information about what the students will learn if
148 Brucks, M., Zeithaml, V.A. & Naylor, G. (2000), p. 361149 Ibid., p. 362150 Ibid., p. 363151 Ibid., p. 372

33
they choose to study there – this information is likely to affect prospective students’ evaluationprocess. Finally, prestige is an acknowledged aspect for several seats of learning and most likelya very important quality dimension in the minds of prospective students.
3.12 Brand Loyalty
Oliver defines loyalty as; “a deeply held commitment to rebuy or repatronize a preferredproduct/service consistently in the future, thereby causing repetitive same-brand or same brand-
set purchasing, despite situational influences and marketing efforts having the potential to cause
switching behavior”152. Brand loyalty can thus be said to measure the level of attachmentcustomers have toward a brand. High levels of attachment have the potential to reduce marketingcosts given the old device that retaining old customers is not as expensive as it is to attract newones.153 Consequently, a company should pay attention to its customers and take care of theirrelations even after the services have been performed or the transactions made. This is afundamental concept in Customer Relationship Management (CRM) and it implies that themarketing efforts should be sustained, in order to continue to influence the customers and tostrengthen their ties to the company and brand. If the CRM is successful, the most loyalcustomers have the potential to become advocates who promote the brand without economicalcompensation.154 Loyal customers can thus provide reassurance to other customers who considerbuying the brand but need additional motivation155.
3.12.1 Proposed Antecedents of Loyalty
Even though it is very difficult to measure loyalty, proposed antecedents of the dimension areperceived customer value and -satisfaction. Further, switching costs can under conditions of highperceived customer value and -satisfaction function as an exit barrier and through that affectloyalty.156 Assuming this is true, then the schools with students that perceive the education to bevaluable and satisfactory should be more likely to have loyal students.
3.12.2 The Attitudinal- and Behavioral Aspects of Loyalty
The brand loyalty concept can be broken down into an attitudinal- and a behavioral aspect. Theattitudinal aspect refers to an emotional attachment to the brand whereas the behavioral aspectrefers to the fact that loyal customers are more prone to repeated purchases.157
Oliver notes that although there is a link between loyalty and satisfaction, it does not imply thatall satisfied customers are loyal even though most loyal customers are satisfied. The relationshipis thus said to be asymmetric. He continues by presenting four distinct development phases ofloyalty. Cognitive loyalty is a shallow state of loyalty based on brand beliefs such as price,
152 Oliver, R.L. (1999), p. 34153 Aaker, D.A. (1991), p. 39-46154 Gummesson, E. (2002), Relationsmarknadsföring: Från 4P till 30R, 3rd ED, Malmö: Liber Ekonomi, p. 31-32155 Aaker, D.A. (1991), p. 48156 Yang, Z. & Peterson, R.T. (2004), p. 801, 812-818157 Chaudhuri, A. & Holbrook, M.B. (2001), The Chain of Effects from Brand Trust and Brand Affect to BrandPerformance: The Role of Brand Loyalty, Journal of Marketing, Vol. 65, Issue 2, p. 81-82

34
attributes, performance levels, etc. The next phase is called affective loyalty, it is a deeper, butstill rather shallow state of loyalty achieved through the cumulative effect of several satisfyingusage occasions resulting in the development of a liking or attitude toward the brand. It is in thisphase that satisfaction by definition is achieved, i.e. a pleasurable fulfillment. The next phase,conative loyalty is a behavioral intention to buy (repurchase) the specific brand induced byrepeated positive affect experiences with it. Noteworthy is that this intention does not necessarilytranslate into action. The final phase is called action loyalty and it is signified by a readiness toact on the previous stage’s intention and a desire to overcome obstacles that might hinder the act,e.g. competitors’ sales promotion. If this course of events is repeated, repurchases will befacilitated through action inertia, i.e. the customer gets caught in a pattern of purchases. As theobservant reader may have noticed, there is a transition taking place from the attitudinal aspect ofloyalty in the first three phases, to the behavioral aspect of loyalty in the fourth and last phase.158
The effect of brand loyalty may be directly translated into future sales, and through that to futureprofits. But depending on the business context, this effect may vary significantly. An underlyingbasis of the loyalty dimension is that the loyalty has to be linked to the brand. Loyalty to a certainproduct or service would not create any value for a company, unless it had a monopolisticposition on the market, e.g. if you are loyal to the product cars, and Saab is the only available carmanufacturer. Moreover, Aaker states that brand loyalty is qualitatively different from the otherkey dimensions of brand equity in that it requires prior use experience to exist, while the othersdo not.159
However, if we consider the presented antecedents of brand loyalty – perceived customer valueand -satisfaction – a state of cognitive loyalty would most likely be possible if a customerperceives the value delivered by one company to be greater than the value delivered by othercompanies even if (s)he bases this merely on brand beliefs, i.e. without prior use experience. Itcould also be that a consumer after repeated use of one brand has reached an understanding ofwhat performance or attributes (s)he requires and (s)he knows that, based on information andtestimonials, another brand fulfills these requirements. The nature of the educational sectormakes any behavioral outcome of loyalty rather superfluous since the majority of students neverreturn to their school after graduation. However, a state of cognitive- of affective loyalty shouldbe possible to achieve and could be maintained and strengthened through alumni activitiesresulting in former students acting as advocates who promote their old school withoutendorsement. At the same time, it should also be possible for a student to develop a low state ofloyalty such as cognitive loyalty toward other schools than the one (s)he is attending, based onfor example information/communication material or testimonials from friends/others.
3.12.3 Loyalty and Services
It should be noted, as Zeithaml and Bitner argues, that consumers are more prone to loyalty whenit comes to services than to products as a result of the possible additional cost a change of servicebrands entails, the limited awareness or information of substituting services, the perceived higherrisk involved, and that repeated patronage often has a positive influence on the level of
158 Oliver, R.L. (1999), p. 35-36159 Aaker, D.A. (1991), p. 39-43

35
satisfaction.160 The additional cost may arise from initial fees required to obtain the service in firstplace or lost of a monetary stake involved, e.g. lost of air mileage points and benefits if youchange airline carrier. The limited awareness may result from the difficulty to acquire correctinformation about services. Even if the service provider states what the customer can expect,people tend to trust personal sources more when it comes to services since they can providetestimonials of the experience quality. Hence, a brand can be ignored simply because a customerdoes not know anyone who used it before. The perceived higher risk results from the nature ofservices, they are intangible, often lack guarantees or warranties, and cannot be completelystandardized, making it hard to replace a service if it fails to meet expectations. As aconsequence, the risk is perceived as higher. Furthermore, many services are too complex andspecialized for consumers to understand and evaluate, e.g. health care, and it is therefore notpossible to assess their quality in an appropriate way. The reason that repeated patronage oftenhas a positive influence on the level of satisfaction comes from the fact that the more frequentcustomer you are, the better service can you expect in most cases. For example, not until youreach a certain bonus level in the frequent flyer program will you be allowed to use the lounge.161
I would like to question the problem of acquiring accurate information about services in thecontext of this study. Given the nature of a business education, it is clear that information cannever be as certain as with products. But in today’s society, there are vast possibilities tocommunicate with present and former students even if you have no personal connection to them.The management of Umeå University seems to have realized this, and has used thecommunication potential of the Internet to let prospective students chat or read blogs written bypresent students, Ph. D students, and researchers. According to Umeå University’s Pro-Vice-Chancellor Åsa Bergenheim has this commitment tripled the traffic at their website compared tothe same period the year before,162
160 Zeithaml, V.A. & Bitner, M.J. (2003), p. 49161 Ibid., p. 39-41162 Larsson, J. (2006), Umeå universitet raggar studenter på Lunarstorm, IDG – Internetworld, Updated 2006-04-10,Retrieved 2006-11-05: http://internetworld.idg.se/
36
4 CONCEPTUAL FRAMEWORK, OPERATIONALIZATION OFCONCEPTS, AND SURVEY DESIGN
The theoretical concepts that were presented in the previous chapter will now be used to
develop a conceptual framework applicable to a business school’s brand and organization. The
concepts in the framework will then be operationalized and employed in a survey that will be
used to collect empirical data.
4.1 Conceptual Framework Development
The aim of this study stated that I would construct a conceptual brand equity frameworkapplicable to a business school’s brand and organization and based on this framework, conduct asurvey in order to gain understanding of both the dimensions that are considered relevant, aswell as the perception(s) of these dimensions with regards to the USBE brand. All this is in linewith my deductive approach, which calls for “a theory or a model that will depict the reality” 163.
The conceptual framework will be made up of the theoretical concepts that were presented in theprevious chapter. The definition of a business school’s brand that was introduced in section 3.4.3will be placed in top of the framework in order to illustrate that all brand equity dimensions foundbelow it comprise the foundation for the stakeholders’ perception(s) of a business school’s brand.
Contrary to Keller, I have chosen to include selected quality dimensions in the framework. Eventhough it can be argued that these dimensions are a type of brand associations, I have considereda more explicit inclusion of them necessary given their importance for a business school’s brandand organization.
The nature of the research question demands two samples (see section 5.1 for a full description ofthe sampling procedure and the samples). Therefore, the first year students at the selectedbusiness schools included in the study, except USBE, will henceforth be referred to as sample O,as in Others, and the first year and the senior students at USBE as sample U, as in USBE. Thesedenotations will facilitate for the reader to tell the samples apart which will be important in thediscussions that are to come.
4.2 Brand Knowledge in the Conceptual Framework
Brand knowledge, which is composed of brand awareness and – image (associations), is a keycomponent in the conceptual framework since it, according to Keller, is considered “the key tocreating brand equity”164.
4.2.1 Brand Awareness
The level of brand awareness is likely to be different between the two samples since sample Ualready attend USBE and is therefore expected to have an inherent high level of awareness. For
163 Johansson Lindfors, M.-B. (1993), Att utveckla kunskap – Om metodologiska och andra vägval vidsamhällsvetenskaplig kunskapsbildning, Lund: Studentlitteratur, p. 55
164 Keller, K.L (1998), p. 46

37
sample O, the level of brand awareness will provide insights into their levels of recall,recognition, and familiarity with the USBE brand.
4.2.2 Brand Image
As described in section 3.8, brand image is conceptualized by the type, favorability, strength, anduniqueness of associations linked to the target concept/node in the associative network. Thesefour factors are important for both samples since a consistent and effective brand image that“communicates the needs satisfied by the brand” can build and maintain brand equity as well asreduce brand parity165. It is expected that sample O will not have as many specific associations toUSBE as sample U but their associations will nonetheless be explored in order to understand ifany of them are more or less salient than others. The type, favorability, strength, and uniquenessof general associations, i.e. associations not specific to USBE, will be included in the frameworkin order to answer the first part of the research question; what are the relevant brand equitydimensions of a business school, or in the context of this study to find out what the determinantfactors of school choice are.
4.3 Quality in the Conceptual Framework
It is obvious that there are differences between the two samples with regards to the perception(s)of the quality dimensions. Sample O will only be able to share its perception of the expectedquality whereas sample U can describe the perceived quality. In addition, for sample U, theperceived quality can indirectly measure their satisfaction with USBE. Both service and productquality dimensions have been included in the framework since it is a mix of these that studentsencounter. The dimension of interactive quality design proposed in section 3.10.2 has also beenadded in connection to the design dimension of the physical environment quality. However, notethat the abstract product quality dimension serviceability is not included as argued for in section3.11.1.
4.4 Brand Loyalty in the Conceptual Framework
It is most unlikely that prospective students would be loyal to USBE. They can at bestdemonstrate a cognitive loyalty, but it is still very unlikely. As mentioned in section 3.12.2, thenature of the educational sector makes any behavioral outcome of loyalty rather superfluous, butsample U’s students can probably demonstrate an affective or conative brand loyalty towardUSBE. The level of loyalty is important since more loyal students are less likely to changeschools during their education. Moreover, students with high loyalty can also be expected to actas advocates who promote USBE without endorsement both during their education as well asafter graduation in the role of alumni.
4.5 The Conceptual Framework
All dimensions discussed above are included in the framework, which can be seen in Figure 4.1.In order to facilitate the understanding of it, certain underlying concepts of the differentdimensions have been omitted and it might therefore help to refer to the more detailed figures
165 Roth, M. (1992), p. 25

38
that were presented in chapter 3. As previously explained, not all dimensions are applicable toboth samples. However, I have chosen not to make any distinction between them in theframework with regards to the few affected dimensions.
Figure 4.1 – The Conceptual Framework of the Study
4.6 Operationalization of Concepts and Survey Design
The conceptual framework provides only an overview of the dimensions of interest. In order toassess the perception(s) of them, all dimensions have to be operationalized, i.e. described in away that allows for measurement166. All dimensions were therefore converted into measurableitems that the respondents would have to evaluate. The next coming sections describe the processused to operationalize the dimensions as well as the process of designing the survey used tocollect data. The index codes refer to the corresponding question section(s) in the surveys, certainquestions and question sections were only included in either one of the surveys since they onlyapplied to either one of the samples. A PDF version of both surveys can be found in Appendix Hand I.
166 Dahmström, K. (2000), Från datainsamling till rapport – att göra en statistisk undersökning, 3rd ED, Lund:Studentlitteratur, p. 55

39
4.6.1 Operationalization of Brand Knowledge – Awareness
Question 2G used an established method to assess the ability of sample O to recognize the USBEbrand among eight fictitious brand names, e.g. EBSU, UESB, etc167. Given that the survey wouldbe conducted on-line, there was a risk that the respondents would simply open another browserwindow and search for the right answer. The results should therefore be interpreted cautiously.The level of brand recall for sample O was unfortunately not assessed in the survey because oferroneous coding during the construction of the survey.
Question 2H assessed sample O’s prior experience of Umeå City and USBE, e.g. if they had everbeen to Umeå, or taken any courses at USBE or other institutions at Umeå University. This typeof questions in combination with the before mentioned question, which assessed their ability torecognize the USBE brand, would provide insights into sample O’s familiarity with USBE.
4.6.2 Operationalization of Brand Knowledge – Image
Given the multifaceted nature of a business school and its activities, it is practically impossible totake all associations making up its image into account. The objective was therefore to includemore salient items that most students would be able to relate to.
Both samples’ image perception would be assessed through sections of questions in which theitems had to be rated on ten-point Likert type interval scales, with the additional option to answer“do not know”. The purpose of these questions was to summarize the respondents’ favorability,strength, and attitude vis-à-vis selected items in the form of attributes and benefits. Section 2A-Eintended to establish a benchmark of determinant factors of school choice, to which the answersof section 3A-D (sample O and U’s perception(s) of USBE) could be compared to later on. It wasreasonable to expect that the respondents of sample O would not be able to fully answer section3A-D. But in any case, it would provide insights into the more salient perception(s) other studentshave of USBE. For sample U, section 3A-D included some additional questions not applicable tosample O, which intended to provide further insights into sample U’s perception(s) of USBE.
The selection of attribute and benefit items used in the questions were influenced by thecommunication material many business schools provide to prospective students, and includeditems such as internationalization, corporate and community relations, course variety, degreelevels, research achievements, etc. Other benefits that were used were influenced by media’srankings of business schools; based on for example salary levels and/or organizational positionsafter graduation. Simple practicalities, e.g. how hard respondents thought it would be to findstudent housing, as well as spare time related aspects such as the range of sport- andentertainment possibilities were also included.
In addition to section 2 and 3, sample U would also have to answer section 6 that was included inthe survey as a mean to control and assess the USBE students’ self-perception(s). The answersfrom this question section would make it possible to explore possible correlations betweenstudents’ perception(s) of USBE and themselves. For example, if someone would answer that
167 Keller, K.L. (1998), p. 326-327

40
there are too few extra curricular activities offered at USBE, at the same time as (s)he answersthat (s)he does not participate in any of the offered activities, then it could be assumed that thisstudent is either very hard to please, or does not really know what activities are being offered.
In order to get a better idea of the uniqueness of the associations, selected associations of USBEwould have to be directly compared to associations of other seats of learning. Given the amountof data necessary to perform this type of analysis, it was considered to be outside the scope of thisstudy and consequently not performed. However, in order to obtain some type of data that couldillustrate the uniqueness of the nine seats of learning included in the study, as well as StockholmUniversity, question section 8 assessed the students’ perception(s) of overall similarity betweenthe schools. The intention was to use the resulting data to construct a set of multidimensionalscales (MDS) and a perceptual map portraying the students’ perception(s) of the uniqueness ofindividual schools vis-à-vis other schools in a multidimensional space. MDS techniques arecommonly used in a marketing context to “identify key dimensions underlying customerevaluations of services, or companies” and would therefore have served the purpose of this studywell168. Unfortunately, the data obtained from section 8 turned out to be of low quality, mostlikely as an effect of the section’s length and complexity, and the intended analysis couldtherefore not be performed. As a consequence, this study did not succeed in generating anyresults on how unique these schools are perceived by prospective students.
4.6.3 Operationalization of Quality
In order to extend the understanding of the importance of quality, question sections 4A-D and5A-D intended to assess the students’ subjective importance perception(s) of quality items withregards to a fictitious business school. The reason for using a fictitious school was to avoid anyinfluence of other non-qualitative associations of “real” schools that might affect the qualityperception(s). Both questions featured ten-point Likert type interval scales on which the influenceof the items on the respondents’ quality perception(s) would be rated. Contrary to section 2 and 3,there were no “do not know” option provided. Most of the items that were used to measure thesequality dimensions were similar to the ones previously used to assess the image perception(s).
4.6.4 Operationalization of Brand Loyalty
The loyalty dimension was only relevant for sample U. It was measured by section 9A-B throughquestions that assessed the likelihood of the respondents to change schools during theireducation, or the likelihood that they would recommend someone to study at USBE. Also thissection employed a ten-point Likert type interval scale with a “do not know” option. Sample U’soverall satisfaction – which is a proposed antecedent of loyalty – was assessed through questionsection 1A-C, which also provided the possibility for the respondents to leave specific commentsof the advantages and disadvantages associated with studying at USBE.
In addition to the questions that related to specific brand equity dimensions, both samples’surveys included miscellaneous background questions of the respondents such as age, sex, schoolof residence, etc.
168 Hair et al. (2005), p. 629

41
4.7 Choice of Scales
There seems to be a disagreement in the research community concerning the classification of theLikert type scales that I have chosen to use in the surveys. The cause of the disagreement iswhether the scales should be considered, and treated, as ordinal or interval scales169. It istherefore important to determine how data obtained from these types of scales will be used in anindividual study, since the type of scale affects the methods of analysis that can be employed, e.g.parametric tests require intervally scaled data. In this study, all data obtained from the Likert typescales will be treated as intervally scaled data. It is after all a common practice among researchersto treat data obtained from Likert type scales as intervally scaled data, e.g. Parasuraman et al. intheir SERVQUAL research170. Moreover, all scales used in this study have constant units ofmeasurement, which characterize interval scales that serve to measure the magnitude or amountof certain attributes171.
169 Jamieson, S. (2004), Likert scales: how to (ab)use them, Medical Education, Vol. 38. Issue 12, p. 1217-1218170 Buttle, F. (1996), SERVQUAL: review, critique, research agenda, European Journal of Marketing, Vol. 30, No. 1,p. 12-13
171 Hair et al. (2005), p. 6-7

42
5 DATA COLLECTION
This chapter includes a presentation of the method used to collect empirical data, a description
of the samples, and a discussion regarding possible biases that might affect the results.
5.1 Sampling Procedure
Individuals that are in a position to provide useful data to answer the research question aremembers of the target population172. As already mentioned in section 4.1, the nature of theresearch question demands two samples, and consequently two target populations have to beconsidered. The first target population includes all first year program students at Swedish
business schools regardless of age, and sex, and the other includes all students currentlyattending any of USBE’s business programs regardless of age, and sex.
The two samples taken from these populations are to be considered as nonprobability judgmentsamples, expected to be representative of the target populations, and as such capable of providinguseful data. The drawback of nonprobability sampling is that a sampling error cannot becalculated, which means that it is not possible to assess the precision of the results. There is also arisk that I, in the role of researcher, bias the study since my personal judgment has been used inselecting both the target population and the sample.173 However, nonprobability sampling iscommonly used in research, especially in the exploratory stages of a study or, as in the case ofthis study, when operational ease is required174.
As mentioned before, there is sample O taken from the first target population, and sample Utaken from the second target population. When necessary, let us also make a distinction betweenthe first year students and senior students within sample U, by referring to them as (sub)samplesU1 respectively U2.
5.1.1Description of Sample O
In order to obtain operational ease, a selection of business schools from which the sample of firstyear students would be made was taken from the previously mentioned ranking made byVeckan’s Affärer in 2003 (see Appendix A: Table A1). Out of the total 25 business schools inSweden that offer Master’s degree study programs in business administration, eight others thanUSBE were selected175. These eight ranked among the foremost eleven on the ranking, and onecan therefore argue that they represent(ed) the major competitors for USBE, which itself rankedseventh. Out of these foremost eleven schools, the Stockholm University decided not toparticipate despite repeated requests, and the Swedish University of Agricultural Sciences wasexcluded given its specialization, which would make it less comparable to the other schools in thestudy.
172 Churchill, Jr., G.A. & Iacobucci, D. (2004),Marketing Research: Methodological Foundations, 9th ED, Mason:Thomson South-Western, p. 322-324
173 Ibid., p. 326-327174 Aaker, D.A., Kumar, V. & Day, G.S. (2003), p. 387175 Beck, A.(2006), p. 32

43
The first year students on these eight schools had relatively recently made an active choice ofwhere to study. Hence, they should hopefully be able to recall which aspects they deemedimportant when they made this choice, and maybe even provide information of how theyperceive(d) USBE.
5.1.2 Description of Sample U
Sample U was made up of both first year (sample U1), and senior students (sample U2) at USBE.The data from sample U1 combined with data from sample O should provide insights into hownew students reason in general, and the aggregated data from sample U1 and U2 should provideinsights into how the USBE students perceive their school.
5.1.3 Access to the Samples and Distribution of Survey Invitation
In order to get access to the samples at selected schools and distribute the survey invitations, i.e.information about the study and an http-link to access the survey (see Appendix A: InvitationA2a-b and Table A3), I contacted concerned program coordinators at selected schools well inadvance in order to present the study and my intentions. Three possible methods of distributionwere discussed, direct e-mail from me to the students, direct e-mail from the program coordinatoror other responsible at the school, and/or distribution through students’ Internet portals at theschools. The preferred method from my side was direct e-mail from program coordinator or otherresponsible at the school, since the probability of participation would most likely be higher if thestudents recognized the sender. In the end, the most common method was direct e-mail from theprogram coordinator or other responsible at the school, but the other methods were used as well.In an effort to increase the chances of good cooperation with the gatekeepers and to be able toforesee possible problems, I kept regular contact by e-mail and/or phone with them up until thesurvey closed. Moreover, all gatekeepers were promised a final copy of the study.
5.2 Potential Biases
All research run the risk of being biased in one or another way. It is therefore important to discusspossible sources of bias beforehand in order to better prepare for them. As already mentioned,there is a risk that the researcher biases a nonprobability sample. But with the research questionand scope of the study in mind, this type of sample was considered most suitable and theassociated risk of researcher bias considered minimal.
5.2.1 Cognitive Dissonance
Another source of bias that the nature of the samples causes is that of cognitive dissonance. Aperson’s cognitions (i.e. elements of knowledge, e.g. attitudes, beliefs and behavior) can either bein agreement (consonant) or in confrontation (dissonant) with each other. Cognitive dissonance isthus a psychologically uncomfortable state of mind resulting from confrontations between aperson’s cognitions. A person experiencing cognitive dissonance will try to reduce thisdissonance in various ways.176 This could mean that a respondent, who for example study at
176 Harmon-Jones, E. & Mills, J. (Eds) (1999), Cognitive Dissonance – Progress on a Pivotal Theory in SocialPsychology, Washington: American Psychological Association, p. 3-5

44
school X but would rather study at school Y, i.e. experience dissonance between behavior andbelief, tries to reduce this dissonance by not providing truthful answers, e.g. overstate orunderstate certain aspects to improve the fit between behavior and belief. In an effort to minimizethe risk of this behavior and its associated bias, the survey did not include any specific questionsconcerning the included schools and the majority of questions were of a general nature.
5.2.2 Response and Response Style Bias
Response bias results from the way the questions are answered, e.g. instead of answeringsincerely, respondents may choose to answer in socially desirable ways, not interpret the questionadequately, avoid taking a stand, etc177. The length and complexity of the survey is likely to affectthe level of response bias since respondents may lose interest in the content of the questions aftera while, and therefore proceed by filling out the remaining questions in a routine manner. In aneffort to alleviate the possible tiresome process of filling out all questions in one sweep, therespondents were at all times given the option to save the answers that they had provided up untilthat time so that they could quit and return to the survey at a more appropriate time withouthaving to start all over again.
Since Likert-type rating scales were used in the surveys, there was a risk that the answers wouldbe biased because of respondents’ response styles. Two common types of response styles areyeasaying/naysaying and standard deviation. The first style refers to respondents who tend to useone extreme end of the scale and the second style to respondents who tend to “use a wide ornarrow range of response intervals about the individual’s mean response”.178 In an attempt toreduce this possible bias, an optional “do not know” answer alternative was provided in mostquestion sections. Possible outlier values that could result from yeasaying/naysaying were alsoinspected in the subsequent data preparation stage (see section 6.3).
5.2.3 Nonresponse Bias
The risk of introducing a nonresponse bias in the data exists when respondents who choose not torespond to the survey at all or partially, differ demographically or attitudinally from the ones whorespond179. There are methods available to determine the extent and direction of the nonresponsebias but most of those methods are rather complex and outside the scope of this study180.
The variety found in the demographic descriptive statistics of the samples (see Appendix B),indicates that the samples were well representable of the multitude of students that choose tostudy business and economics, hence the chances of introducing nonresponse biases wereconsidered as negligible.
177 Sax, L.J., Gilmartin, S.K. & Bryant, A.N. (2003), Assessing Response Rates and Nonresponse Bias in Web andPaper Survey, Research in Higher Education, Vol. 44, No. 4, p. 411
178 Greenleaf, E.A. (1992), Improving Rating Scale Measures by Detecting and Correcting Bias Components inSome Response Styles, Journal of Marketing Research, Vol. 29, Issue 2, p. 176-177
179 Sax, L.J., Gilmartin, S.K. & Bryant, A.N. (2003), p. 411180 Aaker, D.A., Kumar, V. & Day, G.S. (2003), p. 255

45
5.3 Data Collection
The data were collected through the web-based questionnaire tool PHP Survey, which was madeavailable for this study through USBE. An http-link was included in the invitations that were sentout and the students could then choose an appropriate time to fill in the survey. A problem relatedto this method of data collection is that respondents may not receive the invitation if they havechanged e-mail addresses or have no access to a computer181. However, it can be assumed that thetarget populations of this study have access to computers equipped with Internet connectionseither at school or at home. Possible nonresponses are therefore more likely to occur if theydeliberately chose not to participate, if they have not checked their e-mail accounts, or visited thestudents’ portal during the time of the survey. The survey was made available online for a total of18 days. Gatekeepers were encouraged to remind students of the survey and reminders weretherefore sent out at some of the participating schools. Unfortunately, certain schools were notable to distribute the invitation/survey until late, leaving only 7 days at the worst for students toreceive information of it and for filling it out. This was regrettable but hard to avoid even thoughgreat efforts had been made to inform the gatekeepers that time was of an essence. Looking atAppendix A: Table A3, one can see that the schools that distributed the survey late are lessrepresented among the total N of students, e.g. Jönköping and Örebro. This would haveconstituted a problem if we were interested in identifying differences between students atdifferent schools, but given that this study seeks to find out more about students’ generalopinions/perceptions it should be of no concern.
Both the invitation and the opening section of the survey provided thorough information of theaim of the study, and encouraged the students to share their opinions by participating. In an effortto raise the response rate even more, USBE was kind to provide a MP3 player that therespondents could win after the closing of the survey.
Once collected, the complete data set was transferred into the statistical software SPSS version12.0.2 and divided into four different groups (group 1-4) relating to different question sections(see section 7.1: Table 7.1). Next step was to prepare the data for analysis.
181 Aaker, D.A., Kumar, V. & Day, G.S. (2003), p. 258

46
6 DATA PREPARATION
This chapter includes a presentation of the methods used to prepare the collected data for
analysis. Among other things, an assessment of response rates, missing values, methods of
imputation, and associated considerations and decisions will be discussed. An effort has been
made to thoroughly cover the required steps of preparation, which has rendered the chapter
rather technical. The less statistically literate reader may therefore opt for proceeding directly to
chapter 7 RESULTS.
6.1 Assessment of Response and Nonresponse Rate
Out of all 345 responses received from sample O, 35 had to be excluded since they did not fit thetarget population, e.g. not first year students. This left 310 cases for further analysis. For sampleU, only 3 had to be excluded, which left 166 cases for further analysis. Due to a mistake in theconstruction of sample U’s survey, it was at first not possible to discern sample U1 from sampleU2. However, by using a list of all first-year program students provided by the students’expedition at USBE, this problem could be corrected and it turned out that 43 of the total 166cases came from sample U1, and 123 from sample U2 .
For this study, the 310 valid cases from sample O represent a response rate of 17%, while the 166valid cases from sample U represent a response rate of 23% (see Appendix A: Table A3 for a fullaccount).
6.2 Missing Data Analysis
Data is considered missing when “valid values on one or more variables are not available foranalysis”182. Missing data can affect the generalizability of the results and “the patterns andrelationships underlying the missing data” should therefore if possible be identified beforefurther analysis is performed183.
In an attempt to retain as much useful data as possible, the Missing Value Analysis moduleprovided in SPSS was used to analyze both the complete data set as well as the individual groups.The course of action followed a four-step process proposed by Hair, Black, Babin, Anderson, andTatham for identifying and remedying missing data processes, i.e. identifying possible systematicevents causing missing data184.
6.2.1 Identification of the Type of Missing Data
The first step that Hair et al. propose is the identification of the type of missing data. The types ofmissing data processes can be classified as either ignorable, i.e. missing data that are part of theresearch design and do not require any special remedies, or non-ignorable missing data processesthat can be further distinguished as either known or unknown. The unknown non-ignorable
182 Hair et al. (2005), p. 49183 Ibid.184 Ibid., p. 49-50

47
missing data processes are the most difficult to handle since they are harder to identify andaccommodate.185
By examining the data, it became clear that there were both ignorable and non-ignorable missingdata processes present. The ignorable resulted for example from respondents not using the optionto provide additional comments on certain questions, and the unknown non-ignorable resultedmostly from respondents’ unwillingness to answer certain sets of questions, probably as a resultof their length and/or complexity.
6.2.2 The Extent of Missing Data
The second step is to examine the patterns of the non-ignorable missing data and to investigatethe extent of missing data referring to individual cases, items, and even overall. The objective isto “determine whether the extent or amount of missing data is low enough to not affect theresults, even if it operates in a nonrandom manner”186.
In order to correct for missing data, Hair et al. propose that the researcher uses judgment toevaluate the probability of bias the dataset either through ignoring or remedying the missing data.Cases with excessive levels of missing data, e.g. � 50%, concentrating to individual sets ofquestions, as well as individual cases and items with overall excessive levels of missing datashould obviously be deleted.187 Moreover, and as a rule of thumb, Hair et al. suggest that;“missing data under 10% for an individual case or observation can generally be ignored, except
when the missing data occurs in a specific nonrandom fashion”188.
One straightforward method to remedy missing data, is to delete case(s) with missing data (calledlistwise deletion or complete-case analysis)189. Items can also be deleted if they prove to haveexcessive levels of missing data190. Another method is to only use cases with no missing data onthe items necessary for the computation or analysis that is to be done (called pairwise deletion oravailable-case analysis)191. For this study, it was not considered necessary to perform any ofthese methods of remedy before the actual stage of analysis since they are often provided as built-in options in SPSS’s analyze menus.
When examining the overall pattern of missing data, it became apparent that it tended toconcentrate to certain sets of questions. This became even more apparent when the groups wereindividually analyzed, and certain cases (i.e. respondents) turned out to have up to 100% missingdata on separate sets of questions. The reason for this was probably that they had skipped sectionsin the survey that they found lengthy and/or complex.
185 Hair et al. (2005), p. 52186 Ibid., p. 54187 Ibid., p. 55188 Ibid.189 Schafer, J.L. & Graham, J.W. (2002), Missing Data: Our View of the State of the Art, Psychological Methods,Vol. 7, No. 2, p. 155
190 Hair et al. (2005), p. 55191Allison, P.D. (2001), Missing Data: Sage University Paper Series on Quantitative Applications in the SocialScience, Thousand Oaks: Sage Publications, p. 9

48
Of all 310 valid cases in sample O, 169 cases (55 %) had no missing values listwise if theadditional comment options were excluded. The corresponding number for the 166 valid cases insample U was 69 cases (42%). Cases exhibiting 50% or more missing data within the individualgroups were deleted before moving on to the next step.
6.2.3 The Randomness of Missing Data Processes
The third step is to analyze the level of randomness in the missing data. This step is importantsince it determines which methods can be applied to remedy the missing data (imputationmethods).192 Without becoming too technical, there are basically two levels of randomness. The“most” random is referred to as missing completely at random (MCAR), and the second asmissing at random (MAR).193 SPSS can assess the level of randomness through Little’s MCARchi-square test and a separate variance t test. If Little’s MCAR chi-square test finds nostatistically reliable deviation from randomness in the data, it can be classified as MCAR. IfMCAR is not achieved, a separate variance t test can assess if the data can be classified as MARinstead.194
All groups were individually analyzed with Little’s MCAR chi-square test. If the missing datapatterns in the individual groups could not be classified as MCAR, further analysis through aseparate variance t test was performed in which items with less than 5% missing values wereomitted.
All missing data in groups 1, 3, and 4 were classified as MCAR (see Table 6.1). The additionalanalysis of group 2 showed an overall pattern of MAR data with the exception of items 4D1 and4D2, which assessed the impact on students’ overall school quality perception(s) of the fact thatSkolan bedriver MBA utbildning för folk i näringslivet and Skolan marknadsför sin MBAutbildning aktivt genom annonsering i affärspress. The reason for these items more systematicmissing data patterns was probably due to respondents’ lack of knowledge concerning MBAeducations. The importance of these items was considered negligible, and they were thereforeremoved from further analysis.
6.2.4 Selection of Imputation Method
The fourth and last step that Hair et al. propose is to decide on a suitable imputation method.There are several methods of imputation available, which estimate a “missing value based onvalid values of other variables and/or cases in the sample”195. Depending of the degree of, andthe characteristics of the missing data, certain methods are considered more or less suitable. Dataclassified as MCAR can be replaced through any method of imputation whereas MAR datarequire a modeling approach such as the Expectation Maximization (EM) approach.196
192 Hair et al. (2005), p. 56193 Allison, P.D. (2001), p. 8-9194 Hair et al. (2005), p. 56-72195 Ibid., p. 58196 Ibid., p. 56-58

49
Missing data classified as MCAR were replaced by a mean of nearby points spanning all validvalues on the individual item, and missing data classified as MAR were replaced with therecommended EM modeling approach. The methods and number of replaced values forindividual groups can be seen in Table 6.1.
Table 6.1 – Types of Missing Data, Methods of Imputation, and n Replaced Values
Type of Method of Number of Percent of Total
Missing Data Imputation Replaced Values Values in Groupd
Group 1 MCAR Meanb
47 <0.5%
Group 2 MARa
EMc
67 <0.6%
Group 3 MCAR Mean 100 <1.2%
Group 4 MCAR Mean 42 <0.6%a Except for item 4D1 and 4D2, which were subsequently removedb Mean of nearby points spanning all valid values on the individual itemc Expectation Maximization Methodd (n replaced values/(n cases*n items))*100
After all missing values had been replaced, values coded as 0, referring to “do not know”answers, were analyzed and replaced by indicators representing system missing values. Hence, allmissing values that remained in the complete data set, as well as in the individual groups,represented “do not know” answers. This was done so that the “do not know” answers should notdecrease the mean values of items. In Appendix C-F, the numbers in the column marked NStatistic refer to how many valid cases each row item has.
6.3 Identification of Outliers
Outliers are defined as “observations with a unique combination of characteristics identifiable asdistinctly different from the other observations”, e.g. extreme values197. Outliers can becharacterized as either beneficial or problematic, beneficial outliers provide valuable informationabout the characteristics of the population whereas problematic outliers bias the sample’srepresentation of the population. The researcher has therefore to evaluate the possible effects ofeither retaining or excluding observations classified as outliers.198
In this study, standard scores (z-scores) were used to detect univariate outliers, and MahalanobisDistance (D
2) measures divided by their associated degrees of freedom (df) were used to detect
multivariate outliers. In small samples (n<80), cases exceeding a value of 2.5 standard scoresshould be considered as outliers whereas in larger samples, values up to 4 are accepted. For theD2/df measures, similar threshold values are recommended.199 Hair et al. argue that outliersshould be retained in the data “unless demonstrable proof indicate that they are truly aberrantand not representative of any observations in the population”200.
The threshold values were adjusted accordingly to the listwise sample sizes of the individualgroups (see Table 6.2), and identified outliers were individually analyzed in order to detect anyanomalies. A total of three cases exhibited truly anomalous values, and were therefore excluded.
197 Hair et al. (2005), p. 73198 Ibid., p. 73-76199 Ibid., p. 74-77200 Ibid., p. 76

50
Table 6.2 – Outlier Identification
Number of Number of Cases Number of Number
Cases Exceeding Exceeding Cases Used of Cases
z-score Limita
Mahalanobis D2/df Limit
aListwise for D
2/df Removed
Group 1 7 - 323 1
Group 2 23 2 348 1
Group 3 6 - 22 1
Group 4 14 - 56 -a Listwise sample sizes and corresponding z-score and D2/df threshold values: n�100:±2.5, n=101-200:±3, n�201:±3.5
6.4 Test of Underlying Statistical Assumptions of Multivariate Techniques
In order to be able to draw any valid conclusions from the results of the multivariate analyses thatare to come, certain statistical assumptions have to be fulfilled.
6.4.1 Assumption of Normality
A distribution can deviate from a normal distribution either through its skewness (shift sidewise)or kurtosis (shift lengthwise) or a combination of these. The determining factors affecting theseverity of nonnormality is the shape of the offending distribution and the size of the sample.201
Hair et al. notes that the effects of normality violations “effectively diminishes when sample sizereach 200 cases or more”, hence the sample sizes of the individual groups in this study (seesection 7.1: Table 7.1), with the exception of group 4, should contribute to alleviate the mostsevere consequences of not attaining entirely normal distributions202.
Different types of tests exist to assess a distribution’s deviation from normality but with largersamples “the significance level of skewness [and kurtosis] is not as important as its actual size(worse the farther from zero) and the visual appearance of the distribution”203. Considering howfar from zero the values can deviate before nonnormality becomes a problem, Curran, West, andFinch argue that “univariate values approaching at least 2.0 and 7.0 for skewness and kurtosesare suspect”204.
All univariate items in the study were therefore visually inspected in normal probability plots andtheir individual levels of skewness and kurtosis assessed after all answers coded as 0(representing answer: “do not know”) had been transformed into missing values. As can be seenin the skewness and kurtosis columns in the initial tables in Appendix C-F, only one univariateitem (see skewness value of first item in Table D1a) exceeds the threshold values referred to byCurran et al. Hence, all univariate items in the study were considered normally distributed.
201 Hair et al. (2005), p. 80202 Ibid., p. 86203 Tabachnick, B.G. & Fidell, L.S. (2006), Using Multivariate Statistics, 5th ED, Boston, MA: Pearson, p. 80204 Curran, P.J., West, S.G., & Finch, J.F. (1996), The Robustness of Test Statistics to Nonnormality andSpecification Error in Confirmatory Analysis, Psychological Methods, Vol. 1, No. 1, p. 26

51
6.4.2 Homoscedasticity
When using items to explain or predict relationships, it is important that the variances of thedependent item(s) are equally dispersed across the range of independent item(s), this is referred toas homoscedasticity. If the variance should be concentrated to a limited range of values in theindependent item, i.e. heteroscedasticity, the prediction of relationships is affected.205
Levene’s test for equality of variances was used to test the homoscedasticity of selected items.Out of over 47 items tested, only 4 exhibited significant levels of heteroscedasticity. Whenfurther analyzed, no consistent patterns could be detected and heteroscedasticity was thereforenot considered an issue.
205 Hair et al. (2005), p. 83-84

52
7 RESULTS
This chapter includes a presentation of the results obtained from the empirical data. Different
methods of analysis will be used to reveal underlying concepts and issues that can help to
answer the research question.
7.1 Descriptive Statistics
After completing the data preparation stage, all retained items were initially analyzed throughvarious methods of descriptive statistics in order to review the basic features of the sample anddata. As a result of dividing the complete data set into groups and prepare them individually, thenumber of cases between the groups varies. However, since no analyses will be performed on acase level, i.e. examination of one respondent’s answers across all questions, this should not beconsidered an issue. The final composition of the groups after the data preparation stage, withassociated question sections from the survey, can be seen in Table 7.1.
Table 7.1 – Compositions of Groups, and Their Associated Question Sections
Question n of Cases n of Cases n of Cases Total n
Section Sample O Sample U1 Sample U2 Listwise
Group 1 2A-E 309 43 - 352
Group 2 4A-D, 5A-C 307 40 - 347
Group 3 2G-H4, 3A-D, 91C2-F, 92D-F 292 - - 292
Group 4 1A-C, 3A-D, 6, 9A-B - 42 123 165
7.1.1 Overall Demographic Descriptive Statistics
An overview of demographic variables such as sex, age, and school of residence for theindividual groups are provided in Appendix B: Table B1a-c -B4a-c. Overall, across all groupsand samples, the number of female respondents slightly outnumbers the male respondents. Themean (�22) and mode (21) ages are rather comparable across the groups, except in group 4 inwhich the addition of sample U2, the senior students at USBE, raises the mean (�24) and mode(23) somewhat. As previously mentioned, one can see that the schools that distributed the surveylate are less represented among the respondents, but this should not constitute a problem since weare looking for general perceptions.
7.1.2 The Basics of Factor Analysis
A short review of the basics of factor analysis is appropriate before proceeding, given that it is atechnique that will be employed to analyze the data. Factor analysis is commonly used to“identify underlying constructs in the data”, and to reduce the number of items while retaining asmuch information as possible206. It can condense many items into fewer, more comprehensibledimensions that represent concepts not “adequately described by a single measure”207. Theinformation obtained from a factor analysis can then be used as input in strategic and tacticaldecisions, providing both information about general areas of importance (the factors), as well as
206 Aaker, D.A., Kumar, V. & Day, G.S. (2003), p. 563207 Hair et al. (2005), p. 104

53
the individual instruments (the items of the factors) available to management to implementactions.208
In this study, factor analysis is used to reduce the number of items in order to get a more intuitiveunderstanding of the dimensions/constructs they represent, and to construct a series of summatedscales of the items. These summated scales will allow the representation of “multiple aspects of aconcept in a single measure”, which will help assess the perceived importance of the factors forthe respondents.209 Obviously, the items used in the survey are all based on a conceptualfoundation – in this case the conceptual brand equity framework developed in chapter 4 – and itis therefore assumed “that some underlying structure does exist in the set of selected
variables”210. Eventually in the next chapter, the factors will be further analyzed and assignedappropriate labels based on the type of items that load on them.
7.2 Results from Group 1 – Determinant Factors of School Choice
Group 1 comprised data from question section 2 A-E, which assessed the determinant factors ofschool choice. It included both sample O and U1, and should therefore provide insights into whatan average prospective student in Sweden considers important when choosing where to study. Anoverview of all 31 included items, sorted by decreasing mean values can be found in Appendix C:Table C1. As can be seen, the range of mean values extends from a low 2.24 for the item Läsamed kompisar, up to 8.43 forMöjlighet bra yrkesposition.
7.2.1 Identification of the Determinant Factors of School Choice
Group 1 contained 221 listwise cases and fulfilled therefore the sample size requirement forfactor analysis of a 5:1 ratio between sample size and number of items to be analyzed (221:31)211.An initial factor analysis using the principal component method to extract varimax rotated factorswith Eigenvalues over 1 provided a meritorious Kaiser-Meyer-Olkin’s measure of samplingadequacy of 0.881, and a significant Bartlett’s test of sphericity (�2 = 4042.329; d.f. = 465; P<0.0001) indicating that the data set was well suited for data reduction, i.e. factor analysis.
The communalities were then assessed in order to make out items with unsatisfactory levels(<0.50) of variance accounted for by the factor solution. The items that did not make thethreshold value were removed, and the procedure repeated. In the end, three items were removeddue to too low communality values. Two others that cross-loaded on several factors were alsoremoved, as well as three with practical non-significant factor loadings (<0.50) (see superscriptin leftmost column of Appendix C: Table C1 for removed items).212
The final factor solution was made up of seven factors representing 23 items (see Appendix C:Table C2a). Since some items were removed, the number of listwise cases raised to 230, resultingin an increased sample size to item ratio of 10:1 (230:23). These seven factors could explain a
208 Hair et al. (2005), p. 106209 Ibid., p. 135-136210 Ibid., p. 113211 Ibid., p. 112212 Ibid., p. 114-131

54
satisfactory 73.8% of the total variance in the 23 items (see Appendix C: Table C2b), whichmeant that almost three-quarters of the items’ total variance could be explained by less than onethird the number of original items.
When separate Reliability Coefficient Alpha values were calculated for each of the seven factors,all but the two last factors turned out to have acceptable values (>0.70) (see Appendix C: TableC2c). This meant that these two factors did not measure their conceptual definition in a reliableway, and should therefore be excluded. Further development and possible additions of items aretherefore needed before they can be accurately used. With these two factors removed, the totalvariance explained by the remaining factors was still over 60%, which is considered satisfactory.
The summated scale values, consisting of the sum of the mean values for the items that loaded onthe same factor divided by their number, can be seen in Appendix C: Table C2d. By looking atthem, one can see that the second factor has the highest mean value (7.95) followed by factor 4and 3, with values of around 7. Then, there is a gap to the remaining factors 5 and 1, which bothhave values of around 5.50. This means that there are three factors that contain items that thestudents consider rather important as determinants of school choice, as well as two factorscontaining items considered less important.
7.3 Results from Group 2 – Determinant Factors of Overall School Quality
Group 2 comprised data from question sections 4 A-D and 5 A-C, which assessed thedeterminant factors of overall school quality through the dimensions of expected and perceivedquality of a fictitious school. It included both sample O and U1, and should therefore provideinsights into what an average prospective student in Sweden considers when evaluating thequality of a school. An overview of the 34 included items, sorted by decreasing mean values, canbe found in Appendix D: Table D1a-b. Notice the short range of mean values (5.72-8.40), whichprobably results from the wording of the scale with 1 indicating “has a negative effect”, 5indicating ”has neither negative nor positive effect”, and finally 10 indicating “has a very positiveeffect”. In hindsight, this scale should have been further tested before employed. Nonetheless, itis possible to discern certain items that students consider as important determinants of overallschool quality.
7.3.1 Identification of the Determinant Factors of Overall School Quality
A similar course of action as above was employed to extract the determinant factors of overallschool quality. Group 2 contained a whole 347 listwise cases – since no “do not now” answeroption was provided for its question sections – and did therefore fulfill the sample size to itemratio requirement (347:14). A meritorious Kaiser-Meyer-Olkin’s measure of sampling adequacyof 0.872 was obtained, as well as a significant Bartlett’s test of sphericity (�2 = 6369.541; d.f. =561; P <0.0001) indicating data suited for reduction.
The initial analysis revealed two items with unsatisfactory communality values (<0.50), whichwere consequently removed. In addition, three items produced non-practical significant factor

55
loadings (<0.50) and were therefore also removed (see superscript in leftmost column ofAppendix D: Table D1a-b for removed items).213
The final factor solution was made up of eight factors representing 29 quality items (seeAppendix D: Table D2a), which equals a satisfactory sample size to item ratio of nearly 12:1(347:29), with more than 69% of the variance in the 29 items explained by the eight factors (seeAppendix D: Table D2b).
Separate Reliability Coefficient Alpha values for the eight factors indicated that all factors, exceptfactor 7, had acceptable values (>0.7). Factor 7 was therefore removed. The variance accountedfor by the six remaining factors was more than 63% and therefore still considered satisfactory.
The summated scale values of the seven-factor solution indicate that the respondents considerfactor 3 to be most important (see Appendix D: Table D2d) However, note the short range ofmean values in the subsequent four factors indicating that most of the included items areconsidered rather important. Only factor 5 and 8 have values closer to the middle of the scaleindicating neither a negative nor a positive effect.
7.4 Results from Group 3 – Sample O’s Perception(s) of USBE
Group 3 comprised data from question sections 2G-H4, 3A-D, 91C2-F, 92D-F, which assessedsample O’s perception(s) of USBE. An overview of the 29 items, sorted by decreasing meanvalues, can be found in Appendix E: Table E1. Note the few listwise cases, resulting from thelarge number of “do not know” answers. The number of answers can provide an indirect measureof the salience/strength of the associations, since it should be reasonable to consider an item asless salient if the majority of the respondents have answered “do not know”. Also, notice thelarge range of mean values (2.59-8.04) and the sharp drop in mean values after the initial items.
The objective items Känns avlägset and Känns kallt are the most salient associations sample Ohas of USBE and are therefore found in top of Appendix E: Table E1. A mix of items – some ofwhich are closely connected to the fact that Umeå is a large university town – follows theseitems, e.g. Bra studentliv and Utbud föreningsaktiviteter. There is also the somewhat prejudiceperception that the Flesta hade för låga betyg. Additional descriptive statistics found in TableE2a-b indicate that almost a fifth of sample O has Varit i Umeå, and more than 10% has Övervägtläsa på USBE. A crosstabulation of these two items (see Table E2c) shows that the respondentswho have considered studying at USBE are represented both among those who have visitedUmeå and those who have not. However, a Chi-Square test (see Table E2d) indicates that there isa significant difference between the two groups (P <0.0001), which is reflected in the differentpercentages of those who have considered studying at USBE among those who have visitedUmeå before (30.2%) and those who have not (6.3%).
Another crosstabulation of the items Var studerar du and Övervägt läsa på USBE shows that therespondents who have considered studying at USBE can be found at every school included in thestudy except at Stockholm School of Economics (See Table E2e). The results from the less
213 Hair et al. (2005), p. 114-131

56
represented schools, e.g. Jönköping and Örebro, should of course be interpreted cautiously.Nonetheless, the result shows that many of the respondents have considered USBE as analternative.
However, Table E2f tells another story. It shows that out of all respondents, only 10 (3.4%)actually listed USBE Som ett alternativ on their applications. This is only a third of the ones whoclaimed to have considered studying at USBE. Moreover, out of these 10 respondents, 2 hadNågon gång läst vid USBE or another faculty at Umeå University (see Table E2g).
The respondents’ ability to recognize the USBE logotype was somewhat limited as can be seen inTable E2h. Only 13% chose the right alternative, but most had no guess. As mentioned in section4.6.1, the result from this question should be interpreted cautiously. But since we know that 31respondents had considered USBE as an alternative, it would not be too daring to assume that 38respondents recognized the logotype for real.
Over 43% of all 292 respondents in sample O had Läst andra kurser eller program på
universitet/högskola before they commenced their current studies (see Table E2i). 38% of themclaim that their Tilltänkta huvudämne affected where they chose to study, and over 40% claimthat their Tilltänkta examensnivå had an affect on this decision as well (see Table E2j-k). In aneffort to shed some light on these rather high numbers, a crosstabulation of Plannerat huvudämneand Påverkade ditt tilltänkta huvudämne valet av studieort (see Table E2l) was performed. Thecrosstabulation could unfortunately not help to explain the findings any further, which wassomewhat remarkable since one could logically have expected that the less common subjectswould have a greater affect on the choice of school since they are available at fewer places.
7.5 Results from Group 4 – Sample U’s Perception(s) of USBE
Group 4 comprised data from question sections 1A-C, 3A-D, 6, 9A-B which assessed sample U’sperception(s) of USBE. As noted in section 4.6.2 and 4.6.4, had a selection of additional itemsbeen added in sample U’s survey in order to better capture the USBE students’ perception(s). Asection of statements on which they had to grade their own efforts had also been added togetherwith a selection of questions aimed to assess their level of loyalty toward USBE as well as theiroverall satisfaction with USBE.
The range of mean values for the items found in Appendix F: Table F1 is large (3.56-8.51) anduniform, i.e. there are no sharp drops. Most individual items have a sufficient number ofresponses, although the number of listwise cases is rather low. The three most salient items in topof Table F1, can all be said to measure pleasure aspects related to studying at USBE, e.g. Sportoch idrottsutbud, Trivsamma studiekamrater, and Trevlig stad. Then comes a series of schoolrelated aspects such as Brett programutbud, Föreläsarna tillgängliga, and Lätt ställa frågor(under lektionstid).
Looking at Table and Figure F2a, one sees that the students at USBE are relatively satisfied withtheir school on average. Despite this, more than 56% of the USBE students have consideredchanging schools in order to be able to graduate from another school (see Table F2b). Whensummating the additional comments of where they would like to change to (see Table F2c), the

57
Stockholm School of Business, and the universities in Göteborg, Stockholm, Uppsala, and Lundare the most popular, but the students also mention the possibility to study abroad.
When the USBE student were asked if they Rekommenderar gärna någon att läsa på USBE,most answered positively as indicated by the satisfying mean value of 7.78 (see Table F2d). Theirlevel of Stolt över att läsa på USBE was somewhat lower, as was the level of Skulle söka USBEigen, which both had mean values just below 7.0. The students’ self assessment, in the shortquestions section 6 in which they rated their own efforts (see Table F2e), indicates that they donot spend as much time studying or participating in extra curricular activities as they believe/feelthey should.
We will now move on to the analysis of the presented results in order to increase thecomprehension of the collected data.

58
8 DATA ANALYSIS AND DISCUSSION
This chapter contains an analysis of the collected data matched against the conceptual
framework and its theoretical concepts in order to make out the relevant brand equity
dimensions in the context of the study as well as to assess the general perception(s) of them.
8.1 Outline of the Chapter
As can be seen in the conceptual framework (see Figure 4.1) is a brand’s equity composed out ofseveral dimensions and subdimensions. Hence, every unique brand has its own set of dimensions,which are applicable in the very context of that brand. It is therefore not certain that alldimensions will be applicable to a business school even though efforts have been made in thisstudy to only include dimensions that are likely to be applicable. In the same way as “it behoovesthe manager to determine what dimensions of quality consumers believe are relevant for the
product category” do managers have to determine which dimensions of brand equity consumersbelieve are relevant for the product category214. The conceptual framework will serve as aconceptual foundation for this chapter, but new and more suitable in depth models of the relevantbrand equity dimensions will be developed along the course of analysis.
As will become apparent, it is possible to match the results with several theoretical concepts. Forexample, the item Föreläsarna har näringslivserfarenhet is a product-related attribute since itcan affect “the nature and level of product performance”215. It does also match the underlyingdimension expertise of interaction quality, which in turn is a underlying dimension of servicequality. Moreover, it can represent the abstract product quality dimension performance, since itcan affect the performance of the school. Notice how this example validates Melin’s argument,that perceived quality is a type of brand association included in the consumers’ brandknowledge216. I will therefore not describe every possible match for every item but instead try tofocus on the essence.
In order to focus on the essence, the two factor solutions that were obtained in the previouschapter will initially be analyzed in section 8.2-8.3 in order to assign appropriate labels based onthe items’ loadings217. These labels will facilitate the understanding of the solutions and allow usto answer the initial part of the research problem; what are the relevant brand equity dimensionsof a business school? Next, the results of both sample O and U’s perception(s) of USBE will bereviewed and discussed in section 8.4-8.6 in order to be able to answer the second part of theresearch question; what is the general perception(s) of them (the relevant brand equity
dimensions) with regards to USBE?
214 Brucks, M., Zeithaml, V.A. & Naylor, G. (2000), p. 372215 Keller, K.L. (1998), p. 93216 Melin, F. (1999), p. 48217 Hair et al. (2005), p. 131

59
8.2 Analysis of Data From Group 1 – Determinant Factors of School Choice
The factor analysis that was performed on the data obtained from group 1, served to provideinformation on what determinant factors of school choice students consider. As you recall, thefinal factor solution contained 5 factors. We will now review the factors in order of importance,based on the summated scales values (see Appendix C: Table C2a-d).
The most important determinant factor of school choice had the highest summated scale value of7.953 and contained the four items; Möjlighet bra ingångslön, Möjlighet bra yrkesposition, Tidtill anställning, and Status/anseende. These items relate to what an education at a business schoolresults in, i.e. the benefits and rewards of spending time and money on a business education.Benefits are a type of association that refer to the “subjective rewards sought from attributes”, i.e.what the individual consumer wants from the product or service218. All four items are functionalbenefits that relate to the “the nature and level of product performance”, or in this case theperformance of the business school, which can be measured in terms of the items219. The firstthree of them can also be viewed in the light of the service quality dimension outcome quality,which is what the service provider actually does for the customer or what the customer hasreceived when the service has been provided220. These three items are practically analogous totwo of the underlying dimensions that determine the outcome quality; Tid till anställning can inthis context be viewed as waiting time 221. Möjlighet till bra ingångslön, and Möjlighet till brayrkesposition can both be viewed as tangibles, which refer to the physical evidences thatcustomers use to “assess their satisfaction with the service during and after consumption”222.Considering the fourth and last item, if the school enjoys a high level of Status/ anseende will itmost likely have an effect on its students as well. This item can therefore be seen as both anexperiential benefit referring to the feeling one can get from studying at a prestigious businessschool, as well as a symbolic benefit referring to the more extrinsic rewards of it.223 Finally, allfour items will affect the abstract dimension of product quality prestige, which reflects theproducts ability to communicate superiority to the owner, i.e. the student, as well as to relevantsocial groups for him or her224. Since all these items are easy to comprehend are they likely toaffect both students’ and other stakeholders’ attitudes toward the school. The formation ofpositive attitudes is important since “prospective buyers have to develop a favorable attitudetoward the brand before they will buy it”, or in the context of this study, before they will apply toa business school.225
The second most important determinant factor had a summated scale value of 7.15 and was madeup of the four items; Möjlighet utbytesstudier, Internationell anknytning, Möjlighet praktik, andAnknytning näringsliv. Also these items are functional benefits of attending a business school.They are also similar to the abstract product quality dimension versatility, which refers to the
218 Rossiter, J.R. & Percy, L. (1987), p. 151219 Keller, K.L. (1998), p. 93220 Grönroos, C. (1996), p. 56-57221 Brady, M.K. & Cronin Jr., J.J. (2001), p. 40222 Zeithaml, V.A. & Bitner, M.J. (2003), p. 282223 Keller, K.L. (1993), p. 4224 Brucks, M., Zeithaml, V.A. & Naylor, G. (2000), p. 361225 Rossiter, J.R. & Percy, L. (1987), p. 134

60
level and complexity of product features that distinguish it from other similar products226. If theschool can distinguish itself through these benefits, it is likely to be perceived as uniquecompared to other schools227. A unique school that offers favorable benefits will provide itsstudents with an “associative added value”, which can strengthen its unique position in theminds of stakeholders228.
The third most important determinant factor had a summated scale value of 7.027, indicating onlya minor decrease in importance from the preceding factor. It included the three items;Programinnehåll, Kursutbud, and Kursinnehåll, which are all product-related attributes thatdetermine the “the nature and level of product performance”229. On a higher level, theseattributes are all prototypical and essential for a school to function and perform, e.g. in thecontext of this study, it is expected that the school offers the courses necessary for a student tobecome a civilekonom230. There is also a possibility for schools to create unique positions if theycan offer unique courses or programs that the students favor. USBE’s recent commitment to startthe new Retail and Supply Chain Management Program can be seen as an attempt to offer such aunique program. Moreover, all three items are at the same time comparable to the abstractproduct quality dimension performance, which assesses whether the product functions as it issupposed to and if it does it in a consistent/reliable way231.
The fourth most important determinant factor had summated scale value of 5.76, which wasconsiderably lower than for the preceding factors. It was made up of the items; TillgångMasternivå, Tillgång Magisternivå, and Omfattning av forskning. This factor is similar to thethird factor in that its items are also product-related attributes that determine the “the nature andlevel of product performance”232. Also these three attributes are prototypical and essential for abusiness school, and therefore often used to create unique positions. The characteristics of theitems also make them comparable to the underlying dimension expertise of interaction quality inBrady and Cronin’s conceptual model of service quality, since a business school that “offers”these items has to have a certain level of expertise. However, the items say nothing about theother underlying dimensions of interaction quality; attitude and behavior. 233
The fifth and last most important determinant factor had a summated scale value of 5.468 andcontained the four items; Gammal/anrik, Framtoning i media, Kända näringslivsprofiler,Tidigare intagningspoäng, and Kvalitetsackrediterad. These items are a mix of product-relatedand non-product-relates attributes, and share the common characteristics that they in bothinformal and formal ways assure stakeholders of the schools quality. They are therefore in a wayvalence guarantors of the underlying service quality dimension outcome quality meaning that
226 Brucks, M., Zeithaml, V.A. & Naylor, G. (2000), p. 361227 Keller, K.L. (1993), p. 5-6228 Melin, F. (1999), p. 238229 Keller, K.L. (1998), p. 93230 Keller, K.L. (1993), p. 5-6231 Brucks, M., Zeithaml, V.A. & Naylor, G. (2000), p. 361232 Keller, K.L. (1998), p. 93233 Brady, M.K. & Cronin Jr., J.J. (2001), p. 38

61
they in a way guarantee the “essence of the service outcome above and beyond waiting time andtangibles”234.
8.2.1 Labeling the Determinant Factors of School Choice
The five reliable determinant factors in group 1 are all made up of items enough discrete to labelthem accordingly. The most important factor is made up of items that all relate to the outcome ofa business education as well as its associated prestige, and it is consequently labeled Outcomeand Prestige. The second most important factor includes functional benefits that all relate to theversatility dimension of product quality in the sense that they can help position and distinguish aschool from other schools. As a result of this, it is labeled Versatility. The third factor containsproduct-related attributes that can serve as means to position the school and to determine itsperformance, hence it is labeled Performance. The fourth most important factor resembles thethird factor but with the difference that it describes the expertise of the business school throughitems that assess the level of offered courses as well as the extent of conducted research, and it istherefore labeled Expertise. The fifth and last factor assures stakeholders of the outcome qualityof the school through a mix of product-related and non-product-related attributes, and is thereforelabeled Assurance. All determinant factors of school choice in decreasing order of importancefrom left to right, can be seen in Figure 8.1.
Figure 8.1 – Determinant Factors of School Choice235
Notice the key role the Assurance factor plays for a business school since it assures thestakeholders of the Outcome and Prestige of the school’s education. Also notice how most of thedeterminant factors relate to quality dimensions found in the conceptual framework (see Figure4.1). One can argue that this results from using the framework as a base for the study. However,there were never any explicit connections made to the quality dimensions in question section 2A-E that assessed the determinant factors of school choice although many of the included itemswere identical to the ones used later on in the survey to assess the determinant factors of overallschool quality in section 4A-D and 5A-D. This means that the respondents did not consider theitems for their qualitative properties when answering question section 2 A-E, but rather for theirinfluence on school choice.
234 Brady, M.K. & Cronin Jr., J.J. (2001), p. 40235 Author’s Conceptualization

62
8.3 Analysis of Data From Group 2 – Determinant Factors of Overall SchoolQuality
As previously argued in section 3.9, quality is considered a key determinant of customersatisfaction and the management of it is hence an important part of a firm’s business functions236.The factor analysis, which was performed on the data obtained from group 2, served therefore toprovide information of what determinant factors of both expected and perceived school qualitystudents consider. Even if this was not an explicit part of the aim of the study, it would provideadditional insights into the importance of the quality aspect. The final factor solution contained 7reliable factors with summated scale values that could be used to assess the differences ofimportance between the factors, even though it should be noted that the differences were onlyminor (see Appendix D: Table D2a-d). The survey used two different question sections, one withitems relating to expected quality, and one with items relating to perceived quality. The factoranalysis combined data from both sections but confirmed that students consider the two aspectsindividually, given that all but one of the factors contained items originating exclusively from oneof the question sections.
The most important determinant factor of overall school quality had a summated scale value of7.725 and was made up of four items from the question section of perceived quality; Trivsammastudiekamrater, Kursupplägg, Programupplägg, and Utbud föreningsaktiviteter. The first itemTrivsamma studiekamrater is related to the third underlying dimension of physical environmentquality; social factors that addresses the social interaction going on in the servicescape237. Thethree subsequent items can best be described as product-related attributes relating to the design,an underlying dimension of physical environment quality. Even if Brady and Cronin in theirconceptual model consider the design of the servicescape – the functional design – is itreasonable to believe that the planning of programs and courses can have an affect on how astudent perceive a school’s quality, e.g. if a poorly scheduled course leaves no time for self-studies, then it is likely to have a negative effect on the perceived quality.238 Notice that there is adifference between Kurs- and Programupplägg and Kurs- and Programinnehåll, which wereused to address the determinant factors of school choice. Upplägg refers to the day-to-dayplanning and scheduling, while innehåll refers to the selection of courses included in a programor the selection of modules in a course.
The second most important determinant factor had a summated scale value of 7.518 and includedsix items from the question section of perceived quality; Uppmuntrar till kritiskt tänkande, Lättställa frågor under lektion, Föreläsarna tillgängliga, Alternativa undervisningsformer,Föreläsarna har näringslivserfarenhet, and Aktiviteter utöver kursplan. All these items areclearly related to the underlying dimensions attitude, behavior and expertise of the lecturers,which determine the interaction quality of the service239. In the context of this study, the“moment of truth” takes place regularly during several years, which makes it even moreimportant that the customers, i.e. the students, are satisfied240.
236 Menon, A. & Chowdhury, J. (1995), p. 1237 Brady, M.K. & Cronin Jr., J.J. (2001), p. 39238 Ibid., p. 39239 Brady, M.K. & Cronin Jr., J.J. (2001), p. 38240 Zeithaml, V.A. & Bitner, M.J. (2003), p. 99-100

63
The third most important determinant factor had a summated scale value of 7.375 and was theonly factor that included items from both the question section of expected- and perceived quality.However, this was not unexpected since the items were Fräscha lokaler and Fräscha lokaler.The reason for including the same item in both sections was that a student can use the facilities asa cue to quality both before (s)he studies at a school, and during the time (s)he studies there.These items are obviously related to the underlying physical environment quality dimensiondesign, or more precisely facility design, which refers to the functional or aesthetic design of theenvironment241 The state of the facilities, or the servicescape, is a cue that the students will use toassess the quality and capabilities of the school. It can also affect their ultimate servicesatisfaction as well as the satisfaction, productivity and motivation of the firm’s, or school’s,employees.242
The fourth most important determinant factor contained the highest number of items of alldeterminant factors of overall school quality. It included seven items from the question section ofexpected quality and had a summated scale value of 7.33. The items were; Nämns i redaktionellmedia, Är anrik/gammal, Kända näringslivsprofiler har läst där, Status/anseende på
arbetsmarknad, Krävs höga poäng, Kvalitetsackrediterad, and Nätverk i näringsliv. With a mixof product-related and non-product-relates attributes do these items assure stakeholders of theschools quality in both informal and formal ways. They are therefore valence guarantors of theunderlying service quality dimension outcome quality243. They do also reflect the abstractdimension of product quality prestige, in that they communicate superiority244.
The fifth most important determinant factor had a summated scale value of 7.325, indicating onlya minor decrease in importance compared to the fourth factor. It contained four items originatingfrom the question section of expected quality; Erbjuder Magisternivå, Erbjuder Masternivå, Brettkursutbud, and Brett programutbud, which are all product-related attributes. The first two arerelated to the underlying interaction quality dimension expertise, since it can be expected that aschool, which offers Master- and Magister courses have skilled lecturers245. The last two itemsrelate to the abstract product quality versatility that assesses the level and complexity of productfeatures that distinguish a school from other similar schools246. All these items can also beconsidered as prototypical and essential attributes for the business school category247.
The sixth most important determinant factor had a summated scale value of 6.590 indicating asharper decrease in the perceived importance compared to the decrease in between the previousfactors. This factor contained only two items originating from the question section of expectedquality; Snygg hemsida and Funktionell hemsida. Both of them can be interpreted as underlyingdimensions of physical environment quality in the form of both functional and aesthetic design248.They can also be said to relate to the underlying dimension interactive design, which was added
241 Brady, M.K. & Cronin Jr., J.J. (2001), p. 39242 Bitner, M.J. (1992), p. 57243 Brady, M.K. & Cronin Jr., J.J. (2001), p. 40244 Brucks, M., Zeithaml, V.A. & Naylor, G. (2000), p. 361245 Brady, M.K. & Cronin Jr., J.J. (2001), p. 38246 Brucks, M., Zeithaml, V.A. & Naylor, G. (2000), p. 361247 Keller, K.L. (1993), p. 5-6248 Brady, M.K. & Cronin Jr., J.J. (2001), p. 39

64
to the conceptual framework based on the arguments in section 3.10.2 that the interactive designis likely to affect the service experience as much as the physical servicescape. A website can bethe first encounter a prospective student has with a school and therefore used as an initial cue toits quality and capabilities249. It is therefore important that the website is easy to use andfunctional.
The seventh and last most important determinant factor had a summated scale value of 5.89 andcontained two items from the question section of expected quality; Annonsering på Internet andAnnonsering i tidskrifter. Even if this factor is perceived as the least important from the students’perspective does it play an important role in the awareness creating process. A business schoolcould be able to increase the awareness among different groups of stakeholders through repeatedadvertisements in media, which would give the real or fictitious impression that it has a highmarket presence, is committed and have substance. It would also raise the stakeholders’familiarity with the school’s brand, which could strengthen its competitive advantage.250
8.3.1 Labeling the Determinant Factors of Overall School Quality
Also these determinant factors are all made up of items enough discrete to label themaccordingly. The most important factor is related to the functional design of courses andprograms, as well as to social factors in the servicescape. As a consequence of this, it is labeledFunctional Design and Social Factors. Next factor is related to the interaction with lecturers andits quality. It is therefore labeled Lecture Interaction. The third most important factor containstwo items that both address the servicescape and it is thus labeled Servicescape. The fourth factorincludes items that assure stakeholders of the schools’ quality in both informal and formal ways.Hence, it is labeled Assurance. The fifth most important factor contains two types of items, whichrelate to the expertise and versatility of the school and its services. It is therefore labeledExpertise and Versatility. The next factor, the sixth most important, is made up of items thatrelate to the functional and aesthetic design of the school’s website, and it is consequently labeledInteractive design. The seventh and last most important factor includes two items that relate todifferent communication channels in which a school can advertise. Even if the students do notconsider them very important are they likely to play an important role in creating awareness andfamiliarity among the stakeholders. It is therefore labeled Awareness and Familiarity. Alldeterminant factors of overall school quality, in decreasing order of importance from left to right,can be seen in Figure 8.2.
Notice that the most important and the second most important determinant factors areexclusively made up of items from the perceived quality question section, the third mostimportant factor consist of one item from each section, and the remaining factors are exclusivelymade up of items from the expected quality question section. Also note that the expected qualityfactors Assurance, Expertise and Versatility are all determinant factors of school choice as canbe seen in Figure 8.1.
249 Bitner, M.J. (1992), p. 57250 Aaker, D.A. (1991), p. 64-69

65
Figure 8.2 – Determinant Factors of Overall School Quality251
8.4 Analysis of Data From Group 3 – Sample O’s Perception(s) of USBE
Lets begin by reviewing some of the background variables and characteristics of sample O beforeanalyzing its perception(s) of the determinant factors of school choice with regards to USBE.
8.4.1 Sample O’s Prior Knowledge of USBE and Umeå, and Other Background Statistics
It appears as if the level of prior experience with USBE or Umeå has an affect on therespondents’ propensity to consider USBE as an alternative given that more than 30% of the 53respondents who had previously been to Umeå had considered studying at USBE (see AppendixE: Table E2c), while the corresponding percentage for those who had not been to Umeå was only6.3%. This result supports Aaker’s argument that increased brand awareness and familiarity maystrengthen a brand’s competitive advantage252. However, one should remember that there is notalways a correlation between attitudes toward a certain brand and the attitude toward“performing a particular behavior with respect to the brand”, which becomes obvious in light ofthe fact that only 3.4% of the respondents had actually included USBE as an alternative on theirapplications253. Moreover, the low level of recognition, which is reflected in the mere 13% of therespondents who accurately recognized the USBE four-letter combination, indicates that the levelof awareness is very low. A higher level of awareness would increase USBE’s brand equity, assupported by Aaker’s study in which name recognition/high profile was the third (out of 32) mostcommon sustainable competitive advantage among the 248 businesses included in the study254.
The fact that almost 40% of the respondents claim that their Tilltänkta huvudämne affected wherethey choose to study, and that over 40% claim that their Tilltänkta examensnivå affected this aswell (see Appendix E: Table E2j-k) is somewhat remarkable since practically all schools includedin the study offer most business subjects as well as degree levels. However, it might be so thatthese respondents consider certain schools better than others regarding their chosen subject,which could partially explain the result. The reason that their Tilltänkta examensnivå affectedwhere they chose to study is less obvious but may very well be a result of respondents’ lack ofknowledge concerning what other schools offer in general, or a result of respondents answeringin a routine manner without paying attention to the questions.
251 Author’s Conceptualization252 Aaker, D.A. (1991), p. 64-69253 Ajzen, I. & Fishbein, M. (1980), p. 161254 Aaker, D.A. (1989), p. 93-95

66
8.4.2 Sample O’s Perception(s) of the Determinant Factors of School Choice
In order to put sample O’s perception(s) of USBE in perspective, have the labels of thedeterminant factors of school choice been included in the rightmost column of Appendix G:Table G1a parallel to the items that loaded on the factors. Looking at the table, it becomesapparent that sample O’s perception(s) of the items are not as salient as one could desire.
Lets move downward Table G1a and concentrate on where the determinant factors of schoolchoice are found, i.e. the items that prospective students use to assess the factors. The first item,i.e. the most salient one of the ones included in the factors, can be found around tenth position. Itis one of the three items from the third most important factor Performance. The two missingitems for this factor; Programinnehåll and Kursinnehåll, were not included in sample O’s surveygiven that the respondents were not expected to have a perception of them. Continuing downwardin the table to the only item from the fourth most important determinant factor Expertise. Thisfactor is missing the two discrete items; Tillgång Masternivå and Tillgång Magisternivå, whichwere not included in the survey given that their answers are known – USBE has both. Sample Ocould logically expect high levels of both these factors; Performance and Expertise, from USBEgiven that it is a part of the large Umeå University and the items making up these factorscould/should therefore be considered as prototypical and essential attributes for the businessschool category255.
Next down the table comes two of the four items from the second most important determinantfactor Versatility. The other two items of the factor are found further down the table. Thedispersed positions of the four items indicate that sample O has a rather vague perception of howversatile the educations at USBE are.
The four items making up the most important determinant factor of school choice Outcome &Prestige can be found spread out around the twentieth position indicating that sample O has arather weak perception of this factor with regards to USBE as well.
Last comes three items from the fifth most important factor Assurance. The factor is missing twoitems; Tidigare intagningspoäng, which was not included given that it is shifting over the years,and Kvalitetsackrediterad, which was not included given that the answer is known – USBE isEQUIS accredited although the accreditation had not been finalized at the time of the survey. It isvery evident that sample O has a weak perception of this factor with regards to USBE. Even if itis the fifth and last most important determinant factor does it play a key role since it assuresprospective students of the most important factor Outcome & Prestige, and it is therefore of greatindirect importance.
However, in order to know how well these perception(s) compare with the real or true state of theitems, will we first have to look at sample U’s perception(s) of the determinant factors of schoolchoice with regards to USBE since they will provide something of a benchmark of how USBE isperceived from a students’ perspective. Sample O’s perception will then be compared with thisbenchmark in order create a better understanding of how USBE is perceived.
255 Keller, K.L. (1993), p. 5-6

67
8.5 Analysis of Data From Group 4 – Sample U’s Perception(s) of USBE
Lets begin by reviewing some of sample O’s characteristics before analyzing its perception(s) ofthe determinant factors of school choice with regards to USBE.
8.5.1 Sample U’s Satisfaction and Loyalty
A mode value of 7 for sample U’s overall level of satisfaction with USBE (see Appendix F:Table and Bar Chart F2a) indicates that the students are relatively satisfied. However, even if thestatement Rekommenderar gärna någon att läsa på USBE has a mean value of 7.78 (see TableF2d) can it be argued that the students at USBE experience some lower form of loyalty such ascognitive loyalty toward other schools, given that over 56% of the USBE students in the studyhave considered changing schools (see Table F2b)256. Even though there is not always acorrelation between attitudes toward a certain brand and the attitude toward “performing aparticular behavior with respect to the brand”, i.e. to change schools, do this result indicate aneed to make students more loyal to USBE257.
8.5.2 Sample U’s Perception(s) of the Determinant Factors of School Choice
In the rightmost column of Appendix G: Table G1b, parallel to the items that loaded on thedeterminant factors of school choice, have the labels of the factors been included. As can be seenare the items that make up the five determinant factors of school choice with regards to USBE forsample U rather evenly distributed apart from a slight downward tendency.
If we move downward Table G1b and concentrate on where the determinant factors of schoolchoice are found, i.e. the items that prospective students use to assess the factors, will it bepossible to discern that the three items making up the third most important determinant factorPerformance place relatively tight together high up the table around tenth position indicating thatsample U perceives USBE to perform rather well. Next comes the only item that is included inthe table from the fourth most important factor Expertise. It is missing the two discrete items;Tillgång Masternivå and Tillgång Magisternivå, which were not included in the survey given thebefore mentioned reasons. However, the result indicates that sample U perceives USBE to havethe necessary Expertise. As noted in section 8.4.2, could/should the items making up the factorExpertise be considered as prototypical and essential attributes for the business school categorytogether with the items of the factor Performance 258.
Continuing downward in the table to the four items making up the most important factorOutcome & Prestige, which are split into two around the twentieth and thirtieth position. Thesalience of these items is moderate leaving opportunities for improvements. It is howeverimportant to initially assess the nature of the Outcome & Prestige associated with an education atUSBE in order to know what to communicate.
256 Oliver, R.L. (1999), p. 35-36257 Ajzen, I. & Fishbein, M. (1980), p. 161258 Keller, K.L. (1993), p. 5-6

68
Three of the five items that make up the fifth most important determinant factor Assurance arefound in the bottom of the table from positions around the mid thirties and below. As for sampleO, are the items Tidigare intagningspoäng and Kvalitetsackrediterad missing for this factor.Sample U’s perception of this factor is very weak and needs to be improved given that it has akey role in assuring prospective students of the most important factor Outcome & Prestige.
Lastly, the four items of the second most important factor Versatility are dispersed along the tableindicating that also sample U has a rather vague perception of how versatile the educations atUSBE are.
8.6 Differences in Perception(s) of USBE Between the Samples
In order to identify the differences in the perception(s) of USBE between sample O and U, theitems unique for one or the other sample were excluded and only the 28 items included in bothsamples’ surveys retained. An independent t-test was then used to detect any significantdifferences between the samples’ mean values. The t-test indicated that the mean values of thetwo samples were significantly different (P<0.05) on all but four items (see Appendix G: TableG2). Even though the Levene’s test for equality of variance (not shown) indicated that some ofthe items violated the assumption of equal variances, the significance of the t-test was not alteredunder the assumption of unequal variances.
In an effort to make these differences in perception(s) more observable, the 28 items wereassigned scores reflecting the relative strength of their salience with regards to USBE. Tocalculate these relative salience scores, the original positions of the items in Appendix E: TableE1 and Appendix F: Table F1 – which had resulted from the mean values – were inversed(original positions 1,…28; new positions 28,…1) and divided by the total number of includeditems (28/28=1,…1/28=0.036). The resulting quotients were then multiplied by 100(1*100=100,…0.036*100�4) and rounded off to the nearest whole number, which resulted inrelative salience scores between 4 and 100. By calculating the differences in relative saliencescores between the two samples and sorting the items in ascending order of difference, does thedifferences in perception(s) between the two samples become more observable (see Table 8.1). Inthe table, parallel to the items making up the determinant factors of school choice, have the labelsof the factors been included in order to put the perception(s) in perspective. Do note however thatcertain items that make up these factors have been excluded given that they only apply to one orthe other sample or for other reasons previously mentioned in section 8.4.2 and 8.5.2.
Hence, Table 8.1 provides a mean to assess how USBE is perceived by its own students and byprospective students. It allows the identification of differences in perception(s) between thegroups on an individual item level, as well as on an aggregated factor level. An ideal distributionin the table would show all the determinant factors of school choice – preferably in decreasingorder of importance – congregated toward the middle of the table indicating a concurrencebetween the perception(s) of the two samples.

69
Table 8.1 – Perception(s) of USBE, and Associated Determinant Factors of School Choice
Relative Salience
Determinant Factor of
School Choice
Sample
O
Sample
UDiff.
Internationell anknytning 2 - Versatility 18 61 -43 Sample O associate these
Möjligheter utbytesstudier 2 - Versatility 57 93 -36 items less with USBE
Föreläsarna tillgängliga 50 79 -29 than sample U does
Nätverk i näringsliv 14 39 -25
Näringslivsanknytning 2 - Versatility 25 43 -18
Snabbt anställning 1 - Outcome & Prestige 39 54 -15
Trevlig stad 82 96 -14
Känns öppet 75 89 -14
Brett programutbud 68 82 -14
Möjlighet bra yrkesposition 1 - Outcome & Prestige 36 50 -14
Status/anseende på arbetsmarknad 1 - Outcome & Prestige 21 32 -11
Nöjesutbud 61 68 -7
Bra ingångslön 1 - Outcome & Prestige 29 36 -7
Är anrik/gammal 5 - Assurance 7 14 -7
Sport och idrottsutbud 96 100 -4
Alt. undervisningsformer 54 57 -3
Brett kursutbud 3 - Performance 71 71 0 Sample O associate these
Omf. forskningsverksamhet 4 - Expertise 64 64 0 items as much with USBE
Kända näringslivsprofiler 5 - Assurance 4 4 0 as sample U does
Nämns i redaktionell media 5 - Assurance 11 7 4
Bra studentliv 93 86 7
Utbud föreningsaktiviteter 86 75 11
Känns internationellt 43 29 14
Flesta stannar i Norrland 32 11 21
Praktikmöjligheter 2 - Versatility 46 21 25
Flesta studenter är från Norrland 79 46 33 Sample O associate these
Flesta hade för låga betyg 89 25 64 items more with USBE
Känns kallt 100 18 82 than sample U does
When looking at the rightmost column in Table 8.1, it becomes evident that the two samplesperceive USBE as rather different on an item level. It does also become evident that many of theitems that load on the determinant factors of school choice are among the items that sample Oassociates less with USBE than sample U does.
A closer look in the table at the items making up the determinant factors of school choice revealsthat sample U perceives USBE to have rather good Internationell anknytning, even though itcould be improved, and very good Möjligheter utbytesstudier. However, sample O has a veryweak perception of USBE’s connections in the world, and a relatively weak (compared to sampleU) perception of the possibilities to study abroad through USBE, which means that these itemsshould be emphasized more in USBE’s communication in order to raise prospective studentsperception, i.e. make them more aware, of USBE’s Versatility. Next down the table comesUSBE’s Näringslivsanknytning, which is another item making up the factor Versatility. Bothsamples have rather low relative salience scores for this item meaning that there is room forimprovements. If the management of USBE agrees that the real or true state, i.e. not theperceived state, of USBE’s corporate relations is unsatisfactory should they in collaboration withtheir students make an effort to improve them. If the management on the other hand does notagree with this could it indicate an incoherent communication and they should therefore make an

70
effort to communicate the true state of USBE’s corporate relations in order to make prospectiveand present students and other stakeholders aware of it.
Continuing down the table come the four items that make up the most important determinantfactor Outcome & Prestige. The first three of them; Snabbt anställning, Möjlighet brayrkesposition, Status/anseende på arbetsmarknad are all perceived as rather weak by bothsamples, especially the item Status/anseende på arbetsmarknad. The last item in this factor, Braingångslön, receives low relative salience scores from both samples and it is therefore found a bitfurther down the table indicating a smaller difference between the two samples. These four itemsare hard to affect directly for USBE, but they are likely to be affected by long term strategicefforts done in other areas such as improved corporate relations.
Next comes the item Är anrik/gammal, which is a part of the determinant factor Assurance. Theperception of this item is very weak in both samples as expected given USBE’s relatively youngage. There is unfortunately not much the management can do to improve this perception since itis the true state of the item. However, they can on the other hand turn USBE’s young age intosomething good and use it in the communication in order to reduce the negative impact.
Next come three items from separate factors but which receive equal relative salience scores fromboth samples; Brett kursutbud, which is a part of the factor Performance, Omfattandeforkningsverksamhet, which is a part of the determinant factor Expertise, and Kända
näringslivsprofiler, which is a part of Assurance. Both Brett kursutbud and Omfattandeforkningsverksamhet receive rather satisfying relative salience scores from both samples, whichmeans that the USBE management can opt for keeping up the good work with these items as longas the perception(s) of them stay steady, or to raise the awareness of them even further. The itemKända näringslivsprofiler receives really low relative salience scores from both samplesindicating an almost non-existent perception of any known businesspeople that have studied atUSBE. It is actually surprising how seldom one reads or hears in national media about knownbusiness people whom have studied at USBE compared to other business schools. However, theremust be successful USBE alumni out in the business community who could help to increase theawareness of USBE and its activities and abilities by becoming more visible in media, e.g.through the use of PR.
The item Nämns i redaktionell media, which is a part of the determinant factor Assurance, is thefirst item that receives a lower relative salience score from sample U than from sample O. Bothsamples’ scores are however really low indicating that there is room for improvements.
The last item in Table 8.1 that is a part of a factor is Praktikmöjligheter, from the factorVersatility. It receives a rather good relative salience score from sample O and a very low scorefrom sample U. The reason for the low score is probably that the internships USBE helpscoordinate are limited to selected educational programs and the students enrolled in theseprograms constitute only a few of the survey’s respondents.

71
9 CONCLUSIONS AND IMPLICATIONS
With a start in the research question and aim of the study will this chapter outline the conclusions
that can be drawn based on the preceding analysis and discussion. Condensed managerial
implications and suggestions will also be presented in order to sum up the previous discussions
before moving on to a selection of suggestions for future research directions that can add
substance to the current understanding of the subject.
9.1 Research Question and Aim of the Study
The research question asked; what are the relevant brand equity dimensions of a business school,and what is the general perception(s) of them with regards to USBE? In order to answer thisquestion was a conceptual brand equity framework applicable to a business school’s brand andorganization constructed. The framework was then operationalized, which made it possible tocarry out a survey in order to gain understanding of both the dimensions that are consideredrelevant, as well as the perception(s) of these dimensions with regards to the USBE brand. Asstated in section 1.4 has the more general denotation of the relevant brand equity dimensions of abusiness school been interpreted as the determinant factors of school choice in the context of thisstudy.
9.2 The Relevant Brand Equity Dimensions of a Business School
At first, it has to be underlined that the brand equity dimension awareness is implicitly includedamong the relevant dimensions of a business school since it is a prerequisite for linkingassociations to the brand in the associative networks of prospective students. Awareness is not adeterminant factor of school choice but it is a prerequisite for developing these factors. Thedimension loyalty should also be included among the relevant brand equity dimensions since itimpedes students from changing schools and has the potential to turn loyal students/alumni intoadvocates who promote their school without endorsement. These advocates can be of keyimportance since they can provide testimonials of the experience quality of the school forprospective students.
On a more detailed level, the analysis has revealed that the relevant brand equity dimensions of abusiness school – i.e. the determinant factors of school choice in the context of this study (seeFigure 8.1) – are all associations in the form of quality dimensions that prospective students useto:
These five factors are in turn made up of an infinite number of items, which prospective studentsuse to assess the individual factors. The more salient these items are in the minds of prospectivestudents – the greater the chances that the school will be included in their consideration sets.
The analysis of the determinant factors of overall school quality (see Figure 8.2) indicates thatquality associations are important also after a prospective student has made a choice of where to
- Evaluate the expected results of the education (Outcome & Prestige)- Evaluate the expected education itself (Versatility, Performance, and Expertise)- Reassure themselves of the expected results of the education (Assurance)

72
study. The importance of the items that make up the perceived quality factors (Functional Design& Social Factors, Lecture Interaction, and in part Servicescape) are relatively higher than for theassociations in the form of expected quality factors (in part Servicescape, Assurance, Expertise &Versatility, Interactive Design, and Awareness & Familiarity). Hence, once a prospective studenthas become an enrolled student, (s)he will continue to evaluate the expected quality of theeducation that is to come as well as the outcome of it, parallel to the evaluation of the perceivedquality of the current education.
9.3 The General Perception(s) of the Relevant Brand Equity Dimensions With Regards to USBE
The analysis has shown that the general awareness of USBE is low among sample O. It has alsoshown that many of sample U’s students have a somewhat low level of loyalty toward USBE –although their overall level of satisfaction is good – given the large number of present studentswho have considered changing schools in order to be able to graduate from another school.
The most important determinant factor of school choice Outcome & Prestige is perceivedsomewhat differently by the two samples (see Table 8.1). Sample U perceives the Outcome &Prestige associated with an education at USBE as more salient relative to sample O even thoughit is not perceived as very high in absolute measures by any of the samples.
The samples’ perception(s) of the second most important factor are however rather analogous inthat they both perceive USBE’s Versatility as very vague. But by looking at the individualperceptions of the items that make up this factor, it becomes evident that there are some majordifferences in how the samples perceive the individual items.
The samples agree to some extent that the perception(s) of the third and fourth most importantfactors, USBE’s Performance and Expertise, are rather salient – as should be expected from anestablished business school. They do also agree that the perception(s) of the fifth most importantfactor, USBE’s Assurance, is very weak which means that USBE will have difficulties assuringprospective students of the outcome quality of an education at USBE.
9.4 Managerial Implications and Suggestions
Based on the analysis and the preceding conclusions, it is my opinion that he most importantimplications that can be drawn from this study are:
- The general awareness of USBE among prospective students is too low.- Prospective and present students’ quality perception(s) of USBE are of keyimportance.
- The USBE students’ loyalty can be improved.- There are considerable differences in the perception(s) of USBE betweenprospective students and present students.

73
These implications call for action and I would therefore like to propose that the management ofUSBE through a committed brand management initiative attempts to;
To sum up, USBE has the potential to be one of the more popular business educations in Sweden,as confirmed by its recent EQUIS accreditation. However, in order to stay competitive, its brandand stakeholders’ brand associations have to be to properly managed. It is therefore vital that themanagement of USBE accompany the school’s progress in other areas with a committed brandmanagement initiative. If this is properly implemented, USBE has a bright future ahead in thenational, as well as the international, field of business educations.
9.5 Future Research Priorities
Although this study has provided many answers, there are still questions that deserve additionalattention in future studies.
9.5.1 Future Research and the Relevant Brand Equity Dimensions of a Business School
The fact that there is still some variance to be explained by the determinant factors of schoolchoice, as well as by the determinant factors of overall school quality, indicates that trueempirical aspects have been omitted. Additional research could serve to improve themeasurements and it could therefore be of interest to:
- Establish a strategic- and tactical awareness-building scheme intended to raise theawareness of USBE among selected stakeholders.
- Perform follow-ups on students that change schools in order to find out the reasonsand to take appropriate actions to counteract this behavior in the future.
- Perform an annual students’ evaluation of USBE in addition to the courseevaluations, which will allow tracking of students’ overall satisfaction over time.
- Evaluate both the present- and prospective students’ perception(s) of thedeterminant factors of school choice further, in order to find out if they correspondto their real or true state at USBE.
- Develop a brand profile and -manual using the findings of this study as an input.- Adapt the communication to better fit the prospective students using the findingsof this study as an input.
- Investigate which types of media different groups of stakeholders consume inorder to target them through these media.
- Inform successful alumni of the importance of the awareness-building scheme inorder to get them to act as advocates of USBE.
- For all of the above, take advantage of the in-house knowledge among marketinglecturers and students in the Master’s program, e.g. through case studies andworkshops.
- Perform a qualitative study to explore lesser-known determinant factors of schoolchoice and lesser-known determinant factors of overall school quality as well aslesser-known items that can be used as indicators of these factors

74
9.5.2 Future Research and the Perception(s) of USBE
In order to gain additional understanding of the perception(s) of USBE, it could be of interest to:
- Compare the Perception(s) of USBE found in this study with USBE’scommunicated identity in order to identify the brand’s strengths and weaknesses.
- Study USBE’s organizational culture and the employees’ perception(s) of theUSBE brand.
- Study other stakeholders’ perception(s) of the USBE brand.- Study the attitude toward attending USBE and the associated subjective normamong prospective students.

75
10 CREDIBILITY CRITERIAS
In order to facilitate for the reader to evaluate the study will this chapter provide a discussion
regarding the validity and reliability as well as the practical usefulness of the study and its results.
10.1 Validity and Reliability
It is appropriate to discuss the validity and reliability of the study given its quantitative nature.
10.1.1 Construct Validity
The construct validity of a study depends on how well the items (i.e. the operationalizedtheoretical concepts) measure the concept they are supposed to measure259. The construct validitycan be assessed in several ways, one is to evaluate the study’s face validity, which subjectivelyassesses if a “measure used seems to be a reasonable measure for what it purports tomeasure”260. This study should have a high degree of face validity since only established theorieswere used to construct the conceptual framework, which served as a foundation for the survey.Moreover, the selection of items used to measure individual concepts in the survey were allinfluenced by the communication material many business schools provide to prospective studentsand they are therefore expected to further contribute to a high degree of face validity.
10.1.2 External Validity
External validity refers to how well the results can be generalized to other persons or contexts aswell as across other persons or contexts261. Although a nonprobability sample was used, theamount and extent of empirical data from nine of Sweden’s 25 business schools should providethe first part of the results – the relevant brand equity dimensions of a business school – with ahigh degree of external validity. It should therefore be possible to generalize it to other Swedishbusiness educations when the stakeholders in mind are prospective students. It might also bepossible to generalize this result across other types of higher educations even if the degree ofexternal validity is likely to be affected.
The second part of the results – the general perception(s) of them (the relevant brand equitydimensions) with regards to USBE – has a low degree of external validity given that it is limitedto USBE.
10.1.3 Reliability
Reliability refers to how consistent a measure is over multiple measures of an item262. Thereported Reliability Coefficient Alpha or Cronbach’s Alpha value is one such consistencymeasure of the summated scales. Based on the Alpha values, this study should have a high degree
259 Hair et al. (2005), p.104260 Ghauri, P. & Grønhaug, K. (2002), p. 70261 Ibid., p. 72262 Hair et al. (2005), p.137
76
of reliability given that only factors, i.e. summated scales, exhibiting significant Alpha values(>0.70) were included in the analysis.
10.2 Practical Usefulness
The practical usefulness of this study is twofold. First of all, it provides an insight intoprospective students’ way of reasoning. This knowledge can be useful for managers andmarketers at business schools and other schools in general when developing strategic- and tacticcommunication plans. Secondly, the more specific knowledge of how both USBE’s presentstudents, as well as prospective students, perceives USBE can serve as a foundation upon whichthe management of USBE can continue to develop the USBE brand.

77
REFERENCES AND FURTHER READING
Aaker, D.A. (1989), Managing Assets and Skills: The Key to a Sustainable Competitive Advantage,California Management Review, Vol. 31, Issue 2, p. 91-106
Aaker, D.A. (1991), Managing Brand Equity: Capitalizing on the Value of a Brand Name, New York, NY:The Free Press
Aaker, D.A., Kumar, V. & Day, G.S. (2003), Marketing Research, 8th ED, Hoboken, NJ: John Wiley &Sons
Ajzen, I. & Fishbein, M. (1980), Understanding Attitudes and Predicting Social Behavior, Englewood Cliffs, NJ:Prentice Hall
Alba, J.W. & Hutchinson, J.W. (1987), Dimensions of Consumer Expertise, Journal of ConsumerResearch, Vol. 13, Issue 4, p. 411-454
Albarracin, D., Johnson, B.T. & Zanna, M.P. (Eds.) (2005), The Handbook of Attitudes,Mahwah, NJ: Lawrence Erlbaum Associates
Allison, P.D. (2001), Missing Data: Sage University Paper Series on Quantitative Applications in the SocialScience, Thousand Oaks, Calif: Sage Publications
Ambler, T. & Styles, C. (1997), Brand Development Versus New Product Development: Toward a Process Modelof Extension Decisions, Product and Brand Management, Vol. 6, No. 4, p. 222-234
Beck, A. (2006), Nordiska Akademiska Ekonomutbildningar 2006, Stockholm: SERO & Civilekonomerna
Bitner, M.J. (1992), Servicescapes: The Impact of Physical Surroundings on Customers and Employees, Journal ofMarketing, Vol. 58, Issue 2, p. 57-71
Brady, M.K. & Cronin Jr., J.J. (2001), Some New Thoughts on Conceptualizing Perceived Service Quality:A Hierarchical Approach, Journal of Marketing, Vol. 65, Issue 3, p. 34-49
Brucks, M., Zeithaml, V.A. & Naylor, G. (2000), Price and Brand Name as Indicator of Quality
Dimensions for Consumer Durables, Journal of the Academy of Marketing Science, Vol. 28, No. 3,p. 359-374
Bryman, A. & Bell, E. (2003), Business research methods, Oxford: Oxford University Press
Buttle, F. (1996), SERVQUAL: review, critique, research agenda, European Journal of Marketing, Vol. 30,No. 1, p. 8-32
Chaudhuri, A. & Holbrook, M.B. (2001), The Chain of Effects from Brand Trust and Brand Affect to BrandPerformance: The Role of Brand Loyalty, Journal of Marketing, Vol. 65, Issue 2, p. 81-93
Churchill, Jr., G.A. & Iacobucci, D. (2004), Marketing Research: Methodological Foundations, 9th ED, Mason,Ohio: Thomson South-Western
Collberg, B. (2001), Klonade Universitetsprofiler, LUM – Lunds universitet Meddelar, Issue 6, p. XIII
Curran, P.J., West, S.G., & Finch, J.F. (1996), The Robustness of Test Statistics to Nonnormality andSpecification Error in Confirmatory Analysis, Psychological Methods, Vol. 1, No. 1, p. 16-29
Dahmström, K. (2000), Från datainsamling till rapport – att göra en statistisk undersökning, 3rd ED, Lund:Studentlitteratur
Earl, P.E. & Kemp, S. (Eds.) (1999), The Elgar Companion to Consumer Research and Economic
Psychology, Glos: Edward Elgar PublishingEdberg, U. (2005), Utbildas det för många ekonomer?, Civilekonomen, No. 1
Ejlertsson. G. (2005), Enkäten i praktiken: en handbook i enkätmetodik. 2nd ED, Lund: Studentlitteratur
Ekelund, Å. (2003), Ekonomerna svämmar över, Veckans Affärer, No. 15
Eliasson, R. (1995), Forskningsetik och perspektivval, Lund: Studentlitteratur
Garback, M., Holst Westin, K. & Mitteregger, A. (2006), Identitets- och imageundersökning avseende Umeåuniversitet, Stockholm: Augur Marknadsanalys

78
Gardner, B.B. & Levy, S.J. (1955), The Product and the Brand, Harvard Business Review, Vol. 33, Issue2, p. 33-39
Garvin, D.A. (1987), Competing on the Eight Dimensions of Quality, Harvard Business Review, Vol. 65, Issue 6,p. 101-109
Ghauri, P. & Grønhaug, K. (2002), Research Methods in Business Studies – A Practical Guide, 2nd ED, Harlow:Prentice Hall
Greenleaf, E.A. (1992), Improving Rating Scale Measures by Detecting and Correcting Bias Components in SomeResponse Styles, Journal of Marketing Research, Vol. 29, Issue 2, p. 176-188
Grönroos, C. (1996),Marknadsföring i tjänsteföretag, 3:3rd ED, Malmö: Liber Ekonomi
Grönroos, C. (2000), Service Management and Marketing – A Customer Relationship Management Approach, 2nd
ED, Chichester: John Wiley & SonsGummesson, E. (2002), Relationsmarknadsföring: Från 4P till 30R, 3rd ED, Malmö: Liber Ekonomi
Gustavsson, B., Israelsson, T. & Strannefors, T. (2005), Var finns jobben år 2005?, Gnesta:Arbetsmarknadsstyrelsen Närservice
Hair, Jr., J.F., Black, W.C., Babin, B.J., Anderson, R.E. & Tatham, R.L. (2005), Multivariate Data Analysis,6th ED, Upper Saddle River, NJ: Pearson Prentice-Hall
Håkansson, B. (2004), Det missförstådda varumärket: Myt och sanning om ”företagets främsta tillgång”,Helsingborg: Liljedahl & Co
Harmon-Jones, E. & Mills, J. (Eds) (1999), Cognitive Dissonance – Progress on a Pivotal Theory in SocialPsychology, Washington, DC: American Psychological Association
Hewstone, M., Stroebe, W., Codol, J.P. & Stephenson, G.M. (1988), Introduction to Social Psychology,Oxford: Basil Blackwell
Hoeffler, S. & Keller, K.L. (2003), The Marketing advantage of Strong Brands, Brand Management, Vol. 10, No. 6,p. 421-445
Jamieson, S. (2004), Likert scales: how to (ab)use them, Medical Education, Vol. 38. Issue 12, p. 1212-1218
Johansson Lindfors, M.-B. (1993), Att utveckla kunskap – Om metodologiska och andra vägval vid
samhällsvetenskaplig kunskapsbildning, Lund: StudentlitteraturJohnson, J.M. (2000), Graduate Education Reform in Europe, Asia and the Americas and International Mobility of
Scientists and Engineers: Proceedings of an NSF Workshop, Arlington: National Science FoundationKapferer, J.-N. (1997), Strategic Brand Management – Creating and Sustaining Brand Equity Long Term, 2nd ED,
London: Kogan PageKeller, K.L. (1993), Conceptualizing, Measuring, and Managing Customer-Based Brand Equity, Journal of
Marketing, Vol. 57, Issue 1, p. 1-22Keller, K.L. (1998), Strategic Brand Management: Building, Measuring, and Managing Brand Equity, Upper Saddle
River, NJ: Prentice-Hall, p. 94Keller, K.L. & Aaker, D.A. (1992) The Effects of Sequential Introduction of Brand Extensions, Journal of
Marketing Research, Vol. 29, Issue 1: p. 35-50Kent, R.J. & Allen, C.T. (1994), Competitive Interference Effects in Consumer Memory for Advertising: The role of
Brand Familiarity, Journal of Marketing, Vol. 58, Issue 3, p. 97-105Kotler P. (2003), Marketing Management, 11th ED, Upper Saddle River, NJ: Pearson Education
Larsson, A. & Wood, A. (2005), Marknadsföring & Varumärkesbyggande – Universitet & Högskolor i
Konkurrens, Stockholm: National Agency for Higher EducationLarsson, J. (2006) Umeå universitet raggar studenter på Lunarstorm, IDG – Internetworld, Updated 2006-04-10,
Retrieved 2006-11-05: http://internetworld.idg.se/2.1006/1.54344Lawson, R. (2002), Consumer Knowledge Structures: Background Issues and Introduction, Psychology and
Marketing, Vol. 19, Issue 6, p. 447-456Lerman, D. & Garbarino, E. (2002), Recall and Recognition of Brand Names: A Comparison of Word and
Nonword Name Types, Psychology and Marketing, Vol. 19, Issue 7-8, p. 621-639Lewis, E. (2003), It’s a University Challenge, Brand Strategy, Issue 171, May, p. 20

79
Marell, A. (2005) Välkommen till Handelshögskolan!, Homepage of USBE, Updated 2005-12-13, Retrieved 2006-03-09: http://www.usbe.umu.se/handelshogskolan/valkommen.html
Melin, F. (1997), Varumärket som strategiskt konkurrensmedel: Om konsten att bygga upp starka varumärken,Lund: Lund University Press,
Melin, F. (1999), Varumärkesstrategi: Om konsten att utveckla starka varumärken, Malmö: Liber Ekonomi
Menon, A. & Chowdhury, J. (1995), Dimensions of Quality: Considerations in the Context of Consumer Goods,Journal of Marketing Management, Vol. 5, Issue 1, p. 1-15
Nedungadi, P. (1990), Recall and Consumer Consideration Sets: Influencing Choice without Altering BrandEvaluations, Journal of Consumer Research, Vol. 17, Issue 3, p. 263-276
Novick, L.R. & Hurley, S.M. (2001), To Matrix, Network, or Hierarchy: That is the Question, CognitivePsychology, Vol. 42, Issue 2, p. 158-216
Ogilvy, D. (1964), Confessions of an Advertising Man, New York, NY: Dell Publishing Co.
Oliver, R.L. (1999),Whence Consumer Loyalty?, Journal of Marketing, Vol. 63, Issue 4/Special Issue, p. 33-44
Onkvisit, S. & Shaw, J. (1989), Services Marketing: Image, Branding, and Competition, Business Horizons, Vol.32, Issue 1, p. 13-18
Pappu, R., Quester, P.G. & Cooksey, R.W. (2005), Consumer-Based Brand Equity: Improving the
Measurement – Empirical Evidence, Journal of Product and Brand Management, Vol. 14, Issue 3, p. 143-154
Parasuraman, A., Zeithaml, V.A. & Berry, L.L. (1988), SERVQUAL: A Multi Item Scale for Measuring
Consumer Perceptions of Service Quality, Journal of Retailing, Vol. 64, No. 1, p. 12-40Park, C.S. & Srinivasan, V. (1994), A Survey-Based Method for Measuring and Understanding Brand Equity and
Its Extendibility, Journal of Marketing Research, Vol. 31, Issue 2, p. 271-288Paulssen, M. & Bagozzi, R.P. (2005), A Self-Regulatory Model of Consideration Set Formation, Psychology and
Marketing, Vol. 22, Issue 10, p. 785-812Pulley, J.L. (2003), Romancing the Brand, Chronicle of Higher Education, Vol. 50, Issue 9
Ries, A. & Trout, J. in Wiklander, C. & Hansen, J. (2004), Reklambibeln, Stockholm: Redaktionen
Ritchie, J.R.B. & Ritchie, R.J.B. (1998), The Branding of Tourist Destinations – Past Achievements and FutureChallenges, A Basic Report Prepared for Presentation to the 1998 Annual Congress of the International
Association of Scientific Experts in Tourism
Rosa, J.A. & Porac, J.F. (2002), Categorization Bases and Their Influence on Product Category KnowledgeStructures, Psychology and Marketing, Vol. 19, Issue 6, p. 503-532
Rossiter, J.R. & Percy, L. (1987), Advertising and Promotion Management, New York, NY: McGraw Hill
Roth, M. (1992), Depth Versus Breadth Strategies for Global Brand Image Management, Journal of Advertising,Vol. 21, Issue 2, p. 25-36
Sax, L.J., Gilmartin, S.K. & Bryant, A.N. (2003), Assessing Response Rates and Nonresponse Bias in Web andPaper Survey, Research in Higher Education, Vol. 44, No. 4, p. 409-432
Schafer, J.L. & Graham, J.W. (2002), Missing Data: Our View of the State of the Art, Psychological Methods,Vol. 7, No. 2, p. 147-177
Solomon, M.R. (2004), Consumer Behavior: Buying, Having, and Being, 6th ED, Upper Saddle River, NJ: PearsonEducation
Stenshamn, C. (2003), Talang går före skola, Veckans Affärer, no. 15
Tabachnick, B.G. & Fidell, L.S. (2006), Using Multivariate Statistics, 5th ED, Boston, MA: Pearson
Viswanathan, M. & Childers, T.L. (1999), Understanding How Product Attributes Influence Product
Categorization: Development and Validation of Fuzzy Set-Based Measures of Gradedness in Product
Categories, Journal of Marketing Research, Vol. 36, Issue 1, p. 75-94

80
Yang, Z. & Peterson, R.T. (2004), Customer Perceived Value, Satisfaction, and Loyalty: The Role of SwitchingCosts, Psychology and Marketing, Vol. 21, Issue 10, p. 799-822
Yoo, B. & Donthu, N. (2001), Developing and Validating a Multidimensional Consumer-Based Brand EquityScale, Journal of Business Research, Vol. 52, Issue 1, p.1-14
Zeithaml, V.A. (1988), Consumer Perceptions of Price, Quality, and Value: A Means-End Model and Synthesis ofEvidence, Journal of Marketing, Vol. 52, Issue 3, p. 2-22
Zeithaml, V.A. & Bitner, M.J. (2003), Services Marketing: Integrating Customer Focus Across the Firm, 3rd ED,New York, NY: McGraw-Hill
References with Unidentified Authors
Ekonomer i yrkeslivet, examensår 2001, enkät 2004 (2004), CD-ROM, Stockholm: Civilekonomerna
Hetaste skolorna bland studenter (2006), Civilekonomen, No. 6 & No. 7
Umeå School of Business, Information booklet provided by USBE

APPENDIX A – Ranking and Survey Descriptive Statistics
Table A1 – Veckans Affärer’s Ranking of Swedish Business Schools 2003
Total Number of Applicants
Rank School Points / Position fall 061
1 Handelshögskolan i Stockholm 4.53 6.1
2 Handelshögskolan vid Göteborgs universitet 4.26 3.9
3 Ekonomihögskolan vid Lunds Universitet 4.13 2.5
4 Uppsala universitet 3.93 4.1
5 Stockholms universiteta
3.83 3.14
6 Linköpings universitet 3.63 2.2
7 Handelshögskolan vid Umeå universitet (USBE) 3.37 1.2
8 Internationella Handelshögskolan i Jönköping 3.2
9 Mälardalens Högskola 3.06
10 Sveriges Lantbruksuniversitetb
3.0
11 Universitetet i Örebro 2.9
12 Södertörns Högskola 2.83
13 Högskolan i Borås 2.67
14 Ekonomihögskolan vid Växjö Universitet 2.63
15 Högskolan i Halmstad 2.47
16 Mitthögskolan i Sundsvall & Östersund 2.4
17 Blekinges Tekniska Högskola 2.37
18 Universitetet i Karlstad 2.23
19 Högskolan i Gävle 2.17
20 Luleå Tekniska universitet 2.07
21 Handelshögskolan BBS - Högskolan Kalmar 1.93
22 Högskolan i Dalarna 1.77
23 Högskolan i Kristianstad 1.63
24 Högskolan i Trollhättan/Uddevalla 1.63
25 Högskolan i Skövde 1.13a Refused to participate in the studyb Excluded given its specialization
Average number of applicants for every offered position amongthe six leading business schools in the ranking:
6.1 + 3.9 + 2.5 + 4.1 + 3.14 + 2.2 = 21,94
21,94 / 6 = 3.66 applicants /offered position
1Hetaste skolorna bland studenter (2006), Civilekonomen, No. 6, p.7 & No. 7, p. 23

Invitation A2a – Survey Invitation Sent to Sample O
Engagera dig och tävla om en iPod Nano (1GB, värde ca 1500 kr)
Nedanstående länk leder till en enkätunderökning som distribueras på nio olika universitet/högskolor bland utvaldaförstaårsstudenter som läser någon form av ekonomiprogram. Enkäten syftar till att skapa bättre förståelse för defaktorer som påverkar deras val av studieort samt deras uppfattning av ett särskilt svenskt universitetet.
http://survey.usbe.umu.se/research/niklas.wahlstrom/index.php?sid=38
Fyller du i enkäten innan den 9 juni har du möjlighet att tävla om en iPod Nano. Du deltar i tävlingen genom att angeditt namn och en giltig e-mail adress i slutet av enkäten. Det tar ungefär 10-15 minuter att svara på frågorna. Alla svar
behandlas konfidentiellt (enskilda respondenter kommer inte att kunna urskiljas i det sammanställda resultatet). Föratt inte påverka dig inför undersökningen ges en utförligare presentation av denna först i slutet av enkäten.
Vi är mycket tacksamma för att du ställer upp, dina svar är mycket betydelsefulla för det nämnda svenskauniversitetet och universitet då de kommer att ta del av resultatet.
Tack för ditt engagemang/Fabian Wrede
Information in EnglishThe text above informs and encourages Swedish students to participate in a survey conducted on behalf of anotherSwedish university. The aim of the survey is to gather data of how Swedish students decide where to study and howthey perceive this particular university. The survey is only available in Swedish, and should only be filled-in bySwedish students.
Thanks for your understanding
Invitation A2b – Survey Invitation Sent to Sample U
Ge oss din bild av USBE och tävla om en iPod Nano (1GB, värde ca 1500 kr)
Nedanstående länk leder till en enkätunderökning som ingår i min Kandidatuppsats och distribueras på nio olikauniversitet/högskolor bland utvalda studenter som läser någon form av ekonomiprogram. Enkäten syftar till att skapabättre förståelse för de faktorer som påverkar deras val av studieort samt deras uppfattning av USBE.
http://survey.usbe.umu.se/research/niklas.wahlstrom/index.php?sid=39
Fyller du i enkäten innan den 9 juni har du möjlighet att tävla om en iPod Nano. Du deltar i tävlingen genom att ange
ditt namn och en giltig e-mail adress i slutet av enkäten. Det tar ungefär 10-15 minuter att svara på frågorna. Alla svarbehandlas konfidentiellt (enskilda respondenter kommer inte att kunna urskiljas i det sammanställda resultatet).
Dina svar är mycket betydelsefulla och kan bidra till att stärka USBE:s varumärke vilket i slutändan bidrar till att höjastatusen på din utbildning.
Tack för ditt engagemang/Fabian [email protected]
Information in EnglishThe text above informs and encourages Swedish students to participate in a survey conducted as a part of myBachelor thesis. The aim of the survey is to gather data of how Swedish students decide where to study and how theyperceive USBE. The survey is only available in Swedish, and should only be filled-in by Swedish students.
Thanks for your understanding

NAnswers
NAnswers
as%ofFirstYear
as%ofTotal
Survey
Survey
NN
Studentsat
NStudents
Methodof
School
Program
Sent
Reminded
Students
Answers
IndividualSchool
IncludedinStudy
Distribution
Göteborg
Civilekonom
23-May
n/a
230
Logistikprog.
24-May
04-Jun
47
277
57
21%
3%
School'se-mail
Jönköping
BBA
01-Jun
n/a
126
IEP
01-Jun
n/a
76
202
19
9%
1%
School'se-mail
Linköping
Ekonomprog.
02-Jun
n/a
154
Int.Ekonom
22-May
01-Jun
104
258
48
19%
3%
School'se-mail
Lund
Ekonomprog.
23-May
07-Jun
170
Int.Ekonom.
02-Jun
n/a
55
225
66
29%
4%
School'se-mail
Mälardalen
Ekonomprog.
23-May
01-Jun
132
IT-Ekonom
23-May
01-Jun
26
Int.Marknadsf.
23-May
01-Jun
54
Eko.HållbarUtv.
23-May
01-Jun
12
224
34
15%
2%
Author'se-mail
Stockholm(HHS)
Civilekonom
24-May
n/a
300
300
31
10%
2%
Students'Portal
Uppsala
Ekonomprog.
23-May
07-Jun
286
286
51
18%
3%
School'se-mail
Örebro
Ekonomprog.
01-Jun
n/a
90
90
44%
0,2%
School'se-mail
TOTALSAMPLEO:
1862
310
17%
USBE
Civilekonom
23-May
02-Jun
n/a
Int.Ekonom.
23-May
02-Jun
n/a
Serv.Managem.
23-May
02-Jun
n/a
TOTALSAMPLEU:
730
166
23%
23%
School'sand
author'se-mail
Table A3 – Descriptive Statistics of Survey Distribution for Sample O and U

APPENDIX B – Overall Demographic Descriptive Statistics for Individual Groups
Table B1a-c – Demographic Descriptive Statistics GROUP 1 (Sample O, and U1)
Sex Frequency PercentValid
Percent
Cumulative
Percent
Valid Kvinna 189 53.7 53.7 53.7
Man 163 46.3 46.3 100.0
Total 352 100.0 100.0
Age Frequency PercentValidPercent
CumulativePercent
Valid 19.00 26 7.4 7.4 7.4
20.00 69 19.6 19.6 27.0
21.00 93 26.4 26.4 53.4
22.00 57 16.2 16.2 69.6
23.00 35 9.9 9.9 79.5
24.00 25 7.1 7.1 86.6
25.00 14 4.0 4.0 90.6
26.00 9 2.6 2.6 93.2
27.00 5 1.4 1.4 94.6
28.00 3 .9 .9 95.5
29.00 4 1.1 1.1 96.6
30.00 1 .3 .3 96.9
31.00 2 .6 .6 97.4
32.00 3 .9 .9 98.3
33.00 1 .3 .3 98.6
37.00 2 .6 .6 99.1
38.00 1 .3 .3 99.4
39.00 1 .3 .3 99.7
40.00 1 .3 .3 100.0
Total 352 100.0 100.0
Mean 22.2074
Mode 21.00
Std.
Deviation3.10677
School Frequency PercentValidPercent
CumulativePercent
Valid Göteborg 56 15.9 15.9 15.9
HHSStockholm
31 8.8 8.8 24.7
Jönköping 19 5.4 5.4 30.1
Linköping 48 13.6 13.6 43.7
Lund 66 18.8 18.8 62.5
Mälardalen 34 9.7 9.7 72.2
Uppsala 51 14.5 14.5 86.7
USBE 43 12.2 12.2 98.9
Örebro 4 1.1 1.1 100.0
Total 352 100.0 100.0

Table B2a-c – Demographic Descriptive Statistics GROUP 2 (Sample O, and U1)
Sex Frequency PercentValidPercent
CumulativePercent
Valid Kvinna 188 54.2 54.2 54.2
Man 159 45.8 45.8 100.0
Total 347 100.0 100.0
Age Frequency PercentValidPercent
CumulativePercent
Valid 19.00 25 7.2 7.2 7.2
20.00 69 19.9 19.9 27.1
21.00 93 26.8 26.8 53.9
22.00 56 16.1 16.1 70.0
23.00 34 9.8 9.8 79.8
24.00 24 6.9 6.9 86.7
25.00 14 4.0 4.0 90.8
26.00 8 2.3 2.3 93.1
27.00 5 1.4 1.4 94.5
28.00 2 .6 .6 95.1
29.00 4 1.2 1.2 96.3
30.00 1 .3 .3 96.5
31.00 2 .6 .6 97.1
32.00 3 .9 .9 98.0
33.00 1 .3 .3 98.3
36.00 1 .3 .3 98.6
37.00 2 .6 .6 99.1
38.00 1 .3 .3 99.4
39.00 1 .3 .3 99.7
40.00 1 .3 .3 100.0
Total 347 100.0 100.0
Mean 22.2219
Mode 21.00
Std.Deviation
3.18773
School Frequency PercentValid
Percent
Cumulative
Percent
Valid Göteborg 56 16.1 16.1 16.1
HHSStockholm
31 8.9 8.9 25.0
Jönköping 19 5.5 5.5 30.5
Linköping 47 13.5 13.5 44.0
Lund 65 18.7 18.7 62.7
Mälardalen 34 9.8 9.8 72.5
Uppsala 51 14.7 14.7 87.2
USBE 40 11.5 11.5 98.7
Örebro 4 1.2 1.2 100.0
Total 347 100.0 100.0

Table B3a-c – Demographic Descriptive Statistics GROUP 3 (Sample O)
Sex Frequency PercentValid
Percent
Cumulative
Percent
Valid Kvinna 160 54.8 54.8 54.8
Man 132 45.2 45.2 100.0
Total 292 100.0 100.0
Age Frequency PercentValidPercent
CumulativePercent
Valid 19.00 25 8.6 8.6 8.6
20.00 59 20.2 20.2 28.8
21.00 81 27.7 27.7 56.5
22.00 44 15.1 15.1 71.6
23.00 25 8.6 8.6 80.1
24.00 18 6.2 6.2 86.3
25.00 12 4.1 4.1 90.4
26.00 5 1.7 1.7 92.1
27.00 5 1.7 1.7 93.8
28.00 3 1.0 1.0 94.9
29.00 2 .7 .7 95.5
30.00 1 .3 .3 95.9
31.00 2 .7 .7 96.6
32.00 2 .7 .7 97.3
33.00 2 .7 .7 97.9
36.00 1 .3 .3 98.3
37.00 2 .7 .7 99.0
38.00 1 .3 .3 99.3
39.00 1 .3 .3 99.7
40.00 1 .3 .3 100.0
Total 292 100.0 100.0
Mean 22.2158
Mode 21.00
Std.
Deviation3.38148
School Frequency PercentValidPercent
CumulativePercent
Valid Göteborg 56 19.2 19.2 19.2
HHSStockholm
31 10.6 10.6 29.8
Jönköping 16 5.5 5.5 35.3
Linköping 43 14.7 14.7 50.0
Lund 64 21.9 21.9 71.9
Mälardalen 30 10.3 10.3 82.2
Uppsala 49 16.8 16.8 99.0
Örebro 3 1.0 1.0 100.0
Total 292 100.0 100.0

Table B4a-c – Demographic Descriptive Statistics GROUP 4 (Sample U1, and U2)
Sex Frequency PercentValid
Percent
Cumulative
Percent
Valid Kvinna 88 53.3 53.3 53.3
Man 77 46.7 46.7 100.0
Total 165 100.0 100.0
Age Frequency PercentValidPercent
CumulativePercent
Valid 20.00 9 5.5 5.5 5.5
21.00 18 10.9 10.9 16.4
22.00 27 16.4 16.4 32.7
23.00 37 22.4 22.4 55.2
24.00 27 16.4 16.4 71.5
25.00 17 10.3 10.3 81.8
26.00 8 4.8 4.8 86.7
27.00 5 3.0 3.0 89.7
28.00 4 2.4 2.4 92.1
29.00 6 3.6 3.6 95.8
30.00 1 .6 .6 96.4
32.00 1 .6 .6 97.0
33.00 2 1.2 1.2 98.2
34.00 1 .6 .6 98.8
38.00 1 .6 .6 99.4
43.00 1 .6 .6 100.0
Total 165 100.0 100.0
Mean 23.9273
Mode 23.00
Std.Deviation
3.19787
School Frequency PercentValid
Percent
Cumulative
Percent
Valid USBE 165 100.0 100.0 100.0

APPENDIX C – Group 12 – Determinant Factors of School Choice
Table C1 – Determinant Items of School Choice
“Hur viktiga var följande faktorer när du valde Universitet/högskola?”(1 - ”Inte alls viktigt”, 10 - ”Mycket viktigt”)
2A-E N Mean Std. Dev. Skewness Kurtosis
Statistic Statistic Std. Error Statistic Statistic Std. Error Statistic Std. Error
Möjlighet bra yrkesposition 347 8.43 .097 1.801 -1.336 .131 1.874 .261
Möjlighet bra ingångslön 342 8.00 .110 2.032 -1.250 .132 1.555 .263
Status/anseende 340 7.98 .119 2.192 -1.270 .132 1.125 .264
Möjligheter utbytesstudier 348 7.49 .144 2.680 -.951 .131 -.145 .261
Programinnehåll 346 7.47 .117 2.168 -.615 .131 -.297 .261
Internationell anknytning 343 7.47 .132 2.443 -1.016 .132 .257 .263
Tid till anställning 316 7.40 .141 2.513 -1.023 .137 .351 .273
Anknytning näringsliv 336 7.38 .129 2.361 -1.007 .133 .501 .265
Trivsamma studiekamraterb
340 7.11 .132 2.437 -.802 .132 .033 .264
Programutbud 349 6.88 .137 2.562 -.662 .131 -.374 .260
Kursinnehåll 339 6.88 .127 2.335 -.610 .132 -.074 .264
Kursutbud 346 6.73 .128 2.387 -.520 .131 -.313 .261
Tillgång Magisternivå 320 6.71 .155 2.772 -.585 .136 -.700 .272
Geografiskt läge 348 6.69 .145 2.696 -.542 .131 -.773 .261
Tillgång nätverkc
328 6.29 .133 2.408 -.402 .135 -.459 .268
Möjlighet praktik 321 6.26 .158 2.834 -.327 .136 -.995 .271
Tillgång Masternivå 311 6.26 .157 2.764 -.346 .138 -.876 .276
Framtoning i media 339 5.94 .143 2.627 -.296 .132 -.819 .264
Kvalitetsackrediterad 288 5.93 .173 2.937 -.283 .144 -1.038 .286
Fräscha lokalerb
328 5.87 .133 2.411 -.346 .135 -.490 .268
Utbud nöjesaktiviteterc
347 5.59 .151 2.814 -.248 .131 -1.030 .261
Nära hem till familj 351 5.48 .172 3.213 -.135 .130 -1.421 .260
Tidigare intagningspoäng 338 5.48 .162 2.984 -.175 .133 -1.174 .265
Boendemöjligheter 340 5.48 .156 2.872 -.065 .132 -1.122 .264
Rekommendationa
346 5.29 .156 2.903 -.063 .131 -1.219 .261
Gammal/anrik 342 5.18 .162 2.998 .045 .132 -1.229 .263
Utbud föreningsaktiviteterb
345 4.83 .156 2.895 .208 .131 -1.170 .262
Kända näringslivsprofiler 314 4.81 .154 2.722 .166 .138 -1.009 .274
Omfattning av forskning 305 4.31 .148 2.578 .229 .140 -1.067 .278
Utbud sport/idrotta
345 3.47 .144 2.668 .792 .131 -.531 .262
Läsa med kompisara
344 2.24 .114 2.121 1.843 .131 2.594 .262
Valid N (listwise) 221
a Indicates item removed from factor analysis due to low communality level (<0.50)b Indicates item removed from factor analysis due to non practical significance factor loading (<0.50)c Indicates item removed from factor analysis due to cross-loading
2 Question Section 2, Sample O and U1

Table C2a – Rotated Component Matrixa of Determinant Items of School Choice
Factor
1 2 3 4 5 6 7
Gammal/Anrik .705
Framtoning i media .702
Kända näringslivsprofiler .686
Tidigare intagningspoäng .660
Kvalitetsackrediterad .658
Möjlighet bra ingångslön .864
Möjlighet bra yrkesposition .809
Tid till anställning .798
Status/anseende .677
Programinnehåll .868
Kursutbud .840
Kursinnehåll .829
Möjlighet utbytesstudier .874
Internationell anknytning .848
Möjlighet praktik .540
Anknytning näringsliv .515
Tillgång Masternivå .813
Tillgång Magisternivå .809
Omfattning av forskning .570
Möjligheter boende .880
Programutbud .566
Nära hem till familj .884
Geografiskt läge .775
Extraction Method: Principal Component Analysis. Rotation Method: Varimax with Kaiser Normalizationa Rotation converged in 7 iterations
Table C2b – Total Variance Explained Table C2c – Individual Factor ReliabilityCoefficients
Factor Rotation Sums of Squared Loadings Factor Reliability
Total % of Variance Cumulative % Coefficient - Alpha
1 3.265 14.196 14.196 1 0.782
2 3.045 13.24 27.435 2 0.804
3 2.83 12.304 39.739 3 0.905
4 2.452 10.661 50.401 4 0.734
5 2.263 9.84 60.24 5 0.836
6 1.574 6.845 67.086 6 0.614b
7 1.54 6.694 73.779 7 0.612b
Extraction Method: Principal Component Analysis b Indicates Alpha value below <0.7
Table C2d – Summated Scale Values of Determinant Factors of School Choice
Factor Summated
Mean values
1 5.468
2 7.953
3 7.027
4 7.150
5 5.760
6 N/A
7 N/A

APPENDIX D – Group 23 – Determinant Factors of Overall School Quality
Table D1a – Determinant Items of Expected School Quality
“Hur anser du att följande faktorer påverkar den förväntade kvalitén på en fiktiv skola?”(1 - ”Påverkar mycket negativt”, 5 – ”Varken negativt eller positivt”, 10 - ”Påverkar mycket positivt”)
4A-D N Mean Std. Dev. Skewness Kurtosis
Statistic Statistic Std. Error Statistic Statistic Std. Error Statistic Std. Error
Status/anseende påarbetsmarknad
347 8.40 .057 1.054 -2.038 .131 4.231 .261
Yrkesexamen ”civilekonom”a
347 7.99 .077 1.431 -1.536 .131 2.193 .261
Nätverk i näringsliv 347 7.94 .064 1.184 -1.249 .131 1.554 .261
Möjligheter utbytesstudier 347 7.89 .075 1.396 -1.228 .131 .952 .261
Möjligheter till praktika
347 7.62 .075 1.395 -.722 .131 -.485 .261
Tillgång Magisternivå 347 7.49 .080 1.483 -.815 .131 .158 .261
Fräscha lokaler 347 7.32 .064 1.185 -.222 .131 -.776 .261
Tillgång Masternivå 347 7.30 .084 1.561 -.719 .131 -.014 .261
Brett kursutbud 347 7.28 .075 1.393 -.546 .131 -.322 .261
Brett programutbud 347 7.23 .076 1.422 -.437 .131 -.554 .261
Funktionell hemsida 347 7.12 .080 1.483 -.664 .131 .734 .261
Krävs höga poäng 347 7.11 .088 1.636 -1.078 .131 1.218 .261
Kända näringslivsprofiler harläst där
347 7.09 .083 1.552 -.561 .131 -.044 .261
Nämns i redaktionell media 347 7.07 .076 1.424 -.229 .131 -.871 .261
Kvalitetsackrediterad 347 6.97 .081 1.502 -.187 .131 -.740 .261
Är anrik/gammal 347 6.73 .087 1.623 -.322 .131 -.280 .261
Omfattandeforskningsverksamhet
b 347 6.71 .086 1.603 -.246 .131 -.348 .261
Snygg hemsida 347 6.07 .085 1.576 -.255 .131 .613 .261
Annonsering i tidskrifter 347 6.06 .090 1.681 -.215 .131 .002 .261
Annonsering på Internet 347 5.72 .090 1.678 -.171 .131 .305 .261
Valid N (listwise) 347a Indicates item removed from factor analysis due to low communality level (<0.50)b Indicates item removed from factor analysis due to non practical significance factor loading (<0.50)
3 Question Section 4 and 5, Sample O and U1

Table D1b – Determinant Items of Perceived School Quality
“Hur anser du att följande faktorer påverkar den upplevda kvalitén på en fiktiv skola?”(1 - ”Påverkar mycket negativt”, 5 – ”Varken negativt eller positivt”, 10 - ”Påverkar mycket positivt”)
5A-C N Mean Std. Dev. Skewness Kurtosis
Statistic Statistic Std. Error Statistic Statistic Std. Error Statistic Std. Error
Engagerade föreläsareb
347 8.32 .053 .989 -1.800 .131 4.198 .261
Programupplägg 347 8.14 .058 1.081 -1.534 .131 2.861 .261
Kursupplägg 347 8.01 .060 1.115 -1.436 .131 2.700 .261
Föreläsarna harnäringslivserfarenhet
347 7.93 .067 1.246 -1.369 .131 2.019 .261
Aktivt nätverkb
347 7.88 .065 1.216 -1.078 .131 1.098 .261
Trivsamma studiekamrater 347 7.87 .069 1.289 -1.279 .131 1.697 .261
Uppmuntrar till kritiskt tänkande 347 7.64 .070 1.310 -.909 .131 .324 .261
Lätt ställa frågor
under lektion347 7.51 .067 1.246 -.600 .131 -.234 .261
Aktiviteter utöver kursplan 347 7.47 .074 1.387 -.693 .131 .228 .261
Fräscha lokaler 347 7.43 .066 1.225 -.380 .131 -.530 .261
Föreläsarna tillgängliga 347 7.37 .068 1.276 -.419 .131 -.692 .261
Alt. undervisningsformer 347 7.19 .084 1.557 -.793 .131 .276 .261
Internationell känsla 347 7.09 .083 1.552 -.486 .131 -.263 .261
Utbud föreningsaktiviteter 347 6.88 .085 1.582 -.414 .131 -.092 .261
Valid N (listwise) 347a Indicates item removed from factor analysis due to low communality level (<0.50)b Indicates item removed from factor analysis due to non practical significance factor loading (<0.50)

Table D2a – Rotated Component Matrixa of Determinant Items of Overall School Quality
Factor
1 2 3 4 5 6 7 8
Uppmuntrar till kritiskttänkande
.813
Lätt ställa frågor under lektion .805
Föreläsarna tillgängliga .713
Alt. Undervisningsformer .666
Föreläsarna harnäringslivserfarenhet
.609
Aktiviteter utöver kursplan .590
Nämns i redaktionell media .780
Är anrik/gammal .737
Kända näringslivsprofilerhar läst där
.717
Status/anseende påarbetsmarknad
.656
Krävs höga poäng .617
Kvalitetsackrediterad .612
Nätverk i näringsliv .594
Trivsamma studiekamrater .795
Kursupplägg .772
Programupplägg .738
Utbud föreningsaktiviteter .572
Tillgång Magisternivå .841
Tillgång Masternivå .793
Brett kursutbud .708
Brett programutbud .656
Annonsering på Internet .905
Annonsering i tidskrifter .882
Fräscha lokaler .781
Fräscha lokaler .673
Internationell känsla .732
Möjligheter till utbytesstudier .602
Snygg hemsida .807
Funktionell hemsida .805Extraction Method: Principal Component Analysis. Rotation Method: Varimax with Kaiser NormalizationaRotation converged in 8 iterations
Table D2b – Total Variance Explained Table D2c – Individual Factor ReliabilityCoefficients
Factor Rotation Sums of Squared Loadings Factor Reliability
Total % of Variance Cumulative % Coefficient - Alpha
1 3.903 13.459 13.459 1 0.854
2 3.708 12.787 26.246 2 0.827
3 2.669 9.204 35.45 3 0.819
4 2.62 9.034 44.484 4 0.808
5 2.003 6.909 51.393 5 0.900
6 1.832 6.316 57.709 6 0.842
7 1.735 5.984 63.693 7 0.648b
8 1.678 5.786 69.479 8 0.744
Extraction Method: Principal Component Analysis b Indicates Alpha value below <0.7

Table D2d – Summated Scale Values of Determinant Factors of Overall School Quality
Factor Summated
Mean values
1 7.518
2 7.330
3 7.725
4 7.325
5 5.890
6 7.375
7 N/A
8 6.595

APPENDIX E – Group 34 – Sample O’s Perception(s) of USBE
Table E1 – Sample O’s Perception(s) of USBE
“Hur ställer du dig till följande påståenden om Handelshögskolan vidUmeå universitet och Umeå som studieort?”(1 - ”Instämmer inte alls”, 10 - ”Instämmer till fullo”)
3A-D N Mean Std. Dev. Skewness Kurtosis
Statistic StatisticStd.Error
Statistic StatisticStd.Error
StatisticStd.Error
Känns avlägset 235 8.04 .152 2.325 -1.360 .159 1.318 .316
Känns kallt 202 6.83 .206 2.929 -.686 .171 -.751 .341
Sport och idrottsutbud 91 5.97 .260 2.478 -.197 .253 -.673 .500
Bra studentliv 138 5.69 .201 2.359 -.014 .206 -.761 .410
Flesta hade för låga betyg 157 5.605 .2312 2.8972 -.095 .194 -1.206 .385
Utbud föreningsaktiviteter 80 5.44 .286 2.557 .189 .269 -.830 .532
Trevlig stad 158 5.43 .190 2.391 -.047 .193 -.804 .384
Flesta studenter är
från Norrland138 5.41 .224 2.626 .034 .206 -.991 .410
Känns öppet 119 5.37 .215 2.345 -.077 .222 -.960 .440
Brett kursutbud 78 5.14 .245 2.166 -.233 .272 -.689 .538
Brett programutbud 93 5.02 .238 2.295 -.033 .250 -1.008 .495
Omf. forskningsverksamhet 96 4.57 .247 2.421 .315 .246 -.772 .488
Nöjesutbud 111 4.47 .237 2.498 .315 .229 -.862 .455
Möjligheter utbytesstudier 71 4.44 .270 2.276 .260 .285 -.749 .563
Alt. undervisningsformer 46 4.17 .357 2.420 .394 .350 -.401 .688
Föreläsarna tillgängliga 39 4.14 .414 2.582 .079 .378 -.892 .741
Praktikmöjligheter 54 3.92 .299 2.199 .183 .325 -.944 .639
Känns internationellt 70 3.85 .282 2.358 .665 .287 -.386 .566
Snabbt anställning 67 3.83 .263 2.156 .904 .293 .622 .578
Bra yrkesposition 78 3.77 .251 2.221 .745 .272 .133 .538
Flesta stannar i Norrland 118 3.77 .236 2.559 .910 .223 -.018 .442
Bra ingångslön 74 3.63 .252 2.167 .953 .279 .777 .552
Näringslivsanknytning 87 3.57 .226 2.110 .475 .258 -.811 .511
Status/anseende påarbetsmarknad
135 3.42 .190 2.203 .890 .209 .063 .414
Internationell anknytning 93 3.41 .217 2.089 .747 .250 -.415 .495
Nätverk i näringsliv 74 3.39 .212 1.827 .390 .279 -.594 .552
Nämns i redaktionell media 174 3.22 .153 2.023 .856 .184 .119 .366
Är anrik/gammal 114 3.19 .209 2.226 .983 .226 .351 .449
Kända näringslivsprofiler 91 2.59 .195 1.859 1.421 .253 1.498 .500
Valid N (listwise) 21
4 Question Section 2G-H4, 3A-D, 91C2-F, 92D-F, Sample O

Tables E2a-l – Additional Descriptive Statistics of Sample O
Table E2a”Har du någon gång varit i Umeå?”
2H1Frequency Percent
Valid
Percent
Cumulative
Percent
Valid Nej 239 81.8 81.8 81.8
Ja 53 18.2 18.2 100.0
Total 292 100.0 100.0
Table E2b”Har någon gång övervägt att läsa på Handelshögskolan vid Umeå universitet?”
2H2Frequency Percent
ValidPercent
CumulativePercent
Valid Nej 261 89.4 89.4 89.4
Ja 31 10.6 10.6 100.0
Total 292 100.0 100.0
Table E2c”Har du någon gång varit i Umeå? / Har du någon gång över-vägt att läsa på Handelshögskolan vid Umeå universitet?”
2H1 / 2H2 Övervägt läsa på USBE Total
Nej Ja
Varit i
UmeåNej Count 224 15 239
% within Varit i Umeå 93.7% 6.3% 100.0%
Ja Count 37 16 53
% within Varit i Umeå 69.8% 30.2% 100.0%
Total Count 261 31 292
% within Varit i Umeå 89.4% 10.6% 100.0%
Table E2dPearson Chi-Square Test
Value df Asymp. Sig. (2-sided)
Pearson Chi-Square 26.140a
1 .000
N of Valid Cases 292
a 0 cells (.0%) have expected count less than 5. The minimum expected count is 5.63

Table E2e”Var studerar du? / Har du någon gång övervägt attläsa på Handelshögskolan vid Umeå universitet?”
91C2 / 2H2 Övervägt läsa på USBE Total
Nej Ja
Studerar vidGöteborg Count 50 6 56
% within Läser på vilken skola 89.3% 10.7% 100.0%
HHS Stockholm Count 31 0 31
% within Läser på vilken skola 100.0% .0% 100.0%
Jönk�ping Count 14 2 16
% within Läser på vilken skola 87.5% 12.5% 100.0%
Linköping Count 40 3 43
% within Läser på vilken skola 93.0% 7.0% 100.0%
Lund 60 4 64
% within Läser på vilken skola 93.8% 6.3% 100.0%
Mälardalen Count 26 4 30
% within Läser på vilken skola 86.7% 13.3% 100.0%
Uppsala Count 39 10 49
% within Läser på vilken skola 79.6% 20.4% 100.0%
Örebro Count 1 2 3
% within Läser på vilken skola 33.3% 66.7% 100.0%
Total Count 261 31 292
% within Läser på vilken skola 89.4% 10.6% 100.0%
Table E2f”Fanns Handelshögskolan vid Umeå universitet med som ett alternativ (första-
hands eller lägre) på din ansökan till att läsa en ekonomiutbildning?”
2H3Frequency Percent
ValidPercent
CumulativePercent
Valid Ja 10 3.4 3.4 3.4
Nej 271 92.8 92.8 96.2
Minns ej 11 3.8 3.8 100.0
Total 292 100.0 100.0
Table E2g”Har du någon gång läst vid Handelshögskolan vid Umeå universitet eller
annan enhet inom Umeå universitet?”
2H4Frequency Percent
Valid
Percent
Cumulative
Percent
Valid Nej 290 99.3 99.3 99.3
Ja 2 .7 .7 100.0
Total 292 100.0 100.0

Table E2h“Handelshögskolan vid Umeå Universitet använder en logotype med en
kombination av fyra bokstäver. vilken av följande är det?”
2GFrequency Percent
ValidPercent
CumulativePercent
Valid BESU 1 .3 .3 .3
BSUS 3 1.0 1.0 1.4
EBSU 1 .3 .3 1.7
SEBU 1 .3 .3 2.1
SUBE 1 .3 .3 2.4
USBE 38 13.0 13.0 15.4
UESB 10 3.4 3.4 18.8
Vet ej 237 81.2 81.2 100.0
Total 292 100.0 100.0
Table E2i“Har du läst andra kurser eller program på universitet/högskolamellan studenten och ditt nuvarande utbildningsprogram?”
91FFrequency Percent
ValidPercent
CumulativePercent
Valid Nej 165 56.5 56.5 56.5
Ja 127 43.5 43.5 100.0
Total 292 100.0 100.0
Table E2j”Påverkade ditt tilltänkta huvudämne valet av studieort?”
92EFrequency Percent
ValidPercent
CumulativePercent
Valid 1 .3 .3 .3
Nej 180 61.6 61.6 62.0
Ja 111 38.0 38.0 100.0
Total 292 100.0 100.0
Table E2k“Påverkade din tilltänkta examensnivå (ex. Kandidat, Magister, Master) valet av studieort?”
92FFrequency Percent
Valid
Percent
Cumulative
Percent
Valid 2 .7 .7 .7
Nej 169 57.9 57.9 58.6
Ja 121 41.4 41.4 100.0
Total 292 100.0 100.0

Table E2l”Planerat huvudämne / Påverkade ditt tilltänkta huvudämne valet av studieort?”
92D / 92E Huvudämne påverkade studieort Total
Nej Ja
HuvudämneEntreprenörskap 5 9 14
Annat - Se kommentar 8 9 17
Ej bestämt 58 15 73
Finansiering 18 9 27
Int. ekonomi 3 15 18
Logistik 2 5 7
Management 13 11 24
Marketing 28 15 43
Nationalekonomi 8 8 16
Redovisning 38 13 51
Retail 0 2 2
Total 181 111 292

APPENDIX F – Group 45 – Sample U’s Perception(s) of USBE
Table F1 – Sample U’s Perception(s) of USBE
“Hur ställer du dig till följande påståenden om Handelshögskolan vidUmeå universitet och Umeå som studieort?”
(1 - ”Instämmer inte alls”, 10 - ”Instämmer till fullo”)
3A-D N Mean Std. Dev. Skewness Kurtosis
Statistic Statistic Std. Error Statistic Statistic Std. Error Statistic Std. Error
Sport och idrottsutbud 159 8.51 .136 1.709 -1.200 .192 1.035 .383
Trivsamma studiekamrater 165 8.01 .155 1.994 -1.120 .189 .768 .376
Trevlig stad 164 7.87 .168 2.157 -1.132 .190 .971 .377
Möjligheter utbytesstudier 152 7.76 .178 2.193 -1.190 .197 .946 .391
Känns öppet 159 7.40 .151 1.906 -1.048 .192 1.126 .383
Bra studentliv 158 7.37 .154 1.940 -.688 .193 .151 .384
Brett programutbud 164 7.05 .166 2.121 -.740 .190 -.078 .377
Lätt ställa frågor 165 7.01 .179 2.297 -.643 .189 -.244 .376
Föreläsarna tillgängliga 164 6.85 .188 2.407 -.673 .190 -.171 .377
Utbud föreningsaktiviteter 144 6.67 .177 2.122 -.441 .202 -.183 .401
Programinnehåll 163 6.64 .142 1.808 -.700 .190 .339 .378
Brett kursutbud 164 6.51 .155 1.980 -.616 .190 .197 .377
Nöjesutbud 157 6.43 .166 2.083 -.493 .194 -.249 .385
Kursinnehåll 159 6.39 .147 1.848 -.563 .192 -.086 .383
Omf. forskningsverksamhet 133 6.23 .202 2.329 -.459 .210 -.474 .417
Funktionell hemsida 162 6.10 .192 2.449 -.452 .191 -.456 .379
Internationell anknytning 154 5.75 .181 2.242 -.380 .195 -.527 .389
Uppmuntrar till kritiskt tänkande 163 5.61 .180 2.299 -.187 .190 -.696 .378
Alt. undervisningsformer 159 5.55 .199 2.505 -.091 .192 -.891 .383
Snygg hemsida 158 5.46 .180 2.264 -.272 .193 -.537 .384
Föreläsarengagemang 162 5.42 .159 2.024 -.123 .191 -.477 .379
Snabbt anställning 116 5.39 .158 1.703 -.132 .225 -.002 .446
Möjlighet bra yrkesposition 107 5.36 .162 1.679 -.168 .234 -.355 .463
Aktiviteter utöver kursplan 162 5.29 .177 2.250 -.037 .191 -.797 .379
Föreläsarna harnäringslivserfarenhet
153 5.29 .185 2.293 .006 .196 -.603 .390
Flesta studenter är
från Norrland158 5.24 .199 2.507 .081 .193 -.907 .384
Fräscha lokaler 165 5.20 .183 2.353 -.047 .189 -.887 .376
Näringslivsanknytning 156 5.14 .185 2.315 -.185 .194 -.848 .386
Nätverk i näringsliv 149 5.10 .163 1.991 -.152 .199 -.358 .395
Bra ingångslön 101 5.10 .164 1.652 -.297 .240 -.462 .476
Status/anseende på
arbetsmarknad147 5.09 .190 2.298 -.234 .200 -.966 .397
Bra föreläsarpedagogik 164 4.87 .169 2.168 -.078 .190 -.867 .377
Krävande föreläsare 165 4.77 .170 2.180 .031 .189 -.608 .376
Känns internationellt 154 4.71 .210 2.602 .242 .195 -.980 .389
Flesta hade för låga betyg 140 4.50 .208 2.461 .318 .205 -.750 .407
Praktikmöjligheter 141 4.37 .259 3.077 .389 .204 -1.273 .406
Känns kallt 154 4.05 .240 2.973 .713 .195 -.761 .389
Är anrik/gammal 153 4.02 .180 2.221 .409 .196 -.405 .390
Flesta stannar i Norrland 118 3.64 .201 2.179 .787 .223 -.034 .442
Nämns i redaktionell media 143 3.58 .160 1.911 .495 .203 -.456 .403
Kända näringslivsprofiler 114 3.56 .179 1.907 .538 .226 -.340 .449
Valid N (listwise) 59
5 Question Section 1A-C, 3A-D, 6, 9A-B, Sample U

Table and Bar Chart F2a – USBE Students’ Satisfaction
”Hur nöjd är du överlag med USBE/Handelshögskolan vid Umeå universitet?(1 - ”Inte alls nöjd”, 10 - ”Mycket nöjd”)
1AFrequency Percent
ValidPercent
CumulativePercent
Valid 1”Inte alls nöjd” - - - -
2 1 .6 .6 .6
3 7 4.2 4.2 4.8
4 5 3.0 3.0 7.9
5 13 7.9 7.9 15.8
6 18 10.9 10.9 26.7
7 54 32.7 32.7 59.4
8 50 30.3 30.3 89.7
9 11 6.7 6.7 96.4
10 ”Mkt nöjd” 6 3.6 3.6 100.0
Total 165 100.0 100.0
Mean 6.99
Mode 7
Std.
Deviation1.562
2 3 4 5 6 7 8 9 10
0
10
20
30
40
50
60
Frequency
Score
HUR NÖJD MED USBE ÖVERLAG
Table F2b – Considered Changing School
“Har du funderat på att byta studieort under utbildningen för att kunna taexamen vid ett annat universitet/högskola? / Sample U1 eller U2”
9A Sample Total
USBEFörsta år
% withinFörsta år
USBESenior
% withinSenior
% withinTotal
Funderat på attbyta studieort
Nej 22 52.4% 50 40.7% 72 43.6%
Ja 20 47.6% 73 59.3% 93 56.4%
Total 42 100.0% 123 100.0% 165 100.0%

Table F2c – Alternative Schools For USBE Students
91A2 Funderat byta till Approx. Percent
HHS Stockholm 23
Göteborg 20
Stockholms Universitet 20
Uppsala 13
Lund 13
Jönköping 3
Linköping 1
“Others” including abroad 7
Total 100.0
Table F2d – USBE Students’ Loyalty”Värdera följande påståenden”
(1 - ”Instämmer inte alls”, 10 - ”Instämmer till fullo”)
9B N Mean Std. Dev. Skewness Kurtosis
Statistic Statistic Std. Error Statistic Statistic Std. Error Statistic Std. Error
Rekommenderar gärna någon
att läsa på USBE163 7.785 .1667 2.1278 -.976 .190 .465 .378
Stolt över att läsa på USBEb
162 6.98 .183 2.326 -.723 .191 -.053 .379
Skulle söka USBE igen 162 6.906 .2008 2.5557 -.742 .191 -.165 .379
Valid N (listwise) 159bQuestion moved from question section 6
Table F2e – USBE students’ Self Perception
”Hur väl anser du att följande påståenden stämmer för dig?”(1 - ”Instämmer inte alls”, 10 - ”Instämmer till fullo”)
6a
N Mean Std. Dev. Skewness Kurtosis
Statistic Statistic Std. Error Statistic Statistic Std. Error Statistic Std. Error
Lägger förväntad tid på
studier163 6.75 .179 2.291 -.566 .190 -.282 .378
Deltar aktivt i aktiviteterutöver kursplanen
162 6.01 .209 2.654 -.371 .191 -.895 .379
Deltar aktivt iföreningsaktiviteter
164 5.10 .273 3.500 .082 .190 -1.590 .377
Deltar aktivt i föreläsningar 164 4.93 .196 2.514 .310 .190 -.776 .377
Ordentligt påläst 164 4.69 .159 2.031 .176 .190 -.545 .377
Valid N (listwise) 161a The sixth. and last question in section 6 is presented together with question section 9B below

APPENDIX G – Differences in Perception(s) of USBE Between Sample O and U
Table G1a – The Determinant Factors of School Choice and Sample O’s Perception Items
N Mean Determinant Factor of
Statistic Statistic School Choice
Känns kallt 202 6.83
Sport och idrottsutbud 91 5.97
Bra studentliv 138 5.69
Flesta hade för låga betyg 157 5.605
Utbud föreningsaktiviteter 80 5.44
Trevlig stad 158 5.43
Flesta studenter är frånNorrland
138 5.41
Känns öppet 119 5.37
Brett kursutbud 78 5.14 3 - Performance
Brett programutbud 93 5.02
Omf. forskningsverksamhet 96 4.57 4 - Expertise
Nöjesutbud 111 4.47
Möjligheter utbytesstudier 71 4.44 2 - Versatility
Alt. undervisningsformer 46 4.17
Föreläsarna tillgängliga 39 4.14
Praktikmöjligheter 54 3.92 2 - Versatility
Känns internationellt 70 3.85
Snabbt anställning 67 3.83 1 - Outcome & Prestige
Möjlighet bra yrkesposition 78 3.77 1 - Outcome & Prestige
Flesta stannar i Norrland 118 3.77
Bra ingångslön 74 3.63 1 – Outcome & Prestige
Näringslivsanknytning 87 3.57 2 - Versatility
Status/anseende på
arbetsmarknad135 3.42 1 - Outcome & Prestige
Internationell anknytning 93 3.41 2 - Versatility
Nätverk i näringsliv 74 3.39
Nämns i redaktionell media 174 3.22 5 - Assurance
Är anrik/gammal 114 3.19 5 - Assurance
Kända näringslivsprofiler 91 2.59 5 - Assurance
Valid N (listwise) 21

Table G1b – The Determinant Factors of School Choice and Sample U’s Perception Items
N Mean Determinant Factor ofStatistic Statistic School Choice
Sport och idrottsutbud 159 8.51
Trivsamma studiekamratera
165 8.01
Trevlig stad 164 7.87
Möjligheter utbytesstudier 152 7.76 2 - Versatility
Känns öppet 159 7.40
Bra studentliv 158 7.37
Brett programutbud 164 7.05
Lätt ställa frågora
165 7.01
Föreläsarna tillgängliga 164 6.85
Utbud föreningsaktiviteter 144 6.67
Programinnehålla
163 6.64 3 - Performance
Brett kursutbud 164 6.51 3 - Performance
Nöjesutbud 157 6.43
Kursinnehålla
159 6.39 3 - Performance
Omf. forskningsverksamhet 133 6.23 4 - Expertise
Funktionell hemsida 162 6.10
Internationell anknytning 154 5.75 2 - Versatility
Uppmuntrar till kritiskttänkande
a 163 5.61
Alt. undervisningsformer 159 5.55
Snygg hemsidaa
158 5.46
Föreläsarengagemanga
162 5.42
Snabbt anställning 116 5.39 1 - Outcome & Prestige
Möjlighet bra yrkesposition 107 5.36 1 - Outcome & Prestige
Aktiviteter utöver kursplana
162 5.29
Föreläsarna har
näringslivserfarenhet153 5.29
Flesta studenter ärfrån Norrland
158 5.24
Fräscha lokalera
165 5.20
Näringslivsanknytning 156 5.14 2 - Versatility
Nätverk i näringsliv 149 5.10
Bra ingångslön 101 5.10 1 - Outcome & Prestige
Status/anseende påarbetsmarknad
147 5.09 1 - Outcome & Prestige
Bra föreläsarpedagogika
164 4.87
Krävande föreläsarea
165 4.77
Känns internationellt 154 4.71
Flesta hade för låga betyg 140 4.50
Praktikmöjligheter 141 4.37 2 - Versatility
Känns kallt 154 4.05
Är anrik/gammal 153 4.02 5 - Assurance
Flesta stannar i Norrland 118 3.64
Nämns i redaktionell media 143 3.58 5 - Assurance
Kända näringslivsprofiler 114 3.56 5 - Assurance
Valid N (listwise) 59a Indicates item not included in sample O’s survey

Table G2 – Differences in Mean Values of USBE Perception Items Between Sample O and U
N Mean Std. Dev. Std. Error
Sample Statistic Statistic Statistic Mean
Är anrik/gammalb
ANDRA 114 3.19 2.226 .209
USBE 153 4.02 2.221 .180
Redaktionell media ANDRA 174 3.22 2.023 .153
USBE 143 3.58 1.911 .160
Omf. forskningsverksamheta
ANDRA 96 4.57 2.421 .247
USBE 133 6.23 2.329 .202
Kända näringslivsprofilera
ANDRA 91 2.59 1.859 .195
USBE 114 3.56 1.907 .179
Internationell anknytninga
ANDRA 93 3.41 2.089 .217
USBE 154 5.75 2.242 .181
Näringslivsanknytninga
ANDRA 87 3.57 2.110 .226
USBE 156 5.14 2.315 .185
Status/anseende på arbetsmarknada
ANDRA 135 3.42 2.203 .190
USBE 147 5.09 2.298 .190
Brett programutbuda
ANDRA 93 5.02 2.295 .238
USBE 164 7.05 2.121 .166
Brett kursutbuda
ANDRA 78 5.14 2.166 .245
USBE 164 6.51 1.980 .155
Nätverk i näringsliva
ANDRA 74 3.39 1.827 .212
USBE 149 5.10 1.991 .163
Utbytesstudiera
ANDRA 71 4.44 2.276 .270
USBE 152 7.76 2.193 .178
Praktikmöjligheter ANDRA 54 3.92 2.199 .299
USBE 141 4.37 3.077 .259
Alt. undervisningsformerb
ANDRA 46 4.17 2.420 .357
USBE 159 5.55 2.505 .199
Sport och idrottsutbuda
ANDRA 91 5.97 2.478 .260
USBE 159 8.51 1.709 .136
Nöjesutbuda
ANDRA 111 4.47 2.498 .237
USBE 157 6.43 2.083 .166
Snabbt anställninga
ANDRA 67 3.83 2.156 .263
USBE 116 5.39 1.703 .158
Bra ingångslöna
ANDRA 74 3.63 2.167 .252
USBE 101 5.10 1.652 .164
Bra yrkespositiona
ANDRA 78 3.77 2.221 .251
USBE 107 5.36 1.679 .162
Föreläsarna tillgängligaa
ANDRA 39 4.14 2.582 .414
USBE 164 6.85 2.407 .188
Utbud föreningsaktivitetera
ANDRA 80 5.44 2.557 .286
USBE 144 6.67 2.122 .177a Indicates significant difference at <0.001 levelb Indicates significant difference at <0.05 level
The table continues on next page

Table G2 Continued
N Mean Std. Dev. Std. Error
Sample Statistic Statistic Statistic Mean
Bra studentliva
ANDRA 138 5.69 2.359 .201
USBE 158 7.37 1.940 .154
Trevlig stada
ANDRA 158 5.43 2.391 .190
USBE 164 7.87 2.157 .168
Flesta från Norrland ANDRA 138 5.41 2.626 .224
USBE 158 5.24 2.507 .199
Flesta stannar i Norrland ANDRA 118 3.77 2.559 .236
USBE 118 3.64 2.179 .201
För låga betygb
ANDRA 157 5.66 2.897 .2312
USBE 140 4.50 2.461 .2080
Internationelltb
ANDRA 70 3.85 2.358 .282
USBE 154 4.71 2.602 .210
Öppeta
ANDRA 119 5.37 2.345 .215
USBE 159 7.40 1.906 .151
Kallta
ANDRA 202 6.83 2.929 .206
USBE 154 4.05 2.973 .240a Indicates significant difference at <0.001 levelb Indicates significant difference at <0.05 level

INGENUPPFATTNING
1 INTE ALLS
VIKTIGT 2 3 4 5 6 7 8 9
10MYCKETVIKTIGT
Möjligheten att läsa medkompisar som redan lästepå samma skola
gfedc gfedc gfedc gfedc gfedc gfedc gfedc gfedc gfedc gfedc gfedc
Rekommendationer attläsa på skolan frånkompisar/familj/släkt
gfedc gfedc gfedc gfedc gfedc gfedc gfedc gfedc gfedc gfedc gfedc
Universitetets/högskolansframtoning i media gfedc gfedc gfedc gfedc gfedc gfedc gfedc gfedc gfedc gfedc gfedc
Nära hem till familj ochkompisar gfedc gfedc gfedc gfedc gfedc gfedc gfedc gfedc gfedc gfedc gfedc
Det geografiska lägetsåsom staden ellerregionen
gfedc gfedc gfedc gfedc gfedc gfedc gfedc gfedc gfedc gfedc gfedc
Utbudet av sport- och idrottsaktiviteter gfedc gfedc gfedc gfedc gfedc gfedc gfedc gfedc gfedc gfedc gfedc
Utbudet av nöjesaktiviteter(ex. uteställen, bio etc) gfedc gfedc gfedc gfedc gfedc gfedc gfedc gfedc gfedc gfedc gfedc
INGENUPPFATTNING
1 INTE ALLS
VIKTIGT 2 3 4 5 6 7 8 910 MYCKET
VIKTIGT
Tidigare årsintagningspoäng gfedc gfedc gfedc gfedc gfedc gfedc gfedc gfedc gfedc gfedc gfedc
Att skolan har fräschalokaler gfedc gfedc gfedc gfedc gfedc gfedc gfedc gfedc gfedc gfedc gfedc
Att skolan ärkvalitets-ackrediterad av en oberoendeorganisation
gfedc gfedc gfedc gfedc gfedc gfedc gfedc gfedc gfedc gfedc gfedc
Att skolan ärgammal/anrik gfedc gfedc gfedc gfedc gfedc gfedc gfedc gfedc gfedc gfedc gfedc
Möjligheter till boende gfedc gfedc gfedc gfedc gfedc gfedc gfedc gfedc gfedc gfedc gfedc
Utbudet av program (ex. olika inriktningar) gfedc gfedc gfedc gfedc gfedc gfedc gfedc gfedc gfedc gfedc gfedc
INGENUPPFATTNING
1 INTE ALLS
VIKTIGT 2 3 4 5 6 7 8 9
10MYCKETVIKTIGT
Programmens innehåll gfedc gfedc gfedc gfedc gfedc gfedc gfedc gfedc gfedc gfedc gfedc
Utbudet av kurser gfedc gfedc gfedc gfedc gfedc gfedc gfedc gfedc gfedc gfedc gfedc
Kursernas innehåll gfedc gfedc gfedc gfedc gfedc gfedc gfedc gfedc gfedc gfedc gfedcUtbudet avföreningsaktiviteter(ex. studentkåren,intresseföreningar etc.)
gfedc gfedc gfedc gfedc gfedc gfedc gfedc gfedc gfedc gfedc gfedc
Tillgången tillpåbyggnadsutbildning tillmagisternivå
gfedc gfedc gfedc gfedc gfedc gfedc gfedc gfedc gfedc gfedc gfedc
Tillgången tillpåbyggnadsutbildning tillmasternivå
gfedc gfedc gfedc gfedc gfedc gfedc gfedc gfedc gfedc gfedc gfedc
INGENUPPFATTNING
1 INTE ALLS
VIKTIGT 2 3 4 5 6 7 8 9
10MYCKETVIKTIGT
Omfattningen avuniversitetets/högskolansforskningsverksamhet
gfedc gfedc gfedc gfedc gfedc gfedc gfedc gfedc gfedc gfedc gfedc
Chansen att finna trivsamma studiekamrater gfedc gfedc gfedc gfedc gfedc gfedc gfedc gfedc gfedc gfedc gfedc
Universitetets/högskolansanknytning till näringslivet gfedc gfedc gfedc gfedc gfedc gfedc gfedc gfedc gfedc gfedc gfedc
Studenters val av studieort2AB
2A: Hur viktiga var följande faktorer när du valde universitet/högskola?Välj det korrekta svaret för varje punkt:
2B:Välj det korrekta svaret för varje punkt:
2CD2C: Hur viktiga var följande faktorer när du valde universitet/högskola?
Välj det korrekta svaret för varje punkt:
2D:Välj det korrekta svaret för varje punkt:
APPENDIX H – Sample O’s Survey

Universitetets/högskolansinternationella anknytning gfedc gfedc gfedc gfedc gfedc gfedc gfedc gfedc gfedc gfedc gfedc
Möjligheter tillutbytesstudier utomlands gfedc gfedc gfedc gfedc gfedc gfedc gfedc gfedc gfedc gfedc gfedc
Möjligheter till praktik gfedc gfedc gfedc gfedc gfedc gfedc gfedc gfedc gfedc gfedc gfedc
INGENUPPFATTNING
1 INTE ALLS
VIKTIGT 2 3 4 5 6 7 8 9
10MYCKETVIKTIGT
Kändanäringslivsprofilersanknytning till skolan
gfedc gfedc gfedc gfedc gfedc gfedc gfedc gfedc gfedc gfedc gfedc
Tillgången till ettnätverk i näringslivet gfedc gfedc gfedc gfedc gfedc gfedc gfedc gfedc gfedc gfedc gfedc
Skolansstatus/anseende påarbetsmarknaden
gfedc gfedc gfedc gfedc gfedc gfedc gfedc gfedc gfedc gfedc gfedc
Möjligheter till en brayrkesposition efter examen
gfedc gfedc gfedc gfedc gfedc gfedc gfedc gfedc gfedc gfedc gfedc
Möjligheter till braingångslön efter examen gfedc gfedc gfedc gfedc gfedc gfedc gfedc gfedc gfedc gfedc gfedc
Hur lång tid det brukarta att få anställningefter examen därifrån
gfedc gfedc gfedc gfedc gfedc gfedc gfedc gfedc gfedc gfedc gfedc
INGENUPPFATTNING
1INSTÄMMERINTE ALLS 2 3 4 5 6 7 8 9
10INSTÄMMERTILL FULLO
Är anrik/gammal gfedc gfedc gfedc gfedc gfedc gfedc gfedc gfedc gfedc gfedc gfedc
2E2E: Hur viktiga var följande faktorer när du valde universitet/högskola?
Välj det korrekta svaret för varje punkt:
2FGH2F: Inledningvis nämnde vi att vi ville undersöka din och andra studenters bild av ett särskilt unviersitet, därför följernu ett antal frågor om Handelshögskolan vid Umeå universitet.
2G: Handelshögskolan vid Umeå universitet använder en logotyp med en kombination av fyra bokstäver, vilken avföljande är det?
Välj endast en av följande:gfedc BESUgfedc BSUSgfedc EBSUgfedc EUSBgfedc SEBUgfedc SUBEgfedc USBEgfedc UESBgfedc Vet ej
* 2H1: Har du någon gång varit i Umeå?Välj endast en av följande:gfedc Jagfedc Nej
* 2H2: Har du någon gång övervägt att läsa på Handelshögskolan vid Umeå universitet?Välj endast en av följande:gfedc Jagfedc Nej
* 2H3: Fanns Handelshögskolan vid Umeå universitet med som ett alternativ (förstahands eller lägre) på din ansökan tillatt läsa en ekonomiutbildning?
Välj endast en av följande:gfedc Jagfedc Nejgfedc Minns ej
* 2H4: Har du någon gång läst vid Handelshögskolan vid Umeå universitet eller annan enhet inom Umeå universitet?Välj endast en av följande:gfedc Jagfedc Nej
3AB3A: Hur ställer du dig till följande påståenden om Handelshögskolan vid Umeå universitet och Umeå som studieort?
Välj det korrekta svaret för varje punkt:

Nämns ofta iredaktionell media (ex. DN, SVD etc)
gfedc gfedc gfedc gfedc gfedc gfedc gfedc gfedc gfedc gfedc gfedc
Omfattandeforskningsverksamhetbedrivs där
gfedc gfedc gfedc gfedc gfedc gfedc gfedc gfedc gfedc gfedc gfedc
Många kändanäringslivsprofiler harläst där
gfedc gfedc gfedc gfedc gfedc gfedc gfedc gfedc gfedc gfedc gfedc
Har hög internationellanknytning gfedc gfedc gfedc gfedc gfedc gfedc gfedc gfedc gfedc gfedc gfedc
Har hög anknytningtill näringslivet gfedc gfedc gfedc gfedc gfedc gfedc gfedc gfedc gfedc gfedc gfedc
Har högstatus/anseende påarbetsmarknaden
gfedc gfedc gfedc gfedc gfedc gfedc gfedc gfedc gfedc gfedc gfedc
Utbudet av program som erbjuds är brett(ex. olika inriktningar)
gfedc gfedc gfedc gfedc gfedc gfedc gfedc gfedc gfedc gfedc gfedc
INGENUPPFATTNING
1INSTÄMMERINTE ALLS 2 3 4 5 6 7 8 9
10INSTÄMMERTILL FULLO
Utbudet av kurser som erbjuds ärbrett
gfedc gfedc gfedc gfedc gfedc gfedc gfedc gfedc gfedc gfedc gfedc
Har ett omfattandenätverk inäringslivet
gfedc gfedc gfedc gfedc gfedc gfedc gfedc gfedc gfedc gfedc gfedc
Det erbjuds godamöjligheter tillutbytesstudier(utomlands)
gfedc gfedc gfedc gfedc gfedc gfedc gfedc gfedc gfedc gfedc gfedc
Det erbjuds godamöjligheter tillpraktik
gfedc gfedc gfedc gfedc gfedc gfedc gfedc gfedc gfedc gfedc gfedc
Alternativa former av undervisninganvänds där (ex.casebaserad)
gfedc gfedc gfedc gfedc gfedc gfedc gfedc gfedc gfedc gfedc gfedc
Utbudet av sport- ochidrottsaktiviteter ärbrett
gfedc gfedc gfedc gfedc gfedc gfedc gfedc gfedc gfedc gfedc gfedc
Utbudet avnöjesaktiviteter ärbrett (ex.uteställen, bio etc)
gfedc gfedc gfedc gfedc gfedc gfedc gfedc gfedc gfedc gfedc gfedc
INGENUPPFATTNING
1INSTÄMMERINTE ALLS 2 3 4 5 6 7 8 9
10INSTÄMMERTILL FULLO
Studenterutexamineradedärifrån får snabbtanställning
gfedc gfedc gfedc gfedc gfedc gfedc gfedc gfedc gfedc gfedc gfedc
Studenterutexamineradedärifrån får braingångslön
gfedc gfedc gfedc gfedc gfedc gfedc gfedc gfedc gfedc gfedc gfedc
Studenter därifrånfår brayrkespositionerefter examen
gfedc gfedc gfedc gfedc gfedc gfedc gfedc gfedc gfedc gfedc gfedc
Föreläsarna finnstillgängliga utöverföreläsningstid
gfedc gfedc gfedc gfedc gfedc gfedc gfedc gfedc gfedc gfedc gfedc
INGENUPPFATTNING
1INSTÄMMERINTE ALLS 2 3 4 5 6 7 8 9
10INSTÄMMERTILL FULLO
3B:Välj det korrekta svaret för varje punkt:
3CD3C: Hur ställer du dig till följande påståenden om Handelshögskolan vid Umeå universitet och Umeå som studieort?
Välj det korrekta svaret för varje punkt:
3D:Välj det korrekta svaret för varje punkt:

Utbudet avföreningsaktiviteterär bra (ex.studentkåren,intresseföreningaretc.)
gfedc gfedc gfedc gfedc gfedc gfedc gfedc gfedc gfedc gfedc gfedc
Har ett bra studentliv gfedc gfedc gfedc gfedc gfedc gfedc gfedc gfedc gfedc gfedc gfedc
Ligger i en trevlig stad gfedc gfedc gfedc gfedc gfedc gfedc gfedc gfedc gfedc gfedc gfedc
De flesta som läserdär kommer frånNorrland
gfedc gfedc gfedc gfedc gfedc gfedc gfedc gfedc gfedc gfedc gfedc
De flesta som läserdär stannar kvar iNorrland efter examen
gfedc gfedc gfedc gfedc gfedc gfedc gfedc gfedc gfedc gfedc gfedc
De flesta som läserdär hade för lågabetyg för att kommain någon annanstans
gfedc gfedc gfedc gfedc gfedc gfedc gfedc gfedc gfedc gfedc gfedc
Känns internationellt(ex. föreläsningar påengelska)
gfedc gfedc gfedc gfedc gfedc gfedc gfedc gfedc gfedc gfedc gfedc
Känns öppet gfedc gfedc gfedc gfedc gfedc gfedc gfedc gfedc gfedc gfedc gfedc
Känns kallt gfedc gfedc gfedc gfedc gfedc gfedc gfedc gfedc gfedc gfedc gfedc
Känns avlägset gfedc gfedc gfedc gfedc gfedc gfedc gfedc gfedc gfedc gfedc gfedc
1 PÅVERKARMYCKET
NEGATIVT 2 3 4
5 PÅVERKARVARKEN
NEGATIVT ELLER POSITIVT 6 7 8
9 PÅVERKARMYCKETPOSITIVT
Det krävs höga poäng föratt bli antagen gfedc gfedc gfedc gfedc gfedc gfedc gfedc gfedc gfedc
Ett brett utbud av program erbjuds gfedc gfedc gfedc gfedc gfedc gfedc gfedc gfedc gfedc
Ett brett utbud av kurser erbjuds gfedc gfedc gfedc gfedc gfedc gfedc gfedc gfedc gfedc
Skolan erbjuderpåbyggnadsutbildning tillmagisternivå
gfedc gfedc gfedc gfedc gfedc gfedc gfedc gfedc gfedc
Skolan erbjuderpåbyggnadsutbildning tillmasternivå
gfedc gfedc gfedc gfedc gfedc gfedc gfedc gfedc gfedc
1 PÅVERKARMYCKET
NEGATIVT 2 3 4
5 PÅVERKARVARKEN
NEGATIVT ELLER POSITIVT 6 7 8
9 PÅVERKARMYCKETPOSITIVT
Goda möjligheter tillutbytesstudier (utomlands) gfedc gfedc gfedc gfedc gfedc gfedc gfedc gfedc gfedc
Goda möjligheter tillpraktik gfedc gfedc gfedc gfedc gfedc gfedc gfedc gfedc gfedc
Erhåller yrkesexamencivilekonom gfedc gfedc gfedc gfedc gfedc gfedc gfedc gfedc gfedc
Skolan bedriver omfattandeforskningsverksamhet
gfedc gfedc gfedc gfedc gfedc gfedc gfedc gfedc gfedc
Skolan har en snygg hemsida gfedc gfedc gfedc gfedc gfedc gfedc gfedc gfedc gfedc
Skolan har en funktionell hemsida gfedc gfedc gfedc gfedc gfedc gfedc gfedc gfedc gfedc
4AB4: Nu kommer återigen mer generella frågor som syftar till att skapa en bild av vilka faktorer som påverkar studentersval av studieort.
4A: Tänk dig att du som blivande student ska utvärdera den förväntade kvalitén på en ekonomiutbildning på en fiktivskola . Hur anser du att följande faktorer påverkar den förväntade kvalitén?
Observera att du ska tänka dig in i en situation där du står inför valet av utbildning på en fiktiv skola.Välj det korrekta svaret för varje punkt:
4B:Välj det korrekta svaret för varje punkt:
4CD
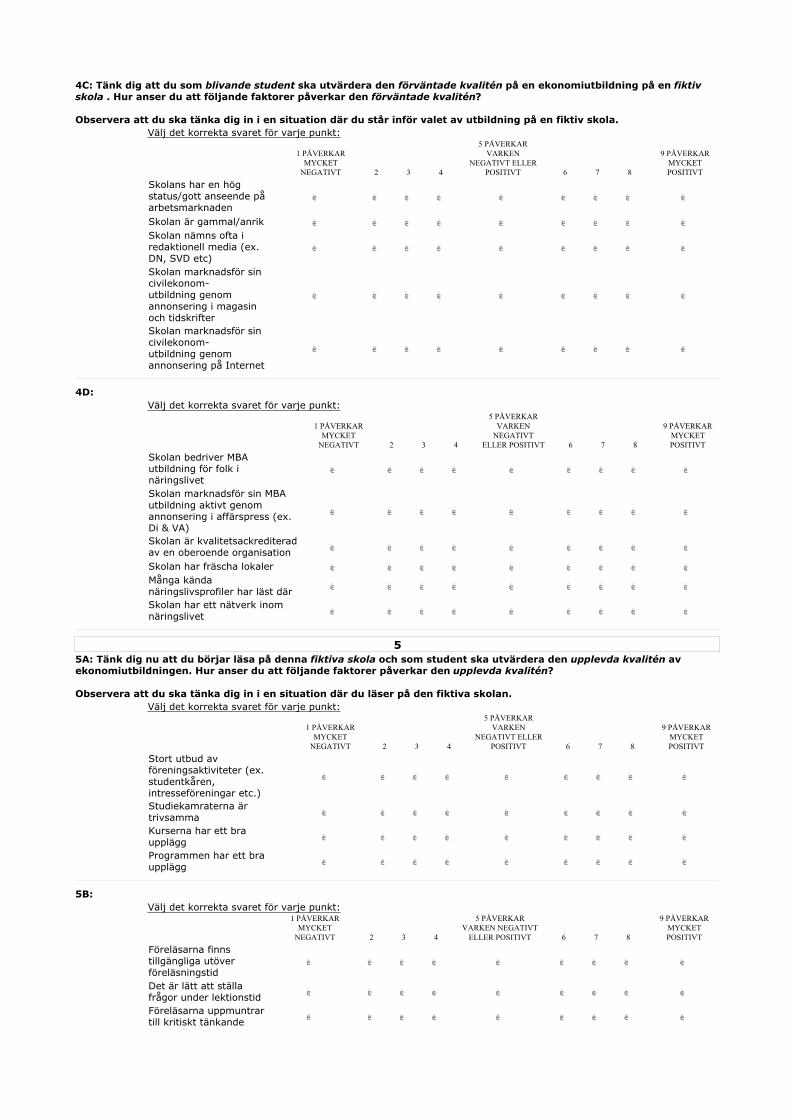
1 PÅVERKARMYCKET
NEGATIVT 2 3 4
5 PÅVERKARVARKEN
NEGATIVT ELLER POSITIVT 6 7 8
9 PÅVERKARMYCKETPOSITIVT
Skolans har en högstatus/gott anseende påarbetsmarknaden
gfedc gfedc gfedc gfedc gfedc gfedc gfedc gfedc gfedc
Skolan är gammal/anrik gfedc gfedc gfedc gfedc gfedc gfedc gfedc gfedc gfedc
Skolan nämns ofta iredaktionell media (ex. DN, SVD etc)
gfedc gfedc gfedc gfedc gfedc gfedc gfedc gfedc gfedc
Skolan marknadsför sincivilekonom-utbildning genom annonsering i magasin och tidskrifter
gfedc gfedc gfedc gfedc gfedc gfedc gfedc gfedc gfedc
Skolan marknadsför sincivilekonom-utbildning genom annonsering på Internet
gfedc gfedc gfedc gfedc gfedc gfedc gfedc gfedc gfedc
1 PÅVERKARMYCKET
NEGATIVT 2 3 4
5 PÅVERKARVARKEN
NEGATIVTELLER POSITIVT 6 7 8
9 PÅVERKARMYCKETPOSITIVT
Skolan bedriver MBA utbildning för folk inäringslivet
gfedc gfedc gfedc gfedc gfedc gfedc gfedc gfedc gfedc
Skolan marknadsför sin MBAutbildning aktivt genom annonsering i affärspress (ex.Di & VA)
gfedc gfedc gfedc gfedc gfedc gfedc gfedc gfedc gfedc
Skolan är kvalitetsackrediteradav en oberoende organisation gfedc gfedc gfedc gfedc gfedc gfedc gfedc gfedc gfedc
Skolan har fräscha lokaler gfedc gfedc gfedc gfedc gfedc gfedc gfedc gfedc gfedcMånga kändanäringslivsprofiler har läst där gfedc gfedc gfedc gfedc gfedc gfedc gfedc gfedc gfedc
Skolan har ett nätverk inomnäringslivet gfedc gfedc gfedc gfedc gfedc gfedc gfedc gfedc gfedc
1 PÅVERKARMYCKET
NEGATIVT 2 3 4
5 PÅVERKARVARKEN
NEGATIVT ELLER POSITIVT 6 7 8
9 PÅVERKARMYCKETPOSITIVT
Stort utbud avföreningsaktiviteter (ex.studentkåren,intresseföreningar etc.)
gfedc gfedc gfedc gfedc gfedc gfedc gfedc gfedc gfedc
Studiekamraterna ärtrivsamma gfedc gfedc gfedc gfedc gfedc gfedc gfedc gfedc gfedc
Kurserna har ett braupplägg gfedc gfedc gfedc gfedc gfedc gfedc gfedc gfedc gfedc
Programmen har ett braupplägg gfedc gfedc gfedc gfedc gfedc gfedc gfedc gfedc gfedc
1 PÅVERKARMYCKET
NEGATIVT 2 3 4
5 PÅVERKARVARKEN NEGATIVT
ELLER POSITIVT 6 7 8
9 PÅVERKARMYCKETPOSITIVT
Föreläsarna finnstillgängliga utöverföreläsningstid
gfedc gfedc gfedc gfedc gfedc gfedc gfedc gfedc gfedc
Det är lätt att ställafrågor under lektionstid gfedc gfedc gfedc gfedc gfedc gfedc gfedc gfedc gfedc
Föreläsarna uppmuntrartill kritiskt tänkande gfedc gfedc gfedc gfedc gfedc gfedc gfedc gfedc gfedc
4C: Tänk dig att du som blivande student ska utvärdera den förväntade kvalitén på en ekonomiutbildning på en fiktivskola . Hur anser du att följande faktorer påverkar den förväntade kvalitén?
Observera att du ska tänka dig in i en situation där du står inför valet av utbildning på en fiktiv skola.Välj det korrekta svaret för varje punkt:
4D:Välj det korrekta svaret för varje punkt:
55A: Tänk dig nu att du börjar läsa på denna fiktiva skola och som student ska utvärdera den upplevda kvalitén av ekonomiutbildningen. Hur anser du att följande faktorer påverkar den upplevda kvalitén?
Observera att du ska tänka dig in i en situation där du läser på den fiktiva skolan.Välj det korrekta svaret för varje punkt:
5B:Välj det korrekta svaret för varje punkt:

Alternativa former av undervisning används(ex. casebaserad)
gfedc gfedc gfedc gfedc gfedc gfedc gfedc gfedc gfedc
De ordinarie föreläsarnahar erfarenheter frånnäringslivet
gfedc gfedc gfedc gfedc gfedc gfedc gfedc gfedc gfedc
1 PÅVERKARMYCKET
NEGATIVT 2 3 4
5 PÅVERKARVARKEN
NEGATIVTELLER POSITIVT 6 7 8
9 PÅVERKARMYCKETPOSITIVT
Andra aktiviteter erbjudsutöver kursplan (ex.gästföreläsningar,företagsbesök, casetävlingaretc.)
gfedc gfedc gfedc gfedc gfedc gfedc gfedc gfedc gfedc
Skolan har en internationellkänsla (ex. föreläsningar påengelska)
gfedc gfedc gfedc gfedc gfedc gfedc gfedc gfedc gfedc
Föreläsarna är engagerade gfedc gfedc gfedc gfedc gfedc gfedc gfedc gfedc gfedc
Skolan har fräscha lokaler gfedc gfedc gfedc gfedc gfedc gfedc gfedc gfedc gfedcDet finns tillgång till ett aktivtnätverk mellan studenter ochnäringsliv underutbildningstiden
gfedc gfedc gfedc gfedc gfedc gfedc gfedc gfedc gfedc
5C:Välj det korrekta svaret för varje punkt:
5D: Skulle du vilja lägga till något till alternativen på ovanstående fråga?Skriv vad det är
du vill läggatill, följt av ensiffra för hurmycket detpåverkar,
1=Påverkaringet,
10=Påverkarmycket
Skriv ditt svar här:
77A: Nedan följer en serie frågor i vilka du skall ta ställning till hur du uppfattar olika univeritet/högskolor i förhållandetill varandra. Det vi vill veta är vad du känner eller tror om respektive universitet/högskola, inte hur det "egentligen"förhåller sig.
7B: Kryssa för de två skolor som du uppfattar som mest olika. Observera att du endast skall markera två alternativ.Välj alla som stämmer:gfedc Ekonomihögskolan vid Lunds universitetgfedc Handelshögskolan vid Göteborgs universitetgfedc Handelshögskolan i Stockholm gfedc Handelshögskolan vid Umeå universitetgfedc Internationella Handelshögskolan i Jönköpinggfedc Linköpings universitetgfedc Mälardalens Ekonomihögskolagfedc Stockholms universitetgfedc Uppsala universitetgfedc Örebro universitet
7C: Kryssa för de två skolor som du uppfattar som mest lika. Observera att du endast skall markera två alternativ.Välj alla som stämmer:gfedc Ekonomihögskolan vid Lunds universitetgfedc Handelshögskolan vid Göteborgs universitetgfedc Handelshögskolan i Stockholm gfedc Handelshögskolan vid Umeå universitetgfedc Internationella Handelshögskolan i Jönköpinggfedc Linköpings universitetgfedc Mälardalens Ekonomihögskolagfedc Stockholms universitetgfedc Uppsala universitetgfedc Örebro universitet

1 MYCKET OLIKA 2 3 4 5 6 7 8 9
10 MYCKET LIKA
Handelshögskolan vid Göteborgsuniversitet gfedc gfedc gfedc gfedc gfedc gfedc gfedc gfedc gfedc gfedc
Handelshögskolan i Stockholm gfedc gfedc gfedc gfedc gfedc gfedc gfedc gfedc gfedc gfedc
Handelshögskolan vid Umeåuniversitet gfedc gfedc gfedc gfedc gfedc gfedc gfedc gfedc gfedc gfedc
Internationella Handelshögskolan iJönköping gfedc gfedc gfedc gfedc gfedc gfedc gfedc gfedc gfedc gfedc
Linköpings universitet gfedc gfedc gfedc gfedc gfedc gfedc gfedc gfedc gfedc gfedc
Mälardalens Ekonomihögskola gfedc gfedc gfedc gfedc gfedc gfedc gfedc gfedc gfedc gfedc
Stockholms universitet gfedc gfedc gfedc gfedc gfedc gfedc gfedc gfedc gfedc gfedc
Uppsala universitet gfedc gfedc gfedc gfedc gfedc gfedc gfedc gfedc gfedc gfedc
Örebro universitet gfedc gfedc gfedc gfedc gfedc gfedc gfedc gfedc gfedc gfedc
1 MYCKET OLIKA 2 3 4 5 6 7 8 9
10 MYCKET LIKA
Internationella Handelshögskolan iJönköping gfedc gfedc gfedc gfedc gfedc gfedc gfedc gfedc gfedc gfedc
Linköpings universitet gfedc gfedc gfedc gfedc gfedc gfedc gfedc gfedc gfedc gfedc
Mälardalens Ekonomihögskola gfedc gfedc gfedc gfedc gfedc gfedc gfedc gfedc gfedc gfedc
Stockholms universitet gfedc gfedc gfedc gfedc gfedc gfedc gfedc gfedc gfedc gfedc
Uppsala universitet gfedc gfedc gfedc gfedc gfedc gfedc gfedc gfedc gfedc gfedc
Örebro universitet gfedc gfedc gfedc gfedc gfedc gfedc gfedc gfedc gfedc gfedc
1 MYCKET OLIKA 2 3 4 5 6 7 8 9 10 MYCKET LIKA
Linköpings universitet gfedc gfedc gfedc gfedc gfedc gfedc gfedc gfedc gfedc gfedc
Mälardalens Ekonomihögskola gfedc gfedc gfedc gfedc gfedc gfedc gfedc gfedc gfedc gfedc
Stockholms universitet gfedc gfedc gfedc gfedc gfedc gfedc gfedc gfedc gfedc gfedc
Uppsala universitet gfedc gfedc gfedc gfedc gfedc gfedc gfedc gfedc gfedc gfedc
Örebro universitet gfedc gfedc gfedc gfedc gfedc gfedc gfedc gfedc gfedc gfedc
8A8A: Hur lika uppfattar du att nedanstående skolor är i jämförelse med Ekonomihögskolan vid Lunds universitet?
Välj det korrekta svaret för varje punkt:
8B8B: Hur lika uppfattar du att nedanstående skolor är i jämförelse med Handelshögskolan vid Göteborgs universitet?
Välj det korrekta svaret för varje punkt:
8C8C: Hur lika uppfattar du att nedanstående skolor är i jämförelse med Handelshögskolan i Stockholm?
Välj det korrekta svaret för varje punkt:
8D8D: Hur lika uppfattar du att nedanstående skolor är i jämförelse med Handelshögskolan vid Umeå universitet ?
Välj det korrekta svaret för varje punkt:
8E8E: Hur lika uppfattar du att nedanstående skolor är i jämförelse med Internationella Handelshögskolan i Jönköping?
Välj det korrekta svaret för varje punkt:

1 MYCKET OLIKA 2 3 4 5 6 7 8 9 10 MYCKET LIKA
Mälardalens Ekonomihögskola gfedc gfedc gfedc gfedc gfedc gfedc gfedc gfedc gfedc gfedc
Stockholms universitet gfedc gfedc gfedc gfedc gfedc gfedc gfedc gfedc gfedc gfedc
Uppsala universitet gfedc gfedc gfedc gfedc gfedc gfedc gfedc gfedc gfedc gfedc
Örebro universitet gfedc gfedc gfedc gfedc gfedc gfedc gfedc gfedc gfedc gfedc
1 MYCKET OLIKA 2 3 4 5 6 7 8 9 10 MYCKET LIKA
Stockholms universitet gfedc gfedc gfedc gfedc gfedc gfedc gfedc gfedc gfedc gfedc
Uppsala universitet gfedc gfedc gfedc gfedc gfedc gfedc gfedc gfedc gfedc gfedc
Örebro universitet gfedc gfedc gfedc gfedc gfedc gfedc gfedc gfedc gfedc gfedc
1 MYCKET OLIKA 2 3 4 5 6 7 8 9 10 MYCKET LIKA
Uppsala universitet gfedc gfedc gfedc gfedc gfedc gfedc gfedc gfedc gfedc gfedc
Örebro universitet gfedc gfedc gfedc gfedc gfedc gfedc gfedc gfedc gfedc gfedc
1 MYCKET OLIKA 2 3 4 5 6 7 8 9 10 MYCKET LIKA
Örebro universitet gfedc gfedc gfedc gfedc gfedc gfedc gfedc gfedc gfedc gfedc
8F8F: Hur lika uppfattar du att nedanstående skolor är i jämförelse med Linköpings universitet ?
Välj det korrekta svaret för varje punkt:
8G8G: Hur lika uppfattar du att nedanstående skolor är i jämförelse med Mälardalens Ekonomihögskola?
Välj det korrekta svaret för varje punkt:
8H8H: Hur lika uppfattar du att nedanstående skolor är i jämförelse med Stockholms universitet?
Välj det korrekta svaret för varje punkt:
8I8I: Hur lika uppfattar du att nedanstående skola är i jämförelse med Uppsala universitet?
Välj det korrekta svaret för varje punkt:
9191A1: Denna enkät avslutas med nedanstående frågor om din bakgrund.
* 91A2: Hur gammal är du?Skriv ditt svar här:
* 91B: Är du man eller kvinna?Välj endast en av följande:gfedc Kvinnagfedc Man
* 91C: Var tog du studenten?Välj endast en av följande:gfedc Blekinge längfedc Dalarnas län gfedc Gotlands län gfedc Gävleborgs längfedc Hallands längfedc Jämtlands längfedc Jönköpings län gfedc Kalmar län gfedc Kronobergs längfedc Norrbottens längfedc Skåne längfedc Stockholms längfedc Södermanlands längfedc Uppsala längfedc Värmlands längfedc Västerbottens längfedc Västernorrlands längfedc Västmanlands längfedc Västra Götalands längfedc Örebro längfedc Östergötlands längfedc Annat land än Sverige
* 91C2: Var studerar du?

Välj endast en av följande:gfedc Ekonomihögskolan vid Lunds universitetgfedc Handelshögskolan vid Göteborgs universitetgfedc Handelshögskolan i Stockholm gfedc Handelshögskolan vid Umeå universitetgfedc Internationella Handelshögskolan i Jönköpinggfedc Linköpings universitetgfedc Mälardalens Ekonomihögskolagfedc Uppsala universitetgfedc Örebro universitet
* 91D: Läser du fristående kurser eller program?Välj endast en av följande:gfedc Programgfedc Fristående kurser
* 91F: Har du läst andra kurser eller program på universitet/högskola mellan studenten och ditt nuvarandeutbildningsprogram?
Välj endast en av följande:gfedc Jagfedc Nej
92[Svara bara på denna fråga om du svarat 'Program' på fråga '91D ']* 92A: Vilket program läser du?
Välj endast en av följande:gfedc Civilekonomprogrammetgfedc Internationella Ekonomprogrammetgfedc Logistikprogrammetgfedc Annat, vad god ange till högerKommentera dina val här:
[Svara bara på denna fråga om du svarat 'Program' på fråga '91D ']* 92A2: Vilken termin läser du på ditt nuvarande utbildningsprogram?
Skriv ditt svar här:
[Svara bara på denna fråga om du svarat 'Program' på fråga '91D ']* 92C: Hur många år gick det från din studentexamen till det att du började läsa på ditt nuvarande utbildningsprogram?
Ange eventuellt halvår som 0.5,med punkt som kommatering
(exempelvis tvåoch ett halvt år
= 2.5)
Skriv ditt svar här:
* 92D: Vilket/vilka av nedanstående huvudämnen stämmer bäst in på det som du har valt eller planerar att välja:Välj endast en av följande:gfedc Entreprenörskapgfedc Finansieringgfedc Internationell ekonomigfedc Logistikgfedc Management/ledarskapgfedc Marknadsföringgfedc Nationalekonomigfedc Redovisninggfedc Retailgfedc Annat – Var god ange till högergfedc Har inte bestämt mig ännuKommentera dina val här:

* 92E: Påverkade ditt tilltänkta huvudämne valet av studieort?Välj endast en av följande:gfedc Jagfedc Nej
* 92F: Påverkade din tilltänkta examensnivå (ex. kandidat, magister, master) valet av studieort?Välj endast en av följande:gfedc Jagfedc Nej
9393A: Tack för att du tog dig tid att fylla i enkäten! OBSERVERA ATT DU MÅSTE TRYCKA "SKICKA" PÅ NÄSTASKÄRMUPPSLAG.
Du har nu chansen att vinna en iPod Nano (1GB) genom att fylla i ditt namn och en giltig e-mail adress. Observera att det endast är möjligt att delta en gång i tävlingen. Vinnaren kommer att meddelas via e-mail senast den 16 juni.
Observera vidare att din e-mail adress inte kommer att kunna kopplas samman med dina svar vilka fortfarande kommer att behandlas konfidentiellt.
93B: Jag vill tävla om en iPod Nano (1GB) och väljer därför att ange mitt namn och e-mail adress. Genom att ange namnoch e-mail adress förbinder jag mig att betala ev. vinstskatt.
Ange mail enligt:
Skriv ditt/dina svar här:Namn:
E-mail:
93C: Skulle jag vinna önskar jag en:Välj endast en av följande:gfedc Vit iPod Nanogfedc Svart iPod Nano
93D: Information om undersökningen.Den enkät du just fyllt i ingår i min kandidatuppsats och syftar till att skapa förståelse för faktorer som påverkarstudenters val av studieort samt deras uppfattning av Handelshögskolan vid Umeå universitet (Umeå School of Business(USBE)). Som du säkert märkte var många av frågorna av en allmän karaktär. Detta för att också dittuniversitet/högskola ska finna resultatet användbart.
Har du ytterligare frågor angående undersökningen är du välkommen att kontakta mig på:
Tack för ditt deltagande /Fabian Wrede
93E: OBSERVERA att du måste trycka "skicka" på nästa skärmuppslag för att enkäten skall skickas och du skall kunnavara med i tävlingen.
Lämna in din enkät.Tack för att du svarat på denna enkät. Faxa den ifyllda enkäten till: .

INGENUPPFATTNING
1 INTE ALLS
VIKTIGT 2 3 4 5 6 7 8 9
10MYCKETVIKTIGT
Möjligheten att läsa medkompisar som redan lästepå samma skola
gfedc gfedc gfedc gfedc gfedc gfedc gfedc gfedc gfedc gfedc gfedc
Rekommendationer attläsa på skolan frånkompisar/familj/släkt
gfedc gfedc gfedc gfedc gfedc gfedc gfedc gfedc gfedc gfedc gfedc
Universitetets/högskolansframtoning i media gfedc gfedc gfedc gfedc gfedc gfedc gfedc gfedc gfedc gfedc gfedc
Nära hem till familj ochkompisar gfedc gfedc gfedc gfedc gfedc gfedc gfedc gfedc gfedc gfedc gfedc
Det geografiska lägetsåsom staden ellerregionen
gfedc gfedc gfedc gfedc gfedc gfedc gfedc gfedc gfedc gfedc gfedc
Utbudet av sport- och idrottsaktiviteter gfedc gfedc gfedc gfedc gfedc gfedc gfedc gfedc gfedc gfedc gfedc
Utbudet avnöjesaktiviteter (ex.uteställen, bio etc)
gfedc gfedc gfedc gfedc gfedc gfedc gfedc gfedc gfedc gfedc gfedc
Studenters bild av USBE1
* 1A: Hur nöjd är du överlag med USBE/Handelshögskolan vid Umeå universitet?Välj endast en av följande:gfedc 1 Inte alls nöjdgfedc 2gfedc 3gfedc 4gfedc 5gfedc 6gfedc 7gfedc 8gfedc 9gfedc 10 Mycket nöjd
1B: Om du skulle nämna de tre främsta fördelarna med att läsa på USBE för en kompis, vilka skulle de i sådana fall vara?(Skriv kortfattat, gärna
i punktform)Skriv ditt svar här:
1C: Om du skulle nämna de tre främsta nackdelarna med att läsa på USBE för en kompis, vilka skulle de i sådana fall vara?(Skriv kortfattat, gärna
i punktform)Skriv ditt svar här:
2AB2A: Hur viktiga var följande faktorer när du valde universitet/högskola?
Välj det korrekta svaret för varje punkt:
2B:
APPENDIX I – Sample U’s Survey

INGENUPPFATTNING
1 INTE ALLS
VIKTIGT 2 3 4 5 6 7 8 910 MYCKET
VIKTIGT
Tidigare årsintagningspoäng gfedc gfedc gfedc gfedc gfedc gfedc gfedc gfedc gfedc gfedc gfedc
Att skolan har fräschalokaler gfedc gfedc gfedc gfedc gfedc gfedc gfedc gfedc gfedc gfedc gfedc
Att skolan ärkvalitets-ackrediterad av en oberoendeorganisation
gfedc gfedc gfedc gfedc gfedc gfedc gfedc gfedc gfedc gfedc gfedc
Att skolan ärgammal/anrik gfedc gfedc gfedc gfedc gfedc gfedc gfedc gfedc gfedc gfedc gfedc
Möjligheter till boende gfedc gfedc gfedc gfedc gfedc gfedc gfedc gfedc gfedc gfedc gfedc
Utbudet av program (ex. olika inriktningar) gfedc gfedc gfedc gfedc gfedc gfedc gfedc gfedc gfedc gfedc gfedc
INGENUPPFATTNING
1 INTE ALLS
VIKTIGT 2 3 4 5 6 7 8 9
10MYCKETVIKTIGT
Programmens innehåll gfedc gfedc gfedc gfedc gfedc gfedc gfedc gfedc gfedc gfedc gfedc
Utbudet av kurser gfedc gfedc gfedc gfedc gfedc gfedc gfedc gfedc gfedc gfedc gfedc
Kursernas innehåll gfedc gfedc gfedc gfedc gfedc gfedc gfedc gfedc gfedc gfedc gfedcUtbudet avföreningsaktiviteter(ex. studentkåren,intresseföreningar etc.)
gfedc gfedc gfedc gfedc gfedc gfedc gfedc gfedc gfedc gfedc gfedc
Tillgången tillpåbyggnadsutbildning tillmagisternivå
gfedc gfedc gfedc gfedc gfedc gfedc gfedc gfedc gfedc gfedc gfedc
Tillgången tillpåbyggnadsutbildning tillmasternivå
gfedc gfedc gfedc gfedc gfedc gfedc gfedc gfedc gfedc gfedc gfedc
INGENUPPFATTNING
1 INTE ALLS
VIKTIGT 2 3 4 5 6 7 8 9
10MYCKETVIKTIGT
Omfattningen avuniversitetets/högskolansforskningsverksamhet
gfedc gfedc gfedc gfedc gfedc gfedc gfedc gfedc gfedc gfedc gfedc
Chansen att finna trivsamma studiekamrater gfedc gfedc gfedc gfedc gfedc gfedc gfedc gfedc gfedc gfedc gfedc
Universitetets/högskolansanknytning till näringslivet gfedc gfedc gfedc gfedc gfedc gfedc gfedc gfedc gfedc gfedc gfedc
Universitetets/högskolansinternationella anknytning gfedc gfedc gfedc gfedc gfedc gfedc gfedc gfedc gfedc gfedc gfedc
Möjligheter tillutbytesstudier utomlands gfedc gfedc gfedc gfedc gfedc gfedc gfedc gfedc gfedc gfedc gfedc
Möjligheter till praktik gfedc gfedc gfedc gfedc gfedc gfedc gfedc gfedc gfedc gfedc gfedc
INGENUPPFATTNING
1 INTE ALLS
VIKTIGT 2 3 4 5 6 7 8 9
10MYCKETVIKTIGT
Kändanäringslivsprofilersanknytning till skolan
gfedc gfedc gfedc gfedc gfedc gfedc gfedc gfedc gfedc gfedc gfedc
Tillgången till ettnätverk i näringslivet gfedc gfedc gfedc gfedc gfedc gfedc gfedc gfedc gfedc gfedc gfedc
Skolansstatus/anseende påarbetsmarknaden
gfedc gfedc gfedc gfedc gfedc gfedc gfedc gfedc gfedc gfedc gfedc
Möjligheter till en brayrkesposition efter examen
gfedc gfedc gfedc gfedc gfedc gfedc gfedc gfedc gfedc gfedc gfedc
Möjligheter till braingångslön efter examen gfedc gfedc gfedc gfedc gfedc gfedc gfedc gfedc gfedc gfedc gfedc
Hur lång tid det brukarta att få anställningefter examen därifrån
gfedc gfedc gfedc gfedc gfedc gfedc gfedc gfedc gfedc gfedc gfedc
Välj det korrekta svaret för varje punkt:
2CD2C: Hur viktiga var följande faktorer när du valde universitet/högskola?
Välj det korrekta svaret för varje punkt:
2D:Välj det korrekta svaret för varje punkt:
2E2E: Hur viktiga var följande faktorer när du valde universitet/högskola?
Välj det korrekta svaret för varje punkt:
3AB

INGENUPPFATTNING
1INSTÄMMERINTE ALLS 2 3 4 5 6 7 8 9
10INSTÄMMERTILL FULLO
Är anrik/gammal gfedc gfedc gfedc gfedc gfedc gfedc gfedc gfedc gfedc gfedc gfedc
Nämns ofta iredaktionell media (ex. DN, SVD etc)
gfedc gfedc gfedc gfedc gfedc gfedc gfedc gfedc gfedc gfedc gfedc
Har fräscha lokaler gfedc gfedc gfedc gfedc gfedc gfedc gfedc gfedc gfedc gfedc gfedc
Omfattandeforskningsverksamhetbedrivs där
gfedc gfedc gfedc gfedc gfedc gfedc gfedc gfedc gfedc gfedc gfedc
Många kändanäringslivsprofiler harläst där
gfedc gfedc gfedc gfedc gfedc gfedc gfedc gfedc gfedc gfedc gfedc
Har hög internationellanknytning gfedc gfedc gfedc gfedc gfedc gfedc gfedc gfedc gfedc gfedc gfedc
Har hög anknytningtill näringslivet gfedc gfedc gfedc gfedc gfedc gfedc gfedc gfedc gfedc gfedc gfedc
Har högstatus/anseende påarbetsmarknaden
gfedc gfedc gfedc gfedc gfedc gfedc gfedc gfedc gfedc gfedc gfedc
Har en snygg hemsida gfedc gfedc gfedc gfedc gfedc gfedc gfedc gfedc gfedc gfedc gfedc
Har en funktionell hemsida gfedc gfedc gfedc gfedc gfedc gfedc gfedc gfedc gfedc gfedc gfedc
Utbudet av program som erbjuds är bra(ex. olika inriktningar)
gfedc gfedc gfedc gfedc gfedc gfedc gfedc gfedc gfedc gfedc gfedc
INGENUPPFATTNING
1INSTÄMMERINTE ALLS 2 3 4 5 6 7 8 9
10INSTÄMMERTILL FULLO
Utbudet av kurser som erbjuds är bra gfedc gfedc gfedc gfedc gfedc gfedc gfedc gfedc gfedc gfedc gfedc
Kurserna som erbjuds har överlagett bra innehåll
gfedc gfedc gfedc gfedc gfedc gfedc gfedc gfedc gfedc gfedc gfedc
Programmen som erbjuds har överlagett bra innehåll
gfedc gfedc gfedc gfedc gfedc gfedc gfedc gfedc gfedc gfedc gfedc
Har ett omfattandenätverk inäringslivet
gfedc gfedc gfedc gfedc gfedc gfedc gfedc gfedc gfedc gfedc gfedc
Många av deordinarie föreläsarnahar erfarenheterfrån näringslivet
gfedc gfedc gfedc gfedc gfedc gfedc gfedc gfedc gfedc gfedc gfedc
Det erbjuds godamöjligheter tillutbytesstudier(utomlands)
gfedc gfedc gfedc gfedc gfedc gfedc gfedc gfedc gfedc gfedc gfedc
Det erbjuds godamöjligheter tillpraktik
gfedc gfedc gfedc gfedc gfedc gfedc gfedc gfedc gfedc gfedc gfedc
Studiekamraternasär trivsamma gfedc gfedc gfedc gfedc gfedc gfedc gfedc gfedc gfedc gfedc gfedc
Alternativa former av undervisninganvänds där (ex.casebaserad)
gfedc gfedc gfedc gfedc gfedc gfedc gfedc gfedc gfedc gfedc gfedc
INGENUPPFATTNING
1INSTÄMMERINTE ALLS 2 3 4 5 6 7 8 9
10INSTÄMMERTILL FULLO
Studenterutexamineradedärifrån får snabbtanställning
gfedc gfedc gfedc gfedc gfedc gfedc gfedc gfedc gfedc gfedc gfedc
Studenterutexamineradedärifrån får braingångslön
gfedc gfedc gfedc gfedc gfedc gfedc gfedc gfedc gfedc gfedc gfedc
3A: Hur ställer du dig till följande påståenden om Handelshögskolan vid Umeå universitet och Umeå som studieort?Välj det korrekta svaret för varje punkt:
3B:Välj det korrekta svaret för varje punkt:
3CD3C: Hur ställer du dig till följande påståenden om Handelshögskolan vid Umeå universitet och Umeå som studieort?
Välj det korrekta svaret för varje punkt:

Studenter därifrånfår brayrkespositionerefter examen
gfedc gfedc gfedc gfedc gfedc gfedc gfedc gfedc gfedc gfedc gfedc
Föreläsarna haröverlag ett högtengagemang
gfedc gfedc gfedc gfedc gfedc gfedc gfedc gfedc gfedc gfedc gfedc
Föreläsarnapedagogik äröverlag bra
gfedc gfedc gfedc gfedc gfedc gfedc gfedc gfedc gfedc gfedc gfedc
Föreläsarna ärkrävande gfedc gfedc gfedc gfedc gfedc gfedc gfedc gfedc gfedc gfedc gfedc
Föreläsarnauppmuntrar till kritiskt tänkande
gfedc gfedc gfedc gfedc gfedc gfedc gfedc gfedc gfedc gfedc gfedc
Det är lätt attställa frågor underlektionstid
gfedc gfedc gfedc gfedc gfedc gfedc gfedc gfedc gfedc gfedc gfedc
Föreläsarna finnstillgängliga utöverföreläsningstid
gfedc gfedc gfedc gfedc gfedc gfedc gfedc gfedc gfedc gfedc gfedc
INGENUPPFATTNING
1INSTÄMMERINTE ALLS 2 3 4 5 6 7 8 9
10INSTÄMMERTILL FULLO
Utbudet av aktiviteter utöverkursplan är bra (ex.gästföreläsningar,företagsbesök etc.)
gfedc gfedc gfedc gfedc gfedc gfedc gfedc gfedc gfedc gfedc gfedc
Utbudet avföreningsaktiviteterär bra (ex.studentkåren,intresseföreningaretc.)
gfedc gfedc gfedc gfedc gfedc gfedc gfedc gfedc gfedc gfedc gfedc
Utbudet av sport- och idrottsaktiviteter är brett
gfedc gfedc gfedc gfedc gfedc gfedc gfedc gfedc gfedc gfedc gfedc
Utbudet avnöjesaktiviteter ärbrett (ex. uteställen,bio etc)
gfedc gfedc gfedc gfedc gfedc gfedc gfedc gfedc gfedc gfedc gfedc
Har ett bra studentliv gfedc gfedc gfedc gfedc gfedc gfedc gfedc gfedc gfedc gfedc gfedc
Ligger i en trevlig stad gfedc gfedc gfedc gfedc gfedc gfedc gfedc gfedc gfedc gfedc gfedc
De flesta som läserdär kommer frånNorrland
gfedc gfedc gfedc gfedc gfedc gfedc gfedc gfedc gfedc gfedc gfedc
De flesta som läserdär stannar kvar iNorrland efter examen
gfedc gfedc gfedc gfedc gfedc gfedc gfedc gfedc gfedc gfedc gfedc
De flesta som läserdär hade för lågabetyg för att kommain någon annanstans
gfedc gfedc gfedc gfedc gfedc gfedc gfedc gfedc gfedc gfedc gfedc
Känns internationellt(ex. föreläsningar påengelska)
gfedc gfedc gfedc gfedc gfedc gfedc gfedc gfedc gfedc gfedc gfedc
Känns öppet gfedc gfedc gfedc gfedc gfedc gfedc gfedc gfedc gfedc gfedc gfedc
Känns kallt gfedc gfedc gfedc gfedc gfedc gfedc gfedc gfedc gfedc gfedc gfedc
1 PÅVERKARMYCKET
NEGATIVT 2 3 4
5 PÅVERKARVARKEN
NEGATIVT ELLER POSITIVT 6 7 8
9 PÅVERKARMYCKETPOSITIVT
Det krävs höga poäng föratt bli antagen gfedc gfedc gfedc gfedc gfedc gfedc gfedc gfedc gfedc
Ett brett utbud av program erbjuds gfedc gfedc gfedc gfedc gfedc gfedc gfedc gfedc gfedc
Ett brett utbud av kurser erbjuds gfedc gfedc gfedc gfedc gfedc gfedc gfedc gfedc gfedc
3D:Välj det korrekta svaret för varje punkt:
4AB4A: Tänk dig att du som blivande student ska utvärdera den förväntade kvalitén på en ekonomiutbildning på en fiktiv skola . Hur anser du att följande faktorer påverkar den förväntade kvalitén?
Observera att du ska tänka dig in i en situation där du står inför valet av utbildning på en fiktiv skola.Välj det korrekta svaret för varje punkt:

Skolan erbjuderpåbyggnadsutbildning tillmagisternivå
gfedc gfedc gfedc gfedc gfedc gfedc gfedc gfedc gfedc
Skolan erbjuderpåbyggnadsutbildning tillmasternivå
gfedc gfedc gfedc gfedc gfedc gfedc gfedc gfedc gfedc
1 PÅVERKARMYCKET
NEGATIVT 2 3 4
5 PÅVERKARVARKEN
NEGATIVT ELLER POSITIVT 6 7 8
9 PÅVERKARMYCKETPOSITIVT
Goda möjligheter tillutbytesstudier (utomlands) gfedc gfedc gfedc gfedc gfedc gfedc gfedc gfedc gfedc
Goda möjligheter tillpraktik gfedc gfedc gfedc gfedc gfedc gfedc gfedc gfedc gfedc
Du erhåller titelncivilekonom efter examen gfedc gfedc gfedc gfedc gfedc gfedc gfedc gfedc gfedc
Skolan bedriver omfattandeforskningsverksamhet
gfedc gfedc gfedc gfedc gfedc gfedc gfedc gfedc gfedc
Skolan har en snygg hemsida gfedc gfedc gfedc gfedc gfedc gfedc gfedc gfedc gfedc
Skolan har en funktionell hemsida gfedc gfedc gfedc gfedc gfedc gfedc gfedc gfedc gfedc
1 PÅVERKARMYCKET
NEGATIVT 2 3 4
5 PÅVERKARVARKEN
NEGATIVT ELLER POSITIVT 6 7 8
9 PÅVERKARMYCKETPOSITIVT
Skolans har en högstatus/gott anseende påarbetsmarknaden
gfedc gfedc gfedc gfedc gfedc gfedc gfedc gfedc gfedc
Skolan är gammal/anrik gfedc gfedc gfedc gfedc gfedc gfedc gfedc gfedc gfedc
Skolan nämns ofta iredaktionell media (ex. DN, SVD etc)
gfedc gfedc gfedc gfedc gfedc gfedc gfedc gfedc gfedc
Skolan marknadsför sincivilekonom-utbildning genom annonsering i magasin och tidskrifter
gfedc gfedc gfedc gfedc gfedc gfedc gfedc gfedc gfedc
Skolan marknadsför sincivilekonom-utbildning genom annonsering på Internet
gfedc gfedc gfedc gfedc gfedc gfedc gfedc gfedc gfedc
1 PÅVERKARMYCKET
NEGATIVT 2 3 4
5 PÅVERKARVARKEN
NEGATIVTELLER POSITIVT 6 7 8
9 PÅVERKARMYCKETPOSITIVT
Skolan bedriver MBA utbildning för folk inäringslivet
gfedc gfedc gfedc gfedc gfedc gfedc gfedc gfedc gfedc
Skolan marknadsför sin MBAutbildning aktivt genom annonsering i affärspress (ex.Di & VA)
gfedc gfedc gfedc gfedc gfedc gfedc gfedc gfedc gfedc
Skolan ärkvalitetsackrediterad av en oberoende organisation
gfedc gfedc gfedc gfedc gfedc gfedc gfedc gfedc gfedc
Skolan har fräscha lokaler gfedc gfedc gfedc gfedc gfedc gfedc gfedc gfedc gfedc
Många kändanäringslivsprofiler har läst där gfedc gfedc gfedc gfedc gfedc gfedc gfedc gfedc gfedc
Skolan har ett nätverk inomnäringslivet gfedc gfedc gfedc gfedc gfedc gfedc gfedc gfedc gfedc
4B:Välj det korrekta svaret för varje punkt:
4CD4C: Tänk dig att du som blivande student ska utvärdera den förväntade kvalitén på en ekonomiutbildning på en fiktiv skola . Hur anser du att följande faktorer påverkar den förväntade kvalitén?
Observera att du ska tänka dig in i en situation där du står inför valet av utbildning på en fiktiv skola.Välj det korrekta svaret för varje punkt:
4D:Välj det korrekta svaret för varje punkt:
55A: Tänk dig nu att du börjar läsa på denna fiktiva skola och som student ska utvärdera den upplevda kvalitén av ekonomiutbildningen. Hur anser du att följande faktorer påverkar den upplevda kvalitén?
Observera att du ska tänka dig in i en situation där du läser på den fiktiva skolan.

1 PÅVERKARMYCKET
NEGATIVT 2 3 4
5 PÅVERKARVARKEN
NEGATIVT ELLER POSITIVT 6 7 8
9 PÅVERKARMYCKETPOSITIVT
Stort utbud avföreningsaktiviteter (ex.studentkåren,intresseföreningar etc.)
gfedc gfedc gfedc gfedc gfedc gfedc gfedc gfedc gfedc
Studiekamraterna ärtrivsamma gfedc gfedc gfedc gfedc gfedc gfedc gfedc gfedc gfedc
Kurserna har ett braupplägg gfedc gfedc gfedc gfedc gfedc gfedc gfedc gfedc gfedc
Programmen har ett braupplägg gfedc gfedc gfedc gfedc gfedc gfedc gfedc gfedc gfedc
1 PÅVERKARMYCKET
NEGATIVT 2 3 4
5 PÅVERKARVARKEN NEGATIVT
ELLER POSITIVT 6 7 8
9 PÅVERKARMYCKETPOSITIVT
Föreläsarna finnstillgängliga utöverföreläsningstid
gfedc gfedc gfedc gfedc gfedc gfedc gfedc gfedc gfedc
Det är lätt att ställafrågor under lektionstid gfedc gfedc gfedc gfedc gfedc gfedc gfedc gfedc gfedc
Föreläsarna uppmuntrartill kritiskt tänkande gfedc gfedc gfedc gfedc gfedc gfedc gfedc gfedc gfedc
Alternativa former av undervisning används(ex. casebaserad)
gfedc gfedc gfedc gfedc gfedc gfedc gfedc gfedc gfedc
De ordinarie föreläsarnahar erfarenheter frånnäringslivet
gfedc gfedc gfedc gfedc gfedc gfedc gfedc gfedc gfedc
1 PÅVERKARMYCKET
NEGATIVT 2 3 4
5 PÅVERKARVARKEN
NEGATIVTELLER POSITIVT 6 7 8
9 PÅVERKARMYCKETPOSITIVT
Andra aktiviteter erbjudsutöver kursplan (ex.gästföreläsningar,företagsbesök, casetävlingaretc.)
gfedc gfedc gfedc gfedc gfedc gfedc gfedc gfedc gfedc
Skolan har en internationellkänsla (ex. föreläsningar påengelska)
gfedc gfedc gfedc gfedc gfedc gfedc gfedc gfedc gfedc
Föreläsarna är engagerade gfedc gfedc gfedc gfedc gfedc gfedc gfedc gfedc gfedc
Skolan har fräscha lokaler gfedc gfedc gfedc gfedc gfedc gfedc gfedc gfedc gfedcDet finns tillgång till ettaktivt nätverk mellanstudenter och näringslivunder utbildningstiden
gfedc gfedc gfedc gfedc gfedc gfedc gfedc gfedc gfedc
INGENUPPFATTNING
1INSTÄMMERINTE ALLS 2 3 4 5 6 7 8 9
10INSTÄMMERTILL FULLO
Jag är ordentligtpåläst införföreläsningarna
gfedc gfedc gfedc gfedc gfedc gfedc gfedc gfedc gfedc gfedc gfedc
Välj det korrekta svaret för varje punkt:
5B:Välj det korrekta svaret för varje punkt:
5C:Välj det korrekta svaret för varje punkt:
5D: Skulle du vilja lägga till något till alternativen på ovanstående fråga?Skriv vad det är du vill
lägga till, följt av ensiffra för hur mycket
det påverkar,1=Påverkar inget,
10=Påverkar mycket
Skriv ditt svar här:
66A: Hur väl anser du att följande påståenden stämmer för dig?
Välj det korrekta svaret för varje punkt:

Jag deltar aktivt iföreläsningarna (ex.ställer frågor ochdiskuterar)
gfedc gfedc gfedc gfedc gfedc gfedc gfedc gfedc gfedc gfedc gfedc
Jag lägger den tiddet förväntas av migpå att studera utöverföreläsningarna
gfedc gfedc gfedc gfedc gfedc gfedc gfedc gfedc gfedc gfedc gfedc
Jag deltar i aktivt iföreningsaktiviteter(ex. studentkåren,intresseföreningaretc.)
gfedc gfedc gfedc gfedc gfedc gfedc gfedc gfedc gfedc gfedc gfedc
Jag deltar aktivt i andra aktiviteterutöver kursplan (ex.gästföreläsningar,företagsbesök,casetävlingar etc.)
gfedc gfedc gfedc gfedc gfedc gfedc gfedc gfedc gfedc gfedc gfedc
Jag är stolt över attläsa på USBE gfedc gfedc gfedc gfedc gfedc gfedc gfedc gfedc gfedc gfedc gfedc
1 MYCKET OLIKA 2 3 4 5 6 7 8 9
10 MYCKET LIKA
Handelshögskolan vid Göteborgsuniversitet gfedc gfedc gfedc gfedc gfedc gfedc gfedc gfedc gfedc gfedc
Handelshögskolan i Stockholm gfedc gfedc gfedc gfedc gfedc gfedc gfedc gfedc gfedc gfedc
Handelshögskolan vid Umeåuniversitet gfedc gfedc gfedc gfedc gfedc gfedc gfedc gfedc gfedc gfedc
Internationella Handelshögskolan iJönköping gfedc gfedc gfedc gfedc gfedc gfedc gfedc gfedc gfedc gfedc
Linköpings universitet gfedc gfedc gfedc gfedc gfedc gfedc gfedc gfedc gfedc gfedc
Mälardalens Ekonomihögskola gfedc gfedc gfedc gfedc gfedc gfedc gfedc gfedc gfedc gfedc
Stockholms universitet gfedc gfedc gfedc gfedc gfedc gfedc gfedc gfedc gfedc gfedc
Uppsala universitet gfedc gfedc gfedc gfedc gfedc gfedc gfedc gfedc gfedc gfedc
Örebro universitet gfedc gfedc gfedc gfedc gfedc gfedc gfedc gfedc gfedc gfedc
1 MYCKET OLIKA 2 3 4 5 6 7 8 9
10 MYCKET LIKA
Handelshögskolan i Stockholm gfedc gfedc gfedc gfedc gfedc gfedc gfedc gfedc gfedc gfedc
77A: Nedan följer en serie frågor i vilka du skall ta ställning till hur du uppfattar olika univeritet/högskolor i förhållande tillvarandra. Det vi vill veta är vad du känner eller tror om respektive universitet/högskola, inte hur det "egentligen" förhållersig.
7B: Kryssa för de två skolor som du uppfattar som mest olika. Observera att du endast skall markera två alternativ.Välj alla som stämmer:gfedc Ekonomihögskolan vid Lunds universitetgfedc Handelshögskolan vid Göteborgs universitetgfedc Handelshögskolan i Stockholm gfedc Handelshögskolan vid Umeå universitetgfedc Internationella Handelshögskolan i Jönköpinggfedc Linköpings universitetgfedc Mälardalens Ekonomihögskolagfedc Stockholms universitetgfedc Uppsala universitetgfedc Örebro universitet
7C: Kryssa för de två skolor som du uppfattar som mest lika. Observera att du endast skall markera två alternativ.Välj alla som stämmer:gfedc Ekonomihögskolan vid Lunds universitetgfedc Handelshögskolan vid Göteborgs universitetgfedc Handelshögskolan i Stockholm gfedc Handelshögskolan vid Umeå universitetgfedc Internationella Handelshögskolan i Jönköpinggfedc Linköpings universitetgfedc Mälardalens Ekonomihögskolagfedc Stockholms universitetgfedc Uppsala universitetgfedc Örebro universitet
8A8A: Hur lika uppfattar du att nedanstående skolor är i jämförelse med Ekonomihögskolan vid Lunds universitet?
Välj det korrekta svaret för varje punkt:
8B8B: Hur lika uppfattar du att nedanstående skolor är i jämförelse med Handelshögskolan vid Göteborgs universitet?
Välj det korrekta svaret för varje punkt:

Handelshögskolan vid Umeåuniversitet gfedc gfedc gfedc gfedc gfedc gfedc gfedc gfedc gfedc gfedc
Internationella Handelshögskolan iJönköping gfedc gfedc gfedc gfedc gfedc gfedc gfedc gfedc gfedc gfedc
Linköpings universitet gfedc gfedc gfedc gfedc gfedc gfedc gfedc gfedc gfedc gfedc
Mälardalens Ekonomihögskola gfedc gfedc gfedc gfedc gfedc gfedc gfedc gfedc gfedc gfedc
Stockholms universitet gfedc gfedc gfedc gfedc gfedc gfedc gfedc gfedc gfedc gfedc
Uppsala universitet gfedc gfedc gfedc gfedc gfedc gfedc gfedc gfedc gfedc gfedc
Örebro universitet gfedc gfedc gfedc gfedc gfedc gfedc gfedc gfedc gfedc gfedc
1 MYCKET OLIKA 2 3 4 5 6 7 8 9
10 MYCKET LIKA
Internationella Handelshögskolan iJönköping gfedc gfedc gfedc gfedc gfedc gfedc gfedc gfedc gfedc gfedc
Linköpings universitet gfedc gfedc gfedc gfedc gfedc gfedc gfedc gfedc gfedc gfedc
Mälardalens Ekonomihögskola gfedc gfedc gfedc gfedc gfedc gfedc gfedc gfedc gfedc gfedc
Stockholms universitet gfedc gfedc gfedc gfedc gfedc gfedc gfedc gfedc gfedc gfedc
Uppsala universitet gfedc gfedc gfedc gfedc gfedc gfedc gfedc gfedc gfedc gfedc
Örebro universitet gfedc gfedc gfedc gfedc gfedc gfedc gfedc gfedc gfedc gfedc
1 MYCKET OLIKA 2 3 4 5 6 7 8 9 10 MYCKET LIKA
Linköpings universitet gfedc gfedc gfedc gfedc gfedc gfedc gfedc gfedc gfedc gfedc
MälardalensEkonomihögskola gfedc gfedc gfedc gfedc gfedc gfedc gfedc gfedc gfedc gfedc
Stockholms universitet gfedc gfedc gfedc gfedc gfedc gfedc gfedc gfedc gfedc gfedc
Uppsala universitet gfedc gfedc gfedc gfedc gfedc gfedc gfedc gfedc gfedc gfedc
Örebro universitet gfedc gfedc gfedc gfedc gfedc gfedc gfedc gfedc gfedc gfedc
1 MYCKET OLIKA 2 3 4 5 6 7 8 9 10 MYCKET LIKA
Stockholms universitet gfedc gfedc gfedc gfedc gfedc gfedc gfedc gfedc gfedc gfedc
Uppsala universitet gfedc gfedc gfedc gfedc gfedc gfedc gfedc gfedc gfedc gfedc
Örebro universitet gfedc gfedc gfedc gfedc gfedc gfedc gfedc gfedc gfedc gfedc
1 MYCKET OLIKA 2 3 4 5 6 7 8 9 10 MYCKET LIKA
Uppsala universitet gfedc gfedc gfedc gfedc gfedc gfedc gfedc gfedc gfedc gfedc
Örebro universitet gfedc gfedc gfedc gfedc gfedc gfedc gfedc gfedc gfedc gfedc
8C8C: Hur lika uppfattar du att nedanstående skolor är i jämförelse med Handelshögskolan i Stockholm?
Välj det korrekta svaret för varje punkt:
8D8D: Hur lika uppfattar du att nedanstående skolor är i jämförelse med Handelshögskolan vid Umeå universitet ?
Välj det korrekta svaret för varje punkt:
8E8E: Hur lika uppfattar du att nedanstående skolor är i jämförelse med Internationella Handelshögskolan i Jönköping?
Välj det korrekta svaret för varje punkt:
8F8F: Hur lika uppfattar du att nedanstående skolor är i jämförelse med Linköpings universitet ?
Välj det korrekta svaret för varje punkt:
8G8G: Hur lika uppfattar du att nedanstående skolor är i jämförelse med Mälardalens Ekonomihögskola?
Välj det korrekta svaret för varje punkt:
8H8H: Hur lika uppfattar du att nedanstående skolor är i jämförelse med Stockholms universitet?
Välj det korrekta svaret för varje punkt:

1 MYCKET OLIKA 2 3 4 5 6 7 8 9 10 MYCKET LIKA
Örebro universitet gfedc gfedc gfedc gfedc gfedc gfedc gfedc gfedc gfedc gfedc
INGENUPPFATTNING
1INSTÄMMERINTE ALLS 2 3 4 5 6 7 8 9
10INSTÄMMERTILL FULLO
Jag rekommenderargärna någon attbörja läsa på USBE.
gfedc gfedc gfedc gfedc gfedc gfedc gfedc gfedc gfedc gfedc gfedc
Om jag stod införvalet att söka enekonomiutbildningigen, så skulle jagsöka till USBE.
gfedc gfedc gfedc gfedc gfedc gfedc gfedc gfedc gfedc gfedc gfedc
8I8I: Hur lika uppfattar du att nedanstående skola är i jämförelse med Uppsala universitet?
Välj det korrekta svaret för varje punkt:
9* 9A: Har du funderat på att byta studieort under utbildningen för att kunna ta examen vid ett annat universitet/högskola?
Välj endast en av följande:gfedc Jagfedc Nej
9B: Nedan följer två påståenden, värdera dessa enligt skalan "1 Stämmer inte alls" till "10 stämmer till fullo".Välj det korrekta svaret för varje punkt:
9191A1: Denna enkät avslutas med nedanstående frågor om din bakgrund.
[Svara bara på denna fråga om du svarat 'Ja' på fråga '9A ']91A2: Du uppgav att du har/hade funderat på att byta studieort under utbildningen för att kunna ta examen vid ett annatuniversitet/högskola. Vilket annat universitet/högskola har/hade du i åtanke?
Skriv namnet påuniversitetet/högskolan
alternativt orten.
Skriv ditt svar här:
* 91A3: Hur gammal är du?Skriv ditt svar här:
* 91B: Är du man eller kvinna?Välj endast en av följande:gfedc Kvinnagfedc Man
* 91C: Var tog du studenten?Välj endast en av följande:gfedc Blekinge längfedc Dalarnas län gfedc Gotlands län gfedc Gävleborgs längfedc Hallands längfedc Jämtlands längfedc Jönköpings län gfedc Kalmar län gfedc Kronobergs längfedc Norrbottens längfedc Skåne längfedc Stockholms längfedc Södermanlands längfedc Uppsala längfedc Värmlands längfedc Västerbottens längfedc Västernorrlands län

gfedc Västmanlands längfedc Västra Götalands längfedc Örebro längfedc Östergötlands längfedc Annat land än Sverige
* 91D: Vilket av följande alternativ läser du?Välj endast en av följande:gfedc Fristående kursgfedc Grundutbildningsprogram (Civiliekonom, IE/IBP eller SM)gfedc Masterprogram (ej som förlängning på grundutbildningsprogram)
* 91F: Har du läst andra kurser eller program på universitet/högskola mellan studenten och ditt nuvarandeutbildningsprogram?
Välj endast en av följande:gfedc Jagfedc Nej
92[Svara bara på denna fråga om du svarat 'Fristående kurs' på fråga '91D ']92A: Vilket program läser du?
Välj endast en av följande:gfedc Civilekonomprogrammetgfedc Internationella Ekonomprogrammetgfedc Service Management programmet
[Svara bara på denna fråga om du svarat 'Fristående kurs' på fråga '91D ']* 92A2: Vilken termin läser du på ditt nuvarande utbildningsprogram?
Skriv ditt svar här:
[Svara bara på denna fråga om du svarat 'Ja' på fråga '91F ']92B: Du uppgav att du hade läst på universitet/högskola innan påbörjandet av ditt nuvarande studieprogram. Var det påUmeå universitet/USBE eller på annat universitet/högskola?
Välj endast en av följande:gfedc USBE/Umeå universitetgfedc Annat universitet/högskola, var god ange till högerKommentera dina val här:
[Svara bara på denna fråga om du svarat 'Fristående kurs' på fråga '91D ']* 92C: Hur många år gick det från din studentexamen till det att du började läsa på ditt nuvarande utbildningsprogram?
Ange eventuellt halvårsom 0.5, med punkt som kommatering
(exempelvis två och etthalvt år = 2.5)
Skriv ditt svar här:
* 92D: Vilket/vilka av nedanstående huvudämnen stämmer bäst in på det som du har valt eller planerar att välja:Välj endast en av följande:gfedc Entreprenörskapgfedc Finansieringgfedc Internationell ekonomigfedc Logistikgfedc Management/ledarskapgfedc Marknadsföringgfedc Nationalekonomigfedc Redovisninggfedc Retailgfedc Annat – Var god ange till högergfedc Har inte bestämt mig ännuKommentera dina val här:

* 92E: Påverkade ditt tilltänkta huvudämne valet av studieort?Välj endast en av följande:gfedc Jagfedc Nej
* 92F: Påverkade din tilltänkta examensnivå (ex. kandidat, magister, master) valet av studieort?Välj endast en av följande:gfedc Jagfedc Nej
9393A: Tack för att du tog dig tid att fylla i enkäten! OBSERVERA ATT DU MÅSTE TRYCKA "SKICKA" PÅ NÄSTASKÄRMUPPSLAG.
Du har nu chansen att vinna en iPod Nano (1GB) genom att fylla i ditt namn och en giltig e-mail adress. Observera att det endast är möjligt att delta en gång i tävlingen. Vinnaren kommer att meddelas via e-mail senast den 16 juni.
Observera vidare att din e-mail adress inte kommer att kunna kopplas samman med dina svar vilka fortfarande kommer att behandlas konfidentiellt.
93B: Jag vill tävla om en iPod Nano (1GB) och väljer därför att ange mitt namn och e-mail adress. Genom att ange namnoch e-mail adress förbinder jag mig att betala ev. vinstskatt.
Ange mail enligt: [email protected]
Skriv ditt/dina svar här:Namn:
E-mail:
93C: Skulle jag vinna önskar jag en:Välj endast en av följande:gfedc Vit iPod Nanogfedc Svart iPod Nano
93D: Information om undersökningen.Den enkät du just fyllt i ingår i min kandidatuppsats och syftar till att skapa förståelse för faktorer som påverkarstudenters val av studieort samt deras uppfattning av USBE. Enkätundersökningen skickas till studenter vid USBE och åttaandra universitet/högskolor i Sverige.
Har du ytterligare frågor angående undersökningen är du välkommen att kontakta mig på:
Tack för ditt deltagande /Fabian Wrede
93E: OBSERVERA att du måste trycka "skicka" på nästa skärmuppslag för att enkäten skall skickas och du skall kunna varamed i tävlingen.
Lämna in din enkät.Tack för att du svarat på denna enkät. Faxa den ifyllda enkäten till: .