determinant expansions of signed matrices and of certain ...
Upload
khangminh22Category
view
0download
0
European Journal of Molecular & Clinical Medicine ISSN 2515-8260 Volume 7, Issue 2, 2020
5336
Determinant Of Capital Structure: A
Comparison Survey Of Manufacturing And
Non-Manufacturing Indonesian Listed
Companies
Sandra Heliola1, Disman
2, Ikaputera Waspada
3, Subiakto Soekarno
4
1,2,3Universitas Pendidikan Indonesia
4Institut Teknologi Bandung
Abstract - The purpose of this study is to review the comparison of the influence of
determinants of capital structure in the manufacturing and non-manufacturing companies
listed on the Indonesia Stock Exchange Period 2009-2018. There is a similarity of firm-
specific factors that affect the two industry groups namely Market to book ratio that has a
significant positive effect and profitability has a significant negative effect. Different from
a significant positive effect on tax, only on non-manufacturing companies while the
significant negative effect on the non-debt tax shield only on manufacturing companies.
The analysis technique uses Panel Data Regression for 274 registered companies, divided
by 103 companies in the manufacturing group and 171 companies in the non-
manufacturing group.
Keywords: Capital Structure, Firm-specific, Manufacturing, Non-manufacturing
1. INTRODUCTION
After the decline in the growth of the lowest market capitalization in 2008 on the Indonesia
Stock Exchange to reach -46%, in 2009 the market capitalization came to the highest growth
spike to 88%. Conversely, in 2008 credit growth reached 31% but in 2009 it dropped to 7%
based on productive credit data from Otoritas Jasa Keuangan (OJK) banking statistics. The
growth movement seems to be in the opposite direction between credit growth and the
company's market capitalization recorded until 2018. Capitalization or market value of equity
reflects the value of a company, so the greater the market capitalization, the more expensive
the company is valued by the market and can encourage companies to increase debt
companies because the market value to the book value of equity is considered a proxy or
investment opportunity (Rajan& Zingales 1995). And, the mixture of capital and debt is
called capital structure (Ehrhardt & Brigham 2011: 600).
The importance of capital structure for companies because debt and equity have costs
attached to it, called the cost of capital, the required rate of return on various types of
financing (Horne &Wachowicz, 2005: 383). Research on the capital structure that was started
by Modigliani&Miller (1958) but has not shown that capital structure influenced the value of
the company and debt is not as a tax deduction. Modigliani & Miller (1963) were motivated
to modified concepts on capital structure, that a corporation will reach its optimal capital
structure when the benefit of company tax is extended to offset the cost of financial distress,
this theory known as Trade-off Theory. Thus, the trade-off theory established a theoretical
framework for explaining the term ―optimal capital structure‖ of the firms. In contrast to

European Journal of Molecular & Clinical Medicine ISSN 2515-8260 Volume 7, Issue 2, 2020
5337
(Myers & Majluf, 1984) with the Pecking Order Theory which does not encourage debt first,
but the company will prioritize internal financing before external financing.
Based on the capital structure theory, the researchers expand by looking at the factors that
influence it. Firm-specific factors influence capital structure decisions (Titman & Wessels,
1988; Rajan& Zingales, 1995; Antoniou et al., 2002; Frank and Goyal, 2009; Hossain & Ali,
2012; Thippayana, 2014). Capital structure decisions are influenced by many factors
(Dincergok&Yalciner, 2011). The combination of capital structure not only affected by firm-
specific factors but also the institutional environment (Fan et al., 2012; Gwatidzo&Ojah,
2014).
In many studies, capital structure has stated the industrial pattern and this is the same
throughout the world. In all developed countries, certain industries are characterized by high
debt-to-capital ratios (utilities, transportation companies, and mature and capital-intensive
manufacturing companies), while other industries use little or no long-term debt financing
(Megginson, 1997: 305). MacKay & Philips (2005) report that industrial factors help explain
the financial structure of a company. Koksal& Orman (2014) in a Turkish listed company
study showed that manufacturing and non-manufacturing companies, in general, are very
similar in terms of their capital structure. Smith et al. (2015) show that the nature of each
industry's characteristics can be explained for variations in the capital structure of firms from
different industrial backgrounds. While Fei Goh et al. (2018) in Malaysian manufacturing
companies, not all variables influence the capital structure. Firm-specific factors vary in the
industry and industry-specific factors are important in terms of the formation of the capital
structure (Li & Islam, 2019).
The diversity of company-specific factors that influence capital structure has also been raised
by previous researchers. Rajan& Zingales (1995) used the Tangibility Asset, Size,
Profitability, and Market to Book Ratio variables to influence the capital structure of
companies in G7 countries. Fan et al. (2012) selected the same company-specific factors in
39 developed and developing countries, and Li & Islam (2019). Delcoure (2007) adds tax and
risk factors while De Jong et al. (2008) supplement specific factors with Non-Debt Tax
Shield and Liquidity and Deesomsak et al. (2004) raise eight firm-specific factors.
The literature has shown that a company's capital structure can be influenced by firm-specific
factors. The financial structure of a company is not identical across industries (Scott &
Martin, 1975) because intuition encourages us to research to better understand the influence
of company-specific factors on capital structure in the manufacturing and non-manufacturing
industries. Thus, the purpose of this study to see if there are differences in the influence of
specific factors on the two industries so that they can contribute to the company in the choice
of capital structure. We compile this paper in the second section reviewing the literature and
theories about capital structure and the specific determinants of capital structure, the third
part talks about sample data and research models, the fourth section provides the results of
empirical analysis, and the last section provides a discussion of the research results along
with the research conclusions.
2. LITERATURE REVIEW
The first time Modigliani &Miller (1958) launched his writing was known as the MM Theory
without Tax. With some assumptions to build their theories, an opinion is generated that
capital structure is irrelevant or does not affect the value of the company. MM Theory was
then corrected in 1963 by including the influence of taxes, so that debt can be used to save
taxes because interest expense can be used as a tax deduction.

European Journal of Molecular & Clinical Medicine ISSN 2515-8260 Volume 7, Issue 2, 2020
5338
2.1 Trade-Off Theory
Jensen &Meckling (1976) with the trade-off theory (TOT) stated that the existence of an
optimal capital structure and capital structure of a company can be determined by creating a
balance between tax effects, agency costs, and bankruptcy costs. This theory proposes that
companies balance the benefits and costs of their financing choices. Companies will owe to a
certain level of debt, where the tax savings (tax shields) from additional debt equals the cost
of financial distress (financial distress), (Myers, 2001). Companies choose their capital
structure by balancing the benefits of borrowing, especially tax savings, with costs associated
with loans including bankruptcy costs, this reflects the exchange of tax savings through debt
with the costs of bankruptcy in it (Baxter, 1967) and Kraus &Litzenberger (1973). In the
trade-off theory, companies have a capital structure target where the costs and benefits of
issuing balanced debt (Beattie et al., 2004).
2.2.1 Pecking Order Theory
A different matter was found by Myers & Majluf (1984) and Myers (1984) in the Pecking
Order Theory (POT). This theory cannot determine the optimal point of the leverage ratio,
each company chooses a leverage ratio based on financing needs and the company will
prioritize internal financing because it has lower costs than external financing. Brealey et al.,
(2008: 25) said that the company prefers internal funding, this is because the funds collected
without sending signals can reduce share prices and if external funds are needed, the
company will issue debt first and only issue equity as a last resort.
2.3 CAPITAL STRUCTURE AND SPECIFIC FACTORS AFFECTING
Previous research shows several ways into describing capital structure through leverage
ratios. Many researchers use the ratio of debt to total assets owned (Rajan& Zingales, 1995;
Sheikh & Wang, 2011; Pandey, 2004; Frank & Goyal, 2009; Koksal& Orman, 2014; Singh,
2016; Hailegebrealet al., 2018). Other diversity in seeing leverage such as Kester (1986),
Gaud et al. (2005), Frank & Goyal (2009), Nejadet al. (2013), Li & Islam (2019) reviewing
leverage in book-and market-value terms. Hall et al. (2004), Bayrakdaroğlu (2013), Al
Bahshet al., (2018), his research looked at leverage through several measures, namely total
debt, long term debt, and short-term debt. In this study leverage is shown through the ratio of
debt to capital as research conducted by Krishnan & Moyer (1997), Dakua (2006) Sayılgan
(2006), Nuswandari (2013). The equity value used is book value, Almazan& Molina (2005)
note that the book value of equity can be important if companies base their decisions on
accounting, not market information.
The diversity of specific factors that affect capital structure is also an interesting thing to
review. In this study, we chose eight specific company factors that followed previous
research that influenced capital structure, namely Tangibility Asset, Market to Book Ratio,
Size, Profitability, Liquidity, Tax, Non-Debt Tax Shield and Business Risk.
Tangible Asset is one of the company-specific factors most widely used to see its effect on
capital structure. Tangible Asset is one of the conditions in guaranteeing a company's debt so
that Padron et al. (2005) states that these assets among total assets affect the level of debt.
The relationship of positive tangible assets to leverage is suggested by Rajan& Zingales,
1995; Gaud et al., 2005; Fan et al., 2012; Al Bahsh, et al, 2018. While research that supports
POT shows a negative relationship (Psillaki& Daskalakis, 2009; Hossain & Ali, 2012; Singh,
2016). The ratio size that we use for TANG is Fixed-Asset/Total Asset.
Market to Book Ratio is a company-specific factor that shows a comparison of the market
value of equity against the book value of equity. Market to book ratio is one of the proxies
used in viewing the company's growth opportunities. The relationship of Market to Book

European Journal of Molecular & Clinical Medicine ISSN 2515-8260 Volume 7, Issue 2, 2020
5339
Ratio with leverage shows market expectations of the value of investment opportunities and
company growth (Antoniou et al., 2002). The greater the opportunity for company growth to
require funding through debt, this positive relationship is proven by Sayilganet al. (2006),
Singh (2016). There is a research gap on this factor, a negative relationship is shown by
Rajan&Zingales (1995), in his research explained two reasons for the negative relationship
between MBR and leverage; First, when the MBR increases, the cost of financial difficulties
will also increase. Second, companies prefer issuing equity when shares are valued
overvalued. The negative relationship for growth opportunities is also shown by Deesomsak
(2004), De Jonget al. (2008).
Firm Size indicates the scale of the company, wherein previous studies commonly used total
assets or total sales as an indicator. In this study, measuring the firm size by the logarithm of
the company's total assets. Firm size can affect leverage, a positive relationship happens
because the larger the firm size will get the convenience and the opportunity to owe more
(Rajan& Zingales, 1995; Antoniou et al., 2002; De Jong et al., 2008; Fan et al., 2012; Singh,
2016; Li & Islam, 2019) Larger companies have an advantage over smaller companies in
accessing credit markets and better-negotiating power when borrowing (Wiwattanakantang,
1999). While in POT the greater the size of the company will prioritize funding internally,
firm size has a negative relationship Nasruddin (2004), Margaretha & Sari (2005).
Profitability in firm-specific factors was measured in general using Return to Asset Ratio or
Return to Equity Ratio. Gaud et al. (2005) note that if past profitability is a good proxy for
future profitability, profitable companies can borrow more because the likelihood of
repayment of loans is greater. Another positive relationship is shown by research Frank &
Goyal (2003). While on the contrary, quite a lot of research shows a negative relationship
between profitability towards leverage Rajan and Zingales (1995); Booth et al. (2001); Hall et
al. (2004). The size of the profitability ratio used is Earning After Taxe / Total Equity.
Liquidity which is shown by the comparison of Current Asset to Current Liabilities (current
ratio) tends to have a negative effect because with high liquidity companies tend to have less
debt because they are expected to be able to generate high cash inflows and can be used to
finance operations and investment activities. In previous studies, a negative relationship was
supported by Deesomsak, et al., (2004), Singh, (2016), Al Bahsh, et al. (2018). Ghasemiet al.
(2016) by using a quick ratio, a positive relationship occurs between liquidity and leverage.
Looking at the effect of Tax, TOT explained that companies in setting debt levels are based
on trade-offs between debt costs and benefits, so companies will raise their debt levels as
long as the marginal tax benefit from additional debt offsets the increase in the cost of
financial bankruptcy. Refer to Booth et al. (2001), Delcoure (2007), De Jong et al. (2008), the
average tax rate is used as a proxy for the benefits of tax protection from debt. But in the
research of Krempet al., (1999) with higher corporate tax rates, it would have resulted in
lower internal funds and higher capital costs. As a result, the formation of fixed capital and
the demand for external funds will decrease so that the inverse relationship between the level
of debt and the effective tax rate. It can be said that the costs associated with debt financing
(eg agency costs and bankruptcy) do not differ from the tax benefits of debt financing
Antoniou et al. (2002). The size of the tax rate is the tax burden on a company's operating
profit.
Non-Debt Tax Shield (NDTS) is a tax reduction due to depreciation, amortization, and long-
term deferred costs. NDTS is the choice of a tax shield on debt financing (DeAngelo
&Masulis, 1980). The calculation of this non-debt tax shield defines depreciation and
amortization expenses which are charged to administrative expenses and sales expenses.

European Journal of Molecular & Clinical Medicine ISSN 2515-8260 Volume 7, Issue 2, 2020
5340
NDTS shows how many companies have secure assets that lead to higher leverage ratios
(Delcoure, 2007). Companies with higher NDTS can predictably use less debt in their
companies. There was no effect of NDTS on leverage Singh (2016).
Income volatility is used to measure business risk (Delcoure, 2007). Business Risk can be
seen from the revenue volatility of a company. The higher the volatility of a company can
risk the possibility of income far above or below their average standard. If income is far
above average, this can result in companies needing to manage high-cost funds to pay off
debt or risk bankruptcy. This situation illustrates the close relationship between business risk
and leverage. In the TOT, higher volatility indicates a higher risk in a company, while
creditors will set a higher interest rate if the project is riskier, and companies with limited
liability tend to take projects with higher risk. The positive relationship to leverage is
supported by Delcoure (2007) while the negative relationship is by De Jong, et al. (2008).
The Business Risk measure is the standard deviation of the operating profit growth in year t
to t-1.
Smith et al. (2015) shown that the nature of each industry's characteristics can explained
variations in the company's capital structure from different industrial backgrounds, so the
hypotheses that we built in this study are:
Table 1 The Hypotheses
Hypotheses Firm-Specific Manufacturing Non-Manufacturing
H0 1 Asset Tangibility positive negative
H0 2 Market to Book Ratio negative positive
H0 3 Size positive negative
H0 4 Profitability negative negative
H0 5 Liquidity negative negative
H0 6 Tax positive positive
H0 7 Non-Debt Tax Shield negative negative
H08 Business Risk negative negative
Note: positive and negative shows the direction of the relationship of firm-specific
factors to the capital structure
3. METHOD
The research method is carried out quantitatively, with a form of causal study that aims to see
the influence between variables in research. The method aims to obtain empirical evidence of
the influence of independent variables, represented by Tangibility Asset, Market to Book
Ratio, Firm Size, Profitability, Liquidity, Tax, Non-Debt Tax Shield, and Business Risk as
the dependent variable.
3.1 Data Collecting Method
This study uses secondary data, which is annual financial statements of non-financial
companies listed on the Indonesia Stock Exchange during the period 2009-2018. The annual
financial reports are obtained from the official website of the Indonesia Stock Exchange
(IDX) at www.idx.co.id and through the IDN Financials website www.idnfinancials.com.

European Journal of Molecular & Clinical Medicine ISSN 2515-8260 Volume 7, Issue 2, 2020
5341
3.2 Population and Sample Determination Method
The population of this study is all issuers that are non-financial companies listed on the
Indonesia Stock Exchange during the period 2009-2018. The exclusion of financial
companies is because financial companies have different and tighter policies by regulators.
The sampling technique used was purposive sampling. Because the research data span of 10
years began in 2009, we selected all companies that did an IPO before 2009 except financial
companies and the companies that did not have complete data, so that our total sample was
274 which is 103 manufacturing industry groups and 171 non-manufacturing groups.
3.3 Variable Definition and Measurement
The dependent variable in this study is the capital structure which is calculated through the
ratio of total debt leverage to total equity. For independent variables are firm-specific factors
in this study that were selected based on previous research are Tangibility Asset, Market to
Book Ratio, Size, Profitability, Liquidity, Tax, Non-Debt Tax Shield and Business Risk.
The measurement of dependent and independent variables can be explained in the table
below:
Table 1. Definition of variables
Variable Indicator
Y Debt to Equity Ratio (DER) Total Debt/Total Equity
X1 Asset Tangibility (TANG) Fixed Asset/Total Asset
X2 Market to Book Ratio (MTB) The market value of equity/ book value of equity
X3 Ukuran perusahaan (SIZE) Ln(Total Asset)
X4 Profitability (PRO) EAT/Total Equity
X5 Liquidity (LIQ) Current Asset/Current Liabilities
X6 Tax Tax payment/EarningBefore Interest &Tax
(EBIT)
X7 Non-Debt Tax Shield
(NTDS)
Depreciation/Total Asset
X8 Business Risk (BR) δ (ΔEBIT)
The strength of the relationship of variable Y with variable X in this study was measured
using panel data regression because the sample contained cross-company data and from time
to time. To see the effect of explanatory variables on debt ratio (DER), there are three
approaches in making panel data regression, namely, Pooled Ordinary Least Square (OLS),
The Random Effects (REM), and The Fixed Effects (FEM). To find out which model to use,
the Chow and Hausman tests were performed.
Regression is carried out in two stages, namely for the manufacturing industry group and the
non-manufacturing industry group with the following regression models:
DER = a+ b1TANG+ b2MBR+ b3SIZE+ b4PRO +b5LIQ +b6TAX +b7NDTS +b8BR + e
Information :
DER : Debt to Equity Ratio (DER)
TANG : Asset Tangibility
MBR : Market to Book Ratio
SIZE : Firm Size
European Journal of Molecular & Clinical Medicine ISSN 2515-8260 Volume 7, Issue 2, 2020
5342
PRO : Return on Equity
LIQ : Liquidity
Tax : Tax
NDTS : Non Debt Tax Shield
BR : Business Risk
A : constant
b1, b2, b3, b4, b5, b6 : regression coefficients
e : error
4. RESULTS
In this section we present various estimation results and empirical findings. We present the
descriptive analysis as follows:
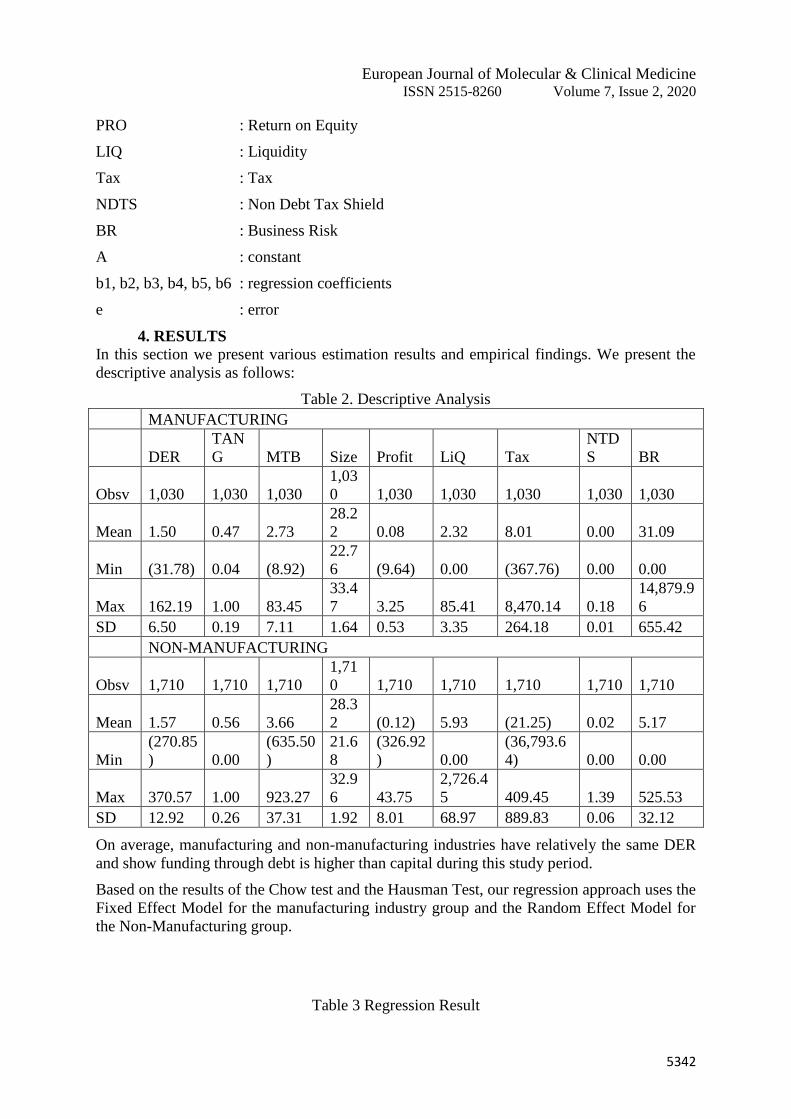
Table 2. Descriptive Analysis
MANUFACTURING
DER
TAN
G MTB Size Profit LiQ Tax
NTD
S BR
Obsv 1,030 1,030 1,030
1,03
0 1,030 1,030 1,030 1,030 1,030
Mean 1.50 0.47 2.73
28.2
2 0.08 2.32 8.01 0.00 31.09
Min (31.78) 0.04 (8.92)
22.7
6 (9.64) 0.00 (367.76) 0.00 0.00
Max 162.19 1.00 83.45
33.4
7 3.25 85.41 8,470.14 0.18
14,879.9
6
SD 6.50 0.19 7.11 1.64 0.53 3.35 264.18 0.01 655.42
NON-MANUFACTURING
Obsv 1,710 1,710 1,710
1,71
0 1,710 1,710 1,710 1,710 1,710
Mean 1.57 0.56 3.66
28.3
2 (0.12) 5.93 (21.25) 0.02 5.17
Min
(270.85
) 0.00
(635.50
)
21.6
8
(326.92
) 0.00
(36,793.6
4) 0.00 0.00
Max 370.57 1.00 923.27
32.9
6 43.75
2,726.4
5 409.45 1.39 525.53
SD 12.92 0.26 37.31 1.92 8.01 68.97 889.83 0.06 32.12
On average, manufacturing and non-manufacturing industries have relatively the same DER
and show funding through debt is higher than capital during this study period.
Based on the results of the Chow test and the Hausman Test, our regression approach uses the
Fixed Effect Model for the manufacturing industry group and the Random Effect Model for
the Non-Manufacturing group.
Table 3 Regression Result

European Journal of Molecular & Clinical Medicine ISSN 2515-8260 Volume 7, Issue 2, 2020
5343
Variable Manufacture Non Manufacture
Fixed Effect Model Random Effect Model
Coefficient Prob. Coefficient Prob.
C 3.9772 0.6775 -3.2703 0.3168
TANG 2.3260 0.2273 -1.0297 0.2384
MTB 0.5644 0.0000 0.0294 0.0000
SIZE -0.1457 0.6710 0.1808 0.1209
PRO -7.8007 0.0000 -1.1323 0.0000
LIQ -0.0226 0.6925 -0.0013 0.6877
TAX 0.0000 0.9360 0.0006 0.0281
NDTS -70.1218 0.0028 1.2270 0.7396
BR 0.0000 0.9184 0.0096 0.1607
R-squared 0.5760 R-squared 0.5188
F-
statistic
11.3498 F-statistic 229.2312
Durbin-Watson stat 1.9877 Durbin-
Watson stat
1.6886
Note: All variables are significant at α=0.05 level
TANG gives the same result not having a significant effect on both industry groups, and this
is beyond our prediction on the hypothesis. The trade-off theory predicts a positive
relationship between leverage and TANG, but the result of this study similar to the research
by Deesomsak (2004), Nejadet al. (2013), Dakua (2018) who do not see a significant
relationship between TANG and leverage. Whereas the study of Li & Islam (2019) did not
find a consistent relationship between asset tangibility and leverage. Referring to the
company DER average above 100% shows TANG has been used maximally so that it might
not be a factor affecting companies in Indonesia in funding decisions through debt.
MTB is one proxy to see the growth opportunities of the company to be a variable that affects
the capital structure. Significant positive relationship in both types of industry groups,
according to our hypothesis for non-manufacturing industries but different from the
manufacturing hypothesis. This positive effect supports Pecking Order Theory, companies
with higher growth will prefer debt financing over equity finance when internal funding is
insufficient. The positive effect was shown in the research of Sayilganet al. (2006); Singh
(2016) and contrary to the research of Rajan& Zingales, 1995; Frank & Goyal, 2003; Li &
Islam, 2019. Comparing the effect of MTB with leverage, positive manufacturing relations
are associated with long-term leverage while non-manufacturing companies have a negative
correlation with term leverage Koksal& Orman (2014). By this result, seeing high growth
opportunities, the Indonesian companies will add their debt to invest to enlarge their business.
SIZE also has no influence on the capital structure for the two industry groups. The two
industry groups on average are based on SIZE measurements with the logarithm of total
assets in this study having relatively the same rate. SIZE does not support TOT nor POT. No
significant results were found in the Dakua’s study (2018). The size of the company affects
the ability and reach of companies to obtain easy and cheap debt financing (Sayilganet al.,
2006), but does not affect on the decision of the company's capital structure in Indonesia.
SIZE is not a primary consideration for creditors in providing additional debt or reducing it,
then it's not an effect on capital structure decisions. Based on statistics, manufacturing

European Journal of Molecular & Clinical Medicine ISSN 2515-8260 Volume 7, Issue 2, 2020
5344
companies tended to follow the POT while non-manufacturing companies follow the TOT
pattern because of the positive direction.
Same as our hypothesis, both industry groups have a significant negative effect PRO on
capital structure. Companies in Indonesia will prioritize utilizing their profits before external
financing, the same as POT that companies with higher profits have lower needs for external
financing so that they have lower leverage. Profitability is an important determinant in both
industry groups, same as in dynamic capital structure, profitability becomes an important
capital structure determinants (S. Soekarno et al., 2015). This finding supports the research of
Rajan& Zingales (1995), Huang & Song (2004), and Frank & Goyal (2009). In the results of
the study by Koksal& Orman (2014) the debt ratio of manufacturing companies responded
more to changes in size and profitability than non-manufacturing companies.
Most of the previous studies had expected the negative effect of LIQ on capital structure, our
prediction of the hypotheses for these two industry groups was a negative effect because
liquidity results can also help explain results for profitability. However, our different results
show that there is no significant relationship between LIQ and capital structure, statistically,
the influence of LIQ of these two industry groups shows a negative direction. Similar to
profitability, if a company's assets are in a higher liquid state, the company will prioritize
internal funding as stated by POT. While studies such as Deesomsaket al. (2004), Viviani
(2008), Singh (2016) are consistent with POT results.
TAX and NDTS are natural determinants that match the trade-off theory (Koksal& Orman
2014). The tax rate in our study is the variable that has the highest standard deviation, the
diversity between the tax burden and benefits enjoyed by the company, and this related to the
applicable taxation rules. The effect of taxation on leverage is the result of a complex set of
tax rules, which makes leverage more or less valuable (De Jong et al., 2008) The results of
this study show that taxes on manufacturing companies do not affect the capital structure, and
some empirical studies find this relationship insignificant (Qureshi et al., 2012; Al Bahsh et
al., 2018), on the contrary, it has a positive effect on non-manufacturing companies, which
means non-manufacturing companies benefit from tax protection from debt, while NDTS
manufacturing companies which influence the capital structure, supporting the research of
Delcoure (2007); Al Bahsh et al. (2018), however NDTS in per non-manufacturing
businesses do not have a significant influence.
This operating profit volatility is used to measure business risk (Delcoure, 2007; Al-Najjar
and Taylor, 2008). Based on pecking-order theory and trade-offs, earnings volatility can
increase the possibility of default because debt holders consider the company's future income
as debt protection (Mehran, 1992). The empirical finding is contrary to our expectation that
there is no effect of BR on capital structure, in line with research by Deesomsak (2004); Al
Bahsh et al., (2018). Delcoure (2007) cannot conclude the relationship between BR and
leverage because there are differences in each of the countries that are sampled. BR does not
play an important role in corporate capital structure decisions in any of the sample countries
studied (Antoniu, 2002).
R2 is employed to test how closely the data are fitted with the regression line. The R2 value
is found to be in the range of 57.60% for manufacturing companies and 51.88% for non-
manufacturing companies, this shows that firm-specific factors provide quite high variables
and can explain variations in risk ratios. Besides, the F statistic confirmed the simultaneous
influence of firm-specific factors on capital structure.
5. DISCUSSION

European Journal of Molecular & Clinical Medicine ISSN 2515-8260 Volume 7, Issue 2, 2020
5345
We have chosen eight firm-specific factors, there is Tangible Asset (TANG), Market to Book
Ratio (MTB), company size (SIZE), profitability (PROF), liquidity (LIQ), Tax (TAX), non-
debt tax shield ( NDTS) and Business Risk (RISK) to see its effect on the capital structure of
companies registered in Indonesia in the 2009-2018 period. However, not all of them have a
significant influence on the capital structure. The correlation between determinants such as
growth opportunities through the MTB proxy and profitability are statistically significant in
both manufacturing and non-manufacturing industry groups. Manufacturing companies with
larger investments get the benefit of a non-debt tax shield (NDTS), not so with companies in
the non-manufacturing industry group, so that NDTS has no significant effect on capital
structure. On the other hand, TAX in the non-manufacturing industry group will increase its
debt in line with the increase in tax burden to create a trade-off debt cost to the tax burden.
This specific variable provides an important contribution in capital structure decisions
because overall R2 of more than 50% for both industry groups influences capital structure
decisions. For the next study, we estimate country-specific such as inflation rate, GDP, and
others to be other factors that give influence besides firm-specific and industry-specific
factors.
6. CONCLUSION
Generally, there are similarities in the influence of company-specific variables on capital
structure in both groups of industries. Not all variables are influential, each only has 3 (three)
firm-specific factors that influence the capital structure, namely MTB, PRO, and NDTS for
manufacturing companies and MTB, PRO, and Tax for non-manufacturing companies. But
seen from the signs of variable coefficients both in the manufacturing and non-manufacturing
industry groups have a tendency to Pecking Order Theory in capital structure decisions. In
contrast to the study of Koksal& Orman (2014), overall, our findings of the relationship
between leverage and various determinants seem to be more in line with the prediction of the
trade-off theory than with the pecking order theory, especially in the case of non-
manufacturing companies.
7. REFERENCES
[1] Almazan A. and Molina C.A. ―Intra-industry capital structure dispersion.‖ Journal
ofEconomics & Management Strategy, Vol. 14, No. 2,2005 pp. 263-297.
[2] Al-Najjar, B., Taylor, P. "The relationship between capital structureand ownership
structure."Managerial Finance, 34(12),2008. pp.919-933.
[3] Antoniou, A., Guney,Y. Paudyal, K. Determinants of Corporate Capital Structure:
Evidence from European Countries. Working Paper, University of Durham, 2002.
[4] Baxter, N.D. "Leverage, Risk of Ruin and the Cost of Capital."The Journal of Finance,
22, 1967, pp. 395-403.
[5] Bayrakdaroğlu, A., Ege, I., Yazıcı, N. "A panel data analysisof capital structure
determinants: Empirical results from Turkishcapital market."International Journal of
Economics and Finance,5(4), 2013, pp. 131-140.
[6] Beattie V., Goodacre A., Thomson S.J. Diversity and determinantsof corporate financing
decisions: survey evidence. Working Paper,University of Stirling, 2004.
[7] Booth, L., Aivazian, V., Demirguc-Kunt, A., & Maksimovic, V. "Capital structure in
developing countries."The Journal of Finance, 56, 2001, pp. 87–130.
[8] Brealey, R., A., S., C., Myers & A. J. Marcus. Dasar-Dasar Manajemen Keuangan
Perusahaan. Buku 2. Edisi 5. Jakarta: PenerbitErlangga, 2008.
[9] Bursa Efek Indonesia. 2019. [Online]. http://www.idx.co.id

European Journal of Molecular & Clinical Medicine ISSN 2515-8260 Volume 7, Issue 2, 2020
5346
[10] Dakua, Sarada."Effect of determinants on financial leverage in Indian steel industry:
A study on capital structure."International Journal of Finance & Economica. 2018, pp.1–
10.
[11] DeAngelo, H., Masulis, R.W. (1980), "Optimal capital structure undercorporate and
personal taxation." Journal of Financial Economics,8,1980, pp. 3-29.
[12] De Jong, A., Kabir, R., & Nguyen, T. T. (2008). "The capital structure around the
world: The roles of firm- and country-specific determinants." Journal of Banking &
Finance, 32, 2008, pp.1954–1969.
[13] Deesomsak, R., Paudyal, K., Pescetto, G. "The determinants ofcapital structure:
Evidence from the Asia Pacific region."Journal ofMultinational Financial Management,
14, 2004, pp. 387-405.
[14] Delcoure, N. The determinants of capital structure in transitional economies.
International Review of Economics & Finance, 16(3), 2007, pp. 400–415.
[15] Dincergok, B., &Yalciner, K. Capital structure decisions of manufacturing firms’ in
developing countries. Middle Eastern Finance and Economics, 12, 2011, pp. 86-100
[16] Ehrhardt, M. C, and Brigham, E.F. Financial Management: Theory and Practice (13
ed.). USA. South-Western Cengage Learning, 2011.
[17] Fan, J., Titman, S., & Twite, G. An international comparison of capital structure and
debt maturity choices. Journal of Financial and Quantitative Analysis, 47(1), 2012, pp.
23–56.
[18] Fei Goh, C., Ying Tai, W.,Rasli, A., Owee Kowang Tan, Zakuan, N.The
Determinants of Capital Structure: Evidence from Malaysian Companies. International
Journal of Supply Chain Management, Vol. 7, No. 3, June 2018.
[19] Frank, M. Z., & Goyal, V. K. Capital structure decisions: Which factors are reliably
important? Financial Management, 38(1), 2009, pp. 1–37.
[20] Ghasemi, M., & Ab Razak, N. H. The Impact of Liquidity on the Capital Structure:
Evidence from Malaysia. International Journal of Economics and Finance, 8(10), 2016,
pp. 130.
[21] Gaud, P., Jani, E., Hoesli, M., Bender, A. The capital structure of Swiss companies:
An empirical analysis using dynamic panel data. European Financial Management, 11(1),
2005, pp. 51-69.
[22] Ghozali, Imam.Aplikasi AnalisisMultivariate dengan Program SPSS.Semarang. BP
Universitas Diponegoro, 2013.
[23] Gwatidzo, T., &Ojah, K. "Firms’ debt choice in Africa: Are institutional
infrastructure and non‐traditional determinants important?"International Review of
Financial Analysis, 31, 2014, pp. 152–166.
[24] Hailegebreal,Demis& Wang, Man. "Determinants of Capital Structure of African
Firms: ACategorical Analysis."European Journal of Business and ManagementVol.10,
No.1, 2018.
[25] Hall, G., Hutchinson, P., & Michaelas, N. "Determinants of the capital structures of
European SMEs."Journal of Business Finance & Accounting, 31, 2004, pp. 711–728.
[26] Horne, James C. Van &Wachowicz, Jr John M. Fundamentals of Financial
Management. Pearson Education Limited Edinburgh Gate Harlow, England, 2005.
[27] Hossain, F & Ali & Ali.A. "Impact of Firm Specific Factors on Capital Structure
Decision: An Empirical Study of Bangladeshi Companies."International Journal of
Business Research and Management (IJBRM), Vol. 3 No. 4, 2012.
[28] Huang, S.H., & Song, F. M. The determinants of capital structure: Evidence from
China. School of Economics and Finance and Centre for China Financial Research,
University of Hong Kong. China,W P, 2004.

European Journal of Molecular & Clinical Medicine ISSN 2515-8260 Volume 7, Issue 2, 2020
5347
[29] IDN Financials, www.idnfinancials.com
[30] Jensen, M., & Meckling, W. "Theory of the firm: Managerial behaviour, agency costs
and ownership structure."Journal of Financial Economics, 3, 1976, pp. 305–360.
[31] Kester, W.C. "Capital and ownership structure: A comparison of United States and
Japanese manufacturing corporations."Financial Management, 25,Spring, 1986, pp. 5-16.
[32] Krishnan, V., Sivarama dan Moyer, R., Charles. 1997. "Performance, Capital
Structure and Home Country: An Analysis of Asian Corporations."Global Finance
Journal, Vol. 8 (1),1997, pp. 129-143.
[33] Koksal, B., Orman, C. "Determinants of capital structure: evidence from a major
developing economy."Small Business Economics, 44(2), 255–282.
[34] Kraus, A., dan Litzenberger, R.H. "A state -preference model of optimal financial
leverage."Journal of Finance. September: 1973, pp. 911-922.
[35] Kremp, E., Stöss, E. and Gerdesmeier, D. Estimation of a debt function: Evidence
from"French and German firm panel data, in: Sauvé, A and Scheuer, M. eds., Corporate
finance inGermany and France, A joint research of the Deutsche Bundesbank and the
Banque de France,1999, pp. 139-194.
[36] Li, Larry & Islam, Silvia Z. "Firm and Industry Specific Determinants of Capital
Structure: Evidence from The Australian Market."International Review of Economics and
Finance 59, 2019, pp. 425–437.
[37] MacKay, P., & Philips, G. M. "How does industry affect firm financial structure.
Review of Financial Studies." 18(4), 2005, pp. 1433–1466.
[38] Margaretha, F., dan L. Sari. "Faktor-faktor yang MempengaruhiStruktur Modal pada
Perusahaan Multinasional di Indonesia."Media Riset Bisnis dan Manajemen, Vol. 5, No.
2 August, 2005, pp. 230-252.
[39] Megginson, L William.Corporate Finance Theory. United States: Addison – Wasley
Educational Publishers Inc.,1997.
[40] Mehran, H. (1992), Executive incentive plans, corporate control, andcapital structure.
Journal of Financial and Quantitative Analysis,27(4), 787-821.
[41] Modigliani, F., & Miller, M. (1958). The cost of capital, corporation finance and the
theory of investment. The American Economic Review, 48, 261–297.
[42] Modigliani, F., Miller, M. Corporate income taxes and cost of capital: A correction.
American Economic Review, 53, 1963, PP. 443-453.
[43] Myers, S. "The capital structure puzzle. The Journal of Finance." 39, 1984, pp. 575–
592.
[44] Myers, S.C. "Majluf, N.S. Corporate financing and investment decisions when firms
have information that investors do not have."Journal of Financial Economics, 13(2),
1984, pp. 187-221.
[45] Myers, S. (2001). "Capital Structure."The Journal of Economic Perspectives, Vol.15,
No.2. Spring 2001—Pages 81–102.
[46] Nasruddin. (2004). "Faktor-Faktor yang MenentukanStruktur Modal: Studi Empirik
pada Perusahaan Industri Farmasi di Bursa Efek Jakarta."Jurnal Akuntansi dan Investasi,
5 (1): 2004, pp. 47-62.
[47] Nejad, Niloufar Rezaie and Wasiuzzaman, Shaista."The Empirical Analysis of Capital
StructureDeterminants – Evidence From Malaysia."World Academy of Science,
Engineering and Technology, 74, 2013, pp. 466-474.
[48] Nuswandari, Cahyani. "DeterminanStruktur Modal dalam Perspektif Pecking Order
Theory dan Agency Theory."DinamikaAkuntansi, Keuangan dan Perbankan, Vol. 2, No.
1, 2013, pp. 92 - 102.
[49] Otoritas Jasa Keuangan. Data Statistik Laporan Tahunan. 2013. https://ojk.go.id/
European Journal of Molecular & Clinical Medicine ISSN 2515-8260 Volume 7, Issue 2, 2020
5348
[50] Pandey, I. M. "Capital structure, profitability and marketstructure: Evidence from
Malaysia."Asia Pacific Journal ofEconomics & Business, 8(2), 2004 78–91.
[51] Psillaki, M., & Daskalakis, D. "Are the determinants of capital structure country or
firm specific?"Small Business Economics, 33(3), 2009, pp. 319–333.
[52] Rajan, R., & Zingales, L. "What do we know about capital structure: Some evidence
from international data."The Journal of Finance, 51, 1995, pp. 1421–1460.
[53] Rana Al Bahsh, Ali Alattar, Aziz N. Yusuf. "Firm, Industry and Country Level
Determinants of Capital Structure: Evidence from Jordan."International Journal of
Economics and Financial Issues, Vol 8 Issue 2,2018, pp. 175.
[54] Sayilgan, G., Karabacak, H., Kucukkocaoglu, G. "The firm-specific determinants of
corporate capital structure: Evidence from Turkish panel data."Investment Management
and Financial Innovations, 3, 2006, pp. 125-137.
[55] Scott, D. F., JR., & Martin, J. D. "Industry influence on financial structure. Financial
Management." 4(1), 1975, pp. 67–73.
[56] Sheikh, N.A., Wang, Z. "Determinants of capital structure: Anempirical study of
firms in manufacturing industry of Pakistan."Managerial Finance, 37, 2011, pp. 117-133.
[57] Singh, D."A Panel Data Analysis of Capital Structure Determinants: An Empirical
Study of Non-Financial Firms in Oman. International Journal of Economics and Financial
Issues" 6(4), 2016, pp. 1650-1656.
[58] Smith, D. J., Chen, J. G., & Anderson, H. D. "The influence of firm financial position
and industry characteristics on capital structure adjustment." Accounting andFinance.
55(4), 2015, pp. 1135–1169.
[59] Soekarno, Subiakto., Kitri, Mandra Lazuardi., Utomo, Suryo. "Capital structure
determinants and the speedof adjustment towards capital structure target:evidence from
Indonesian state-owned enterprises."International Journal of Monetary Economics and
Finance, Inderscience Enterprises Ltd, vol. 9(4), 2015 pp. 388-400.
[60] Thippayana, P. "Determinants of Capital Structure in Thailand."Procedia -Social and
Behavioral Sciences 143, 2014, pp. 1074 – 1077.
[61] Titman, S., & Wessels, R. "The determinants of capital structure choice."Journal of
Finance, 43, 1988, pp. 1−19.
[62] Qureshi, Muhammad Azeem., Akhtar, Waqas., Imdadullah, Muhammad. "Does
Diversification Affect Capital Structure and Profitability in Pakistan?"Asian Social
Science Vol. 8, No. 4, April 2012.
[63] Viviani, J. (2008), ―Capital structure determinants: an empirical study of French
companies in the wine industry.‖ International Journal of Wine Business Research,Vol.
20 No. 2, 2008, pp. 171-194.
[64] Wiwattanakantang, Y. An empirical study on the determinants of the capital structure
of Thai firms. Pacific-Basin Finance Journal, 7, 1999, pp. 371–403.
Copyright © 2022 FDOKUMEN