Differences of Cultural Capital among Students in Transition to University. Some First Survey...
23
DIFFERENCES OF CULTURAL CAPITAL AMONG STUDENTS IN TRANSITION TO UNIVERSITY SOME FIRST SURVEY EVIDENCES Marco Pitzalis Isabella Sulis Mariano Porcu WORKING PAPERS 2008/05 CONTRIBUTI DI RICERCA CRENOS CUEC
-
Upload
independent -
Category
Documents
-
view
1 -
download
0
Transcript of Differences of Cultural Capital among Students in Transition to University. Some First Survey...

DIFFERENCES OF CULTURAL CAPITAL AMONG STUDENTS IN TRANSITION TO UNIVERSITY
SOME FIRST SURVEY EVIDENCES
Marco Pitzalis
Isabella Sulis
Mariano Porcu
WORKING PAPERS
2 0 0 8 / 0 5
C O N T R I B U T I D I R I C E R C A C R E N O S
CUEC
C E N T R O R I C E R C H E E C O N O M I C H E N O R D S U D
( C R E N O S ) U N I V E R S I T À D I C A G L I A R I U N I V E R S I T À D I S A S S A R I
I l C R E N o S è u n c e n t r o d i r i c e r c a i s t i t u i t o n e l 1 9 9 3 c h e f a c a p o a l l e U n i v e r s i t à d i C a g l i a r i e S a s s a r i e d è a t t u a l m e n t e d i r e t t o d a R a f f a e l e P a c i . I l C R E N o S s i p r o p o n e d i c o n t r i b u i r e a m i g l i o r a r e l e c o n o s c e n z e s u l d i v a r i o e c o n o m i c o t r a a r e e i n t e g r a t e e d i f o r n i r e u t i l i i n d i c a z i o n i d i i n t e r v e n t o . P a r t i c o l a r e a t t e n z i o n e è d e d i c a t a a l r u o l o s v o l t o d a l l e i s t i t u z i o n i , d a l p r o g r e s s o t e c n o l o g i c o e d a l l a d i f f u s i o n e d e l l ’ i n n o v a z i o n e n e l p r o c e s s o d i c o n v e r g e n z a o d i v e r g e n z a t r a a r e e e c o n o m i c h e . I l C R E N o S s i p r o p o n e i n o l t r e d i s t u d i a r e l a c o m p a t i b i l i t à f r a t a l i p r o c e s s i e l a s a l v a g u a r d i a d e l l e r i s o r s e a m b i e n t a l i , s i a g l o b a l i s i a l o c a l i . P e r s v o l g e r e l a s u a a t t i v i t à d i r i c e r c a , i l C R E N o S c o l l a b o r a c o n c e n t r i d i r i c e r c a e u n i v e r s i t à n a z i o n a l i e d i n t e r n a z i o n a l i ; è a t t i v o n e l l ’ o r g a n i z z a r e c o n f e r e n z e a d a l t o c o n t e n u t o s c i e n t i f i c o , s e m i n a r i e a l t r e a t t i v i t à d i n a t u r a f o r m a t i v a ; t i e n e a g g i o r n a t e u n a s e r i e d i b a n c h e d a t i e h a u n a s u a c o l l a n a d i p u b b l i c a z i o n i . w w w . c r e n o s . i t i n f o @ c r e n o s . i t
C R E N O S – C A G L I A R I V I A S A N G I O R G I O 1 2 , I - 0 9 1 0 0 C A G L I A R I , I T A L I A
T E L . + 3 9 - 0 7 0 - 6 7 5 6 4 0 6 ; F A X + 3 9 - 0 7 0 - 6 7 5 6 4 0 2
C R E N O S - S A S S A R I V I A T O R R E T O N D A 3 4 , I - 0 7 1 0 0 S A S S A R I , I T A L I A
T E L . + 3 9 - 0 7 9 - 2 0 1 7 3 0 1 ; F A X + 3 9 - 0 7 9 - 2 0 1 7 3 1 2 T i t o l o : D I F F E R E N C E S O F C U L T U R A L C A P I T A L A M O N G S T U D E N T S I N T R A N S I T I O N T O U N I V E R S I T Y S O M E F I R S T S U R V E Y E V I D E N C E S I S B N : 9 7 8 - 8 8 - 8 4 6 7 - 4 4 7 - 0 P r i m a E d i z i o n e : M a r z o 2 0 0 8 © CUEC 2008 V i a I s M i r r i o n i s , 1 0 9 1 2 3 C a g l i a r i T e l . / F a x 0 7 0 2 9 1 2 0 1 w w w . c u e c . i t
Differences of Cultural Capital among studentsin transition to universitySome first survey evidences
Marco Pitzalis, Mariano Porcu, Isabella Sulis‡
Università di Cagliari& CRENoS
March 2008
Abstract
The role played by ‘Cultural Capital’ is crucial in shaping students’ decisions withrespect to the school university transition. This work is based on an ad hoc surveycarried out on a sample of students enrolled in 2006 in the University of Cagliari.The ‘cultural capital’ is a latent variable which students are supposed to possess ata greater or lesser degree. It has been here operationalized in four sub-components:(i) built-up by activities made by students themselves; (ii) built up by activities madeby students’ parents; (iii) transmitted by students’ parents; (iv) built-up by formaleducation experiences. Each sub-component has been evaluated via students’ re-sponses to a battery of items in a questionnaire. Latent Class Analysis has beenadopted in order to provide non arbitrary scaling of some of the sub-componentsand to sort out mutually exclusive classes of students, characterized by a differentintensity of the latent variable. Moreover, Item Response Models have been used toassess the calibration of the questionnaire as an instrument to measure the culturalcapital of the targeted population.
Keywords: cultural capital, students’ transition, university, school, item responsemodels, latent class analysis.JEL Classification: C25, C49
‡Address: Università degli Studi di Cagliari, Dipartimento di Ricerche Economiche eSociali, Viale S. Ignazio 78, 09123 Cagliari. E-mail: {pitzalis,mrporcu,isulis}@unica.it.
1

1 IntroductionThis paper deals with the role played by cultural capital (CC) in shaping students’choices with respect to the transition from high school to university. Its main aim isto propose a way of quantifying the intangible construct CC via a survey question-naire and to spot out differences in the amount of CC owned by clusters of students.This issue has been investigated with an ad hoc survey carried on in 2006 at theUniversity of Cagliari.
According to Pierre Bourdieu’s standpoint (Bourdieu and Passeron, 1970), weassume the CC as a strategic resource that involves the construction of individualhabits linked to a defined position in a relational space. In Bourdieu’s theory, familyplays a strategic role in the conflict for social reproduction: it transmits from onegeneration to another cultural habits and cultural dispositions, skills and resources.Bourdieu focuses on cultural inheritance and the strategic accumulation of culturalcapital as a resource which can be accumulated and translated into other types ofcapitals (firstly, social and symbolic) (Bourdieu, 1994). In Pierre Bourdieu’s theory,the CC has three different forms: embodied, objectified, institutionalized (Bourdieu,1986). We focus on the embodied form of CC which is the product of family so-cialization and cultural activities.
The transition school-university is crucial in determining students’ social lifeand subsequent professional achievement and it remains one of the main topic inves-tigated in the study of social and educational inequalities. The CC – linked to socialorigins – is considered the variable that mainly influences the process of transitionfrom high school to university; it is used as a predictor of educational achievementin different theoretical frames. Hugh Mehan’s phenomenological approach (Mehan,1992) focuses on institutional construction of students destinies (careers), this pro-cess is defined as constitutive action; it explains how the day by day schoolingprocess creates differences among scholars. On the other hand, the rational choiceapproach (Boudon, 1974; Boudon et al., 2001) asserts that actors adopt an utilitar-ian perspective and shows how social origins and family resources affect school anduniversity careers. A key role in school-university placement is played by the fam-ily strategies, the student’s motivation and the social ambitions (Barone, 2006). InPierre Bourdieu’s approach (Bourdieu and Passeron, 1970; Bourdieu, 1989, 1994)– known as the structuralist and constructivist approach – CC plays a strategic roleby interacting with economic and social variables. In spite of the anti-bourdieucriticism (Barone, 2006; Goldthorpe, 2007), the role of CC is not deterministic andthe social agent has strategic perspectives embodied into his social world and cul-
2

ture. Adopting the CC concept as established by Pierre Bourdieu does not excludeto consider the importance of internal variables (like institutional mechanisms inMehan’s perspective) and others factors linked to students’ aptitudes, motivationsand ambitions. Every perspective spots only one side of this research object andserves to complete a complex tableau. We emphasize the role of CC but we assumethat it is the product of a dynamic construction where individuals are engaged intoa process of re-socialization.
In this paper we consider the CC as a product of social construction of familiesand individuals. Families adopt educational strategies linked to their social posi-tion (Laureau, 1987, 2002) and have cultural resources which can be transmittedfrom one generation to another. The issue that arises from this theoretical perspec-tive is that the CC transmitted by the family can be improved by adopting severalstrategies, so that individuals play an active role in such a process. The student tran-sition from high school to university is a critical moment in student trajectory. Theacademic place is the locus where the reproduction social strategies took place.
Hereafter, we will suppose that each individual possesses a basic amount of CC,namely the ‘inherited cultural capital’ (CCIH); it is measured via a proxy variablethat is the highest level of formal education reached by students’ parents. Thisbasic amount of CC can be improved by each person during her daily life (actingas an adolescent and as a young adult). Thus, in our approach, the CC has beenoperationalized in four latent sub-components: (i) the above mentioned ‘inheritedcultural capital’ (CCIH – inherited from students’ parents: i.e., parents’ educationallevel); (ii) the ‘family made cultural capital’ (CCFM – built up by positive actionsmade by students’ families); (iii) the ‘pro-active cultural capital’ (CCPA – built upby the students: self-constructed); (iv) the ‘institutional cultural capital’ (CCFE –built up by the formal education institutions).
2 The SurveyThe population surveyed is formed by students that completed their secondary schoolschemes in 2006 and enrolled at the University of Cagliari for the 2006-07 aca-demic year. A CATI survey was carried out in April-May 2007. The sample sizeis n = 494, that is about 10% of the N = 4880 population. Some descriptive statis-tics concerning the population and the sample are depicted in Table 1; the sampleseems to adequately reproduce the main characteristics of the surveyed population.A special section in the survey questionnaire was devoted to the measurement ofthe latent variable CC which has been operationalized in the already mentioned
3

Table 1: Some descriptive statisticsVariables Sample Population
Sesso (%)F 58.10 62.05M 41.90 37.95
School* (%)Liceo 45.95 46.84Not-Liceo 54.05 53.16
Faculty (%)Economics 10.88 11.87Pharmacy 4.31 4.29Law 12.73 11.79Engineering 16.22 17.90Literature 10.88 9.92Foreign Languages 4.52 5.78Medicine 3.29 4.80Educational Science 6.16 7.77Sciences† 13.76 14.84Political Science 9.65 11.09None‡ 7.60 —
AgeMean 19.88 19.93Median 19.28 19.37SD 2.74 2.75
Final mark§
Mean 79.07 79.23Median 78.00 78.00SD 12.51 14.18∗The Liceo provides a classical education such as the one offered by the old
British Grammar Schools.
†Math, Physics, Biology, Chemistry, Natural Science, Computer Science.
‡The sample column contains 37 people who did not enrol after failing the
admission tests.
§At school graduation (in hundreds of pts.).
4

Table 2: Items and percentage of positive responsesItems % Yes
CCFM
I1 Student’s parents belong to a cultural association 22.9I2 Student has attended non-school music classes 40.9I3 Student has attended non-school foreign language classes 36.7I4 Student’s family has travelled for holidays 72.4I5 Student has visited cultural expositions with parents 10.9I6 Student’s parents have used to buy non-school books as a gift 24.5
CCPA
I7 The student has bought books as a gift 12.9I8 The student has bought non-school books for herself 38.9I9 The student has attended classical music live performances 2.4I10 The student has attended pop music live performances 11.3I11 The student has attended jazz music live performances 1.2I12 The student belongs to a cultural association 22.1
CCFE
I13 The student evaluates as adequate her/his competencies in foreign language 61.5I14 The student evaluates as adequate her/his competencies in computer 50.1I15 The student evaluates as adequate her/his competencies in maths 42.5I16 The student evaluates as adequate her/his competencies in literature 88.8I17 The student evaluates as adequate the overall competencies 57.9I18 The student never failed final year examinations at school 56.7
four sub-components: CCIH , CCFM CCPA and CCFE . The CCIH was measured byconsidering the number of compulsory years necessary to reach the level of formaleducation possessed by one of student’ parents (the one who reached the highestlevel in the couple). This measure has been relativized setting equal to 21 the num-ber of years of formal education that are necessary, on average, to reach the highestlevel of formal education (the PhD). Thus, the variable CCIH signals the CC inher-ited by each student as a quote of the maximum. Six binary items were used toscale each of the three sub-components: the CCFM, the CCPA and the CCFE sub-components. Table 2 shows for each of the 18 items the percentage of positiveanswers. For the first two sub-components, we consider the answer to each of the12 items to be positive only if the student asserts to make the activity frequently.
5

3 Scaling the Cultural Capital via LCAThe intangible construct CC, in this paper operationalized into the before mentionedfour sub-components (CCIH , CCFM, CCFE , CCPA), is a latent variable whose amountis differently cumulated by each student during her lifetime. The CCFE is measuredby asking the students to self assess their competencies on several topics (I13− I17)plus a variable that informs on students’ performances at school (I18). As abovedescribed, the CCIH sub-component is measured by a proxy variable (the years offormal education of students’ parents) that is quantified in a direct way. On thecontrary, the CCFE and the CCPA sub-components share a common feature: they aremeasured by actions made by the students or by their families. For that reason wefocus our attention only on these sub-components to propose a way to scale them.
A Latent Class Analysis (LCA) is applied in order to sort out mutually exclu-sive classes of students (latent classes) who are supposed to take different valuesof the latent variable (Linzer Drew and Jeffrey Lewis, 2007; Barholomew et al.,2002; Agresti, 2002) in the two sub-components CCPA and CCFM. Cases (students)are classified into clusters based upon membership probabilities (posterior proba-bilities) estimated directly from the response pattern given to the items of the ques-tionnaire. Each latent class (LC) groups students who share the same level of CC(with respect to the specific dimension defined by the set of items). The assumptionof a basic latent class model is that responses of individual j to a set of indicatorvariables YYY jjj = (Yj1, . . . ,YjI) are independent conditionally upon the latent classesq = 1, . . . ,Q of the categorical latent variable θ . Thus, by indicating with γ theoverall latent class membership probabilities, with ρ the item-response probabili-ties conditional on the latent class membership, the contribution of individual j toto the likelihood is:
P(YYY j = yyy) =Q
∑θ=1
γθ ΠIi=1ρi|θ . (1)
The LCA has been estimated using the poLCA package implemented in R by LinzerDrew and Jeffrey Lewis (2007). Table 3 shows the LCA fit measures for the 2, 3,and 4 LCA models. The analysis was carried out separately for each sub-component– CCFA and CCPA –. The 3 class model was retained for both sub-components.Moving from the item response probability conditional upon the LC membershipsthe profile of each LC was drawn and LCs was next ordered according to the degreeof CC owned by their members (moving from the ‘lowest’ to the ‘highest’ amountowned of CC). The criteria adopted for sorting classes is based on the probability ofpositive answers returned by the model: values of ρi|θ was used to sort the LCs and
6

to differentiate units in the three classes. Moreover, for ranking, we have taken intoaccount the rate of positive answers reported in Table 2. According to the criteriaused to sort categories, the relation C1 < C2 < C3 holds on both sub-components.
Focusing on CCFM sub-component, we note that students belonging to C1 havethe lowest probabilities to answer positively to all the items: thus, students in C1are classified at the bottom of the LC ranking. The same criteria has been used toorder C2 < C3. Looking at the rate of positive answers (Table 2) item I5 seems tobe the activity that requires students the highest level of CCFM in order to be ful-filled. It is followed by I1, I6, I3, I2 and I4, which have percentages equal to 22.9%,24.5%, 36.7%, 40.9% and 72.4%, respectively. It is interesting to highlight that thethree items with the lowest rates of positive responses are those that require a directinvolvement of students’ parents in the actions in order to be fulfilled. Studentsclustered in C2 show a higher probability than students clustered in C3 to answerpositively only to items I1 and I2. In the remaining four items, students classified inC3 show higher probability of returning positive answers; consequently we decidedto rank C2 < C3. Furthermore, in our model framework, students clustered in C3seems to be the only who possess an amount of CCFM that is sufficient to answerpositively to item I5 (10.9% of positive answers).
Looking at the second component (CCPA), the ranking of the items according tothe rate of positive answers is: I11, I9, I10, I7, I12, I8. Students who are classifiedin C1 have the lowest probability to score positively on items I7, I8, I9, I12. In theremaining two items (I10, I11) differences in the probabilities to get a positive answerare not relevant (I9 = 0.09 vs I9 = 0.08; I10 = 0.03 vs I10 = 0.00). Furthermore,students in C1 exhibit a probability to score positively close to 0 in four items out ofsix. Students in C3 show the highest probabilities to score positively in four itemsout of six (I7, I9, I10, I11). Thus it seems straightforward to order C1 < C2 < C3.
Predicted class membership (CM) vectors are (0.47,0.42,0.11) for the first sub-component and (0.60,0.38,0.02) for the second one. With respect to CCFM, the47% of the sample units is classified in the lowest class (C1); whereas with respectto CCPA the percentage of units in C1 is almost 60%. On the basis of the CCFM,the first class (C1) identifies ‘low intensity actions’ of CC, the second (C2) ‘mod-erate intensity actions’ and the third ‘high intensity actions’ (C3). On the secondcomponent, students can be classified as ‘no active’ (C1), ‘slightly active’ (C2) and‘ moderately active’(C3). From this classification arises that the second componentis strongly biased towards negative categories.
Table 4 shows the cross classification of students according to the levels of thetwo sub-components. Nine profiles of students arise from the table: among the 233
7

Table3:
LCA
mod
elresults:
CC
FM,C
CPA
Com
p.C
CF
MC
CPA
FitMeasures:
2,3,4classmod
el4C
LA:
AIC
(4):
3241
,BIC
(4):
3354
,G2 (4):18
AIC
(4):
1991
,BIC
(4):
2104
,G2 (4):20
3CLA
:AIC
(3):
3234
,BIC
(3):
3318
,G2 (3):24
AIC
(3):
1980
,BIC
(3):
2065
,G2 (3):24
2CLA
:AIC
(2):
3243
,BIC
(2):
3298
,G2 (2):48
AIC
(2):
1992
,BIC
(2):
2047
,G2 (2):49
3classmod
elρ:
Item
respon
seprob
ability
cond
itiona
lonlatent
classmem
bership
Latent
Pr(
Y i=
Yes)
Pr(
Y i=
Yes)
classes
γ̂∗ θI 1
I 2I 3
I 4I 5
I 6γ̂∗ θ
I 7I 8
I 9I 1
0I 1
1I 1
2C
147
%0.06
0.12
0.21
0.50
0.00
0.14
60%
0.00
0.00
0.01
0.09
0.03
0.17
C2
42%
0.35
0.65
0.45
0.81
0.00
0.21
38%
0.30
0.95
0.03
0.08
0.00
0.29
C3
11%
0.32
0.49
0.51
1.00
0.62
0.56
2%0.44
0.83
0.27
1.00
0.30
0.27
∗predictedclassmem
berships
(bymod
alpo
steriorprob
.)
8

students (47.2% of the sample) who received ‘low intensity action’, just 35.2% is‘slightly active’ whereas 64.4% is in the category of ‘no active’. 30.4% of studentsis cross classified ‘low intensity action’ and ‘no active’. Among the 207 studentswho received ‘moderate intensity actions’, 59.4% is ‘no active’ and less than 1.5%is ‘moderately active’. It is interesting to stress the negative trend of those whoreceived ‘high intensity actions’: 44.4% is classified ‘no active’; 46.3% is ‘slightlyactive’, and just 9.3% is ‘moderate active’.
Table 4: Students according to the level of CCPA and CCFMCCCCCCPA
CCCCCCFM
C1 C2 C3 TotalCounts
C1 150 82 1 222333333C2 123 81 3 222000777C3 24 25 5 555444Total 222999777 111888888 999 494
%C1 30.36 16.60 0.20 444777...111666C2 24.90 16.40 0.61 444111...999111C3 4.86 5.06 1.01 111000...999333Total 666000...111222 333888...000666 111...888222 111000000...000000
% for columnsC1 50.51 43.62 11.11 –C2 41.41 43.09 33.33 –C3 8.08 13.30 55.56 –Total 111000000...000000 111000000...000000 111000000...000000
% for rowsC1 64.38 35.19 0.43 111000000...000000C2 59.42 39.13 1.45 111000000...000000C3 44.44 46.30 9.26 111000000...000000Total – – –
Further evidence on the process of transmission and cumulation of the CC arisefrom the amount of CCIH possessed by individuals belonging to the different LCs:
9

Table 5: Mean value of CCIH conditional upon class membershipclasses CCFM CCPA
mean sd mean sdC1 0.52 (0.16) 0.58 (0.17)C2 0.60 (0.18) 0.57 (0.18)C3 0.72 (0.18) 0.69 (0.21)
as Table 5 shows units belonging to C3 have in average value of CCIH higher thanunits in C1 and C2, whereas with respect to the CCPA sub-component, no significantdifferences in mean values arise between C1 and C2.
The first result that arises from this first analysis is that the level of cultural cap-ital is measured on the basis of actions made by students or by their families whichare not calibrated with respect to the intensity of CC owned by the population ofstudents surveyed. Furthermore, results could suggest that the rule chosen in orderto classify a student response in the ‘positive’ category (i.e., the actions describedin the item had to be made frequently) seems to be too restrictive with respect tothe overall level of CC observed in the sample. This consideration holds for bothsub-components: only one item out of twelve has a rate of positive answers greaterthan 50%. Furthermore, on the second sub-component, the ‘difficulty’ of the actiondescribed in the items is even more strong: none of the items reaches the thresholdof 50%; the highest percentage of positive answers observed is 38.9% and two itemsshow extremely low rates of positive scores (under 3%).
4 Assessing the difficulty level of the survey question-naire
In this section we use some tools provided by the Item Response Theory (IRT) inorder to get a relative measure of the difficulty level of the survey questionnaire.An item in the questionnaire is considered relatively difficult in respect to anotherif it requires a higher level of CC in order to be positively answered. The IRTapproach assumes the two sub-components of the CC (CCFM and CCPA) to be latentcontinuum variables. The aim is to use the tool to better understand the resultsobtained in the LCA.
IRT is a probabilistic framework for the development of scales stemming from
10
the psychometrics field. It deals with the whole response pattern of a set of itemsconstituting a questionnaire (test). The characteristics of the items composing thequestionnaire (item parameters) plays in this approach a central role in the phase ofestimation of the subject’s intensity of an attribute (subject parameter)(Baker andKim, 2004; De Boeck and Wilson, 2004). Basically, this family of models assumesthat the chance to score positively to an item depends on two parameters relatedto that item (in psychometric literature such parameters are called ‘difficulty’ and‘discrimination’) and on a subject parameter (‘ability parameter’). Higher levelsof the attribute (the latent variable) imply an increase in the probability that thesubject will response positively to each item (Rasch, 1960; Birnbaum, 1968; Fisherand Molenaar, 1995).
By adopting this approach it has been made possible to sort out a ranking ofthe items according to the intensity of the attribute CC, namely CCxy. Moreover,the item parameters help us to shed some light on further choices in order to ‘cal-ibrate’ the questionnaire for future surveys on the topic. In order to jointly mea-sure both the sub-components CCPA and CCFM two person parameters have beenconsidered θθθ j(θ1 j,θ2 j); one for each latent sub-component measured by the items(Rasch, 1960; Adams et al., 1997; Rijmen and Briggs, 2004). Thus, a between-itemtwo-dimensional model (Adams et al., 1997; Rijmen and Briggs, 2004) has beenspecified where each item taps just on a sub-component (Table 2). The model spec-ifies the probability that unit j answers positively to an item i as function of an itemparameter (βi) and two person parameters (θθθ j)
logit(πi j) = βi +2
∑r=1
λirθ jr. (2)
The βi is the difficulty of the item, whereas λi is called the discrimination parameter.In the framework of the quantification of the CC the lower is βi, the higher is theintensity of the CC measured by the aspect i and the higher is the minimum level ofCC required to students in order to answer positively. The distribution of the twolatent sub-components is assumed to be bivariate normal [N (µ ,Σ)]. The indicatorvector ΛΛΛi (λi1,λi2) specifies on which dimension item i loads. In this framework,we made the assumption that items have the same power to discriminate betweensubjects with different levels of ability by fixing loadings equal to one on each sub-component. This assumption was made considering the strong unreliability of theresults obtained leaving the factor loadings free to vary and by considering thatthe aim of this IRT analysis is just to further investigate the relationships alreadyhighlighted by LCA. Each θ jr measures the intensity of the latent construct (CCPA
11
or CCFM) in subject j. According to the model the higher is βi the easier is thequestion (i.e. the lower is the intensity of CC measured by a question). The higheris θ jr in student j, the higher is the probability that student j answers positivelyto items which tap on dimension r. The model was estimated using the packagegllamm from STATA (Rabe-Hesketh et al., 2004).
Looking at the sub-component CFM (Table 6) the item parameters of I2 (β2 =−0.43) and I3 (β3 = −0.64) highlight that both are relatively easier than the re-maining four items. The item parameter of the most difficult item is equal to -2.34(I5). Looking at the second component, the two easiest items (I8 and I12) have itemparameters equal to −0.57 and −1.57; the most difficult items are I9 and I11 whichhave item parameters equal to −4.29 and −5.02. The difficulty of the selecteditems to measure the sub-component CCPA in respect of the items used to measurethe CCFM is well summarized by the values of the item parameters.
Results depicted in Table 6 show a high degree of positive correlation amongthe two latent traits (0.73). The main results single out by the model is that thestructure of the test appears to be ‘too difficult’ with respect to the average level ofthe cultural capital owned by students surveyed. Specifically, excluding item I3, allitem parameters have a negative sign and the highest odd to get a positive answeris 0.65. On the second sub-component the test appears to be even more difficult tocope with: four items upon six have odds equal or lower than 0.10 (i.e. item I7, I9,I11). The posterior means of person parameters and the 95% confidence intervalsare depicted in Figure 1.
The posterior means – empirical Bayes predictions (Skrondal and Rabe-Hesketh,2004) – of the person parameters for the CCFM have for the 90% of the sample(discarding the first and the last 5%) a range of variation between −1.13 and 1.14and their standard deviations show a high level of uncertainty [min0.59,max0.71].For the CCPA the range of variation for the 90% of the sample is even broader[−1.25;1.50] with higher standard deviations [min0.72,max0.92].
The overlap of the confidence intervals around both person parameters (Figure1) suggests that differences among students would be better highlighted by cluster-ing students in classes as it has been done by the LCA above described; moreover,the large values of the standard deviations indicate the uncertain location of the stu-dents on the latent variable (Bartholomew, 1998). The distribution of the posteriormeans of students person parameters on the two sub-components conditional uponthe class-membership is depicted in Figure 2. The bunching of the sample in threeclusters obtained with LCA seems to be adequate.
The IRT model leads also to a satisfactory description of the difficulty of the
12

Table6:
Between-item
two-dimension
alitem
respon
semod
elitem
parameters
Coef.
dim1(odd
s)Coef.
dim2(odd
s)Std.
Err.
zp-value
I 1-1.41(0.24)
.12
-11.33
0.00
I 2-.4
3(0.65)
.10
-4.01
0.00
I 3-.6
4(0.53)
.10
-5.84
0.00
I 41.12
(3.06)
.11
9.54
0.00
I 5-2.39(0.09)
.16
-14.78
0.00
I 6-1.30(0.27)
.12
-10.72
0.00
I 7-2.33(0.10)
.16
-13.78
0.00
I 8-0.57(0.56)
.11
-4.87
0.00
I 9-4.29(0.01)
.32
-13.36
0.00
I 10
-2.51(0.08)
.17
-14.11
0.00
I 11
-5.02(0.01)
.43
-11.58
0.00
I 12
-1.57(0.21)
.14
-11.22
0.00
rand
omeff
ects
var(
θ 1):
0.82
(SE:.1
4)var(
θ 2):
1.33
(SE:.27
)cov(
θ 1,θ
2):0.75
(SE:.1
2)co
r(θ 1
,θ2)
0.72
13
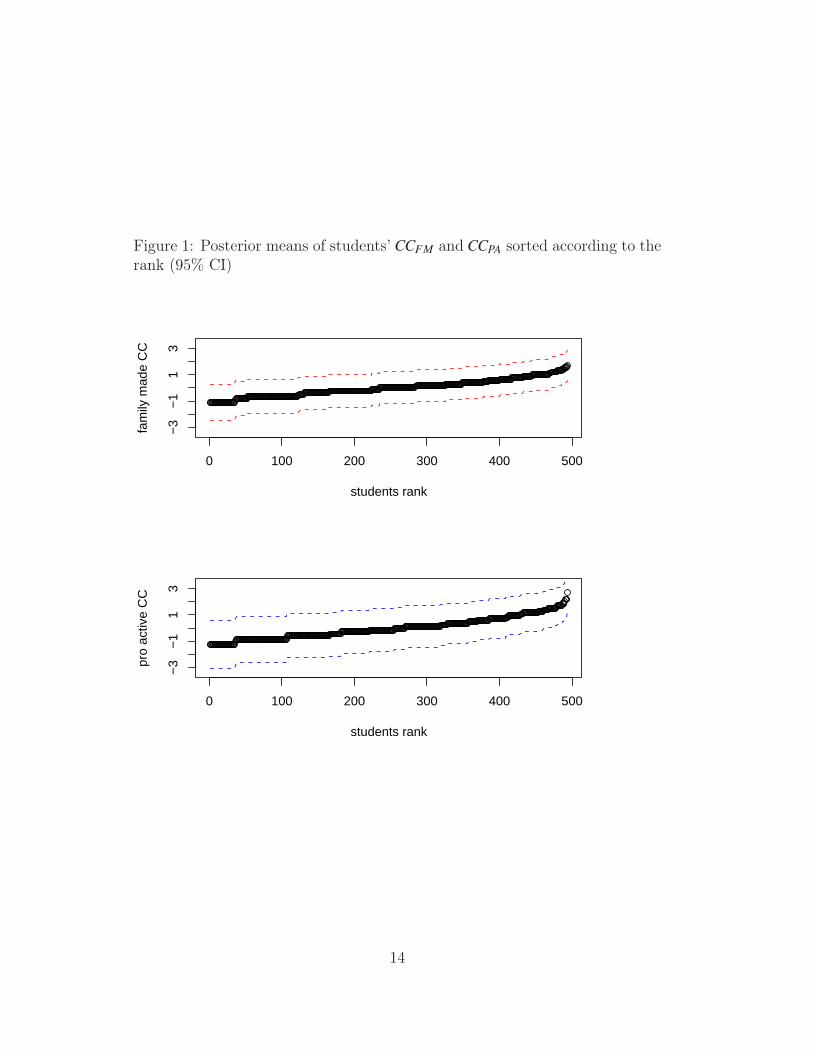
Figure 1: Posterior means of students’ CCFM and CCPA sorted according to therank (95% CI)
0 100 200 300 400 500
−3
−1
13
students rank
fam
ily m
ade
CC
0 100 200 300 400 500
−3
−1
13
students rank
pro
activ
e C
C
14

Figure 2: Box plot of posterior means of students CCFM and CCPA accordingto CCFM and CCPA class membership
C1 C2 C3
−1.
0−
0.5
0.0
0.5
1.0
1.5
CCFM
post
erio
r m
eans
C1 C2 C3
−1
01
2
CCPA
post
erio
r m
eans
15

items of the questionnaire to measure the CC. It shows also a classification ofstudents and items which are consistent with the results obtained using LCA: themost difficult items are those which are scored positively just by students belongingto LC C3, whereas the probability to answer positively to items (relatively) easydoes not show significant differences among the three categories.
5 Some final remarksThe attention of this research has been focused on the analysis of the dimensionalityof the items composing the sections of questionnaire addressed to measure the twosub-components of the latent variable CC, namely CCFM and CCPA and on theirrelative effectiveness in highlighting differences in the amount of CC owned bystudents. For each sub-component the LCA was used in order to classify studentsin three mutually exclusive classes characterized by different intensity of the amountpossessed of the latent variables. The between-item two dimensional model (IRT)adopted in order to validate the results of the LCA provides a relative evaluationof the difficulty of the questions relaying on responses provides on both the sub-components. The values of the item parameters obtained represents a helpful systemof weights to calibrate the questionnaire in subsequent researches.
Further analysis are still in progress in order to assess the relationships amongthe three sub-components of students’ CC and some other relevant aspects. Namely,
a. Students’ characteristics: demographic details, school careers, socioeconomicbackground.
b. The influence of several factors on students’ educational decisions.
c. Students’ strategies in selection of the degree programs.
Furthermore, the next step aims to quantify the sub-component CCFE via LCA, andto validate the results using a between-item three dimensional model to keep simul-taneously into account the overall structure of the three sets of indicators items.
16
ReferencesAdams, R., Wilson, M., and Wu, M. (1997). Multilevel item response models: An
approach to errors in variables regression. Journal of Educational and BehavioralStatistiscs, 22, 47–76.
Agresti, A. (2002). Categorical Data Analysis. Wiley-Intersciencie, Hoboken, NewJersey.
Baker, F. B. and Kim, S. H. (2004). Item Response Theory: Parameter EstimationTecniques. Dekker.
Barholomew, D., Steele, F., and I. Moustaki, J. G. (2002). The Analysis and Inter-pretation of Multivariate Analysis for Social Scientists. Chapman & All.
Barone, C. (2006). Cultural Capital, Ambition and the Explanation of Inequalitiesin Learning Outcomes: A Comparative Analysis. Sociology, 40, 1039–1058.
Bartholomew, D. J. (1998). Scaling unobservable constructs in social science. Ap-plied Statistics, 47, 1–13.
Birnbaum, A. (1968). In F. Lord and M. N. (Eds), editors, Statistical Theories ofMental Test Scores, chapter Some latent trait models and their use in inferring anexaminee’s ability, pages 394–479. Reading, MA: Addison-Wesley.
Boudon, R. (1974). Educatio, Opportunity and Social Inequality. Wiley, New York.
Boudon, R., Bulle, N., and Cherkaoui, M. (2001). Ecole et Société. Les paradoxesde la démocratie. PUF, Paris.
Bourdieu, P. (1986). The Forms of Capital. In J. Richardson, editor, Handbookof Theory and Research for the Sociology of Education. Greenwood Press, NewYork.
Bourdieu, P. (1989). Noblesse d’Etat, Grandes Ecoles et Esprit de Corps. Editionsde Minuit, Paris.
Bourdieu, P. (1994). Raisons pratiques. Sur la theorie de l’action. Edition du Seuil,Paris.
Bourdieu, P. and Passeron, J. (1970). La Reprodution. Editions de Minuit, Paris.
17

De Boeck, P. and Wilson, M. (2004). Item Response Models: a Generalized Linearand non Linear Approach. New York: Springer.
Fisher, G. H. and Molenaar, I. W. (1995). Rasch Models, Foundations, RecentDevelopments, and Applications. Springer-Verlag.
Goldthorpe, J. (2007). Cultural Capital. Some Critical Observations. Sociologica,il Mulino, 2, 1–23.
Laureau, L. (1987). Social Class Differences in Family-School Relationships: TheImportance of Cultural Capital. Sociology of Education, 60, 73–85.
Laureau, L. (2002). Invisible Inequality: Social Class and Childbearing in BlackFamilies and White Families. American Sociological Review, 67, 747–776.
Linzer Drew, A. and Jeffrey Lewis (2007). Polytomous Variable Latent Class Anal-ysis. R package version 1.1.
Mehan, H. (1992). Understanding Inequalities in Schools: The Contribution ofInterpretative Studies. Sociology of Education, 65(1), 1–20.
Rabe-Hesketh, S., Skrondal, A., and Pickles, A. (2004). Gllamm manual. U. C.Berkeley Devision of Biostatistics Working Paper Series, 160.
Rasch, G. (1960). Probabilistic models for some intelligence and attainment tests.Chicago: MESA PRESS.
Rijmen, F. and Briggs, D. (2004). Explanatory Item Response Models, chapterMultiple person dimensions and latent item predictors, pages 111–166. Springer.
Skrondal, A. and Rabe-Hesketh, S. (2004). Generalized Latent Variables Modeling.Chapman and Hall.
18

Ultimi Contributi di Ricerca CRENoS
I Paper sono disponibili in: http://www.crenos.it
08/04 I sab e l la Sul i s , Mar iano Por cu , “Assess ing the Effect iveness of a Stochast ic Regress ion Imputat ion Method for Ordered Categor ica l Data”
08/03 Manue l e B i c e go , Enr i c o Gro s s o , Edoardo Ot rant o , “Recogniz ing and Forecast ing the S ign of Financ ia l Loca l Trends Using Hidden Markov Models”
08/02 Juan de Dios Tena , Edoardo Ot rant o , “A Rea l i s t ic Model for Off ic ia l Interest Rates Movements and the ir Consequences”
08/01 Edoardo Ot ran to , “Cluster ing Heteroskedast ic T ime Ser ies by Model-Based Procedures”
07/16 Serg i o Lodde , “Spec ia l iza t ion and Concentrat ion of the Manufactur ing Industry in the I ta l ian Loca l Labor Systems”
07/15 Giovann i Sul i s , “Gender Wage Different ia l s in I ta ly : a Structura l Est imat ion Approach”
07/14 Fabr iz io Adr ian i , Luca G. De idda , S i l v ia Sonde r e g g e r , “Over-S igna l ing Vs Underpr ic ing : the Role of F inanc ia l Intermediar ies In In i t ia l Publ ic Offer ings”
07/13 Giovann i Sul i s , “What Can Monopsony Expla in of the Gender Wage Different ia l In I ta ly?”
07/12 Gerardo Mar l e t t o , “Cross ing the Alps : Three Transport Pol icy Opt ions”
07/11 Serg i o Lodde “Human Capi ta l And Product iv i ty Growth in the Ita l i an Regiona l Economies : a Sectora l Analys i s”
07/10 Axel Gaut i e r , Dimi t r i Pao l in i , “Delegat ion, Externa l i t ies and Organizat iona l Des ign”
07/09 Rina ldo Brau, Antone l l o E. S co r cu , Laura Vi c i , “Assess ing v i s i tor sat i sfact ion with tour ism re juvenat ion pol ic ies : the case of Rimini , I ta ly”
07/08 Dimit r i Pao l in i , “Search and the f i rm’s choice of the opt imal labor contract”
07/07 Giacomo Carbon i , “Shape of U.S. bus iness cyc le and long-run effects of recess ions”
07/06 Grego ry Co l co s , Mass imo De l Gat t o , Gio rdano Mion and Gianmar co I .P . Ot tav iano , “Product iv i ty and f i rm se lect ion: intra-vs internat iona l t rade”
07/05 Si l v ia Ba l ia , “Report ing expected longevi ty and smoking: ev idence from the share”
07/04 Raf fa e l e Pac i , S t e fano Usa i , “Knowledge f lows across European reg ions”
07/03 Mass imo De l Gat t o , Giordano Mion and Gianmarco I.P. Ottaviano, “Trade Integration, firm selection and the costs of non-europe”
07/02 Vit t o r i o Pe l l i g ra , “Intentions, trust and frames: a note on sociality and the theory of games”
07/01 Oliv i e ro A. Carbon i and Gius eppe Medda , “Government size and the composition of public spending in a neoclassical growth model”
06/17 Susana I ranzo , Fab iano Sch i va rd i and El i sa Tos e t t i , “Skill dispersion and firm productivity: an analysis with employer-employee matched data”
06/16 Luig i Guis o and Fab iano S ch i va rd i , “What determines entrepreneurial clusters?”
06/15 Vit to r i o Pe l l i g ra , “Trust Responsiveness: on the dynamics of fiduciary interactions”

Finito di stampare nel mese di Marzo 2008 Presso Editoria&Stampa
Zona Industriale Predda Niedda str. n. 10 07100 Sassari

www.crenos.it