Accelerating Bus Electrification: Enabling a sustainable ...
Renewable and Sustainable Energy Reviews 14 (2010) 1229–1240
Rural electrification and energy poverty: Empirical evidences from Brazil
Marcio Giannini Pereira a,*, Marcos Aurelio Vasconcelos Freitas a,b, Neilton Fidelis da Silva a,b
a Energy Planning Program (PPE), Coordination of Post-Graduation Programs in Engineering of the Federal University of Rio de Janeiro (COPPE/UFRJ), Brazil., Cidade Universitaria,
Ilha do Fundao, Bloco C, Sala C-211, Postal Code: 68565, CEP 21945-970, Rio de Janeiro, Brazilb International Virtual Institute of Global Change- IVIG, Centro de Tecnologia Bloco I - Sala 129, C.P. 68501 Cidade Universitaria, CEP 21945-970, Rio de Janeiro, Brazil
Contents
1. Introduction . . . . . . . . . . . . . . . . . . . . . . . . . . . . . . . . . . . . . . . . . . . . . . . . . . . . . . . . . . . . . . . . . . . . . . . . . . . . . . . . . . . . . . . . . . . . . . . . . . . . 1229
2. International and Brazilian context. . . . . . . . . . . . . . . . . . . . . . . . . . . . . . . . . . . . . . . . . . . . . . . . . . . . . . . . . . . . . . . . . . . . . . . . . . . . . . . . . . 1230
2.1. Rural electrification and reform worldwide. . . . . . . . . . . . . . . . . . . . . . . . . . . . . . . . . . . . . . . . . . . . . . . . . . . . . . . . . . . . . . . . . . . . . . 1230
2.2. Rural electrification and reform in Brazil . . . . . . . . . . . . . . . . . . . . . . . . . . . . . . . . . . . . . . . . . . . . . . . . . . . . . . . . . . . . . . . . . . . . . . . 1232
3. Use of alternative technologies in rural electrification . . . . . . . . . . . . . . . . . . . . . . . . . . . . . . . . . . . . . . . . . . . . . . . . . . . . . . . . . . . . . . . . . . 1233
4. Methodological aspects and fieldwork . . . . . . . . . . . . . . . . . . . . . . . . . . . . . . . . . . . . . . . . . . . . . . . . . . . . . . . . . . . . . . . . . . . . . . . . . . . . . . . 1234
5. Energy poverty study. . . . . . . . . . . . . . . . . . . . . . . . . . . . . . . . . . . . . . . . . . . . . . . . . . . . . . . . . . . . . . . . . . . . . . . . . . . . . . . . . . . . . . . . . . . . . 1236
6. Conclusion . . . . . . . . . . . . . . . . . . . . . . . . . . . . . . . . . . . . . . . . . . . . . . . . . . . . . . . . . . . . . . . . . . . . . . . . . . . . . . . . . . . . . . . . . . . . . . . . . . . . . 1238
References . . . . . . . . . . . . . . . . . . . . . . . . . . . . . . . . . . . . . . . . . . . . . . . . . . . . . . . . . . . . . . . . . . . . . . . . . . . . . . . . . . . . . . . . . . . . . . . . . . . . . 1239
A R T I C L E I N F O
Article history:
Received 21 October 2009
Received in revised form 23 October 2009
Accepted 8 December 2009
Keywords:
Rural electrification
Energy poverty
Electric reform sector
Public policy
Brazil
A B S T R A C T
The aim of this article is to evaluate the impact of rural electrification on the reduction of energy poverty
in Brazil through the analysis of 23,000 rural domiciles or rural properties between the years 2000 and
2004. The results indicate a fast change in the profile of energy consumption and a reduction of energy
poverty. This new approach works as a complement, among other variables, to analyze and quantify the
real economic, social and energy impacts in rural electrification programs, generally applied in
developing countries.
� 2009 Elsevier Ltd. All rights reserved.
Contents lists available at ScienceDirect
Renewable and Sustainable Energy Reviews
journa l homepage: www.e lsev ier .com/ locate / rser
1 According to Scheikman [2], Brazil is not a poor country, but indeed a rich one
with extremely unequal distribution of income. Its inequality is essentially stable
1. Introduction
The absence of commercially supplied energy in a society,especially electricity, tends to accentuate the existence of socialasymmetry in conditions of living. This can take the form ofincreased poverty, lack of opportunity for development, migratoryflow to large cities and a society’s disbelief regarding its ownfuture. There is a general belief that, with the arrival of electricity,such societies might acquire a higher degree of economicsustainability and a better quality of life.
It is estimated that one-third (1/3) of the world’s population,amounting about 2 billions of people around the world, has noaccess to electric energy. Half of this population lives on the Africancontinent.
* Corresponding author. Tel.: +55 21 25986137; fax: +55 21 25986482.
E-mail address: [email protected] (M.G. Pereira).
1364-0321/$ – see front matter � 2009 Elsevier Ltd. All rights reserved.
doi:10.1016/j.rser.2009.12.013
One of the paths toward economic sustainability refers to theavailability of access to regular electric energy. Such access is a keyelement for the economic development of the rural environmentand for the reduction of poverty. However, expanded access toelectric energy has shown slow progress worldwide, especially dueto the high costs associated with extending grids and developingdecentralized systems by which offers power.
The public policies whose objective it is to reduce poverty andinequality1 necessarily permeate education and health matters.Both are directly related to the availability of electricity, mainly
throughout time. The income of the 10% richest amounts to roughly 50% of the total
income of families, whereas at the other extreme the 50% poorest barely
appropriate 10% of the total income. This disproportional distribution of income
has occurred for at least 30 years, crossing various institutional, political and
economic cycles.
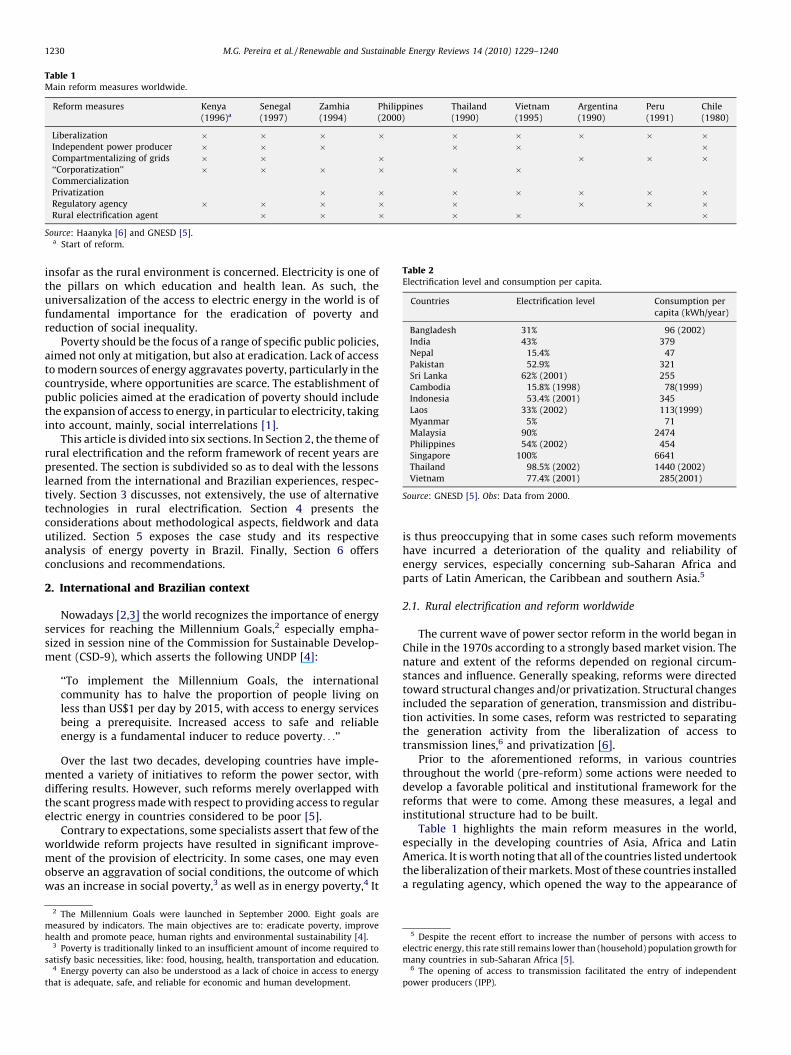
Table 1Main reform measures worldwide.
Reform measures Kenya
(1996)a
Senegal
(1997)
Zamhia
(1994)
Philippines
(2000)
Thailand
(1990)
Vietnam
(1995)
Argentina
(1990)
Peru
(1991)
Chile
(1980)
Liberalization � � � � � � � � �Independent power producer � � � � � �Compartmentalizing of grids � � � � � �‘‘Corporatization’’ � � � � � �Commercialization
Privatization � � � � � � �Regulatory agency � � � � � � � �Rural electrification agent � � � � � �
Source: Haanyka [6] and GNESD [5].a Start of reform.
Table 2Electrification level and consumption per capita.
Countries Electrification level Consumption per
capita (kWh/year)
Bangladesh 31% 96 (2002)
India 43% 379
Nepal 15.4% 47
Pakistan 52.9% 321
Sri Lanka 62% (2001) 255
Cambodia 15.8% (1998) 78(1999)
Indonesia 53.4% (2001) 345
Laos 33% (2002) 113(1999)
Myanmar 5% 71
Malaysia 90% 2474
Philippines 54% (2002) 454
Singapore 100% 6641
Thailand 98.5% (2002) 1440 (2002)
Vietnam 77.4% (2001) 285(2001)
Source: GNESD [5]. Obs: Data from 2000.
M.G. Pereira et al. / Renewable and Sustainable Energy Reviews 14 (2010) 1229–12401230
insofar as the rural environment is concerned. Electricity is one ofthe pillars on which education and health lean. As such, theuniversalization of the access to electric energy in the world is offundamental importance for the eradication of poverty andreduction of social inequality.
Poverty should be the focus of a range of specific public policies,aimed not only at mitigation, but also at eradication. Lack of accessto modern sources of energy aggravates poverty, particularly in thecountryside, where opportunities are scarce. The establishment ofpublic policies aimed at the eradication of poverty should includethe expansion of access to energy, in particular to electricity, takinginto account, mainly, social interrelations [1].
This article is divided into six sections. In Section 2, the theme ofrural electrification and the reform framework of recent years arepresented. The section is subdivided so as to deal with the lessonslearned from the international and Brazilian experiences, respec-tively. Section 3 discusses, not extensively, the use of alternativetechnologies in rural electrification. Section 4 presents theconsiderations about methodological aspects, fieldwork and datautilized. Section 5 exposes the case study and its respectiveanalysis of energy poverty in Brazil. Finally, Section 6 offersconclusions and recommendations.
2. International and Brazilian context
Nowadays [2,3] the world recognizes the importance of energyservices for reaching the Millennium Goals,2 especially empha-sized in session nine of the Commission for Sustainable Develop-ment (CSD-9), which asserts the following UNDP [4]:
‘‘To implement the Millennium Goals, the internationalcommunity has to halve the proportion of people living onless than US$1 per day by 2015, with access to energy servicesbeing a prerequisite. Increased access to safe and reliableenergy is a fundamental inducer to reduce poverty. . .’’
Over the last two decades, developing countries have imple-mented a variety of initiatives to reform the power sector, withdiffering results. However, such reforms merely overlapped withthe scant progress made with respect to providing access to regularelectric energy in countries considered to be poor [5].
Contrary to expectations, some specialists assert that few of theworldwide reform projects have resulted in significant improve-ment of the provision of electricity. In some cases, one may evenobserve an aggravation of social conditions, the outcome of whichwas an increase in social poverty,3 as well as in energy poverty,4 It
2 The Millennium Goals were launched in September 2000. Eight goals are
measured by indicators. The main objectives are to: eradicate poverty, improve
health and promote peace, human rights and environmental sustainability [4].3 Poverty is traditionally linked to an insufficient amount of income required to
satisfy basic necessities, like: food, housing, health, transportation and education.4 Energy poverty can also be understood as a lack of choice in access to energy
that is adequate, safe, and reliable for economic and human development.
is thus preoccupying that in some cases such reform movementshave incurred a deterioration of the quality and reliability ofenergy services, especially concerning sub-Saharan Africa andparts of Latin American, the Caribbean and southern Asia.5
2.1. Rural electrification and reform worldwide
The current wave of power sector reform in the world began inChile in the 1970s according to a strongly based market vision. Thenature and extent of the reforms depended on regional circum-stances and influence. Generally speaking, reforms were directedtoward structural changes and/or privatization. Structural changesincluded the separation of generation, transmission and distribu-tion activities. In some cases, reform was restricted to separatingthe generation activity from the liberalization of access totransmission lines,6 and privatization [6].
Prior to the aforementioned reforms, in various countriesthroughout the world (pre-reform) some actions were needed todevelop a favorable political and institutional framework for thereforms that were to come. Among these measures, a legal andinstitutional structure had to be built.
Table 1 highlights the main reform measures in the world,especially in the developing countries of Asia, Africa and LatinAmerica. It is worth noting that all of the countries listed undertookthe liberalization of their markets. Most of these countries installeda regulating agency, which opened the way to the appearance of
5 Despite the recent effort to increase the number of persons with access to
electric energy, this rate still remains lower than (household) population growth for
many countries in sub-Saharan Africa [5].6 The opening of access to transmission facilitated the entry of independent
power producers (IPP).
Graph 1. Electric energy consumption per capita. Source: International Energy Outlook [7]. Obs: Data from 2002.
Fig. 1. Social conditions and electric energy consumption. Source: Yaeger [8].
Table 3Rate of electrification per region.
Electrification level/regions Urban Rural National
Developing countries 85.6% 51.1% 64.2%
East Asia/China 98.5% 81.00% 86.9%
Latin America 98.00% 52.4% 86.6%
South Asia 68.2% 30.1% 40.8%
Africa 63.1% 16.9% 34.3%
World 91.2% 56.9% 72.8%
Source: GNESD [5]. Obs: Data from 2000.
M.G. Pereira et al. / Renewable and Sustainable Energy Reviews 14 (2010) 1229–1240 1231
the Independent Energy Producer. In some cases, an entity was putin charge of rural electrification.
As already mentioned, the worldwide reforms led to differenti-ated results. Despite the efforts, few of them led to advances inelectrification levels, which still showed extremely low annual percapita electricity consumption (Table 2). This indicates how far thesecountries are from the consumption patterns of the developedcountries. The consumption of electric energy per capita may beconsidered as a reference for well-being (a proxy), which assumesthat the highest consumption per capita is, in fact, the highest thestage of development. As such, countries such as Nepal (47 kWh/year) and Myanmar (71 kWh/year) get a classification of 0.530(2008) and 0.585 (2008) in the Human Development Index,respectively. Such countries are at the threshold of low humandevelopment, as based on the results of the study. For purposes ofillustration, Brazil’s consumption of electric energy is 2400 kWh/year per capita (2008), placing the country at an average position inhuman development, with an index of 0.807 (2008).
Graph 1 highlights the household per capita consumption ofelectric energy per year in some countries. Low consumption ofelectricity can be observed in India (94 kWh/year), on the Africancontinent (153 kWh/year) and in China (181 kWh/year). Bycontrast, high consumption is seen in countries like the USA(4390 kWh/year) and Canada (4737 kWh/year). When consideringthese two extremes, it is useful to emphasize Canada’s consump-tion as being 50 times greater than India’s in the year 2002.According to International Energy Outlook (2005), in 2025 thesame relation will be 18 times greater (India 308 kWh/year andCanada 5670 kWh/year). That is, while the proportion of con-sumption between countries will be lower, consumption willremain highly concentrated in the countries that are nowadaysconsidered to be developed.
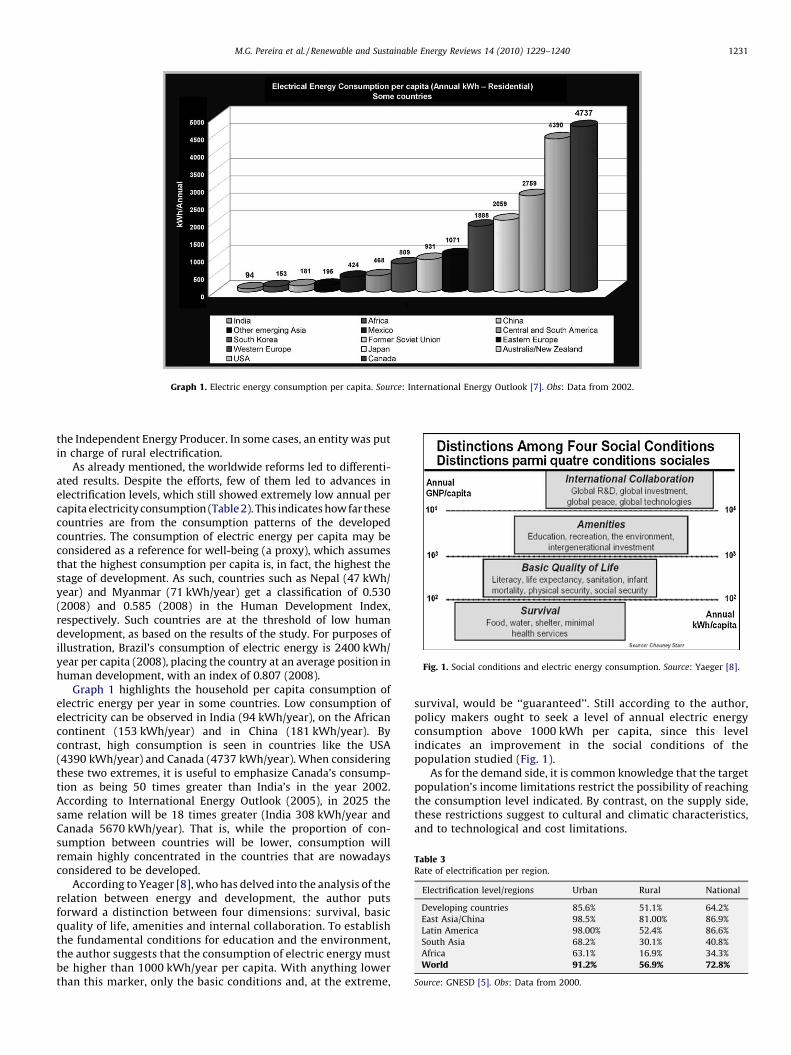
According to Yeager [8], who has delved into the analysis of therelation between energy and development, the author putsforward a distinction between four dimensions: survival, basicquality of life, amenities and internal collaboration. To establishthe fundamental conditions for education and the environment,the author suggests that the consumption of electric energy mustbe higher than 1000 kWh/year per capita. With anything lowerthan this marker, only the basic conditions and, at the extreme,
survival, would be ‘‘guaranteed’’. Still according to the author,policy makers ought to seek a level of annual electric energyconsumption above 1000 kWh per capita, since this levelindicates an improvement in the social conditions of thepopulation studied (Fig. 1).
As for the demand side, it is common knowledge that the targetpopulation’s income limitations restrict the possibility of reachingthe consumption level indicated. By contrast, on the supply side,these restrictions suggest to cultural and climatic characteristics,and to technological and cost limitations.
8 It is a fact that electric energy service is present in most Brazilian households, by
which it is still well ahead of other services such as piped water and fixed
telephones. By contrast, it must be observed how many people still do not have
access to electricity, especially in rural areas, when considering that the offer of a
safe and continuous amount of electric energy is of fundamental importance to
M.G. Pereira et al. / Renewable and Sustainable Energy Reviews 14 (2010) 1229–12401232
Considering again the classification proposed by Kurt Yeager[8],7 and observing the data in Table 2 and Graph 1, it would bepossible to issue a warning on just how far the majority ofcountries listed are with respect to the ‘‘Amenities’’ threshold.Bearing in mind that, generally speaking, the data are aggregatedfor the rural and urban areas, it is possible to assert that the urbanreality insofar as per capita consumption is concerning, it is quitesuperior to the rural average. As such, the latter lies even furtherfrom a level of individual consumption above 1000 kWh/year.
Table 3 emphasizes the electrification rate per region (urbanand rural). One observes how great an effort the African continentneeds to reach universalization of the access to regular electricenergy, especially in rural areas where only 16.9 percent of thepopulation is served. Despite major effort in recent years,considerably leading to penetration of electric energy in Chinaand East Asia, they still needs to endeavor toward universalization,as also does Latin America, especially in rural areas.
According to Albouy and Nadif [9], the reforms performed in theworld have brought to light the impacts more visible andimmediate, such as the increased rates for many users, consideringthe reduction of subsidies built into rates and lower commitmentof the governments in rural electrification programs. On the otherhand, indirect impacts are few studies, such as the best customerservice, the reduction of technical and non-technical losses, andimprovement in government finances. Many of these indirectaspects, regardless of the outcome being positive or negative, thedata are limited for most countries, thus restricting to a broaderassessment
Still Albouy and Nadif [9], in a temporal analysis, it was foundthat in countries, and also in sectors of infrastructure, the sourcesof inefficiency were due to institutional issues, i.e., governmentinterference, regressive subsidies, and in some cases, corruption.
2.2. Rural electrification and reform in Brazil
Prior to the reform process of the Brazilian electricity sector, theconcessionaires were using the resources of state governmentswith scattered programs of rural electrification in areas withhigher population concentrations or even the conjunction offactors of consumers with a greater economic and political powerto claim.
This behavior occurred in the absence of a national policy forrural electrification, opening up space, so that concessionairescould play a stronger business, limiting attendance to those whohave greater economic attractiveness of the investment.
The process of sector restructuring was guided to maximize thevalues of the companies to be privatized, in parallel with thereduction of the obligations of the concessionaires. At that time,little attention was given to the process of expanding service tolow-income population, as well as rural areas.
Privatization and deregulation as a way to reduce the presenceof the State in the economy, have become mandatory in therhetoric of the Brazilian government in the 90s through theseinstruments aimed to introduce greater efficiency in electricsector. In contrast, this movement led to a new regulation and notto deregulation, as well as a renewal of the normative role of theState, but not lowering them.
The creation of the regulatory agency was instrumental in theestablishment of market rules, embedded in a redirection of statefunctions in the first round of reforms (1995–2002). In the second
7 It is interesting to note that in the literature there is still no consensus on the
amount of energy needed to guarantee human survival. This question is extremely
complex, given the diversity of factors affecting the planet’s regions in different
ways, such as: temperature, gender, time length, age, and social customs, among
others.
round of reforms that began in 2003, the expansion planning hasbeen taken, in particular, consider seeking the assistance thecountry’s electricity, considering the supply crisis in the country in2001,8 and encourage investment in the expansion of transmissionlines and in the power plants including renewable energy sources,such as SHP, biomass and wind. The regulatory agency has set thestandards for low-income consumers, with differentiated tariffs.And in parallel, it was established a timetable for universal careuntil 2015, being penalized dealers with up to 10% reducing thetariff revision even those that do not meet the deadlines.
Developing countries have little tradition in investing in R&D ingeneral and in energy R&D in particular. Often R&D efforts areadaptive following externally developed technologies. Totalnational expenditures in R&D in developing countries hardlyrepresent a significant share of their GDPs. In 1994 the average wasabout 0.65% in developing countries and 3% in industrializedcountries. India and Brazil, for example, dedicate a little over 0.5%of their GDP to R&D activities, much less than South Korea andseveral industrialized countries. In per capita terms total BrazilianR&D expenditure in year 2000 were US$ 80.40, more than 10 timessmaller than the US per capita expenditure and 5 times less thanSouth Korea. Nevertheless, several developing countries have overthe years created and supported research institutions with thepurpose of providing technical (and in fewer cases, scientific)assistance to the existing electricity utilities [10].
In the process of privatization of the sector, many companieshave been acquired by multinational groups, in which significantlyreduced investment in research and development. Facing that, itwas established by the Brazilian government that resourcesbetween 0.75% and 1% on net sales of generation concessionaires,transmission and distribution of electric energy, would be used tofund programs and projects in the energy area. The emphasis wason linking the direct expenditure of firms in R&D and the definitionof a comprehensive program to address the long-term challengesin the industry, such as alternative energy sources with lower costsand better quality, waste reduction, energy efficiency, besides ofstimulating the increase of competitiveness of national industrialtechnology.
According to ABRADEE [11], in Brazil the percentage of annualrevenues that is dedicated to R&D varies from 0.5% (distributingutilities) to 1% (transmission and generating utilities). Half of thesevalues are spend by the utilities themselves in internal R&Dprojects; the other half is collected by the CTEnerg fund.Distributing utilities have to invest 0.5% of their annual revenuesin end-use energy efficiency projects. Therefore, end-use efficiencyprogrammes are only implemented by distributing utilities. In1998 about 0.4% of electricity sales was invested in energy R&Dprogrammes, with the approval of Law 9.991/009 and the creationof CTEnerg fund, this percentage in year 2003 raised to 1.1%.
The 1990s were a watershed decade for Brazil’s power sector,which saw deep changes brought to its structure, behavior andperformance. In a reform environment, a regulating entity wascreated, that is, the National Electric Energy Agency (Agencia
Nacional de Energia Eletrica—ANEEL). At the time, ANEEL oversaw aseries of public service concession contracts for the distribution of
bring a movement for rural development in the country.9 In year 2000 the Bill 9.991/00 approved by the Brazilian National Congress
made explicit provisions for a public benefit fund CTEnerg. This Bill allocates part of
the 1% annual utilities revenues for CTEnerg and other part remains with utilities
(generation, transmission and distribution), being spent in efficiency and R&D
programs. Electric utilities remain responsible for the design and implementation of
these programs under the Regulator’s supervision, as previously.
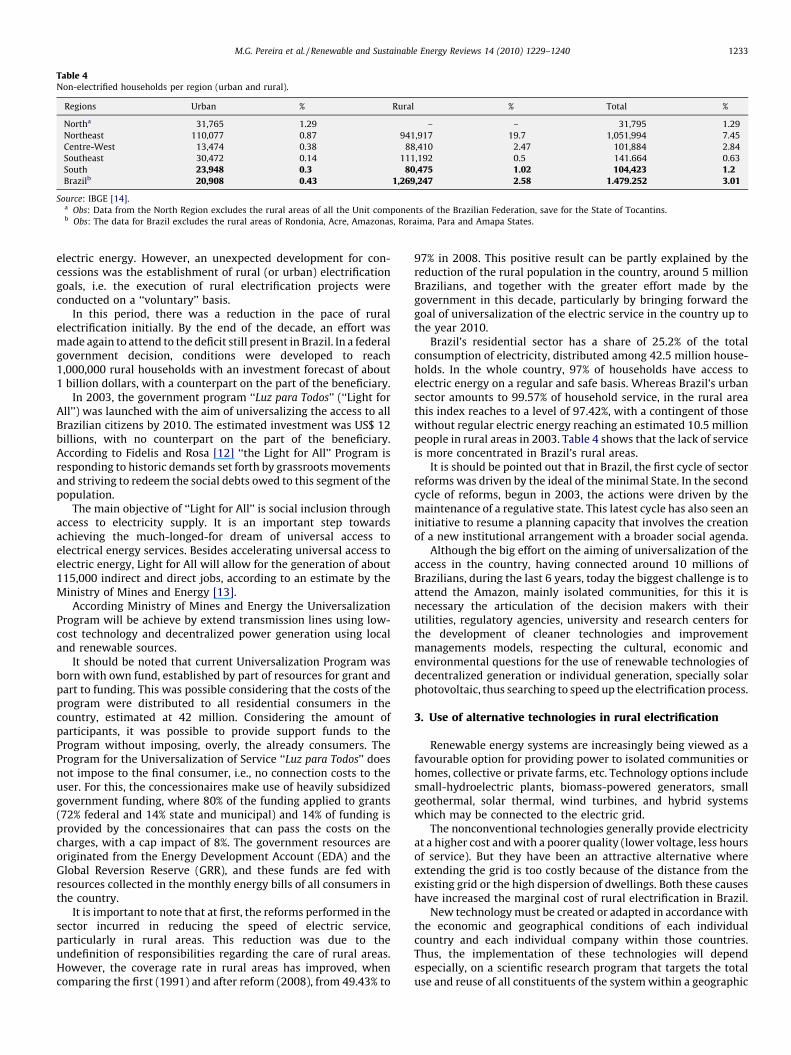
Table 4Non-electrified households per region (urban and rural).
Regions Urban % Rural % Total %
Northa 31,765 1.29 – – 31,795 1.29
Northeast 110,077 0.87 941,917 19.7 1,051,994 7.45
Centre-West 13,474 0.38 88,410 2.47 101,884 2.84
Southeast 30,472 0.14 111,192 0.5 141.664 0.63
South 23,948 0.3 80,475 1.02 104,423 1.2Brazilb 20,908 0.43 1,269,247 2.58 1.479.252 3.01
Source: IBGE [14].a Obs: Data from the North Region excludes the rural areas of all the Unit components of the Brazilian Federation, save for the State of Tocantins.b Obs: The data for Brazil excludes the rural areas of Rondonia, Acre, Amazonas, Roraima, Para and Amapa States.
M.G. Pereira et al. / Renewable and Sustainable Energy Reviews 14 (2010) 1229–1240 1233
electric energy. However, an unexpected development for con-cessions was the establishment of rural (or urban) electrificationgoals, i.e. the execution of rural electrification projects wereconducted on a ‘‘voluntary’’ basis.
In this period, there was a reduction in the pace of ruralelectrification initially. By the end of the decade, an effort wasmade again to attend to the deficit still present in Brazil. In a federalgovernment decision, conditions were developed to reach1,000,000 rural households with an investment forecast of about1 billion dollars, with a counterpart on the part of the beneficiary.
In 2003, the government program ‘‘Luz para Todos’’ (‘‘Light forAll’’) was launched with the aim of universalizing the access to allBrazilian citizens by 2010. The estimated investment was US$ 12billions, with no counterpart on the part of the beneficiary.According to Fidelis and Rosa [12] ‘‘the Light for All’’ Program isresponding to historic demands set forth by grassroots movementsand striving to redeem the social debts owed to this segment of thepopulation.
The main objective of ‘‘Light for All’’ is social inclusion throughaccess to electricity supply. It is an important step towardsachieving the much-longed-for dream of universal access toelectrical energy services. Besides accelerating universal access toelectric energy, Light for All will allow for the generation of about115,000 indirect and direct jobs, according to an estimate by theMinistry of Mines and Energy [13].
According Ministry of Mines and Energy the UniversalizationProgram will be achieve by extend transmission lines using low-cost technology and decentralized power generation using localand renewable sources.
It should be noted that current Universalization Program wasborn with own fund, established by part of resources for grant andpart to funding. This was possible considering that the costs of theprogram were distributed to all residential consumers in thecountry, estimated at 42 million. Considering the amount ofparticipants, it was possible to provide support funds to theProgram without imposing, overly, the already consumers. TheProgram for the Universalization of Service ‘‘Luz para Todos’’ doesnot impose to the final consumer, i.e., no connection costs to theuser. For this, the concessionaires make use of heavily subsidizedgovernment funding, where 80% of the funding applied to grants(72% federal and 14% state and municipal) and 14% of funding isprovided by the concessionaires that can pass the costs on thecharges, with a cap impact of 8%. The government resources areoriginated from the Energy Development Account (EDA) and theGlobal Reversion Reserve (GRR), and these funds are fed withresources collected in the monthly energy bills of all consumers inthe country.
It is important to note that at first, the reforms performed in thesector incurred in reducing the speed of electric service,particularly in rural areas. This reduction was due to theundefinition of responsibilities regarding the care of rural areas.However, the coverage rate in rural areas has improved, whencomparing the first (1991) and after reform (2008), from 49.43% to
97% in 2008. This positive result can be partly explained by thereduction of the rural population in the country, around 5 millionBrazilians, and together with the greater effort made by thegovernment in this decade, particularly by bringing forward thegoal of universalization of the electric service in the country up tothe year 2010.
Brazil’s residential sector has a share of 25.2% of the totalconsumption of electricity, distributed among 42.5 million house-holds. In the whole country, 97% of households have access toelectric energy on a regular and safe basis. Whereas Brazil’s urbansector amounts to 99.57% of household service, in the rural areathis index reaches to a level of 97.42%, with a contingent of thosewithout regular electric energy reaching an estimated 10.5 millionpeople in rural areas in 2003. Table 4 shows that the lack of serviceis more concentrated in Brazil’s rural areas.
It is should be pointed out that in Brazil, the first cycle of sectorreforms was driven by the ideal of the minimal State. In the secondcycle of reforms, begun in 2003, the actions were driven by themaintenance of a regulative state. This latest cycle has also seen aninitiative to resume a planning capacity that involves the creationof a new institutional arrangement with a broader social agenda.
Although the big effort on the aiming of universalization of theaccess in the country, having connected around 10 millions ofBrazilians, during the last 6 years, today the biggest challenge is toattend the Amazon, mainly isolated communities, for this it isnecessary the articulation of the decision makers with theirutilities, regulatory agencies, university and research centers forthe development of cleaner technologies and improvementmanagements models, respecting the cultural, economic andenvironmental questions for the use of renewable technologies ofdecentralized generation or individual generation, specially solarphotovoltaic, thus searching to speed up the electrification process.
3. Use of alternative technologies in rural electrification
Renewable energy systems are increasingly being viewed as afavourable option for providing power to isolated communities orhomes, collective or private farms, etc. Technology options includesmall-hydroelectric plants, biomass-powered generators, smallgeothermal, solar thermal, wind turbines, and hybrid systemswhich may be connected to the electric grid.
The nonconventional technologies generally provide electricityat a higher cost and with a poorer quality (lower voltage, less hoursof service). But they have been an attractive alternative whereextending the grid is too costly because of the distance from theexisting grid or the high dispersion of dwellings. Both these causeshave increased the marginal cost of rural electrification in Brazil.
New technology must be created or adapted in accordance withthe economic and geographical conditions of each individualcountry and each individual company within those countries.Thus, the implementation of these technologies will dependespecially, on a scientific research program that targets the totaluse and reuse of all constituents of the system within a geographic
M.G. Pereira et al. / Renewable and Sustainable Energy Reviews 14 (2010) 1229–12401234
region. Eco-technologies regionally developed can enable conver-sion of wastes to resources and by-products based on theprinciples of Industrial Ecology [15].
The restructuring of the electricity market provides uniqueoccasion for attract and spread cleaner technologies, particularly,renewable energy technology (RET), besides of attracting newplayers within new institutional and regulatory arrangements.10
Old players tend to seek solutions within the existing technologicalregime, not necessarily investing on cleaner technology promotingsustainable society.
The structural changes on sector make possible to have anotherparadigm technological radically different technological systemfrom that of conventional sources, like fuels and nuclear. The broaddeployment of renewables would constitute a technologicalregime shift, inserted under cleaner production11 conception.Renewable energy technology (RETs) differs not only in terms ofsource and technical characteristic, but also in their structural,12
organizational, economic and social elements.There is significant potential for increasing electricity access in
isolated systems through the use of renewable energy. Renewableenergy sources, such as PV, biomass, and small hydro, can beprovided with local resources to remote communities, canguarantee the supply, have much lower environmental impacts,and allow energy independence [18]. According to Peskin andBarnes [19], there are many applications to Photovoltaic, mainlylooking at the evolution of energy demands in the rural areas; oneof its most notable aspects is the role and importance of electricity.Even at the lowest economic levels, just above subsistence, radiosand torches can make a significant improvement in livingstandards and are widely used. The amounts of electricity involvedare tiny, but are absolutely essential.
Household electricity consumption shows large local andinternational variations, as is the case in most features of ruralenergy use. These variations are broadly related to income.Families with higher disposable incomes tend to consume moreelectricity. The length of time a family has had a connection alsohas an effect family consumption usually grows with time.Consumption may also be significantly affected by costs, climate,culture, reliability of supply, and a variety of other factors. In somecountries, for example, the utility sets such high buildingconstruction and house wiring standards for new consumers thatelectricity supplies are effectively restricted to upper-middle-classfamilies who are likely to use a wide variety of appliances oncethey have access to the electricity supply. Other countries applyfew such restrictions, and utility supplies are open to anyone whocan afford the connection fee. This admits many poor familieswhose consumption is likely to be restricted to lighting [20].
The biomass stoves commonly used in developing countries,are not properly designed. As a result, they consume unnecessarilylarge amounts of fuel during cooking and other heating purposesand in addition, pollute the kitchen atmosphere due to incompletecombustion, which subsequently affects the respiratory system ofthe user. During the last decade, the first problem was given toppriority and attempts were made to solve this design of biomass
10 Environmental pressures seem to provide a significant impetus for change in
the selection environment and subsequently in the technological options [16]. In
the long term, the criteria of zero or neutral CO2 emission can be one among others
obligations for utilities according to regulatory agency. According to Klemes and
Huisingh [17], one of the important aspects of cleaner production is minimizing
emissions. Besides the already mentioned CO2 emissions that must be substantially
reduced, there remains much that must be done to also reduce emission of SOX and
NOX. Other important feature of cleaner production is minimization of wastewater.11 Cleaner production refers to the decrease in the waste generation and to the
development of a product that causes a reduction of environmental impact
throughout its life cycle [15].12 The low spatial density of their flows favors decentralized organization of
production and constitutes a critical challenge for regulation and distribution [16].
stoves properly. Some limited measurements indicate that, theimproved design saves 50–80% fuel when compared with thetraditional ones. But a very little attention was given, until now tothe second problem, since 1985 prevention of kitchen atmospherepollution by incomplete combustion of biomass has become aprincipal point of interest at the Eindhoven based Wood burningStove Group [21].
In Brazil although the energy development in recently years, thefirewood is the manly source used for cooking, however its use ismore restricted to the agricultural areas or the urban communitiesof low-income. In the Amazonian case, the agricultural populationsare citizens the sufficiently peculiar conditions: long distances,associates the great difficulties of locomotion and scarce monetaryresources favor the use of local resources on the contrary ofmodern energy source [22].
Regarding the context Amazon, as the fuel (firewood) as far theequipment (stove) are local solutions, with big energetic waste andproduce a lot of smoke. Actually, some studies of implantation ofefficient stoves13 (eco-stoves) in the rural area are under develop-ment, but slowly, although its potential market14 (substitution).
Despite of the current Universalization Program in Brazilconsidering the use of efficient bulbs, there are no clear strategiesof orientation to isolated communities about the use of energy ofan efficient way.
In order to encourage sustainable development and the povertyreduction around the world in the future, today, the society shouldreflect about conceptual, theoretical and practical changes toensure sustainable life-styles for our society. The sustainabledevelopment has to be understood like a journey, not as adestination.
4. Methodological aspects and fieldwork
There are few studies in the available literature about therelation between rural electrification and poverty reduction. Whenstudies do exist, their scope of analysis is limited and usuallyrestricted to experimental projects. Besides that, accordingGunther and Harttgen [24], the poverty measures most establishedonly assess the current poverty status of households, ignoringpoverty dynamics over time.
Poverty should not be seen only in terms of income, consideringthat poverty has many faces, i.e. it extends to other spheres.Although it is repeatedly dealt with as deriving from lack ofincome, poverty should in fact be perceived as a multidimensionalphenomenon, including, inter alia: physical weakness (sub-nutrition, lack of strength, precarious health, incapacity, high rateof active adults who are dependent on others); isolation (isolatedlocation, ignorance (lack of education), lack of access to informa-tion or knowledge); income (lack of income); energy (electricityetc.), (lack of energy); vulnerability (increased exposure to naturaldisasters), impotence (choices, adaptation).
The studies related to mitigating poverty usually conceive of theterm ‘‘poor’’ inrelation toincome.But it isnotalwayspossible tohaveall available data and, when data are available, to make sure they arereliable. One of the alternatives used refers to energy consumption15
as a way to distinguish the ‘‘poor’’ from the ‘‘non-poor’’.The debate surrounding the definition of energy poverty arises
from the notion that poverty in a society is unacceptable. The
13 Traditional stoves are very inefficient and unhealthy.14 The heavy dependency on unmanaged biomass sources has created numerous
socio-economic and environmental problems. This has led to massive deforestation
and allied problems like soil erosion and loss of biodiversity. Besides, by tradition,
the women shoulder the responsibility of wood collection, having been observed to
carry more than 35 kg of firewood over distance of up to 10 km [23].15 For example, in Senegal, the income of consumers is so low that they use electric
energy only for lighting. Such consumers are considered ‘‘poor’’ [5].
M.G. Pereira et al. / Renewable and Sustainable Energy Reviews 14 (2010) 1229–1240 1235
poverty line defines a minimum, and, if there is agreement as to theprinciple that the existence of people below this level isunacceptable, it is to be hoped that the society in question willapply the necessary effort to endure that all its members are abovethe minimum level.
When the insufficiency of income is analyzed, it is possible andlaudable to transfer the income of the wealthiest groups to thepoorest, in the context of promoting equity, so that when the poorestindividual reaches the level of resources of the next poorest, theyboth then receive resources (in the same proportion) until they reachthe level of the next poorest (moving upwards) and so on. In relationto income, equalization mechanisms involving transfers from therichest to the poorest are common, based on the principle ofreparation. In relation to energy equity, however, this mechanism isgenerally neglected by those who formulate energy policy.16
According to Birol [25], this issue when he states that energyeconomists have not addressed the challenges of energy poverty, inparticular in the world’s poorer countries.
It is necessary, drawing the poverty line, to define who is ‘poor’.There is no general consensus as to the minimum amount of energynecessary. Establishing this total requires a priori, a valuejudgment in order to establish the hierarchy of energy choicesin the light of the reality to be studied. The formulation of this valuejudgment, as to the minimum necessary for an individual or familygroup, is normally taken into account the living conditions of theother individuals.
It is essential, in order to draw the energy poverty line, tounderstand how the energy sources are used, given that thesegment to be studied relates to those who are vulnerable, in socio-energy terms. It is possible to indicate that with an incomeincrease, families tend to opt for more modern methods of cooking,heating, lighting and use of home appliances products. Theliterature relates the transition of energy (source/function) toincome, although the demand of lower income groups for energy isrestricted to cooking, heating and lighting. Given that, the absenceof access to most modern sources of energy of this populationgroup, resorts to biomass, thus, severely limiting the improvementof the quality of life and the productive potential of population.This demonstrates that, without public intervention i.e., in theabsence of expansion of the access to electricity, this populationwill remain trapped by energy poverty.
As soon as this transition will occur, remains undefined i.e., thisbehavior depends on the capacity to pay, as well as the availabilityof the energy and the cultural preferences of the potentialconsumers. In general, this process is gradual, and not necessarilylinear. In certain regions of Africa, firewood is also used for externalillumination, and is gradually being substituted by electricitywhen electric energy becomes available to the dwelling. In the hotand humid rural regions of Brazil, firewood is burnt outsidedwellings in order to repel the mosquitoes that infest the region.This behavior remains unaltered, for cultural reasons, even whenthe access to electricity on a safe and regular basis is provided.17
16 The energy wealth issue deserves comment, although it is not the purpose of
this study. In developed nations in particular, by the climate changed spot, the
governments should strongly encourage the population to limit their consumption,
considering a limit per household or per capita, applying disincentives for use above
a certain limit and thus reducing the pressure on the environment.
Spreng [26] suggests per capita consumption of 2000 W as the limit, indicating
that this level is compatible with sustainable development.17 According to studies carried out in South Africa by Mudubansi and Shackleton
[27] on the consumption of firewood before and after electrification, firewood was
used for cooking, prior to electrification, in 99% of the dwellings, in 71% for external
heating of the dwelling and in 29% as raw material for ironing clothes. Following
access to electricity on a regular and safe basis, the consumption of firewood for
cooking was reduced to 96% of dwellings, with 5 % using firewood as a source of
heating external to the dwelling and 0% using it as raw material for the ironing of
clothes.
It is essential to expose energy poverty approaches, like: peoplewho do not have regular and safe access to electricity; familyspends over 10% of their income on energy and to estimate basicenergy needs.
The third approach about estimating basic energy needs hasbeen gaining ground in the literature. However, according toPachauri et al. [28], there is no consensus yet on the question ofminimum amount.
It is relevant to evaluate the total amount of energy realisticallynecessary in Brazil in order to meet the demand for lighting, heatingand cooking. Bearing in mind the lack of information available on theenergy profile of rural populations, without mentioning the effectson the reduction of energy poverty of government policies on theexpansion of access to electricity, it was necessary to undertakefieldwork. Information was gathered in order to draw up an energydiagnosis of the population prior to access to safe and regularelectricity, and then again 3 or 4 years later.
The fieldwork was undertaken via the application of structuredquestionnaires, between 2000 and 2004. The interviewer under-went training in the objectives of the research, the methodology,and the completion of the questionnaires, prior to visiting theregion. The researched sample was considered to be universallyrepresentative, in terms of the issue being examined, of thebeneficiaries of Brazil. The sample was random, being used in thefirst and second stages, respectively, of the information gathering,thus guarantying a reliability rate of over 95% in respect of theinferences drawn.
The existence of external factors cannot be considered animpediment to the evaluation of the results of government actionin promoting access to electricity. In terms of methodology, theuse of a random experimental drawing of the sample, togetherwith a control sample, is advisable, despite being more onerousand time consuming. The control sample must have character-istics which are similar to the population affected by thegovernment policies, including, for example: demographic,geographic, social, environmental, economic and energy char-acteristics, etc. Strictly speaking, the only difference between thesamples should be that one was subject to intervention(electrification) and the other one was not. The control groupwas included in the fieldwork in both phases, in an effort to isolateeffects other than the access to electricity.
Regarding data, they were collected in 21 states of the BrazilianFederation and considered two moments in time, i.e. prior tohaving access to electric energy (first phase) on a regular and safebasis, and 3 years following access (second phase). As far as thesamples are concerned, they were classified and analyzed into twotypes:
� Electrified sample—set of rural households that were part of thenational rural electrification program;� Control sample (or non-electrified)—set of rural households that
were not part of the national rural electrification program.
The pertinent information for the electrified sample amounts17,102 rural households surveyed. They were divided into 8888 inthe first phase and 8214 in the second phase. Regarding the controlsample, the amount is 2885 rural households, divided into 1195 inthe first phase and 1690 in the second phase. However, the divisionwas made according to no information, the valid electrified samplewould reach the level of 11,704 rural households surveyed, dividedinto 7722 in the first phase and 3982 in the second phase.Regarding the valid control sample, the new amount is 1271 ruralhouseholds, divided into 452 in the first phase and 819 in thesecond phase.
With field data regarding the control and electrified samples inhand, it is possible to evaluate whether the energy changes

Table 5Average energy consumption for all sources (GJ/year)—electrified�non-electrified.
Energy Electrified sample Non-electrified sample
First phase 14.16 17.30
Second phase 16.60 12.70
Source: Own elaboration based on the IMPAR Version 2.3 System data CEPEL/
ELETROBRAS [29].
M.G. Pereira et al. / Renewable and Sustainable Energy Reviews 14 (2010) 1229–12401236
occurred resulting from the process of rural electrification. It oughtto be emphasized that the analyses were concentrated oncomparing the phase before having access to electric energy(the first phase) to the situation after the arrival of electric energy(the second phase). As for the control sample (non-electrified)specifically, its objective is to compare the natural impact resultingfrom time, context and conjuncture with the impact resulting fromthe electrification and captured in the other two samples. As such,the effects resulting from electrification and the effects resultingfrom other factors are isolated.
Similar to the concept already divulged by the literature on thetopic of income poverty (poverty line), the task of the presentarticle is to unfold this concept for the energy area. At first, thetopic of energy misery was computed.18 Energy misery representsthe least amount of energy necessary to guarantee human survival.It is equivalent to 30 kg of firewood per month for a family of fourpersons, amounting to a total of 4.6728 GJ/year per family (energymisery line). The assumption is that below this value, survival itselfis at risk, given that every family group requires a minimum ofnecessary energy to satisfy their basic necessities, as for cooking,among other purposes.
The concept of energy poverty line presented here, differswith respect to the amount of values indicated in the literature,despite a continuing lack of consensus as to the amount ofenergy necessary. The present study is based upon theassumption that the energy poverty line is a variant of theenergy misery line, i.e. the consumption of those above theenergy poverty line would be higher than 9.3456 GJ/year perfamily. In addition, it is worth emphasizing that the valuespresented are the result of initial studies made by the ElectricPower Research Center19 [29,30] on the energy profile made inthe rural environment of Brazil. As an illustration, satisfactorybut not ideal consumption of energy for a family in thecountry’s rural regions would be 44.9892 GJ/year, whenconsidering an energy basket of consumption projected at128 kWh/month of electricity, 13 kg of GLP/month, 36 l/monthof gasoline and 43 l/month of diesel fuel. The aforementionedbasket was compiled by means of empirical field observationsbased on the energy consumption profile of about 9000 ruralproperties/households.
The results to be presented are restricted to the energyquestion. However, it is known that other factors must beevaluated. This is how we can gather a set of information ableto guarantee, with the highest degree of reliability, what the realchanges that occurred in the modus vivendi of rural people after thearrival of electric energy were.
18 In the present study, the calculation of energy poverty is made by considering
per capita data, with the following values: energy misery – consumption below
1.1682 GJ/year; energy poverty – consumption below 2.3364 GJ/year, whereas an
indication of satisfactory consumption would be 11.2473 GJ/year.19 The results presented were descendant from a broader study developed by
CEPEL/Eletrobras with the aim of evaluating the economic, social and environmen-
tal changes that followed the implementation of the rural electrification programs
in 21 of 27 States in Brazil.
5. Energy poverty study
Table 5 displays the values of average energy consumption, andconsiders all the sources per year between phases, and separatesthe properties between electrified and non-electrified ones. In theelectrified sample, it can be observed that, in absolute terms,changes occurred in average energy consumption in the first andsecond phases, shifting from 14.16 GJ/year to 16.60 GJ/year. Whenanalyzing the non-electrified sample, one can notice a drop inenergy consumption between the first and second phases.
By performing an average energy consumption differencetest,20 between phases, in the electrified as well as non-electrifiedsample, such differences for the two samples proved to besignificant. Therefore, it can be asserted that changes occurred inenergy consumption for the electrified sample.
Based on Graph 2, it is possible to observe the composition ofthe energy basket prior the access to electric energy and after theaccess to electric energy, and thereby assess the respectivechanges. In the first phase, energy consumption was concentratedin the following triplet: GLP, firewood and diesel, in which the sumof the share reached a level of 90%. When analyzing the phase afterthe access to electric energy, the participation of the trio reaches65% of the energy basket. It is worth highlighting also, the fastpenetration of electric energy reaching the level of 34% of theenergy basket.
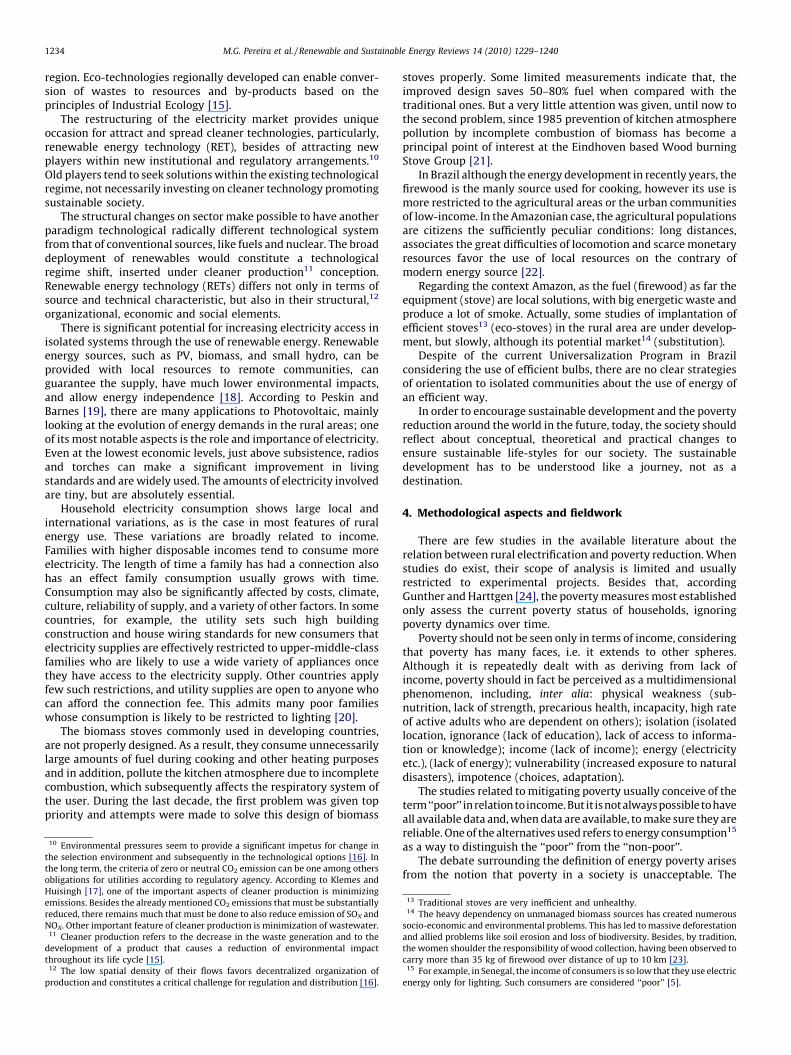
When observing Graph 3, it is possible to confirm thecomposition of the energy basket of the non-electrified samplethrough time. Regarding the GLP, firewood and diesel triplet, therewas a large change in the period analyzed, though the triplet stilldid maintain a considerable share. That is, in the course of theperiod analyzed the share of these items dropped from 94% to 84%in the energy basket.
It should be noted that despite not reaching the initialexpectation of a considerable increase in energy consumption,this was also limited by the studied population’s available income,standing at roughly US$ 238/month per family.
Table 6 shows per capita energy consumption values (GJ/year)between phases and per sample. A positive change can be observedin the thresholds of average consumption between first and secondphases of the electrified sample, between 5.16 GJ/year and 6.65 GJ/year, respectively. On the other end, a negative change inconsumption is shown, between the first and second phases, withrespect to the control sample. There was a drop from 6.91 GJ/yearto 5 GJ/year. When performing the statistical test of averagedifference, the changes were confirmed.
Accordingly, here is the picture of the data on energy poverty forBrazil. Graph 4 indicates the percentage of energy poor prior to theaccess of electric energy and following the rural electrification,especially for the electrified sample, wherein one can notice thedrop in quantity of persons who do not have the minimumavailability of energy to guarantee an adequate livelihood, that is,inserted into the concept of sustainable development. Between theobserved phases, there was a drop in percentage of personsconsidered energy poor from 37.17% to 26.34%.
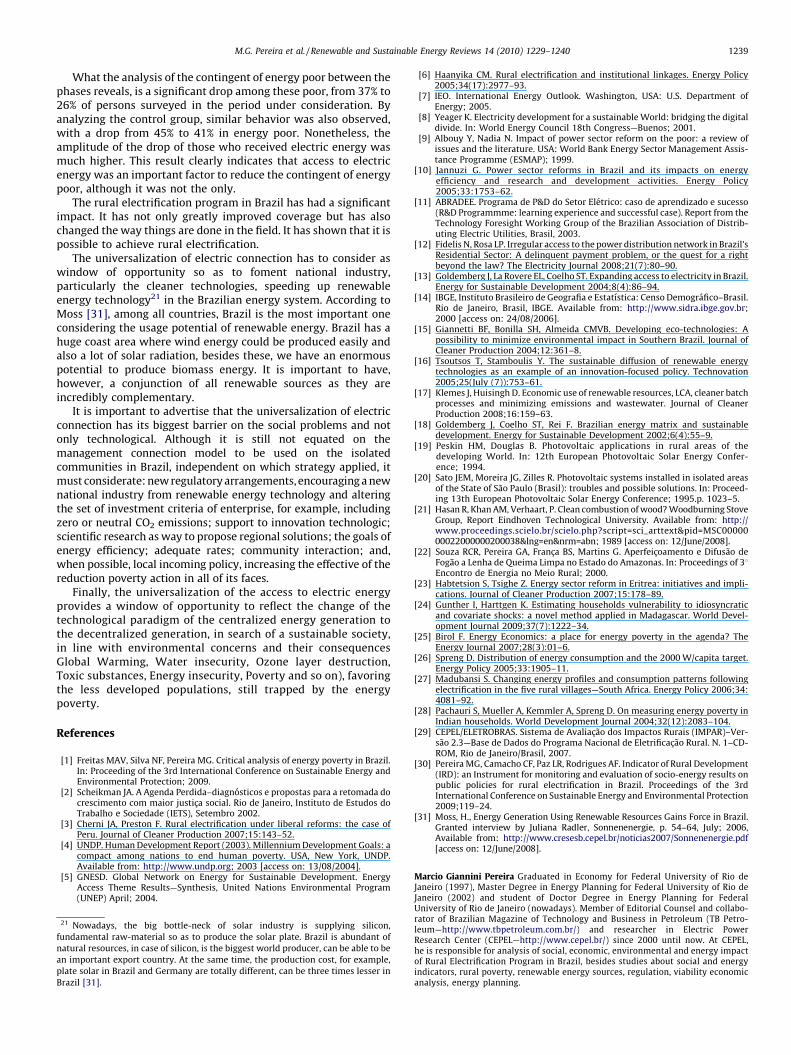
In parallel, Graph 5 points to a reduction in percentage of energypoor for the non-electrified sample, which dropped from 45.64% to41.48% during the period analyzed. However, such a result has alower amplitude when compared to the electrified sample. It
20 To test the hypothesis as to the equality of the averages of a determined variable
between the phases surveyed, statistic average-difference tests were used. In the
result, test significance is observed when Sig. 2—tailed/p-value in the event of the
result being greater than 0.05, the equality hypothesis is invalidated for a reliability
interval of 95%, i.e. the equality hypothesis is rejected. The conclusion drawn is that
the average difference between the variable phases in question is statistically
significant.
Graph 2. Energy consumption profile–electric sample. Source: Own elaboration based on the IMPAR Version 2.3 System data CEPEL/ELETROBRAS [29].
Graph 3. Energy consumption profile–non-electric sample. Source: Own elaboration based on the IMPAR Version 2.3 System data CEPEL/ELETROBRAS [29].
Table 6Energy consumption per capita (GJ/year).
Energy Electrified sample Non-electrified sample
First phase 5.16 691
Second phase 6.65 5.00
Source: Own elaboration based on the IMPAR Version 2.3 System data CEPEL/
ELETROBRAS [29].
M.G. Pereira et al. / Renewable and Sustainable Energy Reviews 14 (2010) 1229–1240 1237
indicates that electric energy was determinant for the reduction ofthis contingent, although it was not the single factor.
Such results confirm the initial expectations on how thecontingent of persons below the energy poverty line wasreduced between the phases. Despite how providing access toelectric energy is the main slope to eradicate electric exclusionand mitigate energy poverty, there are nonetheless aspects ofincome limitation and biomass availability interacting directlywith the result shown. It is important to exemplify theelectrified sample in which there was an increase in consump-tion of electric energy and a decrease in consumption offirewood, GLP and diesel, in addition to a virtual absence ofkerosene consumption. When considering the non-electrified
sample, an increase in charcoal, gasoline and GLP consumptionwas observed.
Finally, such results indicate that rural electrification, in theBrazilian context, enable a positive energy impact on the energyconsumption increase as well as on the consumption distribution
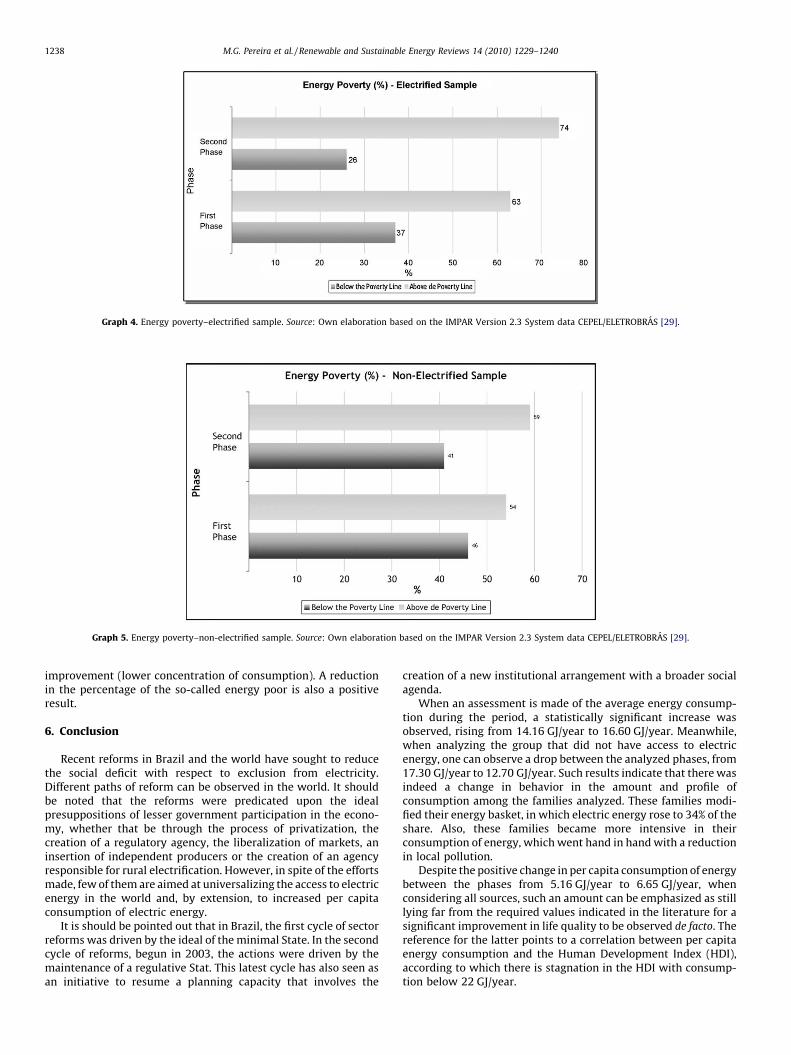
Graph 4. Energy poverty–electrified sample. Source: Own elaboration based on the IMPAR Version 2.3 System data CEPEL/ELETROBRAS [29].
Graph 5. Energy poverty–non-electrified sample. Source: Own elaboration based on the IMPAR Version 2.3 System data CEPEL/ELETROBRAS [29].
M.G. Pereira et al. / Renewable and Sustainable Energy Reviews 14 (2010) 1229–12401238
improvement (lower concentration of consumption). A reductionin the percentage of the so-called energy poor is also a positiveresult.
6. Conclusion
Recent reforms in Brazil and the world have sought to reducethe social deficit with respect to exclusion from electricity.Different paths of reform can be observed in the world. It shouldbe noted that the reforms were predicated upon the idealpresuppositions of lesser government participation in the econo-my, whether that be through the process of privatization, thecreation of a regulatory agency, the liberalization of markets, aninsertion of independent producers or the creation of an agencyresponsible for rural electrification. However, in spite of the effortsmade, few of them are aimed at universalizing the access to electricenergy in the world and, by extension, to increased per capitaconsumption of electric energy.
It is should be pointed out that in Brazil, the first cycle of sectorreforms was driven by the ideal of the minimal State. In the secondcycle of reforms, begun in 2003, the actions were driven by themaintenance of a regulative Stat. This latest cycle has also seen asan initiative to resume a planning capacity that involves the
creation of a new institutional arrangement with a broader socialagenda.
When an assessment is made of the average energy consump-tion during the period, a statistically significant increase wasobserved, rising from 14.16 GJ/year to 16.60 GJ/year. Meanwhile,when analyzing the group that did not have access to electricenergy, one can observe a drop between the analyzed phases, from17.30 GJ/year to 12.70 GJ/year. Such results indicate that there wasindeed a change in behavior in the amount and profile ofconsumption among the families analyzed. These families modi-fied their energy basket, in which electric energy rose to 34% of theshare. Also, these families became more intensive in theirconsumption of energy, which went hand in hand with a reductionin local pollution.
Despite the positive change in per capita consumption of energybetween the phases from 5.16 GJ/year to 6.65 GJ/year, whenconsidering all sources, such an amount can be emphasized as stilllying far from the required values indicated in the literature for asignificant improvement in life quality to be observed de facto. Thereference for the latter points to a correlation between per capitaenergy consumption and the Human Development Index (HDI),according to which there is stagnation in the HDI with consump-tion below 22 GJ/year.
M.G. Pereira et al. / Renewable and Sustainable Energy Reviews 14 (2010) 1229–1240 1239
What the analysis of the contingent of energy poor between thephases reveals, is a significant drop among these poor, from 37% to26% of persons surveyed in the period under consideration. Byanalyzing the control group, similar behavior was also observed,with a drop from 45% to 41% in energy poor. Nonetheless, theamplitude of the drop of those who received electric energy wasmuch higher. This result clearly indicates that access to electricenergy was an important factor to reduce the contingent of energypoor, although it was not the only.
The rural electrification program in Brazil has had a significantimpact. It has not only greatly improved coverage but has alsochanged the way things are done in the field. It has shown that it ispossible to achieve rural electrification.
The universalization of electric connection has to consider aswindow of opportunity so as to foment national industry,particularly the cleaner technologies, speeding up renewableenergy technology21 in the Brazilian energy system. According toMoss [31], among all countries, Brazil is the most important oneconsidering the usage potential of renewable energy. Brazil has ahuge coast area where wind energy could be produced easily andalso a lot of solar radiation, besides these, we have an enormouspotential to produce biomass energy. It is important to have,however, a conjunction of all renewable sources as they areincredibly complementary.
It is important to advertise that the universalization of electricconnection has its biggest barrier on the social problems and notonly technological. Although it is still not equated on themanagement connection model to be used on the isolatedcommunities in Brazil, independent on which strategy applied, itmust considerate: new regulatory arrangements, encouraging a newnational industry from renewable energy technology and alteringthe set of investment criteria of enterprise, for example, includingzero or neutral CO2 emissions; support to innovation technologic;scientific research as way to propose regional solutions; the goals ofenergy efficiency; adequate rates; community interaction; and,when possible, local incoming policy, increasing the effective of thereduction poverty action in all of its faces.
Finally, the universalization of the access to electric energyprovides a window of opportunity to reflect the change of thetechnological paradigm of the centralized energy generation tothe decentralized generation, in search of a sustainable society,in line with environmental concerns and their consequencesGlobal Warming, Water insecurity, Ozone layer destruction,Toxic substances, Energy insecurity, Poverty and so on), favoringthe less developed populations, still trapped by the energypoverty.
References
[1] Freitas MAV, Silva NF, Pereira MG. Critical analysis of energy poverty in Brazil.In: Proceeding of the 3rd International Conference on Sustainable Energy andEnvironmental Protection; 2009.
[2] Scheikman JA. A Agenda Perdida–diagnosticos e propostas para a retomada docrescimento com maior justica social. Rio de Janeiro, Instituto de Estudos doTrabalho e Sociedade (IETS), Setembro 2002.
[3] Cherni JA, Preston F. Rural electrification under liberal reforms: the case ofPeru. Journal of Cleaner Production 2007;15:143–52.
[4] UNDP. Human Development Report (2003). Millennium Development Goals: acompact among nations to end human poverty. USA, New York, UNDP.Available from: http://www.undp.org; 2003 [access on: 13/08/2004].
[5] GNESD. Global Network on Energy for Sustainable Development. EnergyAccess Theme Results—Synthesis, United Nations Environmental Program(UNEP) April; 2004.
21 Nowadays, the big bottle-neck of solar industry is supplying silicon,
fundamental raw-material so as to produce the solar plate. Brazil is abundant of
natural resources, in case of silicon, is the biggest world producer, can be able to be
an important export country. At the same time, the production cost, for example,
plate solar in Brazil and Germany are totally different, can be three times lesser in
Brazil [31].
[6] Haanyika CM. Rural electrification and institutional linkages. Energy Policy2005;34(17):2977–93.
[7] IEO. International Energy Outlook. Washington, USA: U.S. Department ofEnergy; 2005.
[8] Yeager K. Electricity development for a sustainable World: bridging the digitaldivide. In: World Energy Council 18th Congress—Buenos; 2001.
[9] Albouy Y, Nadia N. Impact of power sector reform on the poor: a review ofissues and the literature. USA: World Bank Energy Sector Management Assis-tance Programme (ESMAP); 1999.
[10] Jannuzi G. Power sector reforms in Brazil and its impacts on energyefficiency and research and development activities. Energy Policy2005;33:1753–62.
[11] ABRADEE. Programa de P&D do Setor Eletrico: caso de aprendizado e sucesso(R&D Programmme: learning experience and successful case). Report from theTechnology Foresight Working Group of the Brazilian Association of Distrib-uting Electric Utilities, Brasil, 2003.
[12] Fidelis N, Rosa LP. Irregular access to the power distribution network in Brazil’sResidential Sector: A delinquent payment problem, or the quest for a rightbeyond the law? The Electricity Journal 2008;21(7):80–90.
[13] Goldemberg J, La Rovere EL, Coelho ST. Expanding access to electricity in Brazil.Energy for Sustainable Development 2004;8(4):86–94.
[14] IBGE, Instituto Brasileiro de Geografia e Estatıstica: Censo Demografico–Brasil.Rio de Janeiro, Brasil, IBGE. Available from: http://www.sidra.ibge.gov.br;2000 [access on: 24/08/2006].
[15] Giannetti BF, Bonilla SH, Almeida CMVB. Developing eco-technologies: Apossibility to minimize environmental impact in Southern Brazil. Journal ofCleaner Production 2004;12:361–8.
[16] Tsoutsos T, Stamboulis Y. The sustainable diffusion of renewable energytechnologies as an example of an innovation-focused policy. Technovation2005;25(July (7)):753–61.
[17] Klemes J, Huisingh D. Economic use of renewable resources, LCA, cleaner batchprocesses and minimizing emissions and wastewater. Journal of CleanerProduction 2008;16:159–63.
[18] Goldemberg J, Coelho ST, Rei F. Brazilian energy matrix and sustainabledevelopment. Energy for Sustainable Development 2002;6(4):55–9.
[19] Peskin HM, Douglas B. Photovoltaic applications in rural areas of thedeveloping World. In: 12th European Photovoltaic Solar Energy Confer-ence; 1994.
[20] Sato JEM, Moreira JG, Zilles R. Photovoltaic systems installed in isolated areasof the State of Sao Paulo (Brasil): troubles and possible solutions. In: Proceed-ing 13th European Photovoltaic Solar Energy Conference; 1995.p. 1023–5.
[21] Hasan R, Khan AM, Verhaart, P. Clean combustion of wood? Woodburning StoveGroup, Report Eindhoven Technological University. Available from: http://www.proceedings.scielo.br/scielo.php?script=sci_arttext&pid=MSC0000000022000000200038&lng=en&nrm=abn; 1989 [access on: 12/June/2008].
[22] Souza RCR, Pereira GA, Franca BS, Martins G. Aperfeicoamento e Difusao deFogao a Lenha de Queima Limpa no Estado do Amazonas. In: Proceedings of 38Encontro de Energia no Meio Rural; 2000.
[23] Habtetsion S, Tsighe Z. Energy sector reform in Eritrea: initiatives and impli-cations. Journal of Cleaner Production 2007;15:178–89.
[24] Gunther I, Harttgen K. Estimating households vulnerability to idiosyncraticand covariate shocks: a novel method applied in Madagascar. World Devel-opment Journal 2009;37(7):1222–34.
[25] Birol F. Energy Economics: a place for energy poverty in the agenda? TheEnergy Journal 2007;28(3):01–6.
[26] Spreng D. Distribution of energy consumption and the 2000 W/capita target.Energy Policy 2005;33:1905–11.
[27] Madubansi S. Changing energy profiles and consumption patterns followingelectrification in the five rural villages—South Africa. Energy Policy 2006;34:4081–92.
[28] Pachauri S, Mueller A, Kemmler A, Spreng D. On measuring energy poverty inIndian households. World Development Journal 2004;32(12):2083–104.
[29] CEPEL/ELETROBRAS. Sistema de Avaliacao dos Impactos Rurais (IMPAR)–Ver-sao 2.3—Base de Dados do Programa Nacional de Eletrificacao Rural. N. 1–CD-ROM, Rio de Janeiro/Brasil, 2007.
[30] Pereira MG, Camacho CF, Paz LR, Rodrigues AF. Indicator of Rural Development(IRD): an Instrument for monitoring and evaluation of socio-energy results onpublic policies for rural electrification in Brazil. Proceedings of the 3rdInternational Conference on Sustainable Energy and Environmental Protection2009;119–24.
[31] Moss, H., Energy Generation Using Renewable Resources Gains Force in Brazil.Granted interview by Juliana Radler, Sonnenenergie, p. 54–64, July; 2006,Available from: http://www.cresesb.cepel.br/noticias2007/Sonnenenergie.pdf[access on: 12/June/2008].
Marcio Giannini Pereira Graduated in Economy for Federal University of Rio deJaneiro (1997), Master Degree in Energy Planning for Federal University of Rio deJaneiro (2002) and student of Doctor Degree in Energy Planning for FederalUniversity of Rio de Janeiro (nowadays). Member of Editorial Counsel and collabo-rator of Brazilian Magazine of Technology and Business in Petroleum (TB Petro-leum—http://www.tbpetroleum.com.br/) and researcher in Electric PowerResearch Center (CEPEL—http://www.cepel.br/) since 2000 until now. At CEPEL,he is responsible for analysis of social, economic, environmental and energy impactof Rural Electrification Program in Brazil, besides studies about social and energyindicators, rural poverty, renewable energy sources, regulation, viability economicanalysis, energy planning.

ble Energy Reviews 14 (2010) 1229–1240
Marcos Aurelio Vasconcelos Freitas has graduation at Geography by State Universityof Rio de Janeiro (1983), specialization at Etudes Comparatives Sur Developpement byEcole des Hautes Etudes en Sciences Sociales (1990), Master’s at Nuclear Engineeringby Federal University of Rio de Janeiro (1988) and Ph.D. at Economie de l Environne-ment by Ecole des Hautes Etudes en Sciences Sociales (1994). Currently is Professor ofFederal University of Rio de Janeiro and executive of Virtual Institute of Global Changes(IVIG). Has experience in the area of Nuclear Engineering, with emphasis on multidis-ciplinary, energy focused, mainly, in the subjects: The Carbon Cycle, Amazon, Land Use,Biomass, Climate Changes and Energy.
M.G. Pereira et al. / Renewable and Sustaina1240
Neilton Fidelis da Silva has graduation at Electricity Engineering for Federal Univer-sity of Rio Grande do Norte (1988), specialization Manegement and Total QualityTechnology at Centro Federal de Educacao Tecnologica of Minas Gerais (1993),specialization on Energy Planning at Universidad Politecnica de Madrid Universidadde La Republica (1996), Master Degree at Electricity Engineering for Federal Univer-sity of Rio Grande do Norte (1996) and Doctor Degree in Energy Planning at FederalUniversity of Rio de Janeiro (2006). Member of Editorial Counsel of Global ChangesBrazilian Forum, has experience in the area of wind energy, Electric Sector, Renew-ables Energy and Climate Changes.
Copyright © 2022 FDOKUMEN