Effect of Inadequate Electrification on Nigeria's Economic ...
24
sustainability Article Effect of Inadequate Electrification on Nigeria’s Economic Development and Environmental Sustainability Mustapha Mukhtar 1 , Sandra Obiora 2 , Nasser Yimen 3 , Zhang Quixin 1 , Olusola Bamisile 4, * , Pauline Jidele 5 and Young I. Irivboje 6 Citation: Mukhtar, M.; Obiora, S.; Yimen, N.; Quixin, Z.; Bamisile, O.; Jidele, P.; Irivboje, Y.I. Effect of Inadequate Electrification on Nigeria’s Economic Development and Environmental Sustainability. Sustainability 2021, 13, 2229. https://doi.org/10.3390/su13042229 Received: 11 December 2020 Accepted: 8 February 2021 Published: 19 February 2021 Publisher’s Note: MDPI stays neutral with regard to jurisdictional claims in published maps and institutional affil- iations. Copyright: © 2021 by the authors. Licensee MDPI, Basel, Switzerland. This article is an open access article distributed under the terms and conditions of the Creative Commons Attribution (CC BY) license (https:// creativecommons.org/licenses/by/ 4.0/). 1 School of Economics and Management, Guangdong University of Petrochemical Technology, Maoming 525000, China; [email protected] (M.M.); [email protected] (Z.Q.) 2 School of Economics and Management, University of Electronic Science and Technology of China, Chengdu 610054, China; [email protected] 3 National Advanced School of Engineering, University of Yaounde I, Yaounde 812, Cameroon; [email protected] 4 School of Mechanical and Electrical Engineering, University of Electronic Science and Technology of China, Chengdu 610054, China 5 Faculty of Science, Augustine University, Ilara-Epe, PMB 1010, Lagos State 106101, Nigeria; [email protected] 6 College of Animal Science and Livestock Production, Federal University of Agriculture, Abeokuta 112251, Nigeria; [email protected] * Correspondence: [email protected] Abstract: In this study, the impact of the electricity crisis on the economic growth of Nigeria is presented. Unlike other existing studies that checked the effect of electricity consumption on economic development or environmental sustainability for different countries, the present study will further present a techno-economic analysis of a proffered solution to the imminent electricity crisis. Time- series regression models are used to analyze the effect of electricity consumption on economic development and environmental sustainability while RETScreen professional software is used to perform a techno-economic analysis and determine the feasibility of a 500-kW microgrid Solar Photovoltaic (PV) system integrated for electricity generation. From the analysis results, a strong positive correlation effect is evident between electricity consumption and GNI, as well as a strong negative correlation between electricity consumption and gross domestic savings. Also, strong positive correlation effects are evident in the case of carbon emissions by buildings, by the power industry, and by other combustion industries on electricity consumption in Nigeria. Considering the net present value, internal rate of return and payback periods, the use of solar PV systems for electricity generation is feasible in the 12 different locations in Nigeria studied in this research. The most feasible area for solar PV installation is the northern part of Nigeria as Gombe and Kaduna recorded a simple PBP and an equity PBP are 6.3 years and 7.4 years respectively. Keywords: economic development; electricity; environmental sustainability; Nigeria; solar PV 1. Introduction The target of every country’s economy, be it developing, emerging, or developed coun- try is to achieve sustainable development [1]. The globalization and growth rate witnessed by every economy is increasing the global energy demand consistently as this is a driver for most economic activities. Electricity has become a necessity and an integral part of day-to-day living due to its relationship with human’s industrial production, agricultural productivity, health, education, etc. [2]. Its accessibility enhances both domestic/residential needs and this positively correlates with economic factors like; reduced poverty, enhanced overall standard of living, and increased exportation [3]. Odekanle et al. [4] stated that the constant availability of energy supply for industrial, domestic, and agricultural pur- poses is a strong indicator of a community’s infrastructural development. In fact, energy Sustainability 2021, 13, 2229. https://doi.org/10.3390/su13042229 https://www.mdpi.com/journal/sustainability
-
Upload
khangminh22 -
Category
Documents
-
view
0 -
download
0
Transcript of Effect of Inadequate Electrification on Nigeria's Economic ...

sustainability
Article
Effect of Inadequate Electrification on Nigeria’s EconomicDevelopment and Environmental Sustainability
Mustapha Mukhtar 1 , Sandra Obiora 2 , Nasser Yimen 3 , Zhang Quixin 1, Olusola Bamisile 4,* ,Pauline Jidele 5 and Young I. Irivboje 6
Citation: Mukhtar, M.; Obiora, S.;
Yimen, N.; Quixin, Z.; Bamisile, O.;
Jidele, P.; Irivboje, Y.I. Effect of
Inadequate Electrification on
Nigeria’s Economic Development
and Environmental Sustainability.
Sustainability 2021, 13, 2229.
https://doi.org/10.3390/su13042229
Received: 11 December 2020
Accepted: 8 February 2021
Published: 19 February 2021
Publisher’s Note: MDPI stays neutral
with regard to jurisdictional claims in
published maps and institutional affil-
iations.
Copyright: © 2021 by the authors.
Licensee MDPI, Basel, Switzerland.
This article is an open access article
distributed under the terms and
conditions of the Creative Commons
Attribution (CC BY) license (https://
creativecommons.org/licenses/by/
4.0/).
1 School of Economics and Management, Guangdong University of Petrochemical Technology,Maoming 525000, China; [email protected] (M.M.); [email protected] (Z.Q.)
2 School of Economics and Management, University of Electronic Science and Technology of China,Chengdu 610054, China; [email protected]
3 National Advanced School of Engineering, University of Yaounde I, Yaounde 812, Cameroon;[email protected]
4 School of Mechanical and Electrical Engineering, University of Electronic Science and Technology of China,Chengdu 610054, China
5 Faculty of Science, Augustine University, Ilara-Epe, PMB 1010, Lagos State 106101, Nigeria;[email protected]
6 College of Animal Science and Livestock Production, Federal University of Agriculture,Abeokuta 112251, Nigeria; [email protected]
* Correspondence: [email protected]
Abstract: In this study, the impact of the electricity crisis on the economic growth of Nigeria ispresented. Unlike other existing studies that checked the effect of electricity consumption on economicdevelopment or environmental sustainability for different countries, the present study will furtherpresent a techno-economic analysis of a proffered solution to the imminent electricity crisis. Time-series regression models are used to analyze the effect of electricity consumption on economicdevelopment and environmental sustainability while RETScreen professional software is used toperform a techno-economic analysis and determine the feasibility of a 500-kW microgrid SolarPhotovoltaic (PV) system integrated for electricity generation. From the analysis results, a strongpositive correlation effect is evident between electricity consumption and GNI, as well as a strongnegative correlation between electricity consumption and gross domestic savings. Also, strongpositive correlation effects are evident in the case of carbon emissions by buildings, by the powerindustry, and by other combustion industries on electricity consumption in Nigeria. Consideringthe net present value, internal rate of return and payback periods, the use of solar PV systemsfor electricity generation is feasible in the 12 different locations in Nigeria studied in this research.The most feasible area for solar PV installation is the northern part of Nigeria as Gombe and Kadunarecorded a simple PBP and an equity PBP are 6.3 years and 7.4 years respectively.
Keywords: economic development; electricity; environmental sustainability; Nigeria; solar PV
1. Introduction
The target of every country’s economy, be it developing, emerging, or developed coun-try is to achieve sustainable development [1]. The globalization and growth rate witnessedby every economy is increasing the global energy demand consistently as this is a driverfor most economic activities. Electricity has become a necessity and an integral part ofday-to-day living due to its relationship with human’s industrial production, agriculturalproductivity, health, education, etc. [2]. Its accessibility enhances both domestic/residentialneeds and this positively correlates with economic factors like; reduced poverty, enhancedoverall standard of living, and increased exportation [3]. Odekanle et al. [4] stated thatthe constant availability of energy supply for industrial, domestic, and agricultural pur-poses is a strong indicator of a community’s infrastructural development. In fact, energy
Sustainability 2021, 13, 2229. https://doi.org/10.3390/su13042229 https://www.mdpi.com/journal/sustainability

Sustainability 2021, 13, 2229 2 of 24
consumption is a reflection of a nation’s development due to its immense contribution tosocio-economic growth. Research has shown that there is a relationship between economicgrowth and total energy consumption for many developed countries, however, the shareof electricity in the overall economic development of developing (African) countries wasnot considered [5]. Therefore, there is a need to study the impact of the electricity crisisin many African countries on its overall economic development. One of the main aimsof the United Nations Sustainable Development Goals (UN-SDGs) is to provide accessto modern and clean energy [6].
Globally, carbon emission from fossil fuel usage, cement production, and other in-dustrial processes have played a significant role in global environmental sustainability.Adom et al. [7] studied the long-term effects of demographic, economic, and politicalindices on potential and actual carbon emissions. Their results showed that a higher oil andelectricity price will reduce the current and future carbon emission [7]. The advantages anddisadvantages of enforcing some emission restriction measures within carbon emissioncontrol areas were highlighted in another study [8]. It was reported that the introductionof emission restrictions will reduce the emitted sulfur oxide by 40.4%, however, this willrequire a significant decrease in the vessels sailed by liner shipping company [8]. Con-sidering the transport sector, Lo et al. [9] analyzed the determinants of carbon emissionsin air transport passenger traffic using Italy as a case study. They found that aircraft sizedecreases the emission per available seat kilometers but it increases total emissions [9].The impact of economic growth on Azerbaijan carbon emissions shows that economicgrowth has a positive statistically significant impact on carbon emissions [10]. WhileAndersson et al. [11] presented the relationship between firm ownership and provincialcarbon emissions in China, Lin and Xu [12] analyzed the regional differences in carbonemission efficiency in the Chinese metallurgical industry. In both studies, it is highlightedthat carbon emission is an imminent global issue.
Nigeria has the largest economy and population in African and it is among the top10 most populated in the world. Just like many African countries, Nigeria is still facedwith the difficulty of meeting its ever-increasing population’s energy (especially electricity)demand [13]. Different governmental reforms and policies to rescue the situation in theenergy sector have been ineffective over the years. The power sector has failed to provideelectricity to over 40% of Nigerians in the last 10 years and over 80 million of its citizens arewithout access to electricity [14]. Even after five years of privatizing the electricity sector,the country’s electricity generation, transmission, and distribution remain erratic [15].Ali et al. reported that the investors who acquired the electricity distribution and generationcompanies are grappled with problems like gas shortfall, water management, inadequatesupply, electricity theft, limited distribution networks, and huge metering gap [1].
The energy crisis in the country has drawn both research and political attention to theneed for an imminent solution and alternative sources to complement the existing system.Most researches [16–18], have proffered renewable energy integration is the most sustain-able way forward. Ogundimu and Okoroigwe [19] presented the prospect and challengesof solar thermal energy for electricity production in Nigeria. They reported that fossilfuels subsidy in the country and the cost of solar thermal technology are two main factorsdiscouraging investors and ultimately hindering the use of solar thermal technologiesfor electricity generation. Ejiofor et al. [20] studied the potential of rice husk gasificationtechnology for off-grid electricity generation in Nigeria. A 1.52 MW power generationpotential from rice husk which includes a yearly, monthly, and daily total generation of13,132.8 MWh, 1094.4 MWh, and 36.48 MWh was reported from the study. The potential forelectricity generation from abattoir wastes in Nigeria was presented in another study andan estimated range of 1040 MWh to 1665 MWh of electricity could be generated monthlyfrom these wastes [4]. In another study, Tegina et al. [21] proposed the use of solar PVand wind turbines to fully drive the electricity sector. It was also estimated that about1.54 million renewable energy technology jobs can be created in Nigeria by 2050. Similarly,

Sustainability 2021, 13, 2229 3 of 24
Bamisile et al. [13] developed an approach for sustainable energy planning towards the fullelectrification of Nigeria by 2030 with the use of fossil fuels and renewable energy sources.
In all the aforementioned studies, it has been established that there is a need to increaseelectricity production in Nigeria, however, the impact of the on-going electricity crisis onthe country’s economy is yet to be studied. Although Ali et al. [1] studied economic growth,urbanization, and electricity consumption nexus, their research only focused on the effectof rural-urban migration impact on electricity consumption and economic development.Though globalization, electricity consumption, and economic growth have been establishedas major players in the world’s environmental degradation in literature [22], this study onlyconsidered the top 10 electricity consuming countries globally. Therefore, in this paper,the impact of the electricity crisis in Nigeria on its economic growth is presented. As theworld seeks to reduce carbon emissions, the sustainability of electricity production hasbeen critically scrutinized in recent years. This research seeks will further this course bystudying the impact of electricity consumption in Nigeria on its carbon emission. Unlikeother existing researches in literature that checked the effect of electricity consumption oneconomic development [23,24] or environmental sustainability [25] for different countries,the present study will further present a techno-economic analysis of a proffered solution tothe imminent electricity crisis. This study is novel as different time-series regression modelsare used to analyze the effect of electricity consumption on economic development andenvironmental sustainability. Also, RETScreen professional software is used to performa techno-economic analysis and determine the feasibility of a small-scale off-grid solarphotovoltaic (PV) system integrated for electricity generation. While the technical analysiswill focus on the sizing of the system, the economic feasibility will present the paybackperiod, net present value, and internal rate of return for the sized system. Ten differentlocations across Nigeria will be considered within the scope of this study for solar PVinstallation. This study will serve as a template for researchers to check the electricityconsumption, carbon emission, and economic growth nexus. It will also enhance theknowledge of scholars about the techno-economic analysis of solar energy technology. Abrief summary of Nigeria’s energy sector is presented in Section 2 of this paper while theelectricity crisis in this country is detailed in Section 3. The effect of electricity consumptionon the economic development and environmental sustainability of Nigeria based on datacollected between 1971 and 2014 will be is presented in Section 4. A viable solution to theelectricity crisis is proposed and analyzed in Section 5. The main concluding points arehighlighted in Section 6.
2. Overview of Nigeria’s Energy and Electricity Sector
The electricity system in Nigeria is dominated by natural gas power plants. It accountsfor 85% of the electricity produced while cars (and the transport sector in general) runsfully on diesel and gasoline (petrol) [26]. Therefore, satisfying the unmet electricity demandwithout increasing greenhouse gas emissions and considering resource constraints willcreate a dilemma for Nigeria’s energy decision-makers. To solve this crucial problem, thegovernment has developed the National Renewable Energy and Energy Efficiency Policy(NREEEP). This policy is proposed for the sustainable development agenda and this willcontribute to CO2 mitigation without ignoring its developmental priorities [27]. It outlinesvarious programs and policies for the deployment and utilization of RE technologies. TheNREEEP has short-term, medium-term, and long-term targets to integrate wind and solarenergy into the commercial electricity sector. The long-term target year is 2030 and thisincludes the integration of over 6000 MW of solar (PV and CSP) electricity with otherrenewable electricity into the country’s power sector [28].
Nigeria has both Renewable (RE) and non-RE (conventional fossil) resource deposits inlarge quantities. However, these resources are un/under-utilized, leading to critical energypoverty in the country. For conventional energy or fossil fuel resources, Nigeria has a vastdeposit of natural gas, coal, oil, and lignite. For renewables, there is a large potential energysource like solar, wind, biomass to hydropower [29]. Table 1 summarizes the reserves and

Sustainability 2021, 13, 2229 4 of 24
potentials RE in Nigeria. Other fossil fuel sources like tar sand, bitumen, etc. are alsoavailable in the country [30]. Nigeria’s key Renewable Energy Sources (RES) are hydro,solar, biomass, geothermal energy, and wind [16]. Based on research, installing wind powerplants appears to be more realistic in the coastal and northern parts of Nigeria [31]. Somepotential sites for geothermal energy have been discovered in Nigeria, but they are yet to beexplored on a large and useful scale. Some of the key factors limiting RE growth in Nigeriaare (a) large fossil fuel deposits, (b) inadequate market clarity on the benefits/opportunitiesof RE to the private sector, (c) subsidies on oil and gas products, (d) high knowledge gapson the financial support mechanisms available, and (e) poor power grid network [30].
Nigeria has 23 on-grid generating plants with a total installed capacity of 10,396 MW(out of which 6056 MW is the maximum available capacity). The only RE power plant con-nected to the power grid is hydro with an installed and an available capacity of 1938.4 MWand 1060 MW [32]. Also, there is a critical imbalance between power generation and trans-mission in Nigeria. The transmission network capacity is 5300 MW which is 29% lower thanthe theoretical generating capacity of 7500 MW and also about 41% lower than the availablegeneration capacity. Because of the obvious inherent reliability issues in the transmissioninfrastructure, transmission losses are generally up to 7.4% [32]. Inadequate technologicalinfrastructure, pertinent transmission issues, limited/zero access to the power grid, andinsufficient power supply have all contributed to the energy poverty that has dominatedNigeria [33]. It is appalling that about 40% of Nigerians do not have access/connectionto the electricity grid [13], while a significant percentage of those connected only haveelectricity from 0 to 15 hours daily [34]. Presently, it is practically impossible to have100% renewable electrification as the hydro-power potential is limited [17]. To provide asolution to Nigeria’s electricity problem, researchers have made a series of recommenda-tions. Aliyu et al. [35] detailed Nigeria’s electricity crisis with a special focus on capacityexpansion and power generation. A 100% RE use for Nigeria electricity generation; compre-hensive analysis of available RES and their potential for electricity generation was carriedout Akuru et al. [17]. Considering the population and other factors, the future electricitydemand for Nigeria was estimated in another study [36]. Electricity generation capacitywas speculated to be 160 GW [33] and that load demand would be 19.6 TWh by the year2030 [37].
The feasibility of generating hydrogen from biogas in south-western Nigeria has beenanalyzed and it was found that about 40.5 million tons of hydrogen could be generatedyearly thereby producing 19.46 GWh of electricity [38]. The prospect of thermal gridelectricity based on CSP was also reviewed by Ogunmodimu and Edmund [39] whileEnongene et al. [40] analyzed the prospects of solar PV systems in residential buildings.Both studies found that solar energy is one of the most viable solutions to the presentenergy crisis in Nigeria. The effect of electricity consumption on economic developmentwas presented in another literature [41]. It was discovered that the high the electricitydemand and supply, the more the boost in the economy of the country.
Table 1. Nigeria’s RE and non-RE reserves, potentials, and potentials [42,43].
Resource Reserve Production
Crude Oil 5.24 Btoe (37,453 million bbl) 1.83 × 10⁹ bbl/day
Solar About 4.2 × 10⁶ MWh/day using 0.1% land area (potentialof 3.5 kWh/m2–7.0 kWh/m2 daily) 6 MWh/day
Natural Gas 1.93 × 10¹⁴ scf 2.78 × 10¹² scfSmall Hydropower 3500 MW (0.34 Btoe) 30 MWLarge Hydropower 11,250 MW (0.8 Btoe) 1938 MW
Wind 4 m/s at 12% probability, 70 m height, 20 m rotor (2–4 m/sat 10 m height) -
Coal and Lignite 2.175 × 10⁹ tonne -Animal Waste 2.45 × 10⁶ assorted animals in 2001 7.81 × 10⁵ ton of waste/day
Tar Sand 3.1 × 10¹⁰ bbl equivalent -

Sustainability 2021, 13, 2229 5 of 24
Table 1. Cont.
Resource Reserve Production
Municipal Waste 1.85 × 10⁷ ton (0.5 kg/capita/day) -Energy Crops 2.82 × 10⁷ hectares of arable land 2.56 × 10⁵ ton of assorted crops/day
Fuel Wood 1.1 × 10⁷ hectares of forest and woodland 1.20 × 10⁵ ton/dayAgricultural Residues 9.14 × 10⁷ ton/yr -
Renewable Energy Potential and Utility in Nigeria
Solar energy is abundant and it is the most promising of all the RES in Nigeria. It hasreceived much attention in recent decades due to the abundance of sunlight and it is seen tobe a promising renewable energy source for the future [44]. Nigeria is close to the equator;hence the potential for large-scale solar development to drive the economy is feasible. Theannual technical potential of solar energy with a 5% conversion efficiency in Nigeria isestimated to be 1.50 × 10¹⁸ J of energy [45]. The estimated average radiating solar energyin Nigeria is about 3.84 kWh/m2/day and this is about 1.082 million tons of oil equivalentin a day [45]. The solar potential in this country is also about 4000 times the current dailycrude oil production and about 13,000 times the natural gas daily production [46]. The totalenergy demand of the nation could be met if only 0.1% of the total solar energy potentialon Nigeria’s landmass is converted to electricity (using a 1% efficiency) [47]. In 2018, thetotal solar energy utilized to generate electricity only produced 28.2 GWh [48].
Despite the relatively huge potential of wind power generation in Nigeria, its devel-opment has been nonexistent over the years. The only prominent wind power plant inNigeria is located in Rimi village, Katsina state and it has 37 wind turbines with a totalcapacity of 10 MW [49]. It is disappointing that despite the enormous potential, the totalwind energy utilized for commercial electricity generation is zero or not documented as of2019 [48]. Power generation using large hydropower contributes about 30% to the totalinstalled generation capacity [50].
The combined electricity generation capacity from small hydropower in Nigeria isabout 3500 MW [51]. In this country, energy is obtained from the 3 major hydropowerstations at Kainji, Jebba, and Shiroro [52]. According to International Renewable EnergyAgency (IRENA) [48], in 2018, the total hydropower potential (excluding pumped storage)utilized for electricity generation in Nigeria produced 6758 GWh.
Biomass is one of the potential resources for enormous RE power generation because ofits availability and the application of traditional biomass energy in Nigeria. If this resourceis tapped, it will reduce the adversative environmental and socio-economic effects ofenergy shortages in the country [53]. However, structured policies should be implementedeffectively. Nigeria has the potential to produce an estimated 47.97 MTOE annually frombiomass resources [54], however, it is very difficult to determine the consistency of thisresource (Figure 1). Biomass production for energy generation can be a direct replacementfor fossil fuels and also serve as a backup for the exhaustible fossil fuel resources. Thiswill in turn reduce CO2 emissions and further decrease global warming [53]. The biogaspotentials in Nigeria are vast but technical skills and infrastructures for widespread biogasproduction are insufficient [50]. On average, over 60,952 tons of CO2 can be reducedyearly if biogas is used to displace kerosene [55]. The IRENA has documented that thetotal bioenergy utility for the purpose of generating electricity in Nigeria is 25 GWh.This amount is from bioenergy solid biofuels (no electricity is generated from biogas andbioenergy municipal wastes) [48]. Table 2 presents the total renewable electricity generatedin Nigeria in 2018 compared with other countries as reported by IRENA [48]. The reportincludes electricity generation from renewable energy resources such as hydropower, windenergy onshore, wind energy offshore, solar PV, solar thermal, bioenergy (solid biofuels),bioenergy (biogas), bioenergy (municipal wastes), geothermal energy, and marine energy.

Sustainability 2021, 13, 2229 6 of 24
Sustainability 2021, 13, x FOR PEER REVIEW 6 of 25
The report includes electricity generation from renewable energy resources such as hy-dropower, wind energy onshore, wind energy offshore, solar PV, solar thermal, bioenergy (solid biofuels), bioenergy (biogas), bioenergy (municipal wastes), geothermal energy, and marine energy.
Figure 1. Nigeria renewable (solar/wind) energy potential and electricity sector outlook [55–57].
Table 2. Renewable electricity generation in Nigeria compared with other countries in 2018.
RE Country
Hydrpower Wind Wind Solar Solar Bioenergy Bioen-ergy
Bioenergy Geother-
mal Ma-rine
Total
(Excl. Pumped Stor-age)
(On-shore)
(Off-shore)
(PV) (Ther-mal)
(Solid Biofu-els)
(Biogas) (Municipal
Waste)
GWh GWh GWh GWh GWh GWh GWh GWh GWh GWh GWh
China 1,199,200 357,340 - 178,06
2 - 40,833 - 23,264 - -
1,798,699
USA 295,501 275,732 - 81,244 3940 45,893 13,259 8382 18,773 0 742,724 Brazil 388,971 48,489 - 3987 - 53,364 - - - 494,811
Germany 17,975 90,484 90,467 45,784 - 10,827 33,416 6163 178 - 295,294 India 131,650 55,009 30,707 - 17,781 188 - 235,335 UK 5490 30,217 26,687 12,857 - 23,532 5701 3638 9 108,131
Spain 34,334 50,885 - 7877 4867 4221 923 755 0 103,862 Turkey 59,938 19,949 - 7800 - 474 2159 - 7431 - 97,751 S.Africa 889 6467 - 3926 1029 444 45 - - - 12,800
Figure 1. Nigeria renewable (solar/wind) energy potential and electricity sector outlook [55–57].
Table 2. Renewable electricity generation in Nigeria compared with other countries in 2018.
Hydrpower Wind Wind Solar Solar Bioenergy Bioenergy Bioenergy Geothermal Marine Total
Country
RE (Excl. PumpedStorage) (Onshore) (Offshore) (PV) (Thermal) (Solid Biofuels) (Biogas) (Municipal Waste)
GWh GWh GWh GWh GWh GWh GWh GWh GWh GWh GWhChina 1,199,200 357,340 - 178,062 - 40,833 - 23,264 - - 1,798,699USA 295,501 275,732 - 81,244 3940 45,893 13,259 8382 18,773 0 742,724
Brazil 388,971 48,489 - 3987 - 53,364 - - - 494,811Germany 17,975 90,484 90,467 45,784 - 10,827 33,416 6163 178 - 295,294
India 131,650 55,009 30,707 - 17,781 188 - 235,335UK 5490 30,217 26,687 12,857 - 23,532 5701 3638 9 108,131
Spain 34,334 50,885 - 7877 4867 4221 923 755 0 103,862Turkey 59,938 19,949 - 7800 - 474 2159 - 7431 - 97,751S.Africa 889 6467 - 3926 1029 444 45 - - - 12,800Nigeria 6758 - - 28 - 25 0 - - - 6811Ghana 6017 - - 43 - 17 0 - - - 6077
3. Nigeria Electricity Sector Crisis
The unavailability and inaccessibility of electricity in Nigeria keep increasing yearlyand this is a major challenge yet to be resolved [13]. Globally, Nigeria is one of thepoorest countries in terms of electricity generation. The grid-connected electricity per-capita consumption of this nation is 126 kWh. This is very low when compared withother African/developing countries (South Africa (3926 kWh) and Ghana (361 kWh)) [58].Over 41% of the Nigerian populace has little or no access to electricity; this is more than

Sustainability 2021, 13, 2229 7 of 24
80 million people. Nigeria’s power sector problems affect the generation, transmission,and distribution arm of the power network. It is noteworthy that just 25% of the generatedelectricity is delivered for users’ consumption [59]. The remaining 75% is lost in thegeneration, transmission, and distribution process. Nigeria depends on gas-fired powerplants for more than 80% of its electricity while hydropower generates less than 20% [60].For several decades, electricity crisis in Nigeria has become a norm. This has led to the baneof her economic growth and development. The root causes of this deficiency are connectedto financial, sociopolitical, and structural issues [60]. The major challenges facing the powergeneration companies are highlighted as follows:
• Pipelines are frequently vandalized by militants in Nigeria. Between June 2014 andJune 2015, Nigeria National Petroleum Corporation (NNPC) recorded 3400–4000 at-tacks on the various pipeline locations in the country [61].
• Secondly, purchasing gas from the oil and gas companies to ensure adequate deliveryof gas to fire the thermal power plants is another key issue. This is due to the price atwhich natural gas is sold to the electricity-generating companies. It leads to an increasein the price of electricity which eventually leads to a high cost of doing business [60].
• Thirdly, incessant strike actions embarked upon by different energy-based organiza-tions. This causes gas supply to thermal power stations to be shut-off leading to adrop in the quantity of power available from the national grid by more than 70%. Thisaction is capable of shutting down the country’s economy as the supply of electricity toconsumers is highly dependent on the delivery of natural gas to these power stations.
Nigeria’s power sector is at the mercy of the availability of gas and adequate gassupply infrastructure, creating an urgent need for alternative ways of producing electricity.Finding permanent solutions that will resolve these problems is a herculean task for thegovernment. This situation persists even though Nigeria is well endowed with a largeamount of RE and non- RES. Most of the electricity generated in Nigeria comes from non-RES. Although the Nigerian federal government targets over 30% integration of renewablesinto the energy mix by 2030 [62], it is important for the country to respond to the demandof the circumstances and act fast on its energy policies.
Proposed Solutions to Nigeria Electricity Sector Crisis
In order to meet the high demands of electric power, there is a need to adopt multiplesources of energy with proper energy policies. The low power generation experiencedin Nigeria since independence is mainly due to the nations’ concentrated efforts on elec-tricity generation from only two sources which are hydro and natural gas [63]. Fromkeen observation and obvious results both in literature and experiences, these two energysources have been poorly harnessed and mismanaged. To overcome the challenge of lowpower generation in this country, there is a need to supplement both hydro and gas withother energy sources such as solar and wind [64]. It is also recommended that the currentelectric power generation capacity will have to rise to 160 GW by 2030 to solve Nigeria’selectricity sector crisis [36]. Adequate finance must be set aside for the operation, mainte-nance, upgrading, and expansion of the power sector infrastructure to solve this electricitycrisis. Researchers have recommended different solutions to combat the crisis in Nigeria’selectricity sector and the most outstanding solutions are summarized in Table 3. However,no research in literature considered the role of EVs and hydrogen production in order toenhance renewable integration for electricity generation as a potential solution.

Sustainability 2021, 13, 2229 8 of 24
Table 3. Summary of proposed solutions to Nigeria electricity sector crisis from literature.
References Proposed Solution Description
[65] Energy mix and structured maintenance methodology. Eliminationor minimization of corruption.
[36] Adequate Funding.
[63] Elimination or reduction of gas pipeline and other relatedinfrastructure vandalism.
[66,67]
Introduction of standard electricity reform model to reduce the dominanceof the state government in the power sector. This can be achieved throughthe creation of Independent Regulatory Agencies and private sectorparticipation in the electricity markets.
[18]
Implementing the policy of carbon-neutral energy through strong politicalcommitment at all levels of governance. This is beyond the technicalfeasibility and economic viability of an energy system; it encompasseslong-term and well-designed policy interventions.
[13] Use of natural gas only to meet electricity demand by a single generationtechnology.
[38] Generation of electricity by hydrogen derived from biogas usingfood waste.
[68]
Using hydrogen as a future energy carrier in the transportation, energy,and power sectors. Hydrogen is presented as an alternative fuel that couldreduce energy consumption and reduce/eliminate emissions. The researchshows that if hydrogen-powered vehicles were to become thepredominant mode of road transportation through 2030, there will be asignificant reduction of GHG emissions.
4. Effect of Electricity Consumption on Economic Development and Carbon Emission
In this section, the impacts of the erratic nature of electricity availability to end-users on the country’s overall economic development are analyzed. Also, its effect onthe environmental sustainability of Nigeria is considered. Panel estimators are used inregressing electricity consumption against economic indicators. The details of the methodand the result of the analysis are presented in the subsequent subsections.
4.1. Panel Estimator
In analyzing the effect of inadequate electrification on economic development andenvironmental sustainability in Nigeria, economic development and greenhouse emissionsdata have been collected. First, the effect of economic development on electricity con-sumption between 1981–2014 is analyzed. The economic development indicator variablesutilized in the model as the explanatory variables include gross national income (GNI),trade, gross domestic savings (GDS), and domestic credit to the private sector (DCPS). Elec-tricity consumption is the primary response variable. Second, Nigeria’s carbon emissionsdata in six categories namely total carbon emissions, emissions by the power industry, bythe transportation sector, by buildings, by other combustion industries, and by other sectorsare used as response variables against economic development between 1981–2014. Third,the effect of carbon emissions on electricity consumption in Nigeria is analyzed by usingthe categorized carbon emissions data as predictor variables and electricity consumptionas the response variable between 1971–2014.
GNI has been used in place of GDP as it has become a preferable measure of eco-nomic growth in the past few decades. While GDP measures the gross value added byresidents within a country, GNI considers the total value produced by a country fromwithin and without. The major shortcoming of simply using GDP is that it fails to attributeappropriately, the economic ups and downturns as real changes in cyclical fluctuations.GNI is therefore a reliable alternative with a more complete picture as an economic met-

Sustainability 2021, 13, 2229 9 of 24
ric. In checking the impact of economic development on carbon emissions, Lin et al. [69]and Dong et al. [70], also considered GNI as a more appropriate measure of economicgrowth. Trading of goods and services alongside FDI inflow are often considered as factorsleading towards economic growth [71,72]. Increased savings and domestic credit to theprivate sector which depicts investment into the private sector have also been added aseconomic development indicators. Table 4 provides the variables, definition, sources, andabbreviations for all the predictor and response variables used in the present study.
Table 4. Definition of Variables.
Variable Abbreviation Definition Source
Electricity Consumption Elec.C Annual electric power consumptionproduced by powerplants. World Bank Data (WBS)
CO2 Total TCO2
Annual fossil CO2 emissions andincluding sources from fossil fuel usagenamely combustion, industrial processes
(cement, steel, urea, and chemicals),flaring, and product usage measured in
Mt CO2/yr.
Publication Office of theEuropean Union (POEU)
Database
CO2 per capita CO2Pc Annual fossil CO2 emissions per capita. POEU
CO2 by Power Industry CO2Pi Annual fossil CO2 emissions by countryby the power industry. POEU
CO2 by Buildings CO2B Annual fossil CO2 emissions bybuildings in a country. POEU
CO2 by Transport CO2T Annual fossil CO2 emissions by thetransportation system in a country.
CO2 by Other CombustionIndustries CO2OCI Annual fossil CO2 emissions by other
combustion industries within a country. POEU
CO2 by Other Sectors CO2OSPer capita annual fossil CO2 emissions
within a country. Measured by tCO2/cap/yr.
POEU
Gross National Income GNI
The sum gross domestic product of acountry including the net incomes from
abroad. It indicates the annual valueproduced by a country’s economy [73].
WBS, OECD
Gross Domestic Savings GDS
This is calculated as GDP minus the finalexpenditure of consumption. It includessavings of the private and public sectors,
as well as households [74].
WBS, OECD
Trade% of GDP TradeThis is the sum of all imports and exports
of goods and services measured as apercentage of GDP [75]
WBS, OECD
Domestic Credit to the PrivateSector by Banks: DCPS
This refers to the financial resourcesprovided to the private sector by
depository corporations excluding thecentral bank which all establish a claim
for repayment measured as a percentageof GDP [76].
International Monetary Fund
Two time series data sets have been collected for Nigeria. First, economic data andelectricity consumption data between 1981–2014, and carbon emissions and electricityconsumption data from 1971–2014. The analysis is done by using the time series linearregression model according to the literature specifications [77,78]. First, the analysis is

Sustainability 2021, 13, 2229 10 of 24
done in static form, and then in one-year finite distributed lag form with all autoregressivedynamics in place. The standard static time series formula is therefore implemented as:
Yt = αt + xtβt + εt (1)
where Y is the dependent variable, t time period, β the population Y-intercept, and ε theerror term. With the finite distributed lag form defined as:
Yt = α0 + β0zt + β1zt−1 + β2zt−2 + εt (2)
As a robustness measure, the autoregressive integrated moving average (ARIMA)test model is also utilized in order to capture autoregressive dynamics more explicitly. TheARIMA test model is most appropriate as a robustness measure for better understanding,analyses, and forecasting of the time series data. The standard ARIMA model formula istherefore implemented as:
(1 − ∑ pi=1αiLi)Xt = (1 + ∑ q
i=1θiL1) εt (3)
where L is the lag operator, αi are the autoregressive parameters, and ε the error term. Theaugmented dickey-fuller test for stationarity is also carried out.
Stata and R statistical program has been used as the tool for running each economet-ric model described above and also for plotting the bivariate scatter plots. Table 5 reportsthe descriptive statistics first for electricity consumption, carbon emissions, and economicdevelopment for Nigeria between 1981–2014, and then electricity consumption and carbonemissions from 1971–2014.
Table 5. Descriptive Statistics.
1981–2014
Variables Mean Std. Dev. Min Max N
Elec.C 101.0467 26.81432 50.90104 156.797 34TCO2 87.39029 11.8151 68.05 106.12 34CO2PI 7.07 2.083216 4.67 12.64 34CO2B 5.176765 1.342988 2.79 8.63 34CO2T 19.81029 5.650716 11.76 29.59 34
CO2OCI 10.40412 3.84016 5.43 18.4 34CO2OS 41.32088 10.71773 25.29 66.56 34
GNI 1.50 × 10¹¹ 1.46 × 10¹¹ 2.54 × 10¹⁰ 5.50 × 10¹¹ 34DCPS 9.216964 4.369579 4.948031 22.26723 34Trade 33.06722 12.9492 9.135846 53.27796 34GDS 5.68 × 10¹⁰ 4.02 × 10¹⁰ 1.41 × 10¹⁰ 1.52 × 10¹¹ 34
1971–2014
Elec.C 88.86668 33.32896 28.57044 156.797 44TCO2 81.25591 17.16356 34.87 106.12 44CO2PI 5.824773 2.976317 0.59 12.64 44CO2B 4.456591 1.84232 0.9 8.63 44CO2T 16.98455 7.442569 2.98 29.59 44
CO2OCI 8.690682 4.671511 1.23 18.4 44CO2OS 42.19409 10.55306 25.29 66.56 44
4.2. Empirical Results and Discussions
In this section, the time series static, finite distributed lag, and ARIMA test modelestimation results are discussed to check the effect of economic development on electricityconsumption and carbon emissions, as well as the impact of carbon emissions on electric-ity consumption in Nigeria between 1981–2014, and 1971–2014 respectively. Economicdevelopment indicators used include GNI, trade, GDS, and DCPS. To first get a visualrepresentation of the correlation between these variables, bivariate scatter plots have been

Sustainability 2021, 13, 2229 11 of 24
provided in Figures 2 and 3 showing the effect of electricity consumption on economicdevelopment from 1981–2014, and then the carbon emissions and electricity consumptionnexus effect.
Sustainability 2021, 13, x FOR PEER REVIEW 11 of 25
Figure 2. Effect of Economic Development on Electricity Consumption from 1981–2014.
Figure 2. Effect of Economic Development on Electricity Consumption from 1981–2014.
Sustainability 2021, 13, x FOR PEER REVIEW 11 of 25
Figure 2. Effect of Economic Development on Electricity Consumption from 1981–2014.
Figure 3. Cont.

Sustainability 2021, 13, 2229 12 of 24Sustainability 2021, 13, x FOR PEER REVIEW 12 of 25
Figure 3. Effect of Carbon Emissions on Electricity Consumption from 1971–2014.
In Figure 2, a strong positive correlation effect is evident between electricity con-sumption and GNI, as well as electricity consumption and gross domestic savings be-tween 1981 and 2014 while the others do not show particularly strong positive or negative correlations. This signifies that as electricity consumption increases, the GNI of the coun-try increase. This further stresses the need for more electricity supplies to end-users as this will increase the overall economic development of the country. The negative correlation between electricity correlation and GDS is a reflection of the current reality of the country. Due to the erratic nature of the electricity supply available, many end-users are forced to generate their own electricity using small-scale electricity generating sets (popularly known as generators). The purchase, operation, and maintenance of these generators con-sume a significant amount of their income, thereby reducing their savings. Hence the neg-ative correlation between electricity consumption and GDS.
In Figure 3, strong positive correlation effects are evident in the case of carbon emis-sions by buildings, by the power industry, and by other combustion industries on elec-tricity consumption in Nigeria between 1971 and 2014. However, it is noteworthy that electricity consumption does not affect the total CO2 emission of the nation. To empirically test these nexus effects, the time series regression model is utilized in static form and then in one year finite distributed lag form. As a robustness measure, the ARIMA test model is implemented to check these effects. Table 6 comprehensively reports findings for all 3 models as regards the effect of economic development on electricity consumption and carbon emissions in 6 layers.
Figure 3. Effect of Carbon Emissions on Electricity Consumption from 1971–2014.
In Figure 2, a strong positive correlation effect is evident between electricity consump-tion and GNI, as well as electricity consumption and gross domestic savings between 1981and 2014 while the others do not show particularly strong positive or negative correlations.This signifies that as electricity consumption increases, the GNI of the country increase.This further stresses the need for more electricity supplies to end-users as this will increasethe overall economic development of the country. The negative correlation between elec-tricity correlation and GDS is a reflection of the current reality of the country. Due to theerratic nature of the electricity supply available, many end-users are forced to generatetheir own electricity using small-scale electricity generating sets (popularly known asgenerators). The purchase, operation, and maintenance of these generators consume asignificant amount of their income, thereby reducing their savings. Hence the negativecorrelation between electricity consumption and GDS.
In Figure 3, strong positive correlation effects are evident in the case of carbon emis-sions by buildings, by the power industry, and by other combustion industries on electricityconsumption in Nigeria between 1971 and 2014. However, it is noteworthy that electricityconsumption does not affect the total CO2 emission of the nation. To empirically testthese nexus effects, the time series regression model is utilized in static form and thenin one year finite distributed lag form. As a robustness measure, the ARIMA test modelis implemented to check these effects. Table 6 comprehensively reports findings for all3 models as regards the effect of economic development on electricity consumption andcarbon emissions in 6 layers.
Sustainability 2021, 13, 2229 13 of 24
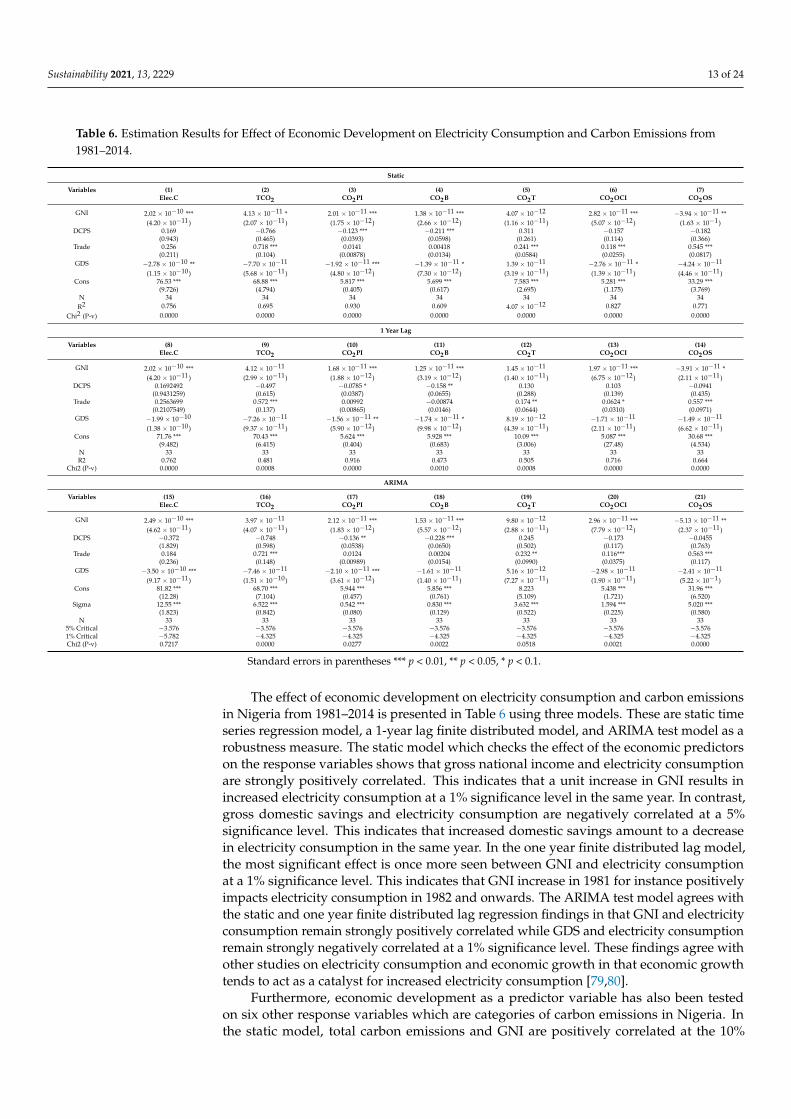
Table 6. Estimation Results for Effect of Economic Development on Electricity Consumption and Carbon Emissions from1981–2014.
Static
Variables (1) (2) (3) (4) (5) (6) (7)Elec.C TCO2 CO2PI CO2B CO2T CO2OCI CO2OS
GNI 2.02 × 10⁻¹⁰ *** 4.13 × 10−11 * 2.01 × 10−11 *** 1.38 × 10⁻¹¹ *** 4.07 × 10⁻¹² 2.82 × 10⁻¹¹ *** −3.94 × 10⁻¹¹ **(4.20 × 10⁻¹¹) (2.07 × 10⁻¹¹) (1.75 × 10⁻¹²) (2.66 × 10⁻¹²) (1.16 × 10⁻¹¹) (5.07 × 10⁻¹²) (1.63 × 10⁻¹)
DCPS 0.169 −0.766 −0.123 *** −0.211 *** 0.311 −0.157 −0.182(0.943) (0.465) (0.0393) (0.0598) (0.261) (0.114) (0.366)
Trade 0.256 0.718 *** 0.0141 0.00418 0.241 *** 0.118 *** 0.545 ***(0.211) (0.104) (0.00878) (0.0134) (0.0584) (0.0255) (0.0817)
GDS −2.78 × 10⁻¹⁰ ** −7.70 × 10⁻¹¹ −1.92 × 10⁻¹¹ *** −1.39 × 10−11 * 1.39 × 10−11 −2.76 × 10⁻¹¹ * −4.24 × 10⁻¹¹
(1.15 × 10⁻¹⁰) (5.68 × 10⁻¹¹) (4.80 × 10⁻¹²) (7.30 × 10⁻¹²) (3.19 × 10⁻¹¹) (1.39 × 10⁻¹¹) (4.46 × 10⁻¹¹)Cons 76.53 *** 68.88 *** 5.817 *** 5.699 *** 7.583 *** 5.281 *** 33.29 ***
(9.726) (4.794) (0.405) (0.617) (2.695) (1.175) (3.769)N 34 34 34 34 34 34 34R2 0.756 0.695 0.930 0.609 4.07 × 10⁻¹² 0.827 0.771
Chi2 (P-v) 0.0000 0.0000 0.0000 0.0000 0.0000 0.0000 0.0000
1 Year Lag
Variables (8) (9) (10) (11) (12) (13) (14)Elec.C TCO2 CO2PI CO2B CO2T CO2OCI CO2OS
GNI 2.02 × 10⁻¹⁰ *** 4.12 × 10⁻¹¹ 1.68 × 10⁻¹¹ *** 1.25 × 10⁻¹¹ *** 1.45 × 10⁻¹¹ 1.97 × 10⁻¹¹ *** −3.91 × 10−11 *(4.20 × 10−11) (2.99 × 10⁻¹¹) (1.88 × 10⁻¹²) (3.19 × 10⁻¹²) (1.40 × 10⁻¹¹) (6.75 × 10⁻¹²) (2.11 × 10⁻¹¹)
DCPS 0.1692492 −0.497 −0.0785 * −0.158 ** 0.130 0.103 −0.0941(0.9431259) (0.615) (0.0387) (0.0655) (0.288) (0.139) (0.435)
Trade 0.2563699 0.572 *** 0.00992 −0.00874 0.174 ** 0.0624 * 0.557 ***(0.2107549) (0.137) (0.00865) (0.0146) (0.0644) (0.0310) (0.0971)
GDS −1.99 × 10⁻¹⁰ −7.26 × 10⁻¹¹ −1.56 × 10⁻¹¹ ** −1.74 × 10−11 * 8.19 × 10−12 −1.71 × 10⁻¹¹ −1.49 × 10⁻¹¹
(1.38 × 10⁻¹⁰) (9.37 × 10⁻¹¹) (5.90 × 10⁻¹²) (9.98 × 10⁻¹²) (4.39 × 10⁻¹¹) (2.11 × 10⁻¹¹) (6.62 × 10⁻¹¹)Cons 71.76 *** 70.43 *** 5.624 *** 5.928 *** 10.09 *** 5.087 *** 30.68 ***
(9.482) (6.415) (0.404) (0.683) (3.006) (27.48) (4.534)N 33 33 33 33 33 33 33R2 0.762 0.481 0.916 0.473 0.505 0.716 0.664
Chi2 (P-v) 0.0000 0.0008 0.0000 0.0010 0.0008 0.0000 0.0000
ARIMA
Variables (15) (16) (17) (18) (19) (20) (21)Elec.C TCO2 CO2PI CO2B CO2T CO2OCI CO2OS
GNI 2.49 × 10⁻¹⁰ *** 3.97 × 10⁻¹¹ 2.12 × 10⁻¹¹ *** 1.53 × 10⁻¹¹ *** 9.80 × 10⁻¹² 2.96 × 10⁻¹¹ *** −5.13 × 10⁻¹¹ **(4.62 × 10⁻¹¹) (4.07 × 10⁻¹¹) (1.83 × 10⁻¹²) (5.57 × 10⁻¹²) (2.88 × 10⁻¹¹) (7.79 × 10⁻¹²) (2.37 × 10⁻¹¹)
DCPS −0.372 −0.748 −0.136 ** −0.228 *** 0.245 −0.173 −0.0455(1.829) (0.598) (0.0538) (0.0650) (0.502) (0.117) (0.763)
Trade 0.184 0.721 *** 0.0124 0.00204 0.232 ** 0.116*** 0.563 ***(0.236) (0.148) (0.00989) (0.0154) (0.0990) (0.0375) (0.117)
GDS −3.50 × 10⁻¹⁰ *** −7.46 × 10⁻¹¹ −2.10 × 10⁻¹¹ *** −1.61 × 10⁻¹¹ 5.16 × 10⁻¹² −2.98 × 10⁻¹¹ −2.41 × 10⁻¹¹
(9.17 × 10⁻¹¹) (1.51 × 10⁻¹⁰) (3.61 × 10⁻¹²) (1.40 × 10⁻¹¹) (7.27 × 10⁻¹¹) (1.90 × 10⁻¹¹) (5.22 × 10⁻¹)Cons 81.82 *** 68.70 *** 5.944 *** 5.856 *** 8.223 5.438 *** 31.96 ***
(12.28) (7.104) (0.457) (0.761) (5.109) (1.721) (6.520)Sigma 12.55 *** 6.522 *** 0.542 *** 0.830 *** 3.632 *** 1.594 *** 5.020 ***
(1.823) (0.842) (0.080) (0.129) (0.522) (0.225) (0.580)N 33 33 33 33 33 33 33
5% Critical −3.576 −3.576 −3.576 −3.576 −3.576 −3.576 −3.5761% Critical −5.782 −4.325 −4.325 −4.325 −4.325 −4.325 −4.325Chi2 (P-v) 0.7217 0.0000 0.0277 0.0022 0.0518 0.0021 0.0000
Standard errors in parentheses *** p < 0.01, ** p < 0.05, * p < 0.1.
The effect of economic development on electricity consumption and carbon emissionsin Nigeria from 1981–2014 is presented in Table 6 using three models. These are static timeseries regression model, a 1-year lag finite distributed model, and ARIMA test model as arobustness measure. The static model which checks the effect of the economic predictorson the response variables shows that gross national income and electricity consumptionare strongly positively correlated. This indicates that a unit increase in GNI results inincreased electricity consumption at a 1% significance level in the same year. In contrast,gross domestic savings and electricity consumption are negatively correlated at a 5%significance level. This indicates that increased domestic savings amount to a decreasein electricity consumption in the same year. In the one year finite distributed lag model,the most significant effect is once more seen between GNI and electricity consumptionat a 1% significance level. This indicates that GNI increase in 1981 for instance positivelyimpacts electricity consumption in 1982 and onwards. The ARIMA test model agrees withthe static and one year finite distributed lag regression findings in that GNI and electricityconsumption remain strongly positively correlated while GDS and electricity consumptionremain strongly negatively correlated at a 1% significance level. These findings agree withother studies on electricity consumption and economic growth in that economic growthtends to act as a catalyst for increased electricity consumption [79,80].
Furthermore, economic development as a predictor variable has also been testedon six other response variables which are categories of carbon emissions in Nigeria. Inthe static model, total carbon emissions and GNI are positively correlated at the 10%

Sustainability 2021, 13, 2229 14 of 24
significance level while trade and total carbon emissions are strongly positively correlatedat the 1% significance level. This indicates that as an economic development indicator,trading activity increases amount to increases in total carbon emissions in the same year.Strong significant effects are also evident in terms of carbon emissions by the powerindustry and by buildings. For these two categories, GNI increase amounts to increasedcarbon emissions while DCPS and emissions are strongly negatively correlated at a 1%significance level. This indicates that as domestic credit to the private sector in Nigeriaincreases, emissions by the power industry and buildings decrease in tandem.
As for the transportation sector, an increase in trading activities is found to negativelyaffect carbon emissions levels in the same year and similarly in the case of a one-year lag.Such that increased trading activities aggravate the carbon emissions by the sector. Thisfinding agrees with recent studies that have found the carbon footprint of the transportationsector especially high [81,82].
Additionally, carbon emissions by the other combustion industries and sectors aresimilarly found to be aggravated by increases in trading activities. Interestingly, althoughcarbon emissions by the other combustion industries are aggravated by increases in grossnational income, a negative effect is the case in terms of emissions by all other sectors.Indicating that carbon emissions are reducing in other economic sectors besides building,transport, and the power industry. These findings are further reiterated by the ARIMAtest model at stronger significance levels. Table 7 reports the estimation results of the3 models on the effect of carbon emissions on electricity consumption between 1971–2014. The first and second models are the time series regression in static form and thenone-year finite distributed lag form. ARIMA test model is used as the third model as arobustness measure. All autoregressive dynamics are in place.
Table 7. Effect of Carbon Emissions on Electricity Consumption from 1971–2014.
(1) (2) (3)Variables Static 1 lag ARIMA
TCO2 −0.196 −0.00651 −0.183(0.608) (0.729) (0.472)
CO2PI 6.551 ** 6.890 ** 7.382 ***(2.579) (3.055) (2.571)
CO2B −2.049 −2.162 −2.289(2.570) (3.034) (2.631)
CO2T 0.335 −0.424 −0.0354(0.710) (0.844) (0.677)
CO2OCI 3.445 *** 3.620 ** 3.722 ***(1.179) (1.415) (1.282)
CO2OS −0.116 −0.0865 −0.110(0.582) (0.688) (0.455)
Constant 45.04 *** 35.88 ** 44.35 ***(10.67) (14.26) (9.519)
Sigma 9.666 ***(1.581)
N 44 43 431% Critical −4.2335% Critical −3.536
R2 0.909 0.868Chi2 0.0000 0.0000 0.0000
Standard errors in parentheses *** p < 0.01, ** p < 0.05.
Using the time series static regression model, Table 7 shows that carbon emissionsby the power industry and by the other combustion industries have strong positivelysignificant correlations with electricity consumption at 5% and 1% significance levelsrespectively. This indicates that increased carbon emissions by the power and othercombustions industries amount to increased electricity consumption rates in the same

Sustainability 2021, 13, 2229 15 of 24
year. The one year finite distributed lag model also provides the same positive significanteffect at the 5% significance level. It shows that increased carbon emissions by the powerand other combustion industries in 1971 for instance, results in an increase in electricityconsumption in 1972. The ARIMA test model further reiterates the same finding at the1% significant level with significant sigma and critical values. As the power industry ispredominantly responsible for energy production and the other combustion industries forhigh levels of greenhouse gas emissions, it is no surprise that out of all the sectors, theirimpact on electricity consumption is most evident.
5. The Way Forward; Techno-Economic Feasibility of Solar PV System in Nigeria
As stated in Section 3, different researchers have proposed different methods tosolve the current electricity crisis in Nigeria. One of the most feasible solutions is theuse of renewable energy sources for electricity generation considering an off-grid systemor a smart/micro-grid. Adesanya and Pearce [83] evaluated the economic viability ofcaptive off-grid diesel and solar PV hybrid energy systems. Their model was proposedfor six different Nigerian private sectors. The analysis results showed that five of thesix sectors had discounted payback times for the systems under the same year and thereturn on investment is greater than 100% [83]. Salihu et al. [84] presented an off-gridPV microgrid developmental study for rural electricity generation in Nigeria. They reportedthat the commissioning of the project in January 2018 improved the economic activitiesand social life of the beneficiary communities greatly [84]. Following the propositions inexisting literature, the present study will present the techno-economic analysis of a 500-kWPV installation for 12 different locations in Nigeria. An off-grid (microgrid) system isconsidered for the feasibility study and a schematic diagram of the PV layout is illustratedin Figure 4. Also, a fixed axis solar PV system is considered as it is the most utilized solarPV technology in Sub-Sahara Africa. Further details about the techno-economic analysisare presented in subsequent subsections.
Sustainability 2021, 13, x FOR PEER REVIEW 16 of 25
technology in Sub-Sahara Africa. Further details about the techno-economic analysis are presented in subsequent subsections.
Figure 4. Solar PV microgrid layout for Nigeria.
5.1. Site Selection The electricity crisis in Nigeria has plagued all its urban and rural communities as
there is no particular location that has 24 h of electricity supply consistently. Therefore, in this study, 12 different locations from all the geo-political zones in Nigeria have been con-sidered for solar PV installation. These locations have been selected based on the available data in the National Aeronautics and Space Administration (NASA) database. The per-formance comparison of solar PV off-grid systems will also be done in this study. This will help determine the most feasible location for the solar PV installation. The details of each of the locations considered in this study are summarized in Table 8.
Table 8. Effect of Carbon Emissions on Electricity Consumption from 1971–2014.
Location Latitude (°N)
Longitude (°E) Elevation (m) Annual Average
Wind Speed (m/s)
Annual Average Daily (Horizontal)
Solar Radiation (KWh/m2/day)
Average Annual Ambient Tempera-
ture (°C)
Aba 5.1 7.4 154 2.1 4.7 25.8 Abuja 9.2 7.2 573 2.4 5.45 26 Ankpa 7.4 7.6 164 2.4 5.12 26.6 Gombe 10.3 11.2 360 3.5 5.77 27.9 Ibadan 7.4 3.9 198 2.5 4.90 26.3 Kaduna 10.5 7.4 615 2.5 5.64 26 Lagos 6.5 3.5 32 2.8 4.74 27.1
Figure 4. Solar PV microgrid layout for Nigeria.

Sustainability 2021, 13, 2229 16 of 24
5.1. Site Selection
The electricity crisis in Nigeria has plagued all its urban and rural communities asthere is no particular location that has 24 h of electricity supply consistently. Therefore,in this study, 12 different locations from all the geo-political zones in Nigeria have beenconsidered for solar PV installation. These locations have been selected based on theavailable data in the National Aeronautics and Space Administration (NASA) database.The performance comparison of solar PV off-grid systems will also be done in this study.This will help determine the most feasible location for the solar PV installation. The detailsof each of the locations considered in this study are summarized in Table 8.
Table 8. Effect of Carbon Emissions on Electricity Consumption from 1971–2014.
Location Latitude (N) Longitude (E) Elevation (m)Annual
Average WindSpeed (m/s)
Annual AverageDaily (Horizontal)
Solar Radiation(KWh/m2/day)
Average AnnualAmbient
Temperature(C)
Aba 5.1 7.4 154 2.1 4.7 25.8Abuja 9.2 7.2 573 2.4 5.45 26Ankpa 7.4 7.6 164 2.4 5.12 26.6Gombe 10.3 11.2 360 3.5 5.77 27.9Ibadan 7.4 3.9 198 2.5 4.90 26.3Kaduna 10.5 7.4 615 2.5 5.64 26Lagos 6.5 3.5 32 2.8 4.74 27.1
Onitsha 6.2 6.8 137 2.1 4.80 26.3Osogbo 7.8 4.6 289 2.3 4.89 26.1
Port Harcourt 4.9 7.0 18 2.1 3.96 26.9Warri 5.5 5.8 18 2.4 2.4 26.8
5.2. Materials and Methods
In this section, the materials used for the simulation of the off-grid PV installation isjustified. RETScreen simulation program is used to execute the designed 500 kW PV system.This simulation program has been used for different techno-economic feasibility studies inexisting works of literature [85–87]. In this study, a China Sunergy PV module with 200 kWpeak capacity is used considering the PV module availability in the RETScreen database.The module has a module efficiency of 15.7% and a practical efficiency of 15.3% (as statedin Table 9). The PV module is also chosen based on its availability in the market and it hasbeen used in other existing studies [87] that considered the feasibility of PV installation.Other details such as current, voltage, operating temperature, etc. of the PV module aresummarized in Table 9.
A 650 kW inverter system is used in modeling the solar PV micro-grid system in accor-dance with works of literature [85–87]. The PV modules and the inverters are consideredto have 3.2% and 1% miscellaneous losses respectively. Also, the inverter used in thisstudy has an efficiency of 95%. The operative relative humidity of the solar PV moduleis 40–95% while the frame of the module is made with an anodized aluminum profile. Insummary, the capacity factor of the PV system varies from one location to the other andthese are similar to the capacity factor used in another study that considered PV installationin Nigeria [13].

Sustainability 2021, 13, 2229 17 of 24
Table 9. Photovoltaic module specifications [87,88].
Item Specification
Manufacturer China SunergyWidth and Length 990 mm × 1956 mm
Module model and type Mono-Si-CSUN200-48MWeight 23.8 kg
Mounting dimensions and thickness 50 mmModule rated power 200 W
Current [@PeakPower] 8.37 AVoltage [@Peak Power] 35.80 V
Module Efficiency 15.7%Practical Efficiency 15.3%Short circuit current 8.83 AOpen circuit voltage. 44.5 V
Operating temperature −40–+85 CFrame Anodized aluminum profile
Standard Operating Conditions (SOC) 25 C, AM 1.5, 1000 W/m2
Operating Relative Humidity 40–95%
5.3. Economic Parameters
To calculate the economic viability of the proposed solution, it is important to usethe appropriate economic variables. It is noteworthy that Nigeria’s currency (Naira) hasbeen fluctuating in recent years and therefore a 420 Naira to a Dollar exchange rate isused for the economic analysis presented while all the calculations are made/presented inDollars. In this study, the total investment (including, installation, PV modules, inverter,development, periodic, engineering, and balance of system component) cost for the 500 kWPV installation is $757,500 [13,89]. Based on the most recent electricity tariff update inNigeria, the electricity pricing used for the economic analysis in this study is $ 0.1484per kilowatt-hour [90]. Also, 1% of the total investment cost is considered as the annualoperation and maintenance (O&M) cost [87]. Furthermore, the interest rate is set at 4%, anda 22-years project life span is used in calculating the economic viability [91]. Although mostsolar PV systems’ life span is 25 years, it is noteworthy that the production of the systemreduces by 10% or more after the first 20–22 years, therefore, 22 years has been used in thisstudy. An inflation rate of 1% is considered while a 15% effective income tax is used forthe analysis.
5.4. Results and Discussions
In this study, a 500-kW PV system is simulated based on technical and economicparameters in order to determine its viability in different locations in Nigeria. RETScreensimulation program has been used for the analysis and the feasibility will be determinedbased on different economic indicators (PBP, IRR, NPV). For comparison purposes, thecapacity of the PV plants is the same for all the locations considered and therefore therequired solar collector area (3266 m2) is the same. However, the electricity productionfrom the PV systems varies from one location to the other as seen in Figure 5. Typically,the solar radiation in the northern part of Nigeria is higher (Table 8) in comparison to theother parts of the country. This is evident in the electricity produced for the PV plantsanalysis in Northern locations namely; Gombe (858 MWh/yr), Kaduna (855 MWh/yr),and Abuja (824 MWh/yr). Based on the result of the analysis, Port-Harcourt (PH) had theleast yearly electricity export rate (582 MWh/yr) followed by Warri (675 MWh/yr) andAba (MWh/yr).

Sustainability 2021, 13, 2229 18 of 24
Sustainability 2021, 13, x FOR PEER REVIEW 18 of 25
installation is $757,500 [13,89]. Based on the most recent electricity tariff update in Nigeria, the electricity pricing used for the economic analysis in this study is $ 0.1484 per kilowatt-hour [90]. Also, 1% of the total investment cost is considered as the annual operation and maintenance (O&M) cost [87]. Furthermore, the interest rate is set at 4%, and a 22-years project life span is used in calculating the economic viability [91]. Although most solar PV systems’ life span is 25 years, it is noteworthy that the production of the system reduces by 10% or more after the first 20–22 years, therefore, 22 years has been used in this study. An inflation rate of 1% is considered while a 15% effective income tax is used for the anal-ysis.
5.4. Results and Discussions In this study, a 500-kW PV system is simulated based on technical and economic pa-
rameters in order to determine its viability in different locations in Nigeria. RETScreen simulation program has been used for the analysis and the feasibility will be determined based on different economic indicators (PBP, IRR, NPV). For comparison purposes, the capacity of the PV plants is the same for all the locations considered and therefore the required solar collector area (3266 m2) is the same. However, the electricity production from the PV systems varies from one location to the other as seen in Figure 5. Typically, the solar radiation in the northern part of Nigeria is higher (Table 8) in comparison to the other parts of the country. This is evident in the electricity produced for the PV plants analysis in Northern locations namely; Gombe (858 MWh/yr), Kaduna (855 MWh/yr), and Abuja (824 MWh/yr). Based on the result of the analysis, Port-Harcourt (PH) had the least yearly electricity export rate (582 MWh/yr) followed by Warri (675 MWh/yr) and Aba (MWh/yr).
Figure 5. Comparison of electricity production by the PV systems for different locations.
The electricity production rate of the PV plant for each of the locations is directly proportional to the cumulative cashflow rate (Figure 6). While the cash flow for the North-ern locations is higher, locations like Ankpa, Enugu, Ibadan, Osogbo, and Onitsha all had a comparatively similar income cashflow rate. Although the use of storage systems has not been considered in the scope of this study, the yearly electricity production from the
Figure 5. Comparison of electricity production by the PV systems for different locations.
The electricity production rate of the PV plant for each of the locations is directly pro-portional to the cumulative cashflow rate (Figure 6). While the cash flow for the Northernlocations is higher, locations like Ankpa, Enugu, Ibadan, Osogbo, and Onitsha all had acomparatively similar income cashflow rate. Although the use of storage systems has notbeen considered in the scope of this study, the yearly electricity production from the PVplants in all the locations shows the potency of the technology for solving the current elec-tricity crisis. Considering the NPV, IRR, and PBP for the projects in all the locations, it canbe concluded that the use of solar PV is economically viable. A project is said to be feasibleif the NPV is greater than 1. As seen in Table 10, the net present value for all the locationsis between $794,108 and $1,245,681. This further justifies the importance of decentralizedrenewable energy-based off-grid systems for meeting Nigerians electricity needs.
Table 10. Summary of the electricity production and the economic indicators for the 500-kW installa-tion in all the locations.
Location Pre-TaxIRR (%)
After-Tax IRR
(%)
NetPresent
Value ($)
AnnualLife
CycleSavings
($/yr)
Benefit-Cost(B–C)Ratio
EnergyProduc-
tion Cost($/MWh)
ElectricityExportIncome
($)
Aba 11.6 9.3 853,074 43,391 2.13 76.16 103,711Abuja 14.40 11.80 1,167,553 59,386 2.54 64.58 122,322Ankpa 13.10 10.60 1,019,185 51,840 2.35 69.57 113,542Enugu 12.40 10.00 938,822 47,752 2.24 72.61 108,786Gombe 15.20 12.50 1,261,767 64,178 2.67 61.38 127,340Ibadan 12.10 9.80 913,360 46,457 2.21 73.63 107,279Kaduna 15.10 12.40 1,245,681 63,360 2.64 62.22 126,945Lagos 11.70 9.40 871,167 44,311 2.15 75.39 104,782
Onitsha 12.00 9.60 895,104 45,528 2.18 74.38 106,199Osogbo 12.40 10.00 946,695 48,152 2.25 72.3 109,252
PH 8.80 6.70 559,020 28,434 1.74 91.52 86,310Warri 11.00 8.80 794,108 40,391 2.05 78.82 100,222

Sustainability 2021, 13, 2229 19 of 24
Sustainability 2021, 13, x FOR PEER REVIEW 19 of 25
PV plants in all the locations shows the potency of the technology for solving the current electricity crisis. Considering the NPV, IRR, and PBP for the projects in all the locations, it can be concluded that the use of solar PV is economically viable. A project is said to be feasible if the NPV is greater than 1. As seen in Table 10, the net present value for all the locations is between $794,108 and $1,245,681. This further justifies the importance of de-centralized renewable energy-based off-grid systems for meeting Nigerians electricity needs.
Table 10. Summary of the electricity production and the economic indicators for the 500-kW in-stallation in all the locations.
Location Pre-Tax IRR (%)
After-Tax IRR (%)
Net Present Value ($)
Annual life Cycle sav-ings ($/yr)
Benefit-Cost (B–C) Ratio
Energy Pro-duction Cost
($/MWh)
Electricity Export In-come ($)
Aba 11.6 9.3 853,074 43,391 2.13 76.16 103,711 Abuja 14.40 11.80 1,167,553 59,386 2.54 64.58 122,322 Ankpa 13.10 10.60 1,019,185 51,840 2.35 69.57 113,542 Enugu 12.40 10.00 938,822 47,752 2.24 72.61 108,786 Gombe 15.20 12.50 1,261,767 64,178 2.67 61.38 127,340 Ibadan 12.10 9.80 913,360 46,457 2.21 73.63 107,279 Kaduna 15.10 12.40 1,245,681 63,360 2.64 62.22 126,945 Lagos 11.70 9.40 871,167 44,311 2.15 75.39 104,782
Onitsha 12.00 9.60 895,104 45,528 2.18 74.38 106,199 Osogbo 12.40 10.00 946,695 48,152 2.25 72.3 109,252
PH 8.80 6.70 559,020 28,434 1.74 91.52 86,310 Warri 11.00 8.80 794,108 40,391 2.05 78.82 100,222
0 3 6 9 12 15 18 21
-1000000
-500000
0
500000
1000000
1500000
Cum
ulat
ive
Cas
hflo
w ($
)
Year
Aba Abuja Ankpa Enugu Gombe Ibadan Kaduna Lagos Onitsha Osogbo PH Warri
Figure 6. Cash cumulative flow for different locations.
The pre-tax and after-tax IRR also reflect that the use of solar PV for electricity pro-duction will be a good investment for both private individual and commercial compa-
Figure 6. Cash cumulative flow for different locations.
The pre-tax and after-tax IRR also reflect that the use of solar PV for electricityproduction will be a good investment for both private individual and commercial com-panies/organization. Since solar radiation is mostly available during working hours,the integration of solar PV plants without storage systems will be more suitable for of-fice/commercial buildings. The simple payback period and the equity payback period ofthe project in all the locations is also very feasible. For Gombe and Kaduna, the simple PBPand equity PBP are 6.3 years and 7.4 years respectively (Figure 7). it is noteworthy that thesimple PBP and equity PBP for all the locations are less than 10 years (excluding EquityPBP for PH). This further shows that this is the right way forward if the country will solveits electricity crisis soon.
As seen in Table 10, other economic parameters such as; annual life cycle saving,benefit-cost ratio, electricity production cost, and electricity export income show that theproject will be viable in any location in Nigeria. Also, considering the continuous increasein Nigeria’s electricity tariffs in recent years, the economics of solar PV utilization willincrease positively within the next few years. This will further make the project moreviable and bring-in more profit for investors. Comparing the difference in locations, thenorthern part of Nigeria is more suitable for solar PV utilization while the extreme south(PH and Warri) is the least suitable. The integration of the PV system in the western part(Osogbo, Lagos, and Ibadan), as well as the eastern part (Onitsha, Enugu) of the country,has similar performance.
Apart from the economic and technical feasibility of the solar PV plant, the envi-ronmental sustainability of the project further justifies its importance. The 500-kW willreduce the yearly CO2 emission by a substantial amount (677 tCO2/yr–861 tCO2/yr). Also,considering the 22-years lifespan of the project, about 21,513 tCO2/yr can be saved frombeing emitted to the atmosphere by installing a 500-kW PV plant in Gombe. The totalemission reduction for all the locations is summarized in Table 11.

Sustainability 2021, 13, 2229 20 of 24Sustainability 2021, 13, x FOR PEER REVIEW 21 of 25
Figure 7. Simple and Equity PBP for 500-kW PV installation in Nigeria.
6. Conclusions In this study, the electricity crisis in Nigeria has been discussed extensively and some
of the proposed solutions in works of literature were reviewed and presented. Also, the effect of the electricity crisis on the economic development of Nigeria over the years has been analyzed based on the data collected between 1971 and 2014. The use of solar PV microgrid system for electricity generation has been proposed as the way forward and the techno-economic viability of the solution has been analyzed extensively. The main con-cluding points from this study are highlighted as follows: • Based on the time series regression analysis, electricity consumption affects the GNI
of the country. Therefore, it can be concluded that economic consumption affects the country’s GNI and an increase in electricity consumption will increase the country’s GNI.
• While electricity consumption affects the CO2 emission from the power industry and other combustion industries, it is noteworthy that the electricity consumption of Ni-geria does not affect the total carbon emission. This further shows the inadequacies in the power industry and it can be concluded that the use of more sustainable means of electricity generation will not affect the country’s environmental sustainability.
• The techno-economic analysis of solar PV micro-grid application for electricity gen-eration showed that this is one of the most effective immediate solutions to the power sector crisis in Nigeria. Considering the economic indicator (NPV, IRR, and PBP) re-sults for the use of a 500-kW solar PV system for electricity generation in 12 different
Figure 7. Simple and Equity PBP for 500-kW PV installation in Nigeria.
Table 11. Emission reduction summary.
Location Net GHG Reduction (tCO2/yr) Net GHG Reduction in 22 yrs (tCO2)
Aba 701 15,419Abuja 827 18,185Ankpa 767 16,880Enugu 735 16,173Gombe 861 21,513Ibadan 725 15,949Kaduna 858 18,873Lagos 708 15,578
Onitsha 718 15,788Osogbo 738 16,242
PH 583 12,832Warri 677 14,900
6. Conclusions
In this study, the electricity crisis in Nigeria has been discussed extensively and someof the proposed solutions in works of literature were reviewed and presented. Also,the effect of the electricity crisis on the economic development of Nigeria over the yearshas been analyzed based on the data collected between 1971 and 2014. The use of solarPV microgrid system for electricity generation has been proposed as the way forward and

Sustainability 2021, 13, 2229 21 of 24
the techno-economic viability of the solution has been analyzed extensively. The mainconcluding points from this study are highlighted as follows:
• Based on the time series regression analysis, electricity consumption affects the GNIof the country. Therefore, it can be concluded that economic consumption affectsthe country’s GNI and an increase in electricity consumption will increase the coun-try’s GNI.
• While electricity consumption affects the CO2 emission from the power industryand other combustion industries, it is noteworthy that the electricity consumption ofNigeria does not affect the total carbon emission. This further shows the inadequaciesin the power industry and it can be concluded that the use of more sustainable meansof electricity generation will not affect the country’s environmental sustainability.
• The techno-economic analysis of solar PV micro-grid application for electricity gener-ation showed that this is one of the most effective immediate solutions to the powersector crisis in Nigeria. Considering the economic indicator (NPV, IRR, and PBP)results for the use of a 500-kW solar PV system for electricity generation in 12 differentlocations in Nigeria, it can be concluded that the use of solar PV is an economicallyviable solution to the imminent electricity crisis.
In the future study, the use of other renewable energy sources available in Nigeria willbe considered for electricity generation. Also, the integration of storage will be analyzed toshow the feasibility of total electricity production based on renewable energy sources. Itis noteworthy that the techno-economic analysis presented in this study only considersthe use solar PV for the micro-grid and this is a limitation for the solution presented. Inthe future, the use of other renewable energy-based technologies will be considered forfurther analysis.
Author Contributions: Conceptualization, M.M.; S.O.; N.Y.; Z.Q.; O.B.; P.J.; and Y.I.I.; methodology,M.M.; S.O.; N.Y.; Z.Q.; O.B.; P.J.; and Y.I.I.; software, M.M.; S.O.; N.Y.; Z.Q.; O.B.; P.J.; and Y.I.I.;validation, M.M.; S.O.; N.Y.; Z.Q.; O.B.; P.J.; and Y.I.I..; formal analysis, M.M.; S.O.; and O.B.;investigation, M.M.; S.O.; N.Y.; Z.Q.; O.B.; P.J.; and Y.I.I.; resources, M.M.; S.O.; N.Y.; Z.Q.; O.B.;P.J.; and Y.I.I.; data curation, M.M.; S.O.; N.Y.; Z.Q.; O.B.; P.J.; and Y.I.I.; writing—original draftpreparation, M.M.; S.O.; N.Y.; Z.Q.; O.B.; P.J.; and Y.I.I.; writing—review and editing, M.M.; S.O.; N.Y.;Z.Q.; O.B.; P.J.; and Y.I.I.; visualization, M.M.; S.O.; N.Y.; Z.Q.; O.B.; P.J.; and Y.I.I.; supervision, M.M.;S.O.; N.Y.; Z.Q.; O.B.; P.J.; and Y.I.I.; project administration, M.M.; S.O.; N.Y.; Z.Q.; O.B.; P.J.; and Y.I.I.;funding acquisition. All authors have read and agreed to the published version of the manuscript.
Funding: This research received no external funding.
Institutional Review Board Statement: Not applicable.
Informed Consent Statement: Not applicable.
Data Availability Statement: The data presented in this study are available on reasonable requestfrom the corresponding author.
Conflicts of Interest: The authors declare no conflict of interest.
References1. Ali, H.S.; Nathaniel, S.P.; Uzuner, G.; Bekun, F.V.; Sarkodie, S.A. Trivariate modelling of the nexus between electricity consumption,
urbanization and economic growth in Nigeria: Fresh insights from Maki Cointegration and causality tests. Heliyon 2020, 6, e03400.[CrossRef] [PubMed]
2. Asumadu-Sarkodie, S.; Owusu, P.A. Recent evidence of the relationship between carbon dioxide emissions, energy use, GDP, andpopulation in Ghana: A linear regression approach. Energy Sources Part B Econ. Plan. Policy 2017, 12, 495–503. [CrossRef]
3. Poveda, A.C.; Martínez, C.I.P. Trends in economic growth, poverty and energy in Colombia: Long-run and short-run effects.Energy Syst. 2011, 2, 281–298. [CrossRef]
4. Odekanle, E.L.; Odejobi, O.J.; Dahunsi, S.O.; Akeredolu, F.A. Potential for cleaner energy recovery and electricity generation fromabattoir wastes in Nigeria. Energy Rep. 2020, 6, 1262–1267. [CrossRef]
5. Ozturk, I.; Acaravci, A. Electricity consumption and real GDP causality nexus: Evidence from ARDL bounds testing approach for11 MENA countries. Appl. Energy 2011, 88, 2885–2892. [CrossRef]

Sustainability 2021, 13, 2229 22 of 24
6. Owusu, P.A.; Asumadu-Sarkodie, S.; Ameyo, P. A review of Ghana’s water resource management and the future prospect. CogentEng. 2016, 3, 1164275. [CrossRef]
7. Adom, P.K.; Kwakwa, P.A.; Amankwaa, A. The long-run effects of economic, demographic, and political indices on actual andpotential CO2 emissions. J. Environ. Manag. 2018, 218, 516–526. [CrossRef]
8. Dulebenets, M.A. Advantages and disadvantages from enforcing emission restrictions within emission control areas. Marit. Bus.Rev. 2016, 1, 107–132. [CrossRef]
9. Lo, P.L.; Martini, G.; Porta, F.; Scotti, D. The determinants of CO2 emissions of air transport passenger traffic: An analysis ofLombardy (Italy). Transp. Policy 2020, 91, 108–119. [CrossRef]
10. Mikayilov, J.I.; Galeotti, M.; Hasanov, F.J. The impact of economic growth on CO2 emissions in Azerbaijan. J. Clean. Prod. 2018,197, 1558–1572. [CrossRef]
11. Andersson, F.N.G.; Opper, S.; Khalid, U. Are capitalists green? Firm ownership and provincial CO2 emissions in China. EnergyPolicy 2018, 123, 349–359. [CrossRef]
12. Lin, B.; Xu, M. Regional differences on CO2 emission efficiency in metallurgical industry of China. Energy Policy 2018, 120,302–311. [CrossRef]
13. Bamisile, O.; Huang, Q.; Xu, X.; Hu, W.; Liu, W.; Liu, Z.; Chen, Z. An approach for sustainable energy planning towards 100 %electrification of Nigeria by 2030. Energy 2020, 197, 117172. [CrossRef]
14. Bamisile, O.; Huang, Q.; Dagbasi, M.; Alowolodu, O.; Williams, N. Development and Assessment of Renewable Energy-IntegratedMultigeneration System for Rural Communities in Nigeria: Case Study. J. Energy Eng. 2020, 146, 1–10. [CrossRef]
15. Okafor, C. Nigeria’ s Power Sector: 58 Years of Falling behind Expectations. 2018. Available online: https://www.thisdaylive.com/index.php/2018/10/02/nigerias-power-sector-58-years-of-falling-behind-expectations/ (accessed on 1 December 2020).
16. Shaaban, M.; Petinrin, J.O. Renewable energy potentials in Nigeria: Meeting rural energy needs. Renew. Sustain. Energy Rev. 2017,29, 72–84. [CrossRef]
17. Akuru, U.B.; Onukwube, I.E.; Okoro, O.I.; Obe, E.S. Towards 100% renewable energy in Nigeria. Renew. Sustain. Energy Rev. 2015,71, 943–953. [CrossRef]
18. Oyewo, A.S.; Aghahosseini, A.; Bogdanov, D.; Breyer, C. Pathways to a fully sustainable electricity supply for Nigeria inthe mid-term future. Energy Convers. Manag. 2018, 178, 44–64. [CrossRef]
19. Ogunmodimu, O.; Okoroigwe, E.C. Solar thermal electricity in Nigeria: Prospects and challenges. Energy Policy 2019, 128, 440–448.[CrossRef]
20. Ejiofor, O.S.; Okoro, P.A.; Ogbuefi, U.C.; Nnabuike, C.V.; Okedu, K.E. Off-grid electricity generation in Nigeria based on rice huskgasification technology. Clean. Eng. Technol. 2020, 100009. [CrossRef]
21. Tegina, I.T.; Dioha, M.O.; Failler, P. Renewable energy scenarios for sustainable electricity supply in Nigeria. Energy Clim. Chang.2020, 100017. [CrossRef]
22. Rahman, M.M. Environmental degradation: The role of electricity consumption, economic growth and globalisation. J. Environ.Manag. 2020, 253, 109742. [CrossRef] [PubMed]
23. Fang, D.; Hao, P.; Yu, Q.; Wang, J. The impacts of electricity consumption in China’s key economic regions. Appl. Energy 2020, 267,115078. [CrossRef]
24. Rajkumari, L. Relation between electricity consumption and economic growth in Karnataka, India: An aggregate and sector-wiseanalysis. Electr. J. 2020, 33, 106768. [CrossRef]
25. Obiora, S.C.; Bamisile, O.; Opoku-Mensah, E.; Frimpong, A.N.K. Impact of banking and financial systems on environmentalsustainability: An overarching study of developing, emerging, developed economies. Sustainability 2020, 12, 8074. [CrossRef]
26. Dioha, M. Nigeria’s Renewable Energy Policy: A Fantasy or Reality? Renew. Energy World 2018. Available online: https://www.renewableenergyworld.com/solar/nigerias-renewable-energy-policy-a-fantasy-or-reality/#gref (accessed on 20 December 2020).
27. Ministry of Power Federal Republic of Nigeria. National Renewable Energy and Energy Efficiency Policy (Nreeep) Approved byFec for the Electricity Sector; Ministry of Power Federal Republic of Nigeria: Abuja, Nigeria, 2015. Available online: http://admin.theiguides.org/Media/Documents/NREEE%20POLICY%202015-%20FEC%20APPROVED%20COPY.pdf (accessed on20 June 2020).
28. Offiong, P. Nigerian Renewal Energy and Energy Efficiency Policy (NREEEP)—Climate Scorecard; 2019. Available online: https://www.climatescorecard.org/2019/02/nigerian-renewal-energy-and-energy-efficiency-policy-nreeep/ (accessed on 20 June 2019).
29. Bamisile, O.; Dagbasi, M.; Babatunde, A.; Ayodele, O. A review of renewable energy potential in Nigeria; Solar power develop-ment over the years. Eng. Appl. Sci. Res. 2017, 44, 242–248. [CrossRef]
30. GET Invest. Nigeria Renewable Energy Potential. 2014. Available online: https://www.get-invest.eu/market-information/nigeria/renewable-energy-potential/ (accessed on 20 June 2020).
31. Wellig, S.D.; Nusslé, S.; Miltner, D.; Kohle, O.; Glaizot, O.; Braunisch, V.; Obrist, M.K.; Arlettaz, R. Mitigating the negative impactsof tall wind turbines on bats: Vertical activity profiles and relationships to wind speed. PLoS ONE 2018, 13, e0192493. [CrossRef][PubMed]
32. Commission, N.E.R. Power Generation in Nigeria. 2018. Available online: https://www.nercng.org/index.php/home/nesi/403-generation# (accessed on 20 June 2019).
33. Monyei, C.G.; Adewumi, A.O.; Obolo, M.O.; Sajou, B. Nigeria’s energy poverty: Insights and implications for smart policies andframework towards a smart Nigeria electricity network. Renew. Sustain. Energy Rev. 2017, 81, 1582–1601. [CrossRef]

Sustainability 2021, 13, 2229 23 of 24
34. Dada, J.O. Towards understanding the benefits and challenges of Smart/Micro-Grid for electricity supply system in Nigeria.Renew. Sustain. Energy Rev. 2014, 38, 1003–1014. [CrossRef]
35. Aliyu, A.S.; Ramli, A.T.; Saleh, M.A. Nigeria electricity crisis: Power generation capacity expansion and environmental ramifica-tions. Energy 2013, 61, 354–367. [CrossRef]
36. Ibitoye, A.; Adenikinju, F.I. Future demand for electricity in Nigeria. Appl. Energy 2007, 84, 492–504. [CrossRef]37. Ibrahim, H.; Kirkil, G. Electricity Demand and Supply Scenario Analysis for Nigeria Using Long Range Energy Alternatives
Planning (LEAP). J. Sci. Res. Rep. 2018, 19, 1–12. [CrossRef]38. Ayodele, T.R.; Alao, M.A.; Ogunjuyigbe, A.S.O.; Munda, J.L. Electricity generation prospective of hydrogen derived from biogas
using food waste in south-western Nigeria. Biomass. Bioenergy 2019, 127, 105291. [CrossRef]39. Ogunmodimu, O.; Okoroigwe, E.C. Concentrating solar power technologies for solar thermal grid electricity in Nigeria: A review.
Renew. Sustain. Energy Rev. 2018, 90, 104–119. [CrossRef]40. Enongene, K.E.; Abanda, F.H.; Otene, I.J.J.; Obi, S.I.; Okafor, C. The potential of solar photovoltaic systems for residential homes
in Lagos city of Nigeria. J. Environ. Manag. 2019, 244, 247–256. [CrossRef]41. Iyke, B.N. Electricity consumption and economic growth in Nigeria: A revisit of the energy-growth debate. Energy Econ. 2015, 51,
166–176. [CrossRef]42. Emodi, K.J.; Boo, N.V. Sustainable energy development in Nigeria: Current status and policy options. Renew. Sustain. Energy Rev.
2015, 51, 356–381. [CrossRef]43. Ley, K.; Gaines, J.; Ghatikar, A. The Nigerian Energy Sector: An Overview with a Special Emphasis on Renewable Energy, Energy
Efficiency and Rural Electrification. 2015. Available online: https://www.giz.de/en/downloads/giz2015-en-nigerian-energy-sector.pdf (accessed on 1 June 2019).
44. Babatunde, A.A.; Abbasoglu, S.; Senol, M. Analysis of the impact of dust, tilt angle and orientation on performance of PV Plants.Renew. Sustain. Energy Rev. 2018, 90, 1017–1026. [CrossRef]
45. Lin, B.; Ankrah, I. On Nigeria’s renewable energy program: Examining the effectiveness, substitution potential, and the impacton national output. Energy 2019, 167, 1181–1193. [CrossRef]
46. Idigbe, S.O.; Onohaebi, K.I. Repositioning the power industry in Nigeria to guarantee reliability in operations and services. J. Eng.Appl. Sci. 2009, 4, 119–125.
47. Bugaje, I.M. Renewable energy for sustainable development in Africa: A review. Renew. Sustain. Energy Rev. 2006, 10, 603–612.[CrossRef]
48. IRENA. Renewable Energy Technologies; IRENA: Abu Dhabi, UAE, 2020. Available online: https://www.irena.org/-/media/Files/IRENA/Agency/Publication/2020/Mar/IRENA_RE_Capacity_Statistics_2020.pdf (accessed on 1 June 2019).
49. Salisu, L.; Garba, I. Electricity Generation Using Wind in Katsina State, Nigeria. Int. J. Eng. Res. Technol. 2013, 2, 1–13.50. Aliyu, A.S.; Dada, J.O.; Adam, I.K. Current status and future prospects of renewable energy in Nigeria. Renew. Sustain. Energy
Rev. 2015, 48, 336–346. [CrossRef]51. Kela, R.; Usman, K.M.; Tijjani, A. Potentials of Small Hydro Power in Nigeria: The Current Status and Investment Opportunities.
Int. J. Sci. Eng. Res. 2012, 9, 1703.52. Giwa, A.; Alabi, A.; Yusuf, A.; Olukan, T. A comprehensive review on biomass and solar energy for sustainable energy generation
in Nigeria. Renew. Sustain. Energy Rev. 2017, 69, 620–641. [CrossRef]53. Simonyan, O.; Fasina, K.J. Biomass resources and bioenergy potentials in Nigeria. Afr. J. Agric. Res. 2013, 8, 4975–4989. [CrossRef]54. Akinbami, J.F.K.; Ilori, M.O.; Oyebisi, T.O.; Akinwumi, I.O.; Adeoti, O. Biogas energy use in Nigeria: Current status, future
prospects and policy implications. Renew. Sustain. Energy Rev. 2001, 5, 97–112. [CrossRef]55. Ayodele, T.R.; Ogunjuyigbe, A.S.O.; Odigie, O.; Jimoh, A.A. On the most suitable sites for wind farm development in Nigeria.
Data Br. 2018. [CrossRef]56. SOLARGIS. Solar resource maps of Nigeria. 2018. Available online: https://solargis.com/maps-and-gis-data/download/nigeria
(accessed on 11 November 2020).57. Portal, A.E. Nigeria-Energy Sector. 2019. Available online: https://africa-energy-portal.org/fr/country/nigeria (accessed on 12
November 2020).58. Advisory Power Team, Office of the Vice President, Federal Government of Nigeria in conjunction with Power Africa. Nigeria
Power Baseline Report. 2015, pp. 1–36. Available online: http://mypower.ng/wp-content/uploads/2018/01/Baseline-Report.pdf (accessed on 10 December 2020).
59. World Energy Council. WEC Trilemma: Country Profile; World Energy Council: Oliver Wyman, UK, 2019.60. Paul, O.; Albert, O.; Adeiza, A. Electricity Crisis in Nigeria: The Way Forward. Am. J. Renew. Sustain. Energy 2015, 1, 180–186.61. Kachikwu, I.E. NNPC GMD to End Oil theft in 8 Months, to Use Drones to Monitor oil Vessels. 2015. Available online: https:
//www.vanguardngr.com/2015/09/nnpc-gmd-to-end-oil-theft-in-8-months-to-use-drones-to-monitor-oil-vessels/ (accessedon 12 November 2020).
62. Fashola, B. FG Targets 30 Per Cent in Renewable Energy Mix by 2030. 2018. Available online: https://punchng.com/fg-targets-30-per-cent-in-renewable-energy-mix-by-2030-fashola/ (accessed on 12 November 2020).
63. Emovon, I.; Samuel, O.D. Prioritising Alternative Solutions to Power Generation Problems Using MCDM Techniques: Nigeria asCase Study. Int. Integr. Eng. 2017, 9, 11–17.

Sustainability 2021, 13, 2229 24 of 24
64. Bode Adewuyi, O.; Kiptoo, M.K.; Fisayo Afolayan, A.; Amara, T.; Alawode, O.I.; Senjyu, T. Challenges and prospects of Nigeria’ssustainable energy transition with lessons from other countries’ experiences. Energy Rep. 2020, 6, 993–1009. [CrossRef]
65. Emovon, I.; Samuel, O.D.; Mgbemena, C.O.; Adeyeri, M.K. Electric Power generation crisis in Nigeria: A Review of causes andsolutions. Int. J. Integr. Eng. 2018, 10, 47–56. [CrossRef]
66. Arowolo, W.; Perez, Y. Market reform in the Nigeria power sector: A review of the issues and potential solutions. Energy Policy2020, 144, 111580. [CrossRef]
67. Urpelainen, J.; Yang, J. Global patterns of power sector reform, 1982–2013. Energy Strateg. Rev. 2019, 23, 152–162. [CrossRef]68. Amoo, R.L.; Fagbenle, L.M. An integrated impact assessment of hydrogen as a future energy carrier in Nigeria’s transportation,
energy and power sectors. Int. J. Hydrog. Energy 2014, 39, 12409–12433. [CrossRef]69. Lin, S.; Wang, S.; Marinova, D.; Zhao, D.; Hong, J. Impacts of urbanization and real economic development on CO2 emissions
in non-high income countries: Empirical research based on the extended STIRPAT model. J. Clean. Prod. 2017, 166, 952–966.[CrossRef]
70. Dong, K.; Hochman, G.; Timilsina, G.R. Do drivers of CO2 emission growth alter overtime and by the stage of economicdevelopment? Energy Policy 2020, 140, 111420. [CrossRef]
71. Le, B.; Tran-Nam, T.H. Trade liberalization, financial modernization and economic development: An empirical study of selectedAsia–Pacific countries. Res. Econ. 2018. [CrossRef]
72. Zhang, Y.; Zhang, S. The impacts of GDP, trade structure, exchange rate and FDI inflows on China’s carbon emissions. EnergyPolicy 2018, 120, 347–353. [CrossRef]
73. WBS. GDP Per Capita. 2011. Available online: https://data.worldbank.org/indicator/NY.GDP.PCAP.CD (accessed on 20May 2020).
74. WBS. Gross Domestic Saving. 2020. Available online: https://data.worldbank.org/indicator/NY.GDS.TOTL.CD (accessed on 20May 2020).
75. World Bank Statistics. Trade (% of GDP). 2020. Available online: https://data.worldbank.org/indicator/NE.TRD.GNFS.ZS(accessed on 19 May 2020).
76. International Monetary Fund. Domestic Credit to Private Sector by Banks. 2020. Available online: https://data.worldbank.org/indicator/FD.AST.PRVT.GD.ZS (accessed on 18 May 2020).
77. Madsen, H. Time Series Analysis. 2007. Available online: http://henrikmadsen.org/wp-content/uploads/2014/02/lect07.pdf(accessed on 12 November 2020).
78. Tan, C.W.; Bergmeir, C.; Petitjean, F.; Webb, G.I. Time Series Regression. Available online: https://arxiv.org/abs/2006.10996(accessed on 10 December 2020).
79. Parajuli, R.; Østergaard, P.A.; Dalgaard, T.; Pokharel, G.R. Energy consumption projection of Nepal: An econometric approach.Renew. Energy 2014, 63, 432–444. [CrossRef]
80. Bennouna, A.; El Hebil, C. Energy needs for Morocco 2030, as obtained from GDP-energy and GDP-energy intensity correlations.Energy Policy 2016, 88, 45–55. [CrossRef]
81. Erdogan, S.; Okumus, I.; Guzel, A.E. Revisiting the Environmental Kuznets Curve hypothesis in OECD countries: The role ofrenewable, non-renewable energy, and oil prices. Environ. Sci. Pollut. Res. 2020, 27, 23655–23663. [CrossRef] [PubMed]
82. ITF. The Carbon Footprint of Global Trade. Int. Transp. Forum Glob. 2015, 12, 1–12.83. Adesanya, J.M.; Pearce, A.A. Economic viability of captive off-grid solar photovoltaic and diesel hybrid energy systems for the
Nigerian private sector. Renew. Sustain. Energy Rev. 2019, 114, 109348. [CrossRef]84. Salihu, T.Y.; Akorede, M.F.; Abdulkarim, A.; Abdullateef, A.I. Off-grid photovoltaic microgrid development for rural electrification
in Nigeria. Electr. J. 2020, 33, 106765. [CrossRef]85. Salehin, S.; Ferdaous, M.T.; Chowdhury, R.M.; Shithi, S.S.; Rofi, M.S.R.B.; Mohammed, M.A. Assessment of renewable energy
systems combining techno-economic optimization with energy scenario analysis. Energy 2016, 112, 729–741. [CrossRef]86. Ramli, M.S.; Wahid, S.S.A.; Hassan, K.K. A comparison of renewable energy technologies using two simulation softwares:
HOMER and RETScreen. AIP Conf. Proc. 2017, 1875. Available online: https://aip.scitation.org/doi/10.1063/1.4998384 (accessedon 1 June 2020). [CrossRef]
87. Bamisile, O.; Olubiyo, F.; Dagbasi, M.; Adun, H.; Wole-Osho, I. Economic analysis and performance of PV plants: An applicationin Kurdistan region of Iraq. Int. J. Renew. Energy Dev. 2019, 8, 293–301. [CrossRef]
88. CSun-Solar. 2017. Available online: http://www.csun-solar.com/fileadmin/dateiablage/media/datasheets/p-mod/en/CSUN305-72P_ENG.pdf (accessed on 1 June 2017).
89. Modernize. How Much Does Solar Panel Installation Cost? 2020. Available online: https://modernize.com/solar/panel-cost-calculator#:~:text=Solarpanelinstallationcostsaround,%2424%2C552intotalinstallationcosts (accessed on 10 December 2020).
90. BBC News|PIDGIN. New Electricity Tariffs in Nigeria 2020. 2020. Available online: https://www.bbc.com/pidgin/tori-53995109#:~:text=Newelectricitytariffwitmore,as62.33Nairaperkwh (accessed on 10 December 2020).
91. Doing Business. Available online: www.doingbusiness.org/getting-electricity (accessed on 1 June 2017).


![[Automation, Electrification, and Shared Mobility in Freight]](https://static.fdokumen.com/doc/165x107/632813a2e491bcb36c0b98fc/automation-electrification-and-shared-mobility-in-freight.jpg)