A high-throughput microcultivation protocol for FTIR spectroscopic characterization and...
10
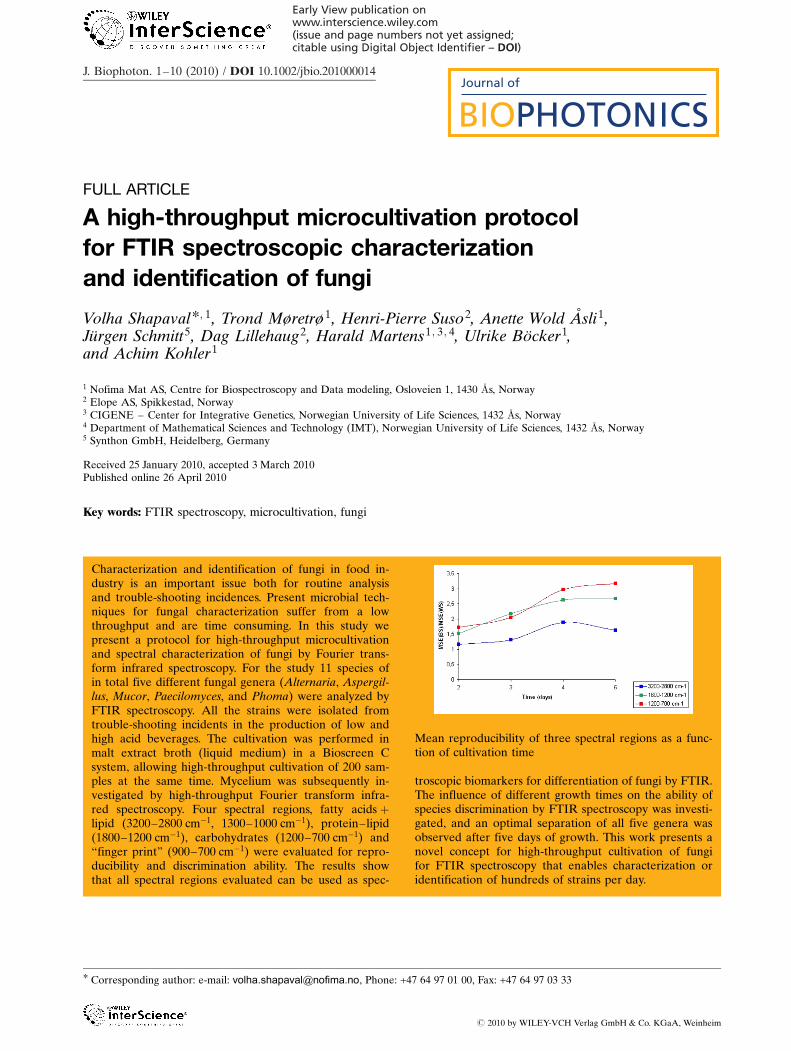
FULL ARTICLE A high-throughput microcultivation protocol for FTIR spectroscopic characterization and identification of fungi Volha Shapaval * ; 1 , Trond Møretrø 1 , Henri-Pierre Suso 2 , Anette Wold A ˚ sli 1 , Ju ¨ rgen Schmitt 5 , Dag Lillehaug 2 , Harald Martens 1 ; 3 ; 4 , Ulrike Bo ¨ cker 1 , and Achim Kohler 1 1 Nofima Mat AS, Centre for Biospectroscopy and Data modeling, Osloveien 1, 1430 As, Norway 2 Elope AS, Spikkestad, Norway 3 CIGENE – Center for Integrative Genetics, Norwegian University of Life Sciences, 1432 As, Norway 4 Department of Mathematical Sciences and Technology (IMT), Norwegian University of Life Sciences, 1432 As, Norway 5 Synthon GmbH, Heidelberg, Germany Received 25 January 2010, accepted 3 March 2010 Published online 26 April 2010 Key words: FTIR spectroscopy, microcultivation, fungi # 2010 by WILEY-VCH Verlag GmbH& Co. KGaA, Weinheim Journal of BIOPHOTONICS Characterization and identification of fungi in food in- dustry is an important issue both for routine analysis and trouble-shooting incidences. Present microbial tech- niques for fungal characterization suffer from a low throughput and are time consuming. In this study we present a protocol for high-throughput microcultivation and spectral characterization of fungi by Fourier trans- form infrared spectroscopy. For the study 11 species of in total five different fungal genera (Alternaria, Aspergil- lus , Mucor, Paecilomyces , and Phoma) were analyzed by FTIR spectroscopy. All the strains were isolated from trouble-shooting incidents in the production of low and high acid beverages. The cultivation was performed in malt extract broth (liquid medium) in a Bioscreen C system, allowing high-throughput cultivation of 200 sam- ples at the same time. Mycelium was subsequently in- vestigated by high-throughput Fourier transform infra- red spectroscopy. Four spectral regions, fatty acids þ lipid (3200–2800 cm 1 , 1300–1000 cm 1 ), protein–lipid (1800–1200 cm 1 ), carbohydrates (1200–700 cm 1 ) and “finger print” (900–700 cm 1 ) were evaluated for repro- ducibility and discrimination ability. The results show that all spectral regions evaluated can be used as spec- troscopic biomarkers for differentiation of fungi by FTIR. The influence of different growth times on the ability of species discrimination by FTIR spectroscopy was investi- gated, and an optimal separation of all five genera was observed after five days of growth. This work presents a novel concept for high-throughput cultivation of fungi for FTIR spectroscopy that enables characterization or identification of hundreds of strains per day. Mean reproducibility of three spectral regions as a func- tion of cultivation time * Corresponding author: e-mail: [email protected], Phone: +47 64 97 01 00, Fax: +47 64 97 03 33 Early View publication on www.interscience.wiley.com (issue and page numbers not yet assigned; citable using Digital Object Identifier – DOI) J. Biophoton. 1–10 (2010) / DOI 10.1002/jbio.201000014
Transcript of A high-throughput microcultivation protocol for FTIR spectroscopic characterization and...
FULL ARTICLE
A high-throughput microcultivation protocolfor FTIR spectroscopic characterizationand identification of fungi
Volha Shapaval*; 1, Trond Møretrø1, Henri-Pierre Suso2, Anette Wold Asli1,Jurgen Schmitt5, Dag Lillehaug2, Harald Martens1; 3; 4, Ulrike Bocker1,and Achim Kohler1
1 Nofima Mat AS, Centre for Biospectroscopy and Data modeling, Osloveien 1, 1430 �As, Norway2 Elope AS, Spikkestad, Norway3 CIGENE – Center for Integrative Genetics, Norwegian University of Life Sciences, 1432 �As, Norway4 Department of Mathematical Sciences and Technology (IMT), Norwegian University of Life Sciences, 1432 �As, Norway5 Synthon GmbH, Heidelberg, Germany
Received 25 January 2010, accepted 3 March 2010Published online 26 April 2010
Key words: FTIR spectroscopy, microcultivation, fungi
# 2010 by WILEY-VCH Verlag GmbH & Co. KGaA, Weinheim
Journal of
BIOPHOTONICS
Characterization and identification of fungi in food in-dustry is an important issue both for routine analysisand trouble-shooting incidences. Present microbial tech-niques for fungal characterization suffer from a lowthroughput and are time consuming. In this study wepresent a protocol for high-throughput microcultivationand spectral characterization of fungi by Fourier trans-form infrared spectroscopy. For the study 11 species ofin total five different fungal genera (Alternaria, Aspergil-lus, Mucor, Paecilomyces, and Phoma) were analyzed byFTIR spectroscopy. All the strains were isolated fromtrouble-shooting incidents in the production of low andhigh acid beverages. The cultivation was performed inmalt extract broth (liquid medium) in a Bioscreen Csystem, allowing high-throughput cultivation of 200 sam-ples at the same time. Mycelium was subsequently in-vestigated by high-throughput Fourier transform infra-red spectroscopy. Four spectral regions, fatty acids þlipid (3200–2800 cm�1, 1300–1000 cm�1), protein–lipid(1800–1200 cm�1), carbohydrates (1200–700 cm�1) and“finger print” (900–700 cm�1) were evaluated for repro-ducibility and discrimination ability. The results showthat all spectral regions evaluated can be used as spec-
troscopic biomarkers for differentiation of fungi by FTIR.The influence of different growth times on the ability ofspecies discrimination by FTIR spectroscopy was investi-gated, and an optimal separation of all five genera wasobserved after five days of growth. This work presents anovel concept for high-throughput cultivation of fungifor FTIR spectroscopy that enables characterization oridentification of hundreds of strains per day.
Mean reproducibility of three spectral regions as a func-tion of cultivation time
* Corresponding author: e-mail: [email protected], Phone: +47 64 97 01 00, Fax: +47 64 97 03 33
Early View publication onwww.interscience.wiley.com(issue and page numbers not yet assigned;citable using Digital Object Identifier – DOI)
J. Biophoton. 1–10 (2010) / DOI 10.1002/jbio.201000014
1. Introduction
Fungi cause serious problems during food produc-tion and storage, since they may produce mycotoxinsand potentially allergenic spores. In addition, theycan induce the synthesis of many enzymes and causeadulterations of organoleptic characteristics [1, 2].Fungi can thrive in high and low acid food likejuices, cheese, bread, fruits, vegetables, jams, jelliesand pickles; and the diversity of fungi is high.
The food industry is using control check points(CCPs) in order to verify that all systems are workingunder controlled parameters. CCPs are monitored,recorded and rectified. They can be also used in foodindustry during trouble-shooting investigation, fungalidentification and in routine analysis. The number ofisolated micro-organisms can be high and there is aneed to develop a method that is cheap, fast and highthroughput. Traditional detection of food-borne fungiis performed by plating on selective media (colony-forming units) [3]; microscopic examination; meas-urements of conductance and other changes in elec-trical properties of the contaminated food substrate;detection of fungal metabolites such as chitin, ergo-sterol or ATP [4]. All these methods are time con-suming and are not specific enough [5, 6]. In additionsome of the methods need highly skilled staff, e.g. theidentification of fungi by microscopic techniques re-quires experienced operators. Methodology presentlyused for trouble shooting, consists of three steps: (1)An isolation, (2) a purification and (3) an identifica-tion procedure. The fungal cultures, obtained afterthe isolation procedure, are not pure and a purifica-tion step is needed in order to obtain pure fungal cul-tures. Finally, fungal pure isolates are identified dur-ing the last step by using specific mycological tests.All previously described steps are time consuming: Ittakes approximately 5 days to isolate fungi fromsamples (isolation procedure), another 5 days to pur-ify fungal isolates (purification procedure), and final-ly 5 to 7 days are needed for the identification proce-dure.
In recent years, rapid methods such as polymerasechain reaction (PCR) and tests based on DNA probes[7, 8], latex agglutination tests [7], direct epifluores-cent filter techniques [2], enzyme-linked immunosor-bent assay (ELISA) [4], immunomagnetic beads andbiochemical assays have been developed and many ofthese methods are commercially available. Thesemethods are rapid, precise and very sensitive for iden-tification purposes. Their major disadvantage is thehigh cost and the fact that they need highly skilled per-sonal. Therefore, their use in large scale is costly andthey are not suitable for industrial routine analysis.
FTIR spectroscopy was developed in the 1990sfor the identification and characterization of micro-organisms and is nowadays used in routine analysisof yeast and bacterial strains [9]. The advantages of
FTIR spectroscopy are high sensitivity, rapidity, easeof use, the universal applicability to all micro-organ-isms and its low running costs [10–12]. Previousstudies have shown that bacteria and yeasts can beidentified by FTIR spectroscopy on species and inmany cases even strain level [13–16].
Different FTIR spectroscopic techniques havebeen used to evaluate their discrimination ability foridentification of fungi: FTIR microscopy has been ap-plied for the identification of fungal genus Penicilliumsp., Memnoniella sp., Fusarium sp. [11] and fungalphyto-pathogens [10]. FTIR spectroscopy has beenused for the differentiation of Aspergillus and Penicil-lium on generic, species and strain level [17], intra-species characterization of airborne filamentous fungi[17] and identification of dermatophytes [18]. Thesestudies are promising and we therefore believe thatFTIR spectroscopy has a clear potential for routineanalysis and trouble shooting in the food industry.The major characterizing features that have to be va-lidated in order to make this new upcoming technol-ogy suitable for industrial use are discrimination abil-ity, high-throughput characteristics, rapidity andreproducibility. The aim of this study was to developa new protocol for high-throughput FTIR screeningthat is developing and optimizing these features.
In the present paper we present a protocol forhigh-throughput cultivation of fungi in liquid med-ium for high-throughput FTIR spectroscopy. In thisprotocol we optimized the sample-preparation pro-cedure with respect to differentiation by FTIR spec-troscopy and in order to achieve sufficient highthroughput for use in routine analysis. Data prepro-cessing protocols for postmeasurement reproducibil-ity improvement have been adapted to the newhigh-throughput protocol.
2. Materials and methods
2.1 Mold strains
All fungal strains are isolates from the food industry.They have been characterized and identified byMycoteam AS (Oslo, Norway) or by the Microbiolo-gical Laboratory at Elopak (Spikkestad, Norway).Information about the sources of isolation is given inTable 1.
2.2 Sample preparationand FTIR measurements
Fungi were grown on malt extract agar (MEA) (Ox-oid, Basingstoke, England) and malt extract broth
V. Shapaval et al.: A high-throughput microcultivation protocol for FTIR spectroscopic characterization of fungi2
Journal of
BIOPHOTONICS
# 2010 by WILEY-VCH Verlag GmbH & Co. KGaA, Weinheim www.biophotonics-journal.org
(MEB, Oxoid). The first step of cultivation was doneon MEA at 25 �C for 5–6 days. Spore suspensionswere prepared by collecting spores from the MEAplates with cotton tips followed by resuspension in10 mL of Tween (T-20) 0.1% (v/v) (Sigma-Aldrich).The second cultivation step was done in the auto-mated Bioscreen C system (Oy Growth Curves AB,Helsinki, Finland), using liquid MEB as medium. Theworking volume of medium in the wells of the Bio-screen microplate (Oy Growth Curves AB, Helsinki,Finland) was 400 ml, consisting of 360 ml of MEB and40 ml of spore suspension. The control wells werefilled with medium (MEB) without spore suspension.Cultivation was carried out at 25 �C, with automati-cally continuous shaking and the optical density ofthe fungal cultures was measured automatically at540 nm every second hour, for five days.
Samples of the fungal mycelium were taken after2, 3, 4, and 5 days and measured by FTIR spectro-scopy. Before FTIR measurements each sample wasprepared in the following way: (1) Mycelium wastransferred from the Bioscreen microplates with abacterial loop to Eppendorf tubes and washed threetimes with 400 ml of distilled H2O, (2) to make the sus-pension of the fungal mycelium homogenous, myce-lium with 50 ml of water was sonicated in a bath-soni-cator (ultrasonic cleaner, VWR; Germany) for 45 minat room temperature. Of each suspension, 8 ml wastransferred to an IR-light-transparent silicon 384-wellmicrotiter plate (Bruker Optik GmbH, Germany).The samples were dried under moderate vacuum (0.9bar) in a desiccator to form films suitable for FTIRanalysis. FTIR measurements were performed using ahigh throughput screening extension (HTS-XT) unitcoupled to a Tensor 27 spectrometer (both BrukerOptik GmbH, Germany). The spectra were recordedin the region between 4000 and 500 cm�1 with a spec-tral resolution of 6 cm�1 and an aperture of 5.0 mm.For each spectrum, 64 scans were averaged.
3. Experimental setup
For each strain, mycelium was collected on 4 differ-ent days (day 2, 3, 4 and 5). For each strain and timepoint, 3 independent cultivations were prepared.From each cultivation 3 technical replicates were ob-tained for FTIR spectroscopy, resulting in a total of380 spectra (one cultivation for Alternaria alternatawas lost due to technical problems).
3.1 Preprocessing of the FTIR spectraand data analysis
The infrared spectra were preprocessed by takingsecond-derivative spectra using a nine-point Savits-ky–Golay algorithm and subsequently applying ex-tended multiplicative signal correction (EMSC) [19].For the EMSC correction a replicate model was con-structed as described by Kohler et al. In order toestimate the replicate variation only technical repli-cates were used, i.e. variation between spectra ob-tained from the same cultivation was estimated andbuild into the replicate correction model. In theEMSC replicate model 5 principal components wereused. The number of components was defined withrespect to the explained variance; explained variancewas 88% using 5 components.
Different spectral regions were examined by com-paring interstrain variation to variation between bio-logical replicates. This was done for the followingspectral regions: (1) fatty-acids region: 3200–2800 cm�1; (2) lipid head group region: 1300–1000 cm�1; (3) protein–lipid region: 1800–1200 cm�1;(4) carbohydrate region: 1200–700 cm�1.
In order to compare the interstrain variation tothe inter-replicate variation (variation between bio-logical replicates), the ratio of the mean-squared
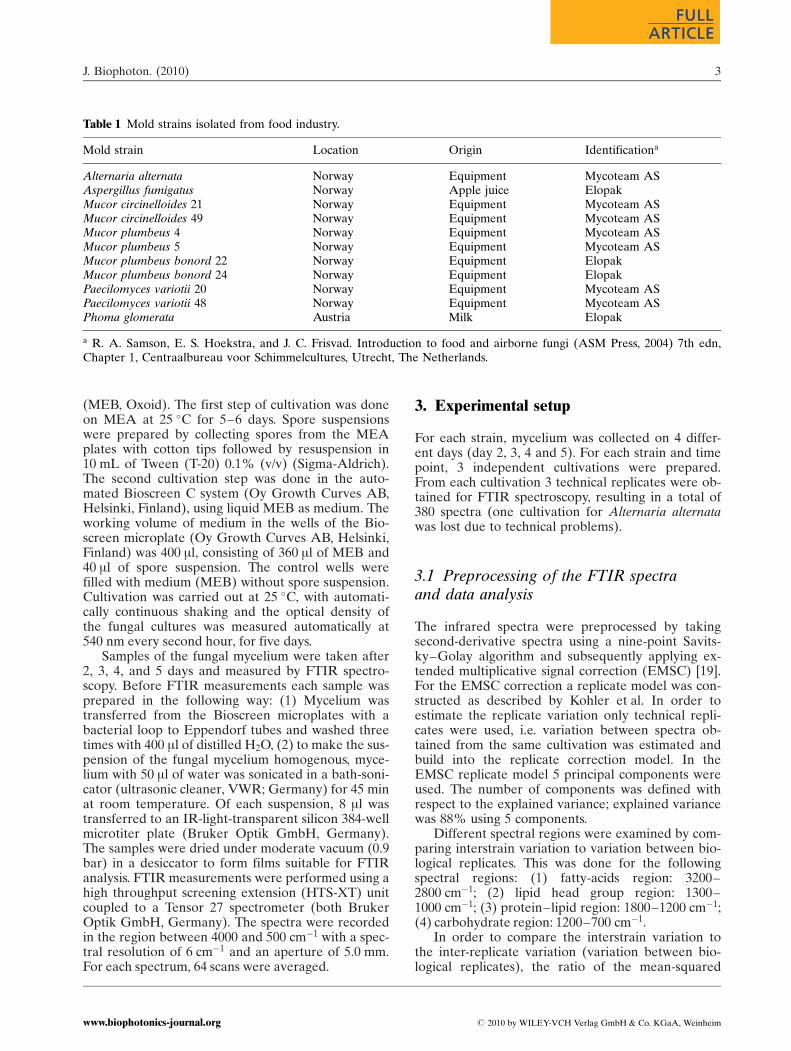
Table 1 Mold strains isolated from food industry.
Mold strain Location Origin Identificationa
Alternaria alternata Norway Equipment Mycoteam ASAspergillus fumigatus Norway Apple juice ElopakMucor circinelloides 21 Norway Equipment Mycoteam ASMucor circinelloides 49 Norway Equipment Mycoteam ASMucor plumbeus 4 Norway Equipment Mycoteam ASMucor plumbeus 5 Norway Equipment Mycoteam ASMucor plumbeus bonord 22 Norway Equipment ElopakMucor plumbeus bonord 24 Norway Equipment ElopakPaecilomyces variotii 20 Norway Equipment Mycoteam ASPaecilomyces variotii 48 Norway Equipment Mycoteam ASPhoma glomerata Austria Milk Elopak
a R. A. Samson, E. S. Hoekstra, and J. C. Frisvad. Introduction to food and airborne fungi (ASM Press, 2004) 7th edn,Chapter 1, Centraalbureau voor Schimmelcultures, Utrecht, The Netherlands.
J. Biophoton. (2010) 3
FULLFULLARTICLEARTICLE
# 2010 by WILEY-VCH Verlag GmbH & Co. KGaA, Weinheimwww.biophotonics-journal.org

error (MSE) between the strains (BS) and themean-squared error (MSE) within the strains (WS)was estimated using the method of Kohler et al. TheMSE(BS)/MSE(WS) ratios give an estimate of thereproducibility. They can either be presented as afunction of wave numbers in order to obtain an esti-mate for the discrimination abilities of single bandsor as mean values for different spectral regions.
In addition, the different spectral regions wereanalyzed by principal component analysis (PCA).PCA was used to investigate how well the strainsclustered with respect to genus and species.
In order to evaluate the natural clusters in thespectral data, hierarchical cluster analysis (HCA)was used. The construction of dendrograms was per-formed using Ward’s linkage algorithm [20]. For cal-culating spectral distance a Euclidian was used andfive principal components with an explained var-iance of 92% were used for PCA.
The data analysis was performed using Unscram-bler 9.6 (Camo, Oslo, Norway) and in-house devel-oped algorithms in Matlab (The MathWorks Inc.,Natick, United States).
4. Results
4.1 Optimization of growth time for FTIRspectroscopy
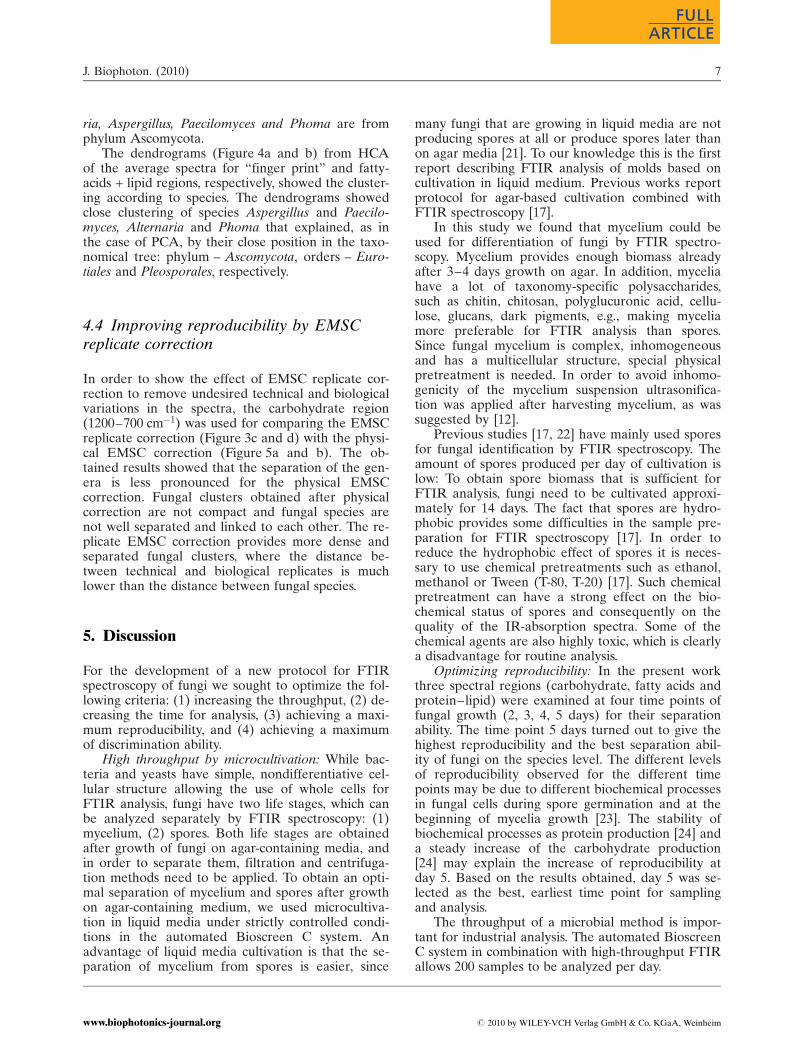
In order to determine the optimal time point forsampling of fungal mycelium for FTIR analysis,mean MSE(BS)/MSE(WS) ratios were calculated forthe four time points of the fungal growth and for dif-ferent spectral regions (Figure 1). For the four timepoints tested (2, 3, 4 and 5 days of growth), the high-est reproducibility was obtained after 5 days ofgrowth for carbohydrate and protein–lipid regions;the fatty-acids region did not show an increase in re-producibility after day 4. Based on these results itwas decided for further analysis to use data obtainedfor samples taken after five days of cultivation.Comparing the mean MSE(BS)/MSE(WS) ratios ofdifferent spectral regions (Figure 1) showed that thecarbohydrate region has the highest reproducibilityduring the whole growth time – reaching a maxi-mum point after five days of cultivation. Fatty acidsand protein–lipid regions have lower reproducibilityin comparison with the carbohydrate region. Thefatty-acids region shows an increase in reproducibil-ity at the beginning of growth, and a decrease at theend of growth. In the protein–lipid region an in-crease in reproducibility can be observed during thewhole growth and it becomes stable at the end ofgrowth. The carbohydrate region shows a trend simi-lar to the protein–lipid region but ends at a higherreproducibility level after 5 days.
4.2 Discrimination ability of differentspectral regions
In Figure 2 the MSE(BS)/MSE(WS) ratio is presentedas a function of the wave numbers for the fatty acids,protein–lipid and carbohydrate region. It can be seenthat in the fatty-acids region (Figure 2a), MSE(BS)/MSE(WS) is high for CH3 (a) symmetric stretching(2957 cm�1, 2872 cm�1), CH2 (a) symmetric stretching(2919 cm�1, 2852 cm�1) and �C––H stretching(3010 cm�1) bands. In addition, a high MSE(BS)/MSE(WS) ratio was obtained for the P¼O asym-metric stretching region (1250–1200 cm�1) corre-sponding to phosphodiesters (Figure 2b and c) and forester C¼O stretching (1742 cm�1, 1728 cm�1) (Fi-gure 2c).
The protein regions (Figure 2c), especially amide(1700–1600 cm�1) and amide (1300 cm�1) alsoshowed a high MSE(BS)/MSE(WS) ratio. The highestMSE(BS)/MSE(WS) ratio was obtained for the carbo-hydrate region (Figure 2d), which is presented mostlyby C–O––C, C––O ring vibrations (1200–700 cm�1)and the so-called “finger print” (900–700 cm�1) re-gion [15, 21].
4.3 Discrimination of different fungiby FTIR spectroscopy
Principal component analysis (PCA) was used to in-vestigate the separation of five fungal genera (Alter-naria, Aspergillus, Mucor, Paecilomyces, and Pho-ma). PCA analysis was done on four spectralregions: (1) The fatty-acids þ lipid region (3200–
Figure 1 (online color at: www.biophotonics-journal.org)Mean reproducibility of three spectral regions as a func-tion of cultivation time: Ratio of the mean-squared error(MSE) between strains (BS) and the mean-squared error(MSE) within the strains (WS) of the FTIR spectra of the11 fungal strains at different time – points of growth: circle(blue) – fatty-acids region (3200–2800 cm�1), square(green) – protein–lipid region (1800–1200 cm�1), triangle(red) – carbohydrate region (1200–700 cm�1).
V. Shapaval et al.: A high-throughput microcultivation protocol for FTIR spectroscopic characterization of fungi4
Journal of
BIOPHOTONICS
# 2010 by WILEY-VCH Verlag GmbH & Co. KGaA, Weinheim www.biophotonics-journal.org
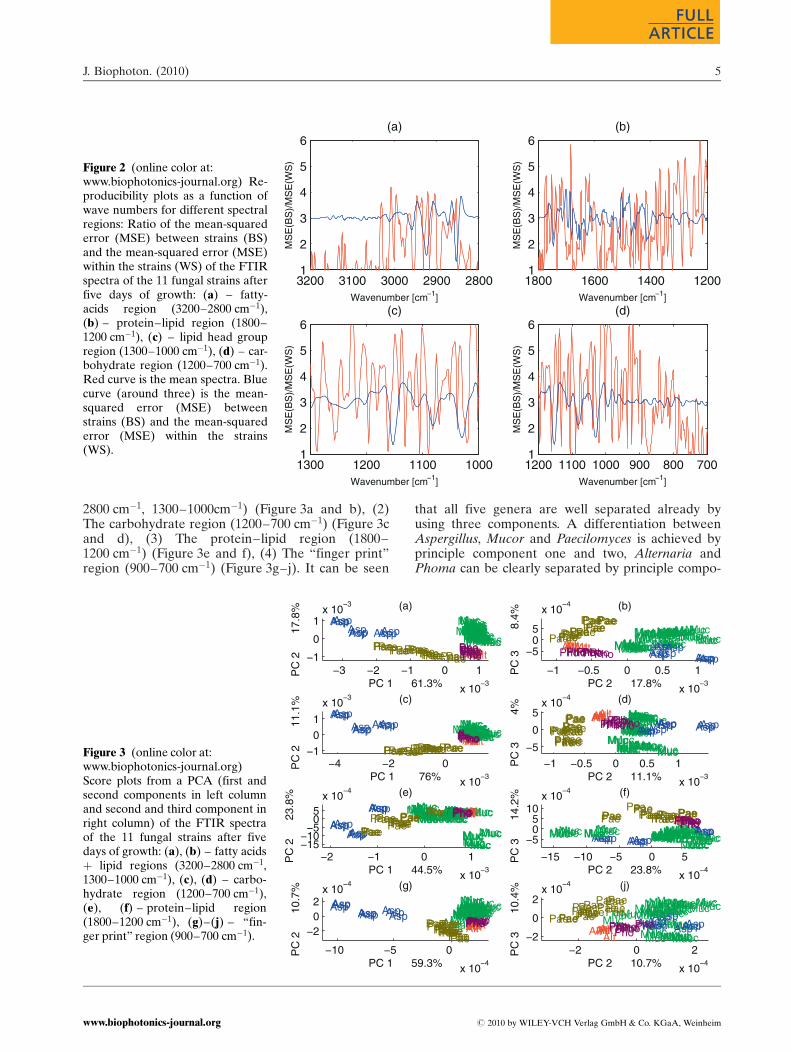
2800 cm�1, 1300–1000cm�1) (Figure 3a and b), (2)The carbohydrate region (1200–700 cm�1) (Figure 3cand d), (3) The protein–lipid region (1800–1200 cm�1) (Figure 3e and f), (4) The “finger print”region (900–700 cm�1) (Figure 3g–j). It can be seen
that all five genera are well separated already byusing three components. A differentiation betweenAspergillus, Mucor and Paecilomyces is achieved byprinciple component one and two, Alternaria andPhoma can be clearly separated by principle compo-
−3 −2 −1 0 1
x 10−3
−1
0
1x 10
−3
PC 1 61.3%
PC
2
17
.8% (a)
MucMucMucMucMuc
MucMucMucMucMucMucMucMucMuc
MucMucMucMucMucMucMucMucMucMucMucMuc
MucMucMuc
MucMuc
MucMucMucMucMuc
AspAspAspAspAsp
Alt
AspAsp
AltAlt
Asp
PaePaePaeMucMucMucAsp
PaePaePae PaePaePaePaePae PhoPaePae PhoPhoPae AltAltAlt
PaePaePaePae PhoPho
MucMucMucMucMucMucMucMucPhoMucMucMucMucMucMucMuc
PhoPhoPho−1 −0.5 0 0.5 1
x 10−3
−505
x 10−4
PC 2 17.8%
PC
3
8
.4% (b)
MucMuc MucMucMucMuc
MucMucMucMucMuc
MucMucMucMucMucMuc
MucMucMucMucMucMucMucMucMuc
MucMucMuc
MucMuc
MucMucMucMucMuc
AspAspAspAspAspAlt AspAspAltAlt
Asp
PaePaePae
MucMucMuc Asp
PaePaePae
PaePaePaePaePae
Pho
PaePae
PhoPhoPaeAltAltAlt
PaePaePaePae
PhoPho
MucMucMucMucMucMuc
MucMucPho MucMucMucMucMucMucMuc
PhoPhoPho
−4 −2 0
x 10−3
−1
0
1
x 10−3
PC 1 76%
PC
2
11
.1% (c)
MucMucMucMucMucMucMucMucMucMucMucMucMucMucMucMucMucMucMucMucMucMucMucMucMucMucMucMucMucMucMucMucMucMucMucMuc
AspAspAspAspAsp
Alt
AspAspAltAlt
Asp
PaePaePae
MucMucMucAsp
PaePaePae PaePaePaePaePaePho
PaePaePhoPho
PaeAltAltAlt
PaePaePae PaePhoPhoMucMucMucMucMucMucMucMucPhoMucMucMucMucMucMucMucPhoPhoPho
−1 −0.5 0 0.5 1
x 10−3
−5
0
5x 10
−4
PC 2 11.1%
PC
3
4%
(d)
MucMuc
MucMucMuc
MucMucMuc
MucMucMucMucMucMuc
MucMucMucMucMucMucMuc
MucMucMucMucMuc
MucMucMucMucMuc
MucMucMucMucMuc
AspAspAspAspAspAlt
AspAspAltAlt
AspPaePaePae
MucMucMucAsp
PaePaePaePaePaePaePaePae
PhoPaePae PhoPhoPae AltAltAlt
PaePaePae
Pae PhoPho
MucMucMuc
Muc
MucMuc
MucMucPhoMucMucMuc
MucMucMucMuc
PhoPhoPho
−2 −1 0 1
x 10−3
−15−10
−505
x 10−4
PC 1 44.5%
PC
2
23
.8% (e)
MucMucMucMucMucMucMucMucMucMucMuc
MucMucMucMucMucMuc MucMucMucMucMucMucMucMucMuc MucMucMuc MucMucMucMucMucMucMuc
AspAspAspAspAsp
AltAspAsp AltAltAsp PaePaePae
MucMucMuc
AspPaePaePae
PaePaePaePaePae PhoPaePae
PhoPhoPae AltAltAlt
PaePaePaePae
PhoPhoMucMucMuc
Muc
MucMuc
MucMuc
Pho
MucMucMuc
MucMucMucMucPhoPhoPho
−15 −10 −5 0 5
x 10−4
−505
10x 10
−4
PC 2 23.8%
PC
3
14
.2% (f)
MucMucMucMucMuc
MucMucMucMucMucMucMucMucMuc MucMucMucMucMucMucMuc MucMucMucMucMuc
MucMucMuc
MucMucMucMucMucMucMucAspAspAspAspAsp
AltAspAsp
AltAlt
Asp
PaePaePaeMucMucMuc Asp
PaePaePae PaePaePaePaePaePho
PaePaePhoPhoPae
AltAltAltPaePaePae Pae PhoPhoMucMucMucMuc MucMucMucMuc
PhoMucMucMuc MucMucMucMuc
PhoPhoPho
−10 −5 0
x 10−4
−202
x 10−4
PC 1 59.3%
PC
2
10
.7% (g)
MucMucMucMucMuc
MucMucMucMucMucMucMucMucMucMucMucMuc
MucMucMucMucMucMucMucMucMucMucMucMucMucMucMucMuc
MucMucMucAspAsp
AspAspAspAlt
AspAsp
AltAlt
Asp
PaePaePae
MucMucMucAsp
PaePaePaePaePaePaePaePaePho
PaePaePhoPho
PaeAltAltAltPaePaePae
PaePhoPhoMucMucMucMucMucMuc
MucMucPho
MucMucMucMucMucMucMucPhoPhoPho
−2 0 2
x 10−4
−2
0
2x 10
−4
PC 2 10.7%
PC
3
10
.4% (j)
MucMucMucMucMuc
MucMucMucMucMuc Muc
MucMucMuc
MucMucMucMuc MucMucMuc
MucMuc MucMucMuc
Muc
MucMuc
MucMuc
MucMucMucMucMucAspAspAspAspAsp
AltAspAsp
AltAlt AspPaePaePae
MucMucMuc
AspPaePaePae
PaePaePaePaePaePho
PaePaePhoPho
PaeAltAltAlt
PaePaePaePae
PhoPho
MucMucMuc
Muc
MucMuc
MucMucPho
MucMucMuc
MucMucMucMuc
PhoPhoPho
280029003000310032001
2
3
4
5
6
Wavenumber [cm−1]M
SE
(BS
)/M
SE
(WS
)
(a)
12001400160018001
2
3
4
5
6
Wavenumber [cm−1]
MS
E(B
S)/
MS
E(W
S)
(b)
10001100120013001
2
3
4
5
6
Wavenumber [cm−1]
MS
E(B
S)/
MS
E(W
S)
(c)
7008009001000110012001
2
3
4
5
6
Wavenumber [cm−1]
MS
E(B
S)/
MS
E(W
S)
(d)
Figure 2 (online color at:www.biophotonics-journal.org) Re-producibility plots as a function ofwave numbers for different spectralregions: Ratio of the mean-squarederror (MSE) between strains (BS)and the mean-squared error (MSE)within the strains (WS) of the FTIRspectra of the 11 fungal strains afterfive days of growth: (a) – fatty-acids region (3200–2800 cm�1),(b) – protein–lipid region (1800–1200 cm�1), (c) – lipid head groupregion (1300–1000 cm�1), (d) – car-bohydrate region (1200–700 cm�1).Red curve is the mean spectra. Bluecurve (around three) is the mean-squared error (MSE) betweenstrains (BS) and the mean-squarederror (MSE) within the strains(WS).
Figure 3 (online color at:www.biophotonics-journal.org)Score plots from a PCA (first andsecond components in left columnand second and third component inright column) of the FTIR spectraof the 11 fungal strains after fivedays of growth: (a), (b) – fatty acidsþ lipid regions (3200–2800 cm�1,1300–1000 cm�1), (c), (d) – carbo-hydrate region (1200–700 cm�1),(e), (f) – protein–lipid region(1800–1200 cm�1), (g)–(j) – “fin-ger print” region (900–700 cm�1).
J. Biophoton. (2010) 5
FULLFULLARTICLEARTICLE
# 2010 by WILEY-VCH Verlag GmbH & Co. KGaA, Weinheimwww.biophotonics-journal.org

nent three. Alternaria and Phoma are taxonomicallycloser, since both of them are from the same order,Pleosporales, and therefore have a similar biochem-ical profile. Mucor, Aspergillus, and Paecilomyces are
species from different families: Mucor is from familyMucoraceae; Aspergillus and Paecilomyces are fromfamily Trichocomaceae. Also, they are from differentphyla: Mucor is from phylum Zygomycota; Alterna-
012
x 10−3
AltaltAltaltPhogloPhogloPhogloMuccirMuccirMuccirMuccirMucpluMuccirMucpluMucpluMucpluMucpluMucpluMucpluMucpluMucpluMucpluMucpluMucpluPaevarPaevarPaevarPaevarPaevarPaevarAspfumAspfumAspfum
(a)
02468
x 10−3
MucpluMucpluMucpluMucpluMucpluMucpluMucpluMucpluMucpluMucpluMucpluMucpluMuccirMuccirMuccirMuccirMuccirAltaltAltaltPhogloPhogloPhogloPaevarAspfumAspfumAspfumPaevarPaevarPaevarPaevarPaevar
(b)
Figure 4 (online color at:www.biophotonics-journal.org)Dendrogram from the HCA of theaverage spectra of the 11 fungalstrains after five days of growth.Two spectral regions were used inthe clustering: (a) – “finger print”region (900–700 cm�1), (b) – fatty-acids þ lipid region (3200–2800 cm�1, 1300–1000 cm�1).
−4 −2 0
x 10−3
−2.5
−2
−1.5
−1
−0.5
0
0.5
1
1.5
2
x 10−3
PC 1 49.2%
PC
2
30
.3%
(a)
MuMu
MuMu
Mu
Mu
MuMu
MuMu
Mu
MuMu
Mu
MuMuMu
Mu
MuMuMu
Mu
MuMu
Mu
Mu
Mu
MuMu
MuMu
Mu
Mu
MuMuMu
AsAs
AsAsAs
Al
AsAs
AlAl
As
Pa
PaPa Mu
MuMu
As
Pa
Pa
Pa
Pa
Pa
PaPaPa PhPaPa
PhPh
PaAlAl
Al
PaPa
Pa
Pa
PhPh
Mu
Mu
Mu
Mu
Mu
Mu
MuMu
Ph
MuMuMu
MuMu
Mu
Mu
PhPhPh
−4 −2 0
x 10−3
−1.5
−1
−0.5
0
0.5
1
1.5
x 10−3
PC 1 49.2%
PC
3
10
.8%
(b)
MuMu
Mu
Mu
Mu
Mu
Mu
Mu
Mu
Mu
Mu
MuMu
MuMu
MuMu
Mu
Mu
Mu
Mu
Mu
Mu
Mu
Mu
Mu
Mu
Mu
MuMuMu
Mu
Mu
Mu
Mu
Mu
AsAs
AsAsAs
Al
As
As
AlAl
As
PaPa
Pa
Mu
Mu
Mu
As
Pa
PaPa
Pa
PaPa
PaPa
Ph
PaPa
Ph
Ph
Pa
Al
Al
Al
PaPa
Pa
Pa PhPhMu
Mu
Mu
Mu
MuMu
MuMu
PhMu
Mu
Mu
Mu
Mu
Mu
Mu
PhPh
Ph
Figure 5 (online color at:www.biophotonics-journal.org)Score plots from a PCA (first andsecond component) of the physicalEMSC corrected FTIR spectra ofthe 11 fungal strains after five daysof growth. One spectral region wasused in PCA analysis: 1200–700 cm�1.
V. Shapaval et al.: A high-throughput microcultivation protocol for FTIR spectroscopic characterization of fungi6
Journal of
BIOPHOTONICS
# 2010 by WILEY-VCH Verlag GmbH & Co. KGaA, Weinheim www.biophotonics-journal.org
ria, Aspergillus, Paecilomyces and Phoma are fromphylum Ascomycota.
The dendrograms (Figure 4a and b) from HCAof the average spectra for “finger print” and fatty-acids + lipid regions, respectively, showed the cluster-ing according to species. The dendrograms showedclose clustering of species Aspergillus and Paecilo-myces, Alternaria and Phoma that explained, as inthe case of PCA, by their close position in the taxo-nomical tree: phylum – Ascomycota, orders – Euro-tiales and Pleosporales, respectively.
4.4 Improving reproducibility by EMSCreplicate correction
In order to show the effect of EMSC replicate cor-rection to remove undesired technical and biologicalvariations in the spectra, the carbohydrate region(1200–700 cm�1) was used for comparing the EMSCreplicate correction (Figure 3c and d) with the physi-cal EMSC correction (Figure 5a and b). The ob-tained results showed that the separation of the gen-era is less pronounced for the physical EMSCcorrection. Fungal clusters obtained after physicalcorrection are not compact and fungal species arenot well separated and linked to each other. The re-plicate EMSC correction provides more dense andseparated fungal clusters, where the distance be-tween technical and biological replicates is muchlower than the distance between fungal species.
5. Discussion
For the development of a new protocol for FTIRspectroscopy of fungi we sought to optimize the fol-lowing criteria: (1) increasing the throughput, (2) de-creasing the time for analysis, (3) achieving a maxi-mum reproducibility, and (4) achieving a maximumof discrimination ability.
High throughput by microcultivation: While bac-teria and yeasts have simple, nondifferentiative cel-lular structure allowing the use of whole cells forFTIR analysis, fungi have two life stages, which canbe analyzed separately by FTIR spectroscopy: (1)mycelium, (2) spores. Both life stages are obtainedafter growth of fungi on agar-containing media, andin order to separate them, filtration and centrifuga-tion methods need to be applied. To obtain an opti-mal separation of mycelium and spores after growthon agar-containing medium, we used microcultiva-tion in liquid media under strictly controlled condi-tions in the automated Bioscreen C system. Anadvantage of liquid media cultivation is that the se-paration of mycelium from spores is easier, since
many fungi that are growing in liquid media are notproducing spores at all or produce spores later thanon agar media [21]. To our knowledge this is the firstreport describing FTIR analysis of molds based oncultivation in liquid medium. Previous works reportprotocol for agar-based cultivation combined withFTIR spectroscopy [17].
In this study we found that mycelium could beused for differentiation of fungi by FTIR spectro-scopy. Mycelium provides enough biomass alreadyafter 3–4 days growth on agar. In addition, myceliahave a lot of taxonomy-specific polysaccharides,such as chitin, chitosan, polyglucuronic acid, cellu-lose, glucans, dark pigments, e.g., making myceliamore preferable for FTIR analysis than spores.Since fungal mycelium is complex, inhomogeneousand has a multicellular structure, special physicalpretreatment is needed. In order to avoid inhomo-genicity of the mycelium suspension ultrasonifica-tion was applied after harvesting mycelium, as wassuggested by [12].
Previous studies [17, 22] have mainly used sporesfor fungal identification by FTIR spectroscopy. Theamount of spores produced per day of cultivation islow: To obtain spore biomass that is sufficient forFTIR analysis, fungi need to be cultivated approxi-mately for 14 days. The fact that spores are hydro-phobic provides some difficulties in the sample pre-paration for FTIR spectroscopy [17]. In order toreduce the hydrophobic effect of spores it is neces-sary to use chemical pretreatments such as ethanol,methanol or Tween (T-80, T-20) [17]. Such chemicalpretreatment can have a strong effect on the bio-chemical status of spores and consequently on thequality of the IR-absorption spectra. Some of thechemical agents are also highly toxic, which is clearlya disadvantage for routine analysis.
Optimizing reproducibility: In the present workthree spectral regions (carbohydrate, fatty acids andprotein–lipid) were examined at four time points offungal growth (2, 3, 4, 5 days) for their separationability. The time point 5 days turned out to give thehighest reproducibility and the best separation abil-ity of fungi on the species level. The different levelsof reproducibility observed for the different timepoints may be due to different biochemical processesin fungal cells during spore germination and at thebeginning of mycelia growth [23]. The stability ofbiochemical processes as protein production [24] anda steady increase of the carbohydrate production[24] may explain the increase of reproducibility atday 5. Based on the results obtained, day 5 was se-lected as the best, earliest time point for samplingand analysis.
The throughput of a microbial method is impor-tant for industrial analysis. The automated BioscreenC system in combination with high-throughput FTIRallows 200 samples to be analyzed per day.
J. Biophoton. (2010) 7
FULLFULLARTICLEARTICLE
# 2010 by WILEY-VCH Verlag GmbH & Co. KGaA, Weinheimwww.biophotonics-journal.org
The EMSC replicate correction is further increas-ing reproducibility. This is achieved by collecting thereplicate variation of cultivations of the same strainobtained in the same Bioscreen C run and buildingthis variation into the EMSC replicate correctionmodel. The replicate correction increased the discri-mination ability further. By cultivating micro-organ-isms in duplicate or triplicate in trouble shooting, thereplicate correction can be part of the data-analysisalgorithm for industrial trouble shooting.
Discrimination ability of spectral regions: The lowreproducibility of the protein region at time point2 days may be due to an increasing amount of pro-teins in fungal cells at this time point. It is knownfrom the literature [24] that spores is rich in DNAand RNA and as a result in proteins, during germi-nation (24–48 h) the amount of proteins increasesrapidly due to cell division, transcription and transla-tion processes inside of cells, after that their amountbecomes constant. Carbohydrates are the most typi-cal reserve material in the fungal cells and theiramount becomes more and more stable during thegrowth [24], this can explain the high reproducibilityfor the carbohydrate region.
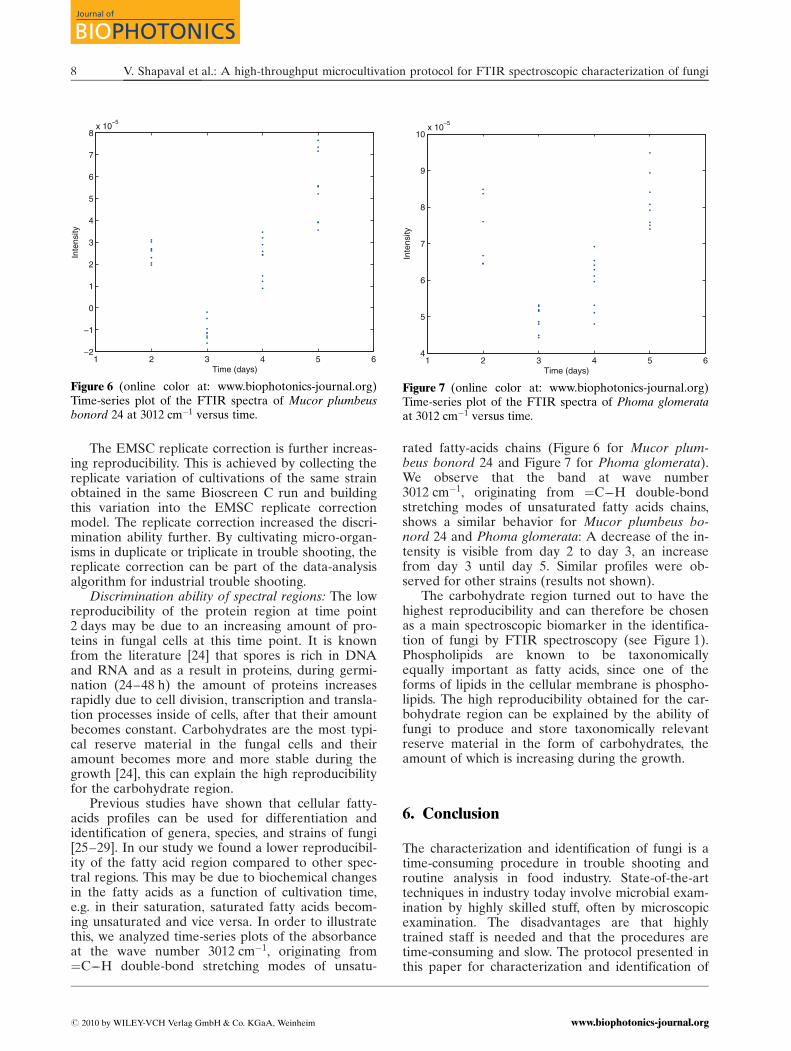
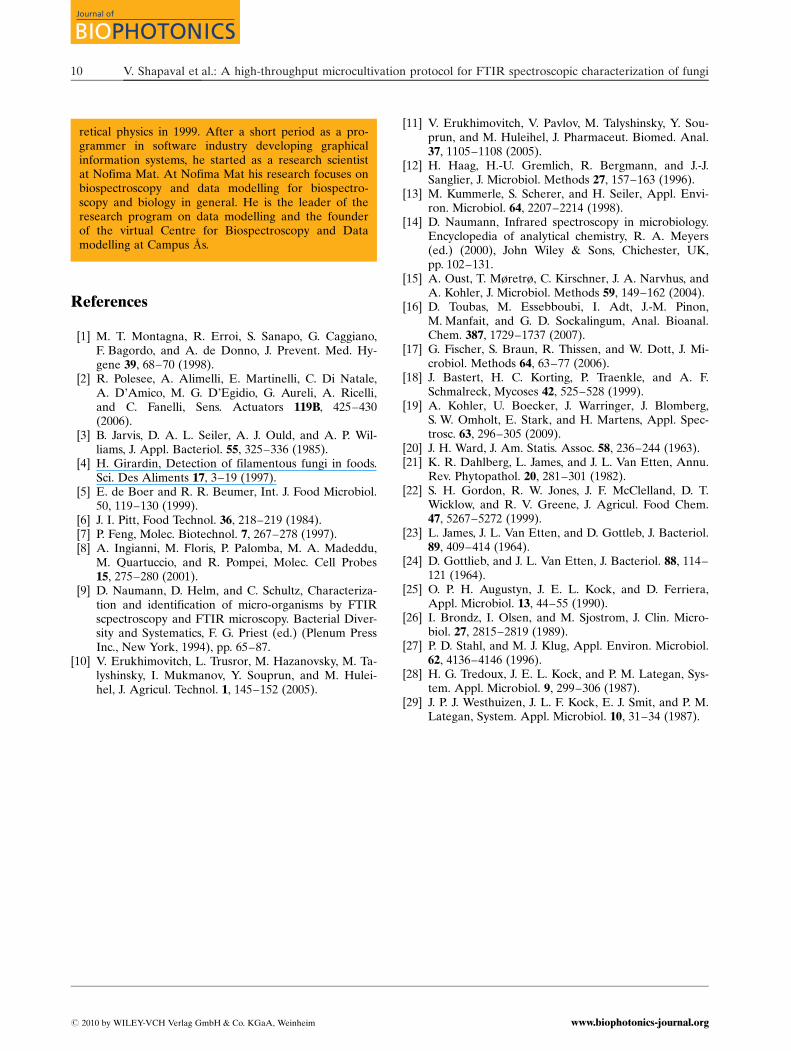
Previous studies have shown that cellular fatty-acids profiles can be used for differentiation andidentification of genera, species, and strains of fungi[25–29]. In our study we found a lower reproducibil-ity of the fatty acid region compared to other spec-tral regions. This may be due to biochemical changesin the fatty acids as a function of cultivation time,e.g. in their saturation, saturated fatty acids becom-ing unsaturated and vice versa. In order to illustratethis, we analyzed time-series plots of the absorbanceat the wave number 3012 cm�1, originating from¼C––H double-bond stretching modes of unsatu-
rated fatty-acids chains (Figure 6 for Mucor plum-beus bonord 24 and Figure 7 for Phoma glomerata).We observe that the band at wave number3012 cm�1, originating from ¼C––H double-bondstretching modes of unsaturated fatty acids chains,shows a similar behavior for Mucor plumbeus bo-nord 24 and Phoma glomerata: A decrease of the in-tensity is visible from day 2 to day 3, an increasefrom day 3 until day 5. Similar profiles were ob-served for other strains (results not shown).
The carbohydrate region turned out to have thehighest reproducibility and can therefore be chosenas a main spectroscopic biomarker in the identifica-tion of fungi by FTIR spectroscopy (see Figure 1).Phospholipids are known to be taxonomicallyequally important as fatty acids, since one of theforms of lipids in the cellular membrane is phospho-lipids. The high reproducibility obtained for the car-bohydrate region can be explained by the ability offungi to produce and store taxonomically relevantreserve material in the form of carbohydrates, theamount of which is increasing during the growth.
6. Conclusion
The characterization and identification of fungi is atime-consuming procedure in trouble shooting androutine analysis in food industry. State-of-the-arttechniques in industry today involve microbial exam-ination by highly skilled stuff, often by microscopicexamination. The disadvantages are that highlytrained staff is needed and that the procedures aretime-consuming and slow. The protocol presented inthis paper for characterization and identification of
1 2 3 4 5 6−2
−1
0
1
2
3
4
5
6
7
8x 10
−5
Time (days)
Inte
nsity
Figure 6 (online color at: www.biophotonics-journal.org)Time-series plot of the FTIR spectra of Mucor plumbeusbonord 24 at 3012 cm�1 versus time.
1 2 3 4 5 64
5
6
7
8
9
10x 10
−5
Inte
nsity
Time (days)
Figure 7 (online color at: www.biophotonics-journal.org)Time-series plot of the FTIR spectra of Phoma glomerataat 3012 cm�1 versus time.
V. Shapaval et al.: A high-throughput microcultivation protocol for FTIR spectroscopic characterization of fungi8
Journal of
BIOPHOTONICS
# 2010 by WILEY-VCH Verlag GmbH & Co. KGaA, Weinheim www.biophotonics-journal.org

fungi by FTIR spectroscopy presents an alternativemethod with three clear advantages. (1) The proto-col has a throughput that is sufficiently high for rou-tine analysis in the food industry: 200 strains can becultivated in parallel and subsequently analyzed byFTIR spectroscopy. (2) The spectral features ob-tained are highly reproducible and do not dependon a visual examination of highly skilled stuff. Andfinally, the reproducibility is sufficiently high to serveas a screening technique in trouble-shooting casesand routine analysis.
Acknowledgements This work was supported by thegrant 186909/I10 financed by the Research Council ofNorway. Financial support from the Agricultural Food Re-search Foundation is also greatly acknowledged.
Volha Shapaval received her M.Sc. in Microbiology atBelarusian State University, Minsk, Belarus in 2004.After a short period as a food microbiologist in beerindustry, she started a second master degree in Bio-and Food Technology at Lund University, Sweden in2006. Volha Shapaval started her Ph.D. at Nofima Matand at the University of Life Science �As, Norway inMay 2008. She is involved in the project “Trackingsources of microbial contamination along the food pro-duction chain by FTIR spectroscopy”.
Trond Møretrø received his master degree in microbiol-ogy at the University of Bergen in Norway in 1995. Heobtained his Ph.D. within the field microbiology/bio-technology, working with optimizing bacteriocin pro-duction in lactic acid bacteria, in 2000 at the Agricultur-al University of Norway. The Ph.D. work was done atNofima Mat. His research focuses on food microbiol-ogy, factors affect survival and growth of microorgan-isms, as well as use of FT-IR for characterization of mi-croorganisms.
Henri-Pierre Suso received his master degree in bio-technology at the University of Reading in England in1996 where he received his Ph.D. in 2002. This was fol-lowed by two postdoctoral, one in the field of popula-tion genetics in the same University as mentionedabove and the latter on functional genetics in the Re-search Atomic centre, Cadarache, France. He is cur-rently holding the position of Manager of Aseptic sys-tems in Elopak packaging company.
Anette Wold Asli holds a Bachelor in Biotechnologyfrom Hedmark University College, Norway. She startedworking as a technician at the Norwegian School ofVeterinary Science, Department of Food Safety and In-fection Biology, 1998–2008. Since 2008 she is working
as Food Technologist at Nofima Mat, Food Safety andQuality.
Jurgen Schmitt is founder a CEO of Synthon GmbH(Heidelberg, Germany) which specializes in the appli-cations of vibrational spectroscopy in industry and aca-demia. His research interest covers the applications formicrobiology, pharmaceutical research and biomedicinewhere he has almost 20 years of experience in the field.
Dag Lillehaug made his master degree in microbialecology at the Norwegian University of Science andTechnology in Trondheim and his Ph.D. in molecularmicrobiology at the University of Oslo. Since 1998,after approximately 20 years in academia, he has beenworking in industry, as head of an R&D department inthe Danone International Research Center in Paris andas Director R&D in Invitrogen/Dynal Biotech in Oslo.He is currently working as Chief Microbiologist in theCorporate Technology Center of Elopak AS in Nor-way.
Harald Martens has a background in biochemical engi-neering and has worked in the field of chemometricssince the early 70-ies, focusing on the conversion ofhigh-dimensional biological and chemical measure-ments into meaningful chemical information. He tookpart in developing the PLS regression method in theearly 80-ies and the Multiplicative Signal Correctrion(MSC). He defended his dr.techn. thesis at the Norwe-gian University of Science and Technology, Trondheim,Norway in 1985. In the 90-ies he worked on model-based compression of video signals. He is currentlyProfessor II, CIGENE/Inst.Math.Sci. & Technol., Nor-wegian U. of Life Sciences, �As and Senior researchscientist, Norwegian Food Research Institute, �As, Nor-way, and Adjunct professor, University of Copenhagen,Faculty of Life Sciences, Denmark.
Ulrike Bocker holds a master degree in Food Scienceand Technology from the University of Hohenheim,Stuttgart, Germany. In 2008 she received her Ph.D. inFood Chemistry from the Norwegian University of LifeSciences and is currently working as a Post-Doc at theNorwegian Institute of Food, Fisheries and Aquacul-ture Research. Her research involves FT-IR and Ra-man (micro-)spectroscopy applied in food sciences,both as methods for investigating process-induced ef-fects on protein secondary structure and as rapid qual-ity screening methods.
Achim Kohler received his master degree in physics atthe University of Freiburg in Germany in 1997 and ob-tained his Ph.D. in the field of Quantum Chaos in theo-
J. Biophoton. (2010) 9
FULLFULLARTICLEARTICLE
# 2010 by WILEY-VCH Verlag GmbH & Co. KGaA, Weinheimwww.biophotonics-journal.org
References
[1] M. T. Montagna, R. Erroi, S. Sanapo, G. Caggiano,F. Bagordo, and A. de Donno, J. Prevent. Med. Hy-gene 39, 68–70 (1998).
[2] R. Polesee, A. Alimelli, E. Martinelli, C. Di Natale,A. D’Amico, M. G. D’Egidio, G. Aureli, A. Ricelli,and C. Fanelli, Sens. Actuators 119B, 425–430(2006).
[3] B. Jarvis, D. A. L. Seiler, A. J. Ould, and A. P. Wil-liams, J. Appl. Bacteriol. 55, 325–336 (1985).
[4] H. Girardin, Detection of filamentous fungi in foods.Sci. Des Aliments 17, 3–19 (1997).
[5] E. de Boer and R. R. Beumer, Int. J. Food Microbiol.50, 119–130 (1999).
[6] J. I. Pitt, Food Technol. 36, 218–219 (1984).[7] P. Feng, Molec. Biotechnol. 7, 267–278 (1997).[8] A. Ingianni, M. Floris, P. Palomba, M. A. Madeddu,
M. Quartuccio, and R. Pompei, Molec. Cell Probes15, 275–280 (2001).
[9] D. Naumann, D. Helm, and C. Schultz, Characteriza-tion and identification of micro-organisms by FTIRscpectroscopy and FTIR microscopy. Bacterial Diver-sity and Systematics, F. G. Priest (ed.) (Plenum PressInc., New York, 1994), pp. 65–87.
[10] V. Erukhimovitch, L. Trusror, M. Hazanovsky, M. Ta-lyshinsky, I. Mukmanov, Y. Souprun, and M. Hulei-hel, J. Agricul. Technol. 1, 145–152 (2005).
[11] V. Erukhimovitch, V. Pavlov, M. Talyshinsky, Y. Sou-prun, and M. Huleihel, J. Pharmaceut. Biomed. Anal.37, 1105–1108 (2005).
[12] H. Haag, H.-U. Gremlich, R. Bergmann, and J.-J.Sanglier, J. Microbiol. Methods 27, 157–163 (1996).
[13] M. Kummerle, S. Scherer, and H. Seiler, Appl. Envi-ron. Microbiol. 64, 2207–2214 (1998).
[14] D. Naumann, Infrared spectroscopy in microbiology.Encyclopedia of analytical chemistry, R. A. Meyers(ed.) (2000), John Wiley & Sons, Chichester, UK,pp. 102–131.
[15] A. Oust, T. Møretrø, C. Kirschner, J. A. Narvhus, andA. Kohler, J. Microbiol. Methods 59, 149–162 (2004).
[16] D. Toubas, M. Essebboubi, I. Adt, J.-M. Pinon,M. Manfait, and G. D. Sockalingum, Anal. Bioanal.Chem. 387, 1729–1737 (2007).
[17] G. Fischer, S. Braun, R. Thissen, and W. Dott, J. Mi-crobiol. Methods 64, 63–77 (2006).
[18] J. Bastert, H. C. Korting, P. Traenkle, and A. F.Schmalreck, Mycoses 42, 525–528 (1999).
[19] A. Kohler, U. Boecker, J. Warringer, J. Blomberg,S. W. Omholt, E. Stark, and H. Martens, Appl. Spec-trosc. 63, 296–305 (2009).
[20] J. H. Ward, J. Am. Statis. Assoc. 58, 236–244 (1963).[21] K. R. Dahlberg, L. James, and J. L. Van Etten, Annu.
Rev. Phytopathol. 20, 281–301 (1982).[22] S. H. Gordon, R. W. Jones, J. F. McClelland, D. T.
Wicklow, and R. V. Greene, J. Agricul. Food Chem.47, 5267–5272 (1999).
[23] L. James, J. L. Van Etten, and D. Gottleb, J. Bacteriol.89, 409–414 (1964).
[24] D. Gottlieb, and J. L. Van Etten, J. Bacteriol. 88, 114–121 (1964).
[25] O. P. H. Augustyn, J. E. L. Kock, and D. Ferriera,Appl. Microbiol. 13, 44–55 (1990).
[26] I. Brondz, I. Olsen, and M. Sjostrom, J. Clin. Micro-biol. 27, 2815–2819 (1989).
[27] P. D. Stahl, and M. J. Klug, Appl. Environ. Microbiol.62, 4136–4146 (1996).
[28] H. G. Tredoux, J. E. L. Kock, and P. M. Lategan, Sys-tem. Appl. Microbiol. 9, 299–306 (1987).
[29] J. P. J. Westhuizen, J. L. F. Kock, E. J. Smit, and P. M.Lategan, System. Appl. Microbiol. 10, 31–34 (1987).
retical physics in 1999. After a short period as a pro-grammer in software industry developing graphicalinformation systems, he started as a research scientistat Nofima Mat. At Nofima Mat his research focuses onbiospectroscopy and data modelling for biospectro-scopy and biology in general. He is the leader of theresearch program on data modelling and the founderof the virtual Centre for Biospectroscopy and Datamodelling at Campus �As.
V. Shapaval et al.: A high-throughput microcultivation protocol for FTIR spectroscopic characterization of fungi10
Journal of
BIOPHOTONICS
# 2010 by WILEY-VCH Verlag GmbH & Co. KGaA, Weinheim www.biophotonics-journal.org