A FORECASTING TOURIST ARRIVALS IN SOUTH AFRICA
13
A. Saayman M. Saayman Forcasting tourist arrivals in South Africa 281 Acta Commercii 2010 FORECASTING TOURIST ARRIVALS IN SOUTH AFRICA Andrea Saayman: North-West University Melville Saayman North-West University SYNOPSIS: Purpose: The aim of this paper is to model and forecast tourism to South Africa from the country’s main intercontinental tourism markets. These include Great Britain, Germany, the Netherlands, the United States of America and France. Problem investigated: Tourism to South Africa has grown substantially since the first democratic elections in 1994. It is currently the third largest industry in the country and a vital source of foreign exchange earnings. Tourist arrivals continue to grow annually, and have shown some resilience to a number of emerging market crises, including the terrorist attacks in the USA. Business success, marketing decisions, government’s investment policy as well as macroeconomic policy are influenced by the accuracy of tourism forecasts, since the tourism product comprises a number of services that cannot be accumulated. Accurate forecasts of tourism demand are paramount to ensure the availability of such services when demanded. In addition, the seasonal nature of tourism leads to a pattern of excess capacity followed by shortage in capacity. Method: Since univariate time series modelling has proved to be a very successful method for forecasting tourist arrivals, it is also the method employed in this paper. The naïve model is tested against a standard ARIMA model, as well as the Holt-Winters exponential smoothing and seasonal-non-seasonal ARIMA models. Forecasting accuracy is assessed using the mean absolute percentage error, root mean square error and Theill’s U of the various models. Monthly tourist arrivals from 1994 to 2006 are used in the analysis, and arrivals are forecasted for 2007. Findings: The results show that seasonal ARIMA models deliver the most accurate predictions of arrivals over three time horizons, namely three months, six months and 12 months. Value: This paper is the first tourist arrivals forecast using South African data for the country as a whole, and therefore it forms an interesting case study as a long haul and growing tourist destination. Conclusion: The univariate forecasts provide fairly accurate forecasts of tourist arrivals in South Africa, especially over the short run. As such, it is understandable why it remains a popular approach to forecast tourist arrivals. However, this method does not make provision for assessing the influence of external events and therefore its policy application is limited. Keywords: forecasting, tourist arrivals, South Africa, ARIMA, SARIMA, Holt-Winter INTRODUCTION AND BACKGROUND TO FORECASTING METHODS After the democratic elections in 1994, tourism in South Africa has grown to become one of the country’s main earners of foreign exchange and creators of employment. The growth in tourism to South Africa meant that the country is currently the main destination for tourists to the African continent (UNWTO, 2009b: 38-39). The growth rate in tourist arrivals has also surpassed that of the world average for more than a decade. The growth is fuelled by reasons that include hosting major events, while political turmoil and terrorist attacks in other parts of the world have had positive effects on South African arrivals. In addition, major markets started to change their travel trends, with an increasing number of tourists from developed countries visiting developing countries (UNWTO, 2009b; Saayman & Rossouw, 2008: 2; SAT, 2009). Based on the arrival figures of visitors to South Africa (see Figure 1), it is clear that the country is experiencing significant growth, but the question remains whether this can be sustained. Answers to this question can assist both government and the private sector in pro-active decision-making (Song & Witt, 2006: 214-215).
-
Upload
universityofcolombo -
Category
Documents
-
view
0 -
download
0
Transcript of A FORECASTING TOURIST ARRIVALS IN SOUTH AFRICA

A. Saayman M. Saayman
Forcasting tourist arrivals in South Africa
281
Acta Commercii 2010
FORECASTING TOURIST ARRIVALS IN SOUTH AFRICA Andrea Saayman: North-West University Melville Saayman North-West University
SYNOPSIS: Purpose: The aim of this paper is to model and forecast tourism to South Africa from the country’s main intercontinental tourism markets. These include Great Britain, Germany, the Netherlands, the United States of America and France. Problem investigated: Tourism to South Africa has grown substantially since the first democratic elections in 1994. It is currently the third largest industry in the country and a vital source of foreign exchange earnings. Tourist arrivals continue to grow annually, and have shown some resilience to a number of emerging market crises, including the terrorist attacks in the USA. Business success, marketing decisions, government’s investment policy as well as macroeconomic policy are influenced by the accuracy of tourism forecasts, since the tourism product comprises a number of services that cannot be accumulated. Accurate forecasts of tourism demand are paramount to ensure the availability of such services when demanded. In addition, the seasonal nature of tourism leads to a pattern of excess capacity followed by shortage in capacity. Method: Since univariate time series modelling has proved to be a very successful method for forecasting tourist arrivals, it is also the method employed in this paper. The naïve model is tested against a standard ARIMA model, as well as the Holt-Winters exponential smoothing and seasonal-non-seasonal ARIMA models. Forecasting accuracy is assessed using the mean absolute percentage error, root mean square error and Theill’s U of the various models. Monthly tourist arrivals from 1994 to 2006 are used in the analysis, and arrivals are forecasted for 2007. Findings: The results show that seasonal ARIMA models deliver the most accurate predictions of arrivals over three time horizons, namely three months, six months and 12 months. Value: This paper is the first tourist arrivals forecast using South African data for the country as a whole, and therefore it forms an interesting case study as a long haul and growing tourist destination. Conclusion: The univariate forecasts provide fairly accurate forecasts of tourist arrivals in South Africa, especially over the short run. As such, it is understandable why it remains a popular approach to forecast tourist arrivals. However, this method does not make provision for assessing the influence of external events and therefore its policy application is limited. Keywords: forecasting, tourist arrivals, South Africa, ARIMA, SARIMA, Holt-Winter
INTRODUCTION AND BACKGROUND TO FORECASTING METHODS After the democratic elections in 1994, tourism in South Africa has grown to become one of the country’s main earners of foreign exchange and creators of employment. The growth in tourism to South Africa meant that the country is currently the main destination for tourists to the African continent (UNWTO, 2009b: 38-39). The growth rate in tourist arrivals has also surpassed that of the world average for more than a decade. The growth is fuelled by reasons that include hosting major events, while political turmoil and terrorist attacks in other parts of the world have had positive effects on South African arrivals. In addition, major markets started to change their travel trends, with an increasing number of tourists from developed countries visiting developing countries (UNWTO, 2009b; Saayman & Rossouw, 2008: 2; SAT, 2009). Based on the arrival figures of visitors to South Africa (see Figure 1), it is clear that the country is experiencing significant growth, but the question remains whether this can be sustained. Answers to this question can assist both government and the private sector in pro-active decision-making (Song & Witt, 2006: 214-215).

A. Saayman M. Saayman
Forcasting tourist arrivals in South Africa
282
Acta Commercii 2010
Figure 1: Total tourist arrivals in South Africa, 1980-2007
Source of data: StatsSA An analysis of South Africa’s main international tourism markets reveals that tourists from Africa are the main source of tourist arrivals – in particular tourists from neighbouring countries, namely Lesotho, Botswana, Zimbabwe, Mozambique and Swaziland. Many of these tourists enter South Africa for the sole purpose of shopping at border towns and/or visiting family and friends. Tourists from overseas countries stem mostly from the United Kingdom, Germany, the Netherlands, the United States of America and France. Since these visitors spend much more than their average African counterpart when visiting South Africa, understanding and forecasting the trends in different markets remain paramount (Saayman & Saayman, 2003). Goh and Law (2002: 499) indicated that the first tourism forecasting studies took place in the early 1960s. In a review of empirical evidence for forecasting tourism demand in 1995, Witt and Witt (1995) classified tourism forecasting methods into two groups, namely causal methods and time series methods. Under the causal methods, econometric models using independent variables such as income, population, prices and qualitative effects, as well as trends and lagged dependent variables were popular in earlier studies. Other researchers used spatial models, and especially the gravity model specification, in forecasting tourism demand (Witt & Witt, 1995). More recent econometric forecasting studies tend to use autoregressive distributed lag specifications, error correction mechanisms, vector autoregressive schemes and time varying parameter models. In addition, adjustments to the almost ideal demand system (AIDS) increased its popularity in this line of research (Song & Li, 2008). Song and Li (2008) confirm that causal and time series methods remain the most popular forecasting methods and a combination of these approaches is being used increasingly, but add that new quantitative approaches have surfaced over the past few years. These include artificial neural networks, the rough set approach, fuzzy time series methods and genetic algorithms that can all be classified under artificial intelligence methods. Yet, Song and Li (2008) criticise these techniques based on their poor theoretical justification, economic rationale and policy application. They continue to state that almost 60 percent of the forecasting research since 2000 has implemented time-series methods, indicating the popularity of this method of forecasting. These methods explore the historic trend in the tourism time series and extrapolate the trend into the future without exploring its underlying causes (Song et al., 2003a). The various time series forecasting methods and results are subsequently reviewed, with emphasis on the methods used in the current paper.

A. Saayman M. Saayman
Forcasting tourist arrivals in South Africa
283
Acta Commercii 2010
The Naïve model The Naïve model assumes that tourism arrivals follow a random walk, and trends and turning points can therefore not be predicted (Goh & Law, 2002: 501). Two versions of the Naïve model exist, with the first
model assuming that tourism arrivals in the current period (denoted by tF ) equal arrivals in the previous
period (denoted by 1tX ) (Burger et al., 2001: 405). Thus:
1tt XF (1)
The second model allows for a seasonal adjustment of the data as indicated below (Goh & Law, 2002: 501-502):
2
211 1
t
tttt
X
XXXF (2)
The naïve models often serve as the benchmark against which the accuracy of the forecasting performance of other models is assessed (Song & Li, 2008: 210). Witt and Witt (1995:465-467) report that the naïve models showed the lowest mean absolute percentage error (MAPE) in research results from the early 1980s. However, since the naïve models forecast no change, they tend to perform weaker in forecasting the direction of change and changes in trends than other methods. Moving average techniques When using average techniques, equal weights are given to all past observations used in computing the average (Lim & McAleer, 2001: 968). When monthly data is considered, the previous 12 observations are chosen and given equal weights in determining the average (Goh & Law, 2002: 502). Thus:
t
tiit XF112
112
1 (3)
Goh and Law (2002:509) found that moving average techniques outperformed the naïve models based on a basket of criteria, which included the MAPE, Theill’s U, root mean square error (RMSE) and the mean square error (MSE). However, it failed to outperform other time series techniques, most notably exponential smoothing, ARIMA and SARIMA techniques (discussed below) on all the criteria.
Exponential smoothing techniques While exponential smoothing techniques also use averages of the data, it assigns different weights to past observations used in forecasting a time series, unlike moving average methods. As such, these methods adjust the smoothing coefficients and reduce the fluctuations caused by the irregular component in the time series under consideration (Lim & McAleer, 2001: 966, 968). In general, the weights show an exponential decay and observations closer to the forecasting period therefore carry a greater weight (Goh & Law, 2002: 502). Lim and McAleer (2001: 971) found that the Holt-Winters exponential smoothing method delivers improved forecasts of tourism arrivals in Australia, a country that also shows severe seasonality in tourist arrivals, compared to other exponential smoothing techniques. The Holt-Winters method allows for smoothing and forecasting a time series that has a permanent
component (or constant, denoted by tX~
), a linear trend (denoted by tB~
) and a multiplicative seasonal
variation (denoted by tS ). The forecast equation is given by (Lim & McAleer, 2001: 973):
jtttt SBiXF~~
, with ...2,1i and 12j for monthly data (4)
The three components of the smoothed series are defined by the following:
11~~
1~
ttjt
tt BX
S
XX , and 10 (5a)
11~
1~~~
tttt BXXB , and 10 (5b)
jt
t
tt S
X
XS 1~ , and 10 (5c)

A. Saayman M. Saayman
Forcasting tourist arrivals in South Africa
284
Acta Commercii 2010
where , and are the smoothing coefficients and tX~
is the smoothed estimate of arrivals at time
t .
In line with Lim and McAleer (2001), Goh and Law (2002: 509) found that the Holt-Winters exponential smoothing forecasting technique outperformed the other smoothing techniques, based on a range of accuracy measurements. The method also outperformed the naïve models as well as the moving average forecasting methods. The MAPE was even lower than those of the ARIMA forecasts (discussed below), but failed to improve on the SARIMA (see below) forecasts.
ARIMA-models and the Box-Jenkins procedure The time-series models that dominate tourism demand forecasting are autoregressive integrated moving average (ARIMA) models (Song & Li, 2008: 210). ARIMA (p, d, q) models were developed by Box and Jenkins in the 1970s and their approach of identification, estimation and diagnostics is based on the principle of parsimony. In identifying the appropriate model specification, the autocorrelation and partial autocorrelation functions are scrutinised. The models are then estimated and the model with the lowest information criteria (Akaike information or Schwartz Bayesian criteria) is chosen as the most appropriate model specification. Before using the model for forecasting, the goodness of fit should be assessed and care taken to avoid overfitting (Asteriou & Hall, 2007: 240-242). The forecasting equation for tourism arrivals with ARIMA (p, d, q) models, where the p denotes the order of the autoregressive part, the d the order of integration and the q the order of the moving average part of the model, is given by (Goh & Law, 2002: 502):
qtqtttptpttt XXXF ...... 22112211 (6)
In terms of lag operator notation, the model’s specification is:
tqtd
p LXL )()( (7)
Song et al. (2003b:136) remark that ARIMA models are often considered as delivering more accurate forecasts than econometric forecasting techniques. This is confirmed by du Preez and Witt (2003: 449) who found ARIMA models to outperform multivariate models in forecasting performance. Goh and Law (2002: 509) indicate that the overall performance of ARIMA models is superior to that of the naïve models and smoothing techniques. However, they indicate that it is outperformed by the forecasting accuracy of SARIMA models (see discussion below). SARIMA-models The seasonal ARIMA model (SARIMA) is an extension of the ordinary ARIMA model to allow for seasonality in the data (Chu, 1998: 602). These seasonal components of the ARIMA model are denoted by capital letters – SARIMA (p, d, q)(P, D, Q)s – where the last bracket indicates the seasonal factor parameters for the order of autoregressive, integration and moving average parts of the model. The first bracket indicates the non-seasonal parameters (Goh & Law, 2002: 502-503). Chu (1998: 603) indicates that a SARIMA (1, 1, 1)(1, 1, 1)12 model yields the following equation:
1312112121113121121211 tttttttt XXXF
(8)
with i and i the non-seasonal parameters that are estimates, i and i the seasonal parameters,
and t an uncorrelated random shock. In an evaluation of the various time series models, the SARIMA
models are often found to deliver the most accurate forecasts for tourism demand (Goh & Law, 2002: 509; Chu, 1998: 612; Song & Li, 2008: 210). Other time series models Although the above-mentioned methods are the most widely applied time series forecasting techniques in tourism demand literature, they are not the only methods used. Volatility models, including autoregressive conditional heteroscedasticity (ARCH) and generalised autoregressive conditional heteroscedasticity (GARCH) models, are increasing in popularity with papers such as those by Chan et al. (2005) and Coshall (2009). Chu (2004) used a cubic polynomial approach in forecasting tourism demand in Singapore. However, Chu found that the forecasting accuracy of this approach is not superior to that of

A. Saayman M. Saayman
Forcasting tourist arrivals in South Africa
285
Acta Commercii 2010
seasonal ARIMA models. Chu (2008) further experimented with new expansions in ARIMA modelling by forecasting tourism demand for Singapore using a fractionally integrated autoregressive moving average (ARFIMA) approach. The ARFIMA (p, d, q) approach differs from the ARIMA (p, d, q) approach only in the estimation of the difference parameter (d). With the standard ARIMA (p, d, q) model, d can only take on integer values (e.g. 0, 1, 2), while d can take on any fractional value (e.g. 0.7, 1.2 etc.) with the ARFIMA (p, d, q) approach. The results, using ARFIMA methodology, are mixed, with Chu (2008) and Gil-Alana (2005) indicating that the ARFIMA approach improved forecasting accuracy relative to the standard ARIMA and SARIMA models, but Franses and Ooms (1997) failed to show improved forecasting results. PROBLEM INVESTIGATED The growing importance of tourism forecasting is highlighted by Song and Witt (2006: 214-215) who indicated that business success, marketing decisions, government’s investment policy as well as macroeconomic policy are influenced by the accuracy of tourism forecasts. Archer (1987: 77) adds that since the tourism product comprises a number of services that cannot be accumulated, accurate forecasts of tourism demand are paramount to ensure the availability of such services when demanded. In addition, the seasonal nature of tourism leads to a pattern of excess capacity followed by shortage in capacity. The aspects raised above support the notion that forecasting tourist arrivals accurately is important for the destination country’s tourism industry as a whole. How to obtain the most accurate forecasts of arrivals has therefore remained a research question in tourism and forecasting literature. However, while many studies have been conducted on forecasting tourist arrivals world wide, only one study has been conducted for South Africa at the end of the 1990s (see Burger et al., 2001). The study only focused on tourism demand to one of South Africa’s popular tourist cities (Durban) and analysed tourist arrivals as a whole for the city. In contrast, this paper aims to model and forecast tourist arrivals to the whole of South Africa from its main overseas markets, using various time series approaches. The forecasting accuracy of the various approaches will also be evaluated to establish the most appropriate univariate time series forecasting method for South African tourism demand. A variety of measures is available to evaluate the forecasting accuracy of the various time series models. Chu (2004) remarks that the most popular measures used by more than 20 researchers are the values of the mean absolute percentage error (MAPE) and the root mean square error (RMSE). These two measures are based on the forecast error, which is the difference between actual arrivals and forecasted arrivals and this forms the basis for the comparison of the various models. Since the forecast error depends on the size of the variable in question, it is difficult to compare the results of two different time series using these measures. To overcome this obstacle, Theill’s U will also be assessed, which is a relative measure that compares the forecast results with that of the naïve (or random walk) model (Goh & Law, 2002: 504). DATA AND METHOD As was mentioned previously, South Africa’s main international tourist markets, excluding African markets, are Great Britain (22.4% of overseas arrivals in 2007), Germany (11.5%), the USA (12.5%), the Netherlands (5.8%) and France (5.2%). Together, arrivals from these markets account for 57.3% of all intercontinental arrivals in 2007. Forecasting arrivals from these markets is therefore important in understanding the dynamics of international tourism to South Africa. Figure 2 illustrates the arrivals from these markets for the period 1994 to 2007. All data used in the analysis was obtained from Statistics South Africa’s Tourism Reports (Report 03-51-02 from 1999 onwards and Statistical Release P0351 for earlier years). It is clear from the figure that tourism to South Africa grows consistently and follows a seasonal pattern.

A. Saayman M. Saayman
Forcasting tourist arrivals in South Africa
286
Acta Commercii 2010
Figure 2: Tourism arrivals from main overseas destinations (1994-2007)
0
10,000
20,000
30,000
40,000
1994 1996 1998 2000 2002 2004 2006
TOURISM_DE
0
4,000
8,000
12,000
16,000
20,000
1994 1996 1998 2000 2002 2004 2006
TOURISM_FR
0
10,000
20,000
30,000
40,000
50,000
60,000
70,000
1994 1996 1998 2000 2002 2004 2006
TOURISM_GB
0
5,000
10,000
15,000
20,000
25,000
1994 1996 1998 2000 2002 2004 2006
TOURISM_NL
4,000
8,000
12,000
16,000
20,000
24,000
28,000
32,000
1994 1996 1998 2000 2002 2004 2006
TOURISM_US
Source of data: Compiled from Statistics South Africa
1 reports
Using monthly arrivals, the models are estimated for the period 1994 to 2006 and forecasted for 2007. This period can be viewed as a relatively stable period in South Africa’s tourist arrivals, since tourist arrivals only started to increase significantly between 1990 and 1993 (StatsSA, 2008), and 2007 is before the onset of the financial crisis, which saw a decline in tourist arrivals worldwide (UNWTO, 2009a). The models that are estimated and forecasted are the Naïve 1 and 2 models, the Holt-Winters exponential smoothing model, ARIMA and SARIMA models, as explained above. Ex post forecasts are then conducted for 2007 in three time periods, namely a three-month, six-month and twelve-month forecast. Forecasting accuracy is assessed using the MAPE, RMSE and Theill’s U statistics. All estimations are done using EViews 6, making use of natural logarithms of the arrivals series. The Augmented Dickey-Fuller (ADF) test revealed that all the series are non-stationary when no constant or trend is added to the testing equation. However, when a constant is included, only arrivals from Germany and the USA are non-stationary. This impacted on the ARIMA model structures. The results of the ADF test are indicated in Table 1. The results of the Phillips-Peron unit root test confirm the ADF test
1 Report 03-51-02 from 1999 onwards and Statistical Release P0351 for earlier years, available on the StatsSA website
www.statssa.gov.za .

A. Saayman M. Saayman
Forcasting tourist arrivals in South Africa
287
Acta Commercii 2010
results, but indicate that stationarity may exist in all the series when a constant is included in the test equation.
Table 1: ADF test results (probabilities)
Variable Test assumption: none
Test assumption: intercept
Variable Test assumption: none
TOURISM_DE 0.9490 0.3116 D(TOURISM_DE) <0.001
TOURISM_FR 0.9647 0.2234 D(TOURISM_FR) <0.001
TOURISM_GB 0.9979 0.2160 D(TOURISM_GB) <0.001
TOURISM_NL 0.9915 0.0119* D(TOURISM_NL) <0.001
TOURISM_US 0.9982 0.0386* D(TOURISM_US) <0.001
* significant at a 5% level ANALYSIS AND FINDINGS The best ARIMA models, based on the Akaike Information Criteria, were used in forecasting tourism arrivals. For Germany, an ARIMA (2,1,2) model was estimated, for France an ARIMA (2,0,2), for Great Britain an ARIMA (4,1,3), for the Netherlands an ARIMA (4,1,2) and for the USA an ARIMA (2,1,2) model proved to be the best fit. For the Seasonal ARIMA models, most arrival series follow the airline model, with Germany, Great Britain and the USA following a SARIMA (0,1,1)(0,1,1)12 structure. Arrivals from France follow a SARIMA (1,0,1)(0,1,1)12 structure and from the Netherlands a SARIMA (1,1,1)(0,1,1) 12 structure. The airline model was first derived by Box and Jenkins in 1970 when they estimated a seasonal ARIMA model using airline passenger data. The model proved quite robust in forecasting seasonal data series and became a benchmark for comparing the accuracy of forecasts (Ghysels et al., 2006:665). The forecasting accuracy of the various models is compared in Tables 2 to 4. Table 2 shows that the seasonal nature of tourist arrivals in South Africa clearly influences the effectiveness of forecasts over all the forecasting horizons assessed. This is especially true in forecasting over longer horizons, with the mean absolute percentage error (MAPE) the smallest in the SARIMA forecasts, followed by the Holt Winters exponential smoothing forecasts for arrivals from all the major overseas tourist markets for the forecasting periods six months and 12 months. It is also noteworthy that the naïve models perform the worst in almost all cases. The only exception is the three-month forecasts for tourists from Germany and France. The second naïve model performs the worst of all the forecasts over the short term.

A. Saayman M. Saayman
Forcasting tourist arrivals in South Africa
288
Acta Commercii 2010
Table 2: Comparison of the forecasting accuracy of the models, based on the mean absolute percentage error (MAPE)*
Model Germany France Great Britain
Netherlands USA
Twelve-month forecast
Naïve 1 3.239 (5) 2.142 (3) 3.859 (5) 3.828 (4) 1.579 (3)
Naïve 2 2.256 (3) 4.587 (5) 2.313 (4) 4.748 (5) 1.824 (5)
Holt Winters 0.708 (2) 1.059 (2) 0.582 (2) 1.158 (2) 0.809 (2)
ARIMA 2.864 (4) 2.149 (4) 1.951 (3) 1.653 (3) 1.612 (4)
SARIMA 0.610 (1) 0.954 (1) 0.395 (1) 0.828 (1) 0.613 (1)
Six-month forecast
Naïve 1 3.534 (5) 2.208 (3) 4.195 (5) 6.000 (5) 1.879 (4)
Naïve 2 1.794 (3) 2.450 (5) 2.166 (3) 2.653 (4) 2.071 (5)
Holt Winters 0.812 (2) 1.093 (2) 0.515 (2) 1.036 (2) 1.221 (2)
ARIMA 3.119 (4) 2.239 (4) 2.203 (4) 1.735 (3) 1.804 (3)
SARIMA 0.787 (1) 0.991 (1) 0.452 (1) 0.724 (1) 0.754 (1)
Three-month forecast
Naïve 1 0.672 (2) 0.934 (1) 1.125 (3) 2.666 (4) 2.169 (4)
Naïve 2 2.904 (5) 2.204 (5) 3.124 (5) 2.676 (5) 2.485 (5)
Holt Winters 0.831 (3) 1.732 (4) 0.397 (2) 1.567 (3) 1.329 (2)
ARIMA 2.881 (4) 0.979 (2) 1.313 (4) 1.102 (2) 1.753 (3)
SARIMA 0.633 (1) 1.311 (3) 0.376 (1) 0.852 (1) 0.952 (1)
*The number in parenthesis indicates the overall ranking of forecasting performance of the methods for each country and time horizon.
In Table 3, the forecasting accuracy of the various forecasting models is assessed using the root mean square error (RMSE) as a measure. It is evident from Table 3, that the results are similar to those in Table 2. The forecasting methods that take into account the seasonal nature of tourist arrivals in South Africa clearly outperform the other models, especially over longer forecasting horizons (six and 12 months). The naïve 1 (or random walk) model only shows some accuracy in short-term forecasts, but fails to perform in the longer run.
Table 3: Comparison of the forecasting accuracy of the models, based on the Root mean square error (RMSE)*
Model Germany France Great Britain
Netherlands USA
Twelve-month forecast
Naïve 1 0.411 (5) 0.245 (4) 0.492 (5) 0.459 (4) 0.180 (3)
Naïve 2 0.291 (3) 0.512 (5) 0.286 (4) 0.573 (5) 0.202 (5)
Holt Winters 0.078 (2) 0.119 (2) 0.069 (2) 0.135 (2) 0.105 (2)
ARIMA 0.323 (4) 0.244 (3) 0.255 (3) 0.214 (3) 0.200 (4)
SARIMA 0.067 (1) 0.111 (1) 0.055 (1) 0.088 (1) 0.081 (1)
Six-month forecast
Naïve 1 0.469 (5) 0.262 (3) 0.558 (5) 0.621 (5) 0.200 (4)
Naïve 2 0.226 (3) 0.265 (5) 0.262 (3) 0.262 (4) 0.230 (5)
Holt Winters 0.089 (2) 0.132 (2) 0.062 (1) 0.126 (2) 0.136 (2)
ARIMA 0.348 (4) 0.264 (4) 0.296 (4) 0.200 (3) 0.198 (3)
SARIMA 0.081 (1) 0.120 (1) 0.065 (2) 0.083 (1) 0.091 (1)
Three-month forecast

A. Saayman M. Saayman
Forcasting tourist arrivals in South Africa
289
Acta Commercii 2010
Naïve 1 0.096 (3) 0.100 (1) 0.146 (3) 0.302 (5) 0.219 (4)
Naïve 2 0.307 (4) 0.252 (5) 0.340 (5) 0.276 (4) 0.260 (5)
Holt Winters 0.094 (2) 0.179 (4) 0.059 (1) 0.168 (3) 0.139 (2)
ARIMA 0.320 (5) 0.104 (2) 0.174 (4) 0.132 (2) 0.180 (3)
SARIMA 0.072 (1) 0.149 (3) 0.063 (2) 0.103 (1) 0.114 (1)
*The number in parenthesis indicates the overall ranking of forecasting performance of the methods for each country and time horizon.
A similar pattern can be observed when Theill’s U is assessed to measure forecasting accuracy. The SARIMA models outperform the other models in all three time horizons, followed by the Holt Winters exponential smoothing forecasts. For the first time, the ARIMA forecast takes the pole position in forecasting accuracy – for France over a three-month forecast. Across all the other time horizons, the non-seasonal ARIMA forecasts struggle to outperform the naïve models, confirming the results of Smeral and Wüger (2005) that the forecasting accuracy of ARIMA models is not always superior to that of naïve models.
Table 4: Comparison of the forecasting accuracy of the models, based on Theill’s U statistic*
Model Germany France Great Britain
Netherlands USA
Twelve-month forecast
Naïve 2 0.015 (3) 0.028 (4) 0.013 (4) 0.031 (4) 0.0105 (4)
Holt Winters 0.004 (2) 0.0065 (2) 0.0032 (2) 0.007 (2) 0.005 (2)
ARIMA 0.016 (4) 0.013 (3) 0.012 (3) 0.012 (3) 0.0099 (3)
SARIMA 0.003 (1) 0.0061 (1) 0.0026 (1) 0.005 (1) 0.004 (1)
Six-month forecast
Naïve 2 0.012 (3) 0.015 (4) 0.012 (3) 0.015 (4) 0.012 (4)
Holt Winters 0.005 (2) 0.0072 (2) 0.0029 (1) 0.007 (2) 0.007 (2)
ARIMA 0.018 (4) 0.014 (3) 0.014 (4) 0.011 (3) 0.010 (3)
SARIMA 0.004 (1) 0.0066 (1) 0.0031 (2) 0.005 (1) 0.005 (1)
Three-month forecast
Naïve 2 0.015 (3) 0.014 (4) 0.016 (4) 0.015 (4) 0.013 (4)
Holt Winters 0.005 (2) 0.010 (3) 0.0027 (1) 0.009 (3) 0.007 (2)
ARIMA 0.016 (4) 0.006 (1) 0.008 (3) 0.007 (2) 0.009 (3)
SARIMA 0.004 (1) 0.008 (2) 0.0029 (2) 0.006 (1) 0.006 (1)
*The number in parenthesis indicates the overall ranking of forecasting performance of the methods for each country and time horizon.
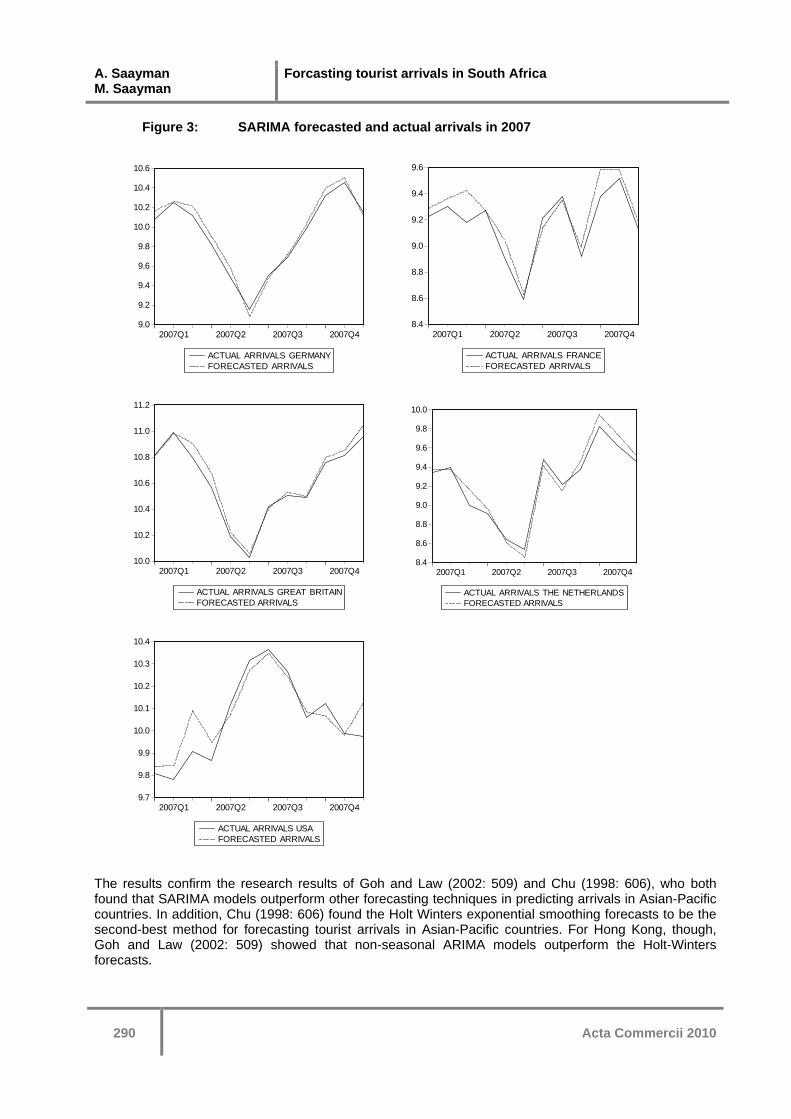
Based on the assessment of forecasting accuracy of the various models, the authors can conclude that the seasonal methods for forecasting international tourist arrivals are superior to the non-seasonal methods. The seasonal ARIMA model seems to be the best predictor over all the forecasting horizons considered, followed by the Holt-Winters exponential smoothing technique. Figure 3 illustrates the one-year forecasts generated by the SARIMA models for all the markets under consideration and this is compared with the actual arrivals in 2007. It is evident from the graphs that the forecasts for Germany, Great Britain and the Netherlands are more accurate than those of arrivals from France and the USA. This is also reflected in the tables above where the errors of the SARIMA model are lower for Germany, Great Britain and the Netherlands than for France and the USA.
A. Saayman M. Saayman
Forcasting tourist arrivals in South Africa
290
Acta Commercii 2010
Figure 3: SARIMA forecasted and actual arrivals in 2007
9.0
9.2
9.4
9.6
9.8
10.0
10.2
10.4
10.6
2007Q1 2007Q2 2007Q3 2007Q4
ACTUAL ARRIVALS GERMANY
FORECASTED ARRIVALS
8.4
8.6
8.8
9.0
9.2
9.4
9.6
2007Q1 2007Q2 2007Q3 2007Q4
ACTUAL ARRIVALS FRANCE
FORECASTED ARRIVALS
10.0
10.2
10.4
10.6
10.8
11.0
11.2
2007Q1 2007Q2 2007Q3 2007Q4
ACTUAL ARRIVALS GREAT BRITAIN
FORECASTED ARRIVALS
8.4
8.6
8.8
9.0
9.2
9.4
9.6
9.8
10.0
2007Q1 2007Q2 2007Q3 2007Q4
ACTUAL ARRIVALS THE NETHERLANDS
FORECASTED ARRIVALS
9.7
9.8
9.9
10.0
10.1
10.2
10.3
10.4
2007Q1 2007Q2 2007Q3 2007Q4
ACTUAL ARRIVALS USA
FORECASTED ARRIVALS
The results confirm the research results of Goh and Law (2002: 509) and Chu (1998: 606), who both found that SARIMA models outperform other forecasting techniques in predicting arrivals in Asian-Pacific countries. In addition, Chu (1998: 606) found the Holt Winters exponential smoothing forecasts to be the second-best method for forecasting tourist arrivals in Asian-Pacific countries. For Hong Kong, though, Goh and Law (2002: 509) showed that non-seasonal ARIMA models outperform the Holt-Winters forecasts.

A. Saayman M. Saayman
Forcasting tourist arrivals in South Africa
291
Acta Commercii 2010
IMPLICATIONS OF THE RESEARCH The analysis indicated that the forecasting models that took into account the seasonal nature of tourist arrivals in South Africa outperformed the other models over all forecasting horizons. Therefore, firstly from a methodological point of view, one has to recognise that international tourist arrivals are seasonal and this has to be accounted for in the modelling process. Secondly, seasonal ARIMA models proved to deliver the most accurate predictions of arrivals over the three time horizons followed by the Holt-Winters exponential smoothing method and could therefore be identified as the superior univariate time series technique in modelling international tourist arrivals to South Africa. Non-seasonal ARIMA models faired overall slightly better than the naïve models, but since they do not take the seasonal nature of overseas arrivals into consideration, their accuracy proved to be far less than that of the seasonal ARIMA models. As such, this research confirms research by Chu (1998) and Goh and Law (2002) who found seasonal ARIMA models to outperform other time series techniques in forecasting tourist arrivals in Asian-Pacific countries. The contribution and importance of this research lie in the findings as well as the application to South African data. Applying seasonal ARIMA models in forecasting international tourist arrivals to South Africa could assist government and the private sector in being more pro-active in their policies and decision-making to have products available when tourists need them. However, one of the drawbacks of using univariate time series techniques in forecasting arrivals is that it does not identify the underlying causes for the changes in arrivals. As such, the research could be expanded to include econometric modelling techniques to identify these causes and to better inform the industry on how to maintain a sustainable growth in tourist arrivals.
SUMMARY AND CONCLUSION The aim of this article was to use various time series approaches to model tourist arrivals to South Africa from its main overseas markets, namely Great Britain, Germany, France, the Netherlands and the USA and to assess the forecasting accuracy of the various techniques. Firstly, this article provided an overview of the various univariate forecasting methods that are applied in forecasting tourist arrivals. Subsequently, four of the methods were applied to forecast tourist arrivals in South Africa from the above markets. In evaluating the accuracy of the ex-post forecasts, the mean absolute percentage error (MAPE), root mean square error (RMSE) and Theill’s U of the various techniques were compared over three time horizons, namely three months, six months and 12 months. The results indicated that the methods that take account of the seasonality of international tourist arrivals in South Africa outperform the others in terms of forecasting accuracy. It is evident that the univariate forecasts provide fairly accurate forecasts of tourist arrivals in South Africa, especially over the short run. As such, it is understandable why it remains a popular approach to forecast tourist arrivals. However, one has to acknowledge that, although accurate, this method does not make provision for assessing the influence of external events. And therefore its application is limited to forecasting arrivals for businesses and government in the event that there are no substantial changes in the current environment. Suggestions for further research include the expansion of the methodology to econometric forecasting techniques in order to address the critique above as well as the application of the current methodology to other industries and sectors of the tourism industry (such as the accommodation sector). REFERENCES Archer, B.H. (1987). Demand forecasting and estimation. In Ritchie, J.R.B. and Goeldner, C.R. (eds). Travel, tourism and hospitality research. New York: Wiley.
Asteriou, D. and Hall, S.G. (2007). Applied Econometrics: a modern approach, revised edition, New York: Palgrave MacMillan.

A. Saayman M. Saayman
Forcasting tourist arrivals in South Africa
292
Acta Commercii 2010
Burger, C.J.S.C., Dohnal, M., Kathrada, M. and Law, R. (2001). A practitioners guide to time-series methods for tourism demand forecasting – a case study of Durban, South Africa. Tourism Management, 22: 403-409. Chan, F., Lim, C. and McAleer, M (2005). Modelling multivariate international tourism demand and volatility, Tourism Management, 26: 459-471.
Chu, F-L. (1998). Forecasting tourism demand in Asian-Pacific countries. Annals of Tourism Research, 25(3): 597-615.
Chu, F-L. (2004). Forecasting tourism demand: a cubic polynomial approach. Tourism Management, 25: 209-218.
Chu, F-L. (2008). A fractionally integrated autoregressive moving average approach to forecasting tourism demand. Tourism Management, 29: 79-88.
Coshall, J.T. (2009). Combining volatility and smoothing forecasts of UK demand for international tourism. Tourism Management, 30: 495-511.
Du Preez, J., and Witt, S. F. (2003). Univariate versus multivariate time series forecasting: An application to international tourism demand. International Journal of Forecasting, 19: 435-451. Franses, P.H. and Ooms, M. (1997). A periodic long-memory model for quarterly UK inflation. International Journal of Forecasting, 13: 117-126. Gil-Alana, L.A. (2005). Modeling international monthly arrivals using seasonal univariate long-memory processes. Tourism Management, 26: 867-878.
Goh, C. and Law, R. (2002). Modeling and forecasting tourism demand for arrivals with stochastic nonstationary seasonality and intervention. Tourism Management, 23: 499-510.
Ghysels, E., Osborn, D.R. and Rodrigues, P.M.M. (2006). Forecasting seasonal time series. In: Elliot, G, Granger, C.W.J. and Timmerman, A. (eds.) Handbook of economic forecasting Volume 1, Amsterdam: Elsevier. pp. 663-714. Lim, C. and McAleer, M. (2001). Forecasting tourist arrivals. Annals of Tourism Research, 28(4): 965-977. Saayman, M. and Rossouw, R. (2008). The economic value of 2010 Soccer World Cup. Acta Commercii, 8: 1-14.
Saayman, M. and Saayman, A. (2003). International and African tourist markets for South Africa: an economic analysis. Africa Insight, 33(1): 93-99.
SAT (South African Tourism). (2009). Highlights of tourism’s performance in 2009. South African Tourism: Johannesburg.
Smeral, E. and Wüger, M. (2005). Does complexity matter? Methods for improving forecasting accuracy in tourism: The case of Australia. Journal of Travel Research, 44: 100-110.
Song, H. and Li, G. (2008). Tourism demand modelling and forecasting – a review of recent research. Tourism Management, 29: 203-220.
Song, H. and Witt, S.F. (2006). Forecasting international tourist flows to Macau. Tourism Management, 27: 214-224.
Song, H., Wong, K.K.F. and Chon, K.K.S. (2003a). Modelling and forecasting the demand for Hong Kong tourism. Hospitality Management, 22: 435-451.

A. Saayman M. Saayman
Forcasting tourist arrivals in South Africa
293
Acta Commercii 2010
Song, H., Witt, S.F. and Jensen, T.C. (2003b). Tourism forecasting: accuracy of alternative econometric models. International Journal of Forecasting, 19: 123-141. StatsSA (Statistics South Africa). (2008). Tourism, 2008. Tourism Statistics, Report No. 03-51-02. Pretoria: Statistics South Africa. UNWTO (2009a). UNWTO World Tourism Barometer, Volume 7, Nr. 1. Madrid: World Tourism Organisation
UNWTO (2009b). UNWTO World Tourism Barometer, Volume 7, Nr. 2. Madrid: World Tourism Organisation.
Witt, S.F. and Witt, C.A. (1995). Forecasting tourism demand: a review of empirical research. International Journal of Forecasting, 11: 447-475.