A forecast model for prediction of black pod disease outbreak ...
24
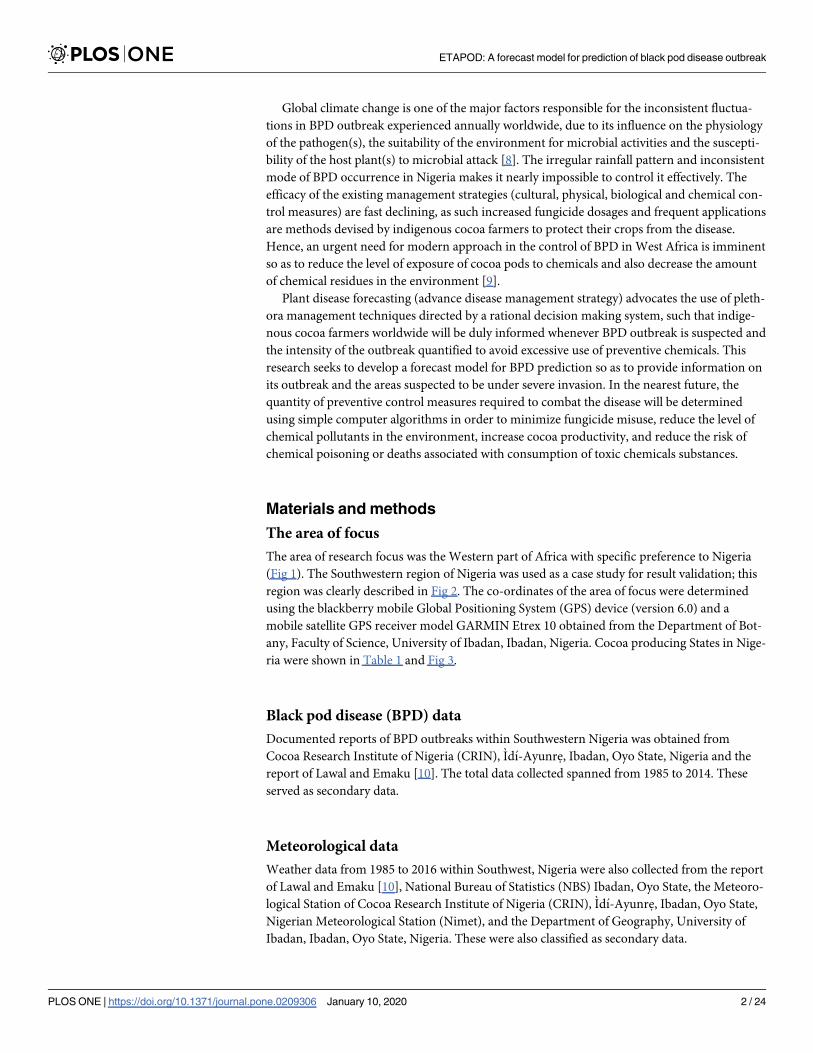
RESEARCH ARTICLE ETAPOD: A forecast model for prediction of black pod disease outbreak in Nigeria Peter M. Etaware ID 1 *, Abiodun R. Adedeji 2 , Oyedeji I. Osowole 3 , Adegboyega C. Odebode 1 1 Department of Botany, Faculty of Science, University of Ibadan, Ibadan, Oyo State, Nigeria, 2 Cocoa Research Institute of Nigeria (CRIN), Idi-Ayunre, Ibadan, Oyo State, Nigeria, 3 Department of Statistics, Faculty of Science, University of Ibadan, Ibadan, Oyo State, Nigeria * [email protected] Abstract Food poisoning and environmental pollution are products of excessive chemical usage in Agriculture. In Nigeria, cocoa farmers apply fungicides frequently to control black pod dis- ease (BPD), this practice is life threatening and lethal to the environment. The development of a warning system to detect BPD outbreak can help minimize excessive usage of fungicide by farmers. 8 models (MRM 1 -MRM 8 ) were developed and 5 (MRM 1 -MRM 5 ) selected for optimization and performance check. MRM 5 (ETAPOD) performed better than the other forecast models. ETAPOD had 100% performance rating for BPD prediction in Ekiti (2009, 2010, 2011 and 2015) with model efficiency of 95–100%. The performance of the model was rated 80% in 2010 and 2015 (Ondo) with model efficiency of 85–90%, 70% in 2011 (Osun) with model efficiency of 81–84%, 60% in 2010 (Ondo and Osun) and 2015 (Osun) with model efficiency of 75–80%, 40% in 2009 (Osun) with model efficiency of 65–69% and 0% 1n 2011 (Ondo) with model efficiency between 0 and 49%. ETAPOD is a simplified BPD detection device for the past, present and future. Introduction Global warming, food poisoning and environmental pollution are current problems emanat- ing from excessive exposure to and combustion of chemical substances. The management of BPD is a major challenge to cocoa farmers in Nigeria as they frequently apply fungicide to safe- guard their crops without consideration for the safety of life and the environment [1]. BPD is more established in West Africa than in any other parts of the world [2]. Adegbola [2] in his review of Africa estimated the average occurrence of the disease as 40% in several parts of West Africa and up to 90% in certain places in Nigeria [3]. In Nigeria, cocoa export made over 80% GNI before the 1960s [3], it was reduced to 37.9% in 1997 [4] due to BPD infection and other factors, yet cocoa export remained more profitable than Rubber, Palm fruits, Groundnut, Yam, Cassava, Maize, Millet, and Sorghum [3]. Cocoa yield decline started in 1971–1972 (255,000 to 241,000Mt), through 1978–1979 (137,000Mt) to 1986 (58,700Mt), with an increase from 165,000–180,000Mt between 2000 and 2003 [5]; [6]. The increase in cocoa production was entirely due to the expansion in production area rather than increases in cocoa yield [7]. PLOS ONE | https://doi.org/10.1371/journal.pone.0209306 January 10, 2020 1 / 24 a1111111111 a1111111111 a1111111111 a1111111111 a1111111111 OPEN ACCESS Citation: Etaware PM, Adedeji AR, Osowole OI, Odebode AC (2020) ETAPOD: A forecast model for prediction of black pod disease outbreak in Nigeria. PLoS ONE 15(1): e0209306. https://doi.org/ 10.1371/journal.pone.0209306 Editor: Min Huang, George Mason University, UNITED STATES Received: December 14, 2018 Accepted: December 16, 2019 Published: January 10, 2020 Copyright: © 2020 Etaware et al. This is an open access article distributed under the terms of the Creative Commons Attribution License, which permits unrestricted use, distribution, and reproduction in any medium, provided the original author and source are credited. Data Availability Statement: All relevant data are within the paper and its Supporting Information files. Funding: The author(s) received no specific funding for this research work. Competing interests: The authors have declared that no competing interests exist.
-
Upload
khangminh22 -
Category
Documents
-
view
0 -
download
0
Transcript of A forecast model for prediction of black pod disease outbreak ...
RESEARCH ARTICLE
ETAPOD: A forecast model for prediction of
black pod disease outbreak in Nigeria
Peter M. EtawareID1*, Abiodun R. Adedeji2, Oyedeji I. Osowole3, Adegboyega
C. Odebode1
1 Department of Botany, Faculty of Science, University of Ibadan, Ibadan, Oyo State, Nigeria, 2 Cocoa
Research Institute of Nigeria (CRIN), Idi-Ayunre, Ibadan, Oyo State, Nigeria, 3 Department of Statistics,
Faculty of Science, University of Ibadan, Ibadan, Oyo State, Nigeria
Abstract
Food poisoning and environmental pollution are products of excessive chemical usage in
Agriculture. In Nigeria, cocoa farmers apply fungicides frequently to control black pod dis-
ease (BPD), this practice is life threatening and lethal to the environment. The development
of a warning system to detect BPD outbreak can help minimize excessive usage of fungicide
by farmers. 8 models (MRM1-MRM8) were developed and 5 (MRM1-MRM5) selected for
optimization and performance check. MRM5 (ETAPOD) performed better than the other
forecast models. ETAPOD had 100% performance rating for BPD prediction in Ekiti (2009,
2010, 2011 and 2015) with model efficiency of 95–100%. The performance of the model
was rated 80% in 2010 and 2015 (Ondo) with model efficiency of 85–90%, 70% in 2011
(Osun) with model efficiency of 81–84%, 60% in 2010 (Ondo and Osun) and 2015 (Osun)
with model efficiency of 75–80%, 40% in 2009 (Osun) with model efficiency of 65–69% and
0% 1n 2011 (Ondo) with model efficiency between 0 and 49%. ETAPOD is a simplified BPD
detection device for the past, present and future.
Introduction
Global warming, food poisoning and environmental pollution are current problems emanat-
ing from excessive exposure to and combustion of chemical substances. The management of
BPD is a major challenge to cocoa farmers in Nigeria as they frequently apply fungicide to safe-
guard their crops without consideration for the safety of life and the environment [1]. BPD is
more established in West Africa than in any other parts of the world [2]. Adegbola [2] in his
review of Africa estimated the average occurrence of the disease as 40% in several parts of
West Africa and up to 90% in certain places in Nigeria [3]. In Nigeria, cocoa export made over
80% GNI before the 1960s [3], it was reduced to 37.9% in 1997 [4] due to BPD infection and
other factors, yet cocoa export remained more profitable than Rubber, Palm fruits, Groundnut,
Yam, Cassava, Maize, Millet, and Sorghum [3]. Cocoa yield decline started in 1971–1972
(255,000 to 241,000Mt), through 1978–1979 (137,000Mt) to 1986 (58,700Mt), with an increase
from 165,000–180,000Mt between 2000 and 2003 [5]; [6]. The increase in cocoa production
was entirely due to the expansion in production area rather than increases in cocoa yield [7].
PLOS ONE | https://doi.org/10.1371/journal.pone.0209306 January 10, 2020 1 / 24
a1111111111
a1111111111
a1111111111
a1111111111
a1111111111
OPEN ACCESS
Citation: Etaware PM, Adedeji AR, Osowole OI,
Odebode AC (2020) ETAPOD: A forecast model for
prediction of black pod disease outbreak in Nigeria.
PLoS ONE 15(1): e0209306. https://doi.org/
10.1371/journal.pone.0209306
Editor: Min Huang, George Mason University,
UNITED STATES
Received: December 14, 2018
Accepted: December 16, 2019
Published: January 10, 2020
Copyright: © 2020 Etaware et al. This is an open
access article distributed under the terms of the
Creative Commons Attribution License, which
permits unrestricted use, distribution, and
reproduction in any medium, provided the original
author and source are credited.
Data Availability Statement: All relevant data are
within the paper and its Supporting Information
files.
Funding: The author(s) received no specific
funding for this research work.
Competing interests: The authors have declared
that no competing interests exist.
Global climate change is one of the major factors responsible for the inconsistent fluctua-
tions in BPD outbreak experienced annually worldwide, due to its influence on the physiology
of the pathogen(s), the suitability of the environment for microbial activities and the suscepti-
bility of the host plant(s) to microbial attack [8]. The irregular rainfall pattern and inconsistent
mode of BPD occurrence in Nigeria makes it nearly impossible to control it effectively. The
efficacy of the existing management strategies (cultural, physical, biological and chemical con-
trol measures) are fast declining, as such increased fungicide dosages and frequent applications
are methods devised by indigenous cocoa farmers to protect their crops from the disease.
Hence, an urgent need for modern approach in the control of BPD in West Africa is imminent
so as to reduce the level of exposure of cocoa pods to chemicals and also decrease the amount
of chemical residues in the environment [9].
Plant disease forecasting (advance disease management strategy) advocates the use of pleth-
ora management techniques directed by a rational decision making system, such that indige-
nous cocoa farmers worldwide will be duly informed whenever BPD outbreak is suspected and
the intensity of the outbreak quantified to avoid excessive use of preventive chemicals. This
research seeks to develop a forecast model for BPD prediction so as to provide information on
its outbreak and the areas suspected to be under severe invasion. In the nearest future, the
quantity of preventive control measures required to combat the disease will be determined
using simple computer algorithms in order to minimize fungicide misuse, reduce the level of
chemical pollutants in the environment, increase cocoa productivity, and reduce the risk of
chemical poisoning or deaths associated with consumption of toxic chemicals substances.
Materials and methods
The area of focus
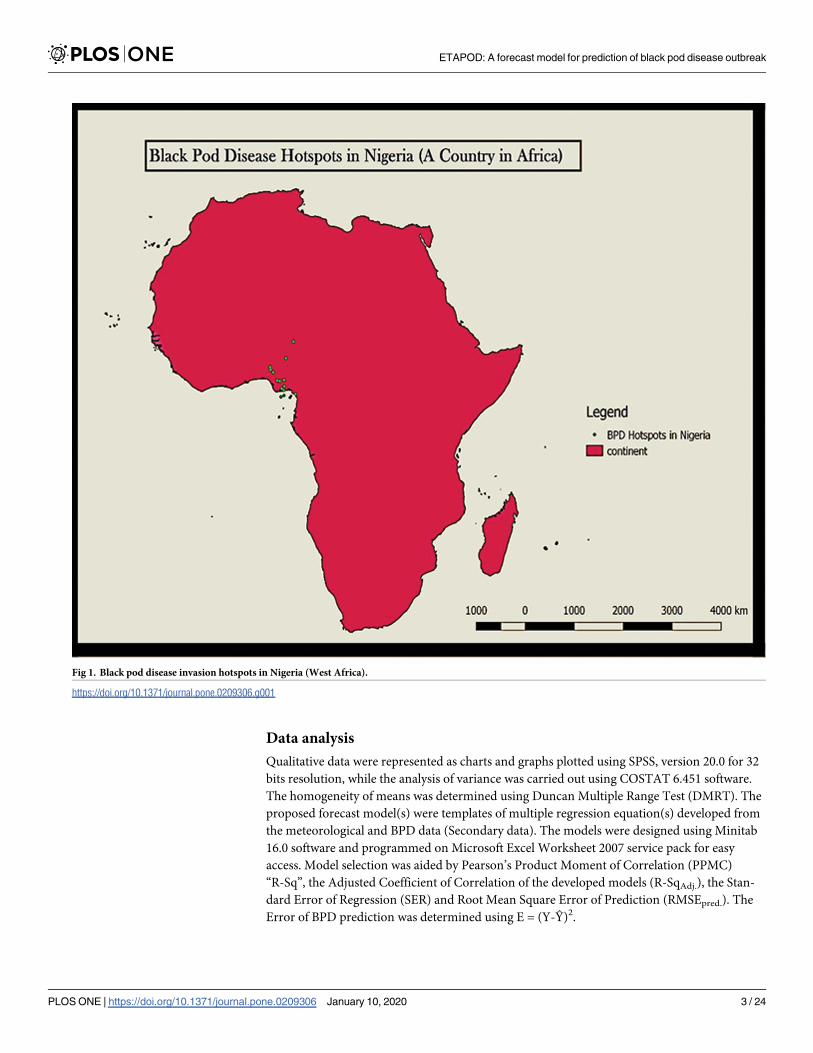
The area of research focus was the Western part of Africa with specific preference to Nigeria
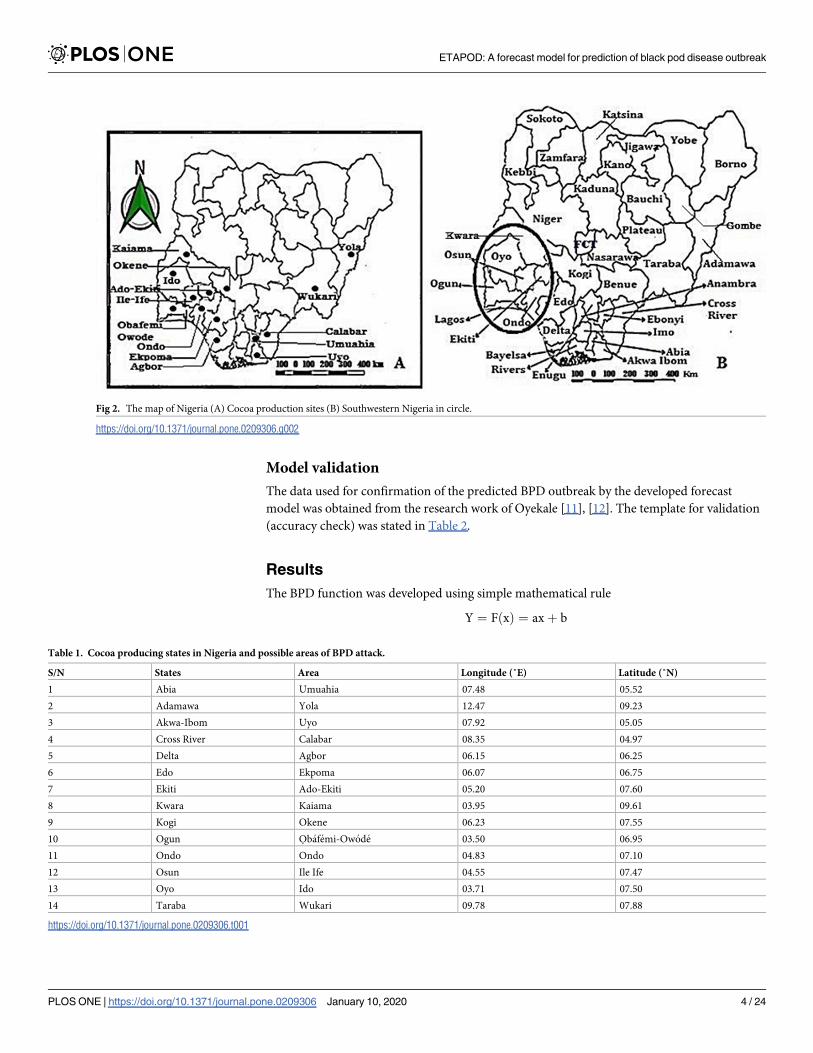
(Fig 1). The Southwestern region of Nigeria was used as a case study for result validation; this
region was clearly described in Fig 2. The co-ordinates of the area of focus were determined
using the blackberry mobile Global Positioning System (GPS) device (version 6.0) and a
mobile satellite GPS receiver model GARMIN Etrex 10 obtained from the Department of Bot-
any, Faculty of Science, University of Ibadan, Ibadan, Nigeria. Cocoa producing States in Nige-
ria were shown in Table 1 and Fig 3.
Black pod disease (BPD) data
Documented reports of BPD outbreaks within Southwestern Nigeria was obtained from
Cocoa Research Institute of Nigeria (CRIN), Idı-Ayunre˙, Ibadan, Oyo State, Nigeria and the
report of Lawal and Emaku [10]. The total data collected spanned from 1985 to 2014. These
served as secondary data.
Meteorological data
Weather data from 1985 to 2016 within Southwest, Nigeria were also collected from the report
of Lawal and Emaku [10], National Bureau of Statistics (NBS) Ibadan, Oyo State, the Meteoro-
logical Station of Cocoa Research Institute of Nigeria (CRIN), Idı-Ayunre˙, Ibadan, Oyo State,
Nigerian Meteorological Station (Nimet), and the Department of Geography, University of
Ibadan, Ibadan, Oyo State, Nigeria. These were also classified as secondary data.
ETAPOD: A forecast model for prediction of black pod disease outbreak
PLOS ONE | https://doi.org/10.1371/journal.pone.0209306 January 10, 2020 2 / 24
Data analysis
Qualitative data were represented as charts and graphs plotted using SPSS, version 20.0 for 32
bits resolution, while the analysis of variance was carried out using COSTAT 6.451 software.
The homogeneity of means was determined using Duncan Multiple Range Test (DMRT). The
proposed forecast model(s) were templates of multiple regression equation(s) developed from
the meteorological and BPD data (Secondary data). The models were designed using Minitab
16.0 software and programmed on Microsoft Excel Worksheet 2007 service pack for easy
access. Model selection was aided by Pearson’s Product Moment of Correlation (PPMC)
“R-Sq”, the Adjusted Coefficient of Correlation of the developed models (R-SqAdj.), the Stan-
dard Error of Regression (SER) and Root Mean Square Error of Prediction (RMSEpred.). The
Error of BPD prediction was determined using E = (Y-Ŷ)2.
Fig 1. Black pod disease invasion hotspots in Nigeria (West Africa).
https://doi.org/10.1371/journal.pone.0209306.g001
ETAPOD: A forecast model for prediction of black pod disease outbreak
PLOS ONE | https://doi.org/10.1371/journal.pone.0209306 January 10, 2020 3 / 24
Model validation
The data used for confirmation of the predicted BPD outbreak by the developed forecast
model was obtained from the research work of Oyekale [11], [12]. The template for validation
(accuracy check) was stated in Table 2.
Results
The BPD function was developed using simple mathematical rule
Y ¼ FðxÞ ¼ axþ b
Fig 2. The map of Nigeria (A) Cocoa production sites (B) Southwestern Nigeria in circle.
https://doi.org/10.1371/journal.pone.0209306.g002
Table 1. Cocoa producing states in Nigeria and possible areas of BPD attack.
S/N States Area Longitude (˚E) Latitude (˚N)
1 Abia Umuahia 07.48 05.52
2 Adamawa Yola 12.47 09.23
3 Akwa-Ibom Uyo 07.92 05.05
4 Cross River Calabar 08.35 04.97
5 Delta Agbor 06.15 06.25
6 Edo Ekpoma 06.07 06.75
7 Ekiti Ado-Ekiti 05.20 07.60
8 Kwara Kaiama 03.95 09.61
9 Kogi Okene 06.23 07.55
10 Ogun O˙
bafemi-Owode 03.50 06.95
11 Ondo Ondo 04.83 07.10
12 Osun Ile Ife 04.55 07.47
13 Oyo Ido 03.71 07.50
14 Taraba Wukari 09.78 07.88
https://doi.org/10.1371/journal.pone.0209306.t001
ETAPOD: A forecast model for prediction of black pod disease outbreak
PLOS ONE | https://doi.org/10.1371/journal.pone.0209306 January 10, 2020 4 / 24
Where, a = Coefficient of x, x = independent variable, b = Constant, Y = Response variable
and F = The Function of the variable x.
Thus,
BPD Outbreak ¼ FðHost; Pathogen; EnvironmentÞ¼ aðHost; Pathogen; EnvironmentÞ þ b
Mathematically,
Recall;Y ¼ FðxÞ ¼ axþ b
Then;D ¼ FðH; P; EÞ ¼ aðH; P; EÞ þ b ð1Þ
In any case the influence of man and vectors (Ants, Termites, and Rodents etc.) serve as
constants in the equation because they influence the spread of BPD in the field, coupled with
the timely combination of the key factors responsible for BPD development.
BPD Outbreak ¼ FðHost; Pathogen; EnvironmentÞ¼ aðHost; Pathogen; EnvironmentÞ þ ðTimeþManþ VectorÞ
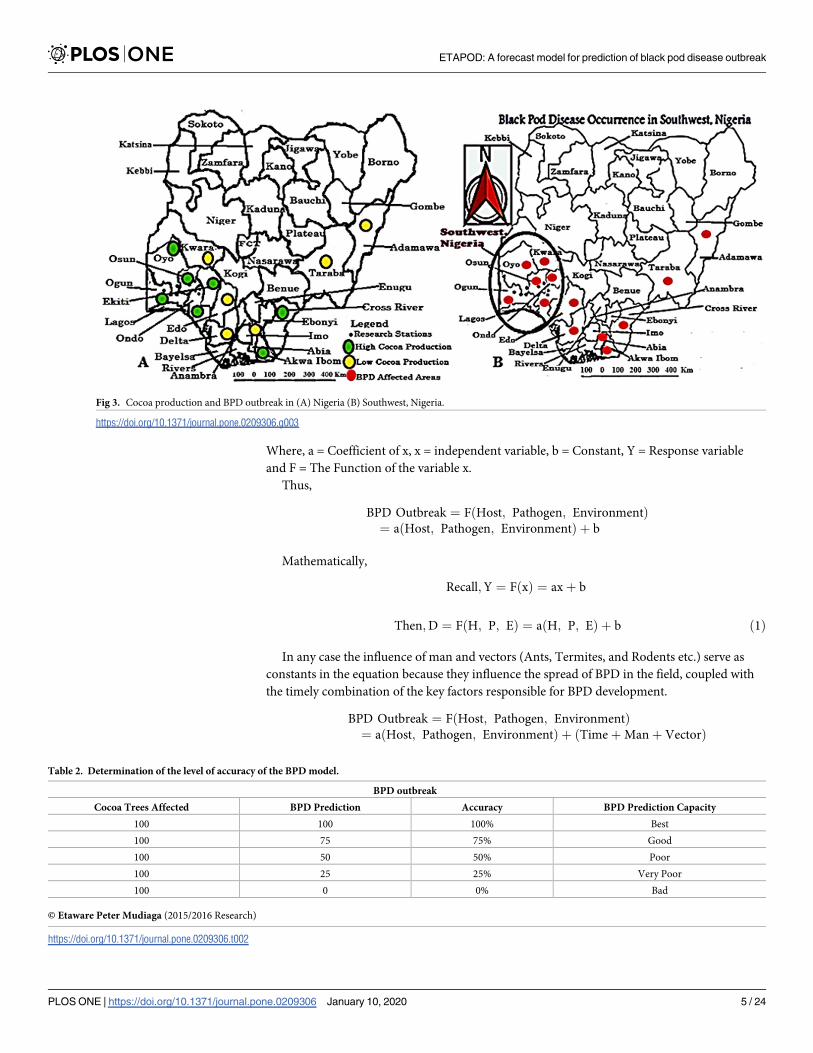
Fig 3. Cocoa production and BPD outbreak in (A) Nigeria (B) Southwest, Nigeria.
https://doi.org/10.1371/journal.pone.0209306.g003
Table 2. Determination of the level of accuracy of the BPD model.
BPD outbreak
Cocoa Trees Affected BPD Prediction Accuracy BPD Prediction Capacity
100 100 100% Best
100 75 75% Good
100 50 50% Poor
100 25 25% Very Poor
100 0 0% Bad
© Etaware Peter Mudiaga (2015/2016 Research)
https://doi.org/10.1371/journal.pone.0209306.t002
ETAPOD: A forecast model for prediction of black pod disease outbreak
PLOS ONE | https://doi.org/10.1371/journal.pone.0209306 January 10, 2020 5 / 24
Mathematically,
Recall;Y ¼ FðxÞ ¼ axþ b
Then; D ¼ FðH; P; EÞ ¼ aðH; P; EÞ þ ðTþMþ VÞ ð2Þ
Where; D ¼ BPD Outbreak; H ¼ Host; P ¼ Pathogen; T ¼ Time; M ¼ man; V¼ Vectors; E ¼ Environment; x ¼ ðH; P; EÞ; and b ¼ ðTþMþ VÞ
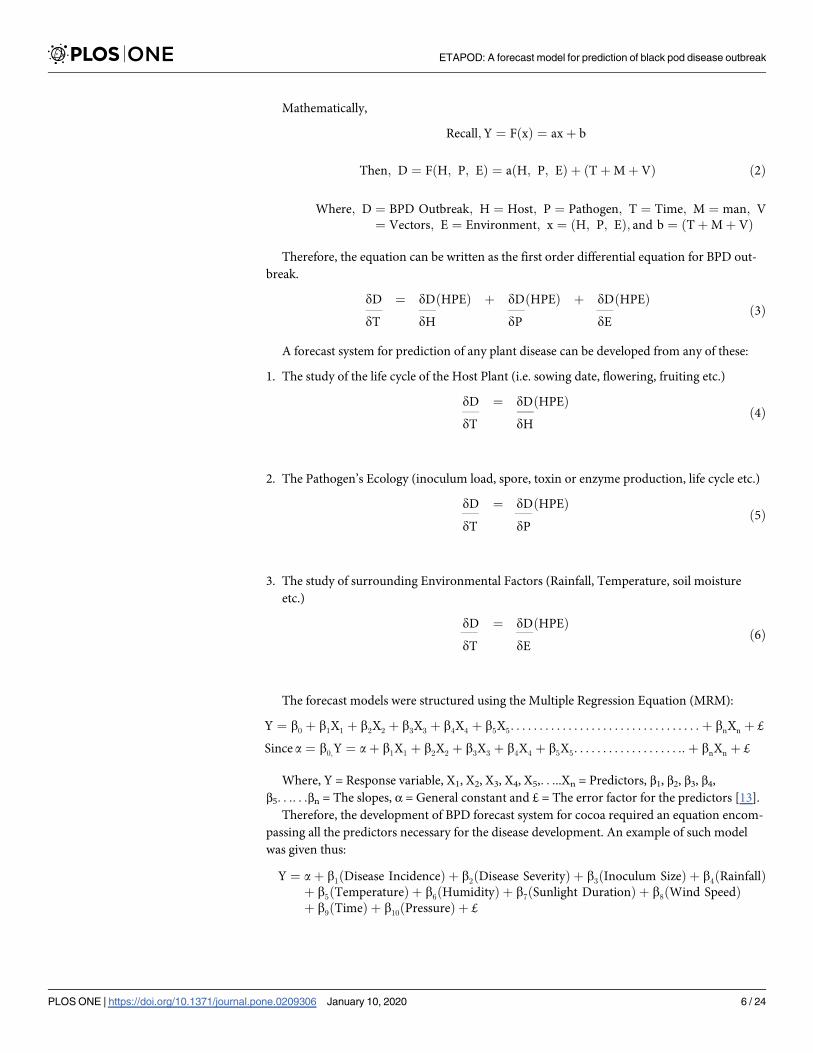
Therefore, the equation can be written as the first order differential equation for BPD out-
break.
dD ¼ dDðHPEÞ þ dDðHPEÞ þ dDðHPEÞ
dT dH dP dEð3Þ
A forecast system for prediction of any plant disease can be developed from any of these:
1. The study of the life cycle of the Host Plant (i.e. sowing date, flowering, fruiting etc.)
dD ¼ dDðHPEÞ
dT dHð4Þ
2. The Pathogen’s Ecology (inoculum load, spore, toxin or enzyme production, life cycle etc.)
dD ¼ dDðHPEÞ
dT dPð5Þ
3. The study of surrounding Environmental Factors (Rainfall, Temperature, soil moisture
etc.)
dD ¼ dDðHPEÞ
dT dEð6Þ
The forecast models were structured using the Multiple Regression Equation (MRM):
Y ¼ b0 þ b1X1 þ b2X2 þ b3X3 þ b4X4 þ b5X5. . . . . . . . . . . . . . . . . . . . . . . . . . . . . . . . .þ bnXn þ £
Since a ¼ b0;Y ¼ aþ b1X1 þ b2X2 þ b3X3 þ b4X4 þ b5X5. . . . . . . . . . . . . . . . . . ::þ bnXn þ £
Where, Y = Response variable, X1, X2, X3, X4, X5,. . ...Xn = Predictors, β1, β2, β3, β4,
β5. . .. . .βn = The slopes, α = General constant and £ = The error factor for the predictors [13].
Therefore, the development of BPD forecast system for cocoa required an equation encom-
passing all the predictors necessary for the disease development. An example of such model
was given thus:
Y ¼ aþ b1ðDisease IncidenceÞ þ b2ðDisease SeverityÞ þ b3ðInoculum SizeÞ þ b4ðRainfallÞþ b5ðTemperatureÞ þ b6ðHumidityÞ þ b7ðSunlight DurationÞ þ b8ðWind SpeedÞþ b9ðTimeÞ þ b10ðPressureÞ þ £
ETAPOD: A forecast model for prediction of black pod disease outbreak
PLOS ONE | https://doi.org/10.1371/journal.pone.0209306 January 10, 2020 6 / 24
Or
Y ¼ b0 þ b1ðDisease IncidenceÞ þ b2ðDisease SeverityÞ þ b3ðInoculum SizeÞ þ b4ðRainfallÞþ b5ðTemperatureÞ þ b6ðHumidityÞ þ b7ðSunlight DurationÞ þ b8ðWind SpeedÞþ b9ðTimeÞ þ b10ðPressureÞ þ £
In any case the individual predictors were tested against the response variable to ascertain
their role(s) in black pod disease outbreak.
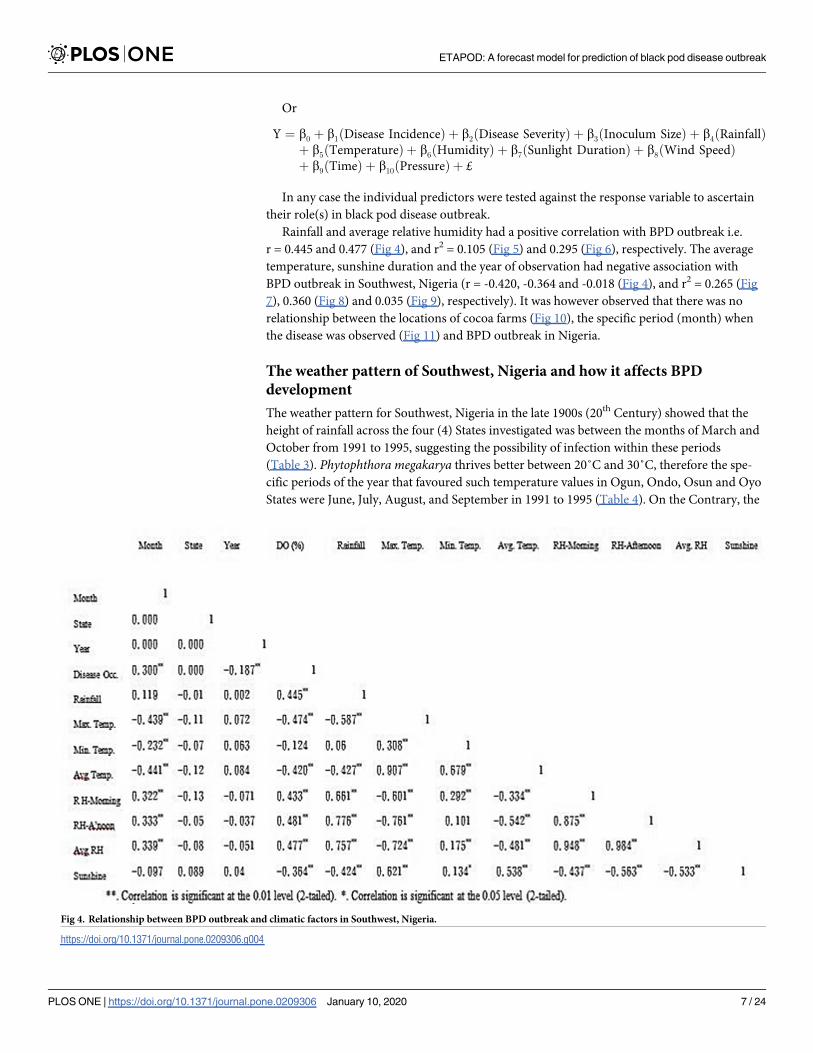
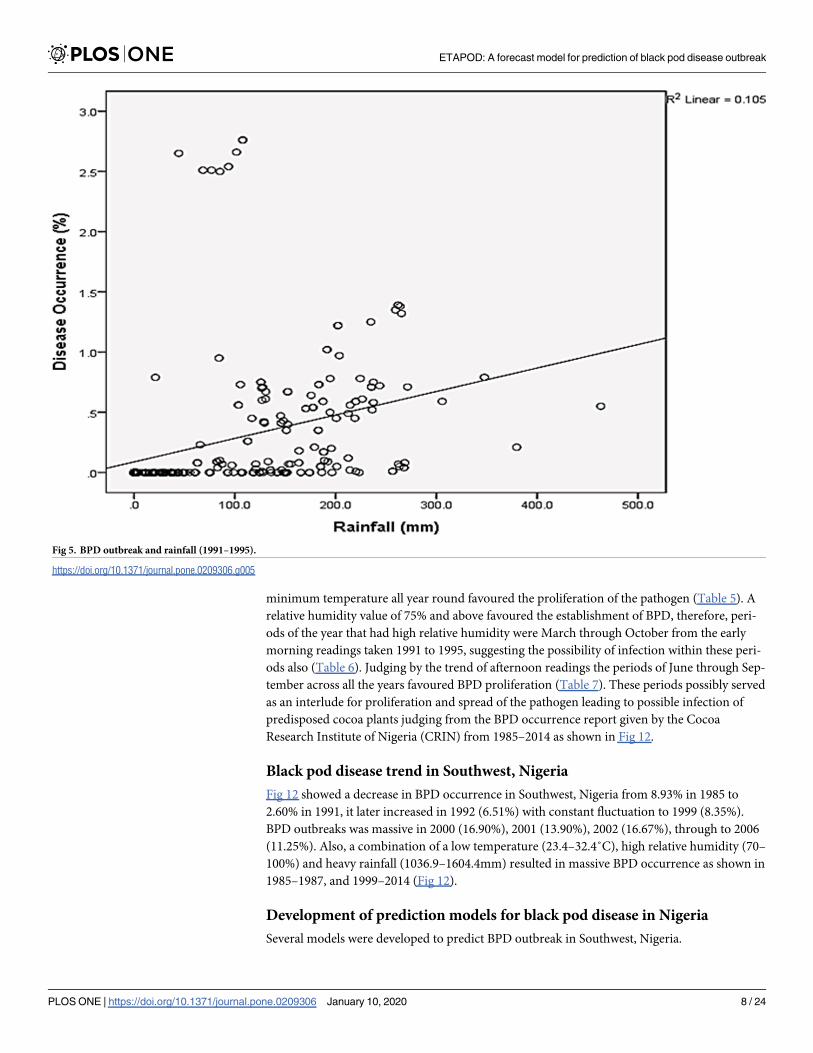
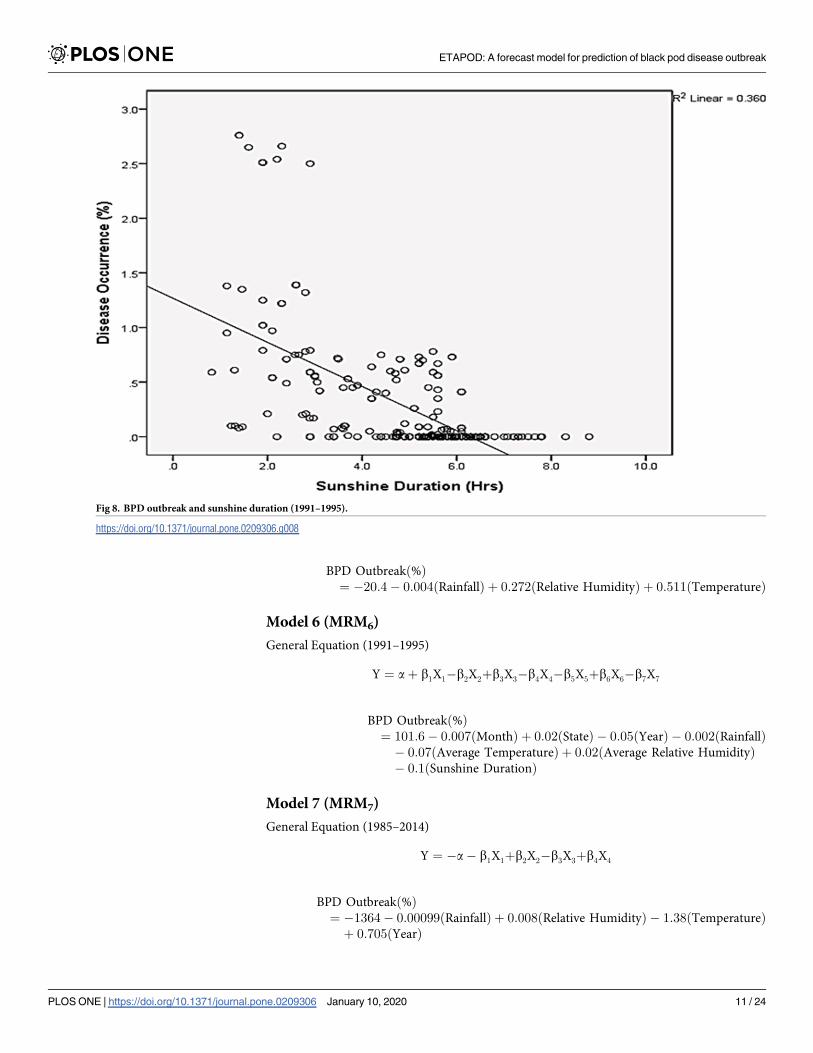
Rainfall and average relative humidity had a positive correlation with BPD outbreak i.e.
r = 0.445 and 0.477 (Fig 4), and r2 = 0.105 (Fig 5) and 0.295 (Fig 6), respectively. The average
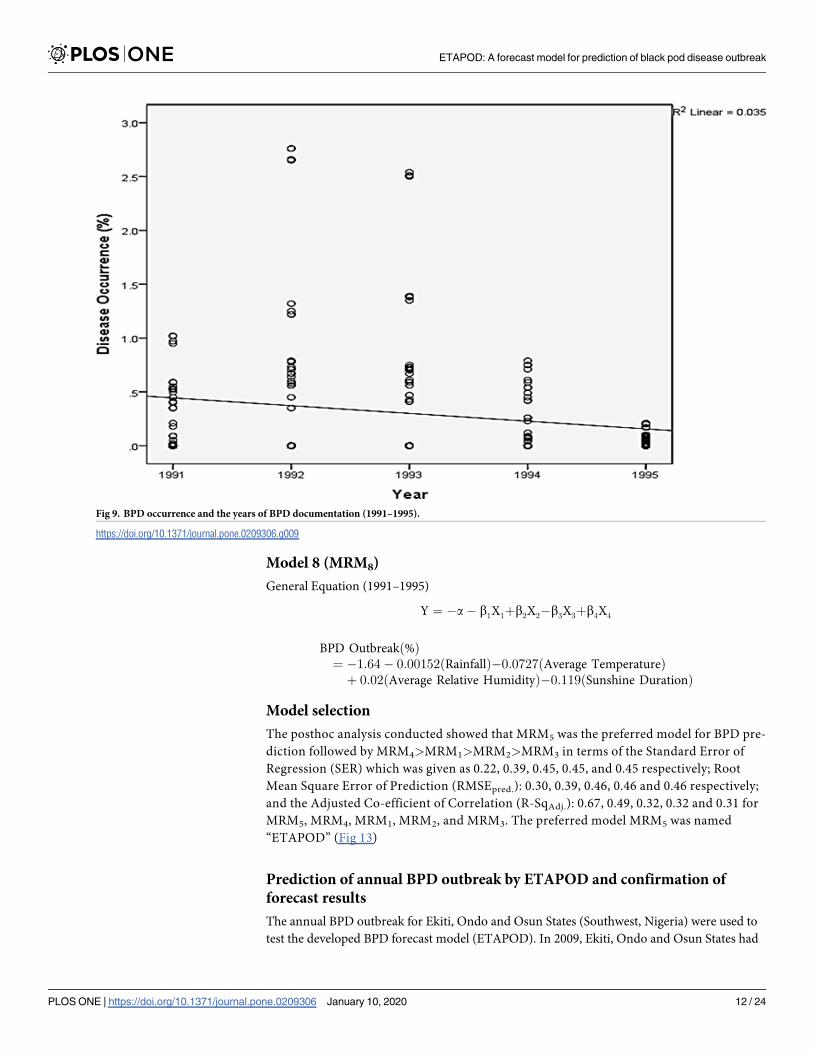
temperature, sunshine duration and the year of observation had negative association with
BPD outbreak in Southwest, Nigeria (r = -0.420, -0.364 and -0.018 (Fig 4), and r2 = 0.265 (Fig
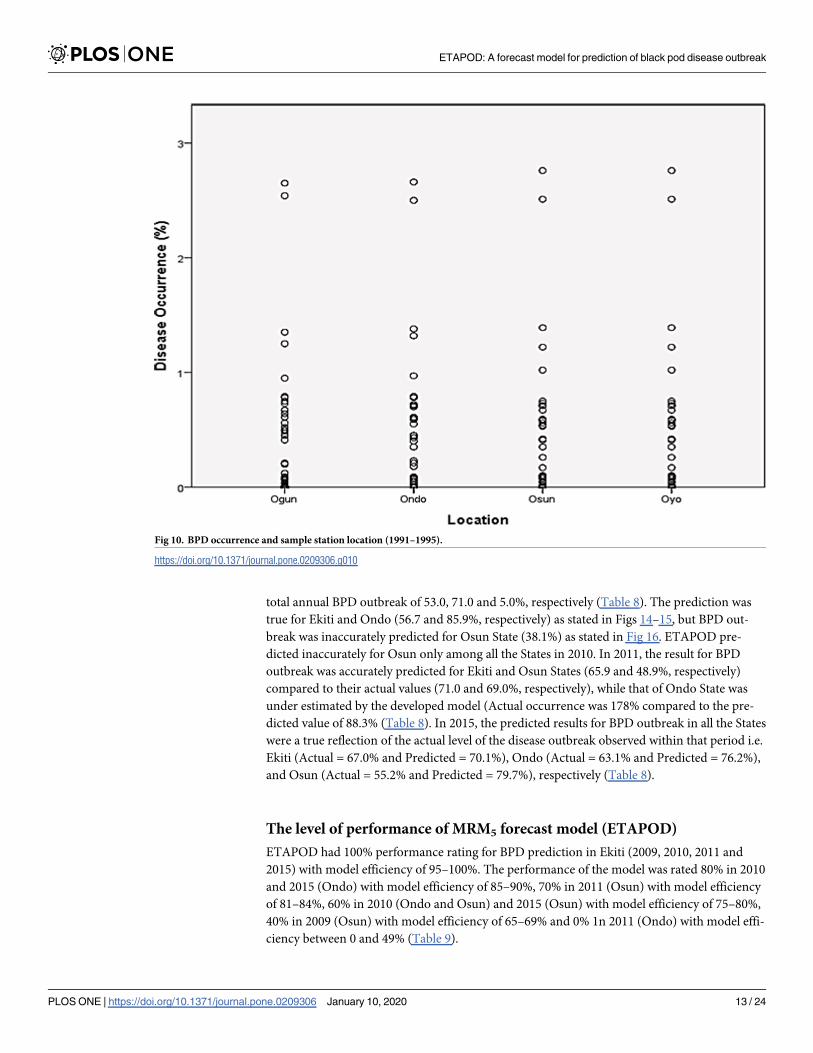
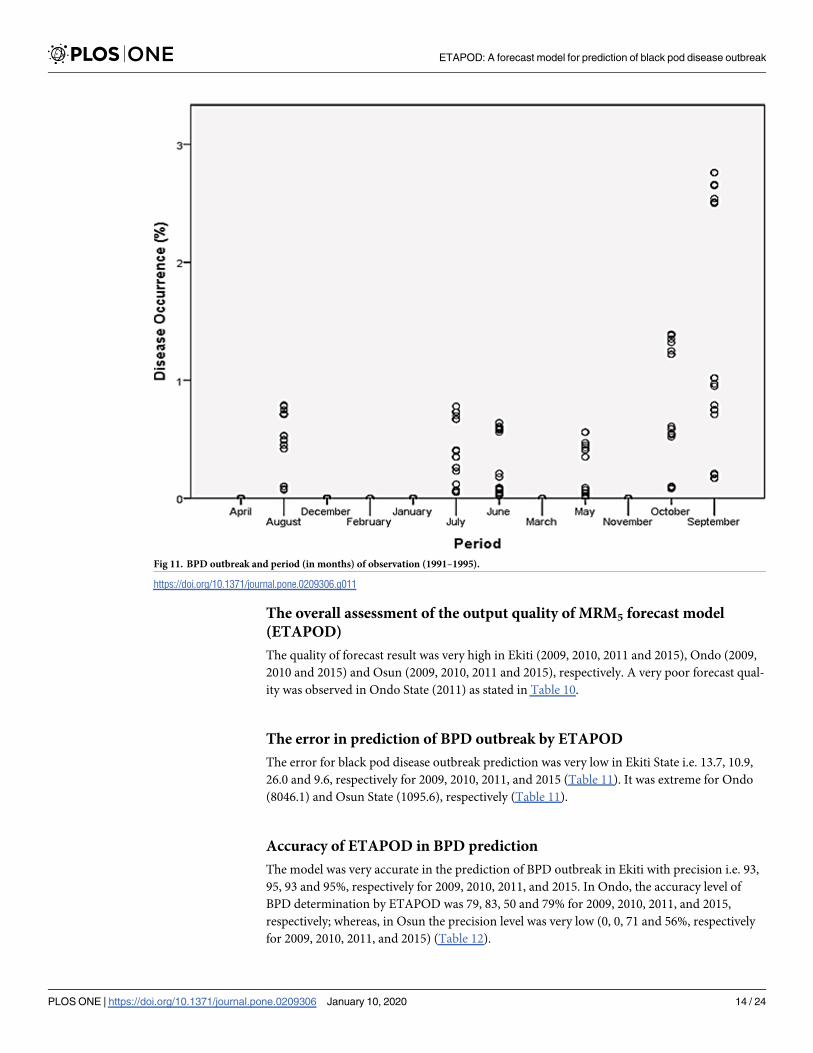
7), 0.360 (Fig 8) and 0.035 (Fig 9), respectively). It was however observed that there was no
relationship between the locations of cocoa farms (Fig 10), the specific period (month) when
the disease was observed (Fig 11) and BPD outbreak in Nigeria.
The weather pattern of Southwest, Nigeria and how it affects BPD
development
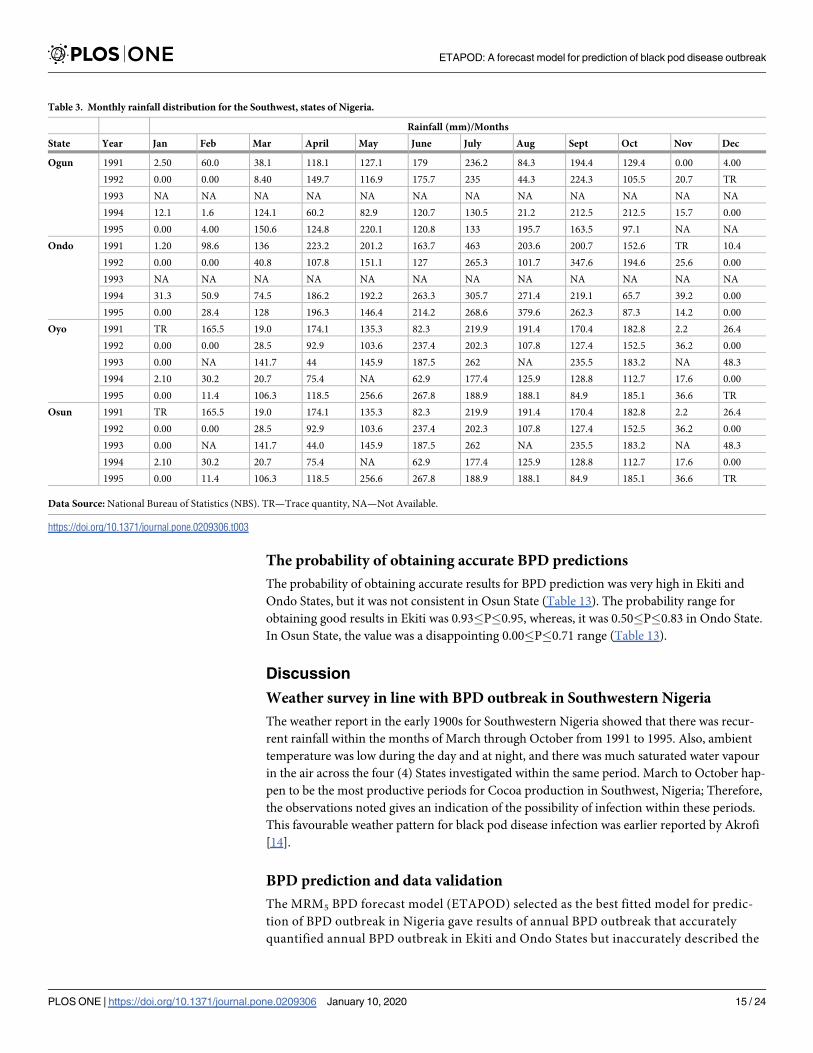
The weather pattern for Southwest, Nigeria in the late 1900s (20th Century) showed that the
height of rainfall across the four (4) States investigated was between the months of March and
October from 1991 to 1995, suggesting the possibility of infection within these periods
(Table 3). Phytophthora megakarya thrives better between 20˚C and 30˚C, therefore the spe-
cific periods of the year that favoured such temperature values in Ogun, Ondo, Osun and Oyo
States were June, July, August, and September in 1991 to 1995 (Table 4). On the Contrary, the
Fig 4. Relationship between BPD outbreak and climatic factors in Southwest, Nigeria.
https://doi.org/10.1371/journal.pone.0209306.g004
ETAPOD: A forecast model for prediction of black pod disease outbreak
PLOS ONE | https://doi.org/10.1371/journal.pone.0209306 January 10, 2020 7 / 24
minimum temperature all year round favoured the proliferation of the pathogen (Table 5). A
relative humidity value of 75% and above favoured the establishment of BPD, therefore, peri-
ods of the year that had high relative humidity were March through October from the early
morning readings taken 1991 to 1995, suggesting the possibility of infection within these peri-
ods also (Table 6). Judging by the trend of afternoon readings the periods of June through Sep-
tember across all the years favoured BPD proliferation (Table 7). These periods possibly served
as an interlude for proliferation and spread of the pathogen leading to possible infection of
predisposed cocoa plants judging from the BPD occurrence report given by the Cocoa
Research Institute of Nigeria (CRIN) from 1985–2014 as shown in Fig 12.
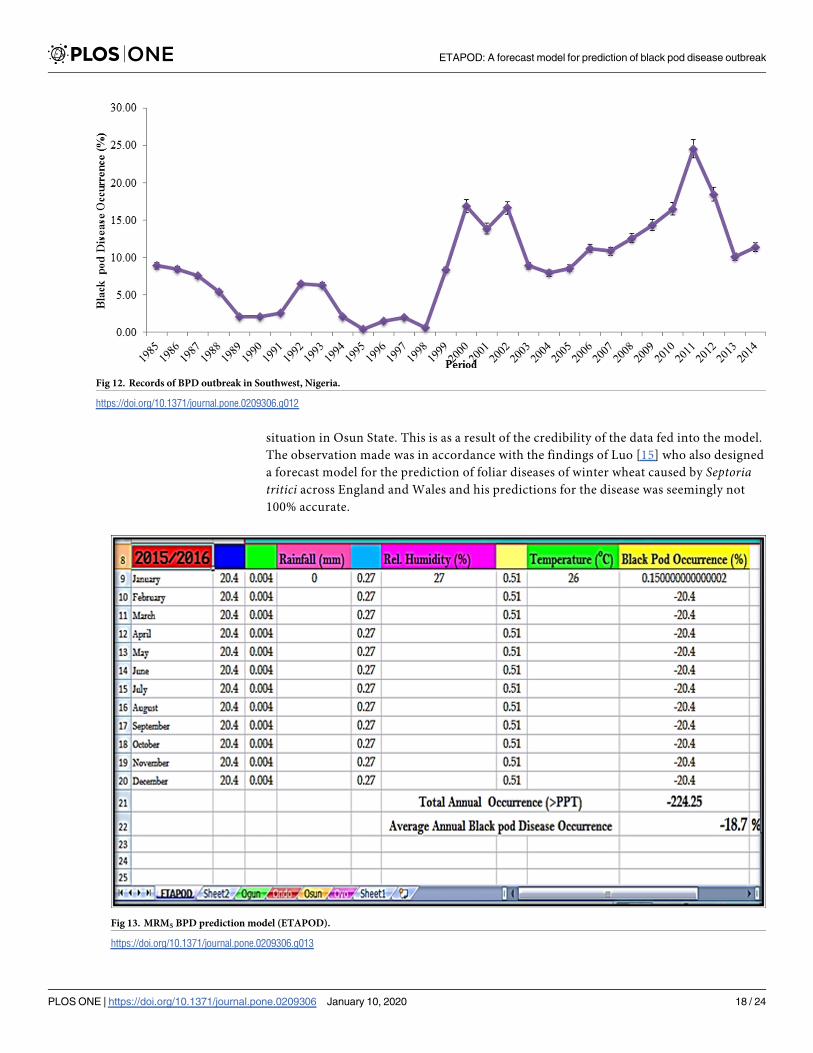
Black pod disease trend in Southwest, Nigeria
Fig 12 showed a decrease in BPD occurrence in Southwest, Nigeria from 8.93% in 1985 to
2.60% in 1991, it later increased in 1992 (6.51%) with constant fluctuation to 1999 (8.35%).
BPD outbreaks was massive in 2000 (16.90%), 2001 (13.90%), 2002 (16.67%), through to 2006
(11.25%). Also, a combination of a low temperature (23.4–32.4˚C), high relative humidity (70–
100%) and heavy rainfall (1036.9–1604.4mm) resulted in massive BPD occurrence as shown in
1985–1987, and 1999–2014 (Fig 12).
Development of prediction models for black pod disease in Nigeria
Several models were developed to predict BPD outbreak in Southwest, Nigeria.
Fig 5. BPD outbreak and rainfall (1991–1995).
https://doi.org/10.1371/journal.pone.0209306.g005
ETAPOD: A forecast model for prediction of black pod disease outbreak
PLOS ONE | https://doi.org/10.1371/journal.pone.0209306 January 10, 2020 8 / 24
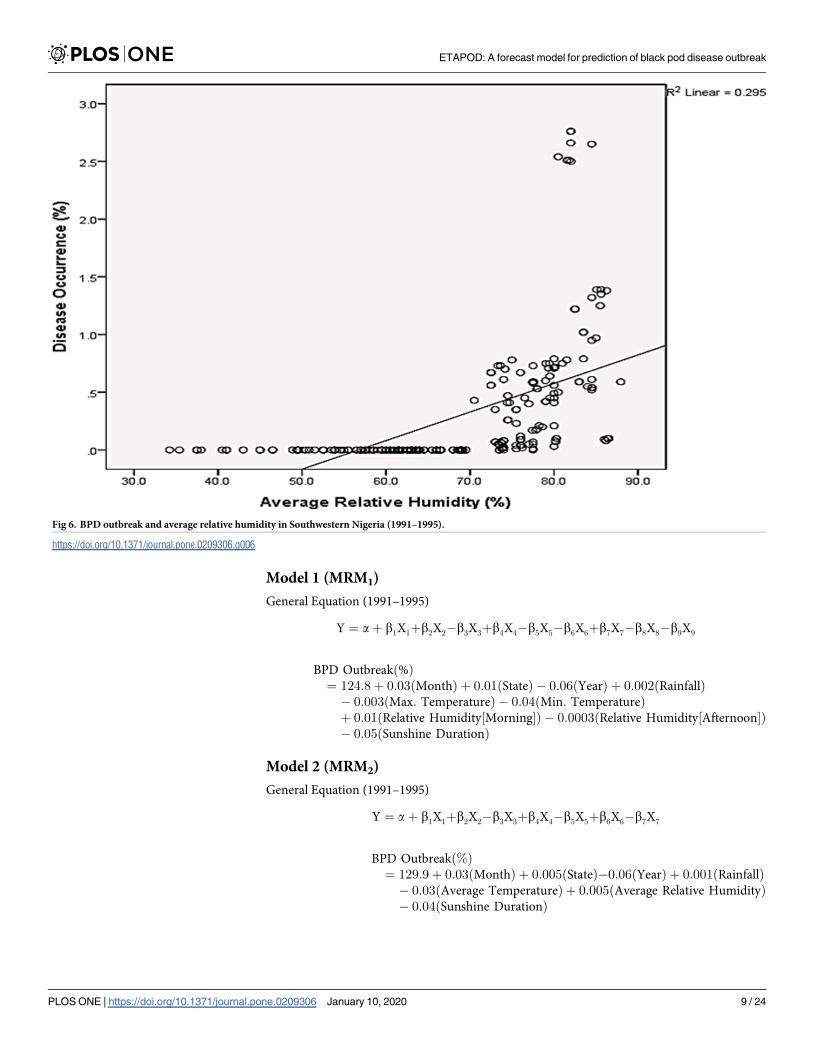
Model 1 (MRM1)
General Equation (1991–1995)
Y ¼ aþ b1X1þb2X2� b3X3þb4X4� b5X5� b6X6þb7X7� b8X8� b9X9
BPD Outbreakð%Þ¼ 124:8þ 0:03ðMonthÞ þ 0:01ðStateÞ � 0:06ðYearÞ þ 0:002ðRainfallÞ� 0:003ðMax: TemperatureÞ � 0:04ðMin: TemperatureÞþ 0:01ðRelative Humidity½Morning�Þ � 0:0003ðRelative Humidity½Afternoon�Þ� 0:05ðSunshine DurationÞ
Model 2 (MRM2)
General Equation (1991–1995)
Y ¼ aþ b1X1þb2X2� b3X3þb4X4� b5X5þb6X6� b7X7
BPD Outbreakð%Þ¼ 129:9þ 0:03ðMonthÞ þ 0:005ðStateÞ� 0:06ðYearÞ þ 0:001ðRainfallÞ� 0:03ðAverage TemperatureÞ þ 0:005ðAverage Relative HumidityÞ� 0:04ðSunshine DurationÞ
Fig 6. BPD outbreak and average relative humidity in Southwestern Nigeria (1991–1995).
https://doi.org/10.1371/journal.pone.0209306.g006
ETAPOD: A forecast model for prediction of black pod disease outbreak
PLOS ONE | https://doi.org/10.1371/journal.pone.0209306 January 10, 2020 9 / 24
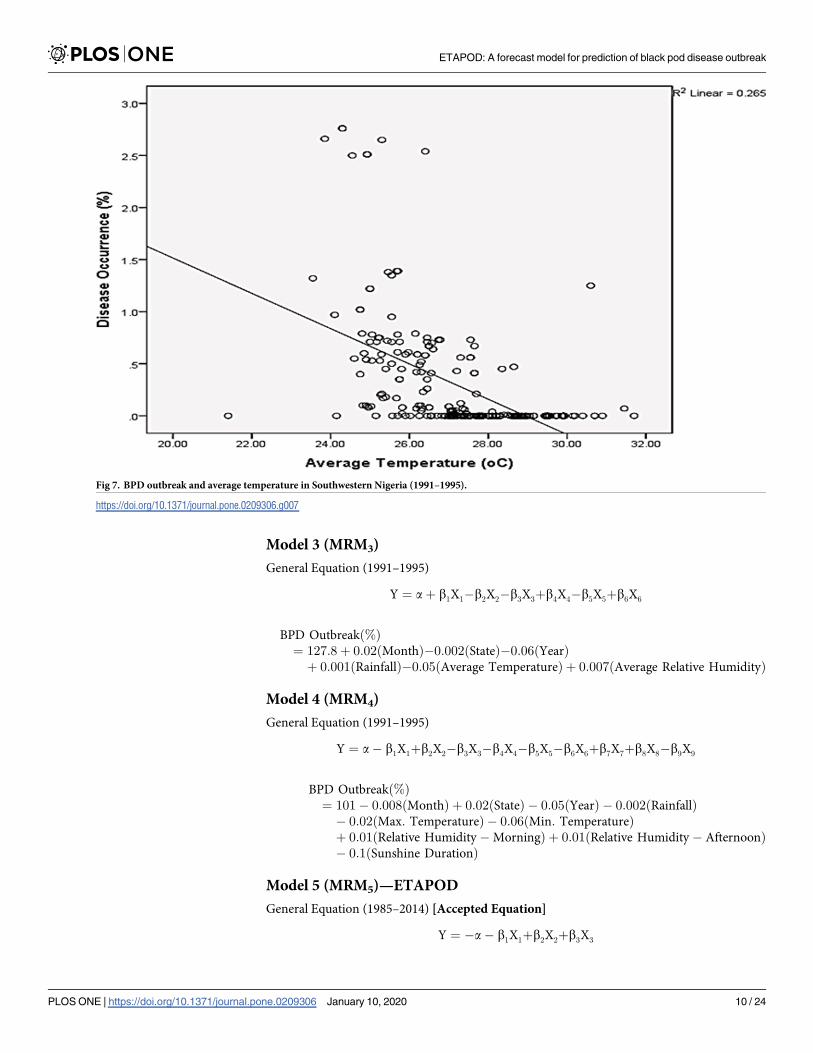
Model 3 (MRM3)
General Equation (1991–1995)
Y ¼ aþ b1X1� b2X2� b3X3þb4X4� b5X5þb6X6
BPD Outbreakð%Þ¼ 127:8þ 0:02ðMonthÞ� 0:002ðStateÞ� 0:06ðYearÞþ 0:001ðRainfallÞ� 0:05ðAverage TemperatureÞ þ 0:007ðAverage Relative HumidityÞ
Model 4 (MRM4)
General Equation (1991–1995)
Y ¼ a � b1X1þb2X2� b3X3� b4X4� b5X5� b6X6þb7X7þb8X8� b9X9
BPD Outbreakð%Þ¼ 101 � 0:008ðMonthÞ þ 0:02ðStateÞ � 0:05ðYearÞ � 0:002ðRainfallÞ� 0:02ðMax: TemperatureÞ � 0:06ðMin: TemperatureÞþ 0:01ðRelative Humidity � MorningÞ þ 0:01ðRelative Humidity � AfternoonÞ� 0:1ðSunshine DurationÞ
Model 5 (MRM5)—ETAPOD
General Equation (1985–2014) [Accepted Equation]
Y ¼ � a � b1X1þb2X2þb3X3
Fig 7. BPD outbreak and average temperature in Southwestern Nigeria (1991–1995).
https://doi.org/10.1371/journal.pone.0209306.g007
ETAPOD: A forecast model for prediction of black pod disease outbreak
PLOS ONE | https://doi.org/10.1371/journal.pone.0209306 January 10, 2020 10 / 24
BPD Outbreakð%Þ¼ � 20:4 � 0:004ðRainfallÞ þ 0:272ðRelative HumidityÞ þ 0:511ðTemperatureÞ
Model 6 (MRM6)
General Equation (1991–1995)
Y ¼ aþ b1X1� b2X2þb3X3� b4X4� b5X5þb6X6� b7X7
BPD Outbreakð%Þ¼ 101:6 � 0:007ðMonthÞ þ 0:02ðStateÞ � 0:05ðYearÞ � 0:002ðRainfallÞ� 0:07ðAverage TemperatureÞ þ 0:02ðAverage Relative HumidityÞ� 0:1ðSunshine DurationÞ
Model 7 (MRM7)
General Equation (1985–2014)
Y ¼ � a � b1X1þb2X2� b3X3þb4X4
BPD Outbreakð%Þ¼ � 1364 � 0:00099ðRainfallÞ þ 0:008ðRelative HumidityÞ � 1:38ðTemperatureÞþ 0:705ðYearÞ
Fig 8. BPD outbreak and sunshine duration (1991–1995).
https://doi.org/10.1371/journal.pone.0209306.g008
ETAPOD: A forecast model for prediction of black pod disease outbreak
PLOS ONE | https://doi.org/10.1371/journal.pone.0209306 January 10, 2020 11 / 24
Model 8 (MRM8)
General Equation (1991–1995)
Y ¼ � a � b1X1þb2X2� b3X3þb4X4
BPD Outbreakð%Þ¼ � 1:64 � 0:00152ðRainfallÞ� 0:0727ðAverage TemperatureÞþ 0:02ðAverage Relative HumidityÞ� 0:119ðSunshine DurationÞ
Model selection
The posthoc analysis conducted showed that MRM5 was the preferred model for BPD pre-
diction followed by MRM4>MRM1>MRM2>MRM3 in terms of the Standard Error of
Regression (SER) which was given as 0.22, 0.39, 0.45, 0.45, and 0.45 respectively; Root
Mean Square Error of Prediction (RMSEpred.): 0.30, 0.39, 0.46, 0.46 and 0.46 respectively;
and the Adjusted Co-efficient of Correlation (R-SqAdj.): 0.67, 0.49, 0.32, 0.32 and 0.31 for
MRM5, MRM4, MRM1, MRM2, and MRM3. The preferred model MRM5 was named
“ETAPOD” (Fig 13)
Prediction of annual BPD outbreak by ETAPOD and confirmation of
forecast results
The annual BPD outbreak for Ekiti, Ondo and Osun States (Southwest, Nigeria) were used to
test the developed BPD forecast model (ETAPOD). In 2009, Ekiti, Ondo and Osun States had
Fig 9. BPD occurrence and the years of BPD documentation (1991–1995).
https://doi.org/10.1371/journal.pone.0209306.g009
ETAPOD: A forecast model for prediction of black pod disease outbreak
PLOS ONE | https://doi.org/10.1371/journal.pone.0209306 January 10, 2020 12 / 24
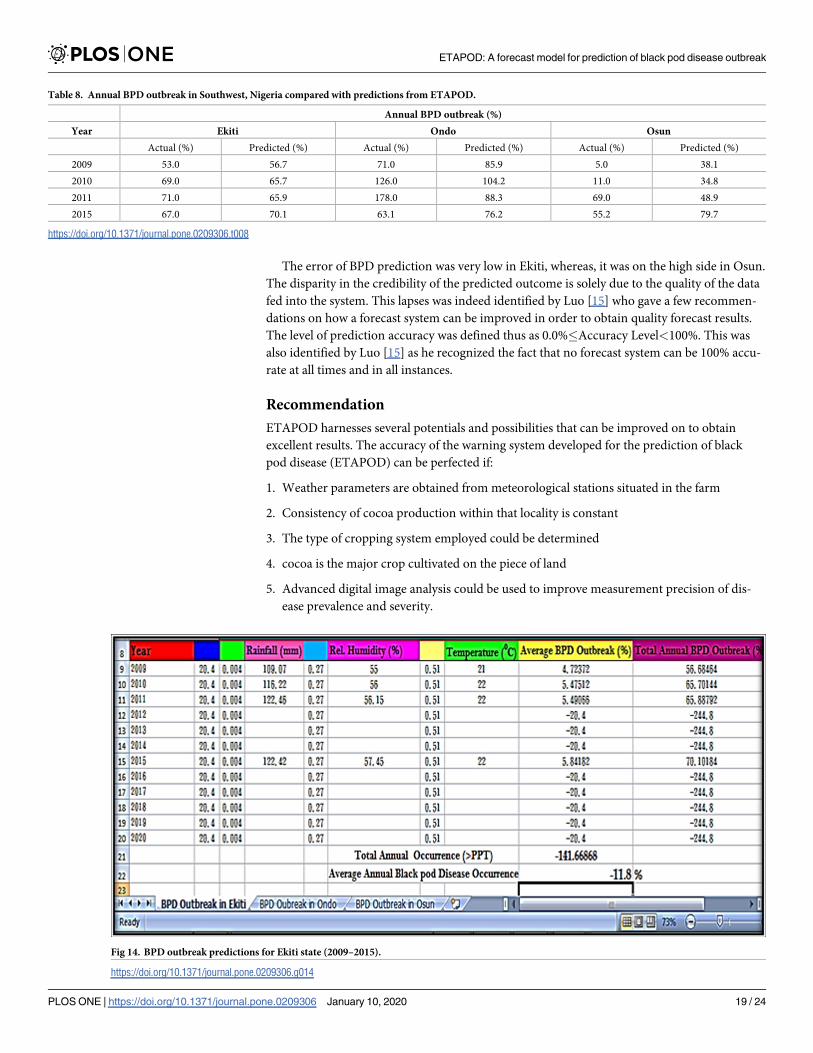
total annual BPD outbreak of 53.0, 71.0 and 5.0%, respectively (Table 8). The prediction was
true for Ekiti and Ondo (56.7 and 85.9%, respectively) as stated in Figs 14–15, but BPD out-
break was inaccurately predicted for Osun State (38.1%) as stated in Fig 16. ETAPOD pre-
dicted inaccurately for Osun only among all the States in 2010. In 2011, the result for BPD
outbreak was accurately predicted for Ekiti and Osun States (65.9 and 48.9%, respectively)
compared to their actual values (71.0 and 69.0%, respectively), while that of Ondo State was
under estimated by the developed model (Actual occurrence was 178% compared to the pre-
dicted value of 88.3% (Table 8). In 2015, the predicted results for BPD outbreak in all the States
were a true reflection of the actual level of the disease outbreak observed within that period i.e.
Ekiti (Actual = 67.0% and Predicted = 70.1%), Ondo (Actual = 63.1% and Predicted = 76.2%),
and Osun (Actual = 55.2% and Predicted = 79.7%), respectively (Table 8).
The level of performance of MRM5 forecast model (ETAPOD)
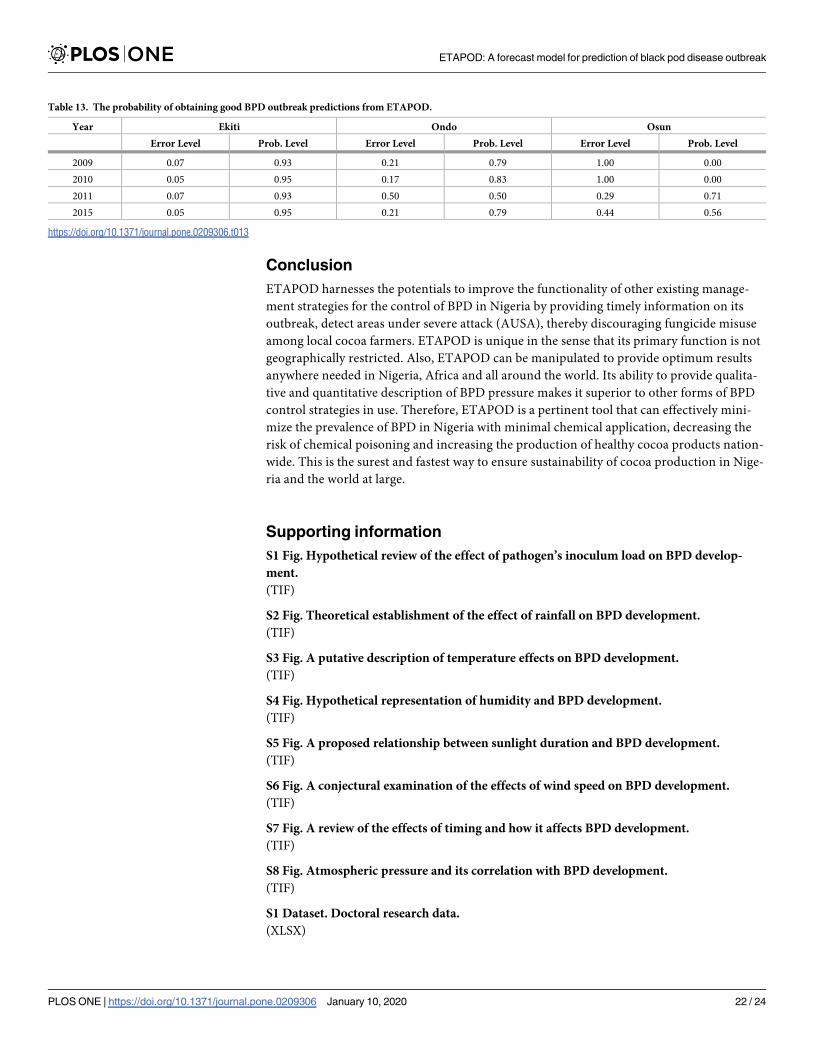
ETAPOD had 100% performance rating for BPD prediction in Ekiti (2009, 2010, 2011 and
2015) with model efficiency of 95–100%. The performance of the model was rated 80% in 2010
and 2015 (Ondo) with model efficiency of 85–90%, 70% in 2011 (Osun) with model efficiency
of 81–84%, 60% in 2010 (Ondo and Osun) and 2015 (Osun) with model efficiency of 75–80%,
40% in 2009 (Osun) with model efficiency of 65–69% and 0% 1n 2011 (Ondo) with model effi-
ciency between 0 and 49% (Table 9).
Fig 10. BPD occurrence and sample station location (1991–1995).
https://doi.org/10.1371/journal.pone.0209306.g010
ETAPOD: A forecast model for prediction of black pod disease outbreak
PLOS ONE | https://doi.org/10.1371/journal.pone.0209306 January 10, 2020 13 / 24
The overall assessment of the output quality of MRM5 forecast model
(ETAPOD)
The quality of forecast result was very high in Ekiti (2009, 2010, 2011 and 2015), Ondo (2009,
2010 and 2015) and Osun (2009, 2010, 2011 and 2015), respectively. A very poor forecast qual-
ity was observed in Ondo State (2011) as stated in Table 10.
The error in prediction of BPD outbreak by ETAPOD
The error for black pod disease outbreak prediction was very low in Ekiti State i.e. 13.7, 10.9,
26.0 and 9.6, respectively for 2009, 2010, 2011, and 2015 (Table 11). It was extreme for Ondo
(8046.1) and Osun State (1095.6), respectively (Table 11).
Accuracy of ETAPOD in BPD prediction
The model was very accurate in the prediction of BPD outbreak in Ekiti with precision i.e. 93,
95, 93 and 95%, respectively for 2009, 2010, 2011, and 2015. In Ondo, the accuracy level of
BPD determination by ETAPOD was 79, 83, 50 and 79% for 2009, 2010, 2011, and 2015,
respectively; whereas, in Osun the precision level was very low (0, 0, 71 and 56%, respectively
for 2009, 2010, 2011, and 2015) (Table 12).
Fig 11. BPD outbreak and period (in months) of observation (1991–1995).
https://doi.org/10.1371/journal.pone.0209306.g011
ETAPOD: A forecast model for prediction of black pod disease outbreak
PLOS ONE | https://doi.org/10.1371/journal.pone.0209306 January 10, 2020 14 / 24
The probability of obtaining accurate BPD predictions
The probability of obtaining accurate results for BPD prediction was very high in Ekiti and
Ondo States, but it was not consistent in Osun State (Table 13). The probability range for
obtaining good results in Ekiti was 0.93�P�0.95, whereas, it was 0.50�P�0.83 in Ondo State.
In Osun State, the value was a disappointing 0.00�P�0.71 range (Table 13).
Discussion
Weather survey in line with BPD outbreak in Southwestern Nigeria
The weather report in the early 1900s for Southwestern Nigeria showed that there was recur-
rent rainfall within the months of March through October from 1991 to 1995. Also, ambient
temperature was low during the day and at night, and there was much saturated water vapour
in the air across the four (4) States investigated within the same period. March to October hap-
pen to be the most productive periods for Cocoa production in Southwest, Nigeria; Therefore,
the observations noted gives an indication of the possibility of infection within these periods.
This favourable weather pattern for black pod disease infection was earlier reported by Akrofi
[14].
BPD prediction and data validation
The MRM5 BPD forecast model (ETAPOD) selected as the best fitted model for predic-
tion of BPD outbreak in Nigeria gave results of annual BPD outbreak that accurately
quantified annual BPD outbreak in Ekiti and Ondo States but inaccurately described the
Table 3. Monthly rainfall distribution for the Southwest, states of Nigeria.
Rainfall (mm)/Months
State Year Jan Feb Mar April May June July Aug Sept Oct Nov Dec
Ogun 1991 2.50 60.0 38.1 118.1 127.1 179 236.2 84.3 194.4 129.4 0.00 4.00
1992 0.00 0.00 8.40 149.7 116.9 175.7 235 44.3 224.3 105.5 20.7 TR
1993 NA NA NA NA NA NA NA NA NA NA NA NA
1994 12.1 1.6 124.1 60.2 82.9 120.7 130.5 21.2 212.5 212.5 15.7 0.00
1995 0.00 4.00 150.6 124.8 220.1 120.8 133 195.7 163.5 97.1 NA NA
Ondo 1991 1.20 98.6 136 223.2 201.2 163.7 463 203.6 200.7 152.6 TR 10.4
1992 0.00 0.00 40.8 107.8 151.1 127 265.3 101.7 347.6 194.6 25.6 0.00
1993 NA NA NA NA NA NA NA NA NA NA NA NA
1994 31.3 50.9 74.5 186.2 192.2 263.3 305.7 271.4 219.1 65.7 39.2 0.00
1995 0.00 28.4 128 196.3 146.4 214.2 268.6 379.6 262.3 87.3 14.2 0.00
Oyo 1991 TR 165.5 19.0 174.1 135.3 82.3 219.9 191.4 170.4 182.8 2.2 26.4
1992 0.00 0.00 28.5 92.9 103.6 237.4 202.3 107.8 127.4 152.5 36.2 0.00
1993 0.00 NA 141.7 44 145.9 187.5 262 NA 235.5 183.2 NA 48.3
1994 2.10 30.2 20.7 75.4 NA 62.9 177.4 125.9 128.8 112.7 17.6 0.00
1995 0.00 11.4 106.3 118.5 256.6 267.8 188.9 188.1 84.9 185.1 36.6 TR
Osun 1991 TR 165.5 19.0 174.1 135.3 82.3 219.9 191.4 170.4 182.8 2.2 26.4
1992 0.00 0.00 28.5 92.9 103.6 237.4 202.3 107.8 127.4 152.5 36.2 0.00
1993 0.00 NA 141.7 44.0 145.9 187.5 262 NA 235.5 183.2 NA 48.3
1994 2.10 30.2 20.7 75.4 NA 62.9 177.4 125.9 128.8 112.7 17.6 0.00
1995 0.00 11.4 106.3 118.5 256.6 267.8 188.9 188.1 84.9 185.1 36.6 TR
Data Source: National Bureau of Statistics (NBS). TR—Trace quantity, NA—Not Available.
https://doi.org/10.1371/journal.pone.0209306.t003
ETAPOD: A forecast model for prediction of black pod disease outbreak
PLOS ONE | https://doi.org/10.1371/journal.pone.0209306 January 10, 2020 15 / 24
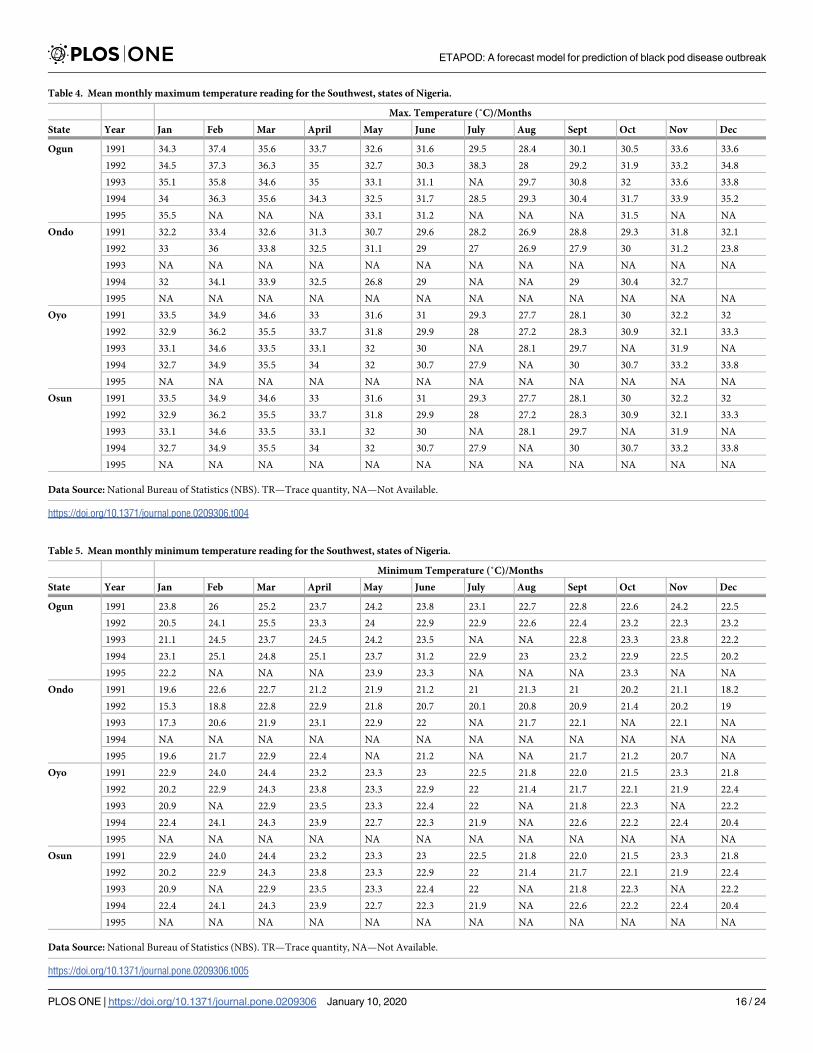
Table 4. Mean monthly maximum temperature reading for the Southwest, states of Nigeria.
Max. Temperature (˚C)/Months
State Year Jan Feb Mar April May June July Aug Sept Oct Nov Dec
Ogun 1991 34.3 37.4 35.6 33.7 32.6 31.6 29.5 28.4 30.1 30.5 33.6 33.6
1992 34.5 37.3 36.3 35 32.7 30.3 38.3 28 29.2 31.9 33.2 34.8
1993 35.1 35.8 34.6 35 33.1 31.1 NA 29.7 30.8 32 33.6 33.8
1994 34 36.3 35.6 34.3 32.5 31.7 28.5 29.3 30.4 31.7 33.9 35.2
1995 35.5 NA NA NA 33.1 31.2 NA NA NA 31.5 NA NA
Ondo 1991 32.2 33.4 32.6 31.3 30.7 29.6 28.2 26.9 28.8 29.3 31.8 32.1
1992 33 36 33.8 32.5 31.1 29 27 26.9 27.9 30 31.2 23.8
1993 NA NA NA NA NA NA NA NA NA NA NA NA
1994 32 34.1 33.9 32.5 26.8 29 NA NA 29 30.4 32.7
1995 NA NA NA NA NA NA NA NA NA NA NA NA
Oyo 1991 33.5 34.9 34.6 33 31.6 31 29.3 27.7 28.1 30 32.2 32
1992 32.9 36.2 35.5 33.7 31.8 29.9 28 27.2 28.3 30.9 32.1 33.3
1993 33.1 34.6 33.5 33.1 32 30 NA 28.1 29.7 NA 31.9 NA
1994 32.7 34.9 35.5 34 32 30.7 27.9 NA 30 30.7 33.2 33.8
1995 NA NA NA NA NA NA NA NA NA NA NA NA
Osun 1991 33.5 34.9 34.6 33 31.6 31 29.3 27.7 28.1 30 32.2 32
1992 32.9 36.2 35.5 33.7 31.8 29.9 28 27.2 28.3 30.9 32.1 33.3
1993 33.1 34.6 33.5 33.1 32 30 NA 28.1 29.7 NA 31.9 NA
1994 32.7 34.9 35.5 34 32 30.7 27.9 NA 30 30.7 33.2 33.8
1995 NA NA NA NA NA NA NA NA NA NA NA NA
Data Source: National Bureau of Statistics (NBS). TR—Trace quantity, NA—Not Available.
https://doi.org/10.1371/journal.pone.0209306.t004
Table 5. Mean monthly minimum temperature reading for the Southwest, states of Nigeria.
Minimum Temperature (˚C)/Months
State Year Jan Feb Mar April May June July Aug Sept Oct Nov Dec
Ogun 1991 23.8 26 25.2 23.7 24.2 23.8 23.1 22.7 22.8 22.6 24.2 22.5
1992 20.5 24.1 25.5 23.3 24 22.9 22.9 22.6 22.4 23.2 22.3 23.2
1993 21.1 24.5 23.7 24.5 24.2 23.5 NA NA 22.8 23.3 23.8 22.2
1994 23.1 25.1 24.8 25.1 23.7 31.2 22.9 23 23.2 22.9 22.5 20.2
1995 22.2 NA NA NA 23.9 23.3 NA NA NA 23.3 NA NA
Ondo 1991 19.6 22.6 22.7 21.2 21.9 21.2 21 21.3 21 20.2 21.1 18.2
1992 15.3 18.8 22.8 22.9 21.8 20.7 20.1 20.8 20.9 21.4 20.2 19
1993 17.3 20.6 21.9 23.1 22.9 22 NA 21.7 22.1 NA 22.1 NA
1994 NA NA NA NA NA NA NA NA NA NA NA NA
1995 19.6 21.7 22.9 22.4 NA 21.2 NA NA 21.7 21.2 20.7 NA
Oyo 1991 22.9 24.0 24.4 23.2 23.3 23 22.5 21.8 22.0 21.5 23.3 21.8
1992 20.2 22.9 24.3 23.8 23.3 22.9 22 21.4 21.7 22.1 21.9 22.4
1993 20.9 NA 22.9 23.5 23.3 22.4 22 NA 21.8 22.3 NA 22.2
1994 22.4 24.1 24.3 23.9 22.7 22.3 21.9 NA 22.6 22.2 22.4 20.4
1995 NA NA NA NA NA NA NA NA NA NA NA NA
Osun 1991 22.9 24.0 24.4 23.2 23.3 23 22.5 21.8 22.0 21.5 23.3 21.8
1992 20.2 22.9 24.3 23.8 23.3 22.9 22 21.4 21.7 22.1 21.9 22.4
1993 20.9 NA 22.9 23.5 23.3 22.4 22 NA 21.8 22.3 NA 22.2
1994 22.4 24.1 24.3 23.9 22.7 22.3 21.9 NA 22.6 22.2 22.4 20.4
1995 NA NA NA NA NA NA NA NA NA NA NA NA
Data Source: National Bureau of Statistics (NBS). TR—Trace quantity, NA—Not Available.
https://doi.org/10.1371/journal.pone.0209306.t005
ETAPOD: A forecast model for prediction of black pod disease outbreak
PLOS ONE | https://doi.org/10.1371/journal.pone.0209306 January 10, 2020 16 / 24
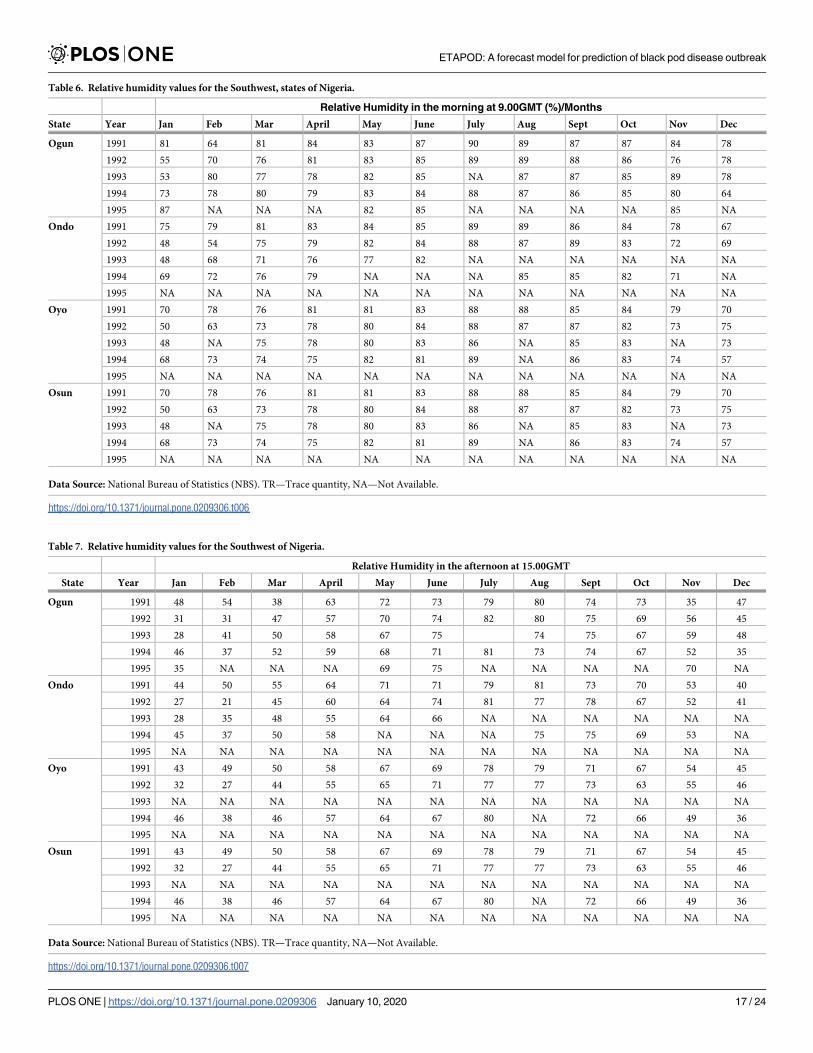
Table 6. Relative humidity values for the Southwest, states of Nigeria.
Relative Humidity in the morning at 9.00GMT (%)/Months
State Year Jan Feb Mar April May June July Aug Sept Oct Nov Dec
Ogun 1991 81 64 81 84 83 87 90 89 87 87 84 78
1992 55 70 76 81 83 85 89 89 88 86 76 78
1993 53 80 77 78 82 85 NA 87 87 85 89 78
1994 73 78 80 79 83 84 88 87 86 85 80 64
1995 87 NA NA NA 82 85 NA NA NA NA 85 NA
Ondo 1991 75 79 81 83 84 85 89 89 86 84 78 67
1992 48 54 75 79 82 84 88 87 89 83 72 69
1993 48 68 71 76 77 82 NA NA NA NA NA NA
1994 69 72 76 79 NA NA NA 85 85 82 71 NA
1995 NA NA NA NA NA NA NA NA NA NA NA NA
Oyo 1991 70 78 76 81 81 83 88 88 85 84 79 70
1992 50 63 73 78 80 84 88 87 87 82 73 75
1993 48 NA 75 78 80 83 86 NA 85 83 NA 73
1994 68 73 74 75 82 81 89 NA 86 83 74 57
1995 NA NA NA NA NA NA NA NA NA NA NA NA
Osun 1991 70 78 76 81 81 83 88 88 85 84 79 70
1992 50 63 73 78 80 84 88 87 87 82 73 75
1993 48 NA 75 78 80 83 86 NA 85 83 NA 73
1994 68 73 74 75 82 81 89 NA 86 83 74 57
1995 NA NA NA NA NA NA NA NA NA NA NA NA
Data Source: National Bureau of Statistics (NBS). TR—Trace quantity, NA—Not Available.
https://doi.org/10.1371/journal.pone.0209306.t006
Table 7. Relative humidity values for the Southwest of Nigeria.
Relative Humidity in the afternoon at 15.00GMT
State Year Jan Feb Mar April May June July Aug Sept Oct Nov Dec
Ogun 1991 48 54 38 63 72 73 79 80 74 73 35 47
1992 31 31 47 57 70 74 82 80 75 69 56 45
1993 28 41 50 58 67 75 74 75 67 59 48
1994 46 37 52 59 68 71 81 73 74 67 52 35
1995 35 NA NA NA 69 75 NA NA NA NA 70 NA
Ondo 1991 44 50 55 64 71 71 79 81 73 70 53 40
1992 27 21 45 60 64 74 81 77 78 67 52 41
1993 28 35 48 55 64 66 NA NA NA NA NA NA
1994 45 37 50 58 NA NA NA 75 75 69 53 NA
1995 NA NA NA NA NA NA NA NA NA NA NA NA
Oyo 1991 43 49 50 58 67 69 78 79 71 67 54 45
1992 32 27 44 55 65 71 77 77 73 63 55 46
1993 NA NA NA NA NA NA NA NA NA NA NA NA
1994 46 38 46 57 64 67 80 NA 72 66 49 36
1995 NA NA NA NA NA NA NA NA NA NA NA NA
Osun 1991 43 49 50 58 67 69 78 79 71 67 54 45
1992 32 27 44 55 65 71 77 77 73 63 55 46
1993 NA NA NA NA NA NA NA NA NA NA NA NA
1994 46 38 46 57 64 67 80 NA 72 66 49 36
1995 NA NA NA NA NA NA NA NA NA NA NA NA
Data Source: National Bureau of Statistics (NBS). TR—Trace quantity, NA—Not Available.
https://doi.org/10.1371/journal.pone.0209306.t007
ETAPOD: A forecast model for prediction of black pod disease outbreak
PLOS ONE | https://doi.org/10.1371/journal.pone.0209306 January 10, 2020 17 / 24
situation in Osun State. This is as a result of the credibility of the data fed into the model.
The observation made was in accordance with the findings of Luo [15] who also designed
a forecast model for the prediction of foliar diseases of winter wheat caused by Septoriatritici across England and Wales and his predictions for the disease was seemingly not
100% accurate.
Fig 12. Records of BPD outbreak in Southwest, Nigeria.
https://doi.org/10.1371/journal.pone.0209306.g012
Fig 13. MRM5 BPD prediction model (ETAPOD).
https://doi.org/10.1371/journal.pone.0209306.g013
ETAPOD: A forecast model for prediction of black pod disease outbreak
PLOS ONE | https://doi.org/10.1371/journal.pone.0209306 January 10, 2020 18 / 24
The error of BPD prediction was very low in Ekiti, whereas, it was on the high side in Osun.
The disparity in the credibility of the predicted outcome is solely due to the quality of the data
fed into the system. This lapses was indeed identified by Luo [15] who gave a few recommen-
dations on how a forecast system can be improved in order to obtain quality forecast results.
The level of prediction accuracy was defined thus as 0.0%�Accuracy Level<100%. This was
also identified by Luo [15] as he recognized the fact that no forecast system can be 100% accu-
rate at all times and in all instances.
Recommendation
ETAPOD harnesses several potentials and possibilities that can be improved on to obtain
excellent results. The accuracy of the warning system developed for the prediction of black
pod disease (ETAPOD) can be perfected if:
1. Weather parameters are obtained from meteorological stations situated in the farm
2. Consistency of cocoa production within that locality is constant
3. The type of cropping system employed could be determined
4. cocoa is the major crop cultivated on the piece of land
5. Advanced digital image analysis could be used to improve measurement precision of dis-
ease prevalence and severity.
Table 8. Annual BPD outbreak in Southwest, Nigeria compared with predictions from ETAPOD.
Annual BPD outbreak (%)
Year Ekiti Ondo Osun
Actual (%) Predicted (%) Actual (%) Predicted (%) Actual (%) Predicted (%)
2009 53.0 56.7 71.0 85.9 5.0 38.1
2010 69.0 65.7 126.0 104.2 11.0 34.8
2011 71.0 65.9 178.0 88.3 69.0 48.9
2015 67.0 70.1 63.1 76.2 55.2 79.7
https://doi.org/10.1371/journal.pone.0209306.t008
Fig 14. BPD outbreak predictions for Ekiti state (2009–2015).
https://doi.org/10.1371/journal.pone.0209306.g014
ETAPOD: A forecast model for prediction of black pod disease outbreak
PLOS ONE | https://doi.org/10.1371/journal.pone.0209306 January 10, 2020 19 / 24
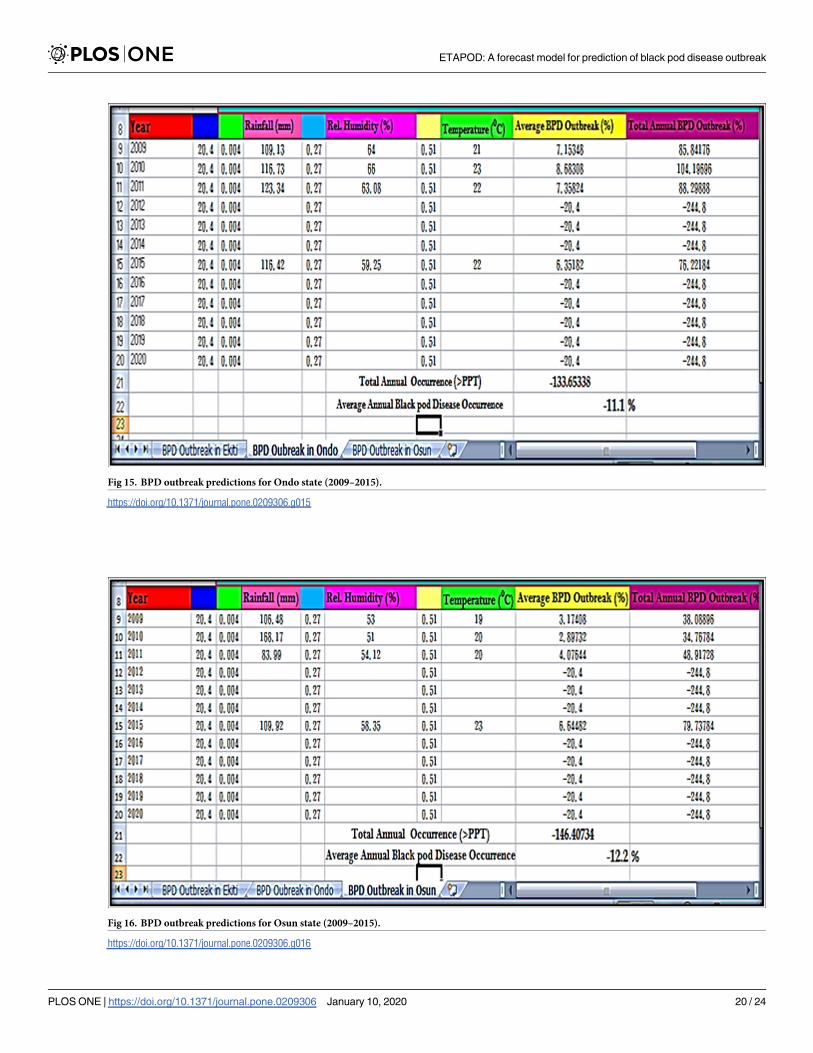
Fig 15. BPD outbreak predictions for Ondo state (2009–2015).
https://doi.org/10.1371/journal.pone.0209306.g015
Fig 16. BPD outbreak predictions for Osun state (2009–2015).
https://doi.org/10.1371/journal.pone.0209306.g016
ETAPOD: A forecast model for prediction of black pod disease outbreak
PLOS ONE | https://doi.org/10.1371/journal.pone.0209306 January 10, 2020 20 / 24
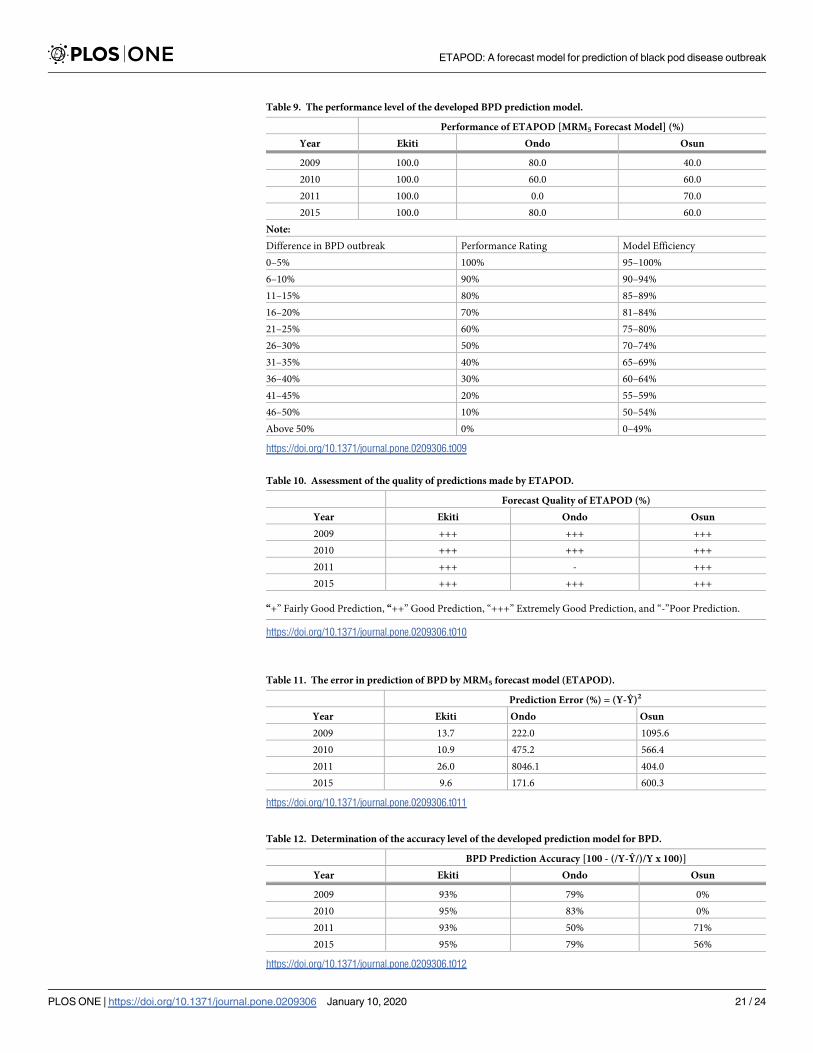
Table 9. The performance level of the developed BPD prediction model.
Performance of ETAPOD [MRM5 Forecast Model] (%)
Year Ekiti Ondo Osun
2009 100.0 80.0 40.0
2010 100.0 60.0 60.0
2011 100.0 0.0 70.0
2015 100.0 80.0 60.0
Note:
Difference in BPD outbreak Performance Rating Model Efficiency
0–5% 100% 95–100%
6–10% 90% 90–94%
11–15% 80% 85–89%
16–20% 70% 81–84%
21–25% 60% 75–80%
26–30% 50% 70–74%
31–35% 40% 65–69%
36–40% 30% 60–64%
41–45% 20% 55–59%
46–50% 10% 50–54%
Above 50% 0% 0–49%
https://doi.org/10.1371/journal.pone.0209306.t009
Table 10. Assessment of the quality of predictions made by ETAPOD.
Forecast Quality of ETAPOD (%)
Year Ekiti Ondo Osun
2009 +++ +++ +++
2010 +++ +++ +++
2011 +++ - +++
2015 +++ +++ +++
“+” Fairly Good Prediction, “++” Good Prediction, “+++” Extremely Good Prediction, and “-”Poor Prediction.
https://doi.org/10.1371/journal.pone.0209306.t010
Table 11. The error in prediction of BPD by MRM5 forecast model (ETAPOD).
Prediction Error (%) = (Y-Ŷ)2
Year Ekiti Ondo Osun
2009 13.7 222.0 1095.6
2010 10.9 475.2 566.4
2011 26.0 8046.1 404.0
2015 9.6 171.6 600.3
https://doi.org/10.1371/journal.pone.0209306.t011
Table 12. Determination of the accuracy level of the developed prediction model for BPD.
BPD Prediction Accuracy [100 - (/Y-Ŷ/)/Y x 100)]
Year Ekiti Ondo Osun
2009 93% 79% 0%
2010 95% 83% 0%
2011 93% 50% 71%
2015 95% 79% 56%
https://doi.org/10.1371/journal.pone.0209306.t012
ETAPOD: A forecast model for prediction of black pod disease outbreak
PLOS ONE | https://doi.org/10.1371/journal.pone.0209306 January 10, 2020 21 / 24
Conclusion
ETAPOD harnesses the potentials to improve the functionality of other existing manage-
ment strategies for the control of BPD in Nigeria by providing timely information on its
outbreak, detect areas under severe attack (AUSA), thereby discouraging fungicide misuse
among local cocoa farmers. ETAPOD is unique in the sense that its primary function is not
geographically restricted. Also, ETAPOD can be manipulated to provide optimum results
anywhere needed in Nigeria, Africa and all around the world. Its ability to provide qualita-
tive and quantitative description of BPD pressure makes it superior to other forms of BPD
control strategies in use. Therefore, ETAPOD is a pertinent tool that can effectively mini-
mize the prevalence of BPD in Nigeria with minimal chemical application, decreasing the
risk of chemical poisoning and increasing the production of healthy cocoa products nation-
wide. This is the surest and fastest way to ensure sustainability of cocoa production in Nige-
ria and the world at large.
Supporting information
S1 Fig. Hypothetical review of the effect of pathogen’s inoculum load on BPD develop-
ment.
(TIF)
S2 Fig. Theoretical establishment of the effect of rainfall on BPD development.
(TIF)
S3 Fig. A putative description of temperature effects on BPD development.
(TIF)
S4 Fig. Hypothetical representation of humidity and BPD development.
(TIF)
S5 Fig. A proposed relationship between sunlight duration and BPD development.
(TIF)
S6 Fig. A conjectural examination of the effects of wind speed on BPD development.
(TIF)
S7 Fig. A review of the effects of timing and how it affects BPD development.
(TIF)
S8 Fig. Atmospheric pressure and its correlation with BPD development.
(TIF)
S1 Dataset. Doctoral research data.
(XLSX)
Table 13. The probability of obtaining good BPD outbreak predictions from ETAPOD.
Year Ekiti Ondo Osun
Error Level Prob. Level Error Level Prob. Level Error Level Prob. Level
2009 0.07 0.93 0.21 0.79 1.00 0.00
2010 0.05 0.95 0.17 0.83 1.00 0.00
2011 0.07 0.93 0.50 0.50 0.29 0.71
2015 0.05 0.95 0.21 0.79 0.44 0.56
https://doi.org/10.1371/journal.pone.0209306.t013
ETAPOD: A forecast model for prediction of black pod disease outbreak
PLOS ONE | https://doi.org/10.1371/journal.pone.0209306 January 10, 2020 22 / 24
S2 Dataset. BPD data for model validation and optimization.
(XLSX)
Author Contributions
Conceptualization: Peter M. Etaware.
Data curation: Peter M. Etaware.
Formal analysis: Peter M. Etaware, Oyedeji I. Osowole.
Funding acquisition: Peter M. Etaware.
Investigation: Peter M. Etaware.
Methodology: Peter M. Etaware, Abiodun R. Adedeji.
Project administration: Peter M. Etaware.
Resources: Peter M. Etaware, Abiodun R. Adedeji.
Software: Peter M. Etaware.
Supervision: Adegboyega C. Odebode.
Validation: Peter M. Etaware, Oyedeji I. Osowole.
Visualization: Peter M. Etaware.
Writing – original draft: Peter M. Etaware.
Writing – review & editing: Peter M. Etaware.
References1. Agbeniyi S.O. and Oni M.O. 2014. Field evaluation of copper based fungicides to control Phytophthora
pod rot of cocoa in Nigeria, International Journal of Development and Sustainability 3(2): 388–392
2. Adegbola, M.O.K. 1972. Cocoa diseases of West Africa, 7th International Cocoa Research Conference,
Douala, Cameroon pg179-184
3. Oluyole K. A. and Lawal J. O. 2008. Determinants of the occurrence of black pod disease of cocoa in
Edo state, Nigeria: a multivariate probit analysis approach, Economics and Statistics Division, Cocoa
Research Institute of Nigeria, Ibadan Nigeria, Journal of innovative development strategy, 2(2): 1–4
4. Oduwole, O. O. 2001. Sustainable cocoa production in Nigeria: Farmers perception of technology char-
acteristics and socio-economic factors in adoption decision making. Proceedings from the 13th Interna-
tional Cocoa Research Conference, Cocoa Research Institute of Nigeria. pp. 1147–1152.
5. Taylor M. N. 2000. Review of Cocoa Production, Consumption, Stocks and Prices- 2, Cocoa Growers
Bulletin. (52): 1–58
6. International Cocoa Organization [ICCO] 2005. World Cocoa production 2005. http://www.icco.org
accessed on the 16th January, 2017 at 14:43GMT.
7. Evans H. C. 2007. Cacao diseases- The trilogy revisited. Journal of Phytopathology 97:1640–1643.
8. Anonymous 1995. Pest and disease: In Report on recent decline in cocoa production in Ghana and
measures to revamp the industry, Report commissioned by the Office of the President of
Ghana, pp. 43–44.
9. Agbeniyi S. O. and Adedeji A.R. 2003. Current Status of Black pod Epidemics in Nigeria, In Proceedings
of 14th International Cocoa Research Conference, pp. 1377–1380.
10. Lawal J.O. and Emaku L.A. 2007. Evaluation of the effect of climatic changes on cocoa production in
Nigeria: Cocoa Research Institute of Nigeria (CRIN) as a case study. African Crop Science Conference
Proceedings (8): 423–426.
11. Oyekale A. S. 2012. Impact of climate change on cocoa agriculture and technical efficiency of cocoa
farmers in South-west Nigeria. Journal of Hum. Ecology, 40(2): 143–148.
ETAPOD: A forecast model for prediction of black pod disease outbreak
PLOS ONE | https://doi.org/10.1371/journal.pone.0209306 January 10, 2020 23 / 24
12. Oyekale A. S. 2015. Climate change induced occupational stress and reported morbidity among cocoa
farmers in Southwestern Nigeria. Annals of agriculture and environmental medicine. 22(2): 357–361.
13. Simon G. 2003. Multiple regression basics. New York University press, Stern school of Business, New
York pp18–58
14. Akrofi A.Y. 2015. Phytophthora megakarya: a review on its status as a pathogen on cacao in West
Africa, African Crop Science Journal 23(1): 1–67
15. Luo, W. 2008. Spatial/Temporal modeling of crop disease data using high-dimensional regression, Ph.
D. Thesis submitted to the Department of Statistics, University of Leads, 223pg.
ETAPOD: A forecast model for prediction of black pod disease outbreak
PLOS ONE | https://doi.org/10.1371/journal.pone.0209306 January 10, 2020 24 / 24