A. f, I! WATSON - International Joint Commission
319
-
Upload
khangminh22 -
Category
Documents
-
view
2 -
download
0
Transcript of A. f, I! WATSON - International Joint Commission


1977
Editors: H. SHEAR - A . f , I! WATSON

The statements and views presented in these proceedings are
those of the authors and of the workshop participants, and do not
necessarily represent the views or policies of the International Joint
Commission, Research Advisory Board and Pollution from Land Use
Activities Reference Group. Mention of trade names or commercial
products does not constitute endorsement or recommendation for use.
ii

PAGE
1.
2.
3 .
k E S OF S E D I M U s r
Material (Geomorphic Control, Magnitude and Frequency of Natural Sheet and Channel Erosion of Unconsolidated Source
Transfer Mechanisms)
D. E. Walling University of Exeter UNITED KINGDOH
Influence of Land Use on Erosion and Transfer Process of Sediment
T. Dickinson and G. Wall
GUELPH. Ontario University of Guelph
Anthropogenic Influences of Sediment Quality at a Source
a) Pesticides and PCB's
R. Miles Agriculture Canada LONM)N, Ontatio
1
5
11
37
69
R. Frank Ontario Ministry of Agriculture 6 Food GUELPH, Ontario
b) Nutrients: Carbon, Nitrogen and Phosphorus
M. Miller University of Guelph GUELPH, Ontario
c) Metals
81
95
G. K. Rutherford Queen's University KINGSTON, Ontario

4 . Regional Overview of the Impact of Land Use on Water Quality 105
A. D . McElroy Mdwest Research Institute KANSAS CITY, Mo.
CHAPTER 2 TRANSFURT OF SEDIMENT
1. Influence of Flow Characteristics on Sediment Transport with Emphasis on Grain Size and Mineralogy
J. Culbertson U.S. Geological Survey RESTON, Va.
2 . Sediment Storage and Remobilization Characteristics of Watersheds
J . Knox
MADISON, Wisconstn University of Wisconsin
C. Nordin U . S . Geological Survey LAKEWOOD. Colorado
117
137
151
3. Forms and Sediment Associations of Nutrients (C.N. and P. ) Pesticides and Metals
a) Nutrients - P 157
H. L. Golterman
NETHERLANDS Limnologisch Instituut
T. Cahill
WEST CHESTER, Pennsylvania Resource Management Associates
b) Nutrients - N 181
T. Logan Ohio State University COLUMBUS. Ohio
c) Pesticides 199
H . B. Pionke U.S. Department of Agriculture Agricultural Research Service UNIVERSITY PARK, Pennsylvania
iv

d) Trace Metals
PAGE
219
Ulrich F6rstner University of Heidelberg
4 . Geochemistry of Sediment/Water Interactions of Nutrients, Pesticides and Metals, Including Observations on Availability
a) Nutrients
b) Pesticides
c) Metals
D. R. Bouldin Cornel1 University ITHACA, New York
J. B. Weber North Carolina State University RALEIGH, North Carolina
Energy Mines and Resources I. Jonasson
OTTAWA, Ontario
IWLICATIONS FOR TI-E GREAT LAKES
J. R. Vallentyne
OTTAWA, Ontario Environment Canada
G. H. DUKY University of Wisconsin MADISON, Wisconsin
1. Physical Processes
2. Nutrients
235
245
255
275
279
285
291
V

PAGE
3 . Pesticides
4 . Metals
G w r E R 5
~ K S H O P ORGANIZERS AND AITNDEES
293
295
299
vi

In April 1972 the United States and Canada signed the Great Lakes Water Quality Agreement. The responsibility for the implementation of this Agreement was assigned to the International Joint Commission. The International Joint Commission was established pursuant to the Boundary Waters Treaty of 1909. Its operating concept assumes that solutions to boundary waters problems should be sought by joint deliberations of a permanent tribunal of three Canadians and three Americans.
Under the terms of the Agreement a Research Advisory Board was established to advise the International Joint Commission on a continuing basis on matters relating to ongoing research and research needs related t o Great Lakes Water Quality. Another group, with a defined lifespan of five years was also established - the International Reference Group on Great Lakes Pollution from Land Use Activities (PLUARG). The PLUARG was charged with answering the following questions:
being polluted by land drainage (including ground and (1) Are the boundary waters of the Great Lakes System
surface runoff and sediments) from agriculture, forestry, urban and industrial land development, recreational and park land development, utility and transportation systems and natural sources?
affirmative, to what extent, by what causes, and in what ( 2 ) If the answer to the foregoing question is in the
localities is the pollution taking place?
(3 ) If the Commission should find that pollution of the
measures would, in its judgement, be most practicable and character just referred to is taking place, what remedial
what would be the probable cost thereof?
programs and control measures, and the need for improvements thereto, relating to:
The Commission is requested to consider the adequacy of existing
(a) inputs of nutrients, pest control products, sediments, and other pollutants from the sources referred to above;
(b) land use;
(c) land fills, land dumping, and deep well disposal practices;
1

(d) confined livestock feeding operations and other animal husbandry operations; and
(e) pollution from other agricultural, forestry and land use sources.
In carrying out its study the Commission should identify deficiencies in technology and recommend actions for their correction.
The PLUARG, in its Study Plan of 1974 established a series of pilot watershed studies and other special land use studies in the United States and Canada to assess the impact of land use on water quality as related to river loadings to the Great Lakes. It was recognized that a variety of nutrients and contaminants are transported both by mineral and organic sediment. A better understanding of sediment-associated nutrient and contaminant transport in streams in time and space was needed to assess their impact on the Great Lakes.
The PLUARG therefore referred this matter to the Research Advisory Board as the IJC's principal advisor on Great Lakes research. An evaluation was requested of the state-of-the-art of this topic together with recommendations
synthesize current research and to identify research needs on nutrient and for further research. The Board in turn decided to sponsor this workshop to
contaminant transport by sediment within fluvial systems. Clarification was sought on the interrelationships of source, in-channel storage, resuspension and transport mechanisms with long-term, seasonal and single-event flows, and including an examination of the interaction of sediment and water chemistry on key nutrients and contaminants.
The Research Advisory Board anticipated positive recommendations
research that has been done can be put to use to solve Great Lakes water from this workshop not only in terms of research needed, but of how the
quality problems. These recommendations moreover, would be sufficiently succinct for clear-cut decisions by the Commission to advise appropriate Governmental action.
It is intended that the recommendations in these proceedings will have an immediate effect on PLUARG studies and a longer term influence on the Great Lakes research community.
Dr. Harvey Shear Dr. Andrew E. P. Watson
International Joint Commissio Great Lakes Regional Office 100 Ouellette Avenue WINDSOR, Ontario
2


For the C i t y o f Kitchener: Mrs. Edith MacIntosh
Mayor o f Kitchener
bring greetings on behalf of Kitchener to all of you who are involved, interested and concerned in this workshop on pollution from land use act- ivities. I was looking over your program and I note that your purpose, and I am quoting, "is to synthesize current research and to identify research needs on nutrient and contaminant transport by sediment within fluvial systems". Further, you will be "clarifying the interrelationships of source, in-channel storage, resuspension and transport mechanisms with long term, seasonal and single-event flows, including an examination of the interaction of sediment and water chemistry on key nutrients and contaminants". I looked at that and I wondered what it all meant. Well, to me it meant, that, for instance, ten years ago at our cottage on the Bruce Penninsula, I could walk down to the shoreline, dip a pail into the water and take a drink. Today I can't do that. My hope is that with your expertise it will be possible in the not too distant future to drink Georgian Bay water again.
Good Morning. It is my pleasure to welcome you here today. I
I brought with me our latest report on the bacterial examination of drinking water and as I mentioned, ten years ago we could drink the water. Whenever we had it tested it came back A number 1. Today, it has a very high coliform bacteria count. It is rather disturbing.
During my term as National President of the Consumer's Association of Canada, the soap bubble conditions in the Great Lakes area was a major
cooperation with the International Joint Commission. I have been told that issue. Canadian consumers fought for the ban on phosphorus in detergents in
this is still a problem. I understand that the Grand River watershed is one of the three major Canadian watersheds selected for intensive study under the PLUARG program. You, as invited experts, will be seeing first hand I hope, the work being done in the Grand. You may be wondering why I was carting around these two huge volumes. Here are 700 pages of the very latest information just tabled this week on what is being done in the Grand River Basin.
Mr. Chairman, delegates, I would like t o issue a very warm welcome to all of you. I know you have come from different countries and from across the province and from other provinces. I hope you have a very success- ful workshop here and we are glad you chose Kitchener. Again, welcome to everyone.
5

For PLUARG Dr. R. L. Thorns
Director Great Lakes Biolimnology Laboratory
Department of Fisheries and the Environment
Canada Centre fo r Inland Waters Fisheries and Marine Service
Bur Zington, Ontario
this meeting, have recently returned from a symposium in Amsterdam on the interaction of sediment and fresh water. The organizer was Dr. Golterman who is going to talk to us later in this workshop on nutrients. The sym- posium was a significant event in limnological studies because it emphasized the fact that the role of sediments in the lacustrine environment is now starting to come to the fore. It is very gratifying to me personally and to many of us engaged on sediment studies at the Canada Centre for Inland Waters. The role and the significance of sediments is thus becoming very apparent, particularly with regard to toxic trace metals and persistent organic contaminants that are becoming all too apparent in our environment.
Thank you very much MKS. MacIntosh. A number of us present at
The PLUARG which is charged with an assessment of the impact on the boundary waters of the Great Lakes of pollutants from diffuse sources, designed its programs to incorporate a significant number of sediment oriented studies. These studies are now in progress. Close to two years ago we decided to hold this workshop in order to bring together many of the internationally known experts in the field of fluvial sediment. We wanted to assure ourselves that the work we were doing was correct. We wanted an opportunity to discuss OUT problems; to assist in the interpretation of our data, and, if the experts have come up with new knowledge or techniques we want to know, so that we may, even at this stage, make modifications to OUK programs. Consequently, I feel that this is a highly significant workshop; to the reference group, to the International Joint Commission and to us participants and wish it every success in achieving its object- ives.
6

For the Research Advisory Board Dr. A. R. LeFeuvre
Director Canada Centre fo r Inland Waters
BurZington, k t a r i o
this important workshop. As the Canadian chairman of the Research Advisory Board, I am very happy that we are able to lend our support and sponsorship to this workshop.
I am very happy to be with you this morning at the beginning of
I think that it is very timely, as Dr. Thomas has pointed out. The topic of the workshop is very important to our understanding of the several mechanisms that are at work in bringing pollutants and nutrients from the diffuse sources on the watershed into the river systems and then eventually into the boundary waters of the Great Lakes. This, of course,
provided for under the Canada-U.S. Water Quality Agreement. The Research is why it is a reference under the International Joint Commission and
Advisory Board, as you may know, is that part of the structure established under the Canada-U.S. Water Quality Agreement which has the responsibility for advising the Governments through the Commission on the needed research, and those research areas which could profitably be accomplished by joint effort, and provide this advice to the Governments in the form of annual reports and special reports.
At our most recent reporting experience which was last July, the Research Advisory Board tabled a report on Research Needs. This was the compilation of identified research needs with priorities that identified f o r the Governments and their agencies those areas that required additional research effort and those areas which were of priority interest. All the workshops that are sponsored by the Research Advisory Board have as one of their objectives the identification of research needs. We hope that in your deliberations over the next several days you will be able to de- lineate and identify more precisely some of the continuing research needs in this important area. I think that we all realize that while we have learned a considerable amount about the processes involved, a great deal is still to be learned in this important area. We certainly encourage you to give conscious thought to the need for additional research as well as to the results of research that has already been undertaken.
Please be conscious of the advice, guidance and recommendations that can come to the final report of PLUARG because of your deliberation here. You have a two fold task: one is to assist PLUARG in developing its recommendations with regard to pollution coming from land use activities.

It is important that you keep this in mind as a very positive and immediate output from your deliberations. The other point to consider is the ident- ification of research needs that still exist and that may be addressed both through government research agencies and through university research.
We are certainly very pleased to bring these words to you this morning and hope that in your deliberations you will have a very successful workshop in this important area, and we wish you the best of luck in your deliberations this morning and the days to follow.

BHiJFVEKl Q SOURCES OF SEDIMENT


Natural Sheet and Channel Erosion of Unconsolidated Source Material (Geomorophic Control, Magnitude and Frequency of
Transfer Mechanisms)
D. E. Walting
INTRODUCTION
This brief discussion of erosion processes and the origins, sources and delivery characteristics of sediment within the fluvial system aims to provide an introductory background to some of the questions assoc- iated with a discussion of sediment-associated contaminants and nutrients. It is concerned essentially with suspended sediment and more particularly the wash load portion of total sediment load, because fine grained sediment is in general the most chemically active. Consideration of the topic can be usefully structured under four headings: first, the general geomor- phological context; secondly, the process mechanisms involved; thirdly, the integration of these processes into the watershed and the spatial character- istics of catchment response, and lastly, the resultant in terms of the temporal pattern of sediment delivery from a watershed.
THE GENERAL GEWCRPKILOGICAL CONTEXT
The magnitude of sediment flux within the fluvial system must reflect the general intensity of the denudation processes and in this respect it is useful to briefly consider the global pattern. Over the past
by the International Hydrological Decade (1965-74), measurements of the twenty or more years, and particularly as a result of the impetus provided
sediment yield of rivers in many parts of the world have become available.' Analysis of this information can provide an insight into the range of values exhibited at the world level and some indication of dominant con- trolling factors. The classic work by Langbein and Schumm,3 based on
be established between annual precipitation and sediment yield and that the rivers in the United States, suggests that a global-scale relationship can
form of the relationship can be accounted for in terms of the opposing influences of vegetation cover and precipitation energy (Figure 1). Maximum yields correspond to an optimum combination of these influences at a mean annual precipitation of 300 nun. A similar pattern was found by Douglas4 in an evaluation of the relationship between sediment yield and annual runoff at the global level, although the inclusion of information from tropical
runoff (Figure 1). These curves are inevitably very generalised as they areas demonstrated a tendency for yields to increase again in areas of high
take little or no account of relief, the environmental energy and other physiographic factors. Attempts have also been made to define the controls according to major vegetation types' and to develop multivariate equations.6
might expect sediment yields in the Great Lakes region to be relatively low and to amount to approximately 100 tonnesfkm'. This conforms to a
In so far as it is possible to apply these general curves, we
11

Y L L
N' 800- A F -rc 3
9 - / \ Q I \ ~400- / \
- 600-
\
0 5 0 0 lo00 1500 2000 E f f e c t i v e P r e c i p i t a t i o n ( m m )
Y L L
ry'
F B
* 150-
L
9 - 1 0 0 -
c - E
i! 50- $ - @ 0 1 I
0 I r 1 I
400 800 M e a n A n n u a l R u n o f f ( m m ) 12
Figure 1.
precipitation and runoff proposed by Langbein and Schum (1958) General global relationships between sediment yield and annual
and Douglas (1967).
12

recent Canadian survey7 which suggests that levels of 20-100 tonnes/km2 are characteristic of this area. The same survey provides an average value of mean suspended sediment concentration of 50-200 mg/l. (Figure 2). A U.S. Geological Survey compilation’ depicts the area of the United States trib- utary to the Great Lakes as exhibiting mean concentrations of less than 300 mg/l (Figure 2) which, for an annual runoff of 300 mm corresponds to sediment yields of less than 90 tonnes/km2. In the geomorphological context, it can be inferred that the area under discussion is characterized by some- what subdued erosion processes. Furthermore, it should be stressed that in such an area it will not always be immediately obvious precisely what processes are involved, and where the dominant sources of sediment are located. Generalized figure; on stream loads inevitably conceal consider- able variations in sediment yield in both space and time and in order to appreciate these more fully, the processes involved must be discussed.
EROSION F’ROCESSES
In considering the processes involved in sediment detachment and entrainment, a useful distinction can be made between two major sediment sources, namely, the land surface and the channel system. The first reflects the action of rainsplash and surface runoff, often termed sheet erosion, and includes the development of rills where surface flow becomes concentrated. The second reflects the erosive power of concentrated channel flow and includes streambank scour, streambed degradation, and floodplain scour. Gully erosion is to some extent a link between the two in that it could be viewed as a development of sheet and rill erosion or a headward extension of channel erosion.
Much work on sheet erosion has been carried out by agricultural engineers concerned with soil erosion and the influence of various cult- ivation practices and conservation measures, and the erosion plot and laboratory sprinkler have become well-used research tools. A distinction can usefully be made between the four major contributing processes, namely, splash detachment, splash transport, runoff detachment and runoff trans- port. Many empirical and theoretical relationshi s have been developed for total soil loss’ and for the component processes,Po based on rainfall and flow properties, topography and soil character (Tables 1 and 2) . Soil erodibility has been related to various physical and chemical properties” and factors such as the particle size characteristics, structure, permea-
must be taken into account. bility, organic matter content, dispersion and cation exchange capacity
The Universal Soil Loss Equation” (U.S.L.E.) developed by the United States Department of Agriculture from over 10,000 plot years of records has been widely applied in many environments and its form provides a summary of the major controls on sheet erosion (Table 1). However, it should be recognized that the equation was developed from data collected from small plots and soil l o s s from a plot cannot necessarily be equated with sediment yield from a drainage basin. If sheet erosion or soil loss is to be estimated for individual events, rather than on a seasonal basis, detailed consideration of temporal variation in sediment availability both during storms and between events is required.’ Erodibility measures should then be thought of a s dynamic rather than static indices and removal
13

14

TABLE I
Some examples of e q u a t i o n s d e s c r i b i n g t h e S h e e t E r o s i o n P r o c e s s . 47
S t = x 1.73
s cs' s p - Ls . '30
. t a n 1 .35 B Kirkby (1969)
A = E 1 .35 0.35 1'75 Musgrave (1947)
THE UNIVERSAL SOIL LOSS EQUATION (U.S.L.E.)
E = R.K.L.S.C.P.
DEVELDPMENTS OF THE U.S.L.E.
b G = a ( Q . q K.L.S.C.P. P
*r
A = (aA
Where:
S t =
x =
B =
A =
E = S
cs =
Ls = s =
P
P - 30 -
E =
R =
+ bcQ. qp' ) K.L.S.C.P.
S o i l t r a n s p o r t
S l o p e l e n g t h
S l o p e g r a d i e n t
S o i l l o s s
S o i l e r o d i b i l i t y f a c t o r
S o i l c o v e r f a c t o r
S l o p e ( p e r c e n t )
S l o p e l e n g t h
2 y e a r 30 m i n u t e r a i n f a l l
S o i l l o s s
R a i n f a l l f a c t o r
Wischmeier and Smith (1965)
Williams (1975)
F o s t e r e t a 1 ( 1 9 7 3 )
K =
L =
s = c = P =
G =
Q = qp = Ar =
A =
a , b =
c = c o e f f i c i e n t
S o i l e r o d i b i l i t y f a c t o r
S l o p e l e n g t h f a c t o r
S l o p e s t e e p n e s s f a c t o r
Cropping fac tor
Conse rva t ion f ac to r
Sediment y ie ld
Runoff volume
Peak f low ra te
Dra inage a rea
S o i l l o s s
Weight ing parameters
15

TABLE 2
Some examples of equations describing various components of the Sheet Erosion Process.4g
RAINFALL DETACHMENT
Dr = Sdr. Ai. 1 Meyer & Wischmeier (1969)
Id = C.COs S (CosS.P2 - C,.d.P) Fleming & Fahmy (1973)
S S = f(KE. M . Vt )
2
2 Negev ( 1967)
RUNOFF DETACHMENT
Df = Sdf . Ai (SQ. Q p ) Rd = K. X.y.S
Meyer & Wischmeier (1969)
Fleming & Fahmy (1973)
TRANSPORT CAPACITY OF RAINFALL
T = St,. S I Meyer & Wischmeier (1969)
It = T.P.Tan S Fleming & Fahmy (1973)
TRANSWRT CAPACITY OF RUNOFF
Meyer & Wischmeier (1969)
Bennett (1974)
INTERRILL TRANSPORT CAPACITY
T , = C . (Si + C ) W. L. (‘2.1) Cl s1 so Foster & Meyer (1975)
Where: Dr =
‘dr = Ai =
I =
I =
c = s = P =
d
c1 =
d =
ss =
I C E =
Soil detached by rainfall
Soil effect factor
Area of increment
Rainfall intensity
Soil detachment rate
Soil type parameter
Angle of slope
Rainfall intensity
Soil parameter
Particle size
Soil splash
Kinetic energy
K =
8 = Y =
Tr =
‘tr = It = T =
T - f -
s = tf
Tc = so = T . = Cl
Soil parameter
Fluid specific gravity
Flow depth
Splash transport capacity
Soil effect constant
Impact transport rate
Parameter
Runoff transport capacity
Soil effect constant
Flow transport capacity
Local bed slope
Interrill transport capaci’
M = RaindroD mass C . = Soil tranSDOrtabilitv co- .~ si Vt = Terminal velocity of raindrops Si = Interrill slope steepness
efficient
Df = Soil detached by runoff Cso = Transport capacity at zero
Sdf = Soil effect constant
Q = Flow rate L = Interrill slope length
Rd = Rate of soil detachment
U = Excess rainfall rate slope
i c = constant
16

of accumulated loose material must be distinguished from the inherent erodibility of the soil. Scope exists for replacement of the rainfall term in the U.S.L.E. with a runoff parameter,14 (Table 1) and research could be directed at providing an index of snowmelt runoff, in order to make the approach more applicable to spring melt conditions.” Results from erosion plots at Sherbrooke, Quebec,I6 Sandusky, Ohio,” and Guelph,” have referred to annual soil loss rates equivalent to up to 126, 280 and nearly 4,000 tonnes/km2 respectively and demonstrate that these processes could be a significant sediment source in this region.
Little attention is usually attached to subsurface erosion pro- cesses in terms of land surface sediment sources, but it should be recognized that water flow within the soil may carry clay particles and colloidal material. In this context it is difficult t o distinguish between suspended and dissolved transport. PipingIg may also develop at horizons in the soil where throughflow is concentrated and where significant hydraulic gradients exist and this mechanism is doubtless significant for sediment removal, although little work has as yet been carried out on its relative importance.
In contrast to sheet erosion, much less attention, both in terms of experimental measurement and theoretical analysis has been applied to processes of channel erosion and many of the mechanisms are poorly under- stood, Where channels are cut in non-cohesive materials, scour will occur along a reach if the transport capacity of the flow is not satisfied and equilibrium transport relationships and regime theory” could be employed to evaluate the extent of erosion. Several studies have focused on the factors influencing the erosion resistance of cohesive materials and the effect of moisture content” but there is considerable scope €or appli- cation t o the field situation. A pioneering field investigation by Wolman in 1959,” pointed t o various mechanisms of bank erosion. He found severe erosion in winter months when high flows attacked banks that were previously wet and he noted significant erosion from combinations of cold periods, wet hanks, frost action and rises in stage, and that freeze-thaw action also
pointed to the importance of pre-conditioning of the banks, particularly by produced some erosion without a change of stage. Subsequent work has
wetting, hcfore significant erosion occurs‘ and Carson &.” have developed a model of bank sediment entrainment for the spring flood in the Eaton Basin, Quebec. This is based on simulation of changes in bank erod- ibility, with sediment entrainment decreasing with increased duration of flow past a point and the rate of initial entrainment closely related to the time elapsed since that point was last submerged.
Gul ly development is generally associated with an imbalance in the fluvial system such as occurs with a severe climatic event, improper land use o r changes in base level. Their growth combines the action of concentrated surface water, alternate freeze-thaw of exposed banks and sides and sloughing due to undercutting and waterfall retreat. Several empirical studies of factors influencing gully growth have been carried out2* but in general the precise mechanics of gully development are poorly understood.
THE WATERSHED RESPONSE TO EROSION PROCESSES
the processes outlined above must be integrated into the catchment and In order t o understand the sediment yield of a drainage basin,
17

evaluated in terms of the overall drainage basin dynamics and hydrology. Not all the sediment eroded from a watershed will be transported out of the basin and the ratio of gross or total erosion (T) to sediment yield (Y) is
generally referred to as the delivery ratio (D), i.e. D = 7, which is usually expressed as a percentage. The delivery ratio may vary from in excess of 90% to approaching zero and in a relatively homogeneous catchment it will tend to decrease with increasing basin area. Several workers have established quantitative relationshi s between the ratio and drainage area and other catchment characteristics,P6 and a generalized relationship between delivery ratio and catchment area based on such work is presented in Figure 3. Considerations of channel routing and in-channel and flood plain deposition and storage are involved in this characteristic of sediment delivery but little attention has been given to the precise process mech- anisms involved.
Y
The relative efficacy of the various erosion processes in con- tributing to the sediment yield is also best evaluated at the basin level. Sheet erosion has primarily been studied on plots of bare or poorly veg- etated soil, often under intense artificial rainfall, and the question of its importance under natural conditions in humid areas is closely related to discussion of the extent to which overland flow is a significant process in storm hydrograph production*’ and the relative importance of throughflow and surface runoff. Kirkby” demonstrated that rainfall intensities rarely exceed natural infiltration capacities in humid areas with good vegetation cover and suggested that throughflow is an important mechanism in storm hydrograph generation, with surface runoff only occurring from saturated areas near the slope base. The concept of widespread overland flow, result- ing from rainfall intensity exceeding infiltration capacity, popularized by Horton” belongs essentially to semi-arid areas.
Furthermore, the partial-area and variable source area models of storm runoff production, which have gained wide acceptance in recent years, 3 0 have very important implications for sediment source areas. If surface runoff is generated from a small portion of the basin close to the channel network, the area of the watershed significant for sediment yield will be limited to this contributing area, (Figure 4 ) . The stream network must also be viewed as a dynamic element of the drainage basin and will in many cases expand and contract in response to variations in catchment moisture status and storm magnitude. 3 1 Acceptance of the dynamic character of both material erodibility and of the contributing area and drainage networks within a catchment necessarily means that sediment entrainment is very time-variant.
The question of the precise sources of the sediment transported from a drainage basin is one that still requires detailed research. When a
overland flow, it is attractive to ascribe the dominant source to the good vegetation cover is present and in the absence of direct evidence of
channel system. Work by Kirkby3’ in an upland catchment in Scotland suggested that 93% of the sediment came from erosion of river bluffs and the study by Carson &. 3 3 of the Eaton Basin in the Quebec Appalachians concluded that the suspended sediment load originated primarily from scour of the banks of the channel network. However, calculation of sediment budgets can indicate that the rate of channel enlargement is totally in-
yield and alternative sources must be sought. Study of the clay mineralogy adequate to account for the volume of sediment represented by the sediment
18

I- W
. Based on:
\ Roehl (1 962) Maner ( 1 958) Gottschalk and Brune (1950) 2 1 0 0 -
2 Maner and Barnes (1 953)
E t 50-
a
F 5- $
20-
*r, 10- t
@ 2-
1 0.0 1 0-05 0.1 0.5 1.0 5 10 50 100 500 1000
1 1 I I I I 1 I I
Drainage Area (Square miles) Figure 3 . A general ized relat ionship between drainage area and sediment
de l ivery ra t io based on the f indings of severa l U . S . workers.

N 0
2 Year Return Period 10 Year Return Period
area
Figure 4 . A hypothetical example of the variation of the storm runoff contributing area and the stream network within a catchment for flood events of different magnitude.

of sediments may provide information on source areas. " Techniques of 'chemical fingerprinting' may also help to provide an answer and it is noteworthy that the increased attention recently being paid to the chemical quality of sediment may indirectly provide valuable evidence as t o sediment sources.
Despite some debate as to precise processes and source areas involved in sediment yield and their relation to storm runoff dynamics, several studies have successfully related catchment sediment yields to hydrometeorological variables, both on an annual and on a storm-period basis, 3 5 and to land use and other catchment characteristics. 3 6 Soil loss equations can also be adapted for catchment use if a routing algorithm is introduced. 3 7 Some researchers have, however, noted differences in the
ment size,3R with yields from plots and small catchments reflecting the pattern of response to hydrometeorological conditions according to catch-
seasonal distribution of rainfall energy and those from large catchments reflecting the runoff regime. Explanation of such contrasts must be sought in considerations of sediment routing, delivery ratios, and the
has also been made in the field of computer simulation of erosion and partial-area concept. Following from the early work of Nege~,'~ progress
sediment yields at the catchment level," although the dependence on existing runoff models and the use of optimized parameters can call to question the extent to which such models represent reality. Some attempts have been made to develop more deterministic models for individual hill- slopes and small catchments," but progress must be limited until o u r knowledge of sediment processes and source areas improves and allows more realistic conceptual models to be formulated.
TEMPORAL PATTERNS OF SEDIMENT I ~ L I V E R Y
Temporal and spatial integration of the processes of erosion and sediment yield within a drainage basin result in a complex pattern of variation in sediment yield at the catchment outlet. A knowledge of the magnitude and timing of sediment concentration and loads is essential if the problems of sediment-associated contaminants and nutrients are to be evaluated. Sediment discharge (S) / streamflow ( (1) o r sediment concen- tration ( C ) / streamflow ( Q ) relationships or rating curves have been used by many workers to characterize the general range of variation of sediment transport rates and to demonstrate the tendency for increased concentrations or loads to be assoc'ated with high flows. In general a relationship of the form S or C = aQ' can be established (Figure 5). The close dependence of sediment concentration on discharge should not be viewed as indicative of a transport capacity effect, because the wash load is essentially a non- capacity load, but rather that the erosion processes causing sediment entrainment generally operate most effectively during periods of high flow. In most cases, considerable scatter about the simple rating relationship is apparent and this can be related to seasonal and hysteretic effects, the detailed timing of the concentration graph relative to the flow hydrograph, and an exhaustion effect operating both during a single event and through a series of events. '* An example from a British catchment of some of these controls and in particular the exhaustion effect is presented in Figure 6 . Several researchers have suggested that the slope (b) and intercept (a) values of a rating relationship can be used to infer source areas and the general sediment dynamics of a catchment. 4 3
21

\ 1 i
9,
E
000
Dai ly Mean D ischarge ( c f s ) - - - . - - -
2 2

W N
Figure 6. Variation of suspended sediment concentration during a series of storm runoff events on the River Dart, Devon, England ( 4 6 km’). This clearly demonstrates the complexity of the relationship between concentration and discharge.

The seasonal distribution of yield from a catchment will reflect the interaction of precipitation and flow regimes and sediment availability. In the Great Lakes region the seasonal yield pattern is dominated by the period of the spring melt, (Figure 7 ) and Dickinson &.'4 calculated that about 55% of the sediment load of rivers in southern Ontario is carried during March and April. Duration o r frequency analysis can also be use- fully employed to demonstrate that a large proportion of the sediment load of a river is carried during a short period of time. In small catchments in East Devon, England, for example, approximately 78 percent of the annual suspended sediment load was carried by flows which equalled or exceeded 1% of the time or within an overall duration equivalent to 3 . 5 days. Similar analysis for several rivers tributary to the Great Lakes is presented in Figure 8 . In the case of the Cass River, Michigan, approximately 80 percent of the load was carried in 5 percent of the year. If the data available are sufficiently detailed, analysis can be extended to individual storms in order to evaluate the relative importance of storms of varying magnitude in sediment production. ' I 5 Long periods of record will also enable relative importance of extreme events to be assessed and anlysis of the significance of events of varying return period could be usefully combined with an assess- ment of the extent and character of the associated contributing areas and of thresholds in hydrologic response. Techniques of measuring suspended sediment concentrations and loads are now well documented46 but careful evaluation of patterns of temporal variation in sediment transport is nec- essary if sampling programmes are to provide reliable estimates of sediment yield.
of the purposes involved and on the subjective views of the writer. In the Any statement of research needs depends closely on the perception
opinion of this writer, who is concerned with the geomorphological and hydro-
and sediment yields should be focused on the drainage basin as a unit of logical background, future research on erosion processes, sediment sources
study. Since the suspended load of a stream is primarily a non-capacity load, attention should be directed towards sediment sources and entrainment processes within the basin rather than channel transport hydraulics. Detailed evaluation of the erosion processes operating on a slope or a small plot may be of limited value if the eroded material does not enter a stream. The fate of the sediment as it is routed down the channel network remains another large area of uncertainty but this is outside the scope of this discussion.
Worthwhile areas of study could include:
1) In terms of process dynamics, detailed investigation of the mechanisms and significance of sediment entrainment by subsurface runoff and of bank erosion is required. Plot and reach studies will be necessary but the results should be integrated within the overall watershed response.
2 ) Development of sediment budgets in order to demonstrate the relative importance of various processes.
2 4

RIVER CASS (2196 km2) 1966-70
C 4 30
4 0 1 BIG CREEK (591 km2)
1967-73 a < 30 20
x
$ 5 10 s P O
Figure 7. The average annual distribution of monthly sediment loads for several rivers draining to the Great Lakes.
25

/ /
/ /
/ /
/
/ /
/ /
/ /
/ /
/ /
/ /
I 1 I I I I I 1 I 1 I 1 I 1 0.1 0.2 0 . 5 1 2 5 10 20 30 40 50 60 70 8C
C u m u l a t i v e P e r c e n t a g e o f T i m e
Figure 8. Duration characteristics of sediment yield from four catchments draining to the Great Lakes. Data from two other U . S . rivers are also included f o r comparative purposes.
26

3) Delimitation of major source areas in order to evaluate the spatially distributed nature of erosion processes.
4) Integration of source and budget studies with realistic concepts of storm runoff production, particularly the partial-area and variable source area concepts.
5) Detailed monitoring of individual storm runoff events in order that the spatial and temporal integration of sediment dynamics can be understood.
6) Development of physically-based models of erosion and sediment yield as a long term objective.
LITERATURE CITED
follow.
1.
2.
3.
4.
5.
6 .
7.
8.
References to elaborate points raised in the preceding discussion (Numbers refer to numbers in parentheses in the text)
Task Committee on Preparation of Sedimentation Manual (1962). Sediment Transportation Mechanics: Introduction and Properties of Sediment, Proc. A.S.C.E. J. Hyd. Div. E, HY4, 77-107. For example: U.N.E.S.C.O., (1974). Gross Sediment Transport to the Oceans, U.N.E.S.C.O. Sc. 74lWSl33.
Holeman, J. N., (1968). The Sediment Yield of Major Rivers of the World, Water Resources Research, 4, 737-47. Langbein. W. B. and Schumm, S. A . , (1958). Yield of Sediment in Relation to Mean Annual Precipitation, Trans. Amer. Geophys. Union, - 39, 1076-84.
See also Wilson, L., (1973). Variations in Mean Annual Sediment Yield as a Function of Mean Annual. Precipitation, Amer. J. Sci. 273, 335-349.
Douglas, I., (1967). Man, Vegetation and the Sediment Yield of Rivers, Nature, 215, 925-8.
Fleming, G., (1969). Design Curves for Suspended Load Estimation, Proc. Inst. Civ. Em., 9, 1-9.
Jansen, J. M. L. and Painter, R. B., (1974). Predicting Sediment Yield from Climate and Topography, J. Hydrol. 11, 371-80.
Stichling, W.. (1973). Sediment Loads in Canadian Rivers, in Fluvial Processes and Sedimentation, Proc. 9th Hydrology Symposium, Edmonton. Alberta, National Research Council, 39-72.
Rainwater, F. H., (1962). Stream Composition in the Conterminous United States, U.S.G.S. Hydr. Inv. Atlas HA61.
27

9. For example: Musgrave, G. W., (1947). The Quantitative Evaluation of Factors in Water Erosion, a First Approximation, J. Soil and Water Conservation 2, 133-8.
Zingg, A. W. (1940) Degree and Length of Land Slope as it Affects Soil Loss in Runoff, Agricultural Engineering 2, 59-64. Wischmeier, W. H. and Smith, D. D. (1958) Rainfall Energy and its Relation to Soil Loss, Trans. Amer. Geophys. Union, 2, (2). 285-91.
Mirtskhoulava, T. E. (1974) Prediction of Erosion Intensification by Man, Int. Assoc. Hydr. Sci. Pub. 113, 78-82.
10. For example: Meyer, L. D. and Wischmeier, W. H. (1969) Mathematical Simulation of the Processes of Soil Erosion by Water, Trans. Am. SOC. Ag. Engrs. 1 2 , ( 6 ) , 754-8, 762.
Foster, G . R. and Meyer, L. D. (1975) Mathematical Simulation of Upland Erosion by Fundamental Erosion Mechanics, in Present and Prospective Technology for Predicting Sediment Yields and Sources, U.S.D.A. ARS-S-40 190-207
Free, G. R. (1960) Erosion Characteristics of Rainfall, Ag. Engineering, 41, (7) 447-9, 455.
Rowlison, D. L. and Martin, G. L. (1971) Rational Model Describing Slope Erosion, Proc. A.S.C.E. J. Irrig. Dr. Div. 97 (IRl), 39-50. Kiling, M. and Richardson, E. V. (1973) Mechanics of Soil Erosion from Overland Flow Generated by Simulated Rainfall, Colorado State University Hydrology Papers, 63.
Carson, M. A . and Kirkby, M. J. (1972) Hillslope Form and Process Ch. 8., Surface Water Erosion.
11. For example: Barnett, A. P. and Rogers, 3 . S. (1966) Soil Physical Properties Related to Runoff and Erosion from Artificial Rainfall Trans. A.S.C.E. 2, 123 et al. Wischmeier, W. H. and Mannering, J . V. (1969) Relation of Soil Properties to its Erodibility, Proc. Soil Sci. SOC. America, 3, (1) , 131-37.
Wischmeier, W. H. &. (1971) A Soil Erodibility Nomograph for Farmland and Construction Sites, J . Soil and Water Conservation - 26, 189-93.
Bryan, R. B. (1969) The Development, Use and Efficiency of Indices of Soil Erodibility, Geoderma, 2, (l), 5-25.
12. Wischmeier, W. H. and Smith, D. D. (1965) Predicting Rainfall- Erosion Losses from Cropland East of the Rocky Mountains, Agriculture Handbook, 282, USDA, ARS.

13.
14.
15.
16.
17.
18.
1.9.
20.
21.
22.
For example: Emmett, W. W. (1970) The Hydraulics of Overland Flow on Hillslopes, U.S.G.S. Prof. Paper 662-A.
Ellison, W. D. (1945) Some Effects of Raindrops and Surface Flow on Soil Erosion and Infiltration, Trans. Amer. Geophys. Union - 26, 415-29.
Williams, J. R. (1975) Sediment Yield Prediction with Universal Equation Using Runoff Energy Factors, in Present and Prospective Technology for Predicting Sediment Yields and Sources, USDA, ARS-S-40, 244-52.
Wigham, J. M. and Stolte, W. J . (1973) Sediment Yield Estimates from an Index of Potential Sediment Production, in Fluvial Processes and Sedimentation, Proc. 9th Hydrology Symposium, Edmonton, Alberta, 208-16.
Clement, P. and Gadbois, P. (1971) Comparison et Interpretation des Resultats de Deux Parcelles Experimentales d'Erosion 1969-70 (Sherbrooke, Quebec). Proc. 2nd Guelph Symp. Geomorphol., 266-27
Schwab, G. 0 . e t & . , (1972) Chemical and Sediment Movement from Agricultural Land into Lake Erie Rept. Water Resources Center, Ohio State University.
Ketcheson, J. K. &., (1973) Potential Contribution of Sediment from Agricultural Land, in Fluvial Processes and Sedimentation, Proc. 9th Hydrology Symposium, Edmonton, Alberta, 208-16.
Jones, A. (1971) Soil Piping and Stream Channel Initiation Water Resources Research, 1, 602-10. For example: Lane, E. W. (1955) The Importance of Fluvial Morphology in Hydraulic Engineering, Proc. A.S.C.E. 3. Hyd. Div., - 81, 1-17.
Blench, T. (1957) Regime Behaviour of Canals and Rivers, Butterworths.
For example: Smerdon, E. T. and Beasley, R. P. (1959) Tractive Force Theory Applied to Stability of Open Channels in Cohesive Soils. Research Bull. 715, Univ. Missouri Ag. Expt. Station, Columbia, Mo.
Grissinger, E. H. (1966) Resistance of Selected Clay Systems to Erosion by Water, Water Resources Research, g,(l), 131-8.
Partheniades, E. (1971) Erosion and Deposition of Cohesive Materials, in H. W. Shen (ed.) River Mechanics, 2.. 251-91.
Wolman, M. G. (1959) Factors Influencing Erosion of a Cohesive River Bank, Amer. J . Sci., 257, 204-16.
29

23.
24.
25.
26.
27.
28.
29.
30.
Knighton, A. D. (1973) Riverbank Erosion in Relation to Streamflow Conditions, River Bollin-Dean, Cheshire, East Midland Geographer, - 5, ( E ) , 416-26.
Harrison, S. S. (1970) Note on the Importance of Frost Weathering in the Disintegration and Erosion of Till in East-Central Wisconsin, Bull. Geol. SOC. Am., 3, 3407-10. Carson, M. J., d., (1973) Sediment Production in a Small Appalachian Watershed During Spring Runoff: The Eaton Basin, 1970-72, Canadian J. Earth Sciences, E, (12), 1707-34.
For example: Thompson, J. R. (1964) Quantitative Effect of Watershed Variables on the Rate of Gully Head Advancement. Trans. Am. SOC. Ag. Engrs., 1, (I), 54-55.
Beer. C. E. and Johnson, H. P. (1965) Factors Related to Gully Growth in the Deep Loess Area of Western Iowa, Proc. (1963) Federal Interagency Sedimentation Conference, USDA Misc. Pub. 970. 37-43.
Heede, B. H. (1974) Stages of Development of Gullies in the Western United States of America, Zeits. Geomorph.. Is, (3), 260-71.
For example: Roehl, J. W. (1962) Sediment Source Areas, Delivery Ratios and Influencing Morphological Factors, Internat. Assoc. Hyd. Sci. Pub., 2, 202-13. Maner, S. B. (1958) Factors Affecting Sediment Delivery Rates in the Red Hills Physiographic Area, Trans. Amer. Geophys. Un., - 39, 669-75.
Renfro, G. W. (1975) Use of Erosion Equations and Sediment- Delivery Ratios for Predicting Sediment Yield, in Present and Prospective Technology for Predicting Sediment Yields and Sources, USDA, ARS-S-LO, 33-45.
For example: Pierce, R. S. (1967) Evidence of Overland Flow on Forest Watersheds: and
Hewlett, J. D. and Hibbert, A. R. (1967) Factors Affecting the Response of Small Watersheds ot Precipitation in Humid Areas, both in:
Sopper, W. E. and Lull, H. W. (eds.) Int. Symp. Forest Hydrology (Pergarnon Press), 247-51 and 275-90.
Kirkby, M. J. (1969) Infiltration, Throughflow and Overland Flow, in R. J. Chorley (ed.) Water Earth and Man, 215-28.
Horton, R. E. (1933) The Role of Infiltration in the Hydrologic Cycle, Trans. Amer. Geophys. Un., 14 446-60. For example: Dunne, T. and Black, R. D. (1970) Partial Area
Resources Research, 5, 1269-1311. Contributions to Storm Runoff in a Small New England Watershed, Water
Ragan, R. M. (1967) An Experimental Investigation of Partial Area Contributors. Int. Assoc. Hyd. Sci. Pub., 3, 241-9.
30

N u t t e r , W . L. and Hewlett, 3. D. (1971) Stormflow Production From Permeable Upland Basins, in Monke, E. J. (Ed.) Biological E f f e c t s i n the Hydro log ica l Cyc le , P roc . Th i rd In t . Semina r fo r Hydrology Professors , 248-58.
Engman, W . T. ( 1 9 7 4 ) P a r t i a l Area Hydrology and i t s A p p l i c a t i o n t o Water Resources , Water Resources Bul le t in (3) , 512-21.
Dunne, T . , Moore, T . R. and Taylor , C . R . (1975) Recogni t ion and Predict ion of Runoff-Producing Zones in Humid R e g i o n s . I n t . A s s . Hyd. S c i . B u l l . 0, 305-27.
31. For example: Gregory, K . J . and Walling, D . E . (1968) The V a r i a t i o n of Drainage Densi ty Within a Catchment . In t . Ass. Hyd. S c i . B u l l . 2, 61-8.
Bly th , K . and Rodda, J . C . (1973) A Stream Length Study. Water Resources Research 2, (5) 1454-61.
32. Kirkby, M. J. (1967) Measurement and Theory of Soil Creep, J. Geol. 3, 359-78.
33. Carson, M . J . gtt (1973) ( s ee r e f . 24 ) .
34. For example: Wall, G . J . and Wilding, L . P. (1976) Mineralogy and Rela ted Parameters o f F luvia l Suspended Sediments in Nor thwes tern Ohio. J . Environ. Qual. 2, 168-73.
Klages, M . G . and Hsieh, Y. P. (1975) Suspended Solids Carried by t h e G a l l a t i n R i v e r of Southwestern Montana: 11. Using M i n e r a l o g y f o r I n f e r r i n g S o u r c e s . J . Environ. Qual. 4. 68-73.
35. F o r example: Dragoun, F. .J. (1962) Rainfal l Energy a s Rela ted t o Sediment Yield, J. Geophys. Research, 67, ( 4 ) , 1495-1501.
Wil l iams, J . R . (1971) P red ic t ion of Sediment Yields from S m a l l Watersheds, Trans. Am. SOC. Ag. Engrs . , E, ( 6 ) , 1158-62.
Guy, H. P. (1964) An A n a l y s i s of Some Storm Per iod Var iab les Affec t ing S t ream Sediment Transpor t , U.S.G.S. Prof . Pape r , 462E.
Wall ing, D. E. (1974) Suspended Sediment and Solute Yields from a Smal l Catchment Pr ior to Urbaniza t ion , Ins t . Br. Geogr. Spec. Pub. 6, 169-191.
36. For example: Hindall , S . M. (1976) Predict ion of Sediment Yie ld in Wiscons in s t reams. Proc . Thi rd Federa l In te ragency Sedimentation Conference, 1205-18.
Shown, L. M . (1970) Evaluation of a Method for Est imat ing Sediment Yie ld , U.S.G.S. P ro f . Pape r , 700-B, 245-9.
Flaxman, E. M. (1972) Predict ing Sediment Yield in the Western United States , Proc . A.S.C.E. J. Hyd. Div. , 98. (HY12); 2073-85.
31

37.
38.
39.
40.
41.
42.
43.
44.
Williams, J. R. (1975) Sediment Routing for Agricultural Watersheds. Water Resources Bulletin, 11. 965-74.
McGuiness. J . L. & (1971) Relation of Rainfall Energy and Streamflow to Sediment Yield from Small and Large Watersheds, J. Soil and Water Cons., 26, 2087-98.
Dickinson, W. T. g & (1975) Fluvial Sedimentation in Southern Ontario, Canadian J. Earth Sciences, 1 2 , 1813-9.
Negev, M. (1967) A Sediment Model on a Digital Computer. Rept. 76, Stanford University, California.
For example: Fleming, G . and Leytham, K. M. (1976) The Hydrologic and Sediment Processes in Natural Watershed Areas. Proc. Third Federal Interagency Sedimentation Conference, 1, 233-46.
Gupta, S. K. (1974) A Distributed Digital Model for Estimation of Flows and Scdiment Load from Large Ungauged Watersheds, Doctoral Thesis, University of Waterloo, Dept. Civil Engineering.
For example: Foster, G. R. and Meyer, L. D. (1975) Mathematical Simulation of Upland Erosion by Fundamental Erosion Mechanics, in Present and Prospective Technology for Predicting Sediment Yields and Sources, USDA ARS-S-40, 190-207.
Meyer, L. D. and Wischmeier, W. H. (1969) Mathematical Simulation of the Process of Soil Erosion by Water, Trans. Am. SOC. Ag. Engrs., 8, ( 4 ) 572-7, 580.
Li Ruh-Ming 5 & (1976) Water and Sediment Routing from Small Watersheds, Proc. Third Federal Interagency Sedimentation Conference, - 1, 193-204
Walling, D. E. and Teed, A. (1971) A Simple Pumping Sampler for Research into Suspended Sediment Transport in Small Catchments, J. Hydtol., z, 325-37. Porterfield, G . (1973) Computation of Fluvial-Sediment Discharge, U.S.G.S. Techniques of Water Resources Investigations, C3, ( 3 ) .
Bauer, L. and Tille, W. (1967) Regional Differentiations of the Suspended Sediment Transport in Thuringia and their Relation to Soil Erosion. Int. Ass. Hyd. Sci. Pub., 75, 367-77.
Flaxman, E. M. (1975) The Use of Suspended Sediment Load Measurements and Equations for Evaluation of Sediment Yield in the West, in Present and Prospective Technology for Predicting Sediment Yields and Sources, USDA ARS-S-40, 46-56.
Dickinson, W. T. eta2 (1975) Fluvial Sedimentation in Southern Ontario, Canadian Journal of Earth Sciences, 1 2 , 1813-9.
32

45. Piest, R. F. (1965) The Role of the Large Storm as a Sediment Contributor, Proc. (1963) Federal Interagency Sedimentation Conference, USDA Misc. Pub. 970, 97-108.
46. For example: Guy, H. P. and Norman, V. W., (1970). Field Methods for Measurement of Fluvial Sediment, U.S.G.S. Techniques of Water Resource Investigations, g, (3).
47. Kirkby, M. J. (1969) Erosion by Water on Hillslopes, in R. J. Chorley (ed.) Water, Earth and Man.
Musgrave, G. W. (1947) Quantitative Evaluation of Factors in Water Erosion, a First Approximation, J. Soil and Water Conservation, 2, 133-8.
Wischmeier, W. H. and Smith, D. D. (1965) Rainfall Erosion
Handbook, 282. Losses from Cropland East of the Rocky Mountains, U . S . D . A . Agr.
Williams, J. R., (1975). - See Ref. 14. Foster, G. R. 9 &. (1973) Erosion Equation Derived from Modelling Principles. ASAE Paper 73-2550.
48. Meyer, L. D. and Wischmeier, W. H., (1969). See Ref. 41.
Fleming, G . and Fahmy, M. (1973) Some Mathematical Concepts for Simulating the Water and Sediment Systems of Natural Water- shed Areas, Univ. Strathclyde Dept. Civ. Eng. Rept. H0-73-26.
Negev, M. (1967). See Ref. 39.
Bennett, J. P. (1974) Concepts of Mathematical Modelling of Sediment Yield, Water Resources Research, lo, 485-92.
Foster, G. R. and Meyer, L. D., (1975). - See Ref. 41.
33


DISCUSS ION
Mr. T. CahiZZ: Dr. Walling, the application of partial area hydrology is complicated in parts of the Great Lakes Basin, especially in Lake Erie by the existence of extensive under-drainage systems in the agricultural
gating partial area applications, or analysis in basins with heavy under- regions. Do you know, or have you had any exposure to any work investi-
drainage networks?
Dr. D. ValZing: I think the short answer to this is no. The concept of partial area and variable source area is rather complicated. It is difficult enough to get this working as a realistic deterministic model, let alone building in underdrainage. The two are obviously very closely linked.
Dr. D. Baker: You used a figure showing three different storms with equal runoff but greatly differing sediment yields associated with those storms. I could not read the time base. To what extent might variations in source
watershed, or is it washing out of accumulated sediments in the channel areas and ground cover affect the sediment yields at the outlet of your
itself? What is the source of the variations?
Dr. D. Wuv'aZv'aZing: The storms were over about a three day period. The water- shed size is about 30 km'. The rainfall characteristics were essentially similar for those three storms. My own feeling is that one has got both storage in the channel and on the land surface, and one has got these important exhaustion effects. Once the first sediment is removed from the land surfare, you get back to the inherent erodibility of the soil and the sediment production rates then drop quite markedly.
DrS. ?'. Uickinson: You made a comment with regard to the bank erosion that you called preconditioning. I might say that initial conditions are important. I suggest that in fact the initial conditions are important for any of the erosion processes and perhaps that is what you are saying and you are also saying source areas are important and the whole timing is important. I think there has been a fair bit of experience in the modelling exercises that if one can make a good guess at the initial conditions, soil conditions, moisture conditions, cropping conditions, or whatever, one may be able t o make a reasonable estimate of what i s going to come off, whether its the bank or the field or whatever. The major problem i s making a good guess of how those conditions vary. Would you agree with that?
3 5

Dr. D. Walling: Yes, entirely. One wants some continuous accounting process whereby one can watch the conditions as they vary through time. A very good point.
Dr. E. &gley: I have one observation to make regarding what you have said. From the point of view of impact on such a large area as the Great Lakes, it is obviously not possible to do the kinds of detailed studies one would like to have for such a broad area other than in small areas to obtain a feeling for the variables involved or the intensity of the processes. I think one of the things we need to address ourselves to, perhaps in the working session, is how do we extend the knowledge that we can gain from
when you are looking at something the size of the Great Lakes area. small areas to assessing impact over broad areas. This is a major problem
36

Influence of Land Use on Erosion and Transfer Process of Sediment
T. Dickinson and G. Wall
The average sediment yield from the landscape and the condition of stream channels tend to change with advancing forms of man's land use acti- vities, as summarized in Table 1. Land uses which can cause severe erosion and sediment problems (e.g. highway and urban construction, timber harvesting, strip mining operations) have been identified; and land uses which tend to
urban settings) have been noted in the literature. Yet it remains difficult stabilize the landscape (e.g. reforestation, permanent pastures, stabilized
to quantitatively estimate changes in erosion and/or sediment yield due to land use changes - even in regions where sediment data are available, let alone in areas where extrapolation is being attempted.
Although persons have observed and measured soil erosion and de- position phenomena in nature and have ascribed general reasons for these occurrences, the interplay of the forces, causes and the boundary conditions pertaining to erosion and sediment movement are less obvious.
An investigation of the influence of land use on erosion and trans- port processes (as indeed an investigation of the processes themselves) also reveals that apparent land use effects are closely related to the scale of the studies undertaken. The dominant forces and boundary conditions govern- ing erosion and sediment transport vary with landscape scale (i.e. the processes predominant on a plot are quite different from those determining conditions on a large field). Although the matter of scale has been empirically handled by simple extrapolation and by means of the delivery ratio approach, the real influence of scale on the processes and on apparent land use effects is not well understood.
In light of the present state of knowledge regarding erosion and transport processes and the part scale has played in affecting statements on land use effects, the following discussion is focused on approaches which have been taken on different landscape scales - identifying items learned and apparent gaps.
PLOT SCALE
Plot studies have been used extensively by agriculturalists and hydrologists to study soil and water losses under a variety of climatic, physiographic, land use, and s o i l management situations. Plots became the unit of experimentation in these studies since they provided a quick and
37

inexpensive means of obtaining the needed data in a short period of time. The basic premise common to all plot studies has been that by locating plots in a similar environment, all variables can be controlled except the one to be studied. Differences in results are therefore attributed to the differ- ences in treatments. Generally, all plot studies have assumed that results were applicable to a greater or lesser degree beyond the limits of the plot.
A review of the literature has indicated that there is no standard design for plot equipment (Hayward, 1971) . Plot sizes range from a few square feet in laboratory studies to several acres in field studies. The most common plot size was 1 / 4 0 to 1/50 of an acre. In general plots were 6, 10, or 12 feet wide and 35, 70 or 72.6 ft. long. Plot width is often deter- mined by drill size and tractor use within the plot. Plot length is usually determined by the local recommended terrace interval or the available length of uniform slope. Mutchler (1963) has given details of plot design and construction.
The experimental design of soil loss plot experiments should permit the measurement of the difference between two or more treatments as well as furnish criteria by which the degree of confidence that can be placed in the result may be judged (Brandt, 1941). The two requisites of such a design are replication and randomisation. The purpose of replication is to increase precision and provide an estimate of error while randomisation ensures that the estimate of error is valid. It is significant to note that while the majority of plot studies reported in the literature did not replicate or randomize treatments, results are presented quantitatively (Hayward, 1971) . The lack of proper design in these studies may mean that the results are either obscure or misleading (Brandt, 1941).
Plot studies have been effectively employed to isolate factors which influence soil loss and runoff. Among the factors found to be most closely related to soil loss and runoff include: plant cover and mulches (Dickson, 1929); Kittredge. 1954; Duley. 1952). cropping practices and tillage (Van Doren and Bartelli, 1956; Meyer and Mannering, 1961), rainfall variables (Wischmeier, 1959; Rogers, &. , 1964) and slope parameters (Neale, 1937; Zingg, 1940; Barnett and Rogers, 1966) . In addition plot studies have been employed to evaluate the effectiveness of remedial measures proposed to reduce soil and water l o s s (Smith, 1941; Van Doren and Bartelli, 1956; Mannering and Meyer, 1961). However, there is an apparent lack of plot research in the literature that was designed to assess the importance of soil factors on erosion and runoff. Similarly, few studies have been conducted to study erosional processes.
The findings from small plot studies have shown conclusively that a myriad of variables affect erosion. However, the extrapolation of plot data beyond the plot remains a problem. While many authors of plot research have freely assumed that their data had an application beyond the plot, it is generally admitted there is little evidence to support the direct aerial expansion of plot data.
Several attempts have been made to relate plot data to field con- ditions through rational o r empirical equations (Zingg, 1940; Musgrave, 1947; Smith, 1941; Van Doren and Bartelli, 1956). However, the universal soil loss equation (Wischmeier and Smith, 1965) is currently the empirical equation in
38

TABLE 1.
EFFECT OF LAND-USE SEQUENCE ON RELATIVE SEDIMENT YIELD AND CHANNEL STABILITY
(after Guy, 1970 - a modification from Wolman, 1967)
LAND USE
A . Natural forest or grassland
B. Heavily grazed areas
C. Cropping
D. Retirement of land from cropping
E. Urban construction
F. Stabilization
C . Stable urban
SEDIMENT YIELD
Low
Low to moderate
Moderate to heavy
Low to moderate
Very heavy
Moderate
Low to moderate
CHANNEL STABILITY
Relatively stable with some bank erosion
Somewhat less stable than A
Some aggradation and increased bank erosion
Increasing stability
Rapid aggradation and some bank erosion
Degradation and severe bank erosion
Relatively stable
39

greatest use. This statistical regression model was based upon soil loss records from test plots in the U.S.A. and takes the form A = RKLSCP where A is the average annual soil loss in tons per acre from a specific field, R is the rainfall factor, K is the soil erodibility factor, L is the slope length, S is the slope gradient, C is the cropping management factor and P is the existing conservation factor.
The universal soil loss equation was designed to predict average annual soil losses from fields and construction sites by sheet and rill erosion. In order to obtain some estimate of the confidence limits of the equation, average annual soil losses were computed on 189 plots for which about 2300 plot years of records were available (Wischmeier, 1973). The plot predictions deviated from the corresponding measured soil losses by an average of 12% of the 11.3 ton overall average soil loss for the sample.
The universal soil loss equation has been used for the prediction of watershed sediment yields but its capabilities and limitations for this use must be recognized (Shen, 1976). Universal soil loss equation predictions provide gross erosion levels and are not designed to predict deposition of sediments. It does not include sediment losses OK gains between the field and the stream OK reservoir. In order to use the universal soil loss equation to estimate sediment yield from a watershed it is necessary to introduce a weighted factor that takes into account deposition of eroded sediments. The sediment delivery ratio (defined as the change per unit area of downstream sediment movement from the source to any given measuring point) has been used for this purpose (Roehl 1962; Speraberry and Bowie, 1969; Renfro, 1972). Williams (1972) has modified the universal soil loss equation for predicting storm sediment yields by substituting the product of storm runoff amount and rate for the rainfall factor (R).
Studies of erosion and sediment transport on watersheds have in- volved two approaches. On the one hand, sediment loads (primarily suspended solids) have been regularly sampled at the watershed outlet and inferences have been drawn regarding the sources of the sediment and the effects of land use. On the other hand, conceptual models of erosion and sedimentation processes have been hypothesized and used t o estimate sediment yields at selected watershed outlet points. Where possible, these estimates have been compared with monitored results - OK monitored data have been used to "cal- ibrate" the models. Each approach is considered below with regard to inherent strengths and weaknesses.
(5) Sediment Load Monitoring
available for other hydrologic variables such as rainfall and streamflow. In Canada, it is only during the last two decades that continuous sampling of
sampling been sparse over area, but also it has been relatively infrequent in sediment loads for selected streams has been undertaken. Not only has
time .
Suspended sediment load data have been sparse in relation to those
40

Although many of the sediment data have been carefully collected, and there have been pressing needs to make good use of this information, conclusions drawn from many of the monitored sediment load data regarding land use effects should be given careful consideration. Problems in this regard are noted below.
Sediment load monitoring has customarily been time- rather than event-oriented (i.e. samples have been collected at regular time intervals rather than focused on storm events). A s a consequence, peak concentrations and loads have not often been well defined. Since the loads occurring during peak flow periods account for the bulk of the total sediment load transported from a watershed (Dickinson, g . , 1975) it is imperative that peak events be adequately sampled.
Sediment samples taken during the year on a time-oriented base that misses many of the major sediment events do not provide either useful estimates of annual suspended loads or indices of such loads. Further, sample loads collected during periods of low flow, and land use effects inferred from low flow data, are not necessarily indicative of the annual suspended sediment load picture. This sampling problem poses a sufficient dilemma, that at the present time there is a need to examine the relative importance of peak flow events in order to design improved sampling schemes.
In the northeastern United States and eastern Canada, the stream sediment load is controlled by source conditions rather than by downstream flow conditions. It is very difficult to "look upstream" from downstream data to identify important sources and land use effects without detailed information on source erosion and transport areas.
(b) Watershed Models
whereby rainfall and runoff detach soil from field surfaces, transport it overland to drainageways, and move it downstream. One group of models
oof fields) and routes the eroded material to other land units and/or down- applies the Universal Soil Loss Equation to land units (e.g. fields or groups
Olson, 1 9 7 4 ; Frere, 1 9 7 3 ) . A second group couples erosion and sediment stream by means of empirical delivery ratios or transport factors (Kling and
delivery concepts to deterministic hydrologic models (Negev, 1967; Fleming, 1972; Simons &., 1975). Although some of the hydraulics-based aspects of these latter models are reasonably sophisticated, many of the concepts per- taining to the erosion of material and its transport are as simplistic and empirical as the delivery ratio approach.
Watershed models of sediment yield have incorporated concepts
There is no doubt that* such models can be fitted to specific sets of input and output data, as numerous examples now illustrate. However, as the components and parameters are conceptual rather than physical in nature,
range of conditions fitted - and to interpret model results in terms of it is extremely risky to apply the models to input conditions outside the
vidual and collective concepts included in the model. land use effects. Predicted effects are not more meaningful than the indi-
4 1

Gaps in existing conceptual models include:
lack of an adequate characterization of the dynamic development of the drainage system in a basin;
lack of identification of the relative importance and physical significance of soil moisture storage concepts;
lack of description of depositional processes in microdrainage systems; and
insufficient emphasis on the role of large storms (year-to-year and storm-to-storm hydrologic differences often account for larger variations in sediment yield than most other factors!)
SWY NOTES
1.
2 .
3 .
4 .
5.
6 .
Although plot studies have contributed information about factors influencing s o i l l o s s and runoff, the lack of statistical rigour in the design of these studies makes it difficult to interpret .ind/or use the results in a quantitative manner.
?imple extrapolation of plot results to larger areas (often implied b y the units used for reporting soil loss, i.e. tons/acre) is not valid.
As plot data are of more qualitative than quantitative value, the use of them as a base for quantitative deterministic models of land use effects is questionable.
Plot studies have not delineated sources of soil loss and associated land use effects.
Land use effects inferred from time-oriented stream sediment sampling programs may be in error both qualitatively and quantitatively.
lxisting watershed modelling approaches - although convenient - have not resolved o u r lack of understanding of erosion and transport processes, and of the effect of land use changes on these processes.
Neither the plot nor the watershed approaches have addressed the problem of erosion sources or the problems of delivery and deposition between sources and downstream locations. In order t o understand the pro-
be given to sources and movement from sources to outlet. Event-oriented cesses and to draw meaningful conclusions about land use effects, focus must
sampling studies from sources downstream, and @e application of dynamic contributing area concepts appear to be two of the most promising new approaches t o the problem.
Ackerman, W. C., and K . L. Corinth, (1962). An Empirical Equation for Reservoir Sedimentation. Publication 59,
o f Land Erosion. pp. 359-366. International Association of Scientific Hydrology, Commission
4 2

Adams, J. E., R. C. Henderson, R. M. Smith, (1959). Interpretations of Runoff and Erosion from Field Scale Plots on Texas Blackland Soil. Soil Sei. x, pp. 232-238.
American Society of Civil Engineering, (1975). Sedimentation Engineering. (ed.) V. A. Vanouri. ASCE, Manuals and Reports on Engineering Practice. No. 54.
Anderson, H. W., (1949). Flood Frequencies and Sedimentation from Forest Watersheds. Transactions, American Geophysical Union, - 30, (4), Washington, D. C., pp. 567-583.
Archer, R. J., (1960). Sediment Discharge of Ohio Streams During Floods of January-February 1959. Ohio Department of Natural Resources, Division of Water, Columbus, Ohio.
Baird, R. W., (1964). Sediment Yields from Blackland Watersheds. Transactions, American Society of Agricultural Engineers, 1. (4), St. Joseph, Michigan, pp. 454-456.
Barnett, A. P., J. S . Rogers, J. H. Holladay, A. E. Dooley, (1965). Soil Erodibility Factors for Selected Soils in Georgia and South Carolina. Trans. Am. SOC. Agric. Engr., 2, pp. 393-395.
Barnett. A. P., J. S . Rogers, (1966). Soil Physical Properties Related to Runoff and Erosion from Artificial Rainfall. Ibid. 2, 123-125 and 128.
Baver. L . D., (1937). Rainfall Characteristics of Missouri in Relation to Runoff and Erosion. Soil Sci. SOC. Am. Proc., ll, 533-536.
Beale, 0. W., G. B. Nutt, T. C. Peele, (1955). The Effects of Mulch Tillage on Runoff, Erosion, Soil Properties and Crop Yields. w., - 19, 244-7.
Beer, C. E., and H. P. Johnson, (1965). Factors Related to Gully Growth in the Deep Loess Area of Western Iowa. Proceedings of the 1963 Federal Interagency Conference on Sedimentation, United States Department of Agriculture, Miscellaneous Publication 970, pp. 37-43.
Bennett, H. H., (1933). The Quantitative Study of Erosion Technique and Some Preliminary Results. Geogr. Rev., 2, pp. 423-432.
Bethlahmy, N., W. J. Kidd, (1966). Controlling Soil Movement From Steep Road Fills. U. S. For. Serv. Res. Note I.N.T. 45.
Blench, T., (1957). Regime Behavior of Canals and Rivers. Butteworth Scientific Publications, London, England.
Blow, F., (1955). Quantity and Hydrological Characteristics of Litter Under Upland Oak Forests in Eastern Tennessee. J. For., 53 190-195.
Bonnard, D., and .I. Bruschin. Transports Solides en Suspension dans les Rivieres Suisses - Lonza, Grand-Eau, 1966-1969. Ecole Polytechnique Federale de Lausanne, Lausanne, Switzerland, (1970).
Borland, W. M., (1961). Sediment Transport of Glacier-Fed Streams in Alaska. Journal of Geophysical Research, 66, (10).
43

Borst, H. L., R. Woodburn, (1940). Rain Simulator Studies of the Effect of Slope on Erosion and Runoff. U.S. Dept. Agric. Soil Conserv. Serv. TP 36.
Borst. H. L., R. Woodburn, (1942). The Effect of Mulching and Methods of Cultivation on Runoff and Erosion from Muskegon Silt Loam. Agric. Engng., St. Joseph, Mich., 3, pp. 19-22.
Brandt, A. E., (1941). The Design of Plot Experiments for Measurement of Runoff and Erosion. 9. 2, pp. 429-432 and 436.
Brice, J. C., (1966). Erosion and Deposition in the Loess-mantled Great Plains, Medicine Creek Drainage Basin, Nebraska. Professional Paper 352-H, United States Geological Survey, Washington, D. C.
Brill, G. D., 0. R. Neal, (1950). Seasonal Occurrence of Runoff and Erosion from a Sandy Soil in Vegetable Production. Agron. J., 42, pp. 192-5.
Brown, C. B., (1950). Sediment Transportation in Engineering Hydraulics, €I. Rouse (ed.) John Wiley and Sons, Inc., New York. N.Y., p. 771.
Browning, G. M., C. L. Parish, J. Glass, (1947). A Method for Determining the Use and Limitations of Rotation and Conservation Practices in the Control of Soil Erosion in Iowa. J. Am. SOC. Agron., 3, pp. 65-73.
Brune, G. B., (1948). Proceedings, Federal Interagency Conference on Sedimentation, Denver, Colo.
Brune, G. B., (1953). Collection of Basin Data on Sedimentation, United States Department of Agriculture, Soil Conservation Service, Milwaukee, Wisc.
Cameron, D. G.. (1952). Studies in S o i l Conservation at Cowra Research Station 1941-45. J. Soil Conser. Serv. N.S.W., 5, pp. 158-168.
Campbell, F. B., H. A. Bauder, (1940). A Rating Curve Method for Determining Silt Discharge of Streams. Transactions, American Geophysical Union, Part 2 , Washington D. C., pp. 603-607.
Carter, C. E., F. E. Dendy, C. W. Doty. (1966). Runoff and Soil Loss from Pastured Loess Soils in North Mississippi. Mississippi Water Resources Conference, Jackson, Miss.
Carreker, J. R., (1946). Proper Cropping Practices Strengthen Terraces on Sloping Ground. Agric. Engng., St. Joseph, Mich., 27, pp. 311- 312, 315.
Carreker, J. R., (1948). Submission to Committee on Agricultural Hydrology. Am. SOC. Agric. Engr. w. (29), pp. 114-116.
Carreker, J. R., (1954). The Effects of Rainfall, Land Slope and Cropping Practices on Runoff and Soil Losses. J. Soil Wat. Conserv., - 9, pp. 115-119.
4 4

Carreker, J. R., A. P. Barnett, (1949). Runoff and Soil Loss Measurements by Cropping Periods. Agric. Engng., St. Joseph, Mich. 2. pp. 173-176.
Clark, C. O . , (1945). Storage and the Unit Hydrograph Transactions American Society of Civil Engineers, 110, pp. 1419-1488.
Colby, B. R., (1956). Relationship of Sediment Discharge of Strean- flow. U . S . Geol. Survey Open-file Report, 170 pp.
Colby, B. R., (1963). Fluvial Sediments - A Summary of Source Transportation, Deposition and Measurement of Sediment Discharge. U.S. Geol. Survey Bull., 1181-A, 49 pp.
Colby, B. R., and C. H. Hembree, (1955). Computations of Total Sediment Discharge, Niobrara River near Cody, Nebraska. Water- Supply Paper 1357, United States Geological Survey, Washington, D.C.
Collier, C. R., (1963). Sediment Characteristics of Small Streams in Southern Wisconsin, 1954-1959. Water-Supply Paper 1669-B, United States Geological Survey, Washington, D. C.
Collier, C. R., et&., (1964) Influences of Strip Mining on the Hydrologic Environment of Beaver Creek Basin, Kentucky, 1955- 1959. Professional Paper 427-B. United States Geological Survey, Washington, D. C.
Collier, C. R., personal communication, (1969).
Collier, C. R., et&., (1971). Influence of Strip Mining on the Hydrologic Environment of Parts of Beaver Creek Basin, Kentucky, 1955-1966. Professional Paper 427-C. United States Geological Survey, Washington, D. C.
Conrey, G. W., E. M. Burrage, (1937). Soil Losses of Fertility Experiment Plots. Soil Sci. SOC. Am. Proc., 2, pp. 547-554.
Costin, A. B., D. J. Wimbush, D. Kerr, (1960). Studies in Catchment Hydrology in the Australian Alps. I1 - Surface Runoff and Soil Loss. CSIRO Div. Pl., Ind. Tech. Pap. No. 14.
Cox, R. K., (1950). The Land Use Factor in Wheat Land Erosion Control. J. Soil Conserv. Serv. NSW, 6, pp. 159-170.
Crawford, N. H. and R. K. Linsley, (1966) Digital Simulation in Hydrology: Stanford Watershed Model IV. Tech. Rept., No. 39, Department of Civil Engineering, Stanford University, California.
Curtis, W. F., J. K. Culbertson, E. B. Chase, (1973). Fluvial Sediment Discharge to the Oceans from the Conterminous United States. U.S. Geol. Survey Circular 67, 17 pp.
Davis, W. W., (1937). A New Method for Measurement of Erosion from Experimental Plots. Soil Sci. SOC. Am. Proc., 2, pp. 579-583.
45

Dawdy, D. R., (1967) Knowledge of Sedimentation in Urban EnVirOmentS. Journal of the Hydraulics Division, ASCE, 2, (HY6), Proc. Paper 5595, pp. 235-254.
Dawdy. D. R., R. W. Litchy, and J. M. Bergmann, (1972). A Rainfall- Runoff Simulation Model for Estimation of Flood Peaks for Small Drainage Basins. U . S . Geological Survey Professional Paper 506-B.
Dickinson, R. E., (1929). The Results and Significance of the Spur
21, pp. 415-422. (Texas) Runoff and Erosion Experiments. J. Am. SOC. Agron., -
Dickinson. W. T., A. Scott, and G. Wall, (1975). Fluvial Sediment- ation in Southern Ontario. Can. Jour. Earth Sciences, 12, (ll), pp. 1813-1819.
Dickinson, W. T., and G. J. Wall, (1976). Temporal Pattern of Erosion and Fluvial Sedimentation in the Great Lakes Basin. Geoscience Canada, 3, pp. 158-163.
Dils, R. E., Soil Loss Plots. Personal Communication.
Diseker, E. G., and J . T. McGinnis, (1967). Evaluation of Climatic Slope and Site Factors on Erosion from Unprotected Roadbanks. Transactions, American Society of AgKiCUltUKd Engineering, - 10, pp. 9-14.
Dodge, A. F . , (1935). Measurement of Runoff as Influenced by Plant Cover Density, Symposia Commemorating Six Decades of the Modern Era in Botanical Science, (Iowa State College), 1. pp. 185-193.
Dortignac, E. J., W. C. Hickey, (1963). Surface Runoff and Erosion as Affected by Soil Ripping. Proc. Fed. Interagency Sediment Conf. 1963. U . S . Dept. Agric. Misc. Publ. 970, pp. 156-165.
Dragoun, F. J., (1962) . Rainfall Energy as Related to Sediment Yield. Journal of Geophysical Research, American Geophysical Union, - 67, (4). Washington, D. C.
Duley, F. L. and F. G. Ackerman, (1934). Runoff and Erosion from Plots of Different Lengths. Journal of Agricultural Research, - 48, (6).
Duley, F. L . , (1939). Surface Factors Affecting the Rate of Intake of Water by Soils. Soil Sci. SOC. Am. PKOC., fi, pp, 60-64.
Duley, F. L., (1952). Relationship Between Surface Cover and Water Penetration, Runoff, and Soil Losses. Proc. Int. Grassld. Cong., 5, pp. 942-946.
Duley, F. L., (1956). The Effect of Synthetic Soil Conditions (HPAN) on Intake Runoff and Erosion. Soil Sci. SOC. Am. PKOC., 0, pp. 420-421.
Duley, F. L., F. G. Ackerman, (1934). Runoff and Erosion from Plots of Different Lengths. Agric. Res. Wash., 48, pp. 505-510.
46

Duley, F. L., 0. E. Hays, (1932). The Effect of the Degree of Slope on Runoff and Soil Erosion. a. 65, pp. 349-360.
Dunford, E. G., (1954). Surface Runoff and Erosion from Pine Grass- lands of the Colorado Front Range. J. For., 52, pp. 923-927.
Einstein, H. A., (1950). The Bed Load Function for Sediment Transportation in Open Channel Flows. Technical Bulletin 1026, United States Department of Agriculture, Soil Conservation Service.
Feagon, W. T., J. Tedmond, (1955). Planning of Hydrology Experiments of Forested Catchments in Australia. Aust. N. 2. Ass. Adv. Sci., Sec. K., Melbourne.
Fleming, G., (1968). The Stanford Sediment Model I: Translation. Bulletin International Association of Scientific Hydrology, XI1 e, Annee 2, pp. 108-125.
Fleming, G., (1969). Design Curves for Suspended Load Estimation, Proceedings, Institution of Civil Engineers, Paper 7185, No. 43, London, England, pp. 1-9.
Fleming, G. (1972). Sediment Erosion-Transport-Deposition Simulation: State-of-the-art. Paper Presneted at the Sediment Yield Workshop, U.S.D.A. Sed. Lab., Oxford, Mississippi, November 28-30.
Flint, R. F., (1972). Fluvial Sediment in Salem Fork Watershed West Virginia, U.S. Geol. Survey Water Supply Paper 1798-K.
Forest Service, Fort Collins, Col., (1965). Notes on Sedimentation Activities, United States Bureau of Reclamation.
Foster, G. R., and L. D. Meyer, (1975). Mathematical Simulation of Upland Erosion Using Fundamental Erosion Mechanics.
Agricultural Research Service. Publication ARS-S-40, United States Department of Agriculture,
Foster, G. R., and W. H. Wischmeier, (1973). Evaluating Irregular Slopes for Soil Loss Prediction. Paper 73-227, Presented at Meeting of American Society of Agricultural Engineers, Lexington, Kentucky.
Free, G. R., (1960). Research Tells How Much Soil We Can Afford to Lose, Crops and Soils, 2, p. 21.
Frere, M. H., (1973). "Adsorption - Transport of Agricultural Chemicals in Watersheds", Transactions of the ASAE, 16, pp. 569-577.
Garcia, G., W. C. Hickey, E. J. Dortignac, (1963). An Inexpensive Runoff Plots. U.S. For. Serv. Res. Note R.M. 12.
Garde, L. E., C. A. Van Doren, (1949). Soil Losses as Affected by Cover Rainfall and Slope. Soil Sci. SOC. Am. Proc., 16, pp. 374-8.
47

Geiger, A. F . , and J. N. Holeman, (1959). Sedimentation of Lake Barcroft, Fairfax County, Va. SCS-TP-136, United States Department of Agriculture, Soil Conservation Service.
George, J . R., (1963). Sedimentation in the Stony Brook Creek Basin, New Jersey, U.S. Geol. Survey Open File Report, 71 pp.
Gilmore, D. A., (1965). Hydrological Investigations of Soil and Vegetation Types in the Lower Cotter Catchment. M. Ag. Sci. Thesis., Aust. Nat. Univ., Canberra.
Glymph, L. M., (1951). Relation of Sedimentation to Accelerated Erosion in the Missouri River Basin. Technical Paper 102, United States Department of Agriculture, Soil Conservation Service.
Glymph, L. M. (1954). Studies of Sediment Yields from Watersheds. Pub-
International Union of Geodesy and Geophysics, pp. 178-191. lication No. 36 de L'Association International D'Hydrologie,
Gottschalk, L. C., and G. M. Brune, (1950). Sediment Design Criteria for the Missouri Basin Loess Hills. SCS-TP-97, United States Department of Agriculture, Soil Conservation Service.
Gray, D. M.. (1968). Snow Hydrology of the Prairie Environment. Proceedings of the Workshop Seminar, Sponsored by the Canadian National Committee for the International Hydrologic Decade and the Univ. of N.B., Feb. 28 and 29.
Grissinger, E. H., (1966). Resistance of Selected Clay Systems to Erosion by Water. Water Resources Research, 2, (1).
Guy, H. P., (1964). An Anlysis of Some Storm-Period Variables Affecting Stream Sediment Transport. Professional Paper 462-E, United States Geological Survey, Washington, D. C.
Guy, H. P., (1965). Residential Construction and Sedimentation at Kensington, Maryland, Proceedings of 1963 Federal Interagency Conference on Sedimentation, United States Dept. of Agriculture, Miscellaneous Publication 970.
Guy, H. P., (1969). Laboratory Theory and Methods for Sediment Analysis: Techniques of Water Resources Investigations of the U.S. Geol. Survey, Book 5, Chapter C1.
Guy, H. P., (1970). Fluvial Sediment Concepts: Techniques of Water Resources Investigations of the U.S. Geol. Survey, Book 3, Chapter Cl.
Guy, H. P., (1970). Sediment Problems in Urban Areas: U.S. Geol. Survey Circular 601-E.
Guy, H. P., and G. E. Ferguson, (1962). Sediment in Small Reservoirs due to Urbanization. Journal of the Hydraulics Division, ASCE, - 8 6 , HY2, Proc. Paper 3070., pp. 27-37.
40

Guy, G . P., and G. E. Ferguson, (1970). Stream Sediment: an Environ- ment Problem: Jour. of Soil and Water Conservation, Soil Conservation Society of America, 5, (6), pp. 217-221.
Guy, H. P., and W. Norman, (1970). Field Methods for Measurement of Fluvial Sediment: Techniques of Water Resources Investigation of the U.S. Geol. Survey, Book 3, Chapter C2.
Happ, S. C., (1944). Effect of Sedimentation on Floods in the Kickapoo Valley, Wisconsin. Journal of Geology, G, (1).
Happ, S. C., (1968). Valley Sedimentation in North-Central Mississippi. Proceedings of Third Mississippi Water Resources Conference, April 9-10.
Happ, S. C., G . Rittenhouse, and G. C. Dobson, (1940). Some Principles of Accelerated Stream and Valley Sedimentation. Technical Bulletin 695, United States Dept. of Agriculture (original source, Rittenhouse, G . , and Holt, R. D. unpublished; copies in SCS and ARS libraries).
Harley, B. M., F. E. Perkins, and P. S. Eagleson, (1970). A Modular Distributed Model of Catchment Dynamics. MIT, Dept. of Civil Engineering, Hydrodynamics Lab. Report No. 133.
Hayward, J . A., (1971). A Review of Soil Loss Plot Studies, Unpublished paper obtained from author. Tussock Grasslands and Moutain Lands Institute, New Zealand.
Heidel, S. S., (1956). The Progressive Lag of Sediment Concentration with Flood Waves. American Geophysical Union Transactions 3 7 , (I), P. 56.
Heineman, H. G . and R. F. Piest, (1975). Soil Erosion-Sediment Field Research in Progress. EOS-Trans AGU, 5 6 , ( 3 ) , pp. 149-157.
Henderson, F. M., (1966). Open Channel Flow. Macmillan, New York.
Hill, A . L., (1965). Rates of Sediment Production in the Kansas River District. Report of Kansas City District, United States Corps of Engineers.
Hickey, W. C., E. J. Dortignac, (undated). An Evaluation of Soil
Arid South West. Int. Assn. Scient. Hydrol., Publ. 65, pp. Ripping and Soil Pitting on Runoff and Erosion in the Semi
22-23.
Holeman, J. N., (1968). The Sediment Yield of Major Rivers of the World. Water Resources Research, 5, (4), pp. 737-747.
Holtan, H. N., N. C. Lopez, (1971). USDAHL-70 Model of Watershed Hydrology. USDA, Agricultural Research Service, Tech. Bulletin 1435.
49

Horton, R. E., (1938). An Interpretation and Application of Runoff Plot Experiments with Reference to Soil Erosion Problems. Soil Sci. SOC. Am. Proc., 2, pp. 340-349.
Horner, G. M., (1960). Effect of Cropping Systems on Runoff, Erosion and Wheat Yields. Agron. J., 52, pp. 342-344.
Homer, G. M., A. G. McCall, F. G. Bell, (1944). Investigations of Erosion Control and Reclamation of Eroded Land at the Palouse Conservation Experiment Station, Pullman, Wash. 1931-42. U . S . Dept. Agric. Tech. Bull. 860.
Interagency Task Force, (1967). Upper Mississippi River Comprehensive Basin Study. Fluvial Sediment, Appendix G, United States Corps of Engineers.
Ireland, H. A., C. F. Sharp, D. H. Eargle, (1939). Principles of Gully Erosion in the Piedmont of South Carolina. Technical Bulletin 633, United States Dept. of Agriculture.
James, L. D., (1970). An Evaluation of Relationships Between Streamflow
A Self-calibrating Version of the Stanford Watershed Model. Water Patterns and Watershed Characteristics Through the Use of O p s e t :
Lexington. Resources Institute Research Report 36, University of Kentucky,
Jansen, J. M. L., R. B. Pamter. (1974). Predicting Sediment Yield
Jour. of Hydrology, g, pp. 371-380. from Climate and Topography. Journ. of Am. SOC. of Civil Engr.
Jones, B. L., (1966). Effects of Agricultural Conservation Practices on the Hydrology of Corey Creek Basin, Pennsylvania, 1954-1960. Water-Supply Paper 1532-C, United States Geological Survey, Washington, D. C.
Jones, H. R., (1961). Runoff and Soil Loss Studies at Wagga Research Station. J. Soil Conserv. Serv. NSW, 17 pp. 156-169.
Kennedy, A. L., (1941). Equipment for Runoff Measurement. Agric. Engng, St. Joseph, Mich., 22, pp. 218 and 220.
Ketcheson, J. W., W. T. Dickinson, P. S . Chisholm, (1973). Potential Contributions of Sediment from Agricultural Land. Proc. 9th Canadian Hydrology Symposium, Edmonton.
Kilinc, M. Y., (1972). Mechanics of Soil Erosion from Overland Flow Generated by Simulated Rainfall. Dissertation, Submitted to the Dept. of Civil Engineering, Colorado State University, Fort Collins, Colorado.
Kittredge, J., (1954). Influences of Pine and Grass on Surface Runoff and Erosion. J. Soil Wat. Conserv., 9, pp. 179-185, 193.
Kling, G. F., G. W. Olson, (1974). "Sediment Transport Computer Model" Cornel1 Agronomy Mimeo, pp. 74-11.
50

Krusekpof, H. H., (1943). The Effect of Slope on Soil Erosion. Missouri Agricultural Experiment Station Research Bulletin 363.
Krusekpof, H. H., (1958). Soils of Missouri--Genesis of Great Soil Groups. Soil Science, 3, pp. 19-27.
Kulp, J . L., (1961). Geologic Time Scale. Soil Science, 133 (3459), pp. 1105-1114.
Kunkle, S . H. and G. H. Comer, (1972). Suspended, Bed, and Dissolved Sediment Loads in the Sleepers River, Vermont. ARS 41-188, United States Dept. of Agriculture, Agricultural Research Service.
Lamb, J., G. R. Free, H. H. Wilson, (1944). The Seasonal Occurrence of Soil Erosion in New York as Related to Rainfall Intensities. J. Am. SOC. Agron., 3 6 , pp. 37-45.
Lamy, D. L., (1949). Some Effects of Summer Storms at Wagga Soil Conservation Research Station, 1947-48. J. Soil Conserv. Serv. NSE, 5, pp. 39-43.
Lane, E. W., (1955). Design of Stable Channels. Transactions, ASCE, 120, Paper No. 2776, pp. 1234-1260.
Lane, E. W., (1955). The Importance of Fluvial Morphology in Hydraulic Engineering. Proceedings, ASCE, a, Paper No. 745.
Lane, E. W., W. M. Borland, (1951). Estimating Bed Load. Trans- actions, American Geophysical Union, Washington, D. C.
Langbein, W. B., S . A. Schumm, (1958). Yield of Sediment in Relation to Mean Annual Precipitation. Transactions, American Geophysical Union, 2, Washington, D. C., pp. 1076-1084.
Leaf, C. F., (1970). Sediment Yield from Central Colorado Snow Zone. ASCE Jour. of Hydraulic Div., 9 5 , pp. 87-93.
Leopold, L. B., (1968). Hydrology for Urban Planning--a Guidebook on the Hydrological Effects of Urban Land Use. U . S . Geological Survey, Circular 554.
Leopold, L. B., W. W. Emmett, R. M. Myrick, (1966). Channel and Hillslope Processes in a Semiarid area in New Mexico. Professional Paper 3524, United States Geological Survey, Washington, D. C.
Leopold, L. B . , T. Maddock, (1953). The Hydraulic Geometry of Stream Channels and Some Physiographic Implications. Professional Paper 252, United States Geological Survey, Washington, D. C.
Leopold, L. B., M. G. Wolman, J. P. Miller, (1964). Fluvial Processes in Geomorphology, W. H. Freeman and Co., San Francisco, Calif. 328 pp.
51

Li, R. M., (1972). Sheet Flow Under Simulated Rainfall. Thesis Submitted to the Dept. of Civil Engineering, Colorado State University, Fort Collins, Colorado.
Li, R. M., H. W. Shen, (1973). Effect of Tall Vegetation on Flow and Sediment. Journal of Hydraulics Division, American Society of Civil Engineers, 9, (HY5). Proc. Paper 9748, pp. 793-814.
Li. R. M., D. B. Simons, (1973). Discussion of "Sediment Yield Computed with Universal Equation" by J. R. Williams and H. D. Berndt. Journal of the Hydraulics Division, American Society of Civil Engineers, 99, (HYll), Proc. Paper 10109, pp. 2145-2147.
Li, R. M., D. B. Simons, M. A. Stevens, (1975). Nonlinear Kinematic Wave Approximation for Water Routing. Water Resources Research, - 11, (2). pp. 245-252.
Lillard, J. H., (1941). Effects of Crops and Slopes on Rates of Runoff and Total Soil Loss. Agric. Engng., St. Joseph, Hich., 22, pp. 396-398 and 406.
Logan, J. M., (1960). Runoff and Soil Loss Studies at Wellington
3, pp. 95-111. Research Station, Part I - Runoff. J. Soil Conserv. Serv. NSE,
Logan, J. M., (1960). Runoff and Soil Loss Studies at Wellington Research Station, Part I1 - Soil Loss. u., 16, pp. 214-227.
Longley, A. J., E. J. Bondy, (1963). Reducing Soil Loss in Kansas. Jour. Soil Wat. Conserv., e, pp. 160-161.
Love, S. K., (1936). Suspended Matter in Several Small Streams. Trans- actions, 17th Annual Meeting, American Geophysical Union, Washington, D. C.
Love, L. D., B. C. Goodell, (1960). Watershed Research on the Frazer Experimental Forest. J. For., 58, pp. 272-275.
Lowdermilk, W. C., (1931). Studies of the Role of Forest Vegetation in Surficial Runoff and Soil Erosion. Agric. Engng, St. Joseph, Mich., 1 2 , pp. 107-112.
Lowdermilk, W. C., (1935). Certain Aspects of the Role of Vegetation
Modern Era in Botanical Science (Iowa State College), 1, pp. 123-132. in Erosion Control. Symposia Commemorating Six Decades of the
Lowdermilk, W. C., H. L. Sundling, (1950). Erosion Pavement to
pp. 96-100. Formation and Significance. Trans. Am. Geophys. Un., 31,
Lull, H. W., K. G. Reinhart, (1963). Logging and Erosion on Rough Terrain in the East. Proceedings of 1963 Federal Interagency Conference on Sedimentation, United States Dept. of Agriculture, Miscellaneous Publication 970, pp. 43-47.
52

Lsuby, G. C., (1963). Causes of Variation in Runoff and Sediment Yield from Small Drainage Basins in Western Colorado. Miscellaneous Publication 970, U . S . Dept. of Agriculture.
Lsuby, G. C., (1970). Hydrologic and Biota Effects of Grazing Versus Non- Grazing Near Grand Junction, Colorado. Professional Paper 700-B, United States Geological Survey., Washington, D. C., pp. 232-236.
Lustig, L. K., (1965). Sediment Yield of the Castaic Watershed, Western Los Angeles County, California - A quantitative Geomorphic Approach. Professional Paper 422-F, U.S. Geological Survey, Washington, D. C.
Mallory, C. W., J. J. Boland, (1970). A System Study of Storm Runoff Problems in a New Town. Water Resources Bull., 6, (6), pp. 980-89.
Maner, S . B., (1958). Factors Affecting Sediment Delivery Rates in the Red Hills Physiographic Area, American Geophysical Union Trans- action, 3, (4). pp. 669-674.
Maner, S . B., L. H. Barnes, (1953). Suggested Criteria for Estimating Gross Sheet Erosion and Sediment Delivery Rates for the Blackland Prairies Problem Area in Soil Conservation. U.S. Dept. of Agriculture, Soil Conservation Service Publication.
Mannering, J. V., L. D. Meyer, (1961). The Effects of Different Methods of Corn Stalk Residue Management on Runoff and Erosion as Evaluated by Simulated Rainfall. Soil Sci. SOC. Am. Proc., 5, pp. 506-510.
Mannering, J. V., (1963). The Effects of Various Rates of Surface Mulch on Infiltration and Erosion. Ibid. 27, pp. 84-86.
Mansue, L. J., A. B. Commings, (1974). Sediment Transport by Streams Draining into the Delaware Estuary. U.S. Geol. Survey Water Supply Paper 1532-H.
Marston, R. B., (1952). Ground Cover Requirements for Summer Storm Runoff Control on Aspen Sites in Northern Utah. J. For., x, pp. 303-7.
McCully, W. G., W. J. Bowmer, (1969). Erosion Control on Roadsides in Texas. Research Report 67-8F, Texas Agricultural and Mechanical University, College Station, Tex.
McKay, G. E., (1968). Problems of Measuring and Evaluating Snowcover; Proceedings of the Workshop Seminar. Canadian Nat. Comm. for Internat. Hydr. Decade and Univ. of N.B., Feb. 28-29.
Menard, H. W., (1961). Some Rates of a Regional Erosion. Journal of Geology, 69, pp. 154-161.
Meyer, L. D.. (1965). Mathematical Relationships Governing Soil Erosion by Water. Journal of Soil and Water Conservation, - 7-0, (4).
53

Meyer, L. D. (1971). Soil Erosion by Water on Upland Areas. Chapter 27, Vol. 11, River Mechanics edited by H. W. Shen, Colorado State University, Fort Collins, Colorado.
Meyer, L. D., G. R. Foster, M. J. M. Romkens, (1975). Sources of Soil Eroded by Water from Upland Slopes. Publication ARS-S-40, U.S. Dept. of Agriculture, Agricultural Research Service.
Meyer, L. D., E. J. Monke, (1965). Mechanics of Soil Erosion by Rainfall and Overland Flow. Transactions, American Society of Agricultural Engineers, A, (4), St. Joseph, Michigan
Meyer, L. D., L. A. Kramer, (1968). Relation Between Land-Slope Shape and Soil Erosion. Paper Presented at the 1968 Winter Meeting of ASAE, Chicago, Illinois.
Meyer, L. D., E. J. Monke, W. H. Wischmeier, (1969). Mathematical
American Society of Agricultural Engineers, 12, St. Joseph, Simulation of the Process of Soil Erosion by Water. Transactions,
Michigan.
Meyer, L. D., J. V. Mannering, (1961). Minimum Tillage for Corn: Its
Michigan, 42, pp. 72-75, 86, 87. Effect on Infiltration and Erosion. Agric. Engng., St. Joseph,
Miller, C. R., (1951). Analysis of Flow-Duration, Sediment-Rating Curve Method of Computing Sediment Yield. United States Bureau of Reclamation, Hydraulics Bureau.
Miller, C. R., R. Woodburn, H. R. Turner, (1962). Upland Gully Sediment Production. International Association of Scientific Hydrology Publication No. 59.
Moore, W. R., C. E. Smith, (1968). Erosion Control in Relation to Watershed Management. Am. SOC. of Civil Engineers, Proc. - 94, (IR3), pp. 321-331.
Moldenhauer, W. C., W. H. Wischmeier, (1960). Soil and Water Losses and Infiltration Rates on Ida Silt Loam as Influenced by Cropping Systems, Tillage Practices and Rainfall Characteristics. Soil Sci. SOC. Am. Proc., 2, pp. 409-413.
Mundroff, J. C . , (1964). Fluvial Sediment in Kiowa Creek Basin, Colorado, U.S. Geol. Survey Water Supply Paper 1798-A.
Murota, A., M. Hashino, (1969). Studies of a Stochastic Rainfall Model and its Application to Sediment Transportation. Tech, Rept., Osaka University, 9, pp. 231-247.
Musgrave, G . W., (1947). The Quantitative Evaluation of Factors in Water Erosion, a First Approximation. Journal of Soil and Water Conservation, 2, pp. 133-138.
Mutchler, C. K., (1963). Runoff Plot Design and Installation for Soil Erosion Studies. Agricultural Research Service Report NO. 41-79, U.S. Dept. of Agriculture.
54

Neale, 0. R., (1937). The Effect of the Degree of Slope and Rainfall Characteristics on Runoff and Soil Erosion. Soil Sci. SOC. Am. Proc., 2, pp. 525-32.
Neale, 0. R., (1939). Some Concurrent and Residual Effects of Organic Matter Additions on Surface Runoff. g. 5, pp. 420-25.
Neal, J. H., (1945). Soil and Water Losses as Affected by Rainfall Characteristics. Agric. Engng., St. Joseph, Michigan, 3, pp. 463-464.
Neal, 0 . R., G. D. Brill, (1951). Conservation Effects of Crop Rotation on a Sandy Soil in Vegetable Production. J. Soil Wat. Conserv., 5, pp. 187-190 and 199.
Neff, E. L . , (1967). Discharge Frequency Compared to Long-Term Sediment Yields. Symposium on River Morphology, International Union of Geodesy and Geophysics, pp. 236-242.
Negev, M., (1967). A Sediment Model on a Digital Computer. Technical Report 76, Stanford University, Stanford, California.
Newman, J. E., (1970). Climate in the 1970's. Crops and Soils, - 22, pp. 9-12.
O'Loughlin, C. L. Private communication.
Olson, T. C., W. H. Wischmeier, (1963). Soil Erodibility Evaluations for Soils on the Runoff and Erosion Stations. Soil Sci. Soc. Am. Proc., 27, pp. 590-592.
Onstad, C. A., G. R. Foster, (1974). Erosion and Deposition Modeling on a Watershed. Scientific Journal Series 8537, Minnesota Agricultural Experiment Station.
Packer, P. E., (1951). An Approach to Watershed Protection Criteria. J. For., 9. pp. 639-644.
Parsons, D. A.. (1954). Coshocton-Type Runoff Samplers, Laboratory Investigations. SCS-TP-124. Soil Conservation Service, U.S. Dept. of Agriculture, Washington, D.C.
Patric, J. H., (1959). Increasing Water Yield in Southern California Mountains. Jour. Am. Water Works Assoc., 51, pp. 474-480.
Peel, T. C., (1937). The Relation of Certain Physical Characteristics to the Erodibility of Soils. Soil Sci. Soc. Am. Proc., 11, pp. 97-100.
Peter, J. C., (1967). Effects on a Trout Stream of Sediment from Agricultural Practices. Journ. of Wildlife Management, - 31, (4).
55

Piest, R. F. , (1963). Long Term Sediment Yields from Small Watershed. International Association of Sci. Hydrology, General Assembly of Berkley, (1963), 11 (2) - Transport of sediment pp. 121-140.
Piest, R. F. , (1965). The Role of the Large Storm as a Sediment Contributor PKOC. of 1963 Federal Interagency Conference on Sedimentation, Miscellaneous Pub. 970. U . S . Dept. of Agriculture, pp. 97-108.
Piest, R. F. , H. G. Heineman, (1965). Experimental Watersheds Contribute Useful Sedimentation Facts. Internat. Assoc. of Sci. Hydr., 1. (2), p. 372.
Piest, R. F., R. G. Spomer, (1968). Sheet and Gully Erosion in the Missouri Valley Loessial Region. Transactions, American Society of Agricultural Engineers, 11, St. Joseph, Michigan, pp. 850-853.
Piest, R. F. , J. M. Bradford, R. G. Spomer, (1975). Mechanisms of Erosion and Sediment Movement from Gullies. Publication ARS- S-40, Agricultural Research Service, U.S. Dept. of Agriculture.
Piest, R. F . , M. Bradford, G. M. Wyatt, (1975). Soil Erosion and Sediment Transport. ASCE Hydraulic Div., p. 65.
Portfield. G., (1972). Computation of Fluvial Sediment Discharge Techniques of Water Resources Investigations of U . S . Geol. Survey, Book 3 , Chapter C3.
Rainwater, F. E., (1962). United States Geological Survey Hydrologic Investigations Atlas. HA-61.
Rantz, S . E., (1964). Snowmelt Hydrology of a Sierra Nevada Stream. U.S. Geol. Survey Paper 1779-R.
Reed, L. A . , (1971). Hydrology and Sedimentation of Corey Creek and Elk Run Basins, North Central Pennsylvania, U.S. Geol. Survey Water Supply Paper 1532-E.
Reed, L. A., (1976). Sediment Characteristics of Five Streams Near Harrisburg, Pennsylvania Before Highway Construction. USGS Water Supply Paper 1798”.
Renard, K. G., (1969). Sediment Rating in Ephemeral Streams. ASAE Transaction, p. 80-85.
Renard, K. G., L. J. Lane, (1972). Sediment Yield as Related to a Stochastic Model of Ephermeral Runoff. Paper Presented at the Sediment Yield Workshop, USDA Sed. Lab., Oxford, Mississippi.
Rendon-Herrero, O . , (1974). Estimation of Washload Produced on Certain Small Watersheds. Journal of the Hydraulics Div., American Society of Civil Engineers, 100, (HY7), PKOC. Paper 10638, pp. 835-848.
56

Renfro, G. W., (1972). Use of Erosion Equations and Sediment Delivery Ratios for Predicting Sediment Yield, Paper Presented at the Sediment Yield Workshop, USDA Sed. Lab., Oxford, Mississippi.
Renfro, G. W., J. W. Adair, (1968). Engineering and Watershed Planning Unit Technical Guide No. 12. S o i l Conservation Service, U.S. Dept. of Agriculture, Fort Worth, Texas.
Renfro, G. W., (1972). Use of Erosion Equations and Sediment Delivery Ratios for Predicting Sediment Yield. USDA Sed. Lab. Oxford, Mississippi.
Rice, R. M., G . T. Foggin, (1971). Effect of High Intensity Storms on Soil Slippage on Mountanous Watersheds in South California. Water Resources Research, 1, ( 6 ) .
Ritter, J. R., (1974). The Effects of Hurricane Agnes Flood on Channel Geometry and Sediment Discharge of Selected Streams in Susquehanna River Basin, Pennsylvania. U.S. Geol. Survey Jour. of Research - 2, (6), pp. 753-761.
Rockwood, D. M., (1964). Program Description and Operating Instructions, Streamtlow Synthesis and Reservoir Regulation. Tech. Bulletin No. 22, U . S . Army Engineering Uivision, North Pacific, Portland, Oregon.
Rodriguez-Iturbe, I., C. F. Nordin, (1968). Time Series Analysis of Water and Sediment Discharges. IASH, 13, (2), pp. 69-86.
Roehl, J . W., (1962). Sediment Source Areas, Delivery Ratios, and
202-203. Influencing Morphological Factors. Publication 58, IASH, pp.
Rogers, J. S . , A. P. Barnett, C. Cobb, (1964). An Evaluation of Factors Affecting Runoff and Soil Loss from Simulated Rainfall. Trans. Am. SOC. Agric. Engr., I, pp. 457-459.
Rosenbrock, H. H., (1960). An Automatic Method for Finding the Greatest
pp. 175-184. or Least Value of a Function. The Computer Journal, 3,
Rowlison, D. L., 6. L. Martin, (1971). Rational Model Describing Slope Erosion. Journal of the Irrigation and Drainage Division, ASCE, 97, ( I r l ) , Proc. Paper 7981, pp. 39-50.
Ruhe, R. V., R. B. Daniels, (1965). Landscape Erosion - Geologic and Historic. Journal of Soil and Water Conservation.
Ruhe, R. V,, R. Meyer, W. H. Scholtes, (1957). Late Pleistocene Radiocarbon Chronology in Iowa. American Journal of Science, I 225, pp. 671-689.
57

Sayre. W. W., H. P. Guy, A. R. Chamberlain, (1963). Uptake and Transport of Radionuclides by Stream Sediments. U.S. Geol. Survey Professional Paper 433-A.
Scheidegger, A. E., (1961). Theoretical Geomorphology, Prentice- Hall, Inc., Englewood Cliffs, N . J .
Schumm, S . A., (1956). The Role of Creep and Rainwash on the Retreat of Badland slopes. American Journal of Science, 254, pp. 693-706.
Schumm, S . A., (1965). Quanternary Paleohydrology. The Quanternary of the United States.
Searcy, J. K., (1959). Flow Duration Curves. Water Supply Paper 1542-A, U.S. Geological Survey, Washington, D. C.
Seginer, I., (1966). Gully Development and Sediment Yield. Research Report No. 13, The Israel Ministry of Agriculture, Soil Conser- vation Division.
Shen, H. W., R. M. Li. (1973). Rainfall Effect on Sheet Flow Over Smooth Surface. Journal of the Hydraulics Division, American Society of Civil Engineers, E.. (HY5). Proc. Paper 9733. pp. 771-792.
Shen, H. W., R. W. Li, (1976). Watershed Sediment Yield, 2, Stochastic Approaches to Water Resources. Edited and published by H. W. Shen for Collins Colorado.
Simons, D. B., R. M. Li, M. A. Stevens, (1975). Development of Models for Predicting Water and Sediment Routing and Yield from Storms on Small Watershed. Colorado State Univ. Report CER74-75DBS-RML"AS24. Prepared for USDA Forest Service, Rocky Mountain Forest and Range Experimental Station, Flagstaff, Arizona.
Smith, D. D., D. M. Whitt, (1948). Evaluating Soil Losses from Field Areas. E. 2, pp. 394-396 and 398.
Smith, D. D., W . H. Wischmeier, (1957). Factors Affecting Sheet and Rill Erosion. Trans. Am. Geophys. Un., 38, pp. 889-896.
Smith, D. D., (1962). Rainfall Erosion. Adv. Agron., 14, pp. 109-148.
Smith, D. D., (1941). Interpretation of Soil Conservation Data for Field Use. Agricultural Engineering, 22, pp. 173-175.
Smith, D. D., (1966). Broad Aspects of Erosion Research Presented at the 1966 American Society of Agricultural Engineers Winter meeting.
Smith, D. D., D. M. Whitt. (1947). Estimating Soil Losses from Field Areas of Claypan Soils. Proceedings, Soil Science Society of America, 12, Madison, Wisc., pp. 485-490.
Smith, D. D., W. H. Wischmeier, (1957). Factors Affecting Sheet and Rill Erosion. Trans. AGU, 3, pp. 889-896.
Smith, D. D., W. H. Wischmeier. (1958). Evaluation of the Factors in Soil Loss Equation. Agricultural Engineer, 2, pp. 458- 462.
58

Smith, B. M., st. (1967). Renewal of Desurfaced Austin Clay. Soil Science, 103.
Smith, R. M., W. L. Stamey, (1965). Determining the Range of Tolerable Erosion. Soil Science, 100, (6).
Soil Conservation Service, United States Department of Agriculture, Procedures for Determining Rates of Land Damage, Land Depreciation, and Volume of Sediment Produced by Gully Erosion. Technical Release No. 32, Geology, July (1966).
Soons, J. M., (1966). Some Observations of Microclimate and Erosion Processes in Cass Basin in the Southern Alps. Paper delivered N. Z. Hydrological Society Symposium on Precipitation and Erosion (1966). (cyclostyled).
Speraberry, J. A., A. J. Bowie, (1969). Predicting Sediment Yields from Complex Watersheds. Trans. ASAE, 12, pp. 188, 201.
Spomer, R. G . , H. G . Heinemann, R. F. Piest, (1971). Consequences of Historic Rainfall on Western Iowa Farmland. Water Resources Research, L, (31, pp. 524-535.
Springer, D. K., C. B. Breinig, M. E. Springer, (1963). Predicting Soil Losses in Tennessee. 3 . Soil Wat. Conserv., 2, pp. 157-158.
Stall, J. B., L. J. Bartelli, (1959). Correlation of Reservoir Sedimentation and Watershed Factors: Springfield Plains, Illinois, Illinois State Water Survey, Report of Investigations 37.
Swanson, N. P., A. R. Dedrick, (1965). Protecting Soil Surfaces Against Water Erosion with Organic Mulches. Paper Delivered Am. Soc. Agron., Ohio, (1965). (cyclostyled).
Swanson, N. P., A. R. Dedrick, H. E. Weakly, (1965). Soil Particles and Aggregates Transported in Runoff from Simulated Rainfall. Trans. Am. SOC. Agric. Engr., &, pp. 437-440.
Swanson, N. P.. A . R. Dedrick, H. E. Weakly, H. R. Haise, (1965). Evaluation of Mulches for Water Erosion Control. w. 8, pp. 438-440.
Swanson, N. P., A. R. Dedrick, (1966). Simulation of Increased Slope Length on Small Runoff Plots. Paper Presented at Am. SOC. Agric. Engr. (cyclostyled).
Taylor, R. E., 0. E. Hays, E. Bay, R. M. Dizon, (1964). Corn Stover Mulch for Control of Runoff and Erosion on Land Planted Corn after Corn. Soil Sci. SOC. Am. Proc., 8, pp. 123-125.
Thompson, J. R., (1964). Quantitative Effect of Watershed Variables on
of Agricultural Engineers, 2, (A), St. Joseph, Michigan. the Rate of Gully Head Advancement. Transactions, American Society
pp. 54-55.
59

Thoreson, A. S . , J. K. Maddy, (1963). Using the Soil Loss Equation in Iowa. J . Soil Wat. Conserv., la, pp. 159-160.
Todorovic, P., V. Yevjevich, (1969). Stochastic Process of Precipitation. Colorado State University Hydrology Paper 35.
Turner, G. T., E. J. Dortignac, (1954). Infiltration Erosion and Herbage Production of Some Mountain Grasslands in Western Colorado. J. For., 52, pp. 858-860.
Uhland, R. E., (1935). The Effect of Plant Cover on Soil and Water Losses. Symposia Commemorating Six Decades of the Modern Era in Biological Science (Iowa State College), 1, pp. 115-122.
United States Department of Agriculture. Summary of Reservoir Sediment
Miscellaneous Publication 1226, Compiled Under the Auspices of Disposition Surveys Made in the United States through 1970.
the Sedimentation Committee, Water Resources Council, (1973).
United States Geological Survey, National Reference List of Water
Washington, D. C . , (1971). Quality Stations, Water Year 1971, Water Resources Division,
United States Geological Survey Water Supply Papers. Quality of Surface Water of the United States, (published) and annual summaries (unpublished) Washington, D. C., (1959-1967).
University of Missouri, Agricultural Experiment Station, (1962). Missouri Soil and Water Conservation Needs Inventory.
Ursic, S . J . , F. E. Dendy, (1965). Sediment Yields from Small Water- sheds Under Various Land Uses and Forest Covers. Proceedings of
Publication 970, United States Dept. of Agriculture, pp. 47-52. (1963) Federal Interagency Conference on Sedimentation, Miscellaneous
USBR., (1960). Investigation of Meyer-Peter, Muller Bedload Formulas. Sedimentation Section, Hydrology Branch, Division of Project Investigation, U.S. Dept. of the Interior, Bureau of Reclamation.
U.S. Dept. of Agriculture, (1975). Erosion and Sedimentation. Soil Conservation Service, Great Lakes Commission, Appen. 18.
U.S. Dept. of Housing and Urban Development, (1970). Proceedings of the National Conference on Sediment Control, Washington, D. C. September 14-16, 1969, May 1970.
U.S. Environmental Protection Agency, (1975). Control of Water Pollution from Cropland. Vol. 1, USDA ARS H-S-1 and EPA 600/2-75-0269.
Van Doren, C . A., R. S . Stauffer, E. H. Kidder, (1950). Effect of Contour Fanning onSsoil Loss and Runoff. Soil Sci. SOC. Am. Proc., 2, pp. 413-417.
Van Doren, C. A., L. J . Bartelli, (1956). A Method for Forecasting Soil Losses. Agricultural Engineering, x, pp. 335-341.
60

Van Vliet, L. J. P., G. J. Wall, W. T. Dickinson. The Effect of Agricultural Land Use on Sheet Erosion Losses in Southern Ontario. Can. Jour. Soil Science (in press).
Vice, R. B., G. E. Ferguson, H. P. Guy, (1968). Erosion from Suburban Highway Construction. Journal of the Hydraulics Division, ASCE, 94. (HY l), Proc. Paper 5742, pp. 347-348.
Vice, R. B., H. P. Guy, G. E. Ferguson, (1969). Sedimentation Movement in an Area of Suburban Highway Construction, Scott Run Basin, Fairfax County, Virginia, 1961-64. U.S. Geol. Survey Water Supply Paper 1591-E.
Walker, P. H., (1966). Postglacial Environments in Relation to Landscape and Soils on the Cary Drift, Iowa. Agriculture and Home Economics Experiment Station Bulletin 549, Iowa State University.
Whitaker, F. D. H. G. Heinemann. The Effects of Soil Management Variables on Soil Losses (to be published in University of Missouri Experiment Station Bulletin).
Whitaker, F. D., V. C. Jameson, V. F. Thornton, (1961). Runoff and Erosion Losses from Mexico Silt Loam in Relation to Fertilization and Other Management Practices. Soil Sci. SOC. Am. Proc., 2, pp. 401-403.
Williams, J. R., (1972). Sediment Yield Prediction with Universal Equation Using Runoff Energy Factor. Paper Presented at the Sediment Yield Workshop, USDA Sed. Lab., Oxford Mississippi.
Williams, J. R., (1975). Sediment Routing for Agricultural Watershed. Water Resources Bulletin, 11, ( 5 ) , pp. 965-970.
Williams, J. R., H. D. Berndt, (1972). Sediment Yield Computed with Universal Equation. Journal of Hydraulics Division, American Society of Civil Engineers, 98, (HYlZ), Proc. Paper 9426, pp. 2087-2098.
Williams, J. R., H. D. Berndt, (1972). Sediment Yield Computed with Universal Equation. Journal of the Hydraulics Division, ASCE, - 98, (HYlZ), Proc. Paper 9426. pp. 2087-2098
Wilson, L., (1972). Seasonal Sediment Yield Pattern of U.S. Rivers, Water Resources Research, 8 (6), pp. 1470.
Wilson, L., (1973). Variation in Mean Annual Sediment Yield as a Function of Mean Annual Precipitation, Am. Jour. of Sci. (in Press). 273, (4). pp. 334-349.
61

Wiltshire, C. R., (1947). Runoff Plots and Standard Runoff and Soil Loss Measuring Equipment Used by the New South Wales Soil Conservation Service. J. Soil Conserv. Serv. N.S.W., 3, pp. 171-178.
Wiltshire, C. R., (1948). The Measurement of Runoff and Soil Loss from Plot Experiments. u. ft, pp. 40-44.
Wischmeier, W. H., (1960). Cropping-Management Factor Evaluations for a Universal Soil Loss Equation. Soil Sci. SOC. Am. Proc., 26, pp. 322-326.
Wischmeier, W. H., (1959). A Rainfall Erosion Index for a Universal Soil Loss Equation. Soil Sci. SOC. Am. Proc., 2, pp. 246-249.
Wischmeier, W. H., (1966). Relation of Field-Plot Runoff to Management and Physical Factors. H. 2, pp. 272-277.
Wischmeier, W. H., D. D. Smith, (1958). Rainfall Energy and its Relationship to Soil Loss. Trans. Am. Geophys. Un., 3, pp. 285-291.
Wischrneier, W. H., D. D. Smith, R. E. Uhland, (1958). Evaluation of Factors in the Soil Lose Equation. Agric. Engng., St. Joseph Michigan, 2, pp. 458-462 and 474.
Wischmeier, W. H., (1962). Storms and Soil Conservation, Jour. of Soil and Water Conservation. x, (2).
Wischmeier, W. H., (1962). Rainfall Erosion Potential, Agric. Engineerinl - 43, (4). pp. 212.
Wischmeier, W. H., (1972). Estimating the Cover and Management Factor for Undisturbed Areas. Paper Presented at the Sediment Yield Workshop, USDA Sed. Lab. Oxford, Mississippi.
Wischmeier, W. H . , D. D. Smith, (1958). Rainfall Energy and its Relationship to Soil Loss, Am. Geophys. Union Trans., 3, - 2, pp. 285.
Wischmeier, W. H . , D. D. Smith, R. E. Uhland, (1958). Evaluation of Factors in the Soil-Loss Equation, Jour. of Agric. Engineering.
Wischmeier, W. H., D. D. Smith, (1960). A Universal Soil-Loss Equation to Guide Conservation Farm Planning. 7th International Congress of Soil Science, Madison, Wisconsin.
Wischmeier, W. H . , D. D. Smith, (1965). Predicting Rainfall-Erosion Losses from Cropland East of the Rocky Mountains. Agriculture Handbook 282, U.S. Dept. of Agriculture, Agricultural Research Service.
62

Wischmeier, W. H., C. B. Johnson, B. V. Cross, (1971). A Soil- Erodibility Nomograph for Farmland and Construction Sites. Journal of Soil and Water Consevation, a, (5), pp. 189-193.
Wischmeier, W. H., (1973). Upslope Erosion Analysis in River Mechanics, 111, H. W. Shen (ed.)
Woodburn, R., (1945). A Comparison of Erosion Losses After Turning Under Legumes and Non Legumes. Agric. Engng., St. Joseph, Michigan, 26, pp. 247-240.
Wolman, M. G . , (1964). Problems Posed by Sediment Derived from Con-
Pollution Control Commission, Annapolis. struction Activities in Maryland. Report to Maryland Water
Wolman, M. G . , J. P. Miller, (1960). Magnitude and Frequency of Forces in Geomorphic Processes. Journal of Geology, 68.
Wolman, M. G . , A. P. Schick, (1967). Effect of Construction on Fluvial Sedimentation in Urban and Suburban Areas in Maryland. Water Resources Research, 3, (2).
Woolhiser. D. A., P. H. Blinco, (1972). Watershed Sediment Yield- A Stochastic Approch. Paper Presented at Sediment Yield Work- shop, USDA Sed. Lab., Oxford, Mississippi.
Woolhiser, D. A.. P. Todorovic, (1974). A Stochastic Model for Sediment Yield for Ephemeral Streams. Proc. International Association for Statistics in Physical Science, Symposium of Hydrology, Tuscon, Arizona, August 29-September 2, 1971, USDA Misc. Publication 1275, pp. 295-308.
Yen, B. C., H. G. Wenzel, Jr., (1970). Dynamic Equations for Steady Spatially Varied Flow. Journal of the Hydraulics Division, American Society of Civil Engineers, 96, ( H Y 3 ) , pp. 801-814.
Yoon, N. Y., (1970). The Effect of Rainfall on the Mechanics of Steady Spatially Varied Sheet Flow on a Hydraulically Smooth Boundary. Ph.D. Thesis, Dept. of Civil Engineering, University of Illinois. Urbana, Illinois.
Yorke, T. H., (1975). Effects of Sediment Control on Sediment Transport in the Northwest Branch Anacostia River Basin, Montgomery County, Maryland, U.S. Geol. Survey, Journ. of Research, 2,(4), pp. 487-494.
Yorke, T. H., W. J. Davis, (1971). Effect of Urbanization on Sediment Transport in Bel Pre Creek Basin, Maryland; U.S. Geol. Survey Prof. Paper 750-B.
Yorke, T. H.. (1972). Sediment Yield of Urban Construction Sources, Montgomery County, Maryland; Progress Report Rock Creek Anacostia River Basin, U . S . Geol. Survey Open file Report, p. 39.
63

Young, R. A., C. K. Mutchler, W. H. Wischmeier, (1964). Influence of Row Direction and Type of Vegetal Cover on the Slope-Soil Loss Relationship. Trans. Am. SOC. Agric. Engr., 2, pp. 316-317 and 320.
Young, R. A., C. K. Mutchler, (1969). Soil Movement on Irregular Slopes, Water Resources Research, 5 ( 5 ) , pp. 1084-1089.
Young, R. A., J. L . Wiesrner, (1973). The Role of Rainfall in S o i l Detachment and Transport. Water Resources Research, 9(6), pp. 1629.
Ziemnicki, S . , C. Jozefaciuk, (1965). Soil Erosion and its Control. Translated from Erozja, Panstwowe Wydawnictwo Rolnicze i Lesne, Warszawa.
Zingg, A. W., (1940). Degree and Length of Land Slope as it Affects Soil Loss in Runoff. Agricultural Engineering, 3, pp. 59-64.
Zingg, A. W., (1941). Soil Movement Within the Surface Profile of Terraced Lands Unpublished report, U.S. Dept. of Agriculture, Soil Conservation Service.
64

DISCUSSION
Dr. C. Nordin: I have a comment on your remarks about sediment monitoring. About forty years ago the Federal Agencies in the United States set up the interagency sedimentation group to look at sampling problems and to standard- ize the methodology in the equipment. The geological survey was quite heavily involved in this. Paul Benedict, and Bruce Colby in particular did very extensive work back in the 30's and 40's. At that time they recog- nized that sediment sampling had to be event-based; that most of the sediment could be carried in a single event during the year or at very irregular intervals. They developed equipment to sample this and methodologies that give you a very good sample. Now people are not monitoring sediment properly. It is for one of two reasons: either they don't know what they are doing and they are unwilling to read the literature, or they are unwilling to spend the money to do it right. But these things have been known for four or five decades.
Dr. T. Dickinson: Well, I can only agree with you Carl. I think it is a good point. Some of these things have been known for years and years, but I only know that, for instance in Canada, we have not been sampling sediment for very long. The measurement techniques are known and they are used. In many cases they are not used well. Now, whether it is because people are not taking the time to use them well or don't know the appropriate mechanism, I am not sure. I don't want to go into the detail, but I agree with you that some of that methodology, or much of it, is already known if we just make good use of it. I suggest that particularly in small watershed studies where the events can be very, very short, people are not making the best use of it and I must say too, that in the International Joint Commission studies, there is a lot of experimentation in doing it and trying to do a better job. I am not openly criticizing a l l studies, but I do say many of the data we have on some of the basins need to be interpreted carefully. If one looks at the sampling frequency and looks at how they were taken, we better acknowledge just how that was done and interpret the results accord- ingly, and very often the sampling frequency in time just is not anywhere near where it has to be to give us meaningful results.
Dr. D. Wazling: Just a general comment that concerns the possibility of using turbidity measurements for documenting sediment output from drainage basins. One of the traditional views is to dismiss these immediately and say they have got far too many problems associated with them, but I have in fact experimented with these in England, and if one uses them for specific
that they will work and they do provide a very useful means of getting a catchment and carries out detailed calibration procedures it seems to me
continuous record of sediment concentration. The point I really want to get at is that if one takes that continuous record as being a worthwhile continuous record, it is extremely interesting to compare individual samp- ling programs with a continuous record. When you start to work out error functions of what individual programs would give compared to what a con- tinuous record would give, then it is absolutely staggering the errors that could be creeping in. And I really want to support your point, you could be 4 or 500% out with the figures when you compare them with the continuous record.
65

Dr. T. Pickinson: Two comments. One: we have taken a look at this. We have been able to find no good relationship on the basins we are working on right now between turbidity and suspended load that we could
venient way. One thing we found convenient about it is that it may be a use in a quantitative way. But I quite agree with you that it is a con-
way of identifying sources. In other words you can set them up and run them continously in a number of places in a basin, and at least begin to identify when there is load coming out of particular areas versus when there is no load coming out of certain areas; even if we can't say how much load is coming from here versus how much is coming from there. We have real diffi- culty making that step because we have done this in places where we got measurements. Certainly as an index of helping us sort out sources, we are finding it very convenient in a couple of the basins.
Dr. D. Simons: I would simply like to make the point in addition to what has been stated that as we monitor small watersheds, plots, large water- sheds; the data collection, the instrumentation, and so forth require a lot of time, a lot of amendments of effort. It is expensive and I do think that it is probably timely to mention that we should take every opportunity to utilize the physically-based models to determine what the data needs are. I think in many instances where we are going out and instrumenting watersheds and plots, we may be gathering data that are trivial OK we may be gathering during times when they are not important. By utilizing these models and carrying out sensitivity analyses, I think we can in the future better design to meet our real data needs to do a better job; get more back for the money spent in the effort.
Dr. T. Lsickinson: I would certainly agree. I think that the models can be a great help and play a great learning part and it may be a way of efficiently spending the dollars we have to try and reach some of the problems faster.
Dr. L. HetZing: Following your talk and the subsequent discussion, I see three different areas where additional study or research resources could be put:
1. Modeling and process development including laboratory and/or field studies directed to the understanding of actual processes.
2 . Field measurements over a variety of watersheds directed towards increasing OUT data base on actual sediment movement.
3 . Development of measurement techniques directed towards improving accuracy and lowering cost. The annual cost of a sediment measure- ment station is now $10,000 to $15,000.
Which of these three areas, given $10,000 or $100,000 or $1 million, would be the best investment considering the present state of the art.
66

Dr. T. Dickinson: I t h i n k t h a t i s one of the purposes o f th i s workshop. I t h i n k we have go t t o do them a l l and I ag ree you can not do them a l l on one p a r t i c u l a r b a s i n . But h o p e f u l l y i n some of t h e s e b r o a d e r p r o j e c t s l i k e t h e IJC o n e , t h e r e is room f o r some to be done on each one t o t ry t o l ea rn f rom each one , t o complement t h e o t h e r . I t h i n k t h a t is t h e s t a g e w e a r e a t . I d o n ' t t h i n k we a r e a t t h e s t a g e w h e r e we can say "let 's p u t a l l o u r money i n one bag". That begs the question, but I t h i n k t h a t is where w e a r e , b e c a u s e we must have more data to make s e n s e , b u t on t h e o t h e r hand we h a v e g o t t o l o o k a t some o f t he p rocesses . I guess the problem I have, i s t h a t i n terms o f p rocesses 1 t h i n k we may have t o s tudy them i n t h e f i e l d , and i n p a r t i c u l a r f i e l d c o n d i t i o n s . A t l e a s t I t h i n k i n some c a s e s w e have go t t o do more of t h a t b e f o r e we can even go i n t o t h e l a b o r a t o r y t o model them because I am n o t s u r e we even know q u i t e how t o s e t up t h e l a b o r a t o r y model f o r t h e f i e l d s i t u a t i o n w e want t o model. I t h i n k t h a t i n t h e l a b o r a t o r y t h e t i m e s c a l e w e can use is one of t h e a d v a n t a g e s , b u t we had b e t t e r f i n d o u t r e a l l y w h a t
t o t r y t o s o r t some of t h a t o u t . I t h i n k we have got t o do a l i t t l e b i t of is t h e time s c a l e of changes i n t h e f i e l d b e f o r e we go i n t o t h e l a b o r a t o r y
a l l of i t and h o p e f u l l y i n l o o k i n g a t a l l t h e r e s o u r c e s i n t h e a r e a a s a poo l we can come up wi th a b a l a n c e t h a t is meaningful, and avoid some of t h e p r e s s u r e s t h a t s u g g e s t h a s t e and "so and so down the road is do ing t ha t " . I n f a c t i f "so and s o down the road is do ing t ha t " , we be t t e r do some th ing e l s e and l e a r n i n t h a t way.
Dr. E. &gley: I h a v e t o d r a w t h i s s e s s i o n t o a c l o s e a s f a r a s my p a r t i - c i p a t i o n is concerned. I wi sh t o o f f e r one comment which I would l i k e a number of you who I know have been working on the re la t ionships between s p e c i f i c k i n d s of l and u se and t h e i r e f f e c t s upon water q u a l i t y t o c o n s i d e r . I f I s y n t h e s i z e c o r r e c t l y w h a t y o u h a v e s a i d T r e v o r ( D i c k i n s o n ) , i n g e n e r a l our a b i l i t y t o use e x i s t i n g d a t a g e n e r a t i n g t e c h n i q u e s is n o t s u f f i c i e n t l y d i s c r i m i n a t o r y t o e n a b l e a d i s t i n c t i o n t o b e made amongst various land uses.
who have done ve ry spec i f i c work on a t t e m p t i n g t o d i s c r i m i n a t e i n terms of I know at least two of you, and I am s u r e t h e r e a r e many more in t h i s room.
w a t e r q u a l i t y and up-stream land uses, and I would l i k e you t o t h i n k a b o u t t h i s b e c a u s e it is a q u e s t i o n t h a t i s g o i n g t o come o u t i n t h e w o r k i n g s e s s i o n s .
67


Anthropogenic Influences of Sediment Quality at a Source.
Pesticides and PCBs
R. Miles
INTRODUCTION
Environmental studies at the London, Ontario, Research Institute of Agriculture Canada have included investigations of the pollution of streams and water systems by insecticides used in agriculture. We have analysed soils in the stream basins, water, suspended sediment, bed load, bed material and fish for insecticide residue content. In this report I shall discuss the concentrations of insecticides found in soil and on the various sediments, the conversion of DDT to its metabolites on sediments, and the relation of water solubility to insecticide adsorption onto sediments. We studied Big Creek, Norfolk County, Ontario, which drains 280 square miles including an
Holland Marsh; an intensively cultivated vegetable muck area about 30 miles important tobacco growing area, and the water system draining the 7,500 acre
north of Toronto. To compare insecticide residues from the two areas in: (a) soil, (b) suspended sediment, and (c) bed material, samples from Big Creek contained 4 .0 , 0.11, and 0.026 ppm DDT, respectively; while corresponding values from Holland Marsh were 29, 8.0, and 0.30 ppm.
DISCUSSION OF RESULTS
An important sediment is the bed load - the shifting mass of sediment and detritus which we sampled using a Bogardi Bed Load Sampler. Residues of total DDT, dieldrin and endosulfan (Thiodan) found in bed material and bed load of Big Creek in 1973 are listed in Table 1. With one exception (August 14th) the concentrations on the bed load were several times greater than the concentrations in the bed material. This means that benthic fish and crust- aceans may be exposed to much m r e insecticide residue than would be indicated by analysis of bed material alone.
DDT converts to its metabolite DDE by splitting off HC1. This conversion to DDE is generally associated with enzyme dehydrochlorination in insects, mammals and fish. DDT conversion to another metabolite DDD is a
ditions. The ratio of metabolite to parent DDT is a measure of the deg- reductive dechlorination and is reported to be favoured by anaerobic con-
radation of the insecticide residue. In Holland Marsh bed material DDE/DDT increased from 0.2 (April) to 0.8 (September) in 1972 and from 0.2 (April) to 1.4 (September) in 1973. DDD/DDT increased from 1.6 (April) to 6.7 (September) in 1972 and from 2.6 (April) to 13.0 (October) 1973. Water is pumped from the marsh drainage ditch depending on water levels, and very little pumping occurs during the summer after June. I t would appear from the above results that in the quiet water of the drainage ditch the microorganisms are able to convert DDT to its metabolites during the period from spring through to
69

autumn. Both DDD and DDE are much less toxic to mammals than the parent DDT (acute oral LD50 to male rats > 4,000, 880 and 200 mg/kg respectively) so the above degradation is a lessening of overall toxicity of DDT residues although DDE is blamed for the thin eggshell syndrome in birds.
Sediment must require considerable time to move along the bed of a stream from source to mouth and we theorized that microorganisms would be able to convert some DDT to its metabolites during the time the sediment moved downstream in Big Creek, a distance of about 30 miles. We sampled bed material at 6 locations on the same day over this distance in 1972 and DDE/ DDT increased from 0.2 (upstream) to 1.5 (stream mouth), while DDD/DDT increased from 0.1 (upstream) to 2.0 (stream mouth). Thus the ratio DDD/DDT in residues in the bottom sediment increased 20 times in samples from upstream to the stream mouth! A similar study in 1973 produced the same trend but not
in overall DDT mammalian toxicity. to as significant a degree. Again this represents a considerable reduction
In analysing water samples for insecticide residue content it is our normal practice to analyse the whole water sample including suspended sediment. To determine the amount of insecticide adsorbed on suspended sediment we filter companion samples and analyse the filtered sediment. Averaging a large number of samples from Big Creek and Holland Marsh we found the per cent of the whole warer analysis which was adsorbed on the sediment to be 61% average for DDT (30-93% range) and 15% average for dieldrin ( 3 - 4 2 % range). These values are in agreement with the water solubility of these compounds (0.0012 ppm for DDT and 0.186 ppm for dieldrin). In the Holland Marsh water samples, diazinon (an organophosphorus insecticide) was present
onto the sediment. These data also agree with the water solubility value (40 at concentrations greater than the dieldrin but no diazinon was found adsorbed
ppm) for diazinon. Our laboratory adsorption experiments verify these findings, i.e. that the more water soluble the chemical, the less it is adsorbed onto the sediments.
In summary, we have found significantly different insecticide residue concentrations in soil, suspended sediment, bed load and bed material. We have noted the conversion on sediment of DDT to its less toxic metabolite DDD and also to DDE. And we suggest that we might have quite different environmental pollution with insecticides in the future - the sediment- associated organochlorine insecticides settle into the bed material of bays when a stream enters the receiving lake, but the water-soluble organophosphorus
distributed in the lake. insecticides which persist will continue on with the water to become widely
70

TABLE 1.
INSECTICIDE RESIDUES IN BED MATERIAL AND BED LOAD, BIG CREEK, NORFOLK COUNTY, ONTARIO (PARTS PER BILLION)
Total - DDT 1973
18 30 October 2
35 100 September 15
27 21 August 14
26 45 July 10
30 198 June 26
Bed Mat. Bed Load
18 62 October 16
Dieldrin
Bed Mat. Bed Load
1 6
1 4
2 1
1 8
1 2
<1 2
71


Anthropogenic Inf luences of Sediment Qual i ty a t a Source .
P e s t i c i d e s and PCBs
R. Frank
INTRODUCTION
Between 1974 and 1976 samples of suspended s o l i d s were c o l l e c t e d a t the r iver mouths o f those watercourses on the Canadian s ide of t h e Great Lakes tha t de l . ivered a t least 0.5% of t h e w a t e r c o n t r i b u t e d t o t h a t l a k e by Canadian land drainage. The suspended so l id s were removed from stream water d u r i n g t h e h i g h f l o w s i n s p r i n g by c e n t r i f u g a t i o n a n d f r e e z e d r y i n g . The
under PLUARG study Task D. Many suspended s o l i d s h a v e s t i l l t o b e f i e l d w o r k w a s c a r r i e d o u t by s t a f f o f t h e Canada Cen t re fo r In l and Wate r s ,
ana lysed and t he f i nd ings g iven here in mus t b e t r e a t e d as pre l iminary .
RESULTS
p e s t i c i d e s ; a l o n g L a k e s Erie and S t . Clair t h e number was 14 of 24 streams; along Lake Huron i t was 9 of 2 1 streams (1974), and 5 of 48 streams (1975), and a long Lake S u p e r i o r i t was 5 of 45 s t reams.
Around Lake Ontario 34 of 53 streams sampled were a n a l y s e d f o r
r e s i d u e s i n 1 9 7 4 were 138 and 160 ppm i n s u s p e n d e d s o l i d s e n t e r i n g L a k e s Ontar io and Huron , whi le in 1975 res idues were c o n s i d e r a b l y l o w e r a t 3 4 . 0 ,
C l a i r , Huron and Superior, In 1974 t he l a rges t componen t i n t he CDDT was t h e 2.9 and 2 . 3 ppb , r e spec t ive ly , on suspended so l jd s en t e r ing Lakes Erie, S t .
p a r e n t compound DDT, bu t i n 1975 t he l a rges t componen t was DDE.
DDT and/or i t s m e t a b o l i t e s were p r e s e n t i n a l l samples. Mean
D i e l d r i n was p r e s e n t i n 50 and 9% of s a m p l e s c o l l e c t e d a t r i v e r mouths a long Lakes Ontar io and Huron i n 1974; these conta ined mean r e s i d u e s of 1 .5 and 0 .2 ppb respect ively. A l l suspended so l id s en t e r ing Lakes Erie- S t . Clair (1975) conta ined d ie ldr in ; the mean r e s i d u e b e i n g 3 . 6 ppb. Mean r e s i d u e s were 0.4 and 0.2 ppb d i e l d r i n i n s o l i d s e n t e r i n g L a k e s Huron and Super ior and were d e t e c t e d i n 80% of samples .
O n t a r i o (mean r e s idue 2 .3 ppb) bu t none en te red Lake Huron in 1974. In 1975, endosul fan was p r e s e n t on 79%, 80% and 40% of suspended sol ids enter ing Lakes Erie - S t . C l a i r , Huron and S u p e r i o r ; a t t h e r e s p e c t i v e mean c o n c e n t r a t i o n s of 5.5, 0.8 and 0.4 ppb.
Endosulfan was p r e s e n t i n 19% of suspended so l ids en te r ing Lake
Heptachlor epoxide and chlordane were not de tec ted on suspended s o l i d s e n t e r i n g L a k e O n t a r i o o r Lake Huron i n 1 9 7 4 t o a limit of 0.5 ppb. Heptachlor epoxide was present in 50%, 40% and 2 0 % , r e spec t ive ly , o f suspended s o l i d s e n t e r i n g L a k e s Erie - S t . Clair, Huron and S u p e r i o r i n 1975. The
85% and 80% of suspended sol ids enter ing Lakes Erie, S t . Clair and Huron i n r e s p e c t i v e mean r e s i d u e s were 1 . 2 , 0.2 and <0.1 ppb. Chlordane was present in
1975 a t mean concent ra t ions o f 2 .9 and 0 .8 ppb , r e s p e c t i v e l y .
73

solids over the two year period to a limit of 1-10 ppb. Organophosphorus insecticides were not found in any suspended
PCBs were present in all suspended solids over the 2-year period. The highest concentrations were in those entering Lake Ontario (194 ppb) and Lake Huron (84 ppb) in 1974. Mean concentrations were 60, 20 and 20 ppb, respectively, in 1975 in solids entering Lakes Erie - St. Clair, Huron and Superior.
A few samples were analysed for HCB in 1974. Two of nine samples entering Lake Ontario contained HCB at 5 ppb. No HCB was found in two samples analysed from streams flowing into Lake Huron.
There were enough samples in 1974 to analyse suspended solids entering Lake Ontario and Lake Huron for s-triazines. None of those streams flowing into Lake Huron contained s-triazines and only 3 of 34 contained detectable levels of s-triazines entering Lake Ontario. The mean residue of the 3 samples was 510 ppb. There was insufficient sample in 1975 to do s-triazine analyses and more sample is being obtained.
monthly intervals throughout the year. Both IDDT and PCB varied greatly trom A few streams in Lakes Ontario and Erie - St. Clair were sampled at
month-to-month. This was especially the case among suspended solids from streams entering Lake Ontario (1974). On the other hand the same parameters showed only small differences in 1975 from Lakes Erie - St. Clair and Huron.
CONCLUSION CCMNTS
This report is intended to be only preliminary and a more exact interpretation will have to await completion of analysis and calculations of actual amounts of pesticide and pollutants being carried to the Great Lakes by streams.
1 4

Table 1. Pesticides in Suspended Solids Collected at the Mouths of Rivers and Streams on the Canadian Side of the Great Lakes
Contaminant 1 Lakes
Ontario (1974)
Erie 6 St. Clair Huron (1975)
Superior (1974) (1975) (1975)
Samples
Analysed
Z M T
Dieldrin
Endosulfan
U VI
Hept. Epox.
Chlordane
PCB
53
34
34 138 2-2380
18
0-6 1 .5
6 2.3
0-35
0
0
34 194 2-1800
24
1 4
14 34
1.1-115
1 4 3.6
0.5-13.8
11 5.5
0.0-18.3
7 1.2
0.0-3.6
1 2 2.9
0.0-20.0
14 60
10-330
2 1
9
8 160 0-1330
1 0 . 2
0.0-2.0
0 - -
0
0
9 84
20-370
48
5
5 2.9
1.4-5.2
4 0.4
0.0-1.5
4 0 .8
0-4.3
0 .2 2
0.0-0.6
4 0 .8
0.0-1.0
20 5
8-30
5
5 2 .3
1.0-4.1
4 0 .2
0.0-0.4
2 0 . 4
0.0-2.0
1 <0.1
0.0-0.2
0
5 20
10-30
'No organophosphorus insecticides found in any suspended solids.
HCB present in 2 of 9 samples from L. Ontario - mean 1.1 ppb, range 0-5 ppb, absent in 2 samples from L . Huron.
Atrazine in 3 of 34 samples in L. Ontario - mean 45 ppb, range 0-1110 ppb. No atrazine in 9 samples from L. Huron ( 1 9 7 4 ) .

I TABLE 2.
L a k e s DDE TDE
Lake Ontario (1974)
L a k e S u p e r i o r ( 1 9 7 5 )
1 .4 Lake Huron (1975)
38 Lake Huron (1974)
8 .0 L a k e s E r i e & S t . Clair (1975)
54
1 . 7
COMPONENTS OF CDDT FOUND IN SUSPENDED SOLIDS COLLECTED AT THE MOUTHS OF RIVERS AND STREAMS ON THE CANADIAN SIDE OF THE
GREAT LAKES
Content i n s u s p e n d e d s o l i d s ( p p b )
OPDDT I P ~ D D T I CDDT ”
20
6 . 4
1 4
0.6
0 . 5
76

DISCUSSION
Mr. J . CuZbertson: On the first half of the discussion, one of the tables indicated 59 and 62% of the insecticide was found on the sediment. How much sediment was this on? Did you determine the mass or surface area or Size Of
these sediments?
Dr. R. Miles: These are very low sediments, all less than 100 milligrams per litre. Some of them are very small, around 10 milligrams per litre. Does that answer your question?
Mr. J . CuIbertson: The major point was, what was the mass of the material associated with this percent?
Dr. R. Miles: I think I had that on one of the first slides, where we had parts per billion level of DDT on the suspended sediment, and as I say this suspended sediment was in the very low milligrams per litre. Now that table you asked about was the percent of the insecticide of the whole water sample that was absorbed on the sediment. We used the whole water sample in corre- lation with flow data that we have from Water Survey of Canada, and we actually measured the pounds of DDT. We calculated them out in weekly pro- gression through the season and we have a paper on that with nutrients and insecticides from Big Creek that is in press. The weights are in grams per year, even some of the insecticides. It does not sound very dramatic, but the concentrations in the water in the streams are still greater than the
basis of the whole water samples or with the flow-data. recommendations by the EPA in the States. We have quantified them on the
Dr. E. GngZey: On the table where you showed the downstream increasing
bed load or on the suspended solids fraction? I was not quite sure about conversion of DDT to DDE and DDD this is, as I understand it, taken on the
that.
Dr. I?. Miles: It was on the title as "Bed Material". That was bed material which we figured would take a considerable time to work down. It probably only gets moved during storm events, say, but we figured that the micro- organisms in the bed material would have a longer period of time to work on the substrate as it moved downstream.
Dr. E. Ongtey: Would it be correct to say that most of this would be asso- ciated with the fine fraction - the clay sized fraction?
Dr. R. Miles: In Big Creek there is no real clay. Mostly gravel 1 1 1 1 sand. The clay would come up in the Holland Marsh where there is a hea\ Idy

underlay under the bed material. It is a little difficult to characterize up there. The bottom mud does not get incorporated down with the clay. It forms its own bed material, the solid mass as opposed to the shifting bed load above that.
Dr. E. Ongley: In your opinion we should not then perhaps restrict ourselves
quality, which is a statement that has been made earlier. to looking at merely the fine sediment fraction, if we are looking at sediment
Dr. R. Miles: Maybe I didn't make that point clear. The point of the bed load analyses was that the benthic fish and crustaceans are exposed to a higher concentration than you would appraise from a bed material analysis of the more permanent bed material. I think you can see, however, that there is a,considerable degradation and dilution from concentrations found in the soil. Also, with the large number of insecticides found in the soil, we are only finding a small proportion of them in the sediments.
Dr. J . Weber: I have a comment. A lot of the grains of sand and coarser material are coated with fine clay particles and with fine organic substances. You can't really separate them. You may get a lot of the finer material associated with the coarser material in surface coverage.
This suggests that there is a lot of corn production. I was wondering if The question I have is that the analysis was on atrazine.
there was any soyabean production, and if so, had you analyzed for dini- troanilins?
Dr. R. Frank: The only anilin that we have looked for is Arochlor.
Dr. J . Weber: Arochlor would be an acid analid. I mean Trifluralin.
Dr. R. Frank: No.
Dr. J . Weber: The reason I ask is because I was also curious as to whether you had analyzed any of the sediments for some nitrosamine contaminants that have been found.
Dr. R. Frank: One of the problems that we have been facing is that we only have five grams of sediment. Our first analysis is for the organochlorine group. If any sample is left we go to the triazine group. If any sample is still left we go to any other group. By then we have usually exhausted our sample.
system to obtain more sample. I understand that one would have to sit at the mouth of some of these streams for a month to get enough sample to do all the analyses. Perhaps Dr. Thomas could elaborate on this.
This is one of the problems we are up against. We need a
70

Dr. H . Thomas: In order to investigate some of the points raised in this discussion, I should explain our procedures. We have gone up to the mouth of the Grand River with our sampling equipment. We sat there for eight hours, pumped some 4600 litres of water and recovered the solids. We have good recoveries of the solids in four size fractions. We have the associated water samples that we can supply for analysis.
to fill in those samples where Dr. Frank did not have enough material. We intend to sample next spring (1977).
It is our intention to do more of this type of work. We want
The point that should be made is that we are not really discussing loadings in this context. We are having a look at concentrations of these materials, as they appear at the interface of the Lakes and rivers themselves.
I think it is rather interesting if one looks at the organo- chlorines. We have done analyses on most of the residual samples from past sampling in the Great Lakes (Lake Erie, Lake St. Clair, Lake Ontario and presently Lake Huron. Lake Superior is yet to be done). This represents an enormous amount of work.
coming into, for example Lake Erie, one gets some shocks. Ralph Miles men- tioned that in certain cases insecticides coming from these watersheds are
are depositing in the open waters of the lakes are much higher and cannot be in the grammes or kilogrammes range. Yet the amounts of these materials that
accounted for from these watersheds. When one looks at Lake Erie, the major impact is from the Detroit River. We know that there are not many pesticides or PCBs in Lake St. Clair. Yet once one looks at Western Lake Erie, the sediments are in terrible shape. Something is happening in that stretch of river that we have to investigate. It is a massive impact compared to a more minor impact from the watersheds themselves.
Once you look at something that equates to a mass balance
Dr. R. Frank: I might just comment, that in the agricultural watersheds we are looking at a much wider range of parameters. We are not only doing that, but we are carrying field surveys to determine exactly how much material is
use of Trifluralin, we go back and look at the water in that watershed, going onto the land surface. Where we have a watershed that has got a big
instead of looking at it as monitoring and trying to get a handle on what is going on out there in the field and then trying to determine what is present. This is being done.
Dr. J . Weber: If you took samples of the bottom deposits, has anyone sampled the concentration of the chemicals in the deposits with depth? You say DDT is decreasing with time, surely then, that means the DDT found deeper might be in higher concentrations, unless it is degraded and in that case you would find metabolites.
Dr. R. Thomas: Well I think that is a function of the ability to sub-sample a sediment core with the resolution you are talking about. For example, in many lakes one centimetre would represent approximately 10 years of accumulation. You have to wait a long time to see any decline. But if you go back up through a core looking for PCBs, we have quite a nice picture in Lake Erie. It starts to appear quite strongly around 1955.
79

Dr. H . Pionka: Were these sediments primarily organic? Were they very high in organic matter?
Dr. I?. Thomas: We have measured total organic carbon in the suspended samples and I must confess I was very surprised indeed. I was anticipating high organic content. This is not the case. We are running up to orders of 7% organic carbon which is not high if you look in the Bay of Quinte in the Great Lakes. You are up over 20% organic carbon in samples from that area, so these are very low in organic matter.
80

Anthropogenic Influences of Sediment Quality at a Source
Nutrients: Carbon, Nitrogen and Phosphorus
M. Miller
INTRODUCTION
Crop production practices have a marked influence on the amount of
the nutrient concentration on the sediment either by altering the physical sediment eroding from farm fields. They may also have a marked influence on
characteristics of the sediment or by altering the nutrient content of surface soil and hence of sediment.
ALTERATIONS IN PHYSICAL CHARACTERISTICS OF SEDIMENT
The erosion process is selective in that sediment generally contains a larger proportion of finer particles and organic matter than does the source soil. The nutrients carbon, nitrogen and phosphorus are in higher concentrations in the finer particles. This is demonstrated for phosphorus in Figure 1 in which the ratio of the phosphorus content of soil fractions to that of the total soil (P enrichment ratio) is related to the maximum par- ticle size included in the fraction. The fact that the phosphorus enrichment in runoff sediment is related to enrichment in clay and organic matter content is also demonstrated in Table 1.
Any management practice which tends to reduce the carrying capacity of the runoff water will tend to reduce the mean particle size of the sediment and hence will tend to increase the nutrient concentration on the sediment. Tillage practices can affect the runoff velocity through its effect on surface roughness, degree of incorporation of plant residues etc. Table 2 illustrates the effect of three tillage practices on the nutrient concentration in the sediment from simulated rainfall.
Romkens, &. , (1973) states that "differences in the N and P concentrations in runoff sediment between tillage systems are primarily due to selective soil erosion.... Ridges across slope and/or corn residue on the soil surface act as sediment traps and natural barriers to surface runoff".
Thus management practices which reduce sediment loss probably will not reduce the nutrient loss proportionately.
ALTERATIONS IN NUTRIENT CONTENT OF SIRFACE SOIL AND HENCE OF SEDIMNT
Carbon
Crop production generally reduces the organic matter content of the surface soil. Because organic matter is critical in maintaining stable soil
agricultural lands. structure, a reduction leads to increased sediment loads in runoff from
81
t

0
0
m
Ln
N
0
N
a2

TABLE 1
PHOSPHORUS ENRICHMENT OF SEDIMENT FROM RUNOFF PLOTS AT GUELPH, ONTARIO AS A FUNCTION OF ENRICHMENT IN
CLAY AND ORGANIC MATTER ( 6 EVENTS FROM 6 PLOTS - 1973-1975)
Dependent Variable I I R2 Independent Variables
P Enrichment Clay Enrichment (Cl. Enrich. ) Org. Mat. Enrichment (Org. Mat. Enrich. )
0.61* 0.64 0 .69 0.70
* R' - proportion of the variability in P enrichment accounted for by
preceding it in the table. regression including this independent variable and all others
I TABLE 2
EFFECT OF TILLAGE SYSTEM ON RUNOFF AND NUTRIENT CONTENT OF SEDIMENT
(FROM ROMKENS. NELSON AND MANNERING, 1973)
Tillage Runoff ( cm)
Chisel 4.39 Coulter 3.81
5.56 Conventional
1.68 1.87
2 4 . 7 4
2022 1278 I 1147
616 387 308
83

Although it is difficult to increase the organic matter content of
heavy applications of manure or sewage sludge, i f they are not incorporated. the surface soil on a sustained basis, temporary increases may occur from
Runoff from such fields would have a markedly higher carbon content, b o t h in solution and in suspended particles during initial runoff events following application. Later runoff events would exhibit much lower differences as illustrated by the data in Table 3 .
Nitrogen
Because nitrogen in soil is, for the most part, associated with the organic matter, the nitrogen and carbon contents of sediment will be closely related. Applications of fertilizer, manure or sewage sludge will temporarily increase the nitrogen content of surface soil. If these materials are applied to the soil surface during the late fall or winter and are not incorporated, the spring runoff will be appreciably higher in both dissolved and particulate nitrogen. If they are added at the times and rates most effective for crop production, there should be little increase in the nitrogen content of the runoff .
Phosphorus
The phosphorus content of the surface soil is modified by crop production practices to a much greater extent than either carbon or nitrogen. Most soils in the natural state are deficient in available phosphorus. Sustained production of high yielding crops requires that phosphorus be added to the s o i l to increase the available phosphorus level. This increases the total phosphorus content of the sediment and, perhaps more importantly it
phosphorus addition on the "extractable P" content of a soil is illustrated increases the labile phosphorus in particular. The influence of fertilizer
by the data in Table 4 .
Because phosphorus reacts in the soil to form only slightly soluble compounds, phosphorus applied to the surface is retained in the surface 1 to 2 cm. thus increasing the available phosphorus content of this portion of the soil to a much greater extent than if the phosphorus were mixed throughout the plow layer (Table 5 ) .
The increase in "Extractable P" in the surface soil results in a similar increase in the "Extractable P" of the sediment and in the dissolved P concentration in the runoff water as illustrated by the data in Tables 6 , 7 and 8.
The relation between dissolved P in runoff and the "Extractable P" in the sediment can be demonstrated €urther by data from runoff plots a t Cuelph. For six runoff events from each of six plots during 1973-1975, "Extractable P" (0.5 N NaHC03) accounted for 55% of the variability in dissolved ortho-P in runoff. The data are plotted in Figure 2. It is apparent from Figure 2 that when manure is present on the surface, there is no relation between dissolved P and extractable P content on the sediment. However, in the absence of surface manure, the relationship is reasonably good.
a4

I TABLE 3
ORGANIC CARBON CONTENT OF SURFACE SOIL (0-1 CM) AND OF SEDIMENT FROM RUNOFF PLOTS AT GUELPH, ONTARIO
%C Treatment Soil (0-1 cm) Sediment*
No manure 1.78 2.52 Manure** - on surface 1.98 2.77
* Average of 9 runoff events 1973-1975
** Applied each year since 1968 without incorporation
TABLE 4
THE INFLUENCE OF FERTILIZER P ADDITION ON "EXTRACTABLE P" CONTENT OF AN ONTARIO SOIL
Fertilizer P Added (kg Plha17 yr)
"Extractable* P" (Pi? PIP)
0 75
7
4 4 600 20 300 11 150
9
* Extractable with 0.5N NaHCO 3'
85

TABLE 5
"EXTRACTABLE P" IN AN ONTARIO SOIL FOLLOWING YEARLY MANURE APPLICATIONS FOR 8 YEARS
Depth
( cm)
0- 1 1-2 2- 3 3- 4 4-5 5-7
9-11 7-9
11-13 13-15
Manured Not incorporated
110 105 95 17 63 45 31 18 17 15
* Extractable with 0.5 N NaHC03.
Extractable P*
Manured Plowed
(Pg PIP)
58 52 55 47 63 68 55 65 55 45
No Manure
28
TABLE 6
"EXTRACTABLE P" IN SOIL AND SEDIMENT AND DISSOLVED ORTHOPHOSPHATE CONTENT OF RUNOFF FROM PLOTS
AT GUELPH, ONTARIO
"Extractable P*" Soil (0-1 cm) Sediment** Dissolved**
Ortho P in Treatment Range Runoff
"""""-(~p/g)"""""""-
Manured - not incorporated 108 100-200 140 Manured - plowed 57 50-95 63 No manure 28 44-90 62
(mgll)
1.38 0.56 0.51
* Extractable with 0.5 N NaHC03
** Six storms 1973-1975.
86

I TABLE 7
THE EFFECT OF PHOSPHORUS FERTILIZER APPLICATION ON "EXTRACTABLE P" IN SEDIMENT AND ON DISSOLVED ORTHOPHOSPHATE
IN RUNOFF. (FROM ROMKENS AND NELSON - 1974)
Extractable P* Dissolved Ortho P Fertilizer P Applied in Runoff in Sediment
(kg/ha) (mg/U ( d g )
0 56 113
14.6 35.4
0.07
0.44 57.6 0.24
* Extractable by Bray P.l test ( . 0 3 N NHrF + .025 N HC1)
1 TABLE 8
INFLUENCE OF METHOD OF FERTILIZER APPLICATION ON "EXTRACTABLE P" IN SEDIMENT (TIMMONS, BURWELL AND HOLT - 1973)
Method of Application "Extractable PI'* in Sediment
(VdP)
No Fertilizer
85 Plowed, disced and fertilized 30 Plowed, fertilized and disced 20 Fertilized, plowed and disced 20
* Extractable with Bray P. 1 test (.03 N NH4F + .025 N HC1)
a7

0
m m
2.0
1.8
1 .6
EL a - 1.2
LC ’c 0 c I
c 0.8 .- V
n.
al - 2 0.4
n .-
0
0
0 Sur face Manure
y = 0 . 0 2 9 7 8 6 ~ - 0 . 0 0 0 0 9 8 ~ ~ - 0.881201 ( r 2 = 0.55) ..
0 . / a 6 b 10
0
0
0
1
40 8 0 100 160 200
E x t r a c t a b l e P c o n t e n t o f s e d i m e n t ( p p d
F i g u r e 2: Re la t i onsh ip be tween NaHCO - e x t r a c t a b l e P o f t h e s e d i m e n t a n d d i s s o l v e d P i n t h e r u n o f f a t t h e e x p e r ? r n e n t a l p l o t s i n G u e l p h .

phosphorus to soil will increase the labile P of the eroded sediment and also the dissolved orthophosphate of runoff water. However, when one attempts to relate dissolved orthophosphate in runoff to the Extractable P in the soil, the relationship is much less clear. The data presented in Figure 3 are from samples of runoff collected from farm fields in two small Ontario watersheds. The area in the field from which the runoff occurred was sampled and the "Extractable P" was determined. The data illustrates the marked effect of surface manure on the dissolved P levels. There is, however, no apparent relationship between dissolved P and extractable P in the soil, even when the samples from the manured fields are excluded. This is probably due, at least
selectivity in the erosion process. The extractable P content will be greater in part, to the variation from one runoff event to another in the degree of
in the finer soil particles. The degree of enrichment in clay and hence the enrichment of extractable P in the sediment will vary from one event to another as well as with management practices, thus it is not possible at this time to predict dissolved P in runoff directly from the extractable P level in surface soils.
From the above discussion it is apparent that application of
Profitable crop production requires that the available phosphorus level be increased in most soils which have not previously been fertilized. rhere is a level, however, above which no further economic increases in yield fill be obtained. This level varies from crop to crop. Generally, it is ligher for vegetable crops such as potatoes, and tomatoes, than for field :KO~S such as corn or barley. Thus soils that are used for vegetable crop xoduction are likely to have a higher available phosphorus content than are rhose used for field crop production. This is illustrated by data in Table 3 .
There are a number of soil tests that can be used to determine the available phosphorus content of the soil and hence the fertilizer required €01- most profitable yield levels. They provide an effective tool to maintain the available phosphorus content of the soil at, but not above, the optimum level. This will assure continued production of high yielding crops while ninimizing the dissolved and total phosphorus content of runoff from agri- cultural fields.
are essential to sustained production of profitable yeilds. To minimize the effects of these applications on the nitrogen and phosphorus content of runoff water we must improve our understanding of the nitrogen and phosphorus requirement of major crops and of the fate of nitrogen, particularly. when applied to the soil. This would allow us to better match the nutrient con- tent of the soil to the needs of the crop, thus avoiding unnecessary levels in the soil and in runoff.
We must accept the fact that applications of nitrogen and phosphorus
We must also develop management systems which permit incorporation
where they are much more subject to the erosional processes. of manure and fertilizer into the soil rather than leaving them on the surface
a9

0
al
a C
m r al
U
'c L 3
m
m
0
0
0
0
0
00
'c 0
-+
.-
c o
m
VI
L
c
ax
U
r
a
0% c
MO
L I
LL
m
al I
"C
n
a
u3
m
a
02
P "
C
NU
x
c
w
1-
I:
90

TABLE 9
"EXTRACTABLE P"* LEVELS I N ONTARIO SOILS I N RELATION TO CROP GROWN
Crop Average Ex t r ac t ab le P*** Optimum E x t r a c t a b l e P**
(Llg/g) (ug/g)
Mixed g r a i n Corn Tobacco P o t a t o e s Soybeans Tomatoes
1 4 20
115 60 1 5 60
I
12 18 64 4 1 18 34
1 1 * E x t r a c t a b l e w i t h 0 . 5 N NaHCO 3 ** Test beyond which no f u r t h e r P r e q u i r e d
*** S a m p l e s s u b m i t t e d t o O n t a r i o S o i l T e s t i n g L a b o r a t o r y . July 1, 1974 - June 30, 1975
9 1

I , TTEM TUHE Cl TED
Romkens, M. J. M., D . W. Nelson and J. V. Mannering, 1973. Nitrogen and Phosphorus Composition of Surface Runoff as Affected by Tillage Method, J. Envir. Qual., 2, 292-295.
Romkens, M. J. M., and D. W. Nelson, 1974. Phosphorus Relation- ships in Runoff from Fertilized S o i l s , J. Envir. Qual., - 3, 10-13.
Timmons, D. R., R. E. Burwell and R. F. Holt, 1973. Nitrogen and Phosphorus Losses in Surface Runoff from Agricultural Land as Influenced by Placement of Broadcast Fertilizer, Water Res. Research, 9, 658-667.
92

DISCUSSION
DP. 7'. Logan: I would like to make a comment. The comment is that I think we have to be very careful about the emphasis we put on soluble phosphorus values coming off small watersheds or plots. We have to keep in mind that the adsorption reaction of phosphorus on sediment is a very rapid process. I have been doing some thinking on this regarding some of those soils that are high in available phosphorus. There are some possibilities that may be happening. One possibility is that on those soils that have appreciable available phosphorus, we might be seeing for example dicalcium phosphate that will be dissolved as we get a dilution during the runoff process. This will produce some of the soluble phosphorus that you are seeing. On looking downstream, you may see a readsorption phenomenon.
Dr. 7'. Dickinson: You mentioned looking ahead to suggestions for remedial work, that one might be able t o improve communication systems to get people to use better fertilizer amounts on their fields.
Carrying this a step further, might it be realistic that in situations where one is applying manure or sludge, things that release nutrients more rapidly into surface runoff water, that it may be that in certain parts of watersheds there may be fields that are not very directly connected to the drainage and microdrainage system. There are fields that for only brief periods of the year might have runoff going into the drainage systems. In areas like that it might be very safe to carry on certain kinds of practices. There might be more opportunities to use a variety of manage- ment practices to be safer. On the other hand there may be parts of a drainage system near the main channel or very close to connected drainage systems where the management practices that would be allowable would be very restricted. In other words, one would have to be much more restrictive
practices on a watershed basis rather than just on a crop basis, there are there. We mentioned that when you start differentiating between management
going to be some problems telling the farmer over here that he can do these things and the farmer over here that he cannot. I see that as a possible way of looking to remedial measures not just on a crop basis or a soil basis, but even on a watershed basis and how that watershed may be receiving things downstream.
Dr. M. MiZZer: Certainly in terms of fertilizer use we do use and apparently need to use much more phosphorus on some crops. We have to build the s o i l phosphate level up to much higher levels on some crops than others. If you could control the production of crops t o those certain areas, it would help. I think that will be a major undertaking.
93


Anthropogenic Influences of Sediment Quality at a Source.
Metals
G. K. Rutherford
releasing controlled amounts of sediments to receiving waterbodies. Anthro- pogenic activities have burst into this process and caused far-reaching and mostly detrimental environmental changes, the extent of which has not yet been fully appreciated.
Erosion and sedimentation are natural, usually gentle, processes
Whereas the soluble ionic transport of chemicals is perhaps the most insidious and dangerous, the object of this paper is to show the myriads of ways in which sediment transported materials are damaging to our way of life. In particular I will emphasize the so-called heavy metals.
BASIC ~ T E R I A L S
A s most suspended particles have been soil materials in the immediate past, it would seem appropriate to consider some of the basic properties of soil materials.
Soils consist of: (i) skeleton grains which form the virtually stable skeleton and are generally immobile and unreactive; (ii) plasma or the fine reactive and mobile parts; (iii) voids or the holes in the soil and (iv) water and e. Although plasma is considered to be the only solid material which moves intact through the soil, both plasma and skeleton may be elements in sediment transportation.
The plasma is generally considered to consist of particles less than 2u in minimum dimension and the skeleton greater than 2U but in reality
COLLOIDAL MATERIALS or materials possessing the properties of colloids - the upper size is about l o p . In other words the plasma consists mainly of
i.e. HAVING SURFACE CHARGES, usually negative. Not only the INORGANIC materials derived from rocks but also ORGANIC materials derived from the destructive microbial breakdown of formerly living organisms exhibit these properties. Virtually all finely comminuted materials of colloidal size possess, to some degree, this electric charge and strangely enough, amorphous materials both organic and inorganic appear to have the highest charges. The total charge, usually measured as ability to hold positively charged cations, is known as the CATION EXCHANGE CAPACITY and this is a specific property of each known compound and of major importance in the understanding of heavy metal transport in suspension.
Soil materials, measured using conventional methods, exhibit a marked total positive electric charge although it has long been known that negative anions may be held or ADSORBED by soil materials. During the last 125 years many theories to explain this phenomenon have been put
95

forward. Since about 1940, the theoretical background t o anion holding processes has been modestly researched but since 1960 and particularly 1970 the anion adsorbing powers of soils is attracting a wider circle of interested workers and a new pattern of thinking appears to be developing.
Soil materials art said to have the property of IONIC EXCHANGE: i n other words the adsorbed ions may be exchanged by other ions and there appear to be three major criteria determining if an ion will be held or exchanged on a colloidal body. Most heavy metals go into solution as individual cations, complex anions, or cations in a variety of forms. These parameters are generally considered to be: ionic charge, ionic radius and degree of hydration. Thus, in soils, cations tend to be bonded by van der Waals-type forces to the "parent" colloid whilst anions generally are more labile and move through and out of the soil body with drainage waters. The concentrations of P O b , S O q , N O J and C 1 in lake and other water bodies, the causes of eutrophication, are a direct result of this.
SOIL FORMING PFWESSES
then appropriate to examine briefly the ramifications of soil forming processes f o r sedimentary reactions. Amongst other things, the soil forming processes tend to:
I f , indeed, sediments have passed through a soil stage it is
(a) produce finer inorganic and organic particles - i.e. more colloids;
(b) form neoformations.
(i) Inorganic. These are formed by the association of ions in solution to form a new insoluble material:
2M + xSi + yo -f [M Six OY]- gives new silicate minerals or z J
more simply Mg + Ca + Cor + CaMgC03.
If these new formations are of colloidal dimensions they will acquire a negative charge. However there is a very important exception to this and that is the sesquioxides:
Fe + OH [Fe(OH) 31' 4
4 or A1 + OH (Al(0H) 31'
and there are all manner of variations over the above theme inasmuch as the final product may have a very variable composition. The same process involves such elements as Mn, Cr and V. These neoformations, particularly in the case of Fe, give soil its characteristic range of colours from the tropics to the Arctic. The sesquioxide neoformations are characteristically POSITIVELY charged and amorphous in nature when formed. With the passage of time, these become crystalline and change their charge slowly to negative and may become quite strongly negatively charged. The origin of this negative charge in soils is thoroughly explored and known. The process of positive adsorption on to silicate colloids is still largely speculative.
96

(ii) Organic. The soil forming processes tend to destroy recently dead plant and animal tissue and form, amongst other things, strongly complexed compounds with metallic cations. The chelates with EDTA* are perhaps the best known and understood and occur in ionic and colloidal dimensions. These compounds commonly enhance the passage of elements such as Zn, Cu, Fe through soils and are said to SEQUESTER these elements. When these organic compounds are broken down by microbial attack the metals become available for recomplexing or precipitation. In the sequestering process the metal may simply be enmeshed or surrounded by the rest of the long- chain molecule(s).
(iii) Weak combination bonding. In the generation of neoformations some metal cations by virtue of size, charge or hydration may be "dragged"
hydroxide (oxide). Although this bonding may be loose, the heavy metal (seduced?) into a loose association with another compound such as iron
elements are strongly occluded into the newly formed compound. Our col- leagues in exploration geochemistry called this SCAVENGING. Whereas the process is by no means as simple as I have implied, it i s extremely
elements. The examples of Cr and Co although at different ends of the important in the concentration of many elements in compounds of other
scale are essentially similar. The concentration of Cr in laterites is thought to be due to this process.
must be made to the nutrition of animals and plants. N, P, K are known as In order to understand the concern about heavy metals, reference
MACRONUTRIENTS and must be fed to plants at the rate of 1 kg/ha; Ca, and Mg are intermediate whilst Zn, Co, Cu, I, F, B , etc., are the so called trace or MICRONUTRIENTS and are fed to plants as g/ha. The heavy metals fall in the micronutrient category and many of these are essential for plant, animal and human growth. What is one group's food is another group's poison. Some trace elements are essential for plant growth in general whilst these may not all be essential for human growth and vice versa. Na is a good example of one of these. The trace (heavy) metals are essential for one or many metabolic functions in plants and/or animals. Fe is essential for blood formation, Mg is needed for chlorophyll, V is part of cholesterol synthesis and Cr is needed for glucose synthesis. Deficiency in B causes cauliflower to malform and deficiency of Mo inhibits the nitrogen fixing bacteria, causes white muscle disease in fowls and probably plays a role in multiple sclerosis in humans.
function of a lack of a nutrient in the growth medium, however, it is It is a common understanding that deficiency diseases are a
equally likely to be a function of ION ANTAGONISM by which process the excess of one element may cause a deficiency of another. Zn appears to be antagonistic (and vice versa) to Ca, Cu, Se and Cd so that excess amounts of this element in industrial waste waters will cause deficiency diseases associated with the other elements. Vegetables in British Columbia in the same area showed differences of element content of up to 500 times, showing extreme differences in microenvironmental conditions.
* Ethylene diamine tetra-acetate

geochemically, to go into solution. At a pH less than 3 one is measuring pAl rather than pH. A1 is extremely poisonous to plants and animals as witnessed by the failure of jute in Guyana.
Low pH in soils may cause AI, which is normally very stable
If heavy metals are transported by sediments and deposited by irrigation waters, as flood waters, in channel and stream bottoms, it is not unlikely that the new environment may give rise to conditions which divorce the element from its parent sediment and allow it to circulate in soil or plant nutrient solution where its ramifications and mischief may be far-reaching.
ANTHROPOGENIC SCURCES OF HEAVY METALS (AND PROCESSES AFFECTING THEIR DISTRIBUTION IN SEDIMENT TRANSPORT)
to sediment transport will now be briefly discussed. The role of the Some of the major sources of pollutants and their relationship
transport medium and the special influence of the source will be brought out. The following man-sponsored sources of environmental pollution are perhaps the best known.
Sewage, sludge and effluent. (Human metabolic processes)
Animal metabolic processes.
Domestic waste disposal.
Industrial waste disposal.
Agricultural plant protection + fertilization. Urban expansion.
Industrial extraction processes; Smelting and Mining.
Precipitation.
Automobiles.
Case study - Mercury.
Human metabolic processes. The greatest uptake of heavy metals in the human intestine occurs at the end of the alimentary tract. The metabolic need for these is quite low hence human feces tend to concen- trate these elements. In the sewage disposal process the more soluble elements (geochemically) such as N, P and K tend to be in solution in '
urine and the heavy metals attached as finely adsorbed organic colloids. In a secondary treatment plant much of this material and a portion of the soluble materials is precipitated out by the use of electrolytes. This SLUDGE is removed and not uncommonly used on agricultural land, primarily as a source of organic matter and P . In an untreated sewage system it is abundantly clear how effective sediment is in concentrating and carrying heavy metals.
Sewage sludge has been shown to have many admirable properties for plant growth - a common limiting factor is the plugging of voids in the soil and the consequent increase in runoff which in turn results in re-entry to the waterways with sediment-borne pollutants.
98

domestic animals result in slight variations of the same effects as in (b) Animal metabolic processes. The many stomach forms of the different
(a) above but in general the same tendencies hold. The soil, and partic- ularly soils with well developed A horizons have an admirable ability to adsorb and process animal manures of a carrying capacity up to 200 times that of common mixed-agriculture. However feed-lot agriculture is based on carrying capacities far higher than these. Many if not most feed lots are sited along or close to waterways. The surface soils soon become trodden and impermeable so that virtually all runoff from the lot empties into the waterway. Well fermented cattle manure from the ruminant stomach must provide about the best imaginable source of transportable sediment- borne heavy mineral pollutants. Most of the recorded fish kills are likely primarily and indirectly a function of excess dissolved nutrients.
(c) Domestic waste disposal. Most domestic waste is still entered in the soil: in the case of incineration pyrolysis and other "refining" processes a treated product is still placed in earth materials. The many studies which have been done on the composition of municipal garbage show the extreme range of composition from place to place and even from day to day. However a great amount of heavy metals, in an unsuspected variety of forms, from additives to paper, tires and paint, through the agencies of microorganisms and decomposition processes may come into solution as simple or complex ions and gain access to the groundwater and become potential hazards. However, the passage and transport of these ions is affected by sediment transport under only two conditions:
(i) when the entombing material is very coarse so that water may move relatively unimpeded through it, and
(ii) during the process of infilling when the spoil material may be washed by rain or by runoff, sediment transport may remove certain heavy metal cations particularly in readily available form such as battery acid and metal pickling solutions.
(d) Industrial waste disposal. Industrial waste disposal concerns indus- tries which discard waste in: (i) liquid form or (ii) solid form. In general the same factors play their role in breakdown and transport as has been described above. Any industrial waste which carries finely divided materials, be it silicates or iron filings, will operate more or less as a colloidal system. The nature of the colloidal "host" will be the determining factor in how long and how effectively the heavy metal element is bound in sediment or is liberated. Host colloids which are broken down by organisms either in an oxidizing or reducing environment will liberate the heavy metal in a potentially hazardous form at an earlier stage than otherwise.
Two host colloids worthy of note in this connection are: (i) tailings from ore refining processes and crushed products of coal, cement and (ii) fertilizer industries, although the same conditions will be obtained in any refining process which uses finely comminuted material.
At Sudbury, for instance, The International Nickel Company produces some 35,000 tons of tailings per day which are fed into large tailings lakes. The average size of these tailings is about 3011 and thus

would have insignificant colloidal properties. Although the tailings are relatively high in some heavy metals they would not constitute a solution hazard should they accidently get into waterways. The surface mining of coal and indeed the crushing of deep-mined coal produces quantities of colloidal-sized, chemically neutral materials which are not uncommonly exposed to surface runoff waters. Not uncommonly, rock minerals in associated strata contain sulphides of Zn and other heavy metals. It is not inconceivable that the host colloidal materials may partake in the transport of heavy metals to some degree. Whereas there is an increasing volume of literature on the ionic solution of heavy metals from such sites, there is, at least to this author virtually no known literary material on the sediment trans- port of heavy metals from such areas.
soluble and sprayed as solutions o r , in fact, with colloidal suspensions (e) Agricultural plant protection and fertilization. Most biocides are
such as oil or clay as the host colloids. .Those biocides which have a heavy metal as the primary killing agent or a host for a series of chlorohydro- carbons (anion), will be transported in erosional processes in the same manner as has been outlined earlier for other sources. The ease of microbial break- down releasing the heavy metal will determine the degree of environmental hazard. Exchange relationships on inorganic colloids will be a similar deciding factor.
Although N, P and K are the primary nutrients used in agriculture a series of "tailor-made" fertilizers are produced for many crops. Those fertilizers in which heavy metals are concentrated either intentionally or accidently during the manufacturing process will present potential hazards for waterways as a result of erosional activities.
(f) Urban expansion. It has been convincingly shown that in many environ- ments urban construction including highways, airports, etc., is the greatest source of sediment in waterways. As the A and B horizons are the major s o i l horizons exposed to erosion and as much of the land used for urban expansion has been prime agricultural land it is not unlikely that the eroded sediments carry significant amounts of adsorbed heavy metal cations bound to both organic and inorganic host colloids. As these sojl horizons are highest in potentially electropositive colloids it can be surmised that these sediments are highest in both complex and simple anions of heavy metals.
As the area of urban roofs and asphalt parking lots steadily increases so must the colloid content of storm water runoff. In arid regions and in dry parts of the year in humid areas the fine dust content of cities increases strikingly. At the same time our affluent society has more careless spills of oils and solids which provide sources of heavy metals.
puts into the atmosphere SOz, N02, other similar gases and the stable (9) Industrial extraction processes. The smelting process if unchecked
oxides and sulphides of heavy metals as particulates. The latter fall to
lesser distances. For example, the concentration of these near the old the soil surfaces or are swept down in the smoke plume at greater o r
smelter at Coniston is high, whilst the concentration from the new 400 m stack at neighbouring Sudbury is spread out a greater distance. Modern
100

smelting methods helped by modern legislation have seemed to reduce the access of active particles to colloids for transport. The future danger will be more from dissolved ionic materials than from transported materials. However, in the past, the smoke plumes and precipitation killed vegetation and have bared the soil surface so that active erosion could take place. The less refined pollutants landing on the surface would be adsorbed first to organic colloids and transported by waterways. Cation exchange processes may then obtain and cause heavy metal cations to become available as poisons or growth inhibitors.
(h) Precipitatg. Although precipitation has long been known to be far from pure near cities and industrial areas it is only recently that detailed studies of the amounts of metals being deposited have been undertaken. It is perhaps in Norway that the most prolific information is available. In recent years, pollution from rainfall has driven salmon and trout from most rivers in the south of the country. The primary effects of this precipitation in most places in North America will be found in solution in rivers and streams and in vegetation changes. This factor, although
However in more arid regions with marked dry seasons, this precipitation important, will have little apparent influence on sediment transportation.
factor may play an important if not critical role due to heavy metal transpcrtatior, ty sediments.
(i) Automobiles. The addition of lead tetraethyl as an antiknock compound in gasoline has occurred since the early 1930's . A great deal of research has been done on soils and vegetation along highways. Most of the research has produced a self-evident result -- the s o i l s are high in adsorbed lead. Notwithstanding the possible high lead contents of vegetables, this lead has remained rather stable. Only when road extensions and widening take place does erosion remove the lead adsorbed on colloids. Two other previously unconsidered elements are Cd and Zn in automobile tires: both elements have been found in conspicuously high amounts near highways. The extensive use of de-icing salts may cause cation exchange reactions which liberate, temp- orarily at least, these three elements in ionic form. Lubrication oils have also been found to have significant amounts of both Cd and Zn.
FUTURE RESEARCH NEEDS
addition to the present data collecting research efforts which must continue, I would submit that the following are worthy of support.
1. The nature, species and charge properties of suspension
Naturally my suggestions will be chauvanistic. However in
transported colloids.
2. Phase relationships between adsorbed and solution ions i n stream channels.
3. The nature of the heavy metals and all ions being transported by sediments.
4 . Laboratory studies on negative (anionic) adsorption.
101

May I, finally, have the temerity to suggest two future events are worthy of your interest which may affect your research efforts:
1. Climatic change. There is a considerable volume of evidence to suggest that we may be approaching a period where almost violent climatic fluctuations may be the norm rather than the exception. This will present a whole new range of demands on the knowledge and experience of our sediment- ologists.
?.. How much longer can the strained soil colloids surrounding commercial, industrial and domestic garbage dumps continue with their life saving ionic exchange without being totally clogged? Many of these dumps are perched precariously near water bodies.
REFERENCE LIST - A. Some Appropriate Texts
Soil Conditions and Plant Growth, E. W. Russell, 10th Edition Longmans, London, (1973).
Non-Agricultural Applications of Soil Surveys, R. W. Simonson, Elsevier, (1974).
Trace Elements in the Environment, E. ,L. Kothny, American Chemical Society, (1973).
Cleaning Our Environment - The Chemical Basis for Action, F. A. Long, American Chemical Society, (1969).
The Natural Environment: Wastes and Control, R. F. Christian 4.. Goodyear Pub. Co., Pacific Palisades California,
(1973).
Micronutrients in Agriculture, J. J. Mortvedc &., American Society of Agronomy, (1972).
Organic Substances in the Environment I & 11, M. Schnitzel, Marcel Dekker, N. Y., (1972).
Cleaning Our Environment - The Chemical Basis for Action, (ed.), F. A. Long, American Chemical Society, (1969).
Vaxtekologi, M. G. Stalfelt, Svenske Bokforlaget, Stockholm.
- B. Symposia and Conferences
Trace Substances in Environmental Health, University of Missouri
I (1967) I1 (1968)
111 (1969) IV (1970)
Agricultural Pollution of the Great Lakes Basin, EPA - Water Quality Office, 13028-C7/71, US Govt. Printer
102

'The Chemical Investigation of Recent Lake Sediments from Wisconsin and their Interpretation, US EPA Water Pollution Control Series, 16010EHR03/71.
Second Research and Applied Technology Symposium on Mined-land Reclamation, National Coal Board, Kentucky, (1974).
Environmental Protection in Surface Mining of Coal, US EPA Environmental Protection, Technology Series, EPA - 670/2/74-093.
Processes, Procedures and Methods to Control Pollution from Mining Activities, US EPA, 430/9.73.011.
Land For Waste Management, (ed.), B.P. Warkentin, National Research Council, Ottawa, (1974).
Municipal Waste Disposal - Problem or Opportunity, Ontario Economic Council, Toronto, (1971).
Solid W&tes - 11, (ed.)., S. S. Miller, American Chemical Society, (1973).
Wastes - Solids, Liquids and Gases, Chemical Publishing Co., N.Y., (1974).
Canada - Ontario Agreement on Great Lakes Water Quality: Research Report No.
2 Sludge Handling and Disposal Seminar, (1974)
3 High Quality Effluents Seminar, (1976).
28 Removal of Phosphates and Metals from Sewage Sludge, (1973).
30 Heavy Metals in Agricultural Lands Receiving Chemical Sewage Sludges, (1975).
33 The Removal and Recovery of Metals from Sludge and Sludge Incinerator A s h , (1976).
35 Land Disposal of Sewage Sludge, Vol . 111, (1976).
38 The Harvest of Biological Production as a Means of Improving Effluents from Sewage Lagoons, (1976).
Subsurface of Disposal of Waste in Canada 111, R. 0. van Everdingen, Environment Canada Technical Bulletin 82, (1974).
Soils in Environmental Protection, B. C. Dept. of Agriculture, 5th B. C. Soil Science Workshop Report, (1975).
First Symposium on Mine and Preparation Plant Refuse Disposal, Coal and the Environment Technical Conference, Kentucky, (1974).
Sediment in a Michigan Trout Stream, USDA Forest Service NC-59, (1971).
F i s h Kills Caused by Pollution In 1972, US EPA 440/9-73-001, (1973).
103

Analyse av organiske mikroforurensninger i nedbdr, G. Lunde og Jdrgen Gether, SNSF Project, (ed.), F Braekke, Oslo, (1974).
Avsyring av sure vann, A. Henriksen og M. Johannessen, SNSF Project IR5/75, (1975). (A literary review of acid precipitation).
104

Regional Overview of the Impact of Land Use on Water Quality
A. 1). MeEZroy
INTRODUCTION
Midwest Research Institute was given the task in mid 1974 of conducting a national assessment of nonpoint source pollution for the U.S. Environmental Protection Agency. The program had two phases. In
were developed. In Phase 11, these functions were employed to calculate Phase I, loading functions for estimation of nonpoint pollution loadings
pollutant loadings on a national basis. The loadings were calculated and reported for minor basins, major basins, the 48 states, and the continental United States. In addition, loadings were aggregated for each of the 10 federal (EPA) regions.
We were asked to develop loading functions based on "available" data. This meant generally that the more sophisticated models under development were not appropriate, since these usually require very detailed information which is not available to the user. Further, such models require a sophistication in use which usually is beyond the capabilities of the personnel involved in nonpoint planning and to whom the functions were directed.
A further constraint consisted of, in most cases, steering clear of determining the impacts of nonpoint pollution on water quality. We thus estimated delivered loads, but did not estimate the resultant impacts on water quality. It goes without saying that this represents a major void which must be fiiled if we are to develop a good picture of the impacts oE nonpoint pollution.
PROGRAM DESCRIPTION
The program included analysis of natural background nonpoint pol- lution, i.e., pollution obtained in the absence of modern man's influences. One can readily appreciate that such a state is not easy t o define, n o r is it a simple matter to develop natural or background loadings which can be rigorously defended. Nevertheless, activities in this area have yielded results which are interesting and one of the most informative comparisons involves background and the present disturbed state.
The loading functions developed and used on the program relied heavily on soil loss from erosion as a building block. Soil loss can be described and estimated with reasonable accuracy by existing equations, f o r which a large body of data is in existence. If one assumes that bulk loadings (or total loadings) of nitrogen, phosphorus, and organic matter can be relatcd simply to s o i l concentrations of these pollutants, then
105

one has a f a i r l y p o w e r f u l t o o l f o r c a l c u l a t i n g l o a d s of ROD, t o t a l n i t r o g e n , and to ta l phosphorus f rom major nonpoin t sources . This approach b e g i n s t o f a i l (or lw less a c c u r a t e ) when eroded sediment is r e l a t i v e l y minor, as i n w e l l managed f o r e s t s o r g r a s s l a n d s , p a r t i c u l a r l y f o r s o l u b l e forms of n i t r o g e n . The s o i l l o s s e q u a t i o n s are a l s o a powerfu l too l f o r e s t ima t ing l oads o f heavy me ta l s de l ive red i n s ed imen t s .
Other approarhes a r e r equ i r ed fo r numerous o the r sou rces , snch as f e e d l o t r u n o f f , l e a c h n t e f r o m s o l i d w a s t e d i s p o s a l , m i n e d r a i n a g e , i r r i g n - t i o n r e t u r n f l o w , and urban runoff. The paper w i l l b r i e f l y p r e s e n t t h e approaches which were taken for such cases .
I'he paper w i l l , h o w e v e r , d e a l p r i n c i p a l l y w i t h t h r r e s u l t s o f t he a s ses smen t , r a the r t han on methods for ca lcu la t ing loads . As i n d i c a t e d above , the assessment was made fo r minor bas ins , ma jo r bas ins , and tlle
which d e p i c t land use hy s t a t e and po l lu t an t l oads by s t a t e . S i m i l a r 48 sL:i tes . :md has been summarized by region. Data w i l l be presented
p r e s e n t a t i o n s w i l l a l s o be made f o r l a n d use and po l lu t an t loads by t h e 10 f e d e r a l r e g i o n s .
DISCUSSION OF RESULTS
O n r o f t h e most us r tu l compar isons involves loads f rom an a c r e o f a p a r t i c u l a r s o u r c e . Some comparisons fol low. Acre load of phosphorus f r o m a background condi t ion, averaged for the 10 regions, vary f rom about 0 . 2 l b / a c r e / y e a r t o a b o u t 6 l b / a c r e / y e a r . L o a d s from f o r e s t s a r e a b o u t t h e same as background in reg ions which were heavi ly fores ted in t h e n a t u r c i l s t a t e , and a r e as l i t t l e a s a b o u t 15% of hackground i n regions which we're
s p a r s e l y f o r e s t e d i n t h e n a t u r a l s t a t e . A c r e l o a d s of phosphorus f1om cropland range from about L t o 20 t imes t uckground w i th t he g rea t e s t r e l a t i v e i n c r e a s e s o c c t ~ r r i n g i n r e g i o n s h e a v i l y f o r e s t e d i n Lhe n a t ~ ~ r a l s t a t e . I n a r i d and semi-ar id regions where cropland i s c h i e f l y i r r i g d t t ' d , c r o p l a n d r e p r e s e n t s a n improvement over background. Pasture and range a c r e l o a d s a r e 1 . 5 t o 2 times background i n Regions V I - I X , and 3 t l l 2 0
g i v e c a l c u l a t e d a c r e l o a d s ranging from about 20 t o 2,000 times back$l,round. times background i n Regions I-V and X. F e e d l o t s (no control assumed)
U n c o n t r o l l e d f e e d l o t s a r e c l e a r l y l e s s o f a n i n s u l t i n b o t h r e l a t i v v m d a b s o l u t e t e r m s i n s e m i - a r i d r e g i o n s of t h e c o u n t r y . Urban runoff c<Irr i t 'h w i t h i t l o a d s of p h o s p h o r u s s ~ ~ b s t a n t i a l l y i n e x c e s s of background (3 t o 30 t imes) in h igh r a in1 all regions o f the count ry and 0 . 2 t o 2 times back- g r o u n d i n t h e a r i d t o m o d e r a t c r a i n f a l l r e g i o n s . N i t r o g e n a n d BOD compar isons wi th background fo l low the same t r e n d s as phosphorus.
Sediment from cropland is about 10 times background in Regions I , 11, 111 and VII; about 20 t imes background in Regions VI, VIII, 1 X and X, I t i s i n t e r e s t i n g t h a t p a s t u r e a n d r a n g e d o n o t d i f f e r s i g n i f i c a n t l y f rom c rop land , i n mos t pa r t s o f t he coun t ry , i n y i e lds of sediment per
more h i l l y ground which erodes more readi ly and which d e l i v e r s i ts a c r e ; t h i s is due i n p a r t t o t h e f a c t t h a t p a s t u r e s g e n e r a l l y occupy the
sediment more completely to s u r f a c e waters i n compar i son t o gene ra l ly f l a t t e r c r o p l a n d . F e e d l o t s ( u n c o n t r o l l e d ) y i e l d 1 0 t o 100 times back- ground acre-loads of sediment; urban runoff 1 t o 10 times background; and cons t ruc t ion 1 t o 1 , 0 0 0 times b a c k g r o u n d . C o n s t r u c t i o n i l l u s t r a t e s p e r h a p s b e t t e r t h a n a n y o t h e r c o m p a r i s o n t h e f a c t t h a t g r e a t e s t r e l a t i v e
106

impacts occur when a natural condition in a high rainfall area is extensively disturbed (as in construction) and that the same activity can have a small relative impact in arid and semi-arid regions.
CONCLUSIONS
Conclusions generally supported by the results are as follows:
* I t is immediately apparent that loads of sediment, nutrient elements, and BOD are proportional, as one might predict, to
state to a highly disturbed state. Agriculture is the the extent that land has been converted from its natural
predominant "disturbed" state, and thus in gross or overall terms is the predominant influence on nonpoint source emissions.
X Comparisons of background loadings with as-is loadings show clearly that the greatest relative impact of man's activities occurs in parts of the country which were relatively non- pclluting in the natural state due to the existence of a n
by reason of climate and terrain highly productive agricultural excellent ground cover of grasses and forests, but which are
lands. The corn b e l t accordingly has suffered the greatest __- relative increase in nonpoint pollution compared to background. This overall effect would appear to reflect the relatively high overall complex of man's activities in such regions, i.e., urbanization and industrialization as well as utilization for agriculture.
* Total loadings tend to be high in regions which are extensively committed to agriculture even though rainfall requirements for agriculture are somewhat marginal, i.e., the Great Plains, but the relative impact of man's activities (increase over back- ground) is less in such regions because the "natural" state is more polluting than the natural state in higher rainfall areas .
* As one proceeds to the arid- semi-arid regions (the West and Southwest) man's activities tend to have a positive effect (excluding secondary effects such as salinity in irrigation return flows), since these activities involve augmentation of rainfall and generation of improved ground cover conditions.
'< While silviculture is a major land use, pollutant loadings
major land use--agriculture--because major land disturbances on an overall basis are substantially less than for the other
in silviculture are relatively minor in extent at any one time. However, the pollutant loadings from disturbed forest lands are high, and transitory local impacts are accordingly also high.
* Construction, surface mining, small feedlots, and terrestrial disposal a l so turn out to be relatively minor in the overall sense, and the impacts would thus appear to be significant
quite high. chiefly when viewed as localized impacts, which again can be
107

* Particularly noteworthy are regions in which man has endeavored to "use" land which has moderate to high rainfall and poor terrain. This effect is pronounced in the states such as Kentucky and Tennessee.
* An i formative set of results was obtained in a study for P NCWQ in which effectiveness of pollution control in agriculture was estimated. The results demonstrate clearly that a rela- tively small proportion of land in agriculture is responsible for a significant fraction of the total load, and that benefits measured in terms of pollution reduction are fairly startling if this land is converted to uses which are judged to be "adequate"
with other observations noted above, indicate that marginal from a soil conservation standpoint. These results, together
land use is particularly critical from the environmental nonpoint source point of view.
* Heavy metal loads delivered in eroded surficial soils and sediments are calculated to be major in quantity rather than "trace" as one might intuitively expect. We are n o t certain what lessons can be learned or what conclusions can be drawn. It is clearly evident that large quantities of heavy metals are delivered to surface waters, either from the natural or man- disturbed states of rural lands, and that these constitute a high background against which loads,from point sources should be viewed and interpreted.
* The overall results of the assessment are rather crudely interpretable in terms of the basic physical/chemical character- istics of the land and water, and of climate. Perhaps the simplest example is mine drainage, which is a function of both
neutralize the acid--the western coal mining regions have a the capacity of a region to generate acid and its capacity to
high neutralizing capacity, while the eastern regions do not. Similarly, relationships between delivered loads of nutrients and BOD, and observed burdens of these same pollutants indicate that surface waters differ across the country in assimilative/ use capacities. The relative proportions of these pollutants further indicate that eutrophication processes can be expected
rainfall to high rainfall regions. to follow a fairly systematic trend as one proceeds from low
* Finally, it is usually true that nonpoint loads of pollutants are substantially in excess of in-stream burdens. One concludes that it is imperative that a better understanding be developed of the nature of assimilation of these pollutants, including adsorption on sediments or trapping out in sediments, equilibria between sediments and water, chemical and biology processes, and transport processes.
+ National Committee on Water Quality.
108

U,S, EPA REGIONS
I. Maine, Vermont, New Hampshire, Massachusetts, Connecticut, Rhode Island.
1 1 . New ‘fork, New Jersey
111. Pennsylvania, Delaware, Virginia, West Virginia, Maryland
IV. Kentucky, Tennessee, North and South Carolina, Georgia, Mississippi, Alabama, Florida
V. Ohio, Illinois, Indiana, Michigan, Wisconsin, Minnesota
VI. Arkansas, Louisiana, Oklahoma, Texas, New Mexico
VII. Iowa, Kansas, Missouri, Nebraska
VIII.Colorado, Montana, North and South Dakota, Utah, Wyoming
IX. Arizona, California, Hawaii, Nevada
X. Alaska, Idaho, Oregon, Washington
109

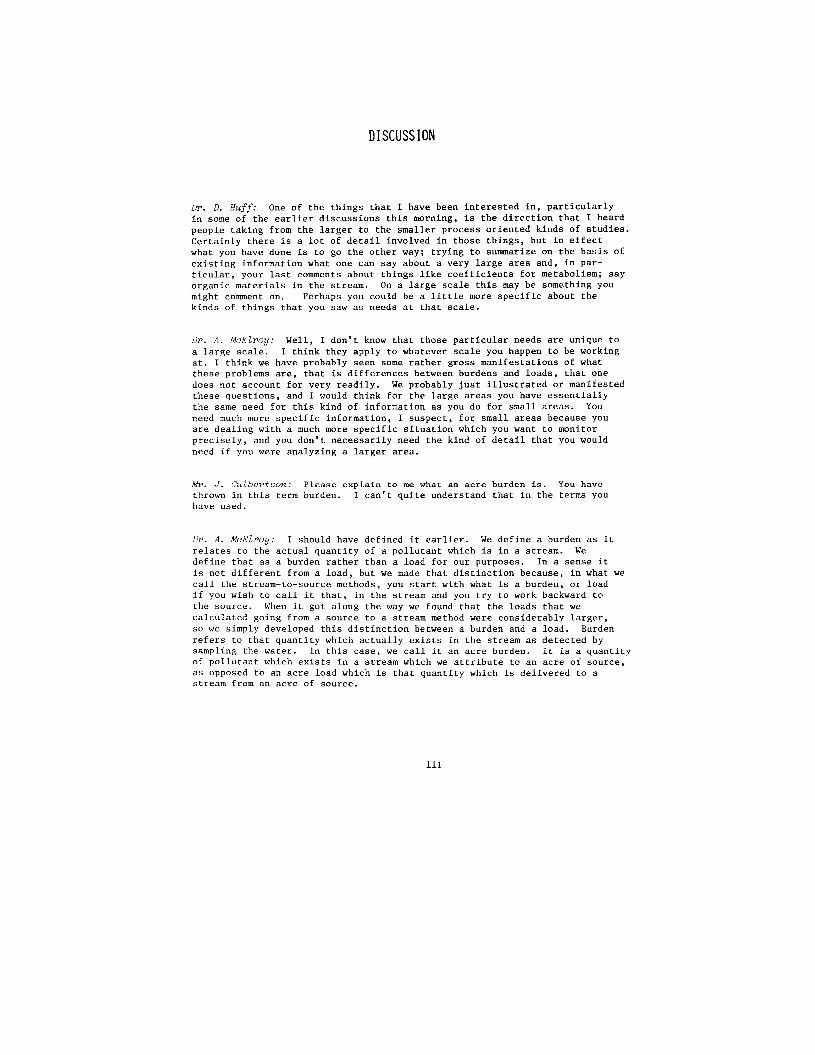
DISCUSSION
Dr. D. Huff: One of the things that I have been interested in, particularly in some of the earlier discussions this morning, is the direction that I heard people taking from the larger to the smaller process oriented kinds of studies.
what you have done is to go the other way; trying to summarize on the basis of Certainly there is a lot of detail involved in those things, but in effect
existing information what one can say about a very large area and, in par-
organic materials in the stream. On a large scale this may be something you ticular, your last comments about things like coefficients for metabolism; say
might comment on. Perhaps you could be a little more specific about the kinds of things that you saw as needs at that scale.
Dr. A . McEZroy: Well, I don't know that those particular needs are unique to a large scale. I think they apply to whatever scale you happen to be working at. I think we have probably seen some rather gross manifestations of what
does not account for very readily. We probably just illustrated o r manifested these problems are, that is differences between burdens and loads, that one
the same need for this kind of information as you do for small areas. You these questions, and I would think for the large areas you have essentially
need much more specific information, I suspect, for small areas because you are dealing with a much more specific situation which you want to monitor precisely, and you don't necessarily need the kind of detail that you would need if you were analyzing a larger area.
M r . J . CuZbertson: Please explain to me what an acre burden is. You have thrown in this term burden. I can't qujte understand that in the terms you have used.
Dr. A. McEZroy: I should have defined it earlier. We define a burden as it
define that as a burden rather than a load for our purposes. In a sense it relates to the actual quantity of a pollutant which is in a stream. We
is not different from a load, but we made that distinction because, in what we call the stream-to-source methods, you start with what is a burden, o r load if you wish to call it that, in the stream and you try to work backward to the source. When it got along the way we found that the loads that we calculated going from a source to a stream method were considerably larger, so we simply developed this distinction between a burden and a load. Burden refers to that quantity which actually exists in the stream as detected by sampling the water. In this case, we call it an acre burden. It is a quantity of pollutant which exists in a stream which we attribute to an acre of source, as opposed to an acre load which is that quantity which is delivered to a stream from an acre of source.
111

Dr. D. Baker: For all of your loading calculations you use a delivery ratio, and I am wondering to what point you are delivering these loads when you are adding up data for counties, states or regions.
Dr. A. MeElroy: We developed a delivery factor which is based on stream densities and upon soil textures and these delivery factors were developed on a land resource area. In other words, we did not develop delivery factors which were specific to a county; rather, we assigned a delivery factor for a big region to a county. We are reluctant to publish our county loads you might say, or to pass them out because they have values assigned to them in a number of cases which are typical of the region, but not necessarily specific to the county.
Dr. D. Baker: A s I recall your delivery ratio graphs, they are not a function of area anyway. They are more related to drainage density, which is area independent. I can't see how you can come up with a delivery ratio that isn't related to the area of the watershed.
Dr. A. MeEZroy: Well, I'll see if I understand your question. If you happen
miles of stream per square mile for example, this essentially is a drainage to have the drainage density in any particular county, and the number of
density. If you have that figure for the county, then this would be essen- tially a drainage density which would in effect depict for you the average distance to the nearest permanent stream for that county. I should think in that case that it would be specific for that area.
Dr. D. Huff: I think that what he is asking is "did you look at the total load delivered say at the outlet, wherever that is for the whole region, and then normalize that?" In other words, to get a per unit area you had to have an area to divide by.
Dr.. A. McEZroy: Well as I said our basic unit for making the calculations was the county, however, we did use for specific sources, the acreages of the various categories of land use in that area. We would apply our delivery
are not quite satisfied yet. factor to whatever acreage we happened to come up with. I have a feeling you
Dr. 5'. Yaksieh: I notice you reported some of your data to about 8 signi- ficant figures. Do you really have that much confidence in it?
U P . A . McElroy: It is hard to teach the computer to do otherwise. Heavens, no !
Dr. S. Yaks ich: What type of error estimates would you place on the numbers you are producing?
1 1 2

at2. (1. hI,-! '~rY,'~t; EPA asked us to develop error analysis for our loadings. We asked some of our people to do this and they said there were not enough statistics available. We did it and if you want to consider all the possible errors, they are quite large; say 50% i f you want to consider enough factors. However, I think that without being able to prove it, generally we are talking about perhaps 202, and one of the reasons is that we are dealing with fairly large areas with a considerable amount of statistics which have been generated for these areas and I would rate them at about 20-25%. Now that is going to vary. For some of OUT pollutants from feed lots, for example, we used ranges of concentrations of pollutants in feed lot runoff which would range a l l the way from very nearly zero up to a couple of thou- sand, so pick a number in the middle of them. We had to For this kind of study.
Dr. S. Yuksich: The reason why I asked i s some of your loading functions were used by another study done by the National Commission on Water Quality in the Lake Erie drainage basin by Dalton, Dalton & Little. Some comparisons of the loadings that they got of total phosphorus coming into Lake Erie in comparison to the type of numbers that we generated from a stream sampling program at about 600 samples during the course of a year for each stream, showed their estimates were about double ours coming out of the streams.
Dr. A. McBZroy: I guess I wouldn't expect the error to be that bad. You have t o bear in mind that these are average numbers that we are using and any one particular year can be very much in deviation from an average year. This is one thing you need to take into consideration. I think that if you were to accept these loading functions in a sense that they are the average and if you are looking for an average condition, then probably they should for the most part be reasonably good. If you were to consider the deviation year to year and try to use an average number you might find out they would be considerably in error for a particular year.


Influence of Flow Characteristics on Sediment Transport with Emphasis on Grain Size and Mineralogy
J . Culbertson
The transport of sediment by water has been studied and documented since at least 1808 (Inter-Agency Committee on Water Resources, 1940). Although not documented, canal builders in India, Afghanistan, and other countries must have learned much about the subject (see Bibliography). A l l o f those early studies were aimed at learning processes of sediment
building of structures and water-conveyance systems. Objectives wLre transport that related to the engineering aspects; that is, related to the
related mostly to determination and prediction of the volume of sediment being deposited in or removed from channel beds, or transported into reservoirs. Theoretical studies were related to the mass and volume of mineral sediments -- those sands and gravels that continuously act to change and modify river systems.
the sanitary aspects of sedimentation as a result of demands for clear water piped to homes and sanitary sewer systems piped from homes. Their needs for knowledge also related more to mass and volume than anything else; however, they recognized that sediments were not all mineral.
Also, during the nineteenth century other engineers were studying
us more aware of the problem related to the sorption and transport of chemical Environmental concerns over the past decade particularly, have made
constituents on sediments. With the recognition of this fact, sediment, very quickly was 1-abeled a pollutant. We now find that water chemists, aquatic biologists, sanitary engineers, geomorphologists, and sediment engineers must talk to each other - the one individual who can understand all of these different specialists calls himself or herself an environmentalist, or perhaps an ecologist. The purpose of this paper is to present a brief description of the processes that govern the transport of sediment by water.
Sediments (fluvial) are solid materials that have a specific gravity greater
ational force. Sediments found in the fluvial environment can be either than 1.00 that will settle in a column of quiescent water due to the gravit-
mineral or organic materials. Table 1 defines the kinds of materials, physical sizes of materials, and their general mode of transport in a flowing stream.
The term sediment must be defined in terms of current needs.
11 7

TABLE 1
KINDS OF MATERIALS
Sediment S i z e C l a s s Mode of Transpor t
Boulders Larger than 256 m Bedload
Cobbles 64-256 mm Bedload
Gravel 2-64 TDUI Bedload
Sand 0.062-2 UIU Bedload or Suspended
S i l t 0.004-0.062 UUU Suspended
Clay 0.0002-0.004 TDUI Suspended
O r g a n i c d e t r i t u s Inc ludes l eaves , trees, b i o l o g i c a l r e m a i n s , e t c .
Bedload or Suspended
Biota Bedload or Suspended Inc ludes bo t tom dwe l l ing organisms
NOTE: The size c l a s s e s of mineral sediments shown are based on the Wentworth s c a l e (Lane 5 &.. 1947).
118

suspended load. The mass of sediment being transported in virtually The mass of sediment being transported in suspension is called
continuous contact with the streambed is called bed load. The transport rate of suspended load is the suspended-sediment discharge, and the trans- port is expressed in terms of mass per unit of time (kilograms per second, megagrams per day, etc.). The range in size and specific gravity of sediments transported for both modes of transport is tremendous.
The environmentalist faces a real problem in sorting out the definitions of terms that have been coined by the various disciplines over the years. Suspended sediment also is called suspended solids, nonfilterable solids, silt, turbidity, etc. Bedload materials are called bed material, bottom material, deposited sediment, benthic material. substrate, etc., depending on the background of the individual. The definition of "solution" also enters the picture. Solution is defined by most water chemists as the liquid that passes through a 0.45 Dm (micrometre) filter. By this definition, a solution can include particles that the engineering profession classifies as fine clay and colloids.
Another problem that relates to measurement and definition of fluvial sediments is that there is a continuous interchange of some sizes of sediment between the streambed and &he streamflow. Sediments in suspension may settle into the bed and m v e for some period of time as bed load, or they may remain at rest until moved back into suspension for another period of time. Even the very fine silts and clays are involved in this process, particularly in reaches of sand bedded streams where there is a loss of flow from the stream to the ground water system.
depth. Zn this situation, fine materials can infitrate the sand bed to a considerable
In order to standardize analytical methods, sedimentologists have related particle size of sediments to quartz spheres (Figure 1). One reason is that most mineral sediments carried by streamflow consist of roughly 92-98 percent of particles having an average specific gravity of 2.65. Therefore 2.65 is used to represent all sediment carried when computing sediment discharge. Sedimentation diameters are used to define size classes for fine sediments because of the relative ease of analytical techniques. Size, shape, specific gravity, and viscosity of the water effect the sedimentation rate, and a small, heavy grain may have the same mass and fall velocity as a larger quartz grain.
Figure 2 illustrates the basic principles of sediment transport. The velocity with depth in the general case is illustrated. The resistance at the bed is caused by the drag of the liquid over the particles, and that drag and turbulence of the flow causes the bed materials to move along the bed or to jump into suspension for unpredictable periods. The upward velocity vector must overcome the gravitational force on a particle in order for it to remain in suspension. Turbulence is greatest near the bed; therefore, the coarsest particles are carried near the bed. Finer sediments, generally finer than 62 Dm (silt and clay size by definition), require little turbulence to maintain them in suspension, and therefore, are transported throughout
used to mean the mass of sediment per unit volume of the water-sediment mixture. the depth of flow in about the same concentration. Concentration is the term
The discharge rate of suspended sediment varies generally with depth as illustrated by the concentration variation with depth.
119

In any given fluid at any temperature
VfP VfP Vf s
If SGp = SGs and VIP = VIS then D = SEDIMENTATION DIAMETER of particle.
If in distilled water at 24°C.
then D ~ STANDARD SEDIMENTATION DIAMETER.
9 Tq P D 1- . I
vfpl vlp2 vlp3 VIS
If Vfpl, Vfp2, Vfp3 7 VfS = STANDARD FALL VELOCITY then D = STANDARD FALL DIAMETER
Figure 1. Relating s t a n d a r d s e d i m e n t d i m e t e r s to d iame te r of quartz sphe res .
1 2 0

' I . Depth Velocity
of
Figure 2. Schematic diagram of velocity and suspended-sediment concentration distribution in a stream vertical
121

122

c1 N w
mg/ 1 at surface = 880 935 910 91 5 91 0 860
mean in vertical = 941 930 942 920 932 907
DISTANCE. IN FEET
Water discharge = 1280 cubic feet per second Mean velocity = 4.41 feet per second
Median diameter of bed materlal = 0 33 rnm
Figure 4 . Distribution of silt and clay (finer than 0.062 mm) in cross section of Rio Crande conveyance channel near Bernardo, New Mexico

I-
* N
C mg/ 1 at surface = 640 770 690 880 660 350
mean in vertical = 1220 1350 1400 1600 1420 1190
c W w LL z x a I- W 0
DISTANCE, IN FEET

Figure 2 also illustrates the sampling problem. Currently available suspended-sediment samplers sample only to a point from about 0.3 to 0.5 feet above the bed. It is evident that these samplers do not sample that part of the flow carrying the greatest concentration of coarse particles.
ments of velocity and suspended sediment made in the Rio Grande conveyance channel near Bernardo, New Mexico (Culbertson 5 &., 1 9 7 2 ) . The convey- ance channel is straight and uniform for several thousand feet. Point velocities and point suspended-sediment samples were obtained at five points in each of six verticals in order to define the isovels and zones of equal concentration of various size classes of sediment. Concentration values shown are in mg/l (milligrams per litre).
Figures 3 , 4 , and 5 illustrate data based on actual field measure-
Velocity distribution (Figure 3 ) was found to be quite variable because of the roughness caused by the dune bed conflguration. Note the four distinct cells of high velocity in the cross section. Also, note the slower velocity along the right bank.
The finer sediments (silts and clays) were distributed almost uniformly throughout the cross section (Figure 4 ) . Concentrations of samples collected at the surface were almost the same as the mean concen- tration in each vertical; therefore, within the limits of accuracy obtainable in most laboratories, a sample collected almost anywhere in
range. this cross section would be considered representative for this size
Figure 5 illustrates the distribution of the coarse suspended sediment (sand). It is obvious that the sampling problem in this case is real. If one wishes to analyze a sample of the streamflow to determine either the mass of sediment being transported or the amount of sorbed constituents on the sediments, one must have a representative sample that contains representative masses of each size class of material.
The preceding discussion has related only to the general case, and the instantaneous steady uniform flow condition. Time variation of
general relation between water discharge and suspended-sediment discharge. sediment transport presents another problem. Figure 6 illustrates the
For a given site, it is not uncommon to find a variation in suspended- sediment discharge of about 1.5 log units for any given water discharge. This variation is caused mostly by: (1) seasonal variations in availability of sediment; (2) snowmelt runoff versus thunderstorm runoff; ( 3 ) period between floods; ( 4 ) and the difference between turbulence characteristics on rising and falling stages.
Figure 7 shows the typical variation of sediment concentration with time and discharge. The differences in concentrations for a given gage height (discharge) between the rising and falling stages can be noted.
In summary, the variation in transport rates of sediment in streams is dependent upon t h e turbulent characteristics of the flow and the avail- ability, size, and specific gravity of sediment in the system. Sediments
125

1 O(
l a
1.0
0.1
WATER DISCHARGE (cfs)
F i g u r e 6 . Direct runoff versus sediment discharge, by day, Pigeon Roost Creek Watershed 5, .January 1957-December 1960. After Piest ( i n Proceedings, 1963, p . 102) .


can be transported either in suspension or as bed load; however, there can be a continuous interchange between the streamflow and the channel bed. The coarser sediments require more turbulence to maintain them in sus- pension, and therefore, are found in greater concentrations near the stream bed. Much greater care is required when sampling streams carrying coarse sediments (sands) in order to obtain a sample that represents the streamflow.
The variability of sediment concentration with water discharge is great, and many samples may be required to define the suspended-sediment discharge during floods. Variability with time also is great, and samples must be obtained throughout the year to define sediment discharge variation due to changes in land use (availability) and seasonal effects.
SELECTE3 LITERATURE
Abbett, R. W., (1956). American Civil Engineering Practice. V.1, sec. 2(John Wiley).
An Appraisal of Water Pollution in the Lake Superior Basin. FWPCA Great Lakes Adm.. April 1969.
Anderscn, A. G., (1942). Distribution of Suspended Sediment in a Natural Stream, Am. Geophys. Union Trans., 2, (Pt. 21 , 678-683.
A.S.T.M. Designation: C136-38T, (1938). Tentative Method of Test for Sieve Analysis of Fine and Coarse Aggregates, Proc., - 38-1, 808-810.
Bagnold, R. A.. (1956). The Flow of Cohesionless Grains in Fluids, Royal So. (London) Philos. Trans., 249, 235-297.
Bagnold, R. A., (1966). An Approach to the Sediment Transport Problem from General Physics, U . S . Geol. Survey Prof. Paper 422-1. 37 pp.
Barthel, J. C., (1969). Pesticide Residues in Sediments o f the Lower Mississippi River and its Tributaries. In: Pesticides Monitoring Jour., 3, (l), 8-66
Barton, J. R., and Lin, Pin-Nam, (1955). A Study of the Sediment Transport in Alluvial Channels. Civil Eng. Dept., Colorado State Univ., Fort Collins, Colo.. 43 pp.. 21 figs., and appendix.
Benedict. P. C.. Albertson, M. L . , and Matejka, D. Q., (1955). Total Sediment Measurement in Turbulence Flume. Amer. SOC. Civil Engineers Trans., 120, 457-484.
Bondurant, D. C., (1955). Report on Reservoir Delta Reconnaissance, Corps of Engineers, Missouri River Division Sediment Series Pub. No. 6.
Borland, W. H.. and Miller, C. R.. (1958). Distribution of Sediment
84, 1587. in Large Reservoirs, Am. SOC. Civil Engr.. Jour. Hyd. Div.. -
128

Bormann, F. H., Likens, G. E., Eaton. J. S . . (1969). Biotic Regulation of Particulate and Solution Losses from a Forest Ecosystem. Bioscience, 19. (7), 600-610.
Brown, H. E., Hansen, E. A., and Champagne, N. E., Jr., (1970). A System for Measuring Total-Sediment Yield from Small Water- sheds, Water Resources Research, 5, (31, 818-826.
Burrell, G . N., (1951). Constant-Factor Method Aids Computation of Reservoir Sediment, Civil Engineering, 21. ( 7 ) , 51-52
Chia-Shun Shih, and Gloyne, E. F., (1969). Influence of Sediments on Transport of Solutes, Jour. Hyd. Div., 95. (HY4).
Colby, B. R., and Hembree, C. H.. (1955). Computation of Total Sediment Discharge, Niobrara River near Cody, Nebr., U.S. Geol. Survey Water-Supply Paper 1357.
Colby, B. R., (1956). Relationship of Sediment Discharge to Stream- flow, U.S. Geol. Survey, Open-File Report.
Colby, B. R., (1957). Relationship of Unmeasured Sediment Discharge to Mean Velocity, her. Geophys. Union Trans., 2, (5), 708-717.
Colby, B. R., (1961). Effect of Depkh of Flow on Discharge of Bed Material. U.S. Geol. Survey Water-Supply Paper 1498-D. 12 pp.
Colby, B. R., (1964). Discharge of Sands and Mean-Velocity Relationships in Sand-Bed Streams, U.S. Geol. Survey Prof. Paper 462-A, 47 PP.
Cook, H. L., (1935). Outline of the Energetics of Stream-Transporation of Solids, Am. Geophys. Union Trans., 16, (2), 456-463.
Corps of Engineers, U.S. Army, (1961). Reservoir Sedimentation Invest- igations Program, Engineering Manual 1110-2-4000.
Culbertson, J. K., Scott, C. H., and Bennett, J. P., (1972). Summary of Alluvial-Channel Data from Rio Grande Conveyance Channel, N. Mex., U.S. Geol. Survey Prof. Paper 562-.I., 49 pp.
David, C., (1969). Sediment Radioactivity in the Columbia River Estuary, In Selected Water Resources Abs., 2, October 1, 1969, 32 p p .
Davis, Foote, and Kelly, (1966). Surveying: Theory and Practice. Fifth edition, Chap. 30 (McGraw-Hill).
Davis, Foote, and Kelly, (1964). Special Surveys: Dept. of Army Tech. Manual 5-235.
Dendy, F . E., and Champion, W. A . , (1969). Summary of Reservoir Sediment Deposition Surveys Made in the United States 'Illrough 1965 , USDA Misc. Pub. 1143.

f h k i n , I f . M. (rev. Brown, C. B . ) , (1939). Silting of Reservoirs, U.S. Dept. Agr. Tech. Bull. 524, 168 pp.
Einstein, H. S., and Chien, Ning, (1953). Can the Rate of Wash Load be Predicted from the Bed-Load Function?, Am. Geophys. Union Trcllls. , E, 867-882.
Einstein, H . S., (1950). The Bed-Load Function for Sediment Trans- portation in Open Channel Flows, U.S. Dept. Agr. Tech. Bull. 1026, 70 pp.
Einstein, H. S., (1954). Second Approximation to the Solution of the Suspended Load theory, U.S. Corps Engineers, Missouri River Div. Sediment Ser. 3 , 30 pp., 12 figs.
Flammer, G. H., (1962). Ultrasonic Mmeasurement of Suspended Sediment, U.S. Geol. Survey Bull. 1141-A, 48 pp.
Gilbert, G . K., (1914). Transportation of Debris by Running Water, U.S. Geol. Survey Prof. Paper 86, 263 pp.
Gleason, 6. R., and Ohlmacher, F. J . , (1965). A Core Sampler for In-Situ Freezing of Benthic Sediments, Ocean Science and Ocean Engineering, Joint Conference Marine Tech. Soc. and Amer. SOC. Lim. and Ocean, Washington, D. C., Trans., L, 737-741.
Gottschalk, L. C. , (1951). Measurement of Sedimentation in Small Reservoirs, Am. SOC. Civil Engr., Proc. Hyd. Div., 77.
Guy, H. P., (1968). Quality Control of Adjustment Coefficients in Geological Survey Research 1968, U.S. Geol. Survey Prof. Paper 600-B, pp. B165-Bl68.
Guy, H . P., (1969). Laboratory Theory and Methods for Sediment Analysis, U.S. Geol. Survey Techniques Water-Resources Inv., Book 5 , Chap. C1, 58 pp.
Guy, H. P., (1970). Fluvial Sediment Concepts, U.S. Geol. Survey Techniques W-R Inv., Book 3, Chap. C1, 58 pp.
Guy, H. P., and Norman, V. W., (1970). Field Methods for Measurement of Fluvial Sediment, U.S. Geol. Survey Techniques W-R Inv., Book 3 , Chap. C2, 59 pp.
Hubbell, D. W., (1964). Apparatus and Techniques f o r Measuring Bed Load, U.S. Geol. Survey Water-Supply Paper 1748, 74 pp.
Hubbell, D. W., and Matejka, D. Q., (1959). Investigations of Sediment Transporation. Middle Loup River at Dunning, Nebr., U . S . Geol. Survey Water-Supply Paper 1476, 123 pp.
Inter-Agency Committee on Water Resources, (1940). A Study of Methods Used in Measurement and Analysis of Sediment Loads in Streams: Field Practice and Equipment Used in Sampling Suspended Sediment, Report No. 1.
130

Inter-Agency Committee on Water Resources, (1940). Equipment f o r Sampling Bed Load and Bed Material, Report No. 2 .
Inter-Agency Committee on Water Resources, (1941). A Study of Methods Used in Measurement and Analysis of Sediment Loads in Streams: Methods of Analyzing Sediment Samples, Report No. 4
Inter-Agency Committee on Water Resources, (1941). A Study of Methods Used in Measurement and Analysis of Sediment Loads in Streams: Laboratory Investigation of Suspended-Sediment Samplers, Report No. 5.
Inter-Agency Committee on Water Resources, (1943). A Study of New Methods for Size Analysis of Suspended-Sediment Samples, Report No. 7 .
Inter-Agency Committee on Water Resources, (1952). The Design of Improved Types of Suspended Sediment Samplers, Report No. 6 .
Inter-Agency Committee on Water Resources, (1953). Accuracy of
Method, Report No. 10. Sediment Size Analysis Made by the Bottom-Withdrawal-Tube
Inter-Agency Committee on Water Resources, (1957). The Development and Calibration of the Suspended-Accumulation Tube. Report No. 11.
Inter-Agency Committee on Water Resources, (1957). Some Fundamentals of Particle-Size Analysis, Report No. 12.
Inter-Agency Committee on Water Resources, (1958). A Study of Methods Used in Measurement and Analysis of Sediment Loads in Streams: Operation and Maintenance of U.S. BM-54 Bed-Material Sampler, Report M.
Inter-Agency Committee on Water Resources, (1959). Sedimentation Instruments and Reports, Report AA.
Inter-Agency Committee on Water Resources, (1963). A Study of Methods Used in Measurement and Analysis of Sediment Loads in Streams: Determination of Fluvial Sediment Discharge, Report No. 14.
Ismail, H. M., (1952). Turbulent Transfer Mechanism and Suspended Sediment in Closed Channels, Am. SOC. Civil Engineers, Trans., - 1 I 7, 409-446.
Jackson, H . W., (1970. A Controlled-Depth Volumetric Bottom Sampler, The Progressive Fish Culturist, 2 (2).
Kennedy, J . F . , (1961). Further Laboratory Studies o f the Roughrle~,~ and Suspended Load of Alluvial Streams, California lnst. ‘1ecI1- nology, W. M. Keck Lab. Rept. KH-R-3.
Keulcgm, C . H . , (1938). Laws of Turbulent Flow i n Open Channels, U.S. Natl. Bur. Standards, Jour. Research, 21, ( f ~ ) , 707-741.
l , i \ i ’ s e v , K. H., (1970). The Role Sediments Play i l l lk~trrmining the ((u:llity of Water, U.S. Army Corps of Engr., i l m . t l ~ n [ l i s t .
131

McCain, E. H., (1957). Measurement of Sedimentation in TVA Reservoirs, Am. SOC. Civil Engr., Jour. Hyd. Div., g , (HY3), Paper 1277.
McCain, E. H., (1965). Operation Manual for Radioactive Sediment Density Probe, Corps of Engineers, Omaha District.
Meyrr-Peter. E., and Muller, R., (1948). Formulas for Bed-Load Transport, Int. Assoc. of Hydraulic Structures Research, 2nd Mtg., Stockholm, Sweden, 39-64.
Proceedings of the Federal Inter-Agency Sedimentation Conference, (1948), 314 pp.
Proceedings of the Federal Inter-Agency Sedimentation Conference, (1963). U.S.D.A. Misc. Pub. No. 970, 933 pp.
Proceedings of the Third Federal Inter-Agency Sedimentation Conference, (1976). Sedimentation Committee of the Water Resources Council.
Prych, E. A., and Hubbell. D. W., (1966). A Sampler for Collecting Sediments in Rivers and Estuaries, Geol. SOC. America Bull., - 77, 549-556.
Ritter. J. R.. and Helley, E. J.. (1969). Optical Method for Determining Particle Sizes of Coarse Sediment, U . S . Geol. Survey Techniques of Water Resources Inv., Book 5 , Chap. c 3 , 3 3 pp.
Sayre, W. W., and Chang, F. M., (1968). A Laboratory Investigation of Open-Channel Dispersion Processes for Dissolved, Suspended, and Floating Dispersants, U . S . Geol. Survey Prof. Paper 433-E, 7 1 PP.
Sayre, W. W., and Hubbell, D. W., (1965). Transport and Dispersion of Labelled Bed Material, North Loup River, Nebr., U.S. Geol. Survey Prof. Paper. 4 3 3 - C , 4 8 pp.
Sellers, B., Papodopoulos, T., and Ziegler, C., (1966). Radioisotope Gage for Monitoring Suspended Sediment Concentration in Rivers and Streams, U.S. Atomic Energy Comm.
Simons, D. B., Richardson, E. V., and Albertson, M. L., (1961). Flume Studies Using Medium Sand (0.45 nun), U.S. Geol. Survey Water-Supply Paper 1498-A, 76 pp.
Sooky, A. A., (1969). Longitudinal Dispersion in Open Channels, Jour. Hyd. Div., 95, (HY4).
Task Force on Bed Forms in Alluvial Channels of the Committee on Sedimentation, ASCE, (1966). Jour. Hyd. Div., 92, (HY3). 51-64.
U.S. Army, Corps of Engineers, Omaha District, (1952). Sediment Transport Characteristics Study of Missouri River at Omaha. Nebr. Unpublished Report.

U.S. Bureau of Reclamation, (1958). Interim Report, Total Sediment Transport Program, Lower Colorado River Basin: Sedimentation Sec., Hydrology Br., Div. Prof. Inv., 175 pp.
U.S. Waterways Experiment Station, (1935). Studies of River Bed Materials and Their Movement, with Special Reference to the Lower Mississippi River, U.S. Waterways Expt. Sta., Paper 17, 161 pp.
Vanoni, V. A . , (1975). Sedimentation Engineering, Am. SOC. Civil Engr., Manuals and Reports on Engineering Practice - No. 54, 745 pp.
Vanoni, V. A., and Brooks. H. H., (1957). Laboratory Studies of the Roughness and Suspended Load of Alluvial Streams, California Inst. Technology, Report No. E-68.
Wolman, M. C . , (1954). A Method of Sampling Coarse River Bed Elaterial, Am. Geophys. Union Trans., 2 1 , (6). 951 pp.
1 3 3


DISCUSSION
Dr. E. ihgley: We are all aware of the fact that the relationship between sediment discharge and flow is generally non-linear when we are looking at total sediment. I am wondering, do you have any feeling for the relation- ship between the finer than 6 2 p fraction with flow? Is it because it is not depth dependent? Is it really a simple function of flow?
Mr. J . 'iciiw2*tsmI; No. The fine material is that material finer than 6 2 micron5 and I might mention that Hydro Comp has a model out where they stop at 50 microns. Why they selected that I don't know. This fine material has been called wash load. There is no relation between the concentration or load of wash load with the hydraulics. It is not velocity- and depth dependent. The sands do relate well with velocity-depth relations but the fine material, no. This is a real problem because vou cannot predict the fine material or washload.
135


Sediment Storage and Remobilization Characteristics of Watersheds
.I. Knox
INTRODUCTION
Accuracy in estimating long term sediment yields depends to a large degree on understanding the natural variability of the magnitude and frequency of surface runoff. Although the magnitude and frequency char- acteristics of surface runoff are normally presumed to display random variation over time, this presumption is often not fulfilled. Long hy- drologic records spanning many decades and proxies of surface r u n o f f that extend to century time scales indicate that natural departures from the long
records span only short periods of time, a condition which is especially term average often occur in clustered sequences. Because many hydrologic
true for sediment yield records in many small watersheds, it is important that observed erosion and sediment transport rates be calibrated to reflect the range of both short term and l ong term variations. Significant changes in erosion and sediment transport often occur when an existing balance between land cover and climate is disrupted. Disruption may occur naturallv in response to climatic change, or it may be produced in response to changes of land use. The responses of sediment yield to changes of climate or land use are mostly related to changes in the magnitude and frequency character- istics of surface runoff. It is also apparent that changes in magnitude and frequency of surface runoff, in turn, cause changes both in the functional relationship between sediment yield and water yield and in the sediment delivery ratio. Nearly all of the techniques currently in practice for estimating long term sediment yields of watersheds involve an assumption of temporal uniformity (stationarity) in the time series of variables that relate to either precipitation or runoff. Over the time span of several decades and longer, the assumption of stationarity may not be met because of changes in either climate or land use or both.
THE MOVEPENT OF SEDIMENT THROU;H K~TERSHEDS
Long term changes in the magnitude and frequency of surface runoff can alter the long term rate of movement of sediment through a watershed by causing changes in the rate of upland erosion and/or in the volume of sediment
upland erosion is largely related to storms and surface runoff events of that is stored in the watershed as colluvium and alluvium. The volume of
moderate magnitude and frequent occurrence. For example, Wischmeier (1962) found that three-fourths of the soil losses from small, cultivated, single- cover plots in the United States were caused by an average of about four storms per year. Piest (1965, p. 101) concluded that, on the average, more than one-half of the annual soil losses from 72 small watersheds from 17 states was related to storms that occur more often that once per year.
137

Altllougll the d a t a of Wischmeier and Piest make it c l e a r t h a t most upland sediment loss i s r e l a t e d t o m e t e o r o l o g i c a l e v e n t s t h a t r e c u r r e l a t i v e l y f r e q u e n t l y , t h e a c t u a l t o t a l number of e v e n t s is r e l a t i v e l y s m a l l . F o r rxdmplc, Knox et al. (1975, p. 42) found t h a t , f o r s m a l l Iowa watersheds d r a i n i n g less than 10 square mi les (16 km2) , the suspended sed iment y ie ld of on ly e igh t t o t en davs no rma l ly accoun ted fo r more than 90 percent of t h e a n n u a l y i e l d . The a c t u a l number of days pe r yea r t ha t a r e a s soc ia t ed w i th r e l a t i v e l y h i g h m a g n i t u d e s u s p e n d e d s e d i m e n t y i e l d s i n c r e a s e s s l i g h t l y a s d r a i n a g e a r e a i n c r e a s e s ( F i g u r e 1 ) . I t may be concluded that the hulk of e r o s i o n a n d t r a n s p o r t a t i o n of sed iments f rom upland s i tes i s r e l a t e d t o a very small number of h y d r o l o g i c e v e n t s , whose occurrence is dependent upon the development of s p e c i f i c m e t e o r o l o g i c a l c o n d i t i o n s . The impor tance o f a small numher of c l i m a t i c e v e n t s makes c l i m a t e v a r i a t i o n c r i t i c a l t o t h e e x p l a n a t i o n o f l ong t e r m v a r i a t i o n s of t h e m o b i l i t y a n d s t o r a g e of sed iments i n watersheds . A modes t change in an expec ted seasonal loca t ion of a s torm t r a c k o r a i r mass boundary a f f e c t s t h e number of occurrences of d a y s w i t h high mngnitude sediment yields . Climate changes o f t h i s t ype exp la in mos t of bot t t the short and long term v a r i a t i o n s of upland sediment yields .
r u n o f f a l s o a f f e c t t h e balance between sediment that is eroded and t rans- por ted v e r s u s sed imen t t ha t is s t o r e d as col luvium and a l luvium (sediment d e l i v e r y r a t i o ) . M i l l e n i a scale episodes of c h a n n e l a l l u v i a t i o n and channel degrada t ion have been documented as occur r ing over wide reg ions (S ta rke l , 1966, 1972; Haynes, 1968, 1976; Klimek and Starkel, 1974; 1NQUA Holocene Symposium, 1975; Knox, 1976; and Johnson, 1976). The r e g i o n a l s y n c h r o n e i t y o f many documen ted a l luv ia l ep i sodes p rov ides ev idence t ha t t he s ed imen t d e l i v e r y r a t i o is sub jec t t o change on l ong term time s c a l e s . C u r r e n t e s t i m a t e s of long term ave rage s ed imen t de l ive ry r a t io s have sugges t ed t ha t t h e r a t i o v a r i e s i n v e r s e l y w i t h d r a i n a g e a r e a r a i s e d t o t h e 0 . 1 2 5 - 0 . 2 0 power ( P i e s t , Miller, and Vanomi, 1975, pp. 462-463; EPA, 1973, p . 58) . Year to y e a r v a r i a b i l i t y i n s u r f a c e r u n o f f may c a u s e l a r g e d e p a r t u r e s f r o m t h e expected average sediment del ivery. For example, when land cover i s h e l d cons t an t , t he magn i tude of t h e s e d i m e n t d e l i v e r y r a t i o i n c r e a s e s w i t h i n c r e a s i n g r u n o f f ( P i e s t , Kramer, and Heinemann, 1975, p. 132; Elutchler and Bowie, 1976, p. 1-21). I f . o v e r t h e l o n g term, vege ta t ive cove r improves t o b e t t e r p r o t e c t t h e l a n d s u r f a c e f r o m e r o s i o n and acts a s a f r i c t i o n f a c t o r
w i l l d e c l i n e (P iesL, K ~ d m e ~ , and Heinemann, 1975, pp. 139-140). On t h e o t h e r t o r educe t he r a t e of s u r f a c e runof f , t hen s e d i m e n t d e l i v e r y p e r c e n t a g e s
h a n d , i f c h a n g e s i n r u n o f f are a s s o c i a t e d w i t h h i g h l y v a r i a b l e f l o o d f l o w s w i t h r e l a t i v e l y f r e q u e n t r e c u r r e n c e of l a rge f l oods , t hen s t r eam channe l s a r e l i k e l y t o become u n s t a b l e and f l o o d p l a i n e r o s i o n may fo l low (Schumm and Lichty , 1963, pp . 74-76; S tevens et 4.. 1975; and Knox, 1976, pp. 182-186).
Long te rm var ia t ions in the magni tude and f requency of sur face
I n summary, t h e amount of t r a n s p o r t a t i o n a n d / o r s t o r a g e of sediment i n w a t e r s h e d s i s dominated by a r e l a t i v e l y small number of hydro logic e v e n t s t h a t t e n d t o o c c u r e a c h y e a r . The ac tua l f r equency and t he cha rac t e r - i s t i c s of t h e c r i t i c a l h y d r o l o g i c e v e n t s is s t rong ly dependen t on t he p r e v a i l i n g c l i m a t e a n d l a n d u s e c h a r a c t e r i s t i c s .
IMPACT OF LONG TEW VPRIATICNS OF CLIMATE
The importance of climate as a v a r i a b l e i n f l u e n c i n g s h o r t term v a r i a t i o n s of s e d i m e n t y i e l d s is gene ra l ly accep ted , bu t many, if not mos t , inves t igaLors assume tha t climate v a r i a t i o n s a r e e s s e n t i a l l y random i n r e l a t i o n t o time s c a l e s t h a n s p a n s e v e r a l d e c a d e s or longer . The assumption
138

FIGURE 1 The relationship between days of occurrence of relatively high magnitude suspended sediment yield and drainage area. The equation explains seventy-six percent of the variance of high sediment yield days and is significant at the 0.01 probability level. High yield days, as defined here, accounted for an average of eighty-five or more percent of annual sediment yields in watersheds draining 500 square miles (1300 krn'). Only about sixty percent of the total annual suspended sediment yields were represented by the high yield days when the drainage area increased to about 5000 square miles (13000 h2). The data utilized in the above equation provide quantitative documentation that a very large fraction of the total annual yield of suspended sediment from a watershed is related to hydrologic events which occur on only a small number of days during the year. The specific magnitude and frequency characteristics of the critical hydrologic events are in turn highly sensitive to variations in the dominant climatic regimes.
___
139

n t randomness is f r equen t ly no t suppor t ed by l o n g h i s t o r i c a l r e c o r d s of c l imn tc no r by p r o x i e s of l o n g c l i m a t e r e c o r d s ( e . g . , t r e e r i n g c h a r a c t e r - i s t i c s ) (Lamb, 1966, pp. 56-112).
C l i m a t e c i r c u l a t i o n r e g i m e s a r e o f t e n c h a r a c t e r i z e d by p o s i t i v e and negat ive feedback mechanisms that lead t o pers i s tence o f anomalous c o n d i t i o n s . P e r s i s t e n c e o f c e r t a i n " p r e f e r r e d " c i r c u l a t i o n r e g i m e s , i n t u r n , c o n t r i b u t e t o p e r s i s t e n c e i n c h a r a c t e r i s t i c s of h y d r o l o g i c e v e n t s . P e r s i s t e n c e o c c u r s on many time sca l e s . Fo r example , an ana lys i s by t h i s au tho r r evea led t ha t , f o r t he yea r s 1941-1969 , f r equenc ie s o f f l oods i n 29 Upper M i s s i s s i p p i V a l l e y w a t e r s h e d s d i s p l a y e d p a t t e r n s o f d e p a r t u r e f r o m ,average that were s t r o n g l y p e r s i s t e n t on approximate ly a decada l t ime s ca l e ( F i g u r e s 2 and 3 ) . The number of "runs" of consecutive occurrences of f l o o d f r e q u e n c i e s , e x p r e s s e d as f ive -yea r runn ing ave rages i n F igure 2 , was n e a r l y fou r s t anda rd dev ia t ions be low the expec ted mean number f o r a s t a t i s t i c a l l y random arr'iv. I t was e s t i m n t r d t h a t d e p a r t u r e s , of t h e a b o v e d e c a d a l s c a l e , wtart' r t , spons ih le f o r four ( ( 1 - , t ~ v t ~ n - t o l d v . i r i a t i o n s i n tht: ave rage sho r t t e rm sed imen t y i e lds .
A n example of how su r face runof f can va ry be tween c l ima t i ca l ly d i f f e r e n t y e a r s i s p rcv ided i n Figure 4 which represents thv Rickapoo Kiver < ) I southwestern Wisconsin. 'The two hydrographs of F i g u r e & d e p i c t IIUW s u r f a c e r u n o f f , t h e p o r t i o n of t he runof f i nc luded i n t h e s p i k e s a b o v e t h e d a s h e d l i n e s on the hydrographs of F igure 4 , can vary between a r e l a t i v e l y dry yenr l ike 1963 and a r e l a t i v e l v w e t y e a r l i k e L965. During 1 9 6 3 , s u r f a c e r u n n f f a c c o u n t e d f o r only twentv percent of a t o t a l r u n o f f o f 6 . 8 i n c h e s . rhr md j o r po r t ion o f su r f ace runof f which did occur was r e l a t e d t o snowmelt i n ?larch (Figure 4 ) . 'The warm s e a s o n c i r c u l a t i o n p a t t e r n s of 1963 were t r rquency associated with regimes which enhanced a i r mass s t a b i l i t v o v e r t h e Kickdpoo Kiver basin. During 1965, the regimes of upper a tmospheric c.ir- Q ul.it inn promuted thc o c c u r r e n c e s o t f r e q u e n t and heavy r a i n f a l l s , c s p e c i d l l v d u r i n g c l i m a t i c t r a n s i t i o n p e r i o d s a t the beginning and end of the w,irm season . 'The t o t a l r u n o f f f o r 1 9 6 5 was approximate ly 13 .4 inches and r i hu t m e - h a l f o f i t occur red as s u r f a c e r u n o f f . The yields of suspended sediment f rom the t r ibu tar ies o f the Kickapoo watershed i n 1965 were e s t i m a t e d t o be a p p r o x i m a t e l y f i v e t i m e s g r e a t e r t h a n t h e y i e l d s f r o m t h e same t r i b u t a r i e s in 1963 (Table I ) . The d a t a of Table 1 i n d i c a t e t h a t r e l a t i v e l v modest changes i n t he r ecu r rence f r cqu t ' nc i e s of s u r f a c e r u n o f f , as r e p r e s e n t e d i n F igure 2 , r an impose ra ther d ramat ic impacts on b o t h s h o r t and long te rm sed imen t y i e lds . I t is impor tan t to no te t ha t l ong hydro log ic time s e r i e h o f t e n show p a t t e r n s o f p e r s i s t e n t d e p a r t u r e s f r o m " l o n g term averages" . lhis c a n b e i l l u s t r a t e d b y t h e p a t t e r n o f r e c u r r t m c e of l a r g e f l o o d s on t h e uppt'r ? l i s s i s s i p p i Rivt.r ( F i g u r e 5), and h v t he mu l t i - cen tu ry r eco rd of Low l l o w s t a g e s u t t h e N i l c River ( F i g u r e 6 ) .
e f f e c t s o f s t r o n g c l i m a t i c b i a s e s . C o m b i n i n g s e d i m e n t r e c o r d s w i t h r e l a t e d , Hany s e d i m e n t y i e l d r e c o r d s a r e s u f f i c i e n t l y s h o r t t o i n c l u d e t h e
bu t l onge r , r eco rds r ep resen t ing s t r eamf low du ra t ion cu rves may b e u n s a t i s -
and b) mos t s t reamflow records da te on ly f rom the cur ren t cen tury , a p e r i o d f a c t o r y b e c a u s e : a ) i t invo lves t he mix ing o f non-homogeneous d a t a s e t s ,
anomalous c l ima te cond i t ions (Wahl and Lawson, 1970; Lamb, 1974; Bryson, t h a t is t h o u g h t b y s e v e r a l c l i m a t o l o g i s t s t o have expe r i enced f r equen t
1974) . If long term estimates o f t h e m o b i l i t y a n d s t o r a g e of s e d i m e n t s a r e c o n f i n e d t o a coming decade or t w o , then hydro logic records should be weighted
140

TABLE 1*
Estimated Suspended Sediment Yields f o r Average Drainage Areas of Stream Orders
in the Kickapoo Watershed Upstream of LaFarge, Wisconsin
" S t r a h l e r " S t ream Order
Average Sediment Yield ( tonslmi') Drainage "wet"* "dry"* Area (mi')
"average" 1965 1963
~
.016
.07
. 3 3
1 .55
6.65
30.50
2450 475 14 30
2025 390 1180
1640 310 945
1320 250 760
1100 2 10 630
88 5 170 520
*The sed imen t y i e ld da t a were gene ra t ed f rom seasona l ly ca l ib ra t ed s ed imen t r a t ing cu rves de r ived f rom U.S. Geologica l Survey sed iment da ta co l lec ted for the Kickapoo River near LaFarge, Wit;consin. For f u r t h e r i n f o r m a t i o n s e e Knox aJ., 1975, pp. 50-57.
141

Decadal scale variation in flood frequencies. A listing of the gaging stations and other descriptive characteristics of the

Total Floods -Partial Duration Series 29 Basins
per Mississippi Valley - 1941 - I949 "" I*Io-lv5v
IVbO- I969
M o n t h
FIGURE 3
Decadal scale variation in seasonal concentrations of flood occurrences (After Knox et al., 1 9 7 5 , p p . 10, 1 7 , 30-40) .
"
Hydrographs - Kickapoo River LaFarge, Wisconsin
FIGURE 4 Climatic influence on runoff. Data from U.S. Geological Survey. After Knox et al., 1975, p. 51.
143

. , ..
FIGURE 5
Annual flood series, M i s s i s s i p p i River at Keokuk, Iowa. Data from U.S. Geological Survey, After b o x e t a1 1975, p . 7 .
- _. 3
Minimum Stagor of th. Nil. Rivor at Cairo, Egypt
1.
FIGURE 6 Progressive 50-year average stages of Nile River. Redrawn from Stevens' Fig. 9 closure to paper by Jarvis (1935, p . 1048).
144

to reflect probable climatic trends. If long term estimates of the mobility and storage of sediments are t o extend to century and longer time scales, then probabilistic interpretations of duration curves based on long records represent "best available" approximations. Planning for long term mobility and storage of sediments in watersheds should probably be viewed in relation to scenarios of possible conditions of climate influence.
IWACT OF LONG TERM VARIATIONS OF [AND USE
The long term mobility and storage of sediment in watersheds is influenced by land use in a way that is analogous to climate changes, because both involve disturbance of the relationships amongst precipitation, land cover, and runoff. The influence of land use on sediment yield has been investigated extensively (e.g., Federal Inter-Agency Sedimentation Con- ferences: 1947, 1963 and 1976; U.S. Environment<Il Protection Agency, 1973; lnternutiou,il Asscwiation of Hydrological Sciences, 1974; U.S. Agricultural Kesearcll Service, 1975; and the American Society o f ('ivil Engineers Task Committce on Sedimentation, 1975). Yvst studies llave dealt with contemporary relat ionsllips between sediment yield m d land COVVI , and rclativrly few have considervd the implic,lLions of land use cllangcs on tlle long term mobility and s to rog , , of sediment in watersheds.
r u n o f t .ind srdiment y i c , l d for any given storm, althougll the impact is Ci>anges v f land use directlv affect the magnitudes of surface
usually greatest i n re1.1tion to moderate magnitude storms of relatively
of the natural veaetation of a SW Wisconsin watershed to agricultural land frequent recurrence. ihox ~1.. (1975, p p . 58-65) found that conversion
use increased the magnitudes of moderate magnitude floods by a factor of
Maryland Piedmont (Wolman, 1967), indicated that sediment vields increased four to seven times. A similar study of l ong term focus, representing the
three to eight times following conversion of natural forest to agricultural land use. Wolman's study also revealed that sediment yields from areas undergoing urban construction may be as much as 1000 times greater than presettlement rates. Much of the sediment that ia related to man-induced accelerated surface runoff is transported only short distances within a watershed (Happ eL al., 1940; Trimble, 1971, 1975; Knox s., 1 9 7 5 , p p . 66-70; Kenfro, 1975'j-r A change to improved land use or watershed conser- vation practices can result in erosion of sedimentary deposits that arcu- mulated during preceding periods of high yields (Trimble, 1976; Happ, 1975). It may therefore be concluded that land use not only exerts a strong con- temporary influence on associated rates of surface runoff and sediment yields, but it may indirectly affect watershed processes and sediment yields of subsequent periods as channel systems attempt to reestablish an equilibrium with new watershed conditions.
LITERATURE CITED
American Society of Civil Engineers, Task Committee on Sedimentation, 1975. Sedimentation Engineering, (Vito Vannmi, Ed.) New York, 745 pp.
liryson, R. A., 1974. A perspective on cljmatic change: Science, V. 184, pp. 753-760.

Environmental Protection Agency (EPA), 1973. Methods for Identifying and Evaluating the Nature and Extent of Non-Point Sources of Pollutants: EPA - 430/9-73-014, Washington, 261 pp.
HLIPP, S . C., Rittenhouse, C., and Dobson, C. C . , 1940, Some
U.S. Department of Agriculture, Tech. Bull. 695. principles of accelerated stream and valley sedimentation:
Havrlt.s, (1, V . , 1968, Geochronology of late-Quanternary alluvium: In - Means of Correlation of Quaternary Successions (R.B. Morrison .rnd II. E. Wright, Eds.) pp. 591-631, Vol. 8. Proceedings V I 1 INQUA Congress, Univ. of Utah Press, Salt Lake City.
International Association of Hydrological Sciences, 1974, Effects of Man on the Intrrtace of the Hydrological Cycle with the Physical Environment: IAHS I'ublication No. 113, 157 pp. """"..~"I_
~" "_ .
INQUA Holocene Symposium, 1975, Weogeographical Changes of Valley Floors in the Holocene: Biuletyn of Genlogiczny, Vol. 19, Warsaw University Press, Warszawa.
. I . t rv i s . C. S . , 1935, Flood-stage records of the river Nile: Trans. American Society of Civil Engineers, Paper No. 1944, pp. 1012-1070.
Johnson , W. C.. 1976, The impact O F environmental change on €luvial systems: Kivkapoo River, Wisconsin: Unpublished Pt1.D. disserat.ion, University o i Wisconhin, Department of Geography.
Klimek, K., and Starkel, L., 1974. History and actual tendency of floodplain development at t h e border of the Polish Carpathians:
Ed.), p p . 185-196, International Geographical Union, Vandenhoeck In: Report O F the Commission on Present-day Processes (H. Poser,
and Kuprecht, Gottingen.
b o x , .1. C., 1976, Concept of the graded stream: In - Theories o f Landform Developms, R. Flemal and W. Melhorn, Eds., Sixth Annual Geomorphology Symposium. Binghamton, N Y , pp. 169-198.
Knox, J. C., Bartlein, P. J . , Hirschboek, K. K., and Muckenhirn, R. J . , 1975. The response of floods and sediment yields to climatic variation and land use in the Upper Mississippi Valley: University o€ Wisconsin Institute for Environmental Studies Report No. 52, 76 pp.
Lamh, H. H.. 1974, The current trends of world climate--a report on the early 1970's and a perspective: University of East Anglia, Norwich, Climatic Research Unit Research Publication No. 3, 28 pp.
Lamb, H. H.. 1966, On the nature of certain climatic epochs which differed from the modern (1900-1939) normal: In: The Changing Climate (H. H. Lamb). pp. 58-112, Methuen and Co., Ltd., London.
Mutchler, C. K., and Bowie. A. J., 1976, Effect of land use on sediment delivery ratios: In - Proceedings of the Third Federal Washington, pp. 1-11. 1-21. Inter-Agency Sedimentation Conference, Water Resources Council,
146

Piest, R. F., 1965. The role of the large storm as a sediment contributor: Proceedings of 1963 Federal Interagency Conference on Sedimentation, Misc. Pub. 970, U.S. Department of Agriculture.
Piest, R. F., Kramer, L . A., and Heinemann, H. G., 1975, Sediment movement from loessial watersheds: In - Present and Prospective Technology for Predicting Sediment Yields and Sources, U.S . Department of Agriculture, Agricultural Research Service Report ARS-S-40., pp. 130-141.
Piest, R. F., Miller, C. R., and Vanomi, V., 1975, Chapter Iv - Sediment sources and sediment yields: In - Sedimentation Engineering, V. Vanomi, Ed., American Sor. Civil Engineers Task Committee on Sedimentation, N Y , pp. 437-493.
Renfro, G . W., 1975, Use of erosion equations and sediment-delivery ratios for predicting sediment yield: In - Present and Prospective Technology for Predicting Sediment Yields and Sources, U.S . Dept. of Agriculture, Agricultural Research Service, Publication ARS-S-40, p p . 33-45.
~ _" ~
__-
Schumm. S. A . , and Lichty, K . W., 1963, Channel widening and tlood- plain construrtion along Cimarron River in Southwestern Kansas: U . S . Geological Survey Prof. Paper 352-D, pp. 71-88.
Starkel, I,., 1966, Post-glacial climate and the moulding of European relief: In - World Climate from 8000 to 0 B.C., Royal Meteorological Society, London, pp. 15-33.
Starkel, L., 1972, Trends of development of valley floors of mountain areas and submontane depressions in the Holocene: Studia Geomorphologica Carpatho-Balcanica, Vol. 6 , pp. 121-133.
Stevens, M. A., Simons, D. B., and Richardson, E. V., 1975. Nonequilibrium river form: Proceedings American Society Civil Engineers, Journal Hyd. Division, H Y 5 , V . 101, PP. 551-566.
Trimble, S. W., 1975, A volumetric estimate of man-induced s o i l erosion on the southern piedmont plateau: In - Present and Prospective Technology f o r Predicting Sediment Yields and Sources, U.S. Dept. of Agric., Agric. Research Service, Publication ARS-S-40, pp. 142-154.
Trimble, S . W., 1976, Sedimentation in Coon Creek Valley, Wisconsin: In - Proceedings of the Third Federal Inter-Agency Sedimentation Conference, Washington, pp. 5-100, 5-112.
U . S . Department of Agriculture. 1965, Proceedings of the Federal Inter Agency Sedimentation Conference, 1963: U.S. Government Printing Office, Washington, 933 pp.
U.S. Department of Agriculture, 1975, Present and Prospective Technology for Predicting Sediment Yields and Sources: Agricultural Research Service Publication ARS-S-40, 285 pp.
147


DISCUSSION
Dr. 0. Bouldin: One of the problems w e a lways run i n to is t h a t w e have got t o make estimates based on imperfect knowledge. Now I see n o t h i n g p a r t i c - u l a r l y wrong w i t h t h a t , b u t what r e a l l y b o t h e r s m e i s t h a t most of t h e time we have no way t o estimate how s u r e we are about , o r p u t c o n f i d e n c e i n t e r v a l s on , t hose estimates, p a r t i c u l a r l y s e d i m e n t l o a d s . What kinds of handles can we put on t h i s p roblem? In o ther words how do we make a n e s t i m a t e of a c o n i i d e n c e i n t e r v a l f o r a sed iment load tha t may be der ived f rom two o r t h r e e y e a r s of d a t a ?
Dr. J . Kwxt Well , again I am s u r e t h i s p r o b a b l y v a r i e s r e g i o n a l l y . The s i t u a t i o n t h a t I am f a m i l i a r w i t h i n t h e u p p e r midwest i s t h a t we do s e e f r e q u e n t l y d e c a d a l s c a l e p e r s i s t e n c e i n t he r eco rds , and we can l ook a t longer term records o f c l i m a t e o r c l i m a t e p r o x i e s . I n t h i s c a s e we have r e c o r d s o f t empera tu re t ha t we can take back t o 1820 or s o . I n t h e c a s e of Canada, the Hudson Bay Company has some n i c e r e c o r d s t h a t go h a c k i a r t h e r . I think what we need to ds i s l o o k a t t h e s e k i n d s of records and see to what d e g r e e t h e p r o b a b i l i t i e s of r e c u r r e n c e of c e r t a i n k i n d s of c r i t i c a l e v e n t s t ha t t r anspor t s ed imen t migh t have va r i ed w i th in t hose r eco rds . Now, t h i s , I t h i n k , i s p r e f e r a b l e , a t l e a s t from my poin t of v i e w , i n e s t i m a t i n g w h a t is l i k e l y t o h a p p e n , s a y o v e r t h e n e x t 10 years than jus t assuming pure randomness .
have the c a p a b i l i t y of p e r f e c t p r e d i c t i o n , even very good p r e d i c t i o n r i g h t I t h i n k you come up w i t h a b e t t e r f i g u r e , bu t aga in I t h i n k b e c a u s e we do not
now, t h a t p r o b a b l y t h e s c e n a r i o a p p r o a c h i s s t i l l a requi rement . You have t o look a t i t in t e rms of what i s p o s s i b l e and I t h i n k t h o s e p r o b a b i l i t y f i g u r e s a r e p r e t t y good i n t e l l i n g you what is poss ib le , perhaps even what i s reason- ab ly p robab le . We s e e r i g h t now, a t l e a s t o c c u r i n g s i n c e a b o u t 1950, a r e t u r n t o c i r c u l a t i o n p a t t e r n s t h a t seem to have cha rac t e r i zed many y e a r s i n t he p rev ious cen tu ry , r ecu r red w i t h much g r e a t e r f r e q u e n c y . Now whether t h a t i s going t o c o n t i n u e t o happen, I have no way cf knowing, but i t is i n t e r e s t i n g t h a t some of t h e p a t t e r n s we have now a p p a r e n t l y are s i m i l a r t o ones t ha t occu r red ove r l ong pe r iods of time. Much of t h e f i r s t h a l f of t h e 2 0 t h c e n t u r y h a d r e c u r r e n c e f r e q u e n c i e s o f c i r c u l a t i o n p a t t e r n s , p r e c i p t a t i o n c h a r a c t e r i s t i c s and runoff that may be a l i t t l e b i t u n u s u a l o v e r t h e long term s c a l e of t h e l a s t 200 y e a r s or so . Now, i f t h a t is t r u e and we are work ing f rom du ra t ion cu rve ex t r apo la t ions and we w e i g h t o u r d a t a r e l a t i v e t o t h e r e c o r d , t h a t is n o t r e a l l y r e p r e s e n t a t i v e o f w h a t is going to o c c u r i n t h e nex t decade o r s o ; then w e are i n t r o u b l e .
149


Sediment Storage and Remobilization Characteristics of Watersheds
C. Nordin
INTRODUCTION
position of weathering and erosion to its point of ultimate deposition is a complex process developing in time under random influences. By definition (Cramir, 1964), this movement is a stochastic process.
The movement in a watershed of a sediment particle from its
Most of what we know about sediment movement and sediment storage in watersheds comes from empirical observations, and despite the fact that sedimentary processes have been observed for many decades, only a few generalizations can be drawn from the extensive data accumulated. This discussion deals with the following generalizations: (1) the relation of sediment yield to drainage area and its implication in terms of sediment storage in watersheds; ( 2 ) the random nature of daily and annual sediment loads; ( 3 ) short-term in-channel storage of sediment; and finally ( 4 ) a stochastic model of sediment movement and its limitations.
SEDIMENT YIELD AND DRAINAGE AREA
Sediment yield usually is determined one of three ways: (1) from small experimental plots where artificial precipitation is controlled and all runoff and sediment can be measured; ( 2 ) from periodic surveys of sediment collected in reservoirs; and ( 3 ) from sampling sediment loads of streams. Auxilliary methods involving remote sensing, topographic mapping or cross sectional valley and channel surveys also are used.
The relations of sediment yield to drainage area vary from arid to humid regions, but the general trend is for the unit sediment yield to decrease with increasing drainage area. The implications are clear; the movement of eroded sediment is not continuous, and the larger the drainage
major unresolved problems with respect to sediment yield are those re- area, the more chances there are for storage of eroded material. The
lating to storage. If all the sediment eroded from the headwater areas of watersheds is not transported out of the basin, where does this sediment g o , what is its residence time while in storage, and what are the factors
of empirical data collected to determine sediment yield from small water- that control its movement and deposition? Despite the tremendous amount
sheds, it has not been possible to draw sufficient generalizations to permit answering these sorts of questions.
Most of the reliable data on sediment yield are from watersheds with drainage areas less than about 10 square kilometres, while most
greater than 200 square kilometres. Very little information is available stream sediment discharge records are for basins with drainage areas
for basins in the range of 10 to 200 square kilometres drainage area.
151

DAILY AND ANNUAL SEDIMENT LOADS
The sediment yield from large watersheds and sediment discharge to the oceans are determined from measurements of sediment discharge at gauging stations. These records are considered fairly reliable because: (1) the flow and transported sediment are confined generally to a single channel where measurements are relatively simple and standardized; and (2) many of these stations have been operated for years so that the stochastic properties of the time series of flow and sediment discharge are well-defined.
against water discharge. Generally, there is a fair correlation with an increasing trend of sediment load with water discharge, indicating that the same variables affect both runoff and sediment yield, and almost always there is considerable scatter about a mean line relating sediment discharge to water discharge. Typically, the sediment discharges from arid and semi arid regions are several Orders of magnitude higher for a given water discharge than those from more humid basins, and at low flows, the scatter in sediment load for arid regions is five or six orders of magnitude compared to about an order of magnitude for the humid regions. Part of this scatter is seasonal variation, but even after integrating over the annual cycle, there is considerable scatter in the relation of annual sediment load to annual streamflow.
A common method of displaying sediment loads is to plot them
Land use has substantial impact on sediment yield, and most activities such as road building, urbanization, timbering, and strip mining, if not subjected to careful controls, can increase substantially the sediment yield of a specific area. The rate of rehabilitation of a disturbed area is generally rapid in urban areas and decreases with decreasing annual precipitation in rural areas.
IN-CHANNEL STORAGE AND REENTRAIN"
In-channel storage and reentrainment of sediment may be a long- term phenomenon associated with the building of point bars and flood plains with concurrent lateral migration of channels, or it may be a
properties of the flow. There is little basis today other than projection seasonal or shorter-term phenomenon related to hydrologic and hydraulic
of historical data for predicting rates of lateral migration of channels, but short-term changes related to stream hydrology OK to hydraulic sorting can be modelled with reasonable success if sufficient data are available to establish initial conditions, boundary conditions, and inputs. The two general approaches to modelling these processes are: (1) to construct stochastic models of the time series of water discharge and sediment discharge (Rodriguez and Nordin, 1968); or (2) to employ computational hydraulics as described by Bennett (1974).
152

STOCHASTIC M~DELS OF PARTICLE M~VEMENT
-L Mathematically, the position vector X(t) of a particle at time
t is given by
f t
-L where the initial position X(o) = o at time t = 0 . The velocity 0 ,
is a random function of position and time so X also is a random function of position and time.
* O.t
Equation 1 says simply that a particle's position is the integral over its velocity and the description is precise whether the movement is continuous or discontinuous. From a practical point of view, though, the utility of equation 1 is restricted to some few cases where the particle velocity can be specified or where the distributions of particle step lengths and rest periods are known; so the applications are limited mostly to the hydraulic problems of predicting dispersion of fine particles or bedload transport under conditions of steady uniform flow. Considerable progress has been made in recent years on these particular stochastic models, but there still exist some disturbing departures of empirical observations from the theoretical models (Nordin, 1975), so the problems can hardly be considered solved. Nonetheless, it is encouraging that at least certain aspects of the sediment transport processes can be approached on a fairly rigorous mathematical basis.
Although equation 1 is an exact description of particle movement, there are practical limitations in its applications. The first restriction requires the process be stationary; that is, the parameters describing the distributions in the process should not vary with time. A second restriction, one that is even more critical, is that the model is kinematic; so for predictive purposes, it is necessary to relate the parameters of the model to the dynamic forces of the flow. This can be done for steady uniform Flow over a flat bed. For this case, the particle steps, <, are assumed to be instantaneous and equation 1 becomes
n(t)
X(t) = [21
i = l
wwhere n(t) is the random number of steps in the time interval o to t of a given particle. The step lengths relate to particle size and flow conditions near the bed, while the number of steps relates to these same factors and t the size distribution of the bed; that is, to the number of particles of a particular size that are available for transport. The distribution of rest periods of a particle is related to the distribution of a number of steps, n, and it provides the probability that a particle will be stored on the bed for any finite time interval.
153

Todorovic and Nordin (1975) generalize the w s t important theoretical results of various stochastic models that have been proposed and derive expressions for the errors involved in the approximations in equation 2.
Probably the most critical research need today is to compile and generalize existing empirical data to permit interpolation and extra- polation to areas where no field data have been collected. Such general- ization would also serve as a rational basis for network design to collect additional field data where it is needed. Further development of math- ematical and stochastic models should be undertaken, with particular attention to methods for treating non-steady or non-stationary processes.
LITERATURE CITED
Bennett, J . P., (1974) Concepts of Mathematical Modelling of Sediment Yield Water Resources Research, lo. ( 3 ) . 485-492.
Cram&, Harald, (1964). Model Building With the Aid of Stochastic Processes Technometrics, 5, (2), 133-159.
Nordin, Carl, (1976). Simulation of Velocity Distribution and Mass Transfer Stochastic Approaches to Water Resources (ea. H. W. Shen), P. 0. Box 606, Fort Collins, CO., V. 11, chap. 22, 24 p.
Rodriguez-Iturbe, I., and Nordin, C. F., (1968), Time Series Analysis of Water and Sediment Discharges Int. Assoc. for Scientific Hydrology, 13, ( 2 ) , 69-86.
Todorovic, Petar, and Nordin, C. F., Jr., (19751, Evaluation of Stochastic Models Describing Movement of Sediment Particles on Riverbeds U.S. Geol. Survey Journ. of Research, 3, (5), 513-517.
154

DISCUSSION
Dr. E. Ongley: 1 am wondering, if you have any feeling for whether there is an inverse relationship between particle size and the residence time in transport? Would you suspect that?
Dr. C. Nordin: I have evidence that says that there is under steady uniform flow conditions. Experimental evidence in a laboratory flume shows that the rest period duration, or a distribution of rest periods of a particle is a function of the particle size. Once you get into a natural condition where you do not have steady, uniform flow, where you have particles depositing some place and picked up somewhere else, it is hard to say. One typical storage problem that you would run into is in most natural channels where you have material eroded from the outside of a bed being deposited on the next bar downstream. This material might be stored in that bar for centuries until the meander sweeps on downstream. So what is the rest period of particles there? They take a few hops along the channel and rest in that bar deposit for a couple of decades or a couple of centuries until the meander sweeps on downstream and picks them up. This is important in terms of nutrients and contaminants because there is a possibility for contaminants to be deposited in a flood plain and then be re-exposed at a later time on a fairly uniform basis. So you may never get these things out of the channel.
Ur. J . Knor: Carl (Nordin), what time scale are you applying a randomness on? The reason I ask is that on certain time scales, things are certainly not very random; they are very episodic.
with the ideas of randomness if you look at the work that Mandelbroth and Vr. C. Nordin: I do not think that the concept of persistence is in conflict
Hurst have done, or even the work that G. I . Taylor did in introducing the correlation function to statisticians. There is a persistence, and until that correlation dies out this persistence determines the movement.
Dr. .J. Knox: The point is really how much energy do you want to expend to make something that appears random at one scale really deterministic at another scale?
155

Dr. C. Nordin: Well as an engineer I am p e r f e c t l y c o n t e n t e d t o work w i t h d e s i g n l i v e s . Most e n g i n e e r s a r e w i l l i n g t o work wi th 50 yea r s o r 100 yea r s because i f t hey des ign someth ing , t hey a r e go ing t o be gone by t h e time i t f a i l s . The time s c a l e s a r e v e r y d i f f e r e n t . I a g r e e w i t h you t h a t t h e r e are e p i s o d e s of ve ry low flow and very high flow of v e r y i n t e n s e a c t i v i t y and I d o n ' t know how you h a n d l e t h e s e .
Dr. J . Knox: One t h i n g t h a t we d id t o improve t he l eve l of exp la ined va r i ance be tween water y ie ld and sed iment y ie ld was to ca l ibra te for the var ious k inds o f e v e n t s w i t h i n a g iven phys iog raph ic a r ea and g iven l and u se r eg ion . The exp la ined va r i ance ro se and t hen you cou ld i n t e rp re t your r eco rds Over a l o n g e r term of e v e n t s by look ing at the s t ream f low f rom which you usual ly have l onge r r eco rds . It is a m a t t e r of c a l i b r a t i n g o v e r s h o r t e r p e r i o d s of time, f o r p a r t i c u l a r times of e v e n t s a n d t h e n g e t t i n g a l o n g e q u a t i o n w i t h dummy v a r i a b l e t y p e i n p u t s w h e r e a 1 OK a 0 i s ahead of t h e c a l i b r a t i o n c o e f f i c i e n t . I f t h a t e v e n t o c c u r r e d i n t h a t p e r i o d , it had a 1 and mul t i - p l i e d it i n . I f it d i d n o t i t c a n c e l l e d i t o u t . T h a t g i v e s p r e t t y r e a s o n a b l e r e s u l t s . I t e x p l a i n s most of the var iance but i t t a k e s a l o t of time and much e f f o r t , b u t i t can be a s igni f icant improvement .
Dr. C. Nordin: I t h i n k I would a l s o a g r e e w i t h y o u r s u g g e s t i o n t h a t when you s t a r t s i m u l a t i n g or t r y i n g t o p r e d i c t t h e s e t h i n g s t h r o u g h s i m u l a t i o n y o u h a v e t o l o o k a t a l a r g e v a r i e t y o f s c e n a r i o s or you have to run a lot of r e a l i z a t i o n s o f y o u r s t o c h a s t i c p r o c e s s and get some d i s t r i b u t i o n o f t h e s e .
156

Forms and Sediment Associations of Nutrients (C.N. b p . ) Pesticides and Metals
Nutrients - P
H . L. Golterman
I NTRODUCT I ON
As most of the Dutch lakes are situated in the deltas of the Rhine and Meuse, they receive large amounts of nutrients from this source. In total they receive 6 g m-', y-l; about 50% from the Rhine. The Rhine carries about 70,000 tonnes of PO+-P per year, of which 80% is transported into the North Sea. Of the remaining 15,000 tonnes about 50 - 60% is accumulating in the Dutch lakes, which receive an annual load of about 6 g per m2 per year.
ESTIWTES OF RIVERINE PHOSPHATE
Sources
Three different sources of riverine phosphate - and thus of the Rhine - can be distinguished:
1) natural erosion; 2) human waste; 3) agricultural runoff.
Global Phosphate Resources
A first estimate of the erosion can be made with a global mean value. Phosphate occurs in rocks as calcium apatite, in the range between 0.07 - 0.13%. Van Wazer (1961) estimated the total amount of phosphate in the lithosphere to be 1.1 x loz5 g of which lo" g is present in the sea in the dissolved state, while l o z 1 g is buried in marine sediments. (Only 3 x 10l6 g is considered to be mineable).
Erosion-derived Phosphate
During chemical weathering the major part of this amount is converted into a "lattice bound clay" phosphate. In unpolluted clays the phosphate phosphorus is about 0.1%.
Following Meybeck's (1976) estimate for total solid riverine transport (2 x 10l6 g per year, = 5 x the dissolved transport) we arrive at a figure for erosion for PO~-P of 2 x 10¹³ g per year.
157

For specific calculations we use Meybeck's figures for erosion of:
- 500 tonnes per k m 2 for small alpine rivers; - 200 tonnes per k m 2 for middle sized basins (A= about 100,000 k m 2 ) and - 140 tonnes per km2 for large basins (A > 400,000 k m 2 ) ,
while rivers in a low relief area have values about 10 times lower. With this kind of calculation we arrive at a value for the mine of about 4,000 tonnes.
Silicate - Phosphate Ratio6 A second calculation makes use of the ratio Si02-Si/POs-P, which we
found to be around 100/1 in many unpolluted rivers in Africa and Southern France. This calculation gives a POh-P load in the Rhine of about 10,000 tonnes. Human waste can be estimated to be around 50,000 tonnes per year, based on an annual POs-P production of 1.5 kg per year per person.
Agricultural Phosphate
Agricultural runoff can be estimated at 1,000 - 10,000 tonnes per year assuming a runoff of 0.05-0.5 kg per ha per year. The total of these three fractions is about 65,000 - 70,000 tonnes per year, not far from the measured value.
Phosphate Availability - Algal Bioassays Availability of sediment phosphate was studied by algal bio-assays,
using Scenedemus as a test organism. All sediment yielded a good algal growth, although not all the phosphate appeared to be available. It seems that the phosphate bound into the clay lattice (the "natural" clay phosphate)
crops. Phosphate freshly adsorbed onto clay is easily available to algal is not available for algae, although it is readily available for agricultural
cultures.
Phosphate Availability - Chemical (NTA) Desorption
It was found that with NTA (nitrilotriacetic acid) an amount of phosphate could be extracted equal to that used by algae. Iron bound phosphate is entirely available, while the availability of apatite depends on the crystal size. Whether this potential availability can indeed be used in the real lake situation depends largely of course on the hydrodynamics of the system.
158

Long Term Studies
Experiments in an artificial pond (enclosure type) supported the
m2 of POq-P was released by the sediments. The NTA extractable phosphate results of the bioassays. In half a year's experiment well over 1 g. per
fraction decreased in the same period by 50%.
A Sediment Phosphate Model
A schematic model discussed relates to the importance of sediment phosphate to the general phosphate cycle.
Colterman, H. L., 1973. Natural phosphate sources in relation to phosphate budgets. Water Research 7, 3-17.
Golterman, H. L., 1977. Sediments as a source of phosphate for algal growth (In press. Proceedings of a symposium, held in Amsterdam September 1976. Interactions between sediments and freshwater) Junk/Pudoc, The Netherlands.
Meybeck, M . , 1976. Total mineral dissolved transport by world major rivers. Hydrological Sciences-Bulletin-des Sciences Hydrologiques XXI, 2 611976.
Van Wazer, J R., (ed), 1961. "Phosphorus and its Compounds," 2 Vols., Vol. 2, Interscience, New York".
159


DISCUSSION
Dr. D. BouZdin: Does the soil in the agar disc undergo reduction during the assay or does it remain oxidized?
Dr. H . Goltermun: It remains oxidized.
Dr. ,J. Shapiro: What concentrations of NTA do you use f o r extracting?
Dr. H. Golteman: 0.01 molar, pH about 7-8.
L%. d. Shupiro: Do you think the concentrations that would normally be expected from use of NTA in detergents could have any effect?
Dr. H. I;olteman: No, this is about a thousand times as much.
161


Forms and Sediment Associations of Nutrients (C.N. & P.) Pesticides and Metals
Nutrients - P
T. CahiZZ I NTRODKT I ON
The purpose of this discussion is to summarize current knowledge of phosphate transport, particularly as developed during the past four years. Prior to 1 9 7 2 , measurement of both orthophosphate and total phos- phate in natural river systems was done on a grab sampling basis, usually without corresponding stream flow measurement. The inclusion of total phosphate as a regular water quality parameter was actually n o t widespread prior to the mid-l960's, so that the historical record is both short and
The absolute variability of concentration over time can be estimated from largely qualitative. A typical record of this type is shown in Figure 1.
such records, but any projection of mass flux rate or annual mass transport is fraught with error.
A number of studies conducted during 1 9 7 2 , 1 9 7 3 and 1 9 7 4 , (e.g. Baker and Kramer, 1 9 7 3 ; Cahillg &. 1 9 7 4 ) have been based on sampling
with particular emphasis upon storm events. This research has yielded procedures utilizing synchronous measurement of storm flow and chemistry,
several facts regarding the behaviour of phosphate loadings.
The concentration of total phosphate increases with stream discharge, so that the phosphate chemograph closely parallels the hydrograph.
Soluble phosphate behaves quite differently from total phosphate.
Strong correlations are often found between total phosphate and suspended solids concentrations.
Mass transport during storms tends to comprise a very large proportion of total annual phosphate loadings.
Past methods of estimating long term phosphate loadings on the basis of average concentrations have severely underestimated annual mass transport.
More recent studies have continued to build on this knowledge. I
The present discussion is based on the findings of three such investi- gations: 1) analysis of Lake Erie tributaries in the LEWMS' project (COE', 1 9 7 5 ) ; 2 ) the Maumee River Basin Study conducted for the GLBC3 (GLBC, 1 9 7 6 ) ; and 3 ) recent analysis of data for Honey Creek in the Sandusky River Basin of northwest Ohio. Honey Creek has served as a pilot study area in the continuation of the LEWMS project and thus has been the focus of considerable water quality analysis. (See Figure 2 )
* United States Army Corps of Engineers ' Lake Erie Wastewater Management Study Great Lakes Basin Commission
163

""- " I
n
s 1
P
""
"""- -I=
I____
0 """
""-
i: 4
""""I
"""" 4
165

Increased knowledge of the mechanisms whereby phosphorus is released from insoluble forms has suggested that the proper focus of attention in lake eutrophication studies is total phosphate, rather than soluble phosphate or orthophosphate alone. Analysis of the behaviour of total phosphate in river systems has been limited primarily to examination of relationships with discharge. In the Lake Erie basin, the strongest positive relationships with discharge are found in the western tributaries
basins such as the Cattaraugus (Figure 4 ) . Prior studies in the Brandywine such as the Maumee (Figure 3 ) ; the weakest associations occur in the eastern
basin of southeastern Pennsylvania have also indicated relatively poor relationships (Figure 5 ) .
Analysis of total phosphate is complicated by the fact that different sources and transport mechanisms are dominant under different flow conditions. Loadings at high flow consist very largely of insoluble sediment-associated phosphate derived from nonpoint sources. During low- flow conditions, soluble phosphate from point sources is likely to pre- dominate, although nonpoint sources such as agriculture and on-site dis- posal of domestic waste may also be important. The behaviour of total phosphate concentrations over time is therefore likely to reflect the mix of sources present in a watershed.
A convenient step in analyzing conventional water quality records is to partition total phosphate into two components: orthophosphate, and total minus ortho phosphate. The latter is treated as an estimate of particulate phosphate, although it is known to be only approximate. (Investigators must of course acknowledge that phosphate delivered to a river system in soluble form may adsorb to particulate material while in transport). Separate analysis of these phosphate components will not necessarily establish the relative importance of specific pollutant sources, but can be very helpful in clarifying the nature of loading mechanisms.
of river basins. An intermediate level of empirical analysis is possible, Ideally, such studies should include detailed chemical/hydrologic modeling
however, which goes beyond simplistic plotting of the data without attempt- ing to specify explicitly all the causal linkages responsible for observed
of this type of intermediate analysis. loadings. The Honey Creek findings discussed below represent the outcome
ORTHOPHOSPHATE
been found to bear a positive association with stream discharge in most river studies, and may in fact be inversely related to discharge over the lower flow range. Such an inverse relationship may be linked to dilution of point source effluents. In the Brandywine Creek studies,'orthophosphate concentrations have been found to obey relationships of the following form:
Unlike total phosphate, orthophosphate concentrations have not
166

ID 0
0
ID
0
ID 0
N
0
c
d
d
4
0
0
0
0
P
Lo In
N
0
c: L”
1/9W
‘d lt1101
16 7

1.5 -
1 .2 -
0 . 9 -
0 .6 -I
'
0.3 - +
.
. H"H+H 0 41
D I S C H R R G E I N CFS
Figure 4 . Cattaraugus Creek a t Gowanda, New York Spring 1975 Sampling Period, From LEWMS, 1976

L = - 2000- $i In E
2 c!
5 1500 E
!z
e 1000-
W
X v)
n
d 4 I- O I-
500
0
I I I I I I 4000 8000 12000 16000
FLOW cubic feet per second
Figure 5. Composite of Storm Samples, 1973 Chadds Ford
169

C Cws + ~ Q P (C - Cms) Q
where: C = orthophosphate concentration; CWs = orthophosphate concentration from nonpoint sources;
Qp = discharge from point source "P";
C = orthophosphate concentration in effluent from point P source "P"; Q = stream discharge.
The quantity Cms represents a base-level orthophosphate concen-
tration which is related to the land use characteristics and natural features of the watershed. In the Lake Erie basin, values of Cms appear to range from
100-200 pg/l in the heavily-impacted western tributaries such as the Portage, to 10-20 pg/l in the eastern watersheds. Loss of orthophosphate due to adsorp-
of this factor is undetermined. tion during transport may affect these relationships, although the influence
Somewhat different findings have been obtained for Honey Creek, a basin which was chosen as a test area partly because of its agricultural nature and absence of major point sources. The orthophosphate concentration in Honey Creek appears to be positively related to discharge--but only during certain periods of the year. Analysis of Honey Creek data has been conducted by partitioning streamflow into two components; direct runoff, and groundwater outflow. The former consists of surface runoff from rainfall and snowmelt events, plus a portion of infiltrated water which passes rapidly to the tile drains underlying agricultural land. Flow separation has been accomplished solely on the basis of discharge records at the watershed mouth; experimentation indicates that the methodology utilized is not critical. The analysis of orthophosphate has then been based on the assumption that each observed concentration represents a weighted average of orthophosphate concentrations in the two flow components. That is,
where: CD =
CG =
Q,, Q , =
orthophosphate concentration in
orthophosphate concentration in
streamflow due to direct runoff outflow, respectively;
direct runoff;
groundwater outflow;
and groundwater
The imputed orthophosphate concentrations CD and CG have been
estimated by regression analysis, utilizing the 1976 record for Honey Creek which spanned 7 months and contained more than 300 observations. Values of C and C were allowed to vary among different portions of the sampling
period (through the use of dumy variables yielding the interesting results
pattern, falling from moderate levels in mid-winter to low values in April, shown in Figure 6). Both of the imputed concentrations followed a similar
then rising to high levels in June and July. The seasonal variation was more pronounced for the imputed orthophosphate Concentration in direct runoff; and this quantity was generally higher than the imputed groundwater concen- tration.
D G
170

0.200
0.160
-I
3 z_ z 0.120 P t a y 0.08
+ z w
0 0
"11""" ' DIRECT RUN OFF I I I I I I I I I I I I
z_ I
P I
a
0.200-
0.160-
-I
3 z
I I y 0.08-
r""-d t 0~120-"~"""""g I
I I I
I
+ z w
0 0
I I p m " l
I I I I
I
I I I
I I I I
GROUNDWATER OUTFLOW
0.04 - 0.04
"11""" ' DIRECT RUN OFF I I I I I I I I I I I I I I I
r""-d I
-
-
- 1""""""g I I I I I p m " l - I I I
I I
I I
I I I I I
I GROUNDWATER I OUTFLOW
Figure 6. Imputed Orthophosphate Concentrations in Direct Runoff and Groundwater Outflow Honey Creek Watershed, 1976

The rise in concentrations from April to June i s believed to be related to fertilizer application on agricultural land. This finding, if verified in other watersheds, could provide an important index of the agricultural contribution to phosphate loadings. The decline in concen- trations from January to April could represent exhaustion of the soluble phosphate available from agricultural activities in the previous year. The mid-February decline in the direct runoff concentration could also be related to another factor. Discharge during the previous period was caused primarily by snowmelt, and contained unusually low suspended solids concen- trations (see discussion below). The rate of phosphate adsorption during transport could therefore have been relatively low, due to lack of available sites. The decline in orthophosphate concentrations which followed the major rainstorm in February 16 could thus represent, in part, simply a return to more normal circumstances with regard to phosphate transformation. In any case, linkage of orthophosphate concentration to the crop production cycle appears to be the only plausible explanation for the overall patterns shown in Figure 6.
The two-compartment approach utilized here for analysis of ortho- phosphate could easily be expanded to a three-compartment approach by incorporation of the point source equation given earlier. This mode of analysis is considered promising in cases where full-scale chemical/ hydrologic modelling is not feasible.
PARTICUATE PHDSPHATE
There is little question that most of the total phosphate in transport during storm flow conditions i s occurring in association with particulate matter, as measured by suspended solids. The overall cor-
not all of the Lake Erie basins, (Figure 7). Linear regressions can be fitted relation between total phosphate and suspended solids is good for most, but
to these data and take the form of y = mx+b, as in the Maumee;
TP (ug/l)=l. 32(SSmg/1)+153 (Maumee at Waterville, 1975).
The Brandywine Basin Data also found a good relationship between total phosphate and solids, but used "Residue on Evaporation" (ROE) rather than suspended solids. bThose data showed the best curve fit (r' = 0.86) to be the power curve y=ax , yielding;
Total Phosphate (pg/l) = 1.48 (ROE) 0.975
Of course, the ROE measurement includes both suspended and dissolved solids, and would not be suitable for basins with relatively high dissolved solids, such as the Maumee.
Recognizing that the bulk of phosphate transport occurs with particulates, it i s of interest to take that portion of the total phosphate which is non-soluble, defined as TP (TP - OP = TP ), and compare its ratio
to suspended solids as the concentration changes over a hydrograph. The linkage of total minus ortho phosphate to suspended solids concentration is extremely strong. In the statistical analysis of Honey Creek data, the only additional factor needed to explain total minus ortho P concentrations
P P
172

LD 0
v)
N
N
4
9 Y
9
4
0
0
1/9W
'd ltJ101
173

was stream discharge (which had a very low estimated exponent). By com- bining and rearranging the predictive relationships for total minus ortho and suspended solids, an expression has been obtained for the ratio of the former to the latter, as a function of discharge, seasonality, and time since start of storm. This predictive equation for the phosphorus-to- sediment ratio (excluding orthophosphate) is depicted graphically in Figure 8. The curves in Figure 8 relate to storm periods in the spring; summer conditions would differ slightly. The phosphorus-to-sediment ratio is found to be linked positively to time since start of storm, which is plotted on the horizontal axis, and negatively to discharge.
differences in the composition of the suspended load carried by the stream during different flow conditions. In the early stages of storm events, and during periods of high discharge generally, a large proportion of the suspended load may consist of coarse grained materials which are relatively low in phosphorus content. Since these are the materials most likely to be lost from storm water during storage and transport, the sediment load at other times tends to be limited primarily to fine colloidal particles, which are relatively high in phosphorus. Although additional studies are needed to provide fuller understanding of these relationships, it is clear that the phosphorus-to-sediment ratio is fairly stable across storm events. During non-storm periods, the ratio tends to be somewhat higher than the values shown in Figure 8 (due in part to the more prominent role played by soluble orthophosphate).
Both of these associations are probably related to systematic
CHANNEL SCOUR AND I~POSITICN
An issue which has been the subject of some discussion is the role of the stream channel in sediment transport, i.e., the extent to which observed suspended solids concentrations reflect SCOUK and deposition processes in the channel system. The Honey Creek data for the February snowmelt/thaw period provide an interesting perspective on this issue. In the four-day period from February 10 to 14, high discharges occurred entirely as a result of snowmelt and thawing of the soil surface. Suspended solids
due to surface flow, rather than raindrop impact. The low concentrations concentrations at Melmore would thus reflect channel scour, and land erosion
observed suggest that channel scour tends to be of relatively minor import- ance.
The following table compares the February snowmelt period with a four-day storm period in March, which involved a somewhat higher peak discharge but similar total runoff. Both of these periods occurred approx- imately two weeks after a major storm; initial discharge in each case was 90 cfs.
Suspended Solids Peak
Discharge in cfs Load in concentration Period Duration Peak Average metric tons (md1)
Feb. 10-14 4.0 days 947 820 March 3-7 4.0 days 1279 805
522 104.1 1950 506.5
174

. 0 0 3 0
.0025
.Ei . 0 0 2 0 c, a a: w 0 a, 2 .0015 m >
.OOlO
- Q= 50 - Q = i 5 0 Q=1100
-
-
I I I I 0 1 2 3 4
T i m e Since Storm S t a r t , i n Days
Figure 8. Values of the Phosphorus-to-Sediment Ratio (Excluding Orthophosphate) by Time Since Storm Start and Discharge (Q) Honey Creek Watershed, 1976.
175

The total suspended solids loading was nearly four times as great in the March storm as in the February snowmelt period; and the peak concen- tration was five times as great. There appears to be no reason, other than the somewhat lower peak discharge, why net channel scour should be less in the February period than in the March period. Scour should perhaps be greater, due to the low utilization of transport capacity by sediment from the land surface. Thus, if these figures can be regarded as representative, one might conclude that channel scour is responsible for no more than about 25% of the total suspended solids load in a moderate storm (and possibly much
periods). The implication would be that the bulk of suspended solids and less, in view of the other potential sources of sediment during snowmelt/thaw
phosphorus loadings from small basins such as Honey Creek tend to originate from the land during the same storm period in which they are observed.
Hydrologic Response
A great deal of analysis has been done (LEWMS, 1975) which considers the variation in concentration of total phosphate with hydrologic response in different watersheds, showing the seasonality, storm duration and mag- nitude effects. Several multipeaked hydrographs have also been analyzed, and demonstrated the "hysteresis" effect. The conclusion drawn from these data is that a rigorous analysis of individual events in a watershed is necessary to understand the generation of diffuse pollutants, and any application of "annual loading factors" is misleading at best. Of par- ticular interest in the data analyzed was the large variability in mass transport produced with different storms. It was seen that any estimate of load contributed per unit area of watershed (kg/ha) would depend entirely upon the period sampled, and thus we can begin to understand why the liter- ature shows such a great variability when different sets of data are compared in this way. Expressed quite simply, there is no such thing as "average" mass flux produced in a watershed, but rather the diffuse pollutant trans- port which occurs is entirely a function of the hydrologic response of the basin, and the mechanisms which generate the response determine the path- ways by which pollutants are brought into suspension or solution and pass through the system. The fact that greater storms produce greater transport per "unit area" could be interpreted to mean that an increased percentage of the basin land area was having pollutants removed form its surface, as "partial area" hydrology would suggest (Dunne, 1973). Dunne and others have suggested that the hydrologic response of a basin does not occur on a uniform basis, but that incident precipitation on certain areas produces the immediate hydrograph rise. These partial areas are flat, impervious soils with high water table, usually contiguous to the drainage channels. Since diffuse pollutant transport occurs in association with this runoff, the management implication is that only a small portion of a total water- shed need be regulated to reduce the production of these pollutants.
TOTAL PHOSPHATE - (~GANIC (COD) TRANSPORT
One might question the possibility that much of the total phos- phate measured with storm transport is occurring in organic matter, or detritus, rather than in association with inorganic matter or soil particles.
176

Everything from decaying vegetation to macroinvertebrates are flushed from a river bottom or land surface and of course contain phosphorus. The only parameter measured over hydrographs which might express the organic trans- port has been Chemical Oxygen Demand (COD). It has been observed that there is a very great increase in concentration of COD during runoff, reaching values averaging 40 mg/l and peaks of over 100 mg/l. This repre- sents an organic transport which, in many basins, far exceeds the input from point sources.
As far as the relationship between total phosphorus and COD goes however, it is very poor; that is, while both materials are in transport during a runoff event, they do not seem to occur in association with each other. While these data is far from conclusive, they do not support the "organic phosphorus" source possibility.
PHOSP~DRUS TRANSPORT THROUGH ESTUARIES
A key question pertaining to the storm transport of phosphorus out of river basins into a lake such as Lake Erie, is just how much phosphorus actually gets flushed through the estuary and reaches the lake. Knowing the nature of these estuaries, the tremendous dredging required to maintain the shipping channels and the sediment-associated nature of most of the total phosphorus, one might speculate that we have exaggerated the loading problem, and in actuality only a fraction of a tributary basin's nutrients actually reach the lake. However, synchronous sampling of riverine and estuarine stations in both the Maumee and Cuyahoga basins during several spring storms in 1975 strongly suggest, although not conclusively, that most if not all of the sediment-associated phosphate is flushed through the estuary during a large storm. A great deal more work, however, is necessary to answer this question satisfactorily.
BIOLOGICAL UPTAKE DURING NON-STORM CONDITIONS
One final question pertains to the phosphate which i s discharged from treatment plants and either taken up by aquatic vegetation or pre- cipitated by calcium ions to settle on the stream bottom. These mechanisms are significant in many basins, especially during summer, (TMACOG', 1976). This "point source residual" can accumulate in a stream, and subsequently may be scoured during storm runoff. However, a continuous mass balance analysis for several watersheds with large point source inputs, such as the Portage basin, demonstrated that only a minor portion of the total mass transport of phosphate during storms can be accounted for by this residual.
SEARCH NEEDS
evolving with respect to the reduction and control of diffuse or non-point In an effort to better guide the management strategies which are
sources in the Great Lakes, some general knowledge gaps can be identified
' Toledo Metropolitan Area Council of Governments
177

regarding phosphate which have broad applicability to other pollutants. Because of the immediate need for this information, these deficiencies receive a higher priority than some of the long term research needs. These knowledge gaps can be filled by four general programs carried out jointly by the various agencies operating in the Great Lakes. They are as follows:
(1) Evaluate the effectiveness of land management techniques, especially agricultural, for nutrient load reduction;
( 2 ) Analyze storm transported phosphate to determine long term bioavailability;
(3) Develop hydrologic response models which more accurately simulate pollutant production and transport mechanisms, and
( 4 ) Evaluate both the positive and negative aspects of widespread acceptance of tillage modification techniques, such as no-till.
While a great wealth of water quality data has been developed throughout the Great Lakes Basin, it is likely that additional sampling will be required for selected watersheds to accomplish the first three programs. Other important research questions should not be neglected, including a reevaluation of erosion loss analysis techniques (USLE) as applied to watersheds, modelling particulate transport during storms, lake bottom release rates and tile drainage effects, to mention only a few. However, the primary objectives of research during the next two to five years should centre on land management techniques which will actually reduce diffuse pollutants and the evaluation of present erosion control techniques to determine if they will accomplish the necessary reduction.
LITERATURE CITED
Baker, D. B. and Kramer, J. W., (1973). Phosphorus Sources and Transport in an Agricultural River Basin of Lake Erie, Proc. 16th Conf. Great Lakes Res.
Bowen, D. H. M., (1970). The Great Phosphorus Controversy, Environmental Science and Technology, 6, 725-726.
Cahill, T. H., P. Imperato and F. H. Verhoff, (1974). Evaluation of Phosphorus Dynamics in a Watershed, Journal of the Environmental Engineering Division, ASCE, April - 100, (EEZ), Proc. Paper 10445.
Cahill, T. H., J. Adam and D. Baker, (1976). The Importance of Diffuse Pollutants in River Chemistry, Presented at the 19th Conference on Great Lakes Research, May 1976.
Cahill, T. H., P. Imperato, P. K. Nebel and F. H. Verhoff, (1975). Phosphorus Dynamics In A Natural River System, in WATER- 1974, 145, 71, A.I.Ch.E., New York.
Cleaves, E. T., Godfrey, A. E. and 0. P. Brinker, (1970). Geochemical Balance of a S m a l l Watershed and its Geomorphic Implications, Geological Society of America Bulletin, e, 3015.
178

Connell, C. H., (1965). Phosphates in Texas Rivers and Reservoirs, Water Research News No. 73, Southwest Water Research Council, Fort Worth Tex.
Deevy, E. S . , Jr., (1970). Mineral Cycles, Scientific American, 223, (3), 149-158.
Dunne, T., and Black R. D . , (1970). Partial Area Contributions to Storm Runoff in a Small New England Watershed, Water Resources Research, 6, 1269.
Hammer, Thomas, H., (1976). Interim Report; Urban Land/Water Relationships, U.S.E.P.A., Cont. No. 68-01-3551, June 1976.
Hutchinson, G . E., (1969). Eutrophication, Past and Present, Eutrophication: Causes, Consequences, Correctives, National Academy of Sciences, Washington, D. C., pp. 17-26.
Johnson, N. M., g . , (1969). A Working Model for the Variation in Stream Water Chemistry at the Hubbard Brook Experimental Forest, New Hampshire, Water Resources Research, 1, 1353.
Keup, L. E., (1968). Phosphorus in Flowing Streams, Water Research, - 2, 373.
Lee, 6 . F., (1969). Analytical Chemistry of Plant Nutrients, Water and Sewage Works, 116, R-38.
Logan, T. J. and G . 0. Schwab, (1976). Nutrient and Sediment Character- istics of Tile Effluent in Ohio, Journal of Soil and Water Conservation, 2, (1).
Mackenthun, K. M., (1965). Nitrogen and Phosphorus in Water, An Annotated United States Selected Bibliography of Their Biological Effects, Publication 1305. United States Department of Health, Education and Welfare, Division of Water Supply and Polution Control, pp. 1-112.
Mackenthun, K. M., (1968). The Phosphorus Problem, Journal of the Water Works Association, 6 0 , 1047-1053.
McKee, 6 . D . , &, (1970). Sediment-Water Nutrient Relationships, Part 2, Water and Sewage Works, 177, 246.
National Assessment of Trends in Water Quality, Environmental Control, Inc., National Technical Information Service, Springfield, Va., June, 1972.
Rendon-Herrero, 0. J . , (1974). Estimation of Small Watersheds, Journal of Hydraulics 835.
Rigler, R. H., (1956). A Tracer Study of the Water, Ecology, x, 550-562.
Washload Produced on Certain Division, ASCE, 1 0 0 ,
Phosphorus Cycle in Lake
179

Sandoval, M. T., T. H. Cahill, and F. H. Verhoff, (1975). Mathematical Modellings of Nutrient Cycling in Rivers, Div. of Env. Chem. ACS., Phila., Pa., April 6, 1975.
Wang, W. C. and Evans, R. L., (1970). Dynamics of Nutrient Concentrations
42, 2117. in the Illinois River, Journal Water Pollution Control Federation, -
Wolman, M. G., (1971). The Nation's Rivers, Science, 174, 905.
180

Forms and Sediment Associations of Nutrients (C.N. & P.) Pesticides and Metals
Nutrients - N
T . Logan
I NTRODKT I ON
Nitrogen along with phosphorus are nutrients that are required by most organisms in large quantities. These organisms range from the smallest bacteria to algae and also higher plants used by man for food.
Many authors have cited nitrogen and phosphorus as the nutrient elements limiting productivity in waters (Mackenthun &., 1967; Hasler, 1970). Keeney indicated that N may be more important than P in limiting growth in eutrophic lakes, especially those high in P (Keeney, 1972).
This review will consider:
1. The forms of nitrogen involved in fluvial transport with emphasis on sediment N.
2. The relative sources of nitrogen entering fluvial systems.
3 . The microbiological and chemical transformations of nitrogen involved in sediment-aquatic environments.
4 . The role of the C/N ratio in nitrogen transformations.
5. Identification of research problems and knowledge gaps.
1, FORMS OF NITROGEN
Nitrate-N Ions - NO-3
Ammonium-N N H + u
Nitrite-N NO-2
soluble anion; product of nitrification; used by most organisms; not retained in soil, leaches readily.
soluble cation; product of decomposition of organic materials; utilized by most organisms; retained on neg- atively charged clay particle.
biological oxidation; toxic soluble anion; product of
to higher plants; does not usually occur in high concen-
soil or sediment at high pH trations; will accumulate in
and under anaerobic conditions.
181

Gases
Ammonia-N
Nitrous oxide
Nitrogen
product of biological decomposition; toxic; evolved when pH is high or under dry soil conditions.
product of denitrification;
product of denitrification. constituent of atmosphere;
PARTICULATE FORMS
of nitrogen In biological systems. In addition to the biologically viable compounds in fauna and flora tissue including protein, amino acids, and nucleic acids. there are the complex N forms found in decomposed organic materials. This organic matter, also called humus is the product of primarily microbiological decomposition. Brenmer (1967) summarized the extensive work in soil organic nitrogen characterization. Based on this work, soil organic nitrogen may be divided into several categories (Table 1). Much of the soil organic N remains unidentified and may include amino acids other than those previously identified and heterocyclic nitrogen compounds (Bremner, 1967).
Many attempts have been made to identify the mostly organic forms
The small amount of fixed MI, is primarily a consequence of the + physiochemical entrapment of NHI, ions between the internal surfaces of expandable clays such as illite (Figure 1). The degree of fixation will vary with expandable clay content and the extent of interlayer weathering.
+
The bioavailability of particulate N has concerned agronomists for years and is also of interest to ecologists studying the impact of
bioavailability with a particular fraction or fractions has been unsuccess- tributary loadings on lake water quality. Attempts to correlate N
ability and mineralization tests (Stanford, 1968) and correlations ful. In recent years, more attention has been given to direct bioavail-
between chemical extraction and N released by incubation (Stanford and Smith, 1976). These tests show some promise in estimating potential N mineralization in soil but have not been extended to aquatic systems.
2, SOURCES OF NITFKIGEN ENTERING FLUVIAL SYSTEMS
a) Runoff and Erosion - the main product of runoff and erosion is surface soil and some crop residue, leaves and other debris. Some soluble Nos-N and N1k-N is transported during runoff; however, if erosion is significant the organic soil N contribution will be much greater (Armstrong et&., 1974). Runoff sediment is enriched with nitrogen, i.e. the total N content of the sediment is higher than the soil from which it originated. Hensler and Attoe (1970) found that total N enrichment was 2.7 to 5 fold. This is due to selective clay transport and also the lower density of some organic matter. The total particulate N content of sediment can be estimated from a knowledge of the soils from which it was derived.
182

TABLE 1.
FORMS OF PARTICULATE N IN SOILS
Form X of total N
Amino - N 20-40
Hexosamine 5-10
Purines and pyrimidines -1
Unidentified forms 30-50
Fixed N H 4 3-8
TABLE 2.
CHARACTERISTICS OF WASTEWATER EFFLUENTS
Primary Trickling Secondary Ponds Activated
Sludge
”----% 11-
Total N 31 16 23 23
NO 3-N 0.3 6.3 3.9 0.7
NH4-N 23 5.9 17.0 a. o
183

0
0
0 0
0 0
0 0
0
CI

Jenny ( 1 9 4 1 ) in his classic thesis on soil formation indicated that soil N increased with increasing rainfall and showed that soils developed under grasses contained higher N levels than under forest vegetation (Figure 2 ) . For most of the Great Lakes basins, the total N of virgin soils would be about 0.1 - 0 .25%. Cultivation has resulted in substantial mineralization of soil N (Figure 3 ) and present levels are about 60-70% of the virgin soil N. Further net soil N l o s s is quite low and crop residue management and adequate N fertlization can maintain soil N levels.
b) Tile Drainage and Seepage - this source will contain mostly nitrate; low concentrations of N H b - N and dissolved organic -N may be found in tile drainage (Armstrong et&., 1 9 7 4 ) .
c) Precipitation - varying amounts of N (5-50 kg/ha) can be added in rainfall; made up of both nitrate and ammonia.
d) Sewage - the major source of N from domestic sewage is that discharged as secondary treated effluent. Pound and Crites ( 1 9 7 3 ) indicated that depending on the method of treatment (Table Z ) , effluent will contain varying amounts of N forms with organic N as the major constituent. The organic N is quite stable and resistant to further mineralization. Septic tank leakage can be a major component of N loading in some water- sheds, but this source is difficult to quantify. Most input would be as nitrate.
e) Livestock Wastes - Improper disposal of livestock wastes due application to soil can result in significant N additions to to inadequate storage facilities or because of excessive
streams. Livestock wastes are highly variable in their characteristics depending on livestock type and the degree of decomposition of the manure. Runoff of fresh manure from barnlots or feedlots can result in high BOD and N H 3 loadings which can have disastrous effects on downstream aquatic habitat. Leaching of NO,-N from excessively manured land will mean increased N loading. Livestock wastes vary in total N content (Table 3 ) and the percentage of the total N that is
N is mineral ( N H J + N O 3 ) and about 25-50% of the organic N is subject to mineralization. In general, about 50% of the total
mineralizable in the first year.
f) Processing Wastes - may be high in both N H k - N and organic N . BOD levels are usually high. A localized problem.
g) Overall Sources of N to Great Lakes - Various estimates of point and nonpoint sources of nitrogen would indicate that about 30-50% of the total N loadings are from point sources, par- ticularly wastewater effluents. Loadings of N to Lake Erie from various tributaries (Table 4 ) indicate that most of the N is in the form of N03-N with smaller amounts of organic and NH4-N. If we assume an annual mineralization of 3% for the organic N (based on rates for soil N), then it would appear that sediment N is relatively insignificant as a source of N loading to Lake Erie.
185

0.300 - 0 Grassland soils - 8 Grassland soils (averages) -
- t Forest soils - - + Forest soils (averages) -
c C 0, 0
- -
$J 0.200 a
5:
- - - .- -
LC 0 C 0, C 0 0 C al 0)
- - - c -
- - -
2 E 0.100 - 4- .- Q -
New Jersey
Humidity factor (N.S.Q.)
+
+
Figure 2. E f f e c t of rainfall on s o i l N content (Jenny, 1941)

0
0..
0
0
0 I
18 7

TABLE 3.
CHARACTERISTICS OF LIVESTOCK WASTES
Total N (Percent of total Solids)
Dairy Cow 3.9
Beef Feeder 4.9
Swine Feeder 7.5
Sheep Feeder 4.5
Poultry Layer 5.4
Poultry Broiler 6.8
Horse 2.9
Stream
Cuyahoga
Sandusky
Black
Huron
Portage
TABLE 4.
TRANSPORT OF NITROGEN FROM STREAMS DRAINING INTO LAKE ERIE (1974-1975) LAKE ERIE WASTEWATER MANAGEMENT STUDY
Sediment
mt/yr x lo3
1222
483
270
136
71
48
~_______
N03-N + N02-N mtlyr % *
34700 594
2020 120
5170 85 2
3520 297
1180 317
2100 808
Ammonia-N
mt/yK %
966 16.5
476 20.3
213 35.1
338 28.5
46 12.4
57 21.9
Organic-N
mt/yK %
5174 88.6
1200 71.4
394 64.9
847 71.5
326 87.6
203 78.0
Kjeldahl-
mtlyr
5840
1680
607
1185
372
260
* Percent of total Kjeldahl-N
18 8

3. BIOLOGICAL NITROGEN TRANSFONTIONS IN SEDIENT/WATER SYSTEMS
The important sediment-nitrogen reactions are visualized in Figure 4 (Keeney, 1972).
a) Nitrogen Fixation - primarily by blue-green algae (Cyanophyceae). Some fixation by anaerobic heterotrophs has been reported but N fixation in sediments is probably of only minor importance (Brezonik, 1971).
b) Immobilization - also termed assimilation. In aquatic systems,
NHs-N assimilation is probably more significant than N03-N. Whereas, in terrestial systems (soils) bacteria and fungi are dominant in N assimilation, in aquatic systems the phytoplankton and herbivorous zooplankton are more important because of their numbers and capacity to assimilate organic materials. Bacteria play an important role in the decay of these organisms. Bacteria may aLso be very important in utilizing organic N secreted by zooplankton and converting it to mineral N (Keeney, 1972).
c) Mineralization - Ammonification - Decomposition of organic
+
materials by heterotrophic bacteria results in the release of mineral N as NH;. N regeneration, i.e. net N release, is determined by the stability of organic forms and the ability of the bacteria to convert organic C to cellular C (Foree " et al., 1971). Net mineralization appears to be less efficient under anoxic conditions than when the system is aerated. The degree of mineralization of organic N in sediments will depend on the extent to which the organic material is humified (Bremner, 1967). Recent organic deposits will be mineralized to a greater extent than organic N from soils. In addition, there is some degree of stability imparted by the interaction of organic compounds with clay minerals. Zooplankton are involved in ammonification by
phytoplankton + detritus. Johannes (1968) believes this excreting NH3 and amino acids which they gain by feeding on
to be the dominant mechanism of ammonification in surface waters. Direct autolysis after cell death may account for 30-50% of N released from plant and animal material. Bacterial decomposition is considered to be of minor importance in N mineralization in shallow lakes except where sewage contributes large amounts of organic matter. In sediment systems, however, bacterial and fungal mineralization is the dominant process.
d) Nitrification - Biological oxidation of nitrogen to nitrite and nitrate is performed by heterotrophs including bacteria, fungi and algae; however, these are of limited importance compared with the autotrophic bacteria. The net nitrification is given as:
N H ~ + 20; -f NO; + H ~ O + ZH+ + energy
Nitrite, NO;, is an intermediate oxidation product, but is rzrely present in significant concentrations because the rate of NOz oxfdation is much faster than the initial oxidation of NHr to + N02.
189

ATMOSPHERE { Rainwater 3 External Sources
ATMOSPHERE
External Sources
WATER NO,-, NH,', Organic N
Particulate organic N-NH,' (Nitrification)
9
SEDIMENT ~,y [-I - NH,' (Soluble Exchangeable)
NO,- in Groundwater
Figure 4 . Generalized nitrogen cycle in waterlsediment system (Keeney, 1972)

The conditions for nitrification are favourable in fluvial Systems
will also proceed in bottom sediments if they are stirred and pH above 1 O C and there is evidence to indicate that nitrification
buffered (Keeney, 1972).
e) Denitrification - The biological reduction of nitrate to gaseous N (NO, NzO, N2). This is a significant reaction in streams and lakes, leading to l o s s of nitrogen from the system. Bacteria
Pseudomonas, Alcaligenes, Achromobacter, Bacillus and Micrococcus. responsible for denitrification include species of the genera
Denitrification occurs in the absence of 0,, induced by 0, consumption during decomposition of organic material (BOD) and by the limitation of O 2 diffusion in quiescent water. De- nitrification is limited by temperature (optimum at 60-65°C
near 7). Denitrifiers require a readily available source of and considerable activity above 20°C) and pH (optimum at pH's
organic carbon. Denitrification will be high in high BOD stream sections, especially where the organic carbon is easily decomposable. Denitrification - nitrification can occur simultaneously (Keeney, 1972) and this process is responsible for much of the disappearance of NOB-N from lakes. The role of denitrification in fluvial N03-N balance has not been studied extensively; however, it would appear that conditions for denitrification would be optimum during low flow summer periods if sufficient carbo? is present. Reddy al. (1976) have recently shown that NHs in the anoxic zone of sediment can be denitrified as NH,, diffuses into the oxic zone and is nitrified. The nitrate then diffuses down into the anoxic zone where it is decitrified.
+
4, THE F ~ L E OF THE CARBON/NITROGEN RATIO IN NITROGEN TRANSFORNITIONS
All organisms have a characteristic C/N ratio, depending on the relative amounts of protein in their biomass. Higher plants may range from as high as 1OO:l for some straw residues to as low as 2 O : l for some of the legumes (Brady, 1974). Bacteria and other microorganisms have a ratio of about 9:l. During the heterotrophic decomposition of organic materials, mineral N (N03-N) may be assimilated or released depending on the C/N ratio of the mineral being decomposed (Figure 5 ) . Much of the N assimilated by the heterotrophs will be mineralized as these organisms themselves die and are decomposed. The N not mineralized becomes part of the solid phase (soil or sediment) as organic matter with a C/N ratio of about 10-12:l. This nitrogen is quite resistant to further decay. The C/N ratio of decomposable material in transport will determine if there is a net gain or l o s s of N from the system due to microbiological transformations.
5. SEDIPENT-NITROGEN TRANSFORMATIONS DURING FLUVIAL TRANSPORT
a) During Storm Runoff - during periods of maximum transport in the early spring, biological nitrogen transformations will be minimal due to the short transport intervals and cooler temperatures.
191

192

Sediment nitrogen will closely reflect source materials (eroded soil, resuspended bottom sediments). These sediments are likely to have C/N ratios of about 10-12:l and to be quite stable.
Low Flow Winter Runoff - this is a period of minimum sediment transport. Most of the nitrogen transported will be NOS-N from
There will be a minimum of biological activity. seepage and tile flow with some NHq-N from point discharges.
Low Flow Summer Runoff - during this period, sediment transported will be low; nitrogen transport will be minimal and confined to point sources. Biological activity will be high. Sediment-water phase reactions involving biological nitrogen transformations will be operating under optimum conditions. Nitrate will be removed from the water phase by assimilation and denitritifation. The net addition or removal of N frpm the system will depend on the environmental conditions determined by stream character- istics. Sediment acts to buffer the transport of nitrogen as it does for phosphate. The multitude and complexity of biological N transformations make N transport a very dynamic process and makes estimation of delivery ratios to streams difficult (McElroy " et al., 1976).
6, GAPS I N CURRENT WWLEDGE
Most of the available literature pertains to terrestial or lake systems. In-stream nitrogen transformations involving sediment nitrogen have not been studied extensively.
The extent of microbial and algal N fixation in streams is not known.
A satisfactory model for N transformation during fluvial transport is needed; this is especially true of in-stream assimilation and denitrification.
The extent of transport of N in organic materials (crop residues, leaf litter, detached aquatic vegetation and zooplankton) needs to be further elucidated.
Analytical methods to determine bioavailability of suspended sediment nitrogen should be developed.
The effect of estuaries on nitrogen loadings to the lake is not known.
In summary, the processes of nitrogen cycling and interchange in sediments are complicated and poorly understood. The mechanisms whereby nitrogen is exchanged between water and sediments are probably known, and in some cases qualitative rankings can be given to their importance. However, almost no information is available to establish the in situ rates and controlling factors for these processes (Brezonik, 1971).
193
LITERATURE CITED
Armstrong, D. E., K. W. Lee, P. D. Uttomark, D. R. Keeney, and R. F. Harris, (1974). Land Use/Water Quality Relationships in the U.S. Great Lakes Basin. Task A6: Nutrients. PLUARG, IJC, Windsor. Ontario.
Brady. N. C., (1974). The Nature and Properties of Soils, 8th Edition, Macmillan, New York.
Brewer, J. M., (1967). Nitrogenous Compounds. In Soil Biochemistry, A. D. McLaren and G . H. Petersen, Eds., Marcel Dekker, N. Y., pp. 19-66.
Brezonik. P. L., (1971). Nitrogen: Sources and Transformations in Natural Waters. Presented at American Chemical Society, Los Angeles, California.
Foree, E. G., W. J . Jewel1 and P. L . McCarty, (1971). The Extent of Nitrogen and Phosphorus Regeneration from Decomposing Algae. Water Research, III (27).1-15.
Hasler, A. D., (1970). Man-Induced Eutrophication of Lakes. Global Effects of Environmental Pollution, S . F. Singer, Ed. Springer- Verlag, N. Y., pp. 110-125.
Hensler, R. F. and 0. J. Attoe. (1970). Rural Sources of Nitrates in Water. Proc. 12th Sanit. Eng. Conf., Nitrate and Water Supply, Source and Control, Univ. Illinois. Bull., %,(2),86-98.
Jenny, H., (1941). Factors of Soil Formation. McGraw-Hill, New York.
Johannes, R. E., (1968). Nutrient Regeneration in Lakes and Oceans. Adv. Microbiol. Sea., 1,203-212.
Keeney, D. R.. (1972). The Fate of Nitrogen in Aquatic Ecosystems. Eutrophication Information Program, University of Wisconsin, Madison, Wisc.
McElroy, A. D., S . Y. Chiu, J. W. Nebgen, A. Aleti and F. W. Bennett,
Nonpoint Sources. Midwest Research Institute, EPA-600/2-76 151. (1976). Loading Functions for Assessment of Water Pollution from
Mackenthun, K. M. and W. I. Ingram, (1967). Biological Associated Problems in Freshwater Environments - U.S. Dept. Interior, FWPCA, Washington, D. C.
Nomnik, H.. (1965). Ammonium Fixation and Other Reactions Involving a Nonenzymatic Immobilization of Mineral Nitrogen in Soil. In Soil Nitrogen, Amer. S O C . Agron. Monograph No. 10.
Pound, C. E. and R. W. Crites, (1973). Characteristics of Municipal Effluents. Proc. Joint Conf. Recycling Municipal Sludges and Effluents on Land, Champaign, Ill.
Reddy, K. R., W. H. Patrick, Jr. and R. E. Phillips, (1976). Ammonium Diffusion as a Factor in Nitrogen Loss from Flooded Soils. Soil Sci. SOC. her. Journ., 3,528-533.
194

Stanford, G., (1968). Extractable Organic Nitrogen and Nitrogen Mineralization in Soil. Soil Sci., 1 0 6 , 3 4 5 - 3 5 1 .
Stanford, 6. and S. 3. Smith, (1976). Estimating Potentially Mineralizable Soil Nitrogen from a Chemical Index of Soil Nitrogen Availability. Soil Sci., =,71-76.
ADDITIONAL LITERATURE
Likens. G. E., (1972). Nutrients and Eutrophication: The Limiting- Nutrient Controversy, Symposium. American Society of Limnology and Oceanography, Allen Press, Lawrence, Kansas.
Allen, H. E. and J. R. Kramer, (1972). Nutrients in Natural Waters. Environmental Science and Technology Series, Wiley-Interscience, John Wiley and Sons, New York.
195


DISCUSSION
Dr. R. Swank: Relative to your problem on nitrogen balances in marshes or the ability of marshlands and wetlands to attenuate the nitrogen loads, there is a large study going on now, sponsored by the Smithsonian Institute in the Chesapeake Bay area in Maryland, in which I understand, they are focusing primarly on nitrogen, phosphorus and carbon in wetlands. This is in both salt water marshes and freshwater marshland. We hope to get some useful data out of that. The laboratory where I work (U.S. EPA, Athens, Georgia) is also sponsoring some work at the Westpoint Military Reservation where there are rather extensive small freshwater marshes driven almost entirely by sub-surface flow, intermittent flows and runoff from primarily forested and pasture type land use. There are no pasturing animals on it, just grassland. That might also be very useful for this purpose. We are focusing on that area with regard to some modelling studies. It is a major plus because the data so far suggest that marshes are particularly effective in absorbing nitrogen - i.e. denitrification. They appear to be great sinks f o r nitrogen of all forms, less so for phosphorus and the carbon situation is unclear. Frankly, there apparently seems to be an equilibrium in the marshes, but there are a lot of data being generated there and a lot of research interest in that domain as well.
With regard to the nitrogen sources there is some work that was done by EPA in the agricultural runoff model. We are taking a very close look at the runoff forms of nitrogen by continuous simulation, but it is a process model. It is essentially a marriage of the lump parameter hydrology model with a process nitrogen model. We are doing a lot of cali- bration of that model or testing it, as well as calibration of parameters in various locations around the U.S. We have four years of data at Watkinsville which is in Piedmont, Georgia, near the location of my laboratory. Those data are about to be published and should be of great interest both from pesticides, sediment, water yield and nitrogen yield for agronomic crop growth operations. There are about four different watersheds, a variety of practices, a variety of crops and a variety of management practices.
We have extended that study rather comprehensively to Iowa State University on Four Mile Creek. Iowa State, Purdue and EPA are involved in that one as well. We are looking at in-stream processes there, trying to make some kind of rational judgements about the kinds of nitrogen work you
We hope to have some data out of that, in terms of sediment movements in streams, are talking about as a data gap. We recognize it also as a severe data gap.
loading and dynamic loading. Continuous simulation is the approach we are taking. We have extended that further to do some regionalization based on
197

the Smithsonian Institution's work primarily in the Chesapeake Bay area. We are participating in that study again with the idea of calibrating on a regional basis the R model with this kind of concept. The U . S . Department of Agriculture is involved in that with some of their continuous simulation approaches. I think they are going t o look at ACMO and some of t h e o t h e r new models they have developed recently. So we again are hoping to "piggy-back" onto many researchers for this kind of work. I j u s t wont t o indicate that there is a lot of work underway in some of these data gap areas that may directly relate to the problems of the Great Lakes, even though they are not in f ac t being done in assocation with any of the Great Lakes programs.
198

Forms and Sediment Associations of Nutrients (C.N. & P.) Pesticides and Metals
Pesticides
H. 8. Pionke
I NTRODKT I ON
It is my intention to assist in the PLUARG endeavour by identifying significant gaps in current knowledge and to define associated research needs relative to specific problems of the Great Lakes Basin. The emphasis is on: (1) determining the impact of land use activities on boundary waters rather than upstreams areas; ( 2 ) defining pesticide research needs to answer specific problems or to meet needs of the Great Lakes Basin rather than to answer general issues in pesticide research; and ( 3 ) developing practical remedial measures for correcting the identified problems. The last two needs imply a sufficiently good forecasting and inventory capability to establish present pesticide use and near-future trends.
Because the impact of a pesticide in boundary or upstream waters is going to be related to pesticidal bioactivity in some phase such as the sediment, aqueous, or vegetative phases, the planner's objective is to estimate or determine this bioactive concentration. The bioactive concen- tration depends on the pesticidal concentration and its toxicity. In turn, the pesticide concentration observed in a phase at a downstream point depends on upstream use, persistence, the characteristic pesticide dis- tribution between phases, and the resultant hydrologic dilution. Relatedly, the expected toxicity may be abnormally reduced by adsorption or incorp- oration of the pesticide or abnormally increased to some target species by the presence of other pesticides or chemicals (i.e. synergism).
The title of this paper "Forms and Sediment Associations of Pesticides" defines an important part of the environmental system that exerts controls on pesticidal toxicity and concentration in selected phases. For example, pesticidal persistence, toxicity and concentration of the pesticide distributed between phases can be substantially altered by sediment during l o s s , transport and in the impact area. However, it is the author's opinion that environmentally-oriented, future pesticide research must first be considered in the context of the total system before one component of this system, i.e., the adsorbed and sediment-associated phase can be isolated and considered separately. The current gaps in present knowledge relative to this workshop's objectives are still at a system rather than a component scale. Thus, the pesticide-sediment interaction will not be discussed separately but within the context of the dominant environmental and pesticide properties controlling the pesticide bioactivity in a phase.
199

in term of this assignment and the workshop objectives. a more appropriate set of questions needs to be asked. Basically, these are: "Which pesticides have potentially the greatest impact?" and "For those pesticides selected as having potentially the greatest impact, what are the dominant environ- mental conditions reasonably occurring in the Great Lakes that substantially alter the expected downstream environmental hazard?" Specific answers to these two questions would likely place research emphasis on a select few pesticides and the dominant environmental conditions.
In order to usefully answer the three questions posed by the IJC
osophy t o select pesticides and their key environmental interrelationships My paper will refine and expand these two questions into a phil-
for special research emphasis. This is followed by several specific reco- mmendations most of which are aimed at improving the selection process. The selection process is described by answering the questions which are subdivided and mare clearly defined for purposes of better organizing the folloving discussion.
They are: (1) Which pesticides are and will be applied in large quantities to major watersheds within the Great Lakes Basin? (2) Of these, which pesticides have the basic properties that alone or in combination create a potential environmental hazard under a reasonably selected standard set of environmental conditions? and (3) What known or expected environmental changes in subunits of the watershed could substantially alter the potential environmental hazard of pesticides earlier identified by answering the previous two questions? Generally, the text will follow the flow chart (Figure 1).
Which pesticides are and will be applied in large quantities to major watersheds in the Great Lakes Basin? This is the most important information need for selecting pesticide research. To do this adequately,
This will tie time and area distributions of application together. To annual surveys by specific pesticide according to subwatersheds are needed.
date, this information is not available for the Great Lakes Basin. Best current sources of information are the periodic surveys (1964. 1966, 1971) by the Economic Research Service, USDA, which are presented according to combined State rather than watershed boundaries and by the Ontario Ministry of Agriculture and Food publication, which more closely coincides with watershed boundaries. However, the latter is still not current, the latest year of publication being 1973. The Great Lakes states (Michigan, Minnesota and Wisconsin) were chosen for comparison because this grouping had the highest percentage of land area draining into the Great Lakes Basin of any state grouping. This was approximately one-half the total land area of these three states.
establish use trends in selected Great Lakes states and Ontario (Table l), it is apparent that the organochlorine insecticide use has decreased dramatically. Increased use of methoxychlor, chlordane and the relatively stable usage of toxaphene in the U.S. contradict this overall trend. The
Note that by using these data to designate present use and to
200

FIGURE 1 A FLOW DIAGRAP: FOR IDENTIFYING PESTICIDE RESEARCH P R I O R I T I E S I N THE GREAT LAKES BASIN
\ ( T o x i c , p e r s i s t e n t a n d a d s o r b e d )
I ( i n t e r m e d i a t e t o x - t s i s t e n c e ) i c o l o g y a n d / o r p e r - RESEARCH AUTOPIA-
TICALLY CONSIDERED I FOR COMMON ENVIR-
\ a n d a d s o r b e d ) ( T o x i c , p e r s i s t e n t
I
ONMENTL
PEST IC IDES 7 PERT I NENT ENV I RONMENTAL EXCLUDED ( T o x i c i t y PROPERTIES THAT SUBSTAN- FRY; STUDY ~ ~ ~ { ~ ~ c ~ e r - TIALLY ALTER TOXICITY,
g r e a t l y PERSISTENCE OR ADSORP- r e d u c e d ) T I V I T Y (NON STANDARD BUT
CONDITIONS) EXPECTED ENVIRONMENTAL
I
4 p e r s i s t e n c e . a d s o r p - ( T o x i c i t y a n d f o r
t i v i t y g r e a t l y i n - c r e a s e d )
INDICATE WHICH PESTI- CIDES SHOULD B E STUD- t I E D AND IN WHAT CONTEXT
CONDITIOMS
201

Table 1. Quantities of Organochlorine Insecticides (1000 lb units active ingredients) used in Lake States (Michigan, Wisconsin and Minnesota) for 1964, 1966 and 1971 and in Ontario, Canada for 1968-1973.
Lakes State- 11 Ontario, Canada- 2 1
Insecticide 1964 1966 1971 Trend 1968 1969 1970 1973'
Aldrin 761 717 93 Greatly decreased 3263 27 - - Chlordane - 154 225 Increase (8)- (74) 82 (105)
DDD 104 108 1 Greatly decreased 296 463 85 - 41
DDT 511 430 2
Dieldrin 69 97 - 0.3 0.8 - Endosulfan - 32 2 Stable U U U
I,
- 15
Endrin 12 - - Decrease (3) (3) (0.2)
Heptachlor 105 48 10 Greatly decreased U U U - Lindane 24 58 1 Decrease (2) (2) 6 (3)
Methoxychlor - 5 76 Increase U U U 3
Toxaphene 53 111 40 Stable U U U -
N
0,
" - none reported U = unknown
'/ Farmers Use of Pesticides, 1964, 1966, 1971 - Quantities, Economic Research Service, USDA, Agricultural Economic Reports Nos. 131, 179, 252.
2/ Agricultural Pollution of the Great Lakes Basin, (1971). Environmental Protection Agency, Water Quality Office Publication 13020---07/71.
Roller, Nick F. Survey of Pesticide Use in Ontario, 1973. Economics Branch, Ontario Ministry of Agriculture and Food Parliament Buildings, Toronto, Ontario. M7A 1B6, October 1975. Total amount applied determined by summing specific use categories in Appendix IV.
Parenthetical statements are average annual quantities calculated from the total sale records over the follow- ing two year periods: 1968-1969, 1970-1971 and 1972-1973. Frank, R.; Smith, E. H.; Braun, H. E.; Holdrinet, M.; and Wade, J. W. (1975), Organochlorine Insecticides and Industrial Pollutants in the Milk Supply of the CA..+ .L"" n - , ~ I C 7 9

use of carbamates has increased substantially whereas total organophosphate insecticide usage has remained essentially stable. However, the trends in these data must also be interpreted relative to regulatory actions which have severely prohibited the use of organochlorine pesticides (Table 2, in particular note chlordane and toxaphene). The present applications of such pesticides have either declined to near insignificance or are in imminent danger of being severely restricted for agricultural use. Thus,
directed toward land use effects on pollution in the Great Lakes, research in the context of research leading to future remedial programs that are
into the organochlorine insecticides should be severely downgraded if not dropped from consideration. The most recently available pesticide usage and use trends are summarized in Tables 3 and 4 .
with a knowledge of imminent or recently instituted Provincial, State or Federal regulatory actions. This should include the projected effect of new pesticide introductions. In the context of applying remedial measures, it may take 5-10 or more years to develop a research idea to the level of an effective watershed-scale remedial program. Thus, if successful imple- mentation of remedial measures depends on prior research, long-term pesticide use projections will have to become part of the research planning process.
For trend analysis, results of any survey need to be supplemented
The pesticides listed on Tables 3 and 4 in addition to methoxychlor and toxaphene were used to construct Table 5 . The fungicides were not included because they were applied in much smaller quantitites than were the insecticides and herbicides. Table 5 incorporates some basic pesticidal properties, determined under select conditions, which serve as the base information for the next step.
Of these, which pesticides have the basic properties that alone or in combination create a potential environmental hazard under a reasonably selected standard set of environmental conditions? The three basic pesticidal properties considered here to be of primary importance in the Great Lakes are: persistence; toxicity; and the basic pesticide distribution between phases, e.g., water, sediment and vegetative phases. Considerable inform- ation exists and much of it is already available for guidance on making some of the most basic decisions regarding research emphasis.
On the basis of trend data presented earlier, the shift in pesticide consumption has been from the persistent insecticides of relatively low mammalian toxicity to those of much less persistence but often greater toxicity.
The persistence times of the most commonly used pesticides are presented in Table 5. The persistence categories of low (C6.0 months), intermediate (6-18 months) and high (218 months) were chosen according to time required to dissipate an accumulated 10 year residue once application had stopped according to a first order disappearance rate (Tables 6 and 7). Unless the pesticide degrades to substantially longer-lived phytotoxic daughter-products, the impact of the short-lived pesticides ($6 months one- half life) is expected to be upstream or on watersheds rather than in boundary waters. Thus, the impact of the short-lived compound is probab- ilistic, i.e., based on the probability of a selected rainfall event or series occurring within a certain period after application, which will cause the pesticide concentration in some phase downstream to exceed a
203

Table 2 . Major regulatory action limiting agricultural use of Organochlorine
Insecticides in Ontario. Canada and the U. S .
~~~ ~~
Ontario, Canade 31
11 United States- 31
2 1
Action- Date Act ion- Date
Aldrin
BHC
Chlordane
Dieldrin
DDD
DDT
Endrin
Heptachlor
Hept. Epox.
Lindane
Methoxychlor
Mirex
Toxaphene
Restricted 1969
Never registered for agricultural use
Being reviewed at 1976 Federal level
Restricted 1969
Restricted 1970
Restricted 1970
-
Restricted 1972
Restricted 1969
Never registered - No restriction
No restriction
Never registered -
- -
Restricted at 1972 Federal level
Cancelled
To be reviewed
Suspended
Cancelled
Cancelled
Major restrictions Cancelled
To be reviewed
Suspended
Suspended
To be reviewed
No restriction
Restricted to non food crops (intent to ban)
No restriction
1972
1976
1975
1972
1971
1969 1972
1976
1975
1975
1976 -
1971
-
"Agricultural Pollution of the Great Lakes Basin, Combined Report of Canada and the United States, 1971. Environmental Protection Agency, Water Quality Office Publication 13020-"07171. Also private communication from Dr. R. Frank Ontario Ministry of Agriculture and Food, University of Guelph, Guelph, Ontario
?/The Pesticide Review by D. L. Fowler and J. N. Mahan. Agricultural Stabiliza- tion and Conservation Service. USDA, 1968 to 1975 (annual publication). Also private communication from J. Ellenberger, Regulatory Entomologist, EPA, Washington, D. C.
"Statement may not be legally correct but essentially so based on impact on agricultural use.
Cancel. = No application allowed.
Suspension = No manufacture allowed.
Review = Initiate process that can lead to suspension o r cancellation.
Restrict = Restricted to non agricultural uses.
204

Table 3. Top s i x r a n k i n g i n s e c t i c i d e s a c c o r d i n g t o amount a p p l i e d w i t h u s e
t r e n d s i n p a r e n t h e s e s .
I Lakes States (1971) Ontar io (1973)
Carbary l ( s t a b l e )
Bux ( s t a b l e ) Carbofuran ( g r e a t l y i n c r e a s i n g )
Diazinon ( s t a b l e )
Phora te ( g r e a t l y i n c r e a s i n g )
Azinphosmethyl ( s t a b l e )
Carbary l (unknown)
Chlordane (unknown)
Dursban (unknown)
Carbofuran (unknown)
Phora te (unknown)
Phosvel (unknown)
Table 4 . Top s i x r a n k i n g h e r b i c i d e s a c c o r d i n g t o amount appl ied with use
t r e n d s i n p a r e n t h e s e s .
1
2
3
4
5
6
4,
Lakes S ta tes (1971)
A t r a z i n e ( g r e a t l y i n c r e a s i n g )
Propachlor ( g r e a t l y i n c r e a s i n g )
2,4-D ( s t a b l e )
EPTC-vernolate ( g r e a t l y i n c r e a s i n g )
Amiben ( g r e a t l y i n c r e a s i n g )
Alachlor ( g r e a t l y i n c r e a s i n g )
Ontar io (1973)
Atraz ine (unknown)
B u t y l a t e (unknown)
Alachlor (unknown)
*
2.4-D (unknown)
Amiben (unknown)
Cyanazine (unknown) *
Used most ly in combina t ion wi th At raz ine .
See Table 1 f o r r e f e r e n c e s .
205

206

207

0 N
m
li = l l l lknow~: L = Laboratory Study; F - Field Study; S - Sediment predominant node of transport; W - Water. * ~ ’ e r ~ l ~ ~ c c i ~ ~ is the experimentally dvtermined ~ l m e required for the original pesticide concentration i n soil to he reduced to
one-ll,?tf. is the concentretlcln lethal to 50% of the population exposed for a given number of hours. Hours are i n pazenLllrtlcr1 statement. Kd is ~lle equilibrium concentration adsorbed on the soil or organic carbon (OC) divided by that in 5010210n.
i/il.maher, . I . W . 1972. Decomposition: quantitative Aspects, Chapter 4 In Organic Chemicals i n the Soil Environment: Vol. 1 Harcal Lkkker. New Kork.
?/Edwards, C. A. 1972. Insecticides. Chapter 8 Organic Chemicals i n the Soil Environment: Vol. 1. Uarcel Dekker. E(eu Yurk.
J’l~lmentcl, I). 1971. Ecological Effects of Pesticides on Non-Target Species. Executive Office of the President. Office of S r l c n c c and Technnlogy. GPO Stock No. lalob-0029.
d’Becaose no experimentally determined values available, approximate values based on relative rnohilities are provided (see C2irlr 8 ) .
~ ~ l l . ~ m . a k e r , .I. W. and J. M . Tllompson. 1972. Adsorption, Chapter 2 Organic Chemicals i n the Soil Environment: Vol. 1. H ~ r ~ e l Dekker. New Yurk.
fi’St<wlrt, R. A.. Woolhiser. D. A.. Wischecier, W. N.. Cam. . J . H., and H. H. Frere. 1975. Control of Uater Pollution from C r o p l u c d . Vol . 1. A Manual f a r Guideline Development. ARS Report ARS-H-5-1 or EPA Report 600/2-75-02ba. 111 pp. ~Inu-ltalC life vas calculated to be approximately one-third of the times listed. Three time6 were based on 90% or greater disappe.1rance. 48 or 96 hr LC50 for Bluegills or Rainbow Trout.
l/Caro, 1 . H.. Freeman, 11. P.. m d 8 . C . Turner. 1974. Persistence i n Soil and Losses i n Runoff of Soil-incorporated C.rrhnryl in n Small Watershed. J. Agr. Food Chrm. 22(5):860-863.
H-/,Ahlrichs, .I. L.. Chandler, L., Manke. E. J., and 13. U. Reuszer. 1970. Effect of Pest ic ide Residues and oLhrr Organo- tonic.bots on the Q n u l i t y of Surface and Cround Wazer Resources. Technical Report No. 10. Purdue Univeraity. Water R P ~ O U T ~ P S center. West Lafeyette. Indiana.
V’Velaicol Company. 1972. Phosvel Inaecticidr General Bulletin. Bulletin No. 09-070-b01A. Velsicol Carp.. 341 Eaet Ollio Strrec , Chicago, lllinois 60611.
I_cl’LiLhLenstcin, E. P. 1971. Persistence and Fate of Pesticides &t Soils, Water and Crops: Sigaificance to Humans &t Fate of Pesticides in the Environment. Vol. VI. pp 1-22. A. S. Talrori. ed. Gordon 6 Breach Sci. Publishers.

critical concentration established according to some criteria. Pesticides originally selected according to use and use trends that disappeared from soil at approximately first order rates with half-lives in excess of 18 months, were considered persistent and automatically worthy of further research consideration. The remaining pesticides or resulting phytotoxic daughter-products, with half-lives intermediate between the short-lived and persistent compounds, would require further examination; particularly for c.onditions in which the half-life may be extended under reasonably changed environmental conditions to more than an 18 month half-life. These were defined as following approximate first order kinetics with half-lives between 6 and 18 months under normal s o i l conditions.
The second property, toxicity, should be operationally defined as a critical concentration exceeding some tolerance level for chosen indicator organisms. In this case (Table 5), the Rainbow Trout was used as the indicator organism to group pesticides into low, intermediate, and high acute toxicity
of interest. There is no intent on the author's part in suggesting Rainbow levels because of the general availability of the data for the pesticides
Trout should be the only test organism considered. Chronic toxicity levels, i.e., 96 o r more hours exposure, which should be considered were not included for purposes of this discussion. Testing for increased toxicity due to possible synergistic effects among pesticides should be considered provided that the pesticides are applied both in quantity and in proximity to each other as determined from survey data.
The third pesticidal property following persistence and toxicology
will increase persistence and reduce bioactivity of the compound. Some- is the adsorptivity. Numerous references are available on how adsorptivity
times a portion of the pesticide is irreversibly sorbed and may be essentially removed from the system. Furthermore, adsorption may provide the mechanism for transport and accumulation in selected phases of the stream and lake environment. Determined under standard conditions, the K or distribution coefficient of the pesticide between phases may be a useful indicator. These values are expressed on both the soil and organic matter basis (Table 5). Because these are not available for many pesticides, a rough correlation was observed between Kd and the relative mobility of pesticides in soils (Table 8) which was used to approximate missing data in Table 5. This relationship was observed by Gerber and Guth (1973)'. Also, the phases may include vegetation and fish in addition to sediment and water. These biotic phases often concentrate pesticides by an order or several orders of magnitude above that found in sediments. The K is expected to be useful for: a) estimating zones of accumulation or pisticide distribution among phases; b) identifying primary transport mechanisms for modelling purposes; or c) indicating which pesticides are most susceptible to irreversible sorption or most likely to exhibit increased persistence and reduced toxicity upon adsorption.
d
The K between water and sediment may be especially useful for making some rough cut decisions regarding erosion and fluvial transport of selected pesticides (Figure 2). This figure shows how Kd influences the %
sediment concentration. total pesticide load carried by the sediment fraction relative to the suspended
d
' Short Theory, Techniques and Practical Importance of Leaching and Adsorption Studies, Proc. Eur. Weed Res. Coun. Symp., Herbicides-Soil, pp. 51-69, 1973.
209

N
0
SEDIMENT DILUTION AND EFFECT ON THE X PESTICIDE LOAD TRANSPORTED IN THE SEDIMENT R U S E DILUTION FACTOR
loox lox 4x 2x 0
100
80
60
40
20
0
SEDIMENT CONCENTRATION k / L )

T a b l e 6 . A c c u m u l a t e d p e s t i c i d e r e s i d u e ( k g / h a ) r e s u l t i n g f r o m a n n u a l a p p l i c a -
t i o n s o f 2 k g / h a a c t i v e i n g r e d i e n t s ( c a l c u l a t e d a c c o r d i n g t o C = Coe-kt).
Years of P e r s i s t e n c e i n H a l f L i v e s App l i ca t ion 3 mo 6 mo 1 y r 2 y r 4 y r 8 y r 1 2 y r
1 2
4 3
5 6 7 8 9
10
.125 0.50 1.00
.133 0 .63 1 .50
.134 0.66 1.75
.134 0.67 1.88
.134 0.67 1.94
.134 0.67 1.97
.134 0.67 1.99
.134 0.67 2.00
.134 0.67 2 .01
.134 0.67 2 .01
1 .41 1.70 2.41 3.13 3.12 4.35
3.98 6.26 3.62 5.38
4 .23 7.00 4.40 7.63 4.49 8 .17 4 .55 8.62 4.60 9.00
1 . 8 3 3 .51 5.05 6.46 7.76 8 .95
10.05 11.05 11.97 12 .80
1 .89 3.67 5.35 6.94 8.44 9.86
11.19 12.45 13 .64 14 .80
T a b l e 7 . R e m a i n i n g p e s t i c i d e r e s i d u e ( k g / h a ) a f t e r a p p l i c a t i o n - f r e e i n t e r i m
p e r i o d s of 1-5, 10, 15 and 20 years fo l lowing 10 y e a r s o f s e q u e n t i a l a n n u a l
a p p l i c a t i o n o f 2 k g / h a a c t i v e i n g r e d i e n t s ( c a l c u l a t e d a c c o r d i n g t o
C = C e ) . -k t
Fol lowing F ina l Lapsed T i m e
A p p l i c a t i o n ( y r s ) 3 mo 6 mo 1 y r 2 y r 4 y r 8 y r 12 y r P e r s i s t e n c e in Half Lives
0 1 2 3 4 5
1 0 1 5 20
0.134 0 .01 9.0 0.0 0.0 0.0 0.0 0.0 0.0
0.67 0.17 0.04 0.0 0.3 0.0 0.0 0.0 0.0
2.01 4.60 9 .0 12 .8 14 .8 1.00 3.25 7.6 1 1 . 7 14.0 0.50 2.30 - - - 0.25 1 .63 - - - 0.12 1.15 - - - 0.06 0 .81 3 .8 8 .3 11.0 0.00 0.14 1 . 6 5 .4 8 .3 0.00 0 .03 0.67 3.5 6.2 0.00 0.00 0.28 2 . 3 4 .7
211

* Table 8. Relative mobility of pesticides in soils
Mobility Class (decreasing mobility **
594
TCA+ Dalapon
Tricamba Dicamba (0.0) Chloramben (0.3) Picloram (0.45) Fenac Pyrichlor MCPA Amitrole
Dinoseb Bromacil
2,3,6-TBA
2,4-D (1.6)
3
Propachlor Fenuron (1.0) Prometone (13) Naptalam
Terbacil Propham F luome t uron Norea Diphenamid Thionazin
2,4,5-T (1.0)
Endothall Monuron (33) Atratone WL 19805 Atrazine (25) Simazine (15) Ipazine Alachlor Ametryne Propazine (25) Trietazine
2
Siduron Bensulide Prometryne (55) Terbutryn Propanil Diuron (196) Linuron (147)
Molinate Pyrazon
EPTC Chlorthiamid Dichlobenil Vernolate Pebulate Chlorprouham Azinphosmethyl Diazinon
1
Neburon
DCPA Cloroxuron
Lindane (321) Phorate Parathion Disulfoton Diquat Chlorphenamidine Dichlormate Ethion
Nitralin Zineb
ACNQ C-6989
Morestan Isodrin Benomyl Dieldrin Chloroneb Paraquat Trifluralin Benef in Heptachlor
Aldrin Endrin
Chlordane Toxaphene DDT (10,000)
Helling, C. S . , Kearney, P. C., and Alexander, M., 1971. Belwviour of Pesticides in Soils. Adv. Agron. - 23,147-240.
** Class 5 compounds (very mobile) to Class 1 compounds (immobile); in each class pesticides are ranked in estimated decreasing order of mobility. Underlines designate the most commonly used pesticides by survey. Parentheses enclose average Kd's from Hamaker, J. W. and J. M. Thompson, (1972),Adsorption. Chapter 2 & Organic Chemicals in the Environment, Vol. I. Marcel Dekker, N. Y., 440 pp.

associated with the eroded rather than the aqueous phase at or above rela- tively low Kds, e.g., 100. However, once eroded, the initial transport
will be heavily weighted toward the aqueous phase unless the Kd is 1000 or
more with reasonably high sediment concentration, i.e., over 500 mg/l for the larger Great Lakes tributaries. Further transport downstream increases the likelihood of dilution by other water exhibiting lower sediment concen- tration. From Figure 2, hydrologic dilution of the pesticide by 10 times substantially shifts the pesticide load to the aqueous phase unless the Kd equals or exceeds 10,000. The dilution factor has to be very large, e.g., 100 times or greater to significantly shift the load from the adsorbed to aqueous phase if the Kd is this high. Furthermore, if a dynamic equil-
ibrium exists between fluvial sediment and the aqueous phase, and the Kd
of pesticide adsorption on exposed stream banks and bottoms and associated is large, substantial and perhaps rapid pesticide losses may occur because
vegetation within relatively short travel distances. Usually the Kd for most pesticides used today is 1000 or less, thus weighting the load trans- ported to the aqueous rather than adsorbed phase (Figure 2) . However, adsorptivity or oganic matter may be 10 to 1000 times greater than that for soil (Table 5). Thus, in situations where organic soils, organic sediments or transported organic materials predominate, transport may be heavily weighted toward a sediment fraction of low density. Such highly adsorptive systems are usually primary candidates for investigation related to irre- versible adsorption, increased persistence and decreased bioactivity due to adsorption. The same consideration would apply to highly polluted stream sediment to which the pesticide distribution could be greatly altered.
Washoff losses of pesticides are likely to be predominantly
Table 9 summarizes these three properties f o r the pesticides orig- inally chosen according to the survey.
both upstream impact (toxicity) and downstream impact (persistence), being primarily lost by erosion and transported in both the aqueous and sediment phase. Azinphosmethyl, phorate and diazinon potentially provide upstream impact only, because although they are toxic they lack persistence. They are lost primarily by erosion but transported primarily in the aqueous phase. Thus, hydrologic dilution likely dominates the concentration of
does potentially provide upstream impact and is transported primarily in this material downstream and this concentration dissipates rapidly. Dursban
and carbofuran is limited to upstream areas because of low persistence. the aqueous phase. The persistence was not known. The impact of phosvel
The persistence for bux is unknown. The remaining compounds are not likely to be of concern.
From this table, both chlordane and toxaphene potentially provide
Thus, this whole approach provides some guidelines for research: Firstly, these compounds which are important on the basis of use; secondly,
indicate particular research needs and provide research emphasis assuming the identification of the important pesticidal properties and how they might
normal environmental conditions. This kind of approach not only attempts to direct attention to the most environmentally hazardous properties of a compound but also points out weak or missing data needed to make some of these basic assessments and perhaps provide some insight. However, this
213

Table 9. Selected pesticides grouped according t o combinations of properties.
Pesticide
Chlordane
Toxaphene
Azinphosmethyl
Phorate
Phosvel
Dursban
Methoxychlor
Diazinon
Bux
Carbofuran
Atrazine
Cyanazine
EPTC
Vernolate
Carbaryl
Butylate
Amiben
2,4-D
Alachlor
Propachlor
Toxicity Persistence Adsorptivity Group Ranking for each Property
I I I
I I I
I I11 I1
I I11 I1
I 111 U
I U I11
I U U
I, I1 I11 I1
I1 U U
I1 I11 U
I11 I1 I11
I11 I1 I11
I11 I11 I1
I11 I11 I1
I11 I11 I11
I11 I11 U
I11 I11 I11
I11 111 I11
I11 I11 I11
I11 I11 111
I = Toxicity (0.003 - .05 mg/l, LC50 over 24 to 48 hour for Rainbow Trout), OK persistence 5 18 months (observed time for one-half the original concentration to disappear from soil) OK adsorptivity 2 1000 Kd (Kd = concentration on sediment (x/m) versus that in solution (C at equilib- rium from Freundlich relationship at n=l). ed
I1 = Toxicity (0.052 - 0 . 3 mg/l ditto) or 6 months < persistence < 18 months OK 100 5 Kd < 1000.
I11 = Toxicity (1.0 - 20, mg/l ditto) or persistence 5 6 months or Kd < 100.
U = Unknown.
214

has as yet only treated properties under standard or a selected set of environmental conditions. This is often not the case.
watershed could substantially alter the potential environmental hazard of What known or expected environmental changes in subunits of the
those pesticides earlier identified by answering the previous two questions? Answering this third question assumes that the dominant local stream and lake environments on a seasonal or annual basis are known. Then those dominant, yet nonstandard environmental conditions which substantially extend pesticidal persistence beyond the middle-range persistence OK bias the distribution of pesticide among phases causing a potentially hazardous environmental level, can be identified and their impact researched. This investigation would apply to those pesticides of intermediate persistence or toxicity as determined from answering questions 1 and 2. These could include the effect of: pH changes from field to stream to lake (persistence and redistribution between phases of pH-dependent charged pesticides);
exposure to sediment associated with industrial type pollutants, e.g., chemical reducing conditions on persistence; temperature on persistence;
petroleum products mixed with sediment, on persistence and selective dis- tribution of pesticides in this phase; exposure to organic soils and sediments on toxicity, persistence and adsorptivity, etc. Obviously, the criterion of reasonability should be followed regarding the likelihood of these conditions existing and their severity. The test conditions chosen should not be extreme or unreasonable relative to the expected range in pertinent environmental conditions.
CONCLUSION
In summary, if a pesticide is used extensively or in increasingly
either persistent or has an intermediate half-life that may be extended by larger amounts, is known to be toxic to selected aquatic organisms, and is
adsorption and/or abnormal environmental conditions that are known to occur within the area, then these should be the primary subject of research emphasis.
RECOWMIATIONS
1.
2 .
' 3 .
Better surveys of individual pesticide usage on an annual basis are needed in order to establish present usage and trends in usage. This should be assembled by the I J C according to subwatershed divisions within the Great Lakes Basin.
The organochlorine insecticides should not be the subject of new research unless justified on the basis of present and projected use in the Great Lakes Basin.
The pesticides selected on a usage or use trend basis should be further evaluated according to persistence, toxicity, and adsorptivity under some set of standard conditions. Synergistic effects on selected key aquatic organisms should be evaluated where justified on pesticide use basis. Then the "nonstandard" but reasonably expected local environmental conditions that substantially alter persistence and toxicity occurring downstream from application areas should be identified and researched. An exhaustive literature review could supply much of this information.
215

This overall approach provides a means of selecting those pesticides
research and monitoring programs. Furthermore, this approach should that should be the primary candidates for subsequent laboratory and field
specifically delineate or further identify needed research.
4 . We need standardization OK development of methodology to experimentally and routinely determine: a) standard persistence, toxicology and adsorptivity; b) the altered toxicity upon adsorption or in association with other pesticides (synergistic effects); and c) the altered persistence upon adsorption, changed pH, 02 status, temperature, etc. Perhaps the study of the selected pesticides in multiphase microcosms may be useful for isolating potential problems. Obviously, the pesticides studied should not be chosen at random, but should be of at least intermediate persistence, toxicity and used in considerable amount according to survey.
5. Certain environmental exceptions exist that should be researched even if not defensible by pesticide use. These include: a) dredge spoil as a renewed source of adsorbed pesticides, particulary the organo- chlorine insecticides; and b) altered K and persistence of selected pesticides partitioned into or exposed t,d highly polluted sediments (lipophilic wastes, industrial wastes, municipal sewerage, etc.).
216

DISCUSSION
/A,. L. HetZing: The way you a r e g o i n g a t t h e p e s t i c i d e i s s u e is usage. Is i t p o s s i b l e o r t h i n k a b l e t o go a t i t t h e o t h e r way? We are i n t e r e s t e d i n
Could one go and take cer ta in test o rgan i sms o r test f i s h o r something else t h o s e p e s t i c i d e s or t h o s e t y p e s t h a t are b io -accumula t ing i n t he env i ronmen t .
a t a lake and measure them f o r t h e r a n g e of t h e s e t h i n g s , and i f t h e y a r e not accumula t ing , no t worry about them?
Dr. H. Pionkc: I w a s n ' t r e a l l y s u g g e s t i n g t h a t we s ta r t on a full-blown programme, c o l l e c t i n g a l l these numbers . I am s a y i n g t h a t i n c e r t a i n c a s e s t h e r e a r e p r o b a b l y m i s s i n g d a t a t h a t c o u l d b e s u p p l i e d . I t h i n k t h a t some of t h e EPA p e o p l e w o u l d l i k e t o s p e a k t o t h i s , b u t I t h i n k t h e r e is a l r e a d y a movement a f o o t t o t r y a n d g e t some of t h i s b a s i c i n f o r m a t i o n . A s I mentioned e a r l i e r , t h i s is i n t h e c o n t e x t a g a i n o f t h e IJC. We a r e t a l k i n g a b o u t t h e Grea t Lakes watershed . There a re many compounds i n u s e a c r o s s t h e c o u n t r y . They are no t u sed i n any amount on t h e Great Lakes watershed. I t h i n k i f you t u r n i t a r o u n d a n d g e t t h e c a r t b e f o r e t h e h o r s e and s ta r t t a l k i n g a b o u t what compounds could create a po ten t i a l p rob lem wi thou t a sk ing whe the r o r n o t t h e y a r e b e i n g a p p l i e d , is t h e wrong way t o g o .
217


Forms and Sediment Associations of Nutrients (C.N. 6 P.) Pesticides and Metals
Trace Metals
Ulrich F6rstner
The availability of trace metals for metabolic processes is closely related to their chemical species both in solution and in par- ticulate matter. For this reason a thorough investigation into the behaviour of trace metals in the dissolved state was undertaken. In com- parison, very little is known about the chemical association of metals in suspended materials and sediments, although the knowledge of characteristic bonding types may be the key to the detection of specific pollution sources in the aquatic environment.
TRANSPORT OF TRACE MALS IN RIVERS
their distribution ratio between the aqueous and solid phases. For ex- The source of trace metals in rivers significantly determines
ample, the bulk of the detrital trace element particulates never leaves the solid phase from initial weathering to ultimate deposition. Similarly, metal dust particles (e.g. from smelters) and effluents containing heavy metals associated with inorganic and organic matter, undergo little or no change after being discharged into a river. This is attributable to the average residence times (of the order of days or weeks), too short €or the establishment of stable, dynamic equilibria between water and suspended material. '
There are characteristic differences in the metal distribution between the aqueous and solid phases. Examples are given in Table 1, indicating the fractions of metals in particulate form as percentages of the total metal discharges from U.S. rivers', rivers in West Germany3 and from the Rhine River in the Netherlands' respectively.
The order of sequence of the mobility for a few selected metals is as follows. Alkali and alkali-earth metals are predominantly present in a dissolved form; for trace metals like boron, zinc and cadmium, the ratio of dissolved species to particulate species is between 2:l and 1:l; copper, mercury, chromium and lead exhibit ratios of the solid phases to the aqueous phases of between 2:l and 4 : l ; whereas iron, aluminum (and manganese under normal Eh conditions) are almost totally transported as solid particles. The preferential bonding of heavy metals in effluents to the solid phase is of particular significance for tracing sources of pollution. During reduced rates of river flow, suspended material settles to the river bed, becoming partially incorporated into the bottom sediment. By virtue of their composition, sediments conserve heavy metal contamination and "express the state of a water body"'. Vertical sediment profiles (cores) often uniquely preserve the historical sequence of pollution intensities6; lateral d i s - tributions (quality profiles) serve to determine and evaluate local sources of pollution .
219

TABLE 1
Metal (example)
Sodium Calcium
Strontium Boron
Cadmium Zinc
Copper Mercury
Chromium Lead
Aluminum Iron
Percentage particulate-associated metals of total metal discharge (solid + aqueous) U.S. Rivers' F.R.G.* Rivers3 Rhine (Neth.)'
- 0.5 2.5
2 1 % - 3 0 % -
30 40 % 45
6 3 % 55 59
76 % 72 84 % 79
98 % 98 98 % 98
-
-
-
% %
- -
% 45 % % 37 %
% 64 % % 5 6 %
% 70 % % 73 %
% - % -
*Federal Republic of Germany
220

Two effects, however, must be considered when sediment analyses are used for the identification of sources of pollution. Firstly, under conditions of high water discharge, erosion of the river bed takes place, and generally leads to a lower degree of local contamination. LSzl6’, for example, obtained data from the Sajo River, Hungary, which indicated that three months after a flood, the mercury concentration in bottom sediments had been reduced to approximately one-quarter of the values found immediately before the flood. Secondly, it is often overlooked that it is imperative
with regard to particle size’, since there is a marked decrease in the to do base metal analyses from river sediments on a standardized procedure
content of metals as sediment particle size increases. An example is given in Figure 1, indicating the concentrations of cadmium in different grain size fractions of sediments from the highly polluted Rhine and Main Rivers in the Federal Republic of Germany”. Maximum concentrations of Cd occur in the fractions of 0.2 pm - 0.6 pm; from there the metal contents decrease both toward finer and coarser grain diameters (relatively high levels of Cd in the sand fractions are probably due to the input of coarse waste particles).
Several methods have been introduced in order to include most of the substances active in metal enrichment, i.e., hydrated oxides, sulphides, amorphous and organic materials, but to exclude coarser-grained sediment fractions which are largely chemically inert: (i) reduction of grain size effects, e.g. the pelitic fraction of < 2 pm diameter”, by extrapolation from the grain size distribution” or by correction for the specific surface area”; (ii) selective chemical treatment for the extraction of acid- soluble fractions by including 0.1 M hydrochloric acid’l*, 0.1 M nitric acid15 and aqua regia/ignition lossIb procedures; (iii) using mineral separation techniques as exemplified by the quartz correction method”; (iv) taking conservative elements, e.g. aluminum, silicon, potassium, and sodium as a reference base for cultural metal inputs’’”’. The question as to which trace metals are characteristic of nonpoint or diffuse sources, which is of particular interest to the present Workshop, cannot be answered
such as highly industrialized areas, one generally finds high levels of to any degree of satisfaction. In areas of heavy environmental pollution
lead, zinc, mercury and cadmium in the river deposits whereas at the same time other metals such as iron, manganese, nickel, and cobalt have only increased insignificantly in comparison. High levels of chromium, cadmium and copper can usually be attributed to industrial waste”, particularly
can usually be connected with diffuse sources such as atmospheric emissions from the tanning and electroplating industries; enrichment of lead and zinc
in the case of lead, and urban sewage effluents for zinc”. Apart from this, the temporally changing influence in the various catchment areas as well as seasonal effects must be taken into consideration as was done by Schleichert” in his study on the metal transport of suspended matter in the Rhine.
CHEMICAL FORMS OF TRACE BTALS I N FLWIATILE SEI)IE:MS
The ratio of heavy metal distribution between the aqueous and solid phases is subject to change due to a general shift of equilibria toward the solid phase. Thus, the total amount of heavy metals in solution gen- erally diminishes along the course of a river during normal flow conditions. This is of importance for the elimination of dissolved wastes, e.g. from metal processing (electroplating, galvanizing), the removal of trace metals from the aqueous phase being effected by mechanisms such as sorption, precipitation, co-precipitation and complexing.
221

In spite of their different origins, environmentally related types of metal bonding are comparable to the natural forms. The most common associations of heavy metals in particulate substances are compiled in Table 2:
(1) Heavy metals are transported and deposited as major, minor OK trace constituents in the natural rock detritus, mostly in inert positions.
(2) Slight alkalinity prevailing in normal surface waters results in the formation and precipitation of hydroxides, carbonates, sulphides and phosphates of heavy metals.
(3) Sorption and cation exchange particularly takes place on fine-grained substances with large surface areas. A generalized sequence of the capacity of the solids to sorb heavy metals was established by Guy 6 ChakrabartiZ4 in the order
MnOz > humic acid > hydrous iron oxides > clay.
Experiments with different sorbents and seawater indicated an extensive extraction of zinc, copper and lead by hydrous iron-and manganese- oxides, clay minerals and peat substances; nickel, cobalt and chromium are closely associated with Mn-oxidesZ5. In experiments on competing exchange of metal cations performed with equal concentrations of humic substancesz6, copper was preferentially sorbed (53%). followed by zinc (21%), nickel (14%). cobalt ( 8 % ) and manganese (4%).
(4) Dissolved organic polymer is increasingly being regarded as a carrier material in the transfer of metals from the mineral phase into the organic material. The younger, less condensed humic acids (fulvic acids) play an especially important role in the bonding of heavy metals in aquatic systems because of their large number of functional groups”. In a summary of organic matter-metal interactions in recent sediments, Nissen - baum L Swaine” mention concentrations of up to 0.4% copper and 0.45% zinc in humic substances from marine reducing environment^^^. A high degree of positive correlation between the content of organic substances, and metal concentrations may, however, not always be interpreted as being the result of direct bonding of heavy metals to organic substances. In highly polluted areas, for instance, contamination by characteristic heavy metals simply coincides with the accumulation of organic substances, both derived from urban, industrial or agricultural sewage effluents. Extraction of metals from fulvic and humic acids in sediments from Lake Malawi indicated that only zinc, copper and vanadium were accumulated in organic material, whereas iron, manganese, chromium, cobalt and nickel are more or less diluted by the organic acids”.
(5) Co-precipitation of heavy metals with hydroxides and carbonates appears to be an important mechanism controlling the metal concentrations in the aquatic environment”’ 32. Experiments on calcium carbonate precipitation in the presence of heavy metal
bility (e.g. cadmium and lead) will be completely eliminated ions33 indicated that heavy metal carbonates having a low solu-
222

TABLE 2
CARRIER SUBSTANCES AND MECHANISMS OF HEAVY METAL BONDING
Minerals of natural rock debris (e. g. heavy minerals)
metal bonding predominently in inert positions
Heavy metal - hydroxides - carbonates - sulphides
Precipitation as a result of exceeding the solubility product in the area of the water course
Clay minerals (Sorption)
PH
Physico-sorption (electrostatic attraction)
Chemical sorption (exchange of H+ in SiOH, AlOH and A1 (0H)z)
Physico-sorption ~ Bitumen, Lipids PH Humic substances , Residual organics
PH
Hydroxides and oxides of Fe/Mn
PH
Calcium carbonate
Chemical sorption (exchange of H+ in COOH-, OH-groups)
complexes
Physico-sorption
Chemical sorption (exchange of H+ in fixed positions)
Co-precipitation as a result of exceeding the solubility product
Physico-sorption
Pseudomorphosis (dependent on supply and time) Co-precipltation (Incorporation by exceeding the solubility product)
223

from the solution as a result of co-precipitation with calcium carbonate (Table 3 ) . Examples from the hcavily polluted Elsenz River (a tributary to the Neckar River) and the Elbe River in West Germany have demonstrated the actual importance of co- precipitation phenomena with hydroxides of iron and calcium carbonate in the natural environment 34 ' of iron hydroxide in the Elsenz River was caused by the mixing
. The presence of large amounts
of normal Elsenz water with alkaline waste water from a local galvanizing industry. The measured concentration of heavy metals found in iron hydroxide concretions are far higher than the concentrations found in the clay-sized fraction of the surrounding Elsenz sediments. Compared to this surrounding clay-sized sediment fraction, heavy metal enrichment by factors of up to 30 times for Cd, 17 for Zn and 1 . 4 for Cu were measured in the iron hydroxide concretions". Groth's3' investigations on the co-precipitation of trace metals with hydrous Fe/Mn oxides (also taking the competition of organic complexing agents into account), indicated an almost complete co-precipitation of copper occurring under all conditions, whereas zinc and cobalt are precipitated to a much lesser extent in the presence of strong EDTA complexing agents than of natural organic chelating substances (Table 4 ) .
In contrast to iron hydroxide, calcium carbonate was found to have concentrated heavy metals far less than those found in the surrounding clay size ELbe sediment fraction". Calcium carbonate coatings had been formed locally in the Elbe River as the result of mixing effects upon the contact of normal Elbe River water with alkaline waste waters from a local Dow Chemicals Plant. Compared to the geochemical background values of heavy metals in carbonate rocks37, enrichment factors of approximately 10 times for Cd, 6 for Cu, 4 . 5 for Zn and 4 for Co were measured in calcium carbonate coatings.
SELECTIVE EXTRACTION PROCEDURES
the different forms of metal association in both natural and polluted sediments: Hirst & Nicholls3* differentiated the metal contents in the detrital and non-detrital fractions of carbonate rocks by acid treatment. Goldberg & Arrhenid6 used EDTA to establish the partition of elements between detrital igneous minerals and authigenic phases in pelagic sed- iments. Arrhenius & Korkish4' tried to separate the iron fraction of the
Chester & Hughes" distinguished the lithogenous and non-lithogenous com- ferro-manganese nodules with 1 M hydrochloric and dilute acetic acid.
ponents in recent aquatic sediment by acid-reducing 1 M hydroxylamine hydrochloride + 25% acetic acid; this method reached particularly wide application in marine ge~chemistry~'-~'. A combination of different extraction procedures was first used by Ni~senbaum~~ for sediments from the Okhotsk Sea (Table 5a), then by G i b b ~ ~ ~ for analyses of trace metals associated with different carrier substances in suspended materials of the Amazon and Yukon Rivers (Table 5b). Engler and co-workers4' developed a separation technique, particularly for dredged materials, precluding atmospheric oxidation at sensitive steps (Table 5c); sediments from Mobile
Many attempts have been undertaken for a selective extraction of
2 2 4

TABLE 3
CO-PRECIPITATION OF TRACE METALS WITH CALCIUM CARBONATE -LOG L = NEGATIVE EXPONENTS OF THE SOLUBILITY PRODUCTS OF METAL CARBONATES
Original Metal contents in the precipitate concentration in % of the original concentration
(Pdl) Cd Pb Co Zn Cu Ni
25 100 100 100 100 96 96
250 100 100 100 100 - 43
2000 100 100 96 96 75 -
-log L 13.2 12.8 12.0 10.2 9.85 6.85
TABLE 4
CO-PRECIPITATION OF TRACE METALS WITH Fe/Mn-HYDROXIDES
Solution Percent of metal additive in the precipitate
Fe cu Zn co Mn
distilled water 98% 95% 14% 47% 80%
lake water no admixture (a) 99% 98% 86% 67% 25% EDTA (b) 99% 88% 18X 25% 25% Peat extract (c) 99% 97% 88% 75% 25%
225

TABLE 5
SELECTIVE EXTRACTION PROCEDURES FOR METAL ASSOCIATIONS IN SEDIMENTS (PRE- AND INTER-TREATMENT STEPS - WASHING, CENTRIFUGATION, FILTRATION
ETC. - ARE NOT INCLUDED IN THE TABLE; A - DEFINITATION OF THE CHEMICAL PHASE ACCORDING TO THE AUTHORS)
- a. NISSENBAIIM, 1972
Treatment of sediment Ref. Chemical phasea
1) 30% Hz02
2) 2 N acetic acid (pH - 3) 3) 6 N HC1 4) Fuse with Na~C03
Perox. fraction
Acetic ac.-fraction
HC1-fraction
Residue fraction
- b . GIBBS. 1973
Treatment of sediment Ref. Chemical phasea -
1) 1 N MgClz-solution. pH=7 Cation exchange + adsorption 2) Reduction with sodium dithionite/
complexing with sodium citrate Metallic coatings
3 ) Sodium hypochlorite, pH=8,5; see (2) Solid organic material
4 ) lithium metaborate lOOO"C, HN03 Detrital crystalline material
- c. ENGLER, BRANNON, ROSE & BRIGHAM, 1974 (modified by GUPTA & CHEN, 1975)
Treatment of sediment Ref. Chemical phasea -
1) 1N ammonium acetate, sediment-pH
2) 1M acetic acid ( G & CH)
3) 0.1M hydroxylamine hydrochloride solution in 0.01M nitric acid
4 ) 30% hydrogen peroxide at 95OC, extract with 1N NHbOAc, pH=2,5 or extract with 0.01M HN03 (G 6 CH)
5) Sodium dithionite/citrate or
acid at 100°C for 3 hrs (G 6 CH) 0.04M NH20H.HC1 in 25% acetic
6 ) Digestion with HN03, HF, HClOs
Exchangeable ions
Carbonate, some Fe/Mn-oxides
Easily reducible phase (manganese oxide + amorphous iron oxide)
Organic phase (organics + sulphide)
Moderately reducible phase (iron oxide)
Lithogenous fraction
- d. PATCHINEEJAM, 1975
Treatment of sediment Ref. Chemical piesea
1) 0.2 N BaClz-tri.ethanolamine Adsorption + cation exchange 2) 0.1 N NaOH Humates + Fulvates 3) COZ-treatment Carbonate co-precipitates
4 ) 1 M NHzOH.HC1/25% acetic acid Hydrous Fe/Mn-oxides co-prec.
5) Digestion with HF/HClO,, HN03 Detrital silicates
226

Bay (Alabama), Ashtabula, Ohio (Lake Erie) and Bridgeport, Connecticut (Long Island Sound) were investigated4'. Further modification of the Engler scheme was performed by Gupta & C ~ ~ I I ' ~ and applied on sediments from Los Angeles Harbor. Patchineelam differentiated the metal contents associated with cation exchan e positions, humic acids, carbonate minerals and hydrous Fe/Mn oxides". The first three examples' 5' ' relatively unpolluted systems (Dead Sea: 14 ppm Cu, 13 ppm Pb, 36 ppm Zn),
compiled in Figure 2, represent
while both the latter area^'^'^^ are strongly contaminanted by heavy metals (Los Angeles Harbor: 568 ppm Cu, 342 ppm Pb, 632 ppm Zn). In the example of the Lower Rhine sediment3', two groups of metals can be distinguished from a comparison of metal data of recent Rhine deposits with analyses of ancient Rhine sediments obtained from drilling cores in the Cologne area". High percentages of detrital fractions are found for those elements which are less affected by man's activities, e.g. iron ( 3 . 0 % in fossil Rhine deposits - 3 . 4 % in recent pelitic sediments of the Rhine), nickel (85 ppm - 165 ppm), and cobalt ( 1 4 ppm -35 pprn); on the other hand, lattice-held fractions are very low for metals such as lead ( 3 0 ppm - 333 pprn), zinc
iments, lead, copper and chromium are particularly associated with the (115 ppm - 1558 ppm) and cadmium ( 0 . 3 ppm - 28.4 ppm). In the Rhine sed-
hydroxide phases. These findings can be explained by the specific sorption of lead to iron-hydroxide5', by the effective co-precipitation of copper together with hydrous Fe/Mn oxides36, and by the absence of carbonate phases of chromium in natural aquatic systems. The preferential carbonate bonding of zinc and cadmium, on the other hand, can be attributed to the
pH-Eh conditions of common island as well as to the characteristic relatively high stability of zinc-carbonate and cadmium-carbonate under the
co-precipitation of these components with calcium-carbonate. Copper and cadmium contents are found to be closely associated to organic substances. The metal fractions in cation exchange positions represent less than ten percent of the total metal content associated to sediment. Similar results were obtained by Gupta & Chen" particularly with respect to the low metal concentrations in exchangeable form and to the sequence of metals associated with detrital (silicate) minerals. The only exception is copper (98% in detrital phase) of which 0nJ.S; 10 to 14% is bonded to silicates in Nissenbaum's study on the Sea of Okhotsk . THE RLEASE OF TRACE F ~ A L S FROM RIVER SEDIMENTS
Heavy metals which are "immobili~ed"~~ in the bottom sediments of rivers and dams constitute a potential hazard to water quality since they may be released as a result of chemical changes in the aquatic milieu:
(1) Increased salinity of the water body leads to competition between dissolved cations and adsorbed heavy metal ions and results in partial replacement of the latter. Such effects should particularly be expected in the estuarine environment. Apart from the highly complicated situation there5', however, it was demonstrated, that the decrease in heavy metal concen- trations at the river/sea interface i s caused by mixing processes of polluted river particulates with relatively "clean" marine sediments5' rather than by solubilization and/or desorption.
( 2 ) A lowering of pH leads to the dissolution of carbonate and hydroxide minerals and also - as a result of hydrogen ion competition - to an increased desorption of metal cations.
227

N N m
FIGURE 1: Cadmium concentrations in different grain size fractions of sediments from the rivers Maine (*) and Rhine".

Mn SEA OF OKHOTSK (NISSENBAlJM.1972)
"Pwox ~ Froctlon"
"Acotlc acid "
YUKON RIVER ( OIBES, 1973 1
Fe Ni Co Cr Cu Pb Zn Cd
FIGURE 2: Extraction of different forms of metal associations in sediments (examples).
229

Long-term changes of the pH-conditions have been observed from highly industrialized areas by atmospheric S O 2 emissions 5 9 ' 6 o
mainly in waters poor in bicarbonate ions. Acid mine drainage effects a 1,000 - 10,000- fold increase of iron, manganese, nickel, cobalt, copper and zinc61'62.
A change in the redox conditions is usually caused by the increased input of nutrients. Oxygen deficiency in the sediments leads to an initial dissolution of hydrated manganese oxide, followed by that of the analogous iron compound63. Since these metals are readily soluble in their divalent states, any co-precipitates with metallic coatings become partially remobilized. There are indications, that, for example, copper, zinc and cadmium are released from anoxic sediments into surface water64. These processes, however, seem to be controlled rather more by bacterial activity and subsequent complex formation than by ion migration65; since the calculated stability for the sulphide compounds is strongly exceeded by the concentrations of Cu, Cd, Zn, Pb and other metals in the pore
The growing use of synthetic complexing agents (e.g. nitrilotri- acetic acid) in detergents to replace polyphosphates6' increases the solubilization of heavy metals from aquatic sediment69'70. A considerable number of heavy metal chelates are not destroyed during water pr~cessing~~, for example by bank filtration7', and may lead to a potential danger for the drinking-water supply.
Microbial activities enhance the release of metals in three main ways: (i) by formation of inorganic compounds capable of complexing metal ions; (ii) by influencing the physical properties and the pH-Eh-conditions of the environment; (iii) by means of oxidative and reductive processes catalyzed by enzymes, microorganisms can convert inorganic metal compounds to organic molecules; organo-mercurial transformations show that such mechanisms may strongly increase metal toxicity' 3'74.
The latter two mechanisms may be further aided by physical effects such as erosion, dredging and bioturbation, which also affect the release of pore solutions rich in metals.
The senior author (U.F.) wishes to express his thanks to the organizers of the Workshop for their kind invitation to participate; additional support by the Centre Europben d'Etudes des Polyphosphates is gratefully appreciated. We are indebted to Dr. G. T. W. Wittmann (Pretoria) for providing data and valuable suggestions.
LITERATURE CITED
1. Wittmann, G. T. W. & Forstner, U. Water S . A . , (1976) 2, 67-72.
2 . Kopp, J . F . & Kroner, R. C.. (1968). Trace Metals in Waters of the United States. U.S. Dept. Interior, FWPCA, Cinncinnati.
230

3. Heinrichs, H., (1975). Diss. Gottingen, 97 pp.
4.
5 .
6.
7.
8.
9.
10.
11.
12.
13.
14.
15.
16.
17.
18.
19.
20.
21.
22.
23.
24.
25.
DeGroot, A. J . , &., (1973) Sware Metalen in Fluviatiele en Mariene Ecosystemen. Symp. May 24-25.
Zullig, H., (1956). Schweiz. Zeitschr. Hydrologie, 18. 7-143 Forstner, U., (1976) Naturwissenschaften, 6 3 , 465-470
Forstner, U. & Muller, G., (1974). Schwermetalle in Flussen und Seen als Ausdruck der Umweltverschmutzung. Spring-Verlag Berlin
Laszlo, F., (1975) Abstr. Int. Conf. Heavy Metals Environm., Toronto, C-130.
Wittmann, G. T. W. 6 FoKstneK, U.S. (1976) Afr. Jour. Sci. I?_, 242-264
Working Group Metals, Water Research Program of the German
data. Research Society (Deutsche Forschungsgemeinschaft), unpubl.
Banat, K., et&., (1972) Naturwissenschaften. 2, 525-528
DeGroot. A. J . , e. (1971) Geol. en Mijnb., 50 393-398 Oliver. B. G., (1973) Environmn. Sci. Technol., 2, 135-137
Piper, D. 2.. (1971) Geochmin. Cosmochin. Acta, 25, 531-550.
Jones, A. S . G., (1973) Mar. Geol., g, Ml-M9.
Literathy, P. 6 Laszlo, F., (1975). Int. Symp. Geochim. Natural Water, Burlington.
Thomas, R. L . . (1972) Can. J. Earth Sci., 2. 636-651 E., (1973) lo. 194-204. Bruland, K. W., d., (1976). Environmn. Sci. Technol. 5, 425-432. Kemp, A. L. W., etg., (1976) Fish. Res. Board Can., 22, 440-462.
Forstner, U. & Muller, G. Geoforum, (1973a). g 53-61 Rupert0 Carola, (1973b), 51, 67-71 Fortschr. Miner., (1976) 12, 271-288. Schleichert. U. & Hellmann, H. (1973) Lit. Rept. Bundesanstalt fur Gewasserkunde Koblenz, 32 pp.
Schleichert, U. (1975) Deutsche Gewasserkundl. Mitt., 19, 150-157. Forstner, U. 6 Patchineelam, S . R., (1976) Chemikerzeitung, 100, 49-57.
Guy, R. D. 6 Chakrabarti, C. L. (1975) Abst. Inst. Conf. Heavy Metals Environnm., Toronto, D-29.
Krauskopf, K. (1954) Geochmin. Cosmoschim. Acta, 2, 1-34.

26.
27.
28.
29.
30.
31.
32.
33.
34.
35.
36.
37.
38.
39.
40.
41.
42.
43.
44.
45.
46.
47.
48.
Rashid, M. A., (1974) Chem. Geol., 13, 115-123
Rashid, M. A . , (1971) Soil Sci., 111, 298-306
Nissenbaum, A. & Swaine, D. J . (1976) Geochim. Cosmochim. Acta 809-816
Presley, B. J. et g . , (1972) Geochim. Cosmochim. Acta, 2, 1073-1090
Forstner, U . (1976) Proc. SIL/UNESCO-Symposium on Interactions Between Sediments and Freshwater, Amsterdam, 6-13 Sept., (in press)
Krenkel, ed.), 137-147 Lee, G . F., (1975) In: Heavy Metals in the Aquatic Environment (P.A.
Patchineelam, S . R., (1975) Unpublished Diss. Heidelberg, 137 p.
Popova, T. P., (1961) Geochemistry 12. 1256-1260 Patchineelam, S . R. Paper Submitted for Publication
Patchineelam, S . R. Paper Submitted for Publication
Groth, P., (1971) Arch. Hydrobiol. 6 8 , 305-374
Wedepohl, K. H. (1970) Verh. Geol. Bundesanstalt Wien, 6, 692-705 Hirst, D. M. 6 Nicholls, G . D. J. (1958) Sediment Petrol., E. 461-468 Goldberg, E. D. & Arrhenius, G . O . S . (1958) Geochim. Cosmoschim. Acta, - 13, 153-212
Arrhenius, G.O.S. & Korkish, J. , (1958) Am. Assoc. Adv. Sci.,
Chester, R. & Hughes, M. J., (1967) Chem. Geol., 2, 249-262
Chester, R. & Hughes, X. J., (1969) Deep-sea Res., 16, 639-654
Chester, R. & Hessiha-Hanna, R. G . , (1970) Geochim. Cosmochim. Acta, - 34. 1121-1128
Sayles, F. L. etg., (1975) Bull. Geol. SOC. her. 3 6 , 1423-1431
Nissenbaum, A. (1972) Israel J. Earth Sci., 11, 143-154 w., (1976) 3, 111-116 Gibbs, R. J . (1973) Science 1 8 0 , 71-73
Engler, R. M. a. (1974) 168th ACS Natl. Meeting, Atlantic City, N.J.
Brannon, J. M. et 4.. (1976) U.S. Waterways Experim. Station Misc. Paper D-76-18.
232

4 9 . Cupta, S . K. & Chen, K. Y. (1975) Environm. Lett., 10, 129-158
50. Jackson, M . L. (1958) Soil Chemical Analysis, Prentice-Hall I n c . , Englewood Cliffs, N. J., 4 9 8 pp
51. Holmgren, 6 . S . ( 1 9 6 7 ) Soil Sci. SOC. Amer. Proc., 3, 210-211
5 2 . Chao, L. L.
53 . Volkov, I. I
54. .Jenne, E. A.
55. Hem, .J. D. ( 1
56.
5 7 .
5 8 .
5 9 .
6 0 .
6 1 .
6 2 .
6 3 .
6 4 .
6 5 .
6 6 .
6 7 .
68.
69.
70.
71.
72.
73.
74.
1 9 7 4 ) Soil Sci. SOC. Amer. Proc., z, 764-768
& Fomina, L . S . (1974) APPG Mem., 2, 456-476
(1968) Am. Chem. SOC. Adv. Ser. G, 337-387
9 7 2 ) Water Resour. Res. S, 661-679
Koppe, P. ( 1 9 7 3 ) Gas-Wasserfach, 114, 170-175
Ouinker, .J. C. 6 Nolting, R. F. ( 1 9 7 6 ) Neth. J . Sea. Res. LO, 71- 1 0 2
Muller , C. & Forstner, U., ( 1 9 7 5 ) Environm. Geol., 1, 33-39
Oden, S . & Ah., T. Sartryck Ur Ymer, 103-122 (Arsbok 1 9 7 0 )
Whitby, L. X. &. ( 1 9 7 6 ) Can. Mineralogist, 14, 47-57
Forstner, U. & Wittmann, G . T . W. (1976) Geoforum 1. 41-49
Hiller, K. D. ( 1 9 7 3 ) in: Cycling and Control of Metals, EPA Cincinnatti, 91-94
Tessenow, U. & Baynes, Y. (1975) Naturwissenschaften, 6 2 , 342-343
Reinhard, D. & Forstner, U. ( 1 9 7 5 ) N. Jb. Geol. Palaont. Mh., 301-320
Cline, J. T. & Upchurch, G . B. (1975) Proc. 16th Conf. Great Lakes Res., 349-356
Brooks, R. R. &. ( 1 9 6 8 ) Geochim. Cosmochim. Acta, 2, 397-414
Elderfield, H. & Hepworth, A. (1975) Mar. Poll. Bull., 6. 85-87
Epstein, S. S. (1972) Int. J. Environm. Stud., 2, 291-200
Banat, K . 9 &. (1974) Chem. Geol. 14, 199-207
Chau, Y. K . & Shiomi, M. T. (1972) Water, Air, S o i l Poll., 1_, 149-155
Schottler, U. ( 1 9 7 5 ) Ztschr. Dtsch. Geol. Ges. 126, 373-384
Lagerwerff, J. V. (1967) Am. Assoc. Adv. Aci. Publ. 9 5 , 343-364
Fagerstrom, T. & Jernelov, A. (1972) Water Res., 6, 1193-1202
Wood, J . M. (1974) Science, 183, 1049-1052
2 3 3


Geochemistry of Sediment/Water Interactions of Nutrients, Pesticides and Metals, Including Observations on Availability.
Nutrients
D. R. Bouldin
I NTRODUCT I ON
During the period September 1972 through September 1975, phosphorus fractions and flow were monitored in a 300 k m 2 (126 m i 2 ) watershed in central New York. In addition several studies were made of composition and flow in selected subwatersheds for portions of this experimental period.
The water samples were collected manually. Sampling frequency was concentrated during periods of high discharge rate. The total phosphorus in the water was separated into three fractions according to the following scheme. Within 2 to 3 hours after removal from the stream, the sample was centrifuged at high speed to remove particulate matter. The untreated super- natant was analysed immediately for inorganic phosphorus and this fraction was labelled molybdate reactive phosphorus (MRF'). Another portion of the supernatant was oxidized with persulfate and the results of this analysis were labelled TSP. Finally, samples of the particulate matter were analysed for total phosphorus. Hence we derive 3 fractions: a) a molybdate reactive fraction which is probably mainly dissolved inorganic phosphorus, b) a fraction which includes the molybdate reactive plus organic phosphorus and c) the particulate fraction which is primarily the phosphorus associated with the suspended solids.
The total quantity of these various fractions carried out of the watershed during a specified time interval (loading) was calculated as follows. The concentration of MRP increased as discharge rate increased and the concen- tration of MRP was higher on the ascending limb of the hydrograph relative to the descending limb; hence, regressions of MRP on discharge rate and rate of change of discharge rate were calculated and these regressions were used for interpolation purposes. The loading of MRP was then calculated as the sum of
regression. In general the difference in concentration between MRP and TSP the product of discharge per 2 hours, times concentration calculated from the
was relatively constant and seemed to vary in a random fashion about the mean of 12 microgrammes P/1. The phosphorus content of the particulate matter varied randomly about a mean of 0.11% P.
There are 3 aspects of the data which will be discussed in detail. These are: 1) The removal from solution of soluble phosphorus inputs from point sources during movement downstream, presumably by reaction with the streambed. 2) A procedure for allocating the loading of soluble phosphorus to a) biogeochemical ("natural" or "background") sources, b) diffuse sources associated with human activity and c) point sources associated with human activity. 3 ) A rationale for the working hypothesis that the soluble phos- phorus will have a major impact on the biology of lakes while the phosphorus associated with the particulate matter will have only a minor impact.
235

Two independent subwatersheds which together comprised about 3/4 of the total area of the whole watershed were selected for detailed study of behaviour of soluble phosphorus. One of these subwatersheds (location 16) contained a secondary sewage treatment plant serving 1200 people who effluent was emptied into the stream. This served as a major point source o f soluble phosphorus. The other subwatershed (location 15) was similar in other aspects but did not contain such a well defined point source. One set of data which illustrates that the total soluble phosphorus (TSP) was not conserved in the stream is presented in Table 1. Particularly noteworthy are the losses during low flow periods, which were primarily the summer months. Presumably this loss is associated with reaction between phosphorus in the water and material in the streambed. During the periods of higher flow, there appeared to be some redissolution of this phosphorus, but recovery was not complete.
Two small subwatersheds which were almost devoid of human activity were selected for study of total soluble phosphorus loading in the absence of human activity, and in addition the water from 4 wells sunk in an active agricultural area located on well-drained outwash was monitored. A l l of the samples from these sites contained about the same amount of MRP and TSP regardless of source. The averages were 6 2 0 . 3 microgrammes MRP/1 (123 samples) and 15% 0.9 microgrames TSP/1 (107 samples). Thus the loading of these phosphorus fractions in the absence of human activity was set equal to these concen- trations times total discharge, which averages about 0.5 meter/ year in the area we studied.
The remainder of the MRP and TSP was allocated to the sum of the diffuse and point sources. The landscape is a mosaic of point and diffuse sources. There are numerous single family dwellings (%3000), a sizeable fraction of which are served by septic tank-disposal fields which are not functioning properly and many simply overflow into drainageways. Milk house wastes are often emptied into drainageways. There are about 125 dairies in the watershed most of which have barnlots and the manure from these is spread on the associated cropland. Since the strategy for control of this multitude of sources is very different and since control of all is probably impractical, some means of estimating the relative importance would provide useful insights.
The rationale for the separation of these sources is as follows. The diffuse sources have a major impact on water composition only when water runs over the soil surface and into drainage ways. Thus there is a soil factor and a precipitation intensity-distribution factor. Some soils are so permeable to water that only on very rare occasions will water run over the surface and into flowing drainageways. These are usually the most intensively farmed soils, and also receive the most manure. On the other hand, overland flow of water is common on less permeable soils and this is particularly true for barnlots where the compaction from the animal traffic reduces permeability. In contrast, milk house wastes and sewage inputs are mostly the same each day regardless of precipitation intensity.
The foregoing discussion suggests that the major impact of diffuse source loading will be on the high discharge associated with precipitation events which produce large amounts of surface runoff. A complicating factor (during high discharge) is the dissolution of phosphorus from bed sediment which has reacted with point sources during the preceding low discharge intervals.
236

TABLE 1
Comparison of loading of total soluble phosphorus during selected periods for 2 major subwatersheds (locations 15 and 16) and the total watershed (location 1). The areas of subwatersheds 15 and 16 are 147 and 104 km2 respectively and the area of watershed 1 is 330 km’. Note that during low discharge intervals, the MRP loading from 15 and 16 was considerably higher than that at location 1, even though location 1 included 1 5 , 16 and an additional 78 km2 of area. Location 16 includes the secondary sewage treatment plant.
Period
May 1974
October 1974 through
November 1974 through May 1975
May 1974 through August 1975
Discharge at location 1
(m3 x
r 40
153
210
15
340
822
1253
237

We proceeded to analyse high discharge events as follows utilizing the hydrograph analysis of Chow. This separates flow into 3 components:
a) that associated with a base flow reservoir
b) that associated with an interflow reservoir and
c) that associated with surface runoff.
Then a plot of the concentration of MRF' against surface runoff as a fraction of total flow was made and the results were extrapolated to 100% surface runoff. which served to estimate the concentration of MRP in the surface runoff.
The results for the whole watershed for three winters are illustrated i n Figure 1. The results indicate the concentration of MRP in the surface runoff is in the range of 34 to 60 microgrammes MRP/1, which is considerably higher than the 6 microgrammes MRP/l estimated for biogeochemical sources. The loading of diffuse sources was then calculated as the product of the estimated concentration at 100% surface runoff multiplied by the estimated amount of surface runoff (5 12 to 15% of total discharge). Finally, the point source inputs were estimated by difference.
To summarize the calculations, the biogeochemical inputs were estimated as the product of total flow times average concentration of MRP (or TPS) in wells and stream flow from watersheds devoid of human activity. The inputs associated with human activity were estimated as the difference between total loading and biogeochemical loading. The diffuse source loading (assoc- iated with human activity) was calculated as the product of estimated concen- tration in surface runoff times estimated amount of surface runoff (% 12- 15% of total flow in the watershed studied). Finally the point source inputs were estimated as the remainder.
Clearly one can raise many questions about the validity of this procedure. We defend it to the extent that it represents a reasonable first approx- imation and simultaneously suggest a more precise and less arbitrary procedure should be developed.
Samples of the results of this analysis are presented in Table 2.
The third aspect of our analysis is associated with the implications of results of loading of phosphorus to the biota of lakes. The phosphorus Carried in streams is distributed among several chemical forms and physical states. Consideration of the nature and behaviour of these several components suggests that their effect on the biology of lakes differs. A major fraction of the total phosphorus carried out of a watershed by a stream is associated with the particulate matter suspended in the water, much of which is delivered during a relatively short period of time when the discharge rate is very high and hence the velocity of flow is sufficient to transport particles of varying sizes and densities. A smaller fraction of the total phosphorus is dissolved
contained 500 to 1000 microgrammes of phosphorus per litre associated with in the water. For example, during storm periods Fall Creek water often
particulate matter and 20 to 40 microgrammes per litre of dissolved phosphorus. Upon reaching the lake these fractions behave very differently; the larger particles soon settle to the bottom because water movement in the lake is no longer sufficient to keep them in suspension. At least in the lakes in central New York, a few days after a large storm which delivers large amounts of suspended solids, the water in the lake (even near stream outlets) becomes relatively clear and only the fine particles remain in suspension plus, of
2 3 8

TABLE 2.
ALLOCATION OF MOLYBDATE REACTIVE PHOSPHORUS (MRP) IN WATER AT LOCATIONS 15, 16 AND 1 FOR THE PERIOD
MAY 1974 THROUGH AUGUST 1975.
BGC 11 Human Activity
Point Diffuse Total Location kg kg x kg x kg x
15
16
1250 590 47 95 8 565 45
3060 930 30 885 20 1260 41 1
1800 310 17 1100 61 394 22
"Biogeochemical
n a x 00
I I I 025 050 0.75 1.0
SURFACE RUNOFF + TOTAL DISCHARGE
Figure 1. The regressions of MRP concentration on fraction of the total flow as surface runoff at location 1 for three winters.
239

course, the dissolved constituents. Lake samples seldom contain more than a total of 10 to 50 microgrammes of phosphorus per litre in all forms. Thus the phosphorus remaining in the lake water is very different in nature and amount from that delivered by the stream during storm periods.
According to the reasoning which follows, the amount of particulate phosphorus delivered by the stream has only a minor effect on the biology of lakes, while the dissolved phosphorus has a major effect.
First, the bottom of the lake is covered with sediment delivered by past events from the lake basin. If the phosphorus in the sediment delivered by past events was essentially in the same forms as that delivered by current events, accumulation of more of the same seems unlikely to change the effect of the bottom sediments on lake biology; that is, adding a few millimetres of sediment to several metres of sediment seems unlikely to have an important effect on lake biology.
Second, questions can be raised about the chemical activity of the particulate phosphorus; for example, if samples of suspended solids were leached with phosphorus-free water, how rapidly would the solid phase phosphorus dissolve and what would be the concentration of phosphorus in the leaching water? The results of such studies show that there is a small amount (usually considerably less than 10%) of the total phosphorus which dissolves fairly rapidly and that the concentration of leachate decreases as leaching continues. Such phosphorus is referred to as labile or sorbed phosphorus. Once this labile phosphorus is removed, the remainder dissolves very slowly and concen- trations in solution are only a few microgrammes per litre. Furthermore, this is consistent with the fact that most of the phosphorus associated with the suspended solids has persisted through long geological periods; its resistance to dissolution must be considerable or it would have been leached out of the unconsolidated mantle and carried to the sea long ago. The results of studies with Fall Creek sediments demonstrate that the particulate matter contains about 1.1 milligrammes of total phosphorus per gram and about 0.04 milligrammes ( 4 % ) of this is in a labile or sorbed form.
Further evidence that soluble, not adsorbed, phosphorus is the critical factor determining phytoplankton concentrations is provided by comparative studies of the way lakes respond to phosphorus loadings. Detailed investigations on a group of New York lakes revealed that average summer standing crops of phytoplankton were better correlated with loadings cal- culated as soluble phosphorus than with those determined in the form of total phosphorus. Models resulting from this work have subsequently been extended to a global basis for temperate latitude lakes. These and other arguments lead us to formulate the following hypotheses about the effects of these fractions for temperate systems with soils and bedrock similar to those of the New
most of the total soluble phosphorus (TSP) is available to organisms in York lakes: 1) probably 100% of the molybdate reactive phosphorus (MRP) and
lakes. 2 ) probably the labile or sorbed fraction of particulate phosphorus is of limited importance to the biology of lakes. 3) probably the remainder of the particulate phosphorus is of no consequence to the biology of lakes.
emphasize the question of biological effects of the different phosphorus fractions. There seems to be no reasonable defense for the hypothesis that all fractions are of equal biological importance. Thus measurements of loading based on the single parameter of total P delivered by streams seem to
A most important aspect of the preceding paragraphs is to at least
240

be of limited value in terms of estimating impact on lake biology. However, total P in the photic zone of the lake is an important parameter, but it should be noted that total P delivered by the stream and total P in lake water are entirely different; in fact, the MRP and TSP fractions measured i n stream flow are probably comparable in many respects to total P in lake samples.
operation with an interdisciplinary team funded in part by the Rockefeller Foundation, FT70103. A more comprehensive summary of the project is to be found in the following book:
Major portions of the work reported here were performed in co-
Porter, Keith, ed. Nitrogen and Phosphorus: Food Production, Waste and the Environment. Ann Arbor Sci. Publications, Inc. Ann Arbor, 1975.
241


DISCUSSION
Dr. T . Logan: You mentioned the method that you used for estimating the labile phosphorus by using the equilibrium phosphorus concentration and extrapolating to the amount that is desorbed. We have been doing more or less the same type of procedure to find what fraction of the particulate phosphorus might be bio-available. The only thing that bothers me about
going to desorb in a given time which you pretty well define by your exper- that method is that it is time-dependent. It is the amount that you are
imental conditions. But if you consider the situation that might be occurring in the lake, it is possible that you can regenerate additional labile phosphorus if you let the sediment rest or put it through a rest period. We have done some of this and in fact you can regenerate a consi- derable amount of labile phosphorus. I want to know how we try and resolve these types of problems.
Dr. D. Bouzdin: The argument I would use is that we are interested in the incremental effect on the phosphorus associated with the sediments that we are adding. We assume that the sediments already there contain the phosphorus that they inherited from the geological materials and that adding a fresh batch really is not going to have too much influence on the lake. The thing is, the new sediment coming in has this labile fraction that may in fact have a much larger impact on the lake than the old sediment. That is our rationale, and to be sure I would not say that what we did was the best. It is a crude estimate and you can go into a lot of refinement with that, and I think you probably should. The only point I am trying to make I s that it is not a very large fraction of the total sediment phosphorus that we are dealing with. It is a relatively small fraction in our particular case and I do not think this is something that you extrapolate everywhere.
Dr. T. Logan: The other point is, do you think that this labile phosphorus is a sediment parameter? Do you see it changing with land use OK ferti- lization practices, manure practices, this type of thing, or is it more or less determined by the soil characteristics?
Dr. D. BouZdin: I think it should very much depend on the kinds of treatment. I would think the suspended solids derived from a non-agricultural landscape are quite different in nature from those derived from a barnlot. The amount
243

of labile phosphorus on the barnlot sediments is quite high. Let me say one other thing, I am just convinced from everything I see and all the analysis of the data I can carry out, that well over 50% of the total sus- pended solids in the Fall Creek Watershed are simply derived from stream bank erosion, and this is not the kind of erosion that is the reworking old sed- iments. In one case in the stream sub-watershed that gives me the highest loading of suspended solids, the stream is clearly eating its way through an old terminal moraine. It has not got there yet. It is still chewing away on that and you can see that in very many places in the watershed. We have got a little bit of suspended solids from the barnlots mixed up with a lot of stuff that has never seen phosophorus or manure or anything else. It is ground up glacial debris that has been sitting there for 10,000 years.
244

Pesticides and Metals, Including Observations on Availability. Geochemistry of Sediment/Water Interactions of Nutrients,
Pesticides
J . B . Weber
INTRODUCTION
Pesticides used in agricultural production eventually reach the
be decomposed by chemical, biological, or photochemical degradation. soil where they are acted upon by various processes. The chemicals may
They are also acted upon by transfer processes such as adsorption, exu- dation, retention and accumulation by organisms, adsorption by soil colloids, and other surfaces, and movement in the vapour, liquid and solid state through the atmosphere, soil, and water (1. 2, 3 ) . In this paper, we are concerned primarily with pesticides and particulate matter that end up as sediment in water.
SEDIKNT
Soil sediment is defined as the solid material, both mineral and organic, that is in suspension, is being transported, or has been moved from its site of origin by air, water, gravity, or ice and has come to rest on the earth's surface either above or below sea level (4). It is by far the United States' single largest water pollutant, exceeding the sewage load by some 500 to 700 times (5). About half of all sediment originates on agricultural land (6) and some of it contains adsorbed pesticides ( 7 ) .
The properties of sediment influence its effect on the environment. Physical properties, including size, density, and shape of the particles affect the sediment movement. Coarse sediment is relatively inert, but fine sediments composed of silt, clay, and organic materials are chemically active and may absorb or desorb chemicals from solution. The bulk of the sediment problem, however, is caused by the colloidal fractions of sediment. The colloidal material may be a mixture of clay minerals, of the expanding or nonexpanding type, and of organic materials ranging from relatively hydrophilic and undecomposed to highly lipophilic and highly decomposed. Little is known about the chemistry of sediment in field situations, but information is available on the interaction of pesticides with various soil colloids and specific adsorbents ( 3 , 8 ) . It is also known that radioactive materials from fallout selectively erode with soil sediment
deposits (7) and there is a good possibility that an analogous situation and may result in higher concentrations of radioactivity in reservoir
is occurring with pesticides. A recent survey along tributaries of the lower Mississippi River revealed isolated bottom sediment deposits con- taining as much as 0 . 5 ppm DDT ( 9 ) .

Complete elimination of soil erosion is impossible, so guidelines are being developed to define acceptable levels of erosion and sedimentation (10). Models for predicting runoff (11) and pesticide movement through soils (12) are being developed. An excellent bibliography on the effects of agricultural practices or environmental quality is also available (13).
PESTICIDE I ~ R A C T I O N ~
Herbicides, insecticides, and fungicides vary greatly in their physical and chemical properties and in their behaviour in the environment (1, 3 , 14, 15, 16). Of the many properties that regulate pesticide behaviour, at least four are of primary importance. They include: (a) ability to ionize; (b) presence of complexing elements (P, As); (c) water solubility; and (d) ability to vapourize ( 3 ) . A classification of pesticides based on the over- all characteristics of these four properties of selected pesticides is shown in Table 1. Chemical names for the compounds are given in Table 2.
PESTICIDE FROPERTIES
The ability of a pesticide to ionize determines whether or not the chem- ical will have an ionic charge in aqueous solution. Cationic pesticides, such as the herbicides cyperquat, difenzoquet, diquat, and paraquat, are readily adsorbed by negatively charged surfaces of colloidal soil sediment ( 3 ) . They are completely removed from aqueous solution by colloidal sediment and move with the sediment ( 3 ) . Anionic pesticides, such as the acidic her- bicides dalapon, dicamba. picloram, and 2,4-D are adsorbed in only small amounts by colloidal soil sediment and are readily desorbed in aqueous systems ( 3 ) . They are, therefore, found primarly in the solution phase in waters. Basic pesticides, such as the 6-triazine herbicides ametryn, atrazine, prometon, and prometryn are adsorbed by acidic colloidal surfaces in relatively large amounts and by neutral or basic colloidal surfaces in much smaller amounts. Since their adsorption is dependent on the acidity of the system, the amount that is retained or released by soil sediment depends on the pH of the system ( 3 , 17). They are, therefore, in equilibrium with the sediment and the solution phase. Nonionic pesticides are adsorbed by colloidal surfaces primarily through physical adsorption forces and the amount that is retained by soil sediment is dependent to a large extent upon the water solubility of the pesticide and the hydrophilic/lipophilic char- acteristics of the sediment ( 3 ) . Relatively water soluble, nonionic pest- icides, such as aldicarb, CDAA, dimethoate, molinate, carbetamide, fenuron, methomyl, and propoxur, are adsorbed by soil colloids in very small amounts and are readily desorbed in dynamic, aqueous systems. Pesticides of very
endrin, and oryzalin, are adsorbed by highly lipophilic organic colloidal low water solubility such as aldrin, BHC, lindane, trifluralin, DDT, dieldrin,
sediments but not by hydrophilic clay colloids. They are in equilibrium with the surrounding aqueous phase, but because of their low solubilities desorb only slightly. Nonionic pesticides of moderate water solubilities are intermediate between the low and high water soluble compounds in their reaction with colloidal sediments. Pesticides which possess complexing elements such as phosphate, (demeton, disulfoton, glyphosate, parathion, and phorate) or arsenic (DSMA, MAMA and MSMA) readily complex with clay colloids and move with these sediments.
246

N c. U
TABLE 1.
CLASSIFICATION OF SELECTED PESTICIDES BASED ON THE OVEMLL CHARACTERISTICS OF IONIZABILITY, WATER SOLUBILITY, PRESENCE OF COMPLEXING ELEMENTS, AND VAPOURIZABILITY
~~
Nonionic Pesticides I With
Complexing High Water Ionic Pesticides
Moderate Water Low Water Elements Solubility Solubility Solubility
Cationic Basic Acidic Non- Non- Non- Non- Pesticides Pesticides Pestieides Volatile Volatile Volatile Volatile Volatile Volatile Volatile Volatile
cyperquat ametryn dalapon demeton DSMA aldicarb carbetamide CDEC butachlor aldrin DDT
difenzoquat atrazine dicamba disulfoton glyphosate CDAA fenuron EPTC diuron BHC dieldrin
diquat prometon picloram parathion MAMA dimethoate methomyl pebulate fluometuron lindane endrin
paraquat prometryn 2,4-D phorate MSMA molinate propoxur vernolate monuron trifluralin oryzalin

Table 2.
NAMES AND PROPERTIES SELECTED PESTICIDES
Common Name
cyperquat
difenzoquat
diquat
paraquat
one t ryn
atrazine
prometon
prometryn
dalapon
dicamba
picloram
2,4-0
demeton
disulfoton
parathion
phorate
DSMA
glyphosate
"A
MSMA
aldicarb
Water solubility
Vapour
Chemical Name (wd pressurc
1-methyl-4-phenylpyridinium ion > l o 5 1.2-dimethyl-3.5-diphenylpyrazium ion >lo5
6.7-dihydrodipyrido[1,2-a:2',1'-c]pyrazinediium ion>105
l,l'-dimethyl-4,4'-bipyridinium ion >lo5
2-(ethylamino)-4-(isopropylamino)-6-(methylthio) 185 -s-triazine
2-chloro-4-(ethylamino)-6-(isopropylamino)-s- 33 triazine
2,4-bis(isopropylamino)-6-(methoxy)-s-triazine 750
2.4-bis(isopropylamino)-6-(methylthio)-s-triazine 48
2,2-dichloropsopionic acid
3,6-dichloro-o-anisic acid
4-amino-3,5,6-trichloropicolinic acid
2,4-dichlorophenoxy acetic acid
0,O-diethyl-o(and S)-(Z-(ethylthio)ethyl) phosphorothioates
0,O-diethyl-S-(2-ethy1thio)ethyl)phosphoro- dithioate
0,O-diethyl-0-p-nitrophenyl phosphorothioate
0,O-diethyl-S-(ethy1thio)-methyl phosphoro- dithioate
disodium methanearsonate
N-phosphonomethylglycine
monoammonium methanearsonate
monosodium methanearsonate
2-methy1-2-(methylthio)-propionaldehyde-O- (methylcarbamoy1)oxine
>lo5
4500
430
900
250
66
24
50
> l o 5 > l o 5
loG
l o 6 6000
( m m Hg @ 21
< 10-
(10-6
2 x 10⁻⁶
5 x
3 x 10-6
a 0 - 6
1 x 10"~
1.8 x
10"
2.3 x
<lo-
a 0 - e
a 0 - 6
1 x
248

Common Name
CDlZA
dimethoate
molinate
carbetamide
f enuron
methomyl
propoxur
CDEC
EPTC
pebulate
vernolate
butachlor
diuron
fluometuron
monuron
aldrin
BHC
lindane
trifluralin
DDT
dieldrin
endrin
oryzalin
Chemical Name
N,N-diallyl-2-chloroacetamide
0,O-dimethyl-S-(-methylcarbamoylmethyl) phosphorodithioate
S-ethylhexahydro-1H-azepine-1-carbothioate
D-N-ethyl-2-(phenylcarbamoyloxy)-propioamide
l,l-dimethyl-3-phenylurea
solubility Water
(ppm)
>lo5
25,000
800
3500
3000
S-methyl-N-((methylcarbamoy1)oxy)thioacetimidate 10,000
2-isopropylphenyl-N-methylcarbamate
2-chloroallyl diethyldithiocarbamate
S-ethyl dipropylthiocarbamate
S-propyl butylethylthiocarbamate
S-propyl dipropylthiocarbamate
N-butoxymethyl-2-chloro-2',6'-diethylacetanilide
3-(3,4-dichlorophenyl)-l,l-dirnethyurea
1,l-dimethyl-3-(a,a,a-trifluoro-m-tolyl)urea
3-(p-chlorophenyl)-l,l-dimethylurea
1,2,3,4,10,10-hexachloro-l,4,4a,5,8,8a-hexahydro- 1,4-endo-exo-5,8-dimethanonaphthalene
1,2,3,4,5~,6-hexachlorocyclohexane
gamma isomer of 1,2,3,4,5,6-hexachlorocyclohexane
2000
92
370
60
90
23
42
90
230
0.2
10
10
a,a,a-trifluor-2,6-dinitro-N,N-dipropyl-p-toluidine 0.05
dichlorodiphenyltrichlorethane 0.001
1,2,3,4,10,10-hexachlor-exo-6,7-epoxy-l,4,4a,5,6, 0.25 7,8,8a-octahydro-l,4-endo-exo-5,8-dimethano- naphthalene
1,2,3,4.10,10-hexachloro-6,7-epoxy-1,4.4a.5.6.7 0.23 8,8a,-octahydro-l,4-endo,endo-5,8-dirnethanonaphthalene
3,5-dinitro-N4,N'-dipropylsulfanilamide 2.4
Vapour
(mm Hg @ 25'C) pressure
1 x io-'
5.6 x
(10-
2.2 x 10⁻³
3.4 x
3.5 x
1.0 x
4.5 x
5 x
10-
5 X
1 . 3 x 10" 10-
1 . 9 X
2.7 X loq6
2 x 10"
249

Pesticides with vapour pressures higher than 1 x mm of Hg at 25' C are considered to be volatile and generally need to be incorporated into the soil to be effective (3). Generally the higher the vapour pressure, the more volatile is the chemical. Such pesticides, including those listed in Table 1 and the esters of the phenoxy acid herbicides, are adsorbed by colloidal soil sediments, but they are readily desorbed in dynamic aqueous systems; in addition the vapours escape from the aqueous phase into the atmosphere.
PESTICIDE b m ~ ~
Studies on the movement of pesticides from agricultural lands showed that the chemicals were transported both in the runoff water and adsorbed to suspended materials (18, 19, 20, 28). The amounts transported in runoff depended on climatic factors such as frequency, intensity, and duration of rain; chemical properties of the pesticides; and properties of
dition. the soils such as soil type, slope, and moisture content and surface con-
Barnett % &. (18) found that ester formulations of 2,4-D were more susceptible to runoff than the more soluble amine salt forms. The ester forms adsorbed to soil particles and moved with the eroding soil, whereas the amine forms dissolved and leached into the soil.
Surface runoff of 2,4-D and picloram was found to be greater from sod than from fallow soil surfaces in studies by Trichell (19). The opposite was found by Edwards (30) to be the case for atrazine. Runoff of 2,4,5-T was about equal under the same conditions (3). Herbicide runoff increased with increasing slope and rate of application and concentration decreased when runoff passed over untreated sod.
In studies where trifluralin, DDT, toxaphene, or methylparathion was applied to cotton, less than 1%, 3.12%, 1%, and 0.25%, respectively, was recovered in the runoff (26, 26). Of the four pesticides recovered, 84%, 96%, 75%, and 12%, respectively was associated with the sediment.
The highest concentrations of diuron, summitol, 2,4-D, 2,4,5-T, and picloram observed in surface runoff waters were 1.8 ppm, 0.5 ppm, 4.2 ppm. 1.2 ppm, and 2.7 ppm respectively, in ditchbank weed control studies in Utah ( 2 9 ) . The greatest herbicide movement occurred during intial storms following herbicide application.
southern states, and Puerto Rico, ranged from 0.10 to 0.87 ppm in the first runoff and decreased to less than 0.2 ppm in later runoff (21). Most of the herbicide was found distributed in the 0 to 30 cm zone (22), but in two sandy soils it was found in the 15 to 30 cm zone in high enough concentrations in injure bioassay plants (23).
Fluometuron movement in runoff from studies conducted in five
two years before spraying, less than 0.1% of the 2,4-D, and less than 1% of the picloram applied was lost in runoff from the first seven runoff events after herbicide application (24).
In a study conducted in areas where forest vegetation had been cut
250

Sheets st. (25) found, where 2,4-D, 2,4,5-T, picloram, or dicamba was applied to small plots in a mountain watershed, maximum con- centrations of 2.55 ppm, 0.68 ppm, 4.19 ppm, and 0.16 ppm, respectively, occurred in surface runoff during the first OK second event after appli- cation.
BIOACTIVITY OF ADSOREED PESTICIDES
Biological availability of bound pesticides is dependent upon the type of pesticide and colloidal sediment involved (2, 1 7 ) . Pesticides that are weakly adsorbed to the surfaces of colloidal sediment, such as the phenoxy acid herbicides, are readily desorbed into the surrounding aqueous environment and dissipate primarily through dilution. Pesticides, such as diquat and paraquat, that are adsorbed on the internal surfaces of expanding types of clay colloids are not released to the aqueous phase and are not available to organisms. Pesticides that are very water insoluble are normally adsorbed to the surface of lipophilic sediment. They are in equilibrium with the surrounding aqueous environment and are released or degraded chem- ically OK biologically, except in those cases where the chemicals have become part of the organic collodial matrix. The majority of pesticides are intermediate in biological degradability in the bound state. They are in equilibrium with the surrounding dynamic media which tends to desorb them and make them available for degradation.
GMCLUS IONS
The extent to which pesticides applied to agricultural lands may pollute runoff water and the eroding sediment depends on the physical, chemical, and biological properties of the chemicals, the intensity and duration of the rainfall, and edaphic properties such as soil cover, soil type, and slope.
LITERATURE CITED
A Primer on Agricultural Pollution. (1971)., J. Soil and Water Conservation, g,(2); 44-65.
Bailey, G. W., R. R. Swank, Jr., and H. P. Nicholson. (1974)., Predicting Pesticide Runoff from Agricultural Land: A Conceptual Model. J. Environ. Qual., 2,95-102.
Barnett, A. P., E. H. Hauser, A. W. White, and J. H. Holladay. (1967)., Loss of 2,4-D in Washoff from Cultivated Fallow Land. Weeds, x, 133-137.
Barthel, W. F., J. C. Hawthorne, J. H. Ford, G. C. Bolton, L. L. McDowell, E. H. Grissinger, and D. A. Parsons. (1969)., Pesticide Residue in Sediments of the Lower Mississippi River and its Tributaries. Pesticides Monitoring J., 2(1), 8-66.
251

Bradley, J. R., Jr., T. J. Sheets, and M. D. Jackson. (1972)., DDT and Toxaphene Movement in Surface Water from Cotton Plots. J. Environ. Qual., 1. 102-105
Control of Water Pollution from Cropland. (1975) Vol. 1-A Manual for Guideline Development. ARS, USDA, and Office of Research and Development, EPA Report No. ARS-H-5-1, Superintendent of Documents, Washiongton, D. C.
Davidson, J. M., G. H. Brusewitz, D. R. Baker, and A. L. Wood. (1975)., Use of Soil Parameters for Describing Pesticide Movement Through Soils. Environmental Protection Agency Report No. 660/2-75-009, National Environmental Research Centre, Office of Research and Development, EPA, Corvallis, Oregon. 149 pp.
Edwards, W. M. (1972)., Agricultural Chemical Pollution as Affected by Reduced Tillage Systems. Proc. No-Tillage Systems Symposium, February 21-22, 1972, Columbus, Ohio., pp. 30-40.
Environmental Quality: An Annotated Bibliography of Papers, Published in the Soil Science Society of America Proceedings, (1962-1971)., Soil Science Society of America, Madison, Wisconsin, 1975.
Epstein, E. and W. J. Grant., (1968). Chlorinated Insecticides in Runoff water as Affected by Crop Rotation. Soil Sci. SOC. Amer. Proc., 32, 423-426.
Evans, J. 0 . and D. R. Duseja. (1973)., Herbicide Contamination of Surface Runoff Waters. Environmental Protection Agency Report R2-73-266. Superintendent of Documents, U . S . Government, Washington, D. C., 99 pp.
Glymph, L . M. and C. W. Carlson. (1966)., Cleaning Up Our Rivers and Lakes, Paper No. 66-711. American Society Agricultural Engineering, St. Joseph, Michigan. 43 pp.
Glymph, L. M. and H. C . Storey. (1967)., Sediment--its Consequences and Control. Pub. 85. American Association Advancement of Science, Washington, D. C., pp. 205-220.
Peeper, T. F. and J. B. Weber. (1974)., Vertical Fluometuron Movement in Runoff Studies of the Southern Region. Proc. So. Weed Sci. S O C . , 27, 324-332.
Resource Conservation Glossary., (1970) Soil Conservation Society of America, Ankeny, Iowa.
Savage, K. E . (1975)., S-78 Regional Research Project--Movement and
Vertical Movement in Soil. Proc. So. Weed Sci. SOC., 8 , 3 2 Persistence of Fluometuron in the South: I. Persistence and
(abstract)
Sheets, T. J., J. R . Bradley, Jr., and M. D. Jackson. (1973)., Movement of Trifluralin in Surface Water. Proc. So. Weed Sci. SOC., 26, 376 (abstract).
252

Suffling, R., D. W. Smith, and G. Sirons. (1974)., Lateral LOSS of Picloram and 2,4-D from a Forest Podzol During Rainstorms. Weed Res., 2, 301-304.
Trichell, D. W., H. L. Morton, and M. G. Merkle. (1968)., Loss of Herbicides in Runoff Water. Weed Sci., 16, 447-449.
Weber, J. B. (1972)., Interaction of Organic Pesticides with Particulate Matter in Aquatic and Soil Systems. In R. F. Gould (ed.) Fate of Organic Pesticides in the Aquatic Environment, Chapter 4, pp. 55-120, American Chemical Society, Washington, D. C.
Weber, J. B. (1975)., Agricultural Chemicals and Their Importance as a Non-point Source of Water Pollution. Proc. S . E. Regional Conf. Non-Point Sources of Water Pollution, Virginia Polytechnic Institute and State University, May 1-2, 1975, pp. 115-129.
Weber, J . 8. (1970)., Mechanisms of Adsorption of s-triazines by Clay Colloids and Factors Affecting Plant Availability. & F. A. Gunther (ed.) The Triazine Herbicides, pp. 93-130, Springer-Verlag, N. Y.
Weber, J. B., Environmental Safety of Pesticides: The Old VS. the New. Submitted for publication in Environ. Sci. and Tech., June, (1976).
Weber, J. B. and S . B. Weed. (1974)., Effects of Soil on the Biological Activity of Pesticides. Chapter 10, pp. 223-256, W. P. Guenzi (ed.) Pesticides in Soil and Water, Soil Science Society of America, Inc., Madison, Wisconsin.
Weber, J. B., S . B. Weed, and T. J. Sheets. (1972)., Pesticides: How They Move and React in the Soil. Crops and Soils Magazine, z,(l), 14- 17.
Weber, 3 . B., T. J. Monaco, and A. D. Worsham. (1973)., What Happens to Herbicides in the Environment? Weeds Today, 4,(1),16-17,22.
Weed, S . B. and J. B. Weber. (1974)., Pesticide-Organic Matter Inter- actions, Chapter 3, pp. 39-66, W. D. Guenzi (ed.) Pesticides in Soil and Water, Soil Science Society of America, Inc., Madison, Wisconsin.
White, A. W., A. P. Barnett, B. G . Wright, and J. H. Holladay. (1967).. Atrazine Losses from Fallow Land Caused by Runoff and Erosion. Environ. Sci. Tech., 1. 740-744.
Wiese, A. F. (1975). S-78 Regional Research Project--Movement and Persistence of Fluometuron in the South: 11. Lateral Movement in Runoff Water. Proc. So. Weed Sci. SOC., 28, 322, (abstract).
253


Pesticides and Metals, Including Observations on Availability. Geochemistry of SedimentlWater Interactions of Nutrients,
Metals
I. Jonasson
INTRODUCTION
is of prime concern in the development of an understanding of what may be the A knowledge of an element's behaviour at a sediment-water interface
significant chemical controls on that element's dispersion and perhaps upon its fixation into sediments.
Allied research on the transport of elements in solution as com- plexed species has received wide attention in the geochemical literature. Pitwell (1973) has concluded that the most common complexing ligands present in groundwaters are water itself, carbonate, chloride, fluoride and some organic acids. Taken to their extreme limits, processes by which metals are mobilized, transported, precipitated and remobilized are considered important steps in the formation of sedimentary sulphide orebodies. Saxby (1973) has suggested that on diagenesis, metal-organic complexes may eventually form concentrations of metallic sulphides.
However, this discussion is concerned primarily with the nature of the dynamic interactions, mainly chemical, which affect the cycling of a given trace metal ion or its compounds through fluvial systems.
Firstly it is necessary to deal with organic matter and its involve- ment in such interactions, and then with the influences of certain hydrous metal oxides. In nature, these might be regarded as two relatively pure systems representing end-members of a full spectrum of interactions in which practically any substance present can be regarded as a participant in dis- persion processes.
of the tree covered section of the Canadian Shield and Interior Lowlands. Streams are commonly fed by waters from swamps, marshes and muskeg. The residence time of waters within organic trash ensures considerable dissol- ution of humic materials. Silts and clays are often covered with finely divided organic matter. By contrast, stream sediments from the far north of Canada and from the alpine Cordilleran regions are generally clean of organic matter; waters derived mainly from snow melt contain very little dissolved organics and adsorption of metals directly into clays, rock flour and hydrous metal oxides and dissolution of mineral particles are the predominant water- sediment interactions.
For example, organic matter predominates in the flat-lying terrain
TAL INTERACTIONS (a) Interactions Involving Organic Matter
Within surficial waters the most significant form of metal-organic interaction is generally accepted to involve chelation of trace elements
2 5 5

with the complex, polymeric organic compounds which comprise humic matter (Saxby 1969, Bowen, 1966). Experimental studies have shown that, in compar- ison with model organic compounds likely to find their way into natural waters, soluble humic matter has the greatest potential to form soluble, stable metal complexes in competition with hydrolytic and other precipitating reactions. Solid humic matter in a fluvial system exhibits exceptionally strong cation exchange properties thus concentrating trace metals from solution onto a solid phase of a bed sediment.
The trace element distribution between sediment and natural water, and the chemical factors influencing this are of prime concern. The dominant interactions here are suggested to be cation hydrolysis, cation exchange
species formation involving both cations and anions. reactions and related adsorption-desorption processes, as well as complex
Of the organic species involved, humic acids, fulvic acids and humins are the most abundant. A major problem in studies on the nature of metal-complex speciation centres in the fact that all of the above compounds form part oE an extremely heterogeneous mixed polymer system where the differences between the sub-divisions are due to variations in elemental composition, acidity, degree of polymerization and range of molecular weights. Thus, humins comprise the highest molecular weight groups; highly polymerized and largely insoluble in aqueous solution. Humic acids are from the middle molecular size range, also very complex and, in part, soluble under certain conditions of acidity. Fulvic acids are likely the main transporters of metals in solution and comprise hydrophilic polyhydroxy aliphatic and aromatic acids. At the low molecular weight end of the range are the so-called yellow organic acids commonly observed in swamp waters or in stream waters of certain arid zones, particularly where considerable carbonate is present. These substances are probably also important in pore waters and interstitial waters of bed sediments representing as they do end members of humic matter degrad- ation. Micro-organisms are, in part, responsible for the decomposition of the higher weight organic acids (Kuznetsov, 1975) producing the smaller more soluble fragments. Micro-organisms are also important in mobilizing certain metals from sediments by means of very specific biochemical interactions. These have been well discussed in the literature and will not be discussed further here (Wong et&., 1975 for Pb; Chau et&., 1976 for Se; Wood, 1974, 1975 for Sn, Hg, A s and S e ) .
It should also be noted that humic and fulvic acids behave as negatively charged species in solution, due to the ionization of their acidic carboxyl and hydroxyl groups. Neutralization of this charge, perhaps by interacting metal ions, metal oxide colloids, or adsorption onto clay par- ticles can lead to flocculation of the colloids and subsequently further coprecipitation of metals. Mechanisms by which metallic ions from natural waters are absorbed or complexed by such organic matter, have been discussed extensively by many authors (e.g. Krauskopf, 1955; Schnitzer and Khan, 1972; Curtis, 1966). The attractive interactions of ions with soluble, colloidal or particulate organic material range from weak forces leaving the ion easily replaceable (physical adsorption) to strong forces indistinguishable from chemical bonds and often not replaceable (i.e., chemisorption, or specific adsorption).
The problems involved in studying metal-sediment-water interactions either in laboratory models or in the field are many. Several useful reaction schemes have been proposed as a basis for laboratory studies. That of Curtis (1966) is shown in Figure 1. According to Curtis' idealistic scheme, metal ions can show a positive correlation with organic carbon in a sediment when
256

metal-organic compounds or ions y adsorption of
metal-organic material onto clay particles
4* or M(H~o)~+ Y
( h e metal-C correlation)
no interaction (no element4 correlation)
x organic matter and element competing for clay particles
(-ve element - C correlation)
CP: clay particles
ORG: organic matter
Figure 1: Generalized metal-organic-solid reaction scheme as proposed by Curtis (1966).
251

metal ions interact in solution with dissolved organic matter that is in turn concentrated by adsorption onto particulates such as clay minerals. Zero correlations may result when there is no solution phase interaction and the dissolved organic matter alone adsorbs onto the particulates. If there is competition between metal ions and dissolved organics for adsorption sites, then negative carbon-metal correlations are the result. Ong and Bisque (1968) and Ong 4. (1970) have refined the Curtis scheme to consider colloids as possible transporting agents of metal ions (Figure 2 ) .
The ability of solid humic matter to physically and chemically adsorb metals from aqueous solution has been well documented. For example, Rashid (1974) investigated metal adsorption onto sedimentary and peat humic
brought into contact with humic acid; Cu was preferentially adsorbed. acids. A solution containing equal amounts of Co, Cu, Mn, Ni and Zn ions was
Leaching with various agents showed that Cu was held far more firmly than the other metals. From these and similar experiments described in the literature, it has proved possible to indicate a probable order of binding strength for a
number of metal ions onto humic or fulvic acids, e.g., UOn > Hg* > Cu* > Pb* > Zn* > Nift > Co*. Ca* is considered to bind as strongly as Pb .
Similar experiments by Rashid to adsorb base metals from seawater were not nearly so successful probably due to the very low contents of these metals in seawater and the dominating presence of alkali and alkaline earth cations, which although likely more weakly adsorbed are in much greater abundance when in competition for adsorption sites. This is an important parameter to be considered in all field studies of freshwater systems as well.
* ft
looked, nor should the fact that the order of metal-organic matter stabilities will vary somewhat according to the nature and complexity of the organics and to conditions such as acidity and redox potential.
The importance of relative binding strengths should not be over-
actions concerns the ability of soluble organic acids to chemically leach and even dissolve minerals. Thus particulates trapped in organic-rich sediments,
undergo a prolonged attack by sorbed fulvic or humic acids which can extract perhaps as a result of coprecipitation or surface adsorption, will slowly
a variety of elements including metals. For example Baker (1973) found that humic acids rapidly decompose sulphides such as chalcopyrite, chalcocite, sphalerite, galena or pyrite and silicates such as clays, micas or chlorite and also metal oxides such as pyrolusite or geothite; the last being an
dolomite and malachite are also vulnerable to dissolution by humic acids. On observation of some relevance to stream systems. The carbonates calcite,
the other hand, Sequi &. (1976) have reported that the alkali solubility of soil organic matter, common in stream sediments, is greatly dependent on the nature of metal ions present in the stream.
Another major function of organic matter in water-sediment inter-
sediments and water seem to be mutually destructive of all solid species. The ultimate result of the breakdown of a mineral or metal-sediment complex by organic acids must be to promote the remobilization of that metal ion until the adsorption, flocculation, polymerization, precipitation cycle takes it out of solution once again.
Therefore interactions among metal ions, minerals, organic

Organic acids (hydrophilic, negatively charged colloids)
Chemical Metal-organic aspect predominates (hydrophilic + M' + M+
complexes
colloids)
Metal-humates Physical (precipitates) aspect M+
(neutral colloids) *-. predominates
Metal-organic complexes (hydrophobic colloids)
Figure 2: Metal-organic interaction scheme as proposed by Ong etas. (1970).
259

Organic matter is also capable of acting as a reducing agent. In this way ferrous ion can be stabilized in oxygenated solution by complexation with certain organic acids (Theis and Singer, 1973) such as tannic or gallic, as well as by naturally occurring humic acid compounds (Rashid and Leonard,
1973). It is possible that other metal ions such as UO;? , or oxy-anions of no, V or As could also be stabilized in solution in a lower oxidation state when complexed by humic matter; but there does not yet appear to be general agreement on this (Bloomfield and Kelso, 1973). However, the solubilization of hydrous Fe and Mn oxides attributed to a reduction process following complexation by fulvic acids (Zajicek and Pojasek, 1976); (Koshy g &., 1967). The fate of metal ions whose dispersion in stream sediments is controlled by adsorption and desorption from Fe and Mn oxide surfaces is therefore strongly influenced by the operation of such reduction processes with humic matter.
ft
One very specific example of how metal mobilization can be directly effected by humic acid reduction concerns the production of Hgo from mercuric
(Hg ) ion (Alberts &. , 1974). By this means, Hg , which is normally
by other metal ions (Strohal and Huljev, 1970), is freed from its ligand upon considered to be very strongly bound to humic matter and not easily displaced
only. In this way it can easily pass back into solution from reducing sed- reduction to elemental Hg which in turn is held by weak absorptive forces
iment s .
-4-k +t
The influence of sulphide has not been considered to date. A number of authors have conducted laboratory tests to investigate competition between organic ligands and sulphide ion for dissolved metal ions. Timperley and Allan (1974) attempted to determine the forms of binding of Cu, Fe and Zn in organic-rich reducing muds. One of the main conclusions drawn was that Cu was held mainly by sulphide precipitation, whereas organic complexing was more important for Zn and Fe. Their work suggests that there may be some value in using the solubility data for simple metal sulphides as a basis for predicting metal-sediment interaction behaviour in such sediments. For example, Cd might behave like Zn but As and Hg might be largely fixed as sulphide or organic-sulphide complexes or adducts.
In this context, the work of Boulegue and Michard (1974) is relevant. They noted that inorganic sulphur is present in sediments as polymeric hydro- sulphides which are good complexing agents in their own right. They can also act as both redox and acidity buffers. Interactions between these and metal ions would be expected to be strong.
One of the major problems in studying water-sediment interactions relates to a dearth of information on the nature of metal-ligand speciation. However, some powerful analytical tools have come into use recently whereby metal ion speciation in natural waters can now be studied.
Anodic stripping voltametry (e.g. Zirino and Healy, 1972) can be used to demonstrate the importance of complexation reactions and perhaps to measure the apparent stability constants for strong complexes formed between metal ions dissolved in lake (Chau &., 1974) and river waters (Ramamoorthy and Kushner, 1975). But as Langford and Gamble (1974) have pointed out, this application is limited to relatively "non-labile" complexes with large organic ligands (e.g., fulvic acids). They suggest that a study of the kinetics of formation of such complex species would be informative in that kinetic
260

mechanisms of reaction can help to predict solution equilibria. Faster reactions involving the formation of kinetically more labile complexes could be studied by means of techniques such as stopped-flow spectroscopy.
By using anodic stripping voltammetry or pulse polarography or electrophoresis methods in combination with other experimental techniques, considerable data on elemental speciation could be gathered (Raspov &., 1975). Bilinski gal. (1976) have measured stability constants for some hydroxo- and carbonato-complexes of Pb (IT), Cu (II), Cd (II), and Zn (11); important species in most surficial waters and certainly in groundwaters. Benes and Steinnes (1974) have described in situ dialysis experiments which permit determination of truly dissolved and colloidal forms of trace elements in natural waters. The more such research which can be done on site, the better.
Field studies on the effects that interactions between trace metals and organic matter have on dispersion processes are not commonly encountered. Dc (:root (1971) and de Groot 1. (1971) have published extensive data on the Rhine River system. The Rhine has been subjected to industrial pollution and as a consequence, the reported Hg, Zn, Cr, Pb, Cu and A s levels of the fluvial sediments were high. But downstream from the freshwater tidal area, a pronounced remobilization of these elements into solution was observed. It was considered that the change in chemical conditions, e.g., oxygenation and increased salinity, prompted intensive decomposition of the sediment organic materials which were retaining these metals. From this de Groot concluded that the formation of soluble metal-organic complexes was mobilizing the pollutant metals from the sediments. It is interesting to observe in de GrooL's data that the order of remobilization oE the metals, Hg > Cu > Zn > Pb Cr > A s > Co > Fe, is roughly the reverse of the solubilities of simple sulphides. Therefore it seems likely that the greater complexing affinities of e . g . , Hg (IT) and Cu (11) towards soluble organic matter are more important kinetically than their sulphide solubilities. It has also been suggested that dilution by incoming sediments carried by ocean tides is partly responsible for the apparent mobilization effects. This may be true, but does not account for the observed sequence of elemental mobilization.
The release of heavy metals from river bottom sediments has been studied in the laboratory mainly with the use of radioisotopes. For example, Co-60 has been used in the Danube River (Radosavjevric &., 1973); Mn-54, 211-65, Sc-46, Co-60 and Hg-203 have been used in the Columbia River, (Lenaers, 1971; Bothner and Carpenter, 1973).
in stream systems is described by Jackson (1975). He designed model laboratory experiments over a pH range 4 to 9 to simulate interactions in the system: dissolved metal ion-clay -dissolved natural organic acids. The objective was to compare results with data from field studies within carefully selected stream systems. Interferences due to the presence of dissolved carbonate were also observed. The ability of soil-derived humic and fulvic acids to
precipitates, was investigated. Cu (11), Pb ( I I ) , Zn (11) and Ni (11) cations desorb metal previously adsorbed on clay and also metal from metal hydroxide
were chosen for study.
One of the more interesting studies of metal-sediment interactions
261

Results indicated that Cu was strongly stabilized in solution, but W , I S the most kinetically hindered in desorption reactions. Pb was least retained in solution by organic complexing but was effectively removed by inducing colloidal coagulation of organic matter. The solubilities of Zn and N i were enhanced by organic complexing but were found to be pH dependent with hydrolysis leading to decreased solubilities. Furthermore, Ni solubility was also dccreased by carbonate precipitation.
Jackson, (1975) also embarked upon a field study of selected streams in which similar processes were thought t o prevail. Predicted behaviour was compared with observed hehaviour. He found that the natural dispersion of Pb and Fe seemed to be favoured by organic complexing. Cu dispersion was strongly governed by sorption to organic-rich sediments. The hehaviour of Ni was strongly controlled by interference, reactions - viz., with carbonate and llydroxide at alkaline pH. The model reaction scheme was found to be inadequate
with solid organic phases included in the scheme. f o r Zn. .Jackson suggested that these laboratory experiments be continued
b) 1-nteractions Involving HydrousLetal Oxides
Fe and Mn oxides are certainly important species in organic systems but their role as direct adsorbers of metal ions is overshadowed by com- petition from the more reactive humic acids and organo-clays or obscured by coatings uf u ~ g d u i e matter. Moreover, these oxides are unstable in certain organic-rich sediments, particularly if at all reducing. However, in fluvial systems, such as those found in the Canadian sub-arctic or in alpine regions, the role of organic matter in water-sediment interactions is relatively unimportant compared with the influences of hydrous Fe and Mn oxides. The same situation may also be true of more rugged regions of the Canadian Shield.
oxides in fluvial systems (e.g., Perhac, 1 9 7 2 ; Crasselly and Hetenyi, 1 9 7 1 ) . Quite a number of studies have been made on the functions of these
The relevant chemistry of Mn , in aqueous solution has also been described (Handa, 1 9 6 9 ; Benes, 1 9 6 7 ) . For example it has been shown that the oxides
strongly adsorb i o n s such as Hg , (Lockwood and Chen, 1 9 7 3 ; 1 9 7 4 ) and Co*,
Ni* and Zn (McKenzie, 1 9 7 2 ) . The behaviour of Mn* in water and speciation between pH 2-8 has been documented by Angino &. ( 1 9 7 1 ) . Most common
species are Mn(@H):, ElnC!!; X I ! prcdomizantly, Mn(H20) g* ion. Micro-organisms
are capable of oxidizing Mn to Mn (IV) in natural waters (Schweisfurth, 1 9 7 2 ) .
ft
U
H
*
Sylva (1972) has summarized the hydrolysis chemistry of Fe (111)
The formation of polynuclear species of Fe and Mn oxides is likely a very along with its polymerization reactions in which colloids and sols are formed.
important process in the remobilization of Fe (11) and Mn (11) from reduced sediments. Such colloidal species are quite reactive towards trace metal i o n s .
fluvial systems some studies of arctic drainage by Cameron and co-workers (Cameron, 1974; Allan al., 1 9 7 4 ; Cameron and Ballantyne, 1 9 7 5 ) can be summarized.
To illustrate the dominant role Fe and Mn oxides can have in certain
262

N.W.T. r esembles , a t f i r s t s i g h t , a l ake sys t em r a the r t han f l uv ia l - type d r a i n a g e , However cha ins o f l akes a re connec ted by ove r f low s t r eams i n
Because of t h e v i r t u a l a b s e n c e o f d i s s o l v e d o r g a n i c m a t t e r i n waters and of s p r i n g a n d e a r l y summer dur ing which t i m e mos t meta l d i spers ion takes p laces .
c o l l o i d a l o r d i s p e r s e d s u s p e n s i o n s of humic ma te r i a l , t hese wa te r sheds can be regarded as i n o r g a n i c s y s t e m s i n w h i c h c h e m i c a l p r o c e s s e s f o l l o w p r e d i c t a b l e p a t h s d e s c r i b e d by pH, meta l ion hydro lys is and s imple complex ion format ion . For example, the s tgble forms of Cu i n t h e s e w a t e r s of n e a r - n e u t r a l pH a r e expec ted t o be CuOH , CuCO3' and [Cu(C03)~] - . I n f a c t , i n c e r t a i n l a k e s w h e r e Cu is qu i t e abundan t i n su r round ing rocks , t he ca rbona te ma lach i t e
nea r equ i l ib r ium wi th t h e s e p r e c i p i t a t e s when Cu, OH- and CO1- a re de te rmined p r e c i p i t a t e s o n t o t h e bed sediments. The water bodies a re found t o be i n
i n t h e l a k e w a t e r s . Under t h e same c o n d i t i o n s , Zn i s l i k e l y p r e s e n t i n t h e
The d ra inage i n t he ba r r en g rounds of t he Hacke t t R ive r a r ea o f t he
w a t e r s a s ZnOH and [Zn(H,O)6]* ions. +
Two wa te r sheds supp l i ed by metal ions f rom s imi la r bur ied vo lano- g e n i c Cu-Zn s u l p h i d e m i n e r a l i z a t i o n c a n be compared. The f i r s t s i t u a t i o n , at Hacket t River , N.W.T. demonst ra tes the degree of d i s p e r s i o n of Zn and Cu when waters n e a r t h e s o u r c e of t h e m e t a l i o n s r e t a i n a pH i n e x c e s s of 7 . This was found (Cameron and Ballantyne, 1975) to be due to the presence in the catchment of cons ide rab le exposures of carbonate-enr iched ( l imy) vo lcanic rocks . Inspec t ion of F igure 3 r e v e a l s t h a t d i s p e r s i o n of Zn f rom the Eas t C l e a v e r z o n e f a l l s o f f r a p i d l y o v e r a d i s t a n c e of about 6 m i l e s . Cu i s l o s t f r o m s o l u t i o n f a r more r a p i d l y , r e a c h i n g i t s n a t u r a l b a c k g r o u n d l e v e l s ( f o r t h i s r e g i o n ) of 1 ppb a f t e r a b o u t 3 miles d i spe r s ion . D i s so lved Fe o r Mn was g e n e r a l l y less than 5 ppb, even a t s o u r c e . The s e c o n d s i t u a t i o n , a t Agricola Lake, N.W.T. , is v i r t u a l l y i d e n t i c a l t o the Hacket t River water - shed excep t t ha t t he unde r ly ing vo lcan ic rocks are devoid of carbonate minera ls . The e f f e c t s on pH are immedia te ly apparent (F igure 4 ) a t s o u r c e , pH is commonly between 3 and 4 w i t h Fe reaching 800 ppb and Mn reaching 90 ppb. A s well d i s s o l v e d Zn f a l l s from about 1000 ppb t o a b o u t 2 ppb over 5 m i l e s . F i g u r e 4 a l so d i s p l a y s t h e c h a n g e i n pH down-drainage.
The work of Jenne, (1968) has shown t h a t t h e main c o n t r o l s on Cu and Zn d i s p e r s i o n r e l a t e t o t h e i r f i x a t i o n i n h y d r o u s Fe and Mn oxides
Mn w e r e i n i t i a l l y p r e s e n t a t very low l e v e l s i n t h e a l k a l i n e l a k e w a t e r s of c o a t i n g s or p r e c i p i t a t e s . Cameron and co-workers observed that when Fe and
the Hacket t River area nea r sou rce , due t o t he p re sence of l imy rocks r e s t r i c - t i n g m o b i l i t y o f t h o s e i o n s , t h e d i s p e r s i o n of s o l u b l e Zn and Cu through chains o f l a k e s w a s more ex tens ive . Th i s is a t t r i b u t e d t o t h e a b s e n c e of an oxide s c a v e n g e r c o p r e c i p i t a t i n g t r a c e metals down-drainage. Thus dispersion can b e s a i d to be enhanced i n sp i t e of t h e i n t i a l l y h i g h w a t e r pH.
By c o n t r a s t , i n t h e A g r i c o l a Lake watershed where there i s
accompanied i n t o s o l u t i o n by i n i t i a l l y h i g h d i s s o l v e d Fe and Mn. Rapid l i t t l e limy m a t e r i a l t o s u p p r e s s a c i d i t y , i n i t i a l l y h i g h Zn and Cu were
h y d r o l y s i s of t h e s e i o n s r e s u l t e d i n t h e c o p r e c i p i t a t i o n of Cu and Zn (and A s , F igu re 5 ) i n to l ake s ed imen t s as t h e pH i n c r e a s e d w i t h d i l u t i o n . T h e r e f o r e d i s p e r s i o n was found to be much more l i m i t e d t h a n i n t h e H a c k e t t R i v e r s i t u a t i o n i n s p i t e of t h e i n i t i a l l y h i g h c o n c e n t r a t i o n s o f Cu and Zn and the very low water pH. F igure 4 a l s o i n d i c a t e s t h a t Zn b e g i n s t o a p p e a r i n l a k e s e d i m e n t s when t h e pH exceeds 4 . 5 , about 2 miles down-drainage,
of Zn i s probably i n p a r t i c u l a t e form. i . e . , when Fe and Mn o x i d e s a r e fo rming a s suspens ions . Fu r the r t r anspor t
263

Figure 3. Distribution of zinc and copper in ppb, and pH in lake waters from the Hackett River area, N.W.T. ( a f t e r Cameron & Rallantvne. 1975)

265

- Zn (log pprnl ~n sedim
ents 0
N
0
N
1 I I
R

ORGANIC-INORGANIC INTERACTIONS
would have several predictable effects. Complexation of metal ions would inhibit hydrolysis of Fe and Mn, redissolve oxide precipitates, and restrict
buffer, therefore it is likely that high acidity as observed in the Agricola the coprecipitation of Cu and Zn. Humic matter is also an efficient acidity
Lake area would be suppressed at the source and much more localized. What is less predictable are the scavenging effects colloidal organic matter would have on free metal ions, complexed metal ions and on the interactions between all of these species and bottom sediments.
It is clear that the presence of organic matter in these systems
LITEXATURE CITED
Alberts, J . J . , Schindler, J. E . , Miller, R. W. and Nutter, D. E. , (1974), Elemental Mercury Evolution Mediated by Humic Acid. Science, 184, (4139), 879-898.
Allan, R. J . , Cameron, E. M., and Jonasson, I. R., (1974), Mercury and Arsenic Levels in Lake Sediments From the Canadian Shield. I n "Primero Congreso Internacional de Mercurio" Barcelona, Tom 11, Publ. (1975), Fab. Nac. Moneda y Timbre, Madrid, pp. 93-119.
Angino, E. E . , Hathways, L. R., Worman, T., (1971), Identification of Manganese in Water Solutions by Electron Spin Resonance, Adv. Chem. Ser., No. 106, 299-308.
Baker, W. E . , (1973), The Role of Humic Acids From Tasmanian Podzolic Soils in Mineral Degradation and Metal Mobilization, Geochem. Cosmochim. Acta, 21, 269-281.
Benes, P. and Steinnes, E., (1974), In Situ Dialysis for the Determination of the State of Trace Elements in Natural Waters, Water Research, 8, 947- 953.
Benes, P., (1967), On the State of Manganese and Gold Traces in Aqueous Solution, J . Inorg. Nucl. Chem., 29, 2889-2898.
Bilinski, H . Huston, R. and Stumm, W., (1976), Determination of the Stability Constants of Some Hydroxo and Carbonato Complexes of Pb (II), Cu (II), Cd (11) and Zn (11)
Differential Pulse Polarography, Analyt. Chim. Acta, $,(I), in Dilute Solutions by Anodic Stripping Voltammetry and
157.
Bloomfield, C., and Kelso, W. I.,
Plant Matter, J. Soil. Sci., g, 368-379. (1973), The Mobilization and Fixation of Mo, V and U by Decomposing
261

I k ~ t I ~ n ~ ~ r , F I . 1 1 . .mi (:,lrpentc-r, K., ( 1 ' ) 7 3 ) , Sc,rllt i o n - l l r ~ s o r p t i o n K e a r t i o n s of Mercury wi th Suspended b ln t t e r i n t lw Columbia Kiver . I t ad ioac t . Contam. Mar ine Envi ron . , l ' roc. S v m l ~ . , p p . 73-87.
l ~ o u l e p , t l e , J . , and Nichard, (:. , (19741, In tcxrac t ions Between Sulphur-Polysulphide Sys tem and O r g a n i c M a t e r i a l i n Reducing Media, C. R . Acad. S c i . , S e r . I). 279, ( l ) , 13-15.
U o w e n , 11. .I. M . , ( 1 9 6 6 ) , Trace E lements in Biochemis t ry , Academic Press , London.
HoyLt, , I<. I d . and . lonasson, 1. K . ,
E l e m e n t i n ( ; r o c h e m i c a 1 P r o s p e c t i n g , J . (;eochem. Exp lo r . , 1, ( 1 9 7 3 ) . The Geochemistry o f Arsen ic and i t s Use as a n I n d i c a t o r
251-296.
Cameron, E . M . , (1974) . Geochemical Methods of E x p l o r a t i o n f o r M a s s i v e S u l p h i d e M i n e r a l i z a t i o n i n t h e C a n a d i a n S h i e l d . I n " G e o c h e m i c a l I : xp lo ra t ion - 1974 , " P roc . 5 th In t . Geochem. Explor . Symp. , V a n c o u v e r , e d s . E l l i o t t , I . L. a n d F l e t c h e r , W. K . , Pub. 1975 . , 21-49.
Cameron, E . M . a n d B a l l a n t y n e , S . B . , (1975) , Exper imenta l Hydrogeochemica l Surveys of the High Lake a n d H a c k e t t R i v e r Areas, N o r t h w e s t T e r r i t o r i e s , G e o l . Su rv . Can . , Paper No. 75-29, 19 pp .
(:hau, Y . K., G a c h t e r , K . , and Lum Shue Chan, K . , ( 1 9 7 4 ) , D e t e r m i n a t i o n of the Apparen t Complex ing Capac i ty of Lake Wate r s , J . F i s h . Res. Rd., Canada, 3 1 , ( 9 ) , 1515-1519.
Chau, Y . K . , Wong, 1'. T. S . , S i l v e r b e r g , B . A . , Luxon, P. I,. , and Bengent , (:. A . , ( 1 9 7 6 ) , M e t h y l a t i o n of S e l e n i u m i n t h e A q u a t i c E n v i r o n m e n t , S c i e n c e , 1 9 2 , (4244), 1130-1131.
C u r t i s , C . [ I . , ( 1 9 6 6 ) , The I n c o r p o r a t i o n of S o l u b l e O r g a n i c Matter i n t o S e d i m e n t s and i t s E f f e c t on Trace E lemen t Assemblages . l n "Advances
I'ergamon P r e s s , O x f o r d , p p . 1-13. in Organic Geochemis t ry" , eds . Hobson, G . D. a n d L o u i s , M. C . ,
( : r o s s e l l y , Cy. and He teny i , M . , (197L), The Kole of M a n g a n e s e M i n e r a l s i n t h e M i g r a t i o n of E lemen t s , S O C . Mining Geo l . J apan , Spec . I s sue 3 , pp. 474-477.
G r o o t , A . J . de, (1971) . Occurrence and Behaviour of Heavy Metals i n K i v e r Deltas w i t h S p e c i a l R e f e r e n c e t o t h e R h i n e a n d Ems R i v e r s . I n P r o c . NATO Nor th Sea Conf . , Aviemore , Scot land , ed . Goldberg , E. C., p p . 308-325.
268

Groot, A. J . de, Goeij, J. J . M. de and Zegers, C., ( 1 9 7 1 ) , Contents and Behaviour of Mercury as Compared With Other Heavy Metals in Sediments from the Rivers Rhine and Ems., Geol. Mijnbouw, 50, 393-398.
Handa, B. K. , ( 1 9 6 9 ) , Chemistry of Manganese in Natural Waters, Chem. Geol., - 5, 161-165.
Jackson, K. S., ( 1 9 7 5 ) , Geochemical Dispersion of Elements Via Organic Complexing, Unpubl. Thesis, Carleton Univ., Ottawa, Canada, 344 pp.
Jenne, E. A.,
Soils and Waters: The Significant Role of Hydrous Fe and Mn ( 1 9 6 8 ) , Controls on Mn, Fe, Co, Ni, Cu and Zn Concentrations in
Oxides. In “Trace Inorganics in Water”, Adv. Chem. Ser., No. 7 3 . , Amer. Chem. Soc., 337-387.
Koshy, E., Desai, M. V. M. and Ganguly, A. K., ( 1 9 6 7 ) , Studies on Organo-Metallic Interactions in the Marine
Dissolved Organic Substances in Seawater, Curr. Sci., 2, Environment. I. Interaction of Some Metallic Ions with
555.
Krauskopf, K. B.,
50th Anniv. Vol., 411-463. ( 1 9 5 5 ) , Sedimentary Deposits of Rare Metals, Econ. Geol.,
Kusnetsov, S. I.,
Deposits and Their Diagenesis, Soil Sci., =(I), 81-88. ( 1 9 7 5 ) , Role of Micro-Organisms in the Formation of Lake Bottom
Langford, C. H. and Gamble, D. S., ( 1 9 7 4 ) , Dynamics of Interaction of Cations and Fulvic Acids, Proc.
systems, Publ. 1 9 7 4 N.R.C. Ottawa, 11, 37-39. Int. Conf. Transport of Persistent Chemicals in Aquatic Eco-
Lenaers, W. M., ( 1 9 7 1 ) , Photochemical Degradation of Sediment Organic Matter. Effect on Zn-65 release. Report (1971) RLO-2227-T-12-32 64 pp. Nucl. Sci. Abstr., %,(20), ( 1 9 7 2 ) , No. 48038.
Lockwood, R. A. and Chen, K. Y.,
Environ. Sci., Technol., 1, (IT), 1028-1034. ( 1 9 7 3 ) , Adsorption of Hg (11) by Hydrous Manganese Oxides,
Lockwood, R. A., and Chen, K. Y., ( 1 9 7 4 ) , Adsorption of Hg (11) by Ferric Hydroxide, Environ. Letts., 4, (3 ) , 151-166 .
McKenzie, R. M., ( 1 9 7 2 ) , Sorption of Some Heavy Metals by the Lower Oxides of Manganese, Geoderma, g,(l), 29-35.
Ong, H. L. and Bisque, R. E.,
106, 220-224. ( 1 9 6 8 ) , Coagulation of Humic Colloids by Metal Ions, Soil. Sci.,
269

Ong, f l . L., Swanson, V. E . , and Bisque, R. E., (.L970), Natural Organic Acids as Agents of Chemical Weathering, U.S. Geol. Surv., Prof. Paper 700-C, pp. 130-137.
Perhac, R. M., (19721, Distribution of Cd, Co, Cu, Fe, Mn, Ni, Pb and Zn in Dissolved and Particulate Solids From Two Streams in Tennessee, . I . Hydrol., 15, 177-186.
Pitwell, I,. R., (1973), Some Coordination Effects in Orebody Formation, Chrm. Geol . , 1 2 , 39-49.
Radosavl.jevic, R., Tasovac, T., Draskovic, R., Zaric, M. and Markovic, V . (1973), Complex Behaviour of Cobalt in the Danube River, Arch. Hydrobiol., S u p p l . , 4 3 , ( 2 ) , 241-248.
Knmamoc~rthy, S. and Kushner, I). . J . , (19751, Heavy Metal Binding Sites in River Water, Nature, (London), 255, (5516), 399-401.
kashld, M. A. and Leonard, J. D., (19731, Modifications of the Solubility and Precipitation Behaviour of Various Metals as a Result of Their Interactions With Sedimentary Humic Acid., Chem. Geol., l l , 89-97.
Rashid, M. A.,
Chem. Geol., 12, 115-123. (1974), Adsorption of Metals on Sedimentary and Peat Humic Acids,
Raspov, B., Valenta, P. and Nurnberg, H. W., (1975), The Formation of Cd(I1) - NTA Complex in Seawater, Int., Conf., Heavy Metals in the Environment, Toronto (1975), Abstr. NO. D-5.
Saxby, J. D., (1969), Metal-Organic Chemistry of the Geochemical Cycle, Rev. Pure. Appl. Cilrlu., &, i31-150.
Saxby, . J . D., (1973), Diagenesis of Metal-Organic Complexes in Sediments: Formation of Metal Sulphides From Cysteine Complexes, Chem. Geol . , 12, 241-288.
Schnitzer, M. and Khan, S. U., (1972), Humic Substances in the Environment, Marcel Dekker Inc., New York, N.Y.
Schweisfurth, R.,
Supply Sytems, Gas - Wasserfach, Wasser - Abwasser, u,(l2), (1972), Manganese Oxidizing Micro-Organisms in Drinking Water
562-572.
Sequi, P . , Guidi, C. and Petruzzelli, G., (1976), Influence of Metals on Solubility of Soil Organic Matter, (koderma, 12, (3), 153-162.
2 70

S t r o h a l , P. a n d H u l j e v , D . , ( 1 9 7 0 ) , M e r c u r y P o l l u t a n t I n t e r a c t i o n W i t h Humic Acids b y Means o f R a d i o i s o t o p e s , N u c l . T e c h n i q u e s E n v i r o n . P o l l u t . , P roc . Symp., I'ubl. I . A . E . A . Vienna, (1971) , 439-446.
S y l v a , K . N . ,
2 2 , 115-132. (1972) , The Hydro lys i s of I r o n (III), Rev. Pure. and Appl . (:hem.,
~~
'Theis , T . L. and S i n g e r , P. C . , ( 1 9 7 3 ) . T h e S t a b i l i z a t i o n o f F e r r o u s Lon by Organic Cornpomds i n N a t u r a l W a t e r s . I n "Trace Me ta l s and Meta l -Organic 1n tcrac : t ions i n N a t u r a l WaLers" , ed . S inger , P . C . , Ann A r b o r P u b l . , Inc., Mich. , 703-320.
Timp<.r ley, M . l t . a n d A l l a n , K . . I . , (1Y74), T l u ~ Formation and D e t e c t i o n o f M e t a l D i s p e r s i o n H a l o e s i n O r g a n i c 1,;ike Sed imen t s , .J. (:c.ocl~em. E x p l o r . , 1, 167-190.
Wong, 1'. T . S . , Chau, Y . K . , and Luxon, P. I,. , ( 1 9 i 5 ) , M e t h y l a t i o n of Lead i n t h e E n v i r o n m e n t , N a t u r e , (London), Z-3, (5489) . 263.
Woud, . J . M . , (1974) . B io log ica l Cyc le s fo r Tox ic E lemen t s i n t he Env i ronmt 'n t , S r i e n c e , 1-X'. (4129), 1049-1051.
Wood, 1. M . , ( 1 9 7 5 ) , M e t d h o l i c C y c l e s f o r Toxic. E l tmcnts , I'roc. I n L . , ( :onf . , l ieavy Metals in the I :nvironmc,nt , ' loronto (1Y75). A h s L r . N o . A - 5 .
Za j i c e h , 0. 1'. and P o j a s e k , K. R . ,
I<c,sour . Res. , XL, ( 2 ) . 305-308. ( 1 9 7 h ) , F u l v i c Acid and A q u a t i r Manganest, 'Trdnsport, W J L L , I
Zirino, A . and R e a l y , M . I . . , (1972) , pi1 C o n t r o l l e d D i f f e r e n t i a l V o l t a m m e t r y o f (: t ,rL.l ln Iracc ' i r n n s i t i o n E l e m e n t s i n N a t u r a l W a t c r s , E n v i r o n . S c i . ' l < ~ c ~ l 1 1 1 0 1 . , h, ( 3 ) , 243-249.
271


EidDVEi 8 IMPLICATIONS FOR THE MEAT MKES


J . R. Vullentyne
INTRODUCTION
Here are the three questions posed by the Governments of the United
Pollution from Land Use Activities: States and Canada to the International Joint Commission in the Reference on
( 1 ) Are the boundary waters of the Great Lakes System being polluted by land drainage (including ground and surface runoff and sediments) from agriculture, forestry, urban and industr ial land development, recrcational and park land development, u t i l i t y and transportation systems and natural sources?
( 2 1 I f the answer to the foregoing question i s i n the affirm- a t ive , to what extent , bll what causes, and in what Ldcalit ies is the pollution taking place?
( 3 ) I f the Comission should find that pollution of the character just referred t o i s taking place, what remedial measures would, i n i t s judgement, be most practicable and w h a t would be the probable cost thereof?
Dr. D. R. Bouldin commented this morning that if this Workshop, which has been arranged to help answer these questions, had been held three years ago when PLUARG was just beginning its work, there would have been nothing to talk about: the relevant information was not on hand. 1 think he is right. But even with the new data, talents and personalities that have been brought to bear on the problem within PLUARG and in this Workshop, the issues still remain complex and resistant to quantitative interpretation.
the defendability of proposed remedial measures requested in Question 3 of the Reference. If a remedial measure is not defendable it will not be accepted by the Commission, by the two Governments, or by the affected people and organizations in the two countries. The most important component of any strategy for action is therefore a strategy for defence. For this reason,
be the reverse of the order in which they were posed. the order of attention given by PLUARG is answering the three questions should
This complexity worries me. I see it as a persistent threat to
From information presented at this Workshop it is apparent that the most important factors contributing t o the complexity of the problems are:
(1) the virtual impossibility of tracing the sources and ultimate fates of pollutants once they have entered into stream transport;
275

( 2 ) t h e v a r i e t y and l a r g e number of independent sources r e q u i r i n g s e p a r a t e c o n t r o l ;
(3) t h e v a r i a b i l i t y of c l i m a t i c f a c t o r s a f f e c t i n g l a n d r u n o f f , t h e i r low f r e q u e n c y a n d u n p r e d i c t a b i l i t y i n time;
( 4 ) l o c a l v a r i a t i o n s of s o i l and t opograph ic f ac to r s a f f ec t ing runoff ;
(5 ) p e r s i s t e n t q u e s t i o n s c o n c e r n i n g t h e a v a i l a b i l i t y t o p l a n t s , or t o x i c i t y i n t h e e n v i r o n m e n t of c h e m i c a l s i n d i f f e r e n t phases or forms.
I t w i l l no t he easy for PIJJARG, f o r t h e Commission o r f o r r e g u l a t o r y a g e n c i e s i n Canada and the Uni ted S ta tes to formula te and defend remedia l m e a s u r e s p e r h i n i n g t o a l a r g e number of c o n t r o l p o i n t s whose e f f e c t s a r e not ea s i ly t r aceab le t o boundary wa te r s . Because of t h i s c o m p l e x i t y i t w i l l he impnrtant t o s t r e s s two a s p e c t s of d e f e n s i v e s t r a t e g y i n t h e t e c h n i c a l r e p o r t L O t h e Commission.
I , ACCENT TE LONG TERM
As t he t ime base l eng thens t he ra te of d e l i v e r y of p e r s i s t e n t p o l l u t a n t s t o b o u n d a r y w a t e r s i n c r e a s e s . Al.so, i t mus t he s t r e s sed t o t he Commission t h a t p o l l u t i o n of boundary waters a r i s i n g from Land u s e a c t i v i t i e s
need l o r c h a n g e s i n human a t t i t u d e s a n d h e h a v i o u r a l p r a c t i c e s i n r e g a r d t o i s not go ing t o be so lved o r even quan t i t a t ive ly unde r s tood ove rn igh t . The
l a n d u s e a c t i v i t i e s s u g g e s t s t h a t i t may be o p t i m i s t i c t o t h i n k i n terms of E t f r c t i n g s o l u t i o n s i n less than a g e n e r a t i o n ' s time. I hope tha t PLIIARG w i l l mnkc r e f e r e n c e t o t h e n e e d f o r c o n t r o l i i n g t h e r a t e of growth of human pop- u l a t i o n and technology in the Great Lakes i3asin; it i s a l r e a d y c o n t r o l l i n g us, as i n d i v i d u a l s , t o an e x t e n t w e do n o t r e a l i z e . I b e l i e v e t h a t t h e Commission, t h e two governments and the people and o rgan iza t ions i nvo lved wi1.l unde r s t and t he accen t on Lhe long t e r m i f i t is p rope r ly p re sen ted . Hut t h i s accen t shou ld no t he u sed a s an e x c u s e f o r i n a c t i o n o r d e l a y .
t h e l e s s , a quote from E . Machel l -Cox ' s t rans la t ion of Sun Tzu ' s , "The P r i n c i p l e s of War," w r i t t e n 2300 yea r s ago , is n o t o u t of p l a c e :
War is not an appropr i a t e ana logy i n t he p re sen t con tex t ; neve r -
"Once h o s t i l i t i e s h a v e b e g u n , i f v i c t o r y h e l o n g d e f e r r e d , weapons will grow blunt and ardour dampened; i f the army a t t a c k a c i t y , i t w i l l exhaus t i t s s t r e n g t h ; i f i t he !ong i n t h e f i e l d , s ta te s u p p l i e s w i l l b e i n s u f f i c i e n t . Now, when weapons are blunted, ardour dampened, s t rength exhausted and t r e a s u r e g o n e , t h e o t h e r p r i n c e s w i l l rise and take advantage of your extremity and, though you were a very Sage, you s h o u l d no t then remedy the consequences . So i t i s t h a t
IicBvc'r liear t l la t l ong campaigns are c l eve r . The re has neve r chough you s h a l l h e a r of s t u p i d h a s t e i n war y e t you s h a l l
x ' c ' t heen a c o u n t r y t h a t h a s b e n r € i t e d b y a long war."
276

11. AVOID GENERALITIES 1 . 1 ~ ~ THE PLAGUE: Do NOT TRY TO SOLVE EVERYTHING AT b C E
waters than o thers ; for example , those in c lose p roximi ty to boundary waters . Ce r t a in l and use a c t i v i t i e s are more l i k e l y tc, a f fec t boundary
Because o f t h e i r s m a l l s i z e , l a r g e s u r f a c e a r e a and charge, f ine-grained p a r t i c l e s a r e l i k e l y t o be more i m p o r t a n t t h a t c o a r s e - g r a i n e d p a r t i c l e s i n t r a n s p o r t i n g p o l l u t a n t s from d i s t a n t s i t e s to boundary waters . S teep s lopes a r e l i k e l y t o b e more s u s c e p t i b l e t o e r o s i o n t h a n f l a t l a n d w i t h p o r o u s s o i l s . L e t t h e r e bt- an he i r a rchy of p r i o r i t i e s i n s p a c e and time. Over- g e n e r a l i z a t i o n w i l l o n l y a n t a g o n i z e t h o s e whose c a s e s d o n o t e a s i l y f i t i n t o the genera l scheme; and the loss of t h e i r suppor t w i l l on ly weaken the cause . I n t h i s c o n t e x t i t is worth re-emphasizing the importance of a d e f e n s i v e s t r a t e g y t o PLUARG wi th another quote f rom E . Machel l -Cox ' s t rans la t ion of Sun Tzu ' s , "The P r i n c i p l e s of War."
" J u s t a s i t i s no g r e a t s i g n of s t r e n g t h t o l i f t a n autumn h a i r , of k e e n s i g h t t o see the sun and moon, o r of sha rp hea r ing t o hea r t hunde r , s o i f t h e b a s i s of your v i c t o r y i s appa ren t and w i th in t he unde r s t and ing o f t he common h e r d , i t is n o t of t h e h i g h e s t e x c e l l e n c e ; n o r i s i t o f t he h i g h e s t e x c e l l e n c e i f you win a p i t c h e d b a t t l e a n d a l l t h e w o r l d c r y "Ha!" What t h e a n c i e n t s c a l l e d a c l e v e r f i g h t e r was a man who won, and won e a s y v i c t o r i e s , w h i c h b r o u g h t n e i t h e r a name f o r wisdom n o r c r e d i t f o r c o u r a g e . His v i c t o r i e s came of making no mistakes; by making no mistakes he had ensured v i c t o r y , and needed but t o d e f e a t a n enemy already overcome. l h e s k i l l f u l w a r r i o r is one who p u t s h i m s e l f i n a p o s i t i o n s u c h t h a t he cannot he defeated, and does n o t t h e n l o s e t h e o c c a s i o n o f d e f e a t i n g t h e enemy. The v i c t o r i o u s army f i r s t s e c u r e s i t s v i c t o r y a n d t h e n g i v e s b a t t l e ; t h e v a n q u i s h e d f i r s t e n g a g e s and then s e e k s t o s e c u r c v i c t o r y . "
!7 1


G. H . Dury
INTRODUCTION
It would be redundant for me to attempt to summarize, or to review,
supplied with abstracts and with papers, have listened to the papers presented the Workshop contributions on physical processes. Those attending have been
and to the question-and-answer sessions, have laboured with the various work groups, and have contributed to the recommendations which the work groups will be making. Readers of the final document will be presented with extended abstracts of papers, and with the recommendations that emerge from the Workshop
elsewhere, I propose in these comments to sound certain general themes, to as a whole. Rather than attempting to review, or to repeat, what is said
draw attention to some possible dangers and difficulties in attempting to suggest a possible means of economizing on environmental monitoring, and to
forecast for the future.
W~RKSKIP ACTIVITIES AND ATTITUDES
Like any good conference, this Workshop has led to the informal exchange of knowledge and acquaintance. It has also led to, or at least dis- closed the possibilities of, the interfacing of programs-- programs of re- search, management, and regulation.
It has also revealed a broad range of viewpoints, particularly perhaps among those interested mainly in physical processes. A t the one extreme comes the urgent need for practical action, in containing, reducing, or even eliminating the discharge of sediments, nutrients, and contaminants into the Great Lakes. A t the other extreme comes the desire for long term basic research, especially research into processes of erosion, transportation, and discharge or sedimentation. The two corresponding extreme attitudes are that of eliminating process studies altogether, in favour of implementing immediate control measures, and that of considering control impossible, until sources of input are identified and the processes of input are completely understood.
Somewhat related matters are the high variability of observational data, and the difficulty of extrapolating to large natural basins the results obtained from small basins or from trial plots. Although it may very well prove necessary to do whatever is possible with the data already available, divergent views on what actually is possible were reflected at the Workshop in differing opinions on the potential of computer modelling. On the one hand, soil loss equations can be run through a number of existing computer programs. On the other hand, some researchers consider that the results predicted by computer need careful reappraisal against what happens in the real world. In addition, prediction of soil loss, however accurate, may by no means foretell what actually will be moved out cf the basin.
279

BAS I 14 STORAG~
'I'ht, rrsidcBnce t i n w Cor n u t r i e n t s and contaminants seems t o he rr~~,isorl,~lllv wc.1 I ~ 1 1 ~ 1 1 c ~ r s t 1 1 m 1 , i n tc3rms o f wa te r c l l emis t ry , so i l r l l emis t ry , I I ~ ( J ( l l c , n l i s t r v , .lnd til<' half-Iivcxs o f ciegradablc. stthst.Inces. Ln a d d i t i o n , ~ ' ~ l ~ ~ s i ~ l ~ ~ ~ - ~ ~ i ~ l ~ ~ pl-ogress can l i t , c .1;l imc.d i n t h e s t u d y of t h e t r a n s p o r t a t i o n o f ~ 4 1 t w i v . I I s . ~ c . t ~ ~ . ~ l l y ; ~ t f a c h r d t o s r d i r n c n t i n t r a n s i t . Hy r o n t r a s t , v e r y l i t t l e i q kncrwtl <Illout t l l c residencca tirnc, i n s t o r a g c o f s ed imen t de l ive red t o head- : ; f r t , m ~ s , hut r111t d i schargcd a t the b a s i n mouth . S t reams dra in ing bas ins o f q i ~ i t ~ ' mo<\cr,ltc, s i z e may dc.1ivc.r a t their m o u t h s as l i t t l c , as t e n per cen t o f t l ic ' , 7 r ' d i m t m f f o d iutu the 1wadw;lters. The u n d e l i v e r e d f r a c t i o n g o e s i n t o htorllj:c' sornt~wllt~rr i n t h e h s i n , presumably in l a r g e p a r t a s f l o o d p l a i n ,11111vitm.
'l'Ilc.rc, a p p e a r s t o hv .In u rgen t need , no t on ly fo r t he s tudy of s t o r , t ~ < ~ o f s c ~ i i m c n t , hut , ~ l s o o f t h c s t o r a g e o f s e d i m e n t - a s s o r i a t e d n u t r i e n t s and < . u n t . l m i n a n t s . L i t t l e o r t l o t h i n g s e e m s t o b e known of t he d i s t ance t h rough w l t i < , l l t l ~ c s e m d f ( , r i a l s can be c a r r i e d , i n t i m e o f f l o o d , away from the s t r e a m I~II,IIIIIC~I, o f t h e i r c o n c e n t r a t i o n i n f l o o d p l a i n d e p o s i t s , o r o f L h c i r r e l e a s e Frr~m s toragt . i f c ros ion supe rcedes depos i t i on .
i n 1IIc clc~wnstrram p a r t of a bas in , t hen e ros ion con t ro l i n t he headwa te r s I i <,,dinient a n d . lssociated mater ia l s he thought o f as s to red ma in ly
(cottld promote d ra in ing o i the s t o r a g e r e s c r v o i r s . B e f o r e c o n t r o l , e r o s i o n in t i l e l lcndwaters suppl ies ahund; lnt sediment which tends to choke the lower v.tllr 'ys. ( : o n t r o l , by c u t t i n g o f I the sediment supply, could be expec ted t o r v v e r s e the response--that i s , t o p e r m i t the downstream reaches to switch from rlc~pusit ion to c r o s i o n , ;Ind t h u s t o begin the removal of t h e s t o r e d s e d imcnt .
sedimrnts ( p l u s n u t r i e n t s a n d con taminan t s ) a r e put i n t o J f l u v i a l s y s t e m , and t h e s i t u a t i o n w h e r e t h e y a r e p a r t l y d i s r h a r g e d t h r o u g h t h e b a s i n mouth-- i n t h i s c o n t e x t , i n t o the ( ; r e a t Lakes . This knowledge gap i s p r o b a b l y t h e wides t of a n y of t h o s e i d e n t i f i e d at t h e Workshop. The f a c t t h a t o n l y a small f r a c t i o n o f t h e i n p u t becomes o u t p u t a t t h e mouth s u g g e s t s t h a t the m a i n m o n i t o r i n g e f f o r t , i n thca f i r s t i n s t a n c e , s h o u l d b e d i r e c t e d t o f i n d i n g ou t wha t ac tua l ly i s d ischarged .
'Tht~re i s i n any c i ~ : i c > gap of knowledge between t h e s i t u a t i o n w h e r e
POSSIBLE USE OF SURROGATE OBSERVATIONS
S e v e r a l c o n t r i b u t o r s r e f e r r e d to d i f f i c x l t i e s of s t ream sampl ing , in t e rms bo th of s ampl ing e r ro r s and of sampling techniques. Sampling error c o u l d presumably be reduced by a n i n c r e a s e d i n t e n s i t y of observa t ion , and by improved t e c h n i q u e s , p a r t i c u l a r l y those of sampling bedload. However, con- t i nuous mon i to r ing by means o f hour ly o r even once -da i ly obse rva t ions appea r s out of the q u e s t i o n , o n l o g i s t i c a l g r o u n d s . S i m i l a r l y , c o n t i n u o u s m o n i t o r i n g
would p rove inord ina te ly expens ive for any really s a t i s f a c t o r y n e t w o r k o f by machines , a l though in somr ways more p rac t i cab le t han mon i to r ing by humans,
s t a t i o n s .

For instance, it can readily be shown that, for the Hurricane Agnes floods in New York and Pennsylvania in 1972, the total delivery of water and the total delivery of suspended sediment in a given flood wave can be expressed as a power function of momentary peak discharge (Dury, in press). This statement holds, through a range of recurrence intervals from less than 2 to more than 100 years (annual series), and through a range of drainage areas from less than 1.0 to 16,700 km’. Nearly 97 percent of variation in delivery of sus- pended sediment is statistically explained by variation in momentary peak discharge. This latter variable, once a rating curve has been established, r a n be simply and cheaply recorded by a crest-stage gauge. Once a sediment rating curve has been established, momentary peak f lows of water can be used to give sediment discharge. Methods of this kind are especially attractive,
few days of high flow. since many rivers discharge a very large fraction of total sediment in only a
A possible means of economy resides in surrogate observations.
Sundry contributions to the Workshop suggest that, for some streams at least, discharge of certain nutrients and contaminants can be expressed as
and pesticides were specifically mentioned. Wherever a firm relationship can funrtions of discharge of suspended sediment. Phosphorus, nitrogen, carbon,
be established between discharge of nutrients/contaminants and discharge of suspended sediment, and another between discharge of suspended sediment and discharge of water, then the peak flow/flood wave relationship can be used to measure total delivery in a particular event of sediment, nutrients, and contaminants.
SPAT I AL VARIATION
Just as response to sediment input can differ from one part of a basin to another (*, between upstream and downstream reaches, so variation is to be expected between one basin and another, and between one region and another. If surrogate methods of monitoring are t o be developed for the Great 1.akes r i v e r s , possible regional variation needs to he investigated. I f such variation dues occur, then sample streams for the individual regions could be observed, as against observing all streams throughout the system.
variable. Pilot studies in regional and inter-basin variation would seem to Basin size is likely to prove an additional, and perhaps an influential,
offer useful possibilities.
PREDICTION FOR THE FUTURE
have been impossible three years ago--the implication being that, in the last three years, we have already come a very long way in assembling the data necessary for the tasks in hand. The comment is highly gratifying. A t the same time, a three-year series of Observations is impossibly short for most purposes of prediction.
One attendee remarked that a meeting such as this Workshop would
281

:I 1
W I I i
I t is a x i o m a t i c , t h a t , f o r m a g n i t u d e - f r e q u e n c y a n a l y s i s of s t r e a m f l o w , - e t o r d nc3eds t u he twice as l ong as t h e g r e a t e s t r e c u r r e n c e i n t e r v a l f o r
c.11 c o n f i d e n t p t - e d i r l i o n tan be under taken . Thus , a 100-yea r r eco rd i s nredcvl f o r t h e c o n l i d r n t p r d i c t i o n o f t h e 5 0 - y e a r e v e n t . I n p r a c t i c e , t , ven t s o f g r e a t m . ~ g n i t u d c m d low f requency may have t o b e p r e d i c t e d f r o m short rc'ror(l s c r i c . s , i n wh ich case c o n f i d e n c e limits s h o u l d b e s t a t e d .
~ C , L > ~ I S i n c ~ v i t . r l , l t ~ t i l a t m ~ ~ g n i t u d t ~ - f r c l q u e n c y a n a l y s i s w i l l a p p e a r i n c r e a s i n g l y ,As <, l~stxt-vat ion sc , r ic ,s in tlle (:reat L a k e s a r e a become e x t e n d e d , i t
. ~ t t 1r.1c.t i v t l . tiowt,ver, nlucll r e c e n t a n d t u r r e n t work has t ended t o r evea l ~ l i ~ ~ ' ~ ~ ~ l t i ~ ~ ~ ~ i t i ~ ~ s - - ~ ~ ~ m ~ ~ ~ ~ r ~ ~ l s t ep f i l n r t i i 1ns - - in :i wl1olc r a n g e o r p l l e n m r n a , inc l i lc l ing those o f r l i r n a t e , w e a t h e r , a n d s t r e a m f l o w . It i s , f o r i n s t o n c e , c ~ . n t i ~ - e l v p ~ ' s s i i 1 1 c ~ f o r a n a b r u p t s h i f t t o o c c u r i n t h e a r c a / i n t e n s i t y / d u r a t i o r l 1re1.1t ions i l i p s u f dominan t s to rms , a n d c o n s e q u e n t l y i n t h e i n p u t of sed imen t t o a g i v c r l f l u v i a l s y s t e m .
e v e n t o t v e r y g r e a t m a g n i t u d e c a n r e a s o n a b l y b e i d e n t i f i e d f r o m a s h o r t r r c o r d , i t may p r o v e i m p o s s i b l e t o i d e n t i f y t h r e s h o l d s - - s u c h , f o r e x a m p l e , as t h e t h r e s h o l d w h e r e s e v e r e r h a n n c l e r o s i o n is s u d d e n l y i n i t i a t e d , a n d w h e r e t h c , i n p u t o f s ed imen t i n t o t h e f l o w i n g w a t e r i s s u d d e n l y i n c r e a s e d . A c a s e in point is tha t of the Eng l i sh r i vc ' r Nene , wh ich i n 1947 expe r i enced i i f l o o d belonging somewhere between 500 and 1000 years on t h e a n n u a l series (Dury, 1 9 7 4 ) . 'l'llis t l o o d , h o w e v e r , f a i l e d t o p r o d u c e s i g n i f i c a n t e f C e c t s , e i t h e r i n t h e c h a n n c l o r o n the f l o o d p l a i n . O t h e r r i v e r s a r e known t o r e s p o n d d r a s t i c - a l l y t o f l o o d s of much lower magn i tude ( compara t ive ly speak ing) and of much g r e a t e r f r e q u e n c y . D e s p i t e t h e o b v i o u s d i f f i c u l t i e s , the i d e n t i f i c a t i o n of t h r e s h o l d s o f b e h a v i o u r on t h e p a r t o f stream c h a n n e l s - - a n d , € o r t h a t matter, o f f a r m l . l n d s o i l s - - i s c r u c i a l t o t h e p r e d i c t i o n a n d c o n t r o l o f s e d i m e n t i n p u t . Once a g a i n , p i l o t s t u d i e s a n d r e g i o n a l a s s e s s m e n t a r e i n o r d e r .
1,:ven when ve ry long recor-ds e x i s t , o r when the f r equency o f an
1. G. H. Dury, i n p r e s s : Peak F l o w s , Low Flows, and Aspects o f (:eomorphic Dominance. Expected to a p p e a r i n " R i v e r Channel Clranges"(ed. K . .I. G r e g o r y ) : W i l e y , f o r t h e Br i t i sh Geomorpho log ica l Resea rch Group .
2 . (:. H . Dury , (1974) : Magni tude Frequency Analys is and Channel Murphomrtry : i n "Fluvial Geomorphology", (ed. M. Morisawa), S t a t e U n i v e r s i t y o f New Y o r k P u b l i c a t i o n s i n G e o m o r p h o l o g y , 9 1-121.
2 x 2

EIiFVEB 4 CONCLUSIONS AND RECOMMENDATIONS
FROM THE WORK GROUPS RESEARCH NEEUS


RECMNDATIONS OF THE WORK GR~UPS
The work groups established at the workshop were held in four concurrent sessions. Three groups were each assigned a pollutant related to the sources and transport of sediment (nutrients, metals and pesticides). One group dealt with the physical processes involved in sediment generation and transport. It was made clear to eac.h group that they were to consider PLUARG's present programme of sediment collection and analysis and make any recommendations for changes in sampling and/or analysis. Additionally
grammes and the research needed in the long term t o help answer some of the the groups were to consider the potential impact of ongoing research pro-
questions posed during the plenary sessions.
lap in the discussions. It would be difficult, for example, to discuss the relationship of pesticides to sediment without also discussing the physical processes involved in sediment production and movement. Where recommendations from work groups have overlapped, they have been edited and combined with general recommendations for research needs.
By the very nature of the work groups there was considerable over-
work group chairmen and are not verbatim accounts of the discussion held. The recommendations expressed here have been summarized by the
PHYSICAL PROCESSES
of nutrients and contaminants although it is recognized that physical, chemical and biological processes must all be considered together. The work group examined several questions: (1) What do we need to know? - for PLUARG to satisfactorily complete its Terms of Reference, - for the Governments to manage land use activities to achieve satisfactory Great Lakes water quality, ( 2 ) What do we know?, and ( 3 ) What recommendations should be made to PLUARG and to the Research Advisory Board/IJC in terms of recommended actions o r research needs?
This work group focused upon physical processes in fluvial transport
The Workshop was partitioned into considerations of sources and in- stream transport mechanisms and the discussions of Group 1 are presented here within the same categories. Research needs are discussed both within the context of immediate needs of PLUARG and with a view of future research which, although necessary t o answer the PLUARG Terms of Reference, cannot be feasibly concluded within the life of PLUARG for reasons of c o s t , available time, data limitations. etc.
285

W i t i t reference t o the three questions posed in the PLUARG Terms ( > t Reference, it is :rcrrpted tllet tlie boundary waters of the Great Lakes : ; y s t f n i are being polluted lrom land drainage. Further information needs to hi, developed to define the extent, CJUS~S and localities in which pollution is taking place,, and to define the most practical remedial measures. The items listed h e l o w are a statement of PLUARC, objectives within the context o f (:roup 1 discussions, and necessary to answer the questions posed in the I’I.UAR(: ‘Terms of Reference:
(1) Estimate contemporary fluvial loadings of sediment-related nutrients and contaminants into the Great Lakes.
( 2 ) Assess land use and associated loadings into the Great Lakes in the light of alternative management strategies.
( 3 ) Predict trends of loadings relationships into the future under different management strategies.
( 4 ) Recommend land use practices (remedial measures) in order to reduce or eliminate significant contaminant and pollutant loadings.
It should be noted that the Physical Processes group addressed ~ l r r questions of sources of pollutants from land use activities and the transport and resultant loadings to the Great Lakes; it did not address the questions of impact analysis on the Great Lakes or the processes and fate of sediment in lake-river interface areas such as estuaries.
SOURCES
The discussion of land use practice and sediment production, sediment control and consequent stream loadings of sediment-related quality p,lrameters ( i n upstream areas) centered on the efficacy of detailed site and time-specific cause-effect studies as opposed t o a more general mode approach in which stream loadings either at source of stream terminus are regarded as functions of classes of land use practices (either within a deterministic or statistical framework). I n view of the timeframe for PLUARG, there was a consensus that such tmdelb, which adequately permit a “first-cut‘‘ at landuse-
within the timeframe of PLUARG, deterministic process linkages between lake loadings relationships in time and space ought to be tried. It was felt that
loadings and site-specific land use practices upstream could not be made in drtail for reasons noted below. Therefore, existing models are the place to start since they have produced useful information in parts of the United States
short-term for PLUARG purposes, but need to be calibrated with data from the tor general categories of land use. Such models are likely adequate in the
(:reat Lakes Basin. Although such models may not have a high level of resolution for a11 tributary basins in the Great Lakes when projected downstream to lake boundaries, they provide a focus for the experimental and fluvial process rescarch required to obtain improved relationships between land use activities and lake loadings.
286

The major deficlency both of existing landuse-loadings models and of site specific process-response studies of sediment production by
water quality observations with river mouth loadings. Although the prin- specific land use practice, is the inability to link upstream or source
ciples of sediment transport mechanics are well known, the downstream movement and modification of sediment-related water quality variables are poorly understood. It is recognized that load modification is noL only related to physical processes but also includes biological and chemical interactions. In addition to poorly understood biochemical processes, it is recognized that contemporary data are inadequate to meet the needs of instream process research. These data inadequacies pertain both to poor characterization of variables (e.g., particle-size, inorganic/organic ratio, speciation of key components, aerosol input, etc.) and to lack of definition of spatial and temporal variations associated with parameter flux and with in-stream processes (such as sediment storage-remobilization mechanisms, time of travel of particle-size classes, short (anthropogenic) and long-term (climatic) variations in sediment flux and storage, etc.).
extrapolation from loadings in source areas to loadings at river mouths It is recognized that these inadequacies must be investigated in order that
reflects stream process both in space and in time as the watershed undergoes natural and anthropogenic perturbations.
DATA
Routine data on water quality and quantity have been collected for at least a decade on both sides of the Lakes, and therefore a special effort must be made to assess adequacy of historical data and to fully utilize them within limits established by the assessment procedure. In conjunction with the PLUARG (intensive and event-oriented) supplementary data collection, there is need to examine historical and PLUARG data and collection procedures for the purpose of:
assessing the loads and the accuracy of load estimates for sediment, pollutants and contaminants at river mouths (bearing in mind the often non-linear discharge dependencies illustrated by many variables);
identifying the watersheds which have a major and deleterious effect upon Great Lakes water quality;
evaluating sampling technique, in terms of depth and flow de-
variation in load and the degree to which these data are site pendencies of problem substances, for identification of temporal
dependent;
updating parameter lists to indicate those recently identified as either having a deleterious environmental effect or containing information bearing upon in-stream process mechanisms (e.g., particle-size, organic/inorganic, metal speciation);
evaluating sampling network design so that in-stream load mod- ification from source to mouth may be inferred and the spatial and temporal resolution of loads and source-area contributions may be identified.
287
RECOPMENDATIONS AND RESEARCH NEEDS
111 view of t he l ack of f a m i l i a r i t y of many of t h e workshop par-
a~ld r - r searc t i needs a re s ta ted on g e n e r a l s c i e n t i f i c g r o u n d s . A l t h o u g h t i c i p a n t s w i t h t h e o p e r a t i o n a l o r g a n i z a t i o n of PLUARG, recommendations
r e s e a r c h n e r d s r e f l e c t i n a d e q u a c i e s o f s t a t e - o f - a r t . F e a s i b i l i t y of re- rrcommendations may no t app ly equa l ly t o U.S . o r C a n a d i a n a c t i v i t i e s ,
commendations and research needs must be determined by PLUAKG and t h e Research Advisory Board.
U s i n g r i v e r mouth l o a d s , i d e n t i f y a l l streams t h a t d i s c h a r g e s i g n i f i c a n t loads to the Great Lakes. Of those s t reams tha t a re impor tan t , conduct surveys f rom the mouth (ups t ream) to ident i fy major p roblem input sources . The c o l l e c t i v e wisdom i s t h a t most se r ious p roblems a t t h e mouth w i l l r e l a t e t o p r o b l e m a r e a s n o t f a r u p s t r e a m . I n s u c h c a s e s , management s c e n a r i o s ( a l t e r n a t i v e r e m e d i a l m e a s u r e s ) s h o u l d b e i n v e s t i g a t e d .
Compnrr s t r e a m ( a q u a t i c ) l o a d i n g t o o t h e r s o u r c e s so you know how i m p o r t a n t ( r e l a t i v e l y ) t h e s t r e a m l o a d i n g component i s .
Assess adequacy and app l i cab i l i t y o f ex i s t ing da t a . Th i s shou ld inc lude an assessment of v a r i a b l e s and of the e f f icacy of p r e s e n t J a t a c o l l e c t i o n s t r a t e g i e s f o r t h e i r a b i l i t y t o r e s o l v e s p a t i a l and t empora l t r ends i n l oad ings a t source and mouth. This recommendation does no t necessa r i ly imp ly "more" d a t a c o l l e c t i o n b u t r a t h e r " b e t t e r " da ta co l lec t ion . Necessary changes should be implemented to cor rec t d a t a d e f i c i e n c i e s .
A p p l y ex is t ing sed iment - loadings models bo th to assess sed iment - p r o d i l r t i o n a t s o u r c e , and in order to derivc upper-bound values f o r stream-mouth loadings by p x t r a p o l a t i o n o v e r l a r g e a r e a s .
I d e n t i t y and rank present management s t r a t e g i e s w h i c h f o c u s upon major sources . Models should be used to eva lua te p robable e f fec ts n f a l t e r n a t i v e management choices. (The term models, does not necess,lr i ly imply computer programs. I t may be s imple empir ica l formulae - al though computer models are avai lable and would be usrful) .
I n i t i a t e p r e l i m i n a r y f i e l d s t u d i e s of downstream transport mechanisms and load m o d i f i c a t i o n s of bo th a phys ica l and c h e m i c a l n a t u r e i n s m a l l , r e l a t i v e l v s i m p l e c a t c h m e n t s w i t h t r a n s p o s i t i o n t o s e l e c t e d Type r a t c l m r n t s of g rea t e r complex i ty .
' 8 8

Research Needs:
with respect to general principles and their spatial and temporal Study of erosion and sediment transfer mechanisms in source areas
significance. This should include consideration of "partial area hydrology" insofar as it relates to probable source areas of sediment.
Establish causal mechanisms f o r changes in sediment quality and quantity during stream transport in complex stream systems. This should include fundamental research into the physical, biological and chemical process mechanisms. Such data are required to improve present landuse-loadings models t o that the effect of upstream management alternatives can be assessed in terms of loadings to the Great Lakes.
Develop and apply improved models to all tributary basins in which significant loadings problems exist to facilitate trade-off analyses of alternative remedial measures. Such application should include research developments from bl and 112 above.


NUTRIENTS W ~ R K GROUP
RESEARCH NEEDS ~CDMVENDATIONS
Much more effort should be spent on methods to evaluate the biological availability of the phosphorus entering the lakes from the tributaries. A special group should be set up to concentrate on this aspect.
The kinetics of removal of phosphorus from the water to the stream and river sediments should be studied in greater detail.
The parameters of riverine storage of phosphorus should be investigated in detail.
Based on (2) and ( 3 ) a weighting system should be devised for the various tributary sources of phosphorus.
IWEDIATE ~COFF~ENDATIONS FOR PLuAffi
(I) Characterize all pilot watersheds for spatial variability and attempt to relate this to measured nutrient output based on partial area hydrology models.
(2) The compatibility of various goals should be investigated, i.e. is it better to slow erosion to control pesticide transport, or to allow it to continue to aid in phosphorus de-activation.
( 3 ) One must recognize the divers nature of the Great Lakes area. Recommendations for control must be made on an almost site specific basis.
291


PESTICIDES WORK GROUP
RESEARCH NEEDS RECOWENDATIONS
It is essential for the regulatory and other agencies in Canada and the United States to know precisely the location, names and quantities of organic substances being used which may be hazardous to the biota of the Great Lakes Basin wherever that biota i s of economic or peripheral importance. Such knowledge is essential to establish research priorities and for current and future surveillance.
A need exists to select and develop standard techniques and criteria to evaluate the toxic effects of substances on biota of the greatest importance to the Great Lakes Basin ecosystem. This will ensure that criteria for all substances in use or developed for the future are assessed using the same criteria and at levels likely to be found in the environment.
There is a need to document the case histories of such substances as DDT and PCBs to ensure that mechanisms and transfers as well as past analyses are thoroughly understood in order to develop predictive models for substances of similar nature, but yet to be developed or used. There is little likelihood that any substances will be as thoroughly studied and documented as the major pesticides and derived products used since 1940. The knowledge concerning these should be so firmly corroborated in respect to fluvial, point source and aerial inputs and transformations that all future studies can use the approaches or findings to extrapolate effects before crisis develop.
There is a need for more information on the relative importance
Great Lakes Basin ecosystem. This information is needed before of the various routes by which organic contaminants enter into the
recommendations relating to land use can be seriously considered.
The question of open-water disposal of dredged sediments was raised b u t appears to be adequately covered by the report from the International Working Group on the Abatement and Control of Pollution from Dredging Activities.


[“ETALS W ~ R K GWUP
RESEARCH NEEDS ~COMVENDATIONS
The need,to investigate:
The biological availability of metals in uplands, streams, lakes, and estuaries under various environmental conditions i.e., pH, Eh, etc;
with organic and inorganic sediments in uplands, ground-waters, The various release mechanisms available for metals entrained
streams and lakes;
The metal concentrations and types associated with various size fractions of organic and inorganic sediments and their chemical and/or mineralogical composition;
Whether metals are tied to sediment sizes most difficult to control using conventional and existing soil erosion and sediment control procedures;
Whether sediment erosion and control practices used in agriculture, urban areas, mining, construction and related land uses are adequate to retain these finer-grain sizes. If not, what new technology may be applied for their control;
The probable costs of these control measures and their benefits not only with metals but other entrained pollutants, i.e. N, P , pesticides, etc.;
The processes of chemical fractionation of metals. These processes may influence metal occurrence, transport and bioavailability. Chemical fractionation must be coupled to metal release mechanisms to predict resulting concentrations of metals in aqueous systems;
The organic species (plants, animals, etc.) that tie up metals that might, in turn, be converted to the elemental form of the metal ;
The toxicity levels of metals and complexed metals to various aquatic plants, animals and segments of food chains;
(10) The kinetics of metal complexes as these kinetics will shed light on metal speciation and metal behaviour within aqueous systems. The ionic strengths of metal complexes are influenced by salinity and other factors that must be defined.
295

RECOWENDATIONS FOR PLUARG
(1) 'The reproducibility of results of chemical analyses for meLals using various sampling times, sampling procedures, and analytical techniques must be assured through the con- tinuance of the PLIJARC interlaboratory comparison programme.
(2) PLLJAKG must determine the atmospheric loadings of metals.
made of possible control measures and costs to reduce this T l w sources and source regions must b e found and an estimate
loading.
296

EilFVEl Fl WORKSHOP ORGIINIZERS
AND ATTENDEES


WORKSHOP AITENDEES
Dr. John R . Adam Wate r Qua l i ty Management Program To ledo Me t ropo l i t an Area Counc i l o f
S u i t e 7 2 5 4 2 0 Madison Avenue Toledo, Ohio 43604
I l r . Herbe r t E . A1lc.n A s s i s t a n t : P r o f e s s o r I l l i n o i s I n s t i t u t e o f T e c h n o l o g y Chicago, I l l ino is 60616
Dr. ( : a r l )s Alonso [KIM Sed imen ta t ion Labora to ry 1'. 0. Box 1157 Oxford, Miss. 38655
Dr. Eugene .J. Aubert D i r e c t o r Grea t Lakes Envi ronmenta l Research
2'300 Waslltenaw Avenue Ann Arbor-, Michigan 48104
R i v e r S t t l d i e s L a b o r a t o r y l ' r o f r s so~ Dav id B. Baker
H e i d e l b e r g C o l l e g e T i f f i n , O h i o 4 4 8 8 3
Dr. Keith Bedford Water Resources Centre The Ohio S t a t e U n i v e r s i t y 1791 Neil Avenue Columbus, Ohio 43210
P r o f e s s o ~ David R. Bouldin C o r n e l l I ! n i v e r s i t y Department of Agronomy Bradf ie lo and Emerson Hal l s I t h a c a , New York 14850
(:overnments
Labora to ry
Mr. J. E. Brubaker A g r i c u l t u r a l E n g i n e e r i n g E x t e n s i o n s
O n t a r i o M i n i s t r y of A g r i c u l t u r e
Gue lph , On ta r io
Ms. Margery Bynoe Department of Geography Queen ' s Un ive r s i ty K i n g s t o n , O n t a r i o
Mr. Thomas 1%. C a h i l l Resource Management AssociaLes P. 0. Box 740 West C h e s t e r , PA 19380
Mr. Wayne Chapman
c / o EPA S o i l C o n s e r v a t i o n S e r v i c e
WH 554 Non Poin t Sources Branch
4 0 1 M S t r e e t , S.W. Washington, D. C. 20460
Dr. Y . K . Chau Canada Cen t re fo r In l and Wate r s P . 0. Box 5050 Burlington, Ontario I.7R 4126
Branch
and Food
D i r e c t o r Dr. C:. Cl l e s t e r s
Water Resources Center U n i v e r s i t y of Wisconsin 1975 Willow Drive Madison, Wisconsin 53706
Dr. Richard Coote Eng inee r ing Resea rch Se rv ices A g r i c u l t u r e Canada Ottawa, O n t a r i o K l A OC6
299

Mr. . I . C u l h t ~ r t s m U . S . 1)ep.lrtrncnt of t h e L n t e r i o r L ( ~ o l o g i v a 1 S u r v e v K t ~ s t o n , l ' i r g i n i a 2209Z
Ur. Trevor I l ic kinson Eng inee r ing Depa r tmen t U n i v e r s i t y o f Guelph Ouelp l l , O n t a r i o N 1 ( : L W 1
Ik.partment o f (:eography I ' r< l f e s su r (:. ti. Dury
' 1 ' 1 1 ~ U n i v e r s i t y o f Wisconsin-Madison Srie11t-e Hal l M , l o i s ~ ~ n , Wisconsin 51706
l)r. UrLm Ladie N(IAA/(:reat I.dkes Envi ronmen ta l
Res rn rch 1 , ahora to ry LJUO Washtennw Avenue Ann Arbor , ? l i c h i g a n 48104
I l r . Richard l:t-;ink O n t a r i o M i n i s t r y of A g r i c u l t u r e
O n t a r i o P e s t i c i d e s L a b o r a t o r y U n i v e r s i t y of Guelph [ :ue lph , Ontd i r io N L C 2Wl
Dr. U l r i c h F i i r s t n e r
M i n e r a l . P e t r o g r . l n s t . Lab. f u r Sed imen t fo r schung
U n i v e r s i t y of H e i d e l b e r g B e r l i n s t r a s s e - 1 9 P o s t f a c h 104040 D-69 H e i d e l b e r g B u n d e s c r e p u b l i c , D e u t s c h l a n d
Dr. J . Gaynor R e s e a r c h S t a t i o n A g r i c u l t u r e C a n a d a Harrow, Ontar io NOR 1 G O
Dr. Wal t e r A. Glooschenko Canada Centre f o r I n l a n d Waters P . 0. Box 5050 B u r l i n g t o n , O n t a r i o L7R 4A6
and Food
Dr. fl. L . Golterman L i m n o l o g i s c h I n s t i t u u t N i e u w e r s l u i s 2 5 8 3 N e t h e r l a n d s
Mr. Ron H a l s t e a d R e s e a r c h C o o r d i n a t o r Research Branch A g r i c u l t u r e C a n a d a Ottawa, O n t a r i o K 1 A 0C6
Dr. Leo .J. H e t l i n g
New York S t a t e Depa r tmen t of Env i ronmen ta l Qua l i ty
E n v i r o n m e n t a l C o n s e r v a t i o n Research and Development Unit Albany, New York 12201
Mr. John Holeman E n g i n e e r i n g D i v i s i o n S o i l C o n s e r v a t i o n S e r v i c e Washington, D. C . 20250
Mr. R . C . Hore O n t a r i o M i n i s t r y of the Envi ronr Water Resources Branch
Toron to , O n t a r i o M4V 1P5 135 S t . C l a i r Avenue West
Dr. Da le D. Huff Bui ld ing 3017 Oak R i d g e N a t i o n a l L a b o r a t o r y Oak Ridge, Tennessee 37830
Mr. Robert Johanson Hydrocomp 1502 Page Mill Road P a l o A l t o , C a l i f o r n i a 9 4 3 0 4
D r . I . Jonasson Geologica l Survey of Canada 6 0 1 B o o t h S t r e e t O t t a w a , O n t a r i o
Dr. Klaus Kaiser C a n a d a C e n t r e f o r I n l a n d Waters P . 0. Box 5050 B u r l i n g t o n , O n t a r i o L7R 4A6

Mr. Ken Kemp I n d i a n a S t r e a m P o l l u t i o n C o n t r o l B o a r d P l a n n i n g S e c t i o n 310 W . Michigan Avenue I n d i a n a p o l i s , I n d i a n a
Dr. .J. Knox
U n i v e r s i t y of Wisconsin-Madison I n s t i t u t e for E n v i r o n m e n t a l S t u d i e s
1042 Warf B u i l d i n g 610 Walnut Bui ld ing Madison , Wiscons in 5 7 7 0 6
Dr. .I. (;. Konrad S u p e r v i s c r of S p e c i a l S t u d i e s Wiscons i r Depar tment of N a t u r a l
Madison, Wisconsin 53701
Dr. A . K . Lebeuvre Canada Centre f o r I n l a n d Waters P . 0 . Box 5050 B u r l i n g t o n , O n t a r i o L 7 K 4 A 6
P r o f e s s o r '7'. I.ogan 'The O h i o S t a t e U n i v f r s i t y 1885 Neil Avenue Columbus. Ohio 43210
Resources
Ms. E l s i e MacDonnld S o i l Kescaarch l n s t i t u t e A g r i c u l t u r e C a n a d a O t t a w a , O n t a r i o K 1 A 0C6
Mrs. Edit.1) MacIntosh Mayor C i t y of K i t c h e n e r C i t y H a l l K i t c h e n e i , O n t a r i o
Dr. A . D . McElroy I r e a t m e n ! a n d C o n t r o l P r o c e s s e s S e c t i o n M i d w e s t l { e s r a r c h I n s t i t u t e 425 Volktlr Voulevard K a n s a s C i t y , M i s s o u r i
Mr. William F. Mi ldne r U.S. S o i l C o n s e r v a t i o n S e r v i c e H y a t t s v i l l e , M a r y l a n d 2 0 7 8 2
P r o f e s s o r M. H . M i l l e r Department of Land Resource Sc ience O n t a r i o A g r i c u l t u r a l C o l l e g e U n i v e r s i t y of Cuelph C u e l p h , O n t a r i o N 1 6 2W1
A g r i c u l t u r e C a n a d a Dr. 11. V . Morley
Room 1113 K. W . Nea tby Bu i ld ing C a r l i n g Avenue Ottawa, O n t a r i o K l A 0C6
Dr. M . D . Mul l in US Envi ronmenta l Pro tec t ion Agency G r o s s e I l e L a b o r a t o r y 9311 Groh Koad Grosse I l e , M i c h i g a n 4 8 1 3 8
Dr. Car l Nord in U . S . ( :e( , logical Survey Mai l s top 413 Box 2 5 0 4 6 Denver Fede ra l Cen t r e Lakewood, Colorado 80225
Mr. .I. E. O ' N e i l l Water Kesources Branch M i n i s t r y of t he Env i ronnwnt 135 S t . C l l i r Avenue West T u r o n t o , O n t a r i o M4V 1P5
Dr. E . D. Ongley
( ) w e n ' s U n i v e r s i t y k p a r t m e n t of Geography
K i n g s t o n , O n t a r i o
W a t e r Q u a l i t y Management Branch Mr. R . C. O s t r y
O n t a r i o M i n i s t r y of the Envi ronment 1 3 5 S t . C la i r Avenue West T o r o n t o , O n t a r i o M4V 1P5
Dr. R icha rd K. P , i r i z e k I lepar tment of Geosciences P e n n s y l v a n i a S t a t e U n i v e r s i t y Un ive r s i ty Pa rk , Penn . 16802
301

Ms. Jean Percival Department of Geography Queen's University Kingston, Ontario
Dr. Harry B. Pionke Research Leader U.S. Department of Agriculture 111 Research Building A University Park, Penn. 16802
Mr. J. Ralston Water Resources Planning Unit Ontario Ministry of the Environment 135 St. Clair Avenue West Toronto, Ontario M4V 1P5
Mr. J. D. Roseborough Director Fish and Wildlife Research Branch Ontario Ministry of Natural Resources P. 0. Box 50 Maple, Ontario LOJ 1 E O
Professor G. K. Rutherford Department of Geography Queen's University Kingston, Ontario K7L 3N6
Professor Joseph Shapiro Geology & Ecology Department University of Minnesota Minneapolis, Minnesota 55455
Dr. Harvey Shear International Joint Comisslon Great Lakes Regional Office 100 Ouellette Avenue Windsor, Ontario N9A 6T3
Dr. D. B. Simons Engineering Research Centre Colorado State University Fort Collins, Culorado 80523
Dr. P. G. S l y , Chief Lakes Research Division Canada Centre for Inland Waters P. 0. Box 5050 Burlington, Ontario L7R 4A6
Dr. William Sonzogni Great Lakes Basin Commission 3475 Plymouth Road P. 0 . Box 999 Ann Arbor, Michigan 48106
D r . R. L. Thomas Director Great Lakes Biolimnology Laboratory Canada Centre f o r Inland Waters P. 0 . Box 5050 Burlington, Ontario L7R 4A6
Mr. Robert E. Thronson Environmental Protection Agency Waterside Mall Room 2417-D Washington, D. C. 20460
Dr. J . K. Vallentyne Ocean and Aquatic Affairs Fisheries 6 Marine Services Environment Canada 580 Booth Street Ottawa, Ontario K 1 A OH3
Dr. F. H. Verhoff Route 7 Box 307 Morgantown, W. Va. 26505
Mr. Eric Veska Department of Geological Sciences Brock University St. Catharines, Ontario L2S 3 A 1
Dr. Greg Wall University of Guelph Guelph, Ontario N1G 2W1
Dr. D. E. Walling Department of Geography Armor Building Rennes Drive Exeter, England EX4 4RJ
Dr. A. E. P. Watson International Joint Commission Great Lakes Regional Office
Windsor, Ontario N9A 6T3 100 Ouellette Avenue
302

Mr. G. M . Wood S o l i d W a s t e U n i t O n t a r i o M i n i s t r y of the Envi ronment
'Toronto. Ontar io M4V 1 P 5 1 3 5 S t . C l a i r Avenue Vest
Dr. S tephen Yaksich Corps o f Eng inee r s Department of t h e Army 1776 N i a g a r a S t r e e t H u f I a l o , New York 1 4 2 0 7


PWARG ~ M B E R S H I P
Norman A. Berg (Chairman) Assoc ia t e Admin i s t r a to r So i l Conse rva t ion Se rv ice U.S . Department of Agricul ture P. 0. Box 2890 Washington, D. C. 20013
Konald ldaybrant Water Qual i ty Appra isa l Sec t ion Wate r ( )ua l i t y D iv i s ion Michigan Department of Natural Resources 1’. 0. Box 30028 Lansing, Michigan 48909
I.. Robert Carter
O f f i c e o f t h e A s s i s t a n t Commissioner Coordin. l tor of Environmental Programs
f o r Environmental Health 1330 West Michigan Street Ind ianapo l i s , I nd iana 46206
Leo J. I fe t l ing Env i ron~nen ta l Qua l i ty Kesearcll and Development Unit New York State Department of
50 Wolf Road Envir(mmenta1 Conservat ion
Room 510 Albany, New York 12201
Richard R. P a r i z e k Profess t~r o f Geology Department of Geosciences The P e n n s y l v a n i a S t a t e U n i v e r s i t y Universi ty Park, Pennsylvania 16802
Merle W . Te l lekson Technical Support Branch S u r v e i l l a n c e & Analys is Div is ion Environmental Protect ion Agency Region V
Chicago, I l l i n o i s 60604 230 South Dearborn S t r e e t
John G. Konrad Superv isor of S p e c i a l S t u d i e s Wisconsin Department of Natural
Madison, Wisconsin 53701
Floyd E . Heft Div is ion of S o i l & W a t e r D i s t r i c t s Ohio Department of Natural Resources Fountain Square Columbus. Ohio 43224
Resources
John Pegors Minnesota Pol lu t ion Cont ro l Agency 1015 Torrey Bui lding Duluth, Minnesota 55802
Gerald B. Welsh ( S e c r e t a r y ) Resource Development Division S o i l Conserva t ion Serv ice U.S . Department of Agricul ture P . 0 . Box 2890 Washington, D. C . 20013
305

Murrav (;. .Johnson (Chairman) Di rec to r Gene ra l Ontario Region F i s h e r i e s and b r i n e S e r v i c e Ilepartment o f F i s h e r i e s h Environment 3050 Harves te r Road t iu r l ing ton , On ta r io L 7 N 351
K . I> . l't~omas D i r e c t o r (:rc.at Lakes Uio l imnology Laboratory Canada Ccnt rc f o r I n l a n d Waters 1'. 0. Box 5050 Rurl ingLon, Ontar io L7R 44.6
Ii. V. Morley Kesfnr?t? ( ' o r ~ r , + i n n t o r ( L n v i rvnment a n d K r s o u r c e s ) A g r i c u l t u r e (:anada K . W . Neathy Building Room 1111
Ottawa, Ontar io K I A 0C6 C a r l i n g Avcmue
K . Stiikaze C h i e f Environmental Control Divis ion Envi ronmenta l Pro tec t ion Serv ice Department o f F i s h e r i e s & Environment 1 3 5 S t . Clair Avenue West 2nd Floor Toronto , Ontar io M4V 1P5
K. Code Onta r io Min i s t ry of Natural Resources Room 6602, Whitney Block Queen's Park Toronto . Ontar io
Donald N . .Teffs
Water Resources Branch Ass is tan t L l i rec tor
Ontar io Minis t ry o f the Envi ronment 135 S t . C l a i r Avenue West Toronto, Ontar io M4V 1P5
(:. Martin Wood llead, Solid Waste Unit On ta r io Min i s t ry of the Environment 135 S t . Clair Avenue West Toronto, Ontar io M4V 1P5
.I. E . Urubaker Agr i cu l tu ra l Eng inee r ing Ex tens ions
Ontar io Minis t ry of A g r i c u l t u r e &
( h e l p h , Ontar io N1G 2W1
Head .John Rals ton
Water Resources Planning Unit Ontar io Minis t ry o f the Environmen
Toronto , Ontar io M4V 1P5 135 S t . C l a i r Avenue West
John D. Wiebe ( S e c r e t a r y ) Environmental Assessments Coordina Ontario Region Environmental Management S e r v i c e Department o f F i s h e r i e s & Environrr 3050 Harves te r Road Bur l ing ton , Ontar io L7N 351
Branch
Food
S e c r e t a r i a t R e s p o n s i b i l i t i e s :
Dr. Harvey Shear B i o l o g i s t I n t e r n a t i o n a l J o i n t Commission Great Lakes Regional Off ice
Windsor , Ontar io N 9 A 6T3 100 Ouel le t te Avenue, 8 t h F loo r
306

W~RKSI-KIP ORGANIZERS
Dr. Leo J. Hetling Director, Environmental Quality Research and Development Unit New York State Department of
50 Wolf Road Environmental Conservation
Albany, New York
Mr. John N. Holeman Sedimentation Geologist United States Department of
Washington, D. C. 20250 Soil Conservation Service
Dr. Dale D. Huff Iksearch Hydrologist Environmental Sciences Division Buildlng 3017 Oak Ridge Nationdl Laboratory Oak Ridge, Tennessee 37830
Dr. Edwin D. Ongley Associate Professor Department of Geography Queen's University Kingston, Ontario
Agriculture
Dr. Harvey Shear Aquatic Biologist International Joint Commission Great Lakes Regional Office 100 Ouellette Avenue Windsor, Ontario N9A 6T3
Dr. Richard L. Thomas Director Lakes Research Division
P. 0 . Box 5050 Canada Centre for Inland Waters
Burlington, Ontario L7R 4A6
Dr. Jack R. Vallentyne Senior Scientific Advisor to the
Ocean and Aquatic Affairs Assistant Deputy Minister
Fisheries and Marine Service Environment Canada 580 Booth Street Ottawa, Ontario K1A OH3
307

RESEARCH ADVISORY ~ A R D ~ E R S H I P (AS OF OCTOBER 1976)
Dr. D. I . Mount (Chairman) D i r e c t o r Environmental Kescarch Laboratory
L)uluth, Minnesota ‘15804 6201 Congdon Avenue
P r o f e s s o r Joseph Shnpiro Geology Department Universi ty of Minnesota
Minneapolis, Minnesota 55455 220 I’illsbury Hali.
Dr. Eugene J. Aubert U i r e c t o r Great Lakes Environmental Research
National Oceanographic and Atmospheric
2300 Washtenaw Avenue Ann Arbor, Michigan 48104
Professor Leonard 1%. Dworslcy C i v i l and Environmental Engineering C o r n e l l U n i v e r s i t y 302 Ho lL l s t e r Ha l l I t l t aca , New York 14853
Laboratory
Adminis t ra t ion
Mr. Alvin R. Balden 19 Al ina Lane fiot Springs Village, Arkansas 71901
Mrs. Evelyn Stebbins C i t i z e n s f o r Clean A i r and Water Inc.
Rocky River , Ohio 44116 705 Elmwood
Dr. Herber t E. Al len A s s i s t a n t P r o f e s s o r Department of Environmental
I l l i n o i s I n s t i t u t e of Technology Chicago , L l l ino is 60616
P ro fes so r Arch ie J . McDonnell Department of Civi l Engineer ing Water Resources Research Center The Pennsy lvan ia S t a t e Un ive r s i ty U n i v e r s i t y Park, Pennsylvania 16802
Engineer ing
Ex O f f i c i o
M r . C a r l o s M . F e t t e r o l f , J r . Execu t ive Sec re t a ry Great Lakes Fishery Commission 1451 Green Road Ann Arbor, Michigan 48107
” .~
308

Canadian
D r . A. R. LeFeuvre (Chairman) D i r e c t o r Canada Centre for Inland Waters Environment Canada P. 0. Box 5050 Rur l ing ton , On ta r io L7R 4A6
Mr. Arnold J . Drapeau P r o f e s s o r Ecole Poly technique Campus de L 'Univers i te de Montrea l C.P. 6079 - S u c c u r s d e "A" Montreal, Quebec H3C 3A7
Mr. H. R . Holland 462 Charlesworth Lane Sa rn ia , On ta r io N7Y 2R2
Mr. Paul D. Foley Coordina tor Development and Research Group Ontar io Minis t ry of the Environment 1 7 5 S t . C l a i r Avenue West 'Toronto, Ontario M4V 1P5
D r . J . C . N. Westwood P r o f e s s o r & Head of Microbiology and
Facul ty of Medicine Universi ty of Ottawa Ottawa, Ontar io K 1 N 6N5
Immunology
Mr. J. Douglas Roseborough D i r e c t o r Fish and Wildlife Research Branch Ontar io Minis t ry of Natural Resources P. 0. Box 50 Maple, Ontario 1.O.J 1EO
Mrs. Mary Munro
Bur l ing ton , Ontar io L7N 1C3 3020 F i r s t S t r e e t
Dr. .J. R . Val len tyne S e n i o r S c i e n t i f i c A d v i s o r Ocean & A q u a t i c A f f a i r s F i s h e r i e s & Marine Serv ice Environment Canada 580 Booth Street Ottawa, Ontar io K 1 A OH3
" Ex O f f i c i o
Mr. Floyd C . E lder A/Head, Bas in Inves t iga t ion and
Canada Cent re for In land Waters Environment Canada P. 0. Box 5050 Burlington, 0ntar:io L7R 4A6
Model l ing Sec t ion
" S e c r e t a r i a t - R e s p o n s i b i l i t i e s :
Dr. Dennis E . Konasewich S c i e n t i s t I n t e r n a t i o n a l J o i n t Commission Great Lakes Regional Office 1.00 O u e l l e t t e Avenue, 8 th F loo r Windsor , Ontar io NYA 6TJ
309