Spreadsheets vs. Watson Studio Desktop - IBM
14
IBM Watson January 2020 ® Spreadsheets vs. Watson Studio Desktop Two data analysts and their very different lives ®
-
Upload
khangminh22 -
Category
Documents
-
view
3 -
download
0
Transcript of Spreadsheets vs. Watson Studio Desktop - IBM

IBM Watson January 2020
®
Spreadsheets vs. Watson Studio DesktopTwo data analysts and their very different lives
®

2 Spreadsheets vs. Watson Studio Desktop
Contents 3 Introductions are in order
4 Julian’s “no life” life
5 Another manic Monday
6 What many companies don’t know
7 Ariana: A satisfying job and life
8 Monday morning sure looks fine
9 Embrace work-life balance
10 Learn more

IBM Watson 3
Introductions are in orderMeet Julian and Ariana, two fictional data analysts who work at different fictional companies. Both were hired for their expertise and skills in aggregating data from a myriad of sources and analyzing that data to develop business insights — something they really enjoy. Their companies are in the same industries, and the data that informs their insights is similar. But their days couldn’t be more different.
Why? The answer boils down to data preparation, cleansing and visualization — and the tools they use to do their work. Julian’s company, Top Down Enterprises, is budget-conscious and traditional, choosing to use spreadsheets and a varied collection of disparate tools for data analytics. The company sees no value in investing in automation or data preparation tools because its leaders believe what they have is sufficient and that these activities should be fairly simple, quick exercises.
Ariana’s company, Forward Progression, Inc., knows the value of automation and self-service. They have invested in Watson Studio Desktop, a leading data analytics and AI offering built from the ground up for an AI-powered business. Watson Studio Desktop automates many formerly manual data analytics tasks, including data prep.
This eBook tells the story of the two very different lives Julian and Ariana live because of the investment decisions their companies have made.

4 Spreadsheets vs. Watson Studio Desktop
Meet Julian

IBM Watson 5
Julian’s “no life” lifeAccording to several surveys, as many as two-thirds of all IT and data professionals use spreadsheets for preparing data. Julian is one of them, and it’s the most time-consuming part of his job. Don’t tell that to the management at Top Down Enterprises, though. Their requests for data analysis and reporting keep rolling in with the expectation that data prep is but a minor bump in the road, requiring minimal time and effort to address.
Top Down Enterprise’s managers think that Julian can click a few buttons to transform a raw data set into actionable analysis in just a couple of hours. The reality is that he often spends at least 30 hours a week manually compiling and cleaning his data using spreadsheets. The huge spreadsheets he works with are completely disorganized with spaces and columns all over the place. There are incomplete notes and charts, and no two worksheets are formatted alike.
So, most days for Julian are boring and stressful. He arrives at the office early and goes home late, miserable and exhausted. If he’s asked if he has a life, he laughs mirthlessly. Let’s look at one of his days in detail.
Another manic MondayJulian’s alarm goes off at 5:00 a.m. He sets it early so he can go to the gym and work out. Yet almost immediately, he hears the familiar Slack ping: a colleague in Singapore needs analysis of a massive (and messy) spreadsheet full of data, sent hours before Julian had even turned on his notifications. He brews coffee while eating a bowl of cereal, then heads for the office, mug in hand. He hasn’t made it to the gym in weeks.
No one is in the office when he arrives at 6:00 a.m., so he turns on all the lights and puts on more coffee. He hunts around for snacks and finds a couple of energy bars he hopes will fuel him through his ordeal. Then, Julian sits at his desk and gets to work.
Reviewing the dreaded data fileHe starts by looking at the data file, its headers and its name to make sure he understands what he’s seeing and that he’s downloaded the right file. It appears to be full of estimates, which means he will have to look for other data. He sighs.
He renames the file because it’s called HRALTATTRAT4Qs, which will have no meaning in the future. He then duplicates the file. He’ll work in the copy, leaving the original in case something goes wrong in the copy. He also creates a new sheet called “source,” and adds links to all the data he plans to use in his document. Now there are two files. Things are already messier.
66%As many as two-thirds of all IT and data professionals use spreadsheets for preparing data
The reality is that he often spends at least 30 hours a week manually compiling and cleaning his data using spreadsheets.

6 Spreadsheets vs. Watson Studio Desktop
Reconstructing and reorganizingWith the basic preliminary actions taken, Julian turns his attention to his working spreadsheet. It has tables that don’t start on row 1, column 1. There are tables with variable “splits” (such as the ages of males and females in separate columns) and unequal column lengths. His colleague has added text-based notes to numeric data columns (for example, 0.00264* to represent a significant p-value), and these notes create missing values when opened in other software. He sees that there is also colored text, shaded cells and sticky notes.
As a result, Julian must reconstruct and reorganize the data using manual cut-copy-paste operations. He starts copying and pasting all the data into a useable form and works at it all morning. He has found some errors, and to fix them, he must go to the individual cell and edit the data or the formula there. He’ll get several “#REF” errors because the cells have changed or the formulas point to an invalid cell.
To apply a formula to a column, he writes it in the first cell then copy-pastes or drags it all the way for the whole column — thousands of rows. He grabs more energy bars and works through lunch, which is nothing new.
Merging and joining, splitting, finding/replacing and creating pivot tables and macrosAs Julian suspected, the high number of estimates in the original spreadsheet means adding more data. Sadly, he can’t use SQL, which is the format of the missing data, so he re-creates that data in the spreadsheet. He does data joins and merges tables by matching column data or headers. He also splits variables using functions like “left,”
“right” and “mid” and specifies the values for arguments for the function.
To assess data quality, he uses filter and sort functions to identify missing values and anomalies and builds charts because they can be helpful for understanding the data. Unfortunately, the chart functionality in the spreadsheet is rigid and quirky, so it takes longer than it should for him to get useful information.
To find and replace values, he uses the spreadsheet’s search and replace function. He specifies the text and value to find, and the one to use as a replacement. He runs it on the whole spreadsheet. He wishes he could find and replace by conditions, but that’s not possible.
IBM Watson 7
To get aggregate values, he uses pivot tables. Striving for a consistent look and feel because he knows more spreadsheets like this are coming, he thinks writing a macro that enables him to apply the tables to several spreadsheets is a good idea. When he can’t quite get it to work, he has to resort to Visual Basic tutorials.
Meanwhile, new and updated data has arrived. He supposes he should be grateful that it didn’t come when he was finished and at home. Now, he’ll have to go and individually update the data ranges for each of the pivot tables and pivot charts so they reflect the new data.
It’s starting to get dark.
Fixing VLOOKUPsThe day’s nowhere near over for Julian. Thanks to the new and updated data that arrived while he was teaching himself how to build the macro, one of his VLOOKUPs has stopped working, and another isn’t giving him an answer. He has a headache because he’s hungry. Although he really can’t spare the time, he knows he needs to get something to eat that is more substantial than an energy bar if he’s going to diagnose his VLOOKUP issues.
He leaves the office and heads to the fast food restaurant around the corner. He orders a double bacon cheeseburger, fries and a soft drink to go and rushes back to the office. Unfortunately, he left his badge at his desk. So, he loses precious time calling security and getting them to let him in and onto the elevator.
He wolfs down his meal, promising himself he’ll work it off at the gym the next day or over the weekend, and delves into his VLOOKUP issue. He is pretty sure that a new column he created with the new and updated data caused the first VLOOKUP to stop working. He forgot to change the table array and return the column’s number when he added the column. He solves that problem in less than an hour.
The second VLOOKUP issue is harder to diagnose. He spends the next two hours trying different things before he realizes that he didn’t lock the formula, so the VLOOKUP treated it as a whole column. It went below the row, and VLOOKUP wasn’t able to provide an answer.
Finally, it’s overJulian looks at his watch. It’s 9:00 p.m. He’s worked more than 15 hours and he feels terrible. He knows he’ll spend the next day importing the spreadsheet data into R and MySQL, another process that can require tedious manual changes and even several email exchanges with the data creators.
Eventually, he’ll have data that’s ready for modeling and algorithms, so he can provide scenarios and reports to management. Of course, even then, there’s the risk that the chain of reproducibility will be broken when his plots and statistical summaries are copied onto PowerPoint slides. He’s seen that process introduce errors, break links and create more work because of revisions more times than he can count.
As he heads home, he hopes no data will refresh overnight while he sleeps — something that happens all the time. If it does, he’ll spend the next day duplicating his efforts.
He watches television, reflecting on how too many of his Mondays are like this. He often doesn’t have a chance to do any real analysis of the data — which is what he actually enjoys — until Friday (Thursday, if he’s lucky). That’s barely enough time to do anything other than answer the obvious questions that management expects.
He’s missing out on a lot and his work-life balance is a seesaw with a boulder holding down the work end.

8 Spreadsheets vs. Watson Studio Desktop
Occasionally, he gets a spreadsheet that needs very little preparation, but as his company grows, that’s becoming a
1 in 100 3.1 trillionAt least 1 in every 100 spreadsheet cells contains an error1
Businesses lose $3.1 trillion annually due to poor data quality
rare occurrence. He knows he’s missing out on a lot and that his work-life balance is a seesaw with a boulder holding down the work end. Eventually, he goes to bed and dreams of scripts and macros.
What many companies don’t knowSpreadsheets are wonderful tools and can be useful in many situations — tracking profit and loss, calculating, automating common accounting tasks and more. However, the nature of data has changed since they were created, and despite the best efforts of their vendors, they can’t keep up.
As data analysts know well, spreadsheets are massive now. And, the bigger the spreadsheet, the more hands-on time is needed to update, run and maintain it. Forbes recently reported that the most conservative research-based estimate indicates that at least one in every hundred spreadsheet cells contains an error.1
Granted, lots of those errors are small and usually don’t have major business consequences, until you consider that a business can use hundreds or thousands
“Up to 90 percent of the world’s spreadsheets have serious — even life-threatening — errors.”
of spreadsheets, all with hundreds of thousands of cells. The errors can propagate through merging, joining and more; suddenly, a business is looking at a disaster. In fact, ZDNet reported in 2017 that “up to 90 percent of the world’s spreadsheets have serious — even life-threatening — errors.”2
According to IBM research, in the U.S. alone, businesses lose $3.1 trillion annually due to poor data quality. Much of this poor quality is caused by manual and spreadsheet data prep and overworked data analysts. The more tired you are, the more likely you are to make a mistake when manipulating and recording data. Top Down Enterprises and their counterparts would do well to consider investing in a better solution. The ROI would be worth it. Let’s see how as we look at Ariana’s life with Watson Studio Desktop.

IBM Watson 9
Meet Ariana
10 Spreadsheets vs. Watson Studio Desktop
Ariana: A satisfying job and life After attending some conferences and a series of webinars, Forward Progression, Inc.’s senior management became interested in using IBM Watson Studio Desktop for data analytics. Their IT managers and data analytics team did their homework, talked with IBM and created a list of requirements with input from their data analysts. After several demonstrations and projects with the free trial, the company decided it was the perfect solution for meeting their data analytics challenges.
While the assumption that Julian can prepare data for actionable analytics in a few hours and with a few clicks is a fallacy, for Ariana, it’s a reality. Watson Studio Desktop provides Ariana and Forward Progression’s data analysis team with the environment and tools necessary to solve their business problems by collaboratively working with data. Watson Studio Desktop offers the tools she needs to cleanse, shape, analyze and visualize data, create and train machine learning models and ingest streaming data.
Ariana feels valued by her company, her team and senior management. She is an active contributor to smarter decisions and better business outcomes, thanks to her data analytics and AI skills. She is popular with her colleagues, but she also has a lot of friends outside the office. Fortunately, she has plenty of free time to
spend with them. Why? Because her working hours are reasonable and she is rarely overtired. Let’s see what her day is like.
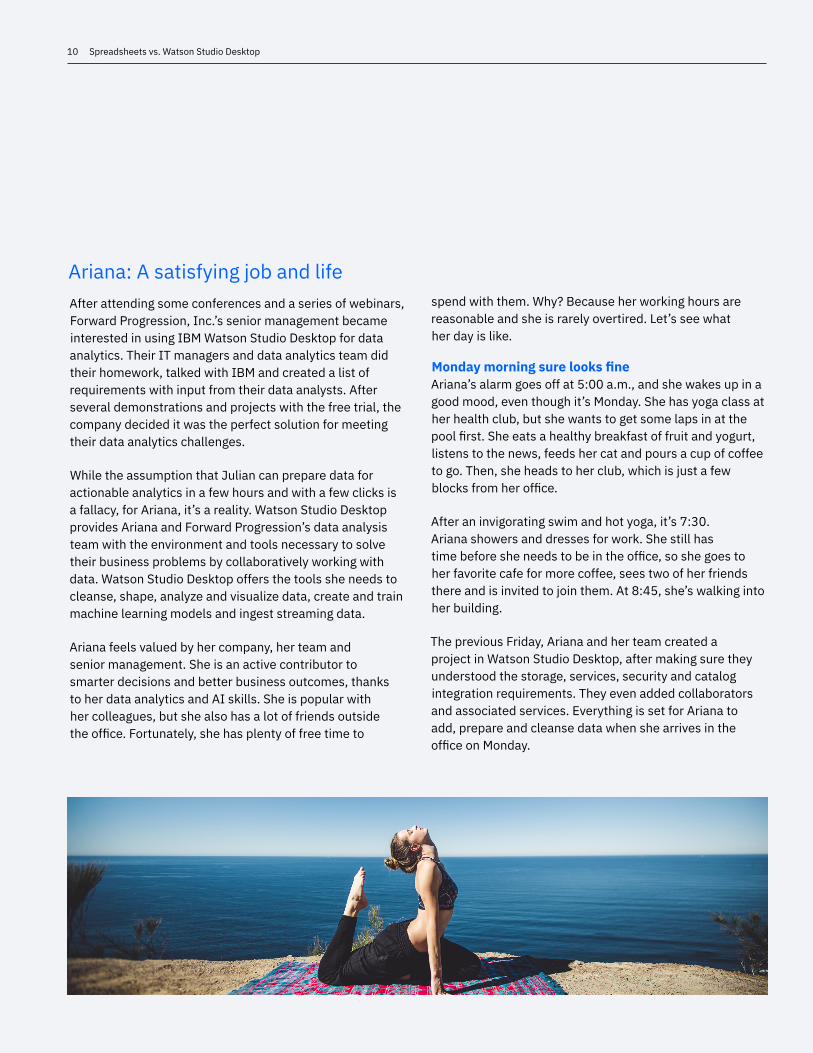
Monday morning sure looks fineAriana’s alarm goes off at 5:00 a.m., and she wakes up in a good mood, even though it’s Monday. She has yoga class at her health club, but she wants to get some laps in at the pool first. She eats a healthy breakfast of fruit and yogurt, listens to the news, feeds her cat and pours a cup of coffee to go. Then, she heads to her club, which is just a few blocks from her office.
After an invigorating swim and hot yoga, it’s 7:30. Ariana showers and dresses for work. She still has time before she needs to be in the office, so she goes to her favorite cafe for more coffee, sees two of her friends there and is invited to join them. At 8:45, she’s walking into her building.
The previous Friday, Ariana and her team created a project in Watson Studio Desktop, after making sure they understood the storage, services, security and catalog integration requirements. They even added collaborators and associated services. Everything is set for Ariana to add, prepare and cleanse data when she arrives in the office on Monday.

IBM Watson 11
She’s now ready to use Data Refinery to refine a data set before she starts using it for analysis or modeling. Data Refinery includes a graphical interface for profiling data to validate it, along with more than 20 customizable charts that give her perspective and insights into her data. So, she chooses the Refine option from the Assets tab. She creates a Data Refinery flow as a set of ordered operations on data. When she saves the refined data set, she loads it to a different location so her source data remains untouched by the refinement process.
Because her data has non-string data types, Data Refinery automatically applies the “Convert column type” GUI operation, and the data types are automatically converted to inferred data types like integer, data or Boolean. At any time, if she needs to, Ariana can undo or edit this step.
From a nightmare to a dream data assetAriana greets her coworkers as she goes to her desk. She sees that a spreadsheet has come in from an office in the U.K. Other than its origin, this spreadsheet is similar to the one Julian received from Singapore. It is massive and messy, with formatting issues, comments and color coding. There are split columns, columns that don’t match, inconsistent tables and more. Ariana isn’t fazed by this at all. She opens Watson Studio Desktop and gets to work on the data.
From her project’s Assets page, Ariana clicks Add to project > Data (she could also click the “Find and Add Data” icon). The Load pane opens, and Ariana drags the spreadsheet onto the pane, where it stays until the load is complete. The file is saved to her project and is listed as a data asset on the Assets page of her project. Ariana can see a preview of the data when she clicks the data asset name.
12 Spreadsheets vs. Watson Studio Desktop
After she refines the sample data set to suit her needs, she edits the Data Refinery details and output information. Then she saves and runs the Data Refinery flow for the full data set. To assess data quality, she can click the Profile tab to see frequency and basic statistics for each column to examine the data. She sees a few things she needs to fix.
Reorganization is no cause for alarmUnlike Julian, Ariana doesn’t have to stress over the issues she’s discovered, nor does she have to reconstruct her data set. She does a little reorganization, though. In just a few clicks, she changes some column names, finds and replaces (including by condition — Julian’s dream), splits a few columns, and removes duplicates and empty rows. She uses Modeler Flow to append a few rows.
For aggregation, she’s back to a few clicks — no pivot tables in sight. Visualizations are built for her, and she simply selects the one she wants without having to deal with quirky and rigid chart-building capabilities. When she adds new data or receives updates to a data set, the visualizations refresh automatically; she does not have to change anything herself.
Ariana does not know the pain of writing a formula for the first cell and copy-pasting for a whole column or getting an #REF error. In Data Refinery, the formula she uses affects the whole column and is consistent throughout. It’s not
possible to cause an error by changing a cell, because Data Refinery won’t let her. She can run reports regularly without worry — and the chances that PowerPoint can destroy her whole process are close to nil.
After her clicks, it’s time for lunch. Her team and the rest of IT are taking a long lunch to celebrate the engagement of a coworker. She doesn’t have to worry. There will be plenty of time for her to dive into the data and begin her analysis when she gets back.
Closing timeIt’s 5:00, and Ariana’s ready to leave. She’s used Watson Studio Desktop to analyze data and even build predictive models, and she’s looking forward to diving deeper into the data over the course of the week. Ariana routinely uncovers insights and possibilities from data that wow her leadership team and have a real impact on the direction of the company — something that gives her a great deal of personal satisfaction and makes her truly valuable to the organization.
But that can all wait until tomorrow. Right now, she has something else to look forward to — her Monday evening book club!
If there were a poster child for work-life balance, it would be Ariana.

IBM Watson 13
Learn moreReady to ease the data preparation burden of your data analysts? Here are some resources that can provide you with more information:
Introduction to Watson Studio Desktop
Data Preparation in Watson Studio Desktop
Data Visualization in Watson Studio Desktop
Try Watson Studio Desktop free for 30 days
Contact an IBM expert and request a free one-on-one consultation
Embrace work-life balanceWe’ve told a good story, but we’ve also given you some facts. Spreadsheets are costing organizations a great deal in lost productivity, business and revenue. Spreadsheets are too error-prone, too manual and too unreliable as data preparation tools for data science and AI.
All kinds of sources back up this statement — from surveys of data scientists to articles in Forbes. There are too many things that can go wrong in the data preparation and cleansing process when spreadsheets are used for data preparation. Julian’s tale of woe didn’t even include the fact that it is very likely the spreadsheet he received from Singapore had not been checked for errors or been subject to any kind of governance.
To reduce friction, address data activity inefficiency and improve worker effectiveness, more companies — including yours — should follow Forward Progression’s lead. Now is the time to invest in a solution that serves as a single data science platform for everything from data preparation to training AI/ML models and more. And who knows — your data analysts could thank you for giving them their lives back.

Please Recycle
© Copyright IBM Corporation 2019
IBM Global Services Route 100 Somers, NY 10589 U.S.A.
Produced in the United States of America February 2020 All Rights Reserved
IBM, the IBM logo and ibm.com are trademarks or registered trademarks of International Business Machines Corporation in the United States, other countries, or both. If these and other IBM trademarked terms are marked on their first occurrence in this information with a trademark symbol (® or ™), these symbols indicate U.S. registered or common law trademarks owned by IBM at the time this information was published. Such trademarks may also be registered or common law trademarks in other countries. A current list of IBM trademarks is available on the Web at “Copyright and trademark information” at ibm.com/legal/copytrade.shtml Other company, product and service names may be trademarks or service marks of others.
References in this publication to IBM products and services do not imply that IBM intends to make them available in all countries in which IBM operates.
Sources1. Meta S. Brown, “3 Reasons Why Replacing Microsoft Excel Is Worth Money To A Boss.” Forbes, 31 Dec. 2017.
2. Robin Harris, “Excel errors: How Microsoft’s spreadsheet may be hazardous to your health,” ZDNet, 28 Jul. 2017.
IBM Watson
®