A DYNAMIC QoS MODEL FOR MULTIMEDIA REAL TIME TRANSMISSION IN ENTERPRISE NETWORKS
11
Journal of Theoretical and Applied Information Technology 10 th April 2014. Vol. 62 No.1 © 2005 - 2014 JATIT & LLS. All rights reserved . ISSN: 1992-8645 www.jatit.org E-ISSN: 1817-3195 214 A DYNAMIC QoS MODEL FOR MULTIMEDIA REAL TIME TRANSMISSION IN ENTERPRISE NETWORKS C.G.RAVICHANDRAN 1 , K.MANIVANNAN 2 1 Department of Electronics and Communication Engineering, Excel Engineering College, Komarapalayam, Namakkal, Tamilnadu-637303, India. 2 Department of Computer Science and Engineering, PSNA College of Engineering & Technology, Dindigul, Tamilnadu-624622, India. E-mail: 1 [email protected], 2 [email protected] ABSTRACT Quality of Service (QoS) is a key factor in many research areas like multimedia real time systems, Web services, distributed systems, Business networking and runtime monitoring. QoS is multi-faceted, fuzzy and dynamic. Current researches focus on implementation level performance assurance, ignoring domain specific or application level metrics which are also very important to service users. In multimedia real time transmissions are distributed and it met various hurdles across the networks. Many real time protocols having difficulties to handle real time multimedia streaming content through the networks. The proposed system provides the multimedia streams to the end users in the high quality in terms reliability, scalability, and uptime with enlarge the communication bandwidth to transfer the compressed multimedia streams using Switched Ethernet Protocol(SEP) at the gateway of each network. Video compressors generate highly variable bit-rate streams that mismatch the constant-bit-rate channels typically provided by real-time protocols severely reducing the efficiency of network utilization. This model views on a framework with the bandwidth and the parameters which is related to the compression. The objective of the model is to provide best possible Quality of Service to each and every user across the networks that access the multimedia real time transmission. Keywords: Switched Ethernet (SEP) protocol, Index of Quality (IQ), Quality of Service (QoS), Non- Functional QoS, Functional QoS. 1. INTRODUCTION Business Network having the capacity to send the any number of multimedia content to any number of channel servers without any special setup which means the channels added in the network will be received the video. Compression of videos is the process of changing the bit rate of the video from constant to variable. Communication protocol allows only the constant bit rate videos not the video contain the variable bit rate. Some automation process is needed to change the bandwidth adapted to the variable bit rate. Elements of network performance within the scope of QoS often include availability (uptime), bandwidth (throughput), latency (delay), and error rate [14]. Depends upon the server or router's performance QoS parameters are identified as a network interface for the particular applications. QoS is especially important for the new generation of Internet applications. Ethernet were not designed to support accurate best performance while implement QoS solutions across the internet. The real time multimedia applications are distributed over the network and met various time with the specific characteristics of real time video streaming of multimedia systems. Video compressors generate highly variable bit-rate streams that mismatch the constant-bit-rate channels [13,14] typically provided by real-time protocols severely reducing the efficiency of network utilization. So it’s necessary to enlarge the communication bandwidth to transfer the compressed multimedia streams using Switched Ethernet (SEP) protocol [20]. SEP provides automatic process to calculate the compression level and change the bandwidth of the stream. The dynamic QOS management increases the automation process of recomposing the compressed rates and bandwidth allocation is established. In a previous work [14], the authors proposed taking advantage of the dynamic quality- of-service (QoS) management features of the FTT communication over switched Ethernet (SEP) protocol to perform the VBR-to-CBR adaptation
-
Upload
scadtechac -
Category
Documents
-
view
3 -
download
0
Transcript of A DYNAMIC QoS MODEL FOR MULTIMEDIA REAL TIME TRANSMISSION IN ENTERPRISE NETWORKS

Journal of Theoretical and Applied Information Technology 10
th April 2014. Vol. 62 No.1
© 2005 - 2014 JATIT & LLS. All rights reserved.
ISSN: 1992-8645 www.jatit.org E-ISSN: 1817-3195
214
A DYNAMIC QoS MODEL FOR MULTIMEDIA REAL TIME
TRANSMISSION IN ENTERPRISE NETWORKS
C.G.RAVICHANDRAN1, K.MANIVANNAN
2
1Department of Electronics and Communication Engineering, Excel Engineering College,
Komarapalayam, Namakkal, Tamilnadu-637303, India. 2Department of Computer Science and Engineering, PSNA College of Engineering & Technology,
Dindigul, Tamilnadu-624622, India.
E-mail: [email protected], [email protected]
ABSTRACT
Quality of Service (QoS) is a key factor in many research areas like multimedia real time systems, Web services, distributed systems, Business networking and runtime monitoring. QoS is multi-faceted, fuzzy and dynamic. Current researches focus on implementation level performance assurance, ignoring domain specific or application level metrics which are also very important to service users. In multimedia real time transmissions are distributed and it met various hurdles across the networks. Many real time protocols having difficulties to handle real time multimedia streaming content through the networks. The proposed system provides the multimedia streams to the end users in the high quality in terms reliability, scalability, and uptime with enlarge the communication bandwidth to transfer the compressed multimedia streams using Switched Ethernet Protocol(SEP) at the gateway of each network. Video compressors generate highly variable bit-rate streams that mismatch the constant-bit-rate channels typically provided by real-time protocols severely reducing the efficiency of network utilization. This model views on a framework with the bandwidth and the parameters which is related to the compression. The objective of the model is to provide best possible Quality of Service to each and every user across the networks that access the multimedia real time transmission. Keywords: Switched Ethernet (SEP) protocol, Index of Quality (IQ), Quality of Service (QoS), Non-
Functional QoS, Functional QoS.
1. INTRODUCTION
Business Network having the capacity to send the any number of multimedia content to any number of channel servers without any special setup which means the channels added in the network will be received the video. Compression of videos is the process of changing the bit rate of the video from constant to variable. Communication protocol allows only the constant bit rate videos not the video contain the variable bit rate. Some automation process is needed to change the bandwidth adapted to the variable bit rate. Elements of network performance within the scope of QoS often include availability (uptime), bandwidth (throughput), latency (delay), and error rate [14]. Depends upon the server or router's performance QoS parameters are identified as a network interface for the particular applications. QoS is especially important for the new generation of Internet applications. Ethernet were not designed to support accurate best performance while implement QoS solutions across the internet. The
real time multimedia applications are distributed over the network and met various time with the specific characteristics of real time video streaming of multimedia systems. Video compressors generate highly variable bit-rate streams that mismatch the constant-bit-rate channels [13,14] typically provided by real-time protocols severely reducing the efficiency of network utilization. So it’s necessary to enlarge the communication bandwidth to transfer the compressed multimedia streams using Switched Ethernet (SEP) protocol [20]. SEP provides automatic process to calculate the compression level and change the bandwidth of the stream. The dynamic QOS management increases the automation process of recomposing the compressed rates and bandwidth allocation is established. In a previous work [14], the authors proposed taking advantage of the dynamic quality-of-service (QoS) management features of the FTT communication over switched Ethernet (SEP) protocol to perform the VBR-to-CBR adaptation

Journal of Theoretical and Applied Information Technology 10
th April 2014. Vol. 62 No.1
© 2005 - 2014 JATIT & LLS. All rights reserved.
ISSN: 1992-8645 www.jatit.org E-ISSN: 1817-3195
215
with MJPEG video streams. This adaptation is based on a multidimensional mechanism that manages, in an integrated way, the compression parameters and the network bandwidth allocated to each stream. The streams’ bandwidth is adjusted online, depending on their relative importance, current compression levels, and global network utilization. The goal is to provide, at every instant, the best possible QoS to each stream, re computing
the compression levels and the allocated network bandwidth in response to significant events such as channel setup/teardown or video structural changes. The remainder of the paper is organized as follows Section 2 elaborates the deeply on related works on the same model. Section 3 demonstrates the system model in detail. Section 4 deals the experiments and comparison of various
results. Section 5 concludes the proposed system.
2. RELATED WORKS
Multimedia transmission over the Internet has been the subject of intense research in recent years [21, 23]. Typical solutions are based on the Transmission Control Protocol/User Datagram Protocol/Internet Protocol (IP) protocol stack complemented by other protocols, e.g., Real-Time Protocol/ Real-Time Control Protocol [23], Real-Time Streaming Protocol [27], or Session Initiation Protocol [21], which measure key network parameters, such as bandwidth usage, packet loss rate, and round-trip delays to control the load submitted to the network. The main drawback of these technologies concerning their use for industrial communications is the latency introduced. Video coding normally results in higher compression rates and, hence, lowers bandwidth requirements than still-image coding [3,4]. On the other hand, in video coding, the reaction to network load variation affects the compression level and, thus, the image quality, while the frame rate is kept constant. This approach is adequate for monitoring applications but not for MES or to surveillance/ recording applications which are often found in Business environments. Furthermore, still-image transmission is more robust than video transmission. This conclusion can be drawn from the fact that, in still-image compression, the frames are independent of each other, and thus, losing one image or parts of it has no consequence for the following images. In turn, video transmission uses different frame types, namely, I-frames, which are independent, but also P-frames, i.e., interfaces coded depending on previous frames, and sometimes B-frames that depend on following frames. This effect is further aggravated by a common practice that consists in enlarging the distance between I-frames to reduce the bandwidth utilization. Any of these situations can reduce severely the temporal redundancy and, thus, the level of compression that can be attained. Whenever timeliness requirements come into
play, the lower latency of JPEG with regard to other video/still-image compression techniques presents a significant advantage. The overall latency in video transmission arises from two main components, namely, the video codec and the network delay/losses [11]. The former ones can be strongly reduced by using still-image coding, as referred before. The latter ones can be improved by using real-time communication protocols, which usually provide CBR channels with bounded latency. Their use, however, requires matching the VBR streams generated by the video encoders to the fixed bandwidth provided by the communication channels. There are different approaches to this matching. Taking a conservative approach, one could reserve a channel with a capacity equal to the maximum bandwidth required by the multimedia source. While taking this approach guarantees that no frames are lost, the fact that the bandwidth requirement generated by multimedia sources typically exhibits a high variance leads to a potentially significant bandwidth waste. One possible approach to overcome this inefficiency problem would be reserving a channel with a capacity equal to the average required bandwidth. Despite being more efficient from a bandwidth point of view, this approach can lead to additional delays or to frame losses, depending on the existence and size of buffers at the source nodes, whenever the instantaneous required bandwidth exceeds the average value. Moreover, note that many applications comprise the transmission of several multimedia streams, thus multiplying the impact of these sources of inefficiency. The difficulty of fitting the VBR into CBR channels are being focused in this model. The dynamic QoS management features of the SEP protocol are used to adapt dynamically the bandwidth of the real-time communication channels. The adaptation mechanism takes as inputs the relative importance, the current allocated bandwidth, and the current compression level of each multimedia source, as well as the global network utilization,

Journal of Theoretical and Applied Information Technology 10
th April 2014. Vol. 62 No.1
© 2005 - 2014 JATIT & LLS. All rights reserved.
ISSN: 1992-8645 www.jatit.org E-ISSN: 1817-3195
216
re computing the compression levels and the allocated network bandwidth in response to significant events such as channel setup/teardown or video structural changes. The goal is to provide, at every instant, the best possible QoS to each stream. The admission control and scheduling capabilities of the SEP protocol allow carrying Fig. 1.QoS Management model.
3. PROPOSED QoS MODEL
The SEP protocol [2,5,20] was selected to address these communication requirements. This is a real-time master–slave protocol that includes features particularly well suited for supporting the needs of the framework herein presented, namely, dynamic traffic scheduling, online admission control, dynamic QoS management, and support of both isochronous and asynchronous traffic with temporal isolation. Fig 1 implies the architecture of SEP. SEP networks comprise a master node, which holds the message properties, a scheduler, an
admission control block, and a QoS manager. Slave nodes implement a transmission control layer that mediates the access to the network. Figure 1 implies the scheduling of traffic in SEP protocol. The master node periodically broadcasts a control message (trigger message) that contains the IDs of the messages that should be transmitted within a predefined interval, designated elementary cycle (EC). The master schedules the traffic dynamically, once every EC; thus, change requests are promptly reflected at the network level. The SEP protocol reserves part of the EC for real-time traffic, enforcing mutual isolation between traffic classes. The QoS manager distributes the network link bandwidth, referred to as US, among the channels according to a predefined QoS policy, the channel QoS parameters, and according to the current number of active channels. Note that US is a bandwidth bound that assures the timeliness of the communication channels in each link according to the scheduling policy in
use.
Figure 1 QoS Management Model
In the first two cases, the bandwidth redistribution is triggered externally, while in the latter case, it is triggered autonomously by a sequence of frames that are dropped or that fall
within the channel but above. There are two counters are used, namely, the overcount and undercount counters, which count the number of consecutive frames that fall above and below the target window. A QoS renegotiation is autonomously triggered whenever any of these counters exceeds a predefined quality change threshold QCT. Algorithm 3.1 shows the hierarchy of procedures involved in the QoS adaptation process. First, the QoS sublayer autonomously adjusts the quantification factor, in a frame-by frame basis, trying to keep the stream bandwidth. The system uses the nearest valid quantification factor (saturation function).

Journal of Theoretical and Applied Information Technology 10
th April 2014. Vol. 62 No.1
© 2005 - 2014 JATIT & LLS. All rights reserved.
ISSN: 1992-8645 www.jatit.org E-ISSN: 1817-3195
217
Whenever a QoS renegotiation is requested, several steps have to be performed. First, the desired bandwidth for each stream wdi is computed. Then, if the link bandwidth Us is not enough to satisfy the desired values, a bandwidth distribution algorithm is used to compute the effective bandwidth (wi) that each stream is allowed to use Algorithm 3.2. Finally, the computed bandwidth of each stream has to be translated into FTT operational parameters (P, Q) Note that there are many different possibilities to carry out both the bandwidth distribution and the mapping of stream bandwidth onto network parameters. The algorithms presented here and explained next are just one possibility that, nevertheless, is effective. Finally, note that Algorithm 3.1 that executes in the end nodes, as well as both Algorithms 3.2 and 3.3 that execute in the master node, incurs on a negligible computation overhead that, in a common PC hardware, may represent, at most, a few microseconds. Thus, this can be done without problems on a per-frame basis. To trigger the process and the communication of the new parameters by the master back to the slaves. In the worst case, the first operation may take two ECs, and the second one may take one EC.
Figure 2.System Architecture
Thus, the current system would even withstand a QoS renegotiation every frame, if needed. Nevertheless, the overhead control mechanisms included in this framework are still valuable since they allow using longer ECs and low computing power platforms, increasing the configuration flexibility.When a node needs to carry out a QoS renegotiation, its QoS sublayer starts by estimating the new desired transmission buffer sizes Bui. These are determined in a way
Algorithm 3.1: Si`=qosRegulation (Pi,Si)
Remarks: computes Si for next frame inside producer Ni
Remarks:Pinv
is the inverse model of P(S)
Si`← Si
if Pi > wi(1-�)
then
Si`← P
inv(Pi
T)
overcount ← overcount+1
else overcount ←0
if Pi < wi(3-�) then qi
`← P
inv(Pi
T)
undercount ← undercount+1 return Si
`
Algorithm 3.2: Wqos
=ωAllocation (M,US)
Remarks: Bandwidth capacity distribution
Uspare ← US - ∑ iωi
min
for each Mi M,sorted by Pri
do
{ if(ωi
d - ωi
min) < Uspare
then ωi ← (ωid - ωi
min)
else ωi ← Uspare
Uspare ← Uspare - ωi
ωiqos
← ωimin
+ωi
}
return(Wqos
={ ωiqos
,….., ωnqos
})
Algorithm 3.3:{(Pi,Qi)∀i} =
µCT(wqos
,N) Remarks: Succ(Qi) is the successor
of Ti in the monotonically increasing
set NiFTT
for each Ni N
do {
Qi=max{Qij, j=1,…..ni : Qi
j ≤ Pi / ωi
qos }
Pi = ωiqos
* Qi
}
Return ((Pi, Qi) i ,W={ω1,……. ωn})

Journal of Theoretical and Applied Information Technology 10
th April 2014. Vol. 62 No.1
© 2005 - 2014 JATIT & LLS. All rights reserved.
ISSN: 1992-8645 www.jatit.org E-ISSN: 1817-3195
218
to fulfill the maximum bandwidth requirement of each stream at each instant, i.e., using the R(q) model with the highest quantification level. Such values are then capped to the application specified upper bound on the frame size fsi . The following expression shows how these values are computed:
Bui = min (fsi, × Fi) (1)
The bandwidth distribution algorithm is arbitrary. It starts from the minimum bandwidth requirements (wmini) and distributes the remaining bandwidth among the channels following a strict priority order according to the Pri parameter and until there is no more system bandwidth to assign. In most cases, there will not be enough system bandwidth to satisfy all channel requests. In such circumstance, some channels will get the requested bandwidth; others will just get their minimum requirement bandwidth, while others will get an intermediate value of bandwidth between the previous two cases.The result of the bandwidth distribution in the previous step is the set of channel bandwidth assignments (wqos) for all channels in the model. Consequently, it must be converted into a (Pi, Qi) duplet to be used by the QoS and FTT sublayer. This conversion is not univocal since different (Pji, Qji) pairs may produce the same bandwidth. Furthermore, at the FTT level, P is bounded, and T may have restrictions, e.g., due to the need to match camera frame-rate restrictions, thus, a direct correspondence between wqosi and a (P, Q) pair may or may not exist. In this case, the mapping algorithm has to compute a bandwidth value that approaches, without exceeding, the bandwidth granted by the bandwidth distribution algorithm (i.e., wi = (Pi /Qi) ≤ wqos). Several mapping approaches are possible, and choosing the best one is application dependent. Algorithm 3.3 describes a mapping approach that attempts to maximize the transmission Ci. To do so, first, the algorithm computes the period T that corresponds to the allocated bandwidth wqosi with Pi = Pui. Since the periods are discrete, we use the closest but lower value in the monotonically increasing set TFTTi. This approximation eventually leads to a bandwidth wi that can be greater than the allocated one. In such cases, Pi is recomputed to match the allocated bandwidth. However, in the sequel, it may happen that the computed Pi violates the defined lower bound (Pi < Pli). In that case, the next value in the period
list succ(Ti) is selected, and Pi is made equal to Pui , which means that an exact bandwidth match cannot be found resulting in a reduced bandwidth wi. Finally, note that, as long as wi ≥ wmini = Pli / Qui, Pi < Pli implies that Pi < Qui , and thus, there will always be succ(Qi) in the set in that case.Within the nodes, the QoS sublayer is responsible for mapping the application QoS parameters onto network QoS parameters. The upper bound of the transmission buffer size
Figure 3 Mapping Of Variable Bit Rate To Constant
Bit Rate Channels
range Pui is determined in each QoS regulation, the buffer size is clearly assured from the QoS sublayer. Each QoS sublayer is also responsible for fitting the multimedia encoded stream within the granted channel bandwidth Wi. This is achieved by adapting the quantification level qi, possibly discarding frames, and even renegotiating the channel bandwidth with the QoS manager, whenever appropriate. The adaptation of q is based on the R(q) frame bandwidth model , where α and λ are considered constant for each stream,β is the frame specific, and q = 100 − q is the compression level which varies symmetrically with respect to the quantification factor
R(q) = � + ����
���� (2)
The actual use of this R(q) model is detailed in [14], and it allows deriving at instance k an estimate of the quantification level for the next frame qk+1 i that will generate a bandwidth Rk+1 i within a channel target window. This window is controlled by a parameter δ, resulting in [wi(1 − 3δ), wi(1 − δ)] ≡ [RT I ± wi δ]. The value of q k+1 is then defined as a function of the
Journal of Theoretical and Applied Information Technology 10
th April 2014. Vol. 62 No.1
© 2005 - 2014 JATIT & LLS. All rights reserved.
ISSN: 1992-8645 www.jatit.org E-ISSN: 1817-3195
219
current frame bandwidth Rki , the current channel bandwidth wi, and δ. Fig. 3 shows three possible scenarios at time t k+1 in which the resulting frame bandwidth falls outside the channel target window. In scenario the generated frame bandwidth Rk+1 exceeds the current channel width wi, causing a frame drop; it is within the channel width but over the target window, it is below the target window, leading
to an underutilization of the channel bandwidth. In all three scenarios, the adaptation is invoked to compute an estimate of the quantification level q k+2 that will generate an R k+2 that falls within the channel target window. The δ factor is a predefined relative fraction of the channel bandwidth, equal for all channels, that sets a compromise between higher efficiency in channel bandwidth utilization (lower δ values)
invocations (higher δ values). Currently, δ is set empirically. Future work will consider the use of channel-specific δ parameters and will analyze their optimization
4. EXPERIMENTAL RESULTS AND
DISCUSSIONS
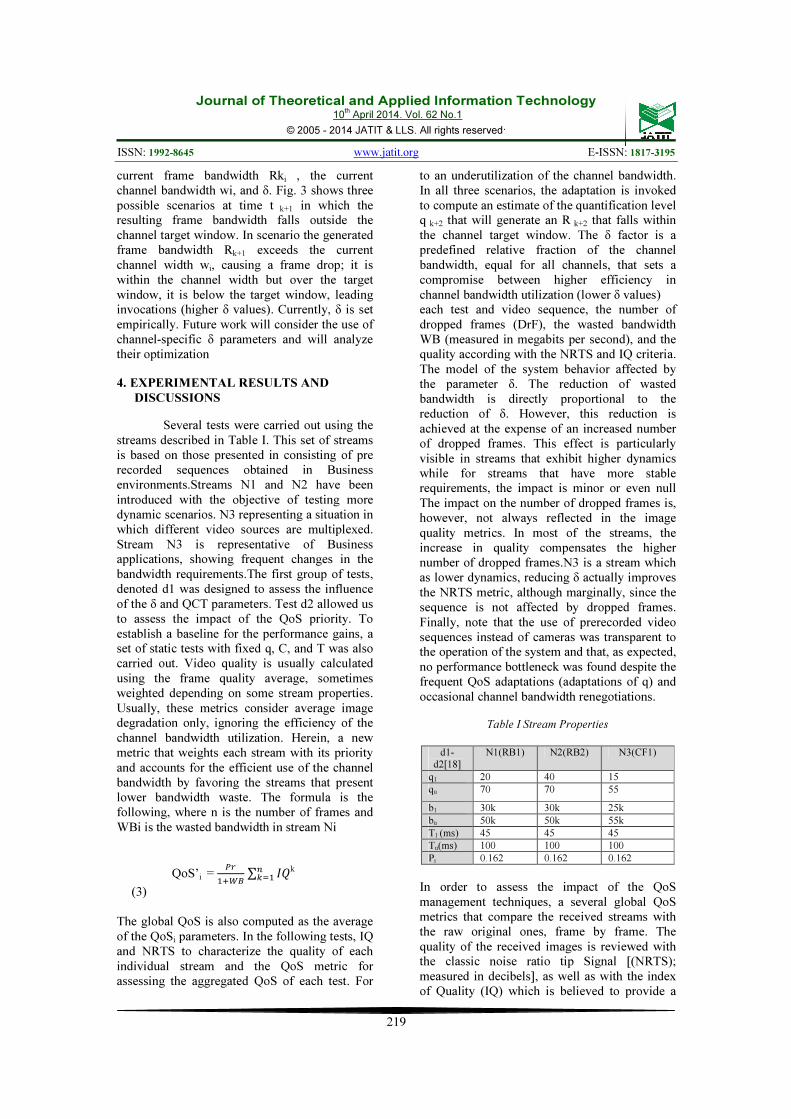
Several tests were carried out using the streams described in Table I. This set of streams is based on those presented in consisting of pre recorded sequences obtained in Business environments.Streams N1 and N2 have been introduced with the objective of testing more dynamic scenarios. N3 representing a situation in which different video sources are multiplexed. Stream N3 is representative of Business applications, showing frequent changes in the bandwidth requirements.The first group of tests, denoted d1 was designed to assess the influence of the δ and QCT parameters. Test d2 allowed us to assess the impact of the QoS priority. To establish a baseline for the performance gains, a set of static tests with fixed q, C, and T was also carried out. Video quality is usually calculated using the frame quality average, sometimes weighted depending on some stream properties. Usually, these metrics consider average image degradation only, ignoring the efficiency of the channel bandwidth utilization. Herein, a new metric that weights each stream with its priority and accounts for the efficient use of the channel bandwidth by favoring the streams that present lower bandwidth waste. The formula is the following, where n is the number of frames and WBi is the wasted bandwidth in stream Ni
QoS’i = ��
�� ∑ ��
��k
(3) The global QoS is also computed as the average of the QoSi parameters. In the following tests, IQ and NRTS to characterize the quality of each individual stream and the QoS metric for assessing the aggregated QoS of each test. For
each test and video sequence, the number of dropped frames (DrF), the wasted bandwidth WB (measured in megabits per second), and the quality according with the NRTS and IQ criteria. The model of the system behavior affected by the parameter δ. The reduction of wasted bandwidth is directly proportional to the reduction of δ. However, this reduction is achieved at the expense of an increased number of dropped frames. This effect is particularly visible in streams that exhibit higher dynamics while for streams that have more stable requirements, the impact is minor or even null The impact on the number of dropped frames is, however, not always reflected in the image quality metrics. In most of the streams, the increase in quality compensates the higher number of dropped frames.N3 is a stream which as lower dynamics, reducing δ actually improves the NRTS metric, although marginally, since the sequence is not affected by dropped frames. Finally, note that the use of prerecorded video sequences instead of cameras was transparent to the operation of the system and that, as expected, no performance bottleneck was found despite the frequent QoS adaptations (adaptations of q) and occasional channel bandwidth renegotiations.
Table I Stream Properties
d1-
d2[18]
N1(RB1) N2(RB2) N3(CF1)
q1 20 40 15
qu 70 70 55
b1 30k 30k 25k
bu 50k 50k 55k
T1 (ms) 45 45 45
Tu(ms) 100 100 100
Pr 0.162 0.162 0.162
In order to assess the impact of the QoS management techniques, a several global QoS metrics that compare the received streams with the raw original ones, frame by frame. The quality of the received images is reviewed with the classic noise ratio tip Signal [(NRTS); measured in decibels], as well as with the index of Quality (IQ) which is believed to provide a

Journal of Theoretical and Applied Information Technology 10
th April 2014. Vol. 62 No.1
© 2005 - 2014 JATIT & LLS. All rights reserved.
ISSN: 1992-8645 www.jatit.org E-ISSN: 1817-3195
220
better correlation with human perception than the NRTS. Video quality is usually calculated using the frame quality average, sometimes weighted depending on some stream properties. Usually, these metrics consider average image degradation only, ignoring the efficiency of the channel bandwidth utilization. Herein, a new metric that weights each stream with its priority and accounts for the efficient use of the channel bandwidth by favoring the streams that present lower bandwidth waste. The formula is the following, where n is the number of frames and WBi is the wasted bandwidth in stream Ni. The global QoS is also computed as the average of the QoSi parameters. In the following tests, the use of IQ and NRTS to characterize the quality of each individual stream and the QoS metric for assessing the aggregated QoS of each test.For each test and video sequence, the tables show the number of dropped frames (DrF), the wasted bandwidth WB (measured in megabits per second), and the quality according with the NRTS and IQ criteria. Reducing δ causes a consistent reduction on the wasted bandwidth, as expected. However, this reduction is achieved at the expense of an increased number of dropped frames. This effect is particularly visible in streams that exhibit higher dynamics while for streams that have more stable requirements, the impact is minor or even null.
Table II Dynamic Streaming Results d1 N1 N2 N3 Norm
Dropped Frames(DrF) 9 0 4 4.33
Wasted Bandwidth(WB) 0.78 1.0 0.67 0.82
Noise Ratio Tip
Signal(NRTS)
32.7 34.7 32.1 33.2
Index of Quality(IQ) 0.82 0.97 0.79 0.86
d2 N1 N2 N3 Norm
Dropped Frames(DrF) 15 8 17 13.33
Wasted Bandwidth(WB) 0.3 0.38 0.42 0.367
Noise Ratio Tip
Signal(NRTS)
32.3 33.9 32.1 32.77
Index of Quality(IQ) 0.82 0.84 0.81 0.82
Comparing Tables II and III clearly shows that the dynamic approach leads to significant improvements in all key aspects. The number of dropped frames is strongly reduced, mainly in the streams with higher dynamics. The quality metrics (NRTS and IQ) are also consistently similar or better. It should be remarked that these results are achieved with better bandwidth utilization.
Table III Static Streaming Results s1 N1 N2 N3 Norm
Dropped Frames(DrF) 6 0 9 5
Wasted Bandwidth(WB) 1.12 1.45 0.59 1.05
Noise Ratio Tip
Signal(NRTS)
29.4 32.9 29.78 30.7
Index of Quality(IQ) 0.86 0.84 0.85 0.85
s2 N1 N2 N3 Norm
Dropped Frames(DrF) 12 2 47 20.3
Wasted Bandwidth(WB) 1.44 1.18 0.64 1.09
Noise Ratio Tip
Signal(NRTS)
30.55 30.82 30.00 30.5
Index of Quality(IQ) 0.82 0.85 0.83 0.83
s3 N1 N2 N3 Norm
Dropped Frames(DrF) 2 60 60 40.67
Wasted Bandwidth(WB) 0.92 0.60 0.60 0.71
Noise Ratio Tip
Signal(NRTS)
34.4 32.30 32.07 32.92
Index of Quality(IQ) 0.89 0.85 0.86 0.87
Table IV presents the QoS' values for each test. The first conclusion that can be withdrawn is that, for properly selected δ parameters, the QoS attained with the dynamic approach can be significantly higher than that with the static approach. The
results have been compared with [20] the existing methodology results and the QoS values making higher effective and efficient results are obtained.Table V shows the QoS parameters with the sample web services with the variable bit rate real time Business application video frame. Sample service consists of high quality of images, sample service1 and sample service2 are deals with the dynamic web services. The table V deeply expresses the three
Table IV QoS results
Table V QoS Parameters for statistical properties
QoS' s1 s2 s3
0.43 0.45 0.47
QoS' d1 d2
0.49 0.58
Service
Name
Service URL Availa
bility
Respon
se Time
(in ms)
Through
put(in
kpbs)
SampleSe
rvice
http://192.168.5.75:8080/
mani/ts1.html
0.94 188.25 243
SampleSe
rvice_1
http://192.168.5.75:8080/
mani/ts2.html
0.74 175.26 310
SampleSe
rvice_2
http://192.168.5.75:8080/
mani/ts3.html
0.89 180.25 276
SampleSe
rvice_3
http://192.168.5.75:8080/
mani/ts4.html
0.79 176.22 316

Journal of Theoretical and Applied Information Technology 10
th April 2014. Vol. 62 No.1
© 2005 - 2014 JATIT & LLS. All rights reserved.
ISSN: 1992-8645 www.jatit.org E-ISSN: 1817-3195
221
Figure 4 Qos Parameters For Statistical Properties QoS parameters using SEP protocol. The high availability and throughput attained with dynamically in the tests which is requesting the live streams via web services with various quality live streams of Business networks undergone the tests and the results shows very high QoS non functional properties has achieved through the proposed model. Table VI shows the combined comparison of the various key elements obtained by the proposed model. The Index of Quality (IQ) is very high in the static and dynamic streams from the observation of the Table VI. Table VII clearly shows the proposed model has achieved the dynamic efficiency results with various sample services. The test involves with the different image quality sample services along with the real time motion objects. Figure 6 shows the availability comparison of two models and the it clearly shows the proposed model proved the efficient hike of the availability. Figure 7 deals for the response time of the static and dynamic stream tested with the above requirements and shows that the response time increased slightly high in the proposed structure. Figure 8 corresponds with the up time of the model and it urges the effective increment of the throughput of the model when compared with the existing model.
5. CONCLUSION AND FUTURE WORK
The network should be support the real
time multimedia transmission applications.
While using the CBR channels of the system the
performance of the system is increased instead of
using VBR channels. The proposed model has
ability to reduce the wasted bandwidth for
increasing performance of the multimedia
streams. The proposed QoS model proved that
changing the channel bandwidth dynamically
according to the streams and the available
bandwidth. The performance of the system is
being compared with the static channels using a
different set of video streams from the Business
environments. Many QoS parameters that
consider for the stream properties, quality of the
stream and the capability of the model to reduced
the wasted bandwidth to assess the performance.
The results obtained show a consistent
superiority of the dynamic adaptation
mechanism, particularly when there are streams
of different priorities. The adaptation is carried
out with reserved channels, thus maintaining the
temporal isolation feature among the streams and
other real-time traffic, thus being suitable for real
time sources integration. In future the various
changes of stream properties has adopt with the
different Business networks and the mechanism
will also support the stream dynamically
changing the quality of frames increasing the
Index of Quality.
REFERENCES
[1] Decotignie.J, “Ethernet-Based Real-Time and Industrial Communications”, Proceedings of the IEEE, Vol: 93 no.6 , pp: 1102 – 1117, June 2005.
[2] Pedreiras. P, Gai.P, Almeida.L, Buttazzo G.C,”FTT-Ethernet: a flexible real-time communication protocol that supports dynamic QoS management on Ethernet-based systems” IEEE Transactions on Vol: 1 no.3, pp: 162 – 172, Aug. 2005.
[3] Skeie.T, Johannessen.S, Holmeide.O, ”Timeliness of real-time IP communication in switched industrial Ethernet networks”, IEEE Transactions on Vol: 2 no:1 ,pp: 25 – 39,Feb. 2006.
0.94
0.74
0.89
0.79
0 0.5 1
SampleService
SampleService_1
SampleService_2
SampleService_3
QoS Availability
188.25 175.26
180.25
176.22
160 180 200
SampleService
SampleService_1
SampleService_2
SampleService_3
QoS Response Time

Journal of Theoretical and Applied Information Technology 10
th April 2014. Vol. 62 No.1
© 2005 - 2014 JATIT & LLS. All rights reserved.
ISSN: 1992-8645 www.jatit.org E-ISSN: 1817-3195
222
[4] Tao Yu, Kwei-Jay Lin, ”Service selection algorithms for Web services with end-to-end QoS constraints”, Proceedings. IEEE International Conference on 6-9 July 2004, pp: 129 – 136.
[5] Pedreiras.P, Luis. A, “The flexible time-triggered (FTT) paradigm: an approach to QoS management in distributed real-time systems”, Proceedings. International on 22-26 April 2003, pp: 9.
[6] Jasperneite.J, Imtiaz. J, Schumacher.M, Weber. K, “A Proposal for a Generic Real-Time Ethernet System”, Vol:5, no:2, pp:75 – 85, IEEE Transactions May 2009.
[7] Silvestre. J, Sempere.V, Albero.T, “Industrial video sequences for network performanceevaluation”,Proceedings.2004IEEEInternationalworkshop sept.2004,pp:343–347.
[8] F. G. Molinero, “Real-time requirements of media control applications,” in Proc. 19th Euromicro Conf. Real-Time Syst., Pisa, Italy, Jun. 2007.
[9] C.-S. Cho, B.-M. Chung, and M.-J. Park, “Development of real-time vision-based fabric inspection system,” IEEE Trans. Ind. Electron., vol. 52, no. 4, pp. 1073–1079, Aug. 2005.
[10] A. Kumar, “Computer-vision-based fabric defect detection: A survey,” IEEE Trans. Ind. Electron., vol. 55, no. 1, pp. 348–363, Jan. 2008.
[11] P. Vadakkepat, P. Lim, L. C. De Silva, L. Jing, and L. L. Ling, “Multimodal approach to human-face detection and tracking,” IEEE Trans. Ind. Electron., vol. 55, no. 3, pp. 1385–1393, Mar. 2008.
[12] C.-L. Hwang and C.-Y. Shih, “A distributed active-vision network-space approach for the navigation of a car-like wheeled robot,” IEEE Trans. Ind. Electron., vol. 56, no. 3, pp. 846–855, Mar. 2009.
[13] W.-F. Xie, Z. Li, X.-W. Tu, and C. Perron, “Servoing with laser pointer in robotic manufacturing systems,” IEEE Trans. Ind. Electron., vol. 56, no. 2, pp. 520–529, Feb. 2009
[14] Information Technology—Digital Compression and Coding of Continuous-Tone Still Images: Requirements and Guidelines, ISO/IEC 10918-1, Feb. 1994.
[15] M. W. Marcellin, M. J. Gormish, A. Bilgin, and M. P. Boliek, “An overview of JPEG-2000,” in Proc. DCC, Mar. 2000, pp. 523–541.
[16] Generic Coding of Moving Pictures and Associated Audio Information—Part 2, Video, ISO/IEC DIS 13818-2, May 1994.
[17] Video Coding for Low Bit Rate Communications, ITU-T Recommendation H.263, Apr. 1995.
[18] Coding of Audio-Visual Objects—Part 2: Visual, ISO/IEC 14496-2 (MPEG-4 Visual Version 1), Apr. 1999.
[19] B. Bouras and A. Gkamas, “Multimedia transmission with adaptative QoS based on real-time protocols,” Int. J. Commun. Syst., no. 16, pp. 225–248, 2003.
[20] R. Marau, L. Almeida, P. Pedreiras,J. Blanes “Online QoS Management for Multimedia Real-Time Transmission in Industrial Networks” in IEEE Transactions on Industrial Electronics, vol. 58, no. 3, march 2011.
[21] J. Silvestre, L. Almeida, R. Marau, and P. Pedreiras, “Dynamic QoS management for multimedia real-time transmission in industrial environments,” in Proc. 12th IEEE Int. Conf. Emerging Technol. Factory Autom.,Sep. 2007, pp. 1473–1480
[22] Mittal, A. Pande, and P. Kumar, “Content-based network resource allocation for real time remote laboratory applications,” in Signal, Image and Video Processing. New York: Springer-Verlag, 2012.
[23] J. Ribas-Corbera and S. Lei, “Rate control in DCT video coding for low delay communications,” IEEE Trans. Circuits
Syst. Video Technol., vol. 9, no. 1, pp. 172–185, Feb. 1999.
[24] J.-C. Tsai, “Rate control for low-delay video coding using a dynamic rate table,” IEEE Trans. Circuits Syst. Video Technol., vol. 15, no. 1, pp. 133–137, Jan. 2005.
[25] Z. Wang, L. Lu, and A. C. Bovik, “Video quality assessment based structural distortion measurement,” Signal Process.:
Image Commun., vol. 19, no. 2, pp. 121–132, Feb. 2004.
[26] Enrique lafuente hernandez, m.c. Frédérique laforest ,claudia catalina gutierrez rodriguez , “ evaluation framework for quality of service in web services: implementation in a pervasive environment” available in http://liris.cnrs.fr/ laboratoire
d'informatique en image et systèmes
d'information,2011.

Journal of Theoretical and Applied Information Technology 10
th April 2014. Vol. 62 No.1
© 2005 - 2014 JATIT & LLS. All rights reserved.
ISSN: 1992-8645 www.jatit.org E-ISSN: 1817-3195
223
Table VI Combined Comparison of Enhanced QoS Model parameters (different streams-N1, N2, and N3)
Figure5 Contribution of each stream
Table VII – Comparison of QoS Parameters with various services
0.49 0.58
0.48
0.55 0.6
0
0.1
0.2
0.3
0.4
0.5
0.6
0.7
s1d1 s2d2 s3
IQ
Static and Dynamic Streams
Static
Dynamic
Experimental Stream-Static 1
DrF WB NRTS IQ
Actual – ISO Standard 25 1.21 32.51 0.80
SEP [23] 28 1.17 32.12 0.81
Proposed Enhanced SEP Model
31 1.05 31.15 0.85
Experimental Stream-Dynamic 1
DrF WB NRTS IQ
Actual-ISO Standard 49 0.60 33.1 0.79
SEP[23] 52 0.58 33.4 0.81
Proposed Enhanced SEP Model
56 0.55 32.7 0.86
Experimental Service-Static 2
DrF WB NRTS IQ
Actual – ISO Standard 55 1.31 32.75 0.79
SEP [23] 58 1.25 32.12 0.80
Proposed Enhanced SEP Model
62 1.21 31.81 0.85
Experimental Service-Dynamic 2
DrF WB NRTS IQ
Actual-ISO Standard 18 0.63 35.21 0.85
SEP [23] 20 0.60 35.91 0.86
Proposed Enhanced SEP Model
23 0.58 34.44 0.90
Experimental Service-Static 3
DrF WB NRTS IQ
Actual – ISO Standard 112 1.01 32.45 0.76
SEP [23] 113 0.89 32.01 0.80
Proposed Enhanced SEP Model
117 0.75 30.56 0.85
Sample service Test
Existing Model [27] Proposed Work
Availability Response
Time (in
ms)
Throughput
(in kpbs)
Availability Response Time
(in ms) Throughput
(in kpbs)
Sample Service 0.90 180.15 225 0.94 188.25 243
SampleService_1 0.69 172.29 291 0.74 175.26 310
SampleService_2 0.84 179.21 257 0.89 180.25 276
SampleService_3 0.76 172.54 302 0.79 176.22 316

Journal of Theoretical and Applied Information Technology 10
th April 2014. Vol. 62 No.1
© 2005 - 2014 JATIT & LLS. All rights reserved.
ISSN: 1992-8645 www.jatit.org E-ISSN: 1817-3195
224
Figure 6 – Statistical values in the Availability
Figure 7 – Statistical values in the Response Time
Figure 8 – Statistical values in the Throughput
0
0.2
0.4
0.6
0.8
1
0 2 4 6
Availability
NF Services
QoS Non Functional Properties
Availability-Existing
Availability - Proposed
170
175
180
185
190
0 2 4 6
Response
Time -(in ms)
NF Services
QoS Non Functional Properties
Response Time-
Existing
Response Time-
Proposed
0
50
100
150
200
250
300
350
0 1 2 3 4 5
Throughput
(Kbps)
NF Services
QoS Non Functional Properties
Throughput-Existing
Throughput-Proposed