13 MULTIMEDIA
298
7. File-Oriented Approach and Database Approach 8. 2-Tier and 3-Tier Client-Server architecture 13 MULTIMEDIA Contents Multimedia: definition—Mass media and multimedia Characteristics of multimedia system— Computer, integration of elements, digital format, interactive Elements of multimedia o Text—Text font, text effects, text animation, text on the Internet o Graphics—Image resolution, image color, image file size, image compression, image capture, bitmap graphics, vector graphics o Audio—Properties of sound, digital audio, sound hardware, sound sampling, sound digitization, music and speech, audio file formats, audio editors, sound compression, selecting a quality audio, audio from a CD to web o Video—Analog and digital video, video editing, digitizing analog video, video compression, video file formats, video on Internet o Animation—Process of animation, creation of animation, hardware and software for animation, animation file formats Multimedia system—Desirable features of multimedia system Multimedia applications—Education, entertainment, training, business, virtual reality Why this chapter Listening to music (CD player, iPod or mp3 player), watching movies (CD, Internet), loading photographs from digital camera to the computer, loading the video clip to the computer, watching animation movies, and playing computer games are some of the multimedia applications. You are using multimedia, quite often, almost every day. The purpose of this chapter is to introduce you to the Multimedia and its elements, and the multimedia applications. 13.1 INTRODUCTION Newspaper and television are the common medium of mass communication. However, they differ in the way they present information to the user. The information in a newspaper is presented as a combination of text, image, and graphics. This has a different impact on the user than the information presented on the television as a combination of image, photo, video, sound and music. Similarly, talking over a telephone (using sound) has a different impact on the user, than, talking using the Internet telephone with a web camera (sound and photo) attached to it. In other words, the same information when presented using different media has a different impact on the user. Or, we can say that the media used for presenting the information affects the way the
-
Upload
khangminh22 -
Category
Documents
-
view
1 -
download
0
Transcript of 13 MULTIMEDIA

7. File-Oriented Approach and Database Approach8. 2-Tier and 3-Tier Client-Server architecture
13
MULTIMEDIA
Contents
Multimedia: definition—Mass media and multimedia Characteristics of multimedia system— Computer, integration of elements, digital format,
interactive Elements of multimedia
o Text—Text font, text effects, text animation, text on the Interneto Graphics—Image resolution, image color, image file size, image compression, image
capture, bitmap graphics, vector graphicso Audio—Properties of sound, digital audio, sound hardware, sound sampling, sound
digitization, music and speech, audio file formats, audio editors, sound compression,selecting a quality audio, audio from a CD to web
o Video—Analog and digital video, video editing, digitizing analog video, videocompression, video file formats, video on Internet
o Animation—Process of animation, creation of animation, hardware and software foranimation, animation file formats
Multimedia system—Desirable features of multimedia system Multimedia applications—Education, entertainment, training, business, virtual reality
Why this chapter
Listening to music (CD player, iPod or mp3 player), watching movies (CD, Internet), loadingphotographs from digital camera to the computer, loading the video clip to the computer,watching animation movies, and playing computer games are some of the multimediaapplications. You are using multimedia, quite often, almost every day. The purpose of thischapter is to introduce you to the Multimedia and its elements, and the multimedia applications.
13.1 INTRODUCTION
Newspaper and television are the common medium of mass communication. However, theydiffer in the way they present information to the user. The information in a newspaper ispresented as a combination of text, image, and graphics. This has a different impact on the userthan the information presented on the television as a combination of image, photo, video, soundand music. Similarly, talking over a telephone (using sound) has a different impact on the user,than, talking using the Internet telephone with a web camera (sound and photo) attached to it. Inother words, the same information when presented using different media has a different impacton the user. Or, we can say that the media used for presenting the information affects the way the

user perceives and understands the information. Multimedia is a combination of graphics, audio,text, animation, and video using the computer.
In this chapter, we will study the different elements of multimedia like sound, graphics, text, andanimation, in detail. This chapter also describes the hardware requirements for the multimediasystems like input and output devices, and the storage requirements. It also discusses thesoftware tools required for drawing images, creating videos, introducing sound effects, and forthe compression of multimedia files. Finally, the chapter discusses the penetration of multimediain our lives, in diverse areas like education, business, training, and entertainment.
13.2 MULTIMEDIA: DEFINITION
Newspaper, radio, television and films are some of the earliest and traditional means of masscommunication that use mass media. Newspapers use text, image and graphics, and, televisionuses text, image, graphics, and sound (Figure 13.1). In these traditional means ofcommunication, the communication is one-way—from the media to the mass users. The usersimply reads the newspaper, listens to the radio, and watches the television and films, and,cannot in any way manipulate the media. Mass media is used by the user in a sequence, linearly.For example, a text book consists of a sequence of combination of text, graphics, and images.The text book is meant to be read linearly from the start to the end. With mass media, the user isin a passive state (receiving whatever is communicated).
Figure 13.1 Mass media
The word multimedia consists of two words—multi and media. The word multi means many andthe word media (plural of medium) are the means through which information is shared. There aredifferent mediums of sharing information like sound, text, image, graphics, animation or video.Multimedia represents information through a variety of media. Multimedia is a combination ofmore than one media—text, graphics, images, audio, or video, which is used for presenting,sharing, and disseminating the information (Figure 13.2). Multimedia is delivered through thecomputer and microprocessor-based devices, thereby introducing the elements of interactivity,which differentiates it from the traditional forms of media (also called mass media). Multimediaor Interactive multimedia allows the user and the multimedia application to respond to each

other. The user is able to control the elements of the multimedia application in terms of whatelements will be delivered and when. Since multimedia systems are integrated with computers,they are also referred to as the digital multimedia system.
13.3 CHARACTERISTICS OF MULTIMEDIA SYSTEM
A multimedia system has four basic characteristics:
Computer is an intrinsic part of the multimedia system. As a result, multimedia has becomeinteractive. In multimedia, computer allows the user to interact with the media and thusmanipulate it by controlling what is to be communicated and when. Multimedia has resulted inthe creation of many new possibilities—(1) the computational power of computer is utilized formultimedia applications, (2) the telecommunication network (Internet, WWW) along with thecomputer enables transmission and distribution of information, and, (3) the use of computerfacilitates design and creation of a variety of new applications.
Figure 13.2 Multimedia
The different elements of multimedia are combined and integrated into a single multimediasystem. Special software is required for the integration of different media element files.
The use of computer in multimedia requires all elements of multimedia to be in digital format.In a digital multimedia system, the media streams are digital and are produced, processed,stored, represented and transmitted using computers. The digital nature of multimedia requiresspecial treatment of the multimedia elements. The hardware and software are needed toconvert multimedia elements from analog to digital format and vice versa. There is a need todecide about the resolution versus quality of output required, during storing of data in thecomputer. Storing multimedia files on computer hard disk takes large amount of disk space, socompression technologies and file formats for storing the different media elements is required.Moreover, special programs are required to play the compressed files. Similarly, special

software is required to edit the different media element files, and to combine and integrate thedifferent elements of the multimedia into a single multimedia system.
Multimedia system is interactive. The user is active and can manipulate whatever is beingcommunicated. Multimedia allows two-way communication. The user can use devices likekeyboard, trackball or joystick to interact with the multimedia system. Interactive multimedia isnon-linear. The user is able to follow the links and jump from one part of the document to theother. Hypermedia enables a user to gain or provide access to text, audio and video, andcomputer graphics using links in a non-linear way, using computers. World Wide Web (WWW) isan example of hypermedia application. The user is able to respond and control what to see orhear and when to do it.
13.4 ELEMENTS OF MULTIMEDIA
A multimedia system consists of several elements like—text, graphics, sound, video, andanimation. The data streams of these different elements of the multimedia system are of twokinds—time-dependent, and time-independent. Media like text, graphics, and image are time-independent. The information is not dependent on the timing of the data stream when using thesemedia. However, media like audio, video, and animation are time-dependent. In time-dependentmedia, the data streams must appear at regular time intervals for the purposes of continuity.
The different media elements are described briefly in the following subsections.
13.4.1 Text
Text is an important element of multimedia. The purpose of using text is to write titles, to definemenus, to navigate, and to write the content.
The text in multimedia is different from the traditional text written using paper and pen.Multimedia text is combined with other elements like graphics and pictures to deliver apowerful effect. Multimedia text can be written in a way that the user needs to jump back andforth, written in multiple channels like pictures, sound, animation, and colored text.
The text must be short and relevant wherever used. Text is often mixed with art resulting in amuch greater impact on the user. Text can also be animated. Text has evolved from beingdisplayed in one size and one color under MS-DOS, to being specified using fonts and color on acolor monitor having Windows, to the vector-based text by Adobe which uses graphics-basedfonts and creates images.
Text Font—The text can be written in different fonts: (Figure 13.3) A font is composed of threethings—typeface, style and size. Arial, Courier, Times are typefaces. Bold and italics are styles.Size is the length of the character (from top to bottom). Arial 11-point italic is a font.
Text effects allow special effects to be added to text fonts by adding depth and visual impact (2Dand 3D effects). Text effects can be created using MS-Word’s WordArt (Figure 13.4). In WordArt,text is treated as a drawing object, i.e. text can be manipulated like an object. WordArt providesspecial effects to the text like, depth, direction, shape, color, and texture. Figure 13.5 shows thesame text with different text effects.
Text animation can be used to make the text move, change or flash. MS-WORD and MS-Power-Point can be used for text animation.

Figure 13.3 Using different text fonts
Figure 13.4 WordArt in MS-Word 2007
Figure 13.5 Text with different font colour, text effects etc.

Text on the Internet can be represented as hypertext. A hypertext uses documents to beconnected via hyperlink. Using hypertext, different documents can be linked and different partsof the same document can be linked. Hyperlinks allow the user to navigate the document in anon-linear way. Using of hyperlink results in the breakdown of the information into small parts(Figure 13.6).
13.4.2 Graphics
Communication via pictures is easier to understand. Graphics is the most important element ofmultimedia. Multimedia presentations are predominantly graphics-based. Graphics elements in amultimedia system are images that could be still pictures (like photographs) converted to digitalformat with the help of scanners, or pictures generated on the computer. They may be 2-dimensional such as photographs, or, 3-dimensional such as objects around us. They may beeither static graphic elements or animated. In computer graphics, an image is always a digitalimage.
Figure 13.6 Text hyperlinks

Image Resolution: The resolution of an image is the number of pixels in the digital image relativeto the physical size of the original material. Resolution is measured in dpi (dots per inch) and isapplied to the image and also to the input and output devices used to scan or print the image.Resolution of monitor is generally, 72 pixels/inch. Higher the resolution, better is the picture.
Image Color: There are two image color models—Red, Green, and Blue (RGB) model, and,Hue,Saturation, and Lightness (HSL) model. The three colors—red, green, and blue—give us quite alarge spectrum by just adding colors. In HSL, the classification of the color circle rests upon threeattributes of colors, called Hue, Brightness, and Saturation.
Image File Size: The image that has been created has to be stored on the computer. The size ofadigital graphic is the size of the graphics file on the computer. The size of graphic files isdependent on three things—(i) Dimension ofthegraphics is the physical size (maximum heightand width in pixels), (ii) Bit-depth is the amount of color information stored in each pixel, and(iii) the compression used to store the image. The quality and size of the graphics file isdependent on the amount of compression used.
Image Compression: Usage of compression technologies is important, especially, for graphicsusedon the Internet, since download time goes up drastically with increasing file size. While theimage is compressed, the quality of the image must not suffer. Two image compressionalgorithms are widely used on the Internet—Joint Photographic Experts Group (JPEG) andGraphical Interchange Format (GIF).
o JPEG compression works well with 24-bit color images (true color). It is suited for imagesthat contain many colors (such as photographs). Figure 13.7 shows files stored with type.jpeg in Windows XP.
Figure 13.7 Pictures stored as jpeg
o GIF supports 8 bits of color information (Grayscale, Color map). GIF compression issuited to images such as line drawings, for images containing text, and cartoonscontaining at most 256 colors. It is preferred for vector graphics over the Internet.
o jpg (for JPEG) and .gif (for GIF) are the most common file formats in use on the web. Arelatively new file format—portable network graphic (.png), improves upon some of .giffeatures. Web browsers require plug-ins for .png.
Image Capture: The graphic images on the computer can either be created using editors or canbe loaded from the devices that capture the graphics images. Scanner, digital camera, digitalvideo camera, and clip art are devices used for loading images on to the computer. Scannerlooks like a photocopy machine and is used to copy an image to the computer. It converts ananalog picture into digital format. Digital camera stores digitized images and digital video

camera stores digitized images with motion, on the computer. Clip art are built-in collection ofpictures on many word processors (Figure 13.8).
There are two types of digital graphics—bitmap graphics and vector graphics.
13.4.2.1 Bitmap Graphics
In bitmap graphics, computer programs store pictures as pixel maps (bit-maps or raster images).The monitor is divided into a grid of pixels (short form of picture elements). Screen area of 800 ×600 pixels is common on Windows platform. Each pixel contains value representing a particularcolor. When a picture is sent to the screen, a graphics driver converts the picture data to pixelvalues on the display.
Bitmap editors allow creating and editing graphics as bitmaps. For example, to retouch aphotograph, just scan it and use bitmap editor to edit it (Figure 13.9). The paint programs andphotoediting programs are bitmap-based programs. Some of the commonly used bitmap editorsare Lview Pro, GIF 89a, Paint Shop Pro, Adobe Photoshop, Fractal Design Painter, Flash, CorelDraw, Corel Photo Paint, and 3D Studio. Figure 13.10 shows an image to be edited in AdobePhotoshop.
Figure 13.8 Clip art in MS-Word 2007

Figure 13.9 A bitmap image
Figure 13.10 Adobe Photoshop
A bitmap image is stored in the bit-mapped (or raster image) file format. Scanners, digitalcamera and digital video camera store images as bitmap images.
Some formats for storing bitmap graphics files are GIF, JPEG, BitMaP (BMP), PostScript (PS), IRIS,and Tagged Image File Format (TIFF).
13.4.2.2 Vector Graphics

Vector graphics uses various mathematical tracks to create graphics. It uses mathematicalequations for the representation of the location, size, color fill, pattern fill etc. Vector graphics issuited for graphic images that require frequent re-sizing (small or enlarge), and repositioning.
Vector editors allow creation and editing of vector graphics. Vector editor is used to drawcartoons, and to create or modify more complicated graphics such as photographs. For example,a geometric figure (straight line or circle) can be drawn on the monitor by using a mathematicalequation. Adobe® Illustrator is an example of vector editor. The Computer Aided Design (CAD)programs, 3-dimensional modeling and animation programs are vector-based programs.
A picture stored as a vector graphic, when enlarged, appears sharp on the screen in comparisonto an enlarged picture using bitmap. This is because in vector graphics the re-sizing requiresusing different values in the mathematical equation representing the graphics. Clip art imagecan be stored both as bitmap and vector graphics.
13.4.3 Audio
Sound consists of all possible sounds which may or may not be audible to humans. Audioconsists of the sounds humans can hear. For example, the sound emitted by the dog-whistle isheard by dogs but not by humans. The presence of sound enhances the effect of a graphicpresentation, video or animation. In a multimedia project, sound can be used in two ways. It canbe used to provide audio content in a multimedia system such as, narration for a clip playing onthe screen; audio sound tracks in movies; short instructions; or, music to communicate as in asong. Sound can also be used in the background and for sound effects.
Sound is produced through vibrations and pressure variations in the air. The vibrations generatea waveform repeated at regular intervals (periods).
Properties of Soundo Amplitude measures the relative loudness or volume of the sound. It is measured in
decibels.o Frequency or pitch is the vibrations per second. If an object vibrates rapidly, it creates a
high-pitched sound. A low-pitch sound is produced by an object that vibrates slowly. Theunit of frequency is hertz (Hz). The human ear can hear frequencies in the range of 20Hzto 20 kHz.
o Bandwidth is the difference between the highest and the lowest frequency contained ina sound signal. A signal with frequency range of 200 Hz to 3,200 Hz, has a bandwidth of3,000 Hz (= 3,200−200).
Digital Audio―Audio is analog in nature and is a con nuous waveform. Also, acous cinstruments produce analog sounds. A computer needs to transfer the analog sound waves intoits digital representation consisting of discrete numbers. Representation of a waveform in adigital way is made by an Analog-to-Digital Converter (ADC). The reverse process is calledDigital-to-Analog Conversion (DAC).
Sound Hardware—Microphone and Speakers are the devices connected to the ADC and DAC,respectively. A microphone converts the sound waves into electrical signals. This signal isamplified, filtered, and sent to ADC. This information is then retrieved and edited using acomputer. To convert this data into sound waves, the audio data is sent to the speakers via aDAC and a reconstruction filter. This produces the analog sound waves that human beings canhear.

Sound Sampling—is a process that converts the analog signal into a digital format. Soundsampling transfers a continuous sound wave into discrete numbers. The rate at which thecontinuous waveform is sampled is called the sampling rate. The rate varies from 5,000–90,000samples/ second. Sampling rate is an important factor in determining how accurately thedigitized sound represents the original analog sound. E.g. CD (Compact Disk) sampling rate is44.1 kHz (44,100 samples/sec) and telephone quality audio is sampled at 8 kHz.
Sound Digitization—is the process of assigning a discrete value to each of the sampled values. Itis performed by an ADC. Recording at high sampling rates produces a more accurate capture ofthe high-frequency content of the sound. Along with the sampling rate, the resolutiondetermines the accuracy with which the sound is digitized. The increase in the number of bits ina recording makes the sound playback increasingly realistic. Sound formats are standard in mostaudio editing software. Sampling rates of 8, 11, 22, and 44 kHz are normally used. There is noloss of quality when reproducing digital audio.
Music and Speech—Digital audio (music and speech) can be created or synthesized using thecomputer. Synthesized sounds are a set of instructions to the hardware audio device on howand when to produce sound.
o Musical Instrument Digital Interface (MIDI) format is the most widely used digital formatfor generating synthesized sound. In MIDI, the actual data is not recorded. MIDI worksby recording the keys depressed, time when the key was depressed, duration for whichthe key was depressed, and how hard the key was struck. Almost all software thatsupport audio can play MIDI files.
o Speech is the natural form of human communication. Speech is time-bound, dynamic,and transient. Distortion and noise are some of the speech effects.
Audio File Formats—The audio is stored on the computer as an audio file. Some commonly usedaudio file formats are—Resource Interleave File Format (RIFF) saved with extension (.wav),Motion Picture Experts Group (MPEG) as (mpg, mp2, mp3), or MIDI as (.mid, midi).
Audio Editors—Audio editors are used to record or manipulate audio files. The editors require asound card to be installed on the computer. The editors allow the user to perform functions likecopy and paste, and, concatenate, append, or mix two or more audio files. Sound effects can beincorporated in audio files using audio editors. Some common audio editing software forWindows are—Cool Edit, Sound Forge XP, Audacity, and Wave Flow. Figure 13.11 shows the iconof Audacity audio editor.
Figure 13.11 An audioeditor software
Audio Compression—Compression is used to reduce the physical size of data so that it occupiesless storage space and memory. Compressed audio files are easier and faster to transfer (smallsize), and also reduces bandwidth utilization thus providing good sound quality. Sinceapplications exchange audio data using networks, standards like International ConsultativeCommittee for Telephone and Telegraph (CCITT), International Standard Organization (ISO), andMPEG are used to achieve the compatibility. The most commonly used compression scheme foraudio is MPEG. MPEG audio coding can compress the original audio on a CD by a factor of 12

without losing the sound quality. Audio files are often encoded in Mp3 (compression ratio is1:10–1:12) as it is the most preferred format for PC and Internet applications.
Selecting a Quality Audio—The choice of sampling rate and compression for an audio dependsupon its use. Sound that is to be embedded on a web page and downloaded over the Internetuses a low or medium sampling rate with compression. For recording a song on a CD, thehighest sampling rate of 44.1 kHz is used. Figure 13.12 and Figure 13.13 shows an audio file inwindows Media players and Audacity, respectively.
13.4.3.1 Audio from a CD to Web
The conversion of audio from a CD onto the web is done in two steps—CD Ripping and MPSEncoding.
CD Ripping—is a process of converting audio CD into .wav format. It uses a program known asthe CD Ripper or Grabber. A grabber reads the digital data directly from the CD and stores it as a.wav file on the hard disk. The .wav file produced by CD ripper contains exactly the sameinformation that is on the CD, without any loss of quality. The .wav file is huge (10 MB perminute of sound), and is difficult to store and transfer.
Figure 13.12 An audio file playing on Windows media vplayer
Figure 13.13 An audio file open in audacity audio editor
MPS Encoding—is the process of converting a wave file into Mp3 format. The size of the MPSfile is about 12 times smaller than that of the wave file, while the quality of MPS file is almostsame as the original file. MPS encoding removes frequencies that cannot be heard by the humanear (< 20 Hz and > 20 kHz) from the wave file. Sounds masked by other sounds are also removedby MPS conversion. Common MPS encoders are CODEC (user has to pay for it), and mpegEncv0.07 and MPlifier vO.52 (freely available). Figure 13.14 shows the lame audio software icon.
Figure 13.14 Audio software to convert to mp3 file
To play Mp3 music—
Get an MPS player (Winamp—Free download from www.mpS.com) Get music—from the Web, or create MPS file from CD music. To create MPS file, convert CD
music to MPS format.o Use CD ripper software, (WinDacS2—Free download) to convert the analog signal from
audio CD to a digital file. It will create .wav file from CD music.o Convert the created .wav file to MPS using an encoder v0.06 by SoloH. It takes one hour
to do one song.
13.4.4 Video

Video is another element of multimedia. Video and audio are closely related, and together theyare the most effective means of communication that can be a part of the multimedia system(Figure 13.15). Digital video is used in making of movies, gaming, and IT industry. The DigitalVideo Disk (DVD) makes it possible to distribute large videos in a compact form.
Figure 13.15 A video film
Analog and Digital Video—Digital video allows random access within a movie; cut, paste, or editvideo; and addition of special effects. It is easy to duplicate digital video without loss of quality.Digital video also allows for interactivity. The video seen on TV, cable TV, or VCR is broadcast inanalog format.
Video Editing—Digital video is easy to edit. Editing involves removing frames, inserting frames,mixing audio with video, creating special effects on video, superimposing clips, adjustingtransparency, and adjusting volume of audio (Figure 13.16). Some of the software packages thatsupport editing are Adobe Premiere, Adobe AfterEffects CS4 and Strata Avid Video.
Figure 13.16 Video software
Digitizing Analog Video—The process of digitizing analog video is called video capture. Video iscaptured using plug-in cards called video capture cards. A video capture card accepts a video

input from an input device such as a VCR or a video camera. The audio is sampled through aseparate cable which attaches to the sound card. The software with the video card synchronizesthe two channels of audio and video. With the software that comes with the video card, thevideo capture process is started. Digital cameras can directly store full-motion video in digitalformats that can be copied onto a computer’s hard disk.
Video Compression—Digital video files are extremely large files that take a large amount of diskspace, and require high data transfer rates from hard disk to screen. Compression restructuresthe data to reduce the size of the file. A compressed video file is decompressed when it isplayed. Several compression/decompression (codec) algorithms are available for compressingdigital videos. Codecs may be asymmetric or symmetric; software-based, hardware-based, orboth. A symmetric codec takes almost the same time to compress and decompress data. Anasymmetric codec takes longer to encode video than it does to decode. Microsoft Video 1,Cinepak and Intel Indeo Video Raw are some of the Window-based codecs. Motion JPEG(MJPEG), MPEG-1, MPEG-2 are examples of the hardware-based codecs.
Video File Formats—The digital video is saved on the disk in a video file format. The AVI formatis used for the PC, and Quicktime format is used for Macintosh. The AVI format is used to playvideo in the Windows environment. It supports 256 colors to millions of colors, sound from 5kHz Mono to CD quality stereo sound, and, can deliver video at rates ranging from 0.03 MB/secto 0.3 MB/sec. Quicktime is similar to the AVI format, and can be viewed on almost everyplatform available. Figure 13.17 shows a snapshot of Windows Movie Maker.
13.4.4.1 Video on Internet
A video captured in real time from a live source is broadcasted using live camera web site. Ittakes video input from a video camera and compresses it to a size that can be delivered over theInternet. Streaming video and surround video are the technology that makes video on the Internetpossible.
Streaming Video—allows transmitting of real time video via the Internet, enabling a user towatch the video as it downloads. The video file takes a few seconds to load before starting theimage. If the transmission slows down, the reserve of video available to the user’s computermemory is used for uninterrupted viewing. VDOLive, RealVideo, Web Theater, and StreamWorks are some of the streaming video products. Figure 13.18 shows a popular video streamingsite.

Figure 13.17 Windows movie maker
Figure 13.18 Streaming video (http://www.youtube.com/)
Surround Video—allows the user to turn the image around in a Web page and interact with itfrom every angle. This is used for displaying products allowing the user to zoom in to any pointand click on URL links.
13.4.5 Animation
Animation is creating of an illusion of movement from a series of still drawings (Figure 13.19).To create a feeling of motion of an image (still drawing), the image is projected on the screen as
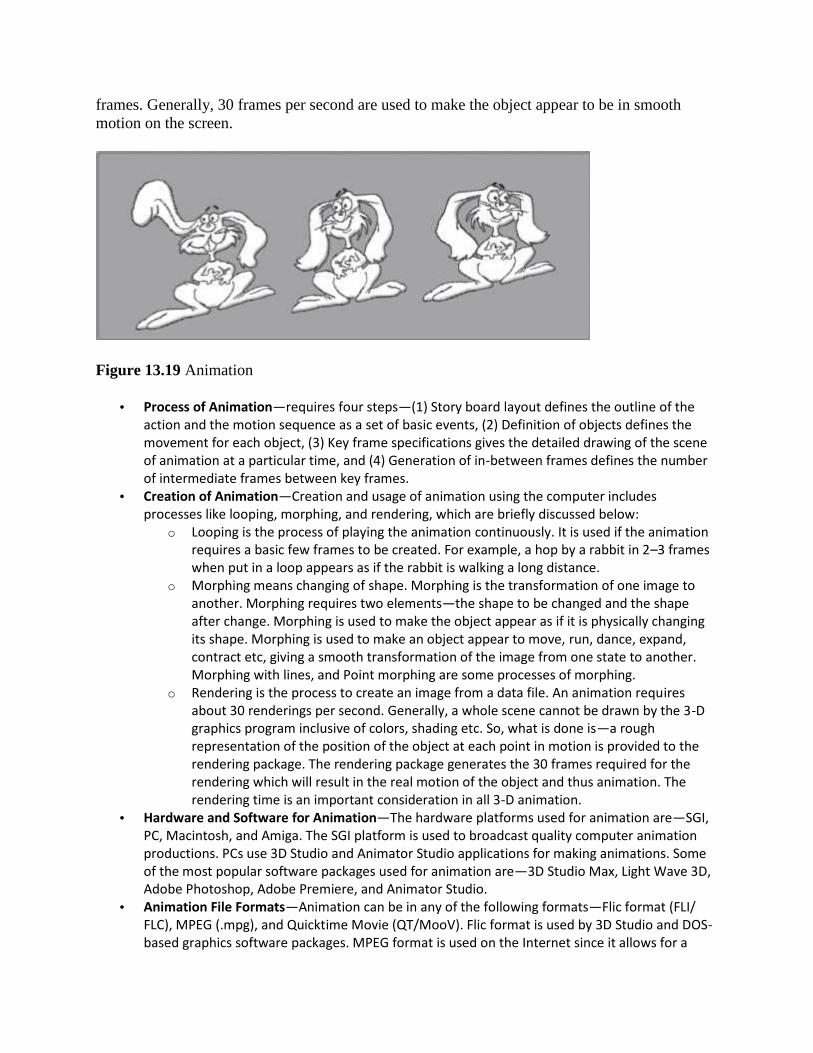
frames. Generally, 30 frames per second are used to make the object appear to be in smoothmotion on the screen.
Figure 13.19 Animation
Process of Animation—requires four steps—(1) Story board layout defines the outline of theaction and the motion sequence as a set of basic events, (2) Definition of objects defines themovement for each object, (3) Key frame specifications gives the detailed drawing of the sceneof animation at a particular time, and (4) Generation of in-between frames defines the numberof intermediate frames between key frames.
Creation of Animation—Creation and usage of animation using the computer includesprocesses like looping, morphing, and rendering, which are briefly discussed below:
o Looping is the process of playing the animation continuously. It is used if the animationrequires a basic few frames to be created. For example, a hop by a rabbit in 2–3 frameswhen put in a loop appears as if the rabbit is walking a long distance.
o Morphing means changing of shape. Morphing is the transformation of one image toanother. Morphing requires two elements—the shape to be changed and the shapeafter change. Morphing is used to make the object appear as if it is physically changingits shape. Morphing is used to make an object appear to move, run, dance, expand,contract etc, giving a smooth transformation of the image from one state to another.Morphing with lines, and Point morphing are some processes of morphing.
o Rendering is the process to create an image from a data file. An animation requiresabout 30 renderings per second. Generally, a whole scene cannot be drawn by the 3-Dgraphics program inclusive of colors, shading etc. So, what is done is—a roughrepresentation of the position of the object at each point in motion is provided to therendering package. The rendering package generates the 30 frames required for therendering which will result in the real motion of the object and thus animation. Therendering time is an important consideration in all 3-D animation.
Hardware and Software for Animation—The hardware platforms used for animation are—SGI,PC, Macintosh, and Amiga. The SGI platform is used to broadcast quality computer animationproductions. PCs use 3D Studio and Animator Studio applications for making animations. Someof the most popular software packages used for animation are—3D Studio Max, Light Wave 3D,Adobe Photoshop, Adobe Premiere, and Animator Studio.
Animation File Formats—Animation can be in any of the following formats—Flic format (FLI/FLC), MPEG (.mpg), and Quicktime Movie (QT/MooV). Flic format is used by 3D Studio and DOS-based graphics software packages. MPEG format is used on the Internet since it allows for a

much faster file transfer because of its reduced file size. The file size is 40 times smaller than aFlic format file. The Quicktime Movie format is the standard Macintosh animation format, whichallows for compression and can contain audio tracks.
13.5 MULTIMEDIA SYSTEM
The multimedia system includes the hardware and software components that are required to beused for multimedia. The hardware and software components required for a multimedia systemare as follows:
Input Devices—Keyboard and OCR for text; Digital cameras, Scanners and CD-ROM for graphics,MIDI keyboards, CD-ROM and microphones for sound; Video cameras, CD-ROM and framegrabbers for video; Mice, trackballs, joy sticks, virtual reality gloves and wands for spatial data;and mouse, touch screen, trackball, tablet, voice recognition system, infrared remotes, magneticcard encoder and reader, 3D input devices, and virtual reality devices.
Output Devices—CD-quality speakers, Hi-resolution monitors, color printers, specialisedhelmets, and immersive devices displays for virtual reality, and video devices.
Storage Devices—Hard disks, CD-ROM drive, Zip drive, DVD drive. Communication Network—Ethernet, Token Ring, FDDI, ATM, Intranets, and Internets. Communication Devices—Modem, Network Interface Card. Computer System—Multimedia Desktop machine, Workstation, MPEG/VIDEO hardware Software—Some of the familiar tools for multimedia software are—Word Processor (MS-WORD,
WordPerfect), Spreadsheet (MS-Excel), Database (Q+E Database/VB), and, Presentation Tools(MS-PowerPoint). Some of the software tools used for different elements of multimedia are asfollows—
o Music Sequencing and Notation—Cakewalk, Cubase, Macromedia Sound Edito Digital Audio—Cool Edit, Sound Forge, Pro Tools, Audacityo Image Editing—Adobe Illustrator, Adobe Photoshop, Macromedia Fireworkso Video Editing—Adobe Premiere, Windows Movie Maker, iMovieo Animation—3D Studio Max, Maya
Multimedia Authoring Tools are programs that help the user in writing multimedia applications.A multimedia authoring tool enables the user to create a multimedia application by linkingtogether objects, such as text, illustration, or music, to present a mixture of textual, graphical,and audio data. These tools are used to make videos, user interfaces, animations, screen savers,games, presentations, and for interactive training and simulations. Macromedia Flash andMacromedia Director are examples of multimedia authoring tools.
13.5.1 Desirable Features of Multimedia System
The hardware and software components used for a multimedia system have a minimumconfiguration to be used for multimedia. A multimedia system should have the followingdesirable features:
Very high processing power—more than 500 MHz of processing speed. Large storage units (50 GB or more) and large memory (512 MB or more). Multimedia Capable File System to deliver real-time media e.g. video/audio streaming. File Formats that allow for compression/decompression in real-time.

Efficient and fast I/O to allow for real-time recording and playback of data. Special operating system that supports direct transfer to disk, real-time scheduling, fast
interrupt processing, and I/O streaming. Network Support for Internet. Software Tools to handle and deliver media, and, design and develop applications.
13.6 MULTIMEDIA APPLICATIONS
Multimedia applications have found their way into different arenas of our life. We are interactingwith multimedia applications in the area of education and entertainment that includes sports,laser shows, video games, or animation movies. Multimedia applications have found their way inbusiness—may it be for advertising, marketing, video meetings, result presentations or customerfeedbacks. Nowadays, training is also imparted using multimedia applications like simulationsand 3D designs. Entertainment parks like Disneyland use virtual reality and multimedia,innovatively design, create, and improve; their games and rides. The following subsectionsdiscuss the impact of multimedia applications in different areas of our life.
13.6.1 In Education
Using multimedia for education encompasses the use of video clips, speech and sound, music,animations, and graphics. The use of these multimedia elements impacts the whole learningprocess and pedagogy. It is always better to visually observe and hear about a topic than onlyreading it from a book.
For Students and Teachers—The students are able to actually view the things being taught usinggraphics, animation or video clips. This brings them more nearer to the topic being taught andhas much more impact on the student than only reading from the book. It also helps bridge thegap between theory and lab work. The teachers use multimedia as a tool for delivering moreeffective lectures (Figure 13.20). They supplement their lectures with PowerPoint presentations,drawings, graphics and 3D graphics. They also use virtual laboratories and simulations tosupport their lectures, share same physical resource across multiple locations, and reducecapital and operational expenditure.
Imparting Education—Multimedia has resulted in spreading education to far-off places wherestudents cannot physically go and attend classes. Moreover, a lecture by a teacher cannot berepeated or replayed unless recorded. Multimedia has enabled such recordings on thecomputer so that the student can view them again and again whenever required. The largediversity of students, who are slow learners, is helped by it. The use of multimedia for impartingeducation is available in the following forms:
o Self-learning CD-ROMs —One can commonly find in the market, self-learning moduleson CD-ROMs for various subjects and for different classes. These modules use graphics,video, and speech, and include training for the subject inclusive of tests and questionpaper along with evaluation (Figure 13.21).

Figure 13.20 A teacher using presentation for teaching
Figure 13.21 Self-learning CD-ROMs
o E-learning Programs—The universities imparting distance education like IGNOU, havestarted using e-learning software to impart lectures to the students. E-learningprograms are now also being offered by the IITs for the students not physically presentat IIT (Figure 13.22). It is popularly referred to as “You can still be in IIT, even if you arenot physically at IIT”. E-learning programs require the students to get registered for theprogram online. The registered student is provided with a username and password,which he uses to log on to the e-learning module to access the lectures, notes and testsbased on them. These also enable Just-in-Time training on a specific topic for a person.

Figure 13.22 E-learning
o Synchronous Learning Technology—This is an initiative for imparting education usingsatellite communication. In this learning technology, the students are required to attendclasses at various computer based learning centers at a fixed time. It is online videolectures, where the instructor delivers the lecture physically at that time at one of thecenters, which is being broadcasted and delivered to the students at the computerbased learning centers. It incorporates Full-motion video, duplex audio, and two-wayVideo /Audio/Data interaction creating classroom-like engagement. The students canlisten to the instructor, see him/her on their computer screens and respond and interactwith the instructor. NIIT Imperia uses this technology for delivering executivemanagement programs (Figure 13.23).
The use of multimedia in education has made education to be more widely available, effectiveand entertaining.

Figure 13.23 Synchronous learning
13.6.2 In Entertainment
Video games and animation movies are some of the common uses of multimedia forentertainment. Gaming is one of the oldest uses of multimedia. It uses the different elements ofmultimedia to make it more realistic and interactive. The users (especially children) arecaptivated by the beauty of the game and heavily engaged in using them. The playing of gameshas its own advantages as it results in the sharpening of mental faculties (requires quick responsefrom the user), allows mixing pleasure with work, and results in enjoyment and relaxation.Nowadays, the games can also be played across the Internet (like chess requiring two players),where the users are located at different physical locations and can interact with each other over agame.
Animation movies are another use of multimedia for entertainment. The movies are generatedusing animation, and usually sound is provided by a well-known personality. Since the moviesare generated using animation, different kinds of movements and effects can be incorporated intoit. They are also cheaper than the actual movies. Some of the recent animated movies (Figure13.24) are—Hanuman (you can see hanuman engulfing the sun, walk in the sky, make a dive etc,which are easy to show using animation than with real characters), Road Side Romeo (sound bySaif Ali Khan, Kareena Kapoor and others), Toy Story 2 (Disney/Pixar), My Friend Ganesha,Bal Ganesha etc.

Figure 13.24 Animation movies
13.6.3 In Training
Training is an important ingredient in any organization. Imparting training to employees requiressignificant amount of effort and resources. There are only a few people in an organization whohave training skills and knowledge, to train others. Earlier, training the employees in anorganization would require the training team to travel to the location of training, incur expenses(lodging, boarding, traveling etc.), and train the people and move on to next location.
With the advent of multimedia in training, software is developed which can be stored on the CD,delivered over web and used by the employees for training. On-line training and simulation aresome other methods which use multimedia for training. In many safety-critical organizations,first the training is provided using simulated software without touching the actual unit. NASAuses simulation to train the astronauts, Maruti in India have car driving centers which trains theaspirant drivers using both simulation-based training and actual car driving (Figure 13.25).Simulation is also used for the training of pilots of airplane, fighter planes and ships. Second Lifesoftware is being used to make a candidate familiar with the inside look and feel of anorganization before he/she appears for the interview.
Figure 13.25 Maruti driving school simulator

13.6.4 In Business
Multimedia is crucial for the success of business organizations. In government and non-government organizations, no meeting is complete without PowerPoint presentations and reportsgenerated along with graphs and images. Moreover, businesses use multimedia to further theirproducts and to enlighten people about their products. A CD giving details of the product is used.Car manufacturers, white-good manufacturers like television, microwave, refrigerators andwashing machines, cell phone manufacturers etc., rely heavily on multimedia to display theirproduct, market them, and to enhance sales of their product (Figure 13.26). Multimedia is alsoused by business organizations to train their people, for marketing and advertising, for creatingvisual and sound effects that are appealing to people, and thus making their product moresaleable. Since the information inclusive of all sound and visual effects can be stored on a CDand distributed, it is considered as an inexpensive means of advertising and business promotion.
Figure 13.26 Multimedia in business
13.6.5 Virtual Reality
Virtual Reality is created using multimedia. Virtual reality is a special environment that iscreated using multimedia, where the users feel as if they are in a three-dimensional world. Itgives the feeling to the users as if they are participating in the scenario. Virtual reality (Figure13.27) uses a head-mounted display which consists of two display screens, and, data gloves thatare used to record the hand movements. The head-mounted display and the gloves are connectedto a computer which has the software for virtual reality installed into it. When the user enters intovirtual reality, the position of the head of the user, eyes, and hand movement is used to decidethe response; the next view is presented accordingly by the virtual reality software.
Virtual reality system enables one or more users to move and react in a computer-simulatedenvironment. Virtual reality systems can reshape the interface between people and informationtechnology by offering new ways to communicate information, visualize processes, and express

ideas creatively. When a user becomes fully immersed in an artificial, three-dimensional worldthat is completely generated by a computer, it is called immersive virtual reality.
The interface devices for a virtual reality system are—(1) Head-mounted display (HMD)—Screens directed at each eye; position tracker, (2) CAVE—Provides illusion of immersion throughprojection of stereo images on floors and walls, and (3) Haptic interface — Relays sense of touchand other physical sensations.
There are different forms of Virtual Reality—Immersive virtual reality, Mouse-controllednavigation through a three—dimensional environment on a graphics monitor, stereo viewingfrom the monitor via stereo glasses, stereo projection systems, and telepresence systems.
Some examples of Virtual Reality applications are:o Experimental “gesture technology”: may have military applicationso Medicine: anxiety disorders, pain reductiono Education and training: anatomy, history, military trainingo Real estate marketing and tourism: virtual walkthroughso Entertainment: CGI movies and games
Figure 13.27 Virtual reality
Late Prof. Randy Pausch of Carnegie Mellon University worked in the area of virtual reality andhas developed software named “Alice” which is used to make virtual reality software. Thissoftware is freely downloadable. His book “ The Last Lecture” (Figure 13.28) mentions the useof virtual reality by Disneyland for their entertainment park (to show Aladdin flying on a carpetetc.).

Figure 13.28 The book “The Last Lecture”
In addition to above applications of multimedia, we can see multimedia pervading into oureveryday lives. Kiosks at hotels, railway stations, bus stops are self-help multimedia informationcenters that provide the users with the necessary information. Multimedia is also used in sportsfor training purposes and for analyzing the game. Some of the common use of multimedia wemostly see while viewing a cricket match is—viewing if a leg bye was correct or not, whether aplayer is run out or not, or, at what angle the ball was thrown. In the Hindi film “Chak De India”,the trainer “Shahrukh Khan” uses multimedia to train the hockey players about the placement ofthe players, their moves etc.
SUMMARY
Television, radio, newspaper are common examples of mass media. Multimedia is a combination of more than one media—text, graphics, images, audio, or video,
which is used for presenting and sharing the information. Multimedia is different from mass media. Multimedia is delivered through the computer and
introduces the element of interactivity. Text, graphics, video, audio, and animation are the different elements of multimedia. Integrated, digital, interactive and computers are the four main characteristics of a multimedia
system. Computers are an intrinsic part of multimedia system. Multimedia is digital since it usesthe computer. The elements of the multimedia are integrated to present a single interface tothe user. Multimedia is interactive and thus non-linear.
Text is used for writing titles, to define menus, to write the content, and to navigate. Text inmultimedia has features like—text font, text effect, and text color. Text can also be animated.Text can be represented as hypertext on the Internet. The documents linked via hyperlinks allownon-linear access.
Graphics can be 2D graphics such as photographs or 3D graphics such as objects we see.

Bitmap graphics and Vector graphics are the two types of digital graphics. Bitmap graphics uses pixel information to generate the graphics. Vector graphics uses mathematical equations to represent the location, color, size, and color of
the graphics. JPEG and GIF are the two widely-used graphics image compression algorithms. Sound is a key element of multimedia. To store the sound on the computer it has to be
converted into digital form and the sound from the computer is converted into analog form tobe sent to the speakers.
Digitization and sampling of sound is required to store the analog sound in digital format. The digitized sound can be edited using audio editors. Sound can also be synthesized using the computer in MIDI format. The audio files need to be compressed to be stored on the disk and to be transmitted through
the Internet. MPEG is a popular algorithm for audio compression. CD ripping and MPS encoding is used to store audio from CD to web. Digital video can be easily stored on DVDs. The process of digitizing analog video is called video
capture. Streaming video and surround video make the video available on the Internet. Animation creates an illusion of movement from a series of still images. Looping, morphing and rendering are the processes for creating animation. I/O devices, storage devices, communication network, computer and software tools are the
hardware and software components required for a multimedia system. A multimedia system has features like high processing power, large storage units, fast and
efficient I/O, and, multimedia capable file system, and file formats. Multimedia is being widely used in areas like education, entertainment, business, and training. Multimedia has made virtual reality a possibility. Virtual reality uses multimedia to create an
environment where the user feels in a 3D world.
KEYWORDS
Animation CD ripping or grabber Hyperlink
Animation movies Codec Hypermedia
Audio editor Data gloves Hypertext
Audio file formats Digital multimedia Image
Bandwidth E-learning Image capture
Bitmap editor Frequency or pitch of sound Image color
Bitmap graphics Head-mounted gear Image compression
Image file size Raster images Text Animation
Image resolution Rendering Text effects
Interactive multimedia Sampling rate Text Font
Looping Self-learning CDROM Vector editor
Mass media Simulator Vector graphics
Morphing Sound amplitude Video
Motion Picture Experts Group Sound digitization Video capture

(MPEG) Sound hardware Video compression
MPS encoding Sound sampling Video editing
Multimedia Streaming video Video file formats
Multimedia Authoring Tools Surround video Video games
Musical Instrument Digital Synchronous learning Virtual Reality
Interface (MIDI) Synthesized sound Wave format
Pixels Text
QUESTIONS
Section 13.2
1. List the differences between mass media and multimedia.
2. Define: (1) multimedia (2) interactive multimedia.
3. List the elements of multimedia.
Section 13.3
4. What is the impact of computer on multimedia?
5. Describe the characteristics of multimedia system.
6. “The digital nature of multimedia requires special treatment of multimedia elements”. Explain.
7. Give an example of hypermedia application.
8. Name some devices used to interact with multimedia.
9. Define hypermedia.
Section 13.4.1
10. Give two examples of time-dependent multimedia system.
11. Give two examples of time-independent multimedia system.
12. What is the purpose of using text in multimedia?
13. What is text font? Give an example.
14. Explain the meaning of the text font—“Times New Roman 11-point italic”.

15. Give two examples of typeface.
16. What is the purpose of using text effects?
17. Name software used for creating text effects.
18. Name software used for creating text animation.
19. What is the use of representing text as hypertext on the Internet?
Section 13.4.2
20. What is the use of graphics element in multimedia system?
21. _____and_____are two types of digital graphics.
22. In what situations it is best to use bitmap graphics and vector graphics.
23. Define resolution of an image.
24. Unit of measuring resolution of an image is_____.
25. Resolution of monitor is measured in_____.
26. Higher the resolution, the better it is (True/False).
27. Give an example of bitmap editor.
28. Give an example of vector graphics editor.
29. List the three factors on which the size of graphics file is dependent.
30. List two formats for storing bitmap graphics file.
31. Why is image compression needed?
32. The two widely-used image compression algorithms are_____and_____.
33. List two formats used for image file format on the web.
34. Name three devices used for loading images on the computer.
35. Explain in one sentence what they do—scanner, digital camera, and clip art.
Section 13.4.3

36. State the difference between audio and sound.
37. Explain the properties of sound.
38. Define the following—(1) Amplitude, (2) Frequency or Pitch, and (3) Bandwidth.
39. What is the unit of frequency?
40. What is the range of the frequency of sound that the human ear can hear?
41. What is the use of DAC and ADC?
42. What is the purpose of microphone?
43. Define sound sampling.
44. Define sampling rate.
45. The CD sampling rate is_____.
46. Explain the purpose of audio editors.
47. Name two audio editing software for Windows.
48. _____ is the most widely-used format for generation of synthesized sound.
49. Explain MIDI format.
50. Name two audio file formats.
51. _____ is an uncompressed audio file format.
52. Why is compression of sound needed?
53. Name two common compression schemes for audio.
54. Describe the process for converting audio from CD to web.
Section 13.4.4
55. Name two video editing software.
56. Define video capture. Describe the process of video capture.
57. Why is compression of video needed?

58. Name some codec algorithm for video.
59. The digital video is stored on a disk on a PC as _____format.
60. The digital video is stored on a disk on a Macintosh as _____format.
61. _____ and _____ technology makes video on the Internet possible.
62. What is a streaming video technology?
63. What do you mean by surround video technology?
Section 13.4.5
64. Explain the four steps that are required to be followed during the process of animation.
65. What is the purpose of morphing?
66. Explain the process of rendering.
67. An animation requires about_____renderings per second.
68. List two software packages used for animation.
69. The file formats to store animation are _____, _____and_____.
Section 13.5
70. List the hardware and software requirements of a multimedia system.
71. What is the purpose of multimedia authoring tools?
72. Name two multimedia authoring tools.
73. List the desirable features of multimedia system.
Section 13.6
74. Describe the impact of multimedia on (1) Education (2) Entertainment (3) Business, and (4)Training.
75. Explain the use of multimedia in imparting education using (1) Self learning CDROMs, (2)E-learning program, and (3) Synchronous learning technology.
76. What is virtual reality?

77. Give an example of the use of virtual reality.
78. Give two examples for each, of the use of multimedia in (1) Education, (2) Entertainment, (3)Business, (4) Training, and (5) Virtual Reality.
Extra Questions
79. Give full form of the following abbreviations:
1. Pixel2. dpi3. RGB4. HSL5. GIF6. BMP7. PS8. JPEG9. TIFF10. ADC11. DAC12. MIDI13. RIFF14. MPEG15. CCITT16. ISO17. HMD
80. Write short notes on:
1. Bitmap graphics2. Vector graphics3. Text4. Image compression5. Image File Size6. Sound sampling7. Sound digitization8. Sound compression9. Video on Internet10. Audio from a CD to Web11. Video Compression12. Animation Creation13. Multimedia system14. Multimedia authoring tools15. Multimedia in Education16. Multimedia in Training17. Multimedia in Business18. Multimedia in Entertainment

19. Virtual Reality
81. Give differences between the following:
1. Mass media and Multimedia2. Bitmap graphics and Vector graphics3. Bitmap editor and Vector graphics editor4. JPEG and GIF image compression5. Streaming video and Surround video
14
COMPUTER SECURITY
Contents
Computer security—Security attacks, security mechanisms, security services Security threat and security attack Malicious software—Virus, worm, trojan horse, javascript, java applet, ActiveX control Hacking—Packet sniffing, password cracking, e-mail hacking Security services—Confidentiality, integrity, authentication, non-repudiation Security mechanisms
o Cryptography—Secret key cryptography, public-key cryptography, hash functiono Digital signature—Digital signature algorithmso Firewall—Functions of firewall, working principle, types of firewall (packet filter firewall,
circuit filter firewall, proxy or application-level firewall)o Users identification and authentication—User name and password, smart card,
biometricso Other security measures—Intrusion detection systems, virus protection software, data
and information backups, SSL, IPsec protocol Security awareness, security policy (formulating a security policy)
Why this chapter
Individual users, organizations, and enterprises use the computers for keeping their data that iscritical to their business and personal use. Also, they use the network (Internet) for thetransmission of data. Since data is critical to the owner, there is a need to keep the computersstoring the data and the network (Internet) over which the data is transmitted, secure. You shouldbe aware of—from whom to secure your data, and also about the security mechanisms to ensuresecurity. Computer security includes security of, both, the computer and the Internet. Thepurpose of this chapter is to introduce you to “Computer Security”.
14.1 INTRODUCTION

We all like to be secure in our home, office, locality, city, country, and in this world. We usedifferent mechanisms to ensure our security. Inside our homes, we keep our valuables safelylocked in a cupboard that is accessible by the elders of the house; we keep the gates of our housebolted and even have an intrusion-detection system installed. We have high walls and gatessurrounding our locality and also a watchman who guards the open gates. We have police for oursecurity within a city and armed forces for the country. We take all these measures to makeourselves and our valuables, resources, possessions secure.
The widespread use of computers has resulted in the emergence of a new area for security—security of computer. Computer security is needed to protect the computing system and toprotect the data that they store and access. Transmission of data using network (Internet) andcommunication links has necessitated the need to protect the data during transmission over thenetwork. Here, we use the term computer security to refer to both the computer security and thenetwork security.
Computer security focuses on the security attacks, security mechanisms and security services.
Security attacks are the reasons for breach of security. Security attacks comprise of all actionsthat breaches the computer security.
Security mechanisms are the tools that include the algorithms, protocols or devices, that aredesigned to detect, prevent, or recover from a security attack.
Security services are the services that are provided by a system for a specific kind of protectionto the system resources.
The purpose of computer security is to provide reliable security services in the environmentssuffering security attacks, by using security mechanisms. The security services use one or moresecurity mechanism(s).
This chapter discusses the different security threats and security attacks from malicious softwareand hackers. The chapter highlights the security services. The security mechanisms likecryptography, digital signatures, and firewalls are discussed in detail. The need for securityawareness and the security policy in an organization is also emphasized.
14.2 SECURITY THREAT AND SECURITY ATTACK
A threat is a potential violation of security and causes harm. A threat can be a maliciousprogram, a natural disaster or a thief. Vulnerability is a weakness of system that is leftunprotected. Systems that are vulnerable are exposed to threats. Threat is a possible danger thatmight exploit vulnerability; the actions that cause it to occur are the security attacks. Forexample, if we leave the house lock open—it is vulnerable to theft; an intruder in our locality(might exploit the open lock)is a security threat; the intruder comes to know of the open lock andgets inside the house—This is a security attack.
A security attack may be a passive attack or an active attack.
The aim of a passive attack is to get information from the system but it does not affect thesystem resources. Passive attacks are similar to eavesdropping (Figure 14.1). Passive attacks may

analyze the traffic to find the nature of communication that is taking place, or, release thecontents of the message to a person other than the intended receiver of the message. Passiveattacks are difficult to detect because they do not involve any alteration of the data. Thus, theemphasis in dealing with passive attacks is on prevention rather than detection.
Figure 14.1 Passive attack
Figure 14.2 Active attack (masquerade)
An active attack tries to alter the system resources or affect its operations. Active attack maymodify the data or create a false data (Figure 14.2). An active attack may be a masquerade (anentity pretends to be someone else), replay (capture events and replay them), modification ofmessages, and denial of service. Active attacks are difficult to prevent. However, an attempt ismade to detect an active attack and recover from them.
Security attacks can be on users, computer hardware and computer software (Figure 14.3).
Attacks on users could be to the identity of user and to the privacy of user. Identity attacksresult in someone else acting on your behalf by using personal information like password, PINnumber in an ATM, credit card number, social security number etc. Attacks on the privacy ofuser involve tracking of users habits and actions—the website user visits, the buying habit of theuser etc. Cookies and spam mails are used for attacking the privacy of users.

Attacks on computer hardware could be due to a natural calamity like floods or earthquakes;due to power related problems like power fluctuations etc.; or by destructive actions of aburglar.
Software attacks harm the data stored in the computer. Software attacks may be due tomalicious software, or, due to hacking. Malicious software or malware is a software codeincluded into the system with a purpose to harm the system. Hacking is intruding into anothercomputer or network to perform an illegal act.
This chapter will discuss the malicious software and hacking in detail.
Figure 14.3 Security attacks
14.3 MALICIOUS SOFTWARE
Malicious users use different methods to break into the systems. The software that isintentionally included into a system with the intention to harm the system is called malicioussoftware. Viruses, Trojan horse, and Worms are examples of malicious programs. Javascriptsand Java applets written with the purpose of attacking, are also malicious programs.
14.3.1 Virus
Virus is a software program that is destructive in nature. Virus programs have the followingproperties:
It can attach itself to other healthy programs. It can replicate itself and thus can spread across a network. It is difficult to trace a virus after it has spread across a network. Viruses harm the computer in many ways—
o corrupt or delete data or files on the computer,o change the functionality of software applications,o use e-mail program to spread itself to other computers,o erase everything on the hard disk, or,

o degrade performance of the system by utilizing resources such as memory or disk space. Virus infects an executable file or program. The virus executes when a program infected with
virus is executed or you start a computer from a disk that has infected system files. Once a virus is active, it loads into the computer’s memory and may save itself to the hard drive
or copies itself to applications or system files on the disk. However, viruses cannot infect write protected disks or infect written documents. Viruses do
not infect an already compressed file. Viruses also do not infect computer hardware; they onlyinfect software.
Viruses are most easily spread by attachments in e-mail messages. Viruses also spread throughdownload on the Internet.
Some examples of viruses are—“Melissa” and “I Love You”.
14.3.2 Worms
Worm is self-replicating software that uses network and security holes to replicate itself. A copyof the worm scans the network for another machine that has a specific security hole. It copiesitself to the new machine using the security hole, and then starts replicating from there, as well.A worm is however different from a virus. A worm does not modify a program like a virus,however, it replicates so much that it consumes the resources of the computer and makes it slow.Some examples of worms are—“Code Red” and “Nimda”.
14.3.3 Trojan Horse
Trojan horse is destructive programs that masquerade as useful programs. The name “Trojanhorse” is given because of the Greek soldiers who reached the city of Troy by hiding themselvesinside a large wooden horse (Figure 14.4). The people of the city of Troy themselves pulled thehorse inside their city, unaware of the fact that the Greek soldiers were hiding inside the horse.Similarly, users install Trojan horses thinking that it will serve a useful purpose such as a gameor provide entertainment. However, Trojan horses contain programs that corrupt the data ordamage the files. Trojan horses can corrupt software applications. They can also damage filesand can contain viruses that destroy and corrupt data and programs. Trojan horse does notreplicate themselves like viruses.

Figure 14.4 Trojan horse
14.3.4 Javascripts, Java Applets and ActiveX Controls
Applets (Java programs), and ActiveX controls are used with Microsoft technology, which canbe inserted in a Web page and are downloaded on the client browser for execution. Applets andActiveX controls are generally used to provide added functionality such as sound and animation.However, these programs when designed with a malicious intention can be disastrous for theclient machine. Java Applets have strong security checks that define what an applet can do andwhat it cannot. ActiveX controls do not have such security checks. Normally, ActiveX controlsmust be kept disabled while working on the Internet (Figure 14.5).
Figure 14.5 (a) Making security settings in Windows XP (b) ActiveX control popup in Internet
Javascript is a scripting language generally nested within HTML code. The client-side scripts ona HTML page execute inside the Web browser on the client computer. Javascript codes can beused to transfer files, send e-mails and write to local files. If used with a maligned intention, thescripts can be dangerous for the client machine.
14.4 HACKING
Hacking is the act of intruding into someone else’s computer or network. A hacker is someonewho does hacking. Hacking may result in a Denial of Service (DoS) attack. The DoS attackprevents authorized users from accessing the resources of the computer. It aims at making the

computer resource unusable or unavailable to its intended users. It targets the computer and itsnetwork connections, to prevent the user from accessing email, web sites, online accounts(banking, etc.), or other services that rely on the affected computer. In a DoS attack, the servicesof the entire network, an Internet site or service, may be suppressed or disabled. The affectedmachine is flooded with spurious requests and messages so as to overload the network. As aresult, the affected machine cannot process the valid requests. This is a denial of service to thevalid users. Generally, the targets of such attacks are the sites hosted on high-profile web serverssuch as banks and credit card payment gateways.
Packet sniffing, E-mail hacking and Password cracking are used to get the username andpassword of the system to gain unauthorized access to the system. These methods gather theinformation when the data is being transmitted over the network.
14.4.1 Packet Sniffing
The data and the address information are sent as packets over the Internet. The packets maycontain data like a user name and password, e-mail messages, files etc. Packet sniffing programsare used to intercept the packets while they are being transmitted from source to destination.Once intercepted, the data in the packets is captured and recorded. Generally, packet sniffers areinterested in packets carrying the username and password. Packet sniffing attacks normally goundetected. Ethereal and Zx Sniffer are some freeware packet sniffers. Telnet, FTP, SMTP aresome services that are commonly sniffed.
14.4.2 Password Cracking
Cracking of password is used by hackers to gain access to systems. The password is generallystored in the system in an encrypted form. Utilities like Password cracker is used to crack theencrypted passwords. Password cracker is an application that tries to obtain a password byrepeatedly generating and comparing encrypted passwords or by authenticating multiple times toan authentication source.
14.4.3 E-mail Hacking
The e-mail transmitted over the network contains the e-mail header and the content. If thisheader and the content are sent without encryption, the hackers may read or alter the messages intransit. Hackers may also change the header to modify the sender’s name or redirect themessages to some other user. Hackers use packet replay to retransmit message packets over anetwork. Packet replay may cause serious security threats to programs that require authenticationsequences. A hacker may replay the packets containing authentication data to gain access to theresources of a computer.
14.5 SECURITY SERVICES
The security services provide specific kind of protection to system resources. Security servicesensure Confidentiality, Integrity, Authentication, and Non-Repudiation of data or message stored
on the computer, or when transmitted over the network. Additionally, it provides assurance foraccess control and availability of resources to its authorized users.
Confidentiality—The confidentiality aspect specifies availability of information to onlyauthorized users. In other words, it is the protection of data from unauthorized disclosure. Itrequires ensuring the privacy of data stored on a server or transmitted via a network, frombeing intercepted or stolen by unauthorized users. Data encryption stores or transmits data, in aform that unauthorized users cannot understand. Data encryption is used for ensuringconfidentiality.
Integrity—It assures that the received data is exactly as sent by the sender, i.e. the data has notbeen modified, duplicated, reordered, inserted or deleted before reaching the intendedrecipient. The data received is the one actually sent and is not modified in transit.
Authentication—Authentication is the process of ensuring and confirming the identity of theuser before revealing any information to the user. Authentication provides confidence in theidentity of the user or the entity connected. It also assures that the source of the received datais as claimed. Authentication is facilitated by the use of username and password, smart cards,biometric methods like retina scanning and fingerprints.
Non-Repudiation prevents either sender or receiver from denying a transmitted message. For amessage that is transmitted, proofs are available that the message was sent by the allegedsender and the message was received by the intended recipient. For example, if a sender placesan order for a certain product to be purchased in a particular quantity, the receiver knows that itcame from a specified sender. Non-repudiation deals with signatures.
Access Control—It is the prevention of unauthorized use of a resource. This specifies the userswho can have access to the resource, and what are the users permitted to do once access isallowed.
Availability—It assures that the data and resources requested by authorized users are availableto them when requested.
14.6 SECURITY MECHANISMS
Security mechanisms deal with prevention, detection, and recovery from a security attack.Prevention involves mechanisms to prevent the computer from being damaged. Detectionrequires mechanisms that allow detection of when, how, and by whom an attacked occurred.Recovery involves mechanism to stop the attack, assess the damage done, and then repair thedamage.
Security mechanisms are built using personnel and technology.
Personnel are used to frame security policy and procedures, and for training and awareness. Security mechanisms use technologies like cryptography, digital signature, firewall, user
identification and authentication, and other measures like intrusion detection, virus protection,and, data and information backup, as countermeasures for security attack.
14.7 CRYPTOGRAPHY
Cryptography is the science of writing information in a “hidden” or “secret” form and is anancient art. Cryptography is necessary when communicating data over any network, particularly

the Internet. It protects the data in transit and also the data stored on the disk. Some termscommonly used in cryptography are:
Plaintext is the original message that is an input, i.e. unencrypted data. Cipher and Code—Cipher is a bit-by-bit or character-by-character transformation without regard
to the meaning of the message. Code replaces one word with another word or symbol. Codesare not used any more.
Cipher text—It is the coded message or the encrypted data. Encryption—It is the process of converting plaintext to cipher text, using an encryption
algorithm. Decryption—It is the reverse of encryption, i.e. converting cipher text to plaintext, using a
decryption algorithm.
Cryptography uses different schemes for the encryption of data. These schemes constitute a pairof algorithms which creates the encryption and decryption, and a key.
Key is a secret parameter (string of bits) for a specific message exchange context. Keys areimportant, as algorithms without keys are not useful. The encrypted data cannot be accessedwithout the appropriate key. The size of key is also important. The larger the key, the harder it isto crack a block of encrypted data. The algorithms differ based on the number of keys that areused for encryption and decryption. The three cryptographic schemes are as follows:
Secret Key Cryptography (SKC): Uses a single key for both encryption and decryption, Public Key Cryptography (PKC): Uses one key for encryption and another for decryption, Hash Functions: Uses a mathematical transformation to irreversibly encrypt information.
In all these schemes, algorithms encrypt the plaintext into cipher text, which in turn is decryptedinto plaintext.
14.7.1 Secret Key Cryptography
Secret key cryptography uses a single key for both encryption and decryption. The sender usesthe key to encrypt the plaintext and sends the cipher text to the receiver. The receiver appliesthe same key to decrypt the message and recover the plaintext (Figure 14.6). Since a single keyis used for encryption and decryption, secret key cryptography is also called symmetricencryption.
Figure 14.6 Secret key cryptography (uses a single key for both encryption anddecryption)
Secret key cryptography scheme are generally categorized as stream ciphers or block ciphers. Stream ciphers operate on a single bit (byte or computer word) at a time and implement some
form of feedback mechanism so that the key is constantly changing.

Block cipher encrypts one block of data at a time using the same key on each block. In general,the same plaintext block will always encrypt to the same cipher text when using a same key in ablock cipher.
Secret key cryptography requires that the key must be known to both the sender and thereceiver. The drawback of using this approach is the distribution of the key. Any person who hasthe key can use it to decrypt a message. So, the key must be sent securely to the receiver, whichis a problem if the receiver and the sender are at different physical locations.
Data Encryption Standard (DES) and Advanced Encryption Standard (AES) are some of the secretkey cryptography algorithms that are in use nowadays.
14.7.2 Public-Key Cryptography
Public-key cryptography facilitates secure communication over a non-secure communicationchannel without having to share a secret key.
Public-key cryptography uses two keys—one public key and one private key. The public key can be shared freely and may be known publicly. The private key is never revealed to anyone and is kept secret. The two keys are mathematically related although knowledge of one key does not allow
someone to easily determine the other key.
Figure 14.7 Public key cryptography (uses two keys—one for encryption and other fordecryption)
The plaintext can be encrypted using the public key and decrypted with the private key andconversely the plaintext can be encrypted with the private key and decrypted with the publickey. Both keys are required for the process to work (Figure 14.7). Because a pair of keys isrequired for encryption and decryption; public-key cryptography is also called asymmetricencryption.
Rivest, Shamir, Adleman (RSA) is the first and the most common public-key cryptographyalgorithm in use today. It is used in several software products for key exchange, digitalsignatures, or encryption of small blocks of data. The Digital Signature Algorithm (DSA) is used toprovide digital signature capability for the authentication of messages.
14.7.3 Hash Functions
Figure 14.8 Hash function (have no key since plain text is not recoverable from cipher text)
Hash functions are one-way encryption algorithms that, in some sense, use no key. This schemecomputes a fixed-length hash value based upon the plaintext. Once a hash function is used, it isdifficult to recover the contents or length of the plaintext (Figure 14.8).
Hash functions are generally used to ensure that the file has not been altered by an intruder orvirus. Any change made to the contents of a message will result in the receiver calculating adifferent hash value than the one placed in the transmission by the sender.
Hash functions are commonly employed by many operating systems to encrypt passwords.Message Digest (MD) algorithm and Secure Hash Algorithm (SHA) are some of the common usedhash algorithms.
The different cryptographic schemes are often used in combination for a secure transmission.Cryptography is used in applications like, security of ATM cards, computer passwords, andelectronic commerce. Cryptography is used to protect data from theft or alteration, and also foruser authentication.
Certification Authorities (CA) are necessary for widespread use of cryptography for e-commerceapplications. CAs are trusted third parties that issue digital certificates for use by other parties. ACA issues digital certificates which contains a public key, a name, an expiration date, the nameof authority that issued the certificate, a serial number, any policies describing how the certificatewas issued, how the certificate may be used, the digital signature of the certificate issuer, and anyother information.
14.8 DIGITAL SIGNATURE
A signature on a legal, financial or any other document authenticates the document. A photocopyof that document does not count. For computerized documents, the conditions that a signeddocument must hold are—(1) The receiver is able to verify the sender (as claimed), (2) Thesender cannot later repudiate the contents of the message, (3) The receiver cannot concoct themessage himself. A digital signature is used to sign a computerized document. The properties ofa digital signature are same as that of ordinary signature on a paper. Digital signatures are easyfor a user to produce, but difficult for anyone else to forge. Digital signatures can be permanentlytied to the content of the message being signed and then cannot be moved from one document toanother, as such an attempt will be detectable.
Digital signature scheme is a type of asymmetric cryptography. Digital signatures use the public-key cryptography, which employs two keys—private key and public key. The digital signaturescheme typically consists of three algorithms:
Key generation algorithm—The algorithm outputs private key and a corresponding public key. Signing algorithm—It takes, message + private key, as input, and, outputs a digital signature. Signature verifying algorithm—It takes, message + public key + digital signature, as input, and,
accepts or rejects digital signature.
The use of digital signatures typically consists of two processes—Digital signature creation andDigital signature verification (Figure 14.9). Two methods are commonly used for creation andverification of the digital signatures.

Figure 14.9 Digital signature
In the First Method, the signer has a private key and a public key. For a message to be sent, thesigner generates the digital signature by using the private key to encrypt the message. Thedigital signature along with the message is sent to the receiver. The receiver uses the public key(known to the receiver) to verify the digital signature. This method is used to verify the digitalsignature. Even if many people may know the public key of a given signer and use it to verifythat signer’s signature, they cannot generate the signer’s private key and use it to forge digitalsignatures.
In the Second Method, a hash function is used for digital signature. It works as follows:o Digital signature creation
The signer has a private key and a public key. For a message to be sent, a hash function in the signer’s software computes an
“original hash result” unique to the “original message”. The signer uses signing algorithm to generate a unique digital signature.
“original hash result” + signer’s private key = digital signature.o The generated digital signature is attached to its “original message” and transmitted
with it.o Digital signature verification uses digital signature, “received message” and signer’s
public key. A “new hash result” of the “received message” is computed using the same
hash function used for the creation of the digital signature. The verification software verifies two things—whether the digital signature was
created using the signer’s private key and, whether the “received message” isunaltered. For this, the signer’s public key verifies the digital signature (signer’spublic key can only verify a digital signature created with the signer’s privatekey). Once the key is verified, the “original hash result” of the digital signature isavailable. It compares “original hash result” with the “new hash result”. Whenthe verification software verifies both the steps as “true”; it verifies the receivedmessage.
The digital signature accomplish the effects desired of a signature for many legal purposes:

Signer Authentication: The digital signature cannot be forged, unless the signer loses control ofthe private key.
Message Authentication: The digital signature verification reveals any tampering, since thecomparison of the hash results shows whether the message is the same as when signed.
Efficiency. The digital signatures yield a high degree of assurance (as compared to papermethods like checking specimen signatures) without adding much to the resources required forprocessing.
The likelihood of malfunction or a security problem in a digital signature cryptosystem, designedand implemented as prescribed in the industry standards, is extremely remote. Digital signatureshave been accepted in several national and international standards developed in cooperation withand accepted by many corporations, banks, and government agencies. In India “InformationTechnology Act 2000” provides legal recognition for transactions carried out by means ofelectronic data interchange and other means of electronic communication, commonly referred toas “electronic commerce”, which involves the use of alternatives to paper based methods ofcommunication and storage of information, to facilitate electronic filing of documents with thegovernment agencies.
14.9 FIREWALL
A firewall is a security mechanism to protect a local network from the threats it may face whileinteracting with other networks (Internet). A firewall can be a hardware component, a softwarecomponent, or a combination of both. It prevents computers in one network domain fromcommunicating directly with other network domains. All communication takes place through thefirewall, which examines all incoming data before allowing it to enter the local network (Figure14.10).
Functions of Firewall—The main purpose of firewall is to protect computers of an organization(local network) from unauthorized access. Some of the basic functions of firewall are:
Firewalls provide security by examining the incoming data packets and allowing them to enterthe local network only if the conditions are met (Figure 14.11).
Firewalls provide user authentication by verifying the username and password. This ensures thatonly authorized users have access to the local network.
Firewalls can be used for hiding the structure and contents of a local network from externalusers. Network Address Translation (NAT) conceals the internal network addresses and replacesall the IP addresses of the local network with one or more public IP addresses.

Figure 14.10 (a) Windows firewall icon in control panel (b) Windows firewall setting (c)Security center
The local network uses a single network interface to interact with the server. Local networkclients use IP addresses that are not attached to any computer. When a client sends a packet tothe Internet, the masquerading server replaces the IP address of the packet with its own IPaddress. When a packet is received by local network, the server replaces the IP address of thepacket with the masqueraded address and sends the packet to the respective client.
Figure 14.11 Firewall
Working of Firewall—The working of firewall is based on a filtering mechanism. The filteringmechanism keeps track of source address of data, destination address of data and contents ofdata. The filtering mechanism allows information to be passed to the Internet from a localnetwork without any authentication. It makes sure that the downloading of information from theInternet to a local network happens based only on a request by an authorized user.
Firewall Related Terminology:
Gateway—The computer that helps to establish a connection between two networks is calledgateway. A firewall gateway is used for exchanging information between a local network andthe Internet.
Proxy Server—A proxy server masks the local network’s IP address with the proxy server IPaddress, thus concealing the identity of local network from the external network. Web proxy

and application-level gateway are some examples of proxy servers. A firewall can be deployedwith the proxy for protecting the local network from external network.
Screening Routers—They are special types of router with filters, which are used along with thevarious firewalls. Screening routers check the incoming and outgoing traffic based on the IPaddress, and ports.
14.9.1 Types of Firewall
All the data that enter a local network must come through a firewall. The type of firewall usedvaries from network to network. The following are the various types of firewalls generally used:
Packet filter Firewall Circuit Filter Firewall Proxy server or Application-level Gateway
14.9.1.1 Packet Filter Firewall
Packet Filter Firewall is usually deployed on the routers (Figure 14.12). It is the simplest kind ofmechanism used in firewall protection.
Figure 14.12 Packet fi Itering
It is implemented at the network level to check incoming and outgoing packets. The IP packet header is checked for the source and the destination IP addresses and the port
combinations. After checking, the filtering rules are applied to the data packets for filtering. The filtering rules
are set by an organization based on its security policies. If the packet is found valid, then it is allowed to enter or exit the local network. Packet filtering is fast, easy to use, simple and cost effective. A majority of routers in the market provide packet filtering capability. It is used in small and
medium businesses. Packet filter firewall does not provide a complete solution.
14.9.1.2 Circuit Filter Firewall
Circuit filter firewalls provide more protection than packet filter firewalls. Circuit filter firewallis also known as a “stateful inspection” firewall.
It prevents transfer of suspected packets by checking them at the network layer.

It checks for all the connections made to the local network, in contrast, to the packet filterfirewall which makes a filtering decision based on individual packets.
It takes its decision by checking all the packets that are passed through the network layer andusing this information to generate a decision table. The circuit level filter uses these decisionstables to keep track of the connections that go through the firewall.
For example, when an application that uses TCP creates a session with the remote host, the TCPport number for the remote application is less than 1024 and the TCP port number for the localclient is between 1024 and 65535. A packet filter firewall will allow any packet which has a portnumber within the range 1024 and 65535. However, the circuit filter firewall creates a directoryof all outbound TCP connections. An incoming packet is allowed if its profile matches with anentry in the directory for the TCP port numbers.
14.9.1.3 Application-Level Gateway
An application-level gateway or a proxy server protects all the client applications running on alocal network from the Internet by using the firewall itself as the gateway (Figure 14.13).
A proxy server creates a virtual connection between the source and the destination hosts. A proxy firewall operates on the application layer. The proxy ensures that a direct connection
from an external computer to local network never takes place. The proxy automatically segregates all the packets depending upon the protocols used for them.
A proxy server must support various protocols. It checks each application or service, like Telnetor e-mail, when they are passed through it.
A proxy server is easy to implement on a local network. Application level gateways or proxy server tend to be more secure than packet filters. Instead of
checking the TCP and IP combinations that are to be allowed, it checks the allowableapplications.
Figure 14.13 Application-level gateway

14.10 USERS IDENTIFICATION AND AUTHENTICATION
Identification is the process whereby a system recognizes a valid user’s identity. Authenticationis the process of verifying the claimed identity of a user. For example, a system uses user-password for identification. The user enters his password for identification. Authentication is thesystem which verifies that the password is correct, and thus the user is a valid user. Beforegranting access to a system, the user’s identity needs to be authenticated. If users are not properlyauthenticated then the system is potentially vulnerable to access by unauthorized users. If strongidentification and authentication mechanisms are used, then the risk that unauthorized users willgain access to a system is significantly decreased. Authentication is done using one or morecombinations of—what you have (like smartcards), what you know (Password), and what youare (Biometrics like Fingerprints, retina scans).
We will now briefly discuss the following authentication mechanisms:
User name and password Smart Card Biometrics—Fingerprints, Iris/retina scan
Once the user is authenticated, the access controls for the user are also defined. Access controlsis what the user can access once he is authenticated.
14.10.1 User Name and Password
The combination of username and password is the most common method of user identificationand authentication. The systems that use password authentication first require the user to have ausername and a password. Next time, when the user uses the system, user enters their usernameand password. The system checks the username and password by comparing it to the storedpassword for that username. If it matches, the user is authenticated and is granted access to thesystem (Figure 14.14).

Figure 14.14 User authentication page
However, there are several security issues with the use of password, like, any invalid user if getsto know of a valid password can get access to the system, a simple password can be easilycracked etc. According to CERT, approximately 80% of all network security issues are causedby bad passwords. Some actions that can be taken to make the passwords safer are as follows:
It is good to change passwords periodically. This decreases chances of cracking passwords. Make a password complex, like mix case, use numbers and special characters. This decreases
ability of automated attacks by increasing possible character combinations. Use longer passwords so as to create exponentially higher number of permutations and
combinations of characters used, making them difficult to break. Be cautious not to leave passwords lying around and don’t share them with friends. Do not use your or your families’ name, age, address, city etc., as part of the passwords.
Nearly all modern multiuser computer and network operating systems, at the very least, employpasswords to protect and authenticate users accessing computer and network resources. Thepasswords are not kept in plaintext, but are generally encrypted using some sort of hash scheme.For example, In Unix/ Linux, all passwords are hashed and stored as a 13-byte string. InWindows NT, all passwords are hashed resulting in a 16-byte hash value.
14.10.2 Smart Card
A smart card is in a pocket-sized card with embedded integrated circuits which can process data.With an embedded microcontroller, smart cards have the unique ability to store large amounts of
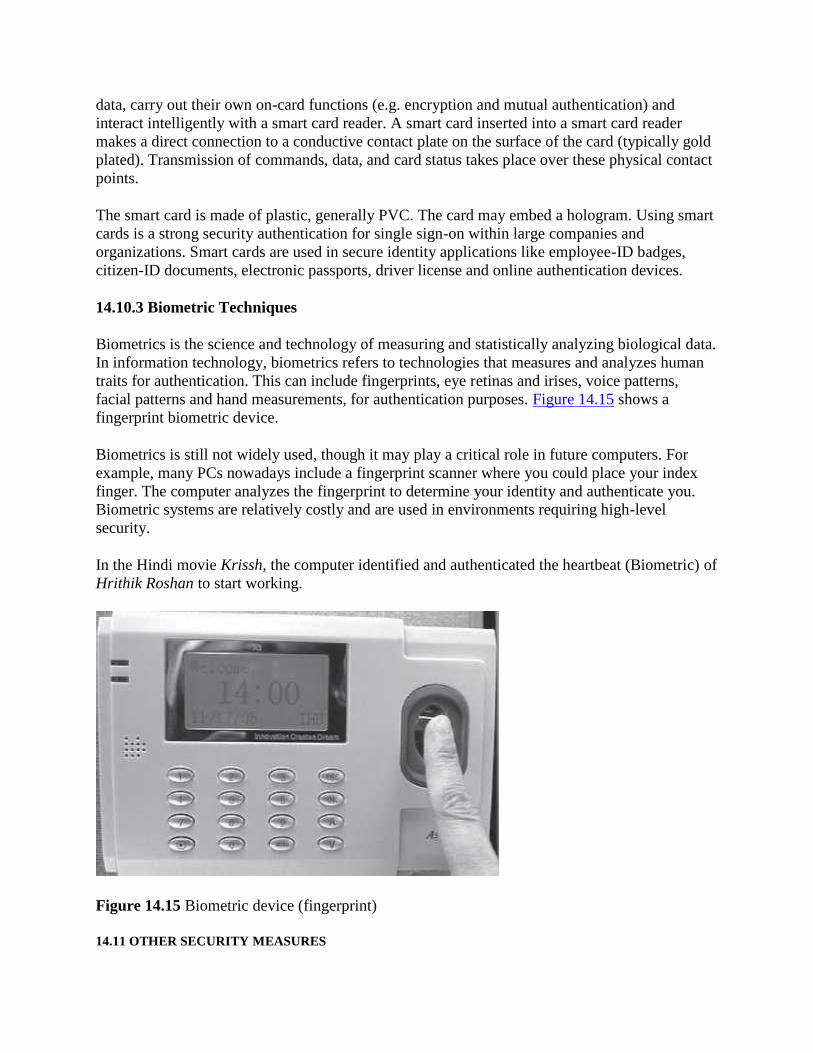
data, carry out their own on-card functions (e.g. encryption and mutual authentication) andinteract intelligently with a smart card reader. A smart card inserted into a smart card readermakes a direct connection to a conductive contact plate on the surface of the card (typically goldplated). Transmission of commands, data, and card status takes place over these physical contactpoints.
The smart card is made of plastic, generally PVC. The card may embed a hologram. Using smartcards is a strong security authentication for single sign-on within large companies andorganizations. Smart cards are used in secure identity applications like employee-ID badges,citizen-ID documents, electronic passports, driver license and online authentication devices.
14.10.3 Biometric Techniques
Biometrics is the science and technology of measuring and statistically analyzing biological data.In information technology, biometrics refers to technologies that measures and analyzes humantraits for authentication. This can include fingerprints, eye retinas and irises, voice patterns,facial patterns and hand measurements, for authentication purposes. Figure 14.15 shows afingerprint biometric device.
Biometrics is still not widely used, though it may play a critical role in future computers. Forexample, many PCs nowadays include a fingerprint scanner where you could place your indexfinger. The computer analyzes the fingerprint to determine your identity and authenticate you.Biometric systems are relatively costly and are used in environments requiring high-levelsecurity.
In the Hindi movie Krissh, the computer identified and authenticated the heartbeat (Biometric) ofHrithik Roshan to start working.
Figure 14.15 Biometric device (fingerprint)
14.11 OTHER SECURITY MEASURES

In addition to the above discussed security techniques, several other security techniques are usedfor security purposes. Some of these are listed below:
Intrusion Detection Systems—They complement firewalls to detect if internal assets are beinghacked or exploited. A Network-based Intrusion Detection monitors real-time network traffic formalicious activity and sends alarms for network traffic that meets certain attack patterns orsignatures. A Host-based Intrusion Detection monitors computer or server files for anomaliesand sends alarms for network traffic that meets a predetermined attack signature.
Virus Protection Software—They should be installed on all network servers, as well ascomputers. They screen all software coming into your computer or network system (files,attachments, programs, etc.) preventing a virus from entering into the system.
Data and Information Backups—It is required for disaster recovery and business continuity.Back-ups should be taken daily and periodically (weekly) and should be kept for at least 30 dayswhile rotating stockpile.
Secure Socket Layer (SSL) is an algorithm developed by Netscape Communications to provideapplication-independent security and privacy over the Internet. SSL is designed so that protocolssuch as HTTP, FTP, and Telnet can operate over it transparently. SSL allows both serverauthentication (mandatory) and client authentication (optional). It uses public-key cryptography(RSA algorithm). HTTP Secure (HTTPS) is an extension to HTTP to provide secure exchange ofdocuments over the WWW
IP Security (IPsec) Protocol—The IPsec protocol suite is used to provide privacy andauthentication services at the Internet layer. IPv4 is currently the dominant Internet Protocolversion. IPv6 is the next-generation Internet Layer protocol for the Internet. IPv6 protocol stacksinclude IPsec, which allows authentication, encryption, and compression of IP traffic. IPsec canbe used to protect any application traffic across the Internet. Applications need not bespecifically designed to use IPsec, unlike SSL where the use of SSL must be incorporated into thedesign of application.
14.12 SECURITY AWARENESS
The aim of the security awareness is to enhance the security of the organization’s resources byimproving the awareness of the need to secure the system resources. Staff members play acritical role in protecting the integrity, confidentiality, and availability of IT systems andnetworks. It is necessary for an organization to train their staff for security awareness andaccepted computer practices. Security of resources can be ensured when the people using it areaware of the need to secure their resources. Security awareness of staff includes the knowledgeof practices that must be adhered to, for ensuring the security and the possible consequences ofnot using those security practices. For example, not disclosing your password to unauthorizedusers is a security practice, but if the users are not aware of the possible consequences ofdisclosing the password, they may disclose their password to other users, unintentionally, thusmaking their systems prone to security attack. In order to make the users and people in anorganization aware of the security practices to be followed, regular training programs areconducted in organizations. Awareness is also promoted by regular security awareness sessions,videotapes, newsletters, posters, and flyers. Figure 14.16 shows a poster for security awareness.

Figure 14.16 Security awareness (A poster)
14.13 SECURITY POLICY
A securitypolicy is a formal statement that embodies the organization’s overall securityexpectations, goals, and objectives with regard to the organization’s technology, system andinformation.
To be practical and implementable, policies must be defined by standards, guidelines, andprocedures. Standards, guidelines, and procedures provide specific interpretation of policies andinstruct users, customers, technicians, management, and others on how to implement thepolicies.
The security policy states what is, and what is not allowed. A security policy must becomprehensive, up-to-date, complete, delivered effectively, and available to all staff. A securitypolicy must also be enforceable. To accomplish this, the security policy can mention that strictaction will be taken against employees who violate it, like disclosing a password.
Generally, security policies are included within a security plan. A security plan details how therules put forward by the security policy will be implemented. The statements within a security

plan can ensure that each employee knows the boundaries and the penalties of oversteppingthose boundaries. For example, some rules could be included in the security policy of anorganization, such as, to log off the system before leaving the workstation, or not to share thepassword with other users.
The security policy also includes physical security of the computers. Some of the measures takento ensure the physical security of a computer are—taking regular backups to prevent data lossfrom natural calamity, virus attack or theft, securing the backup media, keeping valuablehardware resources in locked room (like servers), to avoid theft of systems and storage media.
14.13.1 Formulating a Security Policy
Security policies are defined based on an organization’s needs. A security policy includesapproaches and techniques that an organization is going to apply or include in order to secure itsresources. The steps followed while formulating the security policy are:
Analyzing Current Security Policies—The vulnerabilities and the current security policies must beanalyzed by the security administrators before defining an effective security policy. The securityadministrator is required to study the existing documents containing details of the physicalsecurity policies, network security policies, data security policies, disaster recovery plans, andcontingency plans.
Identifying IT Assets that Need to be Secure—The security administrator must identify the ITresources of an organization that need to be secure. It may include the following:
o Physical resources like computers, servers like database servers and web servers, localnetworks that are used to share the local computer with the remote computer, privatenetworks shared by two or more organizations, corporate network permanentlyconnected to the Internet, laptop, manuals, backup media, communication equipment,network cables, and CDs.
o Information resources like password, data, or applications. The data of an organizationcan be classified for security purposes based upon the sensitivity and the integrity ofdata. For example, public information, internal information, confidential information,and secret information
Identifying Security Threats and Likely Security Attacks—After identifying the IT assets andclassifying them, a security administrator must identify the various security threats to the assets.For example, in a bank the security threat to the database storing the account details of thecustomers may be—unauthorized access to information, attacks of viruses, worms and Trojanhorses, natural disasters like earthquake, fire etc.
Defining the Proactive and Reactive Security Strategies—A proactive strategy is a pre-attackstrategy. It involves identifying possible damage from each type of attack, determining thevulnerabilities that each type of attack can exploit, minimizing those vulnerabilities and making acontingency plan. A contingency plan specifies the actions to be taken in case an attackpenetrates into a system and damages the IT assets of the organization. A contingency plan aimsat keeping the computer functional and ensuring the availability, integrity, and confidentiality ofdata. However, it is not possible for the security administrator to prepare a computer against allattacks. A reactive strategy is implemented on the failure of the proactive strategy. It definesthe steps to be taken after the attack. It aims at identifying the cause of attack, vulnerabilitiesused to attack the system, damage caused by the attack, and repairing of the damage caused bythe attack.
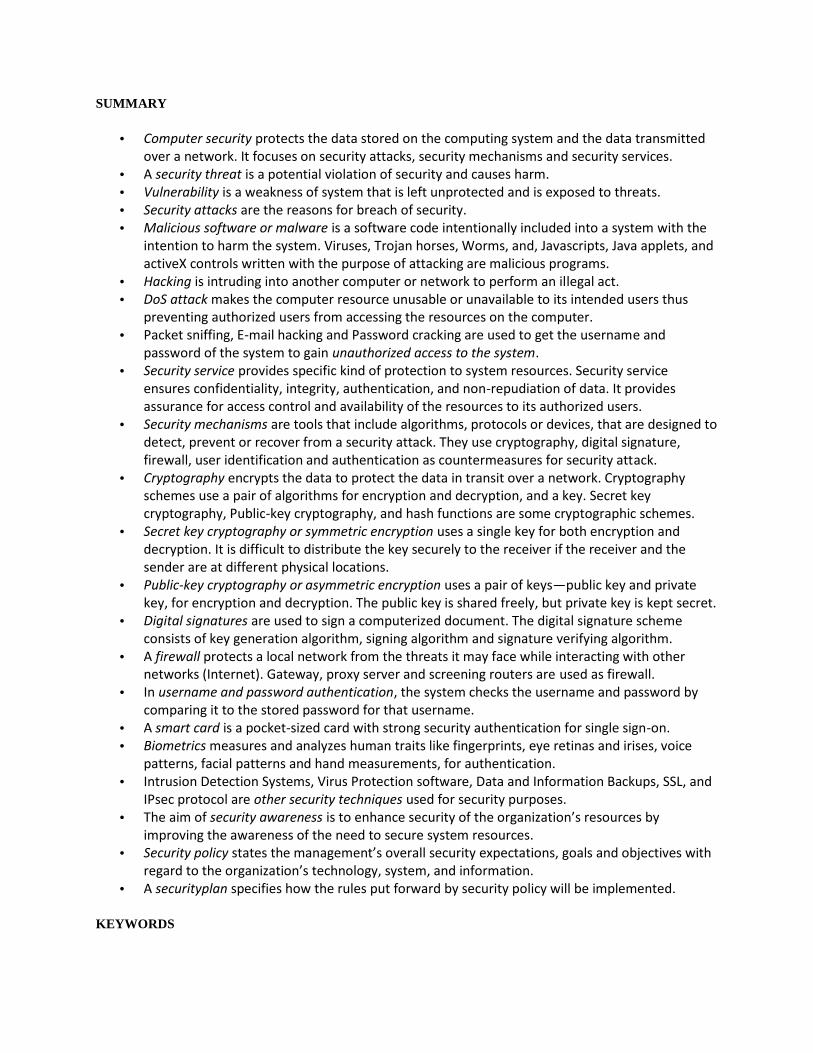
SUMMARY
Computer security protects the data stored on the computing system and the data transmittedover a network. It focuses on security attacks, security mechanisms and security services.
A security threat is a potential violation of security and causes harm. Vulnerability is a weakness of system that is left unprotected and is exposed to threats. Security attacks are the reasons for breach of security. Malicious software or malware is a software code intentionally included into a system with the
intention to harm the system. Viruses, Trojan horses, Worms, and, Javascripts, Java applets, andactiveX controls written with the purpose of attacking are malicious programs.
Hacking is intruding into another computer or network to perform an illegal act. DoS attack makes the computer resource unusable or unavailable to its intended users thus
preventing authorized users from accessing the resources on the computer. Packet sniffing, E-mail hacking and Password cracking are used to get the username and
password of the system to gain unauthorized access to the system. Security service provides specific kind of protection to system resources. Security service
ensures confidentiality, integrity, authentication, and non-repudiation of data. It providesassurance for access control and availability of the resources to its authorized users.
Security mechanisms are tools that include algorithms, protocols or devices, that are designed todetect, prevent or recover from a security attack. They use cryptography, digital signature,firewall, user identification and authentication as countermeasures for security attack.
Cryptography encrypts the data to protect the data in transit over a network. Cryptographyschemes use a pair of algorithms for encryption and decryption, and a key. Secret keycryptography, Public-key cryptography, and hash functions are some cryptographic schemes.
Secret key cryptography or symmetric encryption uses a single key for both encryption anddecryption. It is difficult to distribute the key securely to the receiver if the receiver and thesender are at different physical locations.
Public-key cryptography or asymmetric encryption uses a pair of keys—public key and privatekey, for encryption and decryption. The public key is shared freely, but private key is kept secret.
Digital signatures are used to sign a computerized document. The digital signature schemeconsists of key generation algorithm, signing algorithm and signature verifying algorithm.
A firewall protects a local network from the threats it may face while interacting with othernetworks (Internet). Gateway, proxy server and screening routers are used as firewall.
In username and password authentication, the system checks the username and password bycomparing it to the stored password for that username.
A smart card is a pocket-sized card with strong security authentication for single sign-on. Biometrics measures and analyzes human traits like fingerprints, eye retinas and irises, voice
patterns, facial patterns and hand measurements, for authentication. Intrusion Detection Systems, Virus Protection software, Data and Information Backups, SSL, and
IPsec protocol are other security techniques used for security purposes. The aim of security awareness is to enhance security of the organization’s resources by
improving the awareness of the need to secure system resources. Security policy states the management’s overall security expectations, goals and objectives with
regard to the organization’s technology, system, and information. A securityplan specifies how the rules put forward by security policy will be implemented.
KEYWORDS

Active attack Hacking Public Key Cryptography
ActiveX controls Hash Function (PKC)
Application-level Gateway HTTP Secure (HTTPS) RSA
Asymmetric encryption Integrity Screening routers
Authentication Intrusion Detection System Secret Key Cryptography
Biometrics IP Security (IPsec) Protocol (SKC)
Block ciphers Java applets Secure Socket Layer (SSL)
Certification Authorities Javascripts Security attacks
(CA) Key Security awareness
Cipher Malicious software Security mechanisms
Cipher text Malware Security plan
Circuit Filter Firewall Network Address Translation Security policy
Code (NAT) Security services
Computer security Non-Repudiation Security threat
Confidentiality Packet filter Firewall Smart card
Cryptography Packet replay Stream ciphers
Decryption Packet sniffing Symmetric encryption
Denial of Service (DoS) Passive attack Trojan horse
Digital signature Password User identification
Digital Signature Algorithm Password cracking User name
(DSA) Plaintext Viruses
E-mail hacking Private key Virus Protection software
Encryption Proxy Server Vulnerability
Firewall Public key Worms
Gateway
QUESTIONS
Section 14.2
1. What do you understand by the term Computer security?
2. Define: (i) Security attack, (ii) Security mechanism, and (iii) Security service.
3. Define: (i) Security threat, (ii) Vulnerability, (iii) Passive attack, and (iv) Active attack.
4. A security attack may be a _____ attack or a _____attack.

5. What are the targets of the security attack?
6. List some security attacks that can be made on the users of the computer.
7. List some security attacks that can be made on the computer hardware.
8. What kind of attacks can be made on the computer software?
Section 14.3
9. What is malicious software?
10. Give three examples of malicious programs.
11. List some properties of virus.
12. How can virus harm the computer?
13. Give an example of virus program.
14. Define a worm.
15. Give an example of a worm program.
16. What are Trojan horses?
17. Why is it advisable to keep the active control disabled on your computer?
Section 14.4
18. Define hacking.
19. What is a Denial of Service attack?
20. _____, _____and_____are the methods used to get the username and password of the systemto gain unauthorized access to the system.
21. What do you mean by packet sniffing?
22. Name one packet sniffer software.
23. How does a password cracker work?
24. How is e-mail hacked?
Section 14.6

25. Security services ensure_____, _____ _____and _____of the data.
26. Define (i) Confidentiality, (ii) Integrity, (iii) Authentication, and (iv) Non-Repudiation.
27. _____is used for ensuring confidentiality.
28. Name any two methods that are used for authentication.
29. Non-repudiation deals with_____.
30. List three technologies used for implementing the security mechanisms.
Section 14.7
31. Define cryptography.
32. Define (i) Plain text, (ii) Cipher, (iii) Cipher text, (iv) Encryption, and (v) Decryption.
33. Define a key.
34. What is the significance of key in cryptography?
35. Name the three cryptographic schemes.
36. Why secret key cryptography is also called symmetric encryption?
37. Explain the working of Secret key cryptography.
38. What is the difference between a stream cipher and block cipher?
39. Name a secret key cryptography algorithm.
40. In public key cryptography, how is the public key different from the private key?
41. Why public key cryptography is also called asymmetric encryption?
42. Name a public key cryptography algorithm.
43. _____algorithm is used to provide digital signature.
44. What is the purpose of hash function?
45. Name a hash algorithm.
46. What is the function of Certification Authorities (CA)?
Section 14.8
47. What is the use of digital signature?
48. Is digital signature scheme a symmetric cryptography or asymmetric cryptography?
49. Name the three algorithms included in a digital signature scheme.
50. Explain the digital signature creation and verification using hash function.
51. Signer authentication, Message authentication, and Efficiency are three effects accomplishedby digital signature. Explain.
Section 14.9
52. What is the purpose of firewall?
53. List the functions of firewall.
54. Explain the working of firewall.
55. Define: (i) Gateway, (ii) Proxy Server, and (iii) Screening Routers.
56. Name the three types of firewall.
57. How does the Packet filter Firewall work?
58. How does the Circuit Filter Firewall work?
59. How does the Application-level Gateway work?
Section 14.10—14.11
60. What is the difference between user identification and user authentication?
61. Name three authentication mechanisms.
62. Explain user identification and authentication.
63. What is the need of user authentication?
64. List some steps to make the password safe.
65. What is a smart card?
66. Name three areas where smart card is commonly used.

67. How does biometric technique help in user authentication?
68. What is the purpose of intrusion detection system?
69. What is the need of installing virus protection software on your computer?
70. What is the need of taking regular data and information backups?
71. How is HTTPS different from HTTP?
72. IPv6 protocol includes network security. Explain.
Section 14.12
73. What is the need of spreading security awareness?
74. What is a security policy?
75. What is the need of a security plan?
76. List the steps followed in formulating the security policy.
77. Explain in detail the formulation of security policy.
78. What IT resources need to be made secure in an organization?
79. What is the purpose of proactive security strategy?
80. What is the purpose of reactive security strategy?
Extra Questions
81. Give full form of the following abbreviations:
1. DoS2. SKC3. PKC4. DES5. AES6. DSA7. sha8. ca9. nat10. SSL11. IPsec

82. Write short notes on:
1. Security attack2. Malicious software3. Viruses4. Trojan horse5. Worms6. Hacking7. Security services8. Cryptography9. Secret key cryptography10. Public-key cryptography11. Digital signature12. Firewall13. Types of firewall14. User identification and authentication15. User authentication mechanisms16. User name and Password17. Security awareness18. Security Policy19. Formulating a security policy
83. Give differences between the following:
1. Passive security attack and Active security attack2. Viruses and Worms3. Malicious software and Hacking4. Secret Key Cryptography and Public-Key Cryptography5. Packet filter firewall and Circuit Filter firewall6. Users identification and User authentication7. Proactive Security Strategy and Reactive Security Strategy
Unit IV
COMPUTER PRACTICALS
15
WINDOWS XP
Contents

Introduction Features of Windows XP The desktop—The task bar, the icons and shortcuts Structure of Windows—Title bar, menu bar, tool bar, scroll bar, status bar Windows XP explorer
o The starto The window-Title bar, menu bar, standard bar, address bar, status baro The view-Filmstrip, thumbnails, tiles, icons, list, detailso Selecting fileso Working with folders-Creating, deleting, copying, moving, changingo Files and folders properties-Showing, organizing, modifyingo The searcho The recycle bin-Open, restoring and deleting files or folders, emptyingo Configuring screen-Desktop, screen saver, appearance, themes, settingso Configuring the mouse, adding or removing programso Adding new hardware-Not plug & play, basic information about computero System tools-Backup, character map, disk cleanup, system restore etc.o The scandisko Windows XP media player, Windows XP helpo Windows vista-Updated GUI, Windows instant search, Windows DVD maker, embedded
start menu, the taskbar preview, Windows contactso Windows 7-Desktop, Windows explorer, taskbar, devices, virtual hard disk, Windows
action center, Windows biometric framework, wordpad
Why this chapter
Create, open, copy, hide, search, or delete a file or folder; view a folder’s information, configurethe appearance and theme of the screen, and, add new hardware and software are some of thetasks you perform quite often while working with the computer machine. For performing thesetasks, you interact with the operating system. Windows XP is a most widely used and popularoperating system. The purpose of this chapter is to introduce you to “Windows XP”.
15.1 INTRODUCTION
There exist a number of operating systems, such as DOS, Windows 98, Windows NT, WindowsXP, Windows Vista, Unix, Linux, DOS, Mac OS X Snow Leopard etc. Each Operating System(OS) has its own unique features. Windows XP belongs to the Windows family of OS. WindowsXP represents an important change from the previous versions of Windows OS. Before WindowsXP, Microsoft had two different operating systems, Windows 98 for personal use and WindowsNT/2000 for business and professional environment. Windows XP is a convergence among bothversions; the center of operating system Windows 2000 was divided to create Windows XP, andsome adjustments were done to differentiate Windows XP Home Edition and Windows XPProfessional.
The main benefits of Windows XP are:

For domestic users, it has acquired the stability of Windows NT/2000. Thus, Windows XP is verystable and rarely crashes.
For professional users, it provides greater compatibility with the hardware than WindowsNT/2000.
In this chapter, the environment of Windows XP OS is discussed in detail. A brief description ofWindows Vista and Windows 7 OS is also provided.
15.2 FEATURES OF WINDOWS XP
Windows XP has a new user system completely different from Windows 98. Some new featuresofWindows XP are:
Multiple users with independent profiles can be defined. Each user can have differentpermissions that will allow the user to carry out certain tasks. Each user will have a differentStart menu and My Documents folder that can be protected by password. Multiple users canalso share folders. The system handles the different active users without interferences.
It is better integrated to Internet Explorer. CDs can be burned by dragging and dropping to the recording unit. It is no longer necessary to
install an additional program to record CDs. It has a useful way for showing pictures called Filmstrip. It s easier to configure a domestic network. It recovers better from errors. When a fatal error occurs Windows XP creates a register with all
the information concerning the error and gives user the option of sending it to Microsoft, to beanalyzed.
Windows XP initializes faster than Windows 98. The Start menu and the Task bar have changed. Windows Movie Maker is a new component used for editing films.
15.3 THE DESKTOP
The entire screen on which all windows are displayed is termed as Windows Desktop. It is thefirst screen that appears when the operating system has initialized (Figure 15.1). All your workopens as individual windows on the Windows Desktop.
The Desktop has two parts—the portion where icons are displayed, and the Taskbar at thebottom of the Desktop window. The icons are small images located on the Desktop. Forexample, for Internet Explorer and for Recycle Bin. The Task Bar contains Start button andother parts.
In this chapter, we use the following terminology while working with the mouse:
Pointer—a mouse pointer Click—press left button of mouse once Double Click—press left button of mouse twice

Right Click—press right button of mouse once Select—move the pointer of mouse and keep the left button of the mouse pressed over the
area that you want to select. The selected area will appear in a dark background.
We enclose the command in braces <Command> to represent the command to be clicked.
Figure 15.1 The desktop screen
15.3.1 The Task Bar
On the Desktop, Task Bar appears at the bottom of the screen. The task bar has four parts: (1)Start button, (2) Area for shortcuts, (3) The running programs, and, (4) The Notification Area.
Start Button: It provides access to the entire range of options that Windows XPoffers. If you click it, a menu as shown in Figure 15.2 is displayed.
o It displays the list of programs that are permanently available and that are mostfrequently used. Like, Set Program Access and Defaults, Connect To, Printers and Faxesetc.
o All Programs is used to view all the programs that are installed on the computer.o Documents provide access to the different parts of Windows XP that are most often
used like— My documents, My Recent Documents, My Pictures.o Control Panel allows configuring and customizing of appearance of the computer.o Search is used to find files or folders.

o Help and Support provides help and support to work on Windows.o Run allows directly executing certain commands, for example to execute a specific
program, etc.o Log Off allows closing the current session.o Turn Off Computer allows restarting or turning off the computer.
The area for shortcuts contains icons that are used to access a particular programquickly. To place an icon here, simply drag it from the Desktop. To execute, simply click on theicon.
Figure 15.2 The start button
Running Programs It shows the buttons of the application programs that are currently open. Ifthe button is slightly darker, it is the button of the application program that you are currentlyworking with. When there are several instances of the same program open at the same timethey are grouped under a button. For example, if you have six windows of Internet Explorer

opened at the same time, clicking on the button will display all windows of the InternetExplorer.
The Notification Area contains icons that represent the programs that start up automaticallywhen the computer is turned on. If a round button appears, this allows you to expand orshrink the area that contains the icons of these programs. The time also appears here.
Double-click on an icon to open it.
15.3.2 The Icons and Shortcuts
The user can double-click the icon on the desktop to open it, for example, clicking on the iconwill open up Internet Explorer.
Organizing Icons on Desktop using the following steps:o Right click on Desktop. <Arrange Icons By> (Figure 15.3)
Figure 15.3 Arrange icons by
o Choose to organize by Name, Type, Size, or Modified (date).o You can activate Auto Arrange, which arranges the icons one below the other.o To customize the way the icons are organized, simply drag them with the mouse to
where you want them. For this, Auto Arrange must be deactivated. Create Shortcuts as follows:
o Right click on Desktop. <New> <Shortcut> (Figure 15.4)

Figure 15.4 New shortcut
o A dialog box will appear. Indicate the program for which you want to create theshortcut. You can use Browse button, to find the program.
o Select the file or folder. <Ok> <Next>o Type a name for the Shortcut. <Finish>o Once you have the shortcut on the desktop, you can leave it there or drag it to the quick
access bar on the task bar. Change Date and Time—The computer has a clock located on the right side of the task bar.
To change the Date follow these steps:o Double-click on the clock on the Task bar to open the dialog box (Figure 15.5).
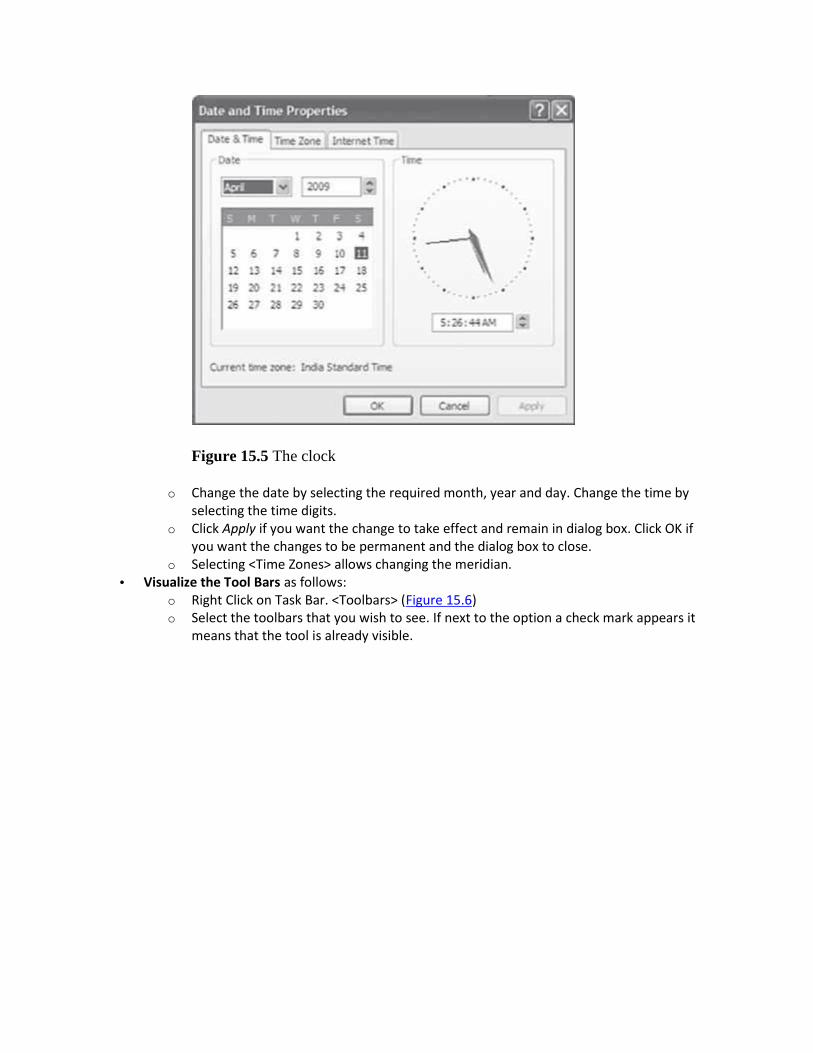
Figure 15.5 The clock
o Change the date by selecting the required month, year and day. Change the time byselecting the time digits.
o Click Apply if you want the change to take effect and remain in dialog box. Click OK ifyou want the changes to be permanent and the dialog box to close.
o Selecting <Time Zones> allows changing the meridian. Visualize the Tool Bars as follows:
o Right Click on Task Bar. <Toolbars> (Figure 15.6)o Select the toolbars that you wish to see. If next to the option a check mark appears it
means that the tool is already visible.

Figure 15.6 The toolbar
15.4 STRUCTURE OF WINDOWS
All the windows in Windows XP have the same structure. Figure 15.7 shows the contents ofdirectory D:\ASHIMA GOEL. The structure of this window is very similar to the others.
Title Bar—It contains name of the program you are working with and name of the openeddocument. The windows can be moved around the window desktop using this title bar. The topright corner has three buttons to minimize, maximize/restore, and close the window.
Menu Bar—It is located under the Title bar and contains the related Pull-down menus for thecurrently active windows; for example—File, Edit, View, Favorites, Tools, and Help. Clicking on amenu name will activate a pull-down menu with various options to select. If you find an optionthat is grey or lighter colored, it means that it is not possible to select it at that moment.
Tool Bar—It contains icons of the most often used commands that can be executedimmediately. These commands can also be executed from the menu bar.
Scroll Bar—The scroll bars allow us to move throughout the page in a quick and simple manner.Simply drag the bar with the mouse or click on the arrows. There are bars to move along thewidth of the page and bars to move along the height of the page. The little square with dots onthe right is used to change the size of the window.
Status Bar—It gives information to the user, depending on the window that is opened at thetime. This bar is not shown by default in Windows XP. You can activate or de-activate it from the<View> <Status Bar>.
Borders for Resizing—A thin border appears around the windows, which can be used to resizethe current window. To resize the current windows, just place the pointer on the border of thewindows (it will become two-headed arrow), click the mouse button, and then hold and drag tothe desired location. The windows will change its size.

Figure 15.7 A window
15.5 WINDOWS XP EXPLORER
Windows Explorer lets the user explore the contents of computer and do file management. Itorganizes and controls the files and folders of the different storage devices such as the harddrive, disk drive, etc. The Windows Explorer is also known as the File Manager. WindowsExplorer is especially useful for copying and moving files. Windows Explorer allows to delete,see, copy, or move files and folders.
15.5.1 The Start
To start Windows Explorer
1. Click on the icon on the task bar or desktop, or,2. <Start> <Programs> <Accessories> <Windows Explorer> (Figure 15.8)

Figure 15.8 The start button
15.5.2 The Window
The window that opens when you start Windows Explorer has the same structure as discussed inthe previous section. The explorer consists of two sections. On the left side there is the directorytree (in a hierarchical order) which shows the list of units and folders on the computer. On theright side there is a section, which shows all the files and folders that the user has selected on theleft hand side. Windows Explorer has different bars that make up the window. These are asfollows:
Title Bar that shows the name of the folder you are in.

Menu Bar contains the menus that allow access to all the operations that can be done with a fileor folder. Clicking on the menu will display the options.
Standard Bar contains the buttons for the most used operations. If this bar is not visible, selectfrom the menu View, the option Toolbars, next select the option Standard buttons.
o Back button —to go to the last page that you have seen.o Forward button—to move one page forward.
o Up button —to go up one level from the current folder.
o Search button —displays a window where you can search for the file
o Folders button —shows the folder’s structure on the left side of the screen.
o Last button —to change the views on the folders (details, Thumbnails) Address Bar shows the name of the folder you are working with.
Status Bar shows additional information of the selected file or folder. It shows the number offiles the folder contains and its total size. If a file is selected, status bar displays the informationof selected objects and their total size.
15.5.3 The View
Windows explorer allows the user to see the folder’s information in different views to facilitate
specific searching. On clicking of the button a menu shows the different options (Figure15.9) that can be selected to view a unit or a folder. The options are - (1) Filmstrip, (2)Thumbnails, (3) Tiles, (4) Icons, (5) List, and (6) Details.
Thumbnails—A small representation of the content appears with the format of the image. Filmstrip—It is used to view the images only. On the bottom part a strip appears with the
images in thumbnail format and on the top a larger representation of the image selected on thebottom is seen.
Tiles—The files and folders are shown with large images with the name, file type, and size in KB Icons—The files are shown with an icon and the name of file. List—Shows small icons, one below the other, so it is easier to search by name. It shows only the
name of file or folder. Details—Icons are shown one below the other, with some of their properties like size, file type,
date of modification, etc.

Figure 15.9 The view options
15.5.4 Selecting Files
The files on folders can be selected in three different ways depending on what files and foldersyou wish to select. Windows Explorer allows you to select a single file or folder, or several filesor folders at the same time.
To select a single file or folder—Click on the file or folder you want to select. Any operation youperform will only apply to the selected file or folder.
To select several files and folders that are consecutive—o Click on the first element and then click on the last element while keeping <Shift> key on
the keyboard pressed.o This can also be done with the mouse. Click on the left of the first file or folder (but not
on it) and, without letting go, drag it. A frame appears that shows the area that theframe encompasses. Continue dragging until all the files and folders you wish to selectare within the frame, then let go of the left mouse button
To select several files and folders that are not consecutive—Click the first file or folder and whilekeeping the <Ctrl> key on the keyboard pressed, continue to click the other files and folders thatyou wish to select.
15.5.5 Working with Folders
Windows Explorer allows you to perform several operations on the files and folders stored in adirectory. You can create a folder, delete a file or folder, copy a file or folder, move a file orfolder, and change the name of a file or folder.
Creating Folderso Open the folders that you have by clicking on the “+” located to the left of the folders. It
will show all of the folders contained in it and the plus sign will become a minus sign “-”; If you click on the minus sign, it will again hide the content of the folder selected.
o Open the folder in which you want to create a new folder by double clicking on it.o <File> <New> <Folder>. A new folder appears with the name New Folder. This is the
name that Windows gives to new folders by default. Type a name for the new folder,and then press Enter key on the keyboard.
Deleting Files or Folders

o Select the files or folders you want to delete.o Once selected, you can delete the file or folder using—<File> <Delete>, or, Press delete
button on the keyboard, or, Click on . The deleted folder moves to the Recycle Bin. Copying Files or Folders
o Select the files or folders you want to copy.o Once selected, you can copy the file or folder using any one of the following ways:
<Edit> <Copy>. Open the folder or disk drive where you want to copy the file to.<Edit> <Paste>, or,
Click on Copy Q. A dialog box is displayed. Search for the folder where you wantto copy the selected file or folder. If you click on the “+” that appears on the left,the contents of the folder will be displayed. Select and open the folder whereyou want to copy the file or folder. <Paste>.
Moving Files or Folderso Select the files or folders you want to move.o Once selected, you can move the file or folder using any one of the following ways:
<Edit> <Move to Folder>. A dialog box is displayed. Search for the folder where youwant to move the selected file or folder. If you click on the “+” that appears on the left,the contents of the folder will be displayed. Select and open the folder where you wantto move the file or folder. <Move>.
Changing the Name of a File or Foldero Select the file or folder whose name you want to change.o Once selected, you can change the name of file or folder using any one of the following
ways: Right click. <Rename>. Write the new name, or, <File> <Rename>. Write the new name.
o Click Enter key or click outside the file or folder so that the changes take place.
15.5.6 Files and Folders Properties
Both files and folders have their own characteristics, for example size, location, date of creation,attributes, etc. In Windows Explorer, to know the characteristics of a file or folder, do either ofthe following:
1. <File> <Properties>, or,2. Right click on a file or folder. Select <Properties> from the displayed menu.
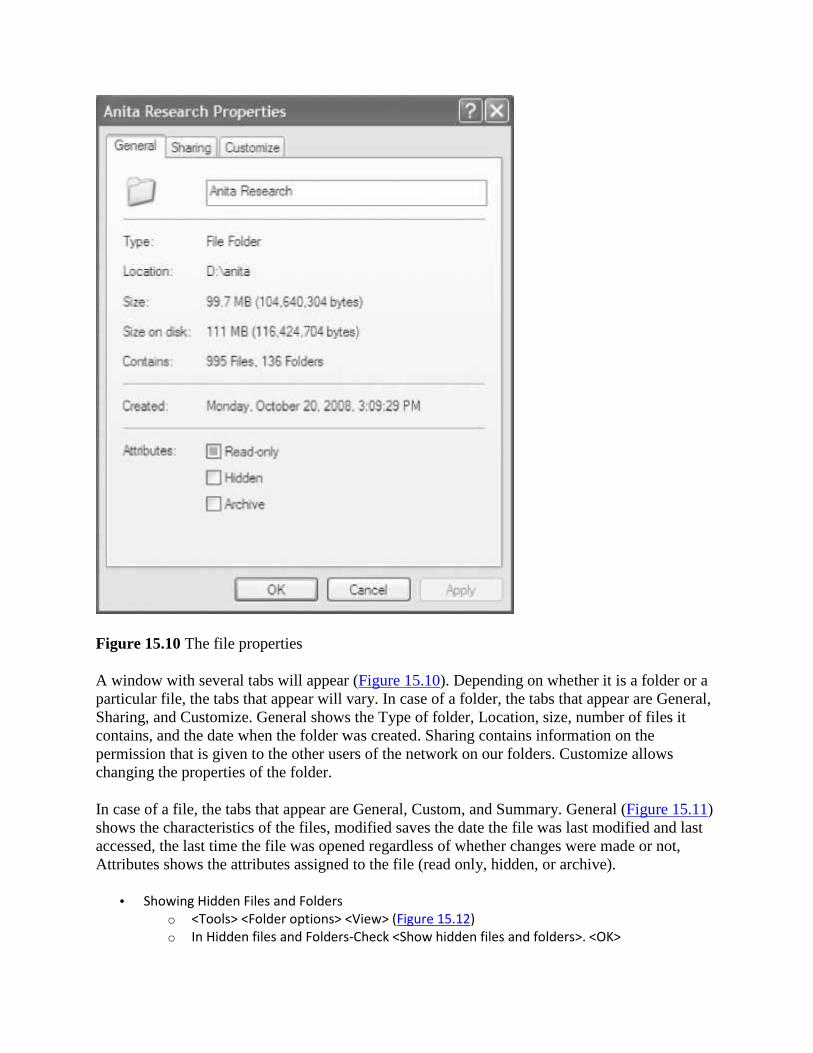
Figure 15.10 The file properties
A window with several tabs will appear (Figure 15.10). Depending on whether it is a folder or aparticular file, the tabs that appear will vary. In case of a folder, the tabs that appear are General,Sharing, and Customize. General shows the Type of folder, Location, size, number of files itcontains, and the date when the folder was created. Sharing contains information on thepermission that is given to the other users of the network on our folders. Customize allowschanging the properties of the folder.
In case of a file, the tabs that appear are General, Custom, and Summary. General (Figure 15.11)shows the characteristics of the files, modified saves the date the file was last modified and lastaccessed, the last time the file was opened regardless of whether changes were made or not,Attributes shows the attributes assigned to the file (read only, hidden, or archive).
Showing Hidden Files and Folderso <Tools> <Folder options> <View> (Figure 15.12)o In Hidden files and Folders-Check <Show hidden files and folders>. <OK>

Figure 15.11 The file properties general tab
Knowing Types of Files—To know the types of files registered in the computer and the programwith which they open.
o <Tools> <Folder Options…> <File Types>o On the window that appears, you can see all of the types of files that the computer can
open. If you select any of them, the details of the program with which it opens willappear.
Organizing Folderso Place cursor on the folder you wish to arrange.
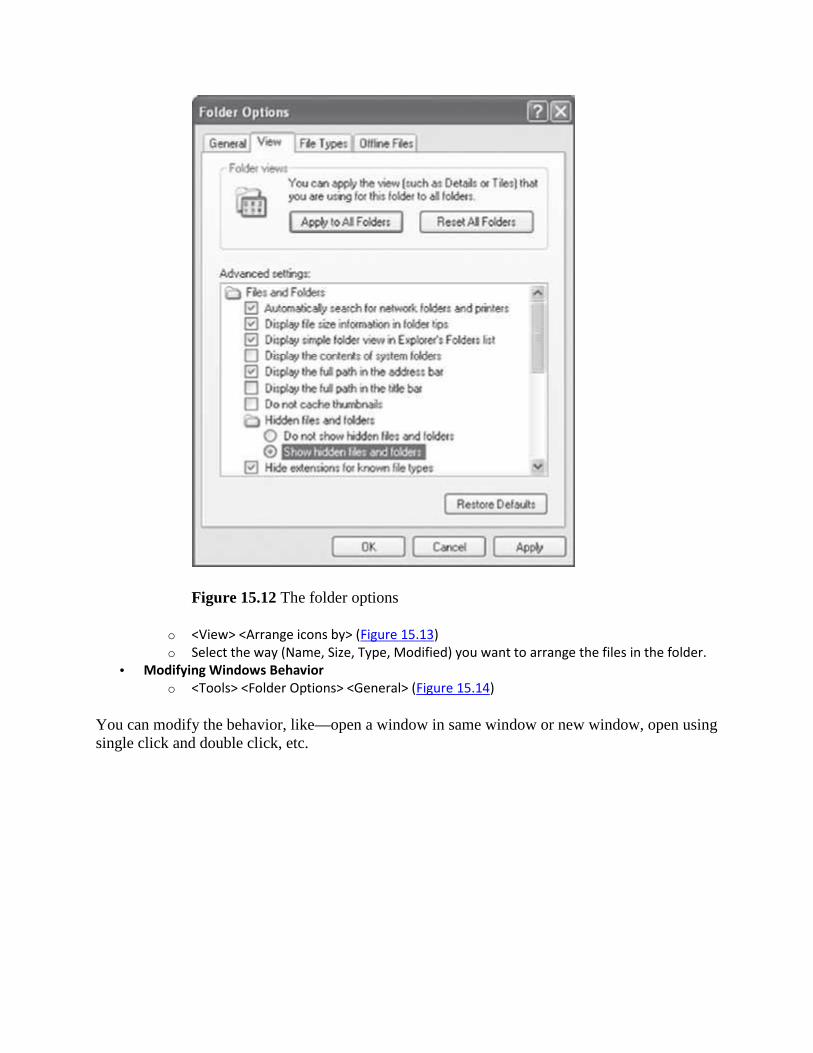
Figure 15.12 The folder options
o <View> <Arrange icons by> (Figure 15.13)o Select the way (Name, Size, Type, Modified) you want to arrange the files in the folder.
Modifying Windows Behavioro <Tools> <Folder Options> <General> (Figure 15.14)
You can modify the behavior, like—open a window in same window or new window, open usingsingle click and double click, etc.

Figure 15.13 Organizing folders
Figure 15.14 To modify window behaviour

15.6 THE SEARCH
With so many files and folders, sometimes it becomes difficult to locate a file or a folder in thedirectory. Windows XP provides Search option to search for hardware, a network, people in thedirectory, Internet pages, etc. To search click <Start> <Search>.
It allows you to search for files and folders, people, hardware, and on the Internet. The searchpop-up screen will be displayed (Figure 15.15).
15.7 THE RECYCLE BIN
The Recycle Bin is a space on the hard disk reserved to store information that is deleted. In theevent of deleting a file or folder by mistake, it is possible to retrieve it from the Recycle Bin. If adeleted file needs to be restored, the Recycle Bin restores files or folders to the place from wherethey were deleted. For example, if a file is deleted from D:\My Documents, when it is restored, itwill go back to this folder. Recycle Bin stores and maintains the deleted documents until the binis emptied.
Figure 15.15 The search pop-up screen
Open Recycle Bin—To open the Recycle Bin, place the cursor on Desktop and double-click onthe Recycle Bin icon . The Recycle Bin window (Figure 15.16) is similar to the WindowsExplorer window, and has similar options. In the Recycle Bin shows the names of the deletedfiles and folders, their original location before it was deleted and the date and time when it wasdeleted.

Restoring Files or Folderso Select the elements to be restored by clicking on them.o Click on the green arrow on the left side with <Restore the selected Items> or <Restore
this Item> depending on whether you have selected more than one item or one item,or, Click on <File> <Restore>
o The selected files will return to where they were located before deletion. Deleting Files or Folders—Once files and folders in the Recycle Bin are deleted, they are deleted
permanently. To delete any file or folder from the Recycle Bin follow these steps:o Select the files to be deleted.o <File> <Delete>, or, press the Delete button on the keyboard.o A window appears asking if you are sure that you want to delete the selected file or
folder. Click Yes if you are sure you want it deleted.o The selected files will disappear and cannot be restored.
Emptying the Recycle Bin—There are three ways to empty the Recycle Bin as follows—o Open Recycle Bin Window. Click on <Empty the Recycle Bin>. A window will appear
asking “Are you sure you want to delete these x items”, where x is the number ofelements currently in the Recycle Bin. Click Yes to empty it.
Figure 15.16 The recycle bin
o Open Recycle Bin window. <File> <Empty Recycle Bin>. A window will appear asking“Are you sure you want to delete these x items”, where x is the number of elementscurrently in the Recycle Bin. Click Yes to empty it.
o Right click on the Recycle Bin icon on the desktop. <Empty Recycle Bin>
15.8 CONFIGURING THE SCREEN
A user spends long hours in front of the computer. Configuration of the screen is required tomake the screen of the desktop comfortable for use. The user can configure the desktop screen asfollows:
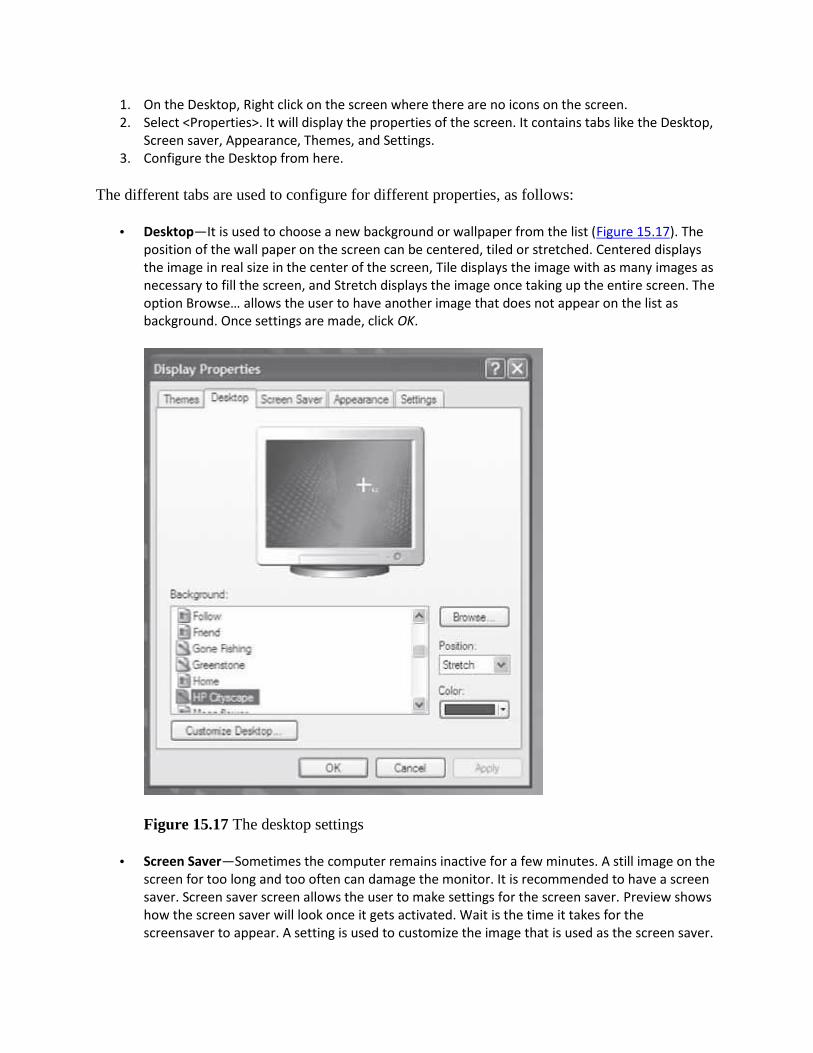
1. On the Desktop, Right click on the screen where there are no icons on the screen.2. Select <Properties>. It will display the properties of the screen. It contains tabs like the Desktop,
Screen saver, Appearance, Themes, and Settings.3. Configure the Desktop from here.
The different tabs are used to configure for different properties, as follows:
Desktop—It is used to choose a new background or wallpaper from the list (Figure 15.17). Theposition of the wall paper on the screen can be centered, tiled or stretched. Centered displaysthe image in real size in the center of the screen, Tile displays the image with as many images asnecessary to fill the screen, and Stretch displays the image once taking up the entire screen. Theoption Browse… allows the user to have another image that does not appear on the list asbackground. Once settings are made, click OK.
Figure 15.17 The desktop settings
Screen Saver—Sometimes the computer remains inactive for a few minutes. A still image on thescreen for too long and too often can damage the monitor. It is recommended to have a screensaver. Screen saver screen allows the user to make settings for the screen saver. Preview showshow the screen saver will look once it gets activated. Wait is the time it takes for thescreensaver to appear. A setting is used to customize the image that is used as the screen saver.

Password protect is a password protection to keep someone else from working on your account,on resume. It will allow you back to the normal screen only after you have entered the correctuser password.
Appearance—It is used to change the appearance of the Desktop screen like, the style youwant, a color scheme and a font size (Figure 15.18). Once settings are made, click OK.
Figure 15.18 The desktop appearance settings
Themes•A Theme groups the different characteristics that affect the appearance of Desktop bygiving it a name. You can select a theme you prefer and on the bottom part you can see how itwill look. If you wish to save the changes, click Save as, then name it and click OK.
Settings—It allows you to select the monitor and graphics card, and choose the resolution andthe color scheme (Figure 15.19). The resolution affects the size of the images. Selecting a colorscheme decides the amount of colors with which the monitor will work with.
15.9 CONFIGURING THE MOUSE
The mouse is a tool that is used constantly and it is recommended to set it as per yourconvenience and needs. To configure the mouse, open the mouse properties window as follows:

<Start> <Settings> <Control Panel> <Printers and Other Hardware> <Mouse> (Figure 15.20)You can do all settings for the mouse from here.
Figure 15.19 The desktop color settings
Figure 15.20 The mouse settings

15.10 ADDING OR REMOVING PROGRAMS
The Adding and Removing tool is used to add a program and to uninstall a program that is nolonger needed. When a new program is installed, Windows creates notes on a file calledWindows Register. The Windows Register stores the current configuration of the system,hardware, software, and different user configurations. A program that needs to be uninstalledcannot be done by simply deleting the files manually. If we delete, only the files linked to aprogram, the records that Windows created on the Register are not removed, so an inconsistencycan occur.
To add or remove programs, open the Add or Remove Programs window as follows:
<Start> <Settings> <Control Panel> <Add or Remove Programs> (Figure 15.21)
The window allows the user to change or remove programs, add new programs, add or removeWindow components, and setting of program access and defaults.
Figure 15.21 Setting to add or remove programs
15.11 ADDING NEW HARDWARE

When we want to add new hardware to a computer, two things can happen: either the componentis Plug & Play or it is not. If the hardware to be installed is Plug & Play, simply connect thehardware and Windows will recognize and install it automatically. Conversely, if you connectthe hardware and the Window recognizes it, then the hardware is Plug & Play. If the Windowsdoes not recognize it, then the element is not Plug & Play and needs to be installed manually. Forinstalling it, an Add new Hardware assistant is provided. When new hardware is installed, thecomputer needs driver for that hardware. The driver contains the files that describe the hardwareand allows the computer to communicate with it.
To add a hardware that is not plug & play, open the window as follows—o <Start> <Settings> <Control Panel> <Printers and Other Hardware> <Add hardware> (on
the left of window) (Figure 15.22)o The Add Window Hardware Wizard appears. Follow the instructions of the wizard for
installation. To see the basic information about your computer like the hardware of your system and their
properties, do the following:o <Start> <Control Panel> <Performance and maintenance> <See basic information about
your computer>o A window named System Properties will appear. It has various tabs. For example, the
General tab shows generic information about your system, such as which processor isinstalled, etc. Select <Hardware> <Device manager>. It shows a list of all the hardwareinstalled on your computer (Figure 15.23).
Figure 15.22 The window and other hardware screen

Figure 15.23 The device manager
15.12 SYSTEM TOOLS
Windows incorporates certain tools such as the Disk Defragmenter, the Disk Cleanup – the toolto free disk space, the Scheduled Tasks, etc. Almost all of these tools are designed to optimizethe behavior of the computer. To select any of these tools, do the following:
<Start> <Programs> <Accessories> <System Tools> (Figure 15.24)
The window shows the different system tools like Backup, Character Map, Disk cleanup, DiskDeFragmenter, Files and Settings Transfer wizard, Scheduled Tasks, System Information, andSystem Restore.
Figure 15.24 The system tools screen

Disk Defragmenter reorganizes the information that is stored on the disk so that the free spacesbetween the information disappear, and the performance of the disk improves.
Figure 15.25 The system information screen
System Information shows information regarding the system, such as the installed applications,the drivers, the processor, etc (Figure 15.25). It gives detailed information about the HardwareResources, Components, Software environment, Internet Settings and MS–Office applications.
Disk Clean Up allows you to empty the disk of information that you do not use, like temporaryfiles, Internet files, or even files in the Recycle Bin.
Character Map is useful to insert symbols that are not on the keyboard. System Restore restores the Windows registry, which is the place where all the information
about changes to the configuration is kept (Figure 15.26). The system itself makes a copy of theregistry every once in a while. With this tool, you can restore some of these copies or generate anew copy of the current registry when you are going to make important changes to theconfiguration of the system. If the new configuration does not work properly, you can go backand restore the system.
Scheduled Tasks is used to schedule any program to run at specific times. For example, you canschedule the use of the Disk Cleanup for once a week, which will run automatically, once aweek.

Figure 15.26 The system restore screen
15.13 THE SCANDISK
It is a tool used to search errors in the system’s units and to repair those errors. When thecomputer is turned off in an abrupt manner it is possible that some files may get damaged.Normally when the computer is turned on, after being turned off abruptly (without using theoption shut down from the Start menu), the Scandisk executes to check the system and repair anyerror that it may find. By using this tool we can fix the possible errors and therefore retrieve theinformation that it contains, although, it is not always possible to retrieve the information.
To use Scandisk, do as follows:
1. Click on My Computer on desktop,2. Select the unit (drive) that you want to perform the scandisk on, for example unit (D:).3. Right click. <Properties> <Tools> <Check Now…> (Figure 15.27)
Once the scan has finalized a confirmation window will appear.

Figure 15.27 The scandisk
Figure 15.28 The windows media player

15.14 WINDOWS XP MEDIA PLAYER
Windows XP includes the Windows Media Player (Figure 15.28) which allows you to listen to
music from a CD. To open the Windows Media Player double click on . It allows playing ofsongs from a CD or from the hard disk drive. There are commands to handle the player, like playas well as to pause, stop the song or video being played, skip back to the previous song on thelist, skip to the next song or video on the playlist, move forward or move backward in a song,control the volume and you can do many more things.
15.15 WINDOWS XP HELP
The Windows XP provides help to questions regarding the use of a Windows XP component ortool. The help is composed of a series of pages that are similar in navigation, as the pages on aweb site. Options are also available to search information about a particular theme from keywords and key phrases.
The most common help provided by Windows XP is in the form of tooltips that appear byplacing the pointer for a few seconds over the majority of the icons on Windows. This help isuseful when you do not remember what an icon is for; the tooltip gives you a hint.
The main way to obtain help is facilitated by the help center and technical support. To open the
Help and Support Center and use the help services click on Help and technical support fromthe <Start> <Settings> <Control Panel> menu.
15.16 WINDOWS VISTA
Windows Vista contains many changes and new features over its predecessor (Windows XP).
Microsoft’s Windows Vista operating system is designed to give better results in less time. Itsimproved graphics look helps in multitasking, and its increased security system makes your datamore secure but it needs very high systems specifications to run. The minimum specification ofthe computer on which Windows Vista can be installed is Pentium 4 or higher, 512 MB RAM,32 MB video card and 40 GB hard disk. But, Windows Vista installed on the computer havingthe above specification makes the computer very slow. To have a reasonable speed of workingwith Windows Vista installed, you should have at least 2.0 GHz Pentium 4 or higher, 1 GB ofRAM, 60 GB hard disk and 64 MB video RAM. The high system requirements are one of thekey reasons for Windows Vista criticism.
Here, we highlight some of the key features of Windows Vista:
Updated GUI and Visual Style Dubbed Windows—Aero is Microsoft’s name for the GUI theme(Luna—Windows XP’s interface). Aero allows for transparent windows edges, window fades and3D task switcher. If your video card supports the Aero Glass interface, you get translucent titlebars and animations. Aero interface enables you to quickly switch between windows and tasks.
Sidebar (Figure 15.29) is the collection of items on the right side of the screen. It is acustomizable window that makes it easy to access frequently used information. It contains a setof devices you can choose from. Some choices are:
o Calculator, analog clock, notepad, recycle bin, games, puzzles, and currency converter.o CPU and memory meters to view the amount of system resources in use.o Feed viewer for tracking items, news, sports etc. via RSS, and Feed watcher for
monitoring the selected RSS feeds.o Slide show that displays a continuous slide show of the photos in the Pictures folder.
The search facility in Windows Vista has been improved. You can use Windows Instant Search tosearch for anything on your computer.
Multimedia tools like Windows DVD Maker have been included. It redesigns networking, audio,print, and displays sub-systems. It makes it easy to burn your movies to disc, and you can createchapters and menus that let you jump to specific scenes. You also have more control over thequality and size of your video files.
Windows Vista has improved the Security of the User’s Data.o New security systems like drive encryption, file system encryption and scheduled
backups improve security of your data.o The new IE7 browser keeps malicious software or Web sites from changing
configuration settings.o Windows Service Hardening keeps OS services from making changes to the registry, file
system, etc., without your permission.o Windows Firewall settings can be controlled both for the outbound traffic as well as
inbound traffic.o Network Access Protection agent prevents Vista clients from connecting to your
network if they don’t have the proper security updates. Embedded Start Menu (Figure 15.30) includes Windows Mail (instead of Outlook Express),
Windows Contacts (new address book), and Windows Calendar, in addition to the features ofthe Start menu of Windows XP.
The Taskbar Preview provides a preview of the open application icon. If there are multipleinstances of that application, you will see all preview pages.
Windows Contacts replaces the Windows Address Book in XP. In addition to the featuressupported by Windows Address book, you can add photos to your contacts and import WindowsAddress Book files from another computer, and do much more.

Figure 15.29 The Windows vista sidebar
Vista includes the Windows Calendar which provides good, basic appointment and eventscheduling that you can view in a daily, weekly, or monthly layout. It includes a Task list andallows you to set reminders and recurring appointments. You can share your calendar withothers on the local computer or the Internet. You can export your calendar to a website andallow others to subscribe to it, and you can subscribe to the calendars of others and view themside by side. You can also easily invite participants to meetings.

Figure 15.30 The Windows Vista start menu
Vista includes the Windows Photo Gallery which replaces the Windows Picture and Fax Viewerin XP. The photo gallery helps you organize and view your digital photos and videos easily. Youcan do simple photo editing and print them.
Vista includes several New Games, such as Ink ball and Chess Titans. File Navigation is easy in Windows Vista. For example, as you vertically scroll the folder tree, the
window automatically scrolls horizontally to keep them in view. You can go directly to any folderin the hierarchy above the one you’re in simply by clicking its name there.
Microsoft’s Windows Vista operating system has a new look and incorporates lots of addedfunctionality over its predecessor. Increased security system that makes your data more secure is

one of its key features. However, running Windows Vista on a machine requires very highsystems specifications.
15.17 WINDOWS 7
Windows 7 makes the most of powerful 64-bit PCs, the new desktop standard. It includes severalfeature advancements in touch, speech, handwriting recognition, support for virtual hard disk,and support for additional file formats, improved performance on multicore processors,improved boot performance, and kernel improvements. It includes performance improvementslike sleep and resume quickly, and spot USB devices faster. It retains Windows Aero userinterface and visual style introduced with Windows Vista.
Figure 15.31 Desktop in Windows 7
Here, we highlight some of the key features of Windows 7—
Desktop (Figure 15.31) allows you to have new themes, slide shows, or gadgets on the desktop.o A desktop Slideshow changes the desktop background in a designated amount of time
with a smooth fading transition.o Themes include desktop slideshow settings. A new control panel interface, accessible
through Personalize context menu item on the desktop provides the ability to customizeand switch between themes.
o The sidebar of Windows Vista has been removed, but Gadgets can be placed ondesktop. The Windows Media Center has been added to Windows 7, which addsplayback of media in MP4, MOV, and many more multimedia containers with nativecodecs for H.264, MPEG4-SP etc.
Windows Explorero Libraries—Windows Explorer (Figure 15.32) in Windows 7 supports Libraries, virtual
folders that aggregates content from various locations—including shared folders onnetworked systems if the shared folder has been indexed by the host system—and
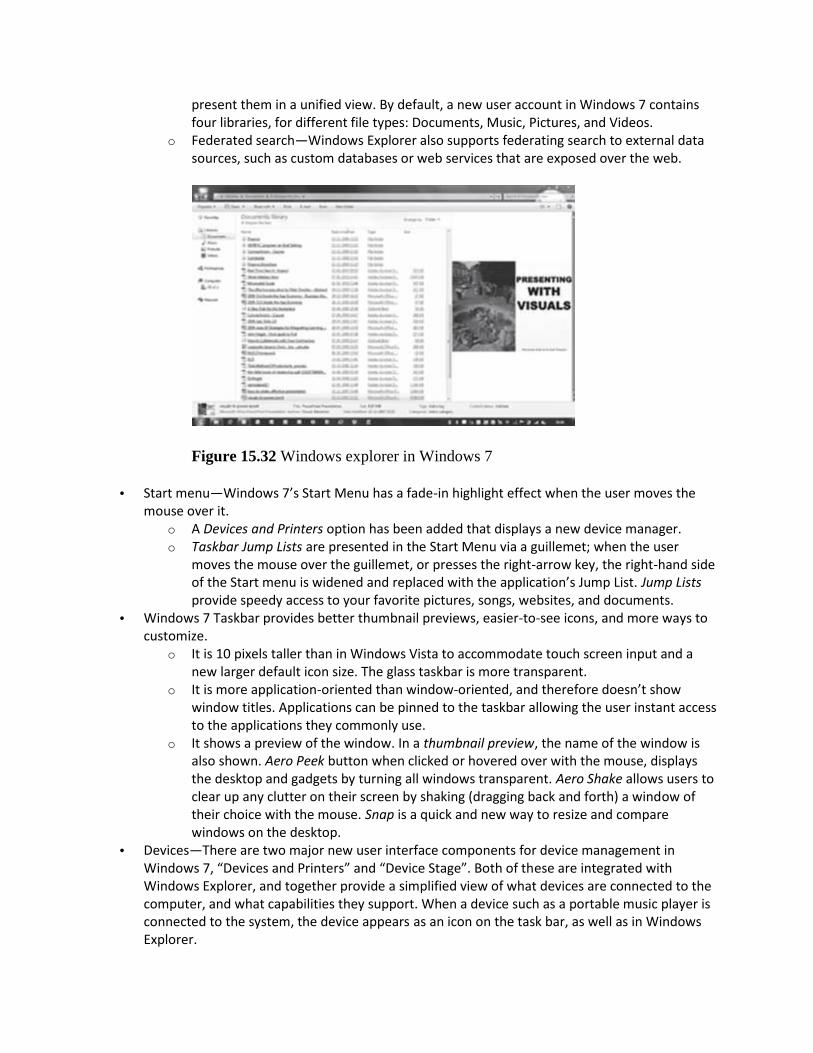
present them in a unified view. By default, a new user account in Windows 7 containsfour libraries, for different file types: Documents, Music, Pictures, and Videos.
o Federated search—Windows Explorer also supports federating search to external datasources, such as custom databases or web services that are exposed over the web.
Figure 15.32 Windows explorer in Windows 7
Start menu—Windows 7’s Start Menu has a fade-in highlight effect when the user moves themouse over it.
o A Devices and Printers option has been added that displays a new device manager.o Taskbar Jump Lists are presented in the Start Menu via a guillemet; when the user
moves the mouse over the guillemet, or presses the right-arrow key, the right-hand sideof the Start menu is widened and replaced with the application’s Jump List. Jump Listsprovide speedy access to your favorite pictures, songs, websites, and documents.
Windows 7 Taskbar provides better thumbnail previews, easier-to-see icons, and more ways tocustomize.
o It is 10 pixels taller than in Windows Vista to accommodate touch screen input and anew larger default icon size. The glass taskbar is more transparent.
o It is more application-oriented than window-oriented, and therefore doesn’t showwindow titles. Applications can be pinned to the taskbar allowing the user instant accessto the applications they commonly use.
o It shows a preview of the window. In a thumbnail preview, the name of the window isalso shown. Aero Peek button when clicked or hovered over with the mouse, displaysthe desktop and gadgets by turning all windows transparent. Aero Shake allows users toclear up any clutter on their screen by shaking (dragging back and forth) a window oftheir choice with the mouse. Snap is a quick and new way to resize and comparewindows on the desktop.
Devices—There are two major new user interface components for device management inWindows 7, “Devices and Printers” and “Device Stage”. Both of these are integrated withWindows Explorer, and together provide a simplified view of what devices are connected to thecomputer, and what capabilities they support. When a device such as a portable music player isconnected to the system, the device appears as an icon on the task bar, as well as in WindowsExplorer.

The improvements and additions made to Windows 7 Core Operating System componentsinclude AVCHD camera support and Universal Video Class 1.1, fewer hardware locks and greaterparallelism.
The Enterprise, Ultimate, and Professional editions of Windows 7 incorporate support for theVirtual Hard Disk (VHD) file format. VHD files can be mounted as drives, created, and bootedfrom.
The Windows Security Center has been renamed to Windows Action Center which encompassesboth security and maintenance of the computer.
Windows 7 includes new Windows Biometric Framework which consists of a set of componentsthat standardizes the use of fingerprint biometric devices. A new Biometric Device Control Panelis included which provides an interface for deleting stored biometrics information,troubleshooting, and enabling or disabling the types of logins that are allowed using biometrics.
Windows 7 adds support for Multiple Firewall profiles. When your computer is connected totwo or more networks at the same time Windows 7 applies a separate firewall profile to eachnetwork connection.
Figure 15.33 Control panel in Windows 7
WordPad in Windows 7o Windows 7’s start-up screen consists of an animation featuring four colored light balls
(red, yellow, green, and blue).o Calculator has been rewritten, with multiline capabilities including Programmer and
Statistics modes along with unit conversion and date calculation.o Many new items have been added to Control Panel (Figure 15.33) including: ClearType
Text Tuner, Desktop Gadgets, Recovery, Troubleshooting, Location and Other Sensors,Credential Manager, Biometric Devices, System Icons, Action Center, and Display.
o Paint and WordPad both have the new ribbon user interface.o Resource Monitor includes numerous new features, including an improved RAM usage
display, display of TCP/IP ports being listened to, filtering processes using networking,filtering processes with disk activity etc.
o For developers, Windows 7 includes a new networking API with support for buildingSOAP based web services in native code.
o Windows 7 includes power-saving features, such as adaptive display brightness, whichdims a laptop’s display when the laptop has not been used for a while.

o The windows borders and taskbar remain translucent when a window is maximized withWindows Aero applied.
HomeGroup allows easy sharing of files and printers on a home network. Windows Live Essentials has programs like Mail, Movie Maker, Photo Gallery, and more. Windows Search allows you to search for virtually anything on your PC, instantly. It works like
search folders i.e. allow pivoting views, and allow you to show content from various locations inone spot.
Windows 7 supports remote media streaming which allows you to enjoy music and video onyour home PC—even when you’re not at home.
It allows you to pair Windows 7 with a touchscreen, replacing a keyboard or mouse. Windows Complete PC Backup allows users to completely restore their PC environment
including the operating system, installed programs, user settings, and data files.
QUESTIONS
1. What is the benefit of Windows XP over its predecessors?2. List any five new features of Windows XP.3. What is Windows Desktop?4. Discuss about the different parts of Windows desktop screen.5. Name the different parts of the Task Bar.6. In which area does the date and time appear on the Windows screen.7. List the different ways in which you can organize icons on desktop (Arrange icons by).8. Describe the structure of Window in Windows XP.9. Write steps to do the following —(1) Organizing icons on Desktop, (2) Create Shortcuts, and (3)
Change Date and Time.10. What is the purpose of the title bar, menu bar, tool bar, scroll bar and status bar in a Window of
Windows XP.11. What is the purpose of Windows XP Explorer?12. List the different views in which you can see the folder information.13. Explain in one or two lines, how the folder information is viewed in (1) Filmstrip, (2) Thumbnails,
(3) Tiles, (4) Icons, (5) List, and (6) Details.14. List the different ways of selecting a file or a folder.15. Write steps to do the following—(1) Create a Folder, (2) Delete a File, (3) Copy a File, (4) Move a
File, and (5) Change the name of a File.16. What information is provided by the <Properties> of the folder.17. Write steps to do the following—(1) Show Hidden Files and Folders, (2) Know the Types of Files,
and (3) Organize Folders.18. What is the purpose of Recycle Bin?19. List the steps to restore a file from Recycle Bin.20. List the steps to configure Desktop, Screen saver, and Screen appearance.21. What is the purpose of Windows Register?22. List the steps to add a non-plug & play hardware.23. Name any three System tools.
Exercises
Instructions: For all the questions take the screen snapshots before you perform the exercise,and, after you perform the exercise.

To take a snapshot of the screen, do the following:
Step 1. <shift key> <function key (fn)> <print screen key (prt sc)>
Step 2. Open a new word document and <Paste> on it.
1. Create shortcuts for any two programs.2. Change the date and time of your computer.3. View the folder in Thumbnail format.4. Create a new folder ‘F’. Copy folder ‘F’ to a new directory. Move the folder from this new
directory to another directory, and name it ‘H’. Delete the original folder ‘F’.5. Search the location where a folder “X” is in your computer.6. Empty the Recycle Bin.7. Restore the deleted files in Recycle Bin.8. Configure your screen. (Change its Appearance, Theme, Screen saver etc.)9. Change the icon of your mouse, when it comes on a tooltip.10. Use the Disk Defragmenter.11. Use Disk Clean up.12. Use the Character Map.13. Find the system information.14. Create a new System Restore point.15. Schedule the disk cleanup task to run now, tomorrow, and day after at the same time.16. While doing any of the above, enjoy the music. Play a song from the playlist using Windows
Media Player.
16
MS-WORD 2007
Contents
Introduction Starting MS-Word MS-Word screen and its components—Office logo button, quick access toolbar, ribbon, tabs,
groups, icons, ruler bar, status bar, scroll bar, work area Office button—New, open, save, save as, print, prepare, send, publish, close Ribbon—Home, insert, page layout, references, mailings, review, view, add-ins
o Home tab—Clipboard, font, paragraph, styles and editingo Insert tab—Pages, tables, illustrations, links, header & footer, text, symbolso Page layout tab—Themes, page setup, page background, paragraph, arrangeo References tab—Table of contents, footnotes, citation and bibliography, captions, index,
table of authoritieso Mailings tab—Create, start mail merge, write and insert fields, preview results, finisho Review tab—Proofing, comments, tracking, changes, compare, protect

o The view tab—Document views, show/ hide, zoom, window, macroso The help
Solved examples—Magazine cover, resume, article with three columns, mail-merge, macro,project report
Why this chapter
One of the applications for which the computer is quite often used is to create documents, like,an article, letter, brochure, web page, newsletter, project report and thesis. The documents mayinclude images, graphics, sound elements and animation, in addition to the text. You use wordprocessing software for creating the different kind of documents. MS-Word is commonly usedword processing software. The purpose of this chapter is to introduce you to MS-Word.
16.1 INTRODUCTION
Word processing software is used for the creation of text-based documents. The word processingsoftware provides tools for composing, editing, formatting, and printing of documents. Inaddition to text, documents can also contain images, pictures, graphics elements, sound clips andanimations. The document can be a poster, report, letter, brochure, web page, newsletter, or, longdocument consisting of an index and links to various chapters.
There are many software packages available, to do the job of word processing. Some of the wordprocessing software that works in DOS environment are WordStar, Easy Word, and WordPerfect. Examples of some more word processing software are-AppleWorks Word Processing forWindows and Mac, Applix Word for Linux, Microsoft Write for Mac, Notepad for Windows,and Star Office Writer. Some examples of online word processors are Google Docs, PDSText (afree online Unicode text editor for Indian Languages), Sun OpenOffice, and ZohoWriter.
MS-Word is a word processing software used in the Windows environment. It is one of the mostpopular word-processing software these days. MS-Word is a part of a bigger software packagecalled MS-Office. In addition to MS-Word, MS-Office includes other software like MS-Excel(for spreadsheet), MS-PowerPoint (for presentations), and MS-Access (for databasemanagement).
MS-Word is a Graphical User Interface (GUI) based software, which makes it easy to use andunderstand. It has a wide range of tools and commands that are used for formatting thedocuments. Some of the important features of MS-Word are as follows:
A document can be created and later edited, whenever required. Editing includes addition oftext, modifying the existing text, or deleting a part of text. Editing can be done on a word,sentence, paragraph, page, or the complete document.
The complete document or a part of the document can be reformatted. Some of the options available for the formatting of a document are—changing the font size,
font color and font style, addition of page numbers, page header and footer, and headings. Various tools like spell check for checking spellings, mail merge for generating multiple copies of
letters with different addresses, macros, and track changes for making corrections are available. MS-Word allows tables to be created and included in the text.

Graphical pictures can be included in a document using pictures from the Clip Art and thepictures imported from other files.
This chapter discusses the usage of MS-Word software in detail. There are many versions of theMS-Word software. Here, we will discuss MS-Word 2007.
In this chapter, the following terminologies are used, while working with the mouse:
Pointer—a mouse pointer Click—press left button of mouse once Double-Click—press left button of mouse twice Select—move the pointer of mouse and keep the left button of the mouse pressed over the
area that you want to select. The selected area will appear in a dark background. Quick Menu—Right click (press right button of mouse once) to get a quick menu
We enclose the command in braces <Command> to represent the command to be clicked.
16.2 STARTING MS-WORD
As already stated, MS-Word software is installed on the Windows operating system. MS-Wordis menu-driven, GUI-based software. While working with MS-Word, using a mouse makesworking on the MS-Word simpler although you can work to some extent using the keyboardalso.
To start using the MS-Word software, any one of the following steps needs to be performed—
If a shortcut key to MS-Word is available as an icon (a small picture that represents an object orprogram) on the Desktop, as shown in Figure 16.1, then double-click the icon, OR,
Figure 6.1 MS-WORD 2007 icon
<Start> <Programs> <Microsoft Office> <Microsoft Office Word 2007>. (Figure 16.2)

Figure 16.2 Start MS-Word 2007
16.3 MS-WORD SCREEN AND ITS COMPONENTS
The user interface of MS-Word 2007 is quite different from the previous versions of MS-Word.It has an improved navigation system which is easier to use. The main screen, as shown in Figure16.3, consists of different components like the Ribbon, Ruler bar, Status bar, Scroll bar, andWork Area. The orientation of the Word 2007 layout and its general features are described asfollows:

The Office Logo Button at the top left corner contains many task buttons for the documentsuch as, New, Open, Save, Save As, Print, and Close. This button also has a list of the recentdocuments. Some of these commands include an expandable menu to provide additionaloptions. (The Office Button replaces the File menu in earlier versions of Word).
The Quick Access Toolbar to the right of the Office Logo button. It
contains shortcuts for the commonly used tools, like, Save , Undo (reverses the last
change), and Repeat (repeats the last action). The buttons that you wish to be displayed can
be selected from the Customize Quick Access Toolbar.
Figure 16.3 MS-Word 2007 screen
The Ribbon is a set of tools and commands across the top of the screen (Figure 16.4). It consistsof a panel of commands which are organized into a set of tabs (also known as the Tab Bar).Within Tabs, Groups are available, which are designated by the names located on the bottom ofthe Ribbon. Each group has icons for the associated command. The Ribbon (Tabs, Groups, andIcons) replaces traditional toolbars and menus of earlier versions of the MS-Word.
The Tabs (Home, Insert, Page Layout, etc.) on the Ribbon contain the buttons needed to editcharacters, text, and layout, as well as the additional tools that you may need.
Each Tab consists of different Groups, like the Home tab has five groups namely, Clipboard,Font, Paragraph, Styles and Editing.

Figure 16.4 The ribbon
Each group has Icons for the commands, which will actually format the document or bring up amenu. To know the function of an icon button (or command), leave the pointer on a button for afew seconds, the function of that button will appear in a small box below the pointer. For
example, leaving the icon on displays “Bold (Ctrl+B)”. Ruler Bar—MS-Word has two rulers—Horizontal and Vertical. The Ruler Bar allows formatting of
horizontal and vertical alignment of text in a document, by adjusting the tabs, indents andmargins.
Status Bar—It displays information about the currently active document. The informationincludes the current page number, total number of pages and the number of words in the
document, zoom slider etc. Right-click on the status bar willshow you the Customize Status Bar (Figure 16.5) pop-up menu. You can select the options youwant to view on the status bar.
Scroll Bar—There are two scroll bars—horizontal and vertical. They help to scroll the content orthe body of document. Scrolling is done by moving the elevator button along the scroll bar, orby clicking on the buttons with the arrow marked on them to move up and down, and left andright of a page.
Work Area—It is the working area in the document window where the text of the document istyped.

Figure 16.5 Customize status bar
16.4 THE OFFICE BUTTON
The Office Button is used to perform file management operations on the file (i.e. the document).It contains commands that allow the user to create a new document, open an existing document,save a document, print a document etc. The Office button contains nine commands, namely,New, Open, Save, Save As, Print, Prepare, Send, Publish, and Close. The Office buttoncommands are shown in Figure 16.6.
Table 16.1 briefly describes the different commands available in the Office Button.
Some of the common operations that are performed using the commands of the Office Button aredescribed as follows:

Figure 16.6 The Office button commands
Office ButtonCommands
Description
New Creates a new blank document, a blog post, class report etc.
Open Opens an already existing document
Save Save a document for which a file name and location has already been specified
Save As Use when you save a document for the first time or, to a different location, or at thesame location with different name or with a new type of document. Here, you specifythe filename for the document, the location where the document is to be stored, andthe save type of the document. You can save the document as a Word document, Word97-2003 document, Word Template etc.

Print Print, Quick Print, or Print Preview the document. You can set properties like printquality, paper type, number of copies, color or grayscale, etc. Preview to see how theprinted document will look after printing.
Prepare Prepare the document for distribution. View document properties, encrypt document,grant permissions etc.
Send Send a copy of the document to e-mail or to Internet Fax
Publish Publish the document as a blog, create a new site for the document etc.
Close Close an open document
Table 16.1 Home tab commands description
Saving a Document for the First Time: < > <Save As>. You can save the document as aWord document, Word 97-2003 document, Word Template etc. (Figure 16.7). On selecting oneof the Save As options, Word will display a dialog box. In the field next to File name, type a namewith which you want to save the document. Navigate in the top portion of the dialog box to thefolder where you want to save the document (choose the right directory where you want to
save the file. You can use to go up in the directory Use to create a new folder). You canalso specify the save type of the document (Figure 16.8). Once you have saved your document
for the first time, you can save further revisions by selecting the < > <Save>, or by clicking
on the Save button in the Quick Access Toolbar.

Figure 16.7 Save as option
Figure 16.8 File save types
Saving a Document Under a Different Name: Open the document by selecting the < >
<Open> Next, < > <Save As> A dialog box will appear. Navigate to the folder where youwant to save the document and type in a new name for the document. Select the Save button.You now have two copies of the document, one with the original name, another with a newname.
Crash Protection: < > <Save As> <Tools><Save Options>. Select the boxes for Save AutoRecover Information every <enter the minutes>. Reset the Minutes from 10 to 1. MS-Wordwould be able to recover a file one minute old.

To Preview your Document before Printing: < > <Print> Select Print Preview. You canswitch between viewing one page and multiple pages, zoom in (it will turn into a magnifyingglass with a + symbol inside) and zoom back out, place your cursor on the document and thistime your cursor will turn into a magnifying glass with a-symbol inside.
To Print: <File> <Print> Make settings like number of copies and pages you want to print.(Figure 16.9). From the Print dialog box you can make further settings like:
o Print What: If the document you want to print has lot of track changes and insertedcomments, you can choose the document to be printed from “Print What” i.e. the finaldraft of the document, the Document Showing Markup that prints the originaldocument with all of the visible edits and comments.
o Zoom: If the document is formatted in a different size than your paper, use Zoom of thePrint dialog box. Use the Scale to Paper Size drop-down menu to select the paper size.Zoom feature is also used to print multiple pages on a single sheet. Use the Pages perSheet drop-down menu to print two, four, six, eight, or even sixteen pages onto onesheet of paper.
16.5 THE RIBBON
The Ribbon of MS-Word has the Office button, and eight tabs, namely, Home, Insert, PageLayout, References, Mailings, Review, View and Add-Ins. Each tab further consists of the groups,and the groups contain icons. Icons are a pictorial representation for a command. Each tab is self-explanatory; for example, if you want to insert any item into the document, click on the Inserttab. The groups and icons related to Insert are displayed. Select the icon for the command whichyou want to use. The different tabs in MS-Word and the groups within them are as follows:
Home: Clipboard, Font, Paragraph, Styles, and Editing Insert: Pages, Tables, Illustrations, Links, Header & Footer, and Text

Figure 16.9 Print dialog box
Page Layout: Themes, Page Setup, Page Background, Paragraph, and Arrange References: Table of Contents, Footnotes, Citations & Bibliography, Captions, Index, and Table
of Authorities Mailings: Create, Start Mail Merge, Write & Insert Fields, Preview Results, and Finish Review: Proofing, Comments, Tracking, Changes, Compare, and Protect View: Document Views, Show/Hide, Zoom, Window, and Macros
The Add-Ins Tab can contain supplemental functionality that adds custom commands andspecialized features to MS-Office products like MS-Word, MS-Excel, MS-PowerPoint.Automation add-ins, application add-ins, smart tags, and COM add-ins are some examples ofadd-ins. MindManager Pro 6, VisionArchive 2.0, and KwikTag 3.4 are some of the Microsoftapproved add-ins for the Microsoft Office.
The commands in the Ribbon have various symbols associated with them, as shown in Figure16.10. These symbols are interpreted as follows:
Simple Command—The command starts executing when it is clicked. Command Followed by Arrow—Clicking on the arrow displays more options for the
command.
Selecting a command
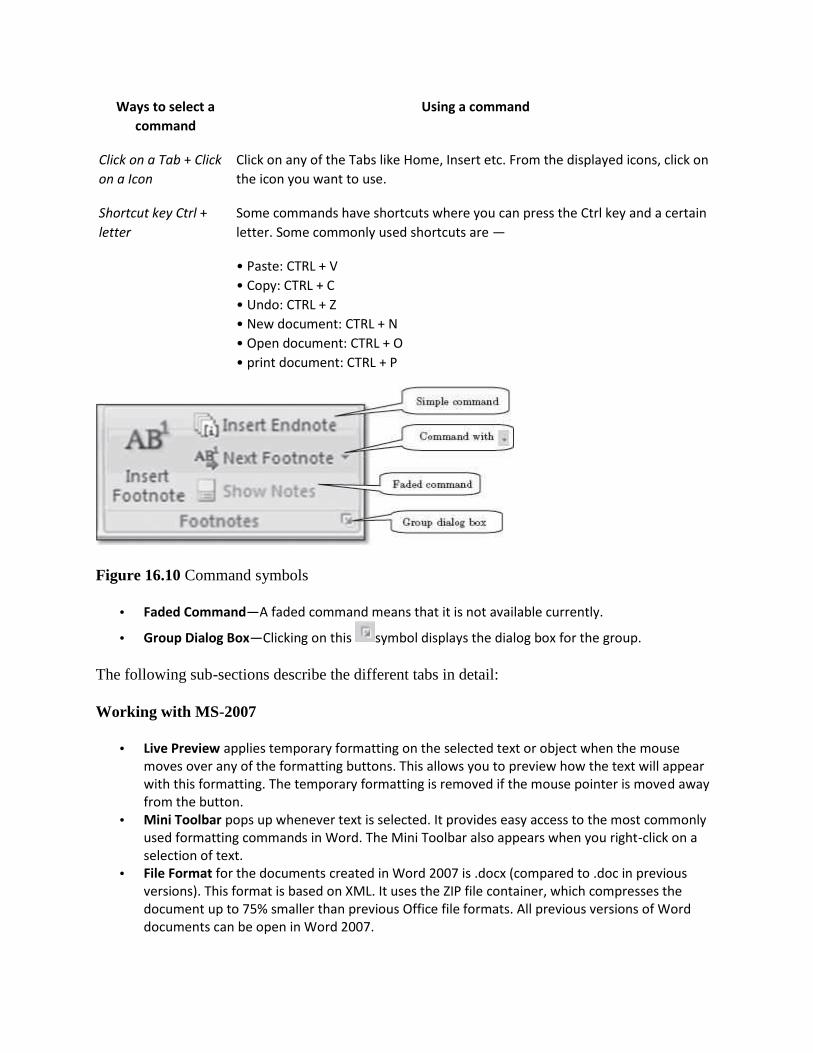
Ways to select acommand
Using a command
Click on a Tab + Clickon a Icon
Click on any of the Tabs like Home, Insert etc. From the displayed icons, click onthe icon you want to use.
Shortcut key Ctrl +letter
Some commands have shortcuts where you can press the Ctrl key and a certainletter. Some commonly used shortcuts are —
• Paste: CTRL + V• Copy: CTRL + C• Undo: CTRL + Z• New document: CTRL + N• Open document: CTRL + O• print document: CTRL + P
Figure 16.10 Command symbols
Faded Command—A faded command means that it is not available currently.
Group Dialog Box—Clicking on this symbol displays the dialog box for the group.
The following sub-sections describe the different tabs in detail:
Working with MS-2007
Live Preview applies temporary formatting on the selected text or object when the mousemoves over any of the formatting buttons. This allows you to preview how the text will appearwith this formatting. The temporary formatting is removed if the mouse pointer is moved awayfrom the button.
Mini Toolbar pops up whenever text is selected. It provides easy access to the most commonlyused formatting commands in Word. The Mini Toolbar also appears when you right-click on aselection of text.
File Format for the documents created in Word 2007 is .docx (compared to .doc in previousversions). This format is based on XML. It uses the ZIP file container, which compresses thedocument up to 75% smaller than previous Office file formats. All previous versions of Worddocuments can be open in Word 2007.

16.5.1 The Home Tab
The Home Tab contains commands for the formatting of text. The Home Tab is also used for theediting of the document like find and replace, and to perform clipboard operations such as cut,copy and paste on the document. Figure 16.11 shows the Home Tab.
Figure 16.11 The home tab
There are five groups within this tab, namely, Clipboard, Font, Paragraph, Styles and Editing.
The Clipboard group contains commands to cut, copy and paste text. The Format Painter is alsopresent here.
Font group commands allow change of the font - font face, style, size, effects (Superscript,Subscript, and Shadow etc.), color and character spacing. You can change these options beforeor after you type your text. If case of after, you need to select the text first.
Paragraph group is used to change paragraph settings — alignment, indents, spacing, andpagination like spacing 1.5 lines, double spacing, indentation, and, spacing before and after aheading. Move your cursor to the line or paragraph you want to change.
The Styles group allows quickly choosing a style and applying the style. Editing group contains commands to select, find and replace text.
Table 16.2 gives the commands in the different groups (in left to right order) of Home Tab alongwith a brief explanation.
To apply formatting to an already written text, first select the text and then apply the formatting
Here, we describe briefly some of the operations that are performed using the commands of theHome Tab.
Move Text: Select and highlight the section you want to move <Home><Clipboard>< < >.
Move the cursor to the place you would like the text to be inserted <Home><Clipboard>< >
Copy Text: Select and highlight the section you want to copy <Home><Clipboard> < > Move
the cursor to the place you want the copied text to be inserted <Home><Clipboard> < > Find and Replace: This is used to find a text, style or paragraph and then replace it with the new
one. This option is useful if you want to find text strings at multiple places in the document, andreplace all of them with the new one.

Home TabGroups
Description
Clipboard
• Paste the cut or copied information in clipboard at the location where cursor is pointingright now (Paste Special — To paste in a particular format. Paste as Hyperlink - Used withcopy to paste the copied information as a hyperlink)• Cut the selected text from the document and put into clipboard for later retrieval.• Copy the selected item or text to the clipboard.• Format painter copies formatting from one place and applies it to another (To applysame formatting to many places, double-click the format painter button)
Font
• Change Font face, change Font size• Grow Font, Shrink Font• Clear Formatting (Clear all formatting from selection, leave only plain text)• Bold, Italics, Underline• Strikethrough (draw a line through middle of selected text), Subscript, Superscript• Change case. You can change the case — sentence, lower, upper, title, or toggle. Selectthe text and click on an option• Text highlight color, Font color
Paragraph
• Bullets (choose from different styles)• Numbered list (choose different formats)• Multilevel list (Choose from different styles)• Increase or decrease indent of the paragraph• Sort alphabetically or numerically• Show paragraph markups• Align text left, right, centre, and justify

• Change spacing between lines• Color background behind selected text• Customize the borders of selected text. Add borders and shading. There are options toselect for setting, style, color, width, fill color, and pattern. You will see a preview at theright. To remove a border or shading, select None.
Styles
• Format titles using different styles like Caption, Emphasis etc.• Change style, color and font used in the document
Editing
• Find text in the document• Replace text in the document (The user can go to a page, section etc. when using findand replace)• Select text or objects in the document
Table 16.2 Home tab commands description
To Select Multiple Text Entries that are scattered words, phrases, or paragraphs for the sameaction, select the first item with your mouse as you normally would. For subsequent items, pressthe CTRL key before you select them. Now you can perform any operation like italicize, boldface,or highlight on all the selected items.
16.5.2 The Insert Tab
The Insert Tab contains commands for inserting objects of many kinds in a document. Thecommands in this tab are used to add pages, tables, and images. It also includes commands tobuild an equation in the document, add symbols, special text, links, and, headers and footers.Figure 16.12 shows the Insert Tab.
Figure 16.12 The insert tab

There are seven groups within this tab, namely, Pages, Tables, Illustrations, Links, Header andFooter, and, Text and Symbols.
The Pages group contains commands to insert a cover page, blank page or a page break. Tables are used to draw and insert tables. Illustrations group allows insertion of pictures, clip art, shapes, smart art, and charts. The Links group is used to insert a hyperlink, bookmark, and cross reference. The Header and Footer group allows insertion of a header, footer, and page numbers. The Text group contains commands to insert a text box, word Art, date, and time. The Symbols group is used to insert symbols, and build mathematical equations.
Some of the Tabs appear only when you use them; like Picture Tools tab, Drawing Tools Tab,Table Tab and Chart Tools Tab
Table 16.3 gives the commands in the different groups of the Insert Tab along with a briefexplanation.
The Insert tab is used to insert a page break, a diagram etc. When a command of the Insert tab isused, insertion takes place at the location where the cursor is present right now. So, beforeinserting the item, place the cursor at the location where the item is to be inserted. When you usethe commands of the insert tab for insertion, you will see that most of the times, a dialog box willopen which allows you to make specific settings, as per your requirement. Here, we will notdiscuss using the dialog boxes as they are self-explanatory, and are easy to use. Some of theoperations using the Insert Tab commands are described below—
To Create Headers and Footers—<Insert> <Header & Footer>. You will see a Header and Footercommand. A Header and Footer tab is opened which allows creation of a Header and Footer,enter text or graphics into the Header or Footer area, insert page numbers, time or date, filename, author name, etc.
Insert TabGroups
Description
Pages
• Insert a fully formatted cover page are available).• Insert a blank page at the current cursor position

• Insert a page break. Start the content located at the current cursor position onthe next page.
Tables
• Insert or draw table in the document (convert text to table, insert an Excelspreadsheet, insert from one of the built-in tables). When a table is drawn, aTable Tool Design Tab (Figure 16.13) and Table Tools Layout Tab opens, whichallows you to select Table Style options, Table Styles, and Table Borders.
Illustrations
• Insert picture from a file. When a picture is inserted, a Picture Tool Format Tabopens (Figure 16.14) which contains commands to format the picture.• Insert clip art into the document (sounds, movies, and drawings) readymadeshapes (lines, arrows, flowchart symbols etc.)• Insert a smart art graphics• Insert a chart (bar graph, pie chart, line area, surface etc.)
Links
• Insert a hyperlink. Hyperlink to an existing file or web page, any place in thesame document, to a new document, or to an email address. Target framespecifies the frame in which you want the hyper linked document to appear. Tohyperlink to the same document, first create a bookmark at the location whereyou want to hyperlink, and select the bookmark to create hyperlink. A hyperlink isdisplayed in a blue color.• Insert a bookmark. Identifies a location or selection of text that you name andidentify for future reference. For example, you might use a bookmark to identifytext where you want a hyperlink to reach.• Insert cross reference

Header andFooter
• To edit the contents of the header. The header will appear at the top of eachpage. You can choose the format of the header from the built-in ones.• To edit the contents of the footer. The contents of footer will appear at thebottom of each page. You can choose the format of the footer from the built-inones.• Insert page number into the document at the top, bottom, or at the marginsetc. You can select the position, alignment and format of the page numbers.
Text
• Insert pre-formatted built-in text box or draw a text box is inserted, a Text BoxTools Format Tab contains commands to format the text box.• Insert useful parts of content like fields• Insert a signature line that specifies the person’s name who will sign it• Insert decorative text in the document, and, date and time into the document• A Drop Cap is an oversized capital at the beginning of a document or section. Tomake the first letter of a document large, select the letter and then use Drop Cap.• Insert an embedded object
Symbols
• Insert common mathematical equations or build your own equations (a newtoolbar appears to insert an equation)• Insert symbols
Table 16.3 Insert tab commands description
Figure 16.13 Table tools design tab

Figure 16.14 Picture tools format tab
Figure 16.15 Text box tools format tab
Insert Bookmarks—Position your cursor where you want to insert the bookmark in thedocument. <Insert> <Links> <Bookmark>. In the dialog box, give the bookmark a name,descriptive of the text or location. Click Add. To return to a bookmark, open the Bookmarkdialog box, select one from the list, and click Go To.
Insert Hyperlink—<Insert> <Links> <Hyperlink>. To link to another location in the samedocument, click Place in This Document option under Link to; In the dialog box’s inner window,select a heading or existing bookmark from the document diagram. To link to anotherdocument, click the Existing File or Web Page option. Navigate to the proper folder and selectthe file’s name.
To Insert Page Numbers—<Insert> <Header & Footer><Page Number>. For more page numberoptions, click on the Format button. To suppress page number on first page, uncheck the ShowNumber on First Page checkbox.
Insert File—Insert the contents of file B into file A. Open file A and place your cursor at thelocation where you want to insert the contents of file B. Select <Insert> <Text> <Object> anduse the dialog box to navigate to file B. Select it, and click on Insert button. The contents of file Bwill be included in file A at the position of the cursor in file A.
To see a command in action; let’s say you want to insert a picture in your document,
<Insert> <Picture> Choose between stock pictures or navigate to your own folder of images.
Click Insert, the selected image appears in your document
16.5.3 The Page Layout Tab
The Page Layout Tab contains commands to apply themes, change page layout, adjust linespacing, and also to adjust background by creating borders or changing page color. The PageLayout Tab is shown in Figure 16.16.

Figure 16.16 The page layout tab
There are five groups within this tab, namely, Themes, Page Setup, Page Background,Paragraph, and Arrange.
The Themes group contains commands to change the overall design of the document includingfonts and colors.
Page Setup is used to set the margins, breaks, number of columns in a page, line numbers etc. Page Background group allows choosing a page background color, and page borders. The Paragraph group is used to make settings for the paragraph like indentation, and line
spacing. The Arrange group is used to arrange the wrapping of text around the selected object, to
position text in context of the selected object, and much more.
Table 16.4 gives the commands in the different groups of Page Layout Tab along with a briefexplanation.
Page LayoutTab Group
Description
Themes
• Themes are used to change the overall design of the document including theme font,theme color, and theme effect.
Page Setup
• Select margin for the whole document orthe current select• Select orientation between• Select a paper size like A3, A4, letter etc.• Add line numbers on the margin alongside each line• Split text into two, three, left or right columns. You can specify the number of

columns, column width and spacing, equal column width, line between columns, andapply to whole document or this point forward.• Turn on hyphenation, which allows the word to break line between the word syllables
PageBackground
• Insert watermark behind the page like Confidential, original etc.• Choose a color for the background of the page. You can choose from fill effects likegradient, texture, pattern, and picture• Add or change the border around the page
Paragraph
• Move in the left side or right side of the paragraph• Change spacing between paragraphs by inserting space above and below the selectedparagraph
Arrange
• Position the selected object on the page. The user can select from different positions.• Bring the selected object in front of all other objects, or at the back of all otherobjects.• Change the way the text wraps around the object• Align the edges of multiple selected objects• Group objects together so that they can be treated like a single group• Rotate or flip the selected object horizontally, vertically, by 90° etc.
Table 16.4 Page layout commands description
Some of the operations that are performed using the commands of the Page Layout tab arebriefly described here.
To Change Page Margins: For left or right page margins, point to a margin boundary on thehorizontal ruler until it changes to a double arrow, and drag the margin boundary to the right or

left. For top or bottom page margins, point to a margin boundary on the vertical ruler until itchanges to a double arrow, and drag the margin boundary to the top or bottom.
To Specify Exact Page Margins: <Page Layout> <Page Setup><Margins>. You can change eithertop, bottom, left, or right margins by clicking in the appropriate text boxes or on the arrows nextto the numbers in Custom margins.
16.5.4 The References Tab
The References Tab contains commands for adding references of all kinds to a document. Thecommands in this tab are used to add Table of Contents, Bibliography, Index etc. The ReferencesTab is shown in Figure 16.17.
Figure 16.17 The References tab
There are six groups within this tab, namely, Table of Contents, Footnotes, Citation &Bibliography, Captions, Index, and Table of Authorities.
The Table of Contents group contains commands to create and update table of contents, andadd text to it.
Footnotes are used to insert or navigate footnotes and endnotes. Citations & Bibliography group allows insertion of citations and bibliography. The Captions group is used to insert captions in a Figure or Table, and to refer to them. The Index group is used to insert or update an index. An index is a list of keywords that are
present in the document and also the page numbers on which they appear. The Table of Authorities group contains command to insert a table of authorities. A Table of
Authorities lists the cases, statues, and other authorities cited in the document.
Table 16.5 gives the commands in the different groups of the References Tab along with a briefexplanation.
16.5.5 The Mailings Tab
The Mailings Tab contains commands that are required to create envelopes and labels, do a mailmerge or formatting of business letters. The Mailings Tab is shown in Figure 16.18.
References TabGroup
Description

Table of Contents
• Add a Table of Content to the document. The user can select from the built-instyles• Add the current paragraph as an entry in the Table• Update the Table of Contents so that the entry refers to the correct pagenumber
Footnotes
• Add footnotes to the document• Add an endnote to the document. Endnotes are inserted at the end of thewhole document.• Next Footnote is used to navigate between the footnotes• Scroll the document to show where the footnotes and endnotes are located
Citations &Bibliography
• Insert citation for a book, periodical journal• Manage sources — to list all the citations cited in the document• Select the style of citation to use in the document• Add a bibliography which lists all the sources cited in the document
Captions
• Add a caption to a picture or an image. It inserts the caption below the image• Insert Table of Figures into the document• Update the Table of Figures• I nsert a cross-reference to a heading, figure or table

Index
• Mark Entry includes the selected text in the index of document• Insert an index into the document and the page numbers on which they appear• Update the index
Table of Authorities
• Add the selected text as an entry in the Table of Authorities• 1 nsert a Table of Authorities into the document• Update the Table of Authorities
Table 16.5 References tab commands description
Figure 16.18 The mailings tab
There are five groups within this tab, namely Create, Start Mail Merge, Write & Insert Fields,Preview Results, and Finish.
The Create group has commands to create envelopes and labels. The Start Mail Merge group contains commands to start the mail merge and select or edit the
recipient list. Write & Insert Fields is used to write and insert the fields that are to be merged. Preview Result group shows how the merged documents will look like. The Finish group is used when you are satisfied with the preview and want to complete the mail
merge.
The commands in the different groups of Mailings Tab along with a brief explanation are shownin Table 16.6.
Some of the operations using the Mailings Tab commands are described below:

Mailings Tab Group Description
Create
• Create and print envelopes• Create and print labels
Start Mail Merge
• Start a mail merge to create a letter that you want to send to different recipients• Select the recipients of your letter• Make changes to the list of recipients
Write &Insert Fields
• Highlight the fields you have inserted into the document• Add an address to the letter• Add a greeting line to your letter (Dear Sir)• Add fields from the recipient list of your document (name, address etc.)• Specify rules to make decision-making ability in mail merge• Tells the meaning of different fields in the recipient list• Update information in the labels from the recipient list
Preview Results
• To preview the merged data from the recipient field• To preview a specific record in the recipient list

• Find by searching the text, and preview the specific record in the recipient list• Specify handling of errors when doing mail merge
Finish
• Finish and complete the mail merge
Table 16.6 Mailings tab commands description
Make Envelopes: If you’ve included the recipient’s address at the top of a letter, you canprepare an envelope directly from the letter. <Mailings> <Create> <Envelopes>. MS-Wordwould have recognized the address and included it. If needed, input your Return Address. ClickAdd to Document, and the envelope will print as the first page of your letter.
Make Labels. <Mailings> <Create> <Labels>. Type the text in this dialog box. Click Options to setthe manufacturer and product code number of the label sheets you’ll be printing on; this willformat your Word document with the sheet’s dimensions and layout. You can print a full page,or a single label, by targeting a row and column position on the sheet.
16.5.6 The Review Tab
The Review Tab contains commands for reviewing the document. The commands in this tab areused when there is a need to correct the contents of the document like tracking changes, checkingspellings and grammar etc. The Review Tab is shown in Figure 16.19.
Figure 16.19 The Review tab
There are six groups within this tab, namely Proofing, Comments, Tracking, Changes, Compare,and Protect.
The Proofing group has commands required for the proofing of document like the spelling andgrammar checker, research etc.
The Comments group contains commands to insert comments, and move back and forth amongthe comments.
Tracking is used to track the changes made to the document. It contains commands to turn onthe track changes, and to make settings for viewing the changes.
Changes group contains commands to view the changes and accept or reject the changes. The Compare group is used to compare or combine different versions of the document.

The Protect group contains command to protect the document by restricting its access.
The commands in the different groups of the Review Tab along with a brief explanation areshown in Table 16.7.
Review TabGroup
Description
Proofing
• Check the spelling and grammar of text in the document• Open Research Task Pane and search through research material• Thesaurus suggests word similar in meaning to the selected word• Translate the selected text into a different language• Enable screen tip that translates the word you pause at, into another language• Set the language used to check the spelling and grammar of the selected text• Find the number of words, characters, paragraphs and lines in your document
Comments
• Add a comment about the selection• Delete the selected comment• Navigate to the previous or the next comment
Tracking
• Track all changes made to the document — insertion, deletion, and updates• Choose how to show the revision of the document• Choose how to show the proposed changes to the document• Choose the kind of markup to show in the document• Show revisions in a separate window

Changes
• Accept or reject the current change and move to the next proposed change• Navigate to the previous and next revision in the document so that you can accept orreject it
Compare
• Compare or combine multiple versions of the document• Choose which source documents to show — the original document, the reviseddocument or both
Protect
• Restrict how people can access the document. You can restrict the formatting stylesallowed, permit only comments to be added by others, or give permissions to differentpeople to edit in specified sections.
Table 16.7 Review tab commands description
16.5.7 The View Tab
The View tab has commands that facilitate in viewing of document. The View Tab is shown inFigure 16.20.
Figure 16.20 The View tab
There are five groups within this tab, namely Document Views, Show/Hide, Zoom, Window andMacros.

The DocumentViews group has commands to view the document in different modes like theprint layout, full screen reading etc.
The Show/Hide group contains commands to show or hide the ruler, gridlines etc. Zoom is used to view the document in smaller or larger sizes. You can zoom with two pages on a
single screen, increase the view to 200%, and so on. Window group contains commands to view the windows like, splitting the window, arranging all
open windows etc. The Macros group is used to create or view a macro.
The commands in the different groups of View Tab along with a brief explanation are shown inTable 16.8.
View TabGroup
Description
DocumentViews
• View the document as it will appear on the printed page. It shows the entire page youare working on including margins, header and footer information.• View the document in a full screen reading view. It maximizes the space available forreading and comments• View the document as it would look as a web page• View the document as an outline and show the outlining tools. Outline symbols andindentations show how the document is organized• View the document as a draft to quickly edit the text. Certain elements of the documentlike the header and footer will not be visible in this view.
Show/Hide
• Show or Hide the Ruler, Gridlines and the Message bar• Document map allows you to navigate the structural view of the document. It lists theheadings of the current document.• Opens a Thumbnail pane which allows you to navigate a long document through smallpictures of each page
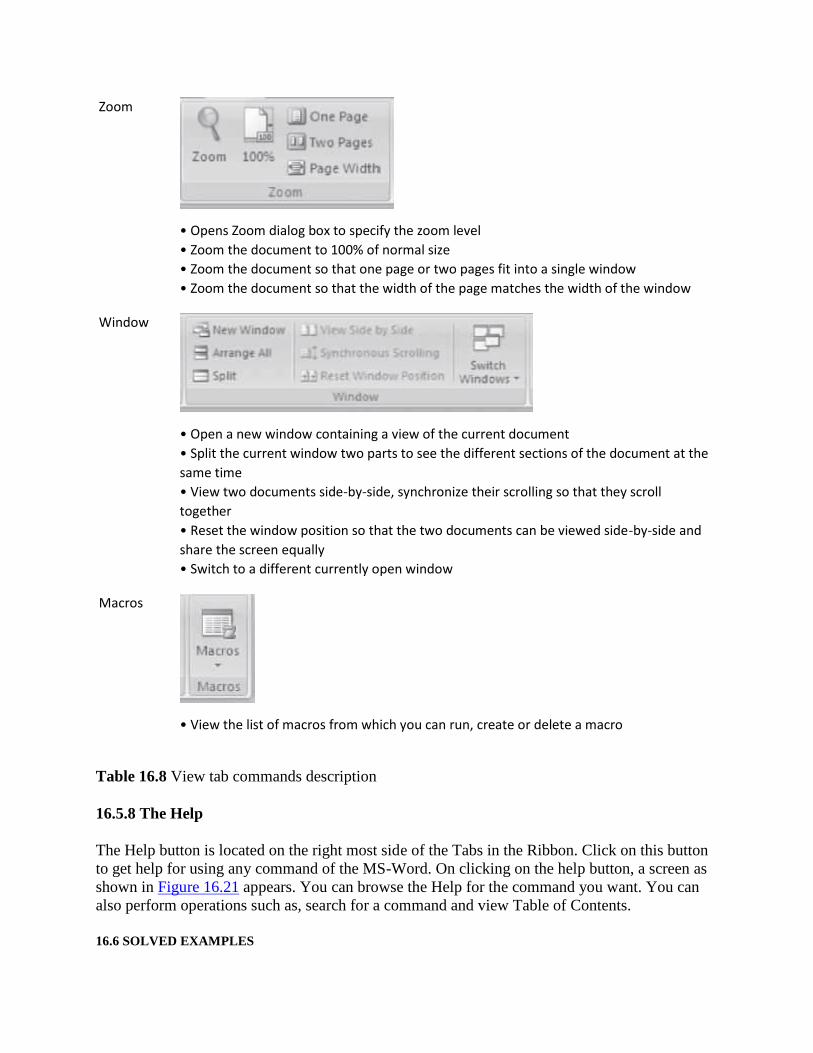
Zoom
• Opens Zoom dialog box to specify the zoom level• Zoom the document to 100% of normal size• Zoom the document so that one page or two pages fit into a single window• Zoom the document so that the width of the page matches the width of the window
Window
• Open a new window containing a view of the current document• Split the current window two parts to see the different sections of the document at thesame time• View two documents side-by-side, synchronize their scrolling so that they scrolltogether• Reset the window position so that the two documents can be viewed side-by-side andshare the screen equally• Switch to a different currently open window
Macros
• View the list of macros from which you can run, create or delete a macro
Table 16.8 View tab commands description
16.5.8 The Help
The Help button is located on the right most side of the Tabs in the Ribbon. Click on this buttonto get help for using any command of the MS-Word. On clicking on the help button, a screen asshown in Figure 16.21 appears. You can browse the Help for the command you want. You canalso perform operations such as, search for a command and view Table of Contents.
16.6 SOLVED EXAMPLES
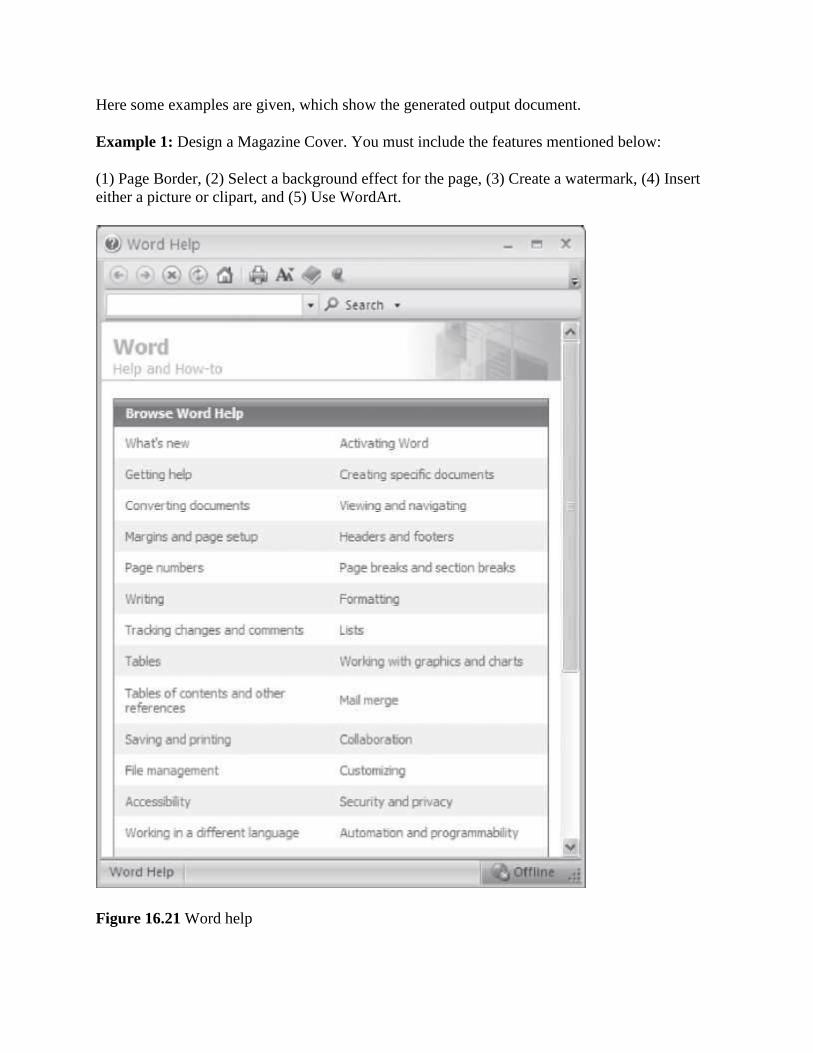
Here some examples are given, which show the generated output document.
Example 1: Design a Magazine Cover. You must include the features mentioned below:
(1) Page Border, (2) Select a background effect for the page, (3) Create a watermark, (4) Inserteither a picture or clipart, and (5) Use WordArt.
Figure 16.21 Word help

Solution 1:
Open blank document. < ><New> Page Border. <Page Layout> <Page Background> <Page Borders> <Art> Background effect. <Page Layout> <Page Background> <Page Color> <Fill Effects> <Texture> Watermark. <Page Layout> <Page Background> <Watermark> Insert Picture. <Insert> <Illustrations> <ClipArt> Use WordArt. <Insert> <Text> <WordArt> You can also use more options like Font Styles etc.
A sample is shown in Figure 16.22.
Example 2: Write your Resume. You must include the features mentioned below—
(1) Tables, (2) Alignment, (3) Bullets, and (4) At least 3 Font Styles and 3 Font Sizes.

Figure 16.22 A magazine cover
Solution 2:
Open blank document < ><New> To Print Title. Select a Font. <Home> <Font> <Theme Font> (You can select the Font Style, size,
effects etc.).
To align title at the centre. Select the title. <Home> <Paragraph>< >
To insert Bullets. <Home> <Paragraph>< >

To insert Table. <Insert> <Tables>. Select the number of columns and rows for the table. <InsertTable>
A sample is shown in Figure 16.23.
Figure 16.23 A resume
Example 3: Design an article of two pages for a magazine with three columns
Use at least 3 different Font styles, 3 Font sizes, 3 Font colors, 3 Font effects Use Hyperlink, Pictures, WordArt
Solution 3:
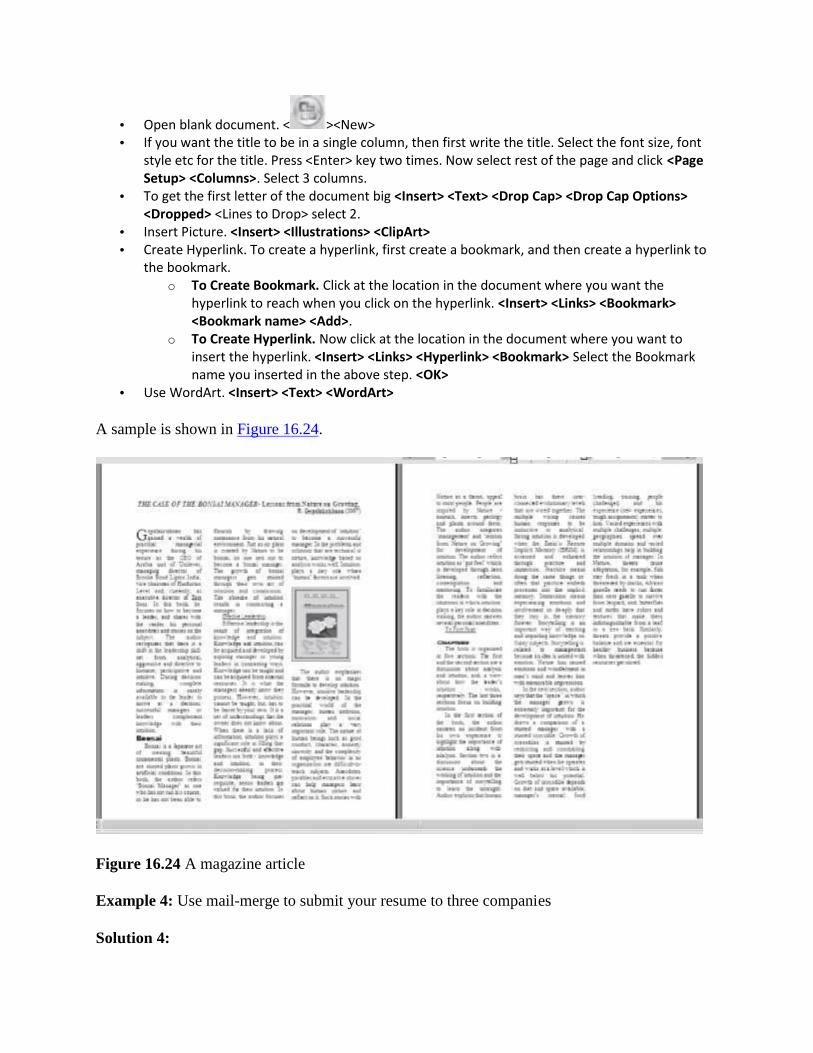
Open blank document. < ><New> If you want the title to be in a single column, then first write the title. Select the font size, font
style etc for the title. Press <Enter> key two times. Now select rest of the page and click <PageSetup> <Columns>. Select 3 columns.
To get the first letter of the document big <Insert> <Text> <Drop Cap> <Drop Cap Options><Dropped> <Lines to Drop> select 2.
Insert Picture. <Insert> <Illustrations> <ClipArt> Create Hyperlink. To create a hyperlink, first create a bookmark, and then create a hyperlink to
the bookmark.o To Create Bookmark. Click at the location in the document where you want the
hyperlink to reach when you click on the hyperlink. <Insert> <Links> <Bookmark><Bookmark name> <Add>.
o To Create Hyperlink. Now click at the location in the document where you want toinsert the hyperlink. <Insert> <Links> <Hyperlink> <Bookmark> Select the Bookmarkname you inserted in the above step. <OK>
Use WordArt. <Insert> <Text> <WordArt>
A sample is shown in Figure 16.24.
Figure 16.24 A magazine article
Example 4: Use mail-merge to submit your resume to three companies
Solution 4:

Open blank document. < ><New> <Mailings> <Start Mail Merge> <Step by Step Mail Merge Wizard>. A window opens on the
right side of the screen. Now follow the six steps given below—o Select Document Type—Select Letters (Figure 16.25)o Starting Document—Select use the current document.o Select Recipients—Select Type a new list. Create. (A window appears as in Figure 16.26.
Enter the data).
Figure 16.25 Starting mail merge

Figure 16.26 Creating new address list
o Write Your letter—Write your letter with address block, greetings etc, as shown inFigure 16.27.
o Preview your letter—Shows the letters merged with the mail addresses, as shown inFigure 16.28.
o Complete the merge.Will complete the merge.
Example 5: Use macro to design letter head of your college
Solution 5:
Open blank document. < ><New>
< ><Word Options> <Popular> Check on the Show Developer tab in the Ribbon. ADeveloper tab is displayed on the Ribbon
Show Developer tab in the Ribbon
Start recording. <Developer> <Record Macro> Enter a name in <Macro Name>. Select thelocation to store in <Store macro in> <OK>. This will start the recording for the macro.
Type the name of the college and insert the logo.

Figure 16.27 A mail letter
Figure 16.28 The merged mail
Stop recording. <Developer> <Stop Recording> To run the macro. <Developer> <Macros>. Select your <Macro name> <Run>
A sample is shown in Figure 16.29.

Figure 16.29 A sample macro
PS: You can also create macros from the View tab <View> <Macro>
Example 6: Use MS-Word to create Project Reports or Thesis
Solution 6: A project Report or thesis has the following specific documentation requirements:
Page settings (Size, No. of columns, Page numbers, header or footer etc.) Different styles for headings and sub-headings Table of Contents Figures and Tables Bibliography

While writing the report, care has to be taken about the following points:
All figure headings are written using the same format. All table headings are written using the same format. The font style of the different headings and sub-headings should be consistent in the entire
document. The table of contents should get updated with the update of the contents of the document References to the bibliography should get updated with the change in the bibliography.
The steps that must be followed while writing a project report or thesis are as follows:
Open a blank document <File> <New> First create a template for the document; i.e. select the bullets and numbering and customize
the various headings in terms of size, color, font style etc., the style to number the figures andtables etc. Then <Save As> <Word Template> to save the template.
Use <References> <Insert Caption> to insert a bibliography. Use <References> <Cross-reference> to refer to the bibliography in the text. Updating the bibliography will automaticallyupdate the cross reference made to the bibliography. Similarly, to refer to a figure or table, usethe cross-reference.
After you have created the template, use the template and type-in your report or thesis.
EXERCISES
1. Design a “Thank You” card.2. Design a “Seasons Greetings” card.3. Design a “Birthday Invitation” card.4. Design a “Get Well Soon” card.5. Design a “Happy Birthday” card.6. Design a poster inviting all students of your college to the Computer Festival.7. Design a notice cum poster inviting all fresher for the fresher’s party.8. Design a notice cum poster inviting seniors for the farewell party.9. Design a certificate that you receive at the end of the Semester for holding a position in the
Computer Society.10. Design your mark sheet.11. Design the Time Table given to you at the start of the Semester without grid lines.12. Prepare the list of practicals you shall do during the semester in an Index form.13. Create a 5-page document. Use hyperlinks. Insert Bookmarks.14. Prepare a notice giving you the schedule of your exams.15. Use mail merge to print envelopes.16. Convert Text to Table.17. Create an organization chart of your Computer Society.18. Create a web page having your own details using MS Word.19. Open two documents in MS-Word and view them together.20. Compare two documents using MS-Word.21. Create thumbnails for your project.22. Write 10 mathematics equations.23. Use the Letter Wizard to write a letter to the principal asking for a two day leave.24. Add addresses for five recipient of your letter in Q 23.

25. Use Macro to design the Computer Society Certificate.26. Create a table to show the rate list of the Mother Diary Fruit and Vegetable Vendor. After you
have created the table use the following — (1) Split the table to show the Vegetables and Fruitsseparately, (2) Split a Cell, and (3) Merge two cells.
27. Sort the Table created in Q 26 in decreasing order of rate list.28. Insert a row in Table of Q 26, to write the Total of the “Rate” column. Find the total of all the
rates.29. Insert a column in the leftmost side of the table in Q 26 to include the S.No.30. While printing the table in Q 26, hide the gridlines.31. Convert the Table into a Text separating the Item name from the rate list by a hyphen “ ‐ ” in Q
26.32. Type name and addresses of 10 students separated by a comma. Now convert this text into a
table. For example,
Ashima, AkashDarshan Society
Anirudh, Supreme Society
Ajay, Ashiana Apartments
Some Extra Questions
1. Enter a list of 5 things you have to do this week. Number the list. Select the list again and turnon the bullet. Change the bullet symbol to any other character. Insert Date and time.
2. Check the spelling and grammar in an existing document. Use the “Replace All” option in Findand Replace to replace each instance of some word.
3. Create and print an envelope that includes your return address. Create a full page of returnlabels for yourself.
4. First type a one page document in double spacing. Apply the following to it:1. Select the text and convert it into two columns. Make second column wider than the
first and add a line between the columns.2. Change the Page Orientation to Landscape.
5. Using Draw Table feature, insert a 7-column, 6-row table to create a calendar for the currentmonth.
1. Enter the names of the days of the week in the first row of the table.2. Centre the day names horizontally and vertically.3. Change the font and font size as desired.4. Insert a row at the top of the table.5. Merge the cells in the row and enter the current month and year using a large font size.6. Shade the row.7. Enter and right-align the dates for the month in the appropriate cells of the table.8. Change the outside border to a more decorative border. Identify two important dates in
the calendar and shade them.6. Create mailing labels to a select group of people from an existing data source file.7. Create a form letter with fields to represent data in an existing data source file. Preview the
merge to see that everything is correct. Merge to a new document. Save the data source file andyour main document but discard the merge document.

The above questions can be made specific by including one or more of the followingoptions:
Font effects (Superscript, Subscript, Shadow etc.) Paragraph effects (Spacing 1.5 lines, Double Spacing, Indentation, Spacing Before and After a
Heading) Enclose the Text in a Border Enclose the Page in a Border Select a Theme for a page Insert Bullets, Numbering, Outline numbering Display a page with two or three columns Add page Background effects (Color, Fill effects, Printed Watermark) Use built-in Styl es and Formatting and show the formatting that has been applied Write the first letter of the document as big First letter. (Hint: Use Drop Cap) Insert Page Break, Date and Time, Symbols like £ Ω ½ © ™ Include Salutation — Dear Madam: a comment Insert a Table of Content, Insert Cross‐Reference (Used for creating referring to a location,
Bibliography) Insert Caption (For Example “Table 1” on top side of a table Insert a Picture from File, ClipArt, and WordArt etc. Insert a diagram, a Text Box, a Bookmark, a comment, a hyperlink, a file Use Spelling and Grammar to check your document for spellings Convert your document into Arabic Find the number of pages, words, characters (with and without spaces), paragraphs and lines in
your document (Hint: Use Word Count) Before typing your document, create a Template for your document headings and then start
typing
Project: Create a document as follows:
Open a New Blank document. Type the text of the document. Save the document in “Original.docx” The title should have the following Style
o Font size—22o Font style—Arial Boldo Alignment—centero Font color—Dark Brown
The text body should have the following Styleo Font size—12o Font style—Times New Romano Alignment—Justifyo Font color—Black
Insert an image from Clip Art. Wrap the text around the clip art as square tight Use bullets in the document with spacing 1.5 lines Set paper as size A4, Portrait. Set paper margin as Top — 1”, Bottom — 1”, Left — 1.5”, Right —
1.05”

Write the title of your document on the header of page. Write the page number and your nameon the footer of page.
Spell check the document. Save the document under a different filename — “revised.docx” Close the document
Exercise: First type the following lines. Then follow the instructions in each line and makechanges to the text accordingly. For example,
Format this line as Bold, Italic, Underline, Times New Roman font face and 14pt font size.
Format this line as Bold, Italic, Underline, Times New Roman font face and 14pt font size.
1. Change the word 3rd so that it looks like 3rd.2. Format this sentence so that the words, and not the spaces between the words, are
underlined.3. Change all of the text in this line to tOGGLE case.4. Change the word C2H2SO4 so that it looks like C2H2SO4.5. Format this sentence to grow the font size and reduce the space between each letter by 1
point.6. Format this line so that it is Bold, font size 28.7. Enter this line of text. This wrd is miss spelt. Use spell check to correct spelling error.8. Format this line to change it to a 24-point font of your choice. Copy this line three times.
Underline two of the copies, using a different underline style for each.
Exercise: Follow the instructions in the following text to format the paragraphs. It alsoshows how the paragraphs will look after the formatting.
This is the start of a new paragraph.
Format this paragraph so that it is centre aligned. Change the line spacing to 1.5. Now add 12points of blank space before the paragraph and 6 points of blank space after this paragraph.Adjust the paragraph so that the right side is indented by 0.3” and the left side is indented by0.6”. The first line should be indented by 0.5”. This is the end of this paragraph.
It looks like the following example.
This is the start of a new paragraph.
Format this paragraph so that it is centre aligned. Change the line

spacing to 1.5. Now add 12 points of blank space before the paragraph and
6 points of blank space after this paragraph. Adjust the paragraph so that the
right side is indented by 0.3” and the left side is indented by 0.6”. The first
line should be indented by 0.5”. This is the end of this paragraph.
It looks like the following example.
17
MS-EXCEL 2007
Contents
Introduction Basics of spreadsheet Start MS-Excel MS-Excel screen and its components— Office logo button, quick access toolbar, ribbon, tabs,
group, status bar, scroll bar, worksheet tab, row, column headings, active cell, formula bar,name box
Office button—New, open, save, save As, print, prepare, send, publish, close Ribbon—Home, insert, page layout, formulas, data, review, view, add-ins
o Home tab—Clipboard, font, alignment, number, styles, cells, editingo Insert tab—Tables, illustrations, charts, links, texto Page layout tab—Themes, page setup, scale to fit, sheet options, arrangeo Formulas tab—Function library, defined names, formula auditing, calculationo Data tab—Get external data, connections, sort and filter, data tools, outlineo The review tab—Proofing, comments, changeso The view tab—Workbook views, show/ hide, zoom, window, macroso The help
Solved examples—Year-wise salesman sales, salary calculation, mark sheet calculation
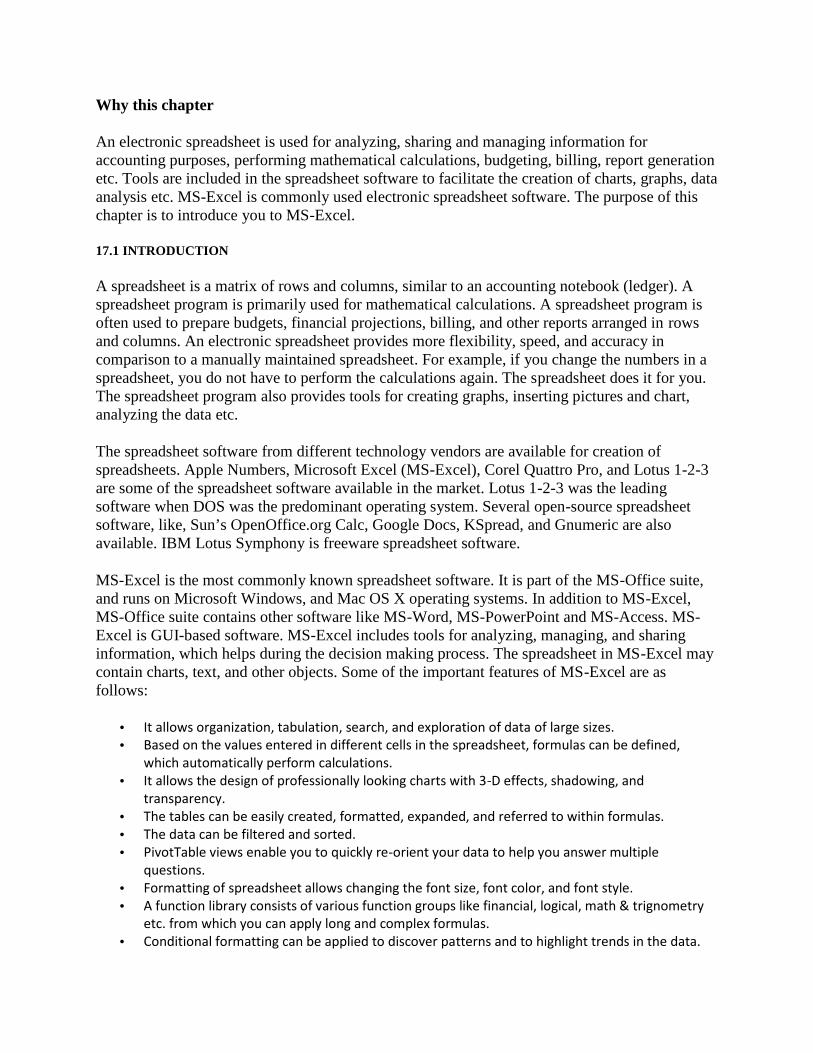
Why this chapter
An electronic spreadsheet is used for analyzing, sharing and managing information foraccounting purposes, performing mathematical calculations, budgeting, billing, report generationetc. Tools are included in the spreadsheet software to facilitate the creation of charts, graphs, dataanalysis etc. MS-Excel is commonly used electronic spreadsheet software. The purpose of thischapter is to introduce you to MS-Excel.
17.1 INTRODUCTION
A spreadsheet is a matrix of rows and columns, similar to an accounting notebook (ledger). Aspreadsheet program is primarily used for mathematical calculations. A spreadsheet program isoften used to prepare budgets, financial projections, billing, and other reports arranged in rowsand columns. An electronic spreadsheet provides more flexibility, speed, and accuracy incomparison to a manually maintained spreadsheet. For example, if you change the numbers in aspreadsheet, you do not have to perform the calculations again. The spreadsheet does it for you.The spreadsheet program also provides tools for creating graphs, inserting pictures and chart,analyzing the data etc.
The spreadsheet software from different technology vendors are available for creation ofspreadsheets. Apple Numbers, Microsoft Excel (MS-Excel), Corel Quattro Pro, and Lotus 1-2-3are some of the spreadsheet software available in the market. Lotus 1-2-3 was the leadingsoftware when DOS was the predominant operating system. Several open-source spreadsheetsoftware, like, Sun’s OpenOffice.org Calc, Google Docs, KSpread, and Gnumeric are alsoavailable. IBM Lotus Symphony is freeware spreadsheet software.
MS-Excel is the most commonly known spreadsheet software. It is part of the MS-Office suite,and runs on Microsoft Windows, and Mac OS X operating systems. In addition to MS-Excel,MS-Office suite contains other software like MS-Word, MS-PowerPoint and MS-Access. MS-Excel is GUI-based software. MS-Excel includes tools for analyzing, managing, and sharinginformation, which helps during the decision making process. The spreadsheet in MS-Excel maycontain charts, text, and other objects. Some of the important features of MS-Excel are asfollows:
It allows organization, tabulation, search, and exploration of data of large sizes. Based on the values entered in different cells in the spreadsheet, formulas can be defined,
which automatically perform calculations. It allows the design of professionally looking charts with 3-D effects, shadowing, and
transparency. The tables can be easily created, formatted, expanded, and referred to within formulas. The data can be filtered and sorted. PivotTable views enable you to quickly re-orient your data to help you answer multiple
questions. Formatting of spreadsheet allows changing the font size, font color, and font style. A function library consists of various function groups like financial, logical, math & trignometry
etc. from which you can apply long and complex formulas. Conditional formatting can be applied to discover patterns and to highlight trends in the data.

This chapter discusses the using of the MS-Excel software in detail. There are many versions ofthe MS-Excel software. Here, we will discuss the MS-Excel 2007.
In this chapter, we use the following terminology while working with the mouse:
Pointer —a mouse pointer Click—press left button of mouse once Double Click—press left button of mouse twice Select —move the pointer of mouse and keep the left button of the mouse pressed over the
area that you want to select. The selected area will appear in a dark background. Quick Menu—Right click (press right button of mouse once) to get a quick menu.
The commands are enclosed in braces <Command> to represent the command to beclicked.
17.2 START MS-EXCEL
Figure 17.1 MS-Excel icon
The MS-Excel software for the Windows operating system should be installed on the computer.MS-Excel is a fully menu-driven software, and the commands are available as icons in variousTabs, and Groups. While working in MS-Excel, using a mouse makes working on MS– Excelsimpler although one can work to some extent through the keyboard also.
To start using the MS-Excel software, any one of the following steps needs to be performed:
If a shortcut key to MS-Excel is available as an icon on the Desktop, as shown in Figure 17.1, thendouble-click the icon, or
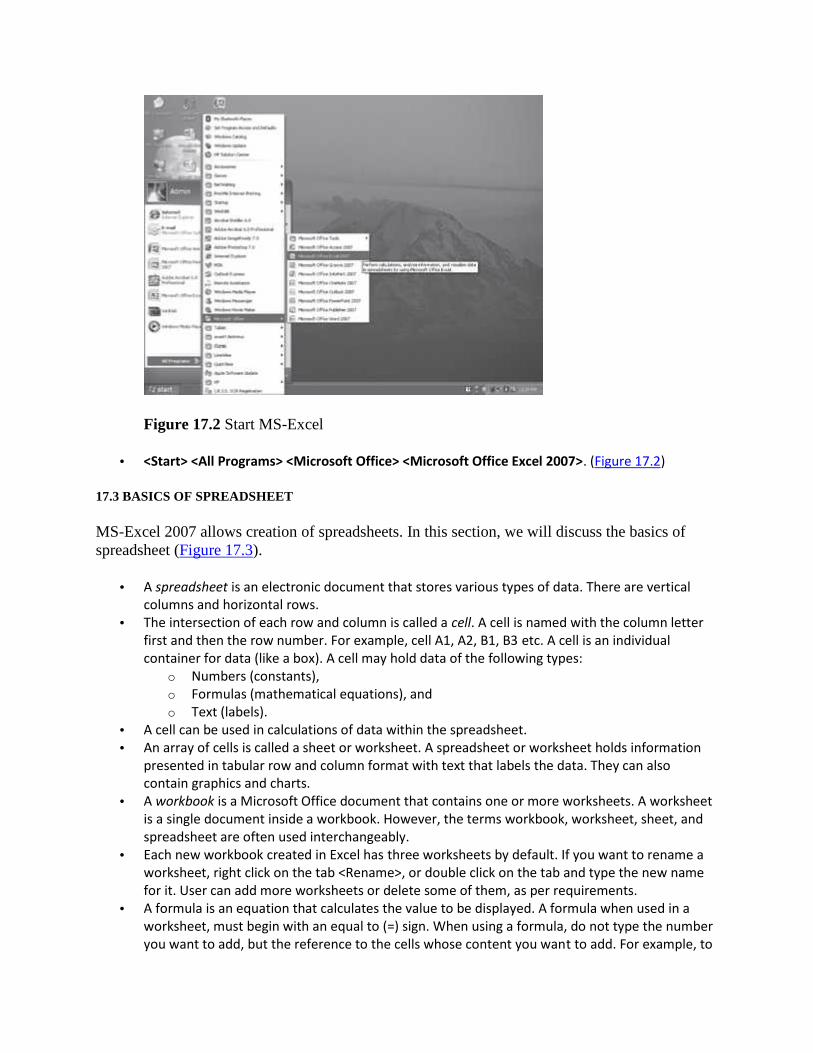
Figure 17.2 Start MS-Excel
<Start> <All Programs> <Microsoft Office> <Microsoft Office Excel 2007>. (Figure 17.2)
17.3 BASICS OF SPREADSHEET
MS-Excel 2007 allows creation of spreadsheets. In this section, we will discuss the basics ofspreadsheet (Figure 17.3).
A spreadsheet is an electronic document that stores various types of data. There are verticalcolumns and horizontal rows.
The intersection of each row and column is called a cell. A cell is named with the column letterfirst and then the row number. For example, cell A1, A2, B1, B3 etc. A cell is an individualcontainer for data (like a box). A cell may hold data of the following types:
o Numbers (constants),o Formulas (mathematical equations), ando Text (labels).
A cell can be used in calculations of data within the spreadsheet. An array of cells is called a sheet or worksheet. A spreadsheet or worksheet holds information
presented in tabular row and column format with text that labels the data. They can alsocontain graphics and charts.
A workbook is a Microsoft Office document that contains one or more worksheets. A worksheetis a single document inside a workbook. However, the terms workbook, worksheet, sheet, andspreadsheet are often used interchangeably.
Each new workbook created in Excel has three worksheets by default. If you want to rename aworksheet, right click on the tab <Rename>, or double click on the tab and type the new namefor it. User can add more worksheets or delete some of them, as per requirements.
A formula is an equation that calculates the value to be displayed. A formula when used in aworksheet, must begin with an equal to (=) sign. When using a formula, do not type the numberyou want to add, but the reference to the cells whose content you want to add. For example, to

add the marks 67, 78, 66, 90, 85, and insert the result in C10 cell, you put the formula=SUM(C5:C9) in C10 cell, where C5 is the cell from where we want to start finding the sum, andC9 is the cell having the last data we want to add. After writing the formula, when you press theEnter key, cell C10 displays the result i.e. 386. The actual formula contained in the cell C10, getsdisplayed in the formula bar, when you click over the number 386. It is advisable to referencethe cell as opposed to typing the data contained in the cell, into the formulas.
17.4 MS-EXCEL SCREEN AND ITS COMPONENTS
The user interface of the MS-Excel makes it easy to use Excel 2007. In contrast to the previousversions of MS-Excel, the new user-interface has an improved navigation system consisting oftabs which further consist of group of commands. The main screen is shown in Figure 17.3. Atthe top side of the screen is the Ribbon. Below the Ribbon are the Name box and the Formulabox. There is a scroll bar, and at the lower side of the screen there are the Worksheet tabs and theStatus Bar. The work area of the screen consists of rows and columns. The orientation of theExcel 2007 layout and its general features are described as follows:
The Office Logo button at the top left corner contains many commands for the documentsuch as, New, Open, Save, Save As, Print, and Close. This button also has a list of the recentdocuments. Some of these commands include an expandable menu to provide additionaloptions. This Office Logo button replaces the File menu in the earlier versions of MS-Office.

Figure 17.3 MS-Excel screen
The Quick Access Toolbar is to the right of the Office Logo button.
It contains shortcuts for the commonly used commands, like, Save Undo (reverses the
last change) and Repeat (repeats the last action). The icons for the commands that the user
want to get displayed on the toolbar can be selected from the Customize Quick AccessToolbar

The Ribbon consists of a panel of commands which are organized into a set of tabs (Figure 17.4).The layout of the Ribbon in MS-Excel is same as that of the Ribbon in MS– Word. Within Tabsare Groups, which are designated by the names located on the bottom of the Ribbon. Eachgroup has icons for the associated command. The Ribbon (Tabs, Groups, and Icons) replaces thetraditional toolbars and menus of earlier versions of MS-Excel.
Figure 17.4 The ribbon
The Tabs (Home, Insert etc.) on the Ribbon contain the commands needed to insert data, pagelayout, formulas etc. as well as any additional commands that you may need.
Each Tab consists of different Groups, like the Home tab has seven groups namely, Clipboard,Font, Alignment, Number, Styles, Cells, and Editing.

Each group has icons for the commands. To know the function of an icon (or command), leavethe pointer on a button for a few seconds, the function of that icon will appear in a small boxbelow the pointer. For
example, leaving the icon on
displays “Bold (Ctrl+B)”.
Status Bar—It displays information about the currently active worksheet. The information
includes the page number, view shortcuts, zoom slideretc.Right-click on the status bar will show you the Customize Status bar (Figure 17.5) pop-upmenu. You can select the options you want to view on the status bar.
Scroll Bar—There are two scroll bars—horizontal and vertical. They help to scroll the content orthe body of worksheet. Scrolling is done by moving the elevator button along the scroll bar, orby clicking on the buttons with the arrow marked on them to move up and down, and left andright of a worksheet.
Worksheet Tab—They are the tabs located at the bottom of each worksheet in theworkbook, which display the names of the sheets. A button is provided to insert a newworksheet. You can move from one worksheet to other using the arrow keys or by clicking onthe appropriate worksheet tab.
Row—The numbers (1, 2, 3 …) that appear on the left side of the worksheet window. The rowsare numbered consecutively starting from 1 to 1,048,576 (approx. 1 million rows).
Column Headings—The letters that appear along the top of the worksheet window. Columnsare listed alphabetically starting from A to XFD i.e.16,384, (approx.16,000 columns).

Figure 17.5 Customize status bar
Active Cell—The intersection of a row and column is called a cell. The cell in which you arecurrently working is the active cell. A dark border outlining the cell identifies the active cell.
Formula Bar—It is located beneath the Ribbon. Formula bar is used to enter and edit worksheetdata. As you type or edit the data, the changes appear in the Formula Bar. When you click themouse in the formula bar, an X and a check mark appear. You can click the check icon to confirmand complete editing, or the X to abandon editing.
Name Box—It displays the cell reference, or column and row location, of the active cell in theworkbook window.

17.5 THE OFFICE BUTTON
The functionality of the Office button in MS-Excel is almost similar to the functionality providedin the MS– Word software. For example, New will open a blank document in MS–Word and ablank Workbook in MS-Excel.
The Office Button is used to perform file management operations on the file (i.e. the workbook).It contains commands that allow the user to create a new workbook, open an existing workbook,save a workbook, print a workbook etc. The Office button contains nine commands (Figure17.6), namely, New, Open, Save, Save As, Print, Prepare, Send, Publish, and Close. The workingof these commands is almost similar to their working in MS–Word. Here, we will discuss thembriefly.
Figure 17.6 The office button commands
Table 17.1 briefly describes the different commands available in the Office Button.
Office ButtonCommands
Description
New Create a new blank workbook.
Open Open an already existing workbook.
Save Save a workbook for which a file name and location has already been specified.
Save As Use when you save a workbook for the first time or to a differents location, or at thesame location with a different name or with a new type of work book. Here, you specifythe filename for the workbook, the location where the workbook is to be stored, andthe save type of the workbook. You can also save the workbook as a Excel Workbook,Excel Binary Workbook, Excel 97–2003 workbook etc. (Figure 17.7).
Print Print, Quick Print, and Print Preview the workbook. You can set properties like printquality, paper type etc. and print the active sheet or the entire workbook. Preview tosee how the workbook will look after printing.
Prepare Prepare the workbook for distribution. View workbook properties, encrypt document,restrict permissions etc.
Send Send a copy of the workbook to e-mail or to Internet Fax.
Publish Distribute the workbook to other people—Save for Excel services, share the workbookby saving it to a document management server, or create a new site for the workbook.(Figure 17.8).
Close Close an open workbook.
Table 17.1 Office button commands description

Figure 17.7 Save as option

Figure 17.8 Publish option
The following describes briefly some of the common operations that are performed using thecommands of the Office Button.
Create a New Workbook: < > <New>. A new window opens up. <Blank Workbook><Create>. There are templates available on the left panel for creating a workbook of a specifictype (e.g. billing statement, sales report).
Saving a Workbook for the First Time: < > <Save As>. Excel will display a dialog box. In thefield next to File name, type a name with which you want to save the workbook. Navigate in thetop portion of the dialog box to the folder where you want to save the workbook (choose the
appropriate directory where you want to save the file. You can use to go up in the directory,
Use to create a new folder). Once you have saved your workbook for the first time, you can
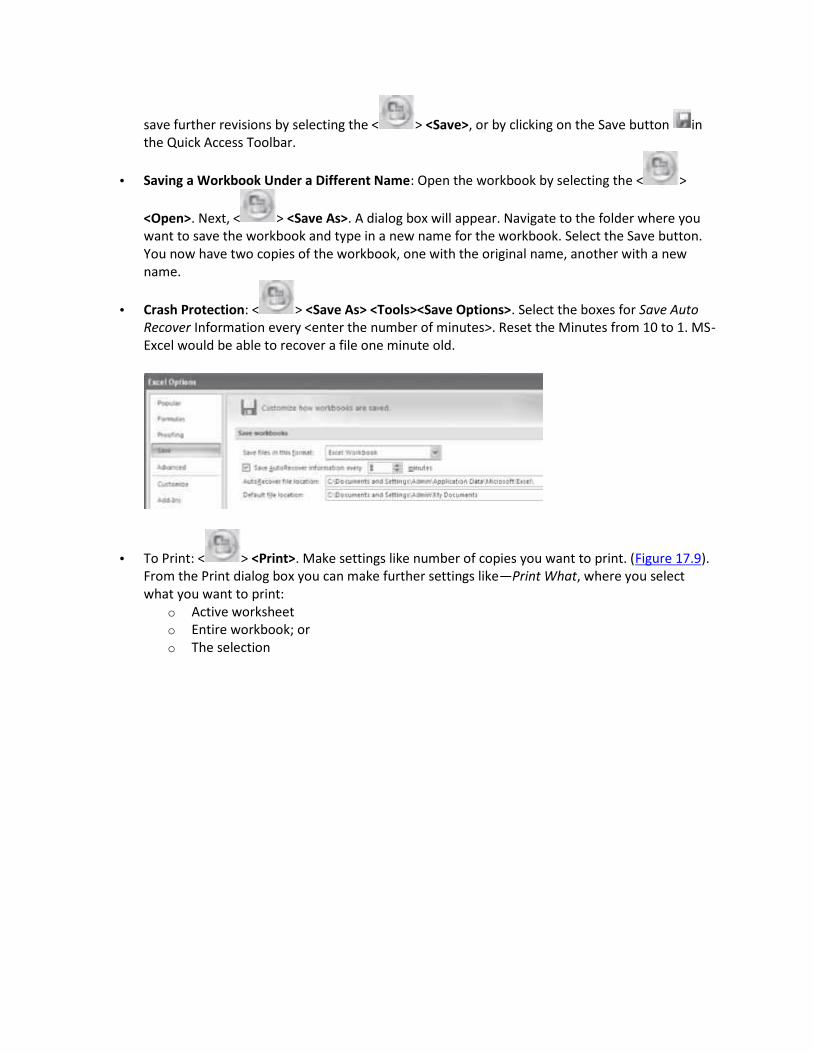
save further revisions by selecting the < > <Save>, or by clicking on the Save button inthe Quick Access Toolbar.
Saving a Workbook Under a Different Name: Open the workbook by selecting the < >
<Open>. Next, < > <Save As>. A dialog box will appear. Navigate to the folder where youwant to save the workbook and type in a new name for the workbook. Select the Save button.You now have two copies of the workbook, one with the original name, another with a newname.
Crash Protection: < > <Save As> <Tools><Save Options>. Select the boxes for Save AutoRecover Information every <enter the number of minutes>. Reset the Minutes from 10 to 1. MS-Excel would be able to recover a file one minute old.
To Print: < > <Print>. Make settings like number of copies you want to print. (Figure 17.9).From the Print dialog box you can make further settings like—Print What, where you selectwhat you want to print:
o Active worksheeto Entire workbook; oro The selection

Figure 17.9 Print dialog box
Quick Tips—How to Learn MS-Excel
When working with MS-Excel, all you need to know is the following:
What a command does? When you want to perform a particular action, which command to use? How to use a command?
Let’s see how we can go about learning MS-Excel.
1. What a command does—When your keep the mouse pointer over a command or icon, thefunction of the command or icon gets displayed in a text box. So it can be known whatthat command does, by moving the mouse over the command.
2. Which command to use—1. To search for a command, first see which tab might have the command. For example, if
any formatting is to be done, click the Home Tab; to insert anything click the Insert tab;to use Formula, click the Formulas tab.
2. It is possible to find the required group and command, most of the time. The commandsthat have similar uses are grouped together in the same group in Excel 2007.
3. Once the command is known, then we need to know how to use the command.o For most of the commands, first place the cursor in the worksheet at the position where
the action is to happen, or, select the object on which you want the action to happen(for example formatting commands). Next, click on the command. The command getsexecuted.
o In some commands, there are a set of steps to use the command.
17.6 THE RIBBON
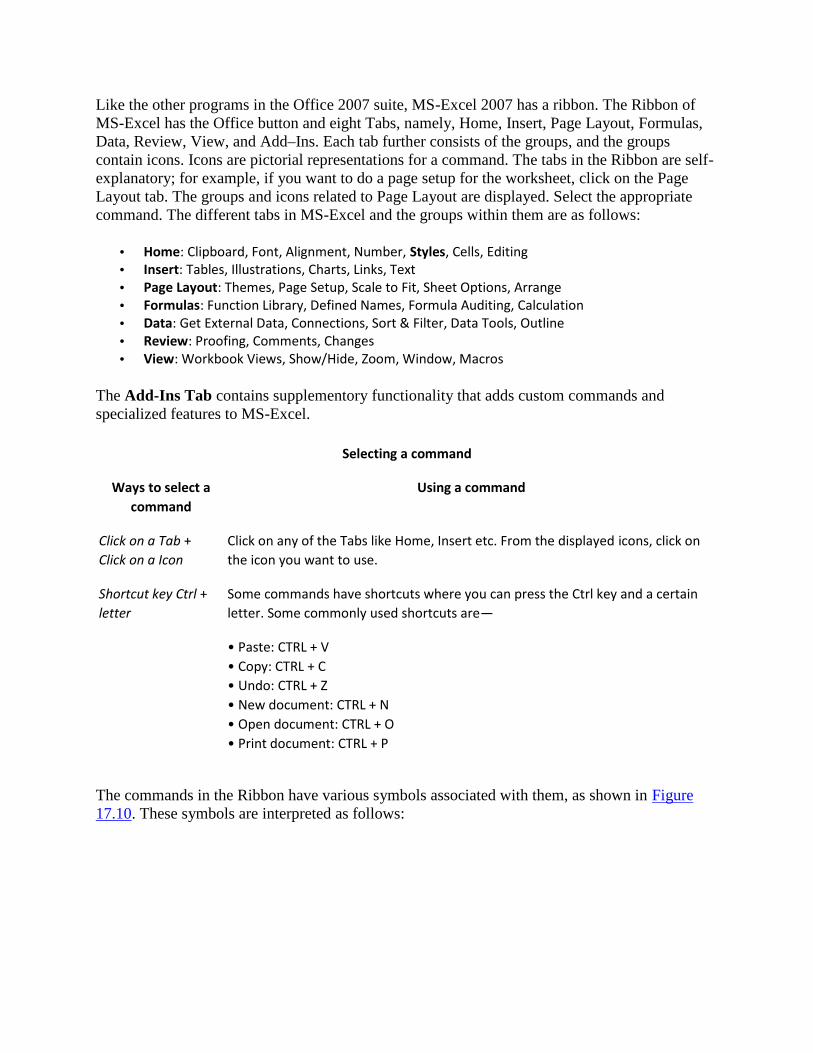
Like the other programs in the Office 2007 suite, MS-Excel 2007 has a ribbon. The Ribbon ofMS-Excel has the Office button and eight Tabs, namely, Home, Insert, Page Layout, Formulas,Data, Review, View, and Add–Ins. Each tab further consists of the groups, and the groupscontain icons. Icons are pictorial representations for a command. The tabs in the Ribbon are self-explanatory; for example, if you want to do a page setup for the worksheet, click on the PageLayout tab. The groups and icons related to Page Layout are displayed. Select the appropriatecommand. The different tabs in MS-Excel and the groups within them are as follows:
Home: Clipboard, Font, Alignment, Number, Styles, Cells, Editing Insert: Tables, Illustrations, Charts, Links, Text Page Layout: Themes, Page Setup, Scale to Fit, Sheet Options, Arrange Formulas: Function Library, Defined Names, Formula Auditing, Calculation Data: Get External Data, Connections, Sort & Filter, Data Tools, Outline Review: Proofing, Comments, Changes View: Workbook Views, Show/Hide, Zoom, Window, Macros
The Add-Ins Tab contains supplementory functionality that adds custom commands andspecialized features to MS-Excel.
Selecting a command
Ways to select acommand
Using a command
Click on a Tab +Click on a Icon
Click on any of the Tabs like Home, Insert etc. From the displayed icons, click onthe icon you want to use.
Shortcut key Ctrl +letter
Some commands have shortcuts where you can press the Ctrl key and a certainletter. Some commonly used shortcuts are—
• Paste: CTRL + V• Copy: CTRL + C• Undo: CTRL + Z• New document: CTRL + N• Open document: CTRL + O• Print document: CTRL + P
The commands in the Ribbon have various symbols associated with them, as shown in Figure17.10. These symbols are interpreted as follows:

Figure 17.10 Command symbols
Simple Command—The command start executing when it is clicked. Command Followed by Arrow—Clicking on the arrow displays more options for the command. Faded Command—A faded command means that it is not available currently. Group Dialog Box—Clicking on this symbol displays the dialog box for the group.
The following sub-sections describe the different tabs in detail.
Working with MS-Excel 2007
Live Preview applies temporary formatting on the selected data or text when the mouse movesover any of the formatting buttons. This allows the preview of, how the text will appear with thisformatting. The temporary formatting is removed if the mouse pointer is moved away from thebutton.
Mini Toolbar is a floating toolbar that pops up whenever a test is selected or right-clicked. Itprovides easy access to the most commonly used formatting commands such as Bold, Italics,Font, Font size, Font color.
File Format for the documents created in Excel 2007 is xlsx. (For earlier versions it was .xls)
17.6.1 The Home Tab
The Home Tab contains commands that are frequently used in an Excel worksheet. It containscommands for formatting of text and numbers, and text alignment. The Home Tab is also usedfor editing the content of sheet like sort and filter, find and select, and, to perform clipboardoperations such as cut, copy, and paste on the sheet. Figure 17.11 shows the Home Tab.
Figure 17.11 The home tab

There are seven groups within this tab, namely, Clipboard, Font, Alignment, Number, Styles,Cells, and Editing.
The Clipboard group contains the cut, copy, and paste commands. The Format Painter is alsopresent here. The Clipboard commands are used in the same manner as you use the MS–WordClipboard commands.
Font group commands allow change of the Font—font face, style, size, and color. These optionscan be changed before or after typing the text. The text whose font needs to be changed shouldbe selected and then with the font commands in the Ribbon, or by menu obtained after right-click, the font can be changed.
Alignment group is used to change alignment of the text in the cells—vertical and horizontalalignment, indentation, wrap the text, shrink it to fit within the cell, and merge multiple cells.
Number group contains commands for number formatting e.g. Number, Date, accounting,decimals, comma style and percentage.
The Styles group can be used to specify conditional formatting by defining formatting rules,convert a range of cells into a table by selecting a pre-defined Table Style, or, format a selectedcell by selecting one of the built-in formatting styles.
Cells allow the user to insert, delete or format the cells, and also whole columns, rows or sheets.Formatting includes renaming, hiding or protecting.
Editing group contains commands to display the sum of selected cells, copy a pattern, clear thedata, formats, and comments from a cell, sort and filter, or find and select specific contentswithin the workbook.
Table 17.2 gives the commands in the different groups (in left to right order) of the Home Tabalong with a brief explanation.
Home TabGroups
Description
Clipboard
• Paste the cut or copied items in Clipboard at the location where cursor is pointing rightnow (Paste Special—To paste in a particular format. Paste as Hyperlink—Used with copyto paste the copied items as a hyperlink.)• Cut removes the selected item from the sheet and pastes it onto a new place, where thecursor is pointing by using the paste command.• Copy copies the selected item and puts it on the Clipboard.• Format painter copies formatting from one place and applies it to another (To applysame formatting to many places, double-click the format painter button.)

Font
• Change font face, change font size.• Increase font size, Decrease font size.• Bold, Italics, Underline• Apply borders to the currently selected cell.• Change the font color• Click on the arrow in dialog box.• Color the background of the selected cells. the bottom right corner of font to see theFormat Cells
Alignment
• Align text to the top, middle or bottom of the cell.• Change the text orientation within a cell for placing a label above a column.• Left align, center, or right align for horizontal alignment in a cell.• increase or decrease, the amount of indentation within a cell.•.Wrap the text to make all content within a cell visible by displaying it on multiple lines.• Merge or unmerge the selected cells together and center the content of the cell.• Click on the arrow in the bottom right corner of Alignment to see the Format Cells dialogbox.
Number
• Choose how a value in a cell is displayed—as currency , percentage, short date etc. Itshows the most commonly used formats with a link to more formats.• Format the cell content to convert a number to a currency, percent, or decimal. Quickstvles allows to choose a visual style for the shape or line• Increase or decrease the number of zeroes after the decimal (degree of precision)• Click on the arrow in the bottom right corner of Number to see the Format Cells dialogbox

Styles
• Conditional formatting highlights intersting cells, emphasize unusual values, andvisualize data using data Bars, color scales, and icon sets• Format a range of cells and convert the range to a table by selecting a pre-defined tablestyle.• Cell Styles are pre-defined styles available to quickly format a cell
Cells
• Insert cells, rows, or columns into a worksheet, or insert additional worksheets into aworkbook• Delete rows or columns• Format the cell—change row height or column width, change visibility, protect or hidecells
Editing
• Auto Sum displays the sum of selected cells directly after the selected cells• Fills a pattern into one or more adjacent cells• Clear deletes everything from a cell, or remove formatting, contents, or comments• Sort & Filter arranges data for easy analysis (data can be sorted in ascending ordescending order, or filter out specific values)• Find & Select (or replace) specific text, formatting or type of information within theworkbook
Table 17.2 Home tab commands description
Here, we describe briefly some of the operations that are performed using the commands of theHome Tab.
Move Text: Select and highlight the section you want to move <Home><Clipboard> . Move
the cursor to the place you would like the text to be inserted <Home><Clipboard> .

Copy Text: Select and highlight the section you want to copy <Home><Clipboard> . Move
the cursor to the place you want the copied text to be inserted <Home><Clipboard> . Find and Replace: This is used to find a text and then replace it with a new one. This option is
use ful if you want to find a text at multiple places in the worksheet and replace all of them witha new one.
17.6.2 The Insert Tab
The Insert Tab contains commands for inserting objects of different kinds in a sheet. Thecommands in this tab are used to add illustrations, tables, links, text, and charts in a worksheet.Figure 17.12 shows the Insert Tab.
Figure 17.12 The insert tab
There are five groups within this tab, namely, Tables, Illustrations, Charts, Links, and Text.
Tables are used to define a range of cells as a table for easy filtering and sorting, and create apivot table or pivot chart to arrange and summarize data.
Illustrations group allows insertion of pictures, clip art, shapes, and smart art. The Charts group helps to display data in a visual manner. It is used to insert different types of
charts such as bar charts and pie charts. The Links group is used to insert a hyperlink to a place in the same workbook or an external one. The Text group contains commands to insert a Text Box, Word Art, Symbol, Digital Signature and
Header And Footer.
Some of the Tabs appear only when you use them; like Picture Tools tab, Drawing Tools Tab,Table Tools Tab, and Chart Tools Tab
Table 17.3 gives the commands in the different groups of the Insert Tab along with a briefexplanation.
Insert TabGroups
Description Groups

Tables
• Summarize data using a pivot table or pivot chart. Pivot table makes it easy to arrangeand summarize comlicated data and drill down on details. When a pivot table is inserted,a pivot Table Tools Tab open (Figure 17.13)• Create a table to manage and analyze related data. Tables make it easy to sort, filterand format data within a sheet. When a table is drawn, a Table Tool Design Tab (Figure17.14) open, Which allows you to select Table Style options, Table Styles, external tabledata etc.
Illustrations
• Insert picture from a file. When a picture is inserted, a Picture Tool Format Tab opens(Figure 17.15) which contains commands to format the picture.• Insert clipart into the document (sounds, movies, drawings)• Insert readymade shapes (lines, arrows, flowchart symbols etc.) into the document. ADrawing Tools Format Tab (Figure 17.16) opens.• Insert a smart art graphics. A Smart Art Tools Format tab opens.
Charts
• Insert a column chart, line chart, pie chart, bar chart, area chart, scatter chart, or a chartof any other kind. A chart Tools design (Figure 17.17), layout and format tab opens foruse.
Links
• Insert a hyperlink to a web page, a picture, an email address or a program

Text
• Insert a text box that can be positioned anywhere on a page.• Edit the header and footer to the sheet. You can insert the page number, date and time,sheet name, picture etc. A Header & Footer Tools Design Tab (Figure 17.18) opens up.• Insert decorative text in the document• Insert signature line that specifies the individual who must sign• Insert an embedded object.• Insert symbols that are part of the keyboard into the document. When you click onSymbol, a symbol table pops up. You can select the symbol you want to insert.
Table 17.3 Insert tab commands description
Figure 17.13 Pivot table tools options tab
Figure 17.14 Table tools design tab
Figure 17.15 Picture tools format tab

Figure 17.16 Drawing tools format tab
Figure 17.17 Chart tools design tab
Figure 17.18 Header and footer tools design tab
When a command of the Insert tab is used, insertion takes place at the location where the cursoris present right now. So, before inserting the item, place the cursor at the location where the itemis to be inserted. When you use the commands of the insert tab for insertion, you will see thatmost of the times, a dialog box will open which allows you to make specific settings, as per yourrequirement. Here, we do not discuss using the dialog boxes as they are self-explanatory, and areeasy to use. Some of the operations using the Insert Tab commands are described below:
To Create Headers and Footers—<Insert> <Text><Header & Footer>. Now you can edit theHeader and Footer of your document. A Header and Footer tab is opened which allows you toadd date and time, page number etc.
Insert Hyperlink—<Insert> <Links> <Hyperlink>. To link to another location in the samedocument, click Place in This Document option under Link to; In the dialog box’s inner window,select a cell reference. To link to another document, click the Existing File or Web Page option.Navigate to the proper folder and select the file’s name. You can also add a link to a newlycreated document or an e-mail address.
Insert Text—<Insert> <Text> <Text Box>. Click anywhere on the sheet where you want to insertthe text box. Drag the corner points of the text box to change its size. Click within the box totype text. To format the text box, select the text box. <Drawing Tools> <Format>. Format theselected text box.
Insert PivotTable—<Insert><Tables><PivotTable>. A Create Pivot Table dialog-box opens up.From the worksheet, select the table or range of cells to choose the data you want to analyze.(You must select the row headings). In the dialog box, select from whether you want to placethe PivotTable in a new worksheet or an existing worksheet. Click <Ok>.

A PivotTable tools tab opens. On the right side of the sheet a PivotTable Field list is displayed.Select the fields to place in the PivotTable and drag the fields for column labels, row labels,report filter or values. A PivotTable is displayed. More settings can be done, using thePivotTable Options and Design tab. (Figure 17.19 shows the PivotTable created using the Namesand Total marks of the students from a set of eight fields).
Figure 17.19 A pivot table example

17.6.3 The Page Layout Tab
The Page Layout Tab contains commands related to the layout and appearance of the pages in adocument. It allows you to apply themes, change the page layout, and also provides options forviewing gridlines and headings. The Page Layout Tab is shown in Figure 17.20.
Figure 17.20 The page layout tab
There are five groups within this tab—Themes, Page Setup, Scale to Fit, Sheet Options, andArrange.
The Themes group contains commands to change the overall theme of current worksheetincluding fonts, colors, and fill effects.
Page Setup is used to set the page margins, orientation, size, background, page breaks, printtitles etc.
Scale to Fit group allows specifying scaling of the page to force fit the document into a specificnumber of pages. It is possible to set the page width and height, stretch or shrink the printedoutput (scaling), and select the paper size and print quality.
The Sheet Options group is used to switch sheet direction (right-to-left), view or print gridlines,and view or print worksheet headings (letters at the top of the sheet and numbers to the left ofthe sheet).
The Arrange group is used to arrange, align or group the shapes and objects in the worksheet.
Table 17.4 gives the commands in the different groups of Page Layout Tab along with a briefexplanation.
Page LayoutTab Group
Description
Themes
• Themes are used to change the overall design of the Colors document including themefont, theme color, and theme effect.
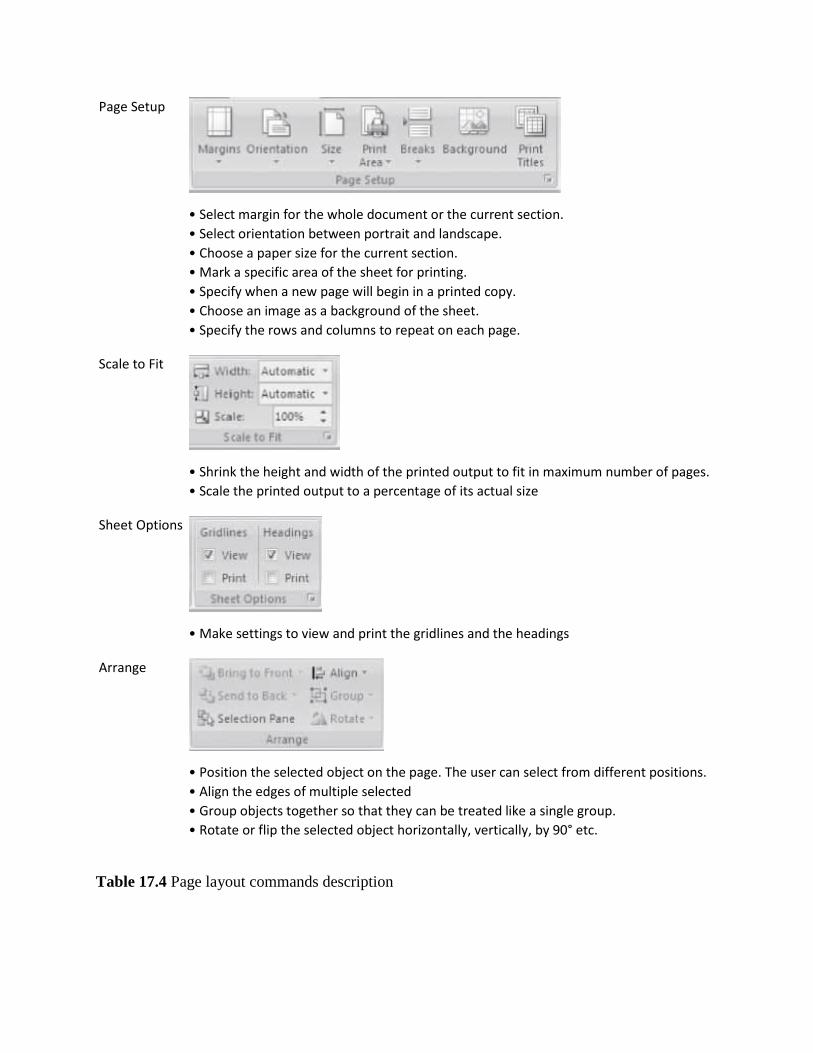
Page Setup
• Select margin for the whole document or the current section.• Select orientation between portrait and landscape.• Choose a paper size for the current section.• Mark a specific area of the sheet for printing.• Specify when a new page will begin in a printed copy.• Choose an image as a background of the sheet.• Specify the rows and columns to repeat on each page.
Scale to Fit
• Shrink the height and width of the printed output to fit in maximum number of pages.• Scale the printed output to a percentage of its actual size
Sheet Options
• Make settings to view and print the gridlines and the headings
Arrange
• Position the selected object on the page. The user can select from different positions.• Align the edges of multiple selected• Group objects together so that they can be treated like a single group.• Rotate or flip the selected object horizontally, vertically, by 90° etc.
Table 17.4 Page layout commands description

Specify page margins—<Page Layout><Page Setup><Margins> Change either top, bottom, left,or right margins by clicking in the appropriate text boxes or on the arrows next to the numbersin Custom margins.
17.6.4 The Formulas Tab
The Formulas Tab allows the user to define equations in order to perform calculations on valuesin the worksheet. The Formulas Tab is shown in Figure 17.21.
Figure 17.21 The formulas tab
There are four groups within this tab, namely, Function Library, Defined Names, FormulaAuditing, and Calculation.
The Function Library contains a library of functions (e.g. mathematical, logical, trigonometric,and math) that can be used to calculate or manipulate data.
Defined Names allows the user to define names to be used to refer to specific formulas, andthen allows searching for those names.
Formula Auditing group includes commands to display formulas rather than results in a cellwindow, check for common formula errors, or trace precedents or dependents in cells that arereferenced within a formula.
Calculation allows user to specify calculation options for formulas—manual, automatic etc.
Table 17.5 gives the commands in the different groups of the Formulas Tab along with a briefexplanation.
Formulas TabGroup
Description
Function Library
• Edit the formula in the current cell by choosing the function and editing thearguments in the selected cell.• Display the sum of the selected cells after the selected cells.• Browse and select from a list of logical functions like AND, IF.• Browse and select from a list of lookup and reference functions like ADDRESS,

LOOKUP.• Browse and select from a list of recently used functions.• Browse and select from a list of text functions like LEN, Replace.• Browse and select from a list of math and trigonometric functions like ABS, FLOOR.• Browse and select from a list of financial functions like DISC, DB.• Browse and select from a list of date and time functions like DATE, HOUR.• Browse and select from a list of statistical, engineering and cube functions likeAVERAGE, COMPLEX.
Defined Names
• Create, edit, delete and find all• Name cells so that can be referred in the formulas by that name.• Choose a name from this workbook and use it in the current formula.• Automatically generate names from the selected cells.
FormulaAuditing
•Trace Precedents Show arrows to indicate what cells affect the value of the currentlyselected cell.• Display the formula in the resulting cell instead of the resultant value.• Trace Dependents—Show arrows to indicate what cells are affected by the currentlyselected cell.• Check for common errors that occur in formulas.• Remove the arrows drawn by Trace Precedents and Trace Dependents.• Launch the Evaluate Formula dialog box to debug the formula.• Monitor the value of certain cells as changes are made to the sheet.
Calculation
• Specify when formulas are calculated.• Calculate the entire workbook now.• Calculate the current sheet now.

Table 17.5 Formulas tab commands description
The formula addressing is briefly described below.
Formula addressing—The formula can have relative addressing, absolute addressing, and mixedaddressing.
o Relative address—To repeat the same formula for many different cells, use the copy andpaste command. The cell locations in the formula are pasted relative to the position wecopy them from. In the original cell we wrote =SUM(B5:C5); when we copy this formulain the cell below, we see that the formula becomes =SUM(B6:C6), i.e. the function willlook at the two cells to its left.
o Absolute address—To keep a certain position that is not relative to the new cell location,use absolute positioning. For this, insert a $ before the column letter or a $ before therow number (or both). The $ sign locks the cell location to a fixed position. For example,=SUM($B$5:$C$5) will copy the same formula to every location we copy.
o Mixed address—A mix of relative and absoluter addresses is used to keep some partrelative and some absolute. For example, =SUM(B$5:C$5) has the column addressrelative and the row address absolute.
17.6.5 The Data Tab
The Data Tab contains the commands related to the retrieval and layout of data that is displayedon a worksheet. The Data Tab is shown in Figure 17.22.

Figure 17.22 The data tab
There are five groups within this tab, namely, Get External Data, Connections, Sort & Filter,Data Tools, and Outline.
The Get External Data group allows you to import data into Excel from external sources, such asan Access database, a Web page, a text file, etc.
Connections include commands needed to create and edit links to external data or objects thatare stored in a workbook or a connection file.
The Sort & Filter group contains commands associated with sorting and filtering the data withina worksheet.
Data Tools contains commands to remove duplicates, data validation, what if analysis, etc. Outline enables the user to group and ungroup a range of cells, and apply subtotals in a given
column based on values of another column.
The commands in the different groups of the Data Tab along with a brief explanation are shownin Table 17.6.
Data TabGroup
Description
Get ExternalData
• Import data from Access, a web page, a text file, and from other sources like SQLServer or Microsoft• Connect to an external data source by selecting from a list of commonly usedsources.
Connections
• Update all the information in the workbook that is coming from the data sources.• Display all data connections for the workbook.

• Specify how cells connected to a data source will update, what contents from thesource will be displayed etc.• View all of the other files this spreadsheet is linked to, so that a link can be updatedor removed.
Sort & Filter
• Sort the selection from the lowest to the highest value or from the highest to thelowest value.• Launch the Sort dialog box to sort based on several criteria all at once.• Enable filtering of the selected cells.• Clear the filter and the sort state for the current range of data.• Reapply the filter and sort in the current range.• Specify complex criteria to limit which records are included in the result set of aquery.
Data Tools
• Separate the contents of one Excel sheet into a set of columns like Name into firstname and last name.• Delete duplicate rows from the sheet.• Prevent invalid data from being entered into a cell.• Combine values from multiple ranges into one new range.• Try out various values for the formulas in the sheet.
Outline
• Group a range of cells so that they can be together expanded or collapsed.• Ungroup the range of cells that were previously grouped.• Total several rows of related data together by automatically inserting subtotals andtotals for the selected cells.• Show or hide a group of cells.
Table 17.6 Data tab commands description
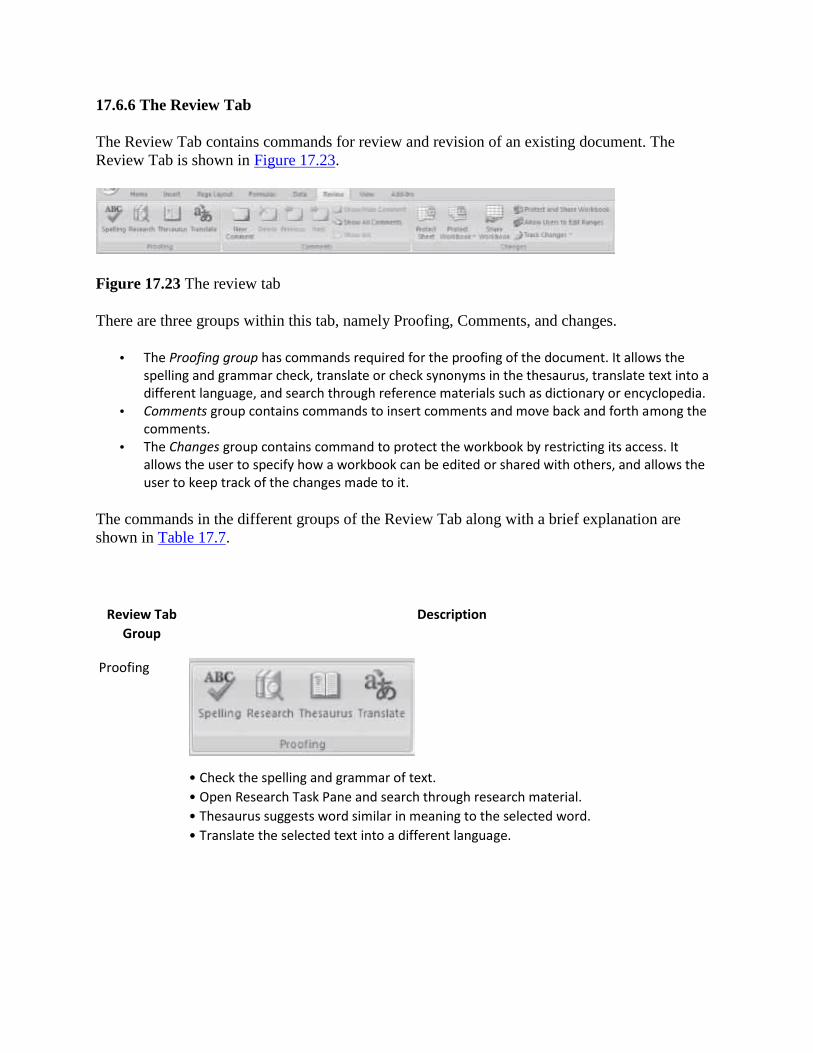
17.6.6 The Review Tab
The Review Tab contains commands for review and revision of an existing document. TheReview Tab is shown in Figure 17.23.
Figure 17.23 The review tab
There are three groups within this tab, namely Proofing, Comments, and changes.
The Proofing group has commands required for the proofing of the document. It allows thespelling and grammar check, translate or check synonyms in the thesaurus, translate text into adifferent language, and search through reference materials such as dictionary or encyclopedia.
Comments group contains commands to insert comments and move back and forth among thecomments.
The Changes group contains command to protect the workbook by restricting its access. Itallows the user to specify how a workbook can be edited or shared with others, and allows theuser to keep track of the changes made to it.
The commands in the different groups of the Review Tab along with a brief explanation areshown in Table 17.7.
Review TabGroup
Description
Proofing
• Check the spelling and grammar of text.• Open Research Task Pane and search through research material.• Thesaurus suggests word similar in meaning to the selected word.• Translate the selected text into a different language.

Comments
• Add a Comment about the selection.• Edit or Delete the selected comment.• Navigate to the previous or the next comment.• Show or hide comment attached to the selected cell.• Display all the comments in the sheet.• Show or hide any ink annotations on the sheet.
Changes
• Restrict how people can access the work sheet or the workbook. You can allowrestricted access using passwords etc.• Allow multiple people to work in a workbook at the same time.• Share the workbook and protect it with a password at the same time.• Allow specific people to edit ranges of cells in a protected workbook or sheet.• Track all changes made to the document including insertions, deletions and formattingchanges.
Table 17.7 Review tab commands description
17.6.7 The View Tab
The View tab has commands that affects how the document appears on the screen. The ViewTab is shown in Figure 17.24.
Figure 17.24 The view tab
There are five groups within this tab, namely, Workbook Views, Show/Hide, Zoom, Window,and Macros.

The Workbook Views group has commands to view the document in different modes likenormal, page break view etc. You can also create your own custom views or switch to full screenview.
The Show/Hide group contains commands to show or hide the ruler, gridlines, message bar,formula bar, or worksheet headings.
Zoom is used to view the document in smaller or larger sizes. You can zoom in and out withdifferent options.
Window group contains commands to create new windows, arrange all open windows andswitch between them, freeze panes so that they continue to appear on the screen whilescrolling, and save a workspace.
The Macros group is used to create or view a macro. Macros allow you to define a sequence ofactions to perform on a document or multiple documents that can be executed again and againsimply by running the macro.
The commands in the different groups of View Tab along with a brief explanation are shown inTable 17.8.
View TabGroup
Description
WorkbookViews
• Normal view shows the document in the normal view.• Page layout allows viewing the document as it will appear in a Printed page. You can seewhere the pages begin and end and also to see the header and footer.• View a preview of where the pages will break when printed.• Save a set of display and print settings as custom view.• View the document in the full screen mode.
Show/Hide
• Gridlines and rulers are used to measure and line up objects on a sheet. Show or Hidethe Ruler, Gridlines, Message bar, Formula Bar, and the Headings.

Zoom
• Open Zoom dialog box to specify the zoom level such as 33%, 66%, 100%, or 200%.• Zoom the worksheet so that the currently selected range of cells fills the entire window.
Window
• Open a new window containing a view of the current workbook.• Arrange all open sheets side-by-side on the screen.• Keep a portion of the screen visible while rest of the sheet scrolls.• Split the window into multiple re-sizable panes containing views of your worksheet.• Hide or unhide the current window.• View two worksheets side-by-side so that their contents can be compared.• Synchronize the scrolling of two documents so that they scroll together.• Reset the window position so that the documents share the space equally.• Save the current layout of the window as workspace so that they can be restored lateron.• Switch to a different currently open window.
Macros
• View the list of macros from which you can run, create or delete a macro
Table 17.8 View tab commands description
17.6.8 The Help
The Help button is located on the right most side of the Tabs in the Ribbon. Click on thisbutton to get help for using any command of the Excel. On clicking on the help button, a screenas shown in Figure 17.25 appears. You can browse the Help for the command you want. You canalso perform operations such as, search for a command and view the Table of Contents.

Figure 17.25 Excel help
Many of the concepts that you use while working with MS–Office suite are common for MS–Word, MS–PowerPoint and MS-Excel. For example, open, close, save, cutting and pasting areperformed the same way in MS-Excel as they are in MS–Word and MS–PowerPoint. The menusare also arranged in a similar layout. If you are not sure how to do something in Excel, then try itas you would do in MS–Word or MS–PowerPoint, and it may work.
17.7 SOLVED EXAMPLES
Example 1: The following table gives year-wise sale figures of five salesmen in Rs.

Calculate total sale year-wise. Calculate the net sales made by each salesman. Calculate the commission for each salesman — If total sales is greater than Rs.1,00,000/-, then
commission is 5% of total sale made by the salesman, else it is 2% of total sale. Calculate the maximum sale made by each salesman. Calculate the maximum sale made in each year. Draw a bar graph representing the sale made by each salesman. Draw a pie graph representing the sales made by salesmen in year 2004.
Solution 1:
Open blank workbook. <New> <Create> Enter the headings of the table
o Double-click on the cell and type.
o If name is too long, use Text Wrap: <Home><Alignment>< >
o Use Text Orientation to change the direction of the text: <Home><Alignment>< > Double-click on the cells and enter the data. Total Year-wise Sales: Since you want to find the total, the function SUM is used.
o If you already know that the SUM function is to be used, then type =SUM(. You will seethat the format of the SUM function appears. Click on number1 in the format and selectthe cells for which you want to find the total. It will write =SUM(E10:E14. Close thebrackets =SUM(E10:E14). This is the total sales of one year. Click on the cell in which youhave found total and pull the plus sign to the other columns of the same row to get totalyear-wise sales of other years.
o If you do not know that the SUM function is to be used, then use the options<Formulas> <Function Library>. Look for the appropriate function.
Net Sales for each Salesman: Same method as for Total Year-wise Sales. Commission: Enter the IF formula.
o Enter =IF(o Then select the cells whose value is to be checked. It will become =IF(I10o Write the condition. >100000,0.05*(o Again select the cells. It will become =IF(I10>100000,0.05*(I10), 0.02*(o Again select the cells, and put brackets.The final formula will look
like=IF(I10>100000,0.05*(I10), 0.02*(I10)) Maximum sale made by each salesman: Use MAX function: =MAX(E10:H10) Maximum sale made in each year: Use MAX function: =MAX(E10:E14)

Select the cells and use <Home><Styles><Conditional Formatting> and <Home><Styles><CellStyles> to give conditional formatting and style, respectively, to the cells.
Bar graph: <Insert><Charts><Bar> A Chart Tools Tab appearso Select <Chart Tools> <Design> Select a Chart Style or change the style using <Chart
Tools><Type> <Change Chart Type>
o <Chart Tools><Data><Select Data>. A dialog box appears. Either enter the cell numbers,or you can select the cells from the worksheet for which you want to make a chart.When you select, a dotted border appears around the selected cells. Next, click <OK> inthe dialog box.
o A chart appears. Now use the <Chart Tools> <Layout> <Labels> to label and decide theplacement of your chart axes, legend, title etc.
o Use <Chart Tools> <Layout> <Current Selection> <Format Selection> to format the chartarea like fill texture, gradient etc.
Pie graph: <Insert><Charts><Pie>. A Chart Tools Tab appears. Follow the same steps as in Bargraph.
Figure 17.26 and Figure 17.27 show the sales table and the graphs.
Figure 17.26 Sales table

Figure 17.27 Bar graph and pie graph for the sales table example
Example 2: A school pays a monthly salary to its employees, which consists of basic salary,allowances, and deductions. The details of allowances and deductions are as follows:
HRA is 30% of the Basic. DA is 20% of Basic. Conveyance Allowance is —
o Rs. 500/-, if Basic is less than or equal to Rs.10000/-o Rs. 750/-, if Basic is greater than Rs.10000/- and less than Rs.20000/-o Rs. 1000/-, if Basic is greater than Rs.20000/-
Entertainment Allowance is —o Rs 500/-, if Basic is less than or equal to Rs.10000/-o Rs.1000/-, if Basic is greater than Rs.10000/-
PF deduction is 6% of Basic. IT deduction is 15% of the Basic. Calculate the following:
o Gross Salary = Basic + HRA + DA + Conveyance + Entertainmento Deduction = PF + ITo Net Salary = Gross Salary — Deduction
Make a salary table and calculate the net salary of the employees.

Solution 2:
Open blank workbook. <New> <Create> Enter the headings of the table
o Double-click on the cell and type.
o If name is too long, use Text Wrap: <Home><Alignment>< >
o Use Text Orientation to change the direction of the text: <Home><Alignment>< > Double-click on the cells and enter the data. Select the cells and use <Home><Styles><CellStyles> to give style to the cells. For HRA enter the formula =0.03*D7 For DA, enter the formula: =0.02*D7 For Conveyance Allowance, write the formula: =IF(D7<=10000,500,IF(AND(D7>10000,
D7<20000),750,1000)) For Entertainment Allowance, enter the formula: =IF(D7<=10000,500,1000) For Gross Salary, enter formula: =SUM(D7:H7) For PF, enter formula: =0.06*D7 For IT, enter formula: =0.15*D7 For Net Deduction, enter formula: =SUM(J7:K7) For Net Salary, enter formula: =I7–L7 Select the cells and use <Home><Styles><Conditional Formatting> and <Home><Styles><Cell
Styles> to give different colors and style to the cells.
Figure 17.28 shows the salary table.
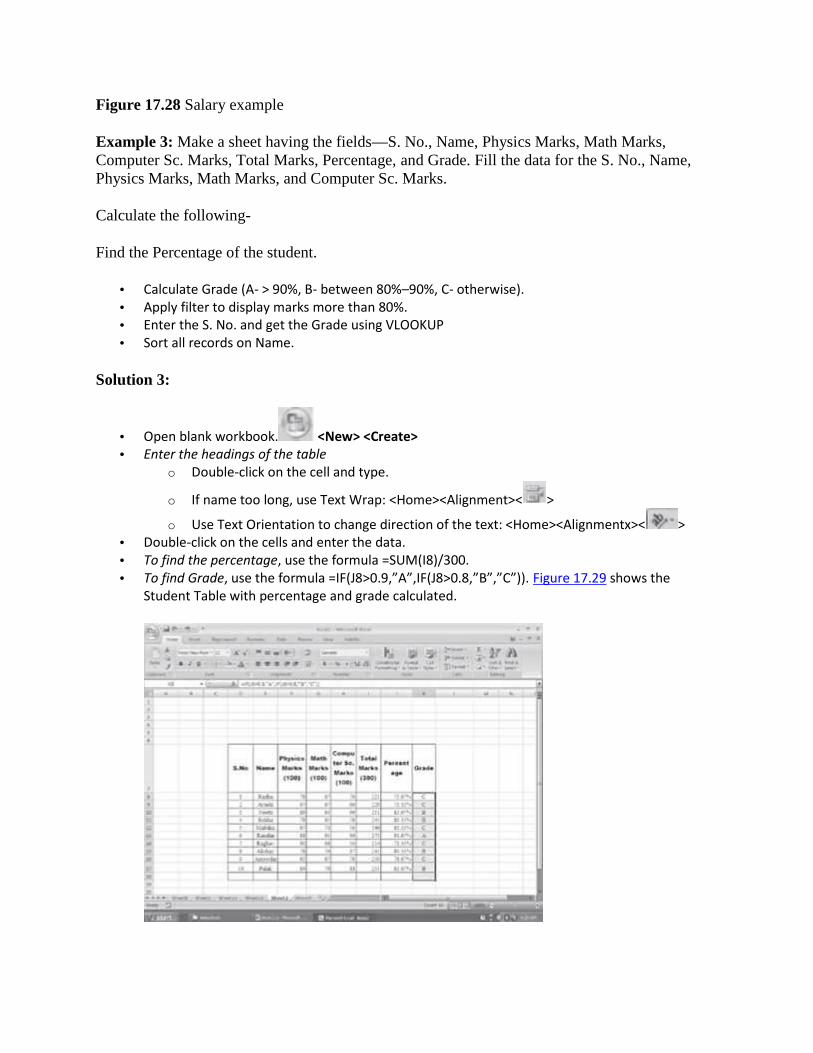
Figure 17.28 Salary example
Example 3: Make a sheet having the fields—S. No., Name, Physics Marks, Math Marks,Computer Sc. Marks, Total Marks, Percentage, and Grade. Fill the data for the S. No., Name,Physics Marks, Math Marks, and Computer Sc. Marks.
Calculate the following-
Find the Percentage of the student.
Calculate Grade (A- > 90%, B- between 80%–90%, C- otherwise). Apply filter to display marks more than 80%. Enter the S. No. and get the Grade using VLOOKUP Sort all records on Name.
Solution 3:
Open blank workbook. <New> <Create> Enter the headings of the table
o Double-click on the cell and type.
o If name too long, use Text Wrap: <Home><Alignment>< >
o Use Text Orientation to change direction of the text: <Home><Alignmentx>< > Double-click on the cells and enter the data. To find the percentage, use the formula =SUM(I8)/300. To find Grade, use the formula =IF(J8>0.9,”A”,IF(J8>0.8,”B”,”C”)). Figure 17.29 shows the
Student Table with percentage and grade calculated.

Figure 17.29 Student marks example
Apply Filter:o Select the column or columns on which you want to apply the filter. Here it is column
Percentage.
o Click on <Data><Sort & Filter><Filter> You will see that an arrow like appears in thatcolumn.
o Click on the arrow. A pop-up menu appears. Click on <Number Filters>. Select one of thedisplayed options. Here we select Greater Than… A Custom AutoFilter dialog boxappears. Since we want all students having more than 80%, put .8 in the box on the rightside. Click <OK>. Figure 17.30 shows filter applied to the Student Table.
Figure 17.30 Student marks example with filter on percentage
Using VLOOKUP: Use VLOOKUP formula, =VLOOKUP(D8,StudentTable,8)

o D8 is the cell number of the S.No field. So, the first argument is the field for which wewant to find the result.
o Student Table is the name given to the whole table. You can specify the cell range ordefine a name for the Table. To specify cell range, simply select the complete table. Todefine a name for the table– Select the table. <Formulas><Defined Names> <DefineName>. A New Name dialog box appears. Write the Name with which you want to referto the Table. Here we write Student– Table. Click <OK>. In the VLOOKUP formula, thesecond argument is the table name.
o The third argument is the column number from where you want the result. Here wewant the Grade, which is the 8th column in the Table.
o So, use the formula =VLOOKUP(D8,StudentTable,8). Figure 17.31 shows VLOOPUPreference in the Student table.
Figure 17.31 Student marks example with VLOOKUP reference

To sort the table on the field Name: Select the column on the basis of which you want to sort.Click <Data><Sort & Filter> <Sort>.
o If only one column of the table is selected, you get a Sort Warning. Click on <Expand theSelection> and <Sort>. You get the sorted table.
o If you select multiple columns you get the Sort dialog box. Here you can specify thelevels of sorting also (for example, level 1—sort on name, level 2—sort on total marksetc.). Click <OK>. You get the sorted table. Figure 17.32 shows the Student table aftersorting.
Figure 17.32 Student marks example with sort on name
Exercises:
1. Design a mark-sheet for a student as follows:

1. Calculate the total marks for each subject. Calculate the grade (A-90% or more, B - 80%-less than 90%, C-70% - less than 80%, D-60% - less than 70%, E-otherwise)
2. Calculate the total marks of all subjects and the total percentage. Depending on thetotal percentage write the following in remarks
1. Excellent-90% or more2. Very Good-80%-less than 90%,3. Good-70%-less than 80%,4. Fair-60%-less than 70%,5. Poor-less than 60%
3. Use cell style to show colored cells4. Use thick outline border5. Use Font size, color and alignment for the text
2. Design the Time Table given to you at the start of the Semester, without grid lines.3. Prepare a schedule of your exams.4. Prepare the rate list of the Mother Dairy Fruit and Vegetable Vendor:
1. Sort the Table in decreasing order of rate list.2. Find the total of all the rates.3. While printing the table hide the gridlines.4. Check the spelling and grammar in an existing document. Use the “Replace” option in
Find and Replace to replace each instance of some word.5. Create a 7-column, 6-row table to create a calendar for the current month.
1. Enter the names of the days of the week in the first row of the table.2. Centre the day names horizontally and vertically.3. Change the font and font size as desired.4. Insert a row at the top of the table. Merge the cells in the row and enter the current
month and year using a large font size. Shade the row.5. Enter and right-align the dates for the month in the appropriate cells of the table.6. Change the outside border to a more decorative border. Identify two important dates in
the calendar, and shade them.6. In a new workbook, create the worksheet. Name the worksheet as Furniture Details. Enter the
data shown in the table below:

1. Calculate the total amount for each item (Quantity*Price/Piece) and also the totalamount for all items.
2. Apply suitable formatting to currency entries (Rs.) and numbers.3. Adjust the column widths where needed. Insert blank rows between column labels and
data.4. Use alignments, fonts, borders, and colors to format the “Furniture Details” worksheet.
For example, put a border around the title, change the color of column headings to red,and center all the entries in Column B.
5. Create a header that includes your name, and a footer that includes current date.Change page orientation to Landscape.
6. Preview and print the worksheet.7. Use the Furniture Table in Question 11 to do the following:
1. Prepare a bar chart for the data. Place the chart as an object in the worksheet.2. Print the entire worksheet with the chart.3. Print the entire worksheet without the chart.4. Change the bar chart to an exploded pie chart. Add a title to the pie chart.
8. Create a worksheet as shown below:1. Calculate the average, mode, and median.2. Draw a bar graph.3. Color all the responses more than 20% in a different color. Count these responses.

9. Create a worksheet as shown below:1. Sort the data in the “Type” column. Filter the areas where “Rice” is supplied.2. Use PivotTables in the this worksheet that uses the SUM function in the quantity.
Change the SUM function to AVERAGE or COUNT.3. Add/modify one or two new records to the data, and then reset the range for the
PivotTable.
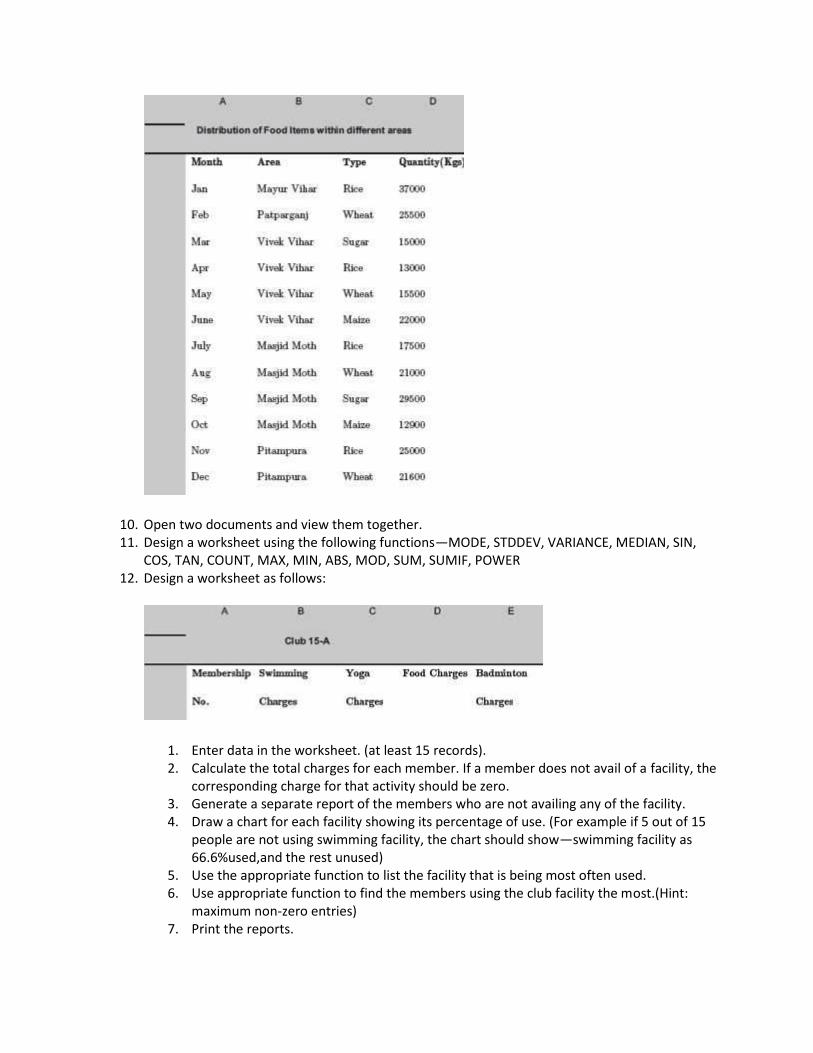
10. Open two documents and view them together.11. Design a worksheet using the following functions—MODE, STDDEV, VARIANCE, MEDIAN, SIN,
COS, TAN, COUNT, MAX, MIN, ABS, MOD, SUM, SUMIF, POWER12. Design a worksheet as follows:
1. Enter data in the worksheet. (at least 15 records).2. Calculate the total charges for each member. If a member does not avail of a facility, the
corresponding charge for that activity should be zero.3. Generate a separate report of the members who are not availing any of the facility.4. Draw a chart for each facility showing its percentage of use. (For example if 5 out of 15
people are not using swimming facility, the chart should show—swimming facility as66.6%used,and the rest unused)
5. Use the appropriate function to list the facility that is being most often used.6. Use appropriate function to find the members using the club facility the most.(Hint:
maximum non-zero entries)7. Print the reports.

The above questions can be made specific by including one or more of the followingoptions:
8. Create and name range data to simplify use.9. Use Names and Labels in functions.10. Use Decision–Making functions such as SUMIF to calculate data based on the evaluation
?of criteria in another data range.11. Use Nested functions such as IF, AND, and OR to analyze data based on multiple
conditions.12. Run and record a macro.13. Save macros in a Personal Workbook, the current workbook, or in a new workbook.14. Open multiple workbooks simultaneously.15. Copy and paste between workbooks.16. Use copy and Paste Special.17. Link data in multiple workbooks.18. Write linking formulas.19. Consolidate data based on its position in a worksheet.20. Consolidate data based on data categories.21. Outline worksheets to display or print various levels of worksheet detail.22. Use Pivot Tables to summarize and analyze large banks of data.23. Modify and expand a pivot table.24. Insert and rename sheet tabs.25. Change column width and row height.26. Use formula with Relative and Absolute cell addresses.27. Analyze formula syntax.28. Use Auto Sum, Auto Calculate, and AutoFill.29. Apply number formats to support worksheet data.30. Align cell entries, apply text formats, and apply cell borders for visual clarity.31. Clear cell contents, comments, and formatting.32. Undo and redo multiple actions.33. Spell check a worksheet.34. Insert and delete rows.35. Copy data to a predefined range.36. Use comments in a worksheet.37. Use Dates in functions.38. Use Conditional Formatting.39. Create Lists.40. Sort on one column or multiple columns.41. Filter list data to select specific date—Filter with custom criteria, Use Advanced Filters,
Remove a filter, Use AutoFilter.42. Use Subtotals.43. Use the Chart Wizard to embed a chart on an Excel worksheet—bar, column, line, and
pie charts.44. Create a chart on a separate chart sheet.45. Read series formulas that underlie charts.46. Size or move a chart or a chart object.47. Change chart types.48. Format charts to improve their appearance.
49. Print charts with the corresponding worksheet data.50. Protect a Worksheet.51. Create a Template.52. Use a Template to Create a Workbook (Hint: <Office button> <New>).53. Import data into Excel.54. Export data from Excel into a text file.
18
MS-POWERPOINT 2007
Contents
Introduction Basics of PowerPoint—PowerPoint basics, PowerPoint terminology Start MS-PowerPoint MS-PowerPoint screen and its components —Office logo button, quick access toolbar, ribbon,
tabs, groups, icons, notes pane, view buttons outline/slides tab, slide pane, ruler bar, status bar,scroll bar
The office button—New, open, save, save as, print, prepare, send, publish, close The ribbon—Home, insert, design, animations, slide show, review, view, add-ins Home tab—Clipboard, slides, font, paragraph, drawing, editing
o Insert tab—Tables, illustrations, links, text, media clipo Design tab—Page setup, themes, backgroundo Animations tab—Preview, animations, transition to this slideo Slide show tab—Start slide show, set up, monitorso Review tab—Proofing, comments, protecto View tab—Presentation views, show/ hide, zoom, color/grayscale, window, macros
The help An example—Create a PowerPoint presentation
Why this chapter
An application of the computer is to use it for presenting our work to a large audience— as aspeaker in a conference, as a manager in an organization, as an instructor in a class etc., using apresentation software. A presentation software facilitates creation of slides for presentation—inclusive of text, graphics, animation, movie clips, sound clips etc. MS-PowerPoint is commonlyused presentation software. The purpose of this chapter is to introduce you to MS-PowerPoint.
18.1 INTRODUCTION
The Presentation software is used for creation of the slides, and to display the information in theform of presentation of slides. Presentation software are easy to use and provide an alternative toother older types of visual aids like hand-drawn slides, blackboards, whiteboards, posters,

pamphlets, handouts, or overhead transparencies. A presentation software provide tools likeeditor that allow insertion and formatting of text, and, methods for inserting and manipulatinggraphic images along with sound and visual effects. The presenter and the participants, bothbenefit from the Presentation software. It provides an easier access to presenter’s ideas andprovides the participants with visual information in addition to the talk.
The presentations can be printed on paper or transparencies, displayed on a computer, or,projected using a video projector for large audiences. The presentations are of many differenttypes like professional (work-related) presentations used by business people and corporate;education presentation used by educators, students, and trainers; entertainment presentation usedfor advertising; and presentations for general communication.
The presentation software from different vendors are available for the creation of presentation.Apple Keynote, Microsoft PowerPoint (MS-PowerPoint), Corel Presentations, and IBM LotusFreelance Graphics are some of the presentation software available in the market. Several open-source presentation software, like, Sun OpenOffice, Impress, MagicPoint, and KPresenter arealso available.
MS-PowerPoint is the most commonly known presentation software. It is a part of the MS-Office suite, and runs on Microsoft Windows and Mac OS X operating systems. MS-PowerPointis a GUI-based software. MS-PowerPoint includes tools for word processing, outlining, drawing,graphing, and presentation management, which are all easy to use and learn. The slides in a MS-PowerPoint presentation may contain text, graphics, movies, and other objects, which may bearranged freely on the slide. Some of the important features of MS-PowerPoint are as follows:
A consistent style in a presentation can be adopted by using a template or Slide Master. Interactive presentations can be made with a system of links and buttons to move to the next
slide; and a full set of hyperlinks that function like a nested website, where the user choosesoptions.
Background effects can be included in the slides. The entrance, emphasis, and exit of elements on a slide itself are controlled using Custom
Animations. Transitions, or movements between slides can be animated in a variety of ways.
Figure 18.1 Shows a presenter making a presentation using PowerPoint

Figure 18.1 A presentation being made using PowerPoint
This chapter discusses the using of the MS-PowerPoint software in detail. There are manyversions of the MS-PowerPoint software. This chapter discusses the MS-PowerPoint 2007.
In this chapter, we will use the following terminology while working with the mouse—
Pointer—a mouse pointer Click—press left button of mouse once Double Click—press left button of mouse twice Select—move the pointer of mouse and keep the left button of the mouse pressed over the
area that you want to select. The selected area will appear in a dark background. Quick Menu—Right click (press right button of mouse once) to get a quick menu
The commands used in this chapter are enclosed in braces <Command> to represent thecommand to be clicked.
18.2 BASICS OF POWERPOINT
MS-PowerPoint 2007 allows the creation of dynamic and high-impact presentations. In thissection, we will discuss the basics of PowerPoint and introduce some PowerPoint terminology.

PowerPoint Basicso A PowerPoint (PPT) presentation consists of a collection of slides.o A slide is a single screen that contains information that the presenter wants to show.o A presentation generally has a Title slide, a Presentation outline slide, several slides
discussing the outlined topics, and the conclusion or summary slide.o The information can be in the form of text as bullet points, images or animation.o Bullet points are not complete explanations; rather they convey a basic thought that is
expanded upon by the presenter, during the presentation.o The presenter can control the movement across the slides or the presentation can be
preprogrammed to perform the navigation automatically. PowerPoint Terminology
o Master contains formatting and design elements common to every slide in thepresentation.
o Template contains slide default settings for colors, fonts, bullet types, and graphics.o Slide Show is the PowerPoint Presentation given, using a projection device such as a
video-data projector or an LCD overhead projector. Slideshows can be enhanced withclip art, Smart Art diagrams, tables, and charts. Custom animations can be used toenliven presentations. Themes and Quick styles allow you to apply styling quickly to awhole presentation of individual elements. In addition to the pre-prepared slide layouts,presenter can also create a customized slide layout, complete with placeholder text,using the Custom Slide Layouts. Smart Art graphics allows insertion of designer qualitygraphics into the presentations.
o Wizard is a step-by-step guide for completing a task.o Transitions are the effect that takes place when you advance from one slide to the next.
Transitions are available only with Slide Shows.o Animations are the sound and the movements that appear when a slide comes on the
screen. For example, it can be used to have one line of text appear on the screen at atime.
o Objects can be the items that can be created with the drawing tools or the pictures thatare imported from other sources (such as scanned images).
o Clip Art is the collection of pictures available in the PowerPoint Clip Art gallery.
18.3 START MS-POWERPOINT
The MS-PowerPoint software for the Windows operating system is installed on the computer.MS-PowerPoint is fully menu-driven software, and the commands are available in the form ofTabs, Groups and Icons. While working in MS-PowerPoint, using a mouse makes working onMS-PowerPoint simpler although one can work to some extent through the keyboard also.
To start using the MS-PowerPoint software, any one of the following steps needs to beperformed—

Figure 18.2 MS-PowerPoint icon
If a shortcut key to MS-PowerPoint is available as an icon on the Desktop, as shown in Figure18.2, then double-click the icon.
<Start> <All Programs> <Microsoft Office> <Microsoft Office PowerPoint 2007>. (Figure 18.3)
Figure 18.3 Start MS-PowerPoint
18.4 MS-POWERPOINT SCREEN AND ITS COMPONENTS
The main screen of the MS-PowerPoint that appears when the software gets started is shown inFigure 18.4. At the top side of the screen is the Ribbon. There is a ruler bar and a scroll bar, andat the lower side of the screen there is the Status Bar. The screen also consists of the viewbuttons, and the different panes like slide pane, notes pane, outline/slide pane. A brief descriptionof the different components of the screen is given below:

Figure 18.4 MS-PowerPoint Screen
The Office Logo Button at the top left corner contains many task buttons for thedocument such as, New, Open, Save, Save As, Print and Close. This button also has a list of therecent documents. Some of these commands include an expandable menu to provide additionaloptions.

The Quick Access Toolbar is to the right of the Office Logo button. It
contains shortcuts for the commonly used tools, like, Save , Undo (reverses the last
change), and Repeat (repeats the last action). The buttons that the user wishes to be
displayed can be selected from the Customize Quick Access Toolbar. The Ribbon is a set of tools and commands across the top of the screen (Figure 18.5). The layout
of the Ribbon in MS-PowerPoint is same as that of the Ribbon in MS-Word and MS-Excel. Itconsists of a panel of commands which are organized into a set of tabs (also known as the TabBar). Within Tabs are Groups, which are designated by the names located on the bottom of theRibbon. Each group has icons for the associated command. The Ribbon (Tabs, Groups and Icons)replaces the traditional toolbars and menus of earlier versions of MS-PowerPoint.
Figure 18.5 The ribbon
The Tabs (Home, Insert etc.) on the Ribbon contain the buttons needed to edit characters, text,and layout, as well as the additional tools that you may need.
Each Tab consists of different Groups, like the Home tab has six groups namely, Clipboard,Slides, Font, Paragraph, Drawing, and Editing.
Each group has Icons for the commands, which will actually format the document or bring up amenu. To know the function of an icon button (or command), leave the pointer on a button for afew seconds, the function of that button will appear in a small box below the pointer. For
example, leaving the icon on displays “Bold (Ctrl .”B)

Notes Pane—It is used by the presenter to makes the notes that are to be used whilepresenting.
View Buttons—They enable user to look at the slides of PPT file on their computer in different
ways. By default, PowerPoint opens the presentation in Normal View , which is the main
view used to design and edit presentations. Slide Sorter presents slide miniatures, allowing
the reorder of the slides, and pre-set the transitions between them. Slide Show shows theslides as if the presenter is actually presenting. The final presentation is presented in the SlideShow mode to the audience. Slides cannot be edited in this view.
Outline/Slides Tab—It contains two views—outline view and slide view. The outline view showsthe text of the slides in a larger format than the Normal view. The slide view displays the slidesas thumbnails, where user can view all the slides in the presentation, rearrange them and hidethe slides, as per requirements.
Slide Pane—This is the work area where most of the editing is done. It shows the slide selectedin the Outline/Slides tab as it will appear in the presentation.
Ruler Bar—There are two rulers—Horizontal and Vertical. The Ruler Bar allows formatting of thehorizontal and the vertical alignment of text in a presentation, by adjusting the tabs, indents andmargins.
Status Bar—It displays information about the currently active presentation. The information
includes the current slide number, Theme, zoom slider etc.Right-click on the status bar will show the Customize Status Bar (Figure 18.6) pop-up menu. Theappropriate option can be selected on the status bar.
Scroll Bar—The vertical scroll bar helps to scroll the slides of the presentation. Scrolling is doneby moving the elevator button along the scroll bar, or by clicking on the buttons with the arrowmarked on them to move up and down the slides.
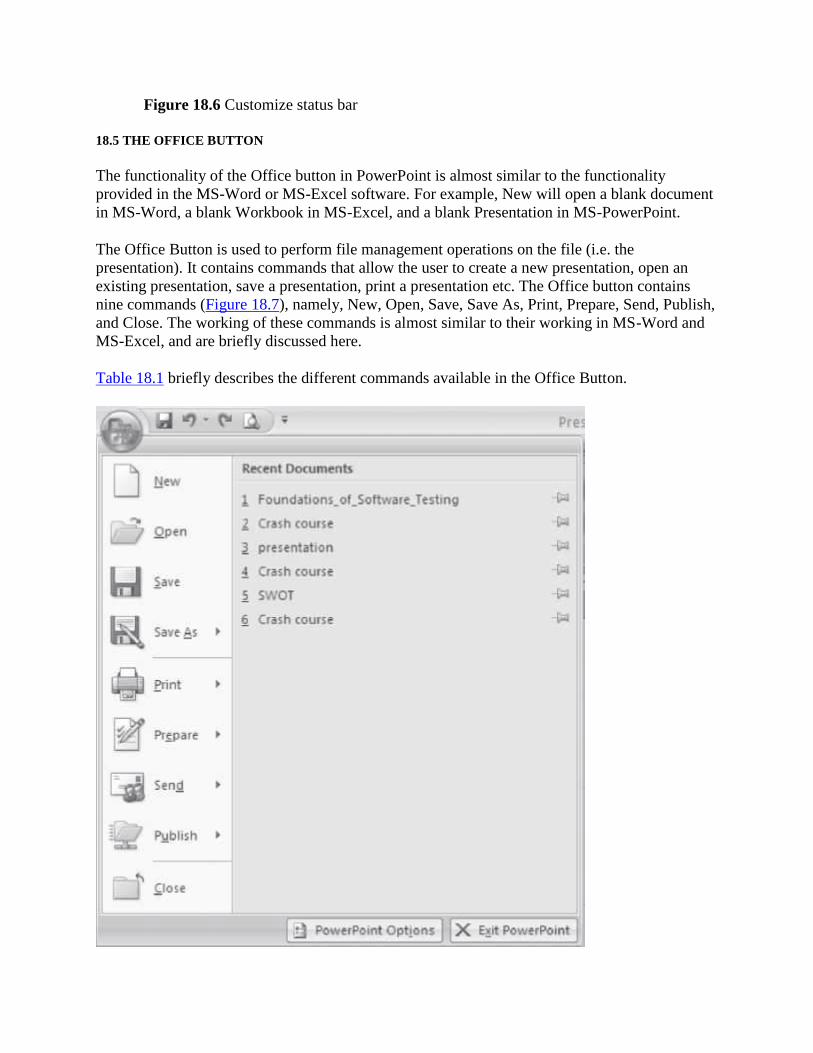
Figure 18.6 Customize status bar
18.5 THE OFFICE BUTTON
The functionality of the Office button in PowerPoint is almost similar to the functionalityprovided in the MS-Word or MS-Excel software. For example, New will open a blank documentin MS-Word, a blank Workbook in MS-Excel, and a blank Presentation in MS-PowerPoint.
The Office Button is used to perform file management operations on the file (i.e. thepresentation). It contains commands that allow the user to create a new presentation, open anexisting presentation, save a presentation, print a presentation etc. The Office button containsnine commands (Figure 18.7), namely, New, Open, Save, Save As, Print, Prepare, Send, Publish,and Close. The working of these commands is almost similar to their working in MS-Word andMS-Excel, and are briefly discussed here.
Table 18.1 briefly describes the different commands available in the Office Button.

Figure 18.7 The office button commands
Office ButtonCommands
Description
New Create a new blank presentation.
Open Open an already existing presentation.
Save Save a presentation for which a file name and location has already been specified.
Save As Used when presentation is saved for the first time or to a different location, or at samelocation with different name or with a new type presentation. Specify the filename forthe presentation, the location where the presentation is to be stored and the save typeof the presentation. Presentation can also be saved as a PowerPoint presentation,PowerPoint show, PowerPoint 97-2003 presentation etc. (Figure 18.8).
Print Print, Quick Print, Print Preview the presentation. Properties like print quality, papertype, number of slides per page, color or grayscale, etc. can be set. Preview to see howthe presentation will look after printing.
Prepare Prepare the presentation for distribution. View presentation properties, encryptdocument, restrict permissions etc.
Send Send a copy of the presentation to e-mail or to Internet Fax
Publish Publish the presentation as handouts, to a CD, save slides to a slide library etc (Figure18.9).
Close Close an open presentation.
Table 18.1 Office button commands description
The following describes briefly some of the common operations that are performed using thecommands of the Office Button:
Create a New Presentation: < > <New>. A new window opens up. <Blank Presentation><Create>. There are templates available on the left panel for creating a presentation of aspecific type (e.g. quiz show, photo album).
Saving a Presentation for the First Time: < > <Save As>. PowerPoint will display a dialogbox. In the field next to File name, type a name with which you want to save the presentation.Navigate in the top portion of the dialog box to the folder where the user wants to save the
presentation (choose the right directory where you want to save the file. You can use to go
up in the directory, Use to create a new folder). Once you have saved your presentation for

the first time you can save further revisions by selecting the < > <Save>, or by clicking on
the Save button in the Quick Access Toolbar.
Saving a Presentation Under a Different Name: Open the presentation by selecting the < >
<Open>. Next, < > <Save As> A dialog box will appear. Navigate to the folder where youwant to save the presentation and type in a new name for the presentation. Select the Savebutton. One now has two copies of the presentation, one with the original name, another with anew name.
Figure 18.8 Save as option
Crash Protection: <Save As> <Tools><Save Options>. Select the boxes for Save Auto RecoverInformation every <enter the number of minutes>. Reset the Minutes from 10 to 1. MS-PowerPoint would be able to recover a file one minute old.
To Preview your Presentation Before Printing: <Print> Select Print Preview. User can switchbetween viewing one slide and multiple slides, zoom in, (it will turn into a magnifying glass witha symbol inside) and zoom back out, place the cursor on the presentation and this time the
symbol inside.—cursor will turn into a magnifying glass with a

Figure 18.9 Publish option
To Print: <File> <Print>. Make settings like number of copies and pages to be printed. (Figure18.10). From the Print dialog box one can make further settings like—Print What, where one canselect one of the following options:
o A slide—Prints one slide per page in landscape orientation.o Handouts—it will ask the number of slides to be printed on one page. It prints two,
three or six slides per page in portrait orientation. Handouts are useful to give to theaudience so that they understand the presentation better, and they can handwritenotes during the presentation.
o Notes pages—Prints a slide in the top half of the page and the speaker’s notes in thebottom half of the page. They are useful for the presenter as it contains notes andreminders.
o Outline views—Prints the presentation in an outline view

Figure 18.10 Print dialog box
Quick Tips—How to Learn MS-PowerPoint
When working with MS-PowerPoint, all one needs to know is the following:
What a command does? When you want to perform a particular action, which command to use? How to use a command?
Here’s a brief description for further enabling you to learn MS-PowerPoint:
1. What a command does—When your keep your mouse pointer over a command or icon,the function of command or icon is gets displayed in a text box. So you can know what acommand does by moving the mouse over the command.
2. Which command to use—1. To search for a command, first see which tab might have the command. For example, if
you want to do any formatting, click the Home Tab; to insert anything click the Inserttab; to design your slides click the Design tab.
2. You will be able to find the group and command you want, most of the time. Thecommands that have similar uses are grouped together in the same group in PowerPoint2007.
3. Once you are able to find the command, then you should know how to use the command.

1. For most of the commands, first place the cursor in the presentation at the positionwhere the action is to happen, or, select the object on which you want the action tohappen (for example formatting commands). Next, click on the command. Thecommand gets executed.
2. In some commands, there is a set of steps to use the command. Simply follow the steps.
18.6 THE RIBBON
Like the other programs in the Office 2007 suite, PowerPoint 2007 has a ribbon. The Ribbon ofMS-PowerPoint has the Office button and eight Tabs, namely, Home, Insert, Design,Animations, Slide Show, Review, View, and Add-Ins. Each tab further consists of the groups,and the groups contain icons. Icons are a pictorial representation for a command. Each Tab isself-explanatory; for example, for a page setup for the slide, click on the Design tab. The groupsand icons related to Design are displayed. Select the Page Setup command. The different tabs inMS-PowerPoint and the groups within them are as follows:
Home: Clipboard, Slides, Font, Paragraph, Drawing, Editing Insert: Tables, Illustrations, Links, Text, Media Clips Design: Page Setup, Themes, Background Animations: Preview, Animations, Transition to This Slide Slide Show: Start Slide Show, Set Up, Monitors Review: Proofing, Comments, Protect View: Presentation Views, Show/Hide, Zoom, Color/Grayscale, Window, Macros
The Add-Ins tab contains supplemental functionality that adds custom commands andspecialized features to MS-PowerPoint.
The commands in the Ribbon have various symbols associated with them, as shown in Figure18.11. These symbols are interpreted as follows:
Selecting a command
Ways to select acommand
Using a command
Click on a Tab +Click on a Icon
Click on any of the Tabs like Home, Insert etc. From the displayed icons, click onthe icon you want to use.
Shortcut keyCtrl + letter
Some commands have shortcuts where you can press the Ctrl key and a certainletter. Some commonly used shortcuts are —
• Paste: CTRL + V• Copy: CTRL + C• Undo: CTRL + Z• New document: CTRL + N
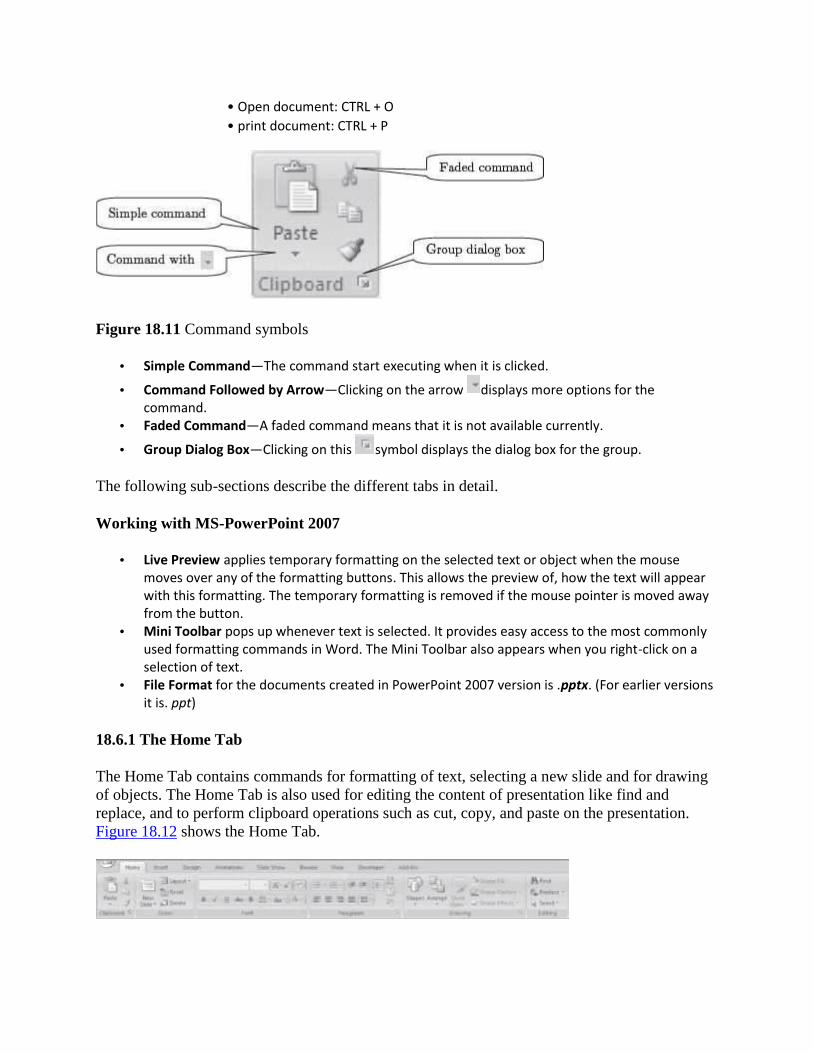
• Open document: CTRL + O• print document: CTRL + P
Figure 18.11 Command symbols
Simple Command—The command start executing when it is clicked.
Command Followed by Arrow—Clicking on the arrow displays more options for thecommand.
Faded Command—A faded command means that it is not available currently.
Group Dialog Box—Clicking on this symbol displays the dialog box for the group.
The following sub-sections describe the different tabs in detail.
Working with MS-PowerPoint 2007
Live Preview applies temporary formatting on the selected text or object when the mousemoves over any of the formatting buttons. This allows the preview of, how the text will appearwith this formatting. The temporary formatting is removed if the mouse pointer is moved awayfrom the button.
Mini Toolbar pops up whenever text is selected. It provides easy access to the most commonlyused formatting commands in Word. The Mini Toolbar also appears when you right-click on aselection of text.
File Format for the documents created in PowerPoint 2007 version is .pptx. (For earlier versionsit is. ppt)
18.6.1 The Home Tab
The Home Tab contains commands for formatting of text, selecting a new slide and for drawingof objects. The Home Tab is also used for editing the content of presentation like find andreplace, and to perform clipboard operations such as cut, copy, and paste on the presentation.Figure 18.12 shows the Home Tab.

Figure 18.12 The home tab
There are six groups within this tab, namely, Clipboard, Slides, Font, Paragraph, Drawing, andEditing.
The Clipboard group contains commands to cut, copy, and paste text. The Format Painter is alsopresent here. The Clipboard commands are used in the same manner as one uses the MS-WordClipboard commands.
Slides group allows to select a theme and layout for a slide, reset a slide or delete a slide. Font group commands allows change of the Font—font face, style, size, effects (Strikethrough,
Shadow etc.), color, and character spacing. These options can be changed, before or after typingthe text. If case of after, select the text first.
Paragraph group is used to change paragraph setting—alignment, indents, spacing, andpagination like Spacing 1.5, Double Spacing, Indentation, and, Spacing Before and After aHeading. Move the cursor to a line which needs to be changed.
The Drawing group allows the quick selection from the in-built shapes, arranging the order andgrouping the objects, filling, outlining, and adding effects to the shape.
Editing group contains commands to select, and, find and replace text.
Table 18.2 gives the commands in the different groups (in left to right order) of the Home Tabalong with a brief explanation.
To apply formatting to an already written text, first select the text and then apply the formatting.
Home TabGroups
Description
Clipboard
• Paste the cut or copied information in Clipboard at the location where cursor is pointingright now (Paste Special—To paste in a particular format. Paste as Hyperlink—Used withcopy to paste the copied information as a hyperlink. Duplicate—To duplicate a slide)Clipboard.• Cut removes the selected text from the presentation and puts into Clipboard for laterretrieval.• Copy copies the selected item or text and puts it on the Clipboard.• Format painter copies formatting from one place and apply to another (To apply sameformatting to many places, double-click the format painter button)

Slides
• Add a new slide to the Presentation.• Change the layout of the selected slide.• Reset the position, size and setting of the slide to default values.• Delete the selected slide from the presentation.
Font
• Change Font face, change font size.• Increase Font size, Decrease Font size.• Clear formatting (Clear all formatting from selection, leave only plain text).• Bold, Italics, Underline.• Strikethrough (draw a line through middle of selected text).• Shadow adds a shadow behind the selected text.• Adjust the spacing between characters.• Change case. Changes the case — sentence, lower, upper, title, or toggle.• Select the text and click on an option.• Change the Font color.
Paragraph
• Bullets (choose from different styles).• Numbered list (choose different formats).• Increase or decrease indent of the paragraph.• Change spacing between lines.• Change the direction of text to vertical, stacked or rotate the text.• Align the text—change how the text is aligned within the text box.• Align text left, right, centre, margins.• Split text into two or more columns.• Convert text into Smart Art graphics.
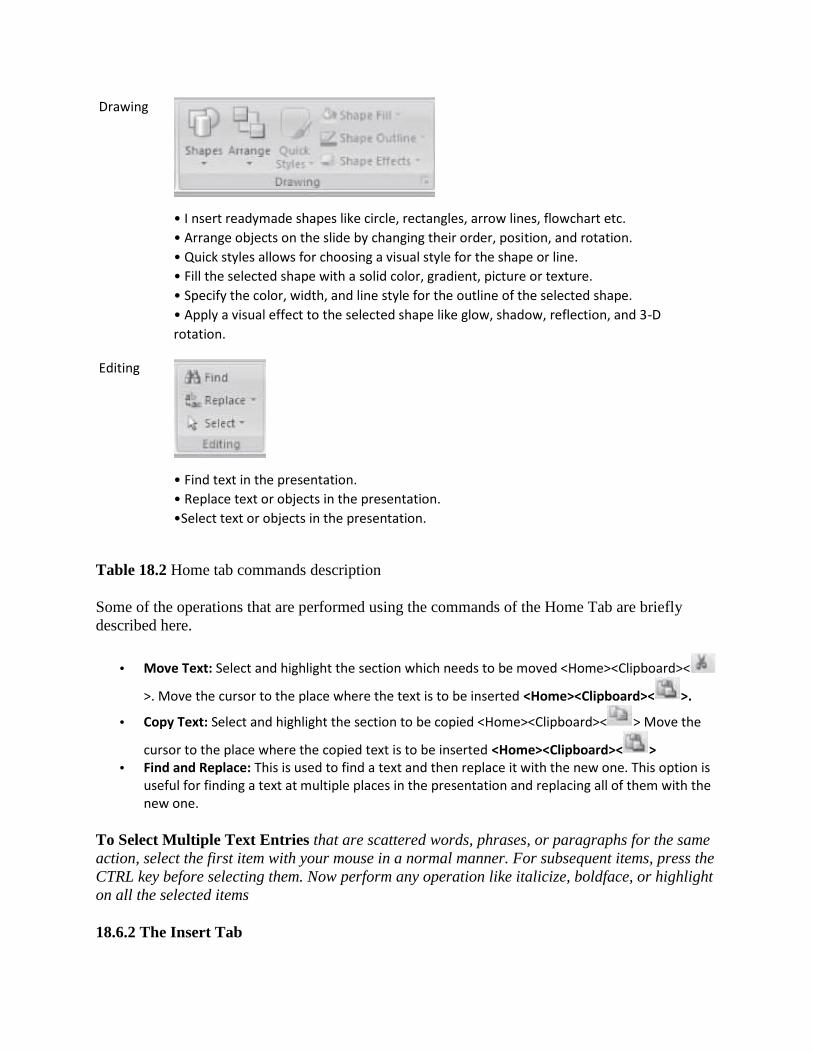
Drawing
• I nsert readymade shapes like circle, rectangles, arrow lines, flowchart etc.• Arrange objects on the slide by changing their order, position, and rotation.• Quick styles allows for choosing a visual style for the shape or line.• Fill the selected shape with a solid color, gradient, picture or texture.• Specify the color, width, and line style for the outline of the selected shape.• Apply a visual effect to the selected shape like glow, shadow, reflection, and 3-Drotation.
Editing
• Find text in the presentation.• Replace text or objects in the presentation.•Select text or objects in the presentation.
Table 18.2 Home tab commands description
Some of the operations that are performed using the commands of the Home Tab are brieflydescribed here.
Move Text: Select and highlight the section which needs to be moved <Home><Clipboard><
>. Move the cursor to the place where the text is to be inserted <Home><Clipboard>< >.
Copy Text: Select and highlight the section to be copied <Home><Clipboard>< > Move the
cursor to the place where the copied text is to be inserted <Home><Clipboard>< > Find and Replace: This is used to find a text and then replace it with the new one. This option is
useful for finding a text at multiple places in the presentation and replacing all of them with thenew one.
To Select Multiple Text Entries that are scattered words, phrases, or paragraphs for the sameaction, select the first item with your mouse in a normal manner. For subsequent items, press theCTRL key before selecting them. Now perform any operation like italicize, boldface, or highlighton all the selected items
18.6.2 The Insert Tab

The Insert Tab contains commands for inserting objects of all kinds in a presentation. Thecommands in this tab are used to add illustrations, tables, links, text, and media clips. It alsoincludes commands to add symbols, slide number, a picture, clip art, shapes, and, headers andfooters. Figure 18.13 shows the Insert Tab.
Figure 18.13 The insert tab
There are five groups within this tab, namely, Tables, Illustrations, Links, Text, and Media Clips.
Tables are used to draw and insert tables. Illustrations group allows insertion of pictures, clip art, pictures from photo album, shapes,
smart art, and charts. The Links group is used to insert a hyperlink, and to add action to an object. The Text group contains commands to insert a text box, word Art, date and time, slide number,
and, header and footer. The Media Clips group is used to insert movie from a file, and sound from a CD or clipboard.
Some of the Tabs appear only when you use them; like Picture Tools tab, Drawing Tools Tab,and Table Tools Tab
Table 18.3 gives the commands in the different groups of the Insert Tab along with a briefexplanation.
Insert TabGroups
Description
Tables
• I nsert or draw table in the slide (insert an Excel spreadsheet, insert from one of thebuilt-in tables). When a table is drawn, a Table Tool Design Tab (Figure 18.14) and TableTools Layout Tab opens, which allows you to select Table Style options, Table Styles andThe Table Borders.

illustrations
• Insert picture from a file. When a picture is inserted, a Picture Tool Format Tab opens(Figure 18.15) which contains commands to format the picture.• Insert clipart into the document (sounds, movies, drawings).• Insert a photo album. Create a new presentation based on the set of pictures. Eachpicture is placed on a new slide.• Insert readymade shapes (lines, arrows, flowchart symbols etc.) into the document.• Insert a smart art graphics.• Insert a chart (bar graph, pie chart, line Area, surface etc.).
Links
• Insert a hyperlink to a web page, a picture, an email address or a program.• Add an action to the selected object to specify the action to be taken when the mousehovers over it or when it is clicked.
Text
• Insert preformatted built-in text box or draw a text box. When a text box is inserted, aText Box Tools Format Tab opens which contains commands to format the text box.• Insert header and footer to the slide. Insert the slide number, date and time, both forthe slides and the notes.• Insert decorative text in the document.• Insert date and time into the document.• Insert slide number into the document.• I nsert symbols that are part of the keyboard into the document. When Symbol isclicked, a symbol table pops up. Select the symbol to be inserted.• Insert an embedded object.

Media Clips
• Insert movie from a file or the clip organizer• Insert sound from a file, clip organizer, a CD track or record the sound.
Table 18.3 Insert tab commands description
Figure 18.14 Table tools design tab
Figure 18.15 Picture tools format tab
When a command of the Insert tab is used, insertion takes place at the location where the cursoris present right now. So, before inserting the item, place the cursor at the location where the itemis to be inserted. While using the commands of the insert tab for insertion, most of the times, adialog box will open which allows making changes to specific settings, as per requirements. Thedialog boxes are not discussed here, as they are self-explanatory and easy to use. Some of theoperations performed using the Insert Tab commands are described below:
To create headers and footers—<Insert> <Text><Header & Footer>. A Header and Footercommand is seen. A Header and Footer tab is opened which allows to the addition of date andtime, slide number etc.
Insert Hyperlink—<Insert> <Links> <Hyperlink.> To link to another location in the samedocument, click Place in This Document option under Link to; In the dialog box’s inner window,select a heading from the document diagram. To link to another document, click the Existing Fileor Web Page option. Navigate to the proper folder and select the file’s name. It is also possibleto add a link to a newly created presentation or an e-mail address.
Insert Text: <Insert> <Text> <Text Box>. In PowerPoint, all text is contained in Text Boxes. Clickanywhere on the slide and drag corner points of the text box to change its size. Click within thebox to type text. To format the text box, select the text box. <Drawing Tools> <Format>. Format

the selected text box. To format the text in the text box; select the text. <Home> <Font><Paragraph>. Format the Font, Size, color, and style of the selected text.
18.6.3 The Design Tab
The Design Tab contains commands to apply themes, change page set up, and to adjust thebackground style. The Design Tab is shown in Figure 18.16.
Figure 18.16 The design tab
There are three groups within this tab, namely, Page Setup, Themes, and Background.
Page Setup opens a dialog box that sets up orientation of the slide, size of the slides and screensize on which the slide is to be shown.
The Themes group contains commands to select a theme, font, color and effect, for the slides. Background group allows choosing a background style for the slide.
Table 18.4 gives the commands in the different groups of the Design Tab along with a briefexplanation.
Design TabGroup
Description
Page Setup
• A Page setup dialog box opens.• Select orientation between portrait and landscape of the slide and also of the notesand handouts.• Select a size for which the slide show is meant like A3, A4, banner, overhead etc.• Select the height and width of the slides.
Themes
• Themes are used to change the overall design of the slide. You can also change thefont, theme color, and theme effect.

Background
• Choose a background style for this theme. Choose from fill effects like gradient, andpicture.• Hide the background graphics of the theme.
Table 18.4 Design commands description
Some of the operations that are performed using the commands of the Design tab are brieflydescribed below.
To Change the Background: <Design> <Background><Background styles> <FormatBackground> Format Background window appears. Set the color, solid or gradient,transparency, picture/texture fill etc.
o <Close> to apply changes only to the current slide.o <Apply to All> to apply changes to all the slides.
To Change the Theme: <Design> <Themes>. To preview the different themes for the slide, movethe cursor over the theme buttons. Select a theme; the theme will apply to all the slides in thepresentation.
o <Colors> changes the color scheme of the current theme.o <Fonts> changes the font of the current theme.o <Effects> changes the effects of the current theme.
18.6.4 The Animations Tab
The Animations Tab contains commands for adding animations and transitions to the slide.Animation is the movement and sound that accompanies text or slides as they are introduced onthe screen. Using animation in the slides by displaying text at crucial moments makes goodimpact on the audience. Transitions are the effects that a presenter can add to PPT and theseeffects get displayed during the Slide Show, as the presenter moves from one slide to the next.The Animations Tab is shown in Figure 18.17.
Figure 18.17 The animations tab
There are three groups within this tab, namely, Preview, Animations, and Transition to ThisSlide.
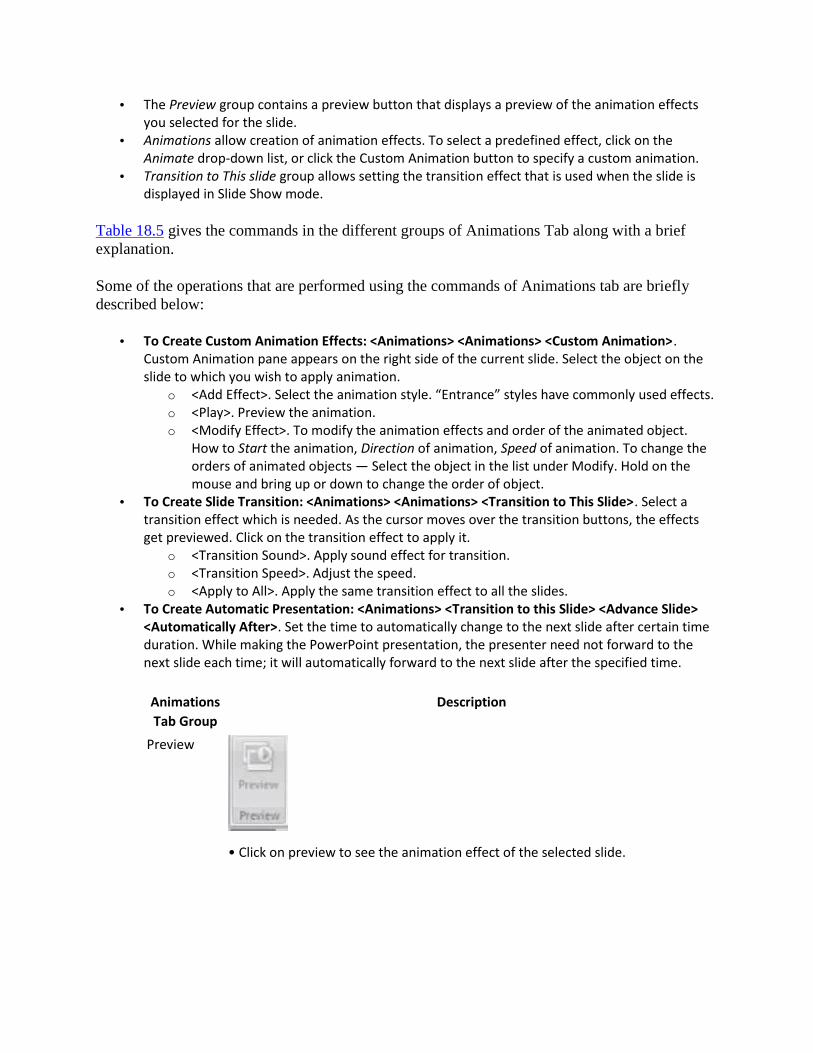
The Preview group contains a preview button that displays a preview of the animation effectsyou selected for the slide.
Animations allow creation of animation effects. To select a predefined effect, click on theAnimate drop-down list, or click the Custom Animation button to specify a custom animation.
Transition to This slide group allows setting the transition effect that is used when the slide isdisplayed in Slide Show mode.
Table 18.5 gives the commands in the different groups of Animations Tab along with a briefexplanation.
Some of the operations that are performed using the commands of Animations tab are brieflydescribed below:
To Create Custom Animation Effects: <Animations> <Animations> <Custom Animation>.Custom Animation pane appears on the right side of the current slide. Select the object on theslide to which you wish to apply animation.
o <Add Effect>. Select the animation style. “Entrance” styles have commonly used effects.o <Play>. Preview the animation.o <Modify Effect>. To modify the animation effects and order of the animated object.
How to Start the animation, Direction of animation, Speed of animation. To change theorders of animated objects — Select the object in the list under Modify. Hold on themouse and bring up or down to change the order of object.
To Create Slide Transition: <Animations> <Animations> <Transition to This Slide>. Select atransition effect which is needed. As the cursor moves over the transition buttons, the effectsget previewed. Click on the transition effect to apply it.
o <Transition Sound>. Apply sound effect for transition.o <Transition Speed>. Adjust the speed.o <Apply to All>. Apply the same transition effect to all the slides.
To Create Automatic Presentation: <Animations> <Transition to this Slide> <Advance Slide><Automatically After>. Set the time to automatically change to the next slide after certain timeduration. While making the PowerPoint presentation, the presenter need not forward to thenext slide each time; it will automatically forward to the next slide after the specified time.
AnimationsTab Group
Description
Preview
• Click on preview to see the animation effect of the selected slide.

Animations
• Animate — Choose an animation effect to apply to objects in the slide.• Custom animation opens the custom animation task pane which lets theanimation of the individual objects on the slide. Add effects like Entrance,Emphasis, Exit, Motion Paths etc, when to start the animated effect (on click etc.),and the speed of animation.
Transition toThis Slide
• Select the special effects that will apply during the transition between theprevious slide and the current slide.• Choose the transition sound, transition speed and apply it to the current slideor to all the slides.• Select On mouse click if the slide is to be advanced on a mouse click during slideshow. Select Automatically after and specify the time after which the slide shouldadvance automatically during slide show.
Table 18.5 Animations tab commands description
18.6.5 The Slide Show Tab
The Slide Show Tab contains commands that are required to setup and start the slide show. TheSlide Show Tab is shown in Figure 18.18.
Figure 18.18 The slide show tab
There are three groups within this tab, namely Start Slide Show, Set Up, and Monitors.
The Start Slide Show group contains commands to start the slide show from the start slide,current slide or to create custom shows. Custom shows allow the selection of slides from thecurrent presentation and presents only the selected slides.
Set Up is used to set up the slide show, record narration, rehearse timings etc.

The Monitors group contains commands to make the monitor settings. The monitor can bechosen or its screen resolution can be set.
The commands in the different groups of Slide Show Tab along with a brief explanation areshown in Table 18.6.
An operation performed using the Slide Show Tab commands is described below:
Slide ShowTab Group
Description
Start SlideShow
• Start the slide show from the beginning or the current slide.• Create custom shows. A Define Custom Show window appears. Select the slides to beadded to the custom show.
Set Up
• Set up the slide show. Its window (Figure 18.19) allows to make settings for the showtype the slides to show, to using timings etc.• It is possible to record the narration, rehearse the timing of presentation, hide a slideetc.
Monitors
• Make monitor settings like the resolution of the monitor,• Use presenter view to present the slide show and the speaker's view on two differentmonitors.
Table 18.6 Slide show tab commands description
Create Custom Show: <Slide Show> <Start Slide Show> <Custom Slide Show> <CustomShows>. A custom show window appears. To create a new custom show, click on New. A Define
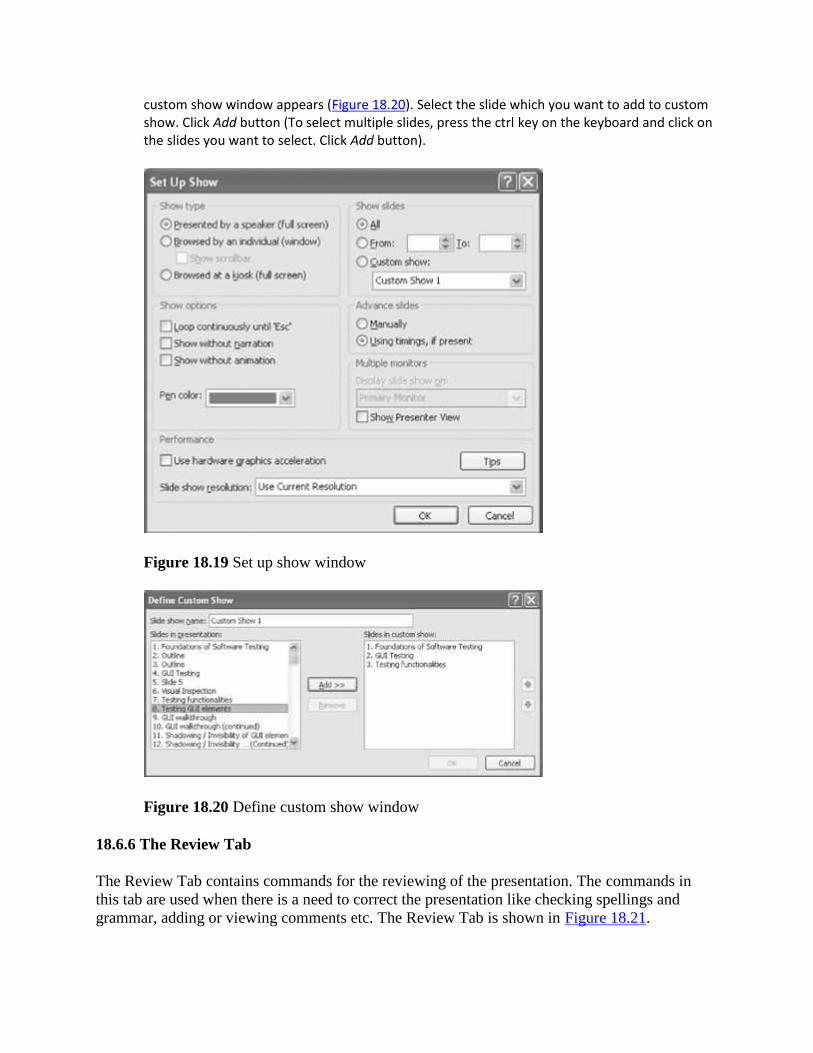
custom show window appears (Figure 18.20). Select the slide which you want to add to customshow. Click Add button (To select multiple slides, press the ctrl key on the keyboard and click onthe slides you want to select. Click Add button).
Figure 18.19 Set up show window
Figure 18.20 Define custom show window
18.6.6 The Review Tab
The Review Tab contains commands for the reviewing of the presentation. The commands inthis tab are used when there is a need to correct the presentation like checking spellings andgrammar, adding or viewing comments etc. The Review Tab is shown in Figure 18.21.

Figure 18.21 The review tab
There are three groups within this tab, namely Proofing, Comments, and Protect.
The Proofing group has commands required for the proofing of presentation like the spellingand grammar checker, research etc.
Comments group contains commands to insert comments and move back and forth among thecomments.
The Protect group contains command to protect the presentation by restricting its access.
The commands in the different groups of Review Tab along with a brief explanation are shownin Table 18.7.
Review TabGroup
Description
Proofing
• Check the spelling and grammar of text.• Open Research Task Pane and search through research material.• Thesaurus suggests word similar in meaning to the selected word.• Translate the selected text into a different language.• Set the language used to check the spelling and grammar of the selected text.
Comments
• Show al the comments and other annotations.• Add a new comment about the selection.• Edit or Delete the selected comment.

Protect
• Navigate to the previous or the next comment.• Restrict how people can access the presentation. You can allow restricted access,unrestricted access or manage the credentials of those who access your presentation.
Table 18.7 Review tab commands description
18.6.7 The View Tab
The View tab has the commands that facilitate viewing the presentation. While working with thepresentation, it is helpful to work with different views. For example, to edit the content of a slide,use the Normal view. The Outline and Slides view on the left side of the screen are not availablein the View menu, but they are two additional significant view options. The Outline viewdisplays a written outline of each slide of your presentation. The Slides tab displays the slides asthumbnails. The View Tab is shown in Figure 18.22.
Figure 18.22 The view tab
There are six groups within this tab, namely Presentation Views, Show/Hide, Zoom,Color/Grayscale, Window, and Macros.
The Presentation Views group has commands to view the presentation in different modes likenormal, slide sorter, notes page, and slide show. It is also possible to view master slide, handoutmaster, and notes master.
The Show/Hide group contains commands to show or hide the ruler, gridlines etc. Zoom is used to view the presentation in smaller or larger sizes. Zoom to increase the view to
200% etc or decrease it below 100%. Color/Grayscale allows viewing the presentation in color, grayscale, and, black and white color. Window group contains commands to view the windows like, arranging all open windows side-
by-side or in cascading style etc. The Macros group is used to create or view a macro.
The commands in the different groups of View Tab along with a brief explanation are shown inTable 18.8.

Some of the operations performed using the View Tab commands are described below:
Change the Order of the Slides: Order of the slides can be changed in two ways:o <View> <Presentation Views> <Slide Sorter>. Simply drag the slide to the location
where it is to be placed, or,o <View> <Presentation Views> <Normal>. Select Slides tab in the left frame. Thumbnails
of the slides in the presentation can be seen. Click on a slide thumbnail and drag up anddown to change the order.
Formatting Presentation in Slide Master: The Slide Master acts as a template for the entirepresentation. Altering anything on the Slide Master will change it for all the slides in thepresentation. <View> <Presentation Views> <Slide Master>. Slide Master Tab appears on theleft-hand side of Home Tab, which provides a set of Slide Master formatting groups — EditMaster, Master Layout, Edit Theme, Background, Page Setup, and Close to go back to NormalView.
View TabGroup
Description
PresentationViews
• Normal view shows a window that splits into Slide, Notes, and the left pane Viewswhere you can choose either Thumbnails or Outline. It shows the slide as it will appearduring the presentation and also allows editing of the slide from this views.• Slide Sorter presents miniatures of each slide. It lets the wholesome picture of thepresentation to be seen. Allows to easily sort, move, add, delete slides, reorder theslides and, add transitions between them.• Notes Page displays a page layout of the notes and the slide. It allows rearrangingthe notes and comparing them to the content of your slide. Notes are not visibleduring the slide show.• Slide show shows the slides as if they were actually being presented. Slides cannotbe edited in this view.• Slide Master opens a Slide Master tab (Figure 18.23), from where the layout and thedesign of the master slide, can be changed (Figure 18.26). It allows changing theproperties of any text, bullet points, backgrounds, colors, etc. Changes on the SlideMaster will be reflected on all the slides in the PPT file.• Handout Master opens a Handout Master tab (Figure 18.24), from where the layoutand the design of the handout slide can be changed (Figure 18.27). Edit the theme,page setup, background slides per page etc. Changes on the Handout Master will bereflected on the hand outs printed for the audience.• Notes Master opens a notes master tab (Figure 18.25). It is possible to edit thetheme, page setup, background slides per page etc. for the notes (Figure 18.28).

Show/Hide
• Gridlines and rulers are used to measure and line up objects on a slide. Show or Hidethe Ruler, Gridlines d the Message bar.
Zoom
• Open Zoom dialog box to specify the zoom level such as 33%, 66%, 100%, 200% etc.• Zoom the presentation so that the slide fits the window.
Color/Grayscale
• View the presentation in full color, grayscale or black and white.
Window
• Open a new window containing a view of the current presentation.• Arrange all open presentations side-by-side on the screen.• View all the open presentations in a cascading style.• Move the splitters which separate the different sections of the windows.• Switch to a different currently open window.
Macros
• View the list of macros to run, create or delete a macro.

Table 18.8 View tab commands description
Figure 18.23 Slide master tab
Figure 18.24 Handout master tab
Figure 18.25 Notes master tab
Figure 18.26 The master title style
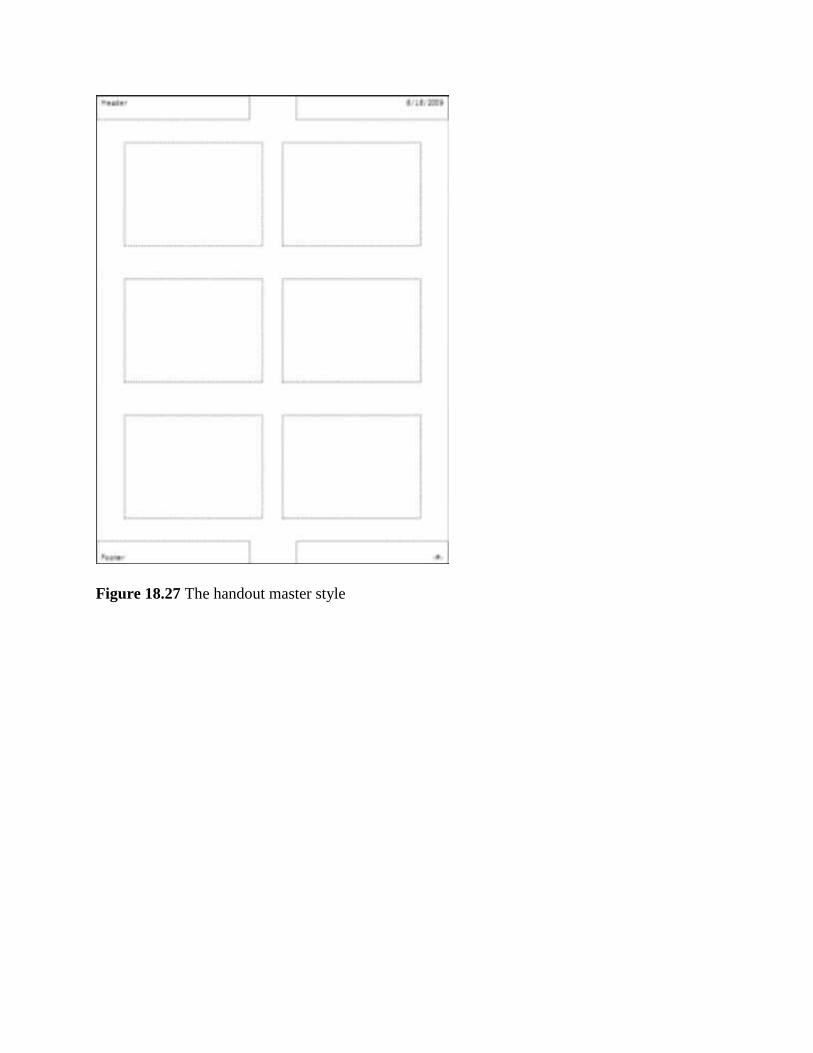
Figure 18.27 The handout master style

Figure 18.28 The notes master style
Present the Slide Show: <View> <Presentation Views> <Slide Show>. You can move to the nextslide, manually, using any of the following ways:
o Click the left mouse button.o Hit the spacebar.o Use the arrow keys on the keyboard. Up and left to go back, right and down to go
forward.o Click on the Esc key on keyboard to exit the Slide Show and go back to Normal view.
18.6.8 The Help
The Help button is located on the right most side of the Tabs in the Ribbon. Click on thisbutton to get help for using any command of the MS-PowerPoint. On clicking on the help button,

a screen as shown in Figure 18.29 appears, and the Help for any command can be browsed.Operations such as, search for a command, and view Table of Contents, can also be performed.
Figure 18.29 PowerPoint help
Many of the concepts that are used while working with MS-Office suite are common for MS-Word, MS-PowerPoint, and MS-Excel. For example, open, close, save, cutting and pasting areperformed the same way in MS Word as they are in PowerPoint. The menus are also arranged in

a similar layout. If you are not sure how to do something in PowerPoint, then try it as you woulddo in MS-Word, and it is likely to work.
18.7 AN EXAMPLE
Here we give an example to create a PowerPoint presentation.
Example 1: Create a PowerPoint Presentation.
Solution 1:
Open blank presentation. <New> <Create> Create a Master slide. <View> <Presentation Views> <Slide Master>. Select the theme, color,
fonts, effects, background styles for your slide (Figure 18.30). Insert the title and footer in theslide (if required). A set of master slides (Figure 18.31) is created (Title slide, Title and layoutslide, Blank slide etc.). It is also possible to create placeholders. Insert placeholder in the slide(Figure 18.32).
Figure 18.30 Master title slide

Figure 18.31 The set of master slides

Figure 18.32 A master slide with your custom layout
Now use the Master slides to create the presentation. <Home> <Slides> <New Slide>. Select thetitle slide. Write the content to it. The content can be text as bullet points, pictures, graphs, clipart etc. Then again add a new slide and write the content, and so on Figure 18.33, Figure 18.34and Figure 18.35).
Figure 18.33 An example of slide using the master slide
Figure 18.34 A slide made using the custom layout slide

Figure 18.35 An example of slide using master picture caption slide
EXERCISES
1. Design a birthday invitation card.2. Design a “Thank You” card.3. Design a “Seasons Greetings” card.4. Design a “Birthday Invitation” card.5. Design a “Get Well Soon” card.6. Design a “Happy Birthday” card.7. Design a Magazine cover. Use the following: (1) Select a theme for the page, (2) Insert either a
picture or clipart, and (3) Use WordArt.8. Design a poster inviting all students of your college to the Computer Festival.9. Design a certificate that you receive at the end of the Semester for holding a position in the
Computer Society.10. Create a 5-slide presentation on any topic. Use Images, Graphs, Chart, Tables, Animation, Time,
Bullets, Transition, Sound, Hyperlink, Background template, Header and Footer.11. View multiple presentations.
The above questions can be made specific by including one or more of the followingoptions from the Home Tab
1. Text Font, Style (Bold, Italic), Size, Color2. Font effects (Superscript, Subscript, Shadow etc.)3. Alignment of text — left, right, center, justify4. Bullets, Numbering5. Paragraph effects — line spacing, spaces before and after a paragraph.6. Change case — sentence, upper case, lower case, title case, toggle case.7. Change slide design

8. Background effects — Fill gradient, texture, pattern, picture in the background of slides,or color of the background
9. Rotate the slide content. Change height and width.10. Fill color and set transparency margin.11. Change the design of arrows.
The above questions can be made specific by including one or more of thefollowing options from the Insert Tab:
12. Insert Date and Time in slide.13. Insert Slide number in slide.14. Insert Footer in slide.15. Insert Date and Time, Slide number and Footer on Notes and Handouts.16. Insert a new slide.17. Insert a Duplicate slide.18. Insert Symbols like £ Ω ⅔ © ™.19. Insert a Picture from File, ClipArt, WordArt, scanner or camera, auto shapes,
organization chart etc.20. Insert a diagram, a chart and an object.21. Insert movies and sounds, sound from clip organizer file, play Audio CD track, record
sound, movie from clip organizer, movie from file.22. Insert a Table. w. Insert a hyperlink.23. Insert Lines, Curves, and Shapes — draw and format lines, draw a rectangle, ellipse,
freeform lines.
The above questions can be made specific by including one or more of thefollowing options from the Review Tab:
24. Use Spelling and Grammar to check the presentation for spellings.25. Convert the slide into Arabic.
The above questions can be made specific by including one or more of thefollowing options from the Slide Show Tab:
26. View Show.27. Set up slide show — advance slide timings, show a few slides only, show without
animation etc.28. Rehearse the timing of slide show.29. Record your narration.30. Insert Action buttons in slide show — buttons for home, help, information, backward,
forward, beginning, end, return, document, sound, movie.

31. Make action settings for the action buttons you have inserted. Action settings for mouseclick and mouse over that button.
32. Add Custom Animation.33. Add Slide Transition.34. Hide a Slide.35. Make Custom shows.36. Insert Sound, Transition Effects, Embed Video.
19
MS-ACCESS 2007
Contents
Introduction Database terminology—Data, table, field, record, primary, relational database Start MS-Access MS-Access screen and its components— Office logo button, quick access toolbar, ribbon, tabs,
groups, icons, navigation pane, navigation buttons, object tabs, view buttons The office button—New, open, save, save as, print, manage, e-mail, publish, close database The ribbon—Home, create, external data, database tools, add-Ins
o Home tab—Views, clipboard, font, rich text, records, sort and filter, findo Create tab—Tables, forms, report, othero External data tab—Import, export, collect data, sharepoint listso Database tools tab—Macro, show/hide, analyze, move data, database tools
The help Solved example—Company relational database schema and queries
Why this chapter
Reservation of railway tickets, account details of customers of a bank, schedule of trains aresome of the common applications that use computerized databases. A database managementsystem is required to store, access, manipulate and manage data in the database. MS-Access iscommonly used relational database management system. The purpose of this chapter is tointroduce you to MS-Access.
19.1 INTRODUCTION
A database is a collection of logically-related and similar data. Database stores similar kind ofdata, for a specific purpose that is organized in such a manner that any information can bederived from it, when needed. The database is accessed for the retrieval, insertion, deletion, orupdating of data. Database Management System (DBMS) is a software system for creating,organizing, and managing the database. DBMS provides an environment to the user to performoperations on the database for creation, insertion, deletion, updating, and retrieval of data.

Some of the common used DBMSs are—Oracle, IBM’s DB2, Microsoft’s SQL Server, andInformix. Some of the desktop based DBMSs are—Microsoft Access, Microsoft FoxPro, andBorland dBase. MySQL is a popular open source DBMS.
Microsoft Access is an application which allows the creation of databases for the MicrosoftWindows family of operating systems. Microsoft Access is a Relational Database ManagementSystem (RDBMS). It can also be used as a database server for a web-based application. It issupported by the ODBC and the .NET Framework.
Access is a tool for managing the databases. Database can store any kind of data—numbers,pages of text, and pictures. Databases can also handle wide range of data size—from a fewhundreds to many millions. Access allows you to design and create complete databases withquick and easy data entry, maintain them, and search for information.
Within Access there are four major areas—Tables, Queries, Forms, and Reports.
Tables store the data in your database. Forms make it easy to enter data in the tables. Data can be entered directly into a table or into a
form (an interface for adding and editing data) which then places it into a table. Queries get information from the data stored in the tables. Filters and queries can be used to
search a database. Reports allow printing of data, based on queries or tables created by the user. Reports enable
the user to analyze the results of a search in a printed format.
Some of the important features of MS-Access are as follows:
You can create tables and manage the tables. The data entry forms can be created easily. It allows building queries to analyze the data. Design reports to present the data. It allows filtering the data based on the text, numbers and date, and also sort the data. Attach files to the database. Access provides rich text support like bold etc. to the data stored in the tables. Access supports grouping of information in the reports like subtotals, count etc.
This chapter discusses the using of MS-Access software in detail. There are many versions of theMS-Access software. Here, we will discuss MS-Access 2007 version.
In this chapter, the following terminology is used while working with the mouse:
Pointer—a mouse pointer Click—press left button of mouse once Double Click—press left button of mouse twice Select—move the pointer of mouse and keep the left button of the mouse pressed over the
area that you want to select. The selected area will appear in a dark background.
Quick Menu—Right click (press right button of mouse once) to get a quick menu
The command enclosed in braces <Command> represents the command to be clicked.
19.2 DATABASE TERMINOLOGY
The database terminology required for the use of MS-Access is described as follows:
Data elements or data—a basic unit of information, e.g. “Ashima”, 16, 100 etc. Table—a matrix of rows and columns. Field—a data category, e.g. name, age, marks. Fields make up the columns of a table. Record—information about a person or objects. Records make up the rows of a table Primary key—a field that uniquely identifies a record in the table. A student registration number
is a primary key as it is unique to each student. A surname as primary key is impractical, as theremay be many people with the same surname, and the primary key will not be unique.
Relational database—The relational database may contain a single table stored as file, or, acollection of related tables stored together. The data elements are stored in different tablesmade up of rows and columns. The different tables are related through the use of common dataelements. Storing of data in multiple tables allows you to store a wider range of data and offergreater flexibility in retrieving the information.
19.3 START MS-ACCESS
Figure 19.1 MS-Access icon
MS-Access software for the Windows operating system is installed on the computer. MS-Accessis a fully menu-driven software, and the commands are available as icons in various Tabs andGroups. Using a mouse makes working on MS-Access simpler, although one can work to someextent through the keyboard also.
To start using the MS-Access software, any one of the following steps need to be performed:
If a shortcut key to MS-Access is available as an icon on the Desktop, as shown in Figure 19.1,then double-click the icon.
<Start> <All Programs> <Microsoft Office> <Microsoft Office Access 2007>. (Figure 19.2)

Figure 19.2 Start MS-Access
19.4 MS-ACCESS SCREEN AND ITS COMPONENTS
The user interface of MS-Access makes it easy for you to work in Access 2007. In contrast to theprevious versions of MS-Access, the new user interface has an improved navigation systemconsisting of tabs which further consist of group of commands.
When Microsoft Access 2007 is started, the screen Getting Started with Microsoft Office Accessscreen (Figure 19.3) comes up.
Click <Blank database> <Create>
Enter the name of the database, and browse to the location where the database is to be stored onthe disk.

Figure 19.3 Getting started with Microsoft Office Access screen
Now, the MS-Access 2007 screen (Figure 19.4) comes up. This window consists of a number ofcomponents to make working in Access easier and more efficient. Some of the componentsare—Navigation Pane, Access work area, View Buttons, and Ribbon. On the MS-Access screen,some of the features like the Office Logo button, Quick Access Toolbar and Ribbon are commonto all Microsoft Office programs like MS-Word, MS-Excel, and MS-PowerPoint. The orientationof the Access 2007 layout and its general features are described as follow:
The Office Logo Button at the top left corner contains commands for the document suchas, New, Open, Save, Save As, Print, and Close. This button also has a list of the recentdocuments. Some of these commands include an expandable menu to provide additionaloptions.
The Quick Access Toolbar is to the right of the Office Logo
button. It contains shortcuts for the commonly used commands, like, Save Undo
(reverses the last change), and Repeat (repeats the last action). The icons for the commands
that you want to get displayed on the toolbar can be selected from the Customize QuickAccess Toolbar.
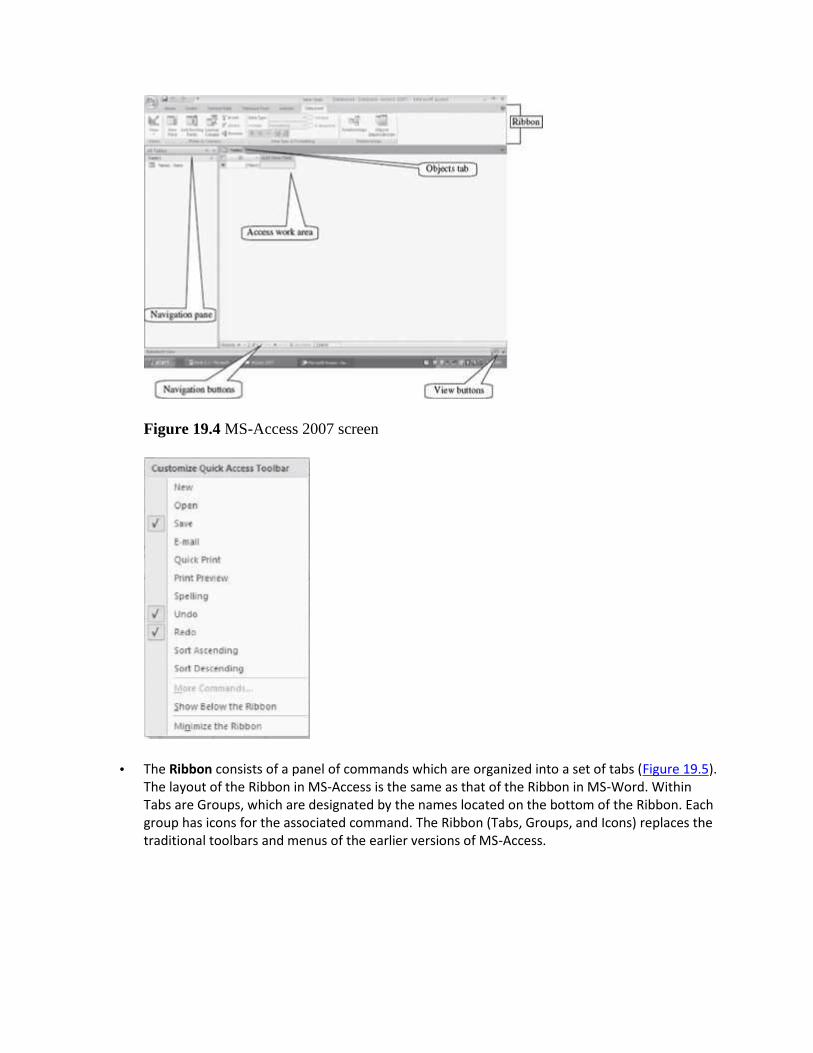
Figure 19.4 MS-Access 2007 screen
The Ribbon consists of a panel of commands which are organized into a set of tabs (Figure 19.5).The layout of the Ribbon in MS-Access is the same as that of the Ribbon in MS-Word. WithinTabs are Groups, which are designated by the names located on the bottom of the Ribbon. Eachgroup has icons for the associated command. The Ribbon (Tabs, Groups, and Icons) replaces thetraditional toolbars and menus of the earlier versions of MS-Access.

Figure 19.5 The ribbon
The Tabs (Home, Create etc.) on the Ribbon contain the commands needed to insert data,create tables, forms, reports etc. as well as the additional commands that be may needed.
Each Tab consists of different Groups, like the Home tab has seven groups namely, Views,Clipboard, Font, Rich Text, Records, Sort & Filter, and Find.
Each group has icons for the commands. To know the function of an icon (or command), leavethe pointer on a button for a few seconds, the function of that icon will appear in a small box
below the pointer. For example, leaving the icon on displays “Bold (Ctrl+B)”.
Navigation Pane—The Navigation Pane shows the entries for all the tables, forms, queries andreports that are created by the user. For opening database objects, click on one of these entry inthe Navigation Pane, and the required object will open in Access work area window.
Navigation Buttons—The navigation buttons display the record number on which you arecurrently working. It has buttons which allows you to move back and forth between thedifferent records of the object. If data is entered in the search button, the cursor moves to thelocation of record where the search is true. Navigation buttons also allows the view of thefiltered records.
Object Tabs—They display the tabs for the objects that you are working with, currently. Onclicking on an object tab, the contents of the object are displayed in the Access work area.
View Buttons—They contain buttons for the different views of the object, like Datasheet view,Design view, PivotTable view, and PivotChart. Clicking on a view displays the object view in theAccess work area.

19.5 THE OFFICE BUTTON
The functionality of Office button in MS-Access is almost similar to the functionality providedin MS-Word, MS-Excel, and MS-PowerPoint software. For example, New will open a blankdocument in MS-Word, a blank workbook in MS-Excel, a blank presentation in MS-PowerPoint,and a blank database in MS-Access.
The Office Button is used to perform file management operations on the file (i.e. the database). Itcontains commands that allow the user to create a new database, open an existing database, savea database, print a database etc. The Office button contains nine commands (Figure 19.6),namely, New, Open, Save, Save As, Print, Manage, E-mail, Publish, and Close Database. Theworking of these commands is almost similar to their working in MS-Word. Here, we willdiscuss them briefly.
Figure 19.6 The Office button commands

Table 19.1 briefly describes the different commands available in the Office Button.
Office ButtonCommands
Description
New Create a new blank database that does not contain any objects. You can also select fromdifferent templates like Assets, Faculty, Issues, and Tasks.
Open Open an already existing database
Save Save a database for which a file name and location has already been specified.
Save As Use when you save the database at a different location or by a different name or with adifferent save type. Specify the filename for the database, the location where thedatabase is to be stored, and the save type of the database (table, query, form orreport). The database can also be saved as Access 2007 database, Access 2002-2003database etc.
Print Print, Quick Print, Print Preview the database. Properties like print quality, paper typeetc. and print the selected records or the entire database, can also be set. Preview tosee how the database will look after printing.
Manage View database properties, compact and repair the database and take back-up of thedatabase (Figure 19.7)
E-mail Send a copy of the database to e-mail
Publish Share the database by saving it to a document management server, package thedatabase, and apply a digital signature.
CloseDatabase
Close an open database.
Table 19.1 Office button commands description
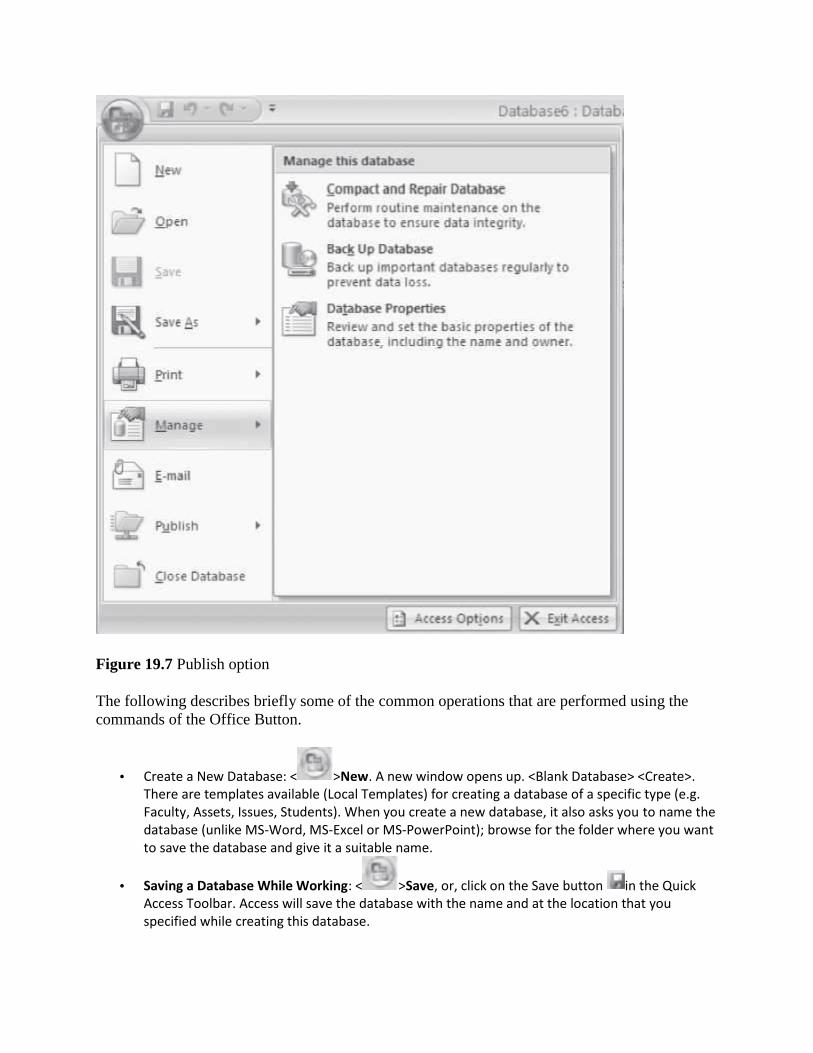
Figure 19.7 Publish option
The following describes briefly some of the common operations that are performed using thecommands of the Office Button.
Create a New Database: < >New. A new window opens up. <Blank Database> <Create>.There are templates available (Local Templates) for creating a database of a specific type (e.g.Faculty, Assets, Issues, Students). When you create a new database, it also asks you to name thedatabase (unlike MS-Word, MS-Excel or MS-PowerPoint); browse for the folder where you wantto save the database and give it a suitable name.
Saving a Database While Working: < >Save, or, click on the Save button in the QuickAccess Toolbar. Access will save the database with the name and at the location that youspecified while creating this database.

Saving a Database Under a Different Name or at a Different Location: Open the database by
selecting the < > Open. Next, < > Save As A dialog box will appear. In the field next toFile name, type a name with which you want to save the database. Navigate in the top portionof the dialog box to the folder where you want to save the database (choose the appropriate
directory where you want to save the file. You can use to go up in the directory, Use tocreate a new folder). Select the Save button. You now have two copies of the database, onewith the original name, another with a new name.
To Print: < >Print. Make settings like number of copies to be printed. (Figure 19.8). Specifyif you want to print the headings on each page, print a form only or a datasheet. From the Printdialog box you can make further settings like—Print Range, where you select what you want toprint—page numbers, database, or selected records.
Figure 19.8 Print dialog box
Quick Tips — How to Learn MS-Access
When working with MS-Access, all you need to know is the following:
What a command does When you want to perform a particular action, which command to use How to use a command
Here I describe how you can go about learning MS-Access.
1. What a command does—When you keep your mouse pointer over a command or icon,the function of the command or icon is displayed in a text box. So you can know what acommand does by moving the mouse over the command.
2. Which command to use—

1. To search for a command, first see which tab might have the command. For example, ifyou want to do any formatting, click the Home Tab; to create a form, table or reportclick the Create tab; to import or export a data, click the External Tools tab.
2. You will be able to find the group and command you want, most of the time. Thecommands that have similar uses are grouped together in the same group in Access2007.
3. Once you are able to find the command, then you should know how to use the command.1. For most of the commands, first you place the cursor in the database at the position
where the action is to happen, or, you select the object on which you want the action tohappen (for example formatting commands). Next, you click on the command. Thecommand gets executed.
2. In some commands, there is a set of steps to use the command.
19.6 THE RIBBON
Like the other programs in the Office 2007 suite, MS-Access 2007 has a ribbon. The Ribbon ofMS-Access has the Office button and five Tabs, namely, Home, Create, External Data, DatabaseTools and Add-Ins. Each tab further consists of the groups, and the groups contain icons. Iconsare a pictorial representation for a command. The tabs in the Ribbon are self-explanatory; forexample, if you want to create a form, click on the Create tab. The groups and icons related toCreate are displayed on the screen. Select the appropriate command. The different tabs in MS-Access and the groups within them are as follows:
Home: Views, Clipboard, Font, Rich Text, Records, Sort & Filter, Find Create: Tables, Forms, Reports, Other External Data: Import, Export, Collect Data, SharePoint Lists Database Tools: Macro, Show/Hide, Analyze, Move Data, Database Tools
The Add-Ins tab contains supplemental functionality that adds custom commands andspecialized features to MS-Access.
The commands in the Ribbon have various symbols associated with them, as shown in Figure19.9. These symbols are interpreted as follows—
Simple Command—The command start executing when it is clicked.
Command Followed by Arrow—Clicking on the arrow displays more options for thecommand.
Selecting a command
Ways to select acommand
Using a command

Click on a Tab + Clickon a Icon
Click on any of the Tabs like Home, Create etc. From the displayed icons,click on the icon you want to use.
Shortcut key Ctrl +letter
Some commands have shortcuts where you can press the Ctrl key and acertain letter. Some commonly used shortcuts are-
• Paste: CTRL + V• Copy: CTRL + C• Undo: CTRL + Z• New document: CTRL + N• Open document: CTRL + O• Print document: CTRL + P
Figure 19.9 Command symbols
Faded Command—A faded command means that it is not available currently.
Group Dialog Box—Clicking on this symbol displays the dialog box for the group.
The following sub-sections describe the different tabs in detail.
Working with MS-Access 2007
Mini Toolbar is a floating toolbar that pops up whenever you right-click on a text. It provideseasy access to the most commonly used commands such as Cut, Copy, Paste, Sort, and Filter.
File Format for the databases created in Access 2007 is .accdb. (For earlier versions it is .mdb)
19.6.1 The Home Tab
The Home Tab contains commands that are frequently used in an Access database. It containscommands for the formatting of text, text alignment, and performing operations on the records.The Home Tab is also used to change the views while working with tables. It is also possible toedit contents of the database like, sort and filter, find and select, and, to perform clipboardoperations such as cut, copy, and paste, using the commands available in the Home tab. Figure19.10 shows the Home Tab.

Figure 19.10 The home Tab
There are seven groups within this tab, namely, Views, Clipboard, Font, Rich Text, Records,Sort & Filter, and Find.
View group allows you to select from the four views when working with the table. The Clipboard group contains the cut, copy and paste commands. The Format Painter is also
present here. The Clipboard commands are used in the same manner as you use the MS-WordClipboard commands.
Font group commands allow change of the font face, style, size, and color. These options can bechanged before or after you start typing of the text. If you use it after you have typed in the text,select the text first.
Rich Text group is used to insert bullets or the numbered list, to increase or decrease the listlevel and to highlight the text color.
Records group contains commands to perform operations on the records like add a new record,save a record, delete a record, perform spell check etc.
The Sort & Filter group allows to sort the records in ascending or descending order, and to applyfilters to the records.
Find group contains commands to select, find and replace text in the document.
Table 19.2 gives the commands in the different groups (in left to right order) of the Home Tabalong with a brief explanation.
Home TabGroups
Description
Views
• View as Datasheet view, Pivot Table view, Pivot Chart view and Design view. Datasheetview is the default view. It allows you to enter data into a table and lets you build the tableas you insert new information. Design view lets you define all aspects of a table before youstart using it.

Clipboard
• Paste the cut or copied items in Clipboard at the location where cursor is pointing rightnow (Paste Special — to paste in a particular format. Paste Append — to paste the copieditems at the last of existing list).• Cut removes the selected item and puts into Clipboard for later retrieval.• Copy copies the selected item and puts it on the Clipboard.• Format painter copies formatting from one place and apply it to another (To apply sameformatting to many places, double-click the format painter button).
Font
• Change Font face, change font size.• Align text left, centre or right.• Bold, Italics, Underline.• Change the Font color.• Color the background of the selected cells.• Show gridlines- horizontal, vertical, both or none.• Alternate fill the back color. In this, alternately the background is colored.
Rich Text
• Increase or decrease the indentation level.• Set the direction of text to be displayed from left to right.• Start a numbered list or a bulleted list.• Make the text look like it is marked with highlighter pen.
Records
• Refresh all records when in datasheet view or in a form.• Create a new record in data sheet view or form.

• Add the field Total Rows in the table to find the total number of records when indatasheet view.• Save the records when in datasheet view or in a form.• Perform spell check on the entries in a table. The Spelling dialog box will display when anerror is located..• Delete records from a table.• Adjust row height, column width, hide or unhide columns, freeze or unfreeze column.This button is only available in datasheet view.
Sort &Filter
• Sort in ascending or descending order.• Clear the sort order that was applied to a table with the ascending and descendingbuttons.• Apply filter. A filter menu opens. Specify the criteria for displaying records in a table.• Selection — selects records that meet specified criteria in a table field. A list of entries inthe field will display. Click the item in the list to display the records that match thatcriterion.• Advanced — opens the Advanced Filter menu; used to specify more advanced filteringoptions.• Toggle filter to display the filtered records and all the records in a table.
Find
• Find a record meeting specified criterion. The Find and Replace dialog box will displaywhere the criterion can be specified.• Replace — To locate data in a table and replace it with new data. The Find and Replacedialog box will display where the criterion can be specified.• Go to the First, Previous, Next, Last, or New record in a table.• Select the record where the insertion point is located or all records in a table.
Table 19.2 Home tab commands description
Here, some of the operations that are performed using the commands of the Home Tab aredescribed briefly:

Move Text: Select and highlight the section you want to move <Home><Clipboard> < >.
Move the cursor to the place you would like the text to be inserted. <Home><Clipboard> <>.
Copy Text: Select and highlight the section you want to copy <Home><Clipboard> < > Move
the cursor to the place you want the copied text to be inserted. <Home><Clipboard> < >. Find and Replace: This is used to find a text and then replace it with the new one. This option is
useful for finding a text at multiple places in the database and replacing all of them with the newone.
Design and Datasheet view: <Home><View>. Select from design view and datasheet view. Inthe design view (Figure 19.11), first design the structure of the table. Enter all the field names,their data types and field properties. In the datasheet view (Figure 19.12), enter the field namesand also type-in the data.
Figure 19.11 Design view
Figure 19.12 Datasheet view
Apply Filter: <Home><Sort & Filter> <Selection>. Select from columns in the datasheet onwhich the filter needs to be applied. From the <Selection> select criteria for the filter. Figure

19.13, shows the select criteria “Equals Ashima”. Filter symbol will be seen on the column onwhich the filter has been applied.
Figure 19.13 Apply filter
19.6.2 The Create Tab
The Create Tab contains commands for inserting different kinds of database objects. Thecommands in this tab are used to add tables that store data, queries that search it, forms that helpedit it, and reports that help print it. Figure 19.14 shows the Create Tab.
Figure 19.14 The create tab
There are four groups within this tab, namely, Tables, Forms, Report, and Other.
Tables allow creation of a new table in Design view, using a table template, and creation ofShare-Point lists.
Forms group allows working with forms like create a form, split a form, and design a form. The Reports group allows working with reports like create a blank report and customized report,
and to create a report in the design view. The Other group is used to create macros, launch the query wizard and create query in the
design view.
Some of the Tabs appear only when you use them; like Table Tools tab, Report Layout ToolsTab, and Form layout Tools Tab
Table 19.3 gives commands in the different groups of Create Tab along with a brief explanation.Some of the tool tabs that appear when a tool is used are shown from Figure 19.15 to Figure19.18.
Create TabGroups
Description
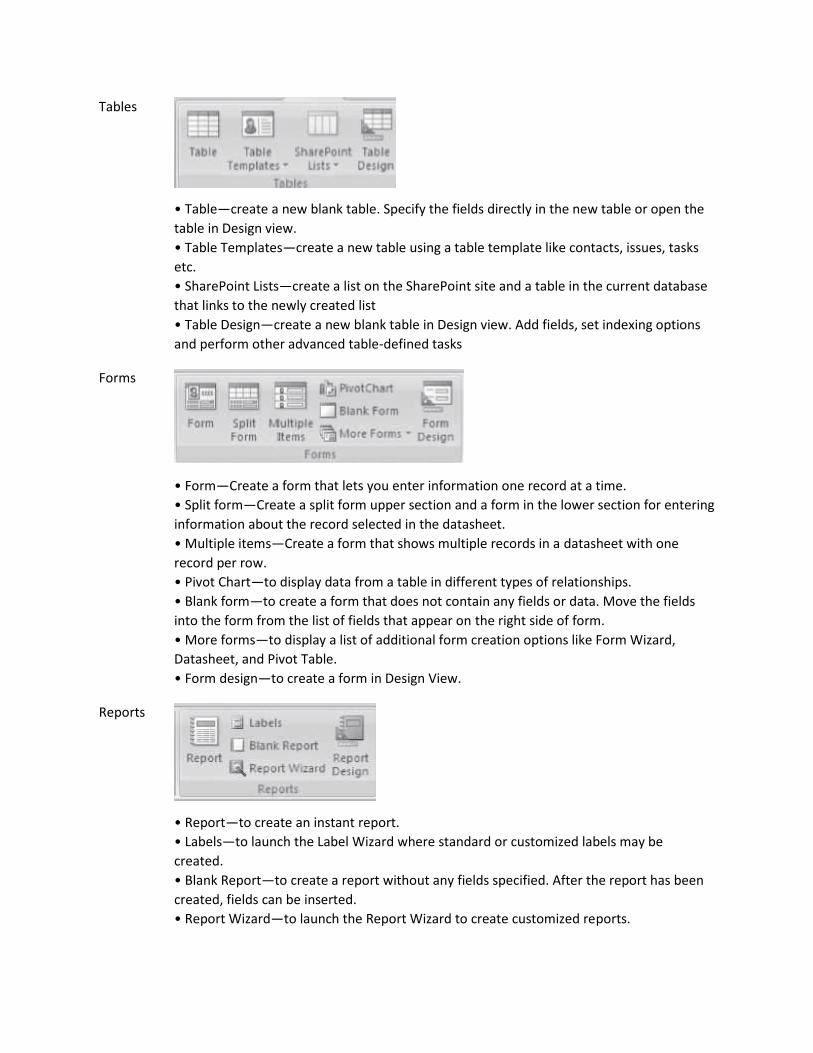
Tables
• Table—create a new blank table. Specify the fields directly in the new table or open thetable in Design view.• Table Templates—create a new table using a table template like contacts, issues, tasksetc.• SharePoint Lists—create a list on the SharePoint site and a table in the current databasethat links to the newly created list• Table Design—create a new blank table in Design view. Add fields, set indexing optionsand perform other advanced table-defined tasks
Forms
• Form—Create a form that lets you enter information one record at a time.• Split form—Create a split form upper section and a form in the lower section for enteringinformation about the record selected in the datasheet.• Multiple items—Create a form that shows multiple records in a datasheet with onerecord per row.• Pivot Chart—to display data from a table in different types of relationships.• Blank form—to create a form that does not contain any fields or data. Move the fieldsinto the form from the list of fields that appear on the right side of form.• More forms—to display a list of additional form creation options like Form Wizard,Datasheet, and Pivot Table.• Form design—to create a form in Design View.
Reports
• Report—to create an instant report.• Labels—to launch the Label Wizard where standard or customized labels may becreated.• Blank Report—to create a report without any fields specified. After the report has beencreated, fields can be inserted.• Report Wizard—to launch the Report Wizard to create customized reports.

• Report Design—to create a report in Design View. Advanced design changes can bemade to the report.
Other
• Query Wizard—to create a simple query, crosstabs query, find duplicates query, or findunmatched query.• Query Design—to create a new blank query. The Show Table dialog box appears. Select atable for creating query.• Macro—to insert macros into the database.
Table 19.3 Create tab commands description
Figure 19.15 Table tools datasheet tab
Figure 19.16 Form layout tools format tab
Figure 19.17 Report layout tools format tab

Figure 19.18 Query tools design tab
Some of the operations using the Create Tab commands are described below:
Create Table in Datasheet View: <Create><Tables><Table>. A blank table is created. Add fieldnames and their types. <Table Tools datasheet>. Click on a field in the table. <Fields andColumns> <Rename> to enter name of the field. Press Enter key. Add all field names. To changefield types - <Table Tools Datasheet> <Data Type and Formatting> <Data Type>. A drop downmenu shows the available data types. Select from it.
Create Form in Layout View: <Create><Forms><Blank Form>. Drag the fields from the right sideof the screen to the center, to be included in the form. Now, format the form. Insert title for theform - <Form Layout Tools Format> <Controls Group> <Title>. Insert Logo <Logo>. Select aformat for the form <Auto Format> <More>. To view the form - Right click the form tab <FormView>. Save the form - Right click the form tab <Save>. This is a simple form. You can use otheroptions also for further formatting of the form.
Create Report in Layout View: <Create><Report><Blank Report>. Drag the fields from the rightside of the screen to the center, to be included in the report. Now, format the report. Insert titlefor the report—<Report Layout Tools Format> <Controls Group> <Title>. Insert Logo <Logo>.Group and Sort - <Group and Sort>. Group, Sorts and Total windows will appear below theReport. Add a group, add a sort. To view the report - Right-click the report tab <Report View>.Save the report - Right-click the report tab <Save>.This is a simple report. It is possible to inserttotals, sub-totals, conditional formatting and auto format, and other options, for furtherformatting the report.
Create a Query in Design View: <Create><Other><Query Design>. A Show Table dialog boxappears. Select a table. <Add> <Close>. A Select Query design grid is displayed. It containsseveral rows like field, table, total, sort, show or criteria. On clicking on a field, a selection arrowappears. Select a field from the list that appears. To view the query - <Results> <View> <SQLview>. To run the query - <Results> <Run>.
19.6.3 The External Data Tab
The External Data Tab contains commands for importing data into Access and exporting it toother programs. The External Data Tab is shown in Figure 19.19.
Figure 19.19 The external data tab
There are four groups within this tab, namely, Import, Export, Collect Data, and SharePointLists.
The Import group allows import of data from different programs into the Access table. Export group is used to export database objects to other programs and formats. Collect Data group allows sending of forms through e-mail to different people, to collect data.

The SharePointLists group are used when SharePoint services are available.
Table 19.4 gives the commands in the different groups of the External Data Tab along with abrief explanation.
External DataTab Group
Description
Import
• Saved imports—to view and run an import operation that was saved previously.• Access—to import data from or link to another Access database.• Excel—To import data from or link to an Excel file.• SharePoint list—to import data from or link to a SharePoint List.• Text file—to import a text file.• XML file—to import an XML file.• More—to display a list of additional formats from which data may be importedfrom.
Export
• Saved Exports—to view and run an export operation that was saved previously.• Excel—to export the selected object in Access to an Excel worksheet.• SharePoint List—to export the selected object to a SharePoint list.• Word—to export the selected object to a Rich Text Format document.• Text File—to export a selected object to a text file.• More—to display a list of additional formats into which a selected object may beexported.
Collect Data

• Create e-mail—to create an e-mail message that includes a form for collectinginformation from users.• Manage Replies—to view replies to data collected in email messages and use themto update databases.
SharePoint Lists
• Work Online—to take all data offline. The data is synchronized when the computeris reconnected to the network.• Synchronize the data between the database and the SharePoint server.• Discard changes made to the database on the SharePoint Server.• Cache List Data—to cache list data on the database server.• Relink Lists—to re-link the broken link between the database server and theSharePoint server.• Move to Share Point some or all parts of a database.
Table 19.4 External Data commands description
Some of the operations that are performed using the commands of the External Data tab arebriefly described below:
To import data from Excel into a table: <Create> <Import> <External Data> <Excel>. A GetExternal Data-Excel Spreadsheet window will appear. Browse to the location from where theworksheet is to be imported. Specify where to store the data in the current database. Select<Import the source data into a new table in the current database>. Click ok. An ImportSpreadsheet Wizard appears. Follow the steps of the wizard. The spreadsheet will be importedto the table name you specify.
19.6.4 The Database Tools Tab
The Database Tools Tab has tools that help experts perform data analysis and add Visual Basiccode (a scripting language). This tab is used for the linking of tables. The Database Tools Tab isshown in Figure 19.20.
Figure 19.20 The database tools tab

There are five groups within this tab, namely, Macro, Show/Hide, Analyze, Move Data, andDatabase Tools.
Macro contains command to work with macros like run a Macro and open visual basic editor. Show/Hide allows you to show or hide the relationships, object dependencies etc. Analyze group includes commands to analyze performance of the document, table, form, report,
and query. Move Data allows to move the data to a new server and to split the database into separate files. Database Tools contains tools to encrypt the database with password etc.
Table 19.5 gives the commands in the different groups of the Database Tools Tab along with abrief explanation.
Database Tools TabGroup
Description
Macro
• Visual Basic — Launch the visual basic editor.• Run a macro, create shortcut menu from macro and convert macros to visualbasic.
Show/Hide
• Define how the data in the tables are related.• Open the object’s property sheet to set its properties.• Show the database object like query and tables that rely on other objects.• Show or hide the message bar.
Analyze

• Analyze the database documenter, analyze the performance of the table, form,query etc.
Move Data
• Migrate some parts of the database to a new or an existing SQL server database.• Split the database into two files - one containing the table and the othercontaining the forms and queries.
Database Tools
• Database tools for encrypting the database with password, switch-boardmanager etc.
Table 19.5 Database tools tab commands description
19.6.5 The Help
The Help button is located on the right most side of the Tabs in the Ribbon. Click on thisbutton to get help for using any command of the Access. On clicking on the help button, a screenas shown in Figure 19.21 appears. Browse the Help for the specific command. It also allows foroperations such as search for a command and view Table of Contents.
Many of the concepts that used while working with MS-Office suite are common for MS-Word,MS-PowerPoint, MS-Access, and MS-Excel. For example, open, close, save, cutting, and pastingare performed the same way in MS-Access as they are in MS-Word, and MS-PowerPoint. Themenus are also arranged in a similar layout. If you are not sure how to do something in Access,then try it as one would do in MS-Word or MS-PowerPoint, and it may work.

Figure 19.21 Access help
19.7 SOLVED EXAMPLE
This is an example to create a database and query it.
Example 1: Create COMPANY relational database schema, as follows:
COMPANY RELATIONAL DATABASE SCHEMA
RELATION NAME ATTRIBUTES

EMPLOYEE Fname, Minit, Lname, SSN, Bdate, Address, Sex, Salary, Superssn, Dno
DEPARTMENT Dname, Dnumber, Mgrssn, Mgrstartdate
DEPT_DLOCATION Dnumber, Dlocation
PROJECT Pname, Pnumber, Plocation, Dnum
WORKS_ON ESSN, Pno, Hours
DEPENDENT ESSN, Dependent name, Sex, Bdate, Relationship
The underlined fields are the primary key. Fill data into the table and perform the followingQueries:
1. Retrieve name of manager for each department and date on which they joined as manager.2. Retrieve the names of employees who work on all the projects that ‘John Smith’ works on.3. Retrieve for each female/male employee a list of the names of dependents.4. Retrieve department no, the no of employees in the department and their average salary for
each department managed by ‘John Smith ’.5. Retrieve for all employees their SSN and department name.6. Retrieve SSN, names, department no. of all employees whose salary is greater than the salary of
all the employees supervised by him/her.
Solution 1.
Open blank database <New> <Create>. Create tables. <Create> <Tables> <Table>. Create six tables with given fields for the relation name Employee, Department, Dept_Dlocation,
Project, Works_on, and Dependent. Fill the data into the tables. There is a relation between the table, which needs to be taken care
when filling in the data. Employee (ssn) and Department (mgrssn); Department (dnumber) andDept_Dlocation (dnumber); Project (dnum) and Department (dnumber); Project(pnumber) andWorks_on (pno); Employee (ssn) and Works_on (essn); Dependent (essn) and Employee (ssn).
Once all the tables with the data are created, design the query. <Create> <Other> <QueryDesign> <View> <SQL view>.
The tables and the SQL queries are shown below.
EMPLOYEE TABLE
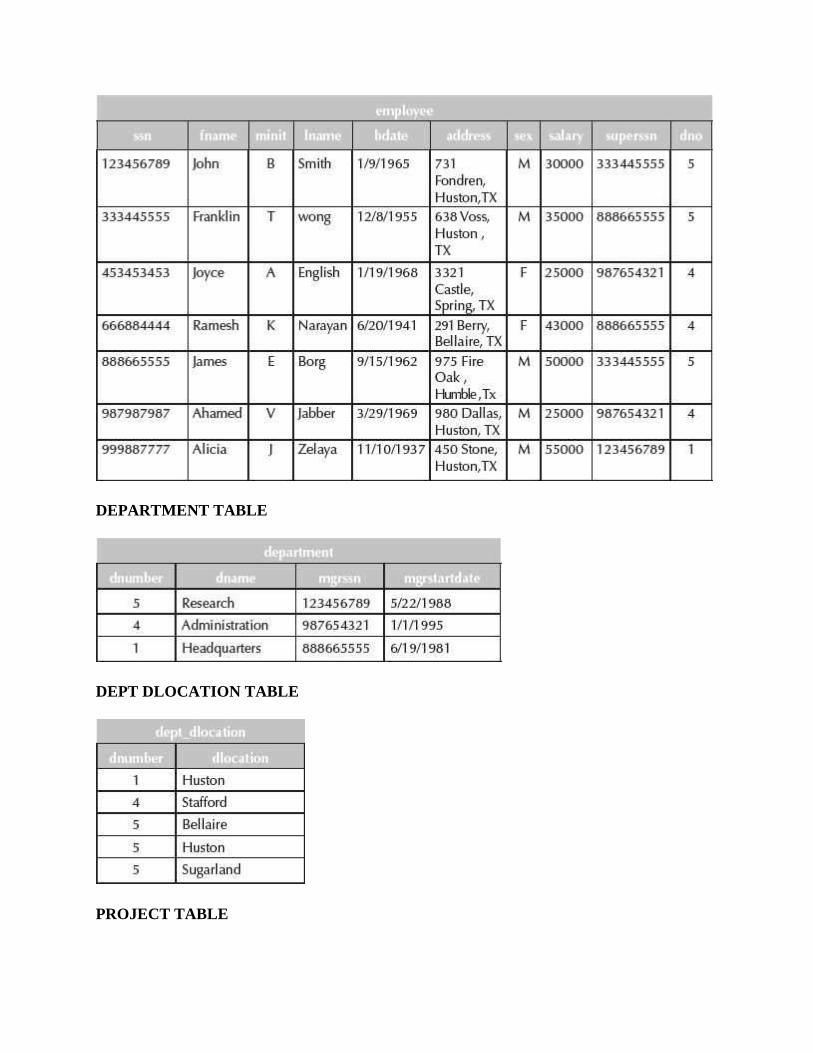
DEPARTMENT TABLE
DEPT DLOCATION TABLE
PROJECT TABLE

DEPENDENT TABLE
WORKS_ON TABLE
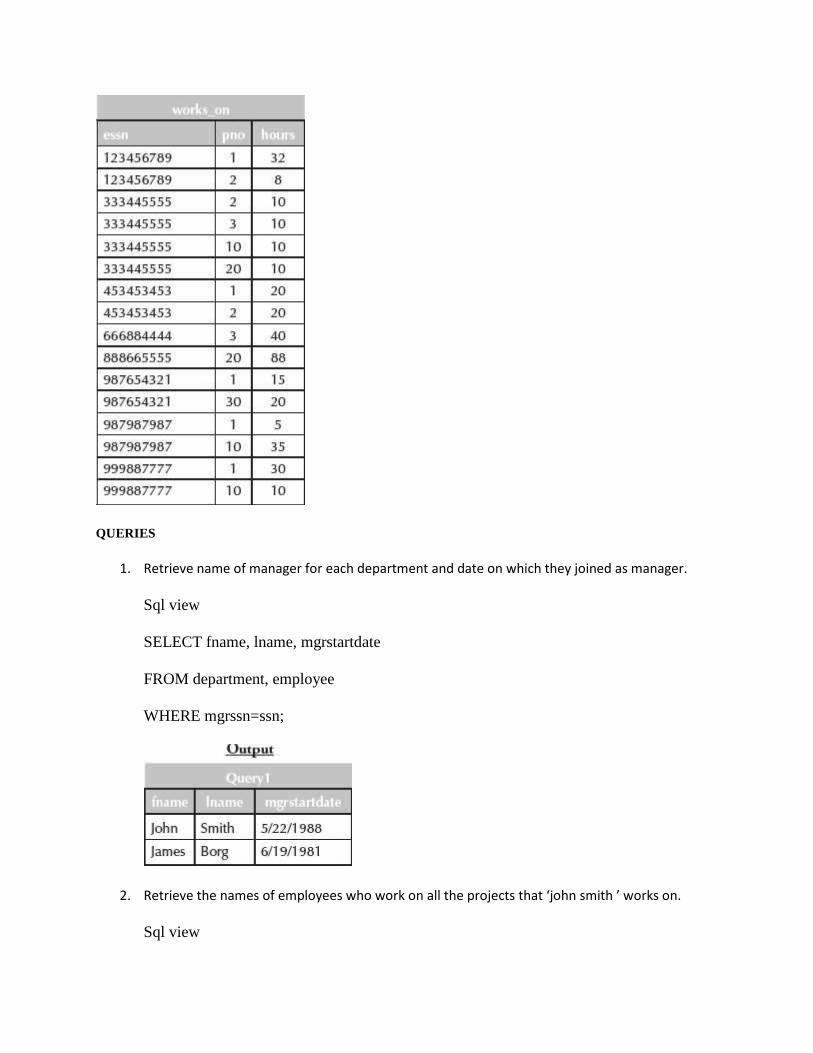
QUERIES
1. Retrieve name of manager for each department and date on which they joined as manager.
Sql view
SELECT fname, lname, mgrstartdate
FROM department, employee
WHERE mgrssn=ssn;
2. Retrieve the names of employees who work on all the projects that ‘john smith ’ works on.
Sql view

SELECT DISTINCT fname, lname
FROM employee, works_on
WHERE pno in (select pno
from works_on,employee
where fname=‘john’ and lname=‘smith’ and essn=ssn;)
and essn=ssn;
3. Retrieve for each female/male employee a list of the names of dependents.
Sql view
SELECT fname, lname,employee.sex,ssn, dependent_name
FROM employee, dependent
WHERE employee.sex=‘m’ and essn=ssn
UNION SELECT fname, lname,employee.sex,ssn, dependent_name
FROM employee, dependent
WHERE employee.sex=‘f’ and essn=ssn;

4. Retrieve department no, the no of employees in the department and their average salary foreach department managed by ‘John Smith’.
Sql view
SELECT dno, count(dno) AS no_of_employees, avg(salary) AS avg_salary
FROM employee
WHERE dno in(select dno
from department
where mgrssn=ssn and fname=‘john’ and lname=‘smith’;)
GROUP BY dno;
5. Retrieve for all employees their SSN and department name.
Sql view
SELECT ssn, dname
FROM employee, department
WHERE dno=dnumber;

6. Retrieve SSN, names, department no. of all employees whose salary is greater than the salary ofall the employees supervised by him/her.
Sql view
SELECT ssn, fname, lname, dno
FROM employee AS e1
WHERE e1.salary >
(
select max(salary)
from employee as e2 where e1.superssn=e2.ssn;
);
Exercises:
1. Create Suppliers and Parts relational database schema as follows:

RELATION NAME ATTRIBUTES
SUPPLIER SNo, Sname, Status, City
PARTS PNo, Pname, Color, Weight, city
PROJECT Ino, Jname, City
SHIPMENT Sno, Pno, Ino, Quantity
The underlined fields are the primary key. Fill in the appropriate data in the tables.Perform the following queries:-
1. Get full details of all the projects in London.2. Get supplier no. for suppliers who supply project J1.3. Get supplier details for suppliers who supply part P2.4. Get supplier names for suppliers who do not supply part P2.5. For each shipment get full shipment details, including total shipment weight.6. Get all shipments where the quantity is in the range 300 to 750 inclusive.7. Get all distinct part-color combinations.8. Get supplier no. for suppliers in Paris with status > 20.9. Get part nos. for parts that either weigh more than 16 pounds or are supplied by
supplier S2, or both.10. Get part cities that store more than five red parts.
2. Create Purchase order relational database schema, as follows:
PURCHASE ORDER RELATIONAL DATABASE SCHEMA
RELATION NAME ATTRIBUTES
VENDOR Vendorno, vname, street, city, region, zip, contact
PRICEINFO Partno, vendorno, catno, price
POHEADER Orderno, orddate, vendorno, invoiceno, status
PODETAIL Orderno, partno, qty, unit-pr
PART Partno, description
POHISTORY Orderno, orddate, vendorno, invoiceno, pototal
The underlined fields are the primary key. Fill data into the table and perform thefollowing Queries:
1. Display all the rows in the part table, sorted by description.

2. Display the part description for the part number 4.3. Select all columns of the PODETAIL table which a quantity greater than 500.4. Display all part numbers, descriptions, prices, catalogue numbers and vendor numbers
and names.5. How many vendors are located in the city of NewYork?6. Find the unit price and quantity information for order number 1101.7. Which parts are priced at the lowest price?
3. Create the following tables:
RELATION NAME ATTRIBUTES
BOOKS Book id, Book name, Author name, Publishers, Price, Type, Quantity
ISSUED Book id, qty issued
4. The underlined fields are the primary key. Fill data into the table and perform thefollowing Queries:
1. Display book name, author name and price of books of Pearson publishers.2. Display book name, author name and price of books that have been issued.3. Give the output of the following queries
1. SELECT COUNT(DISTINCT Publishers) FROM Books;2. SELECT COUNT(*) from Books;3. SELECT SUM(Price) FROM Books WHERE Quantity > 5.
5. Create Library Management relational database schema, as follows:
LIBRARY MANAGEMENT RELATIONAL DATABASE SCHEMA
RELATION NAME ATTRIBUTES
BOOK Book id, title, pub_id
BOOK_AUTHORS Book id, author name
BOOK_COPIES Book id, branch id, noof_copies
BOOK_LOANS Book id, branch id, card no, dateout, duedate
LIBRARY_BRANCH Branch id, branch_name, address
BORROWER Card no, name, address, phone
PUBLISHER Pub id, Pub_name, address, phone_no
The underlined fields are the primary key. Fill data into the table and perform thefollowing Queries:

1. Retrieve the names of all borrowers who do not have any books checked out.2. For each library branch, retrieve the branch name and the total number of books loaned
out from that branch.3. Retrieve the names, addresses, and number of books checked out for all borrowers who
have more than five books checked out.
20
NETWORK AND INTERNET CONNECTIONS
Contents
Introduction Start network connections Create a new connection—
o Connect to dial-up modem, cable or DSL modem, LAN connection, private network,existing home or small office network, DCC between two computers
o Select network connection type— Internet option, network at my workplace, home orsmall office network, advanced connection option
o Getting ready—Choose ISP, set up connection manually, use the CD I got from an ISP Manage a network connection—Disable, enable and repair a network connection, configure IP
settings Network setup Windows firewall Sharing of files Wireless network setup—Create wireless network, add a computer to an existing wireless
network Connect using virtual private network Set up a wired network Automatic wireless network connections—Configure wireless network settings, available
networks, automatically connect to non-preferred networks Set up Internet properties—Internet options Choose an Internet connection—Dial-up access, ISDN, DSL, cable modem, wireless Internet
connections, T-1 lines, Internet over satellite
Why this chapter
Internet and networking is an important part of using the computer. To connect the computer to anetwork or the Internet, using wired or wireless connection, you need to set up a connection andalso be able to manage it. In Windows XP, the Network and Internet Connections option allowsyou to do that. The purpose of this chapter is to introduce you to the Network and Internetconnections of Windows XP.
20.1 INTRODUCTION

Windows XP provides many ways using which to network or link computers at home, at officeor to the Internet. Windows XP provides easy-to-follow wizards to help create, manage, andsecure your network. You can setup five types of network connections i.e., dial-up connections,local area connections, virtual private network connections, direct connections using serial orparallel cables, and, call in to a remote access server from your home or office. It is also possibleto set up wired connections or wireless connections to connect to other computers or the Internet.Windows XP also allows setting up a Firewall that blocks access to the computer from theInternet or a network program and service that is not trusted.
In this chapter, we describe the Network and Internet Connections of Windows XP. The chapterdescribes creating and managing the network connections, setting up a wired and wirelessconnection, setting up the Firewall, and making Internet settings using the Internet options.
20.2 START NETWORK CONNECTIONS
The network connections setting in Windows XP specifies how to connect the computer to anetwork. It might also be needed to change the network settings if the Internet Service Provider(ISP) is changed.
The steps to start the network connections is as follows:
1. <Start> <Control Panel> <Pick a Category> <Network and Internet Connections> <or pick aControl Panel icon> <Network Connections> (Figure 20.1)
2. Windows XP displays the Network Connections window.
All the network connections (Figure 20.2) of the computer can be seen
Figure 20.1 Network and internet connections

In this chapter, the following terminology is used for working with the mouse
Pointer—a mouse pointer Click—press left button of mouse once Right Click—press right button of mouse once Double Click—press left button of mouse twice Select—move the pointer of mouse and keep the left button of the mouse pressed over the
area that you want to select. The selected area will appear in a dark background.
The commands are enclosed in braces <Command> to represent the command to be clicked.
Figure 20.2 Network connections
20.3 CREATE A NEW CONNECTION
To create a new connection, the New Connection Wizard has to be started. The new connectionwizard helps to create a connection to the Internet, to another computer, or to the workplacenetwork. The New Connection Wizard supports setting up the different types of networkconnections like broadband, Virtual Private Network (VPN), modem dialup, serial port, parallelport and infrared. The New Connection Wizard allows the following:

Set up a computer to connect to the Internet using a dial-up modem, a cable or DSL modem, orLAN connection. The Internet Service Provider (ISP) would have provided the settings to beincluded on the computer.
Connect the computer to a private network, such as the company network, using dial-up or VPNconnection to work from home or another location. Your company/organization must give theaccess right for the VPN.
Connect the computer to an existing home or small office network or set up a new one. Assign aunique name for your computer and type in the workgroup name correctly.
Set up a Direct Cable Connection (DCC) between two computers using serial, parallel, or infraredport.
Set up your computer for incoming connection that allows other computers on the localnetwork or on the Internet to connect to it.
To start the New Connection Wizard, do the following steps:
<Start> <Control Panel> <Network and Internet Connections> <Network Connections>. Awindow opens.
On the left side of window, on the tab Network Tasks, click <Create a new connection> (Figure20.3)
A New Connection Wizard opens. Click Next to continue. Select Network connection type. The Network Connection Type (Figure 20.4) presents three
choices for Internet and private network setup:
Figure 20.3 Create a new connection option

Figure 20.4 Network connection type
o Connect to the Internet option allows the user to choose from a list of ISPs, use a setupCD provided by the ISP, or set up a connection manually.
o Connect to the network at my workplace allows client-side setup of both dialup remoteaccess and VPN services.
o Set up a home or small office network allows sharing an Internet connection, share files,folders and printers.
o Set up an advanced connection option supports serial, parallel and infrared portnetworking setups.
Select an option. To connect to the Internet, select the Connect to the Internet option. Click Nextto continue.
The Getting Ready page (Figure 20.5) presents three choices as shown below:

Figure 20.5 Getting ready for Internet connection
o Choose from a list of Internet Service Providers option gives instructions for setting up anaccount with an ISP, then making the Internet connection through that new account.
o Set up my connection manually option sets up connections for accounts that havealready been opened with an ISP (username and password are ready for use). Connect using a dial-up modem option works for phone line Internet services. Connect using a broadband connection that requires a user name and password
(DSL or cable modem Internet services). Connect using a broadband connection that is always on (for “always on” DSL or
cable modem services)o Use the CD I got from an ISP option is used when an installation CD-ROM has been given
to you by the ISP.o Select Choose from a list of Internet Service Providers
Click Finish.
The Windows XP network connection wizard closes and a new window (Figure 20.6) opens.

Figure 20.6 Online services
The Refer me to more Internet Service Providers launches a new Internet Connection Wizard.
The Use MSN Explorer to sign upfor InternetAccess (US only) launches the MSN window.
20.4 MANAGE A NETWORK CONNECTION
Several network management tasks can be performed on a network connection. To manage anetwork connection, do as follows:
Click on the connection you want to manage. Network management task can be performed onthis connection in two ways:
1. On the left side, Network Tasks shows the list of possible tasks you can perform for thisconnection, or
2. Right-click on the network connection you want to manage. A pop-up window appears(Figure 20.7). Select the task to be performed.
Some of the network management tasks you can perform on the selected network connection areas follows:
Disable a network connection—Right-click. <Disable>. Enable a network connection—Right-click. <Enable>. Repair a network connection—Right-click. <Repair>. Configure your Internet Protocol (IP) settings—Use this option to specify the IP address and
Domain Name System (DNS) servers. Right-click a network connection. <Properties>. Generaltab. In This connection uses the following items click <Internet Protocol (TCP/IP)>. Click<Properties>. In the Internet Protocol (TCP/IP) Properties dialog box (Figure 20.8), configure thenetwork settings. Click OK. Click close to return to the Network Connections window.

Figure 20.7 Network management tasks

Figure 20.8 TCP/IP properties
20.5 NETWORK SETUP
The Network Setup wizard is used after physically connecting all computers in the network withthe necessary hardware. The Network Setup Wizard helps do the following:
Configure all computers in the network to share one Internet connection through a hub,gateway etc.
Set up Windows Firewall to protect the computer or network when it is connected to theInternet.
Enable file and printer sharing so that certain files, folders, or printers can be accessed by allcomputers in the network.
Network Setup Wizard can be used as follows:
<Start> <Control Panel> <Network and Internet Connections> <Network Setup Wizard> (Figure20.9).
Click Next. On each window that opens follow the instructions and then click on Next. Finallyyou will reach the window showing Finish. Click on Finish to complete the setup.
Figure 20.9 Network setup wizard
20.6 WINDOWS FIREWALL
Windows firewall is a protective boundary that monitors the incoming traffic from the networkand Internet. Using the firewall, guards against the intruders and unauthorized persons over the
network and the Internet. When connected to the Internet or a network, it blocks unauthorizedaccess to the computer. However, the programs and services that you trust can access yourcomputer. Windows Firewall does not provide the options to filter outgoing connections.
The Windows Firewall is turned on by default. In Windows XP, Windows Firewall is part of theWindows Security Center. Windows Security Center manages security setting of InternetOptions, Windows Automatic Updates and Windows Firewall. It constantly checks whetherWindows Firewall is on, and displays an alert message if it is turned off. Windows SecurityCenter also monitors the antivirus software to ensure that it is updated.
The Windows Firewall window can be opened in either of the following ways:
<Start> <Control Panel> <Network and Internet Connections> <Windows Firewall>, or <Start> <Control Panel> <Network and Internet Connections> <Change Windows Firewall
settings>, or <Start> <Control Panel> <Security Center> <Windows Firewall>, or <Start> <Control Panel> <Windows Firewall>, or <Start> <Connect To> <Show all connections> <Network Tasks> <Change Windows Firewall
settings>, or <Start> <All Programs> <Accessories> <Communications> <Network Connections> <Network
Tasks> <Change Windows Firewall settings>, or <My Network Places> <View network connections> <Network Tasks> <Change Windows Firewall
settings>.
The Windows Firewall is opened as follows:
<Start> <Control Panel> <Network and Internet Connections> <Windows Firewall>. Windows Firewall window opens (Figure 20.10). It has three tabs—General, Exceptions and
Advanced. You can make the Firewall settings from here.

Figure 20.10 Windows firewall
20.7 SHARING OF FILES
Windows XP allows the local sharing and network sharing of the files and folders. To share a fileor folder with other users, perform the following steps:
Right-click on the folder name you want to share. Click <Properties>. Click <Sharing>. Click on Shared Documents for the local sharing (Figure 20.11). Click on Network Setup Wizard
for the network sharing of the file or folder.

Figure 20.11 Sharing of files and folders
Sharing rights for the users can also be set. Permissions can be allowed or denied to specificusers or groups for the sharing of the folder. To share the individual files, put the files in thesame shared folder. All the files and folders in the parent shared folder will be automaticallyshared.
20.8 WIRELESS NETWORK SETUP
The Wireless Network Setup Wizard enables creation of a secure wireless network. Choose thesecurity scheme to be Wired Equivalent Privacy (WEP) or Wi-Fi Protected Access (WPA). WPAgives stronger security to your network, but make sure that the hardware (network adapter andaccess point) supports WPA.
The Wireless Network Setup Wizard can be started as follows:

<Start> <Control Panel> <Network and Internet Connections> <Wireless Network SetupWizard> The Wireless Network Setup Wizard (Figure 20.12) helps to:
Figure 20.12 Wireless network setup wizard
Create a wireless network in which a wireless access point connects all computers together. It isnecessary to assign a network name—Service Set Identifier (SSID) and a secure key with eitherWEP or WPA encryption (Figure 20.13). An SSID is the name of a wireless local area network(WLAN). All wireless devices on a WLAN must use the same SSID to communicate with eachother. The SSID on wireless clients can be set either manually, by entering the SSID into the clientnetwork settings, or automatically by leaving the SSID blank. You can save your network settingsto a Universal Serial Bus (USB) flash drive and use it for configuring the wireless access point andother computers. The USB flash drive can only be used for setting up wireless LAN devices (e.g.access point, camera and phone) that support Windows Connect Now technology (WCN). Thereis an option to print the network settings and set up the network manually.

Figure 20.13 To enter a WEP key for wireless network
Add a computer to an existing wireless network. You can use the USB flash drive to whichsettings were saved during your wireless network creation, or you can set up the networkmanually. To use the flash drive, just plug in the USB flash drive to each computer that you wantto add to the existing wireless network and confirm that the computer will be added to theexisting wireless network when prompted by the wizard. Then the computer will be configuredautomatically for joining the existing wireless network.
20.9 CONNECT USING VIRTUAL PRIVATE NETWORK (VPN)
A VPN provides remote users with secure access to the organization’s network via publicinfrastructure such as Internet. To connect to the VPN, first make the settings required to makethe connection, as follows:
<Start> <Control Panel> <Network and Internet Connections> <Network connection> <Create anew connection>. The New Connection Wizard appears. Click Next.
Select Connect to the network at my workplace. Click Next. Select Virtual Private Network connection. Click Next. In the Company Name text box, type the name given by your company for the connection. Click
Next. In the Host name or IP address text box, type the host name of our company’s computer to
which you want to connect to. Click Next. Select My use on. Click Next. Check the checkbox for Add a shortcut to this connection to my desktop. Click Finish Click Cancel to exit.

To connect to the VPN, do as follows:
From the Desktop, double click your VPN connection shortcut. A dialog box appears. Enter your user name and password. Click Connect.
20.10 SET UP A WIRED NETWORK
Wired networks offer good performance, reliability and security. Wired networks are used toconnect your desktop computer to the Internet and to other computers in your home. If you havea single computer, connecting to the Internet requires plugging a network cable into thecomputer and the modem. If there is more than one computer, connect a router between yourmodem and your computers. If the computer is in a different room from that of the router, anetwork extender can be used to connect the computer.
The steps to connect the computer to the Internet connection using a wired network are asfollows:
Use the services of an Internet service provider (ISP) to have them configure an Internetconnection to your home. Preferably, place the modem in the room with your computer.
Your computer must have a Network adapter. Shut down your computer. <Start> <Turn off Computer> <Turn Off>. Connect the network cable given to you by your ISP to your network adapter. Connect the other
end of the network cable to your modem. Start your computer and log on to Microsoft Windows. Windows automatically detects that you are connected to the Internet.
Your wired connection to the Internet is now ready for use.
20.11 AUTOMATIC WIRELESS NETWORK CONNECTIONS
Windows XP allows establishing a wireless network connection to Wi-Fi network routers andaccess points automatically. This feature helps to make wireless Internet or Wi-Fi networkconnections easily with laptop computers. The steps to be followed to establish a wirelessnetwork connection automatically are as follows:
Check whether the Windows XP computer supports automatic wireless configuration. For thisdo as follows:
o <Start> <Control Panel> <Network and Internet Connections> <Network Connections>o Right-click <Wireless Network Connection> <Properties>
In the Wireless Network Connection properties window, if you see a Wireless Networks tab, thenyou can automatically connect to wireless network connections. Click it.
To enable automatic configuration, Use Windows to configure my wireless network settingscheckbox must be checked on the Wireless Networks tab of the Wireless Network Connection

properties window (Figure 20.14). Automatic wireless network configuration will be disabled ifthis checkbox is unchecked.
Figure 20.14 Use Windows to configure wireless network
The Wireless Networks tab allows access to the set of Available networks (Figure 20.15).Available networks represent the active networks currently detected by Windows XP. To viewthe available networks, click the View Wireless Networks button on that page.
Figure 20.15 View wireless networks
You can also build a set of “Preferred networks” (Figure 20.16) when automatic wirelessconfiguration is active. This list represents a set of known Wi-Fi routers or access points youwish to automatically connect to in future. The order Preferred networks are listed heredetermines the order that Windows XP will automatically attempt when seeking to make awireless connection. You can set this order to your preference.
By default, Windows XP enables automatic wireless configuration support. Also, by default,Windows XP only auto-connects to Preferred networks.
The Advanced button on the Wireless Networks tab of Wireless Network Connection propertiescontrols the default behavior of Windows XP automatic connections. The Automatically connectto non-preferred networks, allows Windows XP to auto-connect to any network on the Availablelist, not just Preferred ones. This option is disabled by default.
When the View Wireless Networks button on the Wireless Network tab is clicked, all theavailable wireless networks in range (Figure 20.17) are seen. Choose the network that you wishto connect to and click the Connect button.

Figure 20.16 Preferred networks
Figure 20.17 Choose a wireless network
If the wireless network is protected, click Change advanced settings. A Wireless NetworkProperties window opens. Click on the Wireless Networks tab. In the Preferred network, selectthe network you want to connect to. Click <Properties>. A window opens. It has three tabs—

Association, Authentication and Connection. Make the required entries in these tabs. Click<OK>.
You should now be connected to the wireless network.
20.12 SET UP INTERNET PROPERTIES—INTERNET OPTIONS
Once you are connected to the Internet, you need to use the Web Browser to access the WorldWide Web (WWW). The Internet Explorer is a Web browser software that comes bundled withthe Windows software. Internet can be accessed by clicking on the Internet Explorer icon jjA.The Internet Explorer settings can be modified using the Internet Options. Internet Optionsallows you to change the settings of Internet Explorer, but it cannot be used to change thesettings of other Web browsers.
To Open Internet Options, do as follows:
<Start> <Control Panel> <Network and Internet Connections> <Internet Options>. An Internet Properties window opens.
The Internet Properties window (Figure 20.18) has seven tabs—General, Security, Privacy,Content, Connections, Programs and Advanced. Specify the first Web page you see on startingthe browser, delete temporary Internet files stored on the computer, use Content Advisor to blockaccess to objectionable material, and specify how colors and fonts are displayed on Web pages.You can also set the security level and specify which programs to use for e-mail. In short, youcan make all the settings for the Internet browser from here.

Figure 20.18 Internet properties
20.13 CHOOSE AN INTERNET CONNECTION
With the growth of technology, the content on the Web has also changed. Now web applicationsinclude content like animations, online gaming, database-driven Web sites and e-commerce.Thus, the need for speed as to how fast we can connect to the Internet has changed.
The overall connection speeds of the different types of Internet connections are given below.There can be variations amongst different Internet Service Providers (ISP).
Dial-up access is economical but slow. Dial-up access uses normal telephone lines so the qualityof the connection is not always good. Speed is 2400 bps to 56 Kbps.
Integrated Services Digital Network (ISDN) is an international communications standard forsending voice, video, and data over telephone lines. Speed is 64 Kbps to 128 Kbps.
DSL is an always on connection. ADSL is the most commonly deployed type ofDSL. Speed is 128Kbps to 8 Mbps.
Cable modem gives you a broadband Internet connection that is designed to operate over cableTV lines. Speed 512 Kbps to 20 Mbps.

Wireless Internet Connections uses radio frequency bands. Wireless Internet provides an always-on connection which can be accessed from anywhere geographically within a network coveragearea. Their speed varies.
T-1 Lines are a leased line option for businesses connecting. T-1 Lines support speeds of 1.544Mbps.
Internet over Satellite (IoS) allows a user to access the Internet via a satellite that orbits theearth. Speed: 492 Kbps to 512 Kbps.
For home users, the ADSL connection is the best suited. It is a broadband connection, always on,not very expensive and can be used with the telephone line. It has a fairly good speed also. Youcan also connect your broadband connection to a wireless modem internally in the home, toaccess the Internet connection from any room of the house wirelessly.
21
USIG LATEX
Contents
Introduction Create LaTeX document Components of a LaTeX document LaTeX commands
o Typing LaTeX commands, page numbering and headings, creating a title page, sections,cross-references, abstracts, double spacing, hyphenation, quotation marks, changing theappearance of words, spacing between words, indenting, centering text, line breaks,mathematical formulas, greek letters, exponents and subscripts, fractions, functions,relations, spacing in math mode, constructing tables, bulleted list, numbered lists,bibliographies, graphic file formats, graphics package, including graphics
Solved example—Title for your article, a section, a bulleted list, a numbered list, a paragraph,display some mathematical formulae
Why this chapter
Nowadays, the production of long articles and books uses a document preparation system thatproduces publication-quality typeset documents. The document preparation system includesprogrammable desktop publishing features and facilities for automating cross-referencing, tables,figures, page layout, bibliography etc. LaTeX is a family of programs designed to produce highquality typeset documents. The purpose of this chapter is to introduce you to LaTeX.
21.1 INTRODUCTION

TeX is a computer program for typesetting documents, created by D. E. Knuth. Typesettinginvolves formatting of the input text. TeX is a mathematical typesetting markup language. A filecreated using TeX may be printed on different kinds of printers and high-resolution typesettingmachines. TeX is widely used by publishers to typeset books and mathematical journals.
LaTeX is a variant of TeX, written by Leslie Lamport. LaTeX is a document preparation systemand document markup language for the TeX typesetting programs. LaTeX focuses on thestructure of the document; TeX focuses on the visual typesetting details. LaTeX is a popularmethod of using TeX.
LaTeX is a family of programs designed to produce publication-quality typeset documents. It isparticularly strong when working with mathematical symbols. It is suited for the production oflong articles and books. It facilitates automatic numbering of chapters, sections, theorems,equations etc., and cross-referencing. LaTeX is widely used by academia and scientists becauseof its high-quality typesetting features achieved due to TeX. It offers programmable desktoppublishing features.
LaTeX is free software, distributed under the LaTeX Project Public License. Here, we work inthe Windows environment, while working with LaTeX.
21.2 CREATE LATEX DOCUMENT
To create a TeX document—
Create a TeX file using a text editor. Some editors are specifically created for working with LaTeXlike WinEdt.
Save the TeX file with the .tex extension. Compile and run the TeX file. If you are using a LaTeX text editor, you can use the menu
commands to run the file. For example, in WinEdt, Accessories>LaTeX, will execute the file andshow the output.
A program Yap previews and prints your LaTeX output.
21.3 COMPONENTS OF A LATEX DOCUMENT
A LaTeX document must contain the following three components:1. \documentclassarticle2. \begindocument3. \enddocument
\documentclassarticle tells LaTeX about the kind of document, as there are different style rulesfor different kinds of documents. We use the article document class. Other classes includereport, book, and letter.
The default font size for each class is 10 point. To use 11 point write, \documentclass [11pt]article. To use 12 point write
\documentclass[12pt] article. The \documentclass command must appear at the start of the LaTeX document, before any
other LaTeX commands.

The space between \documentclass and \begindocument is called the preamble. Thecommands for LaTeX that affect the whole document should be included in the preamble.
The body of the document, where all text is included, must occur between the\begindocument and \enddocument commands.
21.4 LATEX COMMANDS
Here, the common commands in LaTeX are described briefly.
Typing LaTeX Commandso Surround any text that is to be printed as it is, with a \beginverbatim and a
\endverbatim command. Page Numbering and Headings—command \pagestyle
o It should always be between \documentclassarticle and \begindocument. It can takethe following forms: \pagestyleplain is the default. It puts page number at the center of the bottom
of the page and provides no headings. \pagestyleempty provides neither page numbers nor headings. \pagestyleheadings provides page numbers and headings from any \section
that you are using. \pagestylemyheadings provides page numbers and custom headings.
o It can also be applied to a single page using \thispagestyle instead of \pagestyle. Creating a Title Page
o Insert between the \documentclass command and \begindocument command. Thecommands are: \titleyour title here \authoryour name here \datecurrent date \maketitle
o After specifying the arguments of \title, \author, and \date, use \maketitle for this partto be typeset.
o \documentclass can take titlepage option—\documentclass[titlepage]article.o By default, all entries produced by these commands are centered on the lines in which
they appear.o Choose the break points with the \\ command.o To have author names side by side, use \and command.
Sections—o \sectionsectiontitle numbers the sectionso \section*sectiontitle does not number the section.o Both create separate sections with titles in a larger font size.
Cross-References—o \labelname to label the point in the document with some mnemonico Section \refname to refer to that point. \refname will be replaced by the number of
the section containing the corresponding \label command. As with your bibliographycitations, run LaTeX twice to generate these references.
Abstracts—Place text between \beginabstract and \endabstract commands. The abstractshould come immediately after \maketitle.
Double Spacing— Put \renewcommand\baselinestretch2 in the preamble.

Hyphenation—o - (a single dash) is for hyphenating words.o -- (two dashes) is for ranges of numbers.o $-$ is a minus sign in math mode.
Quotation Marks—Beginning and ending quotation marks differ. In LaTeX, use “(on left side ofthe keyboard) to begin a quotation and ” (on right side of the keyboard) to end a quotation.
Changing the Appearance of Words—o \underlinephrase to underline a phrase,o \textbfphrase to print a phrase in boldface, ando \emphphrase to italicize a phrase.
Spacing Between Words—o One blank space is the same as thousand blank spaces.o Tabs are treated like blank spaces.o Blanks at the end of a line are ignored.o A single “Enter” is treated like a blank space.o More than one “ Enter” marks the beginning of a new paragraph.
Indenting—By default LaTeX indents new paragraphs unless the paragraph follows a sectionheading. To change the indentation, use the \indent and \noindent commands, at the beginningof the paragraph in question.
o To choose the amount of indentation, use the command \setlength\parindentsize ofindentation with unit.
o This command affects the whole document, it should go in the preamble, between the\docu-mentclass and \begindocument.
Centering Text—By default, LaTeX will start all text at the left margin. To center a title, a table,etc., surround it with the commands \begincenter and \endcenter.
Line Breaks—Use a ~ for a space that should not be used to break a line.o LaTeX inserts more space at the end of a sentence then between its words. For an
abbreviation like Dr. in the middle of a sentence, use a ~ (if the line should not bebroken there) or a \ followed by a space (if the line could be broken there).
o To force a line to break at a given point, use \\. Mathematical Formulas—There are two ways to insert mathematical formulas into the
document — (1) Formula appears in a paragraph with text — the formula will be compressedvertically, and (2) To have formula appear in a separate paragraph, where there will be morespace.
o For formulas that appear in a paragraph, surround them with $’s. For example, $\alpha$is a Greek alphabet, becomes, α is a Greek alphabet.
o To have formulas appear in their own paragraph, use matching $$ to surround them.For example,
$$
\fracx+yx−y
$$
Becomes

Greek Letters—α is \alpha, β is \beta, γ is \gamma, δ is \delta, ε is \epsilon, θ is \theta, σ is\sigma, П is \Pi. There are many more.
Exponents and Subscripts—Use the ^ character (shift-6), to create exponents. For example,$x^2$ produces x2
• Fractions can be written in two ways — with a diagonal fraction bar or a horizontal one. Forexample, $(x+y)/(x−y)$ becomes (x+y)/(x−y), and
$$
\fracx+yx−y
$$
Becomes
Functions—Use a backslash in front of function names \cos, \max, \sin, \tan, \min Relations—≤ as \le, ≥ as \ge, ≠ as \ne, || as \parallel, ≠ as \not=. There are many more. Spacing in Math Mode—Use the following to adjust the spacing that LaTeX uses in math mode.
o \, produces a small spaceo \: produces a medium spaceo \; produces a large space
Constructing Tables—Surround the entries with \begintabularjustification and \endtabularcommand. The justification should consist of l for left justification, c for centered justification, orr for right justification. Separate column entries by a &, and end each line with a \\. Use \hline toconstruct a horizontal line, and separate the l, c, and r’s by a | wherever you want a vertical line.For example:
\begintabular|r|c|l|
\hline
Right & Center & Left\\
\hline
alpha & beta & gamma\\ delta & epsilon & zeta\\ eta & theta & iota\\
\hline
\endtabular
Bulleted Lists—Surround the information with \beginitemize and \enditemize, and begineach item with an \item. For example,

\beginitemize
\item A bulleted item.
\beginitemize
\item A nested bulleted item.
\enditemize
\item Another bulleted list.
\enditemize
Numbered Lists—Surround the information with \beginenumerate and \endenumerate, andbegin each item with a \item. For example,
\beginenumerate
\item A numbered item.
\beginenumerate
\item A nested numbered item.
\endenumerate
\item Another numbered item.
\endenumerate
Bibliographies—LaTeX provides a mechanism for automatically linking citations with items inthe bibliography. Surround the bibliography with \beginthebibliography and\endthebibliography. For each entry in the bibliography, start with \bibitemlabel, where labelis some mnemonic for the reference.
o A citation in the body of the document is made with \citelabel, where label is the sameas what occurs in the \bibitemlabel.
o To keep track of new references that have been added, run LaTeX twice beforepreviewing when using \cite.
Graphic File Formats—There are a number of graphics formats out there, such as — bmp, eps,gif, jpg, pdf, ps. LaTeX works best with the postscript formats (eps, ps) which were around whenthe program was first created. For the other formats, LaTeX may or may not work. UsingPDFLaTeX will produce a PDF document.

Graphics Package—To include graphics in your document, use \usepackagegraphicx in thepreamble.
Including Graphics Within Your Document—Use the \includegraphicsgraphicfile command toinclude the graphic file in the document. To control the size of the document, specify the heightand width: \includegraphics[height=2in, width = 3in]graphicfile.
21.5 SOLVED EXAMPLES
Here some examples are given that use the various LaTeX commands.
Example 1: Create a title for your article.
Solution 1:
\documentclass [twocolumn, 11 pt] article
\title\HUGE\textbfPreparation of Papers for IEEE TRANSACTIONS and JOURNALS (May2007)
\authorFirst A. Author, Second B. Author, Jr., and Third C. Author, \textitMember, IEEE\begindocument
\maketitle
\enddocument
Output
Preparation of Papers for IEEE TRANSACTIONSand JOURNALS (May 2007)
First A. Author, Second B. Author, Jr., and Third C. Author, Member, IEEEAugust 19, 2009
Example 2: Create a section.
Solution 1:
\documentclassarticle
\begindocument
\sectionIntroduction

Hello how are you?
I am fine here. \enddocument
In the same exercise, if we use line break — \documentclassarticle
\begindocument
\sectionIntroduction
Hello how are you?\\
I am fine here.
\enddocument
Example 3: Create a bulleted list.
Solution 1:
\documentclass [twocolumn, 11 pt] article
\title\HUGE\textbfPreparation of Papers for IEEE TRANSACTIONS and JOURNALS(May2007)
\authorFirst A. Author, Second B. Author, Jr., and Third C. Author, \textitMember, IEEE\begindocument
\maketitle
\sectionIntroduction
This is a display of bulled list \beginitemize
\item Vegetables.
\beginitemize
\item Potato,
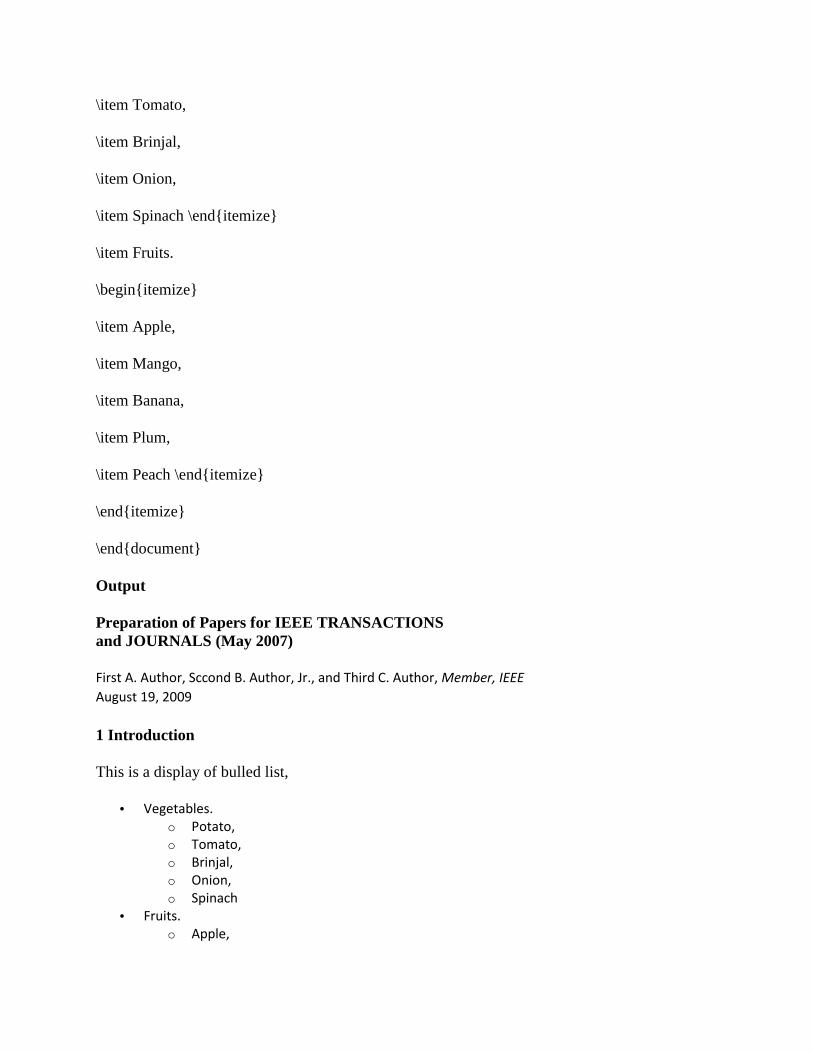
\item Tomato,
\item Brinjal,
\item Onion,
\item Spinach \enditemize
\item Fruits.
\beginitemize
\item Apple,
\item Mango,
\item Banana,
\item Plum,
\item Peach \enditemize
\enditemize
\enddocument
Output
Preparation of Papers for IEEE TRANSACTIONSand JOURNALS (May 2007)
First A. Author, Sccond B. Author, Jr., and Third C. Author, Member, IEEEAugust 19, 2009
1 Introduction
This is a display of bulled list,
Vegetables.o Potato,o Tomato,o Brinjal,o Onion,o Spinach
Fruits.o Apple,

o Mango,o Banana,o Plum,o Peach
Example 4: Create a numbered list.
Solution 1:
\documentclass article
\begindocument
\sectionIntroduction
This is a display of numbered list \beginenumerate
\item Abstract.
\item Introduction.
\item Section 1.
\beginenumerate
\item Section 1.1.
\item Section 1.2 \endenumerate
\item Section 2 \endenumerate
\enddocument
Output
Example 5: Write a paragraph, Use emphasize, bold, and bulleted list.

Solution:
\documentclass article
\begindocument
\sectionChoose an Internet Connection
With the growth of technology, the content on the Web has also changed. Now web applicationsinclude content like animations, online gaming, database-driven Web sites and e-commerce.Thus, the need for speed as to how fast we can connect to the Internet has changed.
Here, we give the overall connection speeds of the different types of Internet connections, thoughthey can vary between \textbfInternet Service Providers (ISP).
\beginitemize
\item \emph Dial-up access is economical but slow. Dial-up access uses normal telephonelines so the quality of the connection is not always good. Speed is 2400 bps to 56 Kbps.
\item \emph Integrated services digital network (ISDN) is an international communicationsstandard for sending voice, video, and data over telephone lines. Speed is 64 Kbps to 128 Kbps.
\item \emph DSL is an always on connection. ADSL is the most commonly deployed type ofDSL. Speed is 128 Kbps to 8 Mbps.
\item \emph Cable modem gives you a broadband Internet connection that is designed tooperate over cable TV lines. Speed 512 Kbps to 20 Mbps.
\item \emph Wireless Internet Connections uses radio frequency bands. Wireless Internetprovides an always-on connection which can be accessed from anywhere geographically within anetwork coverage area. Their speed varies.
\item \emph T-1 Lines are a leased line option for businesses connecting. T-1 Lines supportspeeds of 1.544 Mbps.
\item \emph Internet over Satellite (IoS) allows a user to access the Internet via a satellite thatorbits the earth. Speed: 492Kbps to 512 Kbps.
\end document
Output

Example 5: Display some mathematical formulae.
Solution:
\documentclass article
\begindocument
\sectionSome Mathematical Formulae
Area of Circle is $ \pi * r^2$\\
Area of Rectangle is $ length * breadth$\\
Area of triangle is $1/2*base*height$\\

$sin(x) + cos(x) = 1$
$$
frac210
= \frac420
= \frac840
$$
end document
Output
EXERCISES
Type in a text and perform the following operations on it.
1. Put page numbering and headings2. Create a Title Page — include title, author name and address (two authors side by side), and
date.3. Create sections both numbered and without numbers.4. Include Abstract.5. Double space the article.6. Use Hyphenation in text. (Example sister-in-law)7. Enclose a sentence in quotes.8. Use underline, boldface and italics.9. Write ten mathematical formulae.10. Construct a table with entries.11. Create a bulleted list.12. Create a numbered list.13. Add bibliography.14. Include a graphics file in the document.15. Print some part of text exactly as you have typed it.