A dynamic micro-CT scanner with a stationary mouse bed using a compact carbon nanotube field...
7
A dynamic micro-CT scanner with a stationary mouse bed using a compact carbon nanotube field emission x-ray tube Guohua Cao a , Xiomara Calderon-Colon b , Peng Wang a ∗ , Laurel Burk a , Yueh Z. Lee a,c , Ramya Rajaram b , Shabana Sultana b , David Lalush d , Jianping Lu a,b and Otto Zhou a,b,e a Department of Physics and Astronomy, University of North Carolina, Chapel Hill, NC, 27599 b Curriculum in Applied Sciences and Engineering, University of North Carolina, Chapel Hill, NC, 27599 c Department of Radiology, University of North Carolina, Chapel Hill, NC, 27599 d Department of Biomedical Engineering, North Carolina State University, Raleigh, NC 27695 e Lineberger Comprehensive Cancer Center, University of North Carolina, Chapel Hill, NC 27599 ABSTRACT In this paper we report the development of a high resolution dynamic micro-computed tomography (CT) scanner with a stationary mouse bed using a compact carbon nanotube (CNT) x-ray tube. The scanner comprises a rotating x-ray tube and detector pair and a stationary and a horizontally positioned small animal bed. The system is optimized for in vivo mouse cardiac imaging. Its performance is evaluated with CT scans of phantoms and free-breathing mice. The modulation transfer function (MTF) at 10% is 5 lp/mm. At single frame acquisition, mouse cardiac micro-CT at 20 msec temporal resolution has been demonstrated by prospectively gating the imaging acquisitions to both respiration and cardiac signals. Keywords: micro-CT, in vivo imaging, respiratory and cardiac gating, x-ray tube, carbon nanotube 1. INTRODUCTION Field emission micro-focus x-ray source based on carbon nanotubes (CNT) is a recent invention 1 that has attractive features for biomedical or clinical imaging. 2, 3 Recently we reported the development of an experimental micro-computed tomography (CT) scanner based on a CNT field emission micro-focus x-ray source. 2 Because of the electronic programming and fast switching capabilities of the CNT field emission x-ray source, the system can readily gate its imaging acquisition to non-periodic physiological signals providing high temporal and spatial resolutions in small animal imaging. The experimental system, however, uses a stationary CNT x-ray source housed in a large vacuum chamber. To collect projection images, it rotates the vertically positioned mouse samples during CT scanning. This configuration is undesirable, and in some cases, impossible for in vivo imaging of laboratory small animals where the natural position is required during imaging. In this paper, we report a new design of this micro-CT scanner with a stationary mouse bed which is made possible with the recent development of a compact CNT micro-focus x-ray tube. The performance of the dynamic micro-CT scanner was evaluated by MTF and contrast and noise analysis. Cardiac micro-CT of free-breathing mice was demonstrated with both respiratory and cardiac gating. 2. MATERIALS AND METHODS 2.1 The dynamic micro-CT scanner Figure 1 shows a picture of the micro-CT scanner. It mainly consists of a compact CNT field emission micro- focus x-ray tube developed in-house, a flat panel x-ray detector (Model C7940DK-02, Hamamatsu), a high precision goniometer (Model 430, HUBER, Germany), and a home-made mouse bed. The x-ray tube and the ∗ Present address: Xintek, Inc., 7020 Kit Creek Rd., Research Triangle Park, NC, 27709 Further author information: G. Cao: E-mail: [email protected], O. Zhou: E-mail: [email protected] Medical Imaging 2009: Physics of Medical Imaging, edited by Ehsan Samei, Jiang Hsieh, Proc. of SPIE Vol. 7258, 72585Q · © 2009 SPIE CCC code: 1605-7422/09/$18 · doi: 10.1117/12.813817 Proc. of SPIE Vol. 7258 72585Q-1
Transcript of A dynamic micro-CT scanner with a stationary mouse bed using a compact carbon nanotube field...
A dynamic micro-CT scanner with a stationary mouse bedusing a compact carbon nanotube field emission x-ray tube
Guohua Caoa, Xiomara Calderon-Colonb, Peng Wanga∗, Laurel Burka, Yueh Z. Leea,c, RamyaRajaramb, Shabana Sultanab, David Lalushd, Jianping Lua,b and Otto Zhoua,b,e
aDepartment of Physics and Astronomy, University of North Carolina, Chapel Hill, NC, 27599bCurriculum in Applied Sciences and Engineering, University of North Carolina, Chapel Hill,
NC, 27599cDepartment of Radiology, University of North Carolina, Chapel Hill, NC, 27599
dDepartment of Biomedical Engineering, North Carolina State University, Raleigh, NC 27695eLineberger Comprehensive Cancer Center, University of North Carolina, Chapel Hill, NC
27599
ABSTRACT
In this paper we report the development of a high resolution dynamic micro-computed tomography (CT) scannerwith a stationary mouse bed using a compact carbon nanotube (CNT) x-ray tube. The scanner comprises arotating x-ray tube and detector pair and a stationary and a horizontally positioned small animal bed. The systemis optimized for in vivo mouse cardiac imaging. Its performance is evaluated with CT scans of phantoms andfree-breathing mice. The modulation transfer function (MTF) at 10% is 5 lp/mm. At single frame acquisition,mouse cardiac micro-CT at 20msec temporal resolution has been demonstrated by prospectively gating theimaging acquisitions to both respiration and cardiac signals.
Keywords: micro-CT, in vivo imaging, respiratory and cardiac gating, x-ray tube, carbon nanotube
1. INTRODUCTION
Field emission micro-focus x-ray source based on carbon nanotubes (CNT) is a recent invention1 that hasattractive features for biomedical or clinical imaging.2, 3 Recently we reported the development of an experimentalmicro-computed tomography (CT) scanner based on a CNT field emission micro-focus x-ray source.2 Becauseof the electronic programming and fast switching capabilities of the CNT field emission x-ray source, the systemcan readily gate its imaging acquisition to non-periodic physiological signals providing high temporal and spatialresolutions in small animal imaging. The experimental system, however, uses a stationary CNT x-ray sourcehoused in a large vacuum chamber. To collect projection images, it rotates the vertically positioned mousesamples during CT scanning. This configuration is undesirable, and in some cases, impossible for in vivo imagingof laboratory small animals where the natural position is required during imaging.
In this paper, we report a new design of this micro-CT scanner with a stationary mouse bed which is madepossible with the recent development of a compact CNT micro-focus x-ray tube. The performance of the dynamicmicro-CT scanner was evaluated by MTF and contrast and noise analysis. Cardiac micro-CT of free-breathingmice was demonstrated with both respiratory and cardiac gating.
2. MATERIALS AND METHODS
2.1 The dynamic micro-CT scanner
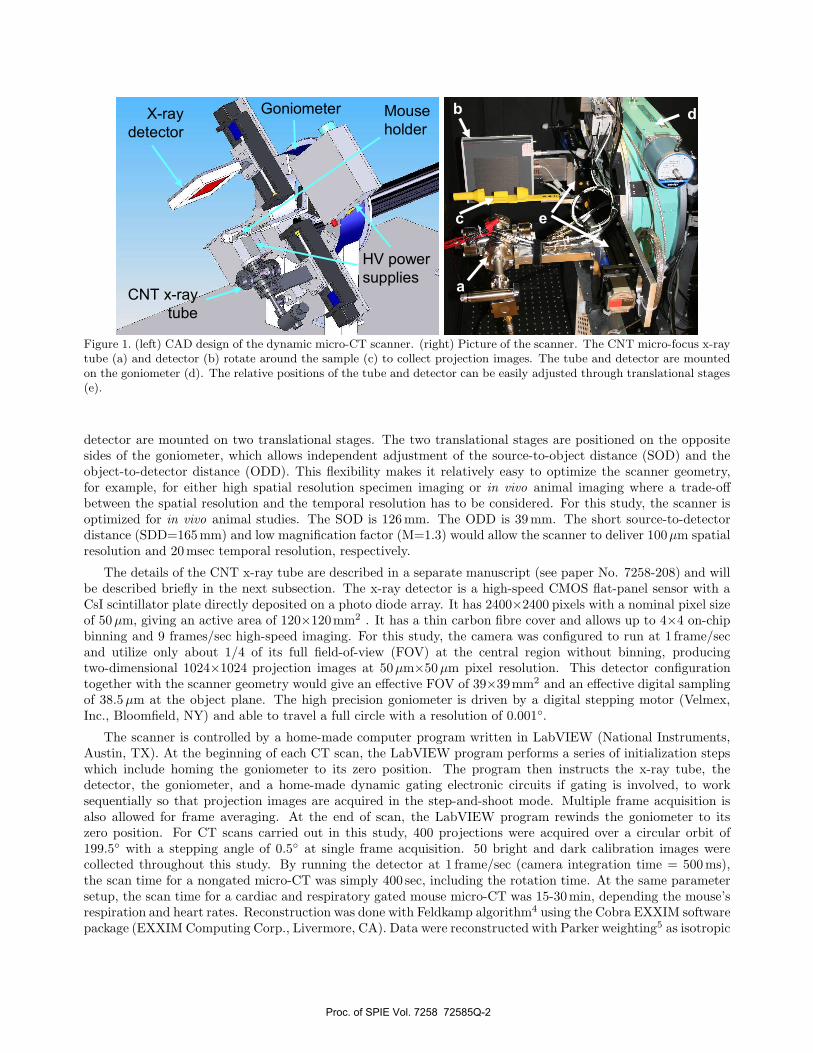
Figure 1 shows a picture of the micro-CT scanner. It mainly consists of a compact CNT field emission micro-focus x-ray tube developed in-house, a flat panel x-ray detector (Model C7940DK-02, Hamamatsu), a highprecision goniometer (Model 430, HUBER, Germany), and a home-made mouse bed. The x-ray tube and the
∗Present address: Xintek, Inc., 7020 Kit Creek Rd., Research Triangle Park, NC, 27709Further author information: G. Cao: E-mail: [email protected], O. Zhou: E-mail: [email protected]
Medical Imaging 2009: Physics of Medical Imaging, edited by Ehsan Samei, Jiang Hsieh,Proc. of SPIE Vol. 7258, 72585Q · © 2009 SPIE
CCC code: 1605-7422/09/$18 · doi: 10.1117/12.813817
Proc. of SPIE Vol. 7258 72585Q-1
a
b
c e
dX-ray detector
CNT x-raytube
HV power supplies
Mouse holder
Goniometer
Figure 1. (left) CAD design of the dynamic micro-CT scanner. (right) Picture of the scanner. The CNT micro-focus x-raytube (a) and detector (b) rotate around the sample (c) to collect projection images. The tube and detector are mountedon the goniometer (d). The relative positions of the tube and detector can be easily adjusted through translational stages(e).
detector are mounted on two translational stages. The two translational stages are positioned on the oppositesides of the goniometer, which allows independent adjustment of the source-to-object distance (SOD) and theobject-to-detector distance (ODD). This flexibility makes it relatively easy to optimize the scanner geometry,for example, for either high spatial resolution specimen imaging or in vivo animal imaging where a trade-offbetween the spatial resolution and the temporal resolution has to be considered. For this study, the scanner isoptimized for in vivo animal studies. The SOD is 126mm. The ODD is 39mm. The short source-to-detectordistance (SDD=165mm) and low magnification factor (M=1.3) would allow the scanner to deliver 100μm spatialresolution and 20msec temporal resolution, respectively.
The details of the CNT x-ray tube are described in a separate manuscript (see paper No. 7258-208) and willbe described briefly in the next subsection. The x-ray detector is a high-speed CMOS flat-panel sensor with aCsI scintillator plate directly deposited on a photo diode array. It has 2400×2400 pixels with a nominal pixel sizeof 50μm, giving an active area of 120×120mm2 . It has a thin carbon fibre cover and allows up to 4×4 on-chipbinning and 9 frames/sec high-speed imaging. For this study, the camera was configured to run at 1 frame/secand utilize only about 1/4 of its full field-of-view (FOV) at the central region without binning, producingtwo-dimensional 1024×1024 projection images at 50μm×50μm pixel resolution. This detector configurationtogether with the scanner geometry would give an effective FOV of 39×39mm2 and an effective digital samplingof 38.5μm at the object plane. The high precision goniometer is driven by a digital stepping motor (Velmex,Inc., Bloomfield, NY) and able to travel a full circle with a resolution of 0.001◦.
The scanner is controlled by a home-made computer program written in LabVIEW (National Instruments,Austin, TX). At the beginning of each CT scan, the LabVIEW program performs a series of initialization stepswhich include homing the goniometer to its zero position. The program then instructs the x-ray tube, thedetector, the goniometer, and a home-made dynamic gating electronic circuits if gating is involved, to worksequentially so that projection images are acquired in the step-and-shoot mode. Multiple frame acquisition isalso allowed for frame averaging. At the end of scan, the LabVIEW program rewinds the goniometer to itszero position. For CT scans carried out in this study, 400 projections were acquired over a circular orbit of199.5◦ with a stepping angle of 0.5◦ at single frame acquisition. 50 bright and dark calibration images werecollected throughout this study. By running the detector at 1 frame/sec (camera integration time = 500ms),the scan time for a nongated micro-CT was simply 400 sec, including the rotation time. At the same parametersetup, the scan time for a cardiac and respiratory gated mouse micro-CT was 15-30min, depending the mouse’srespiration and heart rates. Reconstruction was done with Feldkamp algorithm4 using the Cobra EXXIM softwarepackage (EXXIM Computing Corp., Livermore, CA). Data were reconstructed with Parker weighting5 as isotropic
Proc. of SPIE Vol. 7258 72585Q-2
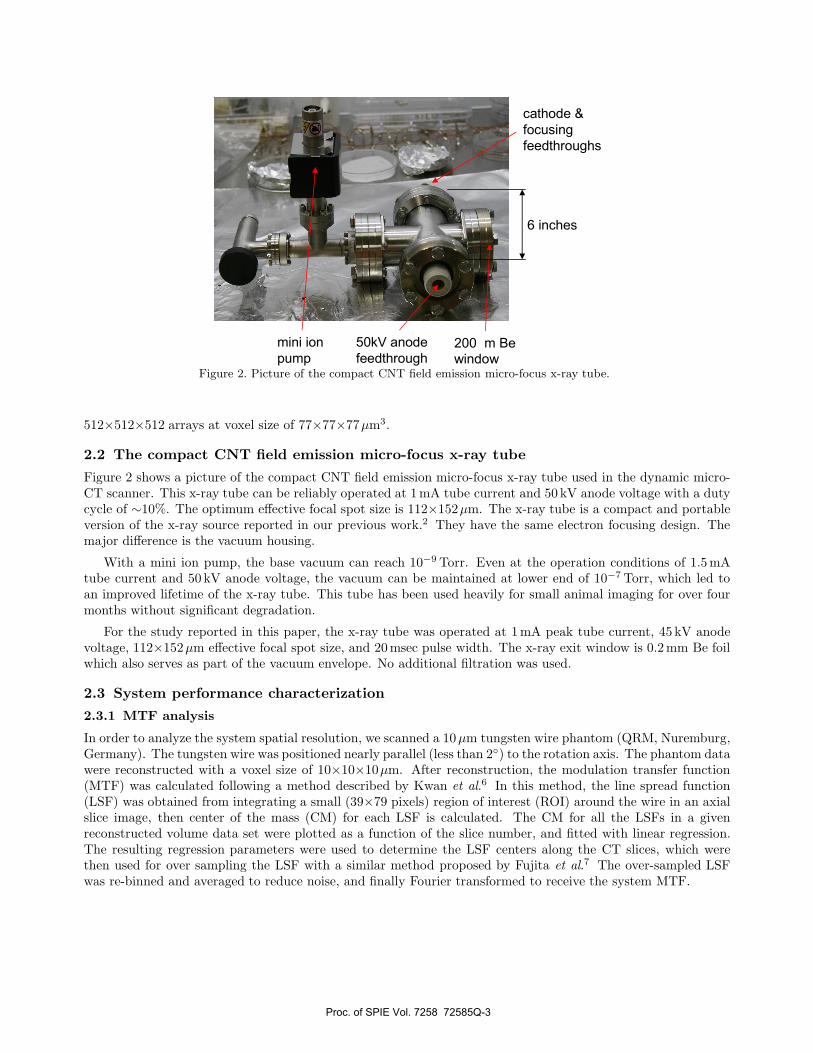
50kV anode feedthrough
mini ion pump
200µm Be window
cathode & focusing feedthroughs
6 inches
Figure 2. Picture of the compact CNT field emission micro-focus x-ray tube.
512×512×512 arrays at voxel size of 77×77×77μm3.
2.2 The compact CNT field emission micro-focus x-ray tube
Figure 2 shows a picture of the compact CNT field emission micro-focus x-ray tube used in the dynamic micro-CT scanner. This x-ray tube can be reliably operated at 1mA tube current and 50 kV anode voltage with a dutycycle of ∼10%. The optimum effective focal spot size is 112×152μm. The x-ray tube is a compact and portableversion of the x-ray source reported in our previous work.2 They have the same electron focusing design. Themajor difference is the vacuum housing.
With a mini ion pump, the base vacuum can reach 10−9 Torr. Even at the operation conditions of 1.5mAtube current and 50 kV anode voltage, the vacuum can be maintained at lower end of 10−7 Torr, which led toan improved lifetime of the x-ray tube. This tube has been used heavily for small animal imaging for over fourmonths without significant degradation.
For the study reported in this paper, the x-ray tube was operated at 1mA peak tube current, 45 kV anodevoltage, 112×152μm effective focal spot size, and 20msec pulse width. The x-ray exit window is 0.2mm Be foilwhich also serves as part of the vacuum envelope. No additional filtration was used.
2.3 System performance characterization
2.3.1 MTF analysis
In order to analyze the system spatial resolution, we scanned a 10μm tungsten wire phantom (QRM, Nuremburg,Germany). The tungsten wire was positioned nearly parallel (less than 2◦) to the rotation axis. The phantom datawere reconstructed with a voxel size of 10×10×10μm. After reconstruction, the modulation transfer function(MTF) was calculated following a method described by Kwan et al.6 In this method, the line spread function(LSF) was obtained from integrating a small (39×79 pixels) region of interest (ROI) around the wire in an axialslice image, then center of the mass (CM) for each LSF is calculated. The CM for all the LSFs in a givenreconstructed volume data set were plotted as a function of the slice number, and fitted with linear regression.The resulting regression parameters were used to determine the LSF centers along the CT slices, which werethen used for over sampling the LSF with a similar method proposed by Fujita et al.7 The over-sampled LSFwas re-binned and averaged to reduce noise, and finally Fourier transformed to receive the system MTF.
Proc. of SPIE Vol. 7258 72585Q-3
2.3.2 Contrast and noise
To analyze the contrast and noise, we scanned a 25mm diameter acrylic cylindrical phantom (hereafter referredas the contrast phantom). The phantom contains five 5mm diameter cylindrical cavities drilled evenly alonga concentric circle of 15mm diameter. The contrast phantom was 30mm long and the cavities were 25mmdeep. Each cavity was filled with air, water, fat mimic (soybean oil with 22% fat), diluted (30mgI/mL) con-trast agent (OMNIPAQUETM, GE Healthcare), and bone simulator (powder hydroxyapatite, Sigma-Aldrich, St.Louis, MO), respectively. The average and standard deviation, in Hounsfield units, of the pixel values within a3×3×3mm3 ROI placed manually in the center of each material were calculated to show the system’s contrastand noise levels. The average HU readings of water and air were set to 0 and -1000, respectively. The CNRswere calculated between water and air and between water and oil. The contrast-to-noise ratio (CNR) betweensubstance 1 and substance 2 is defined by the following equation
CNR1,2 =|μ1 − μ2|
(σ1 + σ2)/2, (1)
where μ1, μ2 and σ1, σ2 are the averages and standard deviations of the pixel values from the ROIs containedwithin the images of substance 1 and substance 2, respectively.
2.3.3 Dose measurement
The radiation dose for a typical mouse cardiac CT scan was measured by imaging a sacrificed mouse with itsskin attached with 4 thermoluminescent dosimeter (TLD) chips. The readout service was provided by K&S
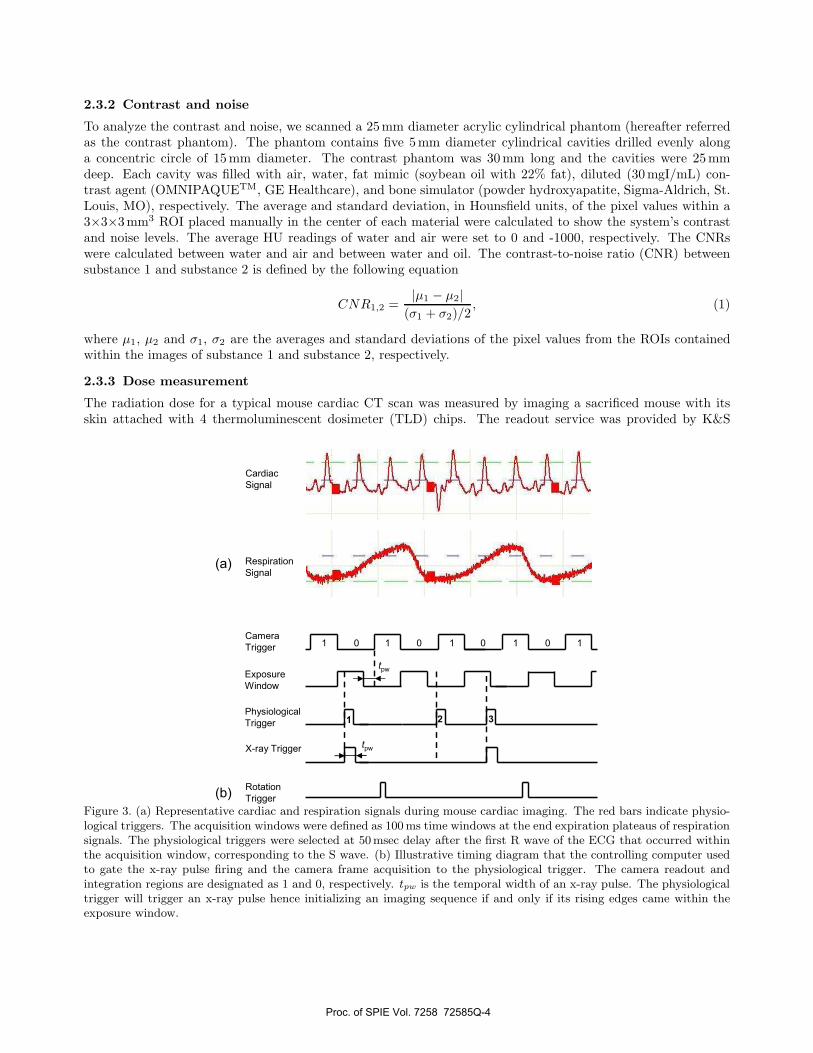
(a)
(b)
Camera Trigger
tpwExposure Window
Physiological Trigger
tpwX-ray Trigger
Rotation Trigger
1
1 1 1 110 0 0 0
2 3
Cardiac Signal
Respiration Signal
Figure 3. (a) Representative cardiac and respiration signals during mouse cardiac imaging. The red bars indicate physio-logical triggers. The acquisition windows were defined as 100 ms time windows at the end expiration plateaus of respirationsignals. The physiological triggers were selected at 50msec delay after the first R wave of the ECG that occurred withinthe acquisition window, corresponding to the S wave. (b) Illustrative timing diagram that the controlling computer usedto gate the x-ray pulse firing and the camera frame acquisition to the physiological trigger. The camera readout andintegration regions are designated as 1 and 0, respectively. tpw is the temporal width of an x-ray pulse. The physiologicaltrigger will trigger an x-ray pulse hence initializing an imaging sequence if and only if its rising edges came within theexposure window.
Proc. of SPIE Vol. 7258 72585Q-4
Associate, Inc. (Nashville, TN).
2.4 Cardiac imaging of free-breathing miceIn vivo mouse imaging experiments were performed following protocols approved by the University of NorthCarolina at Chapel Hill. To demonstrate the cardiac-respiratory gating capability of our system, we imagedseveral mice with an average weight of 25 grams. Animals were anesthetized with 1–2% isoflurane at a flow rateof 1.5–2L/min from a vaporizer. The animal breathing rates after anesthetization were typically in the rangeof 80–100breaths/min. A physiological monitoring system (BioVet, Spin Systems (QLD) Pty Ltd, Brisbane,Australia) was used to obtain the cardiac and respiration signals. The anesthetized animals were placed on topof the pressure sensor in the mouse sample holder and secured with adhesive restraints. The animals were put inthe prone position such that the respiration sensor was approximately in the position of the abdomen to achievemaximum sensor coupling. To obtain the cardiac signals, ECG electrodes were taped to the footpads. Prior toimaging, iodinated contrast agent (Fenestra VC, Advanced Research Technologies Inc., Montreal, Canada) wasinfused via tail vein injection (0.02mL/gram of mouse).
Projection images were acquired using a prospective gating approach following the diagram outlined inFigure 3. The gating electronics is same as the one described in our previous work,2 except that in this studythe physiological triggers were generated based on both respiration and cardiac gating. Physiological triggerswere generated if and only if the first QRS complex of the ECG occurred within an acquisition window definedat a specific phase of the respiration cycle. In this study, the acquisition windows were defined as 100ms at theend expiration plateaus of respiration signals, and the physiological triggers were selected at 50msec delay afterthe first R wave, approximately corresponding to the S wave of the ECG (see Figure 3(a)). Those physiologicaltriggers will trigger a 20msec x-ray pulse hence an image acquisition if and only if their rising edges camewithin the exposure windows (see Figure 3(b)). By running the detector at 1 frame/sec (camera integration time= 500ms), the scan time for a cardiac and respiratory gated mouse micro-CT was 15-30min, depending themouse’s respiration and heart rates. This scan time is critically depending on the temporal coincidence betweenthe physiological triggers and the exposure windows, in addition to the temporal coincidence between the QRScomplex of ECG and the acquisition window of the respiration signal.
3. RESULTS
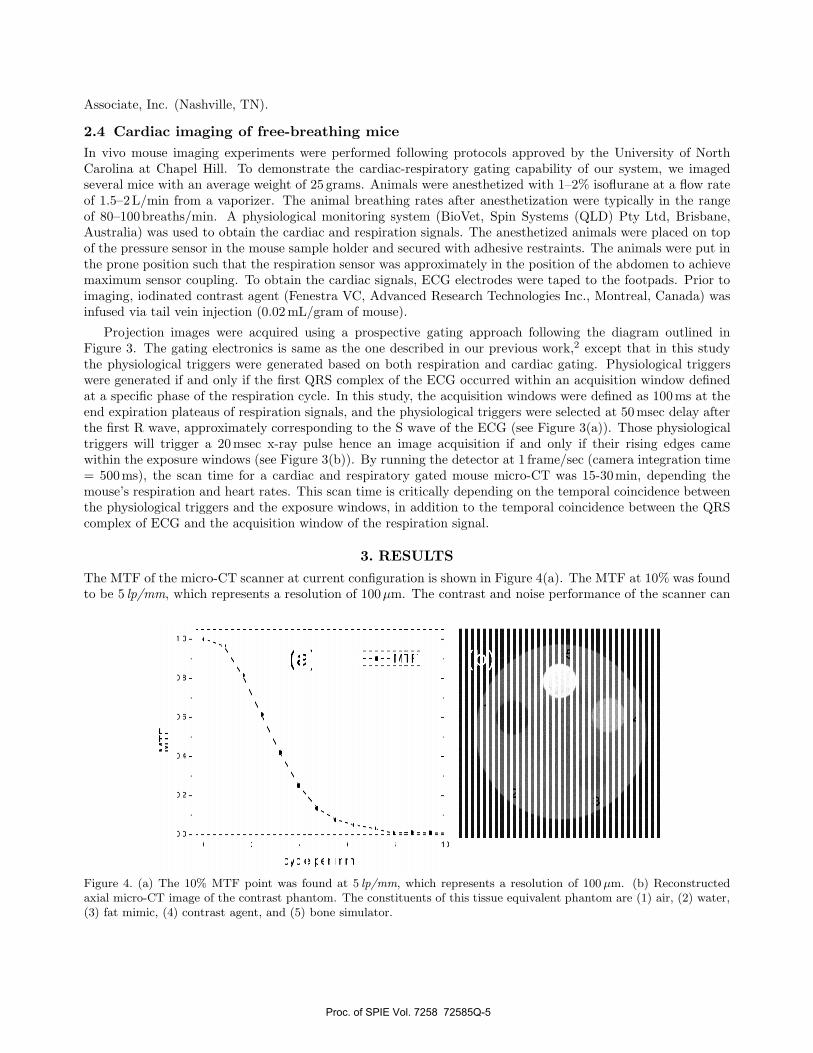
The MTF of the micro-CT scanner at current configuration is shown in Figure 4(a). The MTF at 10% was foundto be 5 lp/mm, which represents a resolution of 100μm. The contrast and noise performance of the scanner can
Figure 4. (a) The 10% MTF point was found at 5 lp/mm, which represents a resolution of 100 μm. (b) Reconstructedaxial micro-CT image of the contrast phantom. The constituents of this tissue equivalent phantom are (1) air, (2) water,(3) fat mimic, (4) contrast agent, and (5) bone simulator.
Proc. of SPIE Vol. 7258 72585Q-5
be examined from an axial micro-CT image of the contrast phantom shown in Figure 4(b). The average pixelvalues and standard deviations, in Hounsfield units, from the five material samples, are given in Table 1. TheCNR between water and air was found to be 9.9, and the CNR between water and oil was found to be 3.7.
Table 1. Averages (μ) and standard deviations (σ), in Hounsfield units, of the pixel values from the ROIs manually placein the center of the five material samples.
μ σAir -1000 100Water 0 103Fat mimic -367 94Contrast agent 1109 130Bone simulator 1636 197
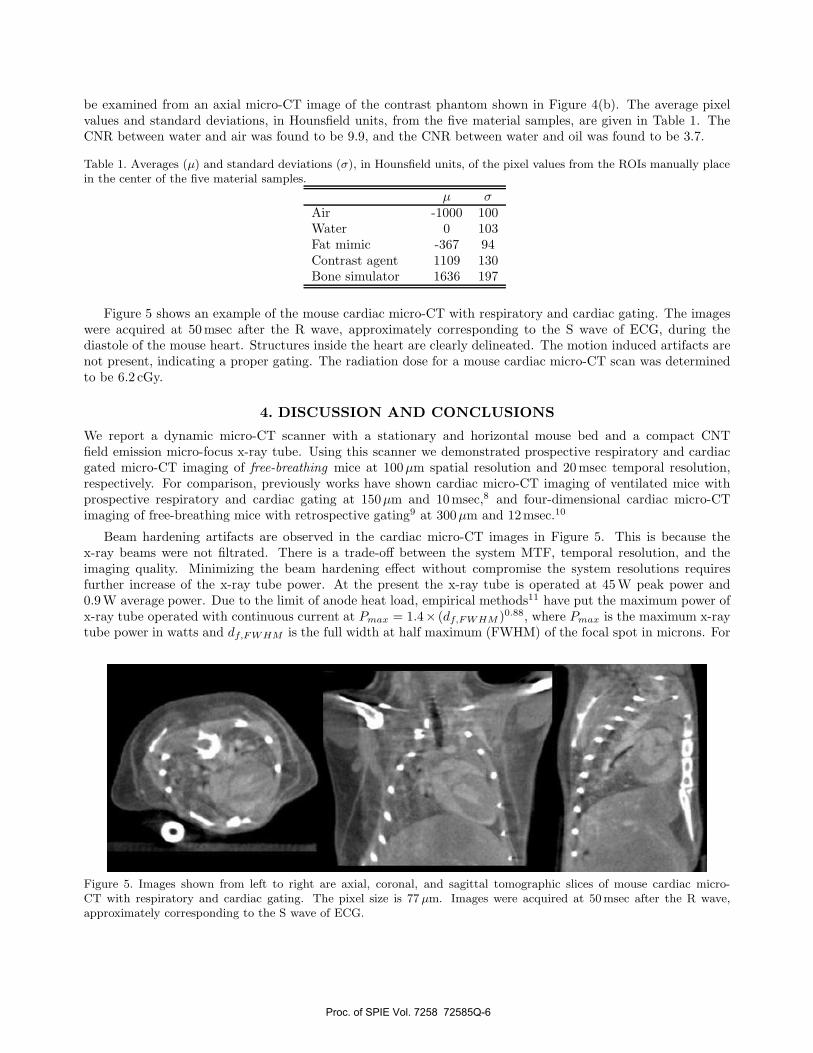
Figure 5 shows an example of the mouse cardiac micro-CT with respiratory and cardiac gating. The imageswere acquired at 50msec after the R wave, approximately corresponding to the S wave of ECG, during thediastole of the mouse heart. Structures inside the heart are clearly delineated. The motion induced artifacts arenot present, indicating a proper gating. The radiation dose for a mouse cardiac micro-CT scan was determinedto be 6.2 cGy.
4. DISCUSSION AND CONCLUSIONS
We report a dynamic micro-CT scanner with a stationary and horizontal mouse bed and a compact CNTfield emission micro-focus x-ray tube. Using this scanner we demonstrated prospective respiratory and cardiacgated micro-CT imaging of free-breathing mice at 100μm spatial resolution and 20msec temporal resolution,respectively. For comparison, previously works have shown cardiac micro-CT imaging of ventilated mice withprospective respiratory and cardiac gating at 150μm and 10msec,8 and four-dimensional cardiac micro-CTimaging of free-breathing mice with retrospective gating9 at 300μm and 12msec.10
Beam hardening artifacts are observed in the cardiac micro-CT images in Figure 5. This is because thex-ray beams were not filtrated. There is a trade-off between the system MTF, temporal resolution, and theimaging quality. Minimizing the beam hardening effect without compromise the system resolutions requiresfurther increase of the x-ray tube power. At the present the x-ray tube is operated at 45W peak power and0.9W average power. Due to the limit of anode heat load, empirical methods11 have put the maximum power ofx-ray tube operated with continuous current at Pmax = 1.4× (df,FWHM )0.88, where Pmax is the maximum x-raytube power in watts and df,FWHM is the full width at half maximum (FWHM) of the focal spot in microns. For
Figure 5. Images shown from left to right are axial, coronal, and sagittal tomographic slices of mouse cardiac micro-CT with respiratory and cardiac gating. The pixel size is 77 μm. Images were acquired at 50msec after the R wave,approximately corresponding to the S wave of ECG.
Proc. of SPIE Vol. 7258 72585Q-6
a x-ray tube with 100μm effective focal spot size, the maximum average tube power is about 80W. Therefore,our x-ray tube was operated at a power way much lower than the fundamental limit set by the anode heatload. The MTF resolution at 10% of our system is primarily limited by the focal spot size of the x-ray tube.With continuing improvements on the electron focusing and CNT cathode performance, we believe a better than100μm spatial resolution and 20msec temporal resolution can be achieved with its current design.
In conclusion, we developed a dynamic micro-CT scanner based on a CNT field emission micro-focus x-raytube, and demonstrated its successful application in cardiac imaging of free-breathing mice.
ACKNOWLEDGMENTS
The authors would like to thank Mr. B. Shieh of the Department of Physics and Astronomy at UNC in designingthe small animal sample stage, Drs. N. Maeda and H. Tomita of the Department of Pathology and LaboratoryMedicine at UNC for supplying the mouse samples and assistance in tail vein injection, and Drs. J. Zhang andS. Chang of the Department of Radiation Oncology at UNC in helping on the dose measurement. We would alsolike to thank Dr. E. A. Hoffman of the Department of Radiology at University of Iowa, Drs. W. Lin, Y. Hong,and B. Yoder of the Department of Biomedical Engineering at UNC for their helpful discussions. This work waspartially supported by grants from NIH-NIBIB (4R33EB004204-01), NIH-NCI (U54CA119343), and Xintek Inc.
REFERENCES
1. Z. Liu, G. Yang, Y. Lee, D. Bordelon, J. Lu, and O. Zhou, “Carbon nanotube based microfocus field emissionx-ray source for microcomputed tomography,” Appl. Phys. Lett. 89, p. 103111, 2006.
2. G. Cao, Y. Z. Lee, Z. Liu, R. Rajaram, R. Peng, X. Calderon-Colon, L. An, P. Wang, T. Phan, D. Lalush,J. Lu, and O. Zhou, “Respiratory-gated micro-CT using a carbon nanotube based micro-focus field emissionx-ray source,” Proc. of SPIE 6913, pp. 401–411, 2008.
3. G. Yang, R. Rajaram, G. Cao, S. Sultana, Z. Liu, D. Lalush, J. Lu, and O. Zhou, “Stationary digitalbreast tomosynthesis system with a multi-beam field emission x-ray source array,” Proc. of SPIE 6913,pp. 1A1–1A10, 2008.
4. L. A. Feldkamp, L. C. Davis, and J. W. Kress, “Practical cone-beam algorithm,” J. Opt. Soc. Am. A1,pp. 612–619, 1984.
5. D. L. Parker, “Optimal short scan convolution reconstruction for fan beam CT,” Med. Phys. 9, pp. 254–257,1982.
6. A. L. C. Kwan, J. M. Boone, K. Yang, and S.-Y. Huang, “Evaluation of the spatial resolution characteristicsof a cone-beam breast CT scanner,” Med. Phys. 34(1), pp. 275–281, 2007.
7. H. Fujita, D.-Y. Tsai, T. Itoh, K. Doi, J. Morishita, K. Ueda, and A. Ohtsuka, “A simple method for deter-mining the modulation transfer function in digital radiography,” IEEE TRANSACTIONS ON MEDICALIMAGING 11, pp. 34–39, 1992.
8. C. Badea, L. W. Hedlund, and G. A. Johnson, “Micro-CT with respiratory and cardiac gating,” Med.Phys. 31, pp. 3324–3329, 2004.
9. M. Drangova, N. L. Ford, S. A. Detombe, A. R. Wheatley, and D. W. Holdsworth, “Fast retrospectivelygated quantitative four-dimensional (4D) cardiac micro computed tomography imaging of free-breathingmice,” Investigative Radiology 42(2), pp. 85–94, 2007.
10. W. Ross, D. D. Cody, and J. D. Hazle, “Design and performance characteristics of a digital flat-panelcomputed tomography system,” Med. Phys. 33(6), pp. 1888–1901, 2006.
11. M. Flynn, S. Hames, D. Reimann, and S. Wilderman, “Microfocus x-ray sources for 3D microtomography,”Nucl. Instrum. Methods Phys. Res. A 353(1–3), pp. 312–315, 1994.
Proc. of SPIE Vol. 7258 72585Q-7