Stationary roller versus velodrome for maximal cycling test: a comparison
10
VOLUME 9 | ISSUE 1 | 2014 | 7 Stationary roller versus velodrome for maximal cycling test: a comparison JOÃO BRITO 1,2 , LUÍS LOPES 1 , ANA CONCEIÇÃO 1,2 , ALDO M. COSTA 2,3,4 , HUGO LOURO 1 Sports Sciences Research Laboratory, Sports Sciences School of Rio Maior, Polytechnic Institute of Santarém, Rio Maior, Portugal 2 Research Center for Sport, Health and Human Development (CIDESD), Portugal 3 Department of Sport Sciences, University of Beira Interior, Covilhã, Portugal 4 Health Sciences Research Center (CICS-UBI), University of Beira Interior, Covilhã, Portugal ABSTRACT Brito, J., Lopes, L., Conceição, A., Costa A.M. & Louro, H. (2014). Wheelchair Stationary roller versus velodrome for maximal cycling test: a comparison. J. Hum. Sport Exerc., 9(1), pp.7-16. The present study aimed to compare the acute cardio-respiratory responses of elite cyclists to a maximal progressive exercise carried out in two different conditions: in a laboratory (using a braked roller) and in an uncovered velodrome. In both testing conditions, ten elite male cyclists (age, 22.3 ± 3.9 years) performed a maximal discontinuous progressive test of 6 minutes per level with 150 W of initial load and increasing 50 W at each level until exhaustion. The heart rate and the ventilation parameters were measured breath-by-breath using a portable metabolic cart gas analysis system with telemetry data transmission. In the first 4 levels of effort, no significant differences were found between the two test conditions regarding VO2, (p=0.193), heart rate (p=0.973) and pedaling cadence (p=0.116). Comparing the maximum values achieved by each athlete in both exercise conditions, significant differences were found for heart rate (p=0.008) and pedaling cadence (p=0.005) but not for VO2max and peak power. Each variable showed a strong correlation between both assessments (VO2, r=0.984, p=0,000; heart rate, r=0.944, p=0.005; pedaling cadence, r=0.900, p=0.014). The amount of variability explained by the linear regression model for both cardio-respiratory parameters also showed a good fit value close to one (VO2max, r2=0.968; heart rate, r2=0.892). Our results suggest that identical cycling protocols conducted in different testing conditions with the same bike leads to equivalent performance but significantly different pedaling cadence and heart rate responses. Key words: CYCLING, OXYGEN CONSUMPTION, HEART RATE, POWER OUTPUT, CADENCE. 1 Corresponding author. Departamento de Ciências do Desporto. Universidade da Beira Interior. Rua Marquês D´Ávila e Bolama. 6201-001 Covilhã. Portugal. E-mail: [email protected] Submitted for publication July 2013 Accepted for publication December 2013 JOURNAL OF HUMAN SPORT & EXERCISE ISSN 1988-5202 © Faculty of Education. University of Alicante doi:10.4100/jhse.2014.91.02 Original Article
Transcript of Stationary roller versus velodrome for maximal cycling test: a comparison
VOLUME 9 | ISSUE 1 | 2014 | 7
Stationary roller versus velodrome for maximal cycling test: a comparison JOÃO BRITO 1,2, LUÍS LOPES 1, ANA CONCEIÇÃO 1,2, ALDO M. COSTA 2,3,4 , HUGO LOURO 1 Sports Sciences Research Laboratory, Sports Sciences School of Rio Maior, Polytechnic Institute of Santarém, Rio Maior, Portugal 2 Research Center for Sport, Health and Human Development (CIDESD), Portugal 3 Department of Sport Sciences, University of Beira Interior, Covilhã, Portugal 4 Health Sciences Research Center (CICS-UBI), University of Beira Interior, Covilhã, Portugal
ABSTRACT
Brito, J., Lopes, L., Conceição, A., Costa A.M. & Louro, H. (2014). Wheelchair Stationary roller versus velodrome for maximal cycling test: a comparison. J. Hum. Sport Exerc., 9(1), pp.7-16. The present study aimed to compare the acute cardio-respiratory responses of elite cyclists to a maximal progressive exercise carried out in two different conditions: in a laboratory (using a braked roller) and in an uncovered velodrome. In both testing conditions, ten elite male cyclists (age, 22.3 ± 3.9 years) performed a maximal discontinuous progressive test of 6 minutes per level with 150 W of initial load and increasing 50 W at each level until exhaustion. The heart rate and the ventilation parameters were measured breath-by-breath using a portable metabolic cart gas analysis system with telemetry data transmission. In the first 4 levels of effort, no significant differences were found between the two test conditions regarding VO2, (p=0.193), heart rate (p=0.973) and pedaling cadence (p=0.116). Comparing the maximum values achieved by each athlete in both exercise conditions, significant differences were found for heart rate (p=0.008) and pedaling cadence (p=0.005) but not for VO2max and peak power. Each variable showed a strong correlation between both assessments (VO2, r=0.984, p=0,000; heart rate, r=0.944, p=0.005; pedaling cadence, r=0.900, p=0.014). The amount of variability explained by the linear regression model for both cardio-respiratory parameters also showed a good fit value close to one (VO2max, r2=0.968; heart rate, r2=0.892). Our results suggest that identical cycling protocols conducted in different testing conditions with the same bike leads to equivalent performance but significantly different pedaling cadence and heart rate responses. Key words: CYCLING, OXYGEN CONSUMPTION, HEART RATE, POWER OUTPUT, CADENCE.
1 Corresponding author. Departamento de Ciências do Desporto. Universidade da Beira Interior. Rua Marquês D´Ávila e Bolama. 6201-001 Covilhã. Portugal. E-mail: [email protected] Submitted for publication July 2013 Accepted for publication December 2013 JOURNAL OF HUMAN SPORT & EXERCISE ISSN 1988-5202 © Faculty of Education. University of Alicante doi:10.4100/jhse.2014.91.02
Original Article
Brito et al. / Maximal cycling tests under velodrome and laboratory conditions JOURNAL OF HUMAN SPORT & EXERCISE
8 | 2014 | ISSUE 1 | VOLUME 9 © 2014 University of Alicante
INTRODUCTION Several authors have expressed doubts about the similarity of physiological responses obtained in laboratory cycling protocols relative to those obtained in field tests (Bertucci et al., 2005; Gardner et al., 2007; Lucía et al., 2000). Laboratory tests have the advantage of being performed under a well-controlled environment, allowing the obtaining of variables usually difficult to measure in outdoor conditions. However, there are limitations on the use of such tests, such as the difficulty in accurately reproducing the position of the athlete on a cycle ergometer. Although various laboratory tests have been validated, the use of specific equipment, similar to that used in training and competition, is one aspect to consider in selecting a test (Padilla et al., 1996). Moreover, to perform a specific laboratory test in cycling, it is important to use equipment adjusted to the cyclist. Indeed, during a traditional anaerobic assessment using a Monark cycle-ergometer, experienced cyclists usually have difficulty in adapting to a position different from that used in competition (Bertucci et al., 2005); the mechanical characteristics of ergometers are clearly dissimilar (Bertucci et al., 2007). Is common knowledge that morphological variables (body mass, height, body surface and frontal area) can significantly impact cyclist performance over different types of terrain and competition stages (Swain, 1994). For this reason several studies have used power output as a control parameter of cyclist effort in various contexts of assessment (Duc et al., 2007; Gardner et al., 2007; Hawley & Noakes, 1992; Lucía et al., 2001; Millet et al., 2003). Nevertheless, some authors (Prins et al., 2007) have suggested that performances obtained in field tests seem to indicate with increased reliability the athlete’s power output in relation to body mass. This seems to occur because cycling energy expenditure is highly dependent on body surface area, equipment used and also the ability to reduce air drag (Heil et al., 1995; Padilla et al., 1996). Most studies comparing the physiological responses obtained in laboratory cycling protocols versus outdoor tests are conducted with stationary bikes. Thus it seems relevant to analyse whether the use of a classic racing bike at a stationary roller during a maximal test protocol can reproduce the results of the same test protocol when performed in real field conditions. In this sense, our study aims to compare the acute cardio-respiratory responses of elite cyclists when performing the same maximal progressive exercise in two different test conditions (laboratory and 400m open air velodrome). MATERIAL AND METHODS Participants Ten male elite road cyclists (mean ±SD, age, 22.3 ± 3.9 years; weight, 66.7 ± 7.8 kg; height, 175.1 ± 8.2 cm; body surface area (BSA), 1.81 ± 0.15 m2; percentage body fat, 6.71 ± 1.57% ) participated in this study. These elite athletes train 9.3 ± 0.4 (mean ±SD) sessions per week and regularly participate in cycling competitions at international level. All measurements were taken immediately before the main national or international competitions to ensure that athletes would be in a state of good overall performance. Subjects were informed in advance about procedures and asked to sign a form of consent that had been approved by the local sport sciences research ethics committee and implemented according to the Helsinki Declaration. Measures The subjects used a classic racing bicycle (Specialized, USA) equipped with a potentiometer SRM Wireless Training System – Science with an accuracy of ±0.5% (Schoberer Rad Messtechnik, Germany) on a
Brito et al. / Maximal cycling tests under velodrome and laboratory conditions JOURNAL OF HUMAN SPORT & EXERCISE
VOLUME 9 | ISSUE 1 | 2014 | 9
braked roller (Tacx Flow, Wassenaar, Netherlands) for the laboratory tests and the same bicycles on a 400 meters velodrome track, in a racing position (i.e. fully dropped posture with the hands on the lower section of the handlebars). The mass of the bicycles was approximately 10kg, with slight variations depending on the size of the frame, which was adapted to each rider's morphology. All the subjects used clip-on pedal systems, and wore similar shorts, jersey and non-aerodynamically-designed safety helmets throughout the test. In both test conditions, the heart rate and the ventilatory parameters were measured by a telemetric portable gas analysis system (Cosmed®, model K4b2, Rome, Italy). The two tests were conducted with a 5-7 days interval. Before and during the velodrome test sessions, wind speed was measured with an anemometer Xplorer laptop brand, model 3 SkywatchXplorer (JDC Electronic, Yverddon-les-Bains, Switzerland). All tests were carried out at wind speeds of less than 15 km.h-1, this being considered the limit for which air resistance is negligible (Pugh, 1971). Procedures Anthropometric data: All anthropometric measurements were assessed according to international standards (Marfell-Jones et al., 2006) and prior to any physical performance test. Body weight was measured (with subjects wearing light clothing and without shoes) to the nearest 0.1 kg using a mechanical scale (SECA®, model 841, Germany) and height was measured to the nearest 0.1 cm with a stadiometer (SECA®, model 214, Germany). The percentage of total body fat was assessed using a bioelectrical impedance device (Tanita tetrapolar bioelectrical impedance analysis, Model TBF-310, Tanita Corporation of America, Inc, Arlington Heights, IL; Tanita-BIA), according to the manufacture’s evaluation assumptions. Maximal progressive exercise protocol: The maximal progressive test in both conditions (laboratory and velodrome) was carried out in random order and each test was initiated only when the VO2 values were similar to baseline. Each subject performed 10 minutes of warm up (Prins et al., 2007). The test protocol consisted of a discontinuous progressive incremental test of 6 minutes duration per level with a 150 W of initial load and increasing 50 W at each level until exhaustion (suggested by Padilla et al., 1996, and adapted by Amann et al., 2006). Since this was a discontinuous maximal protocol, the recovery intervals were defined for each athlete according to their VO2 values measured at rest. Each individual selected the gear ratio for the different levels according to preference. Equally, the pedaling cadence was that preferred by each cyclist (between 90 and 120 rpm) assuming that this parameter had no interference with the maintenance of power output (Lucía et al., 2003). Subjects always controlled the instantaneous and the average power output through a monitor device (Schoberer Rad Messtechnik, Germany) attached to the bicycle handlebar. At baseline and during exercise, expired gases were continuously measured. The expired gases were collected breath-by-breath, and then averaged for 15 seconds intervals (Aisbett & Le Rossignol, 2003); the average values for each minute were later calculated (McCann & Adams, 2002). VO2 stabilization was established when the variation in oxygen uptake was less than 2.1 ml.kg-1.min-1 in fourth consecutive values of 15 seconds (Whipp & Rossiter, 2005). Before each test, time delay and reference air calibration of the device was performed using a gas sample with 16% of O2 concentration and 5% of CO2
Brito et al. / Maximal cycling tests under velodrome and laboratory conditions JOURNAL OF HUMAN SPORT & EXERCISE
10 | 2014 | ISSUE 1 | VOLUME 9 © 2014 University of Alicante
concentration. The flow meter was also calibrated before each testing using a 3000 ml syringe, according to the manufacturer’s recommendation. The heart rate was also continuously monitored and recorded using a Wireless Double Electrode (Polar Electro, Oy, Finland). Heart rate registration was beat-by-beat and then averaged to 15 seconds intervals. The following procedures were fixed at outset: the conditions of temperature and humidity (20 to 22 °C and 50 to 60%, respectively) were kept stable; the subjects did not perform the exercise in the 24 hours prior to tests and the intake of medication and alcohol was similarly restricted; food or caffeine intake was forbidden for 3 hours before the test. Analysis All data for this study were analysed using SPSS computer software for Windows (version 18.0). Data are presented as mean and standard deviations (±SD). A repeated-measures analysis of variance with Bonferroni adjustment was used to analyse the differences between the mean values of each protocol. The sphericity was tested by Mauchly's test. The Greenhouse-Geisser épsilon correction factor was also used when appropriate. The Pearson correlation coefficient was used to evaluate the associations between the cardio-respiratory measures of both protocols. The T-test for pared measures was also used to compare the maximum VO2 values obtained by each subject in both test conditions. Statistical significance for all analyses was as accepted at p ≤ 0.05. RESULTS
Table 1. Descriptive values for all measured parameters in both testing conditions (laboratory and velodrome) and for each protocol level.
Level 1 Level 2 Level 3 Level 4 Level 5 Level 6 (n=10) (n=10) (n=10) (n=10) (n=6) (n=2)
VO2 (ml/kg/min)
Lab M ± SD 45.94±7.38 56.30±9.84 65.80±9.04 71.98±7.11 72.64±8.53 72.50±12.74 Min-Max 35.37-52.09 43.48-63.16 53.03-76.85 63.26-83.20 57.88-78.70 63.54-81.58
Velo M ± SD 41.47±3.20 53.64±5.26 63.31±5.44 72.27±6.15 74.67±3.52 79.36±0.50 Min-Max 37.15-48.56 45.85-62.23 55.52-73.85 63.13-80.78 69.53-80.23 79.01-79.07
Heart Rate (bpm)
Lab M ± SD 136.20±11.30 155.93±16.23 171.50±12.74 180.53±12.10 184.80±4.69 190.83±3.35 Min-Max 118.45-151.85 123.25-182.77 146.52-191.06 161.27-196.90 179.08-190.55 188.56-199.23
Velo M ± SD 146.80±9.21 153.85±9.56 166.96±11.85 178.08±9.05 180.64±8.78 191.67±16.08 Min-Max 129.65-161.24 153.85-168 146.12-182.09 158.50-188.76 192.58-169.05 180.22-203.02
Minute Ventilation (l/m)
Lab M ± SD 60.36±7.64 78.71±13.16 107.66±14.91 139.12±23.27 150.34±12.05 196.98±9.07 Min-Max 50.86-77.04 70.12-108.59 86.65-132.06 109.18-166.87 129.97-161.36 190.56-203.39
Velo M ± SD 65.24±4.85 80.08±8.44 104.06±10.48 131.32±17.65 154.22±7.10 188.02±3.66 Min-Max 59.19-75.51 65.24-92.35 89.08-120.18 108.39-158.03 145.24-162.77 185.43-190.60
Respiratory Exchange Ratio (R)
Lab M ± SD 0.87±0.08 0.91±0.09 0.98±0.10 1.00±0.12 1.21±0.50 1.56±0.91 Min-Max 0.77-1.08 0.84-1.15 0.87-1.24 0.89-1.31 0.92-2.09 0.91-2.20
Velo M ± SD 0.90±0.09 0.90±0.07 0.95±0.09 0.98±0.09 1.01±0.09 0.96±0.06
Brito et al. / Maximal cycling tests under velodrome and laboratory conditions JOURNAL OF HUMAN SPORT & EXERCISE
VOLUME 9 | ISSUE 1 | 2014 | 11
Min-Max 0.80-1.02 0.81-1.00 0.85-1.11 0.84-1.09 0.90-1.09 0.92-1.00 Pedalling Cadence (rpm)
Lab M ± SD 96.26±6.79 101.23±7.02 103.99±5.22 105.05±4.36 105.12±7.02 112.98±10.87 Min-Max 84.23-104.76 89.15-110.11 93.34-110.05 97.63-113.90 99.04-116.37 105.30-120.68
Velo M ± SD 96.67±6.17 98.03±8.36 100.74±5.88 98.90±5.33 98.20±8.03 104.80±3.22 Min-Max 88.11-104.78 85.23-110.72 110.30-89.02 89.04-107.12 87.46-107.91 102.47-107.40
Power (w)
Lab M ± SD 149.60±9.20 201.20±1.59 249.90±1.07 299.14±2.97 348.34±1.96 396.45±3.37 Min-Max 147.84-161.74 197.56-203.14 248.06-252.21 293.40-303.47 346.53-351.10 394.06-398.84
Velo M ± SD 151.05±1.95 201.08±2.19 251.83±2.13 302.79±2.13 350.02±1.06 393.90±4.60 Min-Max 148.50-153.11 198.33-204.28 254.22-248.28 299.23-306.01 353.13-345.73 389.94-396.51
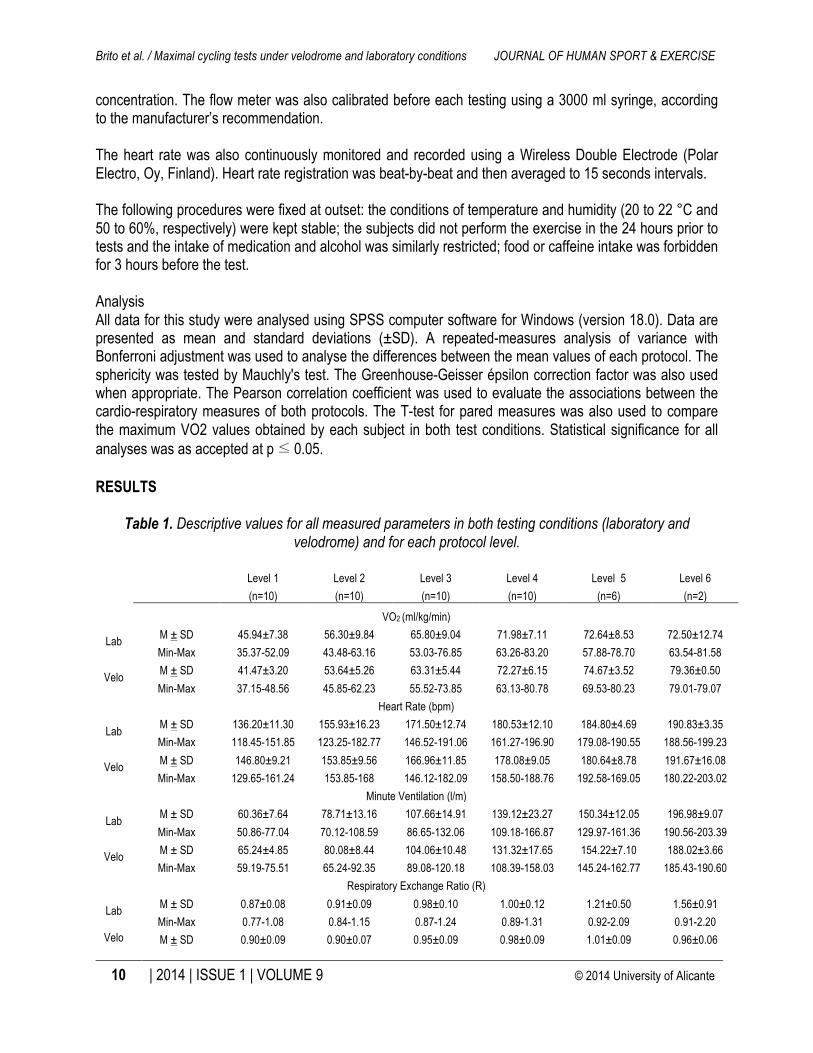
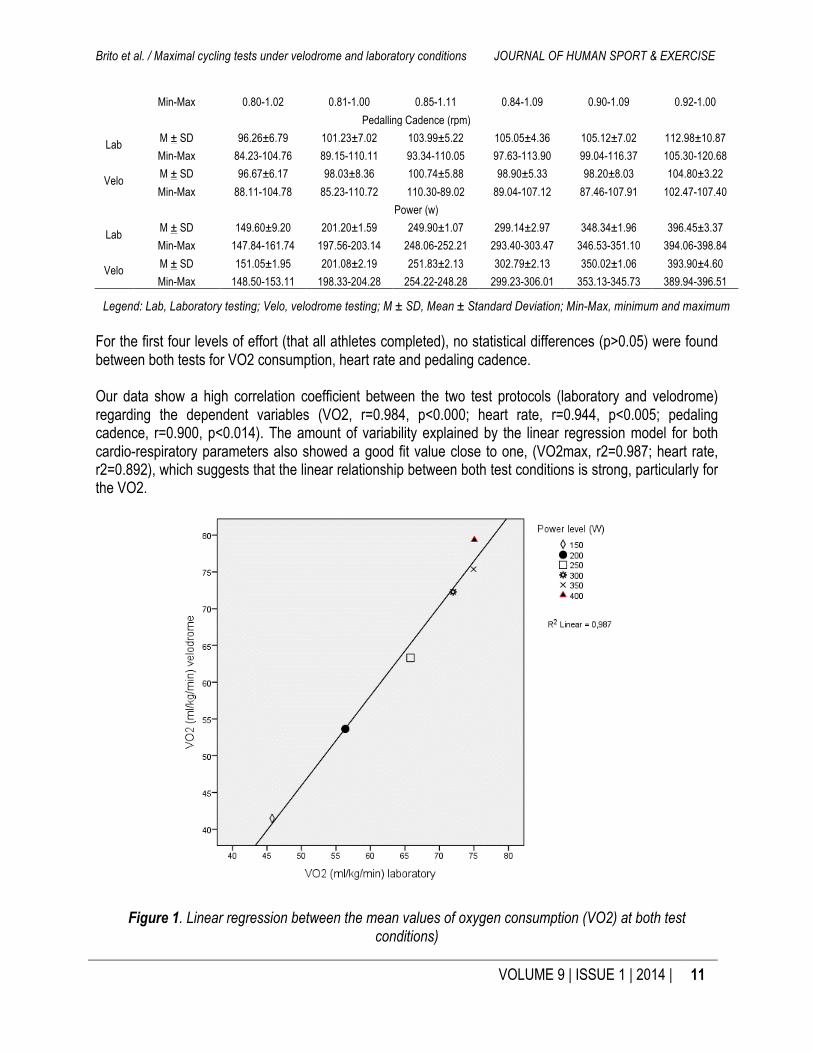
Legend: Lab, Laboratory testing; Velo, velodrome testing; M ± SD, Mean ± Standard Deviation; Min-Max, minimum and maximum For the first four levels of effort (that all athletes completed), no statistical differences (p>0.05) were found between both tests for VO2 consumption, heart rate and pedaling cadence. Our data show a high correlation coefficient between the two test protocols (laboratory and velodrome) regarding the dependent variables (VO2, r=0.984, p<0.000; heart rate, r=0.944, p<0.005; pedaling cadence, r=0.900, p<0.014). The amount of variability explained by the linear regression model for both cardio-respiratory parameters also showed a good fit value close to one, (VO2max, r2=0.987; heart rate, r2=0.892), which suggests that the linear relationship between both test conditions is strong, particularly for the VO2.
Figure 1. Linear regression between the mean values of oxygen consumption (VO2) at both test conditions)
Brito et al. / Maximal cycling tests under velodrome and laboratory conditions JOURNAL OF HUMAN SPORT & EXERCISE
12 | 2014 | ISSUE 1 | VOLUME 9 © 2014 University of Alicante
Figure 2. Linear regression between the mean values of heart rate (bpm) at both test conditions)
Table 2. Descriptive values for all measured parameters in both testing conditions (laboratory and
velodrome) corresponding to the level in which the athlete achieve the VO2max.
. VO2 Heart Rate Pedalling
Cadence (rpm) Peak power
(ml/kg/min) (bpm) (W)
Lab (n=10) M ± SD 74.63 ± 7.27 186.55 ± 8.55 105.92 ± 6.67 337.27 ± 39.53 Min-Max 63.54-83.20 169.25–196.50 97.61–120.69 293.49–398.84
Velo (n=10) M ± SD 75.82 ± 5.15 179.84 ± 6.90 98.15 ± 6.69 344.77 ± 33.03 Min-Max 66.37–80.65 169-188 84.51–107.14 302.3–396.5
P-value 0.465 0.008* 0.005* 0.164 Legend: Lab, Laboratory testing; Velo, velodrome testing; M ± SD, Mean ± Standard Deviation; Min-Max,
minimum and maximum; * significante for p<0.05 The heart rate and the pedaling cadence are significantly different (p<0.05), although the VO2max and the peak power are quite similar in both tests conditions. The peak power has a high standard deviation because the levels of exhaustion achieved by each cyclist were not identical: four cyclists achieved exhaustion at 300W, four at 350W and two at 400W. DISCUSSION Some studies have reported the existence of significant differences in some measured parameters between tests performed in laboratory and real contexts (Gardner et al., 2007; Padilla et al., 1996; Prins et al., 2007). Nevertheless, most of these studies used modified protocols in that for both test conditions the
Brito et al. / Maximal cycling tests under velodrome and laboratory conditions JOURNAL OF HUMAN SPORT & EXERCISE
VOLUME 9 | ISSUE 1 | 2014 | 13
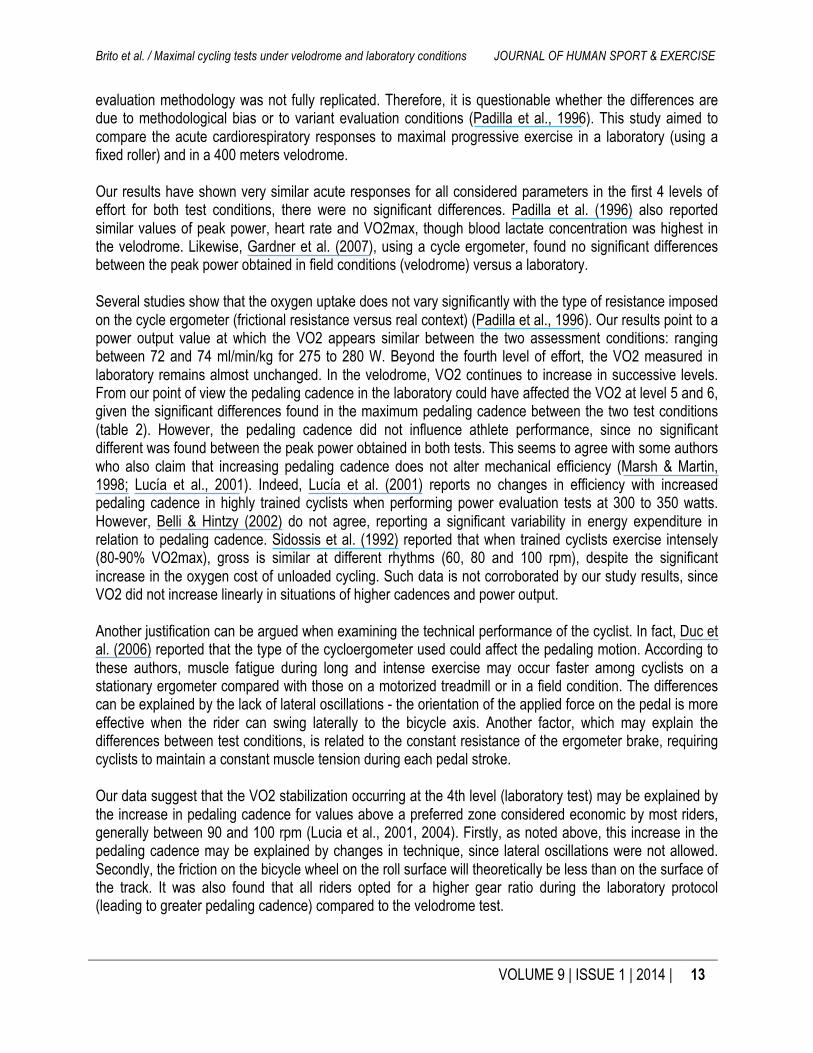
evaluation methodology was not fully replicated. Therefore, it is questionable whether the differences are due to methodological bias or to variant evaluation conditions (Padilla et al., 1996). This study aimed to compare the acute cardiorespiratory responses to maximal progressive exercise in a laboratory (using a fixed roller) and in a 400 meters velodrome. Our results have shown very similar acute responses for all considered parameters in the first 4 levels of effort for both test conditions, there were no significant differences. Padilla et al. (1996) also reported similar values of peak power, heart rate and VO2max, though blood lactate concentration was highest in the velodrome. Likewise, Gardner et al. (2007), using a cycle ergometer, found no significant differences between the peak power obtained in field conditions (velodrome) versus a laboratory. Several studies show that the oxygen uptake does not vary significantly with the type of resistance imposed on the cycle ergometer (frictional resistance versus real context) (Padilla et al., 1996). Our results point to a power output value at which the VO2 appears similar between the two assessment conditions: ranging between 72 and 74 ml/min/kg for 275 to 280 W. Beyond the fourth level of effort, the VO2 measured in laboratory remains almost unchanged. In the velodrome, VO2 continues to increase in successive levels. From our point of view the pedaling cadence in the laboratory could have affected the VO2 at level 5 and 6, given the significant differences found in the maximum pedaling cadence between the two test conditions (table 2). However, the pedaling cadence did not influence athlete performance, since no significant different was found between the peak power obtained in both tests. This seems to agree with some authors who also claim that increasing pedaling cadence does not alter mechanical efficiency (Marsh & Martin, 1998; Lucía et al., 2001). Indeed, Lucía et al. (2001) reports no changes in efficiency with increased pedaling cadence in highly trained cyclists when performing power evaluation tests at 300 to 350 watts. However, Belli & Hintzy (2002) do not agree, reporting a significant variability in energy expenditure in relation to pedaling cadence. Sidossis et al. (1992) reported that when trained cyclists exercise intensely (80-90% VO2max), gross is similar at different rhythms (60, 80 and 100 rpm), despite the significant increase in the oxygen cost of unloaded cycling. Such data is not corroborated by our study results, since VO2 did not increase linearly in situations of higher cadences and power output. Another justification can be argued when examining the technical performance of the cyclist. In fact, Duc et al. (2006) reported that the type of the cycloergometer used could affect the pedaling motion. According to these authors, muscle fatigue during long and intense exercise may occur faster among cyclists on a stationary ergometer compared with those on a motorized treadmill or in a field condition. The differences can be explained by the lack of lateral oscillations - the orientation of the applied force on the pedal is more effective when the rider can swing laterally to the bicycle axis. Another factor, which may explain the differences between test conditions, is related to the constant resistance of the ergometer brake, requiring cyclists to maintain a constant muscle tension during each pedal stroke. Our data suggest that the VO2 stabilization occurring at the 4th level (laboratory test) may be explained by the increase in pedaling cadence for values above a preferred zone considered economic by most riders, generally between 90 and 100 rpm (Lucia et al., 2001, 2004). Firstly, as noted above, this increase in the pedaling cadence may be explained by changes in technique, since lateral oscillations were not allowed. Secondly, the friction on the bicycle wheel on the roll surface will theoretically be less than on the surface of the track. It was also found that all riders opted for a higher gear ratio during the laboratory protocol (leading to greater pedaling cadence) compared to the velodrome test.
Brito et al. / Maximal cycling tests under velodrome and laboratory conditions JOURNAL OF HUMAN SPORT & EXERCISE
14 | 2014 | ISSUE 1 | VOLUME 9 © 2014 University of Alicante
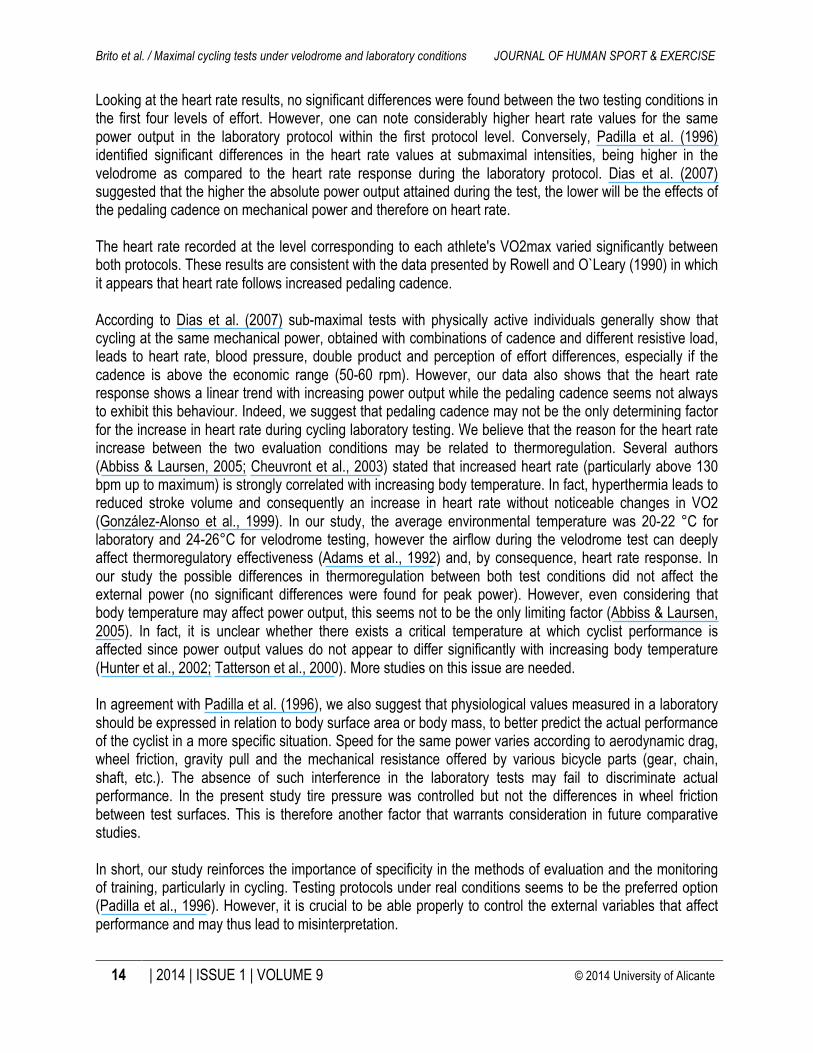
Looking at the heart rate results, no significant differences were found between the two testing conditions in the first four levels of effort. However, one can note considerably higher heart rate values for the same power output in the laboratory protocol within the first protocol level. Conversely, Padilla et al. (1996) identified significant differences in the heart rate values at submaximal intensities, being higher in the velodrome as compared to the heart rate response during the laboratory protocol. Dias et al. (2007) suggested that the higher the absolute power output attained during the test, the lower will be the effects of the pedaling cadence on mechanical power and therefore on heart rate. The heart rate recorded at the level corresponding to each athlete's VO2max varied significantly between both protocols. These results are consistent with the data presented by Rowell and O`Leary (1990) in which it appears that heart rate follows increased pedaling cadence. According to Dias et al. (2007) sub-maximal tests with physically active individuals generally show that cycling at the same mechanical power, obtained with combinations of cadence and different resistive load, leads to heart rate, blood pressure, double product and perception of effort differences, especially if the cadence is above the economic range (50-60 rpm). However, our data also shows that the heart rate response shows a linear trend with increasing power output while the pedaling cadence seems not always to exhibit this behaviour. Indeed, we suggest that pedaling cadence may not be the only determining factor for the increase in heart rate during cycling laboratory testing. We believe that the reason for the heart rate increase between the two evaluation conditions may be related to thermoregulation. Several authors (Abbiss & Laursen, 2005; Cheuvront et al., 2003) stated that increased heart rate (particularly above 130 bpm up to maximum) is strongly correlated with increasing body temperature. In fact, hyperthermia leads to reduced stroke volume and consequently an increase in heart rate without noticeable changes in VO2 (González-Alonso et al., 1999). In our study, the average environmental temperature was 20-22 °C for laboratory and 24-26°C for velodrome testing, however the airflow during the velodrome test can deeply affect thermoregulatory effectiveness (Adams et al., 1992) and, by consequence, heart rate response. In our study the possible differences in thermoregulation between both test conditions did not affect the external power (no significant differences were found for peak power). However, even considering that body temperature may affect power output, this seems not to be the only limiting factor (Abbiss & Laursen, 2005). In fact, it is unclear whether there exists a critical temperature at which cyclist performance is affected since power output values do not appear to differ significantly with increasing body temperature (Hunter et al., 2002; Tatterson et al., 2000). More studies on this issue are needed. In agreement with Padilla et al. (1996), we also suggest that physiological values measured in a laboratory should be expressed in relation to body surface area or body mass, to better predict the actual performance of the cyclist in a more specific situation. Speed for the same power varies according to aerodynamic drag, wheel friction, gravity pull and the mechanical resistance offered by various bicycle parts (gear, chain, shaft, etc.). The absence of such interference in the laboratory tests may fail to discriminate actual performance. In the present study tire pressure was controlled but not the differences in wheel friction between test surfaces. This is therefore another factor that warrants consideration in future comparative studies. In short, our study reinforces the importance of specificity in the methods of evaluation and the monitoring of training, particularly in cycling. Testing protocols under real conditions seems to be the preferred option (Padilla et al., 1996). However, it is crucial to be able properly to control the external variables that affect performance and may thus lead to misinterpretation.
Brito et al. / Maximal cycling tests under velodrome and laboratory conditions JOURNAL OF HUMAN SPORT & EXERCISE
VOLUME 9 | ISSUE 1 | 2014 | 15
CONCLUSIONS The present study allows us to conclude that identical cycling protocols, carried out in different conditions (laboratory and velodrome) with the same bicycle, lead to equivalent performance (peak power and VO2max) but significantly different pedaling cadence and heart rate response. We believe that both conditions are equivalent in terms of performance. However, the differences in the pedaling cadence lead us to suggest that in laboratory testing, cyclist technique differs though this factor is less important for performance than testing in real conditions. In addition, airflow during an outdoor test may likely affect thermoregulatory effectiveness and, by consequence, heart rate response. ACKNOWLEDGMENTS We would like to thank the cyclists that participated as subjects in this study.
REFERENCES
1. Abbiss, C.R., & Laursen, P.B. (2005). Models to explain fatigue during prolonged endurance. Sports Med, 35(10), pp.865-898.
2. Adams, W.C., Mack, G.W., Langhans, G.W., & Nadel, E.R. (1992). Effects of varied air velocity on sweating and evaporative rates during exercise. J App Physiol, 73(6), pp.2668-2674.
3. Aisbett, B., & Le Rossignol, P. (2003). Estimating the total energy demand for supra-maximal exercise using the VO2-power regression from an incremental test. J Sci Med Sport, 6(3), pp.343-347.
4. Amann, M., Subudhi, A.W., & Foster, C. (2006). Predictive validity of ventilatory and lactate thresholds for Cycling time trial performance. Scand J Med Sci Sports, 16(1), pp.27-34.
5. Belli, A., & Hintzy, F. (2002). Influence of pedaling rate on the energy cost of Cycling in Humans. Eur J App Physiol, 88(1-2), pp.158-162.
6. Bertucci, W., Grappe, F., & Groslambert, A. (2007). Laboratory versus outdoor cycling conditions: differences in pedaling biomechanics. J Appl Biomech, 23(2), pp.87-92.
7. Bertucci, W., Taiar, R., & Grappe, F. (2005). Differences between sprint tests under laboratory and actual cycling conditions. J Sports Med Phys Fitness, 45(3), pp.277-283.
8. Cheuvront, S.N., Carter, R., & Sawka, M.N. (2003). Fluid balance and endurance exercise performance. Curr Sports Med Rep, 2(4), pp.220-208.
9. Heil, D.P., Wilcox, A.R., & Quinn, C.M. (1995). Cardiorespiratory responses to seat-tube angle variation during steady-state cycling. Med Sci Sports Exerc, 27(5), pp.730-735.
10. Dias, M.C., Silva, A.C., Júnior, J.M., Lima, J.R., & Novaes, J.S. (2007). Effect of pedal cadence on mechanical power output and physiological variables. Rev Bras Cineantropom Desempenho Hum, 9(3), pp.271-276.
11. Duc, S., Bouteille, T., Bertucci, W., Pernin, J.N., & Grappe, F. (2006). Comparison of pedalling EMG activity between when cycling on stationary ergometer and motorised treadmill. Sci Sports, 21(5), pp.309-312.
12. Duc, S., Villerius, V., Bertucci, W., & Grappe, F. (2007). Validity and reproducibility of the ErgomoPro Power Meter compared with the SRM and Powertap Power Meters. Int J Sports Physiol Perform, 2(3), pp.270-281.
13. Gardner, A.S., Martin, J.C., Martin, D.T., Barras, M., & Jenkins, D.G. (2007). Maximal torque- and power-pedaling rate relationships for elite sprint cyclists in laboratory and field tests. Eur J Appl Physiol, 101(3), pp.287-292.
Brito et al. / Maximal cycling tests under velodrome and laboratory conditions JOURNAL OF HUMAN SPORT & EXERCISE
16 | 2014 | ISSUE 1 | VOLUME 9 © 2014 University of Alicante
14. González-Alonso, J., Teller, C., Andersen, S.L., Jensen F.B., Hyldig, T., & Nielsen, B. (1999). Influence of body temperature on the development of fatigue during prolonged exercise in the heat. J App Physiol, 86(3), pp.1032-1039.
15. Hawley, J.A., & Noakes, T.D. (1992). Peak power output predicts maximal oxygen uptake and performance time in trained cyclists. Eur J App Physiol, 65(1), pp.79-83.
16. Hunter, A.M., St Clair Gibson, A., Mbambo, Z., Lambert, M.I., & Noakes, T.D. (2002). The effects of heat stress on neuromuscular activity during endurance exercise. Pflugers Arch, 444(6), pp.738-743.
17. Lucía, A., Hoyos, J., & Chicharro, J.L. (2001). Preferred pedaling cadence in professional Cycling. Med Sci Sports Exerc, 33(8), pp.1361-1366.
18. Lucía, A., Hoyos, J., Pérez, M., & Chicharro, J.L. (2000). Heart rate and performance parameters in elite cyclists: a longitudinal study. Med Sci Sports Exerc, 32(10), pp.1777-1782.
19. Lucía, A., Hoyos, J., Santalla, A., Earnest, C., & Chicharro, J.L. Tour de France versus Vuelta a España: which is harder? Med Sci Sports Exerc, 35(5), pp.872-878.
20. Lucía, A., San Juan, J.A., Montilla, M.V., Canete, S., Santalla, A., Earnest, C., & Pérez, M. In professional Road Cyclists, low pedaling cadences are less efficient. Med Sci Sports Exerc, 36(6), pp.1048-1054.
21. Marfell-Jones, M.J., Olds, T., Stewart, A.D., & Carte, L. (2006). International standards for anthropometric assessment. Potchefstroom University for CHE, Potchefstroom, South Africa: International Society for the Advancement of Kinanthropometry (ISAK).
22. Marsh, A.P., & Martin P.E. (1998). Perceived exertion and the preferred Cycling cadence. Med Sci Sports Exerc, 30(6), pp.942-948.
23. McCann, D.J., & Adams, W.C. (2002). A dimensional paradigm for identifying the size-independent cost of walking. Med Sci Sports Exerc, 34(6), pp.1009-1017.
24. Millet, G.P., Tronche, C., Fuster, N., Bentley, D.J., & Candau, R. (2003). Validity and reliability of the Polar® S710 Mobile Cycling Powermeter. Int J Sports Med, 2003, 24(3), pp.156-161.
25. Padilla, S., Mujika, I., Cuesta, G., Polo, J.M., & Chatard, J.C. (1996). Validity of a velodrome test for competitive road cyclists. Eur J Appl Physiol Occup Physiol, 73(5), pp.446-451.
26. Prins, L., Terblanche, E., & Myburgh, K.H. (2007). Field and laboratory correlates of performance in competitive cross-country mountain bikers. J Sports Sci, 25(8), pp.927-935.
27. Pugh, L.G. (1971). The influence of wind resistance in running and walking and the mechanical efficiency of work against horizontal or vertical forces. J Physiol, 213(2), pp.255-276.
28. Rowell, L.B., & O’Leary, D.S. (1990). Reflex control of the circulation during exercise: Chemoreflexes and mechanoreflexes. J Appl Physiol, 69(2), pp.401-418.
29. Sidossis, L.S., Horowitz, J.F., & Coyle, E.F. (1992). Load and Velocity of Contraction Influence Gross and Mechanical Efficiency. Int J Sports Med, 13(5), pp.407-411.
30. Swain, D.P. (1994). The influence of body mass in endurance bicycling. Med Sci Sports Exerc, 26(1), pp.58-63.
31. Tatterson, A.J., Hahn, A.G., Martin, D.T., & Febbraio, M.A. (2000). Effects of heat stress on physiological responses and exercise performance in elite cyclists. J Sci Med Sport, 3(2), pp.186-193.
32. Whipp, B.J., & Rossiter, H.B. (2005). The kinetics of oxygen uptake: physiological inferences from the parameters. In: Oxygen Uptake Kinetics in Sport, Exercise and Medicine, edited by Jones AM, Poole DC (pp.62-94). London: Routledge.