A domain-specific language for patchy landscape modelling: The Brittany agricultural mosaic as a...
11
ecological modelling 194 ( 2 0 0 6 ) 233–243 available at www.sciencedirect.com journal homepage: www.elsevier.com/locate/ecolmodel A domain-specific language for patchy landscape modelling: The Brittany agricultural mosaic as a case study C´ edric. Gaucherel a,b,∗ , Nathalie Giboire a , Val´ erie Viaud a,c , Thomas Houet d , Jacques Baudry a , Franc ¸oise Burel e a INRA SAD-Armorique, 65 rue de Saint-Brieuc, CS 84215, 35042 Rennes Cedex, France b INRA–EFPA, UMR AMAP, 34398 Montpellier Cedex 5, France c UMR SAS, INRA–Agrocampus, 65 rue de Saint-Brieuc, CS84215, 35042 Rennes Cedex, France d COSTEL UMR 6554, Universit´ e Rennes 2, Place du Recteur Henri Le Moal, 35043 Rennes Cedex, France e UMR 6553, ECOBIO, Avenue du G´ en´ eral Leclerc, 35 042 Rennes Cedex, France article info Article history: Available online 6 January 2006 Keywords: Categorical landscape Dynamic Modelling platform Farm practices Spatial pattern abstract Recent developments in landscape ecology have emphasised the functional role of hetero- geneity of mosaics such as a “patchworks” of agricultural fields. Explicit (process) landscape models are important tools to study this functional role, although very few model are dedi- cated to patchy landscape dynamics. We construct such a model (L1) manipulating patches (polygons) instead of pixels by a combination of pure attributive or geometrical modifi- cations. In addition, our aim was to build a perennial and dynamic software platform. Hence, the L1 platform contributes to the design of distinct scenarios, as well as distinct models of (forested, agricultural, suburban...) landscapes. It is designed around a kernel modelling, a generic patchy landscape that could be progressively driven to follow nat- ural (climatic, ecological...) forces and human (sociological, economical...) decisions. We present, here, the first model of the L1 platform with an application on a Brittany agricul- tural landscape and four simplified scenarios. We focused on human decisions driving the patchy mosaic and demonstrated the importance of taking into account the different deci- sion levels, from the main characteristics of the European Common Agricultural Policies (CAP) to the farmer individual land use allocation. Results are a set of rules that reproduces Brittany landscape evolutions with increasing complexity driving-decisions, and therefore, with increasing realism degree. They illustrate part of the L1 platform flexibility. © 2005 Elsevier B.V. All rights reserved. 1. Introduction Landscape modelling developed rapidly in the recent year. A landscape is defined here by a spatial assemblage of ele- ments in simultaneous and multiscale interactions, leading to different dynamics (Forman and Gordon, 1981). Existing landscape simulation methods can be roughly classified in three groups: interpolations such as geostatistical ones, neu- ∗ Corresponding author. Tel.: +33 2 23 48 57 72; fax: +33 2 23 48 56 20. E-mail address: [email protected] (C ´ edric. Gaucherel). tral models and processes explicit models (EM) (Turner and Gardner, 1991; Saura and Martinez-Millan, 2000). Interpola- tion methods simulate the spatial distribution of variables, using statistical as well as multiscale properties of the pattern to be simulated (Kyriakidis, 2003). Neutral landscape models are those that produce an expected pattern in the absence of specific landscape processes (With and King, 1997). They are complementary to the EM simulation models, such as the 0304-3800/$ – see front matter © 2005 Elsevier B.V. All rights reserved. doi:10.1016/j.ecolmodel.2005.10.026
-
Upload
independent -
Category
Documents
-
view
0 -
download
0
Transcript of A domain-specific language for patchy landscape modelling: The Brittany agricultural mosaic as a...

e c o l o g i c a l m o d e l l i n g 1 9 4 ( 2 0 0 6 ) 233–243
avai lab le at www.sc iencedi rec t .com
journa l homepage: www.e lsev ier .com/ locate /eco lmodel
A domain-specific language for patchy landscape modelling:The Brittany agricultural mosaic as a case study
Cedric. Gaucherela,b,∗, Nathalie Giboirea, Valerie Viauda,c, Thomas Houetd,Jacques Baudrya, Francoise Burel e
a INRA SAD-Armorique, 65 rue de Saint-Brieuc, CS 84215, 35042 Rennes Cedex, Franceb INRA–EFPA, UMR AMAP, 34398 Montpellier Cedex 5, Francec UMR SAS, INRA–Agrocampus, 65 rue de Saint-Brieuc, CS84215, 35042 Rennes Cedex, Franced COSTEL UMR 6554, Universite Rennes 2, Place du Recteur Henri Le Moal, 35043 Rennes Cedex, Francee UMR 6553, ECOBIO, Avenue du General Leclerc, 35 042 Rennes Cedex, France
a r t i c l e i n f o a b s t r a c t
Article history:
Available online 6 January 2006
Keywords:
Categorical landscape
Dynamic
Modelling platform
Farm practices
Spatial pattern
Recent developments in landscape ecology have emphasised the functional role of hetero-
geneity of mosaics such as a “patchworks” of agricultural fields. Explicit (process) landscape
models are important tools to study this functional role, although very few model are dedi-
cated to patchy landscape dynamics. We construct such a model (L1) manipulating patches
(polygons) instead of pixels by a combination of pure attributive or geometrical modifi-
cations. In addition, our aim was to build a perennial and dynamic software platform.
Hence, the L1 platform contributes to the design of distinct scenarios, as well as distinct
models of (forested, agricultural, suburban. . .) landscapes. It is designed around a kernel
modelling, a generic patchy landscape that could be progressively driven to follow nat-
ural (climatic, ecological. . .) forces and human (sociological, economical. . .) decisions. We
present, here, the first model of the L1 platform with an application on a Brittany agricul-
tural landscape and four simplified scenarios. We focused on human decisions driving the
patchy mosaic and demonstrated the importance of taking into account the different deci-
sion levels, from the main characteristics of the European Common Agricultural Policies
(CAP) to the farmer individual land use allocation. Results are a set of rules that reproduces
Brittany landscape evolutions with increasing complexity driving-decisions, and therefore,
with increasing realism degree. They illustrate part of the L1 platform flexibility.
© 2005 Elsevier B.V. All rights reserved.
1. Introduction
Landscape modelling developed rapidly in the recent year.A landscape is defined here by a spatial assemblage of ele-ments in simultaneous and multiscale interactions, leadingto different dynamics (Forman and Gordon, 1981). Existinglandscape simulation methods can be roughly classified inthree groups: interpolations such as geostatistical ones, neu-
∗ Corresponding author. Tel.: +33 2 23 48 57 72; fax: +33 2 23 48 56 20.E-mail address: [email protected] (Cedric. Gaucherel).
tral models and processes explicit models (EM) (Turner andGardner, 1991; Saura and Martinez-Millan, 2000). Interpola-tion methods simulate the spatial distribution of variables,using statistical as well as multiscale properties of the patternto be simulated (Kyriakidis, 2003). Neutral landscape modelsare those that produce an expected pattern in the absenceof specific landscape processes (With and King, 1997). Theyare complementary to the EM simulation models, such as the
0304-3800/$ – see front matter © 2005 Elsevier B.V. All rights reserved.doi:10.1016/j.ecolmodel.2005.10.026

234 e c o l o g i c a l m o d e l l i n g 1 9 4 ( 2 0 0 6 ) 233–243
proposed patchy landscape model (hereafter L1, for LandscapeFirst). The EM reproduces the landscape patterns resultingfrom the activation of certain processes that are explicitlyincluded in the model (Moloney and Levin, 1996; Keller andDungan, 1999; Mouillot et al., 2001). Hence, EM are explanatorymodels and are possibly used on other regions (and sometimesother scales) submitted to the same processes. The models,we are talking about, are numerical simulations able to pro-duce complete dynamical landscape evolutions, i.e. composi-tion (number and proportion of land covers) and configuration(spatial arrangement of these land covers) landscape evolu-tions. Such models have then to be differentiate from Geo-graphical Information Systems (GIS) or remote sensing LandUse and land Cover Change (LUCC) models sometimes calledlandscape models (Muller and Steinhardt, 2003; Agarwal et al.,2004).
Yet, most of the existing EM are grid-based (raster) mod-els using the pixel as the Unitarian element (Lorek andSonnenschein, 1999; Costanza and Voinov, 2003). Pixels areautonomous but not independent. This spatial dependencycreates pixel association reproducing landscape patches. Atthe opposite, the pixel autonomy leads to complex patchshapes (fractal perimeter, fragmented clusters. . .) (Milne,1991). This grid-base is efficient for rather gradual landscapedynamics like forest fire, but appears to be unrealistic in caseof patchy dynamics like crop successions. Landscape ecology
2. Explicit landscape models and humanlandscapes
Since the first reviews of landscape simulations, numerousprojects have been carried out to model landscapes withexplicit processes (EM). The goal of EM is to embody explicittreatments of spatial relations and dependencies with hetero-geneous domains, dynamic feedbacks and various kinds ofinteractions or flows between elements (Baker, 1989; Sklar andCostanza, 1991). One decade ago, computing technology sug-gested to separate spatially explicit models from the others.This is no more relevant and it has been, for instance, proposedto group landscape models according to their degree of speci-ficity, from the program-level support with a general purposebut a high cost of implementation, to the model-level sup-port having a restrictive purpose but much easier and fasterdevelopments (Fall and Fall, 2001). Towards the middle of thisspectrum are found the domain-specific systems (hereafterplatforms), on which we will focus.
Platforms succeed in providing model-level facilities withprogram-level potentialities by reducing the number ofassumptions made about the object being modelled. Thesemodels choose to specify behaviour rather than a parameteri-sation of pre-specified behaviour for their modelled elements.Examples of such platforms in the landscape/ecology area arealready numerous. Among others, SELES has beneficiated of
these thoughts on the platform notion to optimise a quitegeneric landscape-modelling framework (Fall and Fall, 2001). Itpermits users to create models of various forms, including cel-lular automata, individual based simulation, difference equa-tions, discrete-event simulation and spatio-temporal Markovchains. SELES has already been illustrated on population andwildfire issues. STELLA is a tool for graphically building andrunning spatial stock and flow type models and can be cou-pled with the SME driver using an object-oriented approach(Maxwell and Costanza, 1997). RAMAS is a platform dedicatedto meta-population dynamics and support exploration of dif-ferent landscape mosaics (Boyce, 1996). CORMAS is a multi-agent system platforms addressing resource question, with aparticular attention to southern countries issues (Bousquet etal., 2001). It describes the landscape with a raster or a vectormode, in which each agent is an individual scheme communi-cating with others. FORMOSAIC simulates forest dynamics inlandscape mosaics with an individual-based spatially explicitframework (Liu and Ashton, 1998). CAPSIS is also adaptedto forest issues and succeed in modelling stand growth anddynamics in very diversified situations (De Coligny et al., 2004).CAPSIS was imagined to explore the consequences of theunderlying forest mechanism hypotheses or the forest man-agement, on real as well as virtual stands. Authors of CAPSIStried to create a perennial, portable, open and dynamic soft-ware platform. Finally, the LANDIS and TELSA models seemcomplementary to other platforms, by their ability to manip-ulate patches instead of autonomous pixels composing thelandscape (Kurz et al., 2000; Akcakaya, 2001). While LANDISdecomposed the patch within (linked) pixels, TELSA uses aVoronoı tessellation to create polygons superimposed to thelandscape boundaries to modify it. All of these models arepowerful. Nevertheless, it is difficult to build, under thesehas emphasized the importance of the patch–corridor–mosaicconcept to describe spatial ecological processes (Forman andGordon, 1981). This concept stresses the relative homogene-ity of a patch with rather sharp adjacent boundaries (furthercalled a landscape unit) and the heterogeneity of linear net-works, offering either uniform or non-uniform zones to land-scape fluxes (Burel and Baudry, 2003). This landscape descrip-tion refers to a polygonal (vector-mode) definition that appearsto be particularly relevant for human modified mosaics, suchas agricultural or some forested landscapes. Indeed, humanmanagements (and sometimes geomorphological processes)tend to homogenize some parts of natural landscapes, fortheir own use or for cultural reasons (de Blois et al., 2002). Wewill certainly gain by using categorical process explicit mod-els to study these discontinuous landscapes (Gaucherel et al.,2004). The conception of an landscape explicit model is thefirst objective of this study.
Many environmental disciplines need categorical land-scape explicit models, either to understand the landscapedynamics for themselves or to have dynamical mosaicscapable to support various phenomena (e.g. agronomical orforestry studies, of population or ecosystem analyses, of fire orgene dispersion mechanisms) (Flannigan et al., 2000; Hanskiand Ovaskainen, 2000; Manel et al., 2003). This observationcan be interpreted by the need of various models dedicated tospecific objectives or of one modelling platform able to manip-ulate a generic landscape, later decomposed in specific modelsto answer precise questions. The second objective of this workis to build a platform for generic landscape modelling (L1), thatcan be seen as a domain-specific language dedicated to ruralterrestrial landscapes (Fall and Fall, 2001). The goal is to builda perennial but dynamic software platform, designed arounda kernel, which provides an organisational data structure anda generic landscape structure.
e c o l o g i c a l m o d e l l i n g 1 9 4 ( 2 0 0 6 ) 233–243 235
platforms, the domain-specific control and analytical toolsthat are needed by the categorical rural landscape modellers.Hence, we borrowed some particularities well adapted to ourobjectives in mainly two models among the previously men-tioned ones: the “semantic landscape event” notion foundin SELES and the organisational data structures chosen inCAPSIS.
Evidence about the diverse nature of natural factors (cli-matic, ecological, topographic. . .) and their consequences forlandscape evolutions abound in the literature (Flannigan et al.,2000; Veblen et al., 2000). On counterpart, for most landscapes,the dominant dynamic influence has been that of human(political, sociological, economical. . .) activities (Baudry et al.,2000a; de Blois et al., 2002; Kristensen et al., 2004). Thereis an urgent need to integrate those biophysical and socio-economical factors into landscape models (Wiens, 1999). Wewill pay here a particular attention to human-driven factors(hereafter decisions) that often over-rule natural dynamicsand will choose a Brittany agricultural landscape to illus-trate them. Landscape changes due to human causes areexplained by practices changes or because environment hasbeen modified in a way that excludes previous exploita-tion activities (Pan et al., 1999). In turn, vegetation patternsreflect plant (or animal) dynamic adaptations to changes inavailable resources, substrate availability and physical condi-tions induced by human activities. European landscapes, forinstance, have been widely driven by cultural processes, withriiodamaetCblidtAtetclalbfoultcni
sity of usage of the fields within a farm are: the field size, thedistance to farmstead, the farm type (production system) aswell as the field physical properties. It has often been foundto be the most discriminating factor in farmland use alloca-tion (Agarwal et al., 2004; Thenail and Baudry, 2004). Hence, wemake the central hypothesis in our L1 application that thereexists a connection between the land-use organisation and thefarming activities. We intend to contribute by testing differentrule construction to the urgent need to qualify (and quantify)the current connections between farming systems and land-scape organisation (Lambin et al., 2000).
3. The L1 platform and its genericlandscape
L1 is a portable software built to be perennial, portable anddynamic (De Coligny et al., 2004). The objectives of this plat-form were: (a) to contribute to the design of distinct modelsand to compare their results; (b) to share tools and methods;(c) to transfer models to a wide range of potential users; (d)and to serve as teaching material. To achieve these goals, L1has been developed with a modular architecture. It is not yetan object-oriented software, although it often uses moduleclones to mimic algorithm heritages. L1 was designed arounda kernel, which provides an organisational data structure (sce-narios, time steps. . .) and a generic landscape description:
ecently drastic changes in the spatial distribution, nature andntensity of human activities. It has been mentioned how thentensification of practices raises the questions of resiliencef some vegetation types, of human and natural processesiscrepancies, of the resource availability induced by humanctivities and finally, of the origins of the factors that ulti-ately trigger land-use changes (de Blois et al., 2002; Burel
nd Baudry, 2003). Landscape fragmentation, linked to farmnlargement and the development of settlement infrastruc-ures, is increasingly observed in Europe (Barrington, 1987;arsjens and van der Knaap, 2002). It has been accompaniedy a major but variable decrease in hedgerows density in theseandscapes (Baudry et al., 2000b). This wide spatial restructur-ng shows a lack of assessment of the actual mechanisms ofetermining landscape patterns on farms. European agricul-ural landscapes are often driven by the European Commongricultural Policies (CAP) and soon the EU Water directive,
hrough the farm functioning (Burel et al., 1998; Kristensent al., 2004). Land use organisation is tackled at a field levelhrough its land use allocations, at a farm level through theoherence of the land use allocation as a whole, and at theandscape level through the contributions of farms to theggregation of mosaics (Thenail and Baudry, 2004). Overalland cover and landscape patterns can be largely explainedy differences in the geomorphology, and climate as well as inarming systems. The simple implementation of a successionf activities produces by itself a spatial dynamic of the landse mosaic that may be important. Yet, the dynamics of the
and use technical system can also be dynamics of change:he ploughing of permanent grassland to install a crop suc-ession is such a change, as well as the implementation of aew technique of crop management for instance. The most
mportant variables that we identified to explain the diver-
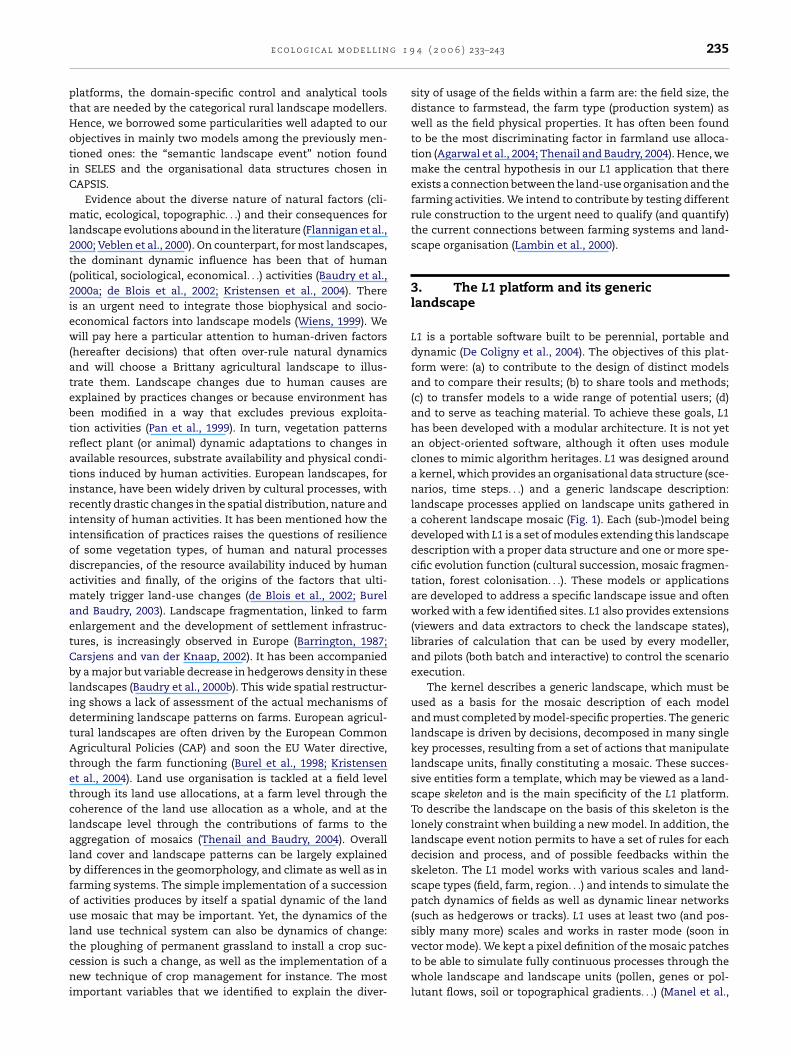
landscape processes applied on landscape units gathered ina coherent landscape mosaic (Fig. 1). Each (sub-)model beingdeveloped with L1 is a set of modules extending this landscapedescription with a proper data structure and one or more spe-cific evolution function (cultural succession, mosaic fragmen-tation, forest colonisation. . .). These models or applicationsare developed to address a specific landscape issue and oftenworked with a few identified sites. L1 also provides extensions(viewers and data extractors to check the landscape states),libraries of calculation that can be used by every modeller,and pilots (both batch and interactive) to control the scenarioexecution.
The kernel describes a generic landscape, which must beused as a basis for the mosaic description of each modeland must completed by model-specific properties. The genericlandscape is driven by decisions, decomposed in many singlekey processes, resulting from a set of actions that manipulatelandscape units, finally constituting a mosaic. These succes-sive entities form a template, which may be viewed as a land-scape skeleton and is the main specificity of the L1 platform.To describe the landscape on the basis of this skeleton is thelonely constraint when building a new model. In addition, thelandscape event notion permits to have a set of rules for eachdecision and process, and of possible feedbacks within theskeleton. The L1 model works with various scales and land-scape types (field, farm, region. . .) and intends to simulate thepatch dynamics of fields as well as dynamic linear networks(such as hedgerows or tracks). L1 uses at least two (and pos-sibly many more) scales and works in raster mode (soon invector mode). We kept a pixel definition of the mosaic patchesto be able to simulate fully continuous processes through thewhole landscape and landscape units (pollen, genes or pol-lutant flows, soil or topographical gradients. . .) (Manel et al.,

236 e c o l o g i c a l m o d e l l i n g 1 9 4 ( 2 0 0 6 ) 233–243
Fig. 1 – Architecture of the L1 landscape-modelling platform. It is designed around a kernel dedicated to categoricallandscapes and support various models. In addition to the pilots, it has numerous libraries and extensions used for spatialmanipulations and controls of the simulated landscapes. This scheme h as been adapted from the CAPSIS Platform (DeColigny et al., 2004).
2003). Yet, the L1 spirit is a fully patchy logic, in a sense oftopology and ecological rules. Examples of the following enti-ties composing the landscape skeleton will be given in theapplication section.
What we call decisions are either natural or human fac-tors driving the landscape evolution. These decisions are setsof landscape events defined by two components: a definitionof the event characteristics (date, frequency, priority and con-sequences in terms of other event calls) and the propertieslandscape changes that define the behaviour and effects ofthe modelled decision (the processes they are composed with,the execution probability, eventually the units and the scalethey are modifying). These modifications are progressive alongtime and can be applied on both real and virtual landscapes.At the opposite of processes, decisions are not explicitly mod-elled by L1 (only implemented), which partly explains whyboth notions have been dissociated. One of the main original-ity of L1 is to authorise attributive as well as geometrical mod-ifications (deformations) of the mosaic uniform units, leadingto composition and configuration evolutions. Attributive mod-ification only implies a change (or no change) of the main unitproperty, as in LUCC models, while geometrical modificationsrefer to a limited number of unit deformations. If changing,each unit can (homothetic or not) dilate or erode, split intotwo or more distinct units, merge with one or more other unitsinto a single unit, appear (with various forms) or disappear.Finally, these actions are applied on landscape units saved
sity to be spatially compatible (superimposed) with the otherscale mosaics.
Each action on units is developed within an independentmodule, gathering one or more algorithms. These modulescan either be used in their original form, or be cloned andmodify to take into account the complexity of real situations.For example, to create a new network segment, whatever isthe network, needs a simple algorithm selecting a set of pix-els along a unit edge. To create a new hedgerow, which is inessence the same operation, needs a more complicated mod-ule using many criteria to manipulate pixels of the closestunit concerned: this module first identifies the unit perime-ter pixels (either inside or outside the unit polygon), then stopon each of them to detect their neighbours, hence identify-ing the neighbouring units they belong to, to select amongthem one or more units according to their main attributes,their hydromorphy degrees or their farms properties storedin another landscape layer. If conditions are favourable tothis hedgerow building, pixels concerned will be stored in anew data structure and be removed from their origin belong-ing unit. Finally, each landscape process is a combination ofthe previous actions that are sequentially executed. For exam-ple, to increase parcel sizes within a farm suggests to repeatunit aggregations, already combining hedgerow removals (ifneeded) and unit merges. This can also be done by unit dila-tion. The majority of the unit actions are operations on aselected set of pixels and a study of their belonging unit prop-
in a “computing structure”. Each unit is defined by a set offields: an identifying number, its main property (often the landcover), the list of pixel coordinates (in 3D, if necessary) and amatrix gathering additional information (neighbouring unitsnumbers, links with other scale units. . .). This saving structureis the mosaic in itself and is sufficient to define the landscape,at least at a particular scale. Farms or other scale entities needa similar unit structure to be defined and used, with the neces-
erties. It needs a permanent dialog between the raster mosaicand the vector definition of the landscape. Note that a full vec-tor description of the landscape would probably simplify andaccelerate this dialog, but not remove it, because of the grad-ual landscape processes (flows for instance).
The kernel was designed to give stability to L1. Toolboxesaiming at analysing environmental indices of the landscapeare also available. It is based on the landscape ecology con-

e c o l o g i c a l m o d e l l i n g 1 9 4 ( 2 0 0 6 ) 233–243 237
cepts to a large extent, but toolboxes calculations have beenimproved to compute connectedness heterogeneity (conta-gion) and other indices of the landscape at each place andat each scale of the patchy mosaics (Li and Reynolds, 1994).Besides housing landscape dynamics models, L1 hosts vari-ous libraries, which mainly concern spatial operations up tonow (Fig. 1). Several libraries have been developed to improvethe spatial handling of the simulated landscape. In particu-lar, specific algorithms permit to handle sets of points, linearnetworks or a mosaic of adjacent polygons with a fully con-trolled scheme. Finally, L1 architecture was designed to enablesimulations to be run in either interactive or automatic mode,which either described a list of scenarios to be compared, orseveral replication of one single scenario. The latter can beused to evaluate the influence of various input parameters orthe effects of stochastic issues and to help calibrate models.The L1 platform ensures the integration of very different kindsof categorical landscapes. The modellers can freely choose thedata structures, the driving-decisions and processes, the sim-ulation steps, the level of detail of the description and thechosen scales. The following application describes one of themodels currently under development, with a particular focuson human-driven landscape evolutions.
4. Application: a human-driven landscape
Tdaertidsaiid(
4
TNuofscnlri9whth
initial land cover image was obtained by photo-interpretationof aerial photographs, but checking occurred via field con-trol, use of topographic maps and agricultural statistics. Ourclassification retained the following land uses: maize (no. 10),fallow land (12), permanent (9) and temporary (8) grasslands,forests (7), other crop productions (11) and other land cov-ers (mainly rivers (4), roads (3) or buildings (6)). The “othercrop production” category gathers cereal and vegetable fields.Hydromorphy has been estimated by simulation from the 50 mIGN digital terrain model and classified in three categories dis-tinct to the river network, using the climato-topographic index(Merot et al., 2003).
4.2. Driving-decisions
As the landscape configuration will stay quite stable for all thescenarios, we choose to use for each simulation the field limitsand LUCC extracted from the map of the real landscape in theyear 1996. Simulations are concerned by composition (LUCC)and configuration changes. We ran simulations over 30 yearswith an annual time step, to broadly reflect the 1980–2010plausible Brittany landscape evolution. The chosen decisionsare constant along the simulation scenarios, but the presenceof a decision appearing to the 12th year (to simulation a simpli-fied CAP reform in 1992) explains the simulation time duration.No diachronic observations were available on this landscapefor this period, although its spatial evolution has been studied
he objective of this L1 application is to explore influences ofistinct combining decisions on the landscape organisationnd to feature the central role of farm systems (Kristensent al., 2001; Thenail and Baudry, 2004). We tried to simulateeal (or plausible) Brittany agricultural landscape evolutionshrough four different simplified scenarios showing increas-ng decisions complexity. Empirical analyses of the spatialistribution of land uses at farm and field scales made it pos-ible to sort out rules that regulate this distribution (Baudry etl., 2004a; Thenail and Baudry, 2004). The modelled landscapes a dynamical space that may be approximately defined by itsnitial state and its driving factors. Hence, we will successivelyetail in this section: (a) the data, (b) the driving-decisions and
c) the landscape indices chosen.
.1. Data
he study site, site A of Pleine-Fougeres South (PFS), is locatedorth of Ille-et-Vilaine (Brittany, Western France). It is sit-ated in an agricultural context of dairy production, basedn extensive grasslands, and few intensive cereal fields andorests (Fig. 2). Data comes from a research project of Frenchite surveys aiming at analyzing biodiversity in European agri-ultural landscapes and especially the influence of hedgerowetworks (Baudry et al., 2000b; Le Coeur et al., 2002). The
andscape covers approximately 66.9% of a ∼3.71 km × 3.91 kmectangle, with a 7 m resolution (pixel size), chosen to discrim-nate the hedgerows from the surroundings. The PFS site has89 agricultural units and a simulated total hedgerow net-ork length of ∼89.6 km, compared to the ∼130.83 km realedgerow network (land cover code no. 2). For a better con-rol of initial conditions, indeed, we re-built 1239 continuousedgerows between agricultural fields (2269 units in total). The
for a long while. This is the reason why we validated scenar-ios by a comparison analysis between the fourth scenarios.For three decades or more, the permanent grassland surfacearea of this region is slowly decreasing, while the fodder cropsfields are multiplying (Burel et al., 1998). The hedgerow net-work, following the fields’ dynamics and progressively reduc-ing, appears to be crucial in terms of constraints for biologicalor geochemical flows (Burel et al., 1998; De la Pena et al., 2003).Driving decisions of landscape dynamics in the Brittany caseare human-driven factors and refer mainly to the EuropeanCommon Agricultural Policies (CAP), to the EU Water direc-tive and to farmer individual land use allocation (Burel andBaudry, 2003; Thenail and Baudry, 2004). To simplify thesecomplex driving decisions and illustrate the L1 abilities, weidentified at least eight processes linked to these decisions:hedgerow planting and removal, landscape unit aggregation(with or without hedgerow removal between them), land useallocation (either random, or from crop to fallow or permanentgrasslands) and land use rotations according to random choiceor to the mean units hydromorphy or/and to farm allocation.Each process has set of rules or criteria (geometrical, attribu-tive, scaling and zoning rules), combined if necessary with aprobability to occur if these rules are operating. Processes arenot simultaneous and need a priority queue or a random callto manage their actions. To apply these processes, except ifmentioned, we choose both a random call of the actions anda random choice of the landscape units concerned. Due tothis stochasticity, it is possible to test the general behaviourof the decisions by roughly equivalent ways: either by dupli-cating each scenario with stochastic variations (Monte Carlotechnique) or by multiplying the process applications on themosaic to get a high combination of successive processes.The second approach was slightly easier to implement and

238 e c o l o g i c a l m o d e l l i n g 1 9 4 ( 2 0 0 6 ) 233–243
Fig. 2 – The site studied (PFS landscape), without (top left) and with the hedgerow network (top right, in black), thehydromorphy map (bottom left) and the 10 farm areas map (bottom right). Hydromorphy levels are equal to 1 (low) to 3(high), while 4 is the river network. The land cover colour map (from 1 to 14) successively concerns: the background,continuous and discontinuous hedgerows, roads, rivers, tracks, buildings, forests, permanent and temporary grasslands,maize, cereals, fallows and soils.
was, then, chosen. Hence, we implemented ∼10 replicationsof each action involved in this application, except for the ran-dom and farm land use allocations, done only once per field.According to these decisions and processes, we choose to buildfour simplified scenarios progressively taking into account thecomplexity of the landscape driving factors:
A. Fully random landscape processes. This may be seen as a refer-ence scenario. While the rules are far from being determin-istic at the landscape level, one can assume that a land-scape simulated from realistic rules differs significantlyfrom a landscape driven by modifying rules randomly cho-sen (Ruiz et al., 2004). The processes involved here are:random attributive change, random units couple aggrega-tion, random planting and removal hedgerows. Attributivechanges are agricultural land use changes and is the onlyaction exclusively concerning the landscape composition.The other actions concern the landscape configuration.The hedgerow actions are randomly called 10 times peryear and per action in average.
B. Simplified CAP and CAP reform (starting in year 12) decisions.CAP application without the farming activities filter is
unrealistic but offers a reference for the attributive andgeometrical landscape modifications. These actions aretwofold: random unit aggregation, attributive change andremoval hedgerow on one hand (same as the first sce-nario), and attributive changes from maize and cereals tofallow and temporary grasslands on the other hand (for theCAP reform only). Fallow and temporary grasslands havea threshold size of 0.5 and 1 ha respectively and are sur-rounded by planted hedgerows.
C. Land hydromorphy constraining simplified CAP and CAP reformdecisions. A significant proportion of small permanentgrasslands, fallows and woodlands characterize the ripar-ian zone. When the farm riparian area is large, the farmerwill need to use it in various ways in order to make thebest use of it (Thenail and Baudry, 2004). Hence, we usedthe dominant hydromorphy of all the agricultural unitsand took them into account when applying the attribu-tive changes: the largest grasslands and fallow lands, farfrom the river, are not allowed (Fig. 2). Except for this point,actions are the same than for the previous scenario.
D. Farm scale land use allocation and land hydromorphy constrain-ing simplified CAP and CAP reform decisions. As we previously

e c o l o g i c a l m o d e l l i n g 1 9 4 ( 2 0 0 6 ) 233–243 239
suggested, we will only consider the field size to influ-ence the attributive changes: the relative surface have beenchosen as 37, 37 and 26% of the total farm surface forgrasslands, maize and cereals respectively (Thenail andBaudry, 2004). Previous scenarios have equiprobable landcover areas (∼33% each). Hence, there exist only one farmtype in our landscape, with ∼100 ha surface area in average(10 farms). These land use changes are randomly appliedonce a year for all the agricultural units, such that thewhole farmland use is modified according to the surfaceproportions. Except for this point, actions (and action calls)are the same than for the previous scenario. This scenarioalso supposed to automatically define the farms (thesedata were missing) by progressively gathering the land-scape units from close randomly chosen farmsteads.
4.3. Landscape indices
Here, we forgot purely structural indices such as fragmenta-tion or shape indices available in the landscape pattern indiceslibraries of L1 extensions. Except for one generic heterogene-ity quantification (the contagion index), we preferred to focuson indicators dedicated to the agronomical context of thisapplication. We used scenarios comparison to test the real-ism of landscape compositions and configurations on the PFSsite. Four groups of measures have been selected to estimatethe statistical landscape property variations. First, we con-sgiipmybonrszfmpahicasctefil1ntttS
L1 models. For information, the following PFS site scenariosrespectively take around 0.7, 3.8, 21.6 and 23.9 h on a PC com-puter with a Pentium IV© and a 2.4 GHz clock.
5. Results
For each simulation (∼10 replications of each hedgerow oraggregation action and one land use allocation per agricul-tural field), we compute the density of the various land uses,as well as spatial statistics, as the position of the land uses tostream. A first result is that randomly generated landscapesdrastically differ from the other rule-based simulations. Forthe latter, differences show up between different sets of rules.As simulations are made with landscape unit entities, a ruleapplied on a specific land cover will modify its abundance (pro-portion) and/or position (spatial distribution) in the landscape.In addition, the 30 years scenarios offer global trends as wellas scenario bifurcations (at year 12) of the corresponding land-scape measures.
The final landscape mosaics show local variations betweenthe four scenarios (Fig. 3). While the random scenario leadsto heterogeneous land uses, the CAP scenario increases thenumbers of grassland and fallow units (colours no. 8, 9 and12), without particular positions. The hydromorphy scenarioreduces their number and imposes particular positions forthese units, while the farm scenario drastically modifies the
idered in a first approximation that the maize mosaic is aood indicator to agricultural intensification. This land uses also concentrating most of the organic fertilization. Theres usually a gradient of level of fertilization from set-aside toermanent grassland, then cereals and maize. Hence, we esti-ated the maize presence frequency during the 30 simulated
ears on every agricultural field and compared this histogrametween the scenarios. The mean maize density is simultane-usly computed. Secondly, the distance of a field to the riveretwork has been found to be a good indicator of the pollutionisks (Baudry and Thenail, 2004b). Brittany landscapes indeedeem to have specific land covers and land uses in riparianones. We computed this differentiation from stream to uphillor each agricultural field in the landscape. Thirdly, we esti-
ated the mean hedgerows density along time, as it couldlay an important role biological and chemical flows. Heregain, there are relationships between types of farm house-old/enterprise and their location on a gradient of decreas-
ng density of hedgerows (Baudry et al., 2000b). Finally, weomputed the heterogeneity (contagion), which synthesizesveraged connections between land uses over the whole land-cape (Li and Reynolds, 1994). Connections between differentrop fields partly regulate biological and geochemical fluxes inhe landscape (Burel and Baudry, 2003). Hence, we are inter-sted in the global landscape structure, more than a specificeld response. For comparison, observed measures are as fol-
ows: the 1996 land use proportions are equal to ∼74.3, 18.9 (or4.5% of the total mosaic) and 6.8% of the total landscape (andot per farm) for grasslands, maize and cereals respectively;he mean normalized contagion is equal to ∼0.0337, includinghe real hedgerow network; grasslands and fallows are effec-ively found to be the dominant land uses nearby the rivers.pecific MATLAB® algorithms have been developed for all the
grassland and cereal land uses spatial distributions, as wellas proportions. While closer to the real landscape, a fineinspection of the last scenario reveals underestimation of thecereal surface. This is due to the simple rules used to rotatefield attributes and suggests that more elaborate rules (usinggrassland ages, farmstead positions, etc.) would improve thesimulation. Averaged distributions and their temporal varia-tions can be analysed using synoptic parameters. Mean con-tagion evolutions, for instance, reveal a quite homogeneousbehaviour between scenarios, except the last one (Fig. 4). TheCAP reform decision in the second scenario shows statisticallyhigher landscape heterogeneity than for the random scenariodue to the grassland and fallow rotations, while lower val-ues are observed for the farm scenario (very close to the realvalue ∼0.034). In the CAP scenario, the first scenario involv-ing the CAP reform, a clear increase of heterogeneity appearsat year 12 and is caused by the fallow and grassland surfaceincreases. The hydromorphy influence and the additional sizecriteria of rotating units tend to reduce this heterogeneity,yet not uniformly in space. Mean hedgerow density evolu-tions reflect the random and grassland perimeter hedgerowplantings and removals (Fig. 4). They basically decrease for allscenarios but the hedgerow planting around new grasslands,that are more numerous in the last scenario, increases theabsolute hedgerow density. The farm scenario also has a morerealistic hedgerow networks (in terms of spatial distribution).
Mean maize density evolutions stay quite stable betweenthe four scenarios (not shown), although the maize unit posi-tions and their frequency of appearance could drastically dif-fer. The farm scenario has a 20.5 ± 1% maize density, closerto the real value (∼19%) than other scenarios (14.5 ± 2%). Themean maize frequency distribution is the number of maizeallocations of each agricultural unit, divided by the simulation

240 e c o l o g i c a l m o d e l l i n g 1 9 4 ( 2 0 0 6 ) 233–243
Fig. 3 – Final landscape mosaics (year 2010) for scenarios: random, A (top left); CAP, B (top right); with hydromorphy, C(bottom left); farms, D (bottom right). See text for details. White arrows, river arms or farm limits superimposed to thelandscapes highlight some of the features caused by the concerned scenario specificities.
Fig. 4 – Heterogeneity contagion (left) and mean hedgerow densities evolutions (right) for the four scenarios (scenarios:random A, solid; CAP B, doted; hydromorphy C, dashed-doted; farms D, dashed). Black dashed lines on the contagion curvesfeature the CAP reform at year 12 and the mean contagion of the real landscape measured at years 1996 and 2000. The blackarrow highlight the shift of the mean hedgerow density caused by the farm constraint (and the grassland appearing) in theD scenario.

e c o l o g i c a l m o d e l l i n g 1 9 4 ( 2 0 0 6 ) 233–243 241
Fig. 5 – Maize frequencies over 30 years (left) and distances of all the agricultural land uses to the river network in 10classes (right), for the 4 scenarios. The grey levels on the distance histograms range from land cover 8–12 (see Fig. 2). Themaximum distance class (no. 10) is ∼900 m.
duration (30 years), and gathered in 10 classes (Fig. 5). Thismeasure seems sensitive to the scenario chosen: the CAP sce-nario modifies the random scenario distribution by shiftingit to the high frequencies (short term appearances); sameobservation for the hydromorphy scenario slightly reducingthe maize frequency (due to the grassland–maize transforma-tions close to the rivers). In addition, it is coherent to observea higher mean frequency equals to ∼0.4 (12 years) for the farmscenario: this slow maize rotation is caused by the empiricalfarm allocations. While this mean is still unrealistic, it provesthat one simple rule linked to another landscape organisationlevel (the farms) can greatly improve the realism of a simula-tion. Finally, distances to the hydrographical network correctlyshow a slight differential allocation for some land uses (Fig. 5).The hydromorphy scenario features the dominant grasslandsand fallows close to the rivers, but this preferential distri-bution seems either negligible or rather difficult to simulate.In addition to these global controls, L1 produces movies onthe simulations, authorising simultaneous local and dynamicanalyses of the scenarios. For example, it is easy to focus ina village surroundings during whole or part of the simula-tion, to visualise the landscape dynamics as would do an earthobserver satellite.
6. Discussion and conclusion
Tstpcsdcurp
ities landscape organisation. Land use allocation as well ashedgerow network dynamics appear to be quite sensitive tothese environmental conditions, but are correctly simulatedin average.
This work studied the simplified CAP, hydromorphy andfarm influences that can be very locally and timely quantifiedthanks to specific structural or agricultural landscape indices.Considering the rule-simulated landscapes, it is worth notingthat different rules can generate similar patterns. The globalsimulation trends give contagion, maize frequencies and dis-tances of agricultural land uses to the river network over 30years: it helps, at least qualitatively, to forecast economicaland ecological decisions. On an agricultural point of view, ourmain result could be summarized in the maize frequenciesdistribution modelled over the 30 years of simulation (Fig. 5).In the first three scenarios, maize fields are roughly uniformlydistributed over the landscape. Taking into account the farmlimits, a new landscape organisation level, forces maize fieldsto come back more frequently at specific places, which is morerealistic (Ruiz et al., 2004). Hence, this farm level appears to bea key factor to explain these landscape dynamics. Simulationsfit quite well the real landscape measures, but more detailedrules (in progress) will certainly lead to landscape structurescloser to the ones observed in nature.
This study is a preliminary but promising work. It is prelim-inary because we only presented here one application of thislandscape platform. Many other L1 applications (with forested
he L1 program is able to simulate complex categorical land-capes with quite simple rules. The results of this work showhat it permits to applied different agricultural scenarios onatchy mosaics. L1 is a landscape-modelling platform dedi-ated to categorical mosaics thanks to its generic landscapekeleton notion. It appears to be efficient to simulate human-riven landscapes at fine scale such as the European agri-ultural or forested contexts. We used it to examine landses (composition) and land use patterns (configuration) fromather different point of view, with a particular focus on theotential impacts of hydromorphic conditions and farm activ-
landscapes, with metapopulations, with paleo-landscapes,etc.) are now in progress. Their incompleteness and the avail-able place prevented us to described them in this article. It isalso preliminary because we choose in this study to validatethe landscape simulations by a detailed comparison analy-sis between distinct scenarios and simulations. This choicehas been partly made to illustrate the ability of L1 to producevarious and increasingly plausible scenarios. In the ambitiousoption of a global model, some adapted specific experimen-tations would certainly be necessary to calibrate (for fore-casts) and validate the landscape simulations. Yet, this work

242 e c o l o g i c a l m o d e l l i n g 1 9 4 ( 2 0 0 6 ) 233–243
is promising because it is one of the first categorical landscapesimulations with a process explicit model, gathering attribu-tive as well as geometrical unit handling. It shows how it ispossible, and even relevant, to model landscape on the basisof some of the landscape ecology concepts.
Landscape modelling is a necessity, as complete experi-mentation cannot be done on land use and farmers choices.Yet, the land use allocation within farms has to be more pre-cisely described (with the other driving factors mentioned atleast). An important question concerns the potential feed-backs between changes in farm type and changes in farm terri-tories and how to combine policies in land planning and mar-ket policies. The modelling approach as a whole also needsto be extended, for instance by taking into account of otherphysical environment conditions: soil, runoff and/or biophys-ical models should be coupled to the landscape modelling.Such global models would be adapted to qualitative as wellas quantitative objectives, either to understand the landscapedynamics for themselves or to dispose of dynamical mosaicscapable to support various phenomena. Our main objectivewas to propose a methodology to test ecological hypotheseson categorical landscape by the way of modelling. Anotherpurpose was to develop a tool to assess the environmentalconsequences of public policies and technological changeson rather different landscape issues. The making of scenar-ios may also help land managers to globally assess importantchanges. In this way, the L1 model permits to analyse (spa-
r
Baudry, J., Thenail, C., 2004b. Interaction between farmingsystems, riparian zones, and landscape patterns: a casestudy in western France. Landscape Urban Plan. 67, 121–129.
Bousquet, F., Le Page, C., Bakam, I., Takforyan, A., 2001.Multiagent simulations of hunting wild meat in a village ineastern Cameroon. Ecol. Model. 138, 331–346.
Boyce, M., 1996. Review of RAMAS/GIS. Quart. Rev. Biol. 71,167–168.
Burel, F., Baudry, J., 2003. Landscape Ecology: Concepts,Methods, and Applications, xvi. Science Publishers, Enfield,N.H, p. 362.
Burel, F., Baudry, J., Butet, A., Clergeau, P., Delettre, Y., Le Coeur,D., Dubs, F., Morvan, N., Paillat, G., Petit, S., Thenail, C.,Brunel, E., Lefeuvre, J.C., 1998. Comparative biodiversityalong a gradient of agricultural landscapes. Acta Oecol.-Int.J. Ecol. 19, 47–60.
Carsjens, G.J., van der Knaap, W., 2002. Strategic land-useallocation: dealing with spatial relationships andfragmentation of agriculture. Landscape Urban Plan. 58,171–179.
Costanza, R., Voinov, A. (Eds.), 2003. Spatially ExplicitLandscape Simulation Modeling (Modeling DynamicSystems), Springer-Verlag, p. 384.
de Blois, S., Domon, G., Bouchard, A., 2002. Landscape issues inplant ecology. Ecography 25, 244–256.
De Coligny, F., Ancelin, P., Cornu, G., Courbaud, B., Dreyfus, P.,Goreaud, F., Gourlet-Fleury, S., Meredieu, C., Orazio, C.,Saint-Andre, L., 2004. Capsis: computer-aided projection forstrategies in silviculture: open architecture for a sharedforest-modelling platform. In Proceedings of the IUFRO
tially and temporally, qualitatively and quantitatively) mostof the processes that drive changes in landscape patterns andecological functioning.
Acknowledgements
Funding was received from the Energy, Environment and Sus-tainable Development Program (FP5) of the European Commis-sion (contact number EVK2-CT-2000-00082, GREENVEINS).
e f e r e n c e s
Agarwal, C., Green, G.M., Grove, J.M., Evans, T.P., Schweik, C.M.,2004. A review and assessment of land-use change models:dynamics of space. In: Time and Human Choice. USDA,Washington.
Akcakaya, H.R., 2001. Linking population-level risk assessmentwith landscape and habitat models. Sci. Total Environ. 274,283–291.
Baker, W.L., 1989. A review of models of landscape change.Landscape Ecol. 2, 111–135.
Barrington, M.J., 1987. Farm fragmentation: a case study fromCoventry’s urban fringe. Geoforum 18, 237–245.
Baudry, J., Bunce, R.G.H., Burel, F., 2000b. Hedgerows: aninternational perspective on their origin, function andmanagement. J. Environ. Manage. 60, 7–22.
Baudry, J., Burel, F., Aviron, S., Martin, M., Ouin, A., Pain, G.,Thenail, C., 2004a. Temporal variability of connectivity inagricultural landscapes: do farming activities help?Landscape Ecol. 18, 303–314.
Baudry, J., Burel, F., Thenail, C., Le Coeur, D., 2000a. A HolisticLandscape Ecological Study of the Interactions betweenFarming Activities and Ecological Patterns in Brittany,France. Landscape Urban Plan. 50, 119–128.
Working Party S5.01-04 Conference, September 2002,Harrison, British Columbia, Canada, pp 371–380.
De la Pena, N.M., Butet, A., Delettre, Y., Morant, P., Burel, F.,2003. Landscape context and carabid beetles (Coleoptera:Carabidae) communities of hedgerows in western France.Agr. Ecosyst. Environ. 94, 59–72.
Fall, A., Fall, J., 2001. A domain-specific language for models oflandscape dynamics. Ecol. Model. 141, 1–18.
Flannigan, M.D., Stocks, B.J., Wotton, B.M., 2000. Climate changeand forest fires. Sci. Total Environ. 262, 221–229.
Forman, R.T.T., Gordon, M., 1981. Patches and structuralcomponents for a landscape ecology. BioScience 31, 733–740.
Gaucherel, C., Fleury, D., Auclair, A., Baudry, J., Dreyfus, P., 2004.Forest modelling based on landscape ecology concepts.Landscape ecology of trees and forests. In: Proceedings ofthe 12th Annual IALE(UK) Conference, pp. 309–312.
Hanski, I., Ovaskainen, O., 2000. The metapopulation capacityof a fragmented landscape. Nature 404, 755–758.
Keller, R.M., Dungan, J.L., 1999. Meta-modeling: aknowledge-based approach to facilitating process modelconstruction and reuse. Ecol. Model. 119, 89–116.
Kristensen, S.P., Thenail, C., Kristensen, L., 2001. Farmers’involvement in landscape activities: an analysis of therelationship between farm location, farm characteristics andlandscape changes in two study areas in Jutland, Denmark.J. Environ. Manage. 61, 301–318.
Kristensen, L.S., Thenail, C., Kristensen, S.P., 2004. Landscapechanges in agrarian landscapes in the 1990s: the interactionbetween farmers and the farmed landscape. A case studyfrom Jutland, Denmark. J. Environ. Manage. 71, 231–244.
Kurz, W.A., Beukema, S.J., Klenner, W., Greenough, J.A.,Robinson, D.C.E., Sharpe, A.D., Webb, T.M., 2000. TELSA: thetool for exploratory landscape scenario analyses. Comput.Electron. Agricult. 27, 227–242.
Kyriakidis, P., 2003. Geostatistics for environmental scientists.Int. J. Geogr. Inform. Sci. 17, 198–200.
Lambin, E.F., Rounsevell, M.D.A., Geist, H.J., 2000. Areagricultural land-use models able to predict changes inland-use intensity? Agr. Ecosyst. Environ. 82, 321–331.

e c o l o g i c a l m o d e l l i n g 1 9 4 ( 2 0 0 6 ) 233–243 243
Le Coeur, D., Baudry, J., Burel, F., Thenail, C., 2002. Why andhow we should study field boundary biodiversity in anagrarian landscape context. Agr. Ecosyst. Environ. 89, 23–40.
Li, H., Reynolds, J.F., 1994. A simulation experiment to quantifyspatial heterogeneity in categorical maps. Ecology 75,2446–2455.
Liu, J.G., Ashton, P.S., 1998. FORMOSAIC: an individual-basedspatially explicit model for simulating forest dynamics inlandscape mosaics. Ecol. Model. 106, 177–200.
Lorek, H., Sonnenschein, M., 1999. Modelling and simulationsoftware to support individual-based ecological modelling.Ecol. Model. 115, 199–216.
Manel, S., Schwartz, M.K., Luikart, G., Taberlet, P., 2003.Landscape genetics: combining landscape ecology andpopulation genetics. Trends Ecol. Evol. 18, 189–197.
Maxwell, T., Costanza, R., 1997. An open geographic modelingenvironment. Simulation 68, 175–185.
Merot, P., Squividant, H., Aurousseau, P., Hefting, M., Burt, T.,Maitre, V., Kruk, M., Butturini, A., Thenail, C., Viaud, V.,2003. Testing a climato-topographic index for predictingwetlands distribution along an European climate gradient.Ecol. Model. 163, 51–71.
Milne, B.T., 1991. Heterogeneity as a multiscale characteristicsof landscapes. In: Kosala, J., Pickett, T.A. (Eds.), EcologicalHeterogeneity. Springer-Verlag, New York, pp. 69–84.
Moloney, K.A., Levin, S.A., 1996. The effects of disturbancearchitecture on landscape-level population dynamics.Ecology 77, 375–394.
Mouillot, F., Rambal, S., Lavorel, S., 2001. A genericprocess-based SImulator for meditERRanean landscApes(SIERRA): design and validation exercises. Forest Ecol.
M
Pan, D.Y., Domon, G., de Blois, S., Bouchard, A., 1999. Temporal(1958–1993) and spatial patterns of land use changes inHaut-Saint-Laurent (Quebec Canada) and their relation tolandscape physical attributes. Landscape Ecol. 14, 35–52.
Ruiz, L., Aurousseau, P., Baudry, J., Beaujouan, V., Cellier, P.,Curmi, P., Durand, P., Gascuel-Odoux, C., Leterme, P.,Peyraud, J.L., Thenail, C., Walter, C., 2004. Conception debassins versants virtuels: vers un outil pour l’etude del’influence de l’organisation spatiale de l’activite agricole etdu milieu physique sur les flux d’azote dans les bassinsversants. In: Monestiez, P., Lardon, S., Seguin, B. (Eds.),Organisation spatiale des activites agricoles et processusenvironnementaux. INRA, pp. 337–354.
Saura, S., Martinez-Millan, J., 2000. Landscape patternssimulation with a modified random cluster method.Landscape Ecol. 15, 661–678.
Sklar, F.H., Costanza, R., 1991. The development of dynamicspatial models for landscape ecology: a review andprognosis. In: Turner, M.G., Gardner, R.H. (Eds.), QuantitativeMethods in Landscape Ecology. Springer-Verlag, New York,pp. 239–288.
Thenail, C., Baudry, J., 2004. Variation of farm spatial land usepattern according to the structure of the hedgerow network(bocage) landscape: a case study in northeast Brittany. Agr.Ecosyst. Environ. 1001, 53–72.
Turner, M.G., Gardner, R.H., 1991. Quantitative Methods inLandscape Ecology. Springer-Verlag, New York.
Veblen, T.T., Kitzberger, T., Donnegan, J., 2000. Climatic andhuman influences on fire regimes in ponderosa pine forestsin the Colorado Front Range. Ecol. Appl. 10, 1178–1195.
Wiens, J.A., 1999. Landscape ecology: the science and the
Manage. 147, 75–97.uller, F., Steinhardt, U., 2003. Landscape modelling andlandscape analysis. Ecol. Model. 168, 215–389 (complete).
action. Landscape Ecol. 14, 103-103.With, K.A., King, A.W., 1997. The use and misuse of neutral
landscape models in ecology. Oikos 79, 219–229.