A Discrete Reeb Graph Approach for the Segmentation of Human Body Scans
8
Submitted for review to CONF2003 A Discrete Reeb Graph Approach for the Segmentation of Human Body Scans Yijun Xiao Department of Computing Sciences University of Glasgow yjxiao@dcs.gla.ac.uk Naoufel Werghi College of Information Technology Dubai University College nwerghi@duc.ac.ae Paul Siebert Department of Computing Sciences University of Glasgow psiebert@dcs.gla.ac.uk Abstract Segmentation of 3D human body (HB) scan is a very chal- lenging problem in applications exploiting human scan data. To tackle this problem, this paper proposes a topolog- ical approach based on Discrete Reeb Graph (DRG) which is an extension of the classical Reeb Graph to unorganized cloud of 3D points. The essence of the approach is detecting critical nodes in the DRG thus permitting the extraction of branches that represent the body parts. Because the human body shape representation is built upon global topological features that are preserved so long as the whole structure of the human body does not change, our approach is quite robust against noise, holes, irregular sampling, moderate reference change and posture variation. Experimental re- sults performed on real scan data demonstrate the validity of our method. 1. Introduction The recent years have seen the emergence of 3D imag- ing technology that enables full scanning of the HB sur- face with reasonable measurement accuracy and acceptable computational cost. This advance facilitates the exploita- tion of the HB form in various areas such as anthropometri- cal research [1, 2, 16], clothing design [3, 4] and virtual hu- man animation [5]. Although the raw data delivered by the HB scanner requires substantial main memory and backing store resources, this data contains little semantic informa- tion. For the effective and efficient use of body scan data, it is usually necessary to partition the whole scan data set into subsets corresponding to the different principal body parts. This segmentation provides the basis for a high-level rep- resentation of the scan data and is a prerequisite for further semantic analysis. For example, in medical applications, the segmentation process provides an atlas for extracting data belonging to limbs that can be used to guide further analysis such as fitting generic limb models. These mod- els can then be used to automate specific clinical protocols, such as spinal curvature assessment. Automatic segmenta- tion of HB data is a challenging problem firstly because the body shape is both articulated and deformable and secondly because the scan data by nature is non-uniformly sampled, often containing gaps and corrupted by measurement noise. The automatic segmentation of the HB scan data into the functional parts was pioneered by Nurre [6]. He approxi- mated the body structure by a stick-template representing the head, the two arms, the two legs and the torso. His goal was to segment the body into six segments corresponding to these parts. This approach combines a global shape de- scription, namely moments analysis, and local criteria of proximity which are derived from a priori knowledge of the relative positions of the body parts in the standard posture (standing body with arms held at the sides). The range data is organized into slices of data points. The horizontal slices are stacked vertically and the data points are assigned to the different body parts according to the slice’s topology and its position in the body. E.g. a slice having two separated closed curves must represent data points measured at the level of the legs. A slice consisting of three closed curves must belong to the torso and arms area, a slice with two joined closed curves is assumed to correspond to the transi- tion between the legs and the torso (at the level of the groin). Certainly this work illustrated a considerable progress to- wards the automatic decomposition of the HB data, however the approach is restricted to a strict standard posture and did not show evidence of robustness with respect to noise, gaps in the data, and variation in the shape and the posture of the HB. Using the framework of Nurre, Ju et al [7] refined this segmentation approach by introducing curvature analysis of profiles extracted from the slices to allow further decom- 1
Transcript of A Discrete Reeb Graph Approach for the Segmentation of Human Body Scans

Submitted for review to CONF2003
A Discrete Reeb Graph Approach for the Segmentation of Human Body Scans
Yijun XiaoDepartment of Computing Sciences
University of [email protected]
Naoufel WerghiCollege of Information Technology
Dubai University [email protected]
Paul SiebertDepartment of Computing Sciences
University of [email protected]
Abstract
Segmentation of 3D human body (HB) scan is a very chal-lenging problem in applications exploiting human scandata. To tackle this problem, this paper proposes a topolog-ical approach based on Discrete Reeb Graph (DRG) whichis an extension of the classical Reeb Graph to unorganizedcloud of 3D points. The essence of the approach is detectingcritical nodes in the DRG thus permitting the extraction ofbranches that represent the body parts. Because the humanbody shape representation is built upon global topologicalfeatures that are preserved so long as the whole structureof the human body does not change, our approach is quiterobust against noise, holes, irregular sampling, moderatereference change and posture variation. Experimental re-sults performed on real scan data demonstrate the validityof our method.
1. Introduction
The recent years have seen the emergence of 3D imag-ing technology that enables full scanning of the HB sur-face with reasonable measurement accuracy and acceptablecomputational cost. This advance facilitates the exploita-tion of the HB form in various areas such as anthropometri-cal research [1, 2, 16], clothing design [3, 4] and virtual hu-man animation [5]. Although the raw data delivered by theHB scanner requires substantial main memory and backingstore resources, this data contains little semantic informa-tion. For the effective and efficient use of body scan data, itis usually necessary to partition the whole scan data set intosubsets corresponding to the different principal body parts.This segmentation provides the basis for a high-level rep-resentation of the scan data and is a prerequisite for furthersemantic analysis. For example, in medical applications,the segmentation process provides an atlas for extracting
data belonging to limbs that can be used to guide furtheranalysis such as fitting generic limb models. These mod-els can then be used to automate specific clinical protocols,such as spinal curvature assessment. Automatic segmenta-tion of HB data is a challenging problem firstly because thebody shape is both articulated and deformable and secondlybecause the scan data by nature is non-uniformly sampled,often containing gaps and corrupted by measurement noise.
The automatic segmentation of the HB scan data into thefunctional parts was pioneered by Nurre [6]. He approxi-mated the body structure by a stick-template representingthe head, the two arms, the two legs and the torso. His goalwas to segment the body into six segments correspondingto these parts. This approach combines a global shape de-scription, namely moments analysis, and local criteria ofproximity which are derived from a priori knowledge of therelative positions of the body parts in the standard posture(standing body with arms held at the sides). The range datais organized into slices of data points. The horizontal slicesare stacked vertically and the data points are assigned to thedifferent body parts according to the slice’s topology andits position in the body. E.g. a slice having two separatedclosed curves must represent data points measured at thelevel of the legs. A slice consisting of three closed curvesmust belong to the torso and arms area, a slice with twojoined closed curves is assumed to correspond to the transi-tion between the legs and the torso (at the level of the groin).Certainly this work illustrated a considerable progress to-wards the automatic decomposition of the HB data, howeverthe approach is restricted to a strict standard posture and didnot show evidence of robustness with respect to noise, gapsin the data, and variation in the shape and the posture of theHB.
Using the framework of Nurre, Ju et al [7] refined thissegmentation approach by introducing curvature analysis ofprofiles extracted from the slices to allow further decom-
1
A Discrete Reeb Graph Approach for the Segmentation of Human Body Scans Submitted for review to CONF2003
position of the body limbs into their articulated segments.Decker and Douros et al [8, 9] advanced Nurre’s work byimproving the localization of the key landmarks of HB. Forinstance, they differentiated the slice circumferences in thetorso area to locate the waist position. However their ap-proach had the same limitations of Nurre’s approach [6].Recently, Wang et al[9] proposed an approach developedwithin a Fuzzy logic framework. As with Nurre’s approach,a strict standing posture is assumed. After many preparationstages, the data is meshed and a segmentation technique ap-plied that involves local curvature analysis of the slice data.However the overall performance of this approach remainsidentical to that of Nurre’s.
In conclusion, the approaches developed to date are re-stricted by their underlying assumptions and may well suf-fer from instability when applied to real applications thatmust process noisy and corrupted 3D HB scan data contain-ing posture variations. Furthermore, no evidence of the re-peatability of these previous algorithms has been reported inthe literature. For a HB data segmentation to be of practicalutility, it must be robust to the variations of the body surfaceshape stemming from biological factors such as age, genet-ics, etc. It must also cope with reasonable perturbationsin body posture. Adhoc techniques cannot satisfy these re-quirements, although they might work for a particular case.This paper proposes an approach defined within a generaltopological analysis framework. A systematic way to seg-ment HB body data is presented that can cope with bodyshape variations and moderate posture changes. The ap-proach does not require any pre-processing stages, operateson raw 3D point-cloud data and does not involve local fea-ture analysis, which would be vulnerable to deficiencies inthe scan data.
The rest of the paper is organized as follows: Section 2describes the theoretical foundation of the approach and itsrelation with Morse theory and the Reed Graph. Section 3describes the segmentation algorithm. The experiments andtheir results are presented in Section 4. The paper concludesin section 5 with a discussion of the results and future work.
2. Morse Theory and Reeb Graph
Morse theory can be thought of as a generalization ofthe classical theory of critical points (maxima, minima andsaddle points) of smooth functions on Euclidean spaces.Morse theory states that for a generic function defined ona closed compact manifold (e.g. a closed surface) the na-ture of its critical points determines the topology of themanifold. Morse functions are generic functions for whichall the critical points are non-degenerate (Hessian matrixof the function at the critical point is non singular). Fora Morse function, the critical points determines the homol-ogy groups of the manifold, that is a sets of points for which
(c)
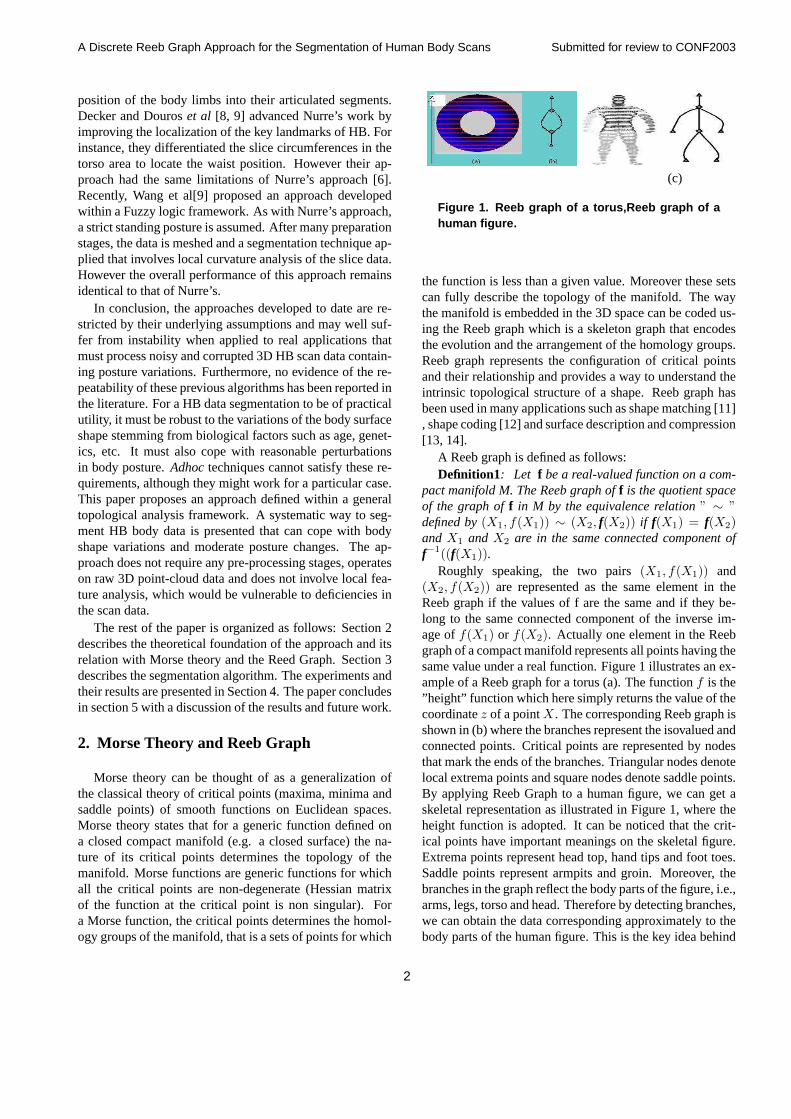
Figure 1. Reeb graph of a torus,Reeb graph of ahuman figure.
the function is less than a given value. Moreover these setscan fully describe the topology of the manifold. The waythe manifold is embedded in the 3D space can be coded us-ing the Reeb graph which is a skeleton graph that encodesthe evolution and the arrangement of the homology groups.Reeb graph represents the configuration of critical pointsand their relationship and provides a way to understand theintrinsic topological structure of a shape. Reeb graph hasbeen used in many applications such as shape matching [11], shape coding [12] and surface description and compression[13, 14].
A Reeb graph is defined as follows:Definition1: Let f be a real-valued function on a com-
pact manifold M. The Reeb graph of f is the quotient spaceof the graph of f in M by the equivalence relation ” ∼ ”defined by (X1, f(X1)) ∼ (X2, f(X2)) if f(X1) = f(X2)and X1 and X2 are in the same connected component off−1((f(X1)).
Roughly speaking, the two pairs (X1, f(X1)) and(X2, f(X2)) are represented as the same element in theReeb graph if the values of f are the same and if they be-long to the same connected component of the inverse im-age of f(X1) or f(X2). Actually one element in the Reebgraph of a compact manifold represents all points having thesame value under a real function. Figure 1 illustrates an ex-ample of a Reeb graph for a torus (a). The function f is the”height” function which here simply returns the value of thecoordinate z of a point X . The corresponding Reeb graph isshown in (b) where the branches represent the isovalued andconnected points. Critical points are represented by nodesthat mark the ends of the branches. Triangular nodes denotelocal extrema points and square nodes denote saddle points.By applying Reeb Graph to a human figure, we can get askeletal representation as illustrated in Figure 1, where theheight function is adopted. It can be noticed that the crit-ical points have important meanings on the skeletal figure.Extrema points represent head top, hand tips and foot toes.Saddle points represent armpits and groin. Moreover, thebranches in the graph reflect the body parts of the figure, i.e.,arms, legs, torso and head. Therefore by detecting branches,we can obtain the data corresponding approximately to thebody parts of the human figure. This is the key idea behind
2

A Discrete Reeb Graph Approach for the Segmentation of Human Body Scans Submitted for review to CONF2003
our approach.
2.1. Discrete Reeb Graph
The classical Morse theory is concerned with only non-degenerate critical points of smooth functions (Morse func-tion) on smooth manifolds. In practice, our data formatdoes not comply with this assumption. The data consistsof points sampled on the measured HB surface. The datamight be corrupted by noise and gaps. The construction ofthe Reeb-Graph for such data, is inspired from the approachof Biasotti et al [12,13] who proposed an Extended ReebGraph which can be extracted from discrete surface, wherethe data is described with a set of polygonal contours. In ourcase the data is an unorganized cloud of 3D data points. Wecall the Reeb graph extracted from such data the DiscreteReeb Graph (DRG). The extraction is based on the notionof connectivity described in the following definitions:
Defenition2 (connectivity of point sets): Two pointsets P = pi, i = 1..m and Q = qj, j = 1..n aredefined as connected if ∃ pi ∈ P and qj ∈ Q such that|pi − qj | ≤ d.Where |pi − qj | means the distance between points pi andqi and d is a threshold that denotes the maximum distancebetween a pair of connected points. The above definitionalso holds for the connectivity between two points for theparticular case where the sets P and Q contain a single pointeach.
Definition 3 (connective point set): A point set C isconnective if ∀ subset Ω ⊂ C and Ω 6= ∅, Ω and Ω areconnected. Where Ω is the complement of Ω in C.
Based on the above definitions the DRG is built on thediscrete set of points according to the following steps:Step1:Establishing level-set curves
For a continuous surface, a level-set curve is the inter-section between a plane of a certain height and the surface.Due to the discrete nature of data, we extract data in a slicewith a height in the domain [h, h + l] , where h is a heightvalue and l is the slice thickness. By choosing an appro-priate value of l, each slice will contain sufficient numberof data points for the analysis to succeed. The data is slicedfrom bottom to top. In all, there are ceil(hmax−hmin
l) slices.
Here ceil() represents the nearest integer towards positiveinfinity and hmax, hmin denote the maximum and mini-mum height value of the data. For each slice, data pointsare grouped into several discrete connective sets consistingof connected data points based on the definition of connec-tivity above. These groups which we call discrete curvesrepresent the level-set curves in the DRG.Step2: Building the connectivity graph
Considering each curve as a node in the graph, two nodesin two adjacent slices respectively are linked if their corre-sponding curves are connected. In this way, we can buildup a graph containing all nodes and their links, i.e., DRG.
Note In the DRG, critical points might degenerate to”critical curves”. In other words, we might not discoverthe exact critical points due to the discreteness of data andthe slicing process, instead these points appear to be criti-cal curves around which the topology of HB varies. There-fore we do not distinguish critical points and critical curvesin our application, and generally we denote them ’criticalnodes’ in the DRG.
3. The segmentation algorithm
Before presenting the details of the segmentation algo-rithm, we describe our problem in a precise manner. Firstof all, the subject of our study is a general human figure.The data is acquired by a general 3D scanner, and no pre-requisites are placed on the specification the scanner. Thedata might be corrupted with noise, holes and gaps. More-over, the human figure stands in the measuring platformwith arms held at the sides and legs separated. Therefore theheight direction of the measured figure is known. In order tosegment scan data according to the DRG, we need firstly toextract critical nodes in the DRG, and then locate branchesrepresenting body parts, finally we retrieve the data pointscorresponding to the branches.
Finding critical nodes in the classical Reeb Graph is veryintuitive. The root and leave nodes represent local extremapoints. The branched nodes represent saddle points. How-ever, it is nontrivial to extract critical nodes in DRG, be-cause the noise and holes might change the local topologicalproperties of the scan data and create ’false’ critical nodes.This problem has been tackled as follows, first we estab-lished three primary topological patterns that appear in theDRG. These patterns are called O-type, λ-type and Y-type(Figure 2). O-type has two saddle nodes connected by two
O-type, λ-type Y-type
Figure 2. Three main patterns in the DRG.
branches. λ-type has only one saddle node with a leavebranch downward. Y-type is similar to λ-type, but has aleave branch upward.
Assuming that the HB posture is reasonably close to thestandard posture shown in Figure 1, an ideal Reeb Graphshould comprise a tree structure containing only λ-type pat-terns. The O-types and Y-types that appear in the real casereflect therefore holes and gaps in the data and must be dis-carded. However holes in the data might also generate the
3

A Discrete Reeb Graph Approach for the Segmentation of Human Body Scans Submitted for review to CONF2003
λ-type pattern in the DRG. The detection of the related falsenodes in such cases is based on the assumption that the sizeof a ’false’ branch in λ-type caused by holes is quite smallcompared to the size of the whole body structure. This as-sumption is valid because a hole in the data has a very lim-ited area compared to the overall HB surface, otherwise thedata set itself would not represent a viable HB scan.
Based on these considerations, the following criteria arethen proposed to identify ’true’ critical nodes in DRG:
• A ”true” saddle node has at least two ”true” branchesall of which are long enough (greater than a threshold).
• ”True” extrema nodes are the deepest leaves of ”true”branches
The segmentation algorithm is based on the analysis ofthe DRG and the above criteria. The algorithm containsonly one pass searching from the bottom to the top of data.In this pass, the critical nodes representing foot toes, groin,hand tips, armpits and head top are detected using the cri-teria mentioned above, and the ’true’ branches betweenthese critical nodes are extracted. Then the identificationof branches corresponding to the body parts becomes verysimple. The branches between the groin and foot/toes cor-respond to legs and the branches between armpits and handtips correspond to arms. The reminder of the data corre-sponds to torso and head. The algorithm for building theDRG and finding the ’true’ saddle nodes and branches isdescribed by the following pseudo-codeNotationNode: A node is an entity which contains a curve in a slice.NewNode(): A function to allocate a new node.Class: A class is defined as a group of connected nodes.Class(Node): The Class containing the Node.NewClass(): A function allocating a new classNum(Class): The number of nodes in the classThreshold: Threshold is the number of nodes in a class,above which the class is considered as a ”true” branchBranch: The ’true’ branch connected to a ’true’ saddle node.
Code:Slicing from bottom to topFor each slice
Group data points into curvesFor each curve
node:=NewNode()If it is the 1-st slice
Class(node) := NewClass()Else
Find out the nodes (N1, N2, .., Nm)in thelast slice connected to the nodeIf m = 0
Class(node):=NewClass
ElseC := (Class(Ni)
⋃Class(N2)...
⋃Class(Nm))
select the classes verifying:Ci|Num(Ci) ≤ Threshold,
i = 1, 2, ., n, (n ≤ m)If n ≥ 2
For each Ci
Branchj = Ci, j := j + 1
Remove Ci
End ForElse
Class(node) = N1, N2, ...NmEnd If
End IfEnd If
End forEnd for
4. Experiments
A series of experiments were conducted to test the va-lidity of the approach. These experiments aims to evaluatethe effectiveness of the algorithm in terms of quality of thesegmentation and also to assess its robustness and stabilitywith respect to: 1)Variation of the HB shape, scan source,and severely corrupted scan data. 2) Variation of the HBposture. 3)Variation of the HB scan reference.
4.1. Variation of the human body shape and scansource
The HB scans were collected form two different sources.The first is the Cyberware website [15], the second is theCAESAR project website [16]. In both sites, the scans wereacquired by the Cyberware whole body scanner WB4[15].This scanner uses laser-based technology in which a laserbeam is projected on the body, the bean profile is capturedby different cameras around the body. The data from eachimage are then combined to produce the 3D points of thebody surface. The scanning time is around 17 seconds.Therefore the scan is subject to trimming effects. The setof collected scans contain 14 scans of different individualsincluding males and females. The number of points in thescans varies around 13 000 points.
The second set of scans is collected by a Wicks&Wilson[17] HB scanner at the Edinburgh Virtual Reality Center[18]. This scanner is based on a Moire technology wherefringe patterns, projected on the body, are captured by eightcameras (in fact four cameras are employed and a movingmirror system, provides another 4 viewing positions). Theset of 3D points extracted from each camera (triangulatingwith the fringe projector) are combined together to form thewhole scan. The scanning time of this device is around 8
4

A Discrete Reeb Graph Approach for the Segmentation of Human Body Scans Submitted for review to CONF2003
seconds, yet the person is required to stand very still dur-ing the scanning. The space inside the scanner is very lim-ited and allows little freedom of the body movement. Forthese reasons, it was difficult to perform scans for a non-standard postures. We did managed however to obtain afew non-standard postures after many trials and collectinga set of 8 scans related to three different male individuals.The number of points each scan comprises approximately11 000 points.
Figure 3 shows the segmented cybeware HB scans. Thefirst two rows show the scanned persons and their associatedsegmented scans. These scans were collected from the Cy-berware [15]. The rest of the rows contain scans retrievedfrom the CAESER [16] website. The photographic imagesof the scanned persons are not available at that site. Re-sults obtained with the second scan data set are illustratedin Figure 5, where the segmented scans are shown togetherwith the images of the scanned persons, taken during thescanning process.
In the above figures, we can observe that scans of sveltepersons, in a standard posture and having limbs well sep-arated, are segmented with a reasonable accuracy(scans 1to 6 in Figure 3 and 1,2,4,5, 6 and 7 in Figure 5. For thesetypes of body profile, joints such as the groin and the armpitcan be detected quite faithfully. For relatively stout persons,the segmentation is acceptable as long as the limbs are wellseparated (7 to 12 in Figure 3), when this is not the case,as in scans 13 to 15 , the segmentation is less faithful tothe body anatomy. Segmentation errors are manifest, for in-stance, by parts of the legs and the arms being segmented aspart of the torso. This result is as expected, because wherethe legs join, or the arms intersect with torso, result in con-nected data points which are then considered as part of asame homology group by the algorithm.
Scans 3 and 8 in Figure 5 correspond to a non-standardposture. By experimenting these postures, we aimed totest the behavior of the segmentation technique when theassumption of a standard posture is not respected. Thesegmented scans show that small region of the arms weresegmented as part of the torso. This is explained by thefact that, for a given Morse function(the height functionin our application), the location of the critical nodes (crit-ical curves in DRG, which marks the borders between thebranches) changes with the configuration of the posture. Inposture 8, for instance, it is the left elbow that represents alocation of critical curve rather than the left armpit.
Nevertheless for both groups of scans, the segmentationalways results in five distinct components, even for the non-standard postures. Furthermore the partitioning is faithfulto the HB anatomy in the sense that each segmented regionbelongs to a distinct body component.
It is also worth mentioning that these results were ob-tained with poor scan data as illustrated in Figure 4(a) which
1 2 3 4
5 6 7 8 9
10 12 13 14 15
Figure 3. Segmenttion of HB scans acquired fromthe Cyberware scanner.
shows a zoomed area around the groin. The non-regularsampling of the data and the presence of gaps and holesare clearly visible. To test further the robustness of the al-gorithm, we corrupted the data by creating large holes inselected scans. The segmentation of these scans, shown inFigure 4(b) was not affected by the presence of holes, de-spite their large size. These results confirm that the algo-rithm is capable of discarding effectively the O type criticalnodes (critical curves) described in Section 3.
4.2. Variation of the human body posture
The folowing experiments aim to test the stability of thealgorithm with respect to posture variation. Naturally thealgorithm is not expected to segment any arbitrary posturesince the approach was built on the assumption that the HB
5

A Discrete Reeb Graph Approach for the Segmentation of Human Body Scans Submitted for review to CONF2003
(a) (b)
Figure 4. (a) Zoomed image illustrating the distri-bution of the scan data. (b) Segmented HB scanscorrupted by large holes.
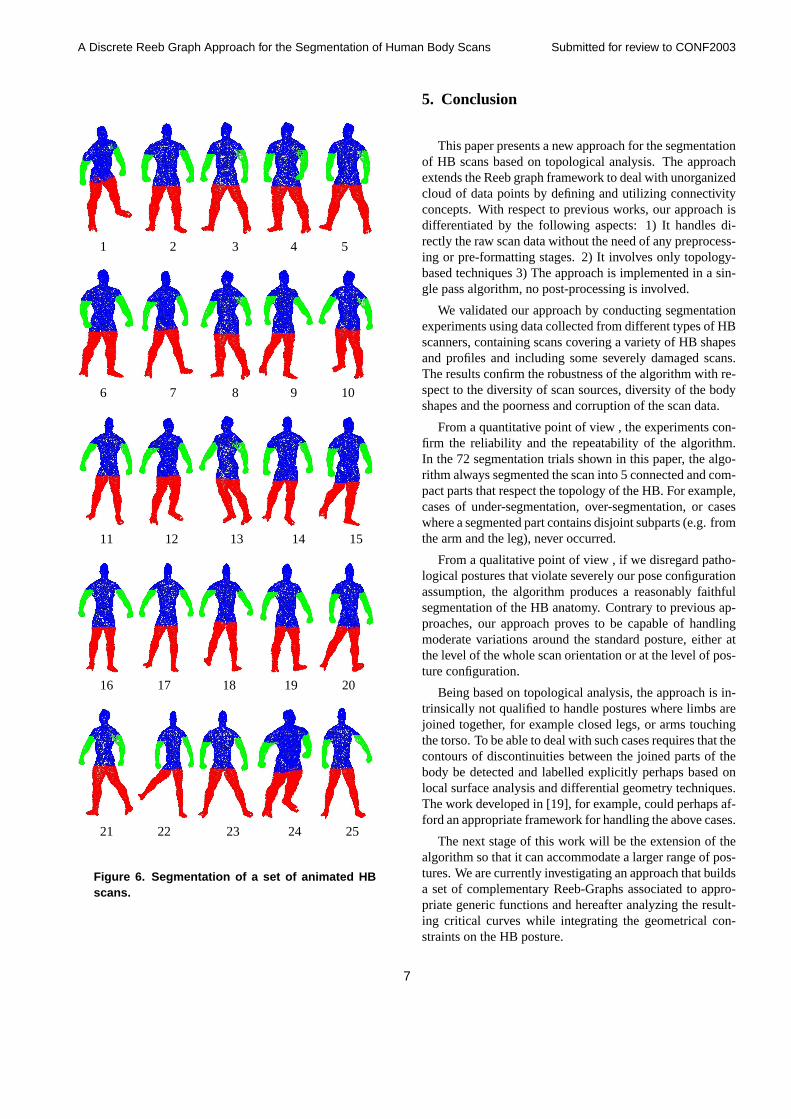
pose is reasonably close to the standard pose. Neverthelessit is desirable that the algorithm should be able to cope withmoderate variations around the standard posture. The set ofvaried postures was obtained as follows: A parameterizedhuman skeleton template was coupled to a Cyberware HBscan. Then sets of random parameters values, centered atthe values associated to the standard posture, were gener-ated. Each set was then applied to the template to generateinstances of the HB model. A set of artificial scans rep-resenting a variety of HB postures could then be obtained.The segmentation results are shown in Figure 6. All thescans were segmented into five parts and retained reason-able fidelity to the structure of HB anatomy. The locationsof the armpits and the groin vary slightly in the segmentedscans. This illustrates the stability of the algorithm withrespect to moderate variations, and confirms that the algo-rithm generates a fair segmentation as long as the geometricconfiguration of the posture remain close to the skeletal rep-resentation of Figure 2.
4.3. Variation of the human body scan reference
The choice of the height function, used in the construc-tion of the DRG, requires the principal orientation of thebody to be co-aligned with the z axis of the coordinate ref-erence attached to the HB scan. This condition cannot besatisfied exactly for many reasons, such as the presence ofsystematic errors in the scan data or the inevitable imper-fections in the posture assumed by the scanned person. Aseries of experiments were conducted to check the behaviorof the algorithm in such cases. These effects were simu-lated by applying rotations on some scans, around the axesx and y of the coordinate reference. The angles of rotationscomprised: −30o, −20o, −10o, 10o, 20o, and 30o. The seg-mented scans are shown in Figure 7. Each row correspondsto a different person. Scans rotated around the x axis arein rows 1 and 2 and those rotated around the y are in rows3 and 4. From the figure it is evident that the changes that
1 2 3 4
5 6 7 8
Figure 5. Segmenttion of HB scans acquired fromthe Wick&Wilson scanner.
affected the critical curves in terms of location and orienta-tion, reflect the characteristics of the rotations. For instance, it can be observed that for the scans in the two last rows,the orientation of critical curve at the level of the groin isbiased towards the angle of the rotation applied on the scan.This aspect is less visible in the scans rotated around the xaxis because the scans are shown from the front view of thebody, which direction is collinear to the x axis. The changesat the locations of the armpits and the groin can be observedthough.
The results show that moderate perturbations on the ori-entation of the scan, e.g. less than 100 can be tolerated. Per-turbations of large amplitude perturbation affect the qualityof the segmentation, however the topological properties ofthe HB template remain preserved.
6
A Discrete Reeb Graph Approach for the Segmentation of Human Body Scans Submitted for review to CONF2003
1 2 3 4 5
6 7 8 9 10
11 12 13 14 15
16 17 18 19 20
21 22 23 24 25
Figure 6. Segmentation of a set of animated HBscans.
5. Conclusion
This paper presents a new approach for the segmentationof HB scans based on topological analysis. The approachextends the Reeb graph framework to deal with unorganizedcloud of data points by defining and utilizing connectivityconcepts. With respect to previous works, our approach isdifferentiated by the following aspects: 1) It handles di-rectly the raw scan data without the need of any preprocess-ing or pre-formatting stages. 2) It involves only topology-based techniques 3) The approach is implemented in a sin-gle pass algorithm, no post-processing is involved.
We validated our approach by conducting segmentationexperiments using data collected from different types of HBscanners, containing scans covering a variety of HB shapesand profiles and including some severely damaged scans.The results confirm the robustness of the algorithm with re-spect to the diversity of scan sources, diversity of the bodyshapes and the poorness and corruption of the scan data.
From a quantitative point of view , the experiments con-firm the reliability and the repeatability of the algorithm.In the 72 segmentation trials shown in this paper, the algo-rithm always segmented the scan into 5 connected and com-pact parts that respect the topology of the HB. For example,cases of under-segmentation, over-segmentation, or caseswhere a segmented part contains disjoint subparts (e.g. fromthe arm and the leg), never occurred.
From a qualitative point of view , if we disregard patho-logical postures that violate severely our pose configurationassumption, the algorithm produces a reasonably faithfulsegmentation of the HB anatomy. Contrary to previous ap-proaches, our approach proves to be capable of handlingmoderate variations around the standard posture, either atthe level of the whole scan orientation or at the level of pos-ture configuration.
Being based on topological analysis, the approach is in-trinsically not qualified to handle postures where limbs arejoined together, for example closed legs, or arms touchingthe torso. To be able to deal with such cases requires that thecontours of discontinuities between the joined parts of thebody be detected and labelled explicitly perhaps based onlocal surface analysis and differential geometry techniques.The work developed in [19], for example, could perhaps af-ford an appropriate framework for handling the above cases.
The next stage of this work will be the extension of thealgorithm so that it can accommodate a larger range of pos-tures. We are currently investigating an approach that buildsa set of complementary Reeb-Graphs associated to appro-priate generic functions and hereafter analyzing the result-ing critical curves while integrating the geometrical con-straints on the HB posture.
7

A Discrete Reeb Graph Approach for the Segmentation of Human Body Scans Submitted for review to CONF2003
Rotation around the axe x
-30 -20 -10 10 20 30
-30 -20 -10 10 20 30Rotation around the axe y
-30 -20 -10 10 20 30
-30 -20 -10 10 20 30
Figure 7. Segmentation of rotated scans.
Acknowledgements
This work is supported by an EPSRC Grant Ref:R0538
References
[1] P.R.M. Jones, M. Rioux, ”Three dimensional surface anthro-pometry:applications to human body”, Optics and Lasers inEngineering, Vol. 28, No. 2, pp.89- 117, 1997.
[2] E. Paquet, K.M Robinette, M. Rioux, ”Management of three-dimensional and anthropometric databases: Alexandria andCleopatra”. J. Electronic Imaging, Vol. 9, pp. 421-431, 2000.
[3] R.P. Pargas, N.J. Staples, J.S. Davis, ”Automatic measure-ment extraction for apparel from a three-dimensional body
scan”, Optics and Lasers in Engineering, Vol. 28, No. 2,pp.157-172, 1997.
[4] F. Cordier, H. Seo, N. Magnenat-Thalmann, ”Made-to-Measure Technologies for an Online Clothing Store”, Com-puter Graphics and Applications, pp.38-48, Jan-Feb 2003.
[5] J. Starck, G. Collins, R. Smith, A. Hilton, and J. Illingworth,”Animated statues”, Journal of Machine Vision Applications,2002.
[6] J.H. Nurre, ”Locating landmarks on human body scan data”Proc. Conf. 3D Digital Imaging and Modeling, pp.289-295,Ottawa, Canada, 1997.
[7] X. Ju, N. Werghi, and J. P. Siebert, ”Automatic Segmentationof 3D Human Body Scans”, Proc. Int. Conf. on ComputerGraphics and Imaging 2000 Las Vegas, USA, 2000.
[8] L. Dekker I. Douros B. F. Buxton P. Treleaven, ”BuildingSymbolic Information for 3D Human Body Modeling fromRange Data”, Proc. Conf. 3D Digital Imaging and Modeling,, pp. 388-397, Ottawa, Canada, 1999.
[9] I. Douros, L. Dekker, B. Buxton, ”Reconstruction of thesurface of the human body from 3D scanner data using B-splines”, Proc. SPIE vol. 3640, pp234-245, San Jose, Califor-nia, January 1999.
[10] C.L Wang, T.K, Chang, M. Yuen, ”From laser-scanned tofeature human model: a system based on fuzzy logic con-cepet”, CAD, Vol.35, pp. 241-253, 2003.
[11] M. Hilaga, Y. Shinagawa, T. Kohmura, T. .Kunii, ”Topol-ogy matching for fully automatic similarity estimation of 3dshape”. SIGGRAPH 2001, pp 203 -212, New York, USA.
[12] Y. Shinagawa, T.L. Kunii and Y.L. Kergosien. ”Surface Cod-ing Based on Morse Theory” , IEEE Computer Graphics andApplications, Vol.11, No.5, pp.66-78, 1991.
[13] S. Biasotti, M. Mortara, M., M. Spagnuolo, ”Surface Com-pression and Reconstruction using Reeb graphs and ShapeAnalysis, Proc. of Spring Conference on Computer Graphics,pp. 175-184, Bratislava 2000.
[14] S. Biasotti, B. Falcidieno, M. Spagnuolo, ”ExtendedReeb Graph for Surface Understanding and Description”,G.Borgefors, I. Nystm, G. Sanniti di Baja (eds) Lectures notesin Computer Sciences, pp. 185-197, 2000
[15] Cyberware, www.cyberware.com
[16] Civilian American and European Surface AnthropometryResource, http://www.hec.afrl.af.mil/cardlab/caesar/
[17] Wicks and Wilson, http://www.wwl.co.uk/wwl2/index.html
[18] Edinburgh Virtual Reality Center,http://www.edvec.ed.ac.uk
[19] F. Ferrie, J. Lagharde, P. Whaite, ”Darboux Frame, Snakesand Super Quadrics, Geometry from the Bottom Up”, IEEETrand. PAMI, Vol.15, No.8, 1993.
8