A CROSS-SECTIONAL SURVEY TO IDENTIFY RISK FACTORS AND CLINICAL SIGNS ASSOCIATED WITH PARASITIC...
41
ITMA-MSTAH thesis, nº 42, 2006 Dr. A. K. M. Anisur Rahman “Thesis presented in fulfilment of the requirements for the degree of Master of Science in Tropical Animal Health” Prince Leopold Institute of Tropical Medicine Department of Animal Health Antwerpen (Antwerp), Belgium A CROSS-SECTIONAL SURVEY TO IDENTIFY RISK FACTORS AND CLINICAL SIGNS ASSOCIATED WITH PARASITIC HELMINTH INFECTIONS OF CATTLE IN MYMENSINGH DISTRICT OF BANGLADESH
Transcript of A CROSS-SECTIONAL SURVEY TO IDENTIFY RISK FACTORS AND CLINICAL SIGNS ASSOCIATED WITH PARASITIC...

ITMA-MSTAH thesis, nº 42, 2006
Dr. A. K. M. Anisur Rahman
“Thesis presented in fulfilment of the requirements for the degree of Master of Science in Tropical Animal Health”
Prince Leopold Institute of Tropical Medicine Department of Animal Health Antwerpen (Antwerp), Belgium
A CROSS-SECTIONAL SURVEY TO IDENTIFY RISK FACTORS
AND CLINICAL SIGNS ASSOCIATED WITH PARASITIC
HELMINTH INFECTIONS OF CATTLE IN MYMENSINGH
DISTRICT OF BANGLADESH

Thesis of Master of Science in Tropical Animal Health
Presented and defended on the 10th of July 2006 At the Prince Leopold Institute of Tropical Medicine (ITMA)
Antwerpen(Antwerp), Belgium
Members of jury Dr Tom Dolan, Analabs, Chairman Prof Dr Claude Saegerman, University of Liège, Member Dr Marc Dispas, VAR, Member Prof. Dr Ir. Berkvens, ITM, Member Dr R. De Deken, ITM, Member Dr Nicolas Praet, ITM, Member

i
Dedication
The work is dedicated to my respected parents, brothers, sisters, my beloved wife and son
Acknowledgements
All praises are due to the almighty Allah who has given me the ability to complete the writing of the thesis. I am grateful to the authority of Directorate-General for Development Cooperation for giving me the chance to study in ITM. I hope that the knowledge I gained through this program will be used for the protection and improvement of livestock health in the developing world.
I am grateful to Prof. Dr. M. Nooruddin, Department of Medicine, Bangladesh Agricultural University (BAU), Mymensingh, Bangladesh who designed the survey and encouraged me to do it. I am indebted to Prof. Mrs. Nurjahan Begum, Department of Parasitology, BAU, Mymensingh, Bangladesh who had kindly taken the responsibility of performing epg of the samples. The cooperation of the farmers and help of Mr. Liton during sample collection are highly appreciated. I am grateful to my wife for helping me during data entering.
The continuous guidance, suggestions and correction of the text by Dr. T. Marcotty (My supervisor) is acknowledged with profound thanks and gratitude. I want to express my heartfelt thanks and gratitude to Prof. Dr. D. Berkvens for his help in statistical analysis.
The excellent help of student’s service is greatly appreciated.
I extend my sincere thanks to all ITM staffs for knowledge imparted during the course.

ii
Table of Contents
Dedication....................................................................................................................................i Acknowledgements .....................................................................................................................i Table of Contents........................................................................................................................ii List of tables ..............................................................................................................................iv List of figures.............................................................................................................................iv List of abbreviations ..................................................................................................................iv Summary.....................................................................................................................................v Chapter I: Introduction ...............................................................................................................1 Chapter II: Literature Review.....................................................................................................2 2.1 Geographic and Socio-Economic context ............................................................................2 2.1.1 Geographic location...........................................................................................................2 2.1.2 Cattle management system ................................................................................................2 2.1.3 Economic review ...............................................................................................................2 2.1.4 Importance of livestock .....................................................................................................2 2.2 Occurence of parasitic helminth infection............................................................................3 2.3 Effect of helminth infection on livestock health and production .........................................3 2.4 Risk factors of parasitic helminth infections ........................................................................6 2.4.1 Trematodes ........................................................................................................................6 2.4.2 Nematodes .........................................................................................................................7 2.5 Clinical signs associated with parasitic helminth infection..................................................8 2.5.1 Trematodes ........................................................................................................................8 2.5.2 Nematodes .........................................................................................................................8 2.6. Statistical analysis................................................................................................................8 2.6.1 Reducing the number of independent variables ................................................................8 2.6.1.1 Association among explanatory variables ......................................................................8 2.6.1.2 Principal component analysis .........................................................................................8 2.6.2 Associations with helminth infections...............................................................................8 2.6.2.1Classification tree ............................................................................................................8 2.6.2.2 Multiple logistic regression ............................................................................................9 Chapter III: Materials and Methods..........................................................................................10 3.1 Survey design and sampling ...............................................................................................10 3.2 Sample collection and processing.......................................................................................10 3.3 Questionnaire based data collection and processing ..........................................................10 3.4 Statistical analysis...............................................................................................................10 3.4.1 Reducing the number of independent variables ..............................................................10 3.4.1.1 Screening for multicollinearity.....................................................................................10 3.4.1.2 Principal component analysis .......................................................................................11 3.4.2 Associations with helminth infections.............................................................................11 3.4.2.1 Classification tree .........................................................................................................11 3.4.2.2 Multiple logistic regression ..........................................................................................11 Chapter IV: Results ..................................................................................................................12 4.1 Data exploration .................................................................................................................12 4.2 Apparent prevalence ...........................................................................................................12 4.3 Reducing the number of independent variables .................................................................12 4.3.1 Association among explanatory variables .......................................................................12 4.3.2 Principal component analysis ..........................................................................................12 4.4 Associations with helminth infections................................................................................18 4.4.1 Classification tree ............................................................................................................18
iii
4.4.1.1 Risk factor and clinical signs........................................................................................18 4.4.2 Multiple logistic regression .............................................................................................18 4.4.2.1 Risk factors and clinical signs ......................................................................................18 Chapter V: Discussion, conclusion...........................................................................................24 5.1 Apparent prevalence ...........................................................................................................24 5.2. Reducing the number of independent variables ................................................................25 5.2.1 Association among explanatory variables .......................................................................25 5.2.2 Principal component analysis (PCA)...............................................................................25 5.3 Associations with helminth infections................................................................................25 5.3.1 Classification tree ............................................................................................................26 5.3.1.1 Risk factor and clinical signs........................................................................................26 5.3.2 Multiple logistic regression .............................................................................................26 5.3.2.1 Risk factors and clinical signs ......................................................................................26 5.4 Conclusion ..........................................................................................................................27 Chapter VI: Recommendations ................................................................................................28 References ................................................................................................................................29 Appendix I ................................................................................................................................31 Appendix II...............................................................................................................................32 Appendix III .............................................................................................................................33

iv
List of tables
Table I: Prevalence of different helminth parasites in cattle reported by authors from Bangladesh and abroad...............................................................................................................4 Table II. Description of variables and their distribution in helminth data ...............................13 Table III. Cattle herd size in helminth data ..............................................................................13 Table IV. Apparent prevalence and epg of different helminth infections of cattle in Mymensingh district of Bangladesh .........................................................................................14 Table V. Apparent prevalence of helminth infections (groups) in cattle of Mymensingh district of Bangladesh ...............................................................................................................14 Table VI. Multiple infections of helminths in cattle of Mymensingh ......................................14 Table VII. Distribution of trematodea infection in cattle of Mymensingh district of Bangladesh..................................................................................................................................................15 Table VIII. Distribution of nematode infection in cattle of Mymensingh district of Bangladesh..................................................................................................................................................16 Table IX. Significant association among explanatory variables ..............................................17 Table X. Results from principal components (PC) analysis of helminth data .........................19 Table XI .Summary of final multiple logistic regression model of nematode infection in cattle of Mymensingh district of Bangladesh using original explanatory variables ..........................19 Table XII. Summary of final multiple logistic regression model of nematode infection in cattle of Mymensingh district of Bangladesh using principal components as explanatory variables....................................................................................................................................19
List of figures
Figure I. Flow chart of association among explanatory variables ............................................20 Figure II. Sreeplot of eigenvalues and principal components (PC) of helminths data.............21 Figure III: Biplot of first two principal components of helminth data .....................................21 Figure IV: Full tree and pruned tree of nematode infection in cattle of Mymensingh district of Bangladesh................................................................................................................................22 Figure V: Important variables for nematode infection in cattle obtained from random forests analysis .....................................................................................................................................23
List of abbreviations
sqkm Square kilometre
epg Egg per gram of faeces
GIS Geographic Information System
OR Odds ratio
CI Confidence Interval FEC Faecal egg count
FAO Food and Agricultural Organization

v
Summary
Keywords: Cattle, helminth, multicollinearity, risk factors, clinical signs, PCA, classification tree, random forests, multiple logistic regression
A cross-sectional survey was undertaken to identify risk factors and clinical signs associated with parasitic helminth infections of cattle in Mymensignh district of Bangladesh. A non-random convenience sampling method was used to select 138 animals from 40 farmers/herds. The eggs per gram of faeces (epg) for nematodes and trematodes were determined by McMaster and Stoll’s methods respectively. Animal-level and herd-level data were recorded by means of a questionnaire. Multicollinearity amongst explanatory variables were assessed using 2X2 χ2 test and one variable in a pair was dropped if P≤0.05 for multiple logistic regression models. Principal component analysis (PCA) was used to consolidate the information contained in all of the explanatory variables into a new set of uncorrelated variables and principal components were used as explanatory variables in multiple logistic regression models of helminth infections. Association study between outcome and explanatory variables was conducted using classification tree, random forests and multiple logistic regression. A positive epg was considered as infected. Analyses were performed using STATA®, version 8.0/Intercooled and R®, Version 2.3.0. Seventy eight percent (78%) of the cattle were found to be infected with at least one type of helminth. Twenty four (24) pairs of combinations of explanatory variables showed significant associations. Male animals (OR=3.3, p=.006, 95% CI=1.4, 7.7) were associated with significantly increased prevalence of nematode infection. Female cattle of the study area are mostly cross-breed, kept indoor, fed relatively good diet and not used for draught purpose. Males are used for draught purpose thereby more exposed to nematode infective stage and provided with relatively poor diet. So stressed male cattle may become more susceptible to nematode infection. All of the three statistical techniques selected gender and rumen motility as most important variables in association with nematode infection in cattle. The result of this survey can only be extrapolated to the periurban cattle population of traditional management system.

1
Chapter I: Introduction
Inadequate feed, widespread diseases and inefficient extension services are considered among the most binding constraints of livestock development in Bangladesh (FAOSTAT 2003). The most important disease of cattle in Bangladesh is considered to be parasitic helminths infection (Rahman & Mondal 1983). At least two third of the total livestock population (23 million) are infected subclinically with parasitic helminth infections (Garrels 1975, Rahman & Mondal 1983). Subclinical diseases are often ignored resulting in heavy economic loss. The economic losses due to subclinical problems in population are significantly higher than clinical problems in individual animals (Martin et al. 1994). A prerequisite for disease control/prevention is to identify factors responsible for that disease. Knowledge of the risk factors facilitates identification of categories of animals that are at particular risk of developing an infection (Thrusfield, 1995). Only age and seasons are two factors studied by some authors in relation to fasciola infection in cattle of Bangladesh. Cattle more than one year of age, females and post-monsoon season were described significantly associated with liver fluke infection (Howlader et al. 1990, Chowdhury et al. 1994). Begum et al. 2003 identified risk period of gastrointestinal nematodes in ruminants and suggested two strategic treatments. Risk factors for animal health and production problems include specific etiologic agents, host factors and environmental factors (Dohoo et al. 1996). Knowledge of the associated factors of a disease is an aid in differential diagnosis also. Pathognomonic clinical signs of a disease help in non laboratory diagnosis which is rapid and cheaper than laboratory diagnosis. For a rational and sustainable helminth control programme, a comprehensive knowledge of the epidemiology of the disease in a specific climate and management system is a prerequisite (Keyyu et al. 2005). There are very few reports regarding risk factors and clinical signs associated with helminth infections in cattle of Bangladesh. A preliminary cross-sectional survey including animal-level and herd-level factors of parasitic helminth infections in cattle of Mymensingh district of Bangladesh was undertaken for the following objectives:
1. to report apparent prevalence of parasitic helminth infections in cattle 2. to identify risk factors of parasitic helminth infections in cattle and 3. to identify clinical signs associated with parasitic helminth infections in cattle
2
Chapter II: Literature Review
2.1 Geographic and Socio-Economic context
2.1.1 Geographic location
The study area is located in the Mymensingh district (24° 20´ to 25° 10´ north latitude and 90° 10´ to 90° 50´ east longitude) of Bangladesh (20° 34´ to 26° 38´ north latitude and 88° 01´ to 92° 42´ east longitude) . Like most parts of Bangladesh the topography is flat. Agricultural crops, permanent pasture and pioneer grasses along rivers are common vegetation. Agricultural crops include rice, jute, potato, wheat etc.The district is moist and humid climatically. It lies about 100 m above sea level. There is one big river and many small rivers in the study area. The climatic pattern is made of three distinct seasons: the pre-monsoon hot season from March through May, the rainy monsoon season which lasts from June through October, and a cool dry winter season from November through February. The pre-monsoon hot season is characterised by high temperature and occurrence of thunderstorms. April is the warmest month in the country when temperatures range from 33 ºC to 36 ºC. Very high humidity, and heavy rainfall and long consecutive days of rainfall characterise the rainy season. Low temperatures, clear sky and meagre rainfall characterise the cool dry season. January is the coolest month when temperatures range from 8ºC to 15ºC with minimum temperature 3ºC to 4ºC. Average annual rainfall in the study area is 2,000 mm. The study was conducted from July to September 2001.
2.1.2 Cattle management system
The cattle management system is small scale dairy with traditional crop-based farming system. The small scale dairy system mainly practises zero-grazing with occasional semi-zero and tethering systems. Animals are permanently housed, while those in semi-zero system are housed during the rainy season and taken out for grazing in river banks, fallow lands or road sides. The feeding practice is ‘cut and carry system’ where indigenous grass is obtained from various places and carried back to the housed animals. Common supplements are ricepolish, wheatbran and oilcake but their supply to animals are low, irregular and restricted mostly to milking cows. Farmers having cultivable land also use these animals for ploughing to produce crops. The common breeds are indigenous and their crosses with Holstein Friesian, Red Sindhi and Shahiwal.
2.1.3 Economic review
Bangladesh is an agricultural country, with 55.6% of the total population (137.4 million, 2000) engaged in farming. Sixty eight percent of the total land (130,170 sqkm) is cultivable. It is one of the densely populated and poorest countries where about 1000 people live per sqkm. The country’s Gross Domestic Product (48,906 million $US in1995) composition by sector stands at agriculture 30% (including livestock), industry 17% and service 53% (1997). GDP annual growth rate is 4.6%. About 35.6% (1995-1996 estimation) of the population live below poverty line. Per capita GDP per year was estimated at 373 US$ in 1995. (FAO STAT 2003).
2.1.4 Importance of livestock
Bangladesh has a low income rural economy with the livestock sector accounting for 3.5% of the GDP. In Bangladesh, there are about 23 million cattle, 1 million buffaloes, 35 million sheep and goats and 105 million poultry (FAOSTAT 2003). Mymensingh district has about

3
0.5 million cattle. The majority of the rural households raise livestock, which provide power for cropping, transport, threshing and oil seed crushing, manure as a source of fuel and fertilizer, a ready source of cash and meat, milk and eggs for human consumption (FAOSTAT 2003).
2.2 Occurence of parasitic helminth infection
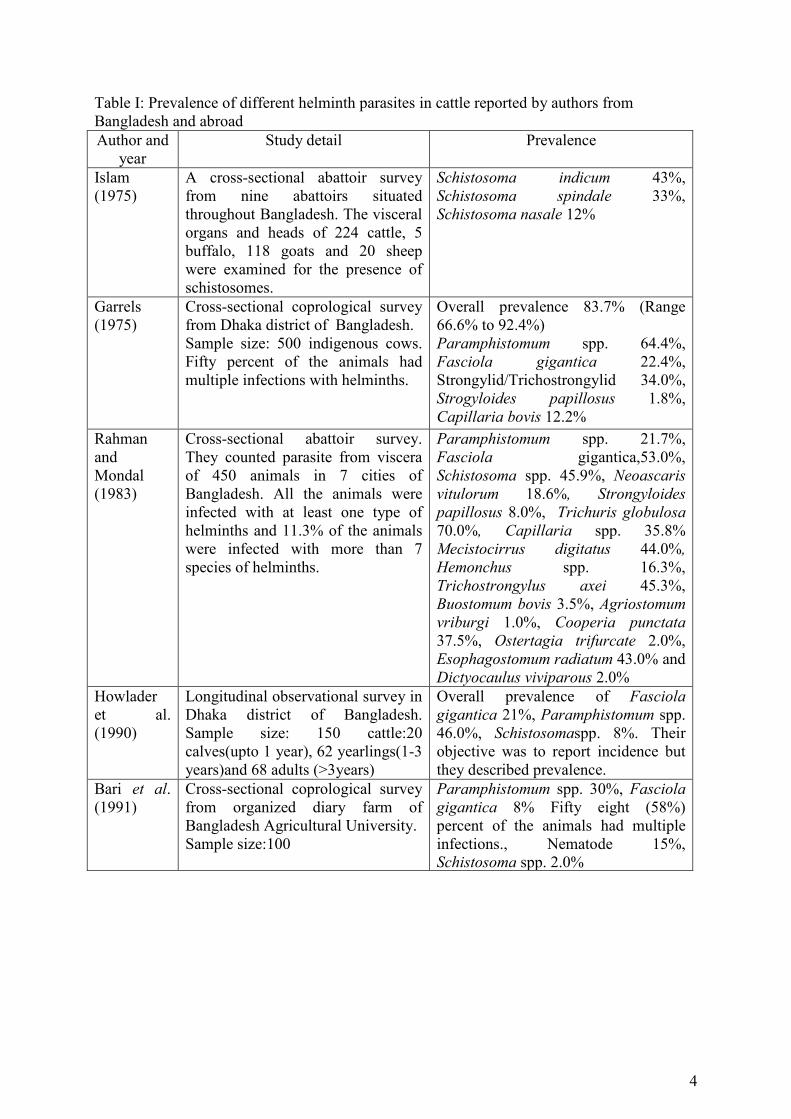
Many authors from Bangladesh reported parasitic helminth infections but most of the findings were from surveys with non probability sampling strategy. Prevalence of helminth infections of cattle in Bangladesh and abroad were shown in Table I.
2.3 Effect of helminth infection on livestock health and production
Parasitic gastro-enteritis and hepatitis are the major causes of diarrhoea in young and adult cattle. Subclinical gastro-intestinal parasitsm causes indirect and more subtle losses. This type of parasitism is regarded as the most important cause of economic loss of the farmers (Maichomo et al.2004). A significantly (p<0.01) increased milk production of 109.5 kg/cow/lactation in treated group was reported by Giasuddin et al. (1995) under extensive and semiextensive cattle management systems of Bangladesh. Under traditional management system in villages of Bangladesh, calves are reared on poor diet. Even a small worm burden may be deleterious for these calves. A mortality rate of 7% in calves from such management system was reported due to parasitic infection in Baghabarighat of Bangladesh (Motalib & Alam 1983). Reduced productivity, mortality and poor product quality were reported to be the effect of parasitic diseases (Morris & Meek 1980). An economic loss amounted to be US$2.6 million due to condemnation of liver during 10-year period for fascioliasis was reported from Kenya (Kithuka et al. 2002). In general gastrointestinal nematode parasitism results in a reduced nutrient to the host through reduction in food intake (mainly for abomasal nematodes) and reduced food efficiency (mainly for small intestinal nematodes). Thus gastrointestinal nematode parasitism reduces host performance through affecting host nutritional status. Conversely, it has also long been known or at least suspected, that improved host nutrition may detrimentally affect gastrointestinal nematodes (Houdijk & Athanasiadou 2003).
Number of eggs per gram of faeces may help to know the severity of parasitic infection. Although there are factors that influence egg counts the following figures can be taken as a guide for the purpose of treatment. In cattle 300-600 eggs of nematode per gram of faeces indicates the advisability of treatment. For Fasciola hepatica the presence of 100-200 eggs per gram of faeces of cattle indicate an infection likely to be pathogenic (Soulsby 1982). Phiri et al.(2005) categorized intensity of fasciola infection as light infection (1-10 epg), moderate infection (11-25 epg), heavy infection (26-50) and severe infection (>50 epg).
4
Table I: Prevalence of different helminth parasites in cattle reported by authors from Bangladesh and abroad
Author and year
Study detail Prevalence
Islam (1975)
A cross-sectional abattoir survey from nine abattoirs situated throughout Bangladesh. The visceral organs and heads of 224 cattle, 5 buffalo, 118 goats and 20 sheep were examined for the presence of schistosomes.
Schistosoma indicum 43%, Schistosoma spindale 33%, Schistosoma nasale 12%
Garrels (1975)
Cross-sectional coprological survey from Dhaka district of Bangladesh. Sample size: 500 indigenous cows. Fifty percent of the animals had multiple infections with helminths.
Overall prevalence 83.7% (Range 66.6% to 92.4%) Paramphistomum spp. 64.4%, Fasciola gigantica 22.4%, Strongylid/Trichostrongylid 34.0%, Strogyloides papillosus 1.8%, Capillaria bovis 12.2% Rahman
and Mondal (1983)
Cross-sectional abattoir survey. They counted parasite from viscera of 450 animals in 7 cities of Bangladesh. All the animals were infected with at least one type of helminths and 11.3% of the animals were infected with more than 7 species of helminths.
Paramphistomum spp. 21.7%, Fasciola gigantica,53.0%, Schistosoma spp. 45.9%, Neoascaris vitulorum 18.6%, Strongyloides papillosus 8.0%, Trichuris globulosa 70.0%, Capillaria spp. 35.8% Mecistocirrus digitatus 44.0%, Hemonchus spp. 16.3%, Trichostrongylus axei 45.3%, Buostomum bovis 3.5%, Agriostomum vriburgi 1.0%, Cooperia punctata
37.5%, Ostertagia trifurcate 2.0%, Esophagostomum radiatum 43.0% and Dictyocaulus viviparous 2.0%
Howlader et al. (1990)
Longitudinal observational survey in Dhaka district of Bangladesh. Sample size: 150 cattle:20 calves(upto 1 year), 62 yearlings(1-3 years)and 68 adults (>3years)
Overall prevalence of Fasciola
gigantica 21%, Paramphistomum spp. 46.0%, Schistosomaspp. 8%. Their objective was to report incidence but they described prevalence.
Bari et al. (1991)
Cross-sectional coprological survey from organized diary farm of Bangladesh Agricultural University. Sample size:100
Paramphistomum spp. 30%, Fasciola gigantica 8% Fifty eight (58%) percent of the animals had multiple infections., Nematode 15%, Schistosoma spp. 2.0%

5
Table I: continued
Author and year
Study detail Prevalence
Cringoli et
al. (2002) Cross-sectional coprological survey from Italy. Eighty one bovine farms randomly selected from 420 farms. The total number of fecal samples collected from 81 bovine farms was 975 (494 cows, 259 heifers/steers and 222 calves).
Herd-level prevalence Fasciola hepatica 11.1% Dicrocoelium dendriticum 53.1% Animal-level prevalence Fasciola hepatica 1.8% Dicrocoelium dendriticum 16.0% F. hepatica epg ranged from 10-100 with an average of 27
Kithuka et al. (2002)
Retrospective abbatoir survey from Kenya. A total of 5421188 cattle were slaughtered in the seven (out of eight) provinces of Kenya during 10-year period.
Fasciola spp. 8% (Range 3.5% to 16%)
Maichomo et al.(2004)
Cross-sectional survey from south-western Kenya. Sample size:109 calves
Overall 69.2% of nematode infection
Keyyu et al. (2005)
Longitudinal survey from the Southern Highlands of Tanzania. A total of 138 multistage stratified random sample
Traditional management system Fasciola gigantica 44.9% Amphistome 82.7% Small-scale dairy system Fasciola gigantica 17.8% Amphistome 35.9% Large-scale dairy system Fasciola gigantica 30.2% Amphistome 47.4%
Molina et al. (2005)
Retrospective abattoir survey in Southern Mindanao, Philippines. Sample size:250
Average prevalence in cattle was 38.05%
Pfukenyi et al. (2005, 2006)
Cross-sectional survey in highveld and lowveld communal grazing areas of Zimbabwe. Sample size:16264
Amphistome 29.5% Fasciola gigantica 15.4%

6
2.4 Risk factors of parasitic helminth infections
2.4.1 Trematodes
For any disease if risk area can be mapped then control program can be focused accordingly. Tum et al. (2004) used GIS model for mapping risk of fascioliasis in cattle and buffalos in Cambodia. They used inundation, proximity to rivers, land use, slope, elevation and density of cattle and buffaloes as determinants which were validated by a survey data.
Fascioliasis has a predictable seasonal pattern in region where snails are active for only part of the year (Radostits et al.2000).The outbreaks of fascioliasis depend upon three main factors: availability of suitable snail habitat, temperature (>15ºC) and moisture (Urquhart et al 1996). In general lymnaeid snails prefer non-acidic low-lying swampy areas with slowly moving water but land with small streams, springs, blocked drainage or spillage water troughs may also be potentially hazardous infecting grounds (Radostits et al. 2000). The ideal moisture condition for snail breeding and development of Fasciola hepatica within snails are provided when rainfall exceeds transpiration. Such conditions are also essential for the development of fluke eggs, for miracidia searching for snails and for the dispersal of cercariae being shed from snail. In subtropical and tropical countries with distinct wet and dry seasons, it appears that optimal development of eggs (Fasciola gigantica) to miracidia occur at the start of wet season and development within the snail is complete by the end of rainy season. Shedding of cercariae commence at the start of dry season when the water level is still high and continues as the water level drops (Urquhart et al 1996). The development and hatching of Fasciola gigantica eggs takes 16-30 days at 20ºC, 11-25 days at 25 ºC and 12-24 days at 30
ºC and development of larval F. gigantica in the snail takes 25-75 days. The prepatent period of Fasciola gigantica is approximately 3 months (Chowdhury et al. 1994). Chowdhury et al. (1994) reported peak snail infectivity at the middle of rainy season. So in Bangladesh context it is presumed that metacercarial availability in herbage will be greatest at the end of rainy season.
Life cycle of amphistomes and schistosoma are also snail dependent and similar to fasciola (Urquhart et al 1996).
Mzembe and Chaudhry (1981) described clear picture of fascioliasis in cattle of Malawi April to July was considered to be the time for snail infection. July to October is cercariae shedding period and encysted metacercariae survival period up to December. Sporadic outbreaks of acute fascioliasis in August and September and chronnic fascioliasis in November to March. Seasonal pattern of fascioliasis was also described by others (Keyyu et al. 2005, Pfukenyi et al. 2005)
Armour (1980) reported that ground water levels of 0-70cm, high stocking densities and trampling of the soil were suitable for favourable snail environment (intermediate host of F. hepatica).
Large pastures were identified as risk factor (OR 2.2, 95% CI 1.4, 3.5, p=0.001) for bovine fascioliasis from the southern Italian Apennines in Italy. The authors also found higher prevalence (χ2 =26.25, p<0.01) in older animals (Cringoli et al. 2002). Significanlty increased for fascioliasis, paramphistomiasis and schistosomiasis infection in older animals were also reported by others (Pfukenyi et al. 2005, Pfukenyi et al. 2006, Molina et al. 2005, Keyyu et al. 2005, Islam, 1975, Rahman & Mondal, 1983). Traditional management system (χ2 =124, df=2, p=0.001) was reported as risk factors for bovine fascioliasis and amphistomiasis in the Sothern Highlands of Tanzania (Keyyu et al. 2005). They explained high prevalence in

7
traditional farms might be due to heavy contamination of snail habitat and ingestion of metacerariae as a result of high stocking density and local overcrowding.
In Bangladesh there are very few communal grazing lands. One example is near baghabari of Pabna district locally called ‘bathan’ (10,000 acres). During the monsoon this area remains deeply flooded for 4-5 months. This land is strip grazed under close supervision from December to June each year. The pasture infectivity of ‘bathan’ was evaluated by Pharo (1981) from a longitudinal survey. He concluded that gastrointestinal parasitism in ‘bathan environment’ is not a problem for growing cattle. He mentioned the reasons behind such low level of parasitism. The ‘bathan’ pastures remain clean at the beginning of the ‘bathan’ season because of being submerged for 4-5 months under monsoon flood. More over some factors, like village children collect cow dung and dry it for fuel, strip grazing and high temperature and or low rainfall from January to June, prevent build up of infective stages of helminth.
2.4.2 Nematodes
The life cycle of nematodes are direct. No multiplication of the parasite takes place out of the final host. So the pasture contamination with infective stages depends upon mainly on biotic potential of the parasite, high stocking density, immune status of the host, hypobiosis, macroclimate and microclimate. A wide spectrum of biotic potential exists in nematodes such as Hemonchus contortus and Ascaris suum producing many thousands of eggs daily wheras Trichostrongylus spp.only a few hundred. Periparturient relaxation of immunity (PPRI) and thereby increased nematode faecal egg count has been observed in sheep and pigs but its involvement in cattle is less well-known. Hypobiosis or arrested larval development in final host is a phenomenon of acquired immunity or as a result of prior experience of certain climatic or seasonal influence. The microhabitats of the free-living stages consist of soil, mat, herbage and host faeces. Moderate temperature and high humidity favour the survival and development of infective stages. The microclimate humidity depends not only on rainfall but also on the soil structure, vegetation type and drainage. One important feature in helminth infection is the regularity with which increased levels appear at the same period each year. Based on the seasonal pattern prediction models had been developed and found successful (Armour, 1980). The nematode larval (L3) concentration in the pasture was found highest in July and lowest in December. Summer and rainy seasons (April-September) with high ambient temperature (19.4-31.5 degrees C), high relative humidity (75-99%), rainfall (0.0-81.4 mm) and high evaporation rate (0.6-8.9 mm) were identified as risk periods of pasture and cattle infection in Mymensingh district of Bangladesh (Begum et al. 2003). From Kenya Nginyl et al. (2001) also reported significant difference in pasture larval counts with time of sampling (p<0.0001). The peak of pasture infectivity occurred in July, August and December 1995 and in February and March 1996
Age immunity does not operate against most of the gastro-intestinal nematodes of ruminants, but may influence the course of infection viz. extended prepatent period, reduced pathogenic effect and possibly an increased ability to acquire immunity. Nginyl et al. (2001) found significantly (p<0.05) higher FEC in calves than those for adults. An apparent increased susceptibility of entire male ruminants to helminths has also been reported which could be of particular epidemiological importance in countries where castration is not routinely practiced. This phenomenon is related to male sex hormone androgen (Armour, 1980).

8
2.5 Clinical signs associated with parasitic helminth infection
2.5.1 Trematodes
The common non pathognomonic signs of fascioliasis are sudden death, rapid loss of condition, reduced milk yield, severe anemia, ascites and bottle jaw. Paramphistomiasis is characterized clinically by anorexia, persistent foetid diarrhoea ,dehydration and weight loss. Intestinal schistosomiasis are reported to be characterized by marked diarrhoea with straining during defecation, presence of large blood clots and mucus with faeces, grinding of teeth, bellowing and grunting during defecation. (Reinecke, 1983, Radostits et al. 2000)
2.5.2 Nematodes
The clinical sign of nematode infection may vary on the type of parasite. The common clinical signs are loss of weight, diarrhoea, edema and anemia (Reinecke, 1983, Radostits et al. 2000)
2.6. Statistical analysis
2.6.1 Reducing the number of independent variables
2.6.1.1 Association among explanatory variables
An important pre-requisite for association study is that the explanatory variables should be statistically independent. One of the problems that complicate association study is multicollinearity. Multicollinearity occurs when the predictor variables are related to each other. Multcollinearity results in unstable estimates of regression coefficients, incorrect variance estimates for the coefficients of those parameters in regression models leading to inflated standard error and loss of statistical power. Simple correlation analysis are used to determine if any pairs of predictor variables are highly correlated and therefore likely to result in multicollinearity. If any such pair is found, one of the predictor variable is selected for inclusion in the final analysis. (Dohoo et. al., 1996).
2.6.1.2 Principal component analysis
Principal component analysis (PCA) can used to consolidate the information contained in all the predictor variables into a new set of uncorrelated (i.e. orthogonal) predictor variables. The computational technique automatically orders the components so that each successive component contains a decreasing proportion of the total variation among in the independent variables. Consequently, the first principal component contains the largest amount of information from the collection of original predictor variables while the last may contain very little additional information (Dohoo et. al., 1996).
2.6.2 Associations with helminth infections
2.6.2.1Classification tree
The classification and regression tree (CART) is a non-parametric method that can select those variables and their interactions that are most important in determining a categorical (classification) or continuous response (Regression) (Speybroeck et al.2004).The first veterinary application of CART was reported by Saegerman et al. (2004) in decision support tools for clinical diagnosis of bovine spongiform encephalopathy in Belgium. Classification tree is primarily a method of constructing a set of decision rules on the predictor variables. The rules are constructed by recursively partitioning the data into successively smaller groups with binary splits based on a single predictor variable. Splits for all of the predictors are examined by an exhaustive search procedure and the best split is chosen (Prasad et al. 2006).

9
In choosing the best splitter, the program seeks to maximize the average “purity” of the two child nodes. Some nodes are terminal, meaning that a final determination for classification has been reached. The end point determines the classification or prediction made by the model. The procedure initially grows maximal trees and then uses techniques such as cross-validation to prune the overfitted tree to an optimal size relying on a complexity parameter (Speybroeck et al.2004). Classification and regression analyses can be performed using the free software R®. Most of the authors used CART® for classification and regression analysis.
Random forests (RF) is a new entry to the field of data mining and is designed to produce accurate predictions that do not overfit the data (Breiman 2001). In RF bootstrap samples are drawn to construct multiple trees. Each tree is grown with randomized subset of predictors, hence the name is “random” forests. A large number of trees (500-2,000) are grown, hence a “forest ” of trees. The trees are grown to maximum size without pruning, and aggregation is by averaging the trees. By growing each tree to maximum size without pruning and selecting only the best split among a random subset at each node, RF tries to maintain some prediction strength while inducing diversity among trees (Prasad et al. 2006). The use of RF in veterinary literature was not found.
2.6.2.2 Multiple logistic regression
Multivariable techniques such as linear regression and logistic regression are now the most commonly used analyses in veterinary epidemiologic studies. Sophisticated software is now available to carry out linear and logistic regression analyses, which automatically selects important predictor variables for inclusion in the model through some form of forward, backward or stepwise selection process. When building a regression model, the investigator usually endeavours to find the most simple (parsimonious) model which adequately describes the data (Dohoo et al.1996)
10
Chapter III: Materials and Methods
3.1 Survey design and sampling
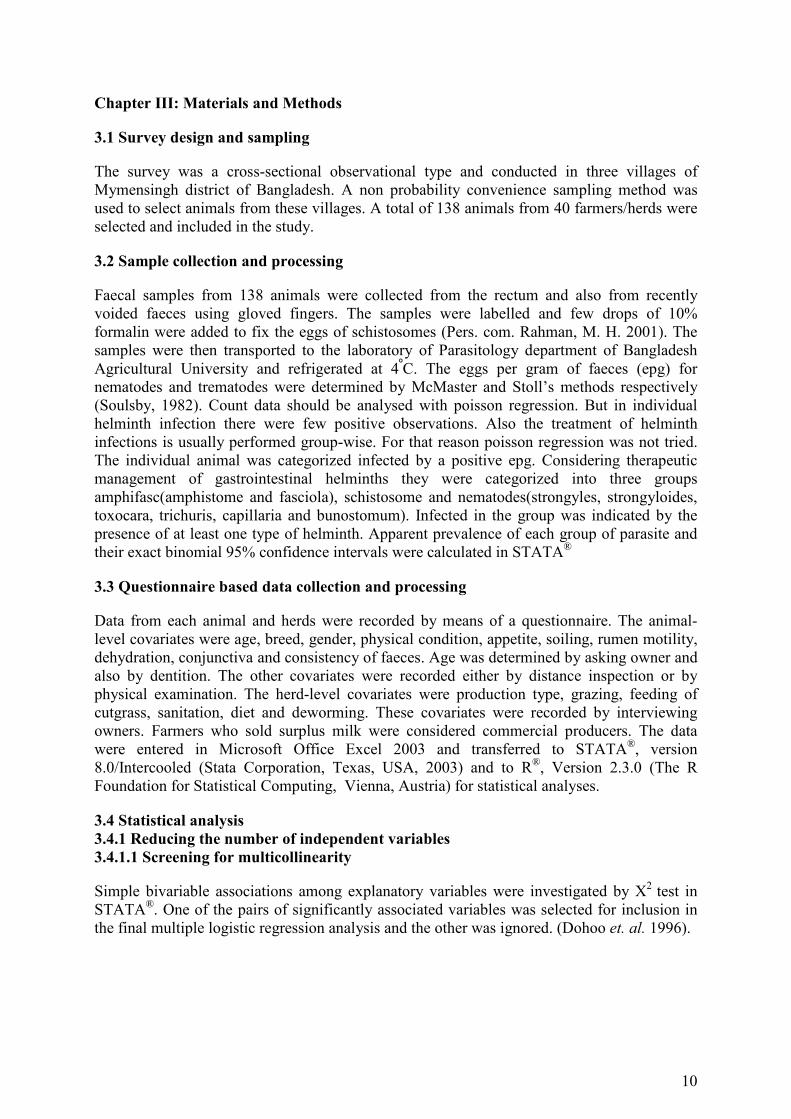
The survey was a cross-sectional observational type and conducted in three villages of Mymensingh district of Bangladesh. A non probability convenience sampling method was used to select animals from these villages. A total of 138 animals from 40 farmers/herds were selected and included in the study.
3.2 Sample collection and processing
Faecal samples from 138 animals were collected from the rectum and also from recently voided faeces using gloved fingers. The samples were labelled and few drops of 10% formalin were added to fix the eggs of schistosomes (Pers. com. Rahman, M. H. 2001). The samples were then transported to the laboratory of Parasitology department of Bangladesh Agricultural University and refrigerated at 4ºC. The eggs per gram of faeces (epg) for nematodes and trematodes were determined by McMaster and Stoll’s methods respectively (Soulsby, 1982). Count data should be analysed with poisson regression. But in individual helminth infection there were few positive observations. Also the treatment of helminth infections is usually performed group-wise. For that reason poisson regression was not tried. The individual animal was categorized infected by a positive epg. Considering therapeutic management of gastrointestinal helminths they were categorized into three groups amphifasc(amphistome and fasciola), schistosome and nematodes(strongyles, strongyloides, toxocara, trichuris, capillaria and bunostomum). Infected in the group was indicated by the presence of at least one type of helminth. Apparent prevalence of each group of parasite and their exact binomial 95% confidence intervals were calculated in STATA®
3.3 Questionnaire based data collection and processing
Data from each animal and herds were recorded by means of a questionnaire. The animal-level covariates were age, breed, gender, physical condition, appetite, soiling, rumen motility, dehydration, conjunctiva and consistency of faeces. Age was determined by asking owner and also by dentition. The other covariates were recorded either by distance inspection or by physical examination. The herd-level covariates were production type, grazing, feeding of cutgrass, sanitation, diet and deworming. These covariates were recorded by interviewing owners. Farmers who sold surplus milk were considered commercial producers. The data were entered in Microsoft Office Excel 2003 and transferred to STATA®, version 8.0/Intercooled (Stata Corporation, Texas, USA, 2003) and to R®, Version 2.3.0 (The R Foundation for Statistical Computing, Vienna, Austria) for statistical analyses.
3.4 Statistical analysis
3.4.1 Reducing the number of independent variables
3.4.1.1 Screening for multicollinearity
Simple bivariable associations among explanatory variables were investigated by Χ2 test in STATA®. One of the pairs of significantly associated variables was selected for inclusion in the final multiple logistic regression analysis and the other was ignored. (Dohoo et. al. 1996).
11
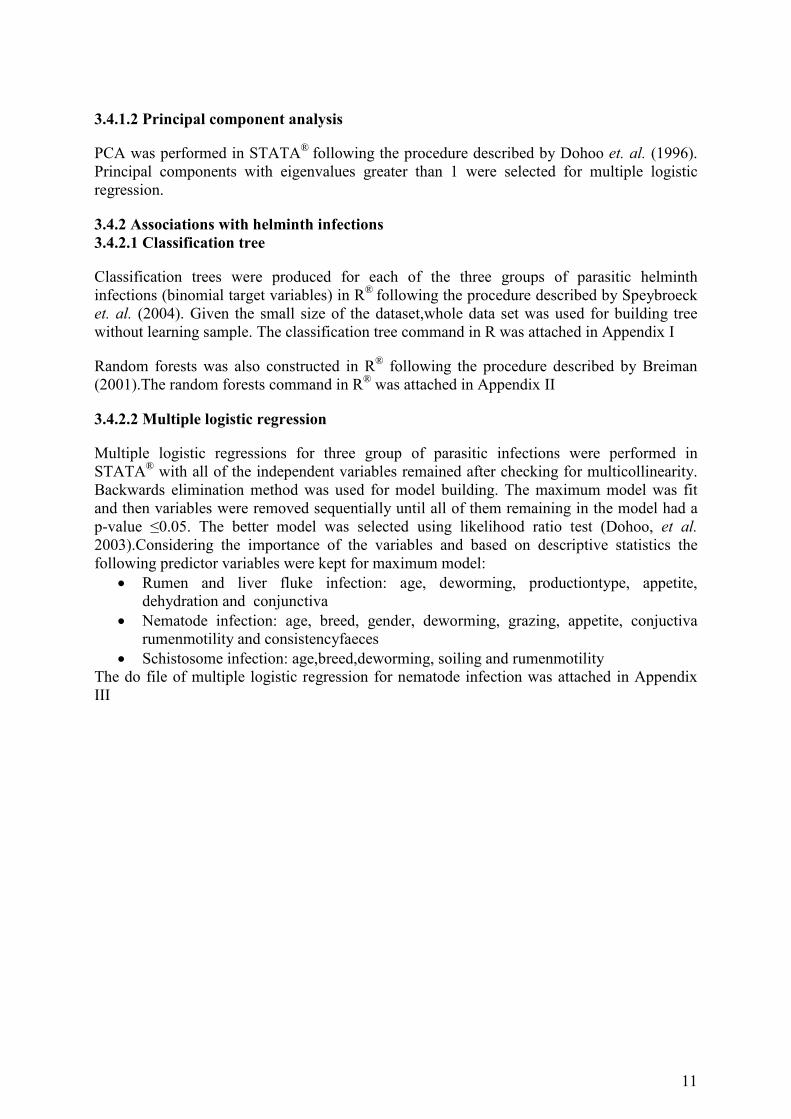
3.4.1.2 Principal component analysis
PCA was performed in STATA® following the procedure described by Dohoo et. al. (1996). Principal components with eigenvalues greater than 1 were selected for multiple logistic regression.
3.4.2 Associations with helminth infections
3.4.2.1 Classification tree
Classification trees were produced for each of the three groups of parasitic helminth infections (binomial target variables) in R® following the procedure described by Speybroeck et. al. (2004). Given the small size of the dataset,whole data set was used for building tree without learning sample. The classification tree command in R was attached in Appendix I
Random forests was also constructed in R® following the procedure described by Breiman (2001).The random forests command in R® was attached in Appendix II
3.4.2.2 Multiple logistic regression
Multiple logistic regressions for three group of parasitic infections were performed in STATA® with all of the independent variables remained after checking for multicollinearity. Backwards elimination method was used for model building. The maximum model was fit and then variables were removed sequentially until all of them remaining in the model had a p-value ≤0.05. The better model was selected using likelihood ratio test (Dohoo, et al. 2003).Considering the importance of the variables and based on descriptive statistics the following predictor variables were kept for maximum model:
• Rumen and liver fluke infection: age, deworming, productiontype, appetite, dehydration and conjunctiva
• Nematode infection: age, breed, gender, deworming, grazing, appetite, conjuctiva rumenmotility and consistencyfaeces
• Schistosome infection: age,breed,deworming, soiling and rumenmotility The do file of multiple logistic regression for nematode infection was attached in Appendix III
12
Chapter IV: Results
4.1 Data exploration
A general overview of the sample is shown in Table II. Female, indigenous, not dewormed and zero-grazed animals predominate in the sample. Mean age of the animals is 3.62±1.7 years. The cattle herd size is provided in Table III. Largest herd size is 11. Most of the herds contain 2 or 3 animals.
4.2 Apparent prevalence
Apparent prevalence of individual helminth infections with their mean epg are shown in Table IV. Prevalence of helminth infections (groups) are in Table V. Both the prevalence (37%) and mean epg (107) are highest in stronyles infections. Whereas the lowest prevalence (2%) and mean epg (1) are observed in capillaria infection. Seventy eight percent cattle are infected with at least one type of helminth. The frequency of multiple helminth infections is given in Table VI. Thirty four percent animals are infected with two types of helminths.
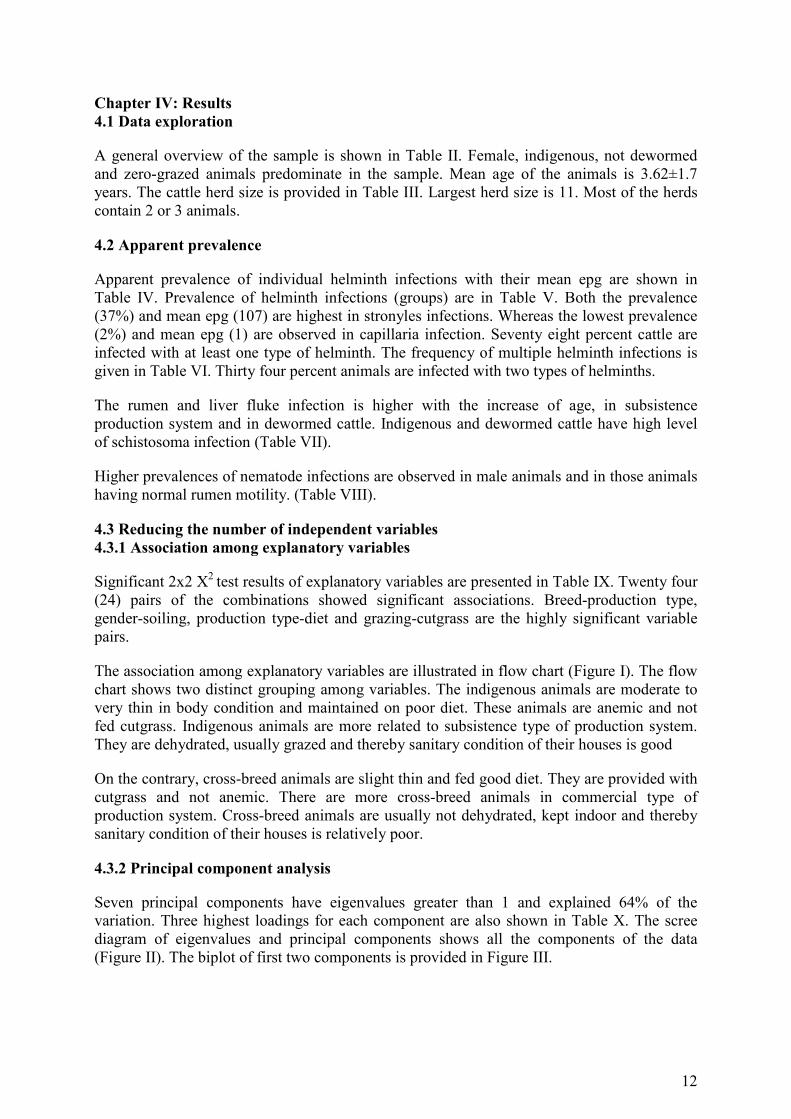
The rumen and liver fluke infection is higher with the increase of age, in subsistence production system and in dewormed cattle. Indigenous and dewormed cattle have high level of schistosoma infection (Table VII).
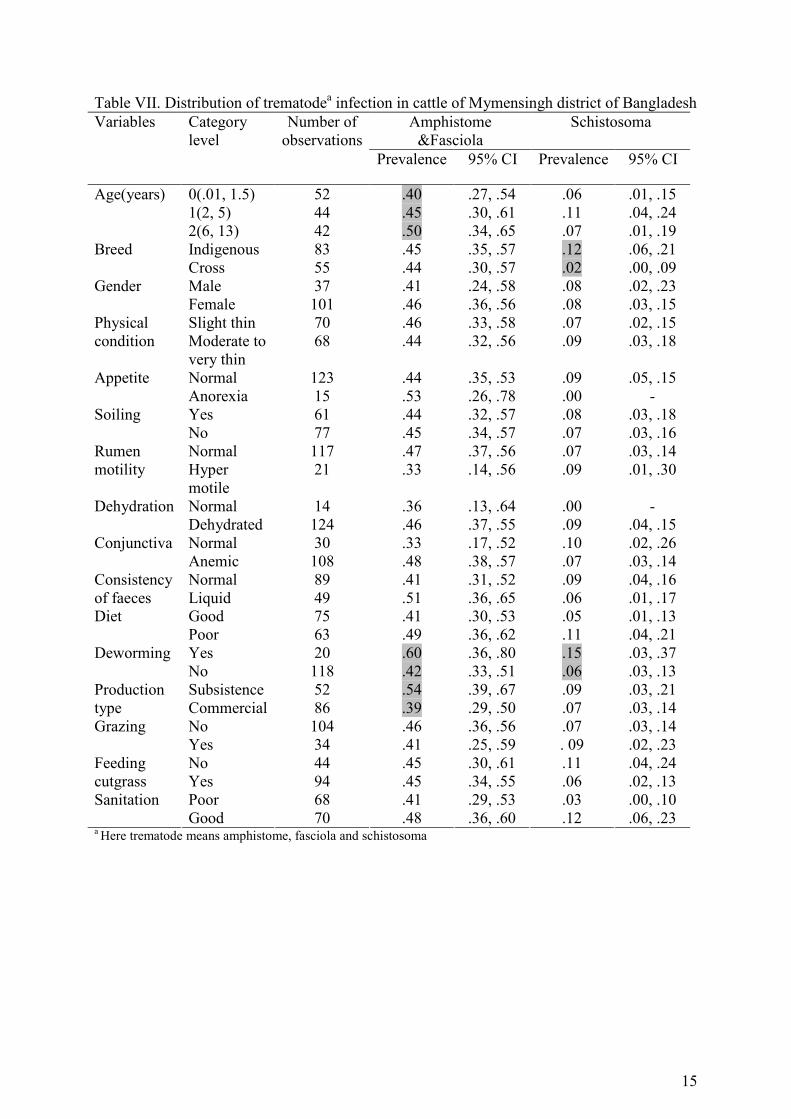
Higher prevalences of nematode infections are observed in male animals and in those animals having normal rumen motility. (Table VIII).
4.3 Reducing the number of independent variables
4.3.1 Association among explanatory variables
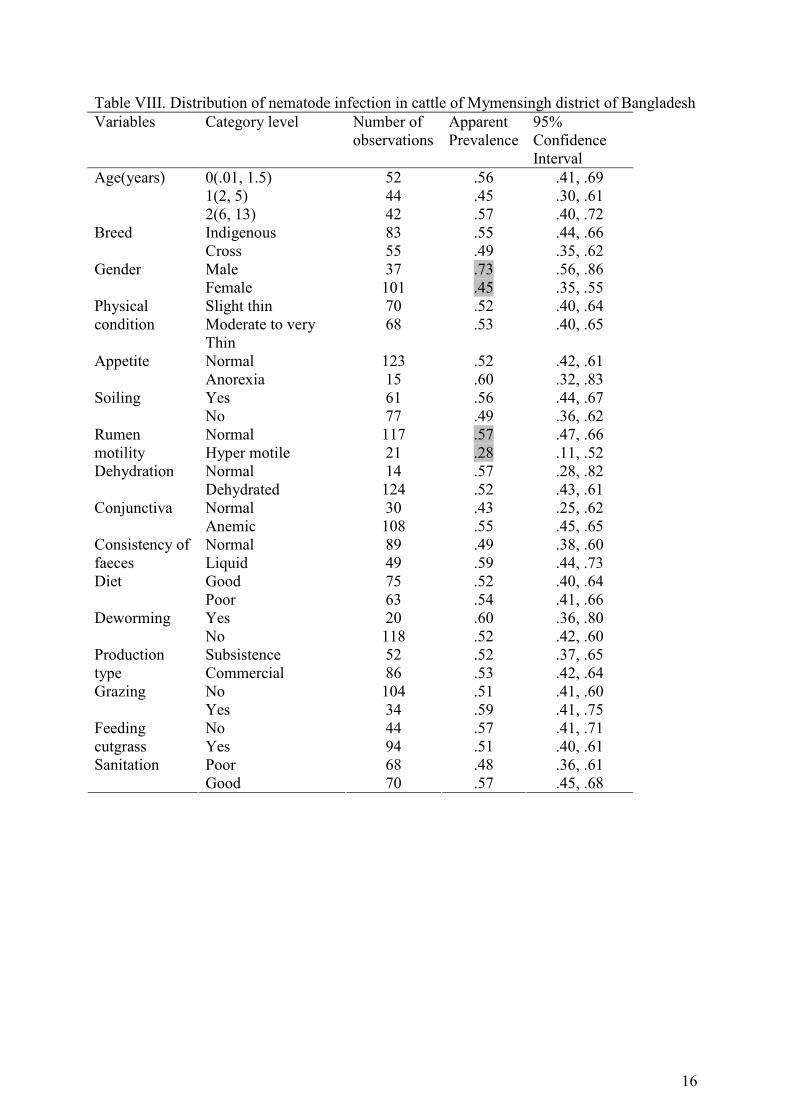
Significant 2x2 Χ2 test results of explanatory variables are presented in Table IX. Twenty four (24) pairs of the combinations showed significant associations. Breed-production type, gender-soiling, production type-diet and grazing-cutgrass are the highly significant variable pairs.
The association among explanatory variables are illustrated in flow chart (Figure I). The flow chart shows two distinct grouping among variables. The indigenous animals are moderate to very thin in body condition and maintained on poor diet. These animals are anemic and not fed cutgrass. Indigenous animals are more related to subsistence type of production system. They are dehydrated, usually grazed and thereby sanitary condition of their houses is good
On the contrary, cross-breed animals are slight thin and fed good diet. They are provided with cutgrass and not anemic. There are more cross-breed animals in commercial type of production system. Cross-breed animals are usually not dehydrated, kept indoor and thereby sanitary condition of their houses is relatively poor.
4.3.2 Principal component analysis
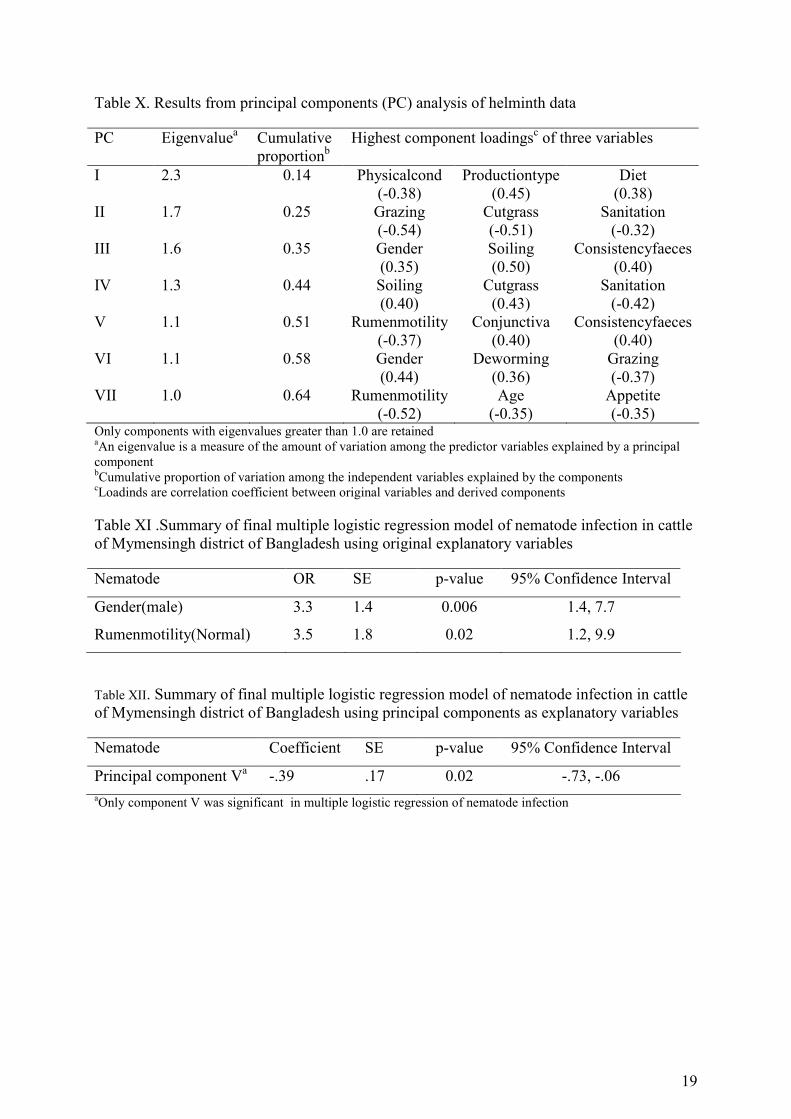
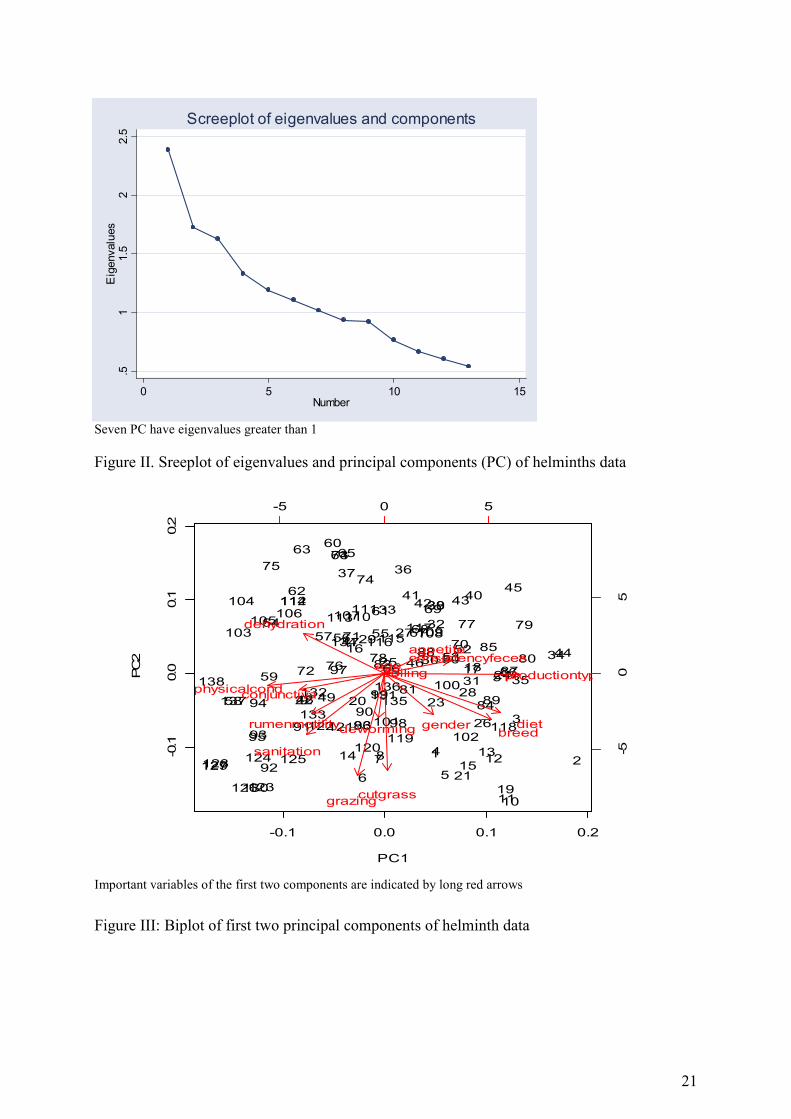
Seven principal components have eigenvalues greater than 1 and explained 64% of the variation. Three highest loadings for each component are also shown in Table X. The scree diagram of eigenvalues and principal components shows all the components of the data (Figure II). The biplot of first two components is provided in Figure III.

13
Table II. Description of variables and their distribution in helminth data
Variables Category level Number of observations
Age(years) 0(.01, 1.5)a 52 1(2, 5) 44 2(6, 13) 42 Breed Indigenous 83 Cross 55 Gender Male 37 Female 101 Physical condition Slight thin 70 Moderate to very thin 68 Appetite Normal 123 Anorexia 15 Soiling of perineum Yes 61 No 77 Rumen motility Normal 117 Hyper motile 21 Dehydration Normal 14 Dehydrated 124 Conjunctiva Normal 30 Anemic 108 Consistency of faeces Normal 89 Liquid 49 Diet Good 75 Poor 63 Deworming Yes 20 No 118 Production type Subsistence 52 Commercial 86 Grazing No 104 Yes 34 Feeding cutgrass No 44 Yes 94 Sanitation Poor 68 Good 70 aMinimum and maximum category value
Table III. Cattle herd size in helminth data of Mymensingh district of Bangladesh
Herd size Frequency
1 5 2 9 3 9 4 7 5 6 6 2 7 1 11 1
Total 40

14
Table IV. Apparent prevalence and epg of different helminth infections of cattle in Mymensingh district of Bangladesh
Helminth Mean SE 95 % CI Mean epga
SE epg
Overall .78 .03 .70 .84 - - Amphistome .35 .04 .27 .44 70 10
Fasciola .15 .03 .10 .23 30 9 Schistosoma .08 .02 .04 .13 9 6 Strongyles .37 .04 .29 .46 107 18
Strongyloides .09 .02 .05 .15 56 19 Toxocara .03 .01 .00 .07 4 5 Trichuris .08 .02 .04 .14 13 7 Capillaria .02 .01 .00 .06 1 3
Bunostomum .08 .02 .04 .14 20 8 aepg=eggs per gram of faeces
Table V. Apparent prevalence of helminth infections (groups) in cattle of Mymensingh district of Bangladesh
Helminth Mean SE 95 % CI
Overall .78 .03 .70 .84 Amphifasca .44 .04 .36 .53 Schistosoma .08 .02 .04 .14 Nematodec .52 .04 .44 .61
aOverall idicates infection by at least one type of parasite bAmphifasc means liver fluke and/or rumen fluke infection
cIndicates infection by at least one type of nematode
Table VI. Multiple infections of helminths in cattle of Mymensingh district of Bangladesh
Number of helminths
frequency Percentage
0 37 26.81 1 41 29.71 2 47 34.05 3 10 7.25 4 2 1.44 5 1 .72
Total 138 100
15
Table VII. Distribution of trematodea infection in cattle of Mymensingh district of Bangladesh
Amphistome &Fasciola
Schistosoma Variables Category level
Number of observations
Prevalence 95% CI Prevalence 95% CI
0(.01, 1.5) 52 .40 .27, .54 .06 .01, .15 1(2, 5) 44 .45 .30, .61 .11 .04, .24
Age(years)
2(6, 13) 42 .50 .34, .65 .07 .01, .19 Indigenous 83 .45 .35, .57 .12 .06, .21 Breed Cross 55 .44 .30, .57 .02 .00, .09 Male 37 .41 .24, .58 .08 .02, .23 Gender Female 101 .46 .36, .56 .08 .03, .15 Slight thin 70 .46 .33, .58 .07 .02, .15 Physical
condition Moderate to very thin
68 .44 .32, .56 .09 .03, .18
Normal 123 .44 .35, .53 .09 .05, .15 Appetite Anorexia 15 .53 .26, .78 .00 - Yes 61 .44 .32, .57 .08 .03, .18 Soiling No 77 .45 .34, .57 .07 .03, .16 Normal 117 .47 .37, .56 .07 .03, .14 Rumen
motility Hyper motile
21 .33 .14, .56 .09 .01, .30
Normal 14 .36 .13, .64 .00 - Dehydration Dehydrated 124 .46 .37, .55 .09 .04, .15 Normal 30 .33 .17, .52 .10 .02, .26 Conjunctiva Anemic 108 .48 .38, .57 .07 .03, .14 Normal 89 .41 .31, .52 .09 .04, .16 Consistency
of faeces Liquid 49 .51 .36, .65 .06 .01, .17 Good 75 .41 .30, .53 .05 .01, .13 Diet Poor 63 .49 .36, .62 .11 .04, .21
Deworming Yes 20 .60 .36, .80 .15 .03, .37 No 118 .42 .33, .51 .06 .03, .13
Subsistence 52 .54 .39, .67 .09 .03, .21 Production type Commercial 86 .39 .29, .50 .07 .03, .14
No 104 .46 .36, .56 .07 .03, .14 Grazing Yes 34 .41 .25, .59 . 09 .02, .23 No 44 .45 .30, .61 .11 .04, .24 Feeding
cutgrass Yes 94 .45 .34, .55 .06 .02, .13 Poor 68 .41 .29, .53 .03 .00, .10 Sanitation Good 70 .48 .36, .60 .12 .06, .23
a Here trematode means amphistome, fasciola and schistosoma
16
Table VIII. Distribution of nematode infection in cattle of Mymensingh district of Bangladesh
Variables Category level Number of observations
Apparent Prevalence
95% Confidence Interval
0(.01, 1.5) 52 .56 .41, .69 1(2, 5) 44 .45 .30, .61
Age(years)
2(6, 13) 42 .57 .40, .72 Indigenous 83 .55 .44, .66 Breed Cross 55 .49 .35, .62 Male 37 .73 .56, .86 Gender Female 101 .45 .35, .55 Slight thin 70 .52 .40, .64 Physical
condition Moderate to very Thin
68 .53 .40, .65
Normal 123 .52 .42, .61 Appetite Anorexia 15 .60 .32, .83 Yes 61 .56 .44, .67 Soiling No 77 .49 .36, .62 Normal 117 .57 .47, .66 Rumen
motility Hyper motile 21 .28 .11, .52 Normal 14 .57 .28, .82 Dehydration Dehydrated 124 .52 .43, .61 Normal 30 .43 .25, .62 Conjunctiva Anemic 108 .55 .45, .65 Normal 89 .49 .38, .60 Consistency of
faeces Liquid 49 .59 .44, .73 Good 75 .52 .40, .64 Diet Poor 63 .54 .41, .66
Deworming Yes 20 .60 .36, .80 No 118 .52 .42, .60
Subsistence 52 .52 .37, .65 Production type Commercial 86 .53 .42, .64
No 104 .51 .41, .60 Grazing Yes 34 .59 .41, .75 No 44 .57 .41, .71 Feeding
cutgrass Yes 94 .51 .40, .61 Poor 68 .48 .36, .61 Sanitation Good 70 .57 .45, .68
17
Table IX. Significant association among explanatory variables
Pair variables Χ2 p value Partial correlation coefficient
Breed Physicalcond 0.005 -0.1665 Breed Dehydration 0.002 -0.1938 Breed Diet 0.01 -0.0230 Breed Production type .000 0.3249 Gender Dehydration .02 -0.1361 Gender Soiling 0.000 0.3105 Physicalcond Conjunctiva .02 0.1148 Physicalcond Consistencyfeces .001 -0.2470 Physicalcond Productiontype .01 -0.0043 Physicalcond Sanitation .01 0.1258 Physicalcond Diet 0.007 -0.1381 Soiling Consistencyfeces 0.009 0.1926 Rumenmotility Sanitation 0.001 0.3146 Rumenmotility Productiontype 0.01 -0.2130 Dehydration Grazing .04 -0.2313 Conjunctiva Sanitation .03 0.1492 Conjunctiva Diet 0.02 -0.1149 Productiontype Diet .000 0.4352 Productiontype Grazing .003 -0.3028 Grazing Cutgrass .000 0.3762 Grazing Sanitation .02 0.1660 Cutgrass Diet .002 0.3245 Cutgrass Deworming .03 0.1189 Sanitation Diet .007 -0.2709

18
4.4 Associations with helminth infections
4.4.1 Classification tree
4.4.1.1 Risk factor and clinical signs
Data of mixed amphistome-fasciola and schistosome infections does not allow the construction of any tree (increase of relative cost at the first branch)The only tree remaining after pruning is that of nematode infection. Three variables are kept after pruning. In order of decreasing priority they are age, rumen motility and sanitation (Figure IV). The accuracy in building classification tree is 64%.
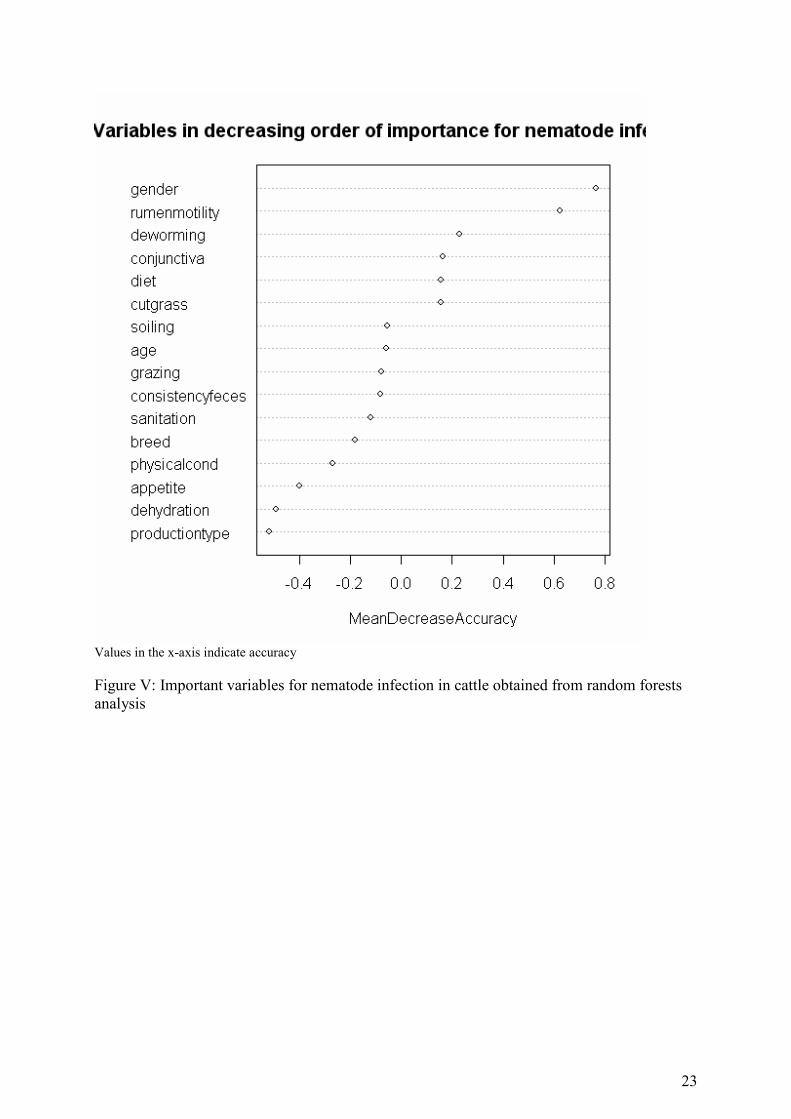
Random forests provides important variables in order of decreasing priority for every group of helminths infection. The important variables for nematode infection only in order of decreasing priority are shown in Figure V. The error rate is 48.55%.
4.4.2 Multiple logistic regression
4.4.2.1 Risk factors and clinical signs
None of the variables are significantly associated with amphistome-fasciola mixed infection and schistosome infection in multiple logistic regression. The only animal level factor significantly associated with nematode infection is sex. Male animal (OR=3.3, p=.006, 95% CI=1.4, 7.7) has significantly increased prevalence of nematode infection (Table XI).Principal component V (p=0.02, 95% CI =-.73, -.06) is significantly associated with nematode infection (Table XII).
In multiple logistic regression, the only clinical sign significantly associated with nematode infection is rumen motility. Animals with normal rumen motility (OR =3.5, p=0.02, 95% CI=1.2, 9.9) has significantly increased prevalence of nematode infection (Table XI).
19
Table X. Results from principal components (PC) analysis of helminth data
PC Eigenvaluea Cumulative proportionb
Highest component loadingsc of three variables
I 2.3 0.14 Physicalcond (-0.38)
Productiontype (0.45)
Diet (0.38)
II 1.7 0.25 Grazing (-0.54)
Cutgrass (-0.51)
Sanitation (-0.32)
III 1.6 0.35 Gender (0.35)
Soiling (0.50)
Consistencyfaeces (0.40)
IV 1.3 0.44 Soiling (0.40)
Cutgrass (0.43)
Sanitation (-0.42)
V 1.1 0.51 Rumenmotility (-0.37)
Conjunctiva (0.40)
Consistencyfaeces (0.40)
VI 1.1 0.58 Gender (0.44)
Deworming (0.36)
Grazing (-0.37)
VII 1.0 0.64 Rumenmotility (-0.52)
Age (-0.35)
Appetite (-0.35)
Only components with eigenvalues greater than 1.0 are retained
aAn eigenvalue is a measure of the amount of variation among the predictor variables explained by a principal component bCumulative proportion of variation among the independent variables explained by the components cLoadinds are correlation coefficient between original variables and derived components
Table XI .Summary of final multiple logistic regression model of nematode infection in cattle of Mymensingh district of Bangladesh using original explanatory variables
Nematode OR SE p-value 95% Confidence Interval
Gender(male) 3.3 1.4 0.006 1.4, 7.7
Rumenmotility(Normal) 3.5 1.8 0.02 1.2, 9.9
Table XII. Summary of final multiple logistic regression model of nematode infection in cattle of Mymensingh district of Bangladesh using principal components as explanatory variables
Nematode Coefficient SE p-value 95% Confidence Interval
Principal component Va -.39 .17 0.02 -.73, -.06
aOnly component V was significant in multiple logistic regression of nematode infection

20
Figure I. Flow chart of association among explanatory variables Green thick lines indicate cross breed, commercial production and good diet group, red lines indicate indigenous, subsistence production and poor diet group
Indigenous
Slight thin Moderate to very
thin
Cross breed Feeding cut grass
Poor diet
Good diet
Not dewormed Commercial production
Subsistence production
Anaemic
Normal faeces
Soiled perineum
Clean perineum
Not dehydrated Dehydrated
No grazing
Grazing
Liquid faeces
Male
Poor sanitation
Normal rumenmotiltiy Good sanitation
Female
Rumen hyper
motile
No anaemia
No cutgrass
21
Seven PC have eigenvalues greater than 1
Figure II. Sreeplot of eigenvalues and principal components (PC) of helminths data
-0.1 0.0 0.1 0.2
-0.1
0.0
0.1
0.2
PC1
PC2
12
3
4
56
78
9
1011
121314
15
16
1718
19
20
21
22 23
2425
26
27
28
29
30
31
32
33
34
35
3637
38394041
42 43
44
45
46
47
48 49
50
51
5253
54555657
58
59
60
61
62
636465
66
6768
69
7071
72
73
74
75
76
77
78
79
80
81
82
83
84
85
8687
88
8990
91
92
93
94
9596
97
98
99100
101
102
103
104
105106 107
108109
110111
112
113
114
115116
117
118119
120
121122
123
124 125
126
127128129
130
131132
133
134
135
136
137
138
-5 0 5
-50
5
age
breedgender
physicalcond
appetite
soiling
rumenmotility
dehydration
conjunctiva
consistencyfeces
productiontype
grazingcutgrass
sanitation
dietdeworming
Important variables of the first two components are indicated by long red arrows
Figure III: Biplot of first two principal components of helminth data
.51
1.5
22.5
Eig
envalu
es
0 5 10 15Number
Screeplot of eigenvalues and components

22
Age group I=0.01-1.5 years, II=2-5years and III=6-13yers, hyp=hyper rumen motility, poor=poor sanitation (added manually in the tree). All bold numbers indicate infected and non-bold numbers not infected
Figure IV: Full tree and pruned tree of nematode infection in cattle of Mymensingh district of Bangladesh
| gender=a
rumenmotility=a
sanitation=b
breed=a(poor)
age=b conjunctiva=a
age=b
breed=a
no(hyp) 12/4
no (cross) 12/5
no (II) 8/2 yes (I, III) 7/12
no (II) 5/3
no (cross)
6/4 yes
3/10
yes (anemic) 2/6
yes(male) 10/27
|
gender=a
rumenmotility=a
sanitation=b no (hyp)
12/4
no (poor) 27/19
yes (good) 16/23
yes (male) 10/27
23
Values in the x-axis indicate accuracy
Figure V: Important variables for nematode infection in cattle obtained from random forests analysis

24
Chapter V: Discussion, conclusion
The objectives of this survey were to identify risk factors and clinical signs associated with parasitic helminth infections in cattle of Mymensingh district of Bangladesh. Due to large number of explanatory variables and very small sample size very little of the objectives were obtained.
5.1 Apparent prevalence
To make inference about the frequency of outcome or prevalence of exposure in a target population, the study subjects should be obtained by a formal random sampling procedure (Dohoo et al. 2003). It was not in the case of this survey of helminth infections in cattle of Mymensingh district of Bangladesh. The farmers having at least one cattle were approached without any prior thinking. Those who agreed to provide their animals for sampling were included. This study area is close to Bangladesh Agricultural University, Mymensingh, Bangladesh. The farmers get easy access of treatment, extension facilities, artificial insemination facility and free consultancy on livestock health and production problems. For that reason they are relatively more aware about the health of their animals. Relatively more cross-breed animals are found in periurban areas due to availability of artificial insemination centres. Similar type of above mentioned facilities are only available in periurban areas of Bangladesh. Periurban areas may include villages surrounding districts and even upa-zillas. This sample represents cattle managed traditionally in periurban condition. So the prevalence from this survey is only applicable for the cattle population of traditional management system in periurban areas of Bangladesh.
The tropical humid climate is very favourable for the endemicity of helminth infections in all parts of Bangladesh. Animals without any parasitic infection are rare (Rahman and Mondal 1983). Mixed infections in host is the rule rather than the exception in most grazing systems. The occurrence of mixed infections may lead to decreased production due to the synergistic effect of each parasite, although this depends on the proportion of the pathogenic species (Garrles 1975, Rahman and Mondal 1983, Bari et al. 1991, Maichomo et al.2004). Prevalence of fasciola infection is in agreement with others (Howlader 1990, Garrels 1975) and that of strongyloides infection with Rahman and Mondal (1983). Bari et al. (1991) observed similar prevalence of amphistomes.
The fecal egg counts can help to measure the severity of infection. According to the classification of Phiri et al. (2005), all fasciola cases have severe infection because the range of epg for fasciola in positive cases is 100-200.
The herd size represents the real picture of traditional cattle management system. Two or three animals are most prevalent in the farms. They are mainly used for draught purpose.
Higher prevalence of amphistome in dewormed cattle can be explained by the fact that available drug (Oxyclozanide) need to be repeated three days after the initial treatment (Pers. com. Sen, M.M. 2005). This is rarely done even if we consider that the drug is effective and administered at appropriate doses and time. In subsistence production system there are more indigenous animals and mainly used for ploughing land. They are also provided with poor diet. They may also be less dewormed than those for commercial production. These may be the reasons for relatively higher prevalence of amphistome and fasciola infections in subsistence production type.

25
Indigenous cattle are used for ploughing land and more exposed to snail habitat. The only drug available against schistosoma infection in Bangladesh is antimony compound (Anthiomaline®), in injectable form, expensive and not readily available. This imported drug is usually used for severe form of nasal schistosomiasis(snoring disease). These may be the reasons for higher prevalence of schistosoma in indigenous and dewormed cattle.
5.2. Reducing the number of independent variables
5.2.1 Association among explanatory variables
Solving the problem of multicollinearity by 2X2 χ2 test or pairwise correlation has some limitations. The choice of which independent variable is to be removed is arbitrary. If pairwise correlation is used then selecting the level of correlation coefficient that represent a problem is also arbitrary. Knowledge of the production system may help to make an appropriate decision (Dohoo et al. 1996).
5.2.2 Principal component analysis (PCA)
Analysis of principal components (PCA) is more of a means to an end rather than an end in itself, because they frequently serve as intermediate steps in much larger investigations. For example principal components may be inputs to a multiple regression or cluster analysis. The PCA shows that production type, grazing, cutgrass, soiling, sanitation, conjunctiva, gender and consistency of faeces are important variables contributing to the largest amount of variation in the data set. The PC V has a significant p-value in multiple logistic regression which is represented by conjunctiva, consistency of faeces and rumen motility. The limitation of PCA is that regression coefficients of PC obtained from multiple logistic regression can not be interpreted. Conversion of the PC coefficients back into coefficients for the original predictor variables does provide values which can be interpreted. This process results in the calculation of coefficients for all predictor variables. One approach to evaluating the importance of these coefficients is to standardise them in order to determine which independent variables produce the largest change in the dependent variable when the independent variable change by one standard deviation. While this will provide an estimate of the importance of each independent variable, it does not indicate whether the variable is a statistically significant predictor (Dohoo et al. 1996).
5.3 Associations with helminth infections
If the primary objective of the cross-sectional survey is to evaluate potential associations between exposure(s) and outcome(s) of interest, a non-random sample of study subjects is often obtained purposively. Some authors criticize this non-random approach because the design is open to considerable selection bias. However, this selection bias generally limits the external validity of the survey rather than the internal validity of the survey. Biases that affect external validity are of less concern than those that affect internal validity. The principal goal may be identifying association between exposure and outcome in defined subgroup of the full study population. Then there should be adequate number of study subjects in the defined subgroups to provide reasonable power for assessing the hypothesis. In cross-sectional survey it is difficult to differentiate factors associated with persistence of outcome and factors associated with developing the outcome in the first instance. Thus factors associated persistence of outcome of interest may be incorrectly concluded as risk factor. Another limitation of cross-sectional survey is the reverse-causation problem (inability to determine which came first, the exposure or outcome). For this reason a cross-sectional survey is best

26
suited for time-invariant exposures such as breed, sex or permanent management factors (Dohoo et al. 2003).
The helminth data of cattle is representative for traditional management system but its sample size is too small to detect important associations. Another problem is the number of covariates. When multiple factors are considered in association studies, the possibility of finding associations ‘due to chance alone’ increases substantially (Dohoo et al. 1996).
5.3.1 Classification tree
5.3.1.1 Risk factor and clinical signs
Classification tree retained sanitation as third important variable for nematode infection. But sanitation is collinear with rumenmotility (χ2 p-value=0.001). Classification tree can deal with multicollinearity in an intuitively correct way (Speyboeck et al. 2004). One explanation may be the high misclassification error rate (36%). Classification tree deals more effectively with large data sets and the issues of higher dimensionality (Speyboeck et al. 2004). The helminth data has 16 covariates but only 138 observations which is very little for a classification tree. Classification and regression trees (CART) are universally applicable to classification and regression problems without assumptions on the structure of the data. The picture of the tree structure gives valuable insights into which variables are important and where, terminal nodes give a natural clustering of the data into homogenous groups. Classification tree has some limitations. A small change in data can produce highly divergent trees (unstable out put). Misclassification error rate is higher than other techniques like bagging and random forests (Breiman 2003).
Random forests handles hundreds and thousands of input variables with no degeneration in accuracy (Breiman 2001). It is not possible to examine individual trees separately (Prasad et al. 2006). Both of the techniques have kept gender and rumen motility as first two important variables for nematode infection. In the helminth data unusually misclassification error rate in random forests was higher than that of classification tree. The possible causes are small sample size and increased error rate in constructing individual tree.
5.3.2 Multiple logistic regression
5.3.2.1 Risk factors and clinical signs
In the multiple logistic regression model, the significantly higher prevalence of nematode infections in males should be interpreted with caution as it could be due to the large numbers of explanatory variables. However, the small sample size and thereby low power does not increase the risk of rejecting erroneously the null hypothesis. There are reports that entire male cattle (bulls) have increased susceptibility to nematode infections (Armour 1980). This phenomenon is related to androgen. In this survey all males are not bull. The male animals in the study area are used for draught purpose and thereby more exposed to the pasture and also more stressed. Male animals are also fed relatively poor diet. Poor diet increase the susceptibility to nematode infection (Houdijk & Athanasiadou 2003). So all these factors may increase the risk of being infected by nematode.
The prevalence of amphistome and fasciola infection has an increased trend with the age in cattle of Mymensingh district of Bangladesh (not significant). There are many reports of higher fluke prevalence in adults than calves (Cringoli et al. 2002, Molina et al. 2005, and Pfukenyi et al. 2005). It is expected because age is a surrogate measure of amount of exposure time.
27
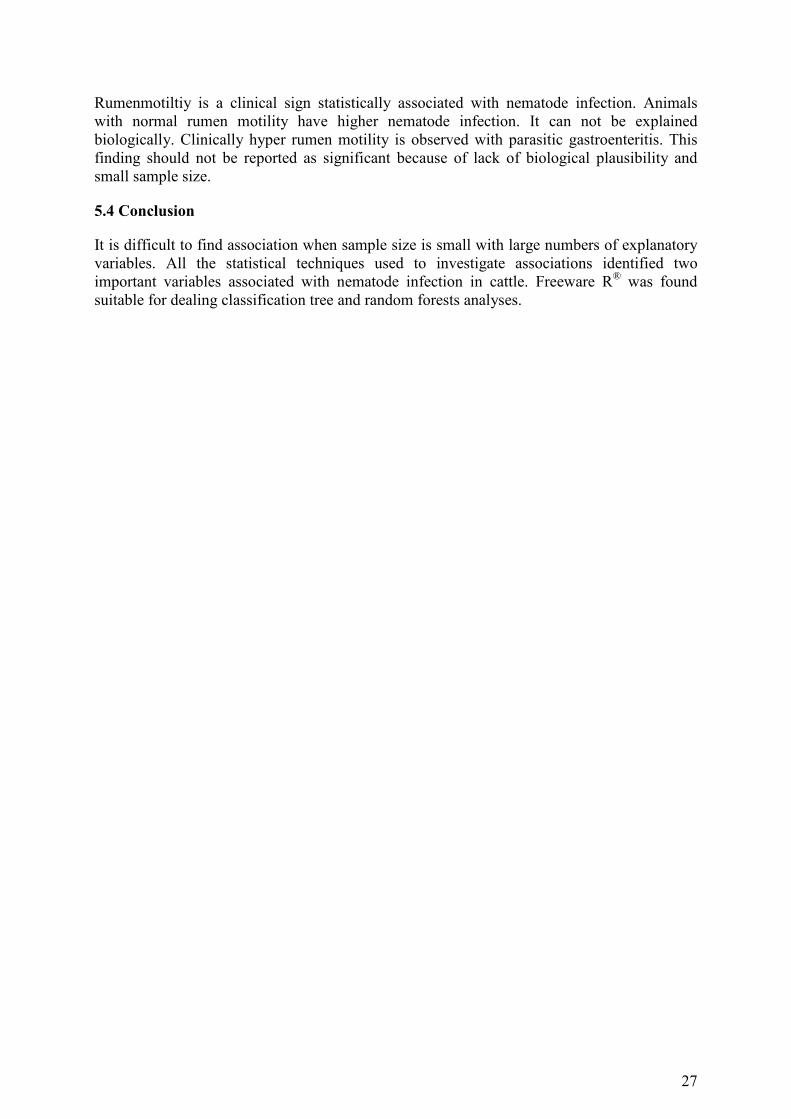
Rumenmotiltiy is a clinical sign statistically associated with nematode infection. Animals with normal rumen motility have higher nematode infection. It can not be explained biologically. Clinically hyper rumen motility is observed with parasitic gastroenteritis. This finding should not be reported as significant because of lack of biological plausibility and small sample size.
5.4 Conclusion
It is difficult to find association when sample size is small with large numbers of explanatory variables. All the statistical techniques used to investigate associations identified two important variables associated with nematode infection in cattle. Freeware R® was found suitable for dealing classification tree and random forests analyses.

28
Chapter VI: Recommendations
The ultimate objective of identifying risk factors of parasitic helminths infection in cattle is its control. To recommend control strategy detail epidemiology of helminth infection in cattle should be known. Demographic, managerial and environmental factors associated with helminth infections in cattle should be known for planning effective control program
Following are some recommendations for further research in Bangladesh context: 1. Determination of true prevalence of specific helminth by Bayesian approach using
multiple tests 2. Retrospective survey of abattoir and veterinary hospital records to have trends,
prevalence, distribution and economic loss due to helminth infections 3. Cross-sectional survey using appropriate sampling design including demographic,
managerial and environmental variables to identify risk factors 4. Cross-sectional survey to determine pasture infectivity in different seasons 5. Risk mapping and predicting helminth infections using Geographical Information
System (GIS) and simulation models
29
References
Armour, J. 1980. The epidemiology of helminth diseases in farm animals. Veterinary Parasitology 6: 7-46 Bari, A. S. M., Talukder, J.R. & Wadud, A.1991..Incidence of gastrointestinalparasites in cattle of Bangladesh Agricultural University Dairy Farm. Progressive Agriculture 2(2): 93-94 Begum, N., Sarker, M. A. S., Majumder, S., Nooruddin, M. & Ehsan, M. A. 2003. Ecology of pre-parasitic stages of gastrointestinal nematodes of ruminants. The Bangladesh Veterinarian 20(2): 80-87 Breiman, L. & Cutler, A. 2003. RFtools-for predicting and understanding data. www.stat.berkeley.edu/users/breiman/RFtools
Breiman, L. 2001. Random Forests. Machine Learning 45: 5-32 Chowdhury, S. M. Z. H., Mondal, M. H., Huq, S. & Rahman, M. H. 1994. Prevalence of Fasciola Cercariae in Lymnaeid Snails in Bangladesh. Australasian Journal of Animal Science 7(3): 401-403 Cringoli, G., Rinaldi, L., Veneziano, V, Capelli, G. & Malone J. B. 2002. A cross-sectional coprological survey of liver flukes in cattle and sheep from an area of the southern Italian Apennines. Veterinary Parasitology 108: 137-143 Dohoo, I. R., Ducrot, C., Fourichon, C., Donald, A. & Hurnik 1996. An overview of techniques for dealing with large numbers of independent variables in epidemiologic studies. Preventive Veterinary Medicine 29: 221-239 Dohoo, I.R., Martin, W. & Stryhn, H. 2003. Veterinary Epidemiologic Research. AVC Inc. Charlottetown, Prince Edward Island, Canada. FAO STAT 2003. FAO statistics database on the world wide web. http://appa.fao.org/ (accessed February, 2003) Garrels, G. 1975. Gastro-intestinal parasitic infestation of cattle in some villages of Dhaka and Tangail districts of Bangladesh. Bangladesh Veterinary Journal 9(1-4): 9-10 Giasuddin, G., Islam, M. M., Khan, E. H. & Kamal, A. H. M. 1995. Cattle health improvement through deworming. The Bangladesh Veterinarian 12(1-2): 13-15 Houdijk, J. G. M. & Athanasiadou, S. A. 2003. Direct and Indirect effects of host nutrition on ruminant gastrointestinal nematodes. In: Proceedings of the Sixth International symposium on the nutrition of herbivores, Merida, Mexico. Howlader, M. M. R., Chowdhury, M. S. Z. H., Taimur, M. J. F. A. & Jahan, S. 1990. Fluke infestations of cattle in some selected villages of Bangladesh. The Bangladesh Veterinarian 7(1): 45-47 Islam, K. S. I. 1975. Schistosomiasis in domestic ruminants in Bangladesh. Tropical Animal Health and Production 7: 244 Keyyu, J. D., Monrad, J., Kyvsgaard, N. C. & Kassuku, A. A. 2005. Epidemiology of Fasciola gigantica and amphistomes in cattle on traditional, small-scale dairy and large-scale dairy farms in the Southern Highlands of Tanzania. Tropical Animal Health and Production 37: 303-314 Kithuka, J. M., Maingi, N., Njeruh, F. M. & Ombui, J. N. 2002. The prevalence and economic importance of bovine fascioliasis in Kenya-an analysis of abattoir data. Onderstepoort Journal of Veterinary Research 69: 255-262 Maichomo, M. W., Kagira, J. M. & Walker, T. 2004. The point prevalence of gastro-intestinal parasites in calves, sheep and goats in Magadi division, South-Western Kenya. Onderstepoort Journal of Veterinary Research 71: 257-261 Martin, S.W., Meek, A.H. & Willeberg, P. 1994. Veterinary Epidemiology: Principles and Methods. Iowa State University press, Ames, Iowa. Molina, E.C., Gongaga, E. A. & Lumbao, L. A. 2005. Prevalence of infection with Fasciola gigantica and its relationship to carcase and liver weights and fluke and egg counts in slaughter cattle and buffaloes in Southern Mindiano, Philippines. Tropical Animal Health and Production 37: 215-221 Morris, R. S. & Meek, A. H. 1980. Measurement and evaluation of the economic effects of parasitic disease. Veterinary Parasitology 6: 165-184 Motalib, M. A. & Alam, M.S. 1983. The possible economic effect of gastrointestinal nematodes in young cattle in Pabna milk shed area of Bangladesh. Bangladesh Veterinary Journal 17(1-4): 5-9 Mzembe, S. A. T. & Chaudhry, M. A. 1981. The epidemiology of fascioliasis in Malawi Part II. Epidemiology in the definitive host. Tropical Animal Health and Production 13: 27-33 Nginyl, J. M., Duncan, J. L., Mellor, D. J., Stear, M. J., Wanyangu, Bain, R. K. & Gatongi, P. M. 2001. Epidemiology of parasitic gastrointestinal nematode infections of ruminants on smallholder farms in central Kenya. Research in Veterinary Science70: 33-39 Pfukenyi, D. M., Mukaratirwa, S., Willingham, A.L. & Monrad, J. 2005. Epidemiological studies of amphistome infections in cattle in the highveld and lowveld communal grazing areas of Zimbabwe. Onderstepoort Journal of Veterinary Research 72: 67-86

30
Pfukenyi, D. M., Mukaratirwa, S., Willingham, A.L. & Monrad, J. 2006. Epidemiological studies of Fasciola gigantica infections in cattle in the highveld and lowveld communal grazing areas of Zimbabwe. Onderstepoort Journal of Veterinary Research 73: 37-51 Pharo, H. J. 1981. The occurrence of gastro-intestinal parasite in growing cattle on native pastures of the Pabna District of Bangladesh. Bangladesh Veterinary Journal 15(3-4): 61-65 Phiri, A. M., Phiri, I. K., Sikasunge,C. S. & Monrad, J. Prevalence of fascioliasis in Zambian cattle observed at selected abattoirs with emphasis on age, sex and origin. Journal of Veterinary Medicine B 52: 414-416 Prasad, A. M., Iverson, L. R. & Liaw. 2006. Newer classification and regression tree techniques: Bagging and random forests for ecological predictions. Ecosystems 9: 181-199 Radostits O. M., Gay, C. C., Blood, D. C. & Hinchcliff, K. W. 2000. Veterinary Medicine. Ninth edition, W. B. Saunders Company Ltd., London Rahman, M. H. & Mondal, M. M. H. 1983. Helminth parasites of cattle (Bos indicus) in Bangladesh. Indian Journal of Parasitology 7(2):173-174 Reinecke, R. K. 1983. Veterinary Helminthology. Butterworth publisher (pty.) ltd. Durban, Pretoria. Saegerman, C., Speybroeck, N., Roels, S., Vanopdenbosch, E., Thiry, E. & Berkvens, D. 2004. Decision support tools for clinical diagnosis of disease in cows with suspected bovine spongiform encephalopathy. Journal of Clinical Microbiology 42: 172-178 Soulsby, E.J.L 1982. Helminths, Arthropods and Protozoa of Domesticated Animals Seventh edition. Bailliere Tindal. England. Speybroeck, N., Berkvens, D., Mfoukou-Ntsakala, A. Aerts, M., Hens, N., Huylenbroeck, G. V. & Thys, E. 2004. Classification trees versus multinomial models in the analysis of urban farming systems in Central Africa Thrusfield, M. 1995. Veterinary Epidemiology Second ed. Blackwell Science ltd. UK. Tum, S., Poutinen, M. L. & Copeman, D. B. 2004. A geographic information systems model for mapping risk of fascioliasis in cattle and buffaloes in Cambodia. Veterinary Parasitology 122:141-149 Urquhart, G. M., Armour, J., Duncan, J., L, Dunn, A. M. & Jennings, F. W. 1996. Veterinary Parasitology. Second edition, Blackwell Science, UK.

31
Appendix I
Classification tree command in R®
data<-read.table("noncodednematode.txt", header=T) attach(data) library(rpart) Nematode<-as.factor(nematode) Age<-as.factor(age) Breed<-as.factor(breed) Gender<-as.factor(gender) Physicalcond<-as.factor(physicalcond) Appetite<-as.factor(appetite) Rumenmotility<-as.factor(rumenmotility) Conjunctiva<-as.factor(conjunctiva) Soiling<-as.factor(soiling) Consistencyfaeces <-as.factor(consistencyfaeces) Dehydration<-as.factor(dehydration) Productiontype<-as.factor(productiontype) Grazing <-as.factor(grazing) Cutgrass <-as.factor(cutgrass) Sanitation <-as.factor(sanitation) Grazing <-as.factor(grazing) Deworming<-as.factor(deworming) Diet<-as.factor(diet) tree<-rpart(Nematode~ age + breed + gender + physicalcond + appetite + soiling + rumenmotility + dehydration + conjunctiva + consistencyfaeces + productiontype+ grazing+ cutgrass+ sanitation+ diet + deworming,control=rpart.control(cp=0)) tree plotcp(tree, minline=TRUE, upper=c(“size”)) mycp<- mycp<-(tree$cptable)[,"CP"][which.min((tree$cptable)[,"xerror"])] prtree<-prune.rpart(tree,mycp) mycp prtree<-prune.rpart(tree, 0.046) prtree predb1<-predict(prtree,type="class") conf.mat<-function(true,new) {t<-table(true,new) s<-sum(t) acc<-round((sum(diag(t)))/s,2) res<-list(conf=t, accuracy=acc) } t.conf<-conf.mat(Nematode, predb1) print(t.conf) par(mfcol = c(1, 2), ann= TRUE, xpd=NA, pty = "m") plot(tree) text(tree, use.n=TRUE) plot(prtree) text(prtree, use.n=TRUE)
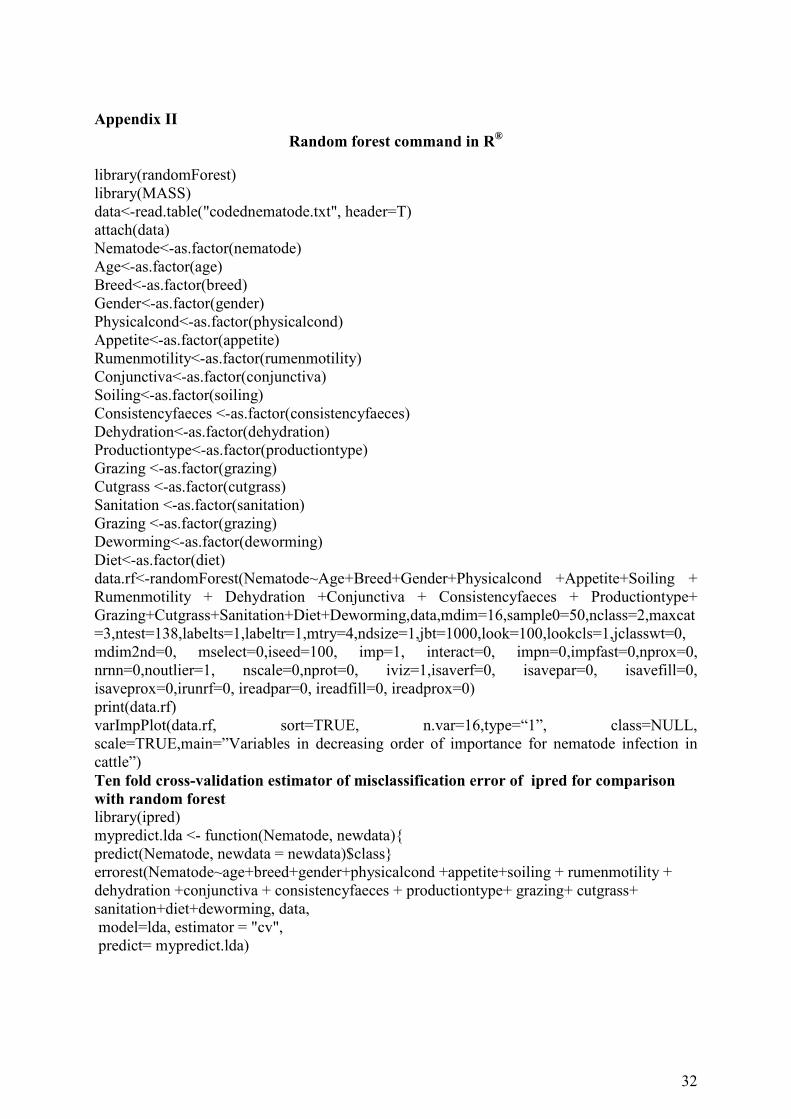
32
Appendix II
Random forest command in R®
library(randomForest) library(MASS) data<-read.table("codednematode.txt", header=T) attach(data) Nematode<-as.factor(nematode) Age<-as.factor(age) Breed<-as.factor(breed) Gender<-as.factor(gender) Physicalcond<-as.factor(physicalcond) Appetite<-as.factor(appetite) Rumenmotility<-as.factor(rumenmotility) Conjunctiva<-as.factor(conjunctiva) Soiling<-as.factor(soiling) Consistencyfaeces <-as.factor(consistencyfaeces) Dehydration<-as.factor(dehydration) Productiontype<-as.factor(productiontype) Grazing <-as.factor(grazing) Cutgrass <-as.factor(cutgrass) Sanitation <-as.factor(sanitation) Grazing <-as.factor(grazing) Deworming<-as.factor(deworming) Diet<-as.factor(diet) data.rf<-randomForest(Nematode~Age+Breed+Gender+Physicalcond +Appetite+Soiling + Rumenmotility + Dehydration +Conjunctiva + Consistencyfaeces + Productiontype+ Grazing+Cutgrass+Sanitation+Diet+Deworming,data,mdim=16,sample0=50,nclass=2,maxcat=3,ntest=138,labelts=1,labeltr=1,mtry=4,ndsize=1,jbt=1000,look=100,lookcls=1,jclasswt=0,mdim2nd=0, mselect=0,iseed=100, imp=1, interact=0, impn=0,impfast=0,nprox=0, nrnn=0,noutlier=1, nscale=0,nprot=0, iviz=1,isaverf=0, isavepar=0, isavefill=0, isaveprox=0,irunrf=0, ireadpar=0, ireadfill=0, ireadprox=0) print(data.rf) varImpPlot(data.rf, sort=TRUE, n.var=16,type=“1”, class=NULL, scale=TRUE,main=”Variables in decreasing order of importance for nematode infection in cattle”)
Ten fold cross-validation estimator of misclassification error of ipred for comparison
with random forest
library(ipred) mypredict.lda <- function(Nematode, newdata){ predict(Nematode, newdata = newdata)$class} errorest(Nematode~age+breed+gender+physicalcond +appetite+soiling + rumenmotility + dehydration +conjunctiva + consistencyfaeces + productiontype+ grazing+ cutgrass+ sanitation+diet+deworming, data, model=lda, estimator = "cv", predict= mypredict.lda)

33
Appendix III
Do file for nematode infection
insheet using codedcombined.txt,clear xi: logit nematode i.age i.breed i.gender i.appetite i.conjunctiva i.rumenmotility i.consistencyfaeces i.grazing i.deworming,nolog est store a drop deworming xi: logit nematode i.age i.breed i.gender i.appetite i.conjunctiva i.rumenmotility i.consistencyfaeces i.grazing,nolog lrtest a drop appetite xi: logit nematode i.age i.breed i.gender i.conjunctiva i.rumenmotility i.consistencyfaeces i.grazing,nolog lrtest a drop conjunctiva xi: logit nematode i.age i.breed i.gender i.rumenmotility i.consistencyfaeces i.grazing,nolog lrtest a test _Iage_1= _Iage_2 drop age xi: logit nematode i.breed i.gender i.rumenmotility i.consistencyfaeces i.grazing,nolog lrtest a drop breed xi: logit nematode i.gender i.rumenmotility i.consistencyfaeces i.grazing,nolog lrtest a drop consistencyfaeces xi: logit nematode i.gender i.rumenmotility i.grazing,nolog lrtest a drop grazing xi: logit nematode i.gender*i.rumenmotility,nolog xi: logit nematode i.gender i.rumenmotility,nolog lrtest a char gender[omit]"1" char rumenmotility[omit]"1" xi: logit nematode i.gender i.rumenmotility,nolog or svyset, psu(herdno) xi:svylogit nematode i.gender i.rumenmotility,nolog or

34
CURRICULUM VITAE
1. Name A. K. M. ANISUR RAHMAN
2. Nationality Bangladeshi by birth
3. Date of birth 31-12-1975
4. Present Position Assistant Professor
5. Present address Department of Medicine Bangladesh Agricultural University Mymensingh-2202, Bangladesh
6. Academic Qualifications
Level of education
Name of Institute / Board
Duration of study
Year of passing
Degree obtained
Division/ Class obtained
Graduate Bangladesh Agricultural University
1993-1997 2000
Doctor of Veterinary Medicine (DVM)
First Class First
Post Graduate
Bangladesh Agricultural University
July 2000-June 2002
2002 M. S. in Medicine
First class with distinction(A+
)
7. Service experience
Lecturer from 23rd July 2000 to 26 January 2004
Assistant professor from 27 January 2004 to date
8. Veterinarian (Medicine) in BAU Vet. Clinic
Two years (from 3rd May 2001 to 3rd May 2003)
9. MS thesis title
Epidemiological, clinical and parasitological studies of pulmonary diseases in slaughter cattle
10. Number of Publications: Five (Four as first author)