A Cross Asset View of Equities - AllianceBernstein
203
January, 2021 A New Policy Environment and Changing Needs of Asset Owners will Frame the Outlook of Capital Markets A Cross Asset View of Equities YOU ARE RECEIVING THIS PUBLICATION AS AN INSTITUTIONAL CLIENT OF ALLIANCEBERNSTEIN. THE PUBLICATION IS FOR YOUR EXCLUSIVE USE ONLY AND NO PERMISSION IS PROVIDED FOR YOU TO FORWARD THIS REPORT ON TO ANY THIRD PARTY.
-
Upload
khangminh22 -
Category
Documents
-
view
1 -
download
0
Transcript of A Cross Asset View of Equities - AllianceBernstein

January, 2021
A New Policy Environment and Changing Needs of Asset Owners will Frame the Outlook of Capital Markets
A Cross Asset View of Equities
YOU ARE RECEIVING THIS PUBLICATION AS AN INSTITUTIONAL CLIENT OF ALLIANCEBERNSTEIN. THE PUBLICATION IS FOR YOUR EXCLUSIVE USE ONLY AND NO PERMISSION IS PROVIDED FOR YOU TO FORWARD THIS REPORT ON TO ANY THIRD PARTY.

JANUARY 2021
SEE DISCLOSURE APPENDIX OF THIS REPORT FOR IMPORTANT DISCLOSURES AND ANALYST CERTIFICATIONS
A new policy environment and changing needs of asset
owners will frame the outlook for capital markets
The outlook for inflation is a key macro debate. Deflationary
pressures from high unemployment and decreasing velocity of
money set against greater desperation from policy makers and the
new fiscal tools they possess. Net, we expect inflation to rise.
Asset owners will have to increase risk levels despite high asset
valuations. This involves including factors alongside traditional asset
classes and higher equity weightings.
A return of inflation is tactically supportive of the Value factor; so we
are overweight. However, we think the yield curve will not steepen to
the usual extent, causing a bifurcation within Value.
Ongoing fiscal support and real rates held at negative levels imply a
debasement of fiat currencies. Thus, we remain overweight gold. We
also think cryptocurrencies may have a role alongside gold in
institutional portfolios.
Published 28-Jan-2021 00:00 UTC


This Blackbook frames the investment narrative of coming years as the confluence of two
large forces: the emergence of a different policy environment and the changing needs of
asset owners. It is because of the combination of these themes that we describe this as a
cross-asset outlook, as these forces together shape the outlook for all capital markets and
different types of return streams.
A key macro debate is whether the policy response to the pandemic will be inflationary. On
balance, we think it will be, as policymakers need to generate inflation given debt levels,
while they also find themselves in possession of new fiscal tools unimaginable a year ago.
However, there are strong deflationary forces as well, in particular high unemployment; we
also think the velocity of money is set to slow further.
An example of where the two narratives underlying this Blackbook combine is in the need
for asset owners to take on more risk, and the resulting implications for strategic asset
allocation. This may force asset owners to use factors alongside asset classes, and also
lead to higher equity weightings, long-short exposure, and greater exposure to real assets.
The Value-Growth debate is again of key concern. A plausibly inflationary outlook makes
the outlook for Value more positive than it has been for years. However, a policy need to
stop a pronounced steepening of the yield curve means that strategically the Value factor
bifurcates. We advocate selective exposure to global Value.
Much of this Blackbook is concerned with where asset owners can turn for positive real
returns that can also offer diversification, should stocks and bonds no longer be effective
mutual diversifiers. This leads to a case for income strategies within equities.
The Staples sector within equities stands out, due to a particularly strong cross-asset case
in the medium term, rather than its merit relative to other equities.
With rates locked low and the prospect of more fiscal support leading to inflation, there is
a clear prospect of debasement of fiat currencies. Therefore, we remain overweight gold,
both for its return prospects and for its role as a diversifier. We also think allocations to
cryptocurrencies have a role in institutional portfolios alongside gold.
Inigo Fraser-Jenkins [email protected] +44-207-170-5134
Alla Harmsworth [email protected] +44-207-170-5130
Sarah McCarthy, CFA [email protected] +353-1-246-3125
Mark Diver [email protected] +44-207-170-5132
Robertas Stancikas, CFA [email protected] +1-212-823-3240
Harjaspreet Mand [email protected] +44-207-170-0546
Maureen Hughes [email protected] +44-207-170-0511
January 27, 2021


SIGNIFICANT RESEARCH CONCLUSIONS 5
INFLATION, INVESTING, AND THE COMING OF MMT 17
SAVINGS, VELOCITY, INFLATION, AND PENSION INVESTING 31
SO WHERE, EXACTLY, MIGHT INFLATION SHOW UP? 43
DURATION IN EQUITIES GOOD, DURATION IN BONDS BAD 53
THE STRATEGIC SECTOR OUTLOOK POST COVID-19 57
THE CROSS-ASSET CASE FOR STAPLES 69
THE BEST FIXED INCOME PORTFOLIO RIGHT NOW IS...IN EQUITIES 85
THE FED, THE MARKET, THE VALUE-GROWTH DEBATE, AND INFLATION 93
VALUE IS DEAD, LONG LIVE VALUE 105
IF CASH AIN'T KING ANYMORE 115
WHY US GROWTH CAN CONTINUE TO SHINE 129
LET'S PLAY TWISTER, LET'S PLAY RISK 141
MULTI-ASSET PORTFOLIOS IN THE CRISIS AND THE OUTLOOK FOR
DIVERSIFICATION IF INFLATION RISES 155
CRYPTOCURRENCIES IN ASSET ALLOCATION — I HAVE CHANGED MY MIND! 167
WILL THEY LET THE BANKRUPTCIES CLEAR? 181


Why is this a cross-asset view of equities? In short, because this is where the most
significant flows are going to take place in coming years. The confluence of an utterly
different policy environment and a much more difficult prospect for asset owners means,
we think, that a cross-asset perspective is the most appropriate lens through which to view
investment decisions in coming years.
Through 2021, there will be a tactical investment narrative around reopening, but the
strategic focus will be on: (1) the fact that we can finally learn what the post-pandemic
policy environment might look like and (2) how asset owners adjust to that. A very specific
example of this presents itself in what is probably the pre-eminent macroeconomic
question for 2021 and beyond, which is the outlook for inflation. We think there are distinct
tactical and strategic narratives here. 2021 has the prospect of potentially sharp rebounds
of prices in specific areas of the economy, as even a slight increase in demand meets very
tight inventory levels. There is then a more strategic inflation narrative that derives from the
desperation of policy makers to engineer inflation and their significantly expanded toolkit
with which to achieve this — i.e., handing cash to people. Either way, we think we are due
an increase in the volatility of inflation.
In this SRC, we lay out our base case for tactical and strategic horizons, motivate why a
cross-asset lens is the correct way to look at the equity market, and lay out the narrative
that we explore in considerably more detail in later chapters.
Thus, the big themes that run though this outlook are:
◼ Inflation: Our base case is that the policy response to the pandemic will end up being
inflationary. Yes, we are still in the midst of a deflationary shock, but over the course of
2021, we expect inflation expectations to rise significantly above their pre-pandemic
level. Inflation expectations in Europe may lag those in the US, and there are some
extra impediments in Europe (policy freedom and a greater risk of zombie companies),
but we expect both regions to see inflation emerge. There are strong contrary
deflationary forces too, which we discuss.
◼ Low real yields: Despite expecting inflation to emerge, we think the yield curve will not
steepen as much as would normally be expected. This reflects both the desire of
policymakers to keep the cost of debt below the growth rate and the fragility of
inflation in the absence of wage inflation. Empirical evidence of this view is already
emerging.
◼ There is disagreement on this macro prognosis: Not everyone agrees that (a) there will
be inflation or (b) that if there is inflation, then the yield curve will not steepen as much
as usual. It is over the course of 2021 that we will likely see evidence on whether both

parts of this view hold. This has huge implications for the desirability of duration in
equities vs. fixed income and, hence, could lead to significant flows. Within equities, it
goes to the heart of a group of tactical questions for 2021 on the case for Value vs.
Growth and whether Value can include Financials.
◼ Asset owners need to increase risk levels: Low returns and higher inflation mean asset
owners will likely have to increase risk levels despite high asset valuations. For pension
funds, the other options are to cut payouts or to increase contributions, which are
politically difficult. Thus, we think asset owners will buy more equity, more real asset
exposure, more long-short returns, and they will be forced to include factors alongside
asset classes in their asset allocation decisions. Increasing risk levels and making sure
fees are only allocated where really needed will, we think, lead to a rethinking of the
nature of strategic asset allocation, a subject we covered in our previous Blackbook, A
New Paradigm for Investing. Increasing risk levels also brings to focus the question of
the kind of risk to have exposure to. In a world where returns of asset "betas" are lower,
the importance of idiosyncratic alpha rather than the traditional definition of alpha is
greater.
◼ New policy environment: The level of public sector debt creates a strong desire to
generate inflation, but more significant still is the extra set of policy tools available that
would have been unimaginable a year ago, in the form of direct cash handouts to
people or businesses. An interesting tactical question is: to what extent do
governments find themselves able to end furlough schemes or other handouts? More
strategically, a set of fiscal policies that allow direct payouts when mixed with a post-
pandemic structurally higher level of unemployment and wider inequality, point in the
direction of polices such as universal basic income (UBI). We can debate what strictly
counts as adoption of Modern Monetary Theory (MMT), but quasi-MMT doesn't seem
so far-fetched.
In terms of key market calls, what do these themes entail?
◼ Value: There have been so many false dawns for the Value factor that we have lost
count. Yes, there are structural headwinds (automation destroying moats around
industries; real rates pinned low, impeding mean-reversion; and the growth of
intangible assets) raising the question of whether Value is being measured correctly.
However, over and above all of these, one element has been missing — inflation. If our
call in this Blackbook, that inflation can return, is correct, then we think the Value factor
will rally. But can the whole Value factor stage a sustained recovery or it is a question
of a series of tactical rallies that require timing? If so, it would be difficult to profit from
it. We suggest that a more specific Value exposure can offer a more reliable and
strategic way to benefit from inflation.
◼ Growth: In parallel to a selected exposure within Value, we also want to maintain a
Growth exposure in the US. Real yields held low and greater longevity of Growth mean
the case for Growth still remains. The main danger would be a significant steepening
of the yield curve, but we don't think that is likely to happen. In the cross-asset
language of this Blackbook, we think investors should hold exposure to long duration
in equities, but not in fixed income.

◼ Income: Investors have a need for assets that pay a positive real yield and offer some
diversification from equity beta. We think that a greater portion of an income portfolio
has to come from equities, particularly those with higher quality characteristics and
able to maintain dividends.
◼ Equity markets' lackluster rise: For the market overall, we forecast positive but small
positive returns. The main impediments are high valuations and that we have just seen
the most intense period of upgrading of earnings forecasts ever. However, a return of
inflation (assuming it does not surpass the 4-5% range, which we think is a distant
prospect) will likely encourage more flows into this asset class.
◼ Stock-bond correlation: As inflation rises, there is a risk that bonds become a less
good diversifier of equity risk. This prompts a rethinking of some of the accepted
norms of asset allocation of recent decades and a hunt for diversifiers.
◼ Gold and cryptocurrencies: Alongside an equity overweight, we also think there will be
growing demand for non-fiat currencies and so continue to be bullish on gold. We
think cryptocurrencies can complement that position and recently changed our stance
on cryptocurrencies accordingly.
Inflation or not…
Probably the central macroeconomic question is whether the outlook is inflationary or not.
While we think, on balance, the policy response to the pandemic will indeed be inflationary;
we freely recognize that strong deflationary forces abound. In early 2021, we are also likely
to see a mix of short-term price pressures as a pick-up in demand meets limited supply with
longer-term policy-induced attempts to raise inflation, and it may be hard to unstitch these
effects. We find that the investors we speak to are split on the issue.
The case for a structural rise in inflation compared to recent years is easy enough to lay out.
It lies in the desperation of policy makers to generate inflation combined with the new tools
that they find themselves in possession of. The debt-GDP ratio for the G7 has reached a
level last seen at the end of WWII (see Exhibit 1). However, back then the need to rebuild
the capital stock and favorable demographics pointed to an ability to grow out of the debt.
Today those forces are absent, hence inflating away the debt is a more tempting option.

Note. Debt to GDP is weighted by the total share of GDP of each country.
Source: Global Financial Data (1900-2018 actuals), IMF estimates (2019-20), and Bernstein analysis
Policy makers have been trying to generate inflation for the past decade without much
success. However, the pandemic and its associated lockdowns have transformed the
policy environment. It has suddenly become acceptable for governments to hand out cash
to individuals or businesses, e.g., in the form of direct cash hand outs (in a sense, helicopter
money), furlough schemes, and business support schemes. Whereas quantitative easing
(QE) could raise asset prices, it seems more plausible that such fiscal routes can have a
more direct impact on broader inflation.
The case against inflation is also strong. Unemployment is likely to remain very high and we
think is unlikely ever to fall back to its 2019 low, as the pandemic will have brought forward
job losses that would have happened in coming years due to automation. So, if there is
inflation, it is likely to be in the absence of wage inflation. In addition, the pervasive
deflationary forces that have been part of the reason all the iterations of QE failed to be
inflationary, such as automation and demographic trends, are still in place.
On balance, we think the scale of the monetary and fiscal response makes an economic
case in favor of inflation. However, for us the real clincher is politics not economics. While
it seems unlikely that full MMT is actually adopted as policy, given its need for a different
institutional structure, aspects of quasi-MMT are evident in the current conjunction of fiscal
and monetary policy. What happened to the Tea Party? Instead, we have record debt levels
and MMT, if not as policy, being increasingly used as a description of the economy. We cover
this in the "Inflation, Investing, and the Coming of MMT" chapter.
A further hurdle to generating inflation is likely to be a decline in the velocity of money. We
think a legacy of the pandemic is savings rates having to materially increase compared to
average levels of the last decade. For believers in the quantity theory of money, this implies
0
20
40
60
80
100
120
140
160
31/1
2/1
900
31/1
2/1
903
31/1
2/1
906
31/1
2/1
909
31/1
2/1
912
31/1
2/1
915
31/1
2/1
918
31/1
2/1
921
31/1
2/1
924
31/1
2/1
927
31/1
2/1
930
31/1
2/1
933
31/1
2/1
936
31/1
2/1
939
31/1
2/1
942
31/1
2/1
945
31/1
2/1
948
31/1
2/1
951
31/1
2/1
954
31/1
2/1
957
31/1
2/1
960
31/1
2/1
963
31/1
2/1
966
31/1
2/1
969
31/1
2/1
972
31/1
2/1
975
31/1
2/1
978
31/1
2/1
981
31/1
2/1
984
31/1
2/1
987
31/1
2/1
990
31/1
2/1
993
31/1
2/1
996
31/1
2/1
999
31/1
2/2
002
31/1
2/2
005
31/1
2/2
008
31/1
2/2
011
31/1
2/2
014
31/1
2/2
017
31/1
2/2
020
%
G7: Debt/GDP 2022 IMF forecast

ever greater increases in the money supply may be required to generate a given level of
inflation. As part of the narrative of this Blackbook, which attempts to link both the policy
outlook and the changing needs of asset owners, this links the challenges of long-run
pension investing with policy decisions aimed at generating inflation, that we discuss in the
"Savings, Velocity, Inflation, and Pension Investing" chapter.
But this is not just a question of long-term strategic policy decisions. The first half of 2021
is likely to see its own inflationary pressures. Inventory levels were very tight even pre-
Covid-19 and have now become tighter, and many sectors have materially cut supply. In
addition, there are supply constraints that result from the imposition of lockdowns. H1
2021 is likely to see a pickup in demand that meets limited supply and thus, could well
result in surprisingly rapid price increases in certain segments of the economy. We discuss
where prices might move fastest in the "So Where, Exactly, Might Inflation Show Up?"
chapter.
The difficulty for investors will be in distinguishing between rapid price increases that are a
function of tight inventories vs. rapid price increases that might indicate a policy error; these
would have very different implications.
The other key policy decision we are likely to learn more about in 2021 is whether the link
between bond yields and inflation has changed. There is a strong argument that
policymakers may wish to keep the cost of debt below the growth rate. This implies the
yield curve may not steepen in a commensurate way with any increase in inflation
expectations. There are already signs of this in the apparent disparity between the recovery
in 10-year inflation breakevens but a smaller increase in 10-year bond yields (see
Exhibit 2). Likewise, the US yield curve out to five years has remained remarkably flat as
inflation expectations increased in the latter half of 2020 (see Exhibit 3).
Source: Datastream and Bernstein analysis Source: Datastream and Bernstein analysis
0.00
0.50
1.00
1.50
2.00
2.50
%
US: 10 year bond yield US: 10 year breakeven
0
0.5
1
1.5
2
2.5
-0.6
-0.4
-0.2
0
0.2
0.4
0.6
0.8
1
16/1
2/2
019
16/0
1/2
020
16/0
2/2
020
16/0
3/2
020
16/0
4/2
020
16/0
5/2
020
16/0
6/2
020
16/0
7/2
020
16/0
8/2
020
16/0
9/2
020
16/1
0/2
020
16/1
1/2
020
%%
US: 3m-5y yield curve
US: 5y-10y yield curve
US: 10 year breakeven (RHS)

We argue that an outlook that sees a return of inflation (at least assuming it does not rise
more than the 4-5% range) and real yields pinned low implies investors should overweight
equities. Yes, the Value factor can recover with inflation, but equity assets that have a long
duration and a link to inflation can also do well, as we discuss in the "Duration in Equities
Good, Duration in Bonds Bad" chapter. More generally, this distinction is a key part of
forming a longer-term view of equity allocations, which we analyze in our "The Strategic
Sector Outlook Post Covid-19" chapter.
Stock-bond correlation and the challenge of finding diversification
Over the long run, we can observe a structural positive link between both the level and the
volatility of inflation with stock-bond correlation (see Exhibit 4 and Exhibit 5). While the
relationship does not always hold, if our base case of higher inflation in the coming months
holds, it should create upward pressure on the stock-bond correlation and at least create
the risk that bonds might not diversify equity risk.
Source: Global Financial Data (GFD), Datastream, and Bernstein analysis Source: GFD, Datastream, and Bernstein analysis
The risk of a change in the assumed level of stock-bond correlation is a good example of
why a cross-asset view of equities is now very relevant. High-grade fixed-income assets
suffer from three potential problems: (1) the probability of delivering negative real returns,
(2) longer duration as rates have declined and, hence, increased interest rate risk, and
(3) the risk that they may be less good diversifiers of equity risk. We explore in our "The Best
Fixed Income Portfolio Right Now Is…in Equities" chapter the potential for equities to fulfil
part of the income potential of fixed income, with a particular focus on higher quality
dividend-paying stocks. Yes, this "story" has been around for a long time, but we argue that
it has renewed importance, given the extreme level of yields and the potential for inflation.
As shown in Exhibit 6, the yield spread of equities over bonds is greater than at any point in
the last 50 years.
-0.6
-0.4
-0.2
0.0
0.2
0.4
0.6
-10
-5
0
5
10
15
20
28/0
2/1
886
28/0
2/1
894
28/0
2/1
902
28/0
2/1
910
28/0
2/1
918
28/0
2/1
926
28/0
2/1
934
28/0
2/1
942
28/0
2/1
950
28/0
2/1
958
28/0
2/1
966
28/0
2/1
974
28/0
2/1
982
28/0
2/1
990
28/0
2/1
998
28/0
2/2
006
28/0
2/2
014
Co
rrela
tion
%, (a
nn
ualize
d)
US: 5y CPI (annualized)
US 5 yr rolling stock bond correlation (RHS)
-0.6
-0.4
-0.2
0.0
0.2
0.4
0.6
0
5
10
15
20
25
30
35
40
45
50
28/0
2/1
886
28/0
2/1
894
28/0
2/1
902
28/0
2/1
910
28/0
2/1
918
28/0
2/1
926
28/0
2/1
934
28/0
2/1
942
28/0
2/1
950
28/0
2/1
958
28/0
2/1
966
28/0
2/1
974
28/0
2/1
982
28/0
2/1
990
28/0
2/1
998
28/0
2/2
006
28/0
2/2
014
Co
rrela
tion
% (
an
nu
alize
d)
US: 5yr vol of CPI (annualized)
US 5 yr rolling stock bond correlation (RHS)

Source: GFD, Datastream, and Bernstein analysis
A sector that is particularly deserving of a cross-asset case in this context is Consumer
Staples. Indeed, in our "The Cross-Asset Case for Staples" chapter, we argue that it is from
a cross-asset perspective that the most bullish case can be made for Staples.
Value
Late 2020 witnessed a significant rotation into Value and out of Momentum. Probably the
key question for positioning in early 2021 is can this rotation continue, or was that it? In a
sense, it feels like we have been here many times before during the last decade of a general
underperformance of Value. Value trades tend to be pro-cyclical, so it is easy enough to
make a case for the factor doing well as vaccines support a more sustained recovery.
However, for us the key feature that makes the potential for Value stronger now than at any
point over the last decade is the prospect for inflation and the role of an equity Value trade
in providing investors with a way of participating in that. Again, another reason to see this
trade from a cross-asset standpoint.
Yes, there continue to be structural impediments to Value, but the prospect of a sustained
period of inflation changes everything for the factor. Not to mention that in a world where
nearly all asset classes are expensive, maybe Value is the only cheap "asset" available to
investors. We discuss this in our "The Fed, the Market, the Value-Growth Debate, and
Inflation" chapter.
However, the prospect that inflation may not be followed by a commensurate steepening
of yield curve raises important questions as to the mechanism by which inflation supports
Value trades. In the "Value is Dead, Long Live Value" chapter, we disaggregate Value stocks
into commodity cyclicals, core cyclicals, and Financials. We show that these groups have
different relationships between inflation expectations and the yield curve. Value stocks that
lie in the Energy and Mining sectors have the most clear-cut link with aggregate inflation. If
inflation rises, then these stocks tend to strongly benefit. Value stocks in the core cyclicals
also benefit mainly from increases in inflation rather than needing to see a steepening of
-12
-10
-8
-6
-4
-2
0
2
4
6
8
31/0
1/1
792
30/1
1/1
797
30/0
9/1
803
31/0
7/1
809
31/0
5/1
815
31/0
3/1
821
31/0
1/1
827
30/1
1/1
832
30/0
9/1
838
31/0
7/1
844
31/0
5/1
850
31/0
3/1
856
31/0
1/1
862
30/1
1/1
867
30/0
9/1
873
31/0
7/1
879
31/0
5/1
885
31/0
3/1
891
31/0
1/1
897
30/1
1/1
902
30/0
9/1
908
31/0
7/1
914
31/0
5/1
920
31/0
3/1
926
31/0
1/1
932
30/1
1/1
937
30/0
9/1
943
31/0
7/1
949
31/0
5/1
955
31/0
3/1
961
31/0
1/1
967
30/1
1/1
972
30/0
9/1
978
31/0
7/1
984
31/0
5/1
990
31/0
3/1
996
31/0
1/2
002
30/1
1/2
007
30/0
9/2
013
31/0
7/2
019
%
US Dividend Yield - 10 year bond yield

the yield curve. This is particularly relevant in the case of individual industries that have the
potential to display potentially significant price-raising ability in 2021. For Financials,
however, more of the support tends to come from the yield curve. Banks can still find
tactical support as inflation rises in 2021. However, investors who wish to express a
structurally positive view of Value over a multi-year horizon might need to be more selective
in their exposure toward Value and focus on core cyclicals and commodities.
There is a more defensive and less pro-cyclical take on Value in the form of companies that
have attractive levels of free cash flow (FCF) yield. In fact, while this factor did less badly
than many other Value factors in 2020, the failure of this factor to deliver acyclical returns
was one of the more disappointing aspects of Value-type factors over 2020. We discuss
this in detail in the "If Cash Ain't King Anymore" chapter, and show that there is still a case
for a free cash yield factor as a less cyclical form of Value and as an element of an income
portfolio in 2021.
Growth
Is this the end of the Growth trade? We think that it is still right to hold US Growth in the
medium term as outlined in our "Why US Growth Can Continue to Shine" chapter. Yes,
Growth stocks may underperform in months that see rapid rises in prices, shifts up in the
yield curve, or particularly strong macroeconomic recovery data. But looking through those
short-term dynamics, we think the medium-term case for Growth depends on two
attributes that still hold: (1) real rates being anchored low and (2) the greater longevity of
Growth for high-growth companies (see Exhibit 7).
Note: In each quarter since 1990, we split the stocks in the MSCI US index into groups by ROE decile (within sectors) and calculated the percentage of stocks in
the High ROE decile at time t that were in the highest 2 deciles over the next one-to-five year period. A four-quarter smoothing is applied to the quarterly
percentages.
Source: FactSet and Bernstein analysis
0
10
20
30
40
50
60
70
80
90
100
Mar-
90
Mar-
91
Mar-
92
Mar-
93
Mar-
94
Mar-
95
Mar-
96
Mar-
97
Mar-
98
Mar-
99
Mar-
00
Mar-
01
Mar-
02
Mar-
03
Mar-
04
Mar-
05
Mar-
06
Mar-
07
Mar-
08
Mar-
09
Mar-
10
Mar-
11
Mar-
12
Mar-
13
Mar-
14
Mar-
15
Mar-
16
Mar-
17
Mar-
18
Mar-
19
1 year forward 2 year forward 3 year forward 4 year forward 5 year forward

What all this means for the overall portfolio
Even if stock-bond correlation does not become positive, any weakening in the negative
correlation between them at the same time as the return-risk trade-off of major asset
classes deteriorates implies a significant increase in portfolio risk for a given level of return.
Even without an inflationary impulse there was a case that risk levels would have to increase
to maintain future returns at rates investors have become used to in the context of the run-
up in asset values over the last 30 years. In addition to potentially making diversification
harder — or at least requiring different kinds of diversifying assets — an increase in inflation
raises the bar on required return if, as seems likely, earning a spread over inflation is the
"true" ultimate benchmark for many types of savings. After all, if one cannot at least
preserve purchasing power, then what is the point of saving in the first place?
Exhibit 8 shows the real return-risk trade-off of the main categories of return streams that
pension plans and other asset owners can buy. The dots show the achieved level of the last
decade and the arrows indicate how we think these will evolve over the next five years. We
explore this in detail in the "Let's Play Twister, Let's Play Risk" chapter.
Note: The dots represent the last 10 years of real returns and volatility for the major return streams investors can buy. The arrows represent Bernstein portfolio
strategy team forecasts for the next 5-10 years.
US Private Equity data is compiled from 1,562 funds, including fully liquidated partnerships, formed between 1986 and 2019. All returns are net of fees,
expenses, and carried interest. Data is provided at no cost to managers. Data provided as of Q1 2020.
Source: Cambridge Associates, Ken French data library, FactSet, Datastream, FRED, and Bernstein analysis
US Equities
US 10 year
Gold
US REITS
US Value (L/S)
US Equity Low Vol (L/O)
US HY Bonds
US Dividend Yield (L/S)
FI Carry
US Composite Growth L/O
US Private Equity
-10
-5
0
5
10
15
0 5 10 15 20 25
Real
Retu
rn
STDEV
Commodity and core cyclical value
Financials value

If this analysis is correct, it implies that in order to meet real-return objectives and aid
diversification in portfolios, factors and asset classes need to be made fungible in the
strategic asset allocation process. Only investing on the basis of unlevered passive
positions in the traditional asset class building blocks creates the risk of failing to achieve
that core target of investing — the preservation of purchasing power.
This is a specific example of the case we outlined in our previous Blackbook, A New
Paradigm for Investing. The building blocks of strategic asset allocation can be thought of
not as standard asset classes but as beta and idiosyncratic alpha. While a theoretical case
for such an approach to investing could have been made for some years, in the post-
pandemic world we see this as more of an urgent need.
If inflation rises, but does not hit the 4-5% range, it implies that equities become the core
overweight in a portfolio. Thus, for the overall portfolio, the question that presents itself is:
what assets can be added that offer a reasonable return-risk trade-off but can also diversify
equity risk. We examine this question in the "Multi-Asset Portfolios in the Crisis and the
Outlook for Diversification if Inflation Rises" chapter. Exhibit 9 shows the trade-off of
return-risk vs. correlation to equities for a range of return streams in periods when inflation
has exceeded 3%. One wants to buy return streams on the upper-left-hand side of the
chart, which suggests a role for equity income strategies, bond carry, and gold, among
others. We note that on this basis US 10-year bonds don't look so bad, but this is the
historical experience since the 1970s, i.e., when yields have been materially higher than
today's level; so, we do not expect the returns to be as good now should inflation rise in this
way.

Note: Correlation is calculated as average 12-month rolling correlation with US equities based on monthly returns. IR is calculated as year-over-year return of the
asset divided by annualized standard deviation. Returns for Energy, REITS, and Metals & Mining are from 1974, returns for FX Carry are from 1975 and returns
for GSCI Commodity index and Oil are from 1971. Equity PBK, Dividend Yield, Momentum, Low Variance, Low Residual Variance, FI Momentum, FI Carry, and FX
Carry factor strategy returns are Long/Short. Energy and Metals & Mining sector returns are relative to broader US equity market.
Source: AQR, Ken French data library, Datastream, and Bernstein analysis
High public and private sector debt levels and the likelihood that the policy debate in many
countries could favor increasing debt levels further, and further direct fiscal support mean
that the risk of debasement of fiat currencies has to be a concern. We have long favored an
increased allocation to gold in portfolios. In addition, we think cryptocurrencies could be
complementary to gold. This is a change of view for us. In the past, we thought the high
volatility of cryptocurrencies ruled them out of mainstream asset allocation decisions. We
explain this change of view in the "Cryptocurrencies in Asset Allocation — I Have Changed
My Mind!" chapter. Two changes have occurred; the "small" one is that the volatility of
bitcoin has declined, especially relative to other assets such as equities. But the main
reason for the change of view is the scale of the build-up of debt post the pandemic, and
how this changes the tone of the policy debate and the risk of inflation.
The final chapter of this Blackbook "Will They Let the Bankruptcies Clear?" considers the
other policy unknown for 2021-22 — will they let the bankruptcies clear? 2020 has seen a
record level of credit issuance and also brought into question the viability of many
businesses. On top of this, the quality of non-financial debt prior to the pandemic had
reached a historical low, e.g., if measured as the proportion of investment-grade debt that
was at the lowest possible tier of investment grade, or as the proportion of loans with cov-
lite structures, etc. This implies that if "normal" conditions applied, we should expect a large
uptick in bankruptcies. In Europe especially, we think there may be more nervousness
about triggering bankruptcies that would put yet more upward pressure on unemployment
rates just as attempts are made to roll back furlough schemes; thus, there is a greater
US Bonds
GSCI Commodity Index
Oi l
Gold
Si lver
Energy Stocks relative
Mining Stocks relative
Price to Book
(L/S)
Div Yield (L/S)
EQ Mom
FI Mom
Equity Low Vol (L/S)
Trade-weighted Yen
FI Carry
FX Carry
REITS
-0.20
0.00
0.20
0.40
0.60
0.80
1.00
1.20
1.40
1.60
-1.00 -0.50 0.00 0.50 1.00
IR
Correlation with US Equities
Higher Return/Risk and
better diversification

likelihood of more "zombie" companies. In the US there may be greater acceptability of
allowing bankruptcies to clear, but some companies being left in a zombie-like state might
be inevitable. For companies that emerge as going concerns, if they have used the
pandemic to issue long-maturity fixed-rate debt, a bout of inflation could actually put them
in a good position, as it shrinks the real value of that debt.
This Blackbook is an attempt to bring together distinct big narratives: the likely path of
policy and how this has changed post pandemic, the outlook for capital markets and
different types of return streams, and lastly, the problems asset owners face. It is the
confluence of these topics that lies at the core of the strategic investment outlook. For this
reason, we think a view on the equity outlook at this juncture has to be formed from a cross-
asset perspective.

◼ We think the policy response to the pandemic will, on balance, be inflationary, although
there are strong contrary forces as well. We work though the arguments for and
against inflation in this chapter.
◼ The reasons in favor of an inflationary outcome are: (1) the size of policy response,
(2) the temptation for governments to inflate their way out of current debt, (3) the Fed
indicating a tolerance for inflation to overshoot, and (4) supply disruptions.
◼ However, there are strong reasons against an inflationary outcome as well:
(1) unemployment being unlikely to ever fall back to the 2019 level, (2) all previous QEs
failing to generate inflation, (3) large number of zombie companies that could keep
inflation depressed, and (4) unfavorable demographics, deunionization, and
automation all remain fundamentally deflationary pressures.
◼ But the clincher for us is that the direction of the political-economic debate is
suggesting a material change in the nature of the policy regime. Even if we don't get
actual MMT as policy anytime soon, it seems likely that it becomes a more common
way to describe the economy.
◼ If politicians adopt that narrative, it points to a much looser and more active role for
fiscal policy, and also brings other policies such as UBI closer to being politically
acceptable. Inflation breakevens have risen sharply over the last nine months, but this
is more about undoing the worst possibilities of a deflationary shock. They have not
yet started to price in a decisive shift higher in inflation.
◼ The issuance of government debt is not only a story about how expenditure is funded,
it is also crucial for the supply of assets to savers. Negative real rates, let alone the
prospect of any form of MMT, decisively shift the balance from savers to creditors. Yet
many governments (especially the US and the UK) continue to want individuals to bear
the risk of saving for retirement.
◼ What should portfolios look like if all this is right? US equities are at an all-time high
multiple. Looking past near-term high volatility (which seems very likely), we think
medium-term investors are going to be forced to buy more equities from this already
expensive starting point. An unenviable prospect. Finding other assets that can also
deliver positive real returns but also diversify equity risk is then key.

Reasons for and against the outlook being inflationary
One of the biggest issues for a medium- or long-term investment view right now has to be
whether the policy response to the pandemic is finally inflationary or not. There has been a
significant increase in inflation breakeven rates and 5y5y inflation swaps since March
2020. But they are still close to the level of 2019 in the US and below that level in Europe.
This recovery is more about reducing the scale of the near-term disinflationary shock of the
pandemic. These series do not yet price in a significant increase in inflation, that still lies
ahead.
We work through the arguments for and against an inflationary future. Our conclusion is
that on balance, yes we think it will be inflationary. However, this is ultimately not really an
argument about economics and more one of the political economy and the extent to which
a new macroeconomic regime creates a different investment backdrop. We consider the
implications of this for portfolios.
We can summarize the case for and against inflation succinctly as follows, the rest of the
chapter explores this in more detail.
Why the outlook is inflationary: (1) This essentially comes down to the observation that
policy makers are now more desperate to generate inflation, given the size of the debt
burden, and also that they have new fiscal tools available to them (handing cash to people),
which have a more plausible claim to impact broad-based inflation (as opposed to asset-
price inflation) than QE ever did.
Specifically, central banks indicating they are willing to see inflation overshooting on the
upside. Most notably, Chairman Powell's comments in H2 2020 explicitly outlined the view
that inflation should be allowed to overshoot on the upside if it has been below target for a
long time.
(2) Supply disruptions because of the pandemic and a more general process of de-
globalization that seems likely to pervade the political debate.
In contrast to this, there are also good reasons why the outlook is not inflationary:
(1) However much policy makers may wish it, stoking inflation via traditional channels might
just be very hard to achieve.
(2) Unemployment will remain high and may never fall to the level of 2019 again, we think.
So it is unlikely that there will be significant aggregate wage pressure. Without wage
pressure, can inflation be sticky?
(3) In addition "everyone" said QE1,2…N would be inflationary, but it never happened. Why
is this different?
(4) We are also going to be left with a large number of zombie companies, which may be a
drag on inflation.
(5) Unfavorable demographics, pervasive deunionization, and tech advances are
fundamentally deflationary. This has been in the backdrop for years and is no different now.
This is hard to counter with either traditional monetary or fiscal tools.

But the main reason is political
We will work through these arguments, next. We think, on balance, there are enough
reasons to make a case for a modest increase in inflation just because the size of the policy
response is so huge compared to previous episodes. But the thing that definitively shifts
the argument for us is our view that a more significant change is happening in the political
economy. In this sense, the outlook for inflation is just one part of the broader narrative for
markets, which is: get used to a permanently larger role for governments across all aspects
of investing, be it in macro variables, the bargaining power of labor vs. corporates, or
corporate governance, not to mention the increased weight of government because of the
likelihood of taxes going up globally.
We have clearly seen a rapid movement of what is seen as acceptable policy in the space
of just six months, with helicopter money and the unprecedented expansion of central bank
balance sheets. As with many other areas of economics and investment, however, the
pandemic really seems to have accelerated forces that were already in existence, which are
more radical when it comes to the framework for the formation of policy.
On the one hand, maybe the policy shifts of 2020 can be understood as an extension of
where we were prior to the pandemic. Central banks have indicated that they are seemingly
willing to see inflation overshooting on the upside and have acted accordingly. The Fed has
loosened the link between inflation and rates. If inflation has been below target for a long
time then it will be allowed to rise above target so that an average level of 2% is maintained.
However, the approach to that is explicitly left vague. As Powell said: "In seeking to achieve
inflation that averages 2 percent over time, we are not tying ourselves to a particular
mathematical formula that defines the average."1 But this is a statement made very much in
the vocabulary of the ancien regime.
The charges that were laid against the policy regime pre-Covid-19 were clear enough. As
has been discussed ad nauseam in the financial media, monetary policy via interest rate
changes has mechanically been running out of ammunition. Successive rounds of QE have
failed to generate sustained inflation and — worse — have contributed to a levering up of
non-financial corporations and households, which have been relying on larger pools of debt
(monetary policy is certainly not the only culprit here — a corporate governance structure
that encouraged issuance of low-grade debt to buy back stock is also to blame). The other
charge against the pre-pandemic policy framework is that not only did it fail to generate
inflation, but it also contributed to inequality though price appreciation of financial assets.
The chorus of central bankers saying that monetary policy cannot achieve its stated goals
without a fiscal counterpart has grown as well. These charges would probably have meant
that the regime of independent monetary policy as the sole tool to cushion the economy
would probably have come to an end at some point anyway. The pandemic has just made
this more urgent and more immediate.
If the post-GFC policy landscape was captured in one phrase it might well be the words of
Theresa May, famously saying that there is "no magic money tree." Well, now it is plain to
see that there is, in fact, a magic money tree, and we can apparently use it with
abandonment (although we do not yet know its limits). Central bank balance sheet
1 https://www.federalreserve.gov/newsevents/speech/powell20200827a.html

expansion and de facto helicopter money (albeit in theory temporary) in many ways sound
a lot like the wishes of the MMT crowd have been met already. As this seeps into the political
debate, we think it will be very hard to counter.
We do not think that full MMT is actually coming anytime soon. That would require a change
in the policy infrastructure that allowed for automatic fiscal stabilizers such as government
jobs guarantee schemes, thereby creating an ability to move up and down the floor for the
price of labor for everyone, whether they were in employment or not, and also political
acceptance that central banks can directly fund governments in advanced economies. That
seems very far from where we are today, and to have the institutions in place, let alone the
political acceptance, would seemingly require several election cycles.
However, even if we do not end up with MMT being implemented as policy, the genie is out
of the bottle. Aside from being an explicit policy decision, MMT can also be seen as a
possible description of how the economy functions. This distinction between MMT as policy
vs. MMT as a descriptor is one that Kelton lays out in her recent book defending MMT.2 It is
in the descriptor role that we think it can form a larger part of the political debate within the
US and Europe, whatever one thinks of it from an economic or political point of view. In fact,
we think in the near term, MMT is going to be most influential and powerful when used as a
descriptor. To be clear, we are not advocating it at all, but strongly suspect that it will be too
tempting for many and, hence, influence the policy debate.
Voltaire famously once described the Holy Roman Empire as neither holy nor Roman nor,
in fact, an empire.3 In a similar vein, MMT has been described as not modern, not monetary,
and not a theory.4 The naysayers point out that issuers of currency have tried this route
before, it is more fiscal than monetary, and cannot really be credited with being a theory
(mind you, not much in finance counts on that front either). Quips aside, the main fear and
main counter argument is that adoption of MMT would lead to hyperinflation that might be
difficult to stop. Countries where this has been tried before have not been the issuer of the
global reserve currency, so the implications are larger and global if the US adopts this route.
Whether it counts as a theory or not, we simply do not have strong empirical evidence of
where the limits lie, thus the fear of stoking too much inflation will likely prevent this from
becoming adopted policy in the near term.
What does seem more likely in the near term is a further extension of what has happened
recently, that is a path to negative real rates, perhaps with a commitment to keep them
there and an explicit blending of fiscal and monetary policy. That is already a break from the
orthodoxy of the last 30 years. But we think that elements of MMT will likely leak into the
political discourse. This is not just a discussion about aggregate economic statistics after
all. It is likely that it will be just as much about the distribution of outcomes as well. Here
unemployment seems central. We think the rapid increase in unemployment of 2020 will
bring forward job losses that would have occurred anyway in future years because of
automation. If unemployment remains high, then increases in the minimum wage might not
be the correct policy response to inequality; in fact, it could have adverse consequences.
2 Kelton, S. (2020) The Deficit Myth, John Murray. 3 Essai sur les Moeurs et l'Espirit des Nations, lxx. 4 For example, see interview with Lacy Hunt https://www.13d.com/kiril-sokoloff-series-on-real-vision-tv/5252020_will-
there-be-hyperinflation-or-deflation/.

Thus, the other political debate that we think will grow in intensity is whether there should
be some move toward UBI, in the context of helicopter money being a reality and MMT
becoming more attractive.
Minimum wages and UBI
Even without steps to full MMT other steps to raise the price of labor do seem more likely in
the US and Europe. Minimum wages are already common; Biden has said he would increase
the minimum wage in the US were he elected. The assumption is that such a policy is
inflationary, though a recent working paper for the Upjohn Institute for Employment
Research by Daniel Macdonald and Eric Nilsson argues that the pass-through effect to
inflation from minimum wage increases is lower than commonly documented in minimum
wage research. The authors examined changes in restaurant food prices in the US during
1978-2015 and concluded that a 10% increase in minimum wage was associated with
only a 0.36% rise in prices and that small minimum wage hikes did not lead to higher prices
at all. However, they did note a clear relationship between large minimum wage hikes and
a clear positive effect on output prices.5
Minimum wages do not put a floor under the price of all labor, however, as the minimum
wage for someone without a job is zero. This would not be the case under UBI. This has
been rapidly gaining attention and popularity in recent years. It is not immediately going to
be adopted in a major developed economy, but we think the unemployment and inequality
consequences of the current recession could well accelerate this debate. Thus, we would
not be at all surprised if some form of UBI was adopted in a major economy at some point
over the next decade.
So far a number of pilot UBI projects have been tried in countries such as Namibia, Kenya,
Finland, and Iran, as well as applying in special circumstances in Alaska. However, so far
none of the projects have been large enough in scale and long enough in duration to draw
universal and definitive conclusions about their effect on unemployment levels and
inflation. Crucially, the impact on inflation would depend on the method used to fund UBI.
If UBI is funded by issuing more treasury bonds, it would add to the already high budget
deficit and further add to the already significant government debt load, increasing the
temptation to let inflation run higher for longer to inflate it away. And unless all the extra
income is saved in anticipation of higher taxes in future, it should have a strong positive
effect on consumption and a positive impact on prices. However, if it is funded in part or in
full by an introduction of new taxes, such as a VAT tax or by increasing the marginal top
income tax rates, the overall effect on inflation might be muted.
Government debt has been key for delegating pension risk
From the point of view of investors, the debate about deficits mainly matters because of
what it means for the future path of inflation. However, there is another angle when it comes
to investing. The whole delegation of retirement risk to individuals is built on the assumption
that there are plentiful assets that can be bought that maintain purchasing power at a given
level of risk. Seen this way, the increased indebtedness of governments in recent decades
5 MacDonald, Daniel and Eric Nilsson. 2016. "The Effects of Increasing the Minimum Wage on Prices: Analyzing the Incidence
of Policy Design and Context" Upjohn Institute Working Paper 16-260. Kalamazoo, MI: W.E. Upjohn Institute for Employment
Research. https://doi.org/10.17848/wp16-260

has been a key part of allowing saving for retirement via assets that had relatively low risk,
not least as the returns on such bonds have been strong even as the supply of them has
inexorably increased.
Assets that are "risk free" are also required for the creation of annuity products that can be
purchased upon retirement, when retirees trade in their accrued savings. Demand for
annuities has risen as a greater proportion of workers are moved to defined contribution
(DC) schemes, and this demand looks set to increase further as cohorts of workers who
have mainly used DC plans retire.6 A fear in recent years was that the supply of long-term
debt might be insufficient to form a base for such annuities. That is less likely to be a
problem now. However, the shift in yields implies that the cost of buying a given annuity is
now much higher.
In fact, one aspect of Kelton's new book that struck us was that she explicitly switches
mode for a moment to talk about the role of US Treasury bonds as assets for investment as
opposed to vehicles for funding the government. Kelton7 makes the point that, as a staffer
on the US Senate Budget Committee, she asked colleagues if they found a magic wand that
could eliminate the entire national debt would they use it? The answer invariably was "yes."
However, when the question was posed as "would you wave a wand to rid the world of US
Treasuries?," people were less keen to wave the wand. This could become an increasingly
relevant issue. In the age of austerity, the political debate about how governments are
funded was mainly focused on the question of how much debt was acceptable. However,
the same governments also wanted to devolve retirement risk to individuals. If that cannot
be maintained, then the cost of retirement as well would be at risk of landing on government
balance sheets. This implies that a really joined-up approach to policy would explicitly link
the new, sharply increased projections for government deficits with the needs of retirees
— both in terms of the range of assets that governments choose to issue and in terms of
the regulations covering the risk level of pension funds and the requirement, or otherwise,
to purchase annuities upon retirement.
Another attack on MMT would be that to print money and engineer inflation at a significantly
higher rate would be a decisive shift in favor of creditors and away from savers. This would
no doubt be another angle in the political debate around any quasi-MMT policies. Though
the move in rates has already tilted policy definitively in that direction, it is also already
explicitly a subject of political debate, e.g., in Germany. Any further loosening of fiscal policy
seems likely to push retirement investing even further away from conventional government
debt and into more "risky" assets. We think the political debate around the fiscal options
from here, from merely extending the current system to versions of MMT need to take into
account the availability and also the role of such debt in the approach to saving for
retirement.
If the outlook is indeed inflationary, it prompts major questions for the appropriate
allocation of portfolios. Investors will inevitably reach back to historical periods of inflation
such as the 1970s and other times as the basis for a "play book" of what might happen.
However, the policy environment has likely shifted. Crucially, this means an increase in
6 Cannon and Tonks (2008) Annuity Markets OUP. 7 Kelton, S (2020) The Deficit Myth, John Murray.

inflation might not lead to a steepening of the yield curve and an increase in real rates. At
one level this can be understood within the framework of monetary policy of recent
decades, just with the proviso that central banks are comfortable with inflation overshoots.
At the other end of the scale, the same state of affairs could be understood in the language
of MMT of the policy levels and goals having changed. Either way, inflation might not be
followed by higher real rates. We discuss at the end of this chapter, the impact that all this
has on portfolios.
Recent move up in inflation expectations
Inflation expectations have moved up significantly in recent months. In fact, both measures
such as 10-year inflation breakevens and 5y5y inflation swaps have moved up in a straight
line since March (see Exhibit 10 and Exhibit 11). However, these are still only slightly above
the level of 2019; so, when we say the outlook is inflationary, it is not this recent level re-
attained by inflation measures that we mean. We have yet to see a definitive move above
the levels of recent years; we think that move is still to come. Right now we are still in a
deflationary shock, given the uncertain impact of the recession. But we think these
measures of forward inflation expectations should continue to rise.
Source: Bloomberg and Bernstein analysis Source: Bloomberg and Bernstein analysis
Policy response and money supply
Perhaps the most obvious reason for claiming that we face an inflationary outlook is the
scale of the policy response and in particular the impact this has had on money supply.
Exhibit 12 shows changes in money supply (M2) and two-year forward inflation. The link is
far from perfect, but it is over a one-to-two-year forward horizon that changes in money
supply have tended to influence inflation, and it is over that horizon that central banks have
traditionally assumed that the transmission mechanism from interest rate changes takes
its full effect.
0
0.5
1
1.5
2
2.5
Aug-1
9
Oct-19
Dec-
19
Feb
-20
Apr-
20
Jun-2
0
Aug-2
0
Oct-20
Dec-
20
%
0.0
0.5
1.0
1.5
2.0
2.5
3.0A
ug-1
5
Feb
-16
Aug-1
6
Feb
-17
Aug-1
7
Feb
-18
Aug-1
8
Feb
-19
Aug-1
9
Feb
-20
Aug-2
0
%
Europe US

Source: Datastream and Bernstein analysis
Governments need to monetize debt
Exhibit 13 shows that the ratio of government debt/GDP for OECD countries is now getting
to a level only seen before at the end of WWII. However, back then there were ample
opportunities to grow out of it. Demographics were much more favorable. Moreover, the
global capital stock had been in part destroyed by the war and needed to be rebuilt. It is far
harder to make a case that we can grow out of the debt this time round; thus, governments
are likely be tempted to inflate their way out of it. Whether this is explicit policy or not, it will
likely bias policy in favor of higher inflation for years to come.
-5.00
0.00
5.00
10.00
15.00
20.00
25.00
01/0
1/1
960
01/0
9/1
961
01/0
5/1
963
01/0
1/1
965
01/0
9/1
966
01/0
5/1
968
01/0
1/1
970
01/0
9/1
971
01/0
5/1
973
01/0
1/1
975
01/0
9/1
976
01/0
5/1
978
01/0
1/1
980
01/0
9/1
981
01/0
5/1
983
01/0
1/1
985
01/0
9/1
986
01/0
5/1
988
01/0
1/1
990
01/0
9/1
991
01/0
5/1
993
01/0
1/1
995
01/0
9/1
996
01/0
5/1
998
01/0
1/2
000
01/0
9/2
001
01/0
5/2
003
01/0
1/2
005
01/0
9/2
006
01/0
5/2
008
01/0
1/2
010
01/0
9/2
011
01/0
5/2
013
01/0
1/2
015
01/0
9/2
016
01/0
5/2
018
01/0
1/2
020
%
US M2 Money Supply, yoy US CPI 2yr forward

Source: GFD and Bernstein analysis
Central banks tolerant of inflation overshoots
At the Jackson Hole seminar at the end of August 2020, Chairman Powell laid out a regime
for policy that is now much more tolerant of inflation overshooting on the upside.
Meanwhile, at the ECB, Christine Lagarde has launched a strategic review of the bank's
inflation targeting policy.8 After the previous such review, the inflation target was revised
from a 0-2% range to a narrower range of below but close to 2%. It is expected that this
review will see the ECB revise the inflation target up to 2%. However, the conclusion of the
review has been postponed to mid-2021 due to the Covid-19 pandemic.
Bond yields have moved higher very recently, but all of this is due to inflation breakevens
moving up, not because of shifts in real yields (see Exhibit 14). We would also point to the
yield curve, which has maintained a very flat structure at all maturities in recent months.
8 https://www.ft.com/content/63404e0e-3dcc-11ea-a01a-bae547046735
0
20
40
60
80
100
120
140
160
31/1
2/1
900
31/1
2/1
903
31/1
2/1
906
31/1
2/1
909
31/1
2/1
912
31/1
2/1
915
31/1
2/1
918
31/1
2/1
921
31/1
2/1
924
31/1
2/1
927
31/1
2/1
930
31/1
2/1
933
31/1
2/1
936
31/1
2/1
939
31/1
2/1
942
31/1
2/1
945
31/1
2/1
948
31/1
2/1
951
31/1
2/1
954
31/1
2/1
957
31/1
2/1
960
31/1
2/1
963
31/1
2/1
966
31/1
2/1
969
31/1
2/1
972
31/1
2/1
975
31/1
2/1
978
31/1
2/1
981
31/1
2/1
984
31/1
2/1
987
31/1
2/1
990
31/1
2/1
993
31/1
2/1
996
31/1
2/1
999
31/1
2/2
002
31/1
2/2
005
31/1
2/2
008
31/1
2/2
011
31/1
2/2
014
31/1
2/2
017
%
G7: Debt/GDP 2020

Source: Bloomberg and Bernstein analysis
Unemployment
However, there are powerful forces to suggest that the outlook might not be inflationary as
well. The one we think carries the most weight is unemployment. We think it is possible that
the low levels of unemployment seen in 2019 mark a historical minimum, which is not likely
to be seen again. The pandemic, size of the recession, shift to ecommerce, and the ongoing
need for distancing likely brings forward an automation of jobs that would have happened
gradually in coming years.
If we do not revisit the low levels of unemployment seen in 2019, then it is hard to imagine
there being any wage pressure in aggregate. We also need to bear in mind that there was a
remarkable absence of wage inflation even when unemployment was so low in recent
years.
Wage inflation is important as it is shifts in wages that tend to promote a more "sticky"
influence on prices than shifts in prices of commodities or input costs. There have been
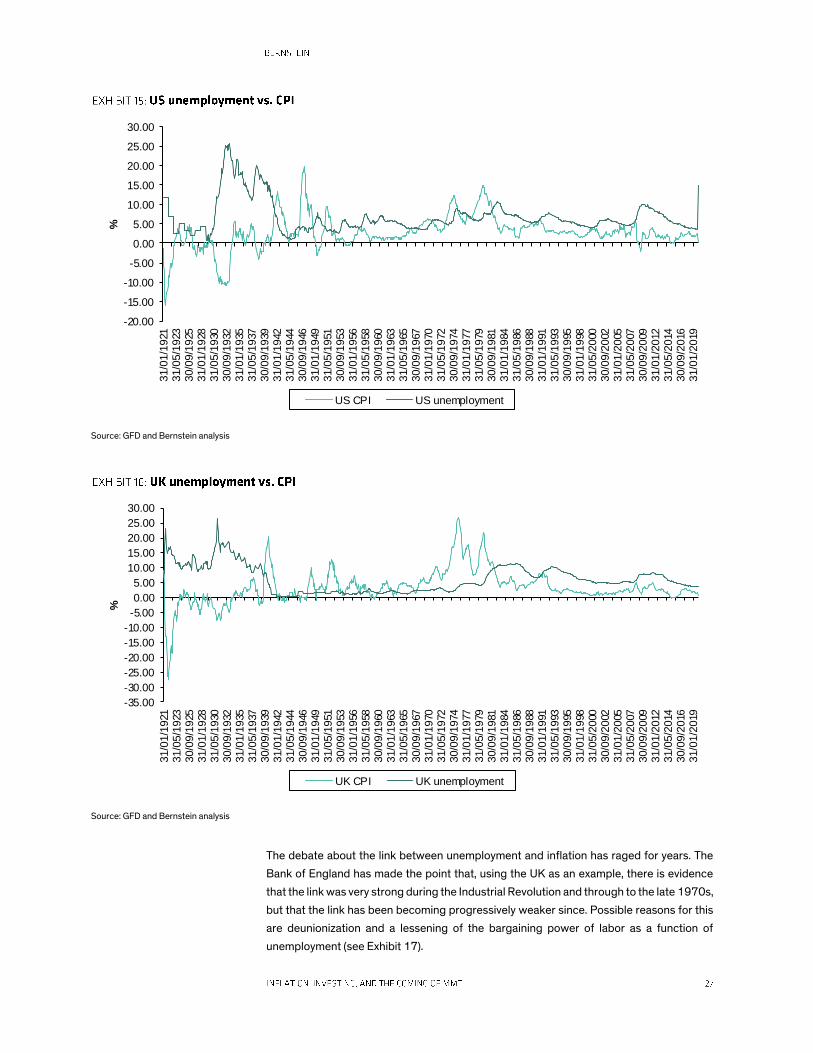
episodes when both inflation and unemployment were elevated — e.g., in the 1970s, but
other periods of high unemployment in the 1930s and the GFC were periods of low or
negative inflation (see Exhibit 15 and Exhibit 16).
-1.5
-1
-0.5
0
0.5
1
1.5
2
2.5
%
US 10y breakeven US 10y real rate
Source: GFD and Bernstein analysis
Source: GFD and Bernstein analysis
The debate about the link between unemployment and inflation has raged for years. The
Bank of England has made the point that, using the UK as an example, there is evidence
that the link was very strong during the Industrial Revolution and through to the late 1970s,
but that the link has been becoming progressively weaker since. Possible reasons for this
are deunionization and a lessening of the bargaining power of labor as a function of
unemployment (see Exhibit 17).
-20.00
-15.00
-10.00
-5.00
0.00
5.00
10.00
15.00
20.00
25.00
30.00
31/0
1/1
921
31/0
5/1
923
30/0
9/1
925
31/0
1/1
928
31/0
5/1
930
30/0
9/1
932
31/0
1/1
935
31/0
5/1
937
30/0
9/1
939
31/0
1/1
942
31/0
5/1
944
30/0
9/1
946
31/0
1/1
949
31/0
5/1
951
30/0
9/1
953
31/0
1/1
956
31/0
5/1
958
30/0
9/1
960
31/0
1/1
963
31/0
5/1
965
30/0
9/1
967
31/0
1/1
970
31/0
5/1
972
30/0
9/1
974
31/0
1/1
977
31/0
5/1
979
30/0
9/1
981
31/0
1/1
984
31/0
5/1
986
30/0
9/1
988
31/0
1/1
991
31/0
5/1
993
30/0
9/1
995
31/0
1/1
998
31/0
5/2
000
30/0
9/2
002
31/0
1/2
005
31/0
5/2
007
30/0
9/2
009
31/0
1/2
012
31/0
5/2
014
30/0
9/2
016
31/0
1/2
019
%
US CPI US unemployment
-35.00
-30.00
-25.00
-20.00
-15.00
-10.00
-5.00
0.00
5.00
10.00
15.00
20.00
25.00
30.00
31/0
1/1
921
31/0
5/1
923
30/0
9/1
925
31/0
1/1
928
31/0
5/1
930
30/0
9/1
932
31/0
1/1
935
31/0
5/1
937
30/0
9/1
939
31/0
1/1
942
31/0
5/1
944
30/0
9/1
946
31/0
1/1
949
31/0
5/1
951
30/0
9/1
953
31/0
1/1
956
31/0
5/1
958
30/0
9/1
960
31/0
1/1
963
31/0
5/1
965
30/0
9/1
967
31/0
1/1
970
31/0
5/1
972
30/0
9/1
974
31/0
1/1
977
31/0
5/1
979
30/0
9/1
981
31/0
1/1
984
31/0
5/1
986
30/0
9/1
988
31/0
1/1
991
31/0
5/1
993
30/0
9/1
995
31/0
1/1
998
31/0
5/2
000
30/0
9/2
002
31/0
1/2
005
31/0
5/2
007
30/0
9/2
009
31/0
1/2
012
31/0
5/2
014
30/0
9/2
016
31/0
1/2
019
%
UK CPI UK unemployment

Source: Bank of England
Zombies and inflation
From a policy perspective, it might be desirable in the short term to allow companies to
remain as going concerns even if in normal times they would have failed. Governments will
do whatever they can to limit increases in unemployment. This is part of the theme of
placing the capital-raising function of markets above their price-discovery function, as part
of a short-term fix. This can either come through keeping costs of credit low or even
loosening requirements for when companies are obliged to declare bankruptcy. The former
is the explicit policy of central banks in the US and Europe, while the latter has also been
adopted in countries such as Germany. The German COVID-19 Mitigation Act provided for
a temporary suspension of the obligation to file for insolvency until September 30, 2020.
Technically insolvent companies have been granted protections to resume or maintain
business operations.
This leaves the high likelihood that economies will see a higher prevalence of "zombie"
companies for some years to come; there is evidence that this can depress inflation.
Acharya et al. examined the effects of a sharp rise in the share of zombie companies in
Europe during 2012-16. They found that credit that was extended to zombie companies
was associated with a decrease in firm defaults and entries, firm mark-ups, and product
prices. According to their estimates, without a rise in zombie credit during this period
European annual inflation would have been 0.45 percentage points higher9 (see
Exhibit 18).
9 Acharya, V. V. , Crosignani, M., Eisert, T., & Eufinger, C. (2020). Zombie Credit and (Dis-) Inflation: Evidence from Europe,
NBER Working Paper Series, National Bureau of Economic Research, Inc.

Note: Shows the year-over-year (YOY) growth of the Consumer Price Index (CPI) on the left axis and the asset-weighted share of zombie firms on the right axis in
our sample. A firm is classified as zombie if it is low-quality (i.e., above median leverage and below median interest coverage ratio) and receives subsidized credit
(interest expenses/debt smaller than that of the highest quality firms in a given year).
Source: Acharya, V. V. , Crosignani, M., Eisert, T., & Eufinger, C. (2020). Zombie Credit and (Dis-) Inflation: Evidence from Europe. NBER Working Paper Series.
Tech, demographics, and deunionization
Meanwhile, in the background, the deflationary forces that have placed downward
pressure on inflation for at least a decade remain in place. As we alluded to in the discussion
of the Phillips curve, deunionization has reduced the bargaining power of labor.
Unionization rates have fallen to levels last seen more than a century ago, and the advance
of the gig economy has further eroded worker bargaining power (see Exhibit 19).

Source: Datastream; Bureau of Labor Statistics (BLS); Thomas, R. and Dimsdale, N. (2016) "Three Centuries of Data - Version 3.0"; Bank of England; and
Bernstein analysis
0
10
20
30
40
50
60
% e
mp
loyed
UK US

◼ The velocity of money is likely to decline post Covid-19. Potentially, this makes it
harder to generate inflation by requiring ever larger increases in money supply. We still
think the policy response will be inflationary, but it puts extra emphasis on the
importance of fiscal measures and, hence, the political nature of generating inflation.
◼ This chapter explores how demand for saving, the velocity of money, funding
retirement, and inflation are intimately related and what this means for investors and
policymakers.
◼ 2020 saw a record increase in the savings rate. Some of that is temporary, but we
argue there will be a sustained and significant increase in the savings rate compared
to the 2019 base level, because of the likelihood of lower real returns from retirement
savings products in future.
◼ If authorities are successful at generating inflation, then exposure to real assets
becomes a larger part of the natural asset allocation mix of this increased saving. We
show that shorn of all the financial engineering of buybacks, equities can count as real
assets. Younger savers hold increasing amounts of that exposure in target date funds,
but asset managers may wish to evolve the structure of such vehicles.
◼ But if real returns are low and an increase in savings creates problems by lowering
velocity and consumption, does it make sense to try to fund pensions at all? If one
started the system from scratch maybe not, but the demographic profile overlaid with
the inter-generational wealth distribution would make it very unlikely that the current
system changes.
◼ This creates opportunities for asset managers in designing products to meet what may
be an increased demand for inflation-protected retirement saving. Meanwhile, for
investment decision making, it also means we should expect a more active political
fiscal policy acting as a force in markets.
◼ The larger equity exposure of the increased savings pool means the stewardship role
of active managers increases. This is an unconventional route, pointing to the role of
ESG in generating growth in the economy. The issues raised in this chapter also point
to the need for a more joined-up approach to the issuance of government debt, not
only seeing it as a vehicle to fund expenditure, but also as creating a flow of assets that
are needed to keep a funded retirement system alive.
A question has been asked several times of late in discussions with clients: will a legacy of
Covid-19 be a decline in the velocity of money and if yes, does that make it even harder for

policymakers to raise inflation? We think the policy response to Covid-19 will end up being
inflationary (once we are out of the immediate deflationary shock), but we recognize there
are very strong forces aligned in the other direction. It is partly for this reason that we think
policymakers will likely be inclined to keep the yield curve flat even as inflation rises.
In our research discussing the case for and against inflation,10 we identified the main new
force against inflation as being unemployment. Our claim is that we may never again see
the low level of unemployment of 2019, unless there is a massive political change to put
employment above other goals. In the absence of wage inflation, any inflation that does
occur might not be "sticky." Other deflationary forces are demographics and technology/
automation, which were major reasons why all the QE1,2…N programs failed to stoke
inflation. A decline in the velocity of money could, in theory, be an extra reason why policy
makers might struggle to create inflation.
Ultimately, we think this debate comes down to politics, not macroeconomics. It has
suddenly become acceptable for policymakers to use fiscal measures that are much more
directly inflationary (handing out cash to people via helicopter money or furlough schemes),
to live with higher deficits, and to increase the money supply in ways not imagined before.
The bottom line is that there will likely be a political force that simply needs inflation to
manage the overall debt level. This is also intimately linked to the bigger question of how
long-term retirement funding works in the post-Covid-19 world.
Savings and velocity of money
2020 has already seen a massive increase in the savings rate, as a reflection of greater risk
aversion leading households to save, but also bluntly being the result of the constraints on
consumption from lockdowns. While the 2020 savings rate is almost certainly a short-term
aberration, we think the prognosis for future years is for the savings rate to settle at a
significantly higher level than the pre-Covid-19 base level.
Exhibit 20 shows the savings rate, inverted on the right-hand axis, plotted with the velocity
of money. Increases in the savings rate are associated with a decline in the velocity of
money, as it is not spent on consuming goods and services.
10 Portfolio Strategy: Inflation, investing and the coming of MMT

Source: FRED, Datastream, and Bernstein analysis
Why might the savings rate increase compared to the 2019 base level? We think high
starting valuations will depress the future returns of most asset classes. This is not a
function of Covid-19, but a function of the run-up in the prices of financial assets for
years.11 This implies a need for increased savings for retirement.
Exhibit 21 shows a simple illustrative model that links the proportion of salary saved as a
function of assumed investment returns. We assume someone starts work aged 20 earning
$25K p.a. and experiences salary growth of 2% p.a. and retires aged 65. Upon retirement,
we assume they purchase an annuity that pays out $35K every year and that they die aged
90. We assume they pay into a savings product each year; this allows a simple analysis of
the scale of the change required to the proportion of salary saved, as we vary the assumed
investment return. Thus, if the expected returns fall from 7% to a more likely 4%, the
savings rate has to rise from 5% to 11% to maintain the same level of income in retirement
from savings.
11 Global Quantitative Strategy: The Strategic Investment Outlook - Blame it on the Boogie
0.00
5.00
10.00
15.00
20.00
25.00
30.000.000
0.500
1.000
1.500
2.000
2.500
%, in
vert
ed
Ratio
US: Velocity of M2 Money Stock US Personal Savings Rate (RHS, inverted)
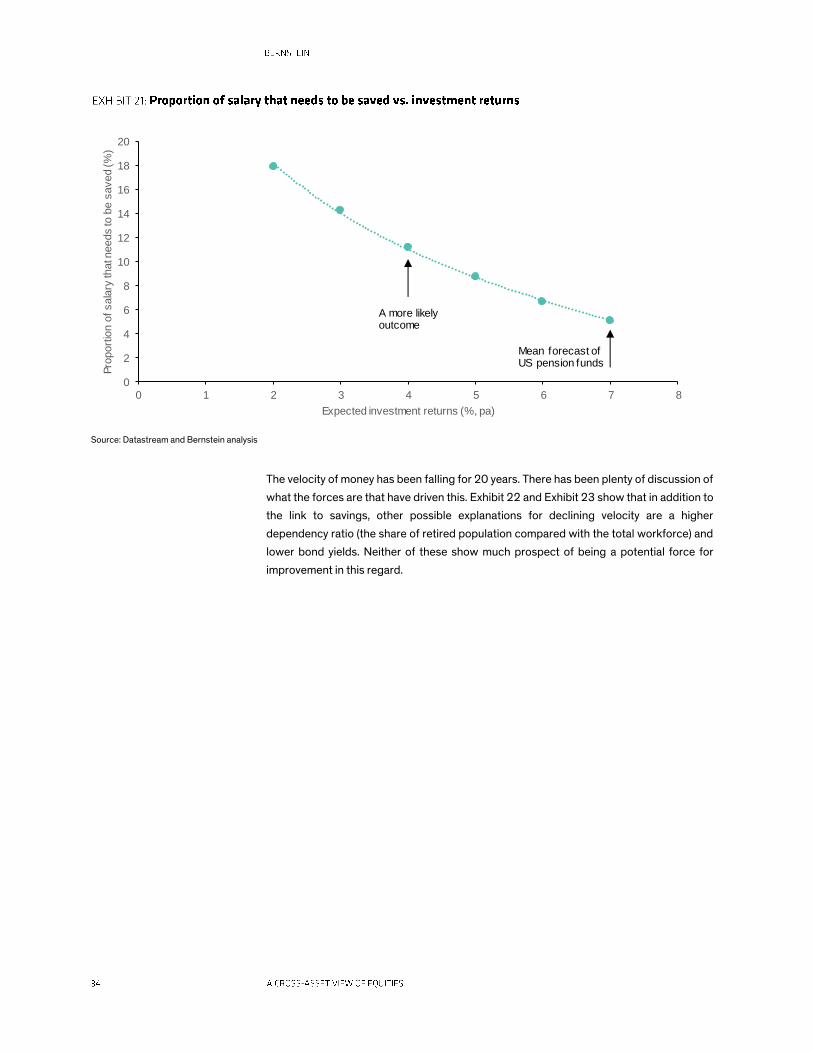
Source: Datastream and Bernstein analysis
The velocity of money has been falling for 20 years. There has been plenty of discussion of
what the forces are that have driven this. Exhibit 22 and Exhibit 23 show that in addition to
the link to savings, other possible explanations for declining velocity are a higher
dependency ratio (the share of retired population compared with the total workforce) and
lower bond yields. Neither of these show much prospect of being a potential force for
improvement in this regard.
0
2
4
6
8
10
12
14
16
18
20
0 1 2 3 4 5 6 7 8
Pro
port
ion o
f sala
ry th
at n
eeds to
be s
aved (%
)
Expected investment returns (%, pa)
A more likely outcome
Mean forecast of US pension funds

Source: FRED, Datastream, and Bernstein analysis Source: FRED, Datastream, and Bernstein analysis
There is endless debate about the drivers of inflation. The new era we are evolving toward
in the wake of the pandemic will likely see this debate elevated to even higher prominence.
We do not seek to advocate any particular approach here, but at the very least, the evolution
of the policy response will likely take into account and be influenced by the major schools
of thought on this. Among these, the quantity theory of money places the velocity of money
at the core of this issue.
Fisher's equation of exchange states that:
MV=PT
Where M is the money supply, V is the velocity of money, P is the price level, and T is the
number of transactions. We note that empirically this relationship has not fared well and the
link between the money supply and inflation, if there is one, has only been apparent for
certain relatively short periods, such as possibly in the 1930-40s and again in the 1970s.
Nevertheless, if this relationship has any influence on policy making at a theoretical level, it
implies that for any given level of desired inflation, that as the velocity of money falls, ever
larger quantities of money need to be created.
Over the last 10 years, the savings rate has averaged 7.5%. The narrative of greater savings
implies a savings rate increasing to the low- to mid-teens rate. Taking the simple
relationship between savings rate and velocity, i.e., not accounting for other variables,
implies a velocity of money at the very least at the lower end of its historical range.
0
2
4
6
8
10
12
14
16
1.0
1.2
1.4
1.6
1.8
2.0
2.2
2.4
%
Rati
o
US: Velocity of M2 Money Stock
US 10y yield (RHS)
0
5
10
15
20
25
301.20
1.40
1.60
1.80
2.00
2.20
2.40
1960
1964
1968
1972
1976
1980
1984
1988
1992
1996
2000
2004
2008
2012
2016
%, in
vert
ed
Ratio
US: Velocity of M2 Money Stock
US dependency ratio (old, % of working age population)

The path of policy evolution appears to be going in a somewhat different direction, with a
much greater emphasis on fiscal policy. 2020 has seen rapid pursuit of much more direct
fiscal measures, e.g., helicopter money, direct handouts of cash to businesses, furlough
schemes, and increases in unemployment aid, all of which are plausibly much more directly
inflationary for a series such as CPI than creating money and using it to buy financial assets.
That is presumably where the emphasis has to fall in future and, indeed, where the political
debate seems to be heading. This implies that we no longer have a situation where there is
a hybrid of monetary and fiscal policy. The role of the central banks becomes then more
about keeping the cost of debt manageable. This is an environment where the steering of
the economy over the business cycle is more political and less technocratic.
What does this mean for how savings are allocated?
If savings increase, what form do they take? If there is even moderately more inflation, then
savers will be more focused on preserving purchasing power and, hence, a need to hold
real assets. We think equities become an even larger share of asset allocation in such an
environment. This includes both public and private equity. Given the stock of listed equity
has been shrinking for the past decade (until the last six months, when issuance again
exceeded buybacks) and given the propensity for younger companies to avoid or delay
listing, the size of private holdings should be larger than they were. However, that does not
mean that a greater allocation to private equity funds makes sense, as we recently
discussed in Portfolio Strategy: Small caps and election risk. Alongside equity, the
allocation to infrastructure and real estate would be other usual places to seek real asset
exposure. However, real estate suffers from two strategic problems. There is the
fundamental problem of its exposure to shopping malls, central city office space, and other
assets that may see a long-term hit to value post the pandemic. Also the correlation of
REITS with equities increases with inflation, so if there is already a large equity allocation
then their utility to overall portfolio value is moot (Portfolio Strategy: Multi asset portfolios
in the crisis and the outlook for diversification if inflation rises).
Can public equities count as a real asset? We think they can, though they have to be shorn
of the mass financial engineering of the last decade when companies have been rewarded
for issuing low-grade debt and buying back their stock. Equities do count as a real asset as
they entitle one to profits that grow together with the real growth in the economy over time.
However, to get a true sense of real earnings growth it needs to be adjusted for buybacks
that reduce the share count and inflate earnings per share but add nothing to the
company's ability to generate profit. In Exhibit 24, we show the total corporate profits as
calculated by the BEA in National Income and Product Accounts (NIPA). We have deflated
the profit growth by CPI and converted it to an index. Since the1950s, real US corporate
profits ex buybacks have grown by 2.6% p.a. — not very large but a positive premium
nonetheless.

Note: NIPA profits deflated by CPI
Source: Datastream, BEA, and Bernstein analysis
The allocation to cash and long duration in fixed income is likely to be low.12 Younger savers
already have a high equity weighting — as they should — though much of this is held via
target date structures rather than direct equity. We think, if anything, the equity allocation
should rise even further. As we have written in recent research, we believe the overall
structure of target date funds is very sound, but the inputs may need to evolve to include
factors and other real-asset exposure. Moreover, such saving will have to recognize that
many people will need to work much longer and, so, the assumption will be that the equity
weightings should likely remain significant even after the notional retirement date is
reached (see Exhibit 25).
12 Portfolio Strategy: Duration in equities good, duration in bonds bad
0
100
200
300
400
500
600
700
1950
1952
1954
1956
1958
1960
1962
1964
1966
1968
1970
1972
1974
1976
1978
1980
1982
1984
1986
1988
1990
1992
1994
1996
1998
2000
2002
2004
2006
2008
2010
2012
2014
2016
2018
Ind
ex
US Real NIPA profit index (NIPA profit - CPI)

Note: (1) A target date fund typically rebalances its portfolio to become less focused on growth and more focused on income as it approaches and passes the
target date of the fund, which is usually included in the fund name.
(2) The Investment Company Institute classifies balanced funds as hybrid in its data.
(3) Equities include equity funds, company stock, and the equity portion of balanced funds.
Funds include mutual funds, bank collective trusts, life insurance separate accounts, and any pooled investment product primarily invested in the security
indicated. Percentages are dollar-weighted averages.
Source: Tabulations from EBR/ICI Participant-Directed Retirement Plan Data Collection Project (see ICI Research Perspective, "401(k) Plan Asset Allocation,
Account Balances, and Loans); and Bernstein analysis.
Should pensions even be funded?
Usually reports about asset allocation or about the asset management industry stop at this
point in the narrative. But all this seems to us to beg a bigger question. Should we even try
to fund pensions?
As a thought experiment , if we were to start from a blank slate and with a starting position
of negative real rates and a slight path upward for inflation, and in addition to that, starting
valuations on the main financial asset classes that are at multi century high levels, then how
plausible is it that savings can realistically generate enough return to cover retirement? As
a related question for public policy, how much of this risk can acceptably be offloaded to
individuals? 401(k) plans came into existence right at the end of the 1970s in time for (and
possibly not unrelated to!) the beginning of the biggest 40-year bull market in history. If the
main cheaply accessible financial assets struggled to keep pace with inflation, would such
an approach still be viable?
Suppose we had a crystal ball that told us that returns from an 80:20 (as the returns from
60:40 would be too horrible to countenance) type retirement account were going to be 1%
real p.a. for the next decade, would society go for that as a retirement option? OK, the
crystal ball might be too pessimistic, as policy can always over-ride valuations for a
surprisingly long time.13 The alternative would be not to bother to try to save for pensions
13 Portfolio Strategy: S&P 4000 or S&P 8000? Our strategists disagree
55.4
5.6
6.3
18.4
38.1
79.5
3.9
7.6
47.6
28.8
0 10 20 30 40 50 60 70 80 90
Memo: equities
Company stock
Non-target date balanced funds
Target date funds
Equity funds
Participants in their twenties
Participants in their sixties
1
2
3

and let future taxpayers pick up the bill. The extent to which these obligations are funded
or not varies enormously by country.
In Exhibit 26, we show for the US the scale of assets in DC plans and IRAs, where there is
no explicit liability to fund — just the need to grow in real terms — and the asset pools
designed to match defined liabilities. However, these two segments alone are only part of
the retirement picture. In addition, there is Social Security, which is unfunded. The present
value of this unfunded obligation out to 2093 is US$14Tn.14
* Data are estimated
Source: Investment Company Institute and Federal Reserve Board (data and estimates) (see Investment Company Institute "The US Retirement Market, Fourth
Quarter 2018"); ICI; ssa.gov.; and Bernstein analysis
Governments will be very keen to stop a greater share of the retirement obligations falling
back on the public sector balance sheet. Therefore, they will be incentivized to make sure
asset managers and pension plans between them are indeed able to cover this. In time, we
think this pressure could be strong enough to cause regulatory change for pension
investing, e.g., with regard to liquidity requirements and the way risk is measured.
There are obvious hurdles to trying to shift this burden onto future taxpayers. The main one
is demographics, with the shape of the age cohort chart showing relatively fewer workers
to pay for retirees. Using UN population forecasts, the working population of the developed
world + China + former Soviet countries taken together is expected to fall from around 1.9
billion today to 1.6 billion over the next 30 years (a 17% fall) and 1.3 billion by 2100 (a 33%
fall) (see Exhibit 27). The reduction of the global working population from the expected
aging of the population over the next 30 years will effectively remove 30% of the extra
14 https://www.ssa.gov/OACT/tr/2019/VI_F_infinite.html#1000194
8.8*
7.5
2.1
3.9
1.8
2.9
4.7
1.7
0.6
13.9
0
2
4
6
8
10
12
14
16
IRAs DC plans Annuities State and localgovernment
Federal government Private-sector Unfunded SocialSecurity
Retirement assets
Unfunded DB plan liabilities
DB plans
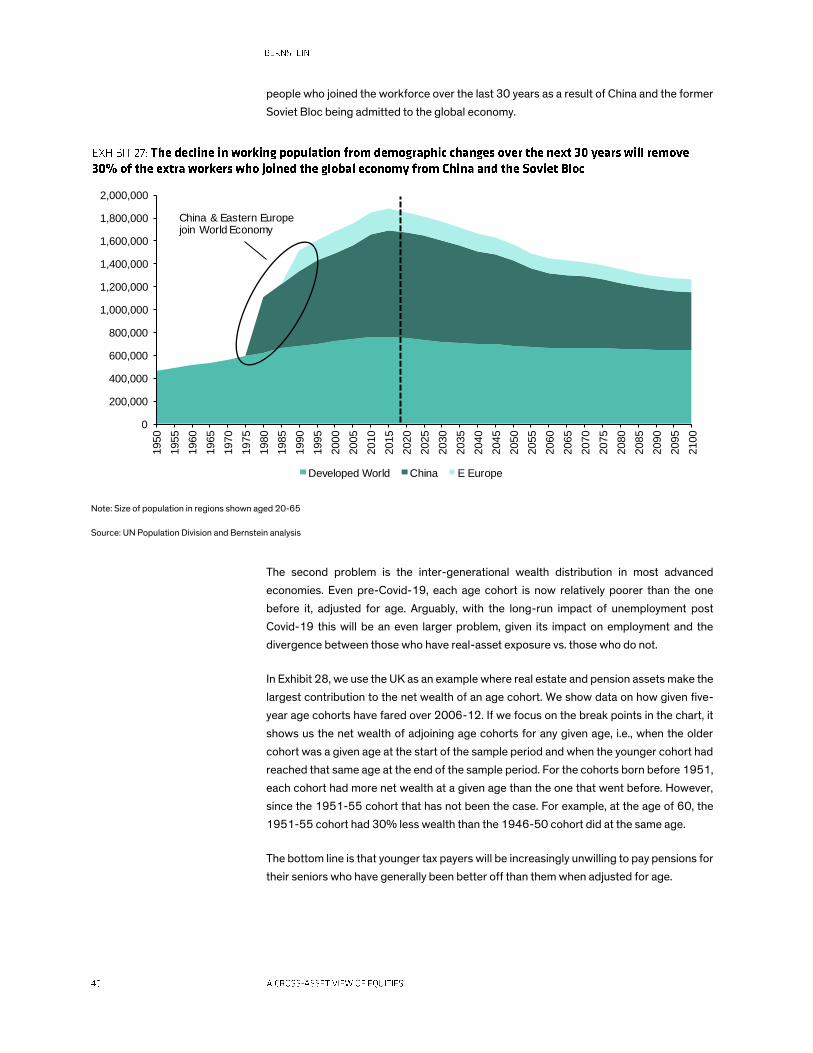
people who joined the workforce over the last 30 years as a result of China and the former
Soviet Bloc being admitted to the global economy.
Note: Size of population in regions shown aged 20-65
Source: UN Population Division and Bernstein analysis
The second problem is the inter-generational wealth distribution in most advanced
economies. Even pre-Covid-19, each age cohort is now relatively poorer than the one
before it, adjusted for age. Arguably, with the long-run impact of unemployment post
Covid-19 this will be an even larger problem, given its impact on employment and the
divergence between those who have real-asset exposure vs. those who do not.
In Exhibit 28, we use the UK as an example where real estate and pension assets make the
largest contribution to the net wealth of an age cohort. We show data on how given five-
year age cohorts have fared over 2006-12. If we focus on the break points in the chart, it
shows us the net wealth of adjoining age cohorts for any given age, i.e., when the older
cohort was a given age at the start of the sample period and when the younger cohort had
reached that same age at the end of the sample period. For the cohorts born before 1951,
each cohort had more net wealth at a given age than the one that went before. However,
since the 1951-55 cohort that has not been the case. For example, at the age of 60, the
1951-55 cohort had 30% less wealth than the 1946-50 cohort did at the same age.
The bottom line is that younger tax payers will be increasingly unwilling to pay pensions for
their seniors who have generally been better off than them when adjusted for age.
0
200,000
400,000
600,000
800,000
1,000,000
1,200,000
1,400,000
1,600,000
1,800,000
2,000,000
1950
1955
1960
1965
1970
1975
1980
1985
1990
1995
2000
2005
2010
2015
2020
2025
2030
2035
2040
2045
2050
2055
2060
2065
2070
2075
2080
2085
2090
2095
2100
Developed World China E Europe
China & Eastern Europe join World Economy

Note: Exhibit compares median net financial wealth across 14 five-year birth cohorts over the period 2006-08 to 2012-14, with the horizontal axis indicating the
median age of that cohort at each point in time.
Source: Resolution Foundation, http://www.resolutionfoundation.org/app/uploads/2017/06/Wealth.pdf
In addition to the shape of the demographic distribution and the question of inter-
generational fairness, there is the question of debt. Debt/GDP has now reached a level last
seen at the end of WWII. But at that time the shape of the age distribution and their wealth
was very different. Moreover, the political narrative appears to be one that will allow more
debt to be issued. Of course, this is being done at historically low interest rates, but that
would be hard to maintain were the cost of debt to rise, thus putting an even further burden
on future tax payers. This emphasizes the need to keep interest rates low so that the cost
of debt is less than the growth rate.
Conclusion
So where does all this leave us?
The policy implications of this will likely vary by country. In some, these forces could well
lead to a gradual swing in favor of funding pensions from future taxation, but at least for
markets such as the US and the UK, that seems very far from being a palatable political
reality. So, if future taxpayers are not on the hook, then savings rates go up. This implies the
velocity of money continues its downward path of recent decades. Policy makers can still
likely generate inflation through a combination of direct fiscal action and possibly even
larger increases in the money supply.
0
£2k
£4k
£6k
£8k
£10k
£12k
£14k
£16k
£18k
20 25 30 35 40 45 50 55 60 65 70 75 80 85 90
1921-25 1926-30
1931-35 1936-40
1941-45 1946-50
1951-55 1956-60
1961-65 1966-70
1971-75 1976-80
1981-85 1986-90
Median family net financial wealth per adult, by cohort: CPIH-adjusted to 2017 prices, 2006-08–2012-14, GB
Age of oldest adult

The need to fund pensions, but also the desire to raise inflation and the increased difficulty
of generating a given level of positive real returns is likely to shape the way investors save
for retirement. Eventually, regulation may have to change to allow pension plans to take on
more risk, or ideally redefine risk in terms of the probability of a hardship outcome rather
than trailing volatility of returns or asset-class mix. We discuss this in the "Let's Play Twister,
Let's Play Risk" chapter. Such a shift would imply a longer investment horizon and
specifically more equities, more long-short, and greater use of cross-asset factors
alongside asset classes.
It also brings us back to the question of the point of the equity market and that of active
management. At the micro level, for any individual investor and any individual PM, it is to
provide a return stream. But in aggregate, there is an emergent property, which is the ability
to allocate capital. An increase in the savings rate does not mean people hold cash, instead
they hold equities. Increased savings means, by definition, that capital is not being deployed
as consumption. However, a greater level of activity when it comes to engagement with the
management of companies that are owned and more focus on the concept of stewardship
means the capital can be very economically active. And so we come — by a very different
path — to the ESG role of active managers as an increasingly important way to generate
growth in the economy.
The other connecting force here is the twin desire of governments to fund continuously
high levels of deficits in our new policy world, but also to keep alive the notion that
individuals can save to fund their own pension. A joined-up view suggests the role of a
government debt management office is not just to issue debt securities to fund
expenditure, but also to create a flow of assets needed for retirement. This could lead to
greater innovation, e.g., in the idea of GDP-linked bonds or else in funding some
expenditure via the issuance of annuities.

◼ If there is a case for inflation, where might price rises appear? It feels like we are still a
little way from that point today, but are there segments of the economy investors
should look to for signs of price increases? In addition, which parts of the equity market
could be expected to respond most favorably? This chapter tries to address these twin
macro and portfolio questions.
◼ We think the policy response to Covid-19 will ultimately be inflationary. However, at
the moment, we are still undergoing the deflationary shock of social distancing rules.
While inflation expectations in the US have just come back to their pre-Covid-19
levels, we are still some way from seeing a definitive move higher in aggregate inflation
expectations.
◼ With inventories at a very low level and supply having been cut, some sectors have
managed to increase prices, e.g., US airlines and European autos. We discuss the
potential for when prices could rise across other cyclical sectors. It will also be
important for investors to distinguish between any rapid price increases that arise as
a result of inventory re-builds vs. price increases that could signify a policy over-
reaction, as these would have different implications for equities and the yield curve.
◼ The potential for raising prices can act as a catalyst for parts of Value-Cyclical sectors.
Thus, we think selected exposure to parts of the Value trade and parts of cyclicality are
warranted. We update our list of "Residual Value" stocks within Cyclical stocks; we
also analyze performance and valuation for relevant sectors. The Cyclical Value screen
implies that investors who want exposure to Cyclical/Value and the potential for prices
finding a floor should have exposure to airlines, autos, and aerospace/defense among
other selected stocks.
We have made the case in earlier chapters that the policy response to Covid-19 will be
inflationary. This conclusion is ultimately the result of three large forces. Governments are
incentivized to create inflation as a way to keep record debt levels manageable;
governments have rapidly adopted new fiscal tools in response to the pandemic that can
be more directly inflationary, and any hesitancy about large increases in the money supply
appear to be in abeyance. Having said that, while inflation expectations have recovered
from the extreme low levels of H1 2020, they have only just risen above the levels of end-
2019 in the US and are still some way below that level in Europe (see Exhibit 29). This is
because there are still significant doubts about whether in the long-term policy can indeed
overcome the deflationary forces that have been so dominant in recent years. Also ongoing
social distancing measures mean we are still in the midst of a deflationary shock. Indeed,

the emergence of Europe's second Covid-19 wave has again put downward pressure on
expectations of future inflation.
Source: Bloomberg and Bernstein analysis
Where is inflation likely to show up first? If the policy response is successful, it will
eventually show up in aggregate CPI, but can we expect it to emerge in other indicators or
in segments of the economy first?
Even before the pandemic hit, inventory growth was running at a very low level (see
Exhibit 30 and Exhibit 31). Inventories fell further during 2020. This means there is
potential for relatively rapid price increases in segments of the economy where inventories
are tight once demand returns. Likewise, there are more service-type sectors where
capacity has been cut. Thus, a company that has already cut capacity — and has possibly
seen competitors go bankrupt — may well have the ability to raise prices. An example here
would be the airline sector, where capacity has been cut by an obviously huge degree.
Note that we are careful not to describe this as pricing power; it's not as if there are
bountiful near-term profits available. However, tangible evidence of where prices are
already rising and where we can expect near-term changes, is crucial for a bottom-up
affirmation that inflation is indeed possible. Moreover, the tightness of inventories and of
supply, in some cases, means there is the possibility of a very rapid rebound in prices as
demand recovers. It is going to be important for investors to distinguish a very rapid price
increase due to inventory rebound vs. one driven by a policy over-reaction. These would
have very different implications for the equity market and the yield curve.
0.5
0.7
0.9
1.1
1.3
1.5
1.7
1.9
2.1
2.3
2.5
Jul-19
Aug-1
9
Sep-1
9
Oct-19
Nov-
19
Dec-
19
Jan-2
0
Feb
-20
Mar-
20
Apr-
20
May-
20
Jun-2
0
Jul-20
Aug-2
0
Sep-2
0
Oct-20
Nov-
20
Dec-
20
Jan-2
1
%
Europe 5y5y inflation index US 5y5y inflation index

Source: Datastream and Bernstein analysis Source: Datastream and Bernstein analysis
In the next section, we reference the work of Bernstein analysts across the key sectors
where we think this question of pricing has key macro connotations for portfolios more
broadly. There are a few areas where the ability to raise prices has persisted through the
pandemic — such as luxury and selected apparel (e.g., Nike). There are other areas where
there has already been an increase in prices; examples would be US airlines and European
autos. Likewise, there are other areas where price declines haven't been as bad as
expected, such as hotels. In this debate, we are leaving aside the commodity cyclicals, as
that is a more overtly macro top-down trade.
Autos
Our autos analysts are seeing some very positive pricing trends in the sector. As a result of
the pandemic, they are seeing strong customer demand pull while at the same time the
available stock levels are not excessive. Thus, auto OEMS are benefiting from positive net
pricing and strong residual values.
The team also expects a secular recovery in vehicle demand as a result of changing
behavior and lifestyles, such as moving out of cities and into the suburbs, and consumers
re-discovering the benefits of personal mobility by car. They believe that retaining most of
the positive pricing is doable and should be at the top of management teams' agendas.
Based on their proprietary pricing model, they estimate that a 1%-point increase in new
light vehicle net pricing would increase the global profit pool for OEMs by a staggering
€20Bn. For more details see: Euro Autos: Pricing - the Gateway to sustainably higher
profitability and valuation.
-2.0%
-1.5%
-1.0%
-0.5%
0.0%
0.5%
1.0%
1.5%
2.0%
2.5%Q
1 1
980
Q2 1
982
Q3 1
984
Q4 1
986
Q1 1
989
Q2 1
991
Q3 1
993
Q4 1
995
Q1 1
998
Q2 2
000
Q3 2
002
Q4 2
004
Q1 2
007
Q2 2
009
Q3 2
011
Q4 2
013
Q1 2
016
Q2 2
018
Q3 2
020
US change in inventories, % GDP
-1.5%
-1.0%
-0.5%
0.0%
0.5%
1.0%
1.5%
Q3 2
005
Q3 2
006
Q3 2
007
Q3 2
008
Q3 2
009
Q3 2
010
Q3 2
011
Q3 2
012
Q3 2
013
Q3 2
014
Q3 2
015
Q3 2
016
Q3 2
017
Q3 2
018
Q3 2
019
Q3 2
020
Europe change in inventories, % GDP

In Europe the sector currently trades at a 37% discount vs. its historical relative average
(see Exhibit 32). However, the earnings revisions balance (ERB) for the sector both in the
US and Europe has gone up significantly in recent months and is looking quite extended
(see Exhibit 33).
Source: FactSet and Bernstein analysis Source: FactSet, IBES, and Bernstein analysis
Machinery
In the machinery industry, our sector analysts note that pricing has been hard to come by in
2020 due to overstocked inventories and weak demand. Not many companies under their
coverage are talking about pricing power. This is reflected in the Machinery Producer Price
indices, which have been trending lower since the second half of 2019 and currently
remain significantly below historical average (see Exhibit 34). One area our analysts
highlight as holding up better is the agricultural equipment space. They note that US
farmers are currently enjoying the benefits of record high prices, high yields, and record
government payouts. Meanwhile, agricultural equipment spending is at a 30-year low and
the market is long overdue for a replacement cycle. Thus, they believe the farmers' strong
cash position and the need for replacement spending will continue to sustain the
agricultural equipment cycle (for more details see: US Chems/US Machinery: High crop
prices + good yield + bailouts = highest farm earnings since 2012/exceptional 2021 for
ag cos).
0.00
0.20
0.40
0.60
0.80
1.00
1.20
1.40
1.60
1.80
2.00
Jan-8
8
Feb
-90
Mar-
92
Apr-
94
May-
96
Jun-9
8
Jul-00
Aug-0
2
Sep-0
4
Oct-06
Nov-
08
Dec-
10
Jan-1
3
Feb
-15
Mar-
17
Apr-
19
Ratio
Europe Autos 12m FWD PE - relative
US Autos 12m FWD PE - relative
-100.00
-75.00
-50.00
-25.00
0.00
25.00
50.00
75.00
100.00
125.00
Jan-8
8
Jan-9
0
Jan-9
2
Jan-9
4
Jan-9
6
Jan-9
8
Jan-0
0
Jan-0
2
Jan-0
4
Jan-0
6
Jan-0
8
Jan-1
0
Jan-1
2
Jan-1
4
Jan-1
6
Jan-1
8
Jan-2
0
Earn
ings R
evis
ions B
ala
nce, %
Europe: Autos - ERB US: Autos - ERB

Source: Datastream and Bernstein analysis
Airlines, logistics, and freight
Airlines
In Europe, low-cost airlines and airlines focused on short-haul will likely be able to raise
prices first, as there is a lot of pent-up vacation demand that will likely be released as soon
as travel restrictions are lifted. According to our analysts, the indications are that airline
pricing can return to pre-Covid-19 levels fairly rapidly during 2021, as this pent-up demand
will have to be met by reduced supply by most EU airlines.
Our US analysts note a similar sentiment. With capacity down 50% or more and an
expected fast pickup in demand once travel restrictions are lifted, there should be room to
allow the carriers to manage up revenue. They also note US airlines are already able to get
a 10-15% premium for tickets leaving in late 2021 compared with tickets leaving in mid-
2021.
Freight Transportation & Logistics
According to our analysts, the current volatility in the freight markets enables forwarders to
increase their services and support pricing. This will likely continue as rate volatility
continues.
On air freight, they note there is a multi-year supply shortage. This will enable cargo airlines
to keep prices at all-time highs for longer and will also help Express companies (DPW and
FDX) to gain volumes and influence their mix. The faster mail decline in core European
countries will eventually lead to price increases on mail prices.
-2.00
-1.00
0.00
1.00
2.00
3.00
4.00
5.00
6.00
7.00
8.00
9.00
01/0
1/1
991
01/1
1/1
991
01/0
9/1
992
01/0
7/1
993
01/0
5/1
994
01/0
3/1
995
01/0
1/1
996
01/1
1/1
996
01/0
9/1
997
01/0
7/1
998
01/0
5/1
999
01/0
3/2
000
01/0
1/2
001
01/1
1/2
001
01/0
9/2
002
01/0
7/2
003
01/0
5/2
004
01/0
3/2
005
01/0
1/2
006
01/1
1/2
006
01/0
9/2
007
01/0
7/2
008
01/0
5/2
009
01/0
3/2
010
01/0
1/2
011
01/1
1/2
011
01/0
9/2
012
01/0
7/2
013
01/0
5/2
014
01/0
3/2
015
01/0
1/2
016
01/1
1/2
016
01/0
9/2
017
01/0
7/2
018
01/0
5/2
019
01/0
3/2
020
%
PPI - Agricultural machinery & equipment, yoy PPI - General purpose machinery & equipment, yoy
PPI - Construction machinery & equipment, yoy

They also note surface transportation rates in the US set a new record in October 2020 and
this is expected to continue. Railroads as assets with pricing power are a theme here, as
they can keep some of that price as profit, whereas truckers are recovering the higher cost
of seating a driver. Air cargo will likely be very strong for the near term on reduced
passenger supply (see Exhibit 35 to Exhibit 38).
Finally, they suggest that the parcel market has an opportunity to increase rates as more
and more retailers are meeting their customer at the doorstep. This reduces the ability of
carriers to compete on prices and forces collaboration, which leads to stickier rates.
The US transport team publishes a weekly Rails dashboard tracking the key sector metrics:
Rails W44-'20 Carloads: Strong bounce in intermodal, signs in life in merchandise, coal
continues to lag.
Source: FactSet and Bernstein analysis Source: FactSet and Bernstein analysis
0.00
0.20
0.40
0.60
0.80
1.00
1.20
1.40
1.60
Jan-8
8
Jan-9
0
Jan-9
2
Jan-9
4
Jan-9
6
Jan-9
8
Jan-0
0
Jan-0
2
Jan-0
4
Jan-0
6
Jan-0
8
Jan-1
0
Jan-1
2
Jan-1
4
Jan-1
6
Jan-1
8
Jan-2
0
Rati
o
Europe: Road & Rail 12m FWD PE - relative
Europe Air Freight and Couriers 12m FWD PE - relative
0.00
0.20
0.40
0.60
0.80
1.00
1.20
1.40
1.60
1.80
Jan-8
8
Jan-9
0
Jan-9
2
Jan-9
4
Jan-9
6
Jan-9
8
Jan-0
0
Jan-0
2
Jan-0
4
Jan-0
6
Jan-0
8
Jan-1
0
Jan-1
2
Jan-1
4
Jan-1
6
Jan-1
8
Jan-2
0
Rati
o
US Road & Rail 12m FWD PE - relative
US Air Freight & Couriers 12m FWD PE - relative

Source: FactSet and Bernstein analysis Source: FactSet and Bernstein analysis
Hotels
Our analyst notes that in 2020 pricing held up much better vs. demand compared to
previous downturns due to a better level of price control/discipline. In past downturns,
price declines have matched falling demand very closely, but in 2020 the worst month of
US room pricing (April) saw a 44% YOY decline in price, which was comfortably above the
68% decline in demand. They also note that any price weakness is driven by mix. This effect
is expected to last three to four years, until business travel recovery catches up with a
recovery in leisure travel. Within different hotel segments, branded hotel pricing is much
more stable compared to independents (see Exhibit 39). (For more details see: Global
Hotels: Recovery check-in. Part 2 - How is pricing holding up?.)
Our Global Hotels and Luxury Goods teams have a weekly tracker that shows occupancy
and pricing trends across key cities around the world (see: Global Hotels & Luxury Goods:
Coronavirus ... leading indicator tracker (week ending 25 October)).
Earnings expectations are still muted, as in both Europe and the US the ERB is still negative
(see Exhibit 40).
-100.00
-80.00
-60.00
-40.00
-20.00
0.00
20.00
40.00
60.00Ja
n-8
8
Jan-9
0
Jan-9
2
Jan-9
4
Jan-9
6
Jan-9
8
Jan-0
0
Jan-0
2
Jan-0
4
Jan-0
6
Jan-0
8
Jan-1
0
Jan-1
2
Jan-1
4
Jan-1
6
Jan-1
8
Jan-2
0
%
Europe: Air Freight & Couriers ERB
-100.00
-80.00
-60.00
-40.00
-20.00
0.00
20.00
40.00
60.00
80.00
100.00
Jan-8
8
Jan-9
0
Jan-9
2
Jan-9
4
Jan-9
6
Jan-9
8
Jan-0
0
Jan-0
2
Jan-0
4
Jan-0
6
Jan-0
8
Jan-1
0
Jan-1
2
Jan-1
4
Jan-1
6
Jan-1
8
Jan-2
0
%
US: Road & Rail ERB
US: Air Freight & Couriers ERB

Source: FactSet and Bernstein analysis Source: FactSet and Bernstein analysis
Retail
For discretionary retail, pricing trends remain challenging. Our European General Retail
analyst, Aneesha Sherman, notes that because of the fragmented and competitive nature
of the market, pricing power of retailers is generally weak and they tend to absorb cost
increases rather than pass them on to consumers. This pressure has been exacerbated due
to the pandemic and, as a result, retailers are choosing to absorb the recent increases in air
freight costs to keep pricing competitive, in an attempt to salvage what sales growth they
can.
For US Softlines & Specialty retail, Jamie Merriman notes the problem of a massive
inventory-to-sales imbalance that built up because of store closures in the spring, which
led to heavy levels of discounting. The situation was worsened by bankruptcies and store
closures, which put a very significant downward pressure on prices as shown in Exhibit 41.
The only few bright spots in the sector are related to luxury, for instance Tapestry recently
noted strong pricing for the Coach brand. However, that was mainly driven by brand-
specific initiatives. Nike has also managed to buck the trend and consistently demonstrated
pricing power despite the pandemic.
0.00
0.50
1.00
1.50
2.00
2.50
3.00
3.50Ja
n-8
8
Jan-9
0
Jan-9
2
Jan-9
4
Jan-9
6
Jan-9
8
Jan-0
0
Jan-0
2
Jan-0
4
Jan-0
6
Jan-0
8
Jan-1
0
Jan-1
2
Jan-1
4
Jan-1
6
Jan-1
8
Jan-2
0
Rati
o
Europe Hotels & Leisure 12m FWD PE - relative
US Hotels & Leisure 12m FWD PE - relative
-100.00
-80.00
-60.00
-40.00
-20.00
0.00
20.00
40.00
60.00
80.00
Jan-8
8Ja
n-9
0Ja
n-9
2Ja
n-9
4Ja
n-9
6Ja
n-9
8Ja
n-0
0Ja
n-0
2Ja
n-0
4Ja
n-0
6Ja
n-0
8Ja
n-1
0Ja
n-1
2Ja
n-1
4Ja
n-1
6Ja
n-1
8Ja
n-2
0
Earn
ing
s R
evis
ions B
ala
nce
, %
Europe: Hotels & Leisure ERB
US: Hotels & Leisure ERB

Source: Haver Analytics and Bernstein analysis
Luxury
Historically, the Luxury sector has enjoyed extremely strong pricing power and was able to
increase prices at a rate that's about 2x higher than the broad CPI index. Going forward,
however, our sector analysts warn against excessive market push and price hikes. They
prefer brands that have an unrealized pricing upside resulting from high consumer
desirability, strong organic growth momentum, and restrained price increases in the recent
past (for more details see: Global Luxury Goods: the “Untapped Price Increase Reservoir”).
The strong pricing power is clearly reflected in the sector valuation — on a 12-month
forward PE basis, the sector trades close to an all-time high valuation relative to the broader
European market and at a 63% premium relative to historical average (see Exhibit 42).
Moreover, the ERB has recently crossed into net upgrade territory, indicating increasing
consensus optimism for the sector's earnings prospects (see Exhibit 43).
-10%
-8%
-6%
-4%
-2%
0%
2%
4%
6%Ja
n-1
0
Jan-1
1
Jan-1
2
Jan-1
3
Jan-1
4
Jan-1
5
Jan-1
6
Jan-1
7
Jan-1
8
Jan-1
9
Jan-2
0
Yo
Y C
han
ge
in A
pp
are
l CP
I %

Source: FactSet and Bernstein analysis Source: FactSet, IBES, and Bernstein analysis
Portfolio implications
The conclusion from this is that there may be pockets of price increases that emerge in
certain sectors before it shows up in overall CPI. Moreover, for cyclical sectors within a
Value universe, these price increases could provide a specific impetus in 2021. We address
this in the chapters devoted to the Value factor.
0.00
0.50
1.00
1.50
2.00
2.50Ja
n-8
8
Jan-9
0
Jan-9
2
Jan-9
4
Jan-9
6
Jan-9
8
Jan-0
0
Jan-0
2
Jan-0
4
Jan-0
6
Jan-0
8
Jan-1
0
Jan-1
2
Jan-1
4
Jan-1
6
Jan-1
8
Jan-2
0
Rati
o
-80.00
-60.00
-40.00
-20.00
0.00
20.00
40.00
60.00
Jan-8
8
Jan-9
0
Jan-9
2
Jan-9
4
Jan-9
6
Jan-9
8
Jan-0
0
Jan-0
2
Jan-0
4
Jan-0
6
Jan-0
8
Jan-1
0
Jan-1
2
Jan-1
4
Jan-1
6
Jan-1
8
Jan-2
0
Earn
ing
s R
evis
ions B
ala
nce
, %

◼ The financial reality post Covid-19 is the attractiveness of different kinds of return
streams being thrown into sharp relief. Nowhere is this more apparent than in the
relative merits of duration in equity and fixed income markets. This underlies a need to
overweight Growth (especially Tech/Healthcare) and also Consumer Staples sectors
when viewed from a cross-asset perspective.
◼ While the Covid-19 crisis has accelerated the long-running fall in discount rates, we
think it has brought a profound change in the policy response and, hence, inflation. An
outlook of (eventually) rising inflation, but with real rates locked low would be a break
from recent decades where both inflation and real rates have fallen.
◼ We compare the fair value of four different types of assets: (1) high-growth equities,
(2) Consumer Staple equities, (3) 10-year bonds, and (4) 10-year TIPS — assuming a
simple model where the equity assets are able to generate different levels of positive
real growth.
◼ In our stylized model, an outlook of inflation rising to 3% but with no change in real
rates would lead to the value of Staples rising by 12% and the value of a stylized
Growth stock rising by 27%. TIPS would see essentially no change in value and the
return on 10-year government bonds would be -17.5%.
◼ Of course, this depends on a macro outlook that is very different from the recent past.
What justification can there be for this? We think this rests on the need that
governments have to keep the cost of debt below the growth rate and also reflects the
fragile nature of inflationary pressures when unemployment is likely to remain very
high.
◼ The investment case made in this chapter really comes into its own when equity
sectors are considered from a cross-asset perspective. So far, there has been no
material flow into equities and out of high-grade fixed income post Covid-19. That can
be rationalized in the context of a short-term outlook that is very uncertain and that we
are still in the midst of a deflationary shock. We think these flows will, however, be large
on a multi-year horizon.
The post Covid-19 outlook for investment is one that is likely to throw the attractiveness of
different kinds of return streams into sharp relief. In a sense, this just carries on the trend
that was in place for years before, with yields falling and long-duration assets seeing an
advantage as a result. But in one crucial way we think that the policy environment has
changed. We think that inflation is set to rise — once we are past the current deflationary

shock — but that rates will not rise in response. If this is correct, then it causes a major
change in the way we think about long-horizon cash flows.
Maybe the point is so obvious as to be trivial, but an outlook where real yields stay low or
even fall further while inflation rises drives a wedge between different kinds of long-
duration assets. It means that long duration in equities is attractive, but long duration in
traditional fixed income is not.
Why the regime is different
This position rests on the assumption that inflation can indeed rise and that rates do not
rise by a commensurate amount in response, as we have discussed in earlier chapters. On
balance, the reason to really believe in inflation is more to do with the pollical economy than
macroeconomics. We are in an environment of a blend of macro and fiscal policy, and policy
decisions can be engineered to create inflation, even stopping well short of policies such
as MMT.
However, if that inflation outlook is fragile — and the failure of prior QEs to achieve that
suggests that it is — then rates are likely to stay low as inflation rises. Moreover, given the
scale of debt, governments will be incentivized to keep the cost of debt below nominal
growth rates. Thus, we think rising inflation will not be met by rising rates. We have already
seen some of this in the Fed's move to inflation averaging, but ultimately more steps can be
made to ensure market yields remain capped.
Two types of long duration in equities
Two types of equity assets stand out as being attractive when viewed in this light from a
cross-asset perspective. These are Growth equities that offer high real growth rates far into
the future but with low payout ratios. The second group are the core candidates as "fixed
income replacement" in the form of Consumer Staple companies.
Later in this Blackbook, we show how the case for US growth stocks still remains. It is
predicated on two observations: (1) that real rates remain anchored low and (2) that the
longevity of growth for high-growth firms has increased.
Currently, the US Consumer Staples sector offers a 2% premium in dividend yield
compared with the US 10-year government bond — the highest level ever. While this
spread has been positive for more than a decade, we think currently the yield advantage of
Staples is particularly important, given the extremely low government bond yields that
would imply significantly negative real returns if inflation reaches or exceeds the Fed's 2%
inflation target. Moreover, bonds are currently facing the highest duration risk in history.
Thus, we do not think they would be able to diversify equity risk as effectively as they have
historically, if we see a sustained period of high inflation. Meanwhile, as shown in
Exhibit 46, Consumer Staples historically had a very attractive return-risk profile in periods
where US inflation was above 3%.
Equity duration good, bond duration bad
In the following section, we present the sensitivity analysis of bonds and equities to
changes in inflation and real rates.

For bonds, we disaggregate the nominal interest rate into real yield and inflation, and model
the impact on the present value of each, of the semi-annual cashflows and the principal.
For the generic US 10-year government bond, we assume an annual 0.625% coupon, while
for the 10-year TIPS we assume the coupon (starting at 0.125%) and the principal increase
is in line with rising inflation. For the equity analysis, we explicitly model the first 20 years of
cash flows. As a starting point, we begin with the current dividend yield for Consumer
Staples and Tech sectors and assume it grows in line with the real consensus long-term
earnings growth expectations averaged over the last 10 years. We also assume that any
increases in inflation are fully passed on to earnings growth. We also assume that the real
growth component starts to decline after year 10 and converges to the long-term terminal
growth rate by year 20. For the terminal value calculation, we fix the r-g term to 2% to
prevent the cases where r > g. The Equity Risk Premium is calculated as 12-month forward
earnings yield – (real risk free rate + inflation) and for the cost of debt, we use the real risk-
free rate + inflation + 1.35% credit spread.
For Exhibit 44 to Exhibit 47, we rebase the value to 100 in a scenario where inflation is at
1% and the real rate is at 0%, and show what happens to the price of the four assets with
varying levels of inflation and real interest rates. For example, if inflation were to rise to 3%
while the real rate remained at 0%, it would imply a 17.5% drop in the price of 10-year
government bonds, the value of TIPS would remain unchanged, while the value of Staples
and a stylized Growth stock would increase by 12% and 27%, respectively. We note this
assumes the equities are able to offer a perfect pass-through of inflation. This could be
questioned and, hence, the scale of the upside; but, any ability to offer positive real growth
would support the multiples.
Source: FactSet, Bloomberg, and Bernstein analysis
Source: FactSet, Bloomberg, and Bernstein analysis
1 2 3 4 5
0 100.00 90.83 82.55 75.08 68.33
1 90.83 82.55 75.08 68.33 62.23
2 82.55 75.08 68.33 47.21 56.72
3 75.08 68.33 62.23 56.72 51.73
4 68.33 62.23 56.72 51.73 47.21
Inflation
Real R
ate
1 2 3 4 5
0 100.00 100.00 100.00 100.00 100.00
1 90.56 90.56 90.56 90.56 90.56
2 82.06 82.06 82.06 82.06 82.06
3 74.39 74.39 74.39 74.39 74.39
4 67.48 67.48 67.48 67.48 67.48Real R
ate
Inflation

Source: FactSet, IBES, and Bernstein analysis
Source: FactSet, IBES, and Bernstein analysis
Conclusion
The emerging new policy regime makes applying experience of the last 40 years somewhat
harder. However, we would argue there are strong reasons to suppose that governments
will be incentivized to manufacture inflation while keeping real rates low. The ability of some
assets to generate positive real returns is, of course, then crucial.
The main conclusion is that in such a world, equity exposure is desired — be it public or
private equity. Dividends can usually at least keep pace with inflation. Long-duration equity
assets are then especially favored. This is not to say there isn’t a role for other equity
exposures too. For example, commodity cyclicals also offer attractive income and
incorporate an inflation hedge. Likewise, there is such a thing as long-duration Value
companies — these can be thought of as turnaround stories.
The investment case made in this chapter really comes into its own when equity sectors are
considered from a cross-asset perspective. There was a belated flow back into equities at
the end of 2020, making up for the outflows earlier in the year. However, there has not been
evidence of a strategic reallocation into equities and out of high-grade fixed income post
Covid-19. That can be rationalized in the context of a short-term outlook that is very
uncertain and that we are still in a deflationary shock. We think these flows will, however,
be large on a multi-year horizon.
1 2 3 4 5
0 100.00 105.78 111.83 118.16 124.77
1 89.45 94.64 100.07 105.76 111.71
2 80.13 84.79 89.67 94.79 100.14
3 71.88 76.07 80.47 85.07 89.89
4 64.59 68.36 72.31 76.46 80.80
InflationR
eal R
ate
1 2 3 4 5
0 100.00 112.67 126.88 142.78 160.57
1 95.40 107.47 120.99 136.14 153.09
2 91.02 102.52 115.41 129.84 145.99
3 86.87 97.83 110.11 123.86 139.24
4 82.93 93.37 105.07 118.18 132.84Real R
ate
Inflation

We set out a longer-term, strategic view of sector allocation post Covid-19. This is not only
a question of the "fundamentals" in each sector, but also depends on the macro outlook
and a set of very different investor needs. These more macro forces acting on long-term
sector relative performance are:
◼ The reaction function of fiscal and monetary policy having changed and real rates are
likely to remain low or negative for a long time.
◼ Likely other strategic policy shifts, e.g., on tax, the bargaining power of labor, and
tolerance of buybacks (looking more broadly than the recent US election).
◼ Valuation spreads at extreme levels, but for some parts of the market mean reversion
likely broken.
◼ The changed demands of investors. The prospect of low real returns, less
diversification, and higher inflation means the strategic sector outlook is likely to be
shaped by cross-asset investors, rather than narrowly only considering equity
investors.
This leaves us with the following strategic sector allocation:
◼ Tech, Healthcare, and Growth Consumer Cyclicals — overweight: Persistent low
discount rates and a greater persistence of superior growth means long duration
within the equity market remains attractive.
◼ Consumer Staples — overweight: From a cross-asset perspective, this offers a
sustainable income stream. This is attractive now that fixed income is less "risk free."
Moreover, this sector has a good claim of offering exposure to positive real growth.
◼ Consumer and Industrial Cyclicals — selective overweight: Record wide valuation
spreads and the prospect of increased inflation has historically meant that some Value
stocks get a bid. Selective stocks in these sectors should be able to react positively to
the valuation and inflation stimuli.
◼ Energy and Mining — selective overweight: Commodity cyclicals are also candidates
to respond positively to higher inflation. Moreover, after a dividend reset in some cases
they are likely to be part of an income trade.
◼ Banks — long-term underweight, possible tactical opportunities: Although increases
in inflation tend to help banks, historically such episodes have also seen the yield curve
steepen. We think the yield curve will not rise to a usual degree as inflation rises, and

this tempers the macro case for relative outperformance. There may well be a tactical
case to own Banks as inflation starts to rise, but over strategic horizons that outlook is
less attractive.
◼ Real Estate — underweight: In theory, higher inflation and low real rates would help.
But correlation of REITS with equities increases with inflation and equity allocations
have to increase already. Moreover, parts of the sector likely face some severe
fundamental headwinds.
Looking beyond the tactical uncertainties of Covid-19, how should investors position within
the equity market from a strategic perspective? We interpret this as a forecast over a three-
to-five-year forward horizon This is not just a question of opining on what sector business
models may happen to win out as the world adjusts to the world post Covid-19. We think
long-run equity sector positioning has to be assessed across several dimensions, some of
which are linked to the macro policy outlook and some to how the demands of investors will
change post Covid-19. It is the confluence of these forces that will shape relative sector
performance in the long run. Specifically:
◼ Long-term path of rates, inflation, and changing reaction function of monetary and
fiscal policy.
◼ Other policy decisions on tax, power of labor, and tolerance of buybacks.
◼ Earnings path/"fundamentals" for sectors.
◼ Valuation spreads are at extreme levels, and while valuation tends to be swamped by
other factors it matters more over strategic horizons. How much of these valuation
spreads can mean revert?
◼ Also, there are the changing needs and demands of investors that will shape the long-
run sector outlook. Long-term asset owners face new challenges post Covid-19 that
changes how they should view sectors. Also, ESG investing is likely to grow.
We think real rates will stay low for an extended period and that the policy response to
Covid-19 will be inflationary. We write about this in detail in the "Inflation, Investing, and the
coming of MMT" chapter. Moreover, the whole policy reaction function has changed. This
is evident in the recent Powell speech laying out an "averaging" approach to inflation
targeting, but we think goes further than this and moves to a combination of fiscal and
monetary policy and, hence, a shift away from the macro framework of the last 30 years.
It seems likely that over strategic horizons post Covid-19, the evolution of policy sees a
reaction against the shareholder-first capitalism of the last 30 years. The forces against
this were already mounting before the pandemic, but permanently higher unemployment
and sharply increased inequality increase the pressure for this. The outcome of the US
election will clearly have an impact in the near term, but thinking beyond the current
election cycle and also beyond the shores of the US, a few large trends stand out. Tax rates
seem destined to be going up globally and for a long time, given deficits. It also seems likely

that various policies will shift bargaining power back to labor. This could be through
increases in minimum wages, but also eventually though programs such as UBI, which we
think will be adopted by some developed countries in due course. This could clearly
influence labor-heavy industries where pay levels are lower. We also think there may be
questioning of the whole model of levering up corporate balance sheets in order to engage
in buybacks and whether that is a good idea and whether it is even acceptable. This also
has sector implications.
Investor needs also seem likely to change. With real returns likely lower, greater difficulty in
finding income, and less diversification between stocks and bonds, mean many equity
sectors may now need to be observed from the point of view of a cross-asset investor
rather than just from the narrow point of view of an equity mandate. Thus, sectors that do
well as inflation rises, those that have a case for delivering sustainable dividends, and those
that give long-term access to real growth are likely to see a bid as assets shift out of high-
grade fixed income over a period of years. A significant part of this capital will flow to non-
listed assets, but the equity market will probably have to absorb a lot of this flow, given its
size and limits to how much of the private asset universe can be easily accessed for many
investors.
The other change in investor demand is likely to come from ESG. ESG is here to stay and it
will likely grow, although figuring out exactly what it means (and how to get paid for doing
it) will take more time. We think much of the active management approach to ESG will focus
on engagement, that lends itself more to stock-level investing rather than broad sector
conclusions. However, the implication is also that there is likely to be a shift away from
buying companies that are already "good" toward those that have a runway to improve.
Though at the same time cheap passive implementation (smart beta for ESG) will likely also
allow asset owners to buy into big themes (e.g., decarbonization).
So, where do these views leave us?
Tech, Healthcare, and Growth Consumer Cyclicals
The confluence of real rates anchored low for a long time with greater persistence of
growth and profitability for high-growth and high-profitability companies means long-
duration sectors within the equity market can maintain a high level of valuation. Yes, the
valuation of Growth stocks in the US has risen above average relative levels of the last
decade, but the valuation spread of high- vs. low-growth stocks is still far from being at
historical extremes (see Exhibit 48). We showed in the "Why US Growth Can Continue to
Shine" chapter that for our group of sustainable growth names we can justify today's
absolute valuation levels, given the current level of rates and the observed level of
persistence of growth. Moreover, on a relative basis, our group of sustainable growth
names actually trade at a discount to the broader market, in part because of the collapse of
forward earnings for parts of the cyclical space (see Exhibit 49). Our sustainable growth list
is overweight Tech/Communications and Healthcare; it also has exposure to some of the
more growth areas of Consumer Cyclicals.

Source: FactSet, IBES, and Bernstein analysis Source: FactSet, IBES (estimates of January 2022 EPS), MSCI, and Bernstein
analysis
In addition to justifying the valuation of Growth stocks, there is also a question of demand.
The main source of demand for equities for the past 10 years has been corporates
themselves through buybacks. While buybacks are currently suppressed, when they
bounce back, Tech seems likely to lead in this regard. Moreover, if antitrust concerns make
it hard for them to do significant M&A, that would also support the ability to do buybacks.
The macro risk for Growth names is from a change in policy regime, i.e., a move to tighten
perceived quasi-monopolies, deglobalization, and tax. Tech and Healthcare are the two
sectors in the US that have benefited most from being able to lower their effective tax rates
over the last decade.
Ecommerce
Short term, our analysts expect a physical retail fight back as markets start to re-open. They
note that the US has 3-5x the retail square footage of most developed markets and lacks
digital aggregators outside of Amazon that can effectively consolidate suppliers and
ensure a frictionless online shopping experience. Moreover, it goes against decades of in-
store buying behavior.
Long term, they continue to like the runway for growth in ecommerce migration — only 8%
of sales took place online globally (ex-China) in 2019. Over the next decade, they expect
penetration rates to approach 25-30% of total retail sales, led by: (1) offline-first
categories such as grocery, apparel, beauty, and furniture moving online; (2) the emergence
of "eShopping," driven by social commerce; and (3) faster adoption of digital channels
abroad, particular in regions such as EMEA, APAC, and LatAm.
0.00
1.00
2.00
3.00
4.00
5.00
6.00
7.00
8.00Ja
n-9
0
Jan-9
2
Jan-9
4
Jan-9
6
Jan-9
8
Jan-0
0
Jan-0
2
Jan-0
4
Jan-0
6
Jan-0
8
Jan-1
0
Jan-1
2
Jan-1
4
Jan-1
6
Jan-1
8
Jan-2
0
Rati
o
US: Composite Growth - 12m FWD PE
US: LTG - 12m FWD PE
0
5
10
15
20
25
30
Jan-9
0
Jan-9
2
Jan-9
4
Jan-9
6
Jan-9
8
Jan-0
0
Jan-0
2
Jan-0
4
Jan-0
6
Jan-0
8
Jan-1
0
Jan-1
2
Jan-1
4
Jan-1
6
Jan-1
8
Jan-2
0
Rati
oUS 12m FWD PE
US Sustainable Growth Median 12m FWD PE

Digital advertising continues to take share from legacy (now at a faster pace), given it's a
better mouse trap with measurable return for advertisers. The size of the addressable
market will likely expand as ecommerce gains and retailers allocate dollars away from
legacy expense buckets (e.g., trade/promo and rent) to digital advertising to drive traffic to
online storefronts. We feel this longer-term total addressable market (TAM) expansion
story often goes underappreciated and can be a significant source of value creation over
time, as many investors view the digital ad market as relatively mature already (~50% online
penetration of current ad spend).
Cloud is expected to be another post Covid-19 winner. Compute needs continue to grow
— IDC has estimated that the global datasphere will grow from 33 zettabytes in 2018 to
175 zettabytes in 2025, implying a 27% CAGR. In a work-from-home world, internet
consumption is up for both personal and professional use. The long-term secular trend of
workload migration to the Cloud will accelerate on the back of Covid-19, as CIO budgets
are put under pressure. With wallets tightening, we expect risk constraints to loosen, and
cost to become the primary driver, which should inflect up the workload migration rate as
macro pressures abate.
Regulation remains the key threat to Tech outperformance and the growth narrative.
Amazon, Facebook, and Google are all in the spotlight and face multiple investigations
spanning across antitrust and privacy that could come to fruition in early 2021. Antitrust
focus on Facebook, Amazon, Apple, Netflix, and Alphabet (FAANG) means that big tech
companies face constraints on the M&A front (particularly consumer-facing deals). This is
concerning to longer-term investors that worry about big tech's ability to defend against
disruptive technologies — if they struggle to innovate and can't buy, how effective are they
at fending off competition? The flipside to this is that it offers some near-to-medium term
support for steady and growing buybacks — there's only so much capital these businesses
can/will deploy organically, and cash balances remain high (at unattractive yields).
See the "Why US Growth Can Continue to Shine" chapter for more details on this.
Consumer Staples
We think viewing the Staples sector through a cross-asset lens makes the most sense, both
from the ability of the sector to deliver an income stream and from its claim to be able to
deliver positive real growth in the long term. Thus, we discuss this sector in more detail in a
separate chapter.
The spread between dividend yields in the sector with bond yields has never been wider.
Unlike more cyclical or Financial sectors, there is evidence that Consumer Staples
companies can maintain this level of dividend and also see it grow in real terms. The
pushback against Staples being seen as part of a replacement for fixed income is that
single-equity securities are more "risky." Yes, in a sense that remains the case, but elements
of this are less clear than they perhaps were historically. The duration and, hence, interest
rate risk of high-grade fixed income is higher than it has ever been before; fixed income is
likely to be a less-good diversifier of equity risk. Also, in an age when elements of MMT-like
policies are on the table and the age of "pax Americana" is over, it is not even clear if there
is such a thing as risk-free assets.

If we are right in our call that inflation is set to rise in coming years, then Consumer Staples,
along with Healthcare tends to be the sector with the best return-risk trade off (we note
that Exhibit 50 unfairly punishes Tech, as for most of this period the sector was very
different from how it looks now).
Source: Datastream and Bernstein analysis
Cross-asset investors are going to seek exposure to assets that can make a claim to have
exposure to positive real growth. As an example, in the case of beverages, our fundamental
analysts see two sources of real long-term growth: (1) volume growth in emerging markets
where per capita consumption is low and (2) trading up in virtually every category and every
geography, but especially in premium spirits and to a lesser extent premium beer. Like-
pricing is harder to achieve; relatively strong in emerging markets with fragmented mom-
and-pop retailers and in the US thanks to the three-tier system, but harder in Europe, with
its very concentrated grocery retail landscape. However, beverage alcohol at least has
inherently low private label penetration.
In the case of the US Food producers, our fundamental analysts would also be looking for
names that are likely to deliver real long-term growth in emerging markets (such as
McCormick and Mondelez), or those that are in categories tied to shifting consumer trends
in the US (again McCormick, given its alignment with health and wellness trends), or those
in the faster-growing snacking category, where even more indulgent snacking options
seem to garner relatively robust pricing power due to low private label exposure
(particularly Hershey). Given recent stock moves and valuation, we currently rate Mondelez
Outperform, and Hershey and McCormick Market-Perform, but these would all be
candidates for delivering positive real growth over the longer term. However, we would at
present steer clear of those US-centric food names in meal-based and more heavily-
processed food categories (General Mills, Kellogg, Campbell Soup, and Smucker’s) — they
have benefited from the pandemic and the shift to at home food consumption, but may
Industrials
MaterialsCons Cyclicals
Cons Staples
Energy
Banks
Insurance
Healthcare
Real Estate
Technology
Telecoms
Utilities
-6.00
-4.00
-2.00
0.00
2.00
4.00
6.00
8.00
0.00 2.00 4.00 6.00 8.00 10.00 12.00 14.00 16.00 18.00 20.00
Re
lati
ve
Re
turn
Risk
US Inflation >3%

come under more fundamental pressure over the medium to long term as the consumer
and retailer trends that prevailed before the pandemic reassert themselves. We discuss this
with our sector analysts in our "The Cross-Asset Case for Staples" chapter.
Consumer and Industrial Cyclicals
As we showed earlier, there exists an unprecedented valuation spread across the equity
market at present. So, one of the most controversial questions is: Can this valuation spread
close? Will mean-reversion be a driver of sector returns? There are structural reasons why
valuation has not worked as a factor in recent years, such as declining bond yields impeding
mean-reversion and the switch of corporate investments from tangible to intangible assets,
but one key missing piece has been inflation. We show in Exhibit 51 that over the last 90
years, the Value factor has done best when inflation has risen. Inflation has persistently
disappointed on the downside over the last five years. If inflation is now set to rise, is this
the key support for Value that has been lacking? If so, should one be buying the cheaper
Value sectors?
Source: Ken French data library, Datastream, and Bernstein analysis
We think there has to be a differentiation between different kinds of Value trades. Perhaps
the easiest case to make is for "undervalued," as opposed to simply being low multiple,
industrial, and consumer cyclicals. Companies in these sectors that are on a large cyclical
discount but have a good case that they can avoid bankruptcy either through sufficient
liquidity or restructuring could be part of a tactical recovery in line with an earnings
improvement in 2021, but also may derive support from longer-term recovery in inflation
expectations. Thus, an eventual recovery means that a Value position can be taken in
selected subsectors, e.g., airlines and hotels. Also in the Industrials are a group of
automation names that we think have a structural case for growth. As deglobalization is
likely to be a feature, then activity that is re-onshored is likely to be heavily automated.
-15
-10
-5
0
5
10
15
20
25
US CPI US value 10-year rolling return

We can overlay a fundamental perspective on these subsectors as well; for more details
see The Day After Blackbook. For Hotels, our sector analysts expect leisure travel to
ultimately recover to its long-term growth trajectory, driven by structural tailwinds such as
aging population, rising middle class, preference for experiences vs. things, as well as
recovery in flight capacity. They see business travel as more at risk.
Within automation, our analysts expect a significant positive shift in sentiment toward
greater adoption of automation as a result of Covid-19. During the pandemic, not only were
supply chains and operations severely disrupted by workers falling ill and factory
lockdowns, there have also been sharp increases in absenteeism and worker turnover as
factory operations resumed. Increased demand for re-onshoring of operations will also be
a tailwind for greater automation demand, boosted by the re-acceleration of manufacturing
wage growth in China. The loss of skilled workers could be mitigated by labor productivity
enhancing technology. The analysts expect automation adoption to develop along two key
lines — unmanned factories as a model for big and advanced manufacturers, and smaller-
scale human-machine collaboration robots that enable automation at a more granular level.
Our airline sector analysts expect travel demand to be shaped by the ability to travel and
the economy's ability to afford travel post the Covid-19 recession, but ultimately they
expect travel demand to return. They also expect meaningful reduction in capacity of up to
25% in Europe over the next two years. This would mark a significant change from previous
cycles where capacity cuts by airlines exiting the industry were quickly backfilled by
incumbents.
Energy and Mining
A second area of Value cyclicals that we think could benefit from inflation and from long-
run mean-reversion are the commodity cyclicals. For investors who think the inflationary
effects of the policy response to Covid-19 will be sooner rather than later, there is a case
to overweight these sectors from now.
There has been a painful downward adjustment of dividend levels in some cases, but
assuming the greater capital discipline of recent years can be maintained, the level of
dividend yield now prevailing in the sector also leaves them looking attractive from a cross-
asset income perspective (see Exhibit 52).

Source: FactSet and Bernstein analysis
Banks
And then there are the banks. One of the issues of outlining a case for Value as a factor is
that there is possibly a disconnect between the Financials and non-financials part of the
factor. Banks have tended to respond very well to increases in inflation historically, along
with the broader Value factor. However, the crucial difference is that usually increases in
inflation are either accompanied by or subsequently followed by a steepening of the yield
curve. This time we do not think that an increase in inflation will be met by a steepening of
the yield curve. The shift in policy already announced makes it clear that rates will stay low
even if inflation rises. Moreover, that policy could be further adapted to more tightly control
the yield curve if need be.
We can also see empirically that in the last couple of months inflation expectations have
moved up but the yield curve out to 10 years has remained flat, only steepening at the 10Y-
30Y maturities. Unstitching the effects of inflation and the curve on Financials in general is
hard, especially if we are right in the assumption that we now face a very different monetary
and fiscal policy regime. We show in Exhibit 53 that relative performance of the banks have
a close relationship to the yield curve in addition to their link to inflation.
In Exhibit 54 and Exhibit 55, we show the result of a very simple bivariate regression where
we plot relative returns of banks vs. the market against contemporaneous changes in
inflation and the 3M-10Y curve. It depends how inflation is measured; inflation
expectations measured via breakevens are equally significant to the yield curve, but
realized inflation loses its significance when the yield curve is included in the specification.
Looking across both these specifications together, we would conclude that while inflation
may provide support, the yield curve is very significant. So, at the very least, without a
steepening curve, the impact of higher inflation is likely to be muted. The question we are
0
0.2
0.4
0.6
0.8
1
1.2
1.4
1.6
Jan-8
8
Jan-8
9
Jan-9
0
Jan-9
1
Jan-9
2
Jan-9
3
Jan-9
4
Jan-9
5
Jan-9
6
Jan-9
7
Jan-9
8
Jan-9
9
Jan-0
0
Jan-0
1
Jan-0
2
Jan-0
3
Jan-0
4
Jan-0
5
Jan-0
6
Jan-0
7
Jan-0
8
Jan-0
9
Jan-1
0
Jan-1
1
Jan-1
2
Jan-1
3
Jan-1
4
Jan-1
5
Jan-1
6
Jan-1
7
Jan-1
8
Jan-1
9
Jan-2
0
Ratio
World: Energy relative PBK World: Mining relative PBK

asking here is where to allocate capital across the market rather than on an absolute basis.
So, on that basis, we would prefer to buy the other parts of Value to gain exposure to mean-
reversion, but not the banks.
In addition to this, there is also the point about bankruptcies. We think there is an extended
bankruptcy cycle still to come. It has been blunted by policy support, but at some point it
still needs to happen. We also worry that ultimately banks may not be able to be masters of
their own destiny, given their key role in directing credit. Thus, on balance we want to
underweight the banks.
Source: GFD, Datastream, and Bernstein analysis
Note: The y variable for the linear regression was YOY returns of the US
Datastream Banks index relative to the Datastream US market index and the x
variables the YOY change in US CPI inflation rate and the YOY change in the
yield curve defined as the spread of the 10-year US sovereign bond yield to
three-month US Treasury bill yield. The data was monthly frequency over the
most recent 10 years.
.Source: Datastream and Bernstein analysis
Note: The y variable for the linear regression was YOY returns of the US
Datastream Banks index relative to the Datastream US market index and the x
variables the YOY change in US 10-year breakeven spread and the YOY
change in the yield curve defined as the spread of the 10-year US sovereign
bond yield to three-month US Treasury bill yield. The data was monthly
frequency over the most recent 10 years.
Source: Datastream and Bernstein analysis
-5
-4
-3
-2
-1
0
1
2
3
4
5
6
-60
-40
-20
0
20
40
60
01/0
1/1
974
01/0
7/1
975
01/0
1/1
977
01/0
7/1
978
01/0
1/1
980
01/0
7/1
981
01/0
1/1
983
01/0
7/1
984
01/0
1/1
986
01/0
7/1
987
01/0
1/1
989
01/0
7/1
990
01/0
1/1
992
01/0
7/1
993
01/0
1/1
995
01/0
7/1
996
01/0
1/1
998
01/0
7/1
999
01/0
1/2
001
01/0
7/2
002
01/0
1/2
004
01/0
7/2
005
01/0
1/2
007
01/0
7/2
008
01/0
1/2
010
01/0
7/2
011
01/0
1/2
013
01/0
7/2
014
01/0
1/2
016
01/0
7/2
017
01/0
1/2
019
01/0
7/2
020
%%
US Banks Relative, yoy US Yield Curve (10y-3m) (RHS)
Yield
Curve CPI Intercept
Coefficient 5.05 -6.29 -0.78
se 1.89 2.19 1.19
t-stat 2.68 -2.88 -0.65
Rsq 0.17
Yield
Curve
10y
Breakeven Intercept
Coefficient 6.27 12.29 -0.01
se 1.73 3.18 1.17
t-stat 3.63 3.86 -0.01
Rsq 0.21

Real estate
We are also underweight real estate. In theory, being told that a period of higher inflation is
coming and that real returns are low would usually lead one to allocate a much higher
exposure to real estate. Exhibit 56 shows that the returns from real estate and REITS
conditioned on inflation tend to be higher when inflation goes up.
However, we think asset owners are going to be forced to strategically hold a higher equity
exposure if the prospect of real returns elsewhere is low and inflation rises. If bonds are no
longer an effective diversifier, then other parts of the total portfolio will also be needed to
help diversify the overweight equity position. REITS see a correlation with equities that rises
with inflation and, thus, are unlikely to be good diversifiers.
In addition, we would point out that the fundamental outlook for large parts of the real
estate sector with exposure to central city office spaces and retail malls looks strategically
unattractive post Covid-19.
Note: The chart shows Real Estate and REITS returns in different inflation regimes, as well as the correlation with US equities.
Real Estate Index returns are from Robert Shiller's database. Returns for REITS are from 1974.
Source: Robert Shiller's database, Datastream, and Bernstein analysis
Factor and asset performance in different inflation regimes
Since 1970
US REITS,
yoy
Real Estate
Index, yoy
<-1 -37.47 -9.25
-1 to 0 -11.10 -4.34
0 to 1 3.67 3.95
1 to 2 17.71 5.37
2 to 3 22.50 4.26
3 to 4 21.90 4.68
4 to 5 4.20 4.04
>5 9.41 8.00
Correlation of assets to equities as inflation rises
Since 1970REITS
Real Estate
Index
<1 0.32 0.22
1-2 0.39 -0.03
2-3 0.33 -0.08
3-4 0.44 -0.10
4-5 0.49 0.02
>5 0.62 0.00


◼ Two guiding principles seem likely to be key for medium-term investing. First,
investors are going to have to work harder to find sources of income, with high-grade
bonds no longer serving that purpose. Second, investors will need to find assets that
can deliver positive growth in real terms. In this chapter, we show that sectors such as
Beverages, Tobacco, Food, and HPC can perform such a role in portfolios. This is not
really an equities chapter, the strongest case for these sectors lies in their position in
a cross-asset context.
◼ The dividend yield spread of Staples over bonds has reached an extreme level. Yes,
earning income this way is more risky, but the risk in government bonds has increased
massively too — they have longer duration than ever before, and the current fiscal
expansion implies that government debt may not be risk-free. Holding Staples stocks
for income can be offset by other portfolio holdings for diversification, liquidity, and
risk, e.g., gold.
◼ Investors need to allocate more to real assets. We think equities can be seen in this
light, as long as they are shorn of the engineering of the last decade of increased
leverage to undertake buybacks. The nature of the Staples sector lends them to being
thought of as real assets, given the ongoing demand for their products whatever the
shape of the business cycle.
◼ Staples are relatively long duration compared to other equities, but much less so than
bonds. Moreover, we show that historically they have achieved the best returns per
unit risk in higher inflation regimes of any equity sector — in short, they have pricing
power.
◼ Long-term consensus expected earnings growth for some subsectors within Staples,
e.g., Beverages, have fallen to the 0-2% range in real terms. Close to zero real growth
seems overly pessimistic for a business that sells booze. Moreover, these growth rates
are well below historical achieved CAGR.
◼ This chapter is mainly for the medium term. More tactically, the record high valuation
on the S&P, we think, implies a lot of volatility to come. So, in the short term, Staples
can be thought of as part of a downside protection strategy, given their low beta.
◼ The bottom line is that we think there is a place for an overweight position on
subsectors within Consumer Staples within a cross-asset portfolio right now.
Once we get beyond the immediate uncertainty of the path of the economy over 2021, two
guiding principles seem likely to be key for medium-term investing. First, investors are
going to have to work harder to find sources of income, with high-grade bonds no longer

serving that purpose. Second, investors will need to find assets that can deliver positive
growth in real terms. In this chapter, we show that sectors such as Beverages, Tobacco,
HPC, and Food Producers can perform such a role in portfolios. We stress upfront that
despite being about specific subsectors and stocks, this is not really an equities chapter at
all. We are not particularly interested in the case for these sectors vs. other sectors in the
market. We think the really important issue is the role of these sectors in a cross-asset
context.
The core of this chapter is the confluence of several factors:
◼ Investors will need income-paying assets, not least as the price appreciation of
financial assets in recent years and in 2021 in particular makes further significant
price appreciation from here very policy-dependent. Assets that deliver a positive real
income are in short supply.
◼ Investors need more real assets in their portfolios. These are usually thought of as
physical assets or rights to the income from a real economy service (e.g., delivering
power). But stripped of the financial engineering of the last decade, we think equities
can be thought of as real assets too. The nature of what sectors such as Beverages,
Food, Tobacco, and HPC deliver seems to lend itself well to this. Their revenues may
not be able to perfectly keep up with real GDP growth or inflation indefinitely, but they
can do so much more effectively than many of the other potential assets that investors
can buy.
◼ The consensus expected long-term annual growth rates for some of the subsectors
within Staples have fallen to 0-2% in real terms. This seems very low given the "Staple"
nature of their main products. Moreover, this is far below historical achieved growth
rates. Long-term EPS forecasts are, by their nature, not something that are enough to
base an investment thesis on alone, as the quality of such numbers is poor. But such
low forecasts are striking for sectors that sell products such as alcohol!
◼ The dividend yield spread for these sectors over bonds has never been greater. Yes,
an individual Beverages or HPC stock is a more risky asset than a 10-year sovereign
bond. But the risk of the 10-year bond has gone up too — the duration of high-grade
bonds is greater than it has ever been before, meaning they carry unprecedented
interest rate risk; their diversifying properties vis-a-vis equities are declining, and the
massive increase in government debt implies they are probably not really risk free.
◼ We think investors need inflation protection in the medium term. Whether the current
policy response to Covid-19 will be inflationary or not is a point of intense debate. We
cover the case for and against that elsewhere, but whatever one's view on this point,
the risk of inflation has risen and the ability to protect from it should be worth more.
We can show that the Staples sector has delivered better risk-adjusted returns than
other sectors when inflation is elevated.
The yield advantage
With government bond yields across the world hitting new lows, the need for yield remains
one of the dominant issues in investors' minds. We have recently noted that in an

environment where bond yields are close to zero or even negative, the best source for
sustainable yield might actually be in equities (see our "The Best Fixed Income Portfolio
Right Now Is…in Equities" chapter). Consumer Staples have always been regarded as a
good source of stable and secure dividend yield and as a close substitute for bonds.
However, as we show, the sector's advantage over fixed income yields is now as great as
ever. Next, we show the spread between dividend yield of Consumer Staples sectors and
the 10-year government bond yield. All sectors, both in Europe and the US, now offer a
significant dividend yield premium, and in most cases it is the highest spread over the last
30 years.
Exhibit 57 and Exhibit 58 show the respective yield spread between the dividend yield from
the Staples subsectors in Europe and the US and the corresponding 10-year bond yield.
The outlook for dividends is in flux, given the massively uncertain nature of the economic
outlook. However, even a 30-50% cut in dividends from here (which we think unlikely)
would still yield a spread right at the top of the 30-year range.

Source: FactSet, Datastream, and Bernstein analysis
-8.00
-6.00
-4.00
-2.00
0.00
2.00
4.00
Jan-9
0
Jan-9
2
Jan-9
4
Jan-9
6
Jan-9
8
Jan-0
0
Jan-0
2
Jan-0
4
Jan-0
6
Jan-0
8
Jan-1
0
Jan-1
2
Jan-1
4
Jan-1
6
Jan-1
8
Jan-2
0
%
Europe: Beverages
-8.00
-6.00
-4.00
-2.00
0.00
2.00
4.00
Jan-9
0
Jan-9
2
Jan-9
4
Jan-9
6
Jan-9
8
Jan-0
0
Jan-0
2
Jan-0
4
Jan-0
6
Jan-0
8
Jan-1
0
Jan-1
2
Jan-1
4
Jan-1
6
Jan-1
8
Jan-2
0
%
Europe: Food Producers
-8.00
-6.00
-4.00
-2.00
0.00
2.00
4.00
Jan-9
0
Jan-9
2
Jan-9
4
Jan-9
6
Jan-9
8
Jan-0
0
Jan-0
2
Jan-0
4
Jan-0
6
Jan-0
8
Jan-1
0
Jan-1
2
Jan-1
4
Jan-1
6
Jan-1
8
Jan-2
0
%
Europe: Household Products
-10.00
-8.00
-6.00
-4.00
-2.00
0.00
2.00
4.00
Jan-9
0
Jan-9
2
Jan-9
4
Jan-9
6
Jan-9
8
Jan-0
0
Jan-0
2
Jan-0
4
Jan-0
6
Jan-0
8
Jan-1
0
Jan-1
2
Jan-1
4
Jan-1
6
Jan-1
8
Jan-2
0
%
Europe: Personal Products
-6.00
-4.00
-2.00
0.00
2.00
4.00
6.00
8.00
10.00
Jan-9
0
Jan-9
2
Jan-9
4
Jan-9
6
Jan-9
8
Jan-0
0
Jan-0
2
Jan-0
4
Jan-0
6
Jan-0
8
Jan-1
0
Jan-1
2
Jan-1
4
Jan-1
6
Jan-1
8
Jan-2
0
%
Europe: Tobacco
-8.00
-6.00
-4.00
-2.00
0.00
2.00
4.00Jan-9
0
Jan-9
2
Jan-9
4
Jan-9
6
Jan-9
8
Jan-0
0
Jan-0
2
Jan-0
4
Jan-0
6
Jan-0
8
Jan-1
0
Jan-1
2
Jan-1
4
Jan-1
6
Jan-1
8
Jan-2
0
%
Europe: Consumer Staples

Source: FactSet, Datastream, and Bernstein analysis
What's new about this? After all, the dividend yield minus bond yield charts have been
upward sloping for decades. Why does this matter now all of a sudden? Moreover, income
achieved in the equity market is not directly comparable to income from 10-year bonds, as
-8
-6
-4
-2
0
2
4
Jan-9
0
Jan-9
2
Jan-9
4
Jan-9
6
Jan-9
8
Jan-0
0
Jan-0
2
Jan-0
4
Jan-0
6
Jan-0
8
Jan-1
0
Jan-1
2
Jan-1
4
Jan-1
6
Jan-1
8
Jan-2
0
%
US: Beverages
-7
-6
-5
-4
-3
-2
-1
0
1
2
3
Jan-9
0
Jan-9
2
Jan-9
4
Jan-9
6
Jan-9
8
Jan-0
0
Jan-0
2
Jan-0
4
Jan-0
6
Jan-0
8
Jan-1
0
Jan-1
2
Jan-1
4
Jan-1
6
Jan-1
8
Jan-2
0
%
US: Food Products
-7
-6
-5
-4
-3
-2
-1
0
1
2
3
Jan-9
0
Jan-9
2
Jan-9
4
Jan-9
6
Jan-9
8
Jan-0
0
Jan-0
2
Jan-0
4
Jan-0
6
Jan-0
8
Jan-1
0
Jan-1
2
Jan-1
4
Jan-1
6
Jan-1
8
Jan-2
0
%
US: Household Products
-8
-7
-6
-5
-4
-3
-2
-1
0
1
2
Jan-9
0
Jan-9
2
Jan-9
4
Jan-9
6
Jan-9
8
Jan-0
0
Jan-0
2
Jan-0
4
Jan-0
6
Jan-0
8
Jan-1
0
Jan-1
2
Jan-1
4
Jan-1
6
Jan-1
8
Jan-2
0
%
US: Personal Products
-8
-6
-4
-2
0
2
4
6
8
Jan-9
0
Jan-9
2
Jan-9
4
Jan-9
6
Jan-9
8
Jan-0
0
Jan-0
2
Jan-0
4
Jan-0
6
Jan-0
8
Jan-1
0
Jan-1
2
Jan-1
4
Jan-1
6
Jan-1
8
Jan-2
0
%
US: Tobacco
-8
-6
-4
-2
0
2
4Jan-9
0
Nov-9
1
Sep-9
3
Jul-95
May-9
7
Mar-
99
Jan-0
1
Nov-0
2
Sep-0
4
Jul-06
May-0
8
Mar-
10
Jan-1
2
Nov-1
3
Sep-1
5
Jul-17
May-1
9
%
US: Consumer Staples

the former is "higher risk." However, we made the case recently that this may be less of a
bar now than historically. The need to achieve a positive real return implies that asset
owners probably have no choice but to take more risk, the range of return vs. risk that is
available in capital markets has simply shifted. There has been a migration along the risk
spectrum to take more equity-like risk within fixed income already; also the duration of
high-quality fixed income assets is higher than ever before. We covered this in the "Let's
Play Twister, Let's Play Risk" chapter.
This matters now in a new way because of the need for asset owners to achieve an absolute
level of yield that is positive in real terms, and the danger that stock-bond correlations could
turn positive. Moreover, for the US Staples stocks, it is only in 2019 that the yield spread
has definitively moved significantly higher.
What if inflation rises?
Another important macroeconomic consideration we have been writing about recently is
the possibility of above-average inflation in the medium run. We believe a period of above-
average inflation would be supportive for Consumer Staples performance. As noted in our
previous research, since 1973, during periods when US inflation was above 3%, Consumer
Staples had the most attractive return-to-risk ratio compared to other sectors in those
cases.
Note that real estate, which is often thought of as an inflation hedge, as it represents a claim
on a "real asset" also has high returns, but with much higher volatility. Moreover, we can
also show that the correlation of real estate with equities increases as inflation rises,
making it unattractive from a diversification perspective. Also, the medium-term outlook for
real estate looks horrible from a fundamental demand perspective.
Given the essential nature of the products, if inflation rises we expect Consumer Staples
companies to be able to broadly maintain their pricing power (albeit imperfectly) and to
pass on any raw material or labor costs to consumers more easily compared with other
sectors.
Valuation
The absolute multiples for the Staples sector in the US and Europe are high. But then the
multiple of nearly everything is high. Again, in the context of valuing Consumer Staples
Equity vs. Credit or government bonds, each relative to their own history, the absolute
valuation of Staples is not overly extreme (see Exhibit 59).
Relative to the broader equity market, the multiples of the Staples sector in the US and
Europe are at the bottom end of their respective trading ranges (see Exhibit 60). Note that
this is not about expensive Tech stocks! Far from it, this is more about the collapse in
forward earnings of cyclicals, which has caused a massive rerating for such companies.

Source: FactSet and Bernstein analysis Source: FactSet and Bernstein analysis
Low long-term growth expectations
We are struck by the extremely low long-term growth estimates for the Consumer Staples
industries in Europe and the US. In Exhibit 61 and Exhibit 64, we show the long-term EPS
growth consensus adjusted for the CPI; the last datapoint shows what the real growth rate
would look like if inflation returned to central banks' target of 2%. On this basis, in Europe,
the Beverages, HPC, and Tobacco sectors would have the worst historical growth outlook.
We are particularly surprised by the extremely negative consensus outlook for Beverages
and HPC sectors, as the expectations there have now fallen below the overall European
market. While we can see the case for low expectations for the whole market in light of
potentially one of the worst recessions in history, we struggle to believe that such defensive
and historically recession-proof sectors would offer close to 0% real growth over the long
run.
In particular, in the case of beverage alcohol, we see very two clear sources of real long-
term growth: (1) volume growth in emerging markets, where per capita consumption is low
and (2) trading up in virtually every category and every geography, but especially in premium
spirits and to a lesser extent premium beer. Like-pricing is harder to achieve; relatively
strong in emerging markets, with fragmented mom-and-pop retailers, and in the US, thanks
to the three-tier system, but harder in Europe, with its very concentrated grocery retail
landscape. However, beverage alcohol at least has inherently low private label penetration.
In the case of the US Food Producers, we would also be looking for names that are likely to
deliver real long-term growth in emerging markets, such as McCormick and Mondelez, or
those that are in categories tied to shifting consumer trends in the US (again McCormick,
given its alignment with health and wellness trends), or those in the faster-growing
snacking category, where even more indulgent snacking options seem to garner relatively
0
5
10
15
20
25
30Ja
n-8
8
Jan-9
0
Jan-9
2
Jan-9
4
Jan-9
6
Jan-9
8
Jan-0
0
Jan-0
2
Jan-0
4
Jan-0
6
Jan-0
8
Jan-1
0
Jan-1
2
Jan-1
4
Jan-1
6
Jan-1
8
Jan-2
0
Rati
o
Europe Consumer Staples 12m FWD PE
US Consumer Staples 12m FWD PE
0
0.2
0.4
0.6
0.8
1
1.2
1.4
1.6
1.8
Jan-8
8
Jan-9
0
Jan-9
2
Jan-9
4
Jan-9
6
Jan-9
8
Jan-0
0
Jan-0
2
Jan-0
4
Jan-0
6
Jan-0
8
Jan-1
0
Jan-1
2
Jan-1
4
Jan-1
6
Jan-1
8
Jan-2
0
Rati
o
Europe Consumer Staples 12m FWD PE - relative
US Consumer Staples 12m FWD PE - relative

robust pricing power due to low private label exposure (particularly Hershey). Given recent
stock moves and valuation, we currently rate Mondelez Outperform and Hershey and
McCormick Market-Perform, but these would all be candidates for delivering positive real
growth over the longer term. However, we would at present steer clear of those US-centric
food names in meal-based and more heavily-processed food categories (General Mills,
Kellogg, Campbell Soup, and Smucker’s) — they have benefited from the pandemic and the
shift to at home food consumption, but may come under more fundamental pressure over
the medium to long term, as the consumer and retailer trends that prevailed before the
pandemic reassert themselves.
As we said earlier, these long-term growth expectations are generally not high quality, as
only a small subset of analysts contributes them. So, one is not going to base the whole
investment case on such figures. However, the absolute level of these forecasts is striking
for the sectors in question.

Note: The charts show long-term earnings growth rates adjusted for CPI. The last datapoint is shown assuming 2% CPI.
Source: FactSet, IBES, and Bernstein analysis
0%
2%
4%
6%
8%
10%
12%
14%
16%
Jan-8
8
Jan-9
0
Jan-9
2
Jan-9
4
Jan-9
6
Jan-9
8
Jan-0
0
Jan-0
2
Jan-0
4
Jan-0
6
Jan-0
8
Jan-1
0
Jan-1
2
Jan-1
4
Jan-1
6
Jan-1
8
Jan-2
0
Europe: Beverages
Europe: Beverages 2% CPI projection
-4%
-2%
0%
2%
4%
6%
8%
10%
12%
14%
16%
18%
Jan-8
8
Jan-9
0
Jan-9
2
Jan-9
4
Jan-9
6
Jan-9
8
Jan-0
0
Jan-0
2
Jan-0
4
Jan-0
6
Jan-0
8
Jan-1
0
Jan-1
2
Jan-1
4
Jan-1
6
Jan-1
8
Jan-2
0Europe: Household Products
Europe: Household Products 2% CPI projection
0%
5%
10%
15%
20%
25%
Jan-8
8
Jan-9
0
Jan-9
2
Jan-9
4
Jan-9
6
Jan-9
8
Jan-0
0
Jan-0
2
Jan-0
4
Jan-0
6
Jan-0
8
Jan-1
0
Jan-1
2
Jan-1
4
Jan-1
6
Jan-1
8
Jan-2
0
Europe: Personal Products
Europe: Personal Products 2% CPI projection
0%
2%
4%
6%
8%
10%
12%
Jan-8
8
Jan-9
0
Jan-9
2
Jan-9
4
Jan-9
6
Jan-9
8
Jan-0
0
Jan-0
2
Jan-0
4
Jan-0
6
Jan-0
8
Jan-1
0
Jan-1
2
Jan-1
4
Jan-1
6
Jan-1
8
Jan-2
0
Europe: Tobacco
Europe: Tobacco 2% CPI projection
0%
2%
4%
6%
8%
10%
12%
Jan-8
8
Jan-9
0
Jan-9
2
Jan-9
4
Jan-9
6
Jan-9
8
Jan-0
0
Jan-0
2
Jan-0
4
Jan-0
6
Jan-0
8
Jan-1
0
Jan-1
2
Jan-1
4
Jan-1
6
Jan-1
8
Jan-2
0
Europe: Food Producers
Europe: Food Producers 2% CPI projection
0%
2%
4%
6%
8%
10%
12%Jan-8
8
Jan-9
0
Jan-9
2
Jan-9
4
Jan-9
6
Jan-9
8
Jan-0
0
Jan-0
2
Jan-0
4
Jan-0
6
Jan-0
8
Jan-1
0
Jan-1
2
Jan-1
4
Jan-1
6
Jan-1
8
Jan-2
0
Europe: Consumer Staples
Europe: Consumer Staples 2% CPI projection

Not only is the projected growth rate of Beverages and HPC lower than the overall market,
it is currently lower than that of the Banks (see Exhibit 62 and Exhibit 63). We struggle to
see how such a cyclical sector, faced with a prospect of extremely low rates for a very long
time as well as an upcoming wave of credit and corporate debt defaults, could warrant an
expected growth premium.
Source: FactSet, IBES, and Bernstein analysis Source: FactSet, IBES, and Bernstein analysis
While in absolute terms, the real expected long-term growth rates are higher in the US
(5.8% vs. 3% in Europe), at the sector level the story is similar to Europe (see Exhibit 64). If
US inflation rose to 2%, that would imply a historical low in real growth expectations for the
Beverages, Personal Care, and Tobacco sectors.
-5.0%
0.0%
5.0%
10.0%
15.0%
20.0%
25.0%
Jan-8
8
Jan-9
0
Jan-9
2
Jan-9
4
Jan-9
6
Jan-9
8
Jan-0
0
Jan-0
2
Jan-0
4
Jan-0
6
Jan-0
8
Jan-1
0
Jan-1
2
Jan-1
4
Jan-1
6
Jan-1
8
Jan-2
0
Europe: Consumer Staples
Europe
Europe: Household Products
Europe: Personal Products
-5.0%
0.0%
5.0%
10.0%
15.0%
20.0%
25.0%
Jan-8
8
Jan-9
0
Jan-9
2
Jan-9
4
Jan-9
6
Jan-9
8
Jan-0
0
Jan-0
2
Jan-0
4
Jan-0
6
Jan-0
8
Jan-1
0
Jan-1
2
Jan-1
4
Jan-1
6
Jan-1
8
Jan-2
0
Europe: Consumer Staples
Europe: Banks
Europe: Household Products
Europe: Personal Products

Note: The charts show long-term earnings growth rates adjusted for CPI. The last datapoint is shown assuming 2% CPI.
Source: FactSet, IBES, and Bernstein analysis
0%
2%
4%
6%
8%
10%
12%
14%
16%
Ja
n-8
8
Ja
n-9
0
Ja
n-9
2
Ja
n-9
4
Ja
n-9
6
Ja
n-9
8
Ja
n-0
0
Ja
n-0
2
Ja
n-0
4
Ja
n-0
6
Ja
n-0
8
Ja
n-1
0
Ja
n-1
2
Ja
n-1
4
Ja
n-1
6
Ja
n-1
8
Ja
n-2
0
US: Beverages
US: Beverages 2% CPI projection
0%
2%
4%
6%
8%
10%
12%
14%
Ja
n-8
8
Ja
n-9
0
Ja
n-9
2
Ja
n-9
4
Ja
n-9
6
Ja
n-9
8
Ja
n-0
0
Ja
n-0
2
Ja
n-0
4
Ja
n-0
6
Ja
n-0
8
Ja
n-1
0
Ja
n-1
2
Ja
n-1
4
Ja
n-1
6
Ja
n-1
8
Ja
n-2
0
US: Food Producers
US: Food Producers 2% CPI projection
0%
2%
4%
6%
8%
10%
12%
14%
Ja
n-8
8
No
v-8
9
Se
p-9
1
Ju
l-9
3
Ma
y-9
5
Ma
r-9
7
Ja
n-9
9
No
v-0
0
Se
p-0
2
Ju
l-0
4
Ma
y-0
6
Ma
r-0
8
Ja
n-1
0
No
v-1
1
Se
p-1
3
Ju
l-1
5
Ma
y-1
7
Ma
r-1
9US: Household Products
US: Household Products 2% CPI projection
0%
2%
4%
6%
8%
10%
12%
14%
16%
18%
Ja
n-8
8
No
v-8
9
Se
p-9
1
Ju
l-9
3
Ma
y-9
5
Ma
r-9
7
Ja
n-9
9
No
v-0
0
Se
p-0
2
Ju
l-0
4
Ma
y-0
6
Ma
r-0
8
Ja
n-1
0
No
v-1
1
Se
p-1
3
Ju
l-1
5
Ma
y-1
7
Ma
r-1
9
US: Personal Products
US: Personal Products 2% CPI projection
0%
2%
4%
6%
8%
10%
12%
14%
16%
18%
Ja
n-8
8
Ja
n-9
0
Ja
n-9
2
Ja
n-9
4
Ja
n-9
6
Ja
n-9
8
Ja
n-0
0
Ja
n-0
2
Ja
n-0
4
Ja
n-0
6
Ja
n-0
8
Ja
n-1
0
Ja
n-1
2
Ja
n-1
4
Ja
n-1
6
Ja
n-1
8
Ja
n-2
0
US: Tobacco
US: Tobacco 2% CPI projection
0%
2%
4%
6%
8%
10%
12%
14%
Ja
n-8
8
Ja
n-9
0
Ja
n-9
2
Ja
n-9
4
Ja
n-9
6
Ja
n-9
8
Ja
n-0
0
Ja
n-0
2
Ja
n-0
4
Ja
n-0
6
Ja
n-0
8
Ja
n-1
0
Ja
n-1
2
Ja
n-1
4
Ja
n-1
6
Ja
n-1
8
Ja
n-2
0
US: Consumer Staples
US: Consumer Staples 2% CPI projection

In Exhibit 65 and Exhibit 66 we compare the current nominal long-term growth estimates
with the actual 12-month forward EPS CAGR since 1995. In almost all cases, the expected
growth rates are significantly below the level the sectors managed to achieve historically.
While the earnings outlook over the next 12-24 months is extremely uncertain, Consumer
Staples has a strong historical record for stable and persistent earnings growth. Thus, in
our view, the current consensus expectations set a very low bar for the sector to surprise
on the upside on this front.
Note: Household product sector CAGR since 1998
Source: MSCI, Datastream, and Bernstein analysis
Source: MSCI, Datastream, and Bernstein analysis
In many cases, near-term earnings estimates have also been substantially downgraded. We
show in Exhibit 67 and Exhibit 68 the FY1 and FY2 ERB for Consumer Staples sectors.
European and US Beverages stand out as having undergone by far the largest earnings
downgrade cycle in the last 30 years. They are closely followed by the Personal Products
sector, which has also seen extreme downward earnings revisions recently. Overall, the
European Consumer Staples sector has seen more aggressive earnings downgrades vs.
the US sector.
0.0%
2.0%
4.0%
6.0%
8.0%
10.0%
12.0%
14.0%
16.0%
Europe LTG (nominal)
Europe EPS CAGR (Local Currency)
0.0%
5.0%
10.0%
15.0%
20.0%
25.0%
30.0%
US LTG (nominal) US EPS CAGR

Source: FactSet, IBES, MSCI, and Bernstein analysis
-60.00
-50.00
-40.00
-30.00
-20.00
-10.00
0.00
10.00
20.00
30.00
Mar-
88
Mar-
90
Mar-
92
Mar-
94
Mar-
96
Mar-
98
Mar-
00
Mar-
02
Mar-
04
Mar-
06
Mar-
08
Mar-
10
Mar-
12
Mar-
14
Mar-
16
Mar-
18
Mar-
20
%
Europe: Beverages ERB (3mma)
-50.00
-40.00
-30.00
-20.00
-10.00
0.00
10.00
20.00
30.00
40.00
Mar-
88
Mar-
90
Mar-
92
Mar-
94
Mar-
96
Mar-
98
Mar-
00
Mar-
02
Mar-
04
Mar-
06
Mar-
08
Mar-
10
Mar-
12
Mar-
14
Mar-
16
Mar-
18
Mar-
20
%
Europe: Personal Products ERB (3mma)
-40.00
-35.00
-30.00
-25.00
-20.00
-15.00
-10.00
-5.00
0.00
5.00
10.00
15.00
Apr-
88
Apr-
90
Apr-
92
Apr-
94
Apr-
96
Apr-
98
Apr-
00
Apr-
02
Apr-
04
Apr-
06
Apr-
08
Apr-
10
Apr-
12
Apr-
14
Apr-
16
Apr-
18
Apr-
20
%
Europe ERB (3mma)
-40.00
-30.00
-20.00
-10.00
0.00
10.00
20.00
Mar-
88
Mar-
90
Mar-
92
Mar-
94
Mar-
96
Mar-
98
Mar-
00
Mar-
02
Mar-
04
Mar-
06
Mar-
08
Mar-
10
Mar-
12
Mar-
14
Mar-
16
Mar-
18
Mar-
20
%
Europe: Consumer Staples ERB (3mma)

Source: FactSet, IBES, MSCI, and Bernstein analysis
Our outlook for volatility is another supportive factor for the Consumer Staples sector.
Historically, valuation multiples in the top two most-expensive deciles range have been
associated with a substantial increase in volatility. As the US 12-month forward PE multiple
has recently hit an all-time high and policy uncertainty remains extremely elevated, we
expect volatility to rise from current levels over the next six months (see Exhibit 69 and
Exhibit 70). As we show in Exhibit 71 and Exhibit 72, the sector has a strong record of
outperformance during periods of rising volatility both in Europe and the US.
-60.00
-50.00
-40.00
-30.00
-20.00
-10.00
0.00
10.00
20.00
30.00
40.00
Mar-
88
Mar-
90
Mar-
92
Mar-
94
Mar-
96
Mar-
98
Mar-
00
Mar-
02
Mar-
04
Mar-
06
Mar-
08
Mar-
10
Mar-
12
Mar-
14
Mar-
16
Mar-
18
Mar-
20
%
US: Beverages ERB (3mma)
-80.00
-60.00
-40.00
-20.00
0.00
20.00
40.00
60.00
80.00
Mar-
88
Mar-
90
Mar-
92
Mar-
94
Mar-
96
Mar-
98
Mar-
00
Mar-
02
Mar-
04
Mar-
06
Mar-
08
Mar-
10
Mar-
12
Mar-
14
Mar-
16
Mar-
18
Mar-
20
%
US: Personal Products ERB (3mma)
-50.00
-40.00
-30.00
-20.00
-10.00
0.00
10.00
20.00
30.00
Apr-
88
Apr-
90
Apr-
92
Apr-
94
Apr-
96
Apr-
98
Apr-
00
Apr-
02
Apr-
04
Apr-
06
Apr-
08
Apr-
10
Apr-
12
Apr-
14
Apr-
16
Apr-
18
Apr-
20
%
US ERB (3mma)
-30.00
-20.00
-10.00
0.00
10.00
20.00
30.00
Apr-
88
Apr-
90
Apr-
92
Apr-
94
Apr-
96
Apr-
98
Apr-
00
Apr-
02
Apr-
04
Apr-
06
Apr-
08
Apr-
10
Apr-
12
Apr-
14
Apr-
16
Apr-
18
Apr-
20
%
US: Consumer Staples ERB (3mma)
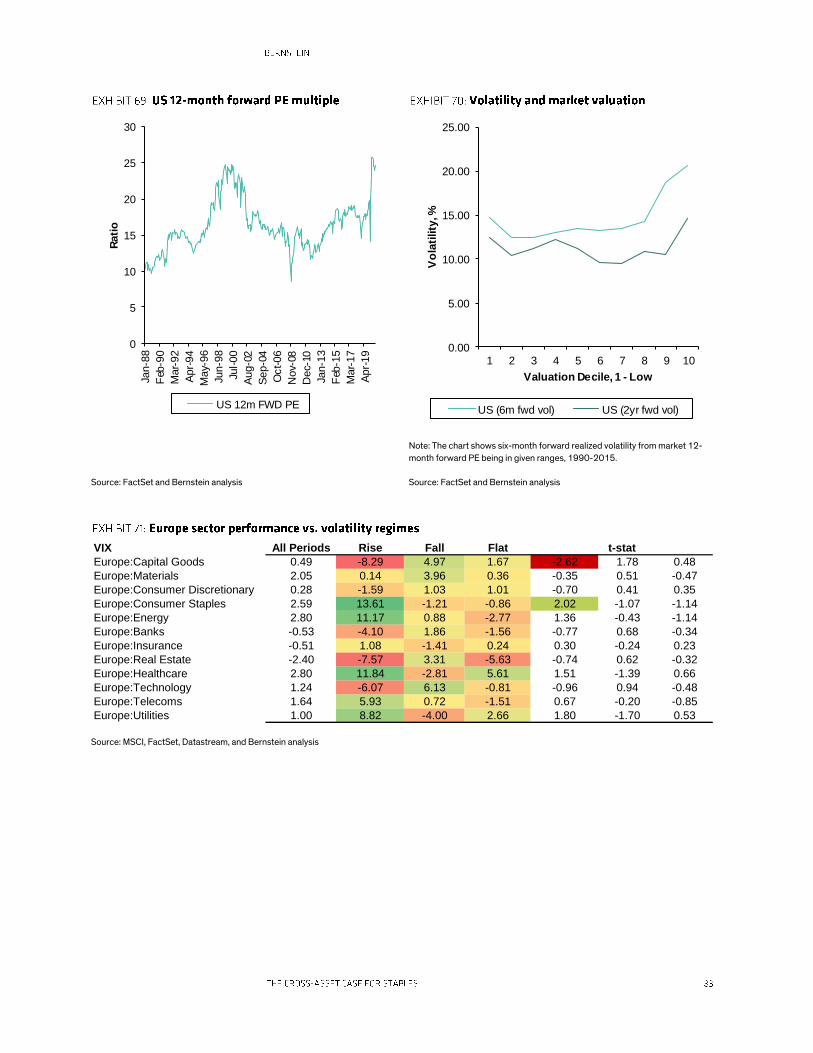
Source: FactSet and Bernstein analysis
Note: The chart shows six-month forward realized volatility from market 12-
month forward PE being in given ranges, 1990-2015.
Source: FactSet and Bernstein analysis
Source: MSCI, FactSet, Datastream, and Bernstein analysis
0
5
10
15
20
25
30
Jan-8
8
Feb
-90
Mar-
92
Apr-
94
May-
96
Jun-9
8
Jul-00
Aug-0
2
Sep-0
4
Oct-06
Nov-
08
Dec-
10
Jan-1
3
Feb
-15
Mar-
17
Apr-
19
Rati
o
US 12m FWD PE
0.00
5.00
10.00
15.00
20.00
25.00
1 2 3 4 5 6 7 8 9 10
Vo
lati
lity
, %
Valuation Decile, 1 - Low
US (6m fwd vol) US (2yr fwd vol)
VIX All Periods Rise Fall Flat
Europe:Capital Goods 0.49 -8.29 4.97 1.67 -2.62 1.78 0.48
Europe:Materials 2.05 0.14 3.96 0.36 -0.35 0.51 -0.47
Europe:Consumer Discretionary 0.28 -1.59 1.03 1.01 -0.70 0.41 0.35
Europe:Consumer Staples 2.59 13.61 -1.21 -0.86 2.02 -1.07 -1.14
Europe:Energy 2.80 11.17 0.88 -2.77 1.36 -0.43 -1.14
Europe:Banks -0.53 -4.10 1.86 -1.56 -0.77 0.68 -0.34
Europe:Insurance -0.51 1.08 -1.41 0.24 0.30 -0.24 0.23
Europe:Real Estate -2.40 -7.57 3.31 -5.63 -0.74 0.62 -0.32
Europe:Healthcare 2.80 11.84 -2.81 5.61 1.51 -1.39 0.66
Europe:Technology 1.24 -6.07 6.13 -0.81 -0.96 0.94 -0.48
Europe:Telecoms 1.64 5.93 0.72 -1.51 0.67 -0.20 -0.85
Europe:Utilities 1.00 8.82 -4.00 2.66 1.80 -1.70 0.53
t-stat

Note: Real estate returns are since 1998.
Source: MSCI, FactSet, Datastream, and Bernstein analysis
VIX All Periods Rise Fall Flat
USA:Capital Goods -0.06 -2.97 2.38 -2.29 -0.77 0.82 -0.75
USA:Materials -1.78 -0.77 -2.12 -2.27 0.18 -0.08 -0.11
USA:Consumer Discretionary 0.36 0.48 1.77 -2.53 0.04 0.64 -1.04
USA:Consumer Staples 1.43 14.76 -4.62 0.80 2.16 -1.61 -0.18
USA:Energy -0.73 5.90 -1.72 -6.79 1.00 -0.21 -1.03
USA:Banks 2.37 1.97 3.06 1.61 -0.06 0.14 -0.17
USA:Insurance 0.42 -0.28 1.20 -0.32 -0.15 0.20 -0.21
USA:Real Estate 4.48 5.53 4.18 3.85 0.12 -0.05 -0.08
USA:Healthcare 2.48 8.42 -3.22 9.21 1.16 -1.52 1.65
USA:Technology 3.73 -3.32 6.37 5.25 -0.98 0.55 0.33
USA:Telecoms -2.73 4.47 -5.52 -3.94 1.09 -0.71 -0.28
USA:Utilities -0.87 6.65 -2.98 -5.06 1.03 -0.46 -0.78
t-stat

◼ With US equities trading at an all-time high level of forward earnings, investors face
the prospect of unexciting near-term equity returns. Yes, liquidity is clearly triumphing
over "fundamentals," and we think the "TINA" argument for having a high equity weight
has some validity in the medium term. But the high multiples, at the very least, mean a
period of high volatility is likely and also spell a prospect of near-term lower price
appreciation. Hence, a focus on income could make sense.
◼ However, the best "fixed income" portfolio right now might actually be a portfolio of
higher-quality equities, where there is some visibility on the dividends. We list US and
European companies that we think can fulfil this criterion. Unsurprisingly, this leads to
stocks in Healthcare and Consumer Staples sectors, but also selected Commodity
cyclicals, Industrial cyclicals, and Utilities.
◼ The spread of US dividend yields over bond yields is wider than at any point since
1955, which is perhaps the most obvious reason why the income trade may now be in
equities. The pushback is that buying income in equites is higher risk. Yes it is, but (1)
investors do not realistically have many other options and (2) fixed income investors
have already been implicitly taking more equity-like risk for years, e.g., by buying more
high-yield credit even as the quality of corporate credit has declined.
◼ There are perhaps less obvious reasons why seeking income in equities makes more
sense now as well. High-grade bonds have higher duration and, hence, more interest
rate risk than at any point in the last 50 years. Moreover, if the outcome of the policy
response to the pandemic is inflationary, then the strategic weight in equities needs to
increase. But at the same time, bonds are likely to become a less effective diversifier
of equity risk. We can show that as inflation rises, long-short income strategies in the
equity market can be more effective diversifiers of equity risk.
◼ Ideally a "fixed income replacement" portfolio would really also include gold, carry
strategies, and infrastructure. We have detailed this in other research (Fund
Management Strategy: An urgent need to replace fixed income). But in this chapter,
we just focus on single-equity securities.
◼ We are not outright bearish on equities in the medium term, as policy support can
trump valuations. So, in a broader context, alongside a global equity income portfolio,
we are still happy to hold exposure to US equities, US Growth, and Gold along with
downside protection in the form of global trades on low volatility and good balance
sheet quality.

US equities have reached their all-time peak multiple on forward earnings. Yes, there is a
case that the “TINA” argument is real and that in a world of low real yields — and especially
if inflation rises — this high multiple will not be an impediment to equity returns. In the
medium term (horizon longer than one year), there is a lot to be said for investors needing
to keep a high allocation to equities. Near term though we think that, at the very least, one
should expect high volatility in equities and unexciting price-return prospects.
Given a backdrop of less potential for near-term price appreciation, a focus on income
seems to make sense. However, high-grade fixed income offers the prospect of
(a) negative real returns, (b) is higher duration than it has ever been before, so carries a very
large interest rate risk, and (c) might not even be a diversifier of equity risk as stock-bond
correlation would likely increase if inflation rises. Meanwhile, for higher-risk debt, despite
the recent massive credit rally, we find it hard to get excited about an asset class that is
exposed to the largest default cycle in history that is poised on the horizon. The only thing
that would support it would be more direct Fed liquidity support, which could indeed well
happen, but is the kind of trade on which it is hard to have a competitive edge.
So, what should the source of this income be? Right now, we think the best fixed income
portfolio is…a portfolio of large-cap equities where there is a good degree of confidence in
the dividend. The relative yielding properties of equities and fixed income have undergone
a massive shift, with the dividend yield on equities now exceeding the yield on bonds by
more than at any point since 1955 (see Exhibit 73).
Source: GFD, Datastream, and Bernstein analysis
But this is not just a simple story about the shift in yield between asset classes. The case for
owning income via equities is even stronger than that. We have shown in our "Multi-Asset
Portfolios in the Crisis and the Outlook for Diversification if Inflation Rises" chapter that if
there is an upward risk to inflation as a result of the policy response to the pandemic, then
equity income offers one of the most attractive combinations of return-risk and ability to
act as a diversifier from equity holdings (see Exhibit 74). In this exhibit, we assume that in a
-12
-10
-8
-6
-4
-2
0
2
4
6
8
31/0
1/1
792
30/1
1/1
797
30/0
9/1
803
31/0
7/1
809
31/0
5/1
815
31/0
3/1
821
31/0
1/1
827
30/1
1/1
832
30/0
9/1
838
31/0
7/1
844
31/0
5/1
850
31/0
3/1
856
31/0
1/1
862
30/1
1/1
867
30/0
9/1
873
31/0
7/1
879
31/0
5/1
885
31/0
3/1
891
31/0
1/1
897
30/1
1/1
902
30/0
9/1
908
31/0
7/1
914
31/0
5/1
920
31/0
3/1
926
31/0
1/1
932
30/1
1/1
937
30/0
9/1
943
31/0
7/1
949
31/0
5/1
955
31/0
3/1
961
31/0
1/1
967
30/1
1/1
972
30/0
9/1
978
31/0
7/1
984
31/0
5/1
990
31/0
3/1
996
31/0
1/2
002
30/1
1/2
007
30/0
9/2
013
31/0
7/2
019
%
US Dividend Yield - 10 year bond yield

moderately higher inflation environment (but not with too high inflation), equities become
the core holding for many investors. Thus, an important question is: what would the
diversifiers be? This exhibit shows the information ratio (IR, return-risk) plotted against
correlation with equity markets in periods since the early 1970s when inflation has been
greater than 3%. To be sure, this is quite far from the current level, but if this comes about,
there are relatively few attractive assets in the top-left-hand corner. The key ones shown
here are dividend yield (L/S), equity low volatility (L/S), and gold.
Note: Correlation is calculated as average 12-month rolling correlation with US equities based on monthly returns.
IR is calculated as YOY return of the asset divided by annualized standard deviation.
Returns for Energy, REITS, and Metals & Mining are from 1974, returns for FX Carry are from 1975, and returns for GSCI Commodity index and Oil are from
1971.
Equity PBK, Dividend Yield, Momentum, Low Variance, Low Residual Variance and FI Momentum, FI Carry, and FX Carry factor strategy returns are Long-Short.
Energy and Metals & Mining sector returns are relative to broader US equity market.
Source: AQR, Ken French data library, Datastream, and Bernstein analysis
The focus of this chapter is on individual equities to hold. We note that a true "replacement
of fixed income" requires a broader set of assets than just high-yielding equities. As we
showed recently in Fund Management Strategy: An urgent need to replace fixed income, a
combination of gold, carry strategies, infrastructure, and other assets is needed to offer a
full combination of income and equity hedging without long-duration risk. However, for
investors who want to focus on a relatively small number of securities, secure dividend
payers make a lot of sense.
A pushback would be that as this is an equity portfolio it will have higher volatility than fixed
income. So, in what way can it be seen as a replacement? Why would an investor be willing
to replace a bond holding with a selection of individual equities? This is true, but:
US Bonds
GSCI Commodity IndexOi l
Gold
Si lver
Energy Stocks
relative
Mining Stocks relative
Price to Book (L/S)
Div Yield (L/S)
EQ Mom
FI Mom
Equity Low Vol (L/S)
FI Carry
FX Carry
REITS
-0.20
0.00
0.20
0.40
0.60
0.80
1.00
1.20
1.40
1.60
-1.00 -0.50 0.00 0.50 1.00
IR
Correlation with US Equities

◼ The "obvious answer" is that in a low real-return world, investors maybe simply cannot
avoid taking on more risk.
◼ The less obvious answer is that in fact, fixed income investors have already been
moving in this direction of effectively taking more equity-like risk over the last decade
anyway by evolving to lower-grade credits, EM debt, and private debt, even as the
average quality of corporate credit declined.
This is all very well, but 2020 has witnessed a stark fall in dividend payments. There has
even been a serious discussion about whether it is socially acceptable for corporates to
make distributions to investors in the middle of a crisis of this scale. Any attempt to form a
portfolio of income stocks to hold for several years has to involve a high bar for dividend
sustainability.
We have long used FCF dividend cover as the starting point for metrics of dividend
sustainability. We update our recent work on dividend sustainability, in Portfolio Strategy:
Will there be any dividends left? We think high FCF yield in combination with a high and
historically stable dividend, and avoiding low balance sheet quality can be used for sectors
with more stable cash flows (Healthcare and Consumer Staples). For cyclicals, given the
still very uncertain nature of the next 12 months, we would prefer to add cash coverage of
expenses as an additional metric to the screening metrics already mentioned. For Utilities,
we select the highest FCF dividend cover stocks within the sector.
We choose to exclude Financials from this. For one, they don't fit into a comparable FCF-
yield or cash-burn type of approach, but more fundamentally we worry about the prospect
for dividends from the sector. In Europe regulators have taken a tougher line on dividends;
but also more generally, while there may be individual stocks that can be exceptions, with
rates likely locked low and a large default cycle still to come, we think that sustainable
dividends might be better sought elsewhere.
We list the companies that pass this screen in Exhibit 75 to Exhibit 77. It is this portfolio
that we think might just be the best "fixed income" portfolio right now. Ideally, we would
hold this as part of a broader portfolio that included exposure to US equities, US Growth,
gold, and low volatility.

Note: These are stocks in non-cyclical sectors that have paid dividends consistently over the last 10 years in the US and in seven of the last 10 years in Europe,
are in the two highest regional quintiles on high FCF and DY combined, and are not in the worst quintile on balance sheet quality. The benchmark universes that
we used were the MSCI US and the largest 300 stocks in the MSCI Europe, both excluding Financials.
O= Outperform rating, M= Market-Perform rating, U = Underperform rating. Further details of the research and important disclosures of the covered securities
are available on Bernstein Research website: www.bernsteinresearch.com.
Source: MSCI, FactSet, and Bernstein analysis
Europe Non-Cyclicals
Sedol Sector Company
PE (12
fwd) DY
FCF
Yield
DY (12m
fwd)
FCF Yield
(12m fwd)
Bernstein
Analyst
Rating
(Cash+credit)/
SGA+interest
exp.)
473249 COMMUNICATIONS TELENOR 14.0 6.0 10.1 6.4 10.3 0.51
483477 COMMUNICATIONS VIVENDI 21.0 2.3 5.3 2.5 3.7 O 0.43
457270 COMMUNICATIONS BOLLORE 23.7 1.8 29.0 1.8 15.1 7.21
712387 CONSUMER STAPLES NESTLE 22.9 2.6 3.8 2.8 3.9 O 0.34
028758 CONSUMER STAPLES BRITISH AMERICAN TOBACCO 8.1 7.8 12.9 8.2 12.4 0.65
416921 CONSUMER STAPLES CARLSBERG B 21.7 2.2 4.4 2.5 5.4 O 0.24
506921 HEALTHCARE BAYER 7.8 5.8 7.4 4.1 2.2 O 0.23
092528 HEALTHCARE GLAXOSMITHKLINE 11.6 6.0 9.0 5.7 7.8 0.31
567173 HEALTHCARE SANOFI 12.4 4.0 6.9 4.2 7.0 O 0.60
711038 HEALTHCARE ROCHE HOLDING GENUSS 14.8 2.9 6.5 3.1 6.2 O 0.48
BHC8X9 HEALTHCARE NOVO NORDISK B 22.5 2.0 5.0 2.2 4.1 O 1.92
US Non Cyclicals
Sedol Sector Company
PE (12
fwd) DY
FCF
Yield
DY (12m
fwd)
FCF Yield
(12m fwd)
Bernstein
Analyst
Rating
(Cash+credit)/
SGA+interest
exp.)
20030N10 COMMUNICATIONS COMCAST CORP A (NEW) 17.9 1.8 6.9 2.0 5.9 O 0.48
71817210 CONSUMER STAPLES PHILIP MORRIS INTL 15.3 5.8 7.3 5.9 6.7 M 1.76
02209S10 CONSUMER STAPLES ALTRIA GROUP 9.4 8.4 10.7 8.6 9.9 O 1.47
44045210 CONSUMER STAPLES HORMEL FOODS CORP 27.1 2.1 3.0 2.2 3.1 2.72
49436810 CONSUMER STAPLES KIMBERLY-CLARK CORP 17.4 3.2 5.5 3.4 5.9 M 0.93
42786610 CONSUMER STAPLES HERSHEY CO (THE) 23.2 2.1 4.7 2.2 3.4 M 1.15
18905410 CONSUMER STAPLES CLOROX CO 25.2 2.2 5.5 2.3 3.3 M 1.12
17134010 CONSUMER STAPLES CHURCH & DWIGHT CO 28.9 1.1 4.4 1.2 4.2 0.81
G5960L10 HEALTHCARE MEDTRONIC PLC 25.0 2.0 3.0 2.0 3.9 O 1.12
47816010 HEALTHCARE JOHNSON & JOHNSON 17.4 2.6 4.4 2.6 5.2 O 0.85
7588710 HEALTHCARE BECTON DICKINSON 19.9 1.3 3.8 1.5 4.5 0.87
91324P10 HEALTHCARE UNITEDHEALTH GROUP 19.0 1.4 6.0 1.4 5.9 O 0.60
12665010 HEALTHCARE CVS HEALTH 9.3 2.9 14.1 2.7 10.7 O 0.42
03073E10 HEALTHCARE AMERISOURCEBERGEN 11.8 1.8 9.2 1.6 7.8 2.46

Note: These are stocks in Cyclicals sectors that have paid dividends consistently over the last 10 years in the US and in seven of the last 10 years in Europe, are in
the two highest regional quintiles on high FCF and DY combined, are not in the worst quintile on balance sheet quality, and have good coverage on a measure of
cash on the balance sheet + available credit lines to SGA + Interest expenses. The benchmark universes we used were the MSCI US and the largest 300 stocks in
the MSCI Europe, both excluding Financials.
O= Outperform rating, M= Market-Perform rating, U = Underperform rating. Further details of the research and important disclosures of the covered securities
are available on Bernstein Research website: www.bernsteinresearch.com.
Source: MSCI, FactSet, and Bernstein analysis
Europe Cyclicals
Sedol Sector Company
PE (12
fwd) DY
FCF
Yield
DY (12m
fwd)
FCF Yield
(12m fwd)
Bernstein
Analyst
Rating
(Cash+credit)/
SGA+interest
exp.)
482477 INDUSTRIALS SGS 32.2 3.0 4.6 3.0 3.2 1.04
572797 INDUSTRIALS SIEMENS 20.5 3.3 6.4 3.0 4.8 1.00
B2B0DG INDUSTRIALS RELX (GB) 20.0 2.6 5.4 2.5 5.0 M 3.15
BYPC1T INDUSTRIALS ASSA ABLOY B 23.2 1.9 5.0 1.9 4.3 4.40
B11ZRK INDUSTRIALS LEGRAND 23.0 1.8 5.0 1.8 4.1 1.20
461785 INDUSTRIALS DEUTSCHE POST 16.1 2.8 8.6 3.4 5.3 O 0.83
B142S6 INDUSTRIALS KUEHNE & NAGEL INTL 29.7 2.0 6.4 2.1 3.8 M 1.20
BH0P3Z MATERIALS BHP GROUP (GB) 11.4 4.6 6.3 5.0 7.8 O 3.34
071887 MATERIALS RIO TINTO PLC (GB) 10.2 5.4 7.8 6.3 7.9 M 8.46
512067 MATERIALS HEIDELBERGCEMENT 8.9 1.0 12.5 3.2 11.2 0.99
416343 TECHNOLOGY CAPGEMINI 16.6 1.1 7.5 1.6 6.4 1.22
US Cyclicals
Sedol Sector Company
PE (12
fwd) DY
FCF
Yield
DY (12m
fwd)
FCF Yield
(12m fwd)
Bernstein
Analyst
Rating
(Cash+credit)/
SGA+interest
exp.)
26875P10 ENERGY EOG RESOURCES 25.3 3.0 5.9 2.6 5.6 O 5.65
85811910 MATERIALS STEEL DYNAMICS 13.1 2.7 3.2 2.6 4.1 4.99
67034610 MATERIALS NUCOR CORP 16.9 3.0 7.1 2.9 3.3 3.70
94106L10 INDUSTRIALS WASTE MANAGEMENT 26.3 1.8 4.3 2.0 4.5 3.23
05301510 TECHNOLOGY AUTOMATIC DATA PROCESS 31.4 2.1 3.8 2.2 4.0 3.17
30213010 INDUSTRIALS EXPEDITORS INTL OF WASH 23.3 1.1 4.0 0.9 4.1 3.10
14912310 INDUSTRIALS CATERPILLAR 25.2 2.3 4.4 2.3 4.4 M 2.53
52605710 CONSUMER DISCRETIONARY LENNAR CORP A 9.7 1.3 18.4 1.3 6.4 2.50
91131210 INDUSTRIALS UNITED PARCEL SERVICE B 20.8 2.4 4.8 2.6 5.2 O 2.48
43851610 INDUSTRIALS HONEYWELL INTERNATIONAL 27.3 1.7 3.4 1.8 3.8 2.20
88250810 TECHNOLOGY TEXAS INSTRUMENTS 28.1 2.5 3.4 2.4 3.5 M 2.20
57772K10 TECHNOLOGY MAXIM INTEGRATED PRDCTS 30.4 2.2 3.2 1.2 3.6 2.09
36955010 INDUSTRIALS GENERAL DYNAMICS CORP 13.2 3.0 6.3 3.1 7.2 M 2.05
70432610 TECHNOLOGY PAYCHEX 33.5 2.7 3.5 2.7 3.9 2.04
85450210 INDUSTRIALS STANLEY BLACK & DECKER 19.3 1.6 5.2 1.7 5.5 2.02
30249130 MATERIALS FMC CORP 15.9 1.7 4.3 1.7 4.2 M 1.97
45230810 INDUSTRIALS ILLINOIS TOOL WORKS 27.9 2.2 4.0 2.1 3.6 1.82
69515610 MATERIALS PACKAGING CORP OF AMER 20.4 2.9 5.4 2.4 4.9 1.59
G8994E10 INDUSTRIALS TRANE TECHNOLOGIES 28.0 1.5 4.4 1.4 3.4 1.59
27743210 MATERIALS EASTMAN CHEMICAL CO 14.8 2.8 9.8 2.7 7.0 1.56
45950610 MATERIALS INTL FLAVORS & FRAGRANCE 18.7 2.8 4.5 2.5 5.3 O 1.36
76075910 INDUSTRIALS REPUBLIC SERVICES 26.5 1.8 4.2 1.8 4.2 1.27
H8498910 TECHNOLOGY TE CONNECTIVITY 22.3 1.6 3.6 1.5 4.1 1.27
23102110 INDUSTRIALS CUMMINS 17.0 2.4 5.5 2.4 5.4 O 1.26
03265410 TECHNOLOGY ANALOG DEVICES 25.4 1.7 3.4 1.6 3.8 M 1.22
83186520 INDUSTRIALS SMITH (A.O.) CORP 24.1 1.9 5.2 1.9 4.3 1.22
92974010 INDUSTRIALS WABTEC CORP 17.2 0.7 5.3 0.6 5.5 1.18
52610710 INDUSTRIALS LENNOX INTERNATIONAL 26.1 1.1 6.0 1.1 3.1 1.15
77390310 INDUSTRIALS ROCKWELL AUTOMATION 28.4 1.7 3.5 1.6 3.3 1.12
05361110 MATERIALS AVERY DENNISON CORP 21.2 1.6 4.2 1.6 4.5 1.07
45920010 TECHNOLOGY IBM CORP 11.1 5.2 11.8 5.1 7.2 M 0.94
88579Y10 INDUSTRIALS 3M CO 19.0 3.4 6.3 3.6 5.9 0.83

Note: The Utilities sector in the MSCI US universe and the largest 300 stocks in the MSCI Europe index were ranked on the basis of FCF dividend cover. The
stocks in the table are the high FCF dividend cover quintile of stocks. Any stocks with a cover of less than one has been removed.
O= Outperform rating, M= Market-Perform rating, U = Underperform rating. Further details of the research and important disclosures of the covered securities
are available on Bernstein Research website: www.bernsteinresearch.com.
Source: MSCI, FactSet, and Bernstein analysis
Europe Utilities - High FCF Dividend Cover Quintile
Sedol/Cusip Sector Company DY
FCF
Dividend
Cover
DY (12m
Fwd)
FCF Yld
(12m
Fwd)
Bernstein
Rating
403187 UTILITIES VEOLIA ENVIRONNEMENT 2.5 3.7 4.7 6.3
466160 UTILITIES VERBUND A 1.0 2.9 1.1 0.6
B3B8D0 UTILITIES SUEZ 2.8 1.9 4.1 9.9
US Utilities - High FCF Dividend Cover Quintile
Sedol/Cusip Sector Company DY
FCF
Dividend
Cover
DY (12m
Fwd)
FCF Yld
(12m
Fwd)
Bernstein
Rating
92840M10 UTILITIES VISTRA ENERGY 2.7 7.5 2.8 19.7
62937750 UTILITIES NRG ENERGY 3.2 5.8 3.3 15.5
00130H10 UTILITIES AES CORP 2.6 1.6 2.4 4.6


◼ Value investors have been waiting for inflation for a decade. We have argued that at
least one reason for the 10-year failure of valuation to work as an investment signal
has been perennial negative surprises on inflation.
◼ However, when inflation rises, usually this eventually leads to real yields rising too and
yield curves steepening. If real rates do indeed rise, then the case for a historical
reallocation into Value on a 1 year+ horizon is strong. However, policy makers may
choose to keep real rates locked low. Moreover, Value companies are not at a historical
discount just because of cyclical risk aversion, many of them have structurally
challenged business models.
◼ So, the central question of this chapter is: if inflation rises but real rates remain low,
should PMs stay with Growth or switch to Value?
◼ The link between Value and inflation is strong, but "deep Value" stocks, i.e., those that
are cheap on price-to-book also usually need rising real yields and steepening curves,
e.g., Banks. For the Value factor overall, if anything, the yield curve and real rates may
matter more than inflation.
◼ There are other "Value" stocks that can still perform well when inflation is high but
rates stay low: Utilities, Real Estate and, possibly, Insurance. But their Value
characteristics are more in their role as income as a factor, rather than cyclical Value.
◼ There has been an allocation into cash over the last three months of historical
proportions. This makes the risk of an inflationary outlook even more critical, as this
cash will presumably need to be reallocated.
◼ Finally, we recently posed the question "Has the Fed gone too far?", but what if really
the Fed hasn’t gone far enough? There is a possibility that the Fed's balance sheet may
need to be significantly expanded beyond the current level to deal with the social
consequences of the virus (the scale of the recession still to come, the level of
unemployment, the increase in inequality, and the inter-generational wealth issues
created by this episode). If that came to pass, then maybe valuation of the market
simply doesn’t matter? We discuss the outlook for the market and allocations in such
a scenario.
If inflation does come back over 2021, what does it mean for allocation within equities? A
central question for equity allocation is what this means for Value vs. Growth. In theory, the

answer is easy. We have made the point before15 that what Value investors have been
waiting for, for years, is a little inflation. As we show in Exhibit 78, over the very long run,
since 1937, there has been a close link between inflation and Value, and periods of rising
inflation have historically been supportive of Value factor performance. However, this
assumes that one can hold a factor for multiple years and that rising inflation is part of a
"Normal" cycle that sees growth and eventually sees real rates rise, and the yield curve
steepen. What if those latter conditions don't apply this time?
Source: Ken French data library, Robert Shiller's database, Datastream, and Bernstein analysis
That inflation link has also held more recently and over shorter horizons. The performance
of Value has closely followed inflation expectations, both in Europe and the US. But again,
there is likely an assumption here that movements in inflation are linked to prospects of
future growth (see Exhibit 79 and Exhibit 80).
15 Global Quantitative Strategy: Has Value met its Waterloo?
-15
-10
-5
0
5
10
15
20
25
US CPI US value 10-year rolling return

Source: Bloomberg, FactSet, and Bernstein analysis Source: Bloomberg, FactSet, and Bernstein analysis
In parallel to the relationship with inflation, Value as a factor has also tended to respond to
shifts in the yield curve. This relationship over the long run is shown in Exhibit 81.
Source: GFD, Datastream, and Bernstein analysis
However, at the same time as inflation is rising it seems likely that central banks will keep
real rates at a very low level. A move to lock the yield curve and low rates would also amplify
the case for long duration in the equity market via Growth assets. If the far-off cash flows
0
20
40
60
80
100
120
140
0
0.5
1
1.5
2
2.5
3
Ind
ex
%
Europe 5y5y inflation index
Europe Composite Value (RHS)
0
20
40
60
80
100
120
140
0
0.5
1
1.5
2
2.5
3
3.5
4
Ind
ex
%
US 5y5y inflation index
US Composite Value (RHS)
-1.50
-1.00
-0.50
0.00
0.50
1.00
1.50
2.00
2.50
3.00
3.50
-30
-20
-10
0
10
20
30
40
01/0
1/1
937
01/0
7/1
939
01/0
1/1
942
01/0
7/1
944
01/0
1/1
947
01/0
7/1
949
01/0
1/1
952
01/0
7/1
954
01/0
1/1
957
01/0
7/1
959
01/0
1/1
962
01/0
7/1
964
01/0
1/1
967
01/0
7/1
969
01/0
1/1
972
01/0
7/1
974
01/0
1/1
977
01/0
7/1
979
01/0
1/1
982
01/0
7/1
984
01/0
1/1
987
01/0
7/1
989
01/0
1/1
992
01/0
7/1
994
01/0
1/1
997
01/0
7/1
999
01/0
1/2
002
01/0
7/2
004
01/0
1/2
007
01/0
7/2
009
01/0
1/2
012
01/0
7/2
014
01/0
1/2
017
01/0
7/2
019
%
%, yo
y
US Value (Price to Book), yoy (2 year rolling average)
US Yield Curve (10y - 3m) (2 year rolling average) (RHS)

on Growth assets continue to be discounted at a very low rate, then their NPV will remain
elevated. This suggests that inflation in the presence of a different kind of policy response
may not be as supportive of Value assets over all others.
To determine the relative significance of the two factors on Value performance, we
regressed smoothed US Value factor returns against smoothed inflation and yield curve
series from January 1937 to May 2020. We added a dummy variable for the period around
WWII when the yield curve was kept flat by the Fed. As shown in Exhibit 82, both the CPI
and the yield curve variables are highly statistically significant in determining the
performance of the Value factor (note this is a contemporaneous regression not a
predictive one, so one is required to make a forecast about future policy to use it). While the
inflation coefficient has a higher t-stat, we note that in key historical periods, like the early
1980s and 1990s when inflation and the yield curve were giving conflicting signals,
ultimately it was the shape of the yield curve that usually prevailed.
Note: The table shows results for a regression of US Value YOY return smoothed over two years against US CPI and Yield Curve (also smoothed over two years)
from 1937 to 2020.
Source: GFD, Datastream, and Bernstein analysis
We also think it's important to note that the yield curve impact might be due to two different
reasons. A steepening yield curve is often seen as a signal for positive future growth. Thus,
it could be that future growth is really a common cause of both the yield curve impact and
Value performance. Alternatively, it could be that the yield curve steepening or flattening
has a direct impact on the Value factor. To disentangle the two effects, we ran a regression
of US Value YOY returns against the yield curve and two-year forward S&P 500 EPS growth
from 1936 to 2020 (we account for the GFC structural break by a dummy variable). As
shown in Exhibit 83, even when including future earnings growth the yield curve coefficient
remains highly statistically significant (t-stat of 4.8). Thus, in our view, it shows the yield
curve has an impact on Value factor performance over and above its role in signaling future
earnings growth.
Source: GFD, Datastream, and Bernstein analysis
R-sq 29%
Variable Coeff t-stat
Intercept -3.23 -4.63
CPI 1.01 10.13
Yield Curve 2.68 8.48
Dummy (1942-1947) 13.62 13.03
R-sq 3.0%
Variable Coeff t-stat
Intercept 2.38 2.84
Yield Curve 2.41 4.78
2 year fwd EPS 0.00 -0.53
Dummy (2008-2011) -11.36 -4.59

This analysis suggests that the yield curve and inflation have tended to have a direct
influence on the performance of the Value factor overall. Another angle is to think about
how the composition of Value has changed over time from a sectoral perspective (see
Exhibit 84).
We took a closer look at the interplay between high inflation and real rates. For this, we
further divided the periods when inflation was above 3% into periods when real rates were
above/below historical average. The key observations are as follows:
◼ Consumer Staples and Healthcare have outperformed in both high- and low-rate
environments; however, their performance was stronger when high inflation was
accompanied by high rates.
◼ Real Estate also outperformed in both environments, but its performance was
stronger when real rates were low. This might make it look like a good holding for the
current environment. However, its absolute volatility is high in such periods and, more
worryingly, we can show that its correlation to equity returns increases when inflation
is high, so it is a less-good diversifier.
◼ Banks, Consumer Cyclicals, and to a lesser extent Insurance, do best when both high
inflation and high rates occur.
◼ Utilities outperformed in low-rate periods but lagged when both inflation and real
rates were high.
◼ Similarly, Energy outperformed strongly when real rates were low but lagged in
periods of high inflation and high rates.
Source: Datastream and Bernstein analysis
We also examined relative sector performance and risk profile in low real rate environments
(see Exhibit 85). Such environments clearly favor Real Estate, Healthcare, and Consumer
Cyclical sectors.
Year CPI
Real
Rate
Real
Estate Energy Utilities Healthcare Industrials
Consumer
Staples Telecoms Insurance Technology
Basic
Materials Banks
Consumer
Cyclicals
1974 11.01 -3.61 -49.29 1.83 1.80 8.53 -12.70 2.26 23.58 -0.46 -10.47 3.52 -8.77 -13.17
1975 9.14 -1.38 72.61 -8.78 8.90 -11.75 4.57 0.39 -8.96 -12.86 -0.46 14.76 -12.69 24.22
1976 5.77 1.04 -22.56 10.47 4.42 -13.35 7.69 -7.25 10.26 8.61 2.85 -0.15 7.06 -2.61
1977 6.47 1.31 7.14 4.89 14.86 1.25 0.78 4.18 8.30 10.74 2.39 -19.51 -0.04 -9.97
1978 7.63 1.52 -0.26 4.11 -12.03 2.12 12.60 0.33 -1.45 5.38 7.87 -3.59 2.02 -8.78
1979 11.25 -0.92 58.21 27.39 -5.31 -3.96 3.18 -9.38 -14.89 15.86 -9.19 12.74 -1.29 -7.10
1980 13.50 -1.07 16.91 34.75 -12.24 -4.82 7.18 -11.14 -20.83 -13.24 -6.41 -3.83 -5.52 -8.33
2005 3.37 1.02 5.70 26.03 9.46 1.72 -2.81 -0.59 -9.86 4.38 -2.28 -2.51 -4.57 -11.30
2006 3.22 1.49 17.80 5.71 4.21 -9.60 -2.04 2.00 15.73 -3.14 -4.77 1.73 1.08 -1.18
2008 3.81 -1.56 -1.95 0.53 7.31 21.21 -4.00 22.37 4.26 -13.98 -9.02 -19.57 -12.52 5.34
2011 3.14 -1.25 6.51 4.71 14.43 8.46 -1.75 10.21 -0.21 -11.63 -2.04 -14.87 -26.41 2.11
Average 7.12 -0.31 10.07 10.15 3.26 -0.02 1.16 1.22 0.54 -0.94 -2.87 -2.84 -5.61 -2.80
Median 6.47 -0.92 6.51 4.89 4.42 1.25 0.78 0.39 -0.21 -0.46 -2.28 -2.51 -4.57 -7.10
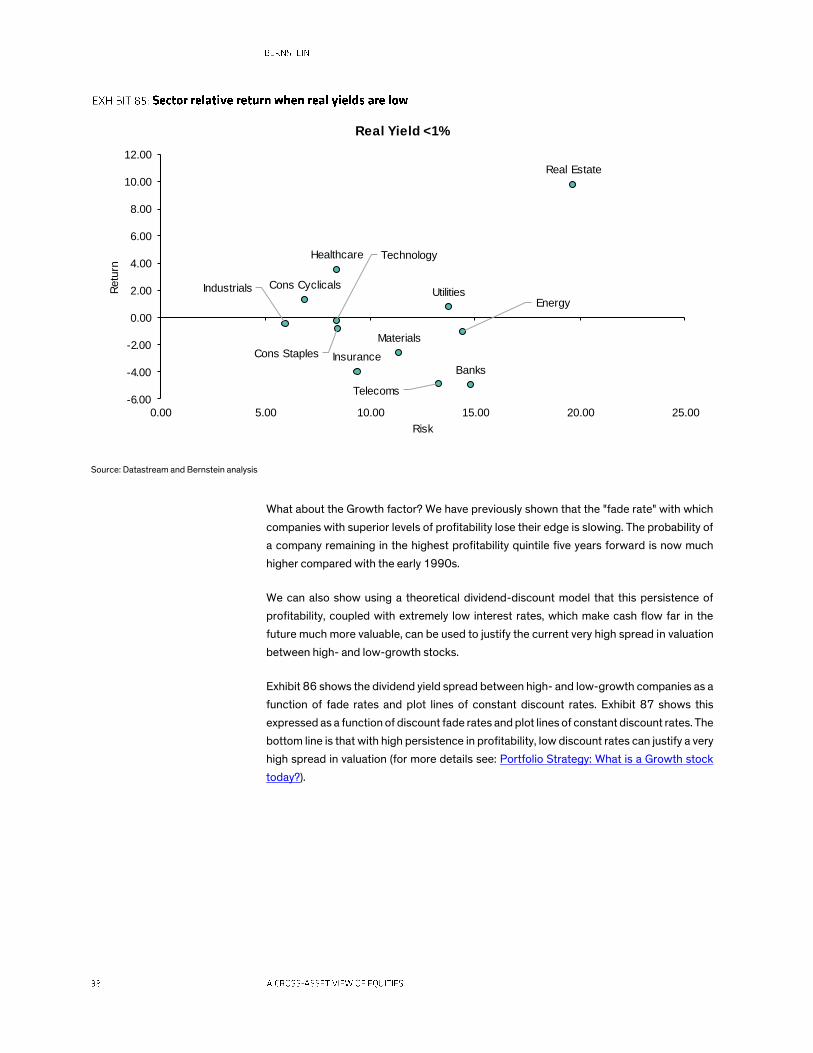
Source: Datastream and Bernstein analysis
What about the Growth factor? We have previously shown that the "fade rate" with which
companies with superior levels of profitability lose their edge is slowing. The probability of
a company remaining in the highest profitability quintile five years forward is now much
higher compared with the early 1990s.
We can also show using a theoretical dividend-discount model that this persistence of
profitability, coupled with extremely low interest rates, which make cash flow far in the
future much more valuable, can be used to justify the current very high spread in valuation
between high- and low-growth stocks.
Exhibit 86 shows the dividend yield spread between high- and low-growth companies as a
function of fade rates and plot lines of constant discount rates. Exhibit 87 shows this
expressed as a function of discount fade rates and plot lines of constant discount rates. The
bottom line is that with high persistence in profitability, low discount rates can justify a very
high spread in valuation (for more details see: Portfolio Strategy: What is a Growth stock
today?).
Industrials
Materials
Cons Cyclicals
Cons Staples
Energy
Banks
Insurance
Healthcare
Real Estate
Technology
Telecoms
Utilities
-6.00
-4.00
-2.00
0.00
2.00
4.00
6.00
8.00
10.00
12.00
0.00 5.00 10.00 15.00 20.00 25.00
Retu
rn
Risk
Real Yield <1%

Source: FactSet and Bernstein analysis Source: FactSet and Bernstein analysis
The recent months of the Covid-19 crisis have demonstrated the resilience of Tech
companies' business models and in many cases helped to further entrench their dominant
market position. We believe this gives the Tech sector earnings much greater visibility
going forward than for other parts of the market. Thus, while the valuation of our Composite
Growth factor has been creeping higher in recent months, we believe it can be sustained in
the current environment (see Exhibit 88).
0
50
100
150
200
250
300
4 8 12 16 20 24
P/D
Sp
read
Decay Time
Constant Discount Rate
5.50% 6% 7%
8% 9% 11%
Current
0
50
100
150
200
250
300
5.5 6 7 8 9 10 11
P/D
Sp
read
Discount Rate
Constant Decay Time
4 8 12
16 20 24
Current

Source: FactSet, IBES, and Bernstein analysis
High cash allocations make inflation outlook even more important
The prospect of inflation is made even more important as the one big asset reallocation
winner of March 2020 to June 2020 has been cash.
Investors have been buying money market funds at a record pace over March 2020-June
2020. According to ICI data, US investors bought US$1.15Tn of money market funds
between the beginning of February and the end of May. This is the largest four-month net
inflow into the asset class that we have seen in our post-1990 historical series and
represents 24% of current as of July 2020. This pace of buying dwarfs the previous four-
month record inflow of US$440Bn, which occurred between October 2008 and January
2009 at the height of the global financial crisis, and represented 11% of total assets of US
money market funds at that time (see Exhibit 89 and Exhibit 90).
0
0.5
1
1.5
2
2.5
3
3.5
401/1
0/1
990
01/0
8/1
991
01/0
6/1
992
01/0
4/1
993
01/0
2/1
994
01/1
2/1
994
01/1
0/1
995
01/0
8/1
996
01/0
6/1
997
01/0
4/1
998
01/0
2/1
999
01/1
2/1
999
01/1
0/2
000
01/0
8/2
001
01/0
6/2
002
01/0
4/2
003
01/0
2/2
004
01/1
2/2
004
01/1
0/2
005
01/0
8/2
006
01/0
6/2
007
01/0
4/2
008
01/0
2/2
009
01/1
2/2
009
01/1
0/2
010
01/0
8/2
011
01/0
6/2
012
01/0
4/2
013
01/0
2/2
014
01/1
2/2
014
01/1
0/2
015
01/0
8/2
016
01/0
6/2
017
01/0
4/2
018
01/0
2/2
019
01/1
2/2
019
01/1
0/2
020
Ratio
US: Composite Growth - 12m FWD PE
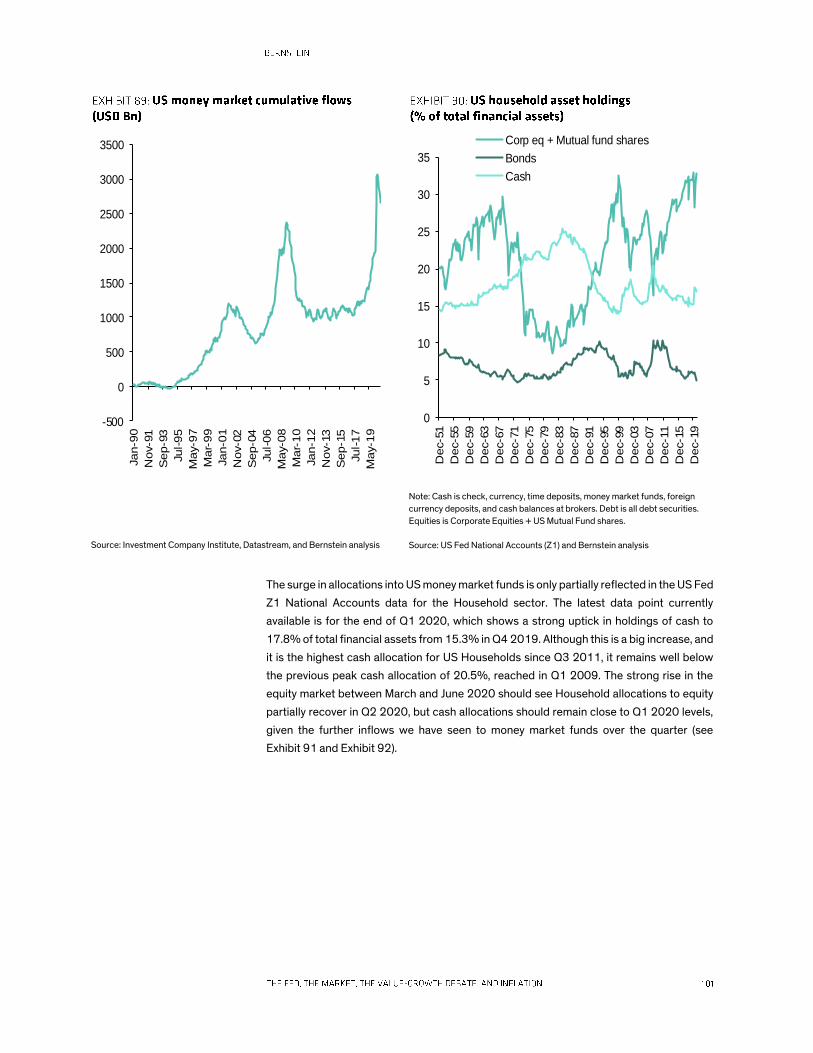
Source: Investment Company Institute, Datastream, and Bernstein analysis
Note: Cash is check, currency, time deposits, money market funds, foreign
currency deposits, and cash balances at brokers. Debt is all debt securities.
Equities is Corporate Equities + US Mutual Fund shares.
Source: US Fed National Accounts (Z1) and Bernstein analysis
The surge in allocations into US money market funds is only partially reflected in the US Fed
Z1 National Accounts data for the Household sector. The latest data point currently
available is for the end of Q1 2020, which shows a strong uptick in holdings of cash to
17.8% of total financial assets from 15.3% in Q4 2019. Although this is a big increase, and
it is the highest cash allocation for US Households since Q3 2011, it remains well below
the previous peak cash allocation of 20.5%, reached in Q1 2009. The strong rise in the
equity market between March and June 2020 should see Household allocations to equity
partially recover in Q2 2020, but cash allocations should remain close to Q1 2020 levels,
given the further inflows we have seen to money market funds over the quarter (see
Exhibit 91 and Exhibit 92).
-500
0
500
1000
1500
2000
2500
3000
3500Jan-9
0
Nov-9
1
Sep-9
3
Jul-95
May-9
7
Mar-
99
Jan-0
1
Nov-0
2
Sep-0
4
Jul-06
May-0
8
Mar-
10
Jan-1
2
Nov-1
3
Sep-1
5
Jul-17
May-1
9
0
5
10
15
20
25
30
35
Dec-5
1
Dec-5
5
Dec-5
9
Dec-6
3
Dec-6
7
Dec-7
1
Dec-7
5
Dec-7
9
Dec-8
3
Dec-8
7
Dec-9
1
Dec-9
5
Dec-9
9
Dec-0
3
Dec-0
7
Dec-1
1
Dec-1
5
Dec-1
9
Corp eq + Mutual fund shares
Bonds
Cash

Note: Cash is check, currency, time deposits, open market paper, and money
market funds. Debt is all debt securities and loans. Equities is Corporate
Equities + US Mutual Fund shares.
Source: US Fed National Accounts (Z1) and Bernstein analysis
Note: We have adjusted total financial assets in our calculations of allocations
to be net of claims of pension funds on the plan sponsors for unfunded
liabilities. Cash is check, currency, time deposits, open market paper, and
money market funds. Debt is all debt securities and loans. Equities is
Corporate Equities + US Mutual Fund shares. Misc Assets is unallocated
insurance contracts and other assets.
Source: US Fed National Accounts (Z1) and Bernstein analysis
What if the Fed hasn’t gone far enough?
We asked recently: Has the Fed gone too far?16 What if that is the wrong question? There
is an emerging possibility that the Fed hasn’t gone far enough. The Fed's balance sheet
could in theory rise further. In fact, the policy response in the depths of the crisis in March
2020 implies that such an effort could occur again should a "bad" event warrant it. This isn’t
really a financial question, but a social one. The central point of our research note on the
Fed was that markets serve several different functions, and occasionally these functions
come into conflict.
In a sense, a further expansion of the Fed's balance sheet from its current level would be an
even more massive case of proverbial can-kicking, but one that may not have to be
addressed for at least one election cycle. It would essentially be placing the near-term
social utility of markets (avoiding mass bankruptcies and even higher unemployment in
2021) above other interests (including the roles of price discovery and capital allocation,
but those have long-term social utility rather than short term).
16 Portfolio Strategy: Has the Fed gone too far?
0
0.1
0.2
0.3
0.4
0.5
0.6
0.7
0.8
Q4 1
951
Q2 1
955
Q4 1
958
Q2 1
962
Q4 1
965
Q2 1
969
Q4 1
972
Q2 1
976
Q4 1
979
Q2 1
983
Q4 1
986
Q2 1
990
Q4 1
993
Q2 1
997
Q4 2
000
Q2 2
004
Q4 2
007
Q2 2
011
Q4 2
014
Q2 2
018
Equities Debt Cash
0
10
20
30
40
50
60
70
80
Q4 1
951
Q2 1
955
Q4 1
958
Q2 1
962
Q4 1
965
Q2 1
969
Q4 1
972
Q2 1
976
Q4 1
979
Q2 1
983
Q4 1
986
Q2 1
990
Q4 1
993
Q2 1
997
Q4 2
000
Q2 2
004
Q4 2
007
Q2 2
011
Q4 2
014
Q2 2
018
Equities Debt
Cash Misc Assets

What would happen if the Fed continued to dramatically expand its balance sheet? Well,
presumably equities rally even further — probably not at the rate we have seen since March
2020, given markets are already expensive, but they would rise and one can imagine a long-
term "grind" higher through a combination of the "fear of missing out" (FOMO) and "there is
no alternative" (TINA) arguments of recent years.
In Portfolio Strategy: S&P 4000 or S&P 8000? Our strategists disagree, I argued the low-
return outlook on the S&P, while Alla pushed for the target 100% higher. I noted that in
making my low target, I was accepting that targets based on mean-reversion are
theoretically attractive but can always totally fail in the face of policy decisions. A further
Fed intervention would be one of those cases and, at the very least, the 4000 10-year
forward target on the S&P would likely be reached nine years early!
The other impact of any further Fed intervention would be to again make the market's role
as a venue for price discovery play second fiddle to its role as a venue for capital raising.
This implies assets being further delinked from "fundamentals," and a maintenance of the
current high correlation environment both within equities and between asset classes.
Stock correlation has remained stubbornly high — a horrible environment for all but the
most concentrated stock pickers — and any further expansion of the Fed's balance sheet
would likely keep it there (see Exhibit 93 and Exhibit 94).
Note: Global, daily data, six-month window. Global L/S Factors: Comp Value,
12-month Price Momentum, Quality, Composite Growth. We use rolling
correlation of absolute returns of long-short factors and correlations of
(signed) returns of stocks.
Source: MSCI, FactSet, IBES, and Bernstein analysis
Source: Datastream, Bloomberg, and Bernstein analysis
0
0.1
0.2
0.3
0.4
0.5
0.6
0.7
0.8
0.9
0.00
0.05
0.10
0.15
0.20
0.25
0.30
0.35
Jul-00
Jul-02
Jul-04
Jul-06
Jul-08
Jul-10
Jul-12
Jul-14
Jul-16
Jul-18
Jul-20
Co
rrela
tion
Co
rrela
tion
Average pairwise stock correlation (LHS)
Average pairwise factor correlation (RHS)
-1
-0.8
-0.6
-0.4
-0.2
0
0.2
0.4
0.6
0.8
1
Jun-8
9
Jun-9
1
Jun-9
3
Jun-9
5
Jun-9
7
Jun-9
9
Jun-0
1
Jun-0
3
Jun-0
5
Jun-0
7
Jun-0
9
Jun-1
1
Jun-1
3
Jun-1
5
Jun-1
7
Jun-1
9
Co
rrela
tion
Correlation across S&P 500, MSCI EM Index, Gold, Oil, US Govt 10 year
Weekly, 25 weeks

Conclusion
The bottom line is that if inflation eventually leads to high real rates and a steepening curve
then investors are right to see this as a historical turning point for the Value factor. This does
not mean that tactically Value is going to perform right now (in fact, tactically we think that
would be the wrong trade), but for horizons greater than one year, it would suggest a pro-
Value stance. However, we think that it must be recognized that there is a strong possibility
that rates do not rise and the yield curve does not steepen. In that case, the low real rates
imply that Growth assets can maintain current valuations, but the dynamics of the Value
trade would depend more on short-term movements up and down in the cycle rather than
seeing a strategic take-off in the prospects of the factor. Income in the equity markets may
well do better than Value, per se, and would also be important as a diversifier of overall
equity risk.
It is possible that a path could be steered through this with an allocation both to long-
duration Growth assets and to inflation-sensitive Deep Value. In a world where most asset
classes (equities, bonds, private equity, and credit) are either fully valued or outright
expensive, maybe the Value factor is the only "asset class" that investors can buy. But, as
we have noted, the power of mean reversion is not enough and the policy path will
determine this more than ever.

One of the most controversial questions for investors coming into 2021 is: what to do about
Value stocks? The question of whether Value is dead has rumbled for the past decade. With
the S&P trading at record multiples and valuation spreads at 90-year extremes, this
question is urgent.
There are a host of reasons why traditional Value definitions have failed over the past
decade. However, we think Covid-19 brings one crucial change: the outlook is now
inflationary. It is very hard for Value to do well as inflation falls. Now that it seems set to rise,
should investors buy cheap stocks?
The central issue here is that the rules have changed. We think while inflation will rise on a
1 year+ horizon, the yield curve will not steepen. This fundamentally changes the link
between mean-reversion of Value and inflation.
We show there are three different kinds of Value stocks:
◼ Undervalued stocks in core cyclical sectors. We show these can rally with inflation
even without the yield curve steepening. We think investors can hold such stocks now
and suggest candidates to buy.
◼ Value within commodity cyclicals. These can also rally with inflation. Moreover, as part
of a cross-asset portfolio, the Energy and Mining sectors play a role as income-bearing
assets in a higher-inflation world.
◼ Banks. Bivariate regressions of Value stocks within the Banks on both inflation and the
yield curve show that the yield curve dominates in determining relative return. Banks
can be part of a tactical pro-inflation trade, but we think over longer horizons they may
not benefit as much as expected if the yield curve does not significantly steepen.
We remain overweight US Growth in global portfolios, but think there is a role for an
exposure to selected Value names within core cyclicals. Indeed, not to own any such names
would be a risk in the case of tactical rallies higher in Value stocks.
Overall, the kinds of stocks to own right now fall into three categories. They are either long-
duration Growth stocks (e.g., Tech/Healthcare) OR sustainable dividend payers that are
crucial as fixed-income replacement holdings (e.g., in Consumer Staples) OR beaten up
core Value cyclicals that we believe are staying in business through the Covid-19 crisis.
The Value factor faces many structural headwinds, but in a world where equities, credit,
and sovereign bonds are all expensive, Value might be the only "cheap" asset to buy, and
inflation gives the impetus. However, the radical shift in the policy landscape means not all
Value stocks will mean-revert. This chapter discusses how the factor has to change.

One of the most controversial questions for portfolio positioning in conversations with PMs
over the last month has been what to do about exposure to Value factors. With Growth
stocks valued at very high multiples, is there a case to buy cheap stocks that have been
beaten by the pandemic and left behind?
We have asked in previous research the question whether Value is dead.17 We concluded
that it was not entirely dead, but that it faced structural headwinds in terms of the loss of
defensive moats around industries, while the switch in corporate investment from tangible
to intangible assets raises the question of whether value is measured appropriately. But
one element that has been missing for the last 10 years is inflation. It is really hard for Value
to rally if inflation is falling, as it has been for much of the last decade.
In many ways, Covid-19 has accelerated trends that were already in place — e.g., the
downward path of discount rates. But in one important aspect, we think it changes the
macro backdrop for markets and that is inflation. We think the policy response to Covid-19
will be inflationary on a one-year time frame, once we are past the current deflationary
shock.18
There is, thus, a potential strategic AND a tactical case for Value. The strategic case:
◼ All major asset classes are expensive (equities, credit, sovereign bonds, and private
equity). With valuations across the market at 90-year extremes, maybe the Value
factor is the only cheap "asset" that investors can buy,
◼ The policy change is of such magnitude that we think it will lead to inflation and, when
inflation goes up, Value usually does well.
To that we can append a tactical case:
◼ Inventories have collapsed and as they rebound could lead to tentative pricing power
in some specific cyclical industries.
◼ The level of disagreement between analysts reached a record high in H1 2020 but is
now falling. As disagreement falls, it tends to help Value companies.
◼ Value tends to be pro-cyclical and can "look through" to a recovery in macro data in
2021.
This all may be the case but we think, in the famous words, that it is different this time. The
reason for the difference is that post Covid-19 we find ourselves in a new policy regime.
We think inflation will return on a time horizon of around a year, but the yield curve will not
steepen. The Fed has told us this already, and if that is not enough to keep market yields
from rising, there is always yield curve control as a next step. So, the past relationship
between Value and inflation might not continue.
17 Global Quantitative Strategy: Has Value met its Waterloo? 18 Portfolio Strategy: Inflation, investing and the coming of MMT

In this chapter, we disaggregate the Value factor into a core cyclical, a commodity cyclical,
and a Financials component and show how these three elements respond differently to the
yield curve and to inflation.
Equity PMs should have exposure to Value stocks in core cyclical groups right now in their
portfolios. The approach here should be to find beaten up stocks that are likely staying in
business, not being nationalized, and can respond to positive economic data when it
comes. These companies likely need a resetting of the supply levels in their industries (e.g.,
fewer seats available on planes) or for inventories to find a floor. At that point, a return of
inflation could be a signal of pricing power returning.
For cross-asset investors having exposure to cheap valuations is important in a world
where most assets are expensive; however, the framework we detail in this chapter gives a
route to separate cheap valuations that might give a mean-reversion signal and those that
don't. We also assume the cross-asset outlook will focus on assets that can offer inflation
protection, and commodity Value names can help in this regard.
There are structural reasons why valuation has not worked as a factor in recent years, such
as declining bond yields impeding mean reversion and the switch of corporate investments
from tangible to intangible assets, but one key missing piece has been inflation. As shown
in our "The Fed, the Market, the Value-Growth Debate, and Inflation" chapter, historically
the Value factor has done best when inflation has risen. Inflation has persistently
disappointed on the downside over the last five years. If inflation is now set to rise, is this
the key support for Value that has been lacking? If so, should one be buying the cheaper
Value sectors?
From an asset-owner perspective, and taking a strictly cross-asset view, a major issue is
nearly all assets being expensive compared to history: equities, sovereign bonds, and
credit. At the same time, valuation spreads across the market are, by some measures, at
extreme levels. Exhibit 98 shows the current market-cap-weighted trailing PE for
expensive stocks in the US is 85x, at record levels, while cheap stocks trade on the same
absolute multiple as they did in the early 1960s, even though discount rates are a lot lower
now than they were then.
So, maybe in a long-short sense, Value is the only cheap "asset" that investors can buy.
Valuations rarely matter in determining the short-term tactical outlook, but over a longer-
term strategic horizon, valuations tend to matter more. But how much of this valuation
spread can mean-revert? We have previously discussed how the outlook for a prolonged
period of low or negative real rates implies that at least some of the spread may not mean-
revert in the near term, though there are elements of value cyclicals that may benefit from
mean reversion (see Exhibit 95).

Note: The historical series is derived from the Ken French data library and it is the market-cap-weighted inverted trailing earnings yield for the most expensive
and cheapest quintile of stocks out of the largest 1,200 US stocks. We exclude stocks with negative trailing earnings.
Source: Ken French data library, MSCI, Bloomberg, FactSet, and Bernstein analysis
A potential tactical driver for cyclical Value stocks is the sharp contraction in levels of
inventories held by corporates, particularly in the US. Even before Covid-19 came along,
inventory levels were low. Over the last six months, they have fallen to record lows. With
inventory levels this tight, there is potential for them to snap back.
The normalization of the Covid-19-related spike in levels of uncertainty around earnings
forecasts, as measured by the dispersion of analyst EPS estimates around the average, is a
positive, both for the market and for Value stocks. Although we have seen a lessening of
uncertainty recently, there is still a substantially higher level of dispersion in estimates than
before the pandemic, for US and European equities overall (see Exhibit 96). But cheap
stocks in the US have seen a substantial fall in uncertainty and a rapid retrenchment of the
dispersion gap vs. expensive stocks (see Exhibit 97). This should also be of some tactical
support to Value stocks.
0
10
20
30
40
50
60
70
80
90
1951
1953
1955
1957
1959
1961
1963
1965
1967
1969
1971
1973
1975
1977
1979
1981
1983
1985
1987
1989
1991
1993
1995
1997
1999
2001
2003
2005
2007
2009
2011
2013
2015
2017
2019
Rati
o
Cheap Expensive
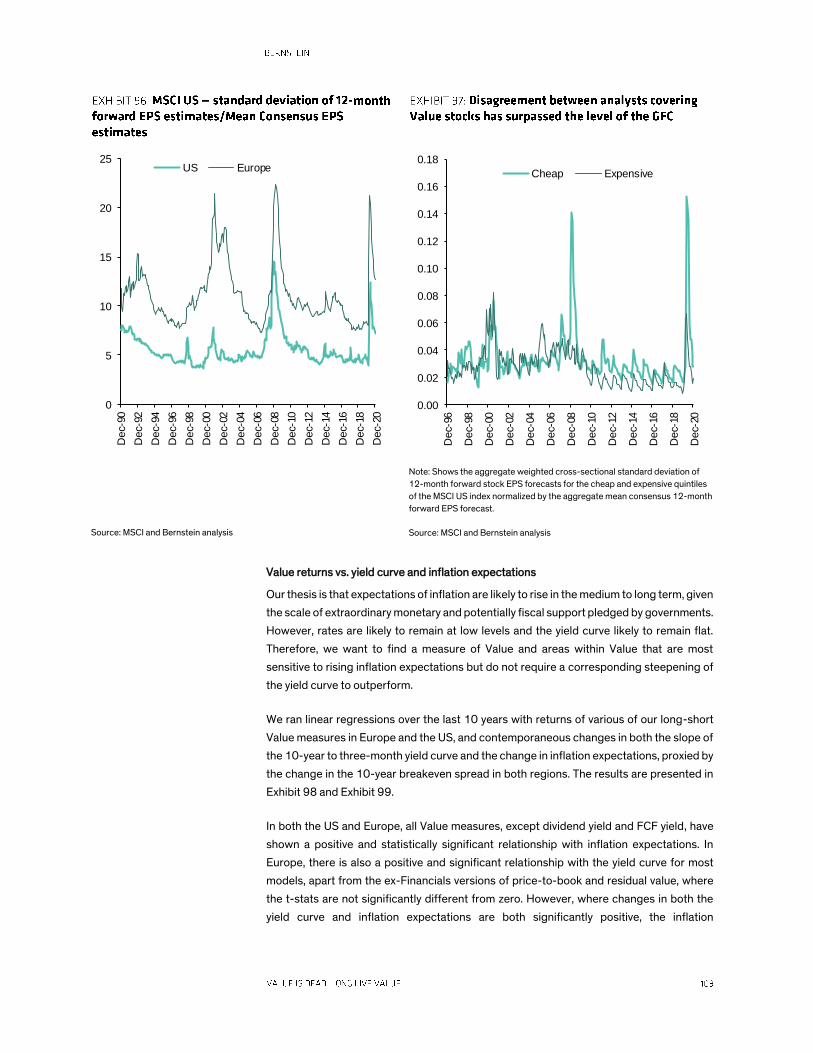
Source: MSCI and Bernstein analysis
Note: Shows the aggregate weighted cross-sectional standard deviation of
12-month forward stock EPS forecasts for the cheap and expensive quintiles
of the MSCI US index normalized by the aggregate mean consensus 12-month
forward EPS forecast.
Source: MSCI and Bernstein analysis
Value returns vs. yield curve and inflation expectations
Our thesis is that expectations of inflation are likely to rise in the medium to long term, given
the scale of extraordinary monetary and potentially fiscal support pledged by governments.
However, rates are likely to remain at low levels and the yield curve likely to remain flat.
Therefore, we want to find a measure of Value and areas within Value that are most
sensitive to rising inflation expectations but do not require a corresponding steepening of
the yield curve to outperform.
We ran linear regressions over the last 10 years with returns of various of our long-short
Value measures in Europe and the US, and contemporaneous changes in both the slope of
the 10-year to three-month yield curve and the change in inflation expectations, proxied by
the change in the 10-year breakeven spread in both regions. The results are presented in
Exhibit 98 and Exhibit 99.
In both the US and Europe, all Value measures, except dividend yield and FCF yield, have
shown a positive and statistically significant relationship with inflation expectations. In
Europe, there is also a positive and significant relationship with the yield curve for most
models, apart from the ex-Financials versions of price-to-book and residual value, where
the t-stats are not significantly different from zero. However, where changes in both the
yield curve and inflation expectations are both significantly positive, the inflation
0
5
10
15
20
25
Dec-
90
Dec-
92
Dec-
94
Dec-
96
Dec-
98
Dec-
00
Dec-
02
Dec-
04
Dec-
06
Dec-
08
Dec-
10
Dec-
12
Dec-
14
Dec-
16
Dec-
18
Dec-
20
US Europe
0.00
0.02
0.04
0.06
0.08
0.10
0.12
0.14
0.16
0.18
Dec-
96
Dec-
98
Dec-
00
Dec-
02
Dec-
04
Dec-
06
Dec-
08
Dec-
10
Dec-
12
Dec-
14
Dec-
16
Dec-
18
Dec-
20
Cheap Expensive

expectations variable tends to have a higher t-stat and, therefore, is the most statistically
significant of the two variables in driving Value returns.
US Value returns, apart from those defined as dividend and FCF yield, have also exhibited
a strong statistically significant relationship with changes in 10-year breakevens, with the
t-stats indicating a stronger relationship than in Europe.
Note: Regressions on six-month returns of long-short Value metrics against
contemporaneous six-month changes in the monthly frequency 10-year to
three-month yield curve (German) and monthly German 10-year breakeven.
Data from December 2009 to August 2020. The shading highlights where the
relationship is positive and statistically significant.
Source: MSCI, FactSet, and Bernstein analysis
Note: Regressions on six-month returns of long-short Value metrics against
contemporaneous six-month changes in the monthly frequency US 10-year to
three-month yield curve and monthly US 10-year breakeven. Data is from
December 2009 to August 2020. The green/light gray shading highlights
where the relationship is positive and statistically significant. The blue/dark
gray shading highlights where the relationship is negative and statistically
significant.
Source: MSCI, FactSet, and Bernstein analysis
From the regression analysis, we conclude that since 2009 changes in inflation
expectations as proxied by changes in 10-year breakeven rates have been more influential
on the returns of most definitions of Value than changes in the yield curve. However, within
Value as a style, we think there are groups of commodity Value and cyclical Value stocks
that are particularly sensitive to changes in inflation expectations and not so reliant on a
steepening of the yield curve.
We ran further regressions on the Value subgroups of our European and US Value
measures to test the sensitivities of the intra-Value groups to changes in inflation
expectations and the yield curve.
We divide our cheap Value stocks into three subbaskets. The Cyclical Value basket
comprises Industrials and Consumer Discretionary stocks, the Commodity Value basket
comprises Energy and Materials stocks, and Financials comprises Financials and Real
Estate stocks. We calculated the equal-weighted performance of each of these baskets
Factor Item Intercept Breakeven
Yield
Curve RSq
Price to Book Coeff -0.01 0.15 0.08 0.33
T -1.24 3.81 3.00
Comp Val Coeff -0.02 0.11 0.06 0.23
T -2.20 2.92 2.41
DY Coeff -0.01 0.03 -0.02 0.01
T -1.59 1.06 -1.08
Forward PE Coeff -0.02 0.12 0.06 0.28
T -2.18 3.36 2.67
Residual Value Coeff -0.01 0.08 0.04 0.26
T -1.45 3.27 2.58
Price to Book (ex fin) Coeff -0.01 0.18 0.02 0.33
T -1.59 5.73 0.75
DY (ex fin) Coeff -0.02 -0.02 -0.02 0.02
T -3.71 -0.65 -0.83
Residual Value (ex fin) Coeff -0.01 0.06 0.03 0.15
T -1.38 2.46 1.67
FCF Yield (ex fin) Coeff 0.02 0.00 -0.01 0.00
T 3.06 0.16 -0.43
Factor Item Intercept Breakeven
Yield
Curve RSq
Price to Book Coeff -0.03 0.14 -0.03 0.31
T -6.06 7.41 -2.38
Comp Val Coeff -0.03 0.10 -0.04 0.14
T -3.95 4.39 -3.20
DY Coeff -0.02 0.02 -0.09 0.38
T -3.45 1.10 -8.15
Forward PE Coeff -0.01 0.06 0.01 0.08
T -1.27 2.56 0.57
Residual Value Coeff -0.01 0.08 0.01 0.23
T -2.68 4.70 1.39
Price to Book (ex fin) Coeff -0.03 0.12 -0.03 0.25
T -5.74 6.42 -2.41
DY (ex fin) Coeff -0.02 0.02 -0.08 0.33
T -3.19 1.06 -7.36
Residual Value (ex fin) Coeff -0.02 0.09 0.00 0.24
T -3.37 5.48 0.20
FCF Yield (ex fin) Coeff 0.01 0.03 0.00 0.03
T 1.92 1.59 0.24

back through time, relative to the equal-weighted benchmark and ran regressions of 12-
month relative returns for each basket on contemporaneous changes in the yield curve and
inflation expectations (10-year breakevens) since the end of 2009.
The results show that in the US, Commodity and Cyclical Value returns are much more
sensitive to changes in inflation expectations than to a steepening yield curve (see
Exhibit 101). Even where the coefficients on both are statistically significant, the change in
inflation expectations t-stats imply a much stronger positive relationship between
Commodity and Cyclical Value returns to inflation expectations than to changes in the yield
curve. This implies Cyclical and Commodity baskets may not need a steepening yield curve
in addition to rising inflation expectations in order to outperform. However, for US
Financials Value, yield curve changes are just as important as rising inflation expectations,
and both may need to occur to see any sustainable outperformance of the Value subgroup.
Though this does not preclude Financials from benefiting tactically from upswings in
inflation, it just might not be a long-term strategic call for the sector.
In Europe, the results are a bit more mixed but generally draw similar conclusions.
Commodity and Cyclical Value are more sensitive to rising inflation expectations than a
rising yield curve, whereas in European Financials Value, returns are dependent on changes
in the yield curve and not to inflation expectations (see Exhibit 100).
Note: Regressions on 12-month returns of the combined baskets of Materials
/Energy (Commodity); Industrials/Consumer Cyclical (Cyclicals) from cheap
price-to-book, Residual Value style relative to the equal-weighted benchmark
against contemporaneous 12-month changes in the monthly frequency
10-year to three-month yield curve (German) and monthly German 10-year
breakeven. Data is from December 2009 to August 2020. The shading
highlights where the relationship is positive and statistically significant.
Source: MSCI, FactSet, and Bernstein analysis
Note: Regressions on 12-month returns of the combined baskets of Materials
/Energy (Commodity); Industrials/Consumer Cyclical (Cyclicals) from cheap
price-to-book, Residual Value style relative to the equal-weighted benchmark
against contemporaneous 12 month changes in the monthly frequency US
10-year to three-month yield curve and monthly US 10-year breakeven. Data
is from December 2009 to August 2020. The shading highlights where the
relationship is positive and statistically significant.
Source: MSCI, FactSet, and Bernstein analysis
This leads us to recommend specific stocks in the core cyclicals that show up on our
Residual Value metric. We think these are candidates to go into a portfolio right now. In
addition, for those particularly focused on inflation risk, commodity cyclicals form another
group, though the path to buying these could take more time. We would stay away from the
Banks.
Value Measure Sector Item Intercept Breakeven
Yield
Curve RSq
Price to Book Commodity Coeff 0.03 0.31 0.01 0.21
T 1.33 4.66 0.30
Cyclicals Coeff 0.06 0.10 0.02 0.09
T 4.88 2.53 0.82
Financials Coeff 0.01 0.01 0.13 0.29
T 0.48 0.35 5.88
Residual Value Commodity Coeff 0.00 0.33 0.00 0.20
T 0.15 4.71 0.03
Cyclicals Coeff 0.03 0.01 0.05 0.09
T 3.76 0.30 2.86
Financials Coeff 0.00 -0.04 0.18 0.29
T -0.30 -0.79 6.34
Value Measure Sector Item Intercept Breakeven
Yield
Curve RSq
Price to Book Commodity Coeff -0.08 0.29 0.02 0.52
T -6.97 10.37 1.10
Cyclicals Coeff 0.04 0.18 0.04 0.42
T 4.33 7.81 2.30
Financials Coeff 0.00 0.07 0.03 0.20
T 0.48 3.68 2.55
Residual Value Commodity Coeff -0.10 0.30 0.01 0.52
T -8.22 10.63 0.75
Cyclicals Coeff 0.01 0.12 0.02 0.42
T 1.91 7.79 2.31
Financials Coeff 0.03 0.16 0.09 0.35
T 2.47 4.91 4.45

Residual Value is our favored measure of Value, which is adjusted for fundamentals and
involves estimating by a cross-sectional regression how much of a stock's sector relative
price-to-book multiple is explained by its sector-relative profitability (ROE). The residual
from the regression provides a measure of value that can be thought of as a mispricing
relative to the firm's fundamentals. We have found in empirical tests that stocks selected
using the residual definition of Value have outperformed the simple price-to-book measure
of Value over the long run (Global Quantitative Strategy: Value without the traps - how and
where to look for mispriced opportunities).
The stocks mentioned in Exhibit 102 and Exhibit 103 are based on the Cyclical Value areas
of our cheap Residual Value stock screen. However, we have also overlaid a forward FCF
yield filter and, where appropriate, the rating from Bernstein stock analysts.
Note: O= Outperform rating, M= Market-Perform rating, U = Underperform rating. Further details of the research and important disclosures of the covered
securities are available on Bernstein Research website: www.bernsteinresearch.com. Other stocks are not covered by Bernstein.
Source: FactSet, MSCI, and Bernstein analysis
Sedol Company
12m Fwd
FCF Yield
Bernstein
Rating
5497102 VOLKSWAGEN STAMM 9.2 M
5529027 DAIMLER 6.7 O
4712798 RENAULT 4.6 O
5756029 BMW STAMM 5.2 O
BMD8KX7 FIAT CHRYSLER AUTOMOBILE 4.3
BMTVQK9 SIEMENS ENERGY 2.1
B1XH026 VINCI 6.8
4253059 AP MOLLER MAERSK A 12.5
7380482 SAINT-GOBAIN 7.6
BB22L96 KION GROUP 4.6
5228658 RANDSTAD NV 5.7
4253048 AP MOLLER MAERSK B 12.5
BZ1G432 MELROSE INDUSTRIES 1.1
4002121 BOUYGUES 12.1

Note: O= Outperform rating, M= Market-Perform rating, U = Underperform rating. Further details of the research and important disclosures of the covered
securities are available on Bernstein Research website: www.bernsteinresearch.com. Other stocks are not covered by Bernstein.
Source: FactSet, MSCI, and Bernstein analysis
Sedol Company
12m Fwd
FCF Yield
Bernstein
Rating
2523044 CARNIVAL CORP (US) -17.6
2635701 NEWELL BRANDS 7.4
2615468 FORD MOTOR CO 4.8
2598699 MOHAWK INDUSTRIES 5.6
2111955 BORGWARNER 5.8
2754907 ROYAL CARIBBEAN GROUP -12.2
2708841 PULTEGROUP 7.3
2250687 HORTON (DR) 4.7
B665KZ5 GENERAL MOTORS 6.1
2511920 LENNAR CORP A 5.8
B570P91 LEAR CORP 7.3
2971029 LKQ CORP 7.5
BY7QL61 JOHNSON CONTROLS (NEW) 4.7
BK9DTN5 L3HARRIS TECHNOLOGIES 7.3 O
2365161 GENERAL DYNAMICS CORP 7.0 M
2885937 TEXTRON 5.1
2955733 WABTEC CORP 5.7
BF0LKD0 KNIGHT-SWIFT TRANSPORT 7.3
2818740 SNAP-ON 6.9
2469052 JACOBS ENGINEERING GROUP 3.7 O
BL5GZ82 INGERSOLL-RAND 3.7
2665861 PACCAR 5.9 M
B1FW7Q2 OWENS CORNING 8.6
2028174 AMERCO
BM5M5Y3 RAYTHEON TECHNOLOGIES 4.1 M


◼ A mystery of H2 2020, is why companies paying attractive yields, and especially those
with high FCF yields, have delivered such a ghastly performance. Aren't investors
meant to be desperate for yield right now? This chapter analyzes why this might have
happened and explores what kinds of high-yielding companies can be bought now.
◼ FCF Yield used to be the most acyclical of the main factors, working in most
environments, offering an attractive halfway house between Value and Quality.
However, we show that the sensitivity of FCF Yield to inflation expectations has picked
up. In common with other Value factors, the tentative increase in inflation expectations
hasn't been enough yet to overwhelm the near-term reality of our current deflationary
shock.
◼ Some of this increased sensitivity to inflation comes from an increase in the weight of
commodity stocks in the FCF Yield factor (reflecting their greater capital discipline in
recent years). But the link also reflects the greater sensitivity of most assets to inflation
and rates, as rates have fallen. When long duration is so in favor, it is hard for a short-
duration factor such as FCF Yield to outperform.
◼ However, within the group of high-FCF-yield companies there are distinctions. Core
cyclicals have started to do better. We think there is a good case to own such cyclicals
with generous FCF yields, at the very least as a way of having a high-quality exposure
to any tactical Value rebounds.
◼ Commodity stocks with high FCF yields have suffered, but we think a case for these
emerges once a recovery in forward inflation expectations can move above the pre-
Covid-19 level,
◼ The other group of high-FCF-yield companies are in Staples and Telcos. We would be
happy to own the Staples in that group now in line with our belief that the sector sees
a bid from cross-asset investors. For the Telcos, it is perhaps more of a case of seeing
what level of capital intensity is required for the group.
◼ The bottom line is that the FCF Yield factor has disappointed in 2020. It is meant to be
an all-weather factor, but has seen its worst performance in 20 years. Tactically,
however, there is a case to be made to selectively own high-yielding stocks at present.
For those with longer horizons, there is an even stronger strategic case, as part of a
fixed income replacement trade.
Tactical vs. strategic cross-asset case
We find it odd that companies paying attractive yields have fared so poorly in recent
months. Aren't investors meant to be desperate for yield? Maybe that would be

understandable if investors were fearful of dividends being cut, but the underperformance
is present even for companies with high levels of forward FCF yield. Maybe this is just about
everything underperforming vs. high growth? Well not entirely — the FCF Yield factor has
done poorly even relative to the market ex-Tech.
This chapter tries to explain this recent underperformance and suggests what kind of yield
strategies investors can buy. The focus of this chapter is tactical, for investing over 2021.
Separately, there is a strategic and a structural demand for yield in the equity market from
the need of asset owners to assess their high-grade fixed income portfolios in light of the
need to generate real positive returns and control duration risk. We covered this at length
in Portfolio Strategy: The cross-asset case for Staples and Portfolio Strategy: The best
fixed income portfolio right now is …. in equities.
In 2020, a strategy of buying the highest-yielding quintile of stocks in the market and selling
the lowest-yielding quintile of stocks would have lost investors in US stocks 26% if they
used dividend yield to discriminate between the long-short baskets or 21% if they used
FCF yield. Investors in European stocks would have fared even worse, with long-short
dividend yield losing 27% and long-short FCF yield losing 29% (see Exhibit 104 and
Exhibit 105).
Source: FactSet, IBES, and Bernstein analysis Source: FactSet, IBES, and Bernstein analysis
This is a problem for the large section of investors who invest for income as opposed to
growth. So why do we think that equity yield strategies are underperforming and can we
find any groups of high-yielding stocks that may currently offer more stable returns?
Even though the low rates on offer in bond markets should make high-dividend-yield
stocks more attractive, we understand that investors may be skeptical about the ability and
60
65
70
75
80
85
90
95
100
105
Dec-
19
Jan-2
0
Feb
-20
Mar-
20
Apr-
20
May-
20
Jun-2
0
Jul-20
Aug-2
0
Sep-2
0
Oct-20
Nov-
20
Dec-
20
US - DY(High/Low)
US - FCF Yield (High/Low)
60
65
70
75
80
85
90
95
100
105
Dec-
19
Jan-2
0
Feb
-20
Mar-
20
Apr-
20
May-
20
Jun-2
0
Jul-20
Aug-2
0
Sep-2
0
Oct-20
Nov-
20
Dec-
20
Europe - DY(High/Low)
Europe - FCF Yield (High/Low)

willingness of companies to maintain payouts. European banks and companies that have
sought government assistance during the pandemic have been discouraged from making
dividend payments and buyback distributions to shareholders. Moreover, the sectors
hardest hit by the pandemic may be more focused on preserving cash than paying
dividends. With increased risk around the sustainability of payouts, it is perhaps
understandable that investors have been unwilling to bid high-dividend-yield stocks higher.
However, the underperformance of the FCF Yield factor, which excludes Financials stocks
and tends to allocate to companies that can better maintain and grow dividends, is more of
a puzzle. We have highlighted in previous research (Global Quantitative Strategy: FCF yield
- the deep dive) that over the long term a long-short strategy of buying high FCF stocks and
selling low FCF stocks has produced superior risk-adjusted returns, outperforming long-
short Quality (ROE), Growth (LTG), Momentum, Size and all the other Value-based
measures such as price-to-book,12-month forward PE and dividend yield. Furthermore,
these superior returns historically earned by the factor globally have been replicable across
regions (see Exhibit 106 to Exhibit 108).
Moreover, a particularly attractive feature of the strategy has been its ability to generate
positive returns regardless of the economic cycle. That is part of the reason why it is our
favored strategic Value-based factor. This used to be the most acyclical of all the main
factors. Has something changed?
Note: January1992 to September 2020
Source: FactSet, IBES, and Bernstein analysis
Note: January1992 to September 2020
Source: FactSet, IBES, and Bernstein analysis
Note: January1992 to September 2020
Source: FactSet, IBES, and Bernstein analysis
So why do we think the FCF Yield factor has not performed as expected in 2020?
Like for other Value-based factors, we think the drop in inflation expectations may be partly
to blame. The recent returns of long-short FCF Yield has moved closely with measures of
forward inflation expectations. This is particularly the case in the US, where FCF has
correlated as strongly with 5y5y forward inflation swaps as the more traditional measures
of Value, such as price-to-book and our Composite Value factor. In Europe, the relationship
between FCF Yield returns and inflation has not been as strong as in the US, but is still
significantly positive, also leading to the conclusion that falling inflation expectations have
-0.1
0
0.1
0.2
0.3
0.4
0.5
0.6
0.7
0.8
0.9
-0.3
-0.2
-0.1
0
0.1
0.2
0.3
0.4
0.5
-0.1
0
0.1
0.2
0.3
0.4
0.5
0.6

been an impediment to the performance of FCF Yield and other Value measures in general,
despite the historically wide valuation spreads between cheap and expensive stocks.
Source: FactSet, IBES, and Bernstein analysis Source: FactSet, IBES, and Bernstein analysis
It is notable that the FCF Yield factor has not responded to the latest uptick in inflation
expectations illustrated in Exhibit 109 and Exhibit 110. We think this upward move has only
really reversed a portion of the collapse in expectations of inflation that we have seen in
recent years and may not yet denote a significant change in expectations of inflation. We
may well need to see further upward moves in order to translate into FCF Yield and Value
outperformance.
We also looked at the changing sensitivity of FCF Yield factor returns to changing inflation
expectations over a longer horizon to gauge whether the recent co-movement with
inflation expectations is unusual. Exhibit 111 shows the t-stats of a rolling three-year
regression of six-month long-short US FCF Yield factor returns on six-month changes in
the 10-year breakeven rate and the US yield curve. The relationship between FCF factor
returns to inflation expectations is usually negative, which makes sense as higher inflation
would normally be associated with a corresponding rise in interest rates, a negative for a
yield strategy. However, the relationship has moved significantly positive over the most
recent three years with a further leg upward in 2020 (see Exhibit 111).
Why has this happened and what may have been the cause? If we disaggregate the FCF
Yield factor into the long and the short side of the trade and assess the impact of inflation
and interest rates on each side separately, then that may provide some insight. The long
side of the strategy, the high-yield stocks should in theory benefit from a yield substitution
effect as inflation expectations and market yields have fallen in recent years. However, the
short side of the trade, which not only is low yield but also long duration would also benefit
60
70
80
90
100
110
120
0.6
1.1
1.6
2.1
2.6
3.1
Jan-1
5
Jul-15
Jan-1
6
Jul-16
Jan-1
7
Jul-17
Jan-1
8
Jul-18
Jan-1
9
Jul-19
Jan-2
0
Jul-20
Jan-2
1
US 5y5y inflation index (LHS)
US - FCF Fwd (RHS)
75
85
95
105
115
125
135
0.6
0.8
1
1.2
1.4
1.6
1.8
2
Jan-1
5
Jul-15
Jan-1
6
Jul-16
Jan-1
7
Jul-17
Jan-1
8
Jul-18
Jan-1
9
Jul-19
Jan-2
0
Jul-20
Jan-2
1
Europe 5y5y inflation index (LHS)
Europe - FCF Fwd (RHS)

from low interest rates, as the Value of future cash flows increase as they are discounted at
lower rates. We have written extensively about the attractiveness of long vs. short duration
in an era of low interest rates (Portfolio Strategy: What is a Growth stock today?) and the
persistence of high profitability. At present, due to record low interest rates, we believe the
"duration" effect on low-yielding stocks is stronger than the substitution effect on high-
yield stocks and, therefore, the current record low rates favor an outperformance of low-
yield (high-duration) stocks over high-yield (low-duration) stocks.
Note: Shows the t-stat from a three-year rolling regression since August 1998 of six-month long-short returns of US FCF Yield factor and contemporaneous
returns of 10-year breakeven spreads and 10-year to three-month US yield curve.
Source: Bloomberg and Bernstein analysis
In addition, in recent years the composition of the high FCF Yield basket has become more
exposed to commodity sectors, as these companies have improved capital discipline and
increased FCF generation. The increased exposure to commodity stocks would also result
in a greater sensitivity to inflation over time (see Exhibit 112).
-10
-8
-6
-4
-2
0
2
4
6
8
10
Feb-0
2
Aug-0
2
Feb-0
3
Aug-0
3
Feb-0
4
Aug-0
4
Feb-0
5
Aug-0
5
Feb-0
6
Aug-0
6
Feb-0
7
Aug-0
7
Feb-0
8
Aug-0
8
Feb-0
9
Aug-0
9
Feb-1
0
Aug-1
0
Feb-1
1
Aug-1
1
Feb-1
2
Aug-1
2
Feb-1
3
Aug-1
3
Feb-1
4
Aug-1
4
Feb-1
5
Aug-1
5
Feb-1
6
Aug-1
6
Feb-1
7
Aug-1
7
Feb-1
8
Aug-1
8
Feb-1
9
Aug-1
9
Feb-2
0
Aug-2
0
t-sta
t

Note: Composition of the US high-FCF-yield basket into broad subgroups. The Cyclical group comprises stocks in the Consumer Discretionary and Industrials
sectors. The Commodity group comprises stocks in the Energy and Materials sectors. The other subgroup consists of Consumer Staples, Technology,
Healthcare, Utilities, and Communications sectors.
Source: FactSet, IBES, and Bernstein analysis
Another possible explanation for the underperformance of long-short FCF strategies is the
sector exposures that result from going long high yield and short low yield. Exhibit 113 and
Exhibit 114 show that in both the US and Europe, FCF Yield is currently overweight Energy,
Communications, and Materials, while underweight Tech and Healthcare. In Europe, both
Energy and Materials have underperformed woefully, while IT and Healthcare on the short
side have outperformed. In the US, Energy has been a laggard while Technology and
Consumer Discretionary have outperformed.
However, if the cause of significant underperformance within the FCF Yield style could be
wholly explained by sector skews within the FCF Yield style, then one would expect the
performance of a sector-neutral version, which irons out these skews, to be significantly
different from the selection of a screening across the market. We compare the non-sector-
neutral and the sector-neutral versions of high FCF stocks vs. a market ex Financials and
ex Technology benchmark in Exhibit 115 and Exhibit 116. Even though the performance of
sector-neutral High FCF Yield is better than the non-sector neutral version in Europe, it still
underperforms strongly. While in the US the performance of both versions is quite similar.
We therefore conclude that even after adjusting for sector skews in the construction of the
FCF Yield style, there remains substantial underperformance of high-FCF-yielding stocks.
0
10
20
30
40
50
60
70
Dec-
91
Dec-
92
Dec-
93
Dec-
94
Dec-
95
Dec-
96
Dec-
97
Dec-
98
Dec-
99
Dec-
00
Dec-
01
Dec-
02
Dec-
03
Dec-
04
Dec-
05
Dec-
06
Dec-
07
Dec-
08
Dec-
09
Dec-
10
Dec-
11
Dec-
12
Dec-
13
Dec-
14
Dec-
15
Dec-
16
Dec-
17
Dec-
18
Dec-
19
%
Cyclical Commodity Other

Note: Chart shows the net sector exposures of high-FCF-yield stocks relative
to low-FCF stocks for our FCF Yield style based on 12-month forward FCF
yield.
Source: IBES, FactSet, and Bernstein analysis
Note: Chart shows the net sector exposures of high-FCF-yield stocks relative
to low-FCF stocks for our FCF Yield style based on 12-month forward FCF
yield.
Source: IBES, FactSet, and Bernstein analysis
Source: IBES, FactSet, and Bernstein analysis Source: IBES, FactSet, and Bernstein analysis
80
85
90
95
100
105
Dec-
19
Jan-2
0
Feb
-20
Mar-
20
Apr-
20
May-
20
Jun-2
0
Jul-20
Aug-2
0
Sep-2
0
Oct-20
Nov-
20
Dec-
20
FCF Fwd (NSN) FCF Fwd (SN)
80
85
90
95
100
105
Dec-
19
Jan-2
0
Feb
-20
Mar-
20
Apr-
20
May-
20
Jun-2
0
Jul-20
Aug-2
0
Sep-2
0
Oct-20
Nov-
20
Dec-
20
FCF Fwd (NSN) FCF Fwd (SN)

Component groups within the FCF factor
We express the view in the "Inflation, Investing, and the Coming of MMT" chapter that
extensive fiscal and monetary stimulus, combined with potential supply bottlenecks may
eventually lead to a more significant rise in inflation over the next one-year-plus horizon in
conjunction with action to prevent a corresponding steepening of the yield curve. Can FCF
as a whole, or at least elements within FCF outperform should both these conditions
materialize? We show in the "Value is Dead, Long Live Value" chapter that there are stock
groupings within Value that are more sensitive to inflation expectations and less sensitive
to changes in the yield curve and, therefore, could provide investors with a more tailored
list of names to profit from these macro conditions. We carried out a similar analysis here
using the subgroups within our FCF models in the US and Europe (see Exhibit 117 and
Exhibit 118).
We regressed six-month rolling long-short returns for trailing FCF Yield and forward FCF
Yield models vs. contemporaneous changes in inflation expectations, proxied by six-month
changes in 10-year breakeven rates and six-month changes in the 10-year to three-month
yield curve.
Since 2009, returns of FCF Yield overall and the subgroups within FCF Yield have exhibited
higher sensitivities to changes in inflation expectations than to the yield curve in most
cases. In the US, all the models tested exhibited a strong positive relationship with changes
in the 10-year breakeven rate with all but the overall trailing FCF Yield model showing a
significantly positive relationship. In Europe, the results are a bit more mixed but the
coefficients on inflation expectations for all the FCF models are positive, if not as significant
in Europe as in the US. Interestingly, the inflation expectation t-stats tend to be higher for
the models based on forward measures of FCF Yield than for trailing FCF Yield.

Note: Regressions on six-month returns of long-short FCF subgroups against
contemporaneous six-month changes in the monthly frequency US 10-year to
three-month yield curve and monthly US 10-year breakeven. Data from
December 2009 to August 2020. The green/light gray shading highlights
where the relationship is positive and statistically significant. The red/dark
gray shading highlights where the relationship is negative and statistically
significant.
Source: FactSet, IBES, and Bernstein analysis
Note: Regressions on six-month returns of long-short FCF subgroups against
contemporaneous six-month changes in the monthly frequency 10-year to
three-month yield curve (German) and monthly German 10-year breakeven.
Data from December 2009 to August 2020. The green/light gray shading
highlights where the relationship is positive and statistically significant. The
red/dark gray shading highlights where the relationship is negative and
statistically significant.
Source: FactSet, IBES, and Bernstein analysis
While FCF as a whole has underperformed strongly in 2020 as inflation expectations have
started to rise, we think there may be subgroupings within the FCF factor that have begun
to respond (see Exhibit 119 to Exhibit 122). We split both of our trailing and forward high
FCF yield model constituents into three groups: the "commodity cyclicals" comprised of
Energy and Materials stocks, the "core cyclical" grouping made up of Industrials and
Consumer Discretionary stocks, and the remaining stocks were put into the “other”
category. We tracked the performance of these baskets vs. our equal-weighted ex
Financials benchmark in the US and Europe. Since March, when the equity market
troughed, we have seen a distinct outperformance of the high-yielding cyclical group of
stocks in both the US and Europe, and for models using both trailing and forward FCF
yields. At the same time, both the high-yielding commodity stocks and the "other" stocks
have underperformed the benchmark or have performed in line with the benchmark.
Factor Label Intercept
10Yr
Breakeven
Yield
Curve R sq
FCF Yield (trailing) Coeff 0.01 0.03 0.00 0.03
T 1.92 1.59 0.24
FCF Yield (Forward) Coeff 0.00 0.07 -0.01 0.11
T 0.01 3.78 -0.76
FCF Commodity Coeff 0.01 0.08 -0.05 0.08
T 1.61 2.91 -2.65
FCF Cyclical Coeff 0.00 0.05 0.02 0.08
T -0.48 2.14 1.28
FCF Other Coeff 0.00 0.06 0.02 0.15
T -0.14 3.28 1.55
Fwd FCF Commodity Coeff 0.04 0.08 -0.03 0.05
T 5.17 2.65 -1.68
Fwd FCF Cyclical Coeff 0.01 0.14 -0.03 0.17
T 1.11 5.00 -1.60
Fwd FCF Other Coeff -0.03 0.05 0.03 0.13
T -4.35 2.54 1.99
Factor Label Intercept
10Yr
Breakeven
Yield
Curve R sq
FCF Yield (trailing) Coeff 0.02 0.00 -0.01 0.00
T 3.06 0.16 -0.43
FCF Yield (Forward) Coeff 0.01 0.05 0.01 0.05
T 2.08 1.65 0.45
FCF Commodity Coeff 0.04 0.06 0.07 0.13
T 4.57 1.46 2.26
FCF Cyclical Coeff 0.04 0.01 0.01 0.01
T 4.76 0.25 0.52
FCF Other Coeff -0.01 0.01 -0.05 0.07
T -1.83 0.47 -2.60
Fwd FCF Commodity Coeff 0.01 0.20 -0.01 0.13
T 0.89 3.56 -0.18
Fwd FCF Cyclical Coeff 0.03 0.03 0.05 0.11
T 5.19 0.86 2.42
Fwd FCF Other Coeff -0.01 0.05 -0.04 0.04
T -1.88 1.80 -2.23

Source: FactSet, IBES, and Bernstein analysis Source: FactSet, IBES, and Bernstein analysis
Source: FactSet, IBES, and Bernstein analysis Source: FactSet, IBES, and Bernstein analysis
Beyond a tactical horizon, there is also a clear cross-asset strategic argument for high FCF
exposure. The dividend yield of US high FCF stocks is currently higher than that of
investment-grade credit, with the spread near the top of the range over the past 27 years
(see Exhibit 123).
60
65
70
75
80
85
90
95
100
105
110
Dec-
19
Jan-2
0
Feb
-20
Mar-
20
Apr-
20
May-
20
Jun-2
0
Jul-20
Aug-2
0
Sep-2
0
Oct-20
Nov-
20
Dec-
20
Commodity FCF (Trailing)
Cyclical FCF (Trailing)
Other FCF (trailing)
60
65
70
75
80
85
90
95
100
105
110
Dec-
19
Jan-2
0
Feb
-20
Mar-
20
Apr-
20
May-
20
Jun-2
0
Jul-20
Aug-2
0
Sep-2
0
Oct-20
Nov-
20
Dec-
20
Commodity FCF (Trailing)
Cyclical FCF (Trailing)
Other FCF (trailing)
60
65
70
75
80
85
90
95
100
105
110
Dec-
19
Jan-2
0
Feb
-20
Mar-
20
Apr-
20
May-
20
Jun-2
0
Jul-20
Aug-2
0
Sep-2
0
Oct-20
Nov-
20
Dec-
20
Commodity FCF (Fwd)
Cyclical FCF (Fwd)
Other FCF (Fwd)
60
70
80
90
100
110
120
Dec-
19
Jan-2
0
Feb
-20
Mar-
20
Apr-
20
May-
20
Jun-2
0
Jul-20
Aug-2
0
Sep-2
0
Oct-20
Nov-
20
Dec-
20
Commodity FCF (Fwd)
Cyclical FCF (Fwd)
Other FCF (Fwd)

Note: Chart shows the spread of the median dividend yield of the US High FCF Yield basket relative to S&P Global AAA Investment Grade Bond Index Yield.
Source: MSCI, S&P Global, and Bernstein analysis
We present names of stocks in Exhibit 124 and Exhibit 125 from the components of High
FCF Yield that we think will benefit from the themes we have discussed in this chapter.
We advocate that investors gain exposure to the "cyclicals" component of the High FCF
Yield baskets, as these stocks have already started to respond tactically to an uptick in
inflation expectations and can provide investors with quality stocks geared toward any
rebound in Value. We also like the high dividend yields and stability on offer from the
Consumer Staples stocks within the high FCF basket and would buy those. In addition, we
think once inflation starts to feature in the economy over the next six to 12 months, the
commodity stocks should become more attractive and respond to the inflationary stimulus.
-6
-5
-4
-3
-2
-1
0
1
2M
ar-
93
Dec-9
3
Sep-9
4
Jun-9
5
Mar-
96
Dec-9
6
Sep-9
7
Jun-9
8
Mar-
99
Dec-9
9
Sep-0
0
Jun-0
1
Mar-
02
Dec-0
2
Sep-0
3
Jun-0
4
Mar-
05
Dec-0
5
Sep-0
6
Jun-0
7
Mar-
08
Dec-0
8
Sep-0
9
Jun-1
0
Mar-
11
Dec-1
1
Sep-1
2
Jun-1
3
Mar-
14
Dec-1
4
Sep-1
5
Jun-1
6
Mar-
17
Dec-1
7
Sep-1
8
Jun-1
9
Mar-
20

Note: O= Outperform rating, M= Market-Perform rating, U = Underperform rating. Further details of the research and important disclosures of the above
covered securities are available on Bernstein Research website: www.bernsteinresearch.com. Other stocks are not covered by Bernstein.
Source: FactSet, IBES, and Bernstein analysis
Region Subgroup Sector Sedol Company
Bernstein
Rating
US COMMODITY ENERGY B3K3L40 MARATHON PETROLEUM
US COMMODITY ENERGY B1YWRK7 CONCHO RESOURCES O
US COMMODITY ENERGY 2838555 CHEVRON CORP
US COMMODITY ENERGY 2654364 CHENIERE ENERGY O
US COMMODITY ENERGY 2967181 WILLIAMS COS O
US COMMODITY ENERGY B3NQ4P8 KINDER MORGAN P O
US COMMODITY ENERGY 2162340 CABOT OIL & GAS CORP
US COMMODITY ENERGY 2130109 ONEOK M
US COMMODITY ENERGY 2655408 OCCIDENTAL PETROLEUM
US COMMODITY MATERIALS 2298386 EASTMAN CHEMICAL CO
US COMMODITY MATERIALS 2636607 NEWMONT CORP O
US COMMODITY MATERIALS 2352118 FREEPORT MCMORAN B
US COMMODITY MATERIALS B0G4K50 CF INDUSTRIES HOLDINGS M
US CYCLICAL CONSUMER DISCRETIONARY 2822019 ADVANCE AUTO PARTS
US CYCLICAL CONSUMER DISCRETIONARY 2598699 MOHAWK INDUSTRIES
US CYCLICAL CONSUMER DISCRETIONARY 2637785 NVR
US CYCLICAL CONSUMER DISCRETIONARY 2111955 BORGWARNER
US CYCLICAL CONSUMER DISCRETIONARY B570P91 LEAR CORP
US CYCLICAL CONSUMER DISCRETIONARY 2635701 NEWELL BRANDS
US CYCLICAL CONSUMER DISCRETIONARY 2971029 LKQ CORP
US CYCLICAL CONSUMER DISCRETIONARY 2293819 EBAY
US CYCLICAL CONSUMER DISCRETIONARY 2250687 HORTON (DR)
US CYCLICAL CONSUMER DISCRETIONARY 2960384 WHIRLPOOL CORP
US CYCLICAL CONSUMER DISCRETIONARY 2511920 LENNAR CORP A
US CYCLICAL CONSUMER DISCRETIONARY 2708841 PULTEGROUP
US CYCLICAL INDUSTRIALS 2818740 SNAP-ON
US CYCLICAL INDUSTRIALS 2648806 NORTHROP GRUMMAN CORP O
US CYCLICAL INDUSTRIALS 2365161 GENERAL DYNAMICS CORP M
US CYCLICAL INDUSTRIALS BF0LKD0 KNIGHT-SWIFT TRANSPORT
US CYCLICAL INDUSTRIALS BK9DTN5 L3HARRIS TECHNOLOGIES O
US CYCLICAL INDUSTRIALS 2955733 WABTEC CORP
US CYCLICAL INDUSTRIALS B1FW7Q2 OWENS CORNING
US CYCLICAL INDUSTRIALS 2134781 UNITED RENTALS M
US OTHER CONSUMER STAPLES BTN1Y44 WALGREENS BOOTS ALLIANCE
US OTHER CONSUMER STAPLES B067BM3 MOLSON COORS BREWING B

Notes: O= Outperform rating, M= Market-Perform rating, U = Underperform rating. Further details of the research and important disclosures of these covered
securities are available on Bernstein Research website: www.bernsteinresearch.com. Other stocks are not covered by Bernstein.
Source: FactSet, IBES, and Bernstein analysis
Region Subgroup Sector Sedol Company
Bernstein
Rating
Europe COMMODITY ENERGY B15C557 TOTAL M
Europe COMMODITY ENERGY 5669354 REPSOL O
Europe COMMODITY ENERGY B03MLX2 ROYAL DUTCH SHELL A O
Europe COMMODITY ENERGY B03MM40 ROYAL DUTCH SHELL B O
Europe COMMODITY ENERGY 4651459 OMV AG
Europe COMMODITY ENERGY 0798059 BP O
Europe COMMODITY ENERGY 7133608 EQUINOR M
Europe COMMODITY MATERIALS 7110753 LAFARGEHOLCIM
Europe COMMODITY MATERIALS BH0P3Z9 BHP GROUP (GB) O
Europe COMMODITY MATERIALS B1XZS82 ANGLO AMERICAN M
Europe COMMODITY MATERIALS 0718875 RIO TINTO PLC (GB) M
Europe COMMODITY MATERIALS 5120679 HEIDELBERGCEMENT
Europe COMMODITY MATERIALS B4T3BW6 GLENCORE M
Europe CYCLICAL CONSUMER DISCRETIONARY 4588364 MICHELIN
Europe CYCLICAL CONSUMER DISCRETIONARY 5687431 HENNES & MAURITZ B M
Europe CYCLICAL CONSUMER DISCRETIONARY 0682538 PERSIMMON
Europe CYCLICAL CONSUMER DISCRETIONARY BJDS7L3 PROSUS N
Europe CYCLICAL CONSUMER DISCRETIONARY 4712798 RENAULT O
Europe CYCLICAL INDUSTRIALS 4002121 BOUYGUES
Europe CYCLICAL INDUSTRIALS 7667163 ATLANTIA
Europe OTHER CONSUMER STAPLES BD0Q398 AHOLD DELHAIZE
Europe OTHER CONSUMER STAPLES 5641567 CARREFOUR
Europe OTHER CONSUMER STAPLES 0287580 BRITISH AMERICAN TOBACCO
Europe OTHER CONSUMER STAPLES 0454492 IMPERIAL BRANDS


◼ How far can the US Growth trade of recent years continue to run? We make the case
that both equity and cross-asset PMs should continue to overweight US Growth in
their portfolios.
◼ From a macro perspective, the key reason is that real rates are likely to stay low for an
extended period. The persistence of growth for high-growth companies has increased
in recent years. That ability to maintain superior growth along with lower discount rates
means long-duration equities can maintain a high multiple.
◼ We show that the absolute valuation of Growth equities can be justified if rates stay at
this level. Yes, the relative multiple of high- vs. low-Growth equities has increased, but
is very far from prior extremes. Moreover, the stocks in our Sustainable Growth basket
(overweight Tech, Communications, and Healthcare) trade at less than the market
multiple because of the collapse in forward earnings for cyclical companies.
◼ For the first time in a decade, US corporates have become net issuers of equity, but
Growth stocks are the ones likely to be able to maintain buybacks (previously the main
source of demand for stocks).
◼ We should be clear: with valuations high, it is likely that near-term volatility increases.
This means that in the short term there are clear risks and Growth stocks need to be
held alongside downside protection trades. But we think investors are forced in the
long term to buy more equities despite valuations. We show, both for equity PMs and
multi-asset investors, that US Growth is a key part of portfolios.
One of the most contentious investment issues today is how far the US growth trade can
continue, especially for the mega-cap names. 2020 has seen an extraordinary acceleration
in what was an already multi-year trend of outperformance. Surely, it cannot continue? The
commentary is very focused on the valuation of such stocks relative to the broader market
and drawing comparisons, with some inevitability, to the TMT bubble of 2000. However, we
think that may be looking in the wrong place, given the economic and capital markets
outlook but also the range of assets available to investors.
We think investors should remain overweight US Growth, both within the context of global
equity portfolios and as part of a cross-asset allocation. The two main macro threats to this
are rising rates (which we do not think likely in the near term) and political risks (tax or a
move against perceived quasi monopolies).
From this point of view, the important macro backdrop for these stocks is:

◼ Real rates likely stay low/negative for an extended period. We think that once we get
through the present deflationary shock, inflation will probably rise. But there are good
reasons to suppose that this does not trigger a usual rise in real rates, thus favoring
long-duration assets within equities.
◼ The ability of incumbent high-growth/high-profitability companies to remain high
growth/profitability has been increasing, boosting the case for such equities
specifically from the point of view of the contribution of long-horizon cash flows to net
present value.
◼ Investors facing negative real returns on most other asset classes are forced to buy in
an already very expensive equity market. Yes, Growth as a factor might be increasingly
"expensive," but the rest of the market is not really cheap as forward earnings
expectations have collapsed for the cyclicals and no one has a clue what those
earnings are going to be for cyclical stocks.
◼ For the first time in a decade, US corporates are net issuers of equity. Until recently,
buybacks had swamped all other sources of demand for listed equities. The market ex
large-cap Growth is staying in net issuance mode…this leaves the big Growth names
as the only ones capable of buybacks.
Set against that, there is the issue that this is the worst recession in a century, which hits
any company with cyclical components to revenues, such as advertising. We discuss what
this means for Growth names. When valuations, in general, are extended it means volatility
is likely to be high. This is true for the market overall and for Growth. Stocks are likely to be
very sensitive in the short term to negative newsflow; hence, the need to hold the Growth
trade in conjunction with downside protection, which we discuss in this chapter. However,
the most serious strategic risks for the Growth trade are: (1) the risk, despite our
expectations, that rates do in fact rise (in which case one should own Value/Financials) and
(2) politics. The political risk likely both from a potential increase in tax burdens and from
the possibility of a concerted move against quasi-monopolies. The path of taxes globally is
upward from here for years to come. So, this is an issue for the whole market (and all
investment advice). Another strand in our strategic outlook is that the pendulum is swinging
away from the very pro-corporate political climate of recent years. Presumably at some
point, the political environment will become less friendly to very large companies. However,
it looks like that may require another US election cycle, however much EU governments
scream about it. Moreover, it is not like the rest of the market is free from political risk.
Investors need to realize we are in a new regime; government is going to be semi-
permanently much more involved in the economy and markets.
It may also be wise to pause and think, almost from a common sense perspective, can the
amount of market cap that has been added to US Growth companies in 2020 really make
sense? The pandemic has upended so many aspects of life and yet the dominance of US
Growth has just continued along a path that was set in recent years. The fact that the market
overall has recovered to pre-pandemic levels is, in a sense, shocking, and the gulf between
prices and "fundamentals" is wider than it has ever been before. This makes it likely that
near-term volatility will remain high as the downside reaction to disappointing news is likely
to be high. For Growth stocks this risk is also high — risks at the macro level coming from

their exposure to changes in interest rate expectations being high and risks of any change
at the micro level in cash flow projections. Investors don't have a great set of options right
now, but we think that both relative to equities and also in a cross-asset sense, US Growth
needs to be part of a portfolio.
What valuation for Growth?
Large, high-growth stocks have performed extremely well since the end of 2019. Exhibit
126 shows how large companies extended their leadership over the average company in
the US in recent years, though they have recently given back some of this. As Exhibit 127
shows, since November 2019, High Composite Growth stocks in the US have
outperformed Low Growth stocks by 24% , and High Long-term Growth has outperformed
Low Growth by 14%.
Note: Shows the relative performance of the market cap weighted MSCI US
and Europe indices relative to the equal-weighted performance of the MSCI
US and Europe indices.
Source: MSCI and Bernstein analysis
Note: LTG refers to consensus five-year EPS growth estimates.
Composite Growth is an equal-weighted blend of LTG, FY0FY3 and
(1- dividend payout ratio)* 3-year average trailing ROE.
Source: FactSet, IBES, and Bernstein analysis
The valuation multiple of high-growth companies has also increased significantly since the
start of 2020 (see Exhibit 128). So yes, it is high in relative terms compared to the last 10
years and the near-term risks from this cannot be dismissed, but is not yet extreme in our
view and it is nowhere near the multiple reached around the dot-com bubble.
80
85
90
95
100
105
110
115
Jan-1
0
Jan-1
1
Jan-1
2
Jan-1
3
Jan-1
4
Jan-1
5
Jan-1
6
Jan-1
7
Jan-1
8
Jan-1
9
Jan-2
0
Ind
ex
MSCI US MSCI Europe
60
70
80
90
100
110
120
130
140
150
Jan-1
5
Jul-15
Jan-1
6
Jul-16
Jan-1
7
Jul-17
Jan-1
8
Jul-18
Jan-1
9
Jul-19
Jan-2
0
Jul-20
Ind
ex
US Composite Growth US: LTG

Source: FactSet, IBES, and Bernstein analysis
What about absolute multiples? The collapse in the discount rate in 2020 and our
assumption that rates stay low is the key part in justifying (or not) the valuation on high-
growth large-cap names.
One way to go about this is to use a simple extension of a DCF model. The huge caveat up
front is that as discount rates collapse, the weight of the NPV attributable to cash flows far
in the future increases. Those cash flows are hard to forecast, so the errors in valuing on an
absolute basis explodes;19 in a sense, the "duration risk" of Growth stocks measured in this
way has increased. In this section, we use an "H model," which is a special case of DCF
models where we assume an initial high-growth phase, followed by a linear decline to a
lower terminal-growth phase to calculate what would be the justified PE ratio for the basket
of our Sustainable Growth stocks (full list in Exhibit 135) under various different discount
rates and growth decay times. We have discussed the H model in detail in our previous
research on Growth stocks (see: Portfolio Strategy: What is a Growth stock today?). Note,
here we use our Sustainable Growth list just as an example. It is somewhat restrictive in that
it excludes companies that do not have 10-year track records of EPS growth, rather critical
for some new Growth names, but it is here as an example of what valuations may be
justified, given discount rates.
19 Indeed, the concept of absolute valuation requires the existence of a risk-free rate. We are not sure such a thing exists
anymore, as we have discussed elsewhere. Absolute valuation of financial assets may no longer really be possible and maybe
all we have is a series of nested risk premia. But we will leave that debate aside for purposes of this chapter.
0.00
1.00
2.00
3.00
4.00
5.00
6.00
7.00
8.00Ja
n-9
0
Dec-
90
Nov-
91
Oct-92
Sep-9
3
Aug-9
4
Jul-95
Jun-9
6
May-
97
Apr-
98
Mar-
99
Feb
-00
Jan-0
1
Dec-
01
Nov-
02
Oct-03
Sep-0
4
Aug-0
5
Jul-06
Jun-0
7
May-
08
Apr-
09
Mar-
10
Feb
-11
Jan-1
2
Dec-
12
Nov-
13
Oct-14
Sep-1
5
Aug-1
6
Jul-17
Jun-1
8
May-
19
Apr-
20
Ratio
US: Composite Growth - 12m FWD PE US: LTG - 12m FWD PE

The NPV of the asset with cash flows described by the H model is calculated as:
𝑉0 = 𝐷0(1 + 𝑔
𝐿) + 𝐷0𝐻(𝑔
𝑆 − 𝑔
𝐿)
𝑟 − 𝑔𝐿
𝑉0 = value per share at t = 0
𝐷0 = current dividend
𝑟 = required rate of return on equity
𝐻 = half-life in years of the high-growth period (i.e., high-growth period = 2H years)
𝑔𝑆
= initial short-term dividend growth rate
𝑔𝐿
= normal long-term dividend growth rate of Year 2H
We can then substitute the dividend as EPS multiplied by the dividend payout ratio and
express the justified PE as follows:
𝐽𝑢𝑠𝑡𝑖𝑓𝑖𝑒𝑑 𝑃𝐸 = 𝑃𝑎𝑦𝑜𝑢𝑡(1 + 𝑔
𝐿) + 𝑃𝑎𝑦𝑜𝑢𝑡 ∗ 𝐻(𝑔
𝑆− 𝑔
𝐿)
𝑟 − 𝑔𝐿
In Exhibit 129, we use the median payout ratio of the current Sustainable Growth basket of
27% and assume that earnings growth starts at 11% and declines to 5% in the long run
(the 11% represents the current expected long-term EPS growth rate of the group). Exhibit
129 illustrates how the justified PE multiple varies with different assumptions about the
discount rate and the decay rate (the time over which the growth rate declines to the long-
term average). The current PE of our Sustainable Growth portfolio is "only" 20.3x. With a
discount rate on its cost of capital up to 6%, this would imply that valuations can be justified.
Source: FactSet, MSCI, IBES, and Bernstein analysis
This valuation relies on the visibility of forward growth. But aside from rising discount rates,
the other remarkable change in recent years has been the increased power of high-growth
companies to remain high growth (see Exhibit 130). It is low discount rates combined with
greater sustainability of growth that justifies the multiple.
5.5 6 7 8 9 10 11
2 60.21 30.11 15.05 10.04 7.53 6.02 5.02
4 63.72 31.86 15.93 10.62 7.97 6.37 5.31
6 67.23 33.62 16.81 11.21 8.40 6.72 5.60
8 70.74 35.37 17.69 11.79 8.84 7.07 5.90
10 74.25 37.13 18.56 12.38 9.28 7.43 6.19
12 77.76 38.88 19.44 12.96 9.72 7.78 6.48
Discount Rate
De
cay

Note: In each quarter since 1990, we split the stocks in the MSCI US index into groups by ROE decile (within sectors) and calculate the percentage of stocks in
the High ROE decile at time t that were in the highest two deciles over the next one-to-five-year period. A four-quarter smoothing is applied to the quarterly
percentages.
Source: FactSet and Bernstein analysis
On a relative basis, the PE of the Sustainable Growth group also does not look extended.
The median 12-month forward PE multiple of the Sustainable Growth basket is currently
close to 20x, which is lower than the overall market multiple of 25x (see Exhibit 131). This
is in part because of the collapse in the expected forward earnings of many cyclical sectors.
0
10
20
30
40
50
60
70
80
90
100
Mar-
90
Mar-
91
Mar-
92
Mar-
93
Mar-
94
Mar-
95
Mar-
96
Mar-
97
Mar-
98
Mar-
99
Mar-
00
Mar-
01
Mar-
02
Mar-
03
Mar-
04
Mar-
05
Mar-
06
Mar-
07
Mar-
08
Mar-
09
Mar-
10
Mar-
11
Mar-
12
Mar-
13
Mar-
14
Mar-
15
Mar-
16
Mar-
17
Mar-
18
Mar-
19
1 year forward 2 year forward 3 year forward 4 year forward 5 year forward
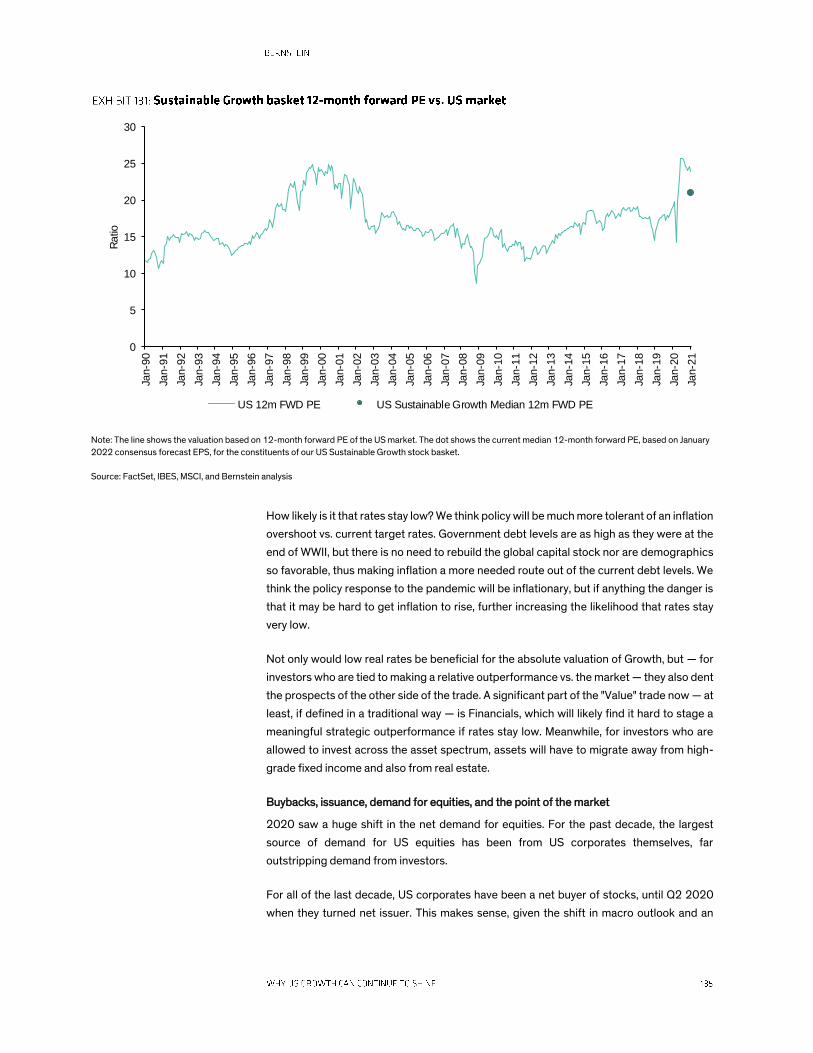
Note: The line shows the valuation based on 12-month forward PE of the US market. The dot shows the current median 12-month forward PE, based on January
2022 consensus forecast EPS, for the constituents of our US Sustainable Growth stock basket.
Source: FactSet, IBES, MSCI, and Bernstein analysis
How likely is it that rates stay low? We think policy will be much more tolerant of an inflation
overshoot vs. current target rates. Government debt levels are as high as they were at the
end of WWII, but there is no need to rebuild the global capital stock nor are demographics
so favorable, thus making inflation a more needed route out of the current debt levels. We
think the policy response to the pandemic will be inflationary, but if anything the danger is
that it may be hard to get inflation to rise, further increasing the likelihood that rates stay
very low.
Not only would low real rates be beneficial for the absolute valuation of Growth, but — for
investors who are tied to making a relative outperformance vs. the market — they also dent
the prospects of the other side of the trade. A significant part of the "Value" trade now — at
least, if defined in a traditional way — is Financials, which will likely find it hard to stage a
meaningful strategic outperformance if rates stay low. Meanwhile, for investors who are
allowed to invest across the asset spectrum, assets will have to migrate away from high-
grade fixed income and also from real estate.
Buybacks, issuance, demand for equities, and the point of the market
2020 saw a huge shift in the net demand for equities. For the past decade, the largest
source of demand for US equities has been from US corporates themselves, far
outstripping demand from investors.
For all of the last decade, US corporates have been a net buyer of stocks, until Q2 2020
when they turned net issuer. This makes sense, given the shift in macro outlook and an
0
5
10
15
20
25
30
Jan-9
0
Jan-9
1
Jan-9
2
Jan-9
3
Jan-9
4
Jan-9
5
Jan-9
6
Jan-9
7
Jan-9
8
Jan-9
9
Jan-0
0
Jan-0
1
Jan-0
2
Jan-0
3
Jan-0
4
Jan-0
5
Jan-0
6
Jan-0
7
Jan-0
8
Jan-0
9
Jan-1
0
Jan-1
1
Jan-1
2
Jan-1
3
Jan-1
4
Jan-1
5
Jan-1
6
Jan-1
7
Jan-1
8
Jan-1
9
Jan-2
0
Jan-2
1
Ratio
US 12m FWD PE US Sustainable Growth Median 12m FWD PE

implied strong preference of the Fed to prioritize the capital-raising role of credit and equity
markets over their role for price discovery20 (see Exhibit 132).
Much has been said about how lower discount rates raise the fair value of the whole market;
this is true. But at the same time, the main buyer of equities has stopped buying. The rally
since March 2020 has also happened while buyers of funds stayed away and did not buy
either (in equities at least, not so in credit) (see Exhibit 133).
It is the large US Growth companies that are the most likely to be able to maintain buybacks,
as we discuss later in this chapter, thus lending them further relative support.
Note: Shows flow into US Corporate equities from sectors of the economy as
defined by the US flow of funds financial accounts (Z1).
Source: US Federal Reserve and Bernstein analysis
Note: Chart shows three-month average value of stock buybacks and equity
issuance announcements for companies domiciled in the US.
Source: Bloomberg and Bernstein analysis
Tax and politics
The US corporate tax rate has been trending lower since the 1990s. Exhibit 134 shows the
Tech sector has benefited more from this trend than the overall market and its current
effective tax rate of 13% is lower by 3 percentage points vs. the market.
One of the biggest risks, as we alluded in the introduction, is that there is a political backlash
against the appearance of quasi-monopolies. This may well indeed happen in time, but
does not appear to be an immediate risk. Also, there is likely to be an impact on the whole
20 Portfolio Strategy: Has the Fed gone too far?
-8
-6
-4
-2
0
2
4
6
8
Q4 1
951
Q4 1
954
Q4 1
957
Q4 1
960
Q4 1
963
Q4 1
966
Q4 1
969
Q4 1
972
Q4 1
975
Q4 1
978
Q4 1
981
Q4 1
984
Q4 1
987
Q4 1
990
Q4 1
993
Q4 1
996
Q4 1
999
Q4 2
002
Q4 2
005
Q4 2
008
Q4 2
011
Q4 2
014
Q4 2
017
US
D t
rillio
n
Household
Foreign
Life Ins
Pension Funds
Funds&ETFs
Sec. Brokers
Net Equity retirements
0
20
40
60
80
100
120
140
160
180
Feb
-04
Feb
-05
Feb
-06
Feb
-07
Feb
-08
Feb
-09
Feb
-10
Feb
-11
Feb
-12
Feb
-13
Feb
-14
Feb
-15
Feb
-16
Feb
-17
Feb
-18
Feb
-19
Feb
-20
US
D b
n
Buybacks
Issuance
Buybacks (ex Tech)

market from increased government presence in the economy and the market, as we have
discussed in our recent strategy publications.
Note: Ratio of market cap-weighted tax paid to pretax profit.
Source: FactSet, MSCI, and Bernstein analysis
Portfolio implications
Where does this leave Growth assets within a portfolio? With real rates likely locked low for
an extended period, but with a risk that inflation rises, we think long-duration assets in the
equity market can continue to trade at a premium. We consider this from the point of view
of equity and cross-asset portfolios.
Within an equity context, the fear has to be that a combination of over-crowding in High
Growth names and a rebound of deeply discounted Value names leads to an
underperformance of Growth. However, a large weight of Value portfolios is in the Banks
sector. With real rates low, little prospect of a steepening yield curve, and a massive
bankruptcy and default cycle still ahead, we think the outlook for the Banks is unattractive.
Outside of Banks, there could indeed be episodes of tactical Value rallies, such as we saw
in late May 2020, but we think without a sustained increase in inflation and a steepening of
the yield curve, Value rallies will either be tactical or confined to specific cases of
undervalued companies as opposed to Value as a generic factor.
As we showed previously, despite the increase in multiples of Growth stocks, our
Sustainable Growth group (with a heavy overweight of Tech, Communications, and
Healthcare) actually trades at a PE discount to the market, as the forward earnings have
collapsed so far in other parts of the market. We note the level of disagreement between
0.0%
5.0%
10.0%
15.0%
20.0%
25.0%
30.0%
35.0%
40.0%
45.0%
50.0%
01/0
3/1
990
01/0
1/1
991
01/1
1/1
991
01/0
9/1
992
01/0
7/1
993
01/0
5/1
994
01/0
3/1
995
01/0
1/1
996
01/1
1/1
996
01/0
9/1
997
01/0
7/1
998
01/0
5/1
999
01/0
3/2
000
01/0
1/2
001
01/1
1/2
001
01/0
9/2
002
01/0
7/2
003
01/0
5/2
004
01/0
3/2
005
01/0
1/2
006
01/1
1/2
006
01/0
9/2
007
01/0
7/2
008
01/0
5/2
009
01/0
3/2
010
01/0
1/2
011
01/1
1/2
011
01/0
9/2
012
01/0
7/2
013
01/0
5/2
014
01/0
3/2
015
01/0
1/2
016
01/1
1/2
016
01/0
9/2
017
01/0
7/2
018
01/0
5/2
019
01/0
3/2
020
TECHNOLOGY MARKET

analysts covering Value stocks recently reached an all-time record and has since retreated
from that high. Anything that materially further decreased the disagreement could help
Value names.
On balance, we think equity PMs need to remain overweight US Growth. They can hedge
short-term risk by holding downside protection trades in low volatility, sustainable dividend
yield, and good balance sheet quality trades and by sectors such as Utilities and Consumer
Staples. They can hold selected non-Financials Value stocks as an insurance against that
factor tactically rallying, but they should still underweight Value.
From a cross-asset perspective, we think there is also a case to hold US Growth. From this
viewpoint, the need is to hold assets that can generate positive real returns as inflation
rises. This entails a large overweight on equities — the core of that can be a passive position
on the market, but around that some specific trades are needed that can diversify equity
risk (gold, low volatility, sustainable yield, and carry trades), but there is also a need to hold
assets that are exposed to underlying earnings streams that can deliver positive real-term
Growth, and the US Growth trade is a key part of that.
The best case for big-cap Growth would be real rates staying low and higher, but moderate,
inflation in the 2-4% range. Under that scenario, we think equities would eke out small
positive real returns. While Growth stocks would be unlikely to continue appreciating at
anything like their recent rate, they would be likely to at least outperform.

Note: (1) The screen takes the companies in the two highest quintiles of our US Composite Growth screen and removes stocks that have a PEG ratio > 3x and
more than a 10% premium of the average of current FY0FY3 EPS estimated growth and long-term forecast growth over 10-year IBES consensus 12-month
forward Net Income growth. The PEG ratio that we use is 12-month forward PE/LTG. It also excludes companies that are rated Underperform by Bernstein
analysts. Rebalanced on 31 December 2020. (2) O= Outperform rating, M= Market-Perform rating, U = Underperform rating. Further details of the research
and important disclosures of the above covered securities are available on Bernstein Research website: www.bernsteinresearch.com. Other stocks are not
covered by Bernstein.
Source: FactSet, MSCI, IBES, and Bernstein analysis
Sedol Company Sector
PE (12m
Fwd)
Long Term
EPS Gth
FY0FY3 EPS
CAGR
10 Year Net Income
CAGR (12m Fwd) PEG Rating
2857817 NETFLIX COMMUNICATIONS 61.6 41.0 44.3 34.1 1.5 O
BYVY8G0 ALPHABET A COMMUNICATIONS 29.0 16.5 13.5 14.4 1.8 O
2122117 TAKE-TWO INTERACTIVE SOF COMMUNICATIONS 34.6 15.3 13.4 24.0 2.3 O
2310194 ELECTRONIC ARTS COMMUNICATIONS 25.0 13.8 10.6 22.0 1.8 O
2000019 AMAZON.COM CONSUMER DISCRETIONARY 74.9 36.4 39.6 31.7 2.1 O
B5B1S13 DOLLAR GENERAL CORP CONSUMER DISCRETIONARY 20.9 16.0 18.5 15.6 1.3 M
2781585 POOL CORP CONSUMER DISCRETIONARY 39.2 18.0 16.3 19.6 2.2
2637785 NVR CONSUMER DISCRETIONARY 14.1 12.0 20.2 16.9 1.2
2900335 TRACTOR SUPPLY CO CONSUMER DISCRETIONARY 22.4 15.3 13.9 17.0 1.5 O
2250687 HORTON (DR) CONSUMER DISCRETIONARY 9.4 15.8 12.4 41.6 0.6
2259101 TARGET CORP CONSUMER DISCRETIONARY 19.7 13.1 13.2 4.8 1.5 M
B65LWX6 O'REILLY AUTOMOTIVE CONSUMER DISCRETIONARY 19.5 12.8 13.0 15.1 1.5
2272476 DOLLAR TREE CONSUMER DISCRETIONARY 18.8 10.4 12.5 12.4 1.8 O
2822019 ADVANCE AUTO PARTS CONSUMER DISCRETIONARY 17.0 11.9 9.4 5.7 1.4
2511920 LENNAR CORP A CONSUMER DISCRETIONARY 9.7 11.4 9.4 44.5 0.9
B665KZ5 GENERAL MOTORS CONSUMER DISCRETIONARY 7.2 9.2 10.8 2.2 0.8
2983563 CARMAX CONSUMER DISCRETIONARY 19.7 11.8 5.5 7.3 1.7
2960384 WHIRLPOOL CORP CONSUMER DISCRETIONARY 10.2 8.9 8.3 4.5 1.1
BZ07BW4 MONSTER BEVERAGE CONSUMER STAPLES 35.0 14.7 12.8 18.7 2.4 M
BD3W133 KEURIG DR PEPPER CONSUMER STAPLES 19.8 10.4 12.6 13.2 1.9 O
2195841 CHURCH & DWIGHT CO CONSUMER STAPLES 28.9 9.7 9.8 9.4 3.0
2170473 CONSTELLATION BRANDS A CONSUMER STAPLES 22.1 8.8 8.8 17.4 2.5
2497406 KROGER CO CONSUMER STAPLES 10.7 8.0 8.4 8.8 1.3 O
2422806 HERSHEY CO (THE) CONSUMER STAPLES 23.2 7.8 6.5 8.3 3.0 M
2359506 GALLAGHER (ARTHUR J.) FINANCIALS 27.4 11.3 10.4 20.1 2.4
2494504 BLACKROCK A FINANCIALS 20.5 10.7 11.0 9.7 1.9
2252058 MOODY'S CORP FINANCIALS 27.4 10.3 11.2 15.5 2.7
BFSSDS9 INTERCONTINENTAL EXCH FINANCIALS 24.0 10.8 9.5 19.4 2.2
2692687 BROWN & BROWN FINANCIALS 27.6 10.5 9.7 11.3 2.6
2702337 PRICE (T. ROWE) GROUP FINANCIALS 15.2 9.1 10.8 12.1 1.7
2965107 NASDAQ FINANCIALS 21.2 10.1 9.3 9.8 2.1
B0J7D57 AMERIPRISE FINANCIAL FINANCIALS 10.7 8.5 8.5 4.5 1.3
2793610 SEI INVESTMENTS CO FINANCIALS 17.0 12.0 4.8 7.6 1.4
BLP1HW5 AON PLC A FINANCIALS 20.0 7.4 8.8 9.3 2.7
2950482 WEST PHARMACEUTICAL SVCS HEALTHCARE 54.7 20.5 23.0 16.0 2.7
2126335 BRISTOL-MYERS SQUIBB CO HEALTHCARE 8.6 21.4 19.2 14.7 0.4 M
2250870 DANAHER CORP HEALTHCARE 31.9 15.1 21.1 10.9 2.1
2886907 THERMO FISHER SCIENTIFIC HEALTHCARE 23.0 16.2 18.0 17.8 1.4
2305844 PERKINELMER HEALTHCARE 17.5 17.0 15.7 17.9 1.0
2732903 RESMED HEALTHCARE 41.7 22.1 10.0 12.6 1.9
BSPHGL4 ANTHEM HEALTHCARE 12.6 13.7 13.6 7.6 0.9 O
2807061 CENTENE CORP HEALTHCARE 11.6 12.6 11.4 40.8 0.9 O
2917766 UNITEDHEALTH GROUP HEALTHCARE 19.0 12.4 11.6 13.6 1.5 O
2445063 HUMANA HEALTHCARE 18.7 12.0 11.5 7.5 1.6 M
2586122 LABORATORY CORP OF AMER HEALTHCARE 10.8 12.4 10.4 13.3 0.9
2881407 TELEFLEX HEALTHCARE 32.6 12.0 9.8 11.7 2.7
2036070 ALEXION PHARMACEUTICALS HEALTHCARE 12.5 11.0 10.0 32.3 1.1 M
2185284 CERNER CORP HEALTHCARE 24.8 10.6 10.2 13.4 2.3
BHJ0775 CIGNA CORP HEALTHCARE 10.0 10.2 10.2 18.8 1.0 M
2378534 MCKESSON CORP HEALTHCARE 10.2 9.3 10.2 7.7 1.1
2212706 MOLINA HEALTHCARE HEALTHCARE 14.7 8.3 11.0 30.6 1.8
2778844 MERCK & CO HEALTHCARE 12.7 7.3 10.7 3.8 1.7 O
2023607 AMGEN HEALTHCARE 13.8 6.7 7.0 6.8 2.1 M
BF0LKD0 KNIGHT-SWIFT TRANSPORT INDUSTRIALS 12.8 16.5 17.1 22.1 0.8
2656423 OLD DOMINION FREIGHT INDUSTRIALS 29.8 14.4 14.2 24.4 2.1
BK9DTN5 L3HARRIS TECHNOLOGIES INDUSTRIALS 14.5 13.6 13.6 15.0 1.1 O
2641838 NORDSON CORP INDUSTRIALS 30.6 14.1 12.3 8.1 2.2
B1FW7Q2 OWENS CORNING INDUSTRIALS 14.2 13.2 11.9 9.4 1.1
2607647 KANSAS CITY SOUTHERN INDUSTRIALS 23.9 11.7 12.0 12.3 2.0
2671501 PARKER HANNIFIN CORP INDUSTRIALS 22.2 9.3 13.8 5.4 2.4
2445416 HUNT (J.B.) TRANSPORT INDUSTRIALS 23.9 11.7 10.5 9.5 2.1 M
2469052 JACOBS ENGINEERING GROUP INDUSTRIALS 18.6 10.2 11.2 8.9 1.8 O
2517382 UNITED PARCEL SERVICE B INDUSTRIALS 20.8 9.6 8.1 6.7 2.2 O
2522096 LOCKHEED MARTIN CORP INDUSTRIALS 13.6 8.1 8.6 10.3 1.7 M
2648806 NORTHROP GRUMMAN CORP INDUSTRIALS 12.7 7.6 7.7 6.8 1.7 O
2756174 RPM INTL MATERIALS 21.4 12.6 19.1 11.4 1.7
2073022 BALL CORP MATERIALS 28.0 13.8 15.5 8.8 2.0
2011602 AIR PRODUCTS & CHEMICALS MATERIALS 28.9 10.2 12.3 5.3 2.8 O
2427986 CROWN HOLDINGS MATERIALS 15.7 10.3 11.8 7.9 1.5
2804211 SHERWIN-WILLIAMS CO MATERIALS 27.7 9.6 11.1 16.6 2.9
2328603 FMC CORP MATERIALS 15.9 9.8 10.6 9.4 1.6 M
2066408 AVERY DENNISON CORP MATERIALS 21.2 8.9 7.4 6.4 2.4
B7FBFL2 AMERICAN TOWER CORP REAL_ESTATE 41.7 15.9 13.1 17.3 2.6
2379504 NVIDIA TECHNOLOGY 48.2 21.5 32.1 33.7 2.2 O
2588184 MICRON TECHNOLOGY TECHNOLOGY 19.3 14.2 32.1 13.5 1.4 O
B01Z7J1 MONOLITHIC POWER SYSTEMS TECHNOLOGY 64.4 25.0 18.8 18.2 2.6
2502247 LAM RESEARCH CORP TECHNOLOGY 21.6 19.4 21.4 16.3 1.1
B5B2106 FORTINET TECHNOLOGY 38.3 19.2 18.9 30.4 2.0
2342034 FISERV TECHNOLOGY 21.8 17.5 16.7 17.2 1.2
2698782 IPG PHOTONICS TECHNOLOGY 50.0 21.4 11.6 14.4 2.3 O
2008154 ADOBE TECHNOLOGY 44.2 16.7 15.8 18.3 2.7 O
2712013 GLOBAL PAYMENTS TECHNOLOGY 25.1 16.6 14.9 24.5 1.5
2961053 SKYWORKS SOLUTIONS TECHNOLOGY 19.3 12.5 16.6 14.8 1.5
2588173 MICROSOFT CORP TECHNOLOGY 32.2 14.6 14.3 9.3 2.2 O
2302232 CADENCE DESIGN SYSTEMS TECHNOLOGY 44.9 15.4 12.6 32.2 2.9
2046552 APPLIED MATERIALS TECHNOLOGY 17.7 16.0 11.9 11.0 1.1
2592174 MICROCHIP TECHNOLOGY TECHNOLOGY 21.0 12.3 12.3 14.2 1.7
2046251 APPLE TECHNOLOGY 32.4 12.6 11.9 14.0 2.6 M
BDV82B8 LEIDOS HOLDINGS TECHNOLOGY 16.5 11.9 12.4 4.3 1.4
2903958 TRIMBLE TECHNOLOGY 29.3 15.0 8.9 11.2 2.0 O
2480138 KLA CORPORATION TECHNOLOGY 20.9 11.9 11.1 10.7 1.8
2507457 AKAMAI TECHNOLOGIES TECHNOLOGY 19.3 10.4 10.1 12.4 1.9
2661568 ORACLE CORP TECHNOLOGY 14.4 10.9 9.5 2.8 1.3 O
2885409 TEXAS INSTRUMENTS TECHNOLOGY 28.1 10.0 7.4 5.4 2.8 M
B23SN61 VMWARE A TECHNOLOGY 21.3 8.8 7.9 16.9 2.4 O


◼ How can investors achieve a high enough real return to plausibly save for retirement?
Post Covid-19, we think this question has become a lot more urgent…and harder. We
make the case that investors have little choice but to up their risk levels. We are fully
aware of the irony — and indeed outright danger — of telling people to increase risk in
the very month that US equities and bonds are both trading more expensively than ever
before. Welcome to the future of investment!
◼ We show how the real return vs. risk of assets and factors has evolved in a very benign
way recently, but now high asset prices and diminishing options for diversification are
likely to erode this. Investors need to take more risk because: (1) the trade-off of return
vs. risk for most assets seems likely to deteriorate, (2) equity volatility is likely to remain
elevated, and (3) correlation between asset classes is likely increasing.
◼ We think it likely that equities need to be a core medium-term overweight for most
investors though, yes, we know that we are saying this when the S&P is trading at an
all-time high forward PE multiple and household equity allocation is already high. So
there are clear near-term risks.
◼ Some investors have suggested maybe valuations don't matter anymore, but we think
such a view is cavalier. Thus, a core question in this chapter is: which assets can deliver
high returns but also diversify equity risk? The list is small.
◼ Around a core equity holding, we think a longer-term allocation should consist of Gold,
Growth within equities, and Value only if one thinks real rates are rising (or possibly
Value with an altered definition as we discuss). High-yielding equities, low volatility
equities, and carry trades can also form part of this portfolio. Real assets are also
needed in this mix, but with caveats. Regionally, an overweight US position would be
the core, but we also see a strategic return-risk case for EM. Idiosyncratic alpha is a
key part of this allocation, and a larger portion of overall returns than active alpha has
been traditionally.
◼ Target date funds have only kept pace with their required glide path even with strong
asset returns. Their structure is sound, but this analysis suggests the inputs may have
to evolve.
◼ Investors have already been increasing risk, e.g., by allocating more to private assets
and migrating down the quality spectrum in credit, even as credit quality has declined.
We think this higher risk can be mitigated to some extent by a changed approach to
asset allocation and also a more honest approach to time horizons and what that
means in practice.

◼ We discuss what this means for asset managers and asset owners. But the bottom line
is that post Covid-19, and with the valuations of financial assets at all-time highs,
investors may simply have no choice but to increase their level of risk.
Investors are rightly caught up in trying to decipher the economic implications of the next
stage of virus news and the policy response.21 However, if one stands back, then the result
of the virus, the lockdown, and the policy response to both is to magnify a problem that was
already growing before the virus. It is this: what kind of trades or investment can one make
that could plausibly deliver a high enough real return to fund retirement or other savings
needs?
Through all the waves of market psychology, be it described as "FOMO" or "TINA," this is
the underlying question. After all, why does anyone bother investing in anything? Achieving
a positive real return at a given level of risk surely has to be the key goal. Despite the hit of
the pandemic, achieving a positive real return in 2020 has still not been a problem, but in
the aftermath of the pandemic, we think this will become a lot harder. This chapter is about
some ways to possibly deal with this.
But the conclusion is that it is probably going to be unavoidable for investors to take a lot
more risk both because of the available trade-off between return and risk at the individual
asset class level, which is set to get worse, and also because of the worsening correlation
between them.
Exhibit 13622 shows the real return and volatility for a range of assets over the very long
run. It's familiar enough. As taught in finance courses, there is an "efficient frontier" that will
happily justify an allocation to equities, bonds, credit, real estate, and carry that yields real
returns well over 2% p.a., and ample diversification (especially a large negative correlation
between stocks and bonds) allows total portfolio risk to be anchored at a low level.
The position of the 60:40 portfolio in return-risk space over this time is as good as it could
possibly be — and that is before even taking into account the diversification benefits of the
other asset classes. No wonder 60:40 continues to be seen as the default position for so
many retirement options. This chapter is about how this will change and what to do
about it.
21Much as I love REM anyway, I have to acknowledge Michael Kurtz for already nabbing this title for a strategy team note
once before. 22 This chapter involves a lot of charts with masses of points. I apologize for this up front! We usually like to keep things
simple, and the message is, in fact, simple — that the evolving opportunity set for investors is becoming harder having been
benign. With some studying we hope they are, in fact, a relatively clean way of showing this.

Note: US Equity, 10-year bond, price-to-book, dividend yield, equity momentum, FI Momentum, FI Carry, and US 60:40 returns and volatility are shown since
mid-1927. Commodity index and Oil return and volatility history is since 1970, gold and silver histories are from 1969, US REITS are shown since 1972, FX carry
since 1974, and high yield bonds since 1987.
Source: Datastream, AQR, Fama French database, FRED, and Bernstein analysis
Well, so much for the history of the prelapsarian decades before the current crisis. Exhibit
137 shows the same data, but split over time. Showing a dot for each decade would create
a confusing galaxy of points; instead, we show the data for the last decade (labelled by its
starting year 2010), the period 1980-2010 as one long period, the 1970s, and data for the
1960s where it is available. There has been a general tendency for the points to move up
and to the left in recent times, underlining how supportive for asset owners' recent
conditions have been compared to earlier times.
US Equities
US 10 year
GSCI Commodity Index
Gold
SilverUS Price to Book (L/S)
US Dividend Yield (L/S)
EQ Mom
FI Mom
US Equity Low Vol (L/O)
FI Carry
FX Carry
US REITS
HY BondsUS 60/40
-4.00
-2.00
0.00
2.00
4.00
6.00
8.00
0.00 5.00 10.00 15.00 20.00 25.00 30.00 35.00
Re
al R
etu
rn, %
an
nu
alize
d
STDEV
Oil

Source: Datastream, AQR, Ken French data library, FRED, GFD, and Bernstein analysis
We have added forecasts into Exhibit 138 to show how we think the return-risk path of
these assets may evolve. We won't go into the basis for these forecasts in detail in this
chapter. We have covered this in the strategic outlook in Global Quantitative Strategy: The
Strategic Investment Outlook - Blame it on the Boogie. This is essentially just another way
of showing pictorially the impact of the run-up in asset valuations (be it through the impact
of baby boomers saving for retirement, globalization, or more shareholder-friendly policies)
and the impact that declining inflation has had on the opportunities for diversification.
1960
1970
80-2010
2010
1960
1970
80-2010
2010
1970
80-2010
2010
1970
80-2010
2010
80-20102010
1960
1970
80-2010
2010
1970
80-2010
2010
1960
1970
80-2010
2010
80-20102010
1960
1970
80-2010
2010
-10.00
-5.00
0.00
5.00
10.00
15.00
20.00
25.00
0.00 5.00 10.00 15.00 20.00 25.00 30.00
Re
al R
etu
rn
STDEV
US Equities US 10 year GSCI Commodity Index
Gold US REITS US Price to Book (L/S)
US Equity Low Vol (L/O) FI Carry HY Bonds
US 60/40

Source: GFD, Datastream, AQR, Ken French data library, FRED, and Bernstein analysis
Essentially, this projects a view based on the likely path of returns and volatility, given the
run-up in cross-asset valuations in recent years. We are assuming there is a tendency for
inflation to rise in the medium term, driven by the policy response to Covid-19. One major
unknown is whether this inflation can lead to an increase in real rates and a steepening of
the curve, as it has in the past. As a result, we have diagrammatically suggested two paths
for equity value. If real rates do rise, this could be the spark that Value investors have been
waiting for and a long-short Value factor would be a key part of holdings. However, if real
rates don't pick up, then Value could still languish. The other possibility is that the definition
of Value many need to evolve, e.g., with a dramatically smaller allocation to Financials and
a more selected exposure to "undervalued" companies as opposed to "cheap"
companies.23
The potentially (medium-term) bullish news for equity investors in this is that the TINA
argument might just be right (despite near-term risks). There may be little choice for the
core of a portfolio to be a large equity allocation. We are fully aware of the irony of making
this statement in July 2020 that the S&P has reached a new all-time high multiple of 26x
12-month forward earnings. Well, it's actually worse than this, as no one has a clue what
those 12-month forward earnings will look like, not investors or policy makers, nor
corporate management. Our recent work trying to model how possible paths out of
23 See Portfolio Strategy: The Fed, the market the Value-Growth debate and inflation.
US Equities
US 10 year
Gold
US REITS
US Value (L/S)
US Equity Low Vol (L/O)
US HY Bonds
US Dividend Yield (L/S)
FI Carry
US Composite Growth L/O
US Private Equity
-10
-5
0
5
10
15
0 5 10 15 20 25
Real
Retu
rn
STDEV
Commodity and core cyclical value
Financials value

lockdown24 could appear leaves us with the view that the S&P is currently most likely
trading on 26x 2021 earnings, but the multiple could be a lot higher than that. It takes
Herculean assumptions about a "V"-shaped recovery to get to a "normal" multiple.
Maybe valuations just don't matter? Some people have suggested this as an answer to our
current predicament. If equities are the only asset class that is large enough and liquid
enough and "democratized" enough to make up the required returns, then maybe an all-
time high multiple doesn't matter?
However, we don't think such a view can be right. It sounds cavalier and, in fact, downright
dangerous. It might be true that investors in the medium term have little choice but to hold
more equities, but valuations do matter. Squaring this circle might not be about projected
returns, but about risk. We can show that in periods when equity valuations start at high
levels then volatility tends to be high (see Exhibit 139). We think equity volatility will remain
elevated for the foreseeable future. In addition, our recent tactical work suggests that over
short horizons, investors should seek downside protection in ways that do not necessitate
paying a high premium (with volatility well bid, this might mean protection is harder via
options and better via low volatility and income stocks). So, own equities but be prepared
for higher volatility.
We think that risk levels need to increase for three related but distinct reasons:
◼ It will simply be likely harder to achieve a given level of return without taking more risk
in the return-risk trade-off.
◼ The volatility of equities seems set to be higher for some time.
◼ Fewer diversification opportunities. We covered this point in detail in Portfolio
Strategy: Multi asset portfolios in the crisis and the outlook for diversification if
inflation rises.
We can argue at length about whether the high current multiple of equities (an all-time
record high on forward PE in fact) is outright bearish. There are reasons why a combination
of policy and investor desperation for lack of alternatives could hold the market at a high
level, but we do think that it means we should expect volatility to be higher in a sustained
way.
Exhibit 139 shows that when valuation is high, it tends to be followed by a period of higher
volatility. Specifically, we see that as the market moves into 9th and 10th deciles by valuation,
both shorter-term (six-month forward) and longer-term (24-month forward) volatility tends
to rise significantly. Currently, the US market is firmly in the most expensive decile both on
12-month forward PE and Shiller PE multiples, which implies scope for increased equity
volatility in future.
24 Portfolio Strategy & Global Healthcare: No one has a clue on 2021 market earnings - can the latest COVID healthcare
research help?

Note: The six-month forward volatility is plotted against 12-month forward PE market multiple divided into deciles (1 = lowest, 10 = highest) for 1990-2015.
The two-year forward volatility is plotted against Shiller PE market multiple divided into deciles for 1950-2016.
Source: Robert Shiller's database, FactSet, IBES, and Bernstein analysis
So equities are likely to be the core holding over the medium term. But we also think that
the negative correlation of stocks and bonds is likely to unwind. Thus, a key issue is how to
achieve return and diversification of equity risk in particular. Exhibit 140 shows the
information ratio (IR, defined as annualized return/annualized volatility) for a range of
assets, with our projection of how these are likely to evolve. Here, we think the outlook for
inflation is key; our base case is that the policy response to the pandemic is inflationary on
a 1 year+ horizon and we incorporate that assumption here. A lower inflation outlook would
suggest a slightly different path.
Government bonds have been progressively more dominant on an IR-vs.-diversification
basis, while income, low volatility and value have become less useful. We think this is set to
change. Over the next five years, we think the assets in the attractive top-right corner of the
chart in Exhibit 140 look set to be equity income, low volatility, gold, and carry. Value could
be there too, but only if real rates ultimately rise. Real estate would in theory be attractive if
inflation rises and real rates remain low except: (a) the outlook for a sector exposed to retail,
leisure, and central city office space looks horrible, and (b) its correlation with equities tends
to rise with inflation. So we would not want to have any real estate exposure in such a
portfolio.
0.00
5.00
10.00
15.00
20.00
25.00
1 2 3 4 5 6 7 8 9 10
Vo
lati
lity
, %
Valuation Decile, 1 - Low
US (6m fwd vol) US (2yr fwd vol)
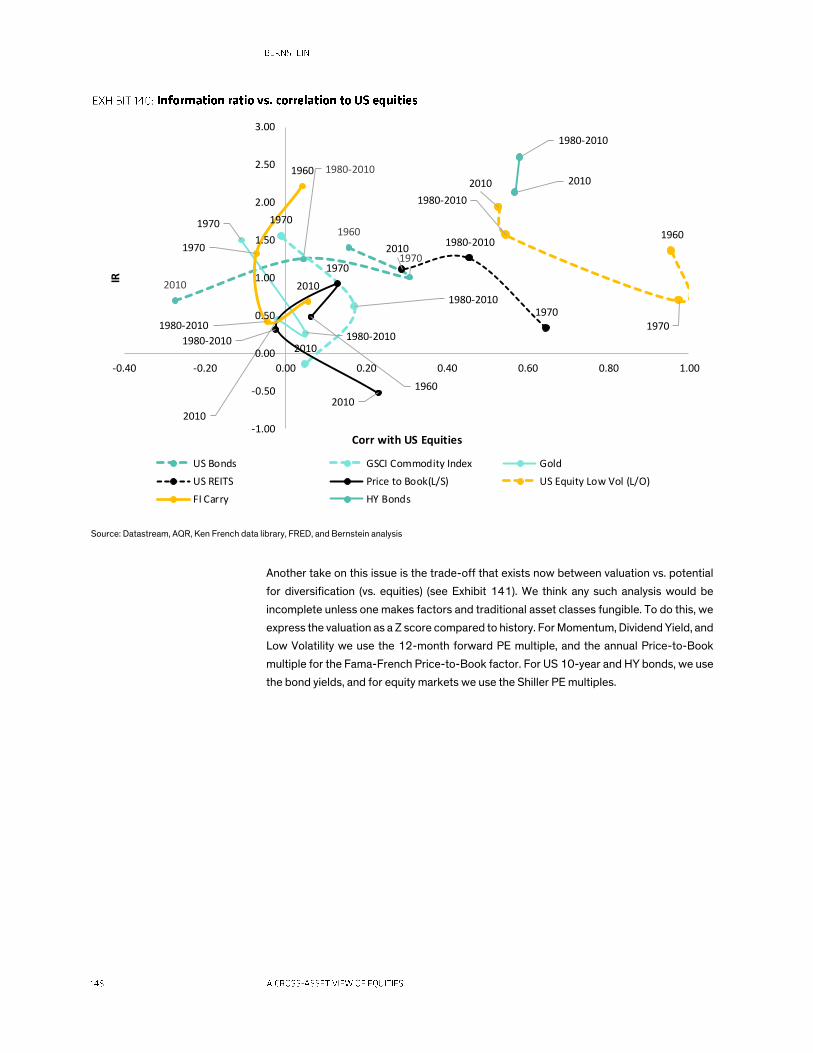
Source: Datastream, AQR, Ken French data library, FRED, and Bernstein analysis
Another take on this issue is the trade-off that exists now between valuation vs. potential
for diversification (vs. equities) (see Exhibit 141). We think any such analysis would be
incomplete unless one makes factors and traditional asset classes fungible. To do this, we
express the valuation as a Z score compared to history. For Momentum, Dividend Yield, and
Low Volatility we use the 12-month forward PE multiple, and the annual Price-to-Book
multiple for the Fama-French Price-to-Book factor. For US 10-year and HY bonds, we use
the bond yields, and for equity markets we use the Shiller PE multiples.
1960
1970
1980-2010
2010
1970
1980-2010
2010
1970
1980-2010
2010
1970
1980-20102010
1960
1970
1980-2010
2010
1960
1970
1980-2010
20101960
1970
1980-2010
2010
1980-2010
2010
-1.00
-0.50
0.00
0.50
1.00
1.50
2.00
2.50
3.00
-0.40 -0.20 0.00 0.20 0.40 0.60 0.80 1.00
IR
Corr with US Equities
US Bonds GSCI Commodity Index Gold
US REITS Price to Book(L/S) US Equity Low Vol (L/O)
FI Carry HY Bonds
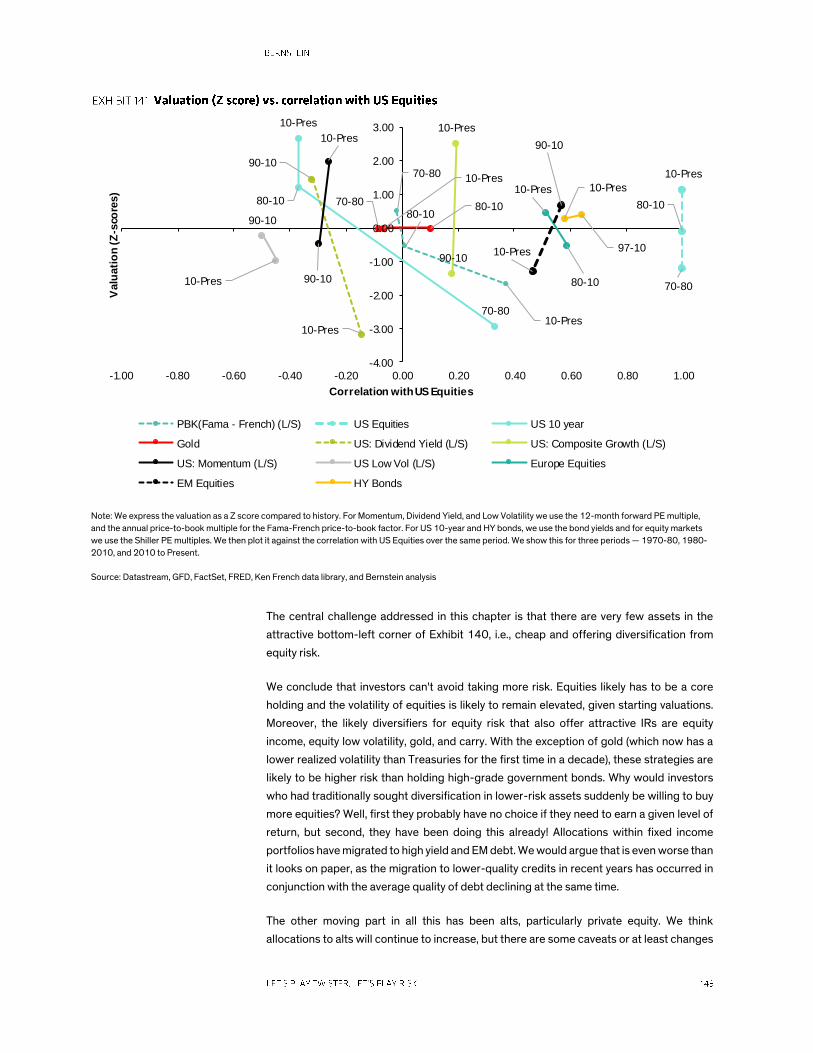
Note: We express the valuation as a Z score compared to history. For Momentum, Dividend Yield, and Low Volatility we use the 12-month forward PE multiple,
and the annual price-to-book multiple for the Fama-French price-to-book factor. For US 10-year and HY bonds, we use the bond yields and for equity markets
we use the Shiller PE multiples. We then plot it against the correlation with US Equities over the same period. We show this for three periods — 1970-80, 1980-
2010, and 2010 to Present.
Source: Datastream, GFD, FactSet, FRED, Ken French data library, and Bernstein analysis
The central challenge addressed in this chapter is that there are very few assets in the
attractive bottom-left corner of Exhibit 140, i.e., cheap and offering diversification from
equity risk.
We conclude that investors can't avoid taking more risk. Equities likely has to be a core
holding and the volatility of equities is likely to remain elevated, given starting valuations.
Moreover, the likely diversifiers for equity risk that also offer attractive IRs are equity
income, equity low volatility, gold, and carry. With the exception of gold (which now has a
lower realized volatility than Treasuries for the first time in a decade), these strategies are
likely to be higher risk than holding high-grade government bonds. Why would investors
who had traditionally sought diversification in lower-risk assets suddenly be willing to buy
more equities? Well, first they probably have no choice if they need to earn a given level of
return, but second, they have been doing this already! Allocations within fixed income
portfolios have migrated to high yield and EM debt. We would argue that is even worse than
it looks on paper, as the migration to lower-quality credits in recent years has occurred in
conjunction with the average quality of debt declining at the same time.
The other moving part in all this has been alts, particularly private equity. We think
allocations to alts will continue to increase, but there are some caveats or at least changes
70-80
80-10
10-Pres
70-80
80-10
10-Pres
70-80
80-10
10-Pres
70-80 80-10
10-Pres
90-10
10-Pres
90-10
10-Pres
90-10
10-Pres
90-10
10-Pres 80-10
10-Pres
90-10
10-Pres 97-10
10-Pres
-4.00
-3.00
-2.00
-1.00
0.00
1.00
2.00
3.00
-1.00 -0.80 -0.60 -0.40 -0.20 0.00 0.20 0.40 0.60 0.80 1.00
Valu
ati
on
(Z
-sco
res)
Correlation with US Equities
PBK(Fama - French) (L/S) US Equities US 10 year
Gold US: Dividend Yield (L/S) US: Composite Growth (L/S)
US: Momentum (L/S) US Low Vol (L/S) Europe Equities
EM Equities HY Bonds

to rules of the road that may be needed. Some would claim that an increased allocation to
private equity is the only way out. There are various problems with this:
◼ We are suspicious of the idea that private equity can out-earn public equity over the
cycle, once fees and the ability to take leverage are taken into account.25
◼ Proponents for private equity would cite the "alpha" from bringing about corporate
change. Fine, but that has exactly the same status as idiosyncratic alpha earned in
active public equities, so we think that it is a question of achieving idiosyncratic alpha
rather than anything special about private equity.
◼ Dry powder is at an all-time high. We are simply asking more from private equity than
we ever have before. We discussed this in detail in The Next 10 Years of Investing.
What returns are needed?
In Exhibit 142, we use a simple lifetime savings model to show that if expected returns on
investments fall from the 7% rate commonly used today (and the average assumed return
of US pension funds) to 4%, then the proportion of current salary that needs to be saved
for an average saver rises from 4% of their annual income to 11% of their annual income.
Exhibit 143 shows that since the GFC, US households have increased their savings rates.
The pandemic has caused an "off the chart" spike in saving, but that presumably is a
temporary effect. If low investment returns become the norm, then the savings rate would
have to rise to levels (until the pandemic) last seen in the 1960s, and the savings rate would
likely have to stay at that level. That would have, in turn, a painful impact on the amount of
income left over that was available to be used for consumption. And, of course, this is for
people who are lucky enough to be able to save each month. If the level of unemployment
proves sticky and does not fall back to the 2019 level, then an alternative will have to be
found for many households.
25 For more details see: "An Inconvenient Fact: Private Equity Returns & The Billionaire Factory", Ludovic Phalippou,
University of Oxford, Said Business School, 2020.

Note: Chart shows the relationship between the proportion of salary that
needs to be saved each year and expected investment returns. To quantify the
impact of asset class returns, we construct a simple lifetime savings model.
We assume someone starts work aged 20 earning $25K p.a. and experiences
salary growth of 2% p.a. and retires aged 65. On retirement, we assume they
purchase an annuity that pays out $35K every year and that they die aged 90.
We assume they pay into a savings product each year and this allows a simple
analysis of the scale of the change required to the proportion of salary that is
saved as we vary the assumed investment return.
Source: Bernstein analysis
Source: FRED and Bernstein analysis
Is there some leeway in this need to generate returns? After all, multiple years of strong
asset price returns might have built in enough of a reserve to weather a lower-return future
for a few years. Exhibit 144 and Exhibit 145 show the required glide path for the size of a
retirement pot assuming an agent who saves 5% of their salary each year and invests it in
a retirement vehicle that on average achieves 7% p.a. We then also take a sample of 2030
and 2040 target date funds and ask what the path would be if they were used for these
savings. The conclusion is that the strong returns of recent years have only managed to
keep track with the required glide path. In other words, the strong returns of recent years
have just been assumed to be normal and have been baked into the assumptions about how
much needs to be saved.
There is nothing wrong with the target date structure. We think it more likely that it is the
inputs that have to change. It was sensible for that to historically largely rely on allocating
between (mainly passive) equities and bonds, and to tilt that over time in a pre-programmed
way. We think that the range of inputs may now need to be cast much wider.
0
2
4
6
8
10
12
14
16
18
20
0 1 2 3 4 5 6 7 8
Pro
po
rtio
n o
f sala
ry th
at n
eed
s to
be s
aved (%
)
Expected investment returns (%, pa)
A more likely outcome
Mean forecast of US pension funds
0
5
10
15
20
25
30
35
Jan-5
9Ja
n-6
2Ja
n-6
5Ja
n-6
8Ja
n-7
1Ja
n-7
4Ja
n-7
7Ja
n-8
0Ja
n-8
3Ja
n-8
6Ja
n-8
9Ja
n-9
2Ja
n-9
5Ja
n-9
8Ja
n-0
1Ja
n-0
4Ja
n-0
7Ja
n-1
0Ja
n-1
3Ja
n-1
6Ja
n-1
9
%
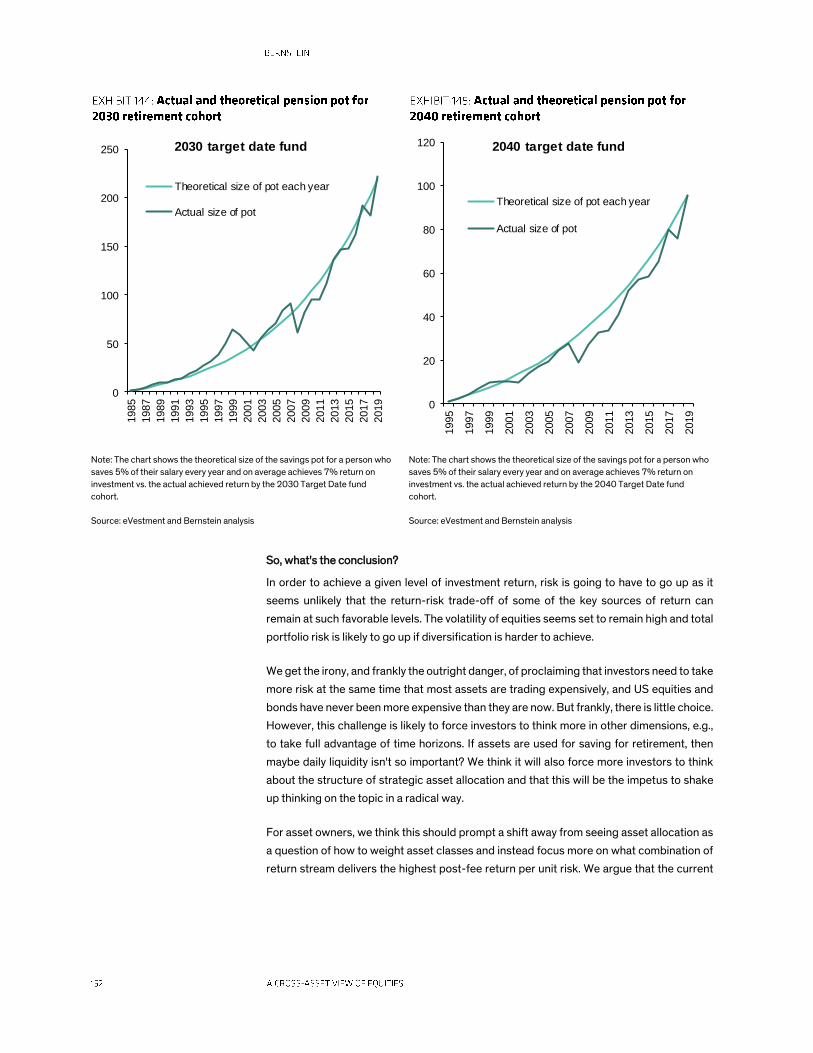
Note: The chart shows the theoretical size of the savings pot for a person who
saves 5% of their salary every year and on average achieves 7% return on
investment vs. the actual achieved return by the 2030 Target Date fund
cohort.
Source: eVestment and Bernstein analysis
Note: The chart shows the theoretical size of the savings pot for a person who
saves 5% of their salary every year and on average achieves 7% return on
investment vs. the actual achieved return by the 2040 Target Date fund
cohort.
Source: eVestment and Bernstein analysis
So, what's the conclusion?
In order to achieve a given level of investment return, risk is going to have to go up as it
seems unlikely that the return-risk trade-off of some of the key sources of return can
remain at such favorable levels. The volatility of equities seems set to remain high and total
portfolio risk is likely to go up if diversification is harder to achieve.
We get the irony, and frankly the outright danger, of proclaiming that investors need to take
more risk at the same time that most assets are trading expensively, and US equities and
bonds have never been more expensive than they are now. But frankly, there is little choice.
However, this challenge is likely to force investors to think more in other dimensions, e.g.,
to take full advantage of time horizons. If assets are used for saving for retirement, then
maybe daily liquidity isn't so important? We think it will also force more investors to think
about the structure of strategic asset allocation and that this will be the impetus to shake
up thinking on the topic in a radical way.
For asset owners, we think this should prompt a shift away from seeing asset allocation as
a question of how to weight asset classes and instead focus more on what combination of
return stream delivers the highest post-fee return per unit risk. We argue that the current
0
50
100
150
200
250
1985
1987
1989
1991
1993
1995
1997
1999
2001
2003
2005
2007
2009
2011
2013
2015
2017
2019
2030 target date fund
Theoretical size of pot each year
Actual size of pot
0
20
40
60
80
100
120
1995
1997
1999
2001
2003
2005
2007
2009
2011
2013
2015
2017
2019
2040 target date fund
Theoretical size of pot each year
Actual size of pot

focus of allocation to equities, bonds, and alts is unlikely to achieve this. Instead, there is
beta, idiosyncratic alpha, and cash/gold.26
Specifically, in terms of allocation, it suggests a structure of the form:
◼ Large overweight in equities.
◼ Gold, also heavily overweight.
◼ Within equities, buy Growth assets.
◼ Buy Value only if one thinks that an increase in inflation will lead to an increase in real
rates and a steepening of the curve. Without that, Value may be confined to tactical
rallies. Or possibly the definition of Value can be adjusted, e.g., stripping it of Financials
and very specifically buying undervalued Consumer, Industrials, and Commodity Value
names.
◼ High-grade bonds are not a good diversifier of equity risk, reallocate instead to equity
low volatility, equity income, and fixed income carry.
◼ In theory, one could buy real estate for income, but actually we would stay well away.
The aftermath of this crisis is likely to be horrible for an extended period for that sector,
and anyway the correlation of real estate and equities tends to rise with inflation.
◼ Infrastructure and real assets also become a core holding. However, a way needs to
be found to achieve this exposure without incurring 2/20 fees. Also, merely being a
real or illiquid asset does not justify an active fee. Some of those exposures can be
achieved passively.
◼ Our Alphalytics research Alphalytics: Tearing up the rules on active management has
shown that idiosyncratic alpha — as opposed to traditional alpha — is persistent. This,
therefore, becomes a key part of achieving overall return objectives.
For asset managers, this implies there is an opportunity for multi-asset businesses to craft
new products to fit this changed set of circumstances, e.g., blending asset classes, and
factors and idiosyncratic alpha. As realization of the changed set of investment
circumstances spreads, there will likely be growing demand for such product from both
institutional and retail investors. For example, bringing real assets and private assets into a
more democratized format that allows a greater number of investors to allocate to the
"beta" element of their returns, but without high fees, or changing the make-up of target
date structures to reflect the different return-risk trade-off would likely be growth areas in
this world.
26 As we laid out in depth in A New Paradigm for Investing.


◼ How has the availability of income and diversification changed over the course of the
current crisis? If the policy response to Covid-19 ends up being inflationary, what are
the prospects for returns and diversification?
◼ If the policy response to Covid-19 ends up being moderately inflationary, we think
equities should be a core holding. But how are the returns of other holdings likely to
fare? We show that if inflation rises then the equity Value factor, FX carry, real estate,
commodities, and gold tend to do well, as might be expected…
◼ …but real estate, high yield, and commodities become unattractive from the point of
view of ability to offer diversification. On that basis, equity income, equity low volatility,
carry, and gold are more valuable. Moreover, we think the outlook for real estate and
high yield are unattractive from a strategic point of view anyway.
◼ If we overlay this with current valuations, then it makes a strategic case for holding
Income/Value strategies within equities along with commodity-related equities.
◼ We analyze how the components of our strategic cross-asset portfolio and fixed
income replacement portfolios have fared in the pandemic. They outperformed 60:40
and hedge fund aggregates in the risk-off months. However, even with portfolios
constructed to have such a diversified set of strategies and assets, it is hard to avoid
drawdowns in such large risk-off months. This shows the importance of adding
sources of persistent (idiosyncratic) alpha to portfolios.
◼ The bottom line is that the impact of the pandemic has made the hunt for return vs.
diversification, in a strategic sense, even harder. Overall, this underlines the
importance of considering strategies/factors and not just asset classes in asset
allocation, especially if one aligns the outlook for returns with the ability to achieve
diversification and the opportunities presented by current valuations.
The current crisis brings a host of tactical and strategic investment challenges: how have
strategies that are designed to yield a positive real return fared? What is the prognosis for
achieving diversification in the current environment? If the policy response to the crisis is
inflationary, what strategic allocations should be made? If high-grade fixed-income assets
are less able to achieve either their traditional return or diversification objectives, how are
the possible alternatives faring?

A theme in our research has been that the true benchmark for most investments should be
a spread over inflation and that it is going to become harder to achieve positive real returns
and diversification in coming years. Our recent Blackbook A New Paradigm for Investing
laid out a framework for thinking about how to respond to this. In our research Fund
Management Strategy: An urgent need to replace fixed income, we suggested a portfolio
approach was needed for replacing high-grade fixed-income assets and we have also set
out suggestions for strategic cross-asset portfolios that span asset classes, factors, and
alpha strategies in Global Quantitative Strategy: 6 strategic trades and 5 tactical trades.
In this chapter we look at:
◼ How different types of multi-asset strategies have performed so far in the Covid-19
crisis.
◼ How such strategies are set up if inflation becomes an issue during 2021 and beyond.
◼ What the current outlook for achieving return and diversification is.
Exhibit 146 shows the return in each of the four highly volatile months, February 2020 to
May 2020, of a selection of strategies that form elements either of our strategic cross-
asset portfolio or else our fixed income replacement strategy.
Overall, our cross-asset portfolio and fixed income replacement portfolio did much better
than 60:40 and hedge fund aggregates in the risk-off months of February and March 2020,
though they underperformed simply holding 10-year bonds. They also materially
underperformed a simple, passive, long-equity position in the rebound. It has been hard to
escape from the initial downward drag on risk assets and the widely dispersed rebound.
Components of such strategies such as bond value, FX carry, and gold did manage to act
as diversifiers from equity risk as the market fell in February-March 2020, but as we show
in Exhibit 147 and Exhibit 148, even these portfolios that try to get returns from a very
broad variety of sources have seen a much higher proportion of their constituent trades
posting positive performance.
The role for skilled active: We note that these portfolios are constructed almost entirely
from asset class and factor betas.27 This can show the importance of including active
strategies as part of a full portfolio — the proviso, of course, being that there has to be
confidence in the persistence of that alpha. The recent Alphalytics research (Comment: The
pandemic and the power of concentration) showed that the subset of managers who
showed prior skill in terms of generating idiosyncratic returns and, crucially, were also very
concentrated, managed to show strong performance in this period. We have shown that
idiosyncratic returns are generally more "sticky" than normal alpha, making them an
appropriate part of such a portfolio.
27 The one exception is the global quant equity alpha model.

Source: FactSet, MSCI, Datastream, HFRX, Bloomberg, and Bernstein analysis
Source: Datastream, FactSet, Bloomberg, and Bernstein analysis Source: Datastream, FactSet, Bloomberg, and Bernstein analysis
US Stable
Yield Total
Return
US REITS
Total
Return
Europe
Infrastructure
Basket Index
(USD)
US TIPS 10Y
FX Carry
(Top 3 /
Bottom 3)
FX
Momentum
(Top 3 /
Bottom 3)
Bond Carry
(Top 3 /
Bottom 3)
GoldMunicipal
Bonds
29/02/2020 -7.19 -6.87 -7.80 1.42 0.69 -0.27 -1.48 0.00 1.29
31/03/2020 -10.20 -17.83 -6.68 -0.31 1.73 0.26 -3.06 1.60 -3.63
30/04/2020 11.96 8.85 4.50 2.40 0.69 0.16 -1.61 5.75 -1.26
31/05/2020 3.60 2.35 4.09 0.47 0.37 0.09 2.98 1.57 3.18
Global Alpha
Model
Residual
ValueBond Value
Bond
Momentum
German
Power Price
Delivery
FCF Yield MSCI World
29/02/2020 -0.69 -1.72 1.09 -2.35 -1.37 -2.97 -8.41
31/03/2020 -4.32 -2.72 7.19 -5.29 -10.03 -3.27 -13.17
30/04/2020 0.20 -3.77 -1.29 -2.11 3.08 -1.56 10.98
31/05/2020 -0.60 -4.51 2.02 1.43 1.99 -3.42 4.90
FI
Replacement
Portfolio
Strategic
Quant
Portfolio
US EquitiesUS 10 year
BondsUS 60/40
Hedge Fund
Composite
29/02/2020 -1.07 -1.58 -8.23 3.81 -3.42 -2.21
31/03/2020 -2.80 -1.91 -12.35 6.11 -4.97 -8.42
30/04/2020 2.01 -0.60 12.82 0.21 7.78 4.79
31/05/2020 1.69 0.23 4.76 -0.013 2.85 -
FI Replacement Portfolio
Strategic Quant Portfolio
0.0%
10.0%
20.0%
30.0%
40.0%
50.0%
60.0%
Feb-20 Mar-20 Apr-20 May-20
Strategic portfolio returns >0
0.0%
10.0%
20.0%
30.0%
40.0%
50.0%
60.0%
70.0%
80.0%
90.0%
100.0%
Feb-20 Mar-20 Apr-20 May-20
FI replacement portfolio returns >0

Inflation hedging properties and what it means for portfolios
We think there is a strong likelihood that the policy response to the lockdown is
inflationary.28 So, once we get over the near-term deflationary shock we currently face, a
strategic allocation may require outright inflation protection.
Exhibit 149 shows the average return of a range of assets/factors since 1970, conditioned
on the level of inflation in a given year (the factor strategies are shown here long-short). The
key conclusions from this are that equities are one of the most effective assets to hold as
inflation rises, at least until inflation reaches a 5% level. We next show that a similar
message for equities comes from looking at valuation conditioned on inflation.
Within equities, Value factors do well as inflation rises, and within Value it is the more "mean
reversion" type of Value factor such as price-to-book that is key and not the more income-
type factors such as dividend yield. There is, of course, a huge ongoing debate about
whether Value "is dead." Our view is that yes, it faces some structural problems such as the
switch to investment being in intangible assets, potentially making metrics such as price-
to-book and PE less meaningful, and whether QE has ended the usual process of mean-
reversion (we discussed this in Global Quantitative Strategy: Has Value met its Waterloo?).
But over and above this, part of the pressure on Value factors in recent years has been
persistent negative surprise of inflation prints.
Within fixed income, it is FX carry strategies that most clearly do progressively better as
inflation rises. On average, these strategies have been loss-making at inflation rates less
than 1%, but have been significantly more profitable at inflation rates over 2%.
Commodities and gold also score well on this basis, both outright commodity holdings and
also the equity of the commodity sectors. We covered the case for gold in more detail in
Portfolio Strategy / Global Metals & Mining: Scrap 60/40 and go mining for gold.
Real assets are also good inflation hedges in theory. We show next that real estate indices
are positively exposed to inflation, and more importantly from an investability perspective
so are REITS. However, this time we would be much more cautious on near-term exposure
to real estate, given the scale of the current recession and the exposure of the sector to the
structural problems of the retail and leisure sectors. We also describe why real estate may
be unattractive from a diversification point of view. One very important real asset —
infrastructure — is missing from this. In recent work, we have used a basket of
infrastructure-exposed Utilities as a proxy for such assets (A New Paradigm for Investing).
However, we do not have long-enough data for such assets to capture a wide-enough
range of inflation regimes. Therefore, we are just going to assert that infrastructure assets
can act as an inflation hedge, given in many cases their ability to extract an income stream
set in real terms.
28 Portfolio Strategy: Tilting the balance from shareholders to governments? The strategic outlook post Covid-19
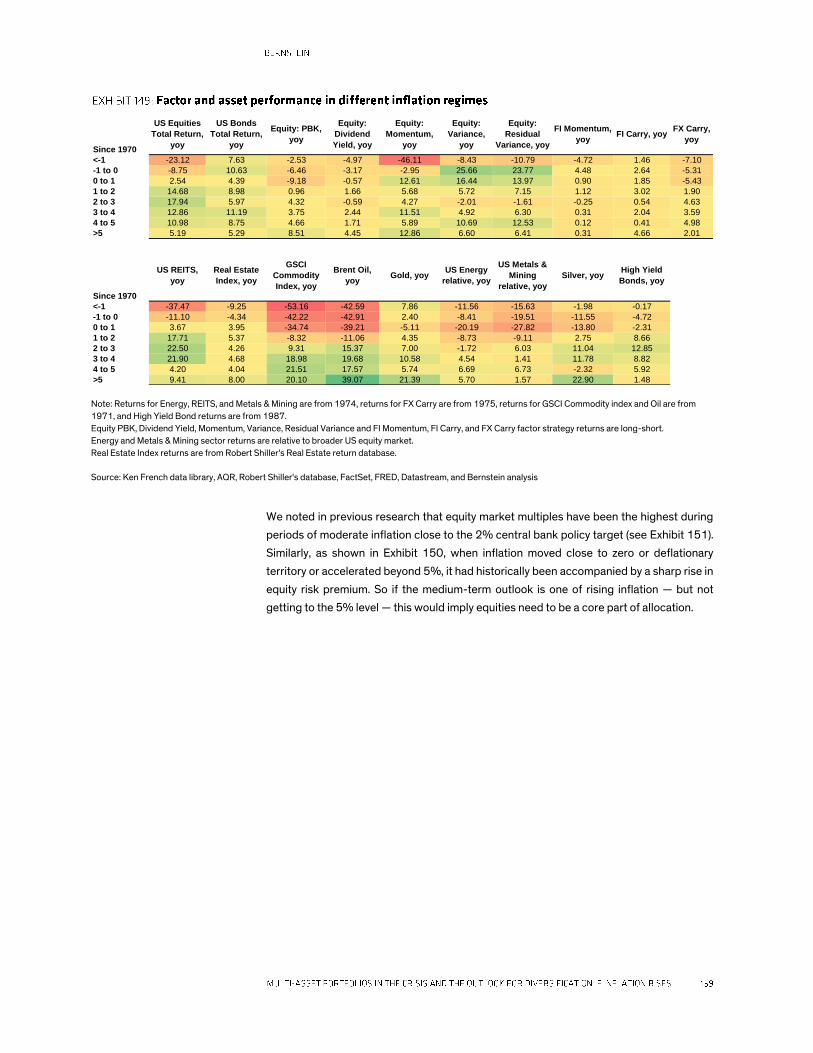
Note: Returns for Energy, REITS, and Metals & Mining are from 1974, returns for FX Carry are from 1975, returns for GSCI Commodity index and Oil are from
1971, and High Yield Bond returns are from 1987.
Equity PBK, Dividend Yield, Momentum, Variance, Residual Variance and FI Momentum, FI Carry, and FX Carry factor strategy returns are long-short.
Energy and Metals & Mining sector returns are relative to broader US equity market.
Real Estate Index returns are from Robert Shiller's Real Estate return database.
Source: Ken French data library, AQR, Robert Shiller's database, FactSet, FRED, Datastream, and Bernstein analysis
We noted in previous research that equity market multiples have been the highest during
periods of moderate inflation close to the 2% central bank policy target (see Exhibit 151).
Similarly, as shown in Exhibit 150, when inflation moved close to zero or deflationary
territory or accelerated beyond 5%, it had historically been accompanied by a sharp rise in
equity risk premium. So if the medium-term outlook is one of rising inflation — but not
getting to the 5% level — this would imply equities need to be a core part of allocation.
Since 1970
US Equities
Total Return,
yoy
US Bonds
Total Return,
yoy
Equity: PBK,
yoy
Equity:
Dividend
Yield, yoy
Equity:
Momentum,
yoy
Equity:
Variance,
yoy
Equity:
Residual
Variance, yoy
FI Momentum,
yoyFI Carry, yoy
FX Carry,
yoy
<-1 -23.12 7.63 -2.53 -4.97 -46.11 -8.43 -10.79 -4.72 1.46 -7.10
-1 to 0 -8.75 10.63 -6.46 -3.17 -2.95 25.66 23.77 4.48 2.64 -5.31
0 to 1 2.54 4.39 -9.18 -0.57 12.61 16.44 13.97 0.90 1.85 -5.43
1 to 2 14.68 8.98 0.96 1.66 5.68 5.72 7.15 1.12 3.02 1.90
2 to 3 17.94 5.97 4.32 -0.59 4.27 -2.01 -1.61 -0.25 0.54 4.63
3 to 4 12.86 11.19 3.75 2.44 11.51 4.92 6.30 0.31 2.04 3.59
4 to 5 10.98 8.75 4.66 1.71 5.89 10.69 12.53 0.12 0.41 4.98
>5 5.19 5.29 8.51 4.45 12.86 6.60 6.41 0.31 4.66 2.01
Since 1970
US REITS,
yoy
Real Estate
Index, yoy
GSCI
Commodity
Index, yoy
Brent Oil,
yoyGold, yoy
US Energy
relative, yoy
US Metals &
Mining
relative, yoy
Silver, yoyHigh Yield
Bonds, yoy
<-1 -37.47 -9.25 -53.16 -42.59 7.86 -11.56 -15.63 -1.98 -0.17
-1 to 0 -11.10 -4.34 -42.22 -42.91 2.40 -8.41 -19.51 -11.55 -4.72
0 to 1 3.67 3.95 -34.74 -39.21 -5.11 -20.19 -27.82 -13.80 -2.31
1 to 2 17.71 5.37 -8.32 -11.06 4.35 -8.73 -9.11 2.75 8.66
2 to 3 22.50 4.26 9.31 15.37 7.00 -1.72 6.03 11.04 12.85
3 to 4 21.90 4.68 18.98 19.68 10.58 4.54 1.41 11.78 8.82
4 to 5 4.20 4.04 21.51 17.57 5.74 6.69 6.73 -2.32 5.92
>5 9.41 8.00 20.10 39.07 21.39 5.70 1.57 22.90 1.48

Source: Datastream and Bernstein analysis Source: Robert Shiller's database, Datastream, and Bernstein analysis
Exhibit 152 and Exhibit 153 show the link between equity value and income strategies with
inflation. The link is stronger between "deep value" and more cyclical metrics such as price-
to-book, but it also holds for income strategies. We have discussed in recent research
(Global Quantitative Strategy: Has Value met its Waterloo?) how there are multiple
structural challenges for Value and these remain in place, but in addition one problem at
least has been persistent negative surprises on inflation prints. Therefore, an uptick in
inflation would be expected to support Value. We also show that FX carry seems to show a
positive link to inflation, as suggested by Exhibit 154.
-1
0
1
2
3
4
5
6
<-2 -2 to -1 -1 to 0 0 to 1 1 to 2 2 to 4 4 to 5 >5
US
ER
P
Inflation
0
5
10
15
20
25
<-2 -2 to -1 -1 to 0 0 to 1 1 to 2 2 to 4 4 to 5 >5
US
CA
PE R
atio
Inf lation

Source: Ken French data library, Datastream, and Bernstein analysis Source: Ken French data library, Datastream, and Bernstein analysis
Source: AQR, Datastream, and Bernstein analysis
What we are interested in is the interaction of expected returns as inflation rises with the
properties of assets as a diversifier. Here we are assuming that inflation can move higher
but does not spiral out of control. In such an environment, equities are the core holding, but
-15
-10
-5
0
5
10
15
20
25Jun-3
6Jun-4
0Jun-4
4Jun-4
8Jun-5
2Jun-5
6Jun-6
0Jun-6
4Jun-6
8Jun-7
2Jun-7
6Jun-8
0Jun-8
4Jun-8
8Jun-9
2Jun-9
6Jun-0
0Jun-0
4Jun-0
8Jun-1
2Jun-1
6Jun-2
0
%
US CPI
US PBK 10-year rolling return (annualized)
-15.00
-10.00
-5.00
0.00
5.00
10.00
15.00
20.00
25.00
01/0
6/1
926
01/0
6/1
933
01/0
6/1
940
01/0
6/1
947
01/0
6/1
954
01/0
6/1
961
01/0
6/1
968
01/0
6/1
975
01/0
6/1
982
01/0
6/1
989
01/0
6/1
996
01/0
6/2
003
01/0
6/2
010
01/0
6/2
017
%
US CPI
US DY 10 year rolling return (annualized)
-8.0
-3.0
2.0
7.0
12.0
17.0
-20
-15
-10
-5
0
5
10
15
20
25
30
01/0
1/1
975
01/0
6/1
976
01/1
1/1
977
01/0
4/1
979
01/0
9/1
980
01/0
2/1
982
01/0
7/1
983
01/1
2/1
984
01/0
5/1
986
01/1
0/1
987
01/0
3/1
989
01/0
8/1
990
01/0
1/1
992
01/0
6/1
993
01/1
1/1
994
01/0
4/1
996
01/0
9/1
997
01/0
2/1
999
01/0
7/2
000
01/1
2/2
001
01/0
5/2
003
01/1
0/2
004
01/0
3/2
006
01/0
8/2
007
01/0
1/2
009
01/0
6/2
010
01/1
1/2
011
01/0
4/2
013
01/0
9/2
014
01/0
2/2
016
01/0
7/2
017
01/1
2/2
018
01/0
5/2
020
%
%, y
oy
FX Carry Index, yoy CPI, yoy (RHS)

what should the overall portfolio look like? Exhibit 155 shows the correlation of assets and
strategies with equities predicated on inflation levels.
The first column shows that bonds become a less useful diversifier as inflation rises, hence
the need to find an alternative. The most striking result to us is that Value, Income, and Low
Volatility strategies within the equity market become better diversifiers from a passive
long-only equity position as inflation rises. The importance of Value as a diversifier does not
seem to be constrained to equities, as Carry strategies with fixed income markets (between
short- and long-dated debt) and FX carry strategies (between the debt of countries with
differing levels of yields) also tend to have lower correlation with equities at higher levels of
inflation.
Gold retains a low correlation with equities as inflation rises, but investable real estate in
the form of REITS and also high-yield bonds have a correlation with equities that increases
with inflation and, hence, become less attractive.
Note: Returns for Energy, REITS, and Metals & Mining are from 1974, returns for FX Carry are from 1975, returns for GSCI Commodity index and Oil are from
1971, and High Yield Bond returns are from 1987.
Equity PBK, Dividend Yield, Momentum, Variance, Residual Variance and FI Momentum, FI Carry, and FX Carry factor strategy returns are long-short.
Energy and Metals & Mining sector returns are relative to broader US equity market.
Real Estate Index returns are from Robert Shiller's Real Estate return database.
Source: Ken French data library, AQR, Robert Shiller's database, FactSet, FRED, Datastream, and Bernstein analysis
In Exhibit 156, we look across all periods where inflation was greater than 3%. On the
vertical axis, we plot the return-risk (information ratio) of a given holding and on the
horizontal axis we plot the correlation of the asset with equities. The attractive assets are in
the top left as these have a higher return-risk and better diversification from a passive long-
equity position. We find that the assets closest to this are equity low volatility, equity
income, gold, and fixed income carry.
Since 1970
US 10y
Bonds
Equity: Price
to Book
Equity:
Dividend
Yield
Equity:
Momentum
Equity:
Variance
Equity:
Residual
Variance
FI Mom FI Carry FX Carry
<1 -0.09 0.19 -0.18 -0.27 -0.21 -0.24 0.09 0.26 0.27
1-2 -0.22 0.26 -0.36 -0.24 -0.32 -0.30 0.15 0.05 0.33
2-3 0.00 0.10 -0.13 -0.09 -0.30 -0.31 0.06 -0.07 0.15
3-4 0.00 -0.02 -0.41 0.04 -0.51 -0.51 0.12 -0.06 0.12
4-5 0.24 -0.10 -0.40 -0.05 -0.50 -0.48 0.00 -0.12 -0.04
>5 0.31 -0.05 -0.50 0.05 -0.63 -0.58 -0.22 -0.16 0.03
Since 1970
GSCI
Commodity
Index
Oil Gold Silver
Energy
Stocks
relative
Mining
Stocks
relative
REITS
Real
Estate
Index
High
Yield
Bonds<1 0.15 0.17 0.13 0.17 -0.16 0.27 0.32 0.22 0.51
1-2 0.13 0.21 -0.11 -0.04 0.02 0.11 0.39 -0.03 0.56
2-3 0.07 0.08 0.05 0.12 -0.11 0.02 0.33 -0.08 0.57
3-4 0.20 0.23 0.03 0.22 0.12 0.18 0.44 -0.10 0.64
4-5 -0.04 -0.02 -0.14 0.16 -0.09 0.17 0.49 0.02 0.51
>5 0.09 0.03 -0.02 0.01 -0.01 0.15 0.62 0.00 0.62
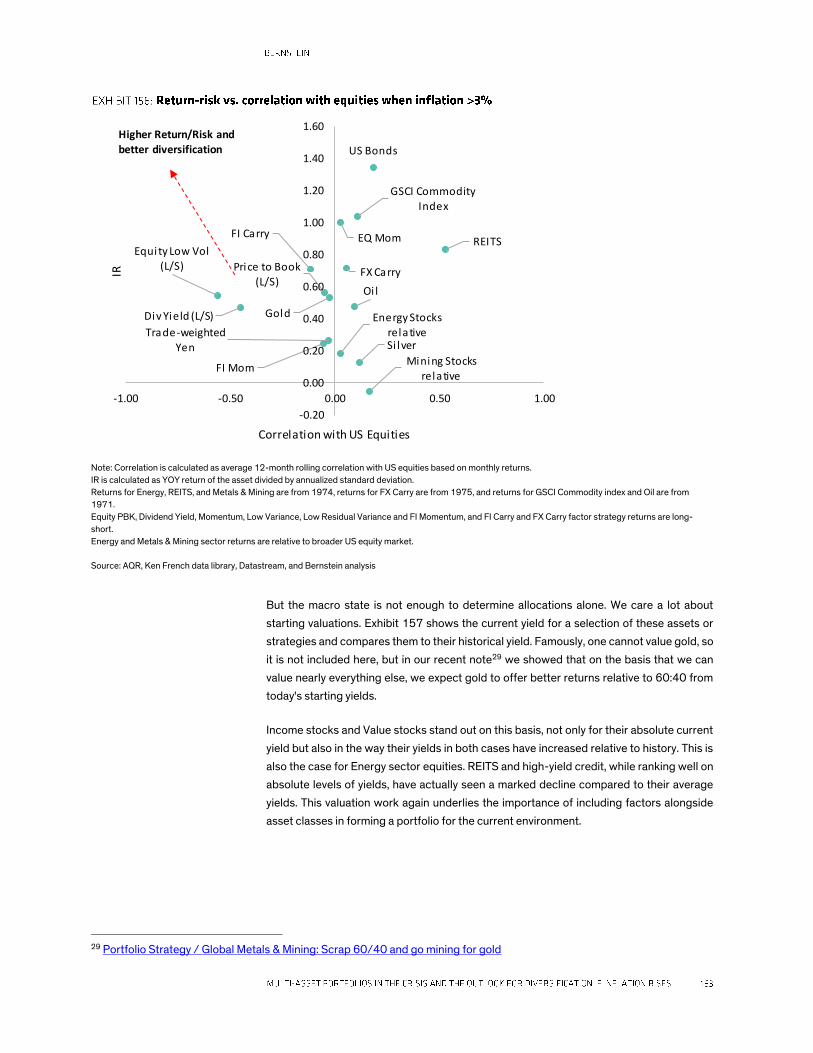
Note: Correlation is calculated as average 12-month rolling correlation with US equities based on monthly returns.
IR is calculated as YOY return of the asset divided by annualized standard deviation.
Returns for Energy, REITS, and Metals & Mining are from 1974, returns for FX Carry are from 1975, and returns for GSCI Commodity index and Oil are from
1971.
Equity PBK, Dividend Yield, Momentum, Low Variance, Low Residual Variance and FI Momentum, and FI Carry and FX Carry factor strategy returns are long-
short.
Energy and Metals & Mining sector returns are relative to broader US equity market.
Source: AQR, Ken French data library, Datastream, and Bernstein analysis
But the macro state is not enough to determine allocations alone. We care a lot about
starting valuations. Exhibit 157 shows the current yield for a selection of these assets or
strategies and compares them to their historical yield. Famously, one cannot value gold, so
it is not included here, but in our recent note29 we showed that on the basis that we can
value nearly everything else, we expect gold to offer better returns relative to 60:40 from
today's starting yields.
Income stocks and Value stocks stand out on this basis, not only for their absolute current
yield but also in the way their yields in both cases have increased relative to history. This is
also the case for Energy sector equities. REITS and high-yield credit, while ranking well on
absolute levels of yields, have actually seen a marked decline compared to their average
yields. This valuation work again underlies the importance of including factors alongside
asset classes in forming a portfolio for the current environment.
29 Portfolio Strategy / Global Metals & Mining: Scrap 60/40 and go mining for gold
US Bonds
GSCI Commodity Index
Oi l
Gold
Si lver
Energy Stocks relative
Mining Stocks relative
Price to Book
(L/S)
Div Yield (L/S)
EQ Mom
FI Mom
Equity Low Vol (L/S)
Trade-weighted Yen
FI Carry
FX Carry
REITS
-0.20
0.00
0.20
0.40
0.60
0.80
1.00
1.20
1.40
1.60
-1.00 -0.50 0.00 0.50 1.00
IR
Correlation with US Equities
Higher Return/Risk and
better diversification

Note: Equity High DY, Low Volatility, Momentum, PBK, FI Momentum, FI Carry, and FX Carry strategies are long only.
Average is calculated since 1990 for all strategies except REITS (since 1999) , US 10-year bonds (since 1970), and US high-yield bonds (since 1997).
Source: FactSet, Datastream, FRED, and Bernstein analysis
Own gold
We also remain overweight gold. Famously one cannot value gold. However, we can value
(nearly) everything else! Exhibit 158 shows the forward return of gold relative to a 60:40
portfolio (based on US equities and bonds) conditioned on starting levels of equity valuation
and bond yields. As we move down the tables, it shows higher starting levels of valuation of
equities and there is a clear indication that the relative performance of gold to 60:40
increases as starting equity valuations increase. The relationship with starting levels of
bond yields is not quite so clear, but one conclusion is that the worst relative gold returns
are from when starting levels of yields are high. There have not been occasions in the last
50 years when both equity valuations have been high and bond yields high. The conclusion
from this is that on the basis of valuation of other assets, the prognosis for gold returns
relative to 60:40 is good. Equity valuations are in the top quintile of Shiller PE and bond
yields are as far as they could be from the high starting levels that tend to create a bad set
up for gold.
From a multi-asset perspective, adding gold into a portfolio can be hard as it does not pay
an income. Moreover, for long periods of time, the real return from the asset is zero. Thus,
it can often be a drag on portfolio performance. But that does not seem to be the case at
present, given the starting valuation and yields on other asset classes.
YieldUS High
DY
US Low
Vol
US
Momentum
US Cheap
PBK
US High Yield
BondsUS REITS
US Energy
Sector
US Metals
& Mining
sector
Current 5.66 1.81 0.97 4.08 7.69 3.51 5.28 1.45
Average 4.34 2.73 1.13 2.28 8.80 3.86 2.58 1.53
Curr-Av 1.32 -0.92 -0.16 1.80 -1.11 -0.35 2.70 -0.07
YieldUS 10y
Yield
US
Equities
Europe
Equities
EM
Equities
FI
MomentumFI Carry FX Carry
Current 0.63 1.74 2.64 2.59 1.01 0.97 0.12
Average 6.28 1.94 3.03 2.29 4.53 2.55 3.01
Curr-Av -5.65 -0.21 -0.39 0.30 -3.52 -1.59 -2.89

Note: Data from June 1972 to April 2020
Source: Datastream, IBES, MSCI, and Bernstein analysis
Gold - 60/40: 1 Year Return
BY Low BY High
1 2 3 4 5 Avg
Shiller Cheap 1 25.4 12.6 -9.2 -1.9
2 4.0 14.8 58.2 -6.4 -20.7 8.5
3 -10.8 8.9 2.4 -17.7 -2.1 -3.3
4 -6.9 13.8 -28.1 1.0
Shiller Exp 5 -0.6 9.0 -13.3 -3.2
Avg -6.1 11.7 6.9 -2.0 -11.0
Gold - 60/40: 3 Year Return
BY Low BY High
1 2 3 4 5 Avg
Shiller Cheap 1 55.6 15.3 -16.7 -5.8
2 7.3 8.0 15.5 -6.1 -16.7 -1.1
3 -14.5 2.7 -11.4 -13.0 -13.4 -9.4
4 -5.0 14.1 -25.5 2.1
Shiller Exp 5 1.0 4.7 -3.0 0.2
Avg -8.2 9.3 -3.7 -0.3 -16.6
Gold - 60/40: 5 Year Return
BY Low BY High
1 2 3 4 5 Avg
Shiller Cheap 1 10.8 9.3 -16.7 -8.1
2 -5.6 -4.5 7.3 -5.2 -15.0 -3.5
3 -12.1 -1.9 -16.0 -15.5 -17.5 -11.4
4 -4.6 13.3 -17.8 4.5
Shiller Exp 5 7.7 0.4 3.3
Avg -9.3 8.0 -5.3 -2.1 -16.4
Gold - 60/40: 7 Year Return
BY Low BY High
1 2 3 4 5 Avg
Shiller Cheap 1 4.3 -0.4 -16.4 -11.1
2 -7.0 -5.7 13.2 -8.2 -14.6 -3.7
3 -10.0 -1.8 -12.5 -16.9 -13.1 -9.8
4 8.4 -9.6 4.6
Shiller Exp 5 9.5 2.6 5.4
Avg -9.5 5.8 -1.0 -6.9 -16.1
Gold - 60/40: 10 Year Return
BY Low BY High
1 2 3 4 5 Avg
Shiller Cheap 1 -3.2 -5.2 -15.7 -12.3
2 -6.1 -5.5 4.0 -11.9 -16.7 -8.2
3 -6.1 -0.3 -8.0 -12.1 -16.0 -6.6
4 1.9 -4.8 0.5
Shiller Exp 5 10.7 6.4 8.1
Avg -6.1 3.1 -0.1 -9.8 -15.9

Outlook for diversification and cross-asset returns
We can draw a few conclusions from this work. We have worried about the strategic
outlook for returns and availability of diversification for some time. The impact of the
pandemic and its associated policy response has acted as an accelerant in this regard and
made the situation even more extreme.
If we assume a moderate increase in inflation, then equities become the core strategic
holding. But at the same time it becomes necessary to add strategies or factors alongside
asset classes in an asset allocation framework. We think these should increasingly be
thought of as interchangeable sources of "beta."
Within this context, high-grade government bonds are likely to be less useful as a
diversifier. Instead, a range of other options are needed. Especially when the current yields
on assets and strategies are taken into account. These portfolio holdings are likely to have
to include income and low volatility within equities and carry strategies in fixed income
along with gold.
We note that in theory real estate is meant to be an inflation hedge, but we do not think that
is attractive. Its correlation with equities rises with inflation, its current income level is lower
than its average level, and we think the near-term outlook for commercial real estate will be
horrible tactically (given the recession) and strategically (given the shifts in retail, leisure,
and other commercial demands in the long run, as a result of the lockdown).
One asset that we have not discussed here is infrastructure. Our usual proxies for
infrastructure (a subset of Utility companies with high exposure in this area) is not sufficient
for us to analyze how they perform as inflation rises. However, we feel we can assert that
infrastructure assets should be inflation hedges and could receive an added boost as a
result of stimulus efforts by governments.

◼ I have changed my mind about bitcoin's role in asset allocation. In January 2018, we
declared that it had no such role. But actually, in our note written in November 2020,
we had to admit it does. What has changed is the policy environment, debt levels, and
diversification options for investors post the pandemic.
◼ Writing about cryptocurrencies after bitcoin has staged a large rally in recent weeks
— followed by a correction — may inevitably sound like playing catch up. As a
strategist, it is depressingly like upgrading a stock after it reaches a new high. Given
the volatility of cryptocurrencies, then no doubt over tactical horizons they can give up
yet more of their recent gains, but this chapter is aimed firmly at the long-term not
tactical horizons. The pandemic poses some profound questions for the role of
cryptocurrency and potentially transforms its role.
◼ This chapter is about two related aspects of crypto: the role of crypto in asset
allocation and the way its potential as a medium of exchange affects the ability to
implement policy. This is bound up in the question of power of governments and their
likely larger role in economies post Covid-19. This, in turn, has massive implications
for asset allocation.
◼ It is relatively easy to create a narrative of why demand for cryptos might increase,
given the economic status quo post Covid-19. A counteracting force is: what is the
limit on supply? Bitcoin has a limited supply, but a multitude of cryptos have been
created. In theory, total crypto supply is unlimited. However, in this respect, they are
like fiat currencies. In practice, only a small number are used for investment. Thus, at
any given time, the supply of cryptos could be limited "for practical purposes," though
the exact enumeration of which cryptos are on that list will vary over time.
◼ The role of cryptos in asset allocation inevitably leads to a discussion of what is
money? In this light, the pandemic acts as a new force both for and against cryptos.
On the positive side, there will likely be increased demand as a result of fiscal
expansion, the likelihood of inflation, the likelihood that taxes increase, and the change
in the debate whereby MMT-related policies are increasingly discussed. In other
words, the greater role that governments will likely play in economies makes cryptos
potentially more appealing. These very same forces may also hinder cryptos. If they
get in the way of policy implementation, governments might seek to constrain them.

Do cryptocurrencies have a role in asset allocation?
When we posed this question in 2018, we concluded that they did not have such a role. We
would like to shift that position and say well actually yes, maybe they do. There are a few
ways to view this question. Probably easiest is to see this through the narrow lens of an
asset allocation problem. We start the chapter with this, as it is the least controversial way
to address the problem. In this light, it becomes a purely empirical question and avoids the
quasi-philosophical question of "what is money?".
We are not going to talk about gold in this chapter, but for us the arguments outlined here
lead primarily to a case to remain overweight gold. We most recently outlined our case for
this in Portfolio Strategy / Global Metals & Mining: Scrap 60/40 and go mining for gold. We
see cryptos as potentially playing a role alongside the precious metal.
There has been a marked change here since we declared that bitcoin has no role in asset
allocation three years ago; these changes have occurred both to the empirical return data
of bitcoin itself and also to the policy framework in which investors operate. With regard to
the former, the volatility of bitcoin has significantly reduced, making it more attractive in its
potential twin roles both as a store of value and as a medium for exchange (see Exhibit 159).
Given increases in volatility of other asset classes, this means the relative volatility of bitcoin
to both gold and equities has declined to historically low levels (see Exhibit 160).
Source: Datastream and Bernstein analysis Source: Datastream and Bernstein analysis
However, the pandemic has also seen the correlation of bitcoin to other major assets rise.
The basic issue is that it is a liquid asset, so in times like early March 2020 it can be sold
easily and, hence, does not escape from a rapid cross-asset deleveraging. The correlation
of bitcoin to other assets has remained high (see Exhibit 161).
0
20
40
60
80
100
120
%, a
nnualiz
ed
12m trailing volatility
Bitcoin Gold S&P 500
0
2
4
6
8
10
12
14
16
%, an
nu
alize
d
12m trailing volatility
Bitcoin vs S&P Volatility
Bitcoin vs Gold volatility

Source: Datastream and Bernstein analysis
What does this mean for its role in asset allocation? We will come to the big picture question
later in this chapter. From a narrow empirical point of view, the downward shift in volatility
of bitcoin makes it more desirable, but its increased correlation points the other way. If we
put this into a simple asset allocation framework, Exhibit 162 shows the weight on bitcoin
that would result, given a range of possible assumed return outcomes for the currency. This
is a very simple optimization with the only constraint being that weights can't be negative.
The first column uses trailing return and risk data since 2016, the other columns then
assume a range of monthly return numbers for bitcoin.
The recent increase in correlation, but decrease in volatility leave these recommended
allocations at levels similar to before the pandemic. The resulting allocation to bitcoin is low,
but then within this simple optimization framework, the allocation to some other asset
classes is zero, so in that context, bitcoin seems to empirically be potentially significant.
-0.2
-0.1
0
0.1
0.2
0.3
0.4
0.5
Co
rrela
tion
12m rolling correlation
Bitcoin vs S&P correlation Bitcoin vs Gold correlation

Note: The analysis uses the return and risk data from January 2016 to October 2020. The risk-free rate is calculated as the average three-month US treasury
yield since 2016. First column shows the weights of an optimal portfolio using actual return and risk numbers from January 2016.
Source: Datastream, Bloomberg, and Bernstein analysis
While bitcoin has become less volatile, though albeit more correlated with equities, there
has been a marked de-correlation between cryptocurrencies over the last year. Exhibit 163
shows the rolling pairwise correlation between the 10 largest cryptos by market cap and
Exhibit 164 shows the correlations between the individual pairs.
Note: Average pairwise correlation of daily price returns over a rolling three-month lookback window for the cryptocurrencies: bitcoin, bitcoin cash, dash, EOS,
ethereum, ethereum classic, litecoin, monero, XRP, and zcash.
Source: Bloomberg and Bernstein analysis
9% 1.50% 3% 5% 10%
S&P 500 29% 27% 31% 31% 29%
EAFE 0% 0% 0% 0% 0%
EM 0% 0% 0% 0% 0%
Commodities 0% 0% 0% 0% 0%
US 10 Year Gov Bond 66% 65% 67% 67% 66%
High Yield 0% 8% 1% 0% 0%
Investment Grade 0% 0% 0% 0% 0%
International Treasuries 0% 0% 0% 0% 0%
Bitcoin 4% 0% 1% 2% 5%
Assumed Bitcoin average monthly return
0.5
0.55
0.6
0.65
0.7
0.75
0.8
0.85
0.9
Aug-1
8
Sep-1
8
Oct-18
Nov-1
8
Dec-1
8
Jan-1
9
Feb-1
9
Mar-
19
Apr-
19
May-1
9
Jun-1
9
Jul-19
Aug-1
9
Sep-1
9
Oct-19
Nov-1
9
Dec-1
9
Jan-2
0
Feb-2
0
Mar-
20
Apr-
20
May-2
0
Jun-2
0
Jul-20
Aug-2
0
Sep-2
0
Oct-20
Nov-2
0

Note: Correlation coefficient of one-day price returns for each pair of cryptocurrencies over the most recent 12 months as of November 2020.
Source: Bloomberg and Bernstein analysis
SAA and the need for liquidity
But we can ask a broader question than the narrow one of an "optimal" allocation. Such an
approach is never going to really be a sufficient answer as optimizers miss the big picture.
In early 2020, we outlined our preferred approach to asset allocation.30 Rather than
thinking of this in terms of traditional asset classes, we think a more fundamental division
is between beta, idiosyncratic alpha, and income. Alongside that is the need for an
allocation to gold and cash for purposes of liquidity (see Exhibit 165). Given the potentially
greater risk for fiat currencies, as discussed next, we think cryptocurrencies could
potentially fit in this latter category. With greater allocations to illiquid assets and the
potential that liquidity has become significantly more fragile in major markets,31 this
becomes more urgent.
30 A New Paradigm for Investing 31 Global Quantitative Strategy: Liquidity poses a strategic challenge to investors
Bitcoin Bitcoin Cash Dash EOS Ethereum
Ethereum
Classic Litecoin Monero XRP Zcash
Bitcoin 1.00 0.81 0.59 0.80 0.82 0.71 0.85 0.80 0.52 0.67
Bitcoin Cash 1.00 0.64 0.88 0.81 0.79 0.84 0.78 0.69 0.73
Dash 1.00 0.62 0.58 0.59 0.60 0.63 0.52 0.78
EOS 1.00 0.81 0.75 0.86 0.76 0.69 0.67
Ethereum 1.00 0.67 0.83 0.77 0.71 0.74
Ethereum Classic 1.00 0.75 0.66 0.52 0.64
Litecoin 1.00 0.76 0.60 0.70
Monero 1.00 0.59 0.70
XRP 1.00 0.64
Zcash 1.00

Source: Bernstein analysis
Crypto as an inflation hedge
This brings us to its role as an inflation hedge. This phrase is used somewhat too loosely.
Technically, a hedge is something that should move in a way to exactly offset another
position. There is no good reason to suspect that a given cryptocurrency should exactly
move in a way that would counteract inflation in a given fiat currency. Indeed, apart from a
fall in the value of bitcoin in March 2020 alongside a fall in inflation expectations, for the
last five years the correlation between bitcoin and inflation expectations has been close to
zero. So the issue is really a more general one of "can cryptos be expected to do well if
inflation rises?". This is important as we would claim that equities, real assets, and gold are
inflation "hedges." Related to this is the question of whether it can act as a diversifier as
inflation rises.
We have made the case in recent research that the policy response to the pandemic is, on
balance, likely to be inflationary. But we also acknowledge that there are strong
deflationary background forces and also the likelihood that unemployment remains very
high for an extended period. We laid out the case for and against an inflationary outlook in
the "Inflation, Investing, and the Coming of MMT" chapter. We think, on balance, there is an
economic argument that the outcome will be inflationary, though it is really politics that tips
the balance in favor of inflation rather than macroeconomics. The likelihood that the
velocity of money may decline means that monetary expansion might need to be even
Beta
Gold, cash
Income
Idiosyncratic alpha
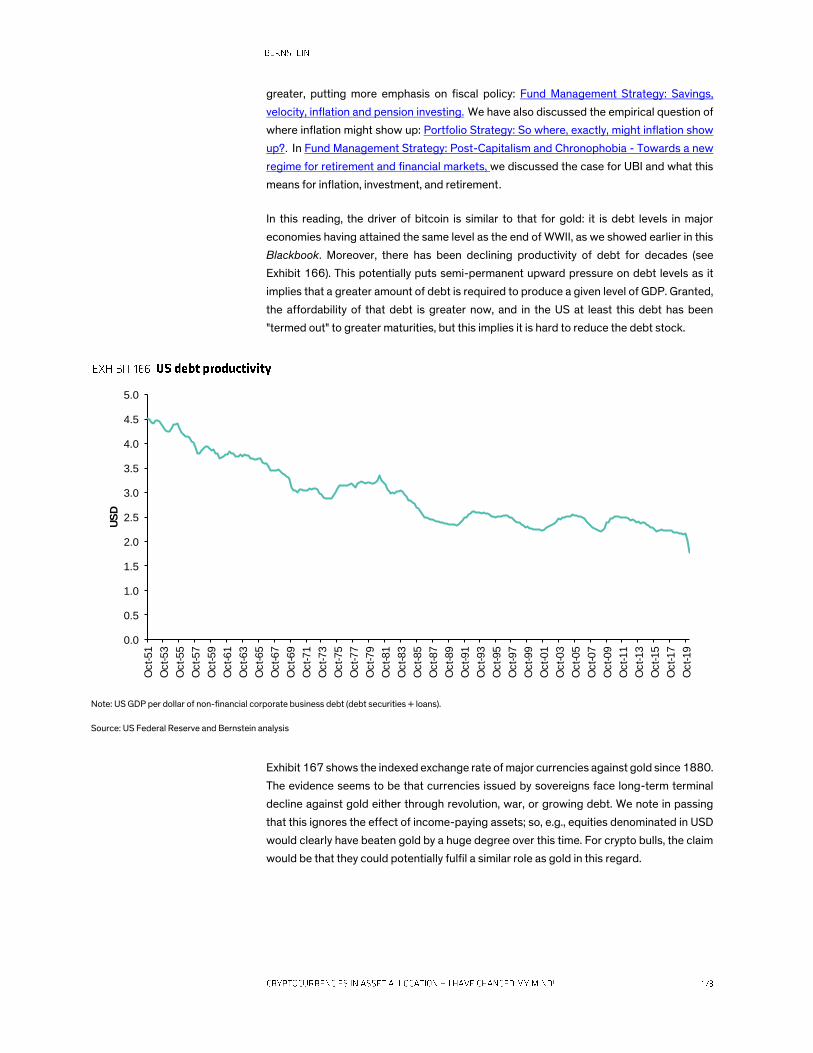
greater, putting more emphasis on fiscal policy: Fund Management Strategy: Savings,
velocity, inflation and pension investing. We have also discussed the empirical question of
where inflation might show up: Portfolio Strategy: So where, exactly, might inflation show
up?. In Fund Management Strategy: Post-Capitalism and Chronophobia - Towards a new
regime for retirement and financial markets, we discussed the case for UBI and what this
means for inflation, investment, and retirement.
In this reading, the driver of bitcoin is similar to that for gold: it is debt levels in major
economies having attained the same level as the end of WWII, as we showed earlier in this
Blackbook. Moreover, there has been declining productivity of debt for decades (see
Exhibit 166). This potentially puts semi-permanent upward pressure on debt levels as it
implies that a greater amount of debt is required to produce a given level of GDP. Granted,
the affordability of that debt is greater now, and in the US at least this debt has been
"termed out" to greater maturities, but this implies it is hard to reduce the debt stock.
Note: US GDP per dollar of non-financial corporate business debt (debt securities + loans).
Source: US Federal Reserve and Bernstein analysis
Exhibit 167 shows the indexed exchange rate of major currencies against gold since 1880.
The evidence seems to be that currencies issued by sovereigns face long-term terminal
decline against gold either through revolution, war, or growing debt. We note in passing
that this ignores the effect of income-paying assets; so, e.g., equities denominated in USD
would clearly have beaten gold by a huge degree over this time. For crypto bulls, the claim
would be that they could potentially fulfil a similar role as gold in this regard.
0.0
0.5
1.0
1.5
2.0
2.5
3.0
3.5
4.0
4.5
5.0
Oct-51
Oct-53
Oct-55
Oct-57
Oct-59
Oct-61
Oct-63
Oct-65
Oct-67
Oct-69
Oct-71
Oct-73
Oct-75
Oct-77
Oct-79
Oct-81
Oct-83
Oct-85
Oct-87
Oct-89
Oct-91
Oct-93
Oct-95
Oct-97
Oct-99
Oct-01
Oct-03
Oct-05
Oct-07
Oct-09
Oct-11
Oct-13
Oct-15
Oct-17
Oct-19
US
D

Source: GFD and Bernstein analysis
Central bank digital currencies; could cryptos be banned?
Central banks have increasingly discussed the possibility of launching their own digital
currencies,32 so-called central bank digital currencies (CBDC). There are a range of
possible advantages here in terms of payment technologies that are not in the scope of this
chapter. One major motivation, however, would be that it would allow the possibility, in
theory, of imposing negative interest rates. This is hard to do with conventional currency,
as at some level of negative interest rates, it would lead people to withdraw their money
from banks and store it at home. That is not desirable for a number of social reasons
(increased crime being one), but it also imposes an effective lower bound on rates that
banks can charge retail customers. If central banks are increasingly exploring such options,
what effect would that have on cryptocurrencies?
It is not just the potential desire to explore deeply negative rates that could be an issue here.
As tax burdens likely rise, including wealth taxes, that may create more demand for cryptos.
There have already been examples where changes in government policy have created a
demand for cryptocurrencies. One extreme example is in Cyprus, which in 2013 had to
impose a drastic levy on bank deposits.
We think the launch of CBDCs could encourage and legitimatize the use of digital
currencies in general. However, it also points to a problem with cryptos. A property that
makes them potentially attractive for asset allocation — i.e., their resistance to being
debased in an attempt to reflate the economy — is actually a possible impediment for them.
Were cryptos to be very widely used, they could seriously hamper an ability for policy to
counteract a recession. In a sense, that is part of the point of them, they are not subject to
32 See, e.g., https://www.bloomberg.com/news/audio/2020-10-21/beno-t-c-ur-on-central-bank-digital-currencies-
podcast.
0
20
40
60
80
100
120
140
31/0
1/1
880
31/0
3/1
883
31/0
5/1
886
31/0
7/1
889
30/0
9/1
892
30/1
1/1
895
31/0
1/1
899
31/0
3/1
902
31/0
5/1
905
31/0
7/1
908
30/0
9/1
911
30/1
1/1
914
31/0
1/1
918
31/0
3/1
921
31/0
5/1
924
31/0
7/1
927
30/0
9/1
930
30/1
1/1
933
31/0
1/1
937
31/0
3/1
940
31/0
5/1
943
31/0
7/1
946
30/0
9/1
949
30/1
1/1
952
31/0
1/1
956
31/0
3/1
959
31/0
5/1
962
31/0
7/1
965
30/0
9/1
968
30/1
1/1
971
31/0
1/1
975
31/0
3/1
978
31/0
5/1
981
31/0
7/1
984
30/0
9/1
987
30/1
1/1
990
31/0
1/1
994
31/0
3/1
997
31/0
5/2
000
31/0
7/2
003
30/0
9/2
006
30/1
1/2
009
31/0
1/2
013
31/0
3/2
016
31/0
5/2
019
Index
GBP/Gold JPY/Gold RUB/Gold USD/Gold

a sovereign power. This is what may excite libertarians, but it also raises social questions
about whether that is the best result for all. What would Jeremy Bentham think? In cryptos'
defense, they are at least the most egalitarian of all assets in that they are genuinely open
to all to buy, whether or not they have a bank account.
It is the core advantage of cryptos that they are outside the bounds of sovereign power
when it comes to debasement, taxation, and nationalization; that also raises the question of
what happens if they get in the way of governments implementing policy? Could cryptos be
outlawed by governments as gold was in the 1930s? Discussion of this usually revolves
around their role in illegal activities. Leaving that to one side, if cryptos caught on so much
that they hampered a policy attempt to reflate an economy (e.g., through the use of negative
rates), then one can imagine a case being made for them to be banned. It is often claimed
they would be hard to outlaw, given they are so decentralized, but we don’t think that people
should underestimate the power of governments to rule out activities they don’t like.
Yes, cryptos might have an advantage in taking out costs, i.e., at least some of the cost that
the banking sector charges the rest of the economy. That can help drive their adoption.
Though, in turn, this raises the question of whether disintermediation of banks would
imperil the credit creation process. As with the debate about the money supply, there are
pros and cons. This would remove costs and could potentially mitigate credit bubbles, but
credit creation by private banks is central to how capitalism works. The bottom line is that
cryptos get in the way of reflationary policies that could be damaging for the real economy.
Of course, cryptos have to be huge for this to have an effect; at the moment they are tiny in
this regard, so this prospect is a long way off.
Bitcoin's big ESG problem
From an ESG perspective, bitcoin's energy consumption presents a big challenge. Can this
be offset by other considerations of social utility? According to the Cambridge Centre for
Alternative Finance, bitcoin's annual electricity consumption is greater than that of
Finland.33 On top of that, there is also the issue of CO2 intensity. The Cambridge data also
shows that more than 78% of bitcoin processing power currently comes from only three
countries — China, Russia, and Kazakhstan — that have a high CO2 emission intensity. As a
result, a recent study by Joule scientific journal examining the carbon footprint of the bitcoin
network estimated that its annual carbon emissions range from 22 megatons to 22.9
megatons of CO2 annually, which is comparable to the emission levels of Jordan and Sri
Lanka.34 Thus, while the bitcoin network currently processes only a tiny fraction of financial
transactions p.a., it has an energy footprint that is multiple times higher than that of banks
and other financial intermediaries. And the energy demands will grow larger in future, as
the bitcoin network expands and the number of processed transactions grows larger.
However, we would note that this could be mitigated, if in future, a larger proportion of
energy required to maintain the network could be generated from renewable energy
sources.
From a social perspective, bitcoin and other cryptocurrencies have been associated with a
number of illegal activities, such as drug purchases, money laundering, and tax evasion. As
33 https://cbeci.org/cbeci/comparisons 34 https://doi.org/10.1016/j.joule.2019.05.012

our sector analysts noted, many countries currently do not have a structured framework for
dealing with cryptocurrencies. Nevertheless, over the past few years, regulatory scrutiny of
these assets has intensified significantly.35
Offsetting this there are positive social considerations. For significant parts of the world's
population who do not have access to bank accounts, there can be very tangible benefits
from greater acceptance of cryptocurrencies. This could be a meaningful social
improvement for populations of poorer countries. Vigna and Casey (2015)36 open their
book with a discussion of how this can help women in countries where they are not allowed
access to the banking system.
What is money?
All this inevitably leads to an almost philosophical question of what, actually, is money
anyway? Montaigne warned us only to philosophize by accident, so this comes at the end
of the chapter and as the result of the discussion of cryptocurrencies as an investment
rather than as a precursor to it.
Once we move beyond the narrow empirical question of the volatility and diversification of
a currency such as bitcoin and what it does in a portfolio from an overall return-risk point of
view, then the topic quickly touches on a broad set of fundamental issues. Many of these
come down to the role of the sovereign state. After Covid-19, debt levels will be higher,
more people will be unemployed and demanding action to address that, and inequality will
be greater, which will create social pressures. Governments have become comfortable with
allowing large increases in the money supply and at the same time they find themselves in
possession of new fiscal tools in their ability to hand out cash to individuals in a way that
was not deemed acceptable before the pandemic. All this is to say that governments are
likely to play a bigger role in economies and markets post Covid-19. No wonder there is a
more intense debate about the concept of MMT. In fact, one could argue that in a sense that
has already become the adopted paradigm, albeit without the institutional trappings of
automatic fiscal stabilizers. But we do think UBI is likely in at least one developed economy
in the next five to 10 years.37
These issues provoke linked questions about the role of money and the nature of long-term
investment saving. Are cryptocurrencies a form of money in the sense of being a medium
of exchange or are they a store of value and, hence, an asset to be used in investment? Well,
they can be both, just as cash denominated in a certain currency can be. We don't think
people need to obsess too much about this question. Both the role of money and the nature
of investing are undergoing changes.
The world had a relatively small number of currencies for hundreds of years, and now the
number of potential currencies has exploded. Indeed, conceptual artists Claudia Sambo
and Holly English, in a recent work suggested that potatoes could be used as money —
https://youtu.be/9HS763kRYIQ. After all, the objection that the supply of potatoes could
35 For more details see: Weekend Tech Byte: Cryptocurrencies and Blockchain: 10+yrs post Bitcoin's invention - where do
we stand? 36 Vigna and Casey (2015): The Age of Cryptocurrency 37 Fund Management Strategy: Post-Capitalism and Chronophobia - Towards a new regime for retirement and financial
markets

increase massively no longer seems to carry much weight as a counter argument to
vegetable money in the wake of the Fed creating US$3Tn in 2020. They also propose that
the value be tied to their nutritional value, a nice swipe at the argument in economics at
what gives value to tokens used as money.
In Book V of Nicomachean Ethics, Aristotle teaches us "Hence all commodities exchanged
must be able to be compared in some way. It is to meet this requirement that men have
introduced money. [It is a measure of] how many shoes are equivalent to a house or a given
quantity of food… Money then serves as a measure which makes things commensurable".38
This is the so-called metalist view of what gives money its value; it essentially is a
commodity that is deemed to have inherent value that can replace a barter system.
The other approach to the question of "what is money" derives more from a view of social
interaction; the claim that money really derives from credit and the need to account for it.
This view was eloquently laid out in Graeber's magisterial history of debt39 with the central
claim that debt has a long history in human society and the idea of economic exchange
starting with bartering is in fact a myth. On this basis, the ultimate basis for the value of a
unit of money in today's society is the demand that is manufactured for it by a government
demanding that its taxes be paid in it.
The debate between these two views and how it applies to cryptos was laid out very well in
Vigna and Casey (2015). They make the case that both schools of thought can be applied
to cryptocurrencies. The metalist view is predicated on the limited supply of cryptos (on
which more later in this chapter). The latter or chartalist view is that bitcoin is a payment
system with a new basis for what gives users trust in the system. On this view, it is simply a
method for recording and settling debt obligations; what makes it interesting is that there
is a new distributed basis of trust not deriving from a central authority.
A concern we have always had is that there is a potential supply problem for cryptos. Yes,
bitcoin famously has a limited supply, but the number of cryptos has no limit. New ones can
be created with ease, so the overall supply of cryptos can grow. However, perhaps this is
not so different than the situation with established fiat currencies. There are a large number
of them, none of which have limited supply, yet in practice only a relatively small number of
them are used for investment purposes. New cryptos can always be created, but if there is
no plausible case for their broad adoption, their extra supply is meaningless. So which ones
count as being broadly accepted? Bitcoin is clearly at the core of this, and then there are a
small group of other ones with reasonably broad acceptance that form an intermediate
group, and outside that group coins don't have a role in investment. This intermediate group
will likely evolve over time and there won't be full agreement as to which coins qualify. We
show the "market cap" of the largest cryptos in Exhibit 168. But then that is the case for fiat
currencies too. So, is the supply of cryptos limited? Well, technically no it is not. But for all
practical purposes, at a given time there may indeed be some limits.
38 Aristotle: Nicomachean Ethics Book V 39 Graeber (2011) Debt: The first 5000 Years

Source: Coinbase and Bernstein analysis
So much for supply. What about demand? A post-pandemic wave of inflation could
potentially create significant demand for alternative currencies for all the reasons we have
discussed here. But while there might be increased demand for cryptos in general, that is
no good if one holds the wrong crypto. As we showed earlier in this chapter, not all
cryptocurrencies move together, and indeed their mutual correlation has fallen recently.
The increased demand is only useful if it is for the specific cryptocurrency that one holds.
Here there is a fundamental linkage between other currencies and sovereignty. Either
money is said to be worth something because the token being used has its own inherent
worth, or else demand for money in question has to be created. One popular way to think
of that is governments and their sovereign ability to impose taxes and determine how these
should be paid. Thus, governments can always create a demand for their currency by saying
that taxes have to be paid in it. Such support is generally speaking absent for bitcoin, pace
Zug that has announced that citizens will be able to pay taxes there in bitcoin from 2021. In
future, one could imagine tax havens or quasi-failed states without well-established
currencies as possibly allowing payment in bitcoin or another cryptocurrency, but it is hard
to imagine a major developed nation allowing that; it would undercut sovereignty too much.
Thus, there is not likely to be a guaranteed backstop of demand.
The future of cryptos is bound up with the nature of sovereignty, how this interacts with
personal liberty, and the major policy decisions that sovereign governments make to steer
their economy. To the extent to which the pandemic has accelerated shifts that were
underway already and also brought about changes in these domains, then it has also
changed the potential role of cryptocurrencies.
In the wake of the pandemic, governments will likely become more powerful (relative to
corporations and individuals). Governments probably feel they have earned this right, given
the extent to which their intervention was necessary to offset the economic impact of
0
100000
200000
300000
400000
500000
600000
700000
Millio
n, U
SD

lockdown (though, of course, those lockdowns were imposed by governments too). We
need to get used to a greater role of governments in the economy, e.g., through the decision
to extend, or not, direct fiscal measures such as furlough schemes, decisions about
whether or not a genuine bankruptcy cycle will be allowed, the likelihood that the tax
burden increases, and also on the path of inflation. On the latter, governments have the
desire to generate it to deal with the debt burden and now also possess new fiscal tools
with which to address that. All these sound like issues true believers in cryptos would point
to as a reason to hold them, but one does not need to be an arch libertarian to make the
case that policy shifts in these directions make a case for holding cryptocurrencies, as long
as one is comfortable with the idea that the supply is limited only "for practical purposes."
Two products of the seventeenth century seem relevant here. The Treaty of Westphalia is
traditionally taken as the starting point for the acceptance that sovereign states are the
basic units for international law. Later, that century also saw the foundation of the Bank of
England as part of an attempt to finance the Royal Navy, but by so doing generated the idea
of a central bank with monopoly on issuing money that would then be acceptable for the
payment of taxes. If cryptocurrencies became much larger than they are today, they
implicitly threaten both these seventeenth century creations. The attractions of cryptos are
what also make them potentially an annoyance for policymakers. Cryptos do have a place
in asset allocation…for as long as they are legal!


◼ Record credit issuance and a collapse in revenues in 2020 creates the risk of the
emergence of many "zombie" companies in 2021. However, the picture is more subtle
and depends on the interaction of policy choices, the evolution of the inflation outlook,
and the desperation of investors for positive real yields. Gogol's Dead Souls tells us
how an attempt to trade in the rights to dead serfs stirs up all kinds of social problems.
It seems to serve as an appropriate hook for the current state of affairs.
◼ The quality of corporate debt declined dramatically prior to the pandemic, as investor
desperation for yield met a corporate culture that has rewarded issuing debt to fund
buybacks. This "should" have led to a significant bankruptcy cycle at the first sign of a
recession. Instead, that has been put on hold by policymakers for eminently sensible
social reasons.
◼ A key policy decision is to what extent will authorities want to let corporate
bankruptcies "clear"? The Fed and the ECB have taken the decision to prioritize the
ability to raise capital over price discovery, but in 2021 this will be less important. A
rise in bankruptcies and defaults seems a text-book route to directing capital to
businesses that are still viable after the pandemic, but at the cost of yet more
unemployment. Which goal will prevail?
◼ It seems likely that US authorities will be more tolerant of bankruptcies, partly for
"cultural" reasons but also, while the unemployment rate will remain very high in the
US, at least we know what it is, and it is likely to decline somewhat as conditions
improve.
◼ In Europe, there may be more nervousness about such an eventuality. The true
unemployment rate in Europe is unknown, given furlough schemes. Also, SMEs form a
larger part of the European economy and they will be particularly vulnerable. Thus, we
may not see as much "clearing" of bankruptcies, with more corporate zombies as a
result.
◼ A clearing of bankruptcies plus a resurgence in inflation over 2021 implies divergent
paths for companies, especially in the US. We can see the case in the US for there
being three kinds of indebted companies: (1) Those that have taken advantage of
current conditions to issue long-maturity fixed-term debt. Assuming their business
model survives intact, rising inflation can shrink the real value of their debt in coming
years. (2) Companies that go bankrupt as their revenues don't come back and they find
it hard to refinance. And (3) given real rates will be anchored low and debt maturity is
long, there will still be a cohort of corporate zombies.

◼ We do not think that aggregate credit spreads will significantly widen in the near term,
given the Fed's ability to support. But as a divergence of corporate outcomes becomes
clearer, there should be more defaults and, hence, some case to buy equities of better
balance sheet quality companies. Longer term, the winners are those that can benefit
from inflation shrinking the real value of their long-term debt.
In Gogol's Dead Souls, Chichikov goes around collecting the rights to dead serfs. They serve
no possible use, but through bureaucratic loopholes and inertia they allow the "hero" to
acquire on paper an apparently valuable asset. Though in the process, we discover the
depressing level of greed exhibited even in the carving up of worthless assets and that he
is ostracized from society, as the act of amassing rights to dead souls is deemed too
disturbing to be countenanced by polite society.
'No, what I'm referring to is not exactly peasants,' said Chichikov. 'I wish to have the dead
ones…'. There and then Manilov dropped his chibouk on the floor, opened his mouth and so
remained, mouth agape, for several minutes.40
2020 has seen record debt issuance by corporates. When combined with the wiping out of
profits for so much of the corporate sector, this implies 2021 will see investors facing up
to a raft of companies becoming debt "zombies." That case is easy enough to outline, but
we think the narrative is subtler than that. Discerning what it means for investors brings
together a view on what policy makers want to achieve plus how desperate investors are
for assets that bear a positive real yield and in addition the ability of inflation to sustainably
emerge. So, positioning portfolios for this depends on the confluence of policy objectives,
macro outcomes, and changing investor needs.
We think there will inevitably be a very significant number of companies that will not survive
the pandemic. However, many of them will have managed to find support through the ability
to access credit along with a combination of furlough schemes, business support schemes,
deferring of real estate charges, and other measures that have been possible, given the
exceptional circumstances of 2020. Figuring out which companies are actually going
concerns and which are not is going to be a major topic for 2021.
Policymakers have prioritized the capital-raising function of markets over their price-
discovery function for eminently sensible social reasons. Nowhere has this been more
apparent than in credit markets. But how long can this be expected to continue? There is a
strong case to be made that authorities should want price discovery to return, or more
bluntly that they will want the bankruptcies to clear through the system so that investors
can work out which companies have a future and which do not. However, this will not be
politically easy, as it implies in the near term that there will be a new cohort of people made
unemployed even as a recovery takes hold. A second consequence could well be a further
market share gain by larger companies that can continue to access credit vs. smaller
companies (especially SMEs) which fail. Both of these are going to be highly politically
40 Nikolay Gogol: Dead Souls

contentious issues that are at odds with the zeitgeist in US and European political
discussion.
Exhibit 169 gives an indication of which regions' corporate debt stresses may be most
acute. It shows the percentage of current total corporate non-financial debt falling due
within each broad region over various future time horizons. Emerging market companies
will need to redeem or refinance a larger portion of current outstanding debt in the near
term than any other region, as 46% of current debt is due to mature within the next three
years and 40% maturing four to 10 years in the future, shown by the left-hand bars on the
chart. In contrast, North American companies have the smallest portion of debt falling due
in the next three years at 20% and also the highest portion of debt with the longest maturity
with 21% due later than 20 years in the future. Asia and Europe fall somewhere in between,
but Asia is more exposed to near-term debt maturity (34% of total debt) and Europe has a
higher portion of debt maturing over the medium term, with over 60% falling due four to 10
years in the future.
Exhibit 170 shows that US companies have continued to increase the maturity of their
stock of debt. Of all the debt issued by US corporates in 2020, 98% is of duration greater
than three years and 49% has a maturity date of greater than 10 years.
Note: Percentage of outstanding debt maturing over various maturity windows. The universe is the constituents of the MSCI All Country World Index excluding
Financials.
Source: Bloomberg and Bernstein analysis
0
10
20
30
40
50
60
70
<=3yr 4-10 year 11-20 year >20 year
%
Asia Europe North America Emerging Mkts

Note: Value of corporate bonds issued by US corporates in 2020. Taken from the LEAG page on Bloomberg. Universe excludes issuance by Financials stocks.
Source: Bloomberg and Bernstein analysis
Even before the pandemic it was apparent that the quality of debt had materially declined.
The proportion of investment-grade debt that was rated BBB, i.e., at the lowest possible
tier of investment grade, first passed the 50% point a year before the pandemic (see
Exhibit 171). There were two dynamics at work here: on the one hand, an increasing
desperation by investors in search of yield and on the other a stock market dynamic (and
management payout culture) that encouraged issuance of low-quality debt in order to buy
back stock over the last decade. This suggests that, other things being equal, a recession
should cause a larger-than-normal increase in credit spreads. As it turns out, central bank
buying of credit has proved a much more powerful force, but the question of debt quality
remains in the background.
Source: FactSet and Bernstein analysis
> 1 year 1698 100
> 3 year 1656 98
> 5 year 1520 90
> 7 year 1135 67
> 10 year 837 49
Value
(USD bn) % of total
0
10
20
30
40
50
60
70
80
Jun-0
0
Dec-
00
Jun-0
1
Dec-
01
Jun-0
2
Dec-
02
Jun-0
3
Dec-
03
Jun-0
4
Dec-
04
Jun-0
5
Dec-
05
Jun-0
6
Dec-
06
Jun-0
7
Dec-
07
Jun-0
8
Dec-
08
Jun-0
9
Dec-
09
Jun-1
0
Dec-
10
Jun-1
1
Dec-
11
Jun-1
2
Dec-
12
Jun-1
3
Dec-
13
Jun-1
4
Dec-
14
Jun-1
5
Dec-
15
Jun-1
6
Dec-
16
Jun-1
7
Dec-
17
Jun-1
8
Dec-
18
Jun-1
9
Dec-
19
Jun-2
0
%
ICE BofAML US Corporate (3-5 Y) (AAA-A) - Market Value
ICE BofAML US Corporate (3-5 Y) (BBB) - Market Value

This decline in quality was evident elsewhere as well. Recent years have seen a sharp
deterioration in creditor protection. Moody's Loan Covenant Quality Indicator, which tracks
the covenant protections provided to investors in the syndicated leveraged loan market, hit
an all-time low in 2020. Such weak creditor protections could ultimately have a big impact
on how much debt can be recovered in an event of default (see Exhibit 172).
Note: Shows a two-quarter rolling average of loan covenant quality scores, measure of covenant protections provided to investors in the syndicated leveraged
loan market calculated by Moody’s.
A higher score denotes weaker covenant quality.
Source: Moody's Investors Service and Bernstein analysis
On the demand side, credit has been the key tactical trade in 2020. Exhibit 173 shows
flows into bond, equity, and money market funds since the beginning of 2020. The
persistent buying of bond funds that we have seen until mid-April 2020 has resulted in a
US$490Bn total inflow into the fund asset class. The biggest beneficiaries have been
dedicated corporate bond funds, which have accounted for US$177Bn, and dedicated
High Yield, which represents US$70Bn of that total. These are likely an underestimate of
the actual totals, as they only capture flows into those funds designated as dedicated
corporate or High Yield. There is also a large category classed as mixed funds, which will
also hold corporate bond assets.
Equity flows had been flat over the same period, shown by the flat equity flow line in
Exhibit 173, but saw strong buying from the beginning of November 2020 into the year
end.
3.30
3.18 3.18
3.60 3.56 3.573.54 3.52
3.67
3.78 3.77
3.613.65
3.78 3.79
3.36
3.55
3.87
4.06 4.044.08 4.10
4.004.06
4.104.16
4.00
3.84 3.83
3.95
4.21
4.294.22
1.5
2.0
2.5
3.0
3.5
4.0
4.5
Q2 2
012
Q3 2
012
Q4 2
012
Q1 2
013
Q2 2
013
Q3 2
013
Q4 2
013
Q1 2
014
Q2 2
014
Q3 2
014
Q4 2
014
Q1 2
015
Q2 2
015
Q3 2
015
Q4 2
015
Q1 2
016
Q2 2
016
Q3 2
016
Q4 2
016
Q1 2
017
Q2 2
017
Q3 2
017
Q4 2
017
Q1 2
018
Q2 2
018
Q3 2
018
Q4 2
018
Q1 2
019
Q2 2
019
Q3 2
019
Q4 2
019
Q1 2
020
Q2 2
020
We
ak
er
S
trto
ng
er
LCQI Scores

Source: EPFR global and Bernstein analysis
What do policymakers want?
An increase in corporate debt, a decline in its quality, and a collapse in revenues in 2020
imply that on paper there are a large number of zombie companies, those that could not
survive an increase in the cost of debt. However, simply using 2020 earnings might not be
a true reflection. Some of these companies are, after all, going to have earnings growth
once normality returns. However, others will find that their business models have
evaporated and they are unable to meaningfully come back. There are three groups of
companies in this regard: (1) Those that genuinely are going concerns and perhaps have
issued long-maturity fixed-rate debt. They will be able to cover interest payments when the
economy reopens and a burst of inflation would actually help in reducing the real value of
the debt in coming years. (2) A group of companies simply won't reopen again and go
bankrupt in 2021 — especially for SMEs. And, (3) a group of true "zombies," where the
business model is basically broken, but which will survive as long as they don't have to
refinance, as they have locked in low borrowing costs at least for a few years.
The US probably has less tolerance for allowing zombies to form, as there is an established
culture of being willing to see bankruptcies. Crucially, we also know what the
unemployment rate actually is in the US. We think the unemployment rate will remain very
elevated, as the pandemic will have brought forward job losses that would have occurred
over the next five to 10 years due to automation. Meanwhile, ongoing business failures will
keep the overall unemployment rate at high levels, compared to the last decade. However,
the unemployment rate will probably still fall from today's level. In Europe, by contrast, there
is probably more aversion to bankruptcies; SMEs are a larger share of the economy and will
be hit hard; we don't even know what the unemployment rate is in Europe because of
furlough schemes. While ending furlough schemes is proving to be politically difficult, they
will be scaled back at least in H1 2021 and unemployment will rise as that happens. Thus,
in Europe there is likely to be more sensitivity to business failures.
-200
-100
0
100
200
300
400
Jan-20 Feb-20 Mar-20 Apr-20 May-20 Jun-20 Jul-20 Aug-20 Sep-20 Oct-20 Nov-20 Dec-20
US
D b
n
All Bond Funds Equity Funds Corporate Bond Funds High Yield Funds

If this read on policy preferences is correct, then it is possible that in the US we see a
stepping back from emergency support for credit markets in 2021. There is still
considerable capacity left in the Fed's announced schemes, as only a part of the announced
credit support facilities have been tapped. The Primary Market Corporate Credit Facility
(PMCCF), announced in March 2020 to ensure credit to large employers, has not had to be
used. The Secondary Market Corporate Credit Facility (SMCCF) has been buying credit in
the secondary market since May 2020, but as spreads have declined the pace of buying
has dropped from US$300Mn per day, to about US$20Mn per day by September 2020.
The Fed has indicated that if further improvement in market functioning occurs, SMCCF
purchases could slow further and potentially cease entirely. Though if liquidity deteriorated,
then it could be increased.41
What might be the consequences of a move to step away from credit support and allow
bankruptcies to clear? That is an event that could lead to a divergence of outcomes
between corporates. One possible analogy could be the taper tantrum of 2013, but with
the caveat that there is still support available should overall market liquidity deteriorate. We
just think it likely that policymakers will deem it desirable for the economy overall to see
bankruptcies rise to make sure that capital is being directed at viable businesses.
We have seen occasions in the past when central banks have indicated that extraordinary
monetary support measures may start to be scaled back. The most notable case of this was
following the comment made by Ben Bernanke, the then Fed chairman, at his appearance
at the joint economic congressional committee meeting on May 22, 2013, when he said
that the Fed was considering reducing or tapering the scale of bond purchases. Exhibit 174
shows the evolution of fund flows for bond fund asset classes in the weeks before and after
Bernanke's comments. All categories of bond funds saw outflows in the weeks following
the Fed comment. Corporate bond funds and high yield bond funds saw the sharpest initial
sell-off, but inflows started to resume after six weeks or so, and by the end of the year they
had recovered all of those initial outflows. Government bond and dedicated EM bond funds
saw more gradual selling after the taper comment, but outflows continued for the rest of
the year.
41 https://www.newyorkfed.org/newsevents/speeches/2020/sin201020

Note: Cumulative weekly flows for bond fund categories around the taper announcement on May 22, 2013. The vertical line signifies the date of the
announcement. Flows are in USD Bn.
Source: EPFR global and Bernstein analysis
What does this mean for positioning?
A theoretical risk for investors is that as a recovery takes hold in 2021, a combination of
forces could lead to the odd situation of the macro regime improving, but credit spreads
widening. This could come about through a combination of policy makers stepping back
from their support, from greater hard evidence of which businesses are structurally
challenged post Covid-19, and also as a delayed reaction to the decline in quality of debt
before the pandemic. The market is not priced for this — both in terms of credit spreads
and also for the relative performance of good vs. bad balance sheet quality companies in
the equity market. But how likely is this to occur? Credit spreads and CDS levels have
recovered to their pre-pandemic levels and investors seem very sanguine about these risks.
Any increase in bankruptcies and defaults would likely be slow, given the available support
that the Fed still has. But the long-term consequences of not allowing this to occur would
likely be worse. Given this is so policy-dependent, it means that timing this transition will be
very hard indeed. The support that is still available also means that at the aggregate level
credit spreads are unlikely to significantly widen in the near term. Instead, what could be
more likely would be a divergence within the market. This could lead in the near term to
more support for companies with higher balance sheet quality, but the real winners longer
term would be those that had termed out debt at long maturities and fixed rates, which
would benefit if inflation rises in coming years.
-25
-20
-15
-10
-5
0
5
10
15
20
25
Jan-13 Feb-13 Mar-13 Apr-13 May-13 Jun-13 Jul-13 Aug-13 Sep-13 Oct-13 Nov-13 Dec-13
Taper Tantrum EM Corporate High Yield Government

Within the equity market, companies with better balance sheet quality have been doing
poorly over November to December 2020 and have given up all their relative gains for the
year, though the trade has fared better in Europe. Exhibit 175 shows the long-short
performance of US and European companies (excluding Financials) on a combination of
leverage and credit rating. In Europe, high balance sheet quality companies have
outperformed low-quality companies by 24.5% in 2020, compared with an 8%
underperformance for US companies. But in both regions, high balance sheet quality has
been underperforming since the beginning of November 2020.
Note: Daily long-short performance of our sector-neutral balance sheet quality factor. The constituents of the MSCI US and MSCI Europe (excluding Financials)
are ranked on a combination of leverage (debt-to-equity) and credit rating (Moody's credit rating) within sectors. The long portfolio is the high balance sheet
quality quintile (i.e., low leverage and highly rated companies) and the short portfolio is the low balance sheet quality (high leverage and low-rated companies).
Portfolios are rebalanced quarterly.
Source: MSCI, FactSet, Moody's, and Bernstein analysis
Better balance sheet quality companies trade at a slight premium, on PE, in both the US and
Europe (see Exhibit 176 and Exhibit 177). At this stage, it is hard to have a strong directional
tactical view of such companies. We think that risk budgets are better deployed elsewhere.
We think though that there can be a role for better balance sheet quality companies
emerging in 2021 if policymakers find themselves in a position to be able to talk about
removing the extraordinary degree of support for credit markets.
80
90
100
110
120
130
140
Index
Europe US

Note: Median valuation of the sector-neutral high balance sheet quality quintile
relative to the median valuation of the sector-neutral low balance sheet quality
quintile.
Source: MSCI, FactSet, Moody's, and Bernstein analysis
Note: Median valuation of the sector-neutral high balance sheet quality quintile
relative to the median valuation of the sector-neutral low balance sheet quality
quintile.
Source: MSCI, FactSet, Moody's, and Bernstein analysis
0
0.5
1
1.5
2
2.5
Price to Book 12m Fwd PE
0
0.5
1
1.5
2
2.5
Price to Book 12m Fwd PE


• Separate branding is maintained for “Bernstein” and “Autonomous” research products. Each brand operates as a separate business unit
within the regulated entities referenced herein namely: Sanford C. Bernstein & Co., LLC, Sanford C. Bernstein (Hong Kong) Limited 盛博香港
有限公司 and Bernstein Autonomous LLP. For information relating to “Autonomous” branded products (including certain Sales materials)
please visit: www.autonomous.com. For information relating to Bernstein branded products please visit: www.bernsteinresearch.com.
Recommendations contained within one type of research product may differ from recommendations contained within other types of
research products, whether as a result of differing time horizons, methodologies or otherwise. Furthermore, views or recommendations
within a research product issued under any particular brand may differ from views or recommendations under the same type of research
product issued under another brand. The Research Ratings System for the Autonomous brand and the Bernstein brand and other
information related to those Rating Systems are below.
• On and as of April 1, 2019, AllianceBernstein L.P. acquired Autonomous Research. As a result of the acquisition, the research activities
formerly conducted by Autonomous Research US LP were assumed by Sanford C. Bernstein & Co., LLC, which continues to publish research
under the Autonomous Research US brand and the research activities formerly conducted by Autonomous Research Asia Limited were
assumed by Sanford C. Bernstein (Hong Kong) Limited 盛博香港有限公司, which continues to publish research under the Autonomous
Research Asia brand.
• On and after close of business on December 31, 2020, as part of an internal reorganisation of the corporate group, Sanford C. Bernstein
Limited transferred its business to its affiliate Autonomous Research LLP. Subsequent to this transfer, Autonomous Research LLP changed
its name to Bernstein Autonomous LLP. As a result of the reorganisation, the research activities formerly conducted by Sanford C. Bernstein
Limited were assumed by Bernstein Autonomous LLP, which is authorised and regulated by the Financial Conduct Authority (FRN 500498)
and now publishes research under the Bernstein Research Brand.
• Please note that all price targets, recommendations and historical price charts are unaffected by the transfer of the business from Sanford C.
Bernstein Limited and have been carried forward unchanged to Bernstein Autonomous LLP. You can continue to find this information on the
Bernstein website at www.bernsteinresearch.com.
• References to "Bernstein" or the “Firm” in these disclosures relate to the following entities: Sanford C. Bernstein & Co., LLC, Bernstein
Autonomous LLP, Sanford C. Bernstein Limited (for dates prior to January, 1, 2021), Autonomous Research LLP (for dates between April 1,
2019 and December 31, 2020), Sanford C. Bernstein (Hong Kong) Limited 盛博香港有限公司, Sanford C. Bernstein (Canada) Limited,
Sanford C. Bernstein (India) Private Limited (SEBI registration no. INH000006378) and Sanford C. Bernstein (business registration number
53193989L), a unit of AllianceBernstein (Singapore) Ltd. which is a licensed entity under the Securities and Futures Act and registered with
Company Registration No. 199703364C.
• Analysts are compensated based on aggregate contributions to the research franchise as measured by account penetration, productivity and
proactivity of investment ideas. No analysts are compensated based on performance in, or contributions to, generating investment banking
revenues.
• The Bernstein brand rates stocks based on forecasts of relative performance for the next 6-12 months versus the S&P 500 for stocks listed
on the U.S. and Canadian exchanges, versus the MSCI Pan Europe Index for stocks listed on the European exchanges (except for Russian
companies), versus the MSCI Emerging Markets Index for Russian companies and stocks listed on emerging markets exchanges outside of
the Asia Pacific region, and versus the MSCI Asia Pacific ex-Japan Index for stocks listed on the Asian (ex-Japan) exchanges - unless
otherwise specified. The Bernstein brand has three categories of ratings:
Outperform: Stock will outpace the market index by more than 15 pp in the year ahead.
Market-Perform: Stock will perform in line with the market index to within +/-15 pp in the year ahead.
Underperform: Stock will trail the performance of the market index by more than 15 pp in the year ahead.
Not Rated: The stock Rating, Target Price and/or estimates (if any) have been suspended temporarily.
• For purposes of the Market Abuse Regulation (MAR) and the FINRA Rule 2241, ‘Outperform’ is classified as a Buy, ‘Market-Perform’ is
classified as a Hold, and ‘Underperform’ is classified as a Sell
• As of 01/26/2021, Bernstein branded ratings were distributed as follows: 311 Outperform - 50.7% (0.0% banking clients) ; 234 Market-
Perform - 38.2% (0.0% banking clients); 68 Underperform - 11.1% (0.0% banking clients); 0 Not Rated - 0.0% (0.0% banking clients). The
numbers in parentheses represent the percentage of companies in each category to whom Bernstein provided investment banking services.
All figures are updated quarterly and represent the cumulative ratings over the previous 12 months. These ratings relate solely to the
investment research ratings for companies covered under the Bernstein brand and do not include the investment research ratings for
companies covered under the Autonomous brand. This information is provided in order to comply with Article 6 of the Commission Delegated
Regulation (EU) 2016/958.
• AXA S.A. holds an equity interest in AXA Equitable Holdings, Inc., which is the ultimate parent company of AllianceBernstein L.P., which in
turn wholly-owns Bernstein. In addition, AllianceBernstein L.P. and certain of its affiliates provide investment advisory services and products

to AXA S.A. and AXA Equitable Holdings, Inc. Collectively AXA S.A. and certain of its affiliates and AXA Equitable Holdings, Inc. are
AllianceBernstein L.P.’s largest client.
• FIS. is covered by both the Autonomous brand and the Bernstein brand. For the research ratings and price target history please go to
https://bcprod.autonomous.com/disclosure_portal/portal.html for securities covered by Autonomous brand and
www.bernsteinresearch.com/go/disclosures for securities covered by the Bernstein brand
• Fiserv. is covered by both the Autonomous brand and the Bernstein brand. For the research ratings and price target history please go to
https://bcprod.autonomous.com/disclosure_portal/portal.html for securities covered by Autonomous brand and
www.bernsteinresearch.com/go/disclosures for securities covered by the Bernstein brand
• Global Payments is covered by both the Autonomous brand and the Bernstein brand. For the research ratings and price target history please
go to https://bcprod.autonomous.com/disclosure_portal/portal.html for securities covered by Autonomous brand and
www.bernsteinresearch.com/go/disclosures for securities covered by the Bernstein brand
• Mastercard, Inc. is covered by both the Autonomous brand and the Bernstein brand. For the research ratings and price target history please
go to https://bcprod.autonomous.com/disclosure_portal/portal.html for securities covered by Autonomous brand and
www.bernsteinresearch.com/go/disclosures for securities covered by the Bernstein brand.
• PayPal Holdings, Inc. is covered by both the Autonomous brand and the Bernstein brand. For the research ratings and price target history
please go to https://bcprod.autonomous.com/disclosure_portal/portal.html for securities covered by Autonomous brand and
www.bernsteinresearch.com/go/disclosures for securities covered by the Bernstein brand.
• Square is covered by both the Autonomous brand and the Bernstein brand. For the research ratings and price target history please go to
https://bcprod.autonomous.com/disclosure_portal/portal.html for securities covered by Autonomous brand and
www.bernsteinresearch.com/go/disclosures for securities covered by the Bernstein brand.
• Visa, Inc. is covered by both the Autonomous brand and the Bernstein brand. For the research ratings and price target history please go to
https://bcprod.autonomous.com/disclosure_portal/portal.html for securities covered by Autonomous brand and
www.bernsteinresearch.com/go/disclosures for securities covered by the Bernstein brand.
12-Month Bernstein Rating History as of 01/26/2021
000333.CH: O (IC) 05/28/19; 000651.CH: O (RC) 09/30/20, M (RC) 10/08/19; 000660.KS: O (RC) 05/18/16; 000858.CH: O (RC) 01/06/21, M
(RC) 07/14/20, O (RC) 02/18/20, M (RC) 09/02/19; 002008.CH: O (IC) 04/18/18; 002120.CH: M (RC) 03/06/20, O (IC) 07/30/19;
002129.CH: O (RC) 09/24/20, U (IC) 11/26/19; 002202.CH: O (IC) 11/26/19; 002251.CH: U (IC) 05/28/19; 002352.CH: O (RC) 05/12/20, M
(RC) 06/06/19; 002415.CH: O (IC) 04/20/17; 002594.CH: U (RC) 04/16/19; 002747.CH: O (IC) 10/27/20; 005930.KS: O (IC) 08/10/11;
005935.KS: O (IC) 08/10/11; 006400.KS: O (IC) 06/11/14; 1083.HK: M (RC) 04/01/19; 1088.HK: U (IC) 11/26/19; 1114.HK: M (RC)
10/16/18; 1128.HK: O (RC) 08/22/18; 1169.HK: M (IC) 05/28/19; 1193.HK: M (RC) 03/02/20, U (RC) 11/05/19; 1211.HK: M (RC) 02/17/20,
U (RC) 04/16/19; 1347.HK: M (RC) 04/03/18; 135.HK: O (RC) 04/01/19; 1398.HK: O (IC) 11/12/19; 1605.JP: O (RC) 05/05/20, M (RC)
03/09/20, O (RC) 02/18/14; 168.HK: U (RC) 11/02/16; 175.HK: O (RC) 01/07/20; 1876.HK: O (RC) 02/18/20, M (IC) 09/30/19; 1898.HK: M
(IC) 11/26/19; 1913.HK: O (RC) 03/12/20, M (RC) 09/10/19; 1928.HK: O (RC) 01/18/19; 1958.HK: M (RC) 01/07/20; 2208.HK: O (IC)
11/26/19; 2222.AB: U (IC) 12/12/19; 2238.HK: M (RC) 04/08/20, O (RC) 04/08/19; 2282.HK: M (RC) 01/18/17; 2303.TT: M (RC) 06/11/18;
2319.HK: O (DC) 02/19/16; 2330.TT: O (RC) 01/12/21, M (RC) 01/30/12; 2333.HK: O (RC) 12/04/20, M (RC) 02/22/19; 2408.TT: M (RC)
01/09/19; 2454.TT: O (RC) 06/06/17; 2502.JP: O (RC) 01/10/19; 2503.JP: M (RC) 08/08/19; 2688.HK: O (IC) 09/05/17; 27.HK: O (RC)
01/18/19; 2883.HK: M (RC) 11/30/20, O (RC) 04/29/20, U (RC) 03/09/20, M (RC) 11/07/19; 291.HK: U (IC) 09/07/16; 300124.CH: M (IC)
04/17/19; 300750.CH: O (IC) 06/11/18; 3034.TT: O (RC) 03/14/18; 3690.HK: O (IC) 01/25/21, O (DC) 08/31/20, O (RC) 05/28/19; 3711.TT:
O (IC) 05/19/18; 384.HK: O (RC) 01/15/18; 386.HK: O (RC) 07/06/17; 392.HK: M (RC) 04/01/19; 3968.HK: M (IC) 11/12/19; 5347.TT: M (IC)
11/17/15; 600011.CH: M (IC) 11/26/19; 600028.CH: M (RC) 04/03/17; 600036.CH: M (IC) 11/12/19; 600104.CH: M (RC) 12/04/20, O (RC)
05/19/17; 600115.CH: O (RC) 12/10/20, M (RC) 09/11/19; 600519.CH: O (RC) 01/06/21, U (RC) 07/14/20, M (RC) 05/07/19; 600600.CH: U
(IC) 09/07/16; 600690.CH: M (IC) 05/28/19; 601012.CH: O (RC) 09/24/20, U (IC) 11/26/19; 601088.CH: U (IC) 11/26/19; 601111.CH: O (RC)
12/10/20, M (IC) 05/17/18; 601398.CH: O (IC) 11/12/19; 601808.CH: U (IC) 06/01/15; 601857.CH: U (RC) 07/06/17; 601888.CH: O (IC)
07/09/20; 601898.CH: M (IC) 11/26/19; 601933.CH: O (IC) 05/28/19; 601939.CH: M (IC) 11/12/19; 603708.CH: M (RC) 07/22/20, O (IC)
05/28/19; 6324.JP: M (RC) 06/05/20, O (IC) 04/17/19; 670.HK: O (RC) 12/10/20, M (RC) 09/11/19; 6808.HK: O (RC) 08/23/19; 6861.JP: O
(IC) 06/06/16; 688339.CH: O (IC) 08/24/20; 6954.JP: O (RC) 03/10/20, M (RC) 07/30/19; 700.HK: O (IC) 01/25/21, O (DC) 08/31/20, O (IC)
01/14/19; 753.HK: O (RC) 12/10/20, M (IC) 05/17/18; 8035.JP: O (IC) 09/13/16; 836.HK: M (IC) 11/26/19; 857.HK: O (RC) 05/05/20, M (RC)
03/09/20, O (RC) 05/28/18; 880.HK: M (RC) 09/12/19; 883.HK: O (RC) 01/04/21, M (RC) 11/30/20, O (RC) 05/05/20, M (RC) 03/09/20, O
(RC) 10/07/14; 8TRA.GR: U (IC) 09/08/20; 902.HK: M (IC) 11/26/19; 916.HK: O (IC) 11/26/19; 939.HK: M (IC) 11/12/19; 9618.HK: O (IC)
01/25/21; 981.HK: U (RC) 08/10/17; 9988.HK: M (IC) 01/25/21; AAL: O (RC) 01/31/18; AAL.LN: M (IC) 01/12/21, O (DC) 02/07/20, O (IC)
09/05/12; AAPL: M (RC) 02/02/18; ABBV: O (IC) 11/09/20, M (DC) 07/14/18; ABF.LN: O (IC) 02/11/20, M (DC) 01/30/17; ABI.BB: O (RC)
03/12/18; ABT: O (IC) 06/26/18; ABX.CN: O (IC) 01/12/21; AC.FP: O (RC) 06/18/19; ADBE: O (IC) 08/17/11; ADDYY: M (IC) 09/19/19; ADI: M
(RC) 03/25/19; ADS.GR: M (IC) 09/19/19; ADSEZ.IN: O (RC) 08/28/17; ADSK: U (RC) 05/01/20, M (RC) 01/13/20; AF.FP: M (RC) 08/17/20, O
(RC) 01/30/20, M (RC) 08/06/19; AGCO: O (IC) 09/22/20, O (DC) 07/16/10; AI.FP: O (IC) 09/24/18; AIR.FP: M (RC) 06/26/20, O (RC)
02/29/16; AIRYY: O (RC) 12/10/20, M (IC) 05/17/18; AKZA.NA: O (IC) 09/24/18; ALKEM.IN: M (IC) 07/21/20; ALNY: O (IC) 07/26/17; ALXN: M
(IC) 11/19/20, O (DC) 09/18/15; AMCX: U (RC) 06/21/18; AMD: M (RC) 09/20/16; AMGN: M (RC) 10/09/20, O (IC) 10/11/19; AML.LN: O (IC)
09/08/20, O (DC) 01/13/20; AMP.IM: M (IC) 03/10/20, M (DC) 01/28/20, M (IC) 11/12/19; AMZN: O (RC) 09/22/20, M (IC) 01/09/20; ANTM: O
(IC) 06/15/16; ANTO.LN: O (IC) 01/12/21, O (DC) 02/07/20, O (RC) 05/21/19; APA: O (IC) 05/13/11; APD: O (RC) 04/15/20, M (RC) 07/17/19;
ARBP.IN: M (IC) 07/21/20; ARMK: M (RC) 06/10/20, O (IC) 09/17/18; ASAN: U (IC) 10/08/20; ASC.LN: M (RC) 05/05/20, U (IC) 02/11/20, O
(DC) 01/30/17; ASML: M (RC) 07/29/20, O (RC) 03/12/20, M (IC) 06/19/18; ASML.NA: M (RC) 07/29/20, O (RC) 03/12/20, M (IC) 06/19/18;
ASX: O (IC) 05/19/18; ATUS: O (RC) 10/05/20, M (RC) 05/05/20, O (IC) 10/15/19; ATVI: U (RC) 10/02/19; AUBANK.IN: M (RC) 05/05/20, O (IC)
07/11/17; AVGO: O (IC) 10/04/16; AXSB.IN: M (RC) 05/23/18; BA: U (RC) 01/04/21, M (RC) 06/26/20, O (RC) 06/12/12; BA/.LN: M (RC)

02/25/19; BABA: M (IC) 01/25/21, O (DC) 08/31/20, O (IC) 01/14/19; BAF.IN: O (RC) 01/21/21, M (RC) 10/08/20, U (RC) 03/27/20, O (IC)
10/11/18; BANDHAN.IN: O (IC) 09/19/18; BAS.GR: O (RC) 01/12/21, M (IC) 09/24/18; BAX: O (DC) 04/10/15; BAYN.GR: O (DC) 06/29/18;
BBCA.IJ: M (IC) 05/22/12; BBL: O (IC) 01/12/21, M (DC) 02/07/20, M (RC) 01/22/18; BBL.TB: M (RC) 04/14/20, O (RC) 08/27/19; BBRI.IJ: O
(IC) 09/03/13; BBY: U (IC) 02/06/17; BDO.PM: O (IC) 09/21/15; BEI.GR: O (IC) 10/12/20, U (DC) 01/13/20; BEST: U (RC) 08/20/19;
BHARTI.IN: O (IC) 10/22/20, O (DC) 07/25/20, O (RC) 08/17/17; BHE.IN: O (IC) 06/23/16; BHEL.IN: M (RC) 01/03/17; BHP: O (IC) 01/12/21, M
(DC) 02/07/20, M (RC) 01/22/18; BHP.AU: O (IC) 01/12/21, M (DC) 02/07/20, M (RC) 01/22/18; BHP.LN: O (IC) 01/12/21, M (DC) 02/07/20,
M (RC) 01/22/18; BIDU: O (DC) 08/31/20, O (RC) 11/08/19; BIIB: M (RC) 06/09/20, O (RC) 10/29/19; BILI: O (IC) 01/25/21; BIOS.IN: M (IC)
07/21/20; BJAUT.IN: O (RC) 01/11/21, M (IC) 09/25/19; BKNG: U (IC) 11/30/20; BLDP: O (IC) 08/24/20; BLUE: O (RC) 11/14/18; BMRI.IJ: O
(IC) 05/22/12; BMRN: M (IC) 07/26/17; BMW.GR: O (IC) 09/08/20, M (DC) 02/28/20, M (IC) 03/13/17; BMY: M (IC) 11/09/20, M (DC)
07/14/18; BN.FP: U (IC) 10/12/20, O (DC) 01/13/20; BOO.LN: O (RC) 05/11/20, M (IC) 02/11/20; BOOT.IN: U (IC) 07/21/20; BP: O (RC)
09/10/15; BP/.LN: O (RC) 09/10/15; BPI.PM: O (IC) 10/18/17; BRBY.LN: M (RC) 03/12/20, U (RC) 08/06/19; BSX: O (IC) 06/26/18; BUD: O
(RC) 03/12/18; BYND: U (RC) 10/13/20, M (RC) 01/15/20; CAG: M (RC) 03/18/20, U (RC) 11/14/18; CARLB.DC: O (RC) 04/15/20, M (RC)
09/10/19; CASY: M (IC) 03/10/20; CAT: M (IC) 09/22/20, O (DC) 07/16/10; CCRI.IN: M (RC) 10/03/19; CDR.PW: M (IC) 07/07/20; CEA: O (RC)
12/10/20, M (RC) 09/11/19; CEO: O (RC) 01/04/21, M (RC) 11/30/20, O (RC) 05/05/20, M (RC) 03/09/20, O (RC) 10/07/14; CF: M (RC)
03/02/20, U (RC) 12/09/19; CFR.SW: M (RC) 11/11/20, O (IC) 04/16/19; CGNX: M (RC) 04/30/19; CHRW: M (RC) 12/06/13; CHTR: O (IC)
10/15/19; CI: M (RC) 05/04/20, O (RC) 08/06/19; CIMB.MK: M (RC) 07/20/20, O (RC) 05/03/19; CIPLA.IN: O (IC) 07/21/20; CL: U (IC)
01/19/21, M (DC) 03/30/20, M (IC) 05/07/07; CLDR: M (RC) 06/06/19; CLPBY: O (IC) 05/13/20; CLX: M (IC) 01/19/21, M (DC) 03/30/20, M
(RC) 07/18/11; CMCSA: O (RC) 06/30/20, M (IC) 10/15/19; CMG: O (IC) 09/11/13; CMI: O (IC) 09/22/20, O (DC) 07/16/10; CNA.LN: M (RC)
11/27/17; CNC: O (RC) 11/14/16; CNE.LN: M (RC) 01/29/13; CNI: O (RC) 01/11/21, M (IC) 05/10/11; CNR.CN: O (RC) 01/11/21, M (IC)
07/22/14; COH.AU: O (IC) 03/10/20, O (DC) 01/28/20, O (IC) 11/12/19; COLOB.DC: O (IC) 03/10/20, O (DC) 01/28/20, O (IC) 11/12/19; COP:
O (RC) 06/08/18; COST: U (RC) 09/18/19; CP: M (RC) 03/12/19; CP.CN: M (RC) 03/12/19; CPB: U (RC) 06/11/20, M (RC) 03/18/20, U (RC)
03/20/17; CPG.LN: O (RC) 04/16/20, U (RC) 04/08/19; CPR.IM: O (RC) 06/08/20, M (RC) 09/10/19; CPRI: M (RC) 11/12/18; CQP: M (RC)
10/08/19; CRDA.LN: M (RC) 09/24/18; CRM: M (RC) 05/03/18; CROMPTON.IN: O (IC) 06/23/16; CSX: O (RC) 10/12/20, M (RC) 10/03/12;
CTEC.LN: U (IC) 03/10/20, U (DC) 01/28/20, U (IC) 11/12/19; CTVA: O (RC) 01/23/20; CTXS: O (IC) 08/17/11; CVS: O (IC) 03/12/19; CXO: O
(RC) 11/01/18; CZR: M (DC) 07/21/20, M (IC) 11/14/18; DAI.GR: O (IC) 09/08/20, M (DC) 01/13/20; DAL: O (RC) 02/06/17; DBS.SP: M (RC)
09/17/19; DBX: U (IC) 08/06/19; DE: M (IC) 09/22/20, O (DC) 07/16/10; DELL: M (IC) 02/15/19; DEMANT.DC: U (IC) 03/10/20, U (DC)
01/28/20, U (IC) 11/12/19; DEO: O (RC) 04/15/20, M (RC) 09/10/19; DG: M (RC) 09/10/19; DGE.LN: O (RC) 04/15/20, M (RC) 09/10/19; DIS:
M (RC) 08/20/15; DISCA: U (RC) 06/06/16; DISH: M (RC) 03/06/20, U (IC) 10/15/19; DLTR: O (RC) 12/13/18; DOW: M (RC) 11/13/20, O (IC)
03/26/19; DPW.GR: O (RC) 08/09/20, M (IC) 06/26/17; DPZ: M (IC) 03/23/17; DRI: O (RC) 04/20/18; DRRD.IN: O (IC) 07/21/20; DSM.NA: U
(RC) 01/12/21, M (RC) 03/30/20, U (RC) 11/27/19; DSV.DC: M (RC) 03/26/20, U (IC) 09/10/19; DVA: M (IC) 03/10/20, M (DC) 01/28/20, M
(IC) 11/12/19; DVN: M (RC) 07/05/17; E: U (RC) 01/04/21, O (RC) 04/07/20, M (RC) 03/09/20, O (RC) 06/14/13; EA: O (IC) 01/17/18; EAT: M
(IC) 09/11/13; EDF.FP: O (RC) 12/03/20, M (IC) 05/01/19; EDP.PL: O (RC) 09/04/19; EDPR.PL: O (IC) 05/01/19; EIM.IN: M (RC) 10/28/20, O
(RC) 06/15/20, M (IC) 03/21/19; EKTAB.SS: M (IC) 11/23/20; EL: O (IC) 01/19/21, O (DC) 03/30/20, O (RC) 04/07/14; EL.FP: O (IC) 04/16/19;
ELE.SM: M (IC) 07/23/18; ELIOR.FP: M (RC) 09/23/20, U (RC) 06/10/20, M (IC) 09/17/18; EMBRACB.SS: O (IC) 07/07/20; ENEL.IM: O (IC)
11/15/17; ENGI.FP: O (IC) 10/15/18; ENI.IM: U (RC) 01/04/21, O (RC) 04/07/20, M (RC) 03/09/20, O (RC) 06/14/13; EOAN.GR: O (IC)
05/08/14; EOG: O (RC) 10/13/14; EPD: O (IC) 05/10/16; EQNR: M (RC) 01/04/21, O (RC) 04/07/20, M (RC) 03/09/20, O (RC) 07/02/19;
EQNR.NO: M (RC) 01/04/21, O (RC) 04/07/20, M (RC) 03/09/20, O (RC) 07/02/19; ET: O (RC) 05/10/17; EVK.GR: O (IC) 09/19/16; EW: M (IC)
06/26/18; EXPE: M (IC) 11/30/20; EZJ.LN: O (RC) 03/10/20, M (RC) 04/08/19; FB: O (IC) 01/09/20; FCA.IM: U (IC) 09/08/20, M (DC)
02/28/20, M (IC) 03/13/17; FDX: O (RC) 08/10/20, M (RC) 10/09/19; FIS: O (DC) 09/08/20, O (IC) 08/18/20; FISV: M (DC) 09/08/20, M (IC)
08/18/20; FMC: M (IC) 11/19/20; FME.GR: M (IC) 03/10/20, M (DC) 01/28/20, M (IC) 11/12/19; FMS: M (IC) 03/10/20, M (DC) 01/28/20, M
(IC) 11/12/19; FORTUM.FH: U (IC) 06/15/20; FP.FP: M (RC) 01/04/21, O (RC) 03/25/20, M (RC) 03/09/20, O (RC) 02/09/18; FRE.GR: O (RC)
03/24/20, M (IC) 03/10/20, M (DC) 01/28/20, M (IC) 11/12/19; FSNUY: O (RC) 03/24/20, M (IC) 03/10/20, M (DC) 01/28/20, M (IC)
11/12/19; FTCH: M (RC) 09/08/20, U (RC) 11/13/19; GALP.PL: M (RC) 01/04/21, O (RC) 02/23/17; GD: M (RC) 05/09/17; GENS.SP: M (RC)
06/09/20, O (RC) 09/03/18; GILD: M (RC) 02/06/20, O (IC) 10/11/19; GIS: U (RC) 06/11/20, M (RC) 03/18/20, U (RC) 03/20/17; GIVN.SW: U
(RC) 01/08/18; GLEN.LN: M (IC) 01/12/21, O (DC) 02/07/20, O (RC) 02/13/13; GLPG.NA: M (RC) 10/18/19; GMAB.DC: O (IC) 11/15/17;
GN.DC: M (IC) 03/10/20, M (DC) 01/28/20, M (IC) 11/12/19; GOLD: O (IC) 01/12/21; GOOGL: O (IC) 01/09/20; GPN: O (DC) 09/08/20, O (IC)
08/18/20; GPPV.IN: O (RC) 07/04/18; HAIN: O (RC) 05/19/20, M (RC) 03/01/19; HAVL.IN: M (RC) 10/03/19; HCA: M (IC) 06/15/16; HCLT.IN:
M (IC) 06/26/19; HD: M (IC) 02/06/17; HDFCB.IN: O (RC) 10/08/20, M (RC) 07/14/20, U (RC) 03/19/20, M (RC) 09/08/19; HEIA.NA: O (RC)
10/21/16; HEIO.NA: O (RC) 10/21/16; HEN.GR: U (IC) 10/12/20, M (DC) 01/13/20; HEN3.GR: U (IC) 10/12/20, M (DC) 01/13/20; HES: O (IC)
09/28/18; HII: M (RC) 05/08/15; HLT: O (IC) 09/10/19; HMB.SS: M (RC) 11/18/20, U (IC) 02/11/20, U (DC) 01/30/17; HMCL.IN: M (RC)
01/09/20; HNP: M (IC) 11/26/19; HO.FP: M (IC) 01/07/19; HOLI: O (IC) 09/08/15; HPE: M (RC) 08/21/18; HPQ: M (RC) 09/09/19; HSY: M (RC)
09/12/19; HUM: M (IC) 10/01/20, O (DC) 01/17/13; IAG.LN: O (RC) 11/06/19; IBE.SM: O (RC) 09/10/18; IBM: M (RC) 03/16/11; ICICIBC.IN: O
(RC) 07/14/20, M (RC) 02/04/19; IDEA.IN: U (DC) 07/25/20, U (RC) 10/29/19; IFF: O (IC) 09/19/16; IFX.GR: O (IC) 06/19/19; IG.IM: M (IC)
05/01/19; IHG.LN: M (RC) 06/01/20, O (IC) 05/02/17; IIB.IN: M (RC) 09/08/19; INFO.IN: M (IC) 06/26/19; INFOE.IN: O (RC) 04/15/20, M (IC)
06/26/19; INFY: M (IC) 09/04/20, U (DC) 01/29/14; INTC: U (RC) 07/24/20, M (RC) 03/26/20, U (RC) 06/26/18; IONS: O (RC) 09/09/19; IPGP:
O (IC) 04/18/18; IQ: M (DC) 08/31/20, M (RC) 09/12/19; ISRG: O (IC) 06/26/18; ITV.LN: U (RC) 11/16/20, M (IC) 07/07/20, O (DC) 02/24/16;
ITX.SM: O (RC) 10/19/20, M (IC) 02/11/20, O (DC) 01/30/17; J: O (IC) 09/22/20; JAZZ: O (RC) 03/11/20, M (IC) 10/11/19; JBHT: M (RC)
01/06/20; JD: O (IC) 01/25/21, O (DC) 08/31/20, O (RC) 03/17/20, M (IC) 01/14/19; JMAT.LN: O (IC) 09/24/18; JNJ: O (RC) 10/11/19; K: U
(RC) 06/11/20, M (RC) 03/18/20, U (RC) 03/20/17; KBANK.TB: M (RC) 01/08/21, O (RC) 08/27/19; KDP: O (IC) 01/19/21; KER.FP: M (RC)
01/08/20; KGF.LN: M (DC) 01/30/17; KHC: M (RC) 02/25/19; KKC.IN: M (IC) 06/23/16; KMB: M (IC) 01/19/21, M (DC) 03/30/20, M (IC)
05/07/07; KMB.IN: O (IC) 11/16/16; KMI: O (RC) 06/26/18; KNIN.SW: M (RC) 10/22/20, O (RC) 06/18/20, M (RC) 10/28/19; KO: O (IC)
01/19/21, O (DC) 03/30/20, O (IC) 11/16/10; KOS: M (RC) 02/28/20, M (RC) 02/26/20, O (RC) 01/04/19; KR: O (RC) 05/20/19; LB: M (RC)
03/01/19; LGF/B: M (RC) 02/21/18; LHA.GR: M (RC) 06/05/20, O (RC) 10/30/19; LHX: O (IC) 12/09/19; LIN: M (RC) 04/15/20, U (IC)
11/05/18; LIN.GR: M (RC) 04/15/20, U (IC) 11/05/18; LISN.SW: O (IC) 10/12/20, M (DC) 01/13/20; LISP.SW: O (IC) 10/12/20, M (DC)
01/13/20; LLY: M (IC) 11/09/20, O (DC) 07/14/18; LMT: M (RC) 12/05/14; LNG: O (RC) 03/26/18; LOW: O (RC) 01/22/18; LPC.IN: O (IC)
07/21/20; LT.IN: O (RC) 07/25/16; LTTS.IN: M (RC) 03/04/20, O (IC) 06/26/19; LULU: M (IC) 09/11/17; LUN.DC: M (RC) 10/24/18; LUV: O (RC)
12/07/20, M (RC) 10/31/19; LVS: O (IC) 11/14/18; LYB: M (RC) 11/13/20, O (IC) 09/10/15; LYFT: M (IC) 01/09/20; MA: O (DC) 09/08/20, O
(IC) 03/27/18; MAR: M (IC) 09/10/19; MBT.PM: M (IC) 10/18/17; MC.FP: O (RC) 08/06/19; MCD: O (RC) 04/18/17; MDLZ: O (IC) 08/02/06;
MDT: O (RC) 10/08/20, M (IC) 06/26/18; MEOH: U (RC) 11/30/20, M (RC) 04/21/20, U (IC) 05/10/17; MGGT.LN: O (RC) 11/23/20, M (RC)
03/23/15; MGM: M (IC) 11/14/18; MKC: M (RC) 09/15/16; MKS.LN: U (DC) 01/30/17; MLCO: O (IC) 03/23/15; MM.IN: O (RC) 06/15/20, M (IC)
03/21/19; MNST: M (IC) 01/19/21; MO: O (IC) 01/19/21, M (DC) 04/09/20, M (IC) 10/15/18; MONC.IM: O (RC) 08/06/19; MOS: O (RC)
10/13/15; MRK: O (IC) 11/09/20, O (DC) 07/14/18; MRK.GR: M (RC) 04/09/19; MSFT: O (IC) 08/17/11; MSIL.IN: O (IC) 03/21/19; MTCL.IN: M

(IC) 06/26/19; MTX.GR: M (RC) 01/11/17; MU: O (RC) 01/09/19; MX.CN: U (RC) 11/30/20, M (RC) 04/21/20, U (IC) 05/10/17; NAS.NO: U (RC)
04/14/20, M (RC) 10/30/19; NEM: O (IC) 01/12/21; NESN.SW: O (IC) 10/12/20, M (DC) 01/13/20; NFLX: O (IC) 03/16/17; NG/.LN: O (RC)
06/14/19; NKE: O (IC) 09/11/17; NLSN: O (RC) 10/14/14; NOC: O (RC) 03/30/20, M (RC) 02/17/15; NOVOB.DC: O (RC) 07/02/18; NOW: O
(IC) 05/23/17; NSC: M (RC) 10/03/12; NTES: M (DC) 08/31/20, M (IC) 01/14/19; NTGY.SM: M (RC) 12/11/19; NTR: O (RC) 03/02/20, M (RC)
01/15/20; NTR.CN: O (RC) 03/02/20, M (RC) 01/15/20; NVDA: O (RC) 02/18/20, M (RC) 02/11/19; NXPI: O (RC) 07/27/18; NXT.LN: M (IC)
02/11/20, U (DC) 01/30/17; NZYMB.DC: O (RC) 01/05/17; OCBC.SP: O (IC) 05/22/12; OKE: M (RC) 01/08/19; ONGC.IN: M (RC) 07/06/17;
OR.FP: O (IC) 10/12/20, U (DC) 01/13/20; ORCL: O (RC) 05/05/14; ORK.NO: M (IC) 10/12/20, O (DC) 01/13/20; ORSTED.DC: M (RC)
09/03/19; OSH.AU: O (RC) 05/05/20, M (RC) 02/03/20, O (IC) 06/29/09; OSK: M (IC) 09/22/20; OXY: U (DC) 08/02/10; PAA: M (RC)
06/18/18; PAGP: M (RC) 06/18/18; PAH3.GR: M (RC) 01/05/21, U (IC) 09/08/20, O (RC) 04/09/14; PBK.MK: U (RC) 07/20/20, M (RC)
08/14/19; PCAR: M (IC) 09/22/20; PDD: O (IC) 01/25/21, O (DC) 08/31/20, O (IC) 06/08/20; PEP: U (IC) 01/19/21, O (DC) 03/30/20, O (IC)
11/16/10; PFE: M (IC) 11/09/20, O (DC) 07/14/18; PG: M (IC) 01/19/21, O (DC) 03/30/20, O (RC) 08/08/11; PHG: O (IC) 03/10/20, O (DC)
01/28/20, O (IC) 11/12/19; PHIA.NA: O (IC) 03/10/20, O (DC) 01/28/20, O (IC) 11/12/19; PINS: M (IC) 01/09/20; PM: M (IC) 01/19/21, O (DC)
04/09/20, O (IC) 10/15/18; PMO.LN: M (RC) 07/05/17; PTCT: O (IC) 04/10/19; PTON: O (IC) 10/23/19; PTR: O (RC) 05/05/20, M (RC)
03/09/20, O (RC) 12/01/16; PTTEP.TB: M (RC) 05/05/20, U (RC) 03/09/20, M (RC) 11/07/12; PUB.FP: M (IC) 07/07/20, M (DC) 02/24/16;
PVH: O (RC) 09/03/19; PVRL.IN: O (IC) 06/26/19; PWR: O (IC) 09/22/20; PXD: O (IC) 08/16/16; PYPL: O (DC) 09/08/20, O (RC) 01/07/20;
QCOM: O (RC) 08/03/20, M (RC) 06/30/16; QS: U (IC) 11/30/20; QSR: O (IC) 04/04/19; QSR.CN: O (IC) 04/04/19; QURE: O (IC) 09/24/19;
RACE.IM: U (IC) 09/08/20, M (DC) 02/28/20, M (RC) 01/15/19; RARE: M (IC) 07/26/17; RB/.LN: U (IC) 10/12/20, O (DC) 01/13/20; RCO.FP: M
(RC) 04/15/20, O (RC) 02/03/20, M (RC) 12/18/18; RDS/A: O (RC) 12/03/20, M (RC) 03/09/20, O (RC) 09/30/14; RDS/B: O (RC) 12/03/20, M
(RC) 03/09/20, O (RC) 09/30/14; RDSA.LN: O (RC) 12/03/20, M (RC) 03/09/20, O (RC) 09/30/14; RDSA.NA: O (RC) 12/03/20, M (RC)
03/09/20, O (RC) 09/30/14; RDSB.LN: O (RC) 12/03/20, M (RC) 03/09/20, O (RC) 09/30/14; RDSB.NA: O (RC) 12/03/20, M (RC) 03/09/20, O
(RC) 09/30/14; REGN: O (RC) 02/25/20, M (IC) 10/11/19; REL.LN: M (IC) 07/07/20, M (DC) 02/24/16; REN.NA: M (IC) 07/07/20, M (DC)
02/24/16; REP.SM: O (RC) 04/07/20, M (RC) 03/09/20, O (RC) 07/10/18; RI.FP: O (RC) 07/29/20, M (RC) 09/10/19; RIGD.LI: O (RC)
01/21/20; RIL.IN: O (RC) 01/21/20; RIO: M (IC) 01/12/21, O (DC) 02/07/20, O (IC) 09/05/12; RIO.AU: M (IC) 01/12/21; RIO.LN: M (IC)
01/12/21, O (DC) 02/07/20, O (IC) 09/05/12; RMG.LN: M (RC) 05/18/20, U (RC) 02/07/20, M (RC) 11/29/19; RMS.FP: M (RC) 12/11/20, O
(RC) 03/12/20, M (IC) 04/16/19; RNO.FP: O (IC) 09/08/20, M (DC) 02/28/20, M (RC) 05/25/17; ROG.SW: O (IC) 07/13/20, M (DC) 07/14/18;
ROST: O (IC) 09/11/17; RR/.LN: U (RC) 12/08/15; RTX: M (IC) 04/07/20; RWE.GR: O (RC) 01/09/18; RYA.ID: O (RC) 03/10/20, M (RC)
01/08/18; RYAAY: O (RC) 03/10/20, M (RC) 01/08/18; SABR: O (RC) 05/11/20, M (RC) 02/14/19; SAF.FP: M (RC) 04/01/20, O (RC)
01/04/18; SAN.FP: O (IC) 09/03/19; SAP: O (RC) 03/13/12; SAP.GR: O (RC) 03/13/12; SBICARD.IN: O (IC) 09/14/20; SBIN.IN: O (IC)
11/16/16; SBUX: M (RC) 01/29/18; SCB.TB: M (RC) 07/06/18; SE: M (DC) 02/27/17; SFM: O (RC) 02/21/20, M (RC) 06/24/19; SHL.GR: O (IC)
03/10/20, O (DC) 01/28/20, O (IC) 11/12/19; SJM: U (RC) 06/11/20, M (RC) 03/18/20, U (RC) 03/20/17; SMPL: O (IC) 08/12/19; SMSN.LI: O
(IC) 08/10/11; SN/.LN: O (RC) 12/18/20, M (RC) 03/30/20, O (IC) 03/10/20, O (DC) 01/28/20, O (IC) 11/12/19; SNAP: O (IC) 01/09/20; SNN:
O (RC) 12/18/20, M (RC) 03/30/20, O (IC) 03/10/20, O (DC) 01/28/20, O (IC) 11/12/19; SNOW: M (IC) 10/01/20; SNP: O (RC) 07/06/17; SNY:
O (IC) 09/03/19; SOON.SW: U (IC) 03/10/20, U (DC) 01/28/20, U (IC) 11/12/19; SPLK: M (RC) 11/06/18; SPOT: U (RC) 07/06/20, M (RC)
03/23/20, U (IC) 01/08/20; SPR: M (RC) 07/08/20, O (RC) 01/05/16; SQ: M (DC) 09/08/20, M (IC) 04/02/19; SRG.IM: M (IC) 05/01/19; SRPT:
O (IC) 10/11/18; SSE.LN: O (RC) 01/09/19; STMN.SW: M (IC) 03/10/20, M (DC) 01/28/20, M (IC) 11/12/19; STO.AU: O (RC) 05/05/20, U (RC)
03/09/20, M (RC) 07/06/17; STX: M (IC) 07/15/20; SUNP.IN: O (IC) 07/21/20; SVT.LN: M (RC) 01/08/20; SW.FP: M (RC) 03/05/20, U (RC)
01/18/19; SY1.GR: M (RC) 08/10/17; SYK: M (IC) 06/26/18; T: M (IC) 10/15/19; TCOM: M (DC) 08/31/20, M (RC) 01/21/20; TCS.IN: O (IC)
06/26/19; TDC: M (RC) 03/05/18; TECHM.IN: O (RC) 02/04/20, M (IC) 06/26/19; TEVA: M (IC) 10/11/19; TGT: M (RC) 05/02/19; THBEV.SP: O
(RC) 01/08/21, M (RC) 08/31/18; TJX: O (IC) 09/11/17; TLW.LN: M (RC) 07/05/17; TMUS: O (IC) 10/15/19; TMX.IN: M (RC) 07/02/18; TOT: M
(RC) 01/04/21, O (RC) 03/25/20, M (RC) 03/09/20, O (RC) 02/09/18; TPR: O (IC) 09/11/17; TRIP: O (IC) 11/30/20; TRMB: O (IC) 09/22/20;
TRN.IM: O (IC) 05/01/19; TSCO: O (IC) 02/26/18; TSLA: U (RC) 07/28/20, M (IC) 03/08/17; TSM: O (RC) 01/12/21, M (RC) 01/30/12; TSN: O
(RC) 06/04/20, M (RC) 04/24/20, O (IC) 05/10/18; TTWO: O (IC) 10/09/18; TUI.LN: U (RC) 12/16/20, M (RC) 12/02/19; TUI1.GR: U (RC)
12/16/20, M (RC) 12/02/19; TVSL.IN: M (IC) 09/25/19; TWE.AU: O (RC) 11/30/20, M (RC) 08/20/20, O (IC) 10/10/18; TWTR: M (RC)
04/08/20, U (IC) 01/09/20; TXN: M (RC) 03/25/19; UAA: M (RC) 09/03/19; UAL: O (RC) 01/31/18; UBER: O (IC) 01/09/20; UCB.BB: O (RC)
10/18/19; UG.FP: U (IC) 09/08/20, O (DC) 02/28/20, O (IC) 03/13/17; UHR.SW: M (IC) 04/16/19; ULVR.LN: U (IC) 10/12/20, O (DC) 01/13/20;
UMC: M (RC) 06/11/18; UMI.BB: U (IC) 09/24/18; UN01.GR: U (RC) 04/09/19; UNA.NA: U (IC) 10/12/20, O (DC) 01/13/20; UNH: O (IC)
06/15/16; UNP: O (RC) 01/11/21, M (RC) 06/17/19; UOB.SP: M (IC) 05/22/12; UPS: O (IC) 05/10/11; URI: M (IC) 09/22/20; UU/.LN: M (RC)
07/03/17; V: O (DC) 09/08/20, O (IC) 03/27/18; VALE: M (IC) 01/12/21, O (DC) 02/07/20, O (RC) 01/25/17; VALE3.BZ: M (IC) 01/12/21, O
(DC) 02/07/20, O (RC) 01/25/17; VFC: M (IC) 09/11/17; VIAC: U (IC) 01/29/20; VIV.FP: O (IC) 07/07/20, M (DC) 02/24/16; VMW: O (RC)
02/06/20, M (RC) 02/10/15; VOLT.IN: O (RC) 06/29/17; VOLVB.SS: O (IC) 09/08/20; VOW.GR: M (RC) 12/15/20, U (IC) 09/08/20, O (DC)
02/28/20, O (RC) 10/12/17; VRTX: O (IC) 11/19/20, M (DC) 09/18/15; VTRS: M (IC) 12/14/20; VZ: M (IC) 10/15/19; WDAY: O (RC) 10/17/18;
WDC: O (IC) 07/15/20; WEN: M (IC) 09/11/13; WIT: U (IC) 09/11/20; WIZZ.LN: O (IC) 09/28/20; WKL.NA: O (IC) 07/07/20, O (DC) 02/24/16;
WLK: M (RC) 03/19/20, O (IC) 06/20/18; WLKP: M (IC) 06/20/18; WMB: O (RC) 03/12/20, M (RC) 08/05/19; WMG: M (IC) 06/23/20; WMT: O
(RC) 05/02/19; WORK: M (IC) 08/14/19; WPL.AU: O (RC) 05/05/20, M (RC) 03/09/20, O (RC) 02/20/18; WPP: U (IC) 07/07/20; WPP.LN: U (IC)
07/07/20, O (DC) 02/24/16; WPRO.IN: U (IC) 06/26/19; WTB.LN: U (RC) 01/17/20; WYNN: O (IC) 11/14/18; YES.IN: U (RC) 03/09/20, M (RC)
07/18/19; YUM: O (RC) 12/16/13; YUMC: M (IC) 11/03/16; ZAL.GR: O (IC) 02/11/20, O (DC) 01/30/17; ZBH: M (RC) 06/11/19; ZM: O (IC)
04/29/19; ZTO: O (IC) 05/16/18;
Rating Guide: O - Outperform, M - Market-Perform, U - Underperform, N - Not Rated
Rating Actions: IC - Initiated Coverage, DC - Dropped Coverage, RC - Rating Change
The Firm produces a number of different types of research products including, among others, fundamental analysis, quantitative analysis and
analytics. Sanford C. Bernstein & Co., LLC, Sanford C. Bernstein (Hong Kong) Limited 盛博香港有限公司, and Bernstein Autonomous LLP,
each issue research products under the “Autonomous” publishing brand independently of the “Bernstein” and “Alphalytics” publishing
brands. Recommendations contained within one type of research product may differ from recommendations contained within other types of
research products, whether as a result of differing time horizons, methodologies or otherwise. Furthermore, views or recommendations

within a research product issued under any particular brand may differ from views or recommendations under the same type of research
product issued under another brand.
Where this material contains an analysis of debt product(s), such material is intended only for institutional investors and is not subject to the
independence and disclosure standards applicable to debt research prepared for retail investors.
This document may not be passed on to any person in the United Kingdom (i) who is a retail client (ii) unless that person or entity qualifies as
an authorised person or exempt person within the meaning of section 19 of the UK Financial Services and Markets Act 2000 (the "Act"), or
qualifies as a person to whom the financial promotion restriction imposed by the Act does not apply by virtue of the Financial Services and
Markets Act 2000 (Financial Promotion) Order 2005, or is a person classified as an "professional client" for the purposes of the Conduct of
Business Rules of the Financial Conduct Authority.
This document may not be passed onto any person in Canada unless that person qualifies as "permitted client" as defined in Section 1.1 of NI
31-103.
To our readers in the United States: Sanford C. Bernstein & Co., LLC, a broker-dealer registered with the U.S. Securities and Exchange
Commission (“SEC”) and a member of the U.S. Financial Industry Regulatory Authority, Inc. (“FINRA”) is distributing this publication in the
United States and accepts responsibility for its contents. Any U.S. person receiving this publication and wishing to effect securities
transactions in any security discussed herein should do so only through Sanford C. Bernstein & Co., LLC. Where this report has been
prepared by research analyst(s) employed by a non-US affiliate (such analyst(s), “Non-US Analyst(s)”) of Sanford C. Bernstein & Co., LLC, such
Non-US Analyst(s) is/are (unless otherwise expressly noted) not registered as associated persons of Sanford C. Bernstein & Co., LLC or any
other SEC-registered broker-dealer and are not licensed or qualified as research analysts with FINRA or any other US regulatory authority.
Accordingly, reports prepared by Non-US Analyst(s) are not prepared in compliance with FINRA’s restrictions regarding (among other things)
communications by research analysts with a subject company, interactions between research analysts and investment banking personnel,
participation by research analysts in solicitation and marketing activities relating to investment banking transactions, public appearances by
research analysts, and trading securities held by a research analyst account.
To our readers in the United Kingdom: This publication has been issued or approved for issue in the United Kingdom by Bernstein
Autonomous LLP, authorised and regulated by the Financial Conduct Authority and located at 50 Berkeley Street, London W1J 8SB, +44
(0)20-7170-5000.
To our readers in Ireland and the member states of the EEA: This publication is being distributed by Sanford C. Bernstein Ireland Limited,
which is authorised and regulated by the Central Bank of Ireland.
To our readers in Hong Kong: This publication is being distributed in Hong Kong by Sanford C. Bernstein (Hong Kong) Limited 盛博香港有限
公司, which is licensed and regulated by the Hong Kong Securities and Futures Commission (Central Entity No. AXC846). This publication is
solely for professional investors only, as defined in the Securities and Futures Ordinance (Cap. 571).
To our readers in Singapore: This publication is being distributed in Singapore by Sanford C. Bernstein, a unit of AllianceBernstein
(Singapore) Ltd., only to accredited investors or institutional investors, as defined in the Securities and Futures Act (Chapter 289). Recipients
in Singapore should contact AllianceBernstein (Singapore) Ltd. in respect of matters arising from, or in connection with, this publication.
AllianceBernstein (Singapore) Ltd. is a licensed entity under the Securities and Futures Act and registered with Company Registration No.
199703364C. It is regulated by the Monetary Authority of Singapore and located at One Raffles Quay, #27-11 South Tower, Singapore
048583, +65-62304600. The business name "Bernstein" is registered under business registration number 53193989L.
To our readers in the People’s Republic of China: The securities referred to in this document are not being offered or sold and may not be
offered or sold, directly or indirectly, in the People's Republic of China (for such purposes, not including the Hong Kong and Macau Special
Administrative Regions or Taiwan), except as permitted by the securities laws of the People’s Republic of China.
To our readers in Japan: This document is not delivered to you for marketing purposes, and any information provided herein should not be
construed as a recommendation, solicitation or offer to buy or sell any securities or related financial products.
For the institutional client readers in Japan who have been granted access to the Bernstein website by Daiwa Securities Group Inc. (“Daiwa”),
your access to this document should not be construed as meaning that Bernstein is providing you with investment advice for any purposes.
Whilst Bernstein has prepared this document, your relationship is, and will remain with, Daiwa, and Bernstein has neither any contractual
relationship with you nor any obligations towards you
To our readers in Australia: Sanford C. Bernstein & Co., LLC, Bernstein Autonomous LLP and Sanford C. Bernstein (Hong Kong) Limited 盛博
香港有限公司 are exempt from the requirement to hold an Australian financial services licence under the Corporations Act 2001 in respect
of the provision of the following financial services to wholesale clients:
• providing financial product advice;
• dealing in a financial product;
• making a market for a financial product; and
• providing a custodial or depository service.

To our readers in Canada: If this publication is pertaining to a Canadian domiciled company, it is being distributed in Canada by Sanford C.
Bernstein (Canada) Limited, which is licensed and regulated by the Investment Industry Regulatory Organization of Canada ("IIROC"). If the
publication is pertaining to a non-Canadian domiciled company, it is being distributed by Sanford C. Bernstein & Co., LLC, which is licensed
and regulated by both the SEC and FINRA into Canada under the International Dealers Exemption. This publication may not be passed onto
any person in Canada unless that person qualifies as a "Permitted Client" as defined in Section 1.1 of NI 31-103.
To our readers in India: This publication is being distributed in India by Sanford C. Bernstein (India) Private Limited (SCB India) which is
licensed and regulated by Securities and Exchange Board of India ("SEBI") as a research analyst entity under the SEBI (Research Analyst)
Regulations, 2014, having registration no. INH000006378 and as a stock broker having registration no. INZ000213537. SCB India is
currently engaged in the business of providing research and stock broking services.
SCB India is a private limited company incorporated under the Companies Act, 2013, on April 12, 2017 bearing corporate identification
number U65999MH2017FTC293762, and registered office at Level 6, 4 North Avenue, Maker Maxity, Bandra Kurla Complex, Bandra (East),
Mumbai 400051 , Maharashtra, India (Phone No: +91-22-68421401).
SCB India does not have any disciplinary history as on the date of this report.
The associates of SCB India or their relatives may have financial interest(s) in the subject company.
SCB India or its associates do not have actual/beneficial ownership of one percent or more securities of the subject company. SCB India is
not engaged in any investment banking activities, as such, SCB India has not managed or co-managed a public offering in the past twelve
months. In addition, neither SCB India nor any of its associates have received any compensation for investment banking services or
merchant banking services from the subject company in the past 12 months.
SCB India or its associates may have received compensation for brokerage services from the subject company in the past twelve months.
SCB India or its associates may have received compensation for products or services other than investment banking or merchant banking or
brokerage services from the subject company in the past twelve months.
SCB India and its associates have not received any compensation or other benefits from the subject company or third party in connection
with the research report.
The principal research analysts who prepared this report, a member of his or her team, are not (nor are any members of their household) an
officer, director, employee or advisory board member of the companies covered in the report.
SCB India and its associate company(ies) may act as a market maker in the financial instruments of the companies covered in the report.
Sanford C. Bernstein & Co., LLC., Bernstein Autonomous LLP, Sanford C. Bernstein (Hong Kong) Limited 盛博香港有限公司, Sanford C.
Bernstein (Canada) Limited and AllianceBernstein (Singapore) Ltd., Sanford C. Bernstein (India) Private Limited are regulated, respectively, by
the Securities and Exchange Commission under U.S. laws, by the Financial Conduct Authority under U.K. laws, by the Hong Kong Securities
and Futures Commission under Hong Kong laws, by the Investment Industry Regulatory Organization of Canada, by the Monetary Authority
of Singapore under Singapore laws, and Securities and Exchange Board of India, all of which differ from Australian laws.
One or more of the officers, directors, or employees of Sanford C. Bernstein & Co., LLC, Bernstein Autonomous LLP, Sanford C. Bernstein
(Hong Kong) Limited 盛博香港有限公司, Sanford C. Bernstein (India) Private Limited, Sanford C. Bernstein (Canada) Limited, Sanford C.
Bernstein (business registration number 53193989L), a unit of AllianceBernstein (Singapore) Ltd. which is a licensed entity under the
Securities and Futures Act and registered with Company Registration No. 199703364C, and/or their affiliates may at any time hold,
increase or decrease positions in securities of any company mentioned herein.
The Firm or its affiliates may provide investment management or other services to the pension or profit sharing plans, or employees of any
company mentioned herein, and may give advice to others as to investments in such companies. These entities may effect transactions that
are similar to or different from those recommended herein.
All Bernstein branded research publications are disseminated to our clients through posting on the firm's password protected website,
www.bernsteinresearch.com. Certain, but not all, Bernstein branded research publications are also made available to clients through third-
party vendors or redistributed to clients through alternate electronic means as a convenience. For access to all available Bernstein branded
research publications, please contact your sales representative or go to http://www.bernsteinresearch.com
The Firm and/or its affiliates do and seek to do business with companies covered in its research publications. As a result, investors should be
aware that the Firm and/or its affiliates may have a conflict of interest that could affect the objectivity of this publication. Investors should
consider this publication as only a single factor in making their investment decisions.
This publication has been published and distributed in accordance with the Firm's policy for management of conflicts of interest in
investment research, a copy of which is available from Sanford C. Bernstein & Co., LLC, Director of Compliance, 1345 Avenue of the
Americas, New York, N.Y. 10105, Bernstein Autonomous LLP, Director of Compliance, 50 Berkeley Street, London W1J 8SB, United
Kingdom, or Sanford C. Bernstein (Hong Kong) Limited 盛博香港有限公司, Director of Compliance, 39th Floor, One Island East, Taikoo
Place, 18 Westlands Road, Quarry Bay, Hong Kong, or Sanford C. Bernstein (business registration number 53193989L) , a unit of
AllianceBernstein (Singapore) Ltd. which is a licensed entity under the Securities and Futures Act and registered with Company Registration

No. 199703364C, Director of Compliance, One Raffles Quay, #27-11 South Tower, Singapore 048583, or Sanford C. Bernstein (India)
Private Limited, Chief Compliance Officer, Level 6, 4 North Avenue, Maker Maxity, Bandra Kurla Complex, Bandra (East), Mumbai 400051.
Additional disclosures and information regarding Bernstein's business are available on our website www.bernsteinresearch.com.
This report has been produced by an independent analyst as defined in Article 3 (1)(34)(i) of EU 296/2014 Market Abuse Regulation (“MAR”).
This publication is not directed to, or intended for distribution to or use by, any person or entity who is a citizen or resident of, or located in any
locality, state, country or other jurisdiction where such distribution, publication, availability or use would be contrary to law or regulation or
which would subject Bernstein or any of their subsidiaries or affiliates to any registration or licensing requirement within such jurisdiction.
This publication is based upon public sources we believe to be reliable, but no representation is made by us that the publication is accurate or
complete. We do not undertake to advise you of any change in the reported information or in the opinions herein. This publication was
prepared and issued by Bernstein for distribution to eligible counterparties or professional clients. This publication is not an offer to buy or
sell any security, and it does not constitute investment, legal or tax advice. The investments referred to herein may not be suitable for you.
Investors must make their own investment decisions in consultation with their professional advisors in light of their specific circumstances.
The value of investments may fluctuate, and investments that are denominated in foreign currencies may fluctuate in value as a result of
exposure to exchange rate movements. Information about past performance of an investment is not necessarily a guide to, indicator of, or
assurance of, future performance.
• I/(we), Mark Diver, Inigo Fraser-Jenkins, Alla Harmsworth, Sarah McCarthy, CFA, Senior Analyst(s)/Analyst(s), certify that all of the views
expressed in this publication accurately reflect my/(our) personal views about any and all of the subject securities or issuers and that no part
of my/(our) compensation was, is, or will be, directly or indirectly, related to the specific recommendations or views in this publication.
Approved By: SS
Copyright 2021, Sanford C. Bernstein & Co., LLC, Bernstein Autonomous LLP, Sanford C. Bernstein (Hong Kong) Limited 盛博香港有限公司, Sanford C. Bernstein (India) Private Limited and AllianceBernstein (Singapore) Ltd., subsidiaries of AllianceBernstein L.P. ~1345 Avenue of the Americas ~ NY, NY 10105 ~212/756-4400. All rights reserved.


WTC Schiphol Airport, A-Tower
+31-20-201-4982
53 State Street
+1-617-788-3705
227 West Monroe Street
+1-312-696-7800
4 Earlsfort Terrace
+353-1-246-3100
Bockenheimer Landstrasse 51
+49-69-5050-77-181
One Island East, Taikoo Place
+852-2918-5762
50 Berkeley Street
+44-207-170-5000
1999 Avenue of the Stars
+1-310-407-0027
Via Monte di Pietà 21
+39-02-30304-400
Maker Maxity, BKC
+91-22-6842-1401
1345 Avenue of the Americas
+1-212-969-2204
One Raffles Quay, South Tower
+65-6230-4600
Hamngatan 11
+46-8-535-274-80
161 Bay Street
+1-416-572-2466
Talstrasse 83
+41-44-227-7910