A CORRELATION STUDY BETWEEN OZONE AND VOLCANIC ACTIVITY
14
A CORRELATION STUDY BETWEEN OZONE AND VOLCANIC ACTIVITY I. LIRITZIS 1, C. POULAKOS 1, E. LAGIOS 2 and D. KOSMATOS 2 1Research Center for Astronomy and Applied Mathematics, Academy of Athens, 14 Anagnostopoulou str., Athens 106 73, Greece; 2Department of Geothermy and Geophysics, University of Athens, Panepistimiopolis, lllisia, Athens 157 84, Greece (Received 15 September 1994) Abstract. A cross-correlation study for time-lags of -t-5 yrs between eleven ground based ozone stations (1957-1985) for ~ = 40°N-75 ° N and ), = 30 o E-114 ° W and five volcanic emissivity indices has shown their close connection: significant correlations well above 90% were obtained. Intepretation of these positive/negative correlations (r) was based on the global wind circulation (aided also by a 2-D, 3-D representation between ~p, A, r), and the types of volcanic aerosols leading to heterogeneous chemical reactions with ozone. Key words: ozone, volcanic eruption, cross-correlation 1. Introduction The recent concern of the world scientific community about the ozone depletion layer in the atmosphere, especially above the Antarctic - the so called Ozone Hole - has focus research on the anthropogenic effects on ozone. The industrial CFC's is considered as the main agent for such an ozone deficiency, albeit it has been shown that volcanic aerosols, after major volcanic eruptions or via gas release from fumaroles, is another ozone destruction cause. However, a detailed spectrum analysis of ozone data (1957-1992) by Xanthakis et al. (1993), has forwarded the idea that causes of ozone layer variations obeys to mainly physical mechanisms. Therefore, the ozone layer varies (and it may have been varied so in the past) in a quasi-periodic manner, whereas, several quasi-periodic terms are superimposed upon each other forming a network of such periodic components. Global volcanicity is here considered as a physical agent which may well influ- ence the ozone layer. In fact, the emitted tephra and gases which accompanied large volcanic eruptions, that reach the height of at least 30 kin, react chemically with ozone (03). Otherwise, evidence for stratospheric ozone-depleting heterogeneous chemistry on volcanic aerosols from volcanoes, such as the Et Chichon and Mt. Pinatubo, has been quoted (Arnold et al., 1990; Pitari and Rizi, 1993). Moreover, the effect of explosive volcanic eruptions on other atmospheric parameters in ozone heights (30-40 km) has been examined, e.g. for solar transmit- tance variation. Indeed, prior to the Agung 1963 event, where absence of significant aerosol-producing eruptions is observed, the apparent solar transmittance follows a biennial oscillation; whereas after 1963 to 1970, the solar transmittance is decreased by 1.5% and recovers to pre-Agung levels in 1970 (Sigurdsson, 1989). Earth, Moon and Planets 66: 217-230, 1994. ~) 1994 Kluwer Academic Publishers. Printed in the Netherlands.
Transcript of A CORRELATION STUDY BETWEEN OZONE AND VOLCANIC ACTIVITY

A CORRELATION STUDY BETWEEN OZONE AND VOLCANIC
ACTIVITY
I. L IRITZIS 1 , C. P O U L A K O S 1, E. L A G I O S 2 and D. K O S M A T O S 2 1Research Center for Astronomy and Applied Mathematics, Academy of Athens, 14
Anagnostopoulou str., Athens 106 73, Greece; 2Department of Geothermy and Geophysics, University of Athens, Panepistimiopolis, lllisia, Athens 157 84, Greece
(Received 15 September 1994)
Abstract. A cross-correlation study for time-lags of -t-5 yrs between eleven ground based ozone stations (1957-1985) for ~ = 40°N-75 ° N and ), = 30 o E-114 ° W and five volcanic emissivity indices has shown their close connection: significant correlations well above 90% were obtained. Intepretation of these positive/negative correlations (r) was based on the global wind circulation (aided also by a 2-D, 3-D representation between ~p, A, r), and the types of volcanic aerosols leading to heterogeneous chemical reactions with ozone.
Key words: ozone, volcanic eruption, cross-correlation
1. Introduction
The recent concern of the world scientific community about the ozone depletion layer in the atmosphere, especially above the Antarctic - the so called Ozone Hole - has focus research on the anthropogenic effects on ozone. The industrial CFC's is considered as the main agent for such an ozone deficiency, albeit it has been shown that volcanic aerosols, after major volcanic eruptions or via gas release from fumaroles, is another ozone destruction cause.
However, a detailed spectrum analysis of ozone data (1957-1992) by Xanthakis et al. (1993), has forwarded the idea that causes of ozone layer variations obeys to mainly physical mechanisms.
Therefore, the ozone layer varies (and it may have been varied so in the past) in a quasi-periodic manner, whereas, several quasi-periodic terms are superimposed upon each other forming a network of such periodic components.
Global volcanicity is here considered as a physical agent which may well influ- ence the ozone layer. In fact, the emitted tephra and gases which accompanied large volcanic eruptions, that reach the height of at least 30 kin, react chemically with ozone (03). Otherwise, evidence for stratospheric ozone-depleting heterogeneous chemistry on volcanic aerosols from volcanoes, such as the Et Chichon and Mt. Pinatubo, has been quoted (Arnold et al., 1990; Pitari and Rizi, 1993).
Moreover, the effect of explosive volcanic eruptions on other atmospheric parameters in ozone heights (30-40 km) has been examined, e.g. for solar transmit- tance variation. Indeed, prior to the Agung 1963 event, where absence of significant aerosol-producing eruptions is observed, the apparent solar transmittance follows a biennial oscillation; whereas after 1963 to 1970, the solar transmittance is decreased by 1.5% and recovers to pre-Agung levels in 1970 (Sigurdsson, 1989).
Earth, Moon and Planets 66: 217-230, 1994. ~) 1994 Kluwer Academic Publishers. Printed in the Netherlands.

218 L LIRITZIS ET AL.
The effect of volcanic emission on ozone variations is examined applying cross- correlation studies between eleven ground-based ozone stations (~ = 40 ° N-75 ° N and A = 30 ° E-114 ° W) and four different volcanic indices, namely; number of volcanoes with volcanic emissivity index (VEI) 2, 3, the total number of volcanoes (VEI = 1 to 5 inclusive) and the total amount of volcanic tephra (in m3). The tephra index is chosen as an indirect index of total released gases from global volcanic eruptions, assuming a linear relationship between the two.
Although VEI > 4 are most penetrating to ozone heights, VEI 2 and 3, surely, reach ozone layers by atmospheric circulation. We bear, however, in mind that large VEI's do not necessarily always imply high levels of SO2 or other chemical agents. Nevertheless, an exact and complete physical mechanism of volcanic output interaction with ozone is not fully understood. Therefore, the present investigation aims at such a target.
2. Data
The ozone data set were supplied by the NASA/WMO for the WMO assessment on the ozone layer (WMO, Reports, No 18 (1988) and 25 (1991)) and refers to eleven stations. The ozone layer for all these stations varies between a minimum of 240 Dobson Units (D.U.) and a maximum of 560 D.U.
The data cover a period of 23-28 years (1957-1985). In some stations there were missing data for upto three years (10% of total record) which were replaced by the average of the total record of each station.
The VEI data (as annual frequency of occurrence numbers) were taken from the catalogue of Simkin et al. (1981) and McCle!land et al. (1989). The volcanoes with VEI = 1 were of very low power and VEI = 4 and 5 were a few to treat them with a sound statistical basis.
3. The Cross-Correlation Analysis
Linear cross-correlation analysis of the two variables was performed, for time-lags t = -t-5 years. Prior to this a 3rd degree polynomial was detrended from all data series (subtraction of their trend). Tables I-IV present the correlation coefficients with the associated probabilities (higher than 50%) of the four variable pairs and Figures 1 (a-f) show some characteristic illustrations for these variations.
3.1. VEI 2 - OZONE
The highest (r) with the higher significance occurs mainly for time lag +2 years (rmax = 0.39, t = -2 , 96% for Edmonton), though there are some cases of high (r) for t = 3-4 years and for t = 0. This variable (r) depends upon the station's location and the particular periodic nature of each ozone data set (Table I).
However, the correlation coefficient seems to exhibit a cyclic variation for the time lags of t = 4-5 years. (Figure lb). This is expected when the quasi-

A CORRELATION STUDY BETWEEN OZONE AND VOLCANIC ACTIVITY 219
TABLE I
Linear-correlation coefficient (r) between Ozone and VEI 2 and corresponding probability of exceeding (r) in a random sample of observations taken from an uncorrelated parent population (significances S > 50% in parenthesis, in blanks S < 50%).
Ozone stations (n) - 5 - 4 - 3 - 2 - 1 0 1 2 3 4 5
n = number of data
Arosa (28) = 460 46 r
)~ = 090 40' E
Bismarck (25) = 460 46 r
)~ = 100 ° 45 r W
Caribou (23) ~p = 460 52 ~
), = 68 ° 01 ~ W
Edmonton (28) = 530 3 #
)~= 113° 3 1 t W
Goosebay (23) = 530 20 r
)~ = 600 25' W
Hradec Kr~il6ve (23)
= 500 11'
)~ = 150 50' E
Lerwick (28)
= 60 ° 08'
) ~ = 0 1 ° l l ' W
Rome (28) = 410 54'
,~ = 12 o 29 'E
Resolute (27)
= 740 43'
,~ = 94 ° 59' W
Reykj avik (24) = 640 08'
)~ = 21 o 5 4 ' W
Toronto (25)
= 43 ° 40'
)~ = 79 ° 24' W
- 0 . 0 6 - 0 . 0 2 0.37 - 0 . 0 8 0.13 0.008 0.08 0.16 -0 .03 0.17
(92%) (50%) (65%) (65%)
- 0 . 0 5
- 0 . 0 9 - 0 . 1 0 - 0 . 0 2 - 0 . 2 0 0.07 0.07 0.04 - 0 . 1 8 0.09 0.0009 0.07
(75%) (65%)
- 0 . 1 2 0.17 -0 .21 -0 .25 0.01 0.09 0.006 - 0 . 1 9 0.01 0.02 0.18
(55%) (60%) (70%) (55%) (55%)
0.03 - 0 . 1 3 - 0 . 0 9 - 0 . 3 9 0.05 0.05 - 0 . 0 2 - 0 . 0 8 0.04 0 . l l 0.21
(96%) (60%)
- 0 . 1 4 0.28 --0.01 - 0 . 1 8 0.023 - 0 . 1 5 0.04 - 0 . 2 2 --0.10 0.004 0.20
(70%) (55%) (50%) (65%) (60%)
0.019 0.08 - 0 . 2 4 0.03 0.16 0.19
(70%) (50%) (65%)
-0 .11 - 0 . 0 9 - 0 . 1 3 - 0 . 0 7 -0 .11
0.10 0.13 0.13 - 0 . 1 6 0.02 0.004 - 0 . 2 6 -0 .003 - 0 . 2 4 - 0 . 0 6 - 0 . 2 9
(55%) (80%) (78%) (85%)
0.04 - 0 . 0 4 - 0 . 0 6 - 0 . 2 2 - 0 . 1 0 -0 .11 0.09 - 0 . 2 0 0.06 0.13 0.19
(70%) (65%) (60%)
0.07 0.32 - 0 . 1 0 - 0 . 2 3 --0.08 0.29 0.17 -0 .007 0.14 - 0 . l l 0.18
(85%) (70%) (85%) (60%) (50%) (60%)
- 0 . 0 2 0.004 -0 .11 - 0 . 1 9 - 0 . 1 2 0.014 - 0 . 0 0 6 -0 .21 0.14 0.07 0.26
(60%) (75%) (75%)
- 0 . 1 3 - 0 . 0 4 0.24 - 0 . 0 9 0.09 - 0 . 1 6 - 0 . 1 2 --0.20 - 0 . 1 2 -0 .28
(70%) (60%) (65%) (78%)
0.001
periodic variations of both ozone (e.g., 3, 4, 6 years and the quasibiennial oscillation (QBO), Xanthakis et al., 1993) and volcanoes (2-25 years, Liritzis et al., 1994) is considered.
2 2 0 i. LIRITZIS ET AL.
TABLE II
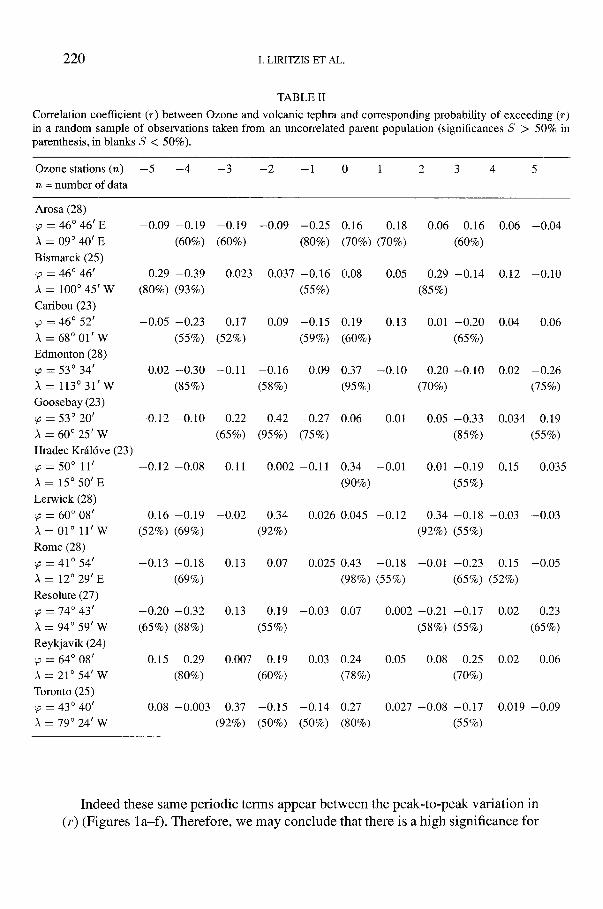
Correlation coefficient (r) between Ozone and volcanic tephra and corresponding probability of exceeding (r) in a random sample of observations taken from an uncorrelated parent population (significances S > 50% in parenthesis, in blanks S < 50%).
Ozone stations (n) - 5 - 4 - 3 - 2 - 1 0 1 2 3 4 5
n = number of data
Arosa (28)
= 46 ° 4 6 ' E - 0 . 0 9 - 0 . 1 9 - 0 . 1 9 - 0 . 0 9 - 0 . 2 5 0.16 0.18 0.06 0.16 0.06 - 0 . 0 4
)~ = 09 ° 40 ' E (60%) (60%) (80%) (70%) (70%) (60%)
Bismarck (25)
= 460 46' 0.29 - 0 . 3 9 0.023 0.037 - 0 . 1 6 0.08 0.05 0.29 - 0 . 1 4 0.12 - 0 . 1 0
A = 100 ° 45 r W (80%) (93%) (55%) (85%)
Caribou (23)
= 46 ° 52' - 0 . 0 5 - 0 . 2 3 0.17 0.09 - 0 . 1 5 0.19 0.13 0.01 - 0 . 2 0 0.04 0.06
), = 68 ° 01' W (55%) (52%) (59%) (60%) (65%)
Edmonton (28)
= 53 o 34' 0.02 - 0 . 3 0 -0 .11 - 0 . 1 6 0.09 0.37 - 0 . 1 0 0.20 - 0 . 1 0 0.02 - 0 . 2 6
= 113 o 31' W (85%) (58%) (95%) (70%) (75%)
Goosebay (23)
~p = 530 20' - 0 . 1 2 - 0 . 1 0 0.22 0.42 - 0 . 2 7 0.06 0.01 0.05 - 0 . 3 3 0.034 0.19
* = 60 o 25' W (65%) (95%) (75%) (85%) (55%)
Hradec Kr~il6ve (23)
= 500 11' - 0 . 1 2 - 0 . 0 8 0.11 0.002 -0 .11 0.34 -0 .01 0.01 - 0 . 1 9 0.15 0.035
= 15 o 50' E (90%) (55%)
Lerwick (28)
= 600 08' 0.16 - 0 . 1 9 - 0 . 0 2 0.34 0.026 0.045 - 0 . 1 2 0.34 - 0 . 1 8 - 0 . 0 3 -0 .03
= 01 ° l l ' W (52%) (69%) (92%) (92%) (55%)
Rome (28)
= 41 ° 54 t - 0 . 1 3 - 0 . 1 8 0.13 0.07 0.025 0.43 - 0 . 1 8 -0 .01 -0 .23 0.15 -0 .05
)~ = 12 o 29' E (69%) (98%) (55%) (65%) (52%)
Resolute (27)
= 740 43' - 0 . 2 0 - 0 . 3 2 0.13 0.19 -0 .03 0.07 0.002 -0 .21 --0.17 0.02 0.23
A = 940 59' W (65%) (88%) (55°770) (58%) (55%) (65°7o)
Reykjavik (24)
---- 64 ° 08' 0.15 - 0 . 2 9 0.007 0.19 0.03 0.24 - 0 . 0 5 0.08 - 0 . 2 5 0.02 0.06
A = 21 ° 54' W (80%) (60%) (78%) (70%)
Toronto (25)
= 43 ° 40' 0.08 - 0 . 0 0 3 0.37 - 0 . 1 5 - 0 . 1 4 0.27 0.027 - 0 . 0 8 - 0 . 1 7 0.019 - 0 . 0 9
= 79 o 24' W (92%) (50%) (50%) (80%) (55%)
I n d e e d t h e s e s a m e p e r i o d i c t e r m s a p p e a r b e t w e e n t h e p e a k - t o - p e a k v a r i a t i o n in
( r ) ( F i g u r e s l a - f ) . T h e r e f o r e , w e m a y c o n c l u d e t h a t t h e r e is a h i g h s i g n i f i c a n c e f o r

A CORRELATION STUDY BETWEEN OZONE AND VOLCANIC ACTIVITY 221
TABLE 1JI
Correlation coefficient (r) between Ozone and VEI Total and corresponding probability of exceeding (r) in a random sample of observations taken from an uncorrelated parent population (significances S > 50% in parenthesis, in blanks S < 50%).
Ozone stations (n) - 5 - 4 - 3 - 2 - 1 0 1 2 3 4 5
n = number of data
Arosa (28) = 46 o 46'
), = 090 40' E
Bismarck (25)
= 46 ° 46'
A = 100 ° 45' W
Caribou (23) = 460 52'
A = 68 ° 01' W
Edmonton (28) ~p = 530 34'
A = 113° 31 'W
Goosebay (23)
= 53 ° 20' )~ = 600 25' W
Hradec Kr~il6ve (23) = 500 11 r
A = 150 50 r E
Lerwick (28)
= 60 ° 08'
A = 0 1 ° l l ' W
Rome (28) = 410 54'
A = 120 29' E
Resolute (27) = 740 43'
A = 940 59' W
Reykjavik (24) qo = 640 08'
A = 210 54' W
Toronto (25) = 430 40'
A = 790 24' W
0.15 0.18 0.14 -0.14 -0.41 -0.12 0.1 -0.21 0.24 0.43
(5007o) (60%) (50%) (52%) (97%) (65%) (68°7o) (97%)
0.09
-0.04 -0.03 0.03 0.09 0.11 0.18 -0.25 -0.37 0.025 0.04 0.05
(5807o) (75%) (92%)
0.04 0.08 0.05 -0 .2 -0.25 0.28 -0.19 -0.13 0.21 -0.08 -0.03
(80%) (78%) (68%)
-0.11 -0.44 -0.23 -0.07 0.026 0.23 0.12 0.04 0.06 -0.15 -0.15
(97%) (68%) (65%) (52%) (50%)
0.36 0.29 0.007 -0.33 -0.32 -0.003 -0.25 -0.01 0..33 0.16 0.23
(88%) (80%) (85%) (85%) (70%) (85°7°) (50%) (65%)
0.06 -0.03 0.01 0.008 -0.52
(98%)
0.36 -0.03 -0.17 -0.09 -0.33
(90%) (58%) (90%)
0.19 -0.13 -0.29 -0.13 -0.47
(60%) (85%) (50%) (98%)
0.13 -0.05 -0.09 -0.41 -0.21
(95%) (65%)
0.25 -0.1 -0.18 -0.18 -0.48
(70%) (58%) (55%) (97%)
-0.02 0.04 0.18 -0.04 -0.34
(58%) (90°70)
-0.05 0.16 -0.15 0.04 0.22 0.23
(55%) (60%) (65%)
-0.09 -0.14 -0.09 0.38 0.19 0.20
(52%) (93%) (60070) (65%)
-0.12 0.34 0.09 0.31 0.14 -0.01
(90°70) (85%) (50%)
0.37 -0.01 0.t7 0.49 -0.001 -0.37
(93%) (65%) (98%) (90%)
0.02 0.03 0.11 0.41 0.12 -0.005
(95%)
0.11 0.17 -0.21 0.01 0.05 0.12
(55%) (60%)
the V E I 2 af fec t ing o z o n e l ayer s i m u l t a n e o u s l y or wi th in a lag o f 2 years the V E I
2 p reced ing .

2 2 2 [. LIRITZIS ET AL.
TABLE IV
Correlation coefficient (r) between Ozone and VEI 3 and corresponding probability of exceeding (r) in a random sample of observations taken from an uncorrelated parent population (significances S > 50% in parenthesis, in blanks S < 50%).
Ozone stations (n) - 5 - 4 - 3 - 2 - 1 0 1 2 3 4 5
n = number of data
Arosa (28) = 46 o 46' -0 .03 -0 .0006 -0 .23 -0 .09 -0 .05 0.21 0.19 0.09 0.34 -0 .13 -0 .16
)~ = 09 ° 40' E (70%) (72%) (60%) (90%) (55%)
Bismarck (25) = 46 o 46' 0.26 -0 .19 0.06 -0 .03 -0 .12 -0 .006 -0 .26 0.36 -0 .03 0.44 -0 .10
), = 100 ° 45' W (70%) (55%) (78%) (90%) (95%)
Caribou (23) = 46 o 52' 0.06 -0 .10 -0 .19 -0 .03 -0 .20 0.05 -0 .07 0.25 0.09 0.22 0.01
)t = 68 ° 01' W (60%) (60%) (70%) (65%)
Edmonton (28) = 53 o 34' -0 .03 -0 .28 -0 .28 0.13 -0 .03 0.21 -0 .06 0.19 -0 .11 0.24 -0 .17
)~ = 1130 31' W (82%) (82%) (50%) (65%) (65%) (70%) (55%)
Goosebay (23) = 530 20' 0.223 -0 .29 -0 .27 -0 .05 -0 .28 0.10 -0 .25 0.29 0.05 0.24 -0 .18
), = 60 ° 25' W (70%) (78%) (75%) (78%) (70%) (80%) (65%) (52%)
Hradec Kr~il6ve (23) ~p = 50 o 11' -0 .18 -0 .14 - 0 . 2 - 0 . 2 -0 .07 0.10 0.11 0.29 0.23 0.30 0.04
), = 15 ° 5 0 ' E (52%) (58%) (60%) (80%) (70%) (80%)
Lerwick (28) :p = 60 o 08' 0.06 -0 .45 -0 .25 -0 .20 -0 .22 0.14 0.05 0.38 0.15 0.29 -0 .07
), = 01 ° l l ' W (97%) (70%) (70%) (72%) (52%) (95%) (52%) (85%)
Rome (28) = 410 54' -0 .31 --0.25 -0 .25 -0 .05 -0.001 0.23 0.16 0.31 -0 .05 0.21 -0 .16
)~ = 120 2 9 ' E (87%) (75%) (77%) (78%) (55%) (87%) (65%) (52%)
Resolute (27) = 740 43 ~ -0 .10 -0.11 -0 .04 0.19 0.22 0.18 0.02 0.22 -0 .19 0.04 -0 .48
)~ = 94 o 59' W (65%) (62%) (58%) (70%) (60%) (96%)
Reykjavik (24) = 640 08 t --0.10 -0 .37 -0 .13 -0 .14 0.001 0.12 0.22 0.37 0.06 0.24 -0 .28
= 21° 54' W (90%) (65%) (92%) (65%) (78%)
Toronto (25) ~p = 430 40' 0.20 0.02 -0 .12 --0.007 -0 .24 0.01 -0 .08 -0 .08 -0 .13 0.17 -0 .29
)~ = 790 24' W (60%) (78%) (55%) (80%)
B e y o n d the t = ± 2 yea r s the s y m m e t r i c v a r i a t i o n is c a u s e d b y the i n h e r e n t
q u a s i - p e r i o d i c n a t u r e o f b o t h p a r a m e t e r s . T h e a b o v e o b s e r v a t i o n is a l so r e i n f o r c e d

(a)
A CORRELATION STUDY BETWEEN OZONE AND VOLCANIC ACTIVITY
0,3
223
0,2
0,1
0
-0,1
-0,2
-0,8
-0,4 -5 -4 -3 -2 -1 0 1 2 3 4 5
Time lag (years)
(b) 0,4
0,3
02
o,1
0
-0,1
-0,2
-0,8
' \
\ k
/ t
k
-5 -4 -3 -2 -1 0 1 2 3 4 ,5
Time lag (years)
Fig. 1. Estimated cross-correlation for time-lag of q-5 years, a) VEI3-Ozone for Edmonton. The free-hand dotted curve indicates the periodic nature of the two variables, with cycles of 2 years (quasi-biennial oscillation), b) VEI2-Ozone for Resolute. Quasi-periods of 4 years are shown by a free-hand dotted curve, c) VEI Total-Ozone for Rome. Quasi-periods of 3 and 4 years are shown by the free-hand dotted curve, d) Tephra-Ozone for Caribou. Quasi-periods of 3-4 years are shown by the free-hand dotted curves, e) Tephra-Ozone for Rome. Quasi-periods of 2-3 years are shown-by the free-hand dotted curves, f) Tephra-Ozone for Resolute. Quasi-periods of 2 years are shown by the free-hand dotted curves. All time-series in both variables are the detrended original data with the subtraction of the trend which is a 3rd degree polynomial.
by the ha l f nega t ive correla t ions , a m o n g s t the total corre la t ions , wi th s igni f icances
h igher than 50%.

224
(c) 0,4
I. LIRITZIS ET AL.
0,3
0,2 ~I 0,1 i "X
.,~ ............ I ( ................. I I i!i!i~ [
-0,1 ... . . .
-o.2 \, ( \, / /
-o,3 ~i ilili!iii t -0,4 i~!! ~
-0,5 -5 -4 -3 -2 -1 0 1 2
Time lag (years)
3 4
(d) 0,2
0,15
0,1 0,05
o
• - ' -0,05
-0,1
-0,15
-0.2
-0,25
'Nr " \
-5 -4 -3 -2 -1 0 1 2
Time lag (years)
Fig. Ic-d.
Jl it/," \
3 4 5
3 . 2 . T E P H R A -- O Z O N E
A similar pattem of cyclic variation of (r) is obtained, here, as well. In about half of eleven ozone stations the rma x is obtained for time-lag t = 0, i.e. simultaneous interaction between Tephra and Ozone (rmax = 0.43, t = 0, 98% for Rome). For the significant (r) (S > 50%), half correlations show negative correlation coefficients (Figure lf).
The positive-negative correlation coefficients are almost symmetrical with respect to time-lag t = 0, as anticipated from the inherent quasi-periodic char- acter of the two variables and the method of analysis, too (Table II).

A CORRELATION STUDY BETWEEN OZONE AND VOLCANIC ACTIVITY 225
(e)
"C
0,5
0,4
0,3
0,2 0,1
0
-0,1 -0,2 -0,3
/ i • , :
-5 -4 -3 -2 -1 0 1 2 3 4 5
Time lag (years)
(0 o.s
0,2
0,1
0 .:,~iiiiiiii -0,1 ~i~!~i~;}~
-0,3"°'2 ~ \ iiiii::iii::i
-0,4
-5 -4
/ /
\ /4
/
-2 -1 0 1 2 3 4 5 Time lag (years)
Ae-
Fig. le-f.
3.3. TOTAL VEI - OZONE
A similar pattern is obtained, here, as well but the simultaneous correlations are higher only for four ozone stations (Bismarck, Caribou, Edmonton and Resolute), while, the higher rmax -- 0.49 is for t = 3, with S = 98% (Table III). It is worth noticing here, that nine ozone stations give correlations with very high coefficient of above 90% (Figure 1 c).
3.4. VEI 3 - OZONE
Similar results are obtained and observations are made, here, too. Q'max = -0 .45 , Lerwick, t = - 4 , S = 97%) (Figure l a and Table IV).

2 2 6 I. LIRITZIS ET AL.
4. Discussion
In all these correlations, it is evident that, the volcanic activity, as expressed by different volcanic indices which represent the power of volcanic eruptions, influence ozone layer.
The qualitative effects depend upon each ozone station's location and do not occur on the same year of volcanic activity. Different VEI affects the ozone stations at different times.
Certainly, the negative correlation (anticorrelation) conforms with an anticipated physical mechanism; volcanic dust, including gases and acids +03 causes ozone dissociation which results to ozone layer decrease.
The variation of correlation coefficients for each pair (ozone station-volcanoes) for time-lag t = 0, may represent the general complicating global wind circu- lation (e.g. the westwards jet-stream). It is interesting to apply a two and three- dimensional representation of the (r) against latitude and longtitude. Indeed, the two dimensional contouring (Figure 2a) and the 3-D (Figure 2b) for tephra and ozone show a quite interesting pattern: the westward (and poleward) trend of wind circulation for the tropics (30 ° N-60 ° N) follows the higher (r) of transported volcanic tephra.
However this may not be ideally the case, since the complicated direction of wind circulation may, also, be influenced by temperature changes caused by volcanic dust in the atmosphere (perturbed thermal structure). For example the persistent nature of ozone pertubation has been shown to be still present more than a year after the eruption in ozonesonde measurements at Hilo, Hawaii following the eruption of Pinatubo (Hoffmann et al., 1993)
In general, the ozone layer variation is caused by mechanisms of mixing, diffu- sion, photoassociation and recombination of molecules.
Moreover, it has been documented that volcanic eruptions carrying volcanic particles, dust, sulfate aerosols, sulfur gases, alogens, nitrogen, chlorine and water vapor, introduced in the stratosphere provide sites for heterogeneous chemistry leading to 03 loss (Arnold et al., 1990; Verdecchia et al., 1992; Zvenigorodskii and Smyshlyaev, 1988; Pitari and Rizi, 1993).
However the negative-positive (r), even for a given time-lag, may imply that the volcanic "material" perhaps provide necessary molecules (M) which aid the production of 03 according to the simple equation:
O + 0 3 + M - + O 3 + M ~
The third molecule (M) carry off the released energy in this exothermic reaction, otherwise 03 is dissociated again. It is known, for example, that nitrogen oxides and hydrocarbons transported to the high latitudes during wintertime in the nothem hemisphere seems to play an important role for tropospheric ozone production over middle and high latitudes during spring time. Furthermore, increases in the release

A CORRELATION STUDY BETWEEN OZONE AND VOLCANIC ACTIVITY
404449535762667075 30 30
227
18 18
6 6
- 6 - 6
-18 -18
-30 -30
-42
-54
-78
-90 I - ~
-102
114 [ ~
-42
-54
- - 6 6
Z -78
Ib"
- 9 0
-,o2
tO
Fig. 2a. (a) 2-D representation of (r,),, p) for each ozone station correlated with volcanic tephra, (b) 3-D representation Of (r, ,~, p) for each ozone station correlated with volcanic tephra.
rate of the precursors, may lead to an ozone increase at mid and high latitudes of the order of 1% per year.
In normal atmospheric conditions this reaction leads to 03 production in lower heights, where, the probabili ty of triple collision is higher due to increased density. The presence of volcanic tephra may enhance this collision. On the other hand, other substances of volcanic tephra may trap and react with 03, resulting to dissociation and, thus, ozone depletion.

228 I. LIRITZIS ET AL.
t' l:l
~0 "~o "-~
Fig. 2b.
J
"V-
A study of the effect of E1 Chichon volcanic cloud on ozone and temperature demonstrates that the inclusion of volcanic aerosol in a two-dimensional model can produce temperature increase in the lower stratosphere with strong latitudinal gradients and hence implications for changes in zonal wind structure. The model predicts an approximate 2% depletion of globally total ozone following the eruption (see also relevant papers in Zerefos and Ghazi, 1985)
The obtained anti-correlation between ozone and volcanic indices is thus antic- ipated, but the correlation is not well understood. Although we have given above, a possible interpretation, yet an exact physical mechanism is lacking.
However, it suffices to mention possible causes of 03 increase. a) The radiative perturbation is largely determined by photolysis in the tropics,
while the effects on circulation are most significant at high latitudes. In fact it has been shown that the total radiative effect in the ozone column is an approximately 5% depletion in the tropics along with a wintertime increase poleward of 50 ° latitude (about 4-5% in the northern hemisphere) (Pitari & Rizi, 1993).
b) In the first month or so after the Pinatubo eruption in June 1991, the large amount of SO2 injected into the tropical atmosphere catalyses mid-stratospheric

A CORRELATION STUDY BETWEEN OZONE AND VOLCANIC ACTIVITY 229
ozone production. Thus, it is observed a mid-latitude switch from ozone loss to ozone gain and the increase and subsequent decrease in the total ozone column, as both, measurements and a model have shown (Bekki et al., 1993)
c) Periodical fluctuation of air pollutants following increases-decreases in ozone layer has been observed at Alert, Canada, associated with deep inversion and major anticyclones and air trajectories originating from the northwest (high) and cyclonic disturbance as southerly tranjectories (low) (Chung, 1989), that is purely a global wind circulation cause.
Recently (Summer 1994) it has been reported a temporary ozone increase during a volcanic activity in the Pacific region.
From the present statistical analysis it is profound that the complicated variation of temporal atmospheric ozone is rather partially due to the volcanic activity apart of other agents. Among the natural factors influencing 03 levels are the solar cycle, normal variations in solar radiation, the quasi-biennial oscillation and weather conditions (Petropoulos and Liritzis, 1985).
Although some researchers believe that volcanic debris might not make much difference in stratospheric chemistry, arguments on both sides of the 03 have been presented elsewhere (Kerr, 1993), while here our investigation favours some volcanic effect on ozone variation on a global scale.
5. Conclusions
It has been shown that ozone and volcanic activity expressed by five indices, are well correlated for eleven ozone ground based stations, exhibiting significant correlation coefficients, in most cases, well above 90%.
The positive correlation is not well understood as their anti-correlation does, which has provided a new insight, not previously considered, regarding the role of volcanic eruptions on stratospheric ozone increases.
The main cause for the obtained correlations is due to global wind circulation and the types of emitted volcanic aerosols.
References
Arnold, F., Buehrke, T. and Qiu, S.: 1990, 'Evidence for Stratospheric Ozone- Depleting Heteroge- neous Chemistry on Volcanic Aerosols from E1 Chichon', Nature 348(6296), 49-50.
Bekki, S., Toumi, R. and Pyle, J. A.: 1993, 'Role of Sulphur Photochemistry in Tropical Ozone Changes after the Eruption of Mount Pinatubo', Nature 362(6418), 331-333.
Chung, Y. S.: 1989, 'Concentrations of Atmospheric Constituents Observed at Alert, Canada, in Relation to Air Trajectories and Synoptic Systems', J. Atmosph. Chem. V9, N1-3, 317-331.
Hoffmann, D~ J., Oltmans, S. J., Harris, J. M., Komhyr, N. D., Lathrop, J. A., Defoor, T. and Kuniyuki, D.: 1993, 'Ozonesonde Measurements at Hilo, Hawaii, Following the Eruption of Pinatubo', Geophys. Res. Letts 20(15), 1555-1558.
Kerr, R. A.: 1993, 'Ozone Takes a Nose Dive After the Eruption of Mr. Pinatubo', Science 260(5107), 490-491.
Liritzis, I., Lagios, E. and Kosmatos, D.: 1994, 'Evidence for Periodicity in Global Volcanic Activity', (in preparation)'.
230 I. LIRITZIS ET AL.
McClelland, L., Simkin, T., Summers, M., Nielsen & Stein, T. C. (eds, 1989). 'Global Volcanism 1975-1985 (1989). The first decade of report of the Smithsonian Institution of Scientific Event Alert Network (SEAN)'. National Museum of History, Smithsonian Institution, Washington D.C. pp. 466.
Petropoulos, B. and Liritzis, I.: 1985, 'Ozone Concentration and Aurora Frequency in Relation to Solar-Terrestrial Indices', In Quadrennial Ozone Symposium. (Zerefos and Ghari eds), D. Reidel Publ. Co, Dordrecht, pp. 691-696.
Pitari, G. and Rizi, V.: 1993, 'An Estimate of the Chemical and Radiative Perturbation of Stratospheric Ozone Following the Eruption of Mt Pinatubo', J. Atmosph. Sci. 50(19), 3260-3276.
Simkin, T., Siebert, L., McClelland, L., Bridge, D., Newhall, C. and Latter, J. H.: 1981, 'Volcanoes of the World', Hutchinson and Ross, Stroudsburg, pg, 232pp.
Sigurdsson, H.: 1989, 'Evidence of Volcanic Aerosols Loading of the Atmosphere and Climate Response', Paper presented at the International Geosphere-Biosphere Meeting on Geosphere Fluctuations: Short Term Instabilities in the Earth System, Hamburg, West Germany, 13-16 December 1988.
Verdecchia, M., Viscouti, G. and Pitari, G.: 1992, 'Radiative Pertubation due to the Eruption of E1 Chichon: Effects on Ozone', J. Atmos. Terr. Phys. 54(7-8), 1081-1084.
Xanthakis, J., Poulakos, C. and Zerefos, C.: 1993, 'Stratospheric Ozone Variation in the Northern and the Southern Hemisphere During the Period 1917-1990', Earth, Moon, Planets 60, 109-125.
Zerefos, C. S. and Ghazi A. (eds): 1985, 'Atmospheric Ozone', Proceedings of the Quadrennial Ozone Symposium, Halkidiki, Greece, 3-7 Sept., 1984. Published by D. Reidel Publ. Co, Dordrecht, for the Commission of the European Communities, pp. 842.
Zvenigorodskii, S. G. and Smyshlyaev, S. P.: 1988, 'Effect of Volcanic Eruptions on the Gas Com- position of the Amaosphere', Meteorologiya i Gidologiya, no. 3, 119-123.