A Comparison of Methods for Analyzing Viral Load Data in Studies of HIV Patients
16
RESEARCH ARTICLE A Comparison of Methods for Analyzing Viral Load Data in Studies of HIV Patients Charles E. Rose 1 *, Lytt Gardner 1 , Jason Craw 1 , Sonali Girde 2 , Andrew J. Wawrzyniak 3 , Mari-Lynn Drainoni 4,5,6 , Jessica Davila 7 , Jack DeHovitz 8 , Jeanne C. Keruly 9 , Andrew O. Westfall 10 , Gary Marks 1 1 Division of HIV/AIDS Prevention, Centers for Disease Control and Prevention, Atlanta, Georgia, United States of America, 2 ICF Macro International, Inc., Atlanta, GA, United States of America, 3 Psychiatry and Behavioral Sciences, University of Miami Miller School of Medicine, Miami, FL, United States of America, 4 Department of Health Policy & Management, Boston University School of Public Health, Boston, MA, United States of America, 5 Section of Infectious Diseases, Department of Medicine, Boston University School of Medicine, Boston, MA, United States of America, 6 Center for Healthcare Organization and Implementation Research, ENRM VA Hospital, Bedford, MA, United States of America, 7 Department of Medicine, Baylor College of Medicine, Houston, TX, United States of America, 8 STAR Clinic, Department of Medicine, SUNY Downstate Medical Center, Brooklyn, NY, United States of America, 9 Department of Medicine, Johns Hopkins University School of Medicine, Baltimore, MD, United States of America, 10 Department of Biostatistics, University of Alabama-Birmingham School of Public Health, Birmingham, AL, United States of America * [email protected] Abstract HIV RNA viral load (VL) is a pivotal outcome variable in studies of HIV infected persons. We propose and investigate two frameworks for analyzing VL: (1) a single-measure VL (SMVL) per participant and (2) repeated measures of VL (RMVL) per participant. We com- pared these frameworks using a cohort of 720 HIV patients in care (4,679 post-enrollment VL measurements). The SMVL framework analyzes a single VL per participant, generally captured within a “window” of time. We analyzed three SMVL methods where the VL binary outcome is defined as suppressed or not suppressed. The omit-participant method uses a 8-month “window” (-6/+2 months) around month 24 to select the participant’s VL closest to month 24 and removes participants from the analysis without a VL in the “window”. The set- to-failure method expands on the omit-participant method by including participants without a VL within the “window” and analyzes them as not suppressed. The closest-VL method analyzes each participant’s VL measurement closest to month 24. We investigated two RMVL methods: (1) repeat-binary classifies each VL measurement as suppressed or not suppressed and estimates the proportion of participants suppressed at month 24, and (2) repeat-continuous analyzes VL as a continuous variable to estimate the change in VL across time, and geometric mean (GM) VL and proportion of participants virally suppressed at month 24. Results indicated the RMVL methods have more precision than the SMVL methods, as evidenced by narrower confidence intervals for estimates of proportion sup- pressed and risk ratios (RR) comparing demographic strata. The repeat-continuous method had the most precision and provides more information than other considered methods. We generally recommend using the RMVL framework when there are repeated VL PLOS ONE | DOI:10.1371/journal.pone.0130090 June 19, 2015 1 / 16 OPEN ACCESS Citation: Rose CE, Gardner L, Craw J, Girde S, Wawrzyniak AJ, Drainoni M-L, et al. (2015) A Comparison of Methods for Analyzing Viral Load Data in Studies of HIV Patients. PLoS ONE 10(6): e0130090. doi:10.1371/journal.pone.0130090 Academic Editor: Julian W. Tang, Alberta Provincial Laboratory for Public Health/ University of Alberta, CANADA Received: January 2, 2015 Accepted: May 15, 2015 Published: June 19, 2015 Copyright: This is an open access article, free of all copyright, and may be freely reproduced, distributed, transmitted, modified, built upon, or otherwise used by anyone for any lawful purpose. The work is made available under the Creative Commons CC0 public domain dedication. Data Availability Statement: The data underlying this study are subject to ethical restriction and owned by the CDC. All data are available upon request, and data requests should be directed to the Centers for Disease Control and Prevention, NCHHSTP, DHAP, Epidemiology Branch, at 1600 Clifton Rd, MS E-45, Atlanta, GA, 30333. Please note that release of these data must be in accordance with the provisions of the Public Health Service Act (42 U.S.C. 242m(d)), requiring that the privacy of individuals who provide personal information be protected. In addition, the CDC/ATSDR Policy on Releasing and Sharing Data
Transcript of A Comparison of Methods for Analyzing Viral Load Data in Studies of HIV Patients

RESEARCH ARTICLE
A Comparison of Methods for Analyzing ViralLoad Data in Studies of HIV PatientsCharles E. Rose1*, Lytt Gardner1, Jason Craw1, Sonali Girde2, Andrew J. Wawrzyniak3,Mari-Lynn Drainoni4,5,6, Jessica Davila7, Jack DeHovitz8, Jeanne C. Keruly9, AndrewO. Westfall10, Gary Marks1
1 Division of HIV/AIDS Prevention, Centers for Disease Control and Prevention, Atlanta, Georgia, UnitedStates of America, 2 ICF Macro International, Inc., Atlanta, GA, United States of America, 3 Psychiatry andBehavioral Sciences, University of Miami Miller School of Medicine, Miami, FL, United States of America,4 Department of Health Policy & Management, Boston University School of Public Health, Boston, MA,United States of America, 5 Section of Infectious Diseases, Department of Medicine, Boston UniversitySchool of Medicine, Boston, MA, United States of America, 6 Center for Healthcare Organization andImplementation Research, ENRM VA Hospital, Bedford, MA, United States of America, 7 Department ofMedicine, Baylor College of Medicine, Houston, TX, United States of America, 8 STAR Clinic, Department ofMedicine, SUNY Downstate Medical Center, Brooklyn, NY, United States of America, 9 Department ofMedicine, Johns Hopkins University School of Medicine, Baltimore, MD, United States of America,10 Department of Biostatistics, University of Alabama-Birmingham School of Public Health, Birmingham, AL,United States of America
AbstractHIV RNA viral load (VL) is a pivotal outcome variable in studies of HIV infected persons.
We propose and investigate two frameworks for analyzing VL: (1) a single-measure VL
(SMVL) per participant and (2) repeated measures of VL (RMVL) per participant. We com-
pared these frameworks using a cohort of 720 HIV patients in care (4,679 post-enrollment
VL measurements). The SMVL framework analyzes a single VL per participant, generally
captured within a “window” of time. We analyzed three SMVL methods where the VL binary
outcome is defined as suppressed or not suppressed. The omit-participant method uses a
8-month “window” (-6/+2 months) around month 24 to select the participant’s VL closest to
month 24 and removes participants from the analysis without a VL in the “window”. The set-
to-failure method expands on the omit-participant method by including participants without
a VL within the “window” and analyzes them as not suppressed. The closest-VL method
analyzes each participant’s VL measurement closest to month 24. We investigated two
RMVL methods: (1) repeat-binary classifies each VL measurement as suppressed or not
suppressed and estimates the proportion of participants suppressed at month 24, and (2)
repeat-continuous analyzes VL as a continuous variable to estimate the change in VL
across time, and geometric mean (GM) VL and proportion of participants virally suppressed
at month 24. Results indicated the RMVL methods have more precision than the SMVL
methods, as evidenced by narrower confidence intervals for estimates of proportion sup-
pressed and risk ratios (RR) comparing demographic strata. The repeat-continuous method
had the most precision and provides more information than other considered methods. We
generally recommend using the RMVL framework when there are repeated VL
PLOSONE | DOI:10.1371/journal.pone.0130090 June 19, 2015 1 / 16
OPEN ACCESS
Citation: Rose CE, Gardner L, Craw J, Girde S,Wawrzyniak AJ, Drainoni M-L, et al. (2015) AComparison of Methods for Analyzing Viral LoadData in Studies of HIV Patients. PLoS ONE 10(6):e0130090. doi:10.1371/journal.pone.0130090
Academic Editor: Julian W. Tang, Alberta ProvincialLaboratory for Public Health/ University of Alberta,CANADA
Received: January 2, 2015
Accepted: May 15, 2015
Published: June 19, 2015
Copyright: This is an open access article, free of allcopyright, and may be freely reproduced, distributed,transmitted, modified, built upon, or otherwise usedby anyone for any lawful purpose. The work is madeavailable under the Creative Commons CC0 publicdomain dedication.
Data Availability Statement: The data underlyingthis study are subject to ethical restriction and ownedby the CDC. All data are available upon request, anddata requests should be directed to the Centers forDisease Control and Prevention, NCHHSTP, DHAP,Epidemiology Branch, at 1600 Clifton Rd, MS E-45,Atlanta, GA, 30333. Please note that release of thesedata must be in accordance with the provisions of thePublic Health Service Act (42 U.S.C. 242m(d)),requiring that the privacy of individuals who providepersonal information be protected. In addition, theCDC/ATSDR Policy on Releasing and Sharing Data
measurements per participant because it utilizes all available VL data, provides additional
information, has more statistical power, and avoids the subjectivity of defining a “window.”
IntroductionHIV RNA viral load (VL) is a pivotal outcome variable in studies of HIV infected persons.Viral load measures are central to clinical trials of new antiretroviral (ART) therapy regimens[1, 2], randomized trials of ART adherence [3], and observational cohort studies of HIVpatients [4–12]. In addition, VL is a key component of surveillance databases that provideinformation on the continuum of care of HIV patients [13, 14]. Hence, VL is an essential out-come variable across a wide spectrum of HIV research and surveillance studies.
There are several methods for analyzing VL as the outcome variable, and there are impor-tant differences among these methods. We conceptualize these methods using two frameworks:(1) use of a single measure VL (SMVL) per person, in which the single VL may have beenselected from among multiple VLs available during a follow-up period for that person and (2)using all repeated VL measurements (RMVL) available during a follow-up period. Using theSMVL framework when there are several VL measurements available during a follow-upperiod necessitates choosing each participant’s VL measurement for inclusion in the analysis.Studies that analyze VL at a single time-point after enrollment often use an analysis interval(“window”) to capture that single value (e.g., 12 months after enrollment +/- 60 days). Thisapproach requires the investigator to decide how to analyze subjects with VL values that lieoutside the “window” (e.g., whether to exclude, include, or impute these subjects’ VL measure-ments). Limitations of this approach include ignoring within-participant variability, potentialloss of information, and lower statistical power which can result in erroneous or misleadingconclusions.
In contrast to the SMVL framework, the RMVL framework provides additional power, flexi-bility, and uses all available information. Flexibility of the RMVL framework is demonstratedby the ability to use repeated measures statistical models that may incorporate random effectsfor the intercept (baseline VL) and slope (VL trend across time) for each participant; some-thing the SMVL framework cannot do because it uses only one measurement per participant.The RMVL framework provides additional information because models within this frameworkmay estimate the geometric mean (GM) VL over time as well as estimate the VL for each par-ticipant at any specified follow-up time. In addition, one can obtain the proportion of partici-pants who are virally suppressed at the specified follow-up time without using an arbitrarilydefined “window.”
Using data from a recent retention in care (RIC) study, we investigate the SMVL and RMVLframeworks for analyzing VL data. Our purpose is to describe and compare several analyticmethods for analyzing VL data under each of these frameworks, articulate their strengths andlimitations, offer insights to guide selection of a model most suitable for the intent of an investi-gation, and compare results obtained using these methods when applied to an observationalcohort study of HIV patients.
Methods
Modeling VL Suppression Using the Single Measure Framework (SMVL)The VL outcome is often defined as a dichotomous variable based on VL suppression, whereVL below a threshold, e.g.,<200 copies/mL, is defined as suppressed [6, 7]. Viral load
Methods for Analyzing Viral Load Data in Studies of HIV Patients
PLOS ONE | DOI:10.1371/journal.pone.0130090 June 19, 2015 2 / 16
specifies that, in order to meet privacy requirements,CDC must ensure that confidential information is notdisclosed.
Funding: ICF Macro International provided supportin the form of a salary for author SG as a contractorto CDC, but did not have any additional role in thestudy design, data collection and analysis, decision topublish, or preparation of the manuscript. The specificroles of the full authors are articulated in the ‘authorcontributions’ section.
Competing Interests: SG is an employee of ICFMacro International, a contractor to CDC, providingpersonnel support for data management andanalysis. There are no patents, products indevelopment or marketed products to declare. Thisdoes not alter the authors’ adherence to all the PLOSONE policies on sharing data and materials.

suppression is viewed as the desired outcome in longitudinal studies of HIV infected patients,where patients are followed over time after an initiating event (e.g., beginning ART treatment)or enrolling in an intervention and viral suppression determined at a specific time-point.
We investigated three commonly used analysis methods within the SMVL framework,which we illustrate using four hypothetical patients and their VL measurements (Fig 1). In allSMVL analyses we modeled VL as a dichotomous variable at a single specified follow-up timeby classifying VL as suppressed or not suppressed. The first method uses only participants whohave a VL measurement within the specified “window,” and if a participant had more than oneVL measurement within the “window” we used the measurement closest to the specified fol-low-up time-point. If a participant lacked a VL within the “window” (triangles in Fig 1) thenthey were dropped from the analysis and we refer to this method as omit-participant. The sec-ond method, set-to-failure, used the same participants and their selected VL measurements asthe omit-participant method; additionally, participants who lacked a VL within the “window”were included in the analysis and treated as non-suppressed. The third method, closest-VL,expands the concept of a “window” by using all participants and their closest VL measurementsto the specified follow-up time, which implies the participant’s closest VL may be outside the“window.” In our analysis of these three methods using patient cohort data, our primary out-come is the proportion of participants who are virally suppressed at the specified time-point.
Fig 1. An example of log10(VL) copies/mL collected over time from baseline (month zero) and at subsequent follow-up visits for four participants.The triangles and squares represent the closest VL to month 24 for each of the four participants.
doi:10.1371/journal.pone.0130090.g001
Methods for Analyzing Viral Load Data in Studies of HIV Patients
PLOS ONE | DOI:10.1371/journal.pone.0130090 June 19, 2015 3 / 16
Modeling VL using the Repeated Measures Framework (RMVL)Our RMVL framework uses all VL measurements for all participants to estimate the geometricmean (GM) VL and/or proportion of participants who are virally suppressed at the specifiedfollow-up time. Using our Fig 1 example, the RMVL framework uses all 18 VL measurementscollected during the follow-up period as well as the four baseline measurements for the fourhypothetical participants. Here we present two analysis methods using the RMVL framework.
The first RMVL method, the repeated measures binary method (repeat-binary), expandsthe SMVL framework for the dichotomous analysis of VL suppression at a single follow-uptime by using all VL measurements available from baseline onward for each participant. Forexample, in Fig 1 all VL measurements below and above the threshold for viral suppression arecategorized as suppressed or non-suppressed, respectively. We modeled the repeat-binary datausing an appropriate model for binary data, e.g., log-binomial, and accounted for correlationwithin a person due to repeated measurements (e.g., generalized estimating equations) (see S1Appendix for model specification). We included the time, calculated as VL measurement dateminus the enrollment date, as a variable in the model to allow us to estimate the proportionsuppressed at the specified (or any desired) follow-up time.
The second RMVL method used all available VL data from each participant and modeledlog10(VL) as a continuous variable (repeat-continuous method). Modeling VL as a continuousvariable using a random effects model allowed us to estimate individual patient’s VL, and thegroup GM VL, in addition to estimating the proportion suppressed. Because VL data are sub-ject to lower and / or upper limit of detection (LOD), values that vary by the sensitivity of theassay, we accounted for LOD values using the repeat-continuous method with the Gaussianprobability density and cumulative density functions (pdf-cdf) mixture distribution [15–17](see S1 Appendix 1 for model description). The repeat-continuous method included a partici-pant-specific random effect for the intercept (baseline VL) and slope (VL trend over time) andthe method can predict each participant’s VL change over time and VL at the specified follow-up time. In addition, we calculated the group GM VL at month 24 by setting the slope andintercept random effects to zero. We summarized the participant slopes and predicted VL atthe specified follow-up time using summary statistics and graphical methods, e.g., box plots. Inaddition, we classified each participant’s predicted VL at the specified follow-up time as sup-pressed or not suppressed. Lastly, to obtain a CI about the virally suppressed proportions, weused bootstrapping [18].
Data for Modeling VL Suppression
Study BackgroundThe data used for the analysis came from a retention in care trial [19] that was conducted at sixHIV clinics in the U.S., located in Baltimore, Birmingham, Boston, Brooklyn, Houston, Miami.Each participant provided written informed consent, and the study was approved by the Insti-tutional Review Boards at each participating clinic site. The six clinical sites are University ofMiami Miller School of Medicine, Boston University School of Medicine, Baylor College ofMedicine, SUNY Downstate Medical Center, Johns Hopkins University School of Medicine,and University of Alabama-Birmingham Department of Medicine. Patients were eligible forinclusion if they had missed a primary care visit in the past 12 months, or had a gap in care�6months, or were new to the clinic. The trial randomized enrollees to intervention and controlarms and examined the effect of the intervention on improving attendance for primary care.The intervention significantly improved clinic attendance, but did not detect a significant effecton VL. Our analysis used VL measurements from the time of enrollment through up to 26
Methods for Analyzing Viral Load Data in Studies of HIV Patients
PLOS ONE | DOI:10.1371/journal.pone.0130090 June 19, 2015 4 / 16
months of observation. Viral load measurements were obtained from patients during regularlyscheduled primary care visits and not special study visits. The VL measurements obtainedfrom patients were not equally spaced in time and the number of primary care visits variedsubstantially among patients.
HIV RNA VL data (copies/mL and an indicator for upper and lower LOD) as well as datesof laboratory tests were supplied by each clinic. A chart review was used to determine if partici-pants were on ART at their enrollment (baseline) and, if not, if the participant started ARTduring the 12 months after baseline. Demographic variables (age and race/ethnicity) wereobtained from self-reports on an audio computer-assisted self-interview (ACASI) completedby each RIC study participant at time of enrollment.
Statistical AnalysisWe omitted patients from the analysis who were virally suppressed (<200 copies/mL) atbaseline because, as a group, they had no substantial variation in their baseline and post-enroll-ment visit(s) viral load measurements and comprised over half of the participants. Our analyticsample included patients who were not virally suppressed at baseline and had at least one post-enrollment VL measurement (720 of the 1838 patients who enrolled in the RIC trial).
Descriptive statistics were computed using the overall cohort of 720 and stratified by agegroup (18–29, 30–39,� 40), race/ethnicity (white, black, Hispanic, other), and ART status.Participants were followed up to month 26; therefore our “window” was defined as 6 months(180 days) prior and 2 months (60 days) after month 24. We treated log10(VL) as a continuousvariable and calculated the GM VL and 95% confidence interval (CI) using the baseline VLmeasurements for the 720 participants. In addition, we summarized all VL measurements afterenrollment by calculating the proportion of VL measurements for all 720 participants (4679post-enrollment visits) that were suppressed. Lastly, we computed the time from month 24 tothe closest VL measurement for each participant to depict the number of participants with VLswithin and outside of our defined “window” around month 24. All statistical analyses wereconducted using SAS software 9.3 [20].
For each of the SMVL methods (omit-participant, set-to-failure, closest-VL) we estimatedthe proportion of participants (overall and by characteristic, using univariable models for race/ethnicity, age, and ART status) who were virally suppressed (VL<200 copies). In addition, wecalculated the 95% CI of the proportion, risk ratio (RR) for race/ethnicity and age subgroupcomparisons, and RR 95% CI using a log-binomial model with α<0.05 as significant (see S1Appendix for model details). All three analysis methods within the SMVL framework requireddeciding how to treat the time-varying covariate ART when modeling at a single point in time.We modeled ART status using two methods: baseline ART (yes/no) and was ART prescribedat baseline or during the first 12 months of a patient’s observation after enrollment (baseline+12m: yes/no).
The first RMVL method (repeat-binary) modeled the binary outcome variable (suppressed /not suppressed) using all baseline and post-enrollment VL measurements to estimate the VLsuppression proportions over time. We used a log-binomial model and GEE with an exchange-able covariance structure to account for repeated measurements within a participant (see S1Appendix for model details). Each univariable model includes a stratification variable (e.g.,age), continuous time (months) calculated as the post-enrollment VL date minus the baselineVL date, and stratification variable by time interaction to estimate the proportion of partici-pants who are virally suppressed at month 24. The stratification by time interaction allows fora separate slope for each stratification subgroup. We used the repeat-binary model to estimatethe proportion with viral suppression, proportion 95% CI, RR, and RR 95% CI at month 24.
Methods for Analyzing Viral Load Data in Studies of HIV Patients
PLOS ONE | DOI:10.1371/journal.pone.0130090 June 19, 2015 5 / 16

Our repeat-continuous RMVL method modeled log10(VL) as a continuous variable to estimatethe GM VL and proportion of participants that are virally suppressed at month 24. Our modeltreated VL measurements at the lower and upper LOD as censored using the Gaussian cdf and1–cdf, respectively. The VL measurements that are not censored are modeled using the Gauss-ian pdf. Each univariable model includes the stratification variable (e.g., race/ethnicity), time(months), and stratification variable by time interaction. In addition, we included a randomintercept (baseline VL) and slope (VL trend over time) for each participant. The GM VL and95% CI at month 24 for each characteristic were estimated by setting the random effects tozero. We used the estimated participant-specific intercept and slope to predict VL at month 24for each participant and classified these predictions as suppressed or not suppressed using thethreshold of<200 copies. These virally suppressed proportions from the model were summa-rized for the stratification variables (e.g., race/ethnicity). The 95% CI for the proportion and CIwidth were estimated using bootstrapping [18] (see S1 Appendix for model details).
ResultsAmong the 720 participants, most were�40 years of age (61.3%), male (63.6%), black (73.2%),and on ART at baseline (57.5%) (Table 1). The highest GM VL copies/mL at baseline were forage 18–29 (15838), male (11627), black race (10754), and not on ART at baseline (19159). Themedian number of VL measurements per participant during the entire study was 6 (IQR 4, 9)with the median days between VL measurements of 90 days (IQR 55, 130). Of the 4679 post-enrollment VL measurements, 2443 of them were<200 (52.2%), and the percent of post-enrollment VLs<200 was highest for age 18–29 (53.9%), male (54.7%), white (64.2%), and onART at baseline (55.2%). The time from month 24 to the participant’s closest VL reveals a totalof 551 participants (76.5%) had their closest VL within 6 months (180 days) before or 2 months
Table 1. The baseline calculated geometric mean (GM) viral load (VL), GM VL 95% confidence interval (CI), and proportion of all visits for all partici-pants with VL <200 (suppressed) after baseline for each characteristic.
Characteristic Baseline VL copies/mL (N = 720) Proportion of Records with VL <200 after Baseline (N = 4679)
N GM VL GM VL 95% CI VL <200 (n = 2443) VL �200 (n = 2236) Percent
Overall 720 9975 8436, 11795 2443 2236 52.2
Age (years)
18–29 106 15838 10262, 24443 375 321 53.9
30–39 172 12748 9065, 17927 528 522 50.3
40+ 441 8101 6548, 10021 1540 1385 52.6
Missing 1 0 8 0.0
Sex
Male 458 11627 9436, 14327 1594 1318 54.7
Female 261 7490 5681, 9876 849 906 48.4
Transgender 1 0 12 0.0
Race / Ethnic
White 80 9456 5723, 15624 300 167 64.2
Black 527 10754 8844, 13076 1727 1763 49.5
Other 21 7394 2777, 19686 77 57 57.5
Hispanic 92 7273 4555, 11612 339 249 57.7
ART Baseline
Yes 414 6157 4970, 7628 2308 1873 55.2
No 306 19159 14933, 24581 135 363 27.1
doi:10.1371/journal.pone.0130090.t001
Methods for Analyzing Viral Load Data in Studies of HIV Patients
PLOS ONE | DOI:10.1371/journal.pone.0130090 June 19, 2015 6 / 16

(60 days) after month 24, including 232 (32.2%) within 30 days (Fig 2). Of the 169 participants(23.5% of 720) with their closest VL before 6 months prior to month 24, there were 106 (14.7%of 720)>360 days from month 24. Of the 106 participants with their closest VL>360 daysfrom month 24 there were 53 (7.4%) who had their closest VL to month 24 within 6 months ofbaseline. The median time from month 24 to the participant’s closest VL was 28 days prior tomonth 24 (IQR -144, 14).
Analysis results for modeling VL suppression using the SMVL framework (omit-partici-pant, set-to-failure, closest-VL) and RMVL framework (repeat-binary, repeat-continuous) arepresented in Tables 2 and 3, respectively. Under the SMVL framework, the omit-participantmethod used 551 (76.5%) of the 720 participants who had a VL measurement within the “win-dow” around month 24; whereas set-to-failure and closest-VL methods used all 720 partici-pants (Fig 2). Under the RMVL framework, both the repeat-binary and the repeat-continuousused the 720 participants’ baseline VL measurements and all 4679 VL post-enrollment mea-surements. There was substantial variability among the methods using the SMVL frameworkfor the estimated percent of participants who were virally suppressed at month 24. The esti-mated percentage and associated 95% CI for VL suppression at month 24 were omit-partici-pant 58.8 (54.8, 63.1), set-to-failure 45.0 (41.5, 48.8), and closest-VL 54.2 (50.7, 57.9). The
Fig 2. The retention in care (RIC) study distribution of each participant’s closest VL copies/mL to month 24, where zero represents month 24. Thereare 551 (76.5%) participants who have their closest VL within 6 months of month 24 and 232 (32.2%) whose closest VL is within 30 days.
doi:10.1371/journal.pone.0130090.g002
Methods for Analyzing Viral Load Data in Studies of HIV Patients
PLOS ONE | DOI:10.1371/journal.pone.0130090 June 19, 2015 7 / 16

repeat-binary and repeat-continuous methods using the RMVL framework had similar VLsuppression percent estimates of 58.5 (55.2, 61.9) and 56.7 (55.3, 59.2), respectively. Moreover,
Table 2. The estimated number and percentage of participants virally suppressed (VL <200) at month 24 using the omit-participant, set-to-failure,and closest-VL analysis performed within the SMVL framework using data from the RIC study.
Characteristic Omit-participant (N = 551) Set-to-Failure (N = 720) Closest-VL (N = 720)
NumberVL <200
Percent(95% CI)
RiskRatio(RR)
RR95% CI
NumberVL <200
Percent(95% CI)
RiskRatio(RR)
RR95%CI
NumberVL <200
Percent(95% CI)
RiskRatio(RR)
RR95%CI
Overall 324 58.8 (54.8,63.1)
NA NA 324 45.0(41.5,48.8)
NA NA 390 54.2(50.7,57.9)
NA NA
Age (years)
18–29 35 47.9 (36.8,59.3)
REF 35 33.0(24.8,42.5)
REF 46 43.4(34.3,53.0)
REF
30–39 73 57.9 (49.2,66.2)
1.21 0.91,1.60
73 42.4(35.3,49.9)
1.29 0.93,1.77
91 52.9(45.4,60.3)
1.22 0.94,1.58
40+ 216 61.5 (56.3,66.5)
1.28 0.997,1.65
216 49.0(44.3,53.6)
1.48 1.11,1.98
253 57.4(52.7,61.9)
1.32 1.05,1.67
Race / Ethnic
White 41 70.7 (57.8,80.9)
REF 41 51.3(40.4,62.0)
REF 51 63.8(52.7,73.5)
REF
Black 226 55.0(50.2,59.7)
0.78 0.65,0.94
226 42.9(38.7,47.2)
0.84 0.66,1.06
270 51.2(47.0,55.5)
0.80 0.67,0.97
Other 10 76.9 (47.9,92.4)
0.96 0.76,1.21
10 47.6(27.9,68.2)
0.93 0.57,1.53
12 57.1(36.0,76.0)
0.90 0.60,1.34
Hispanic 47 68.1 (56.3,78.0)
1.09 0.77,1.53
47 51.1(41.0,61.1)
1.00 0.74,1.34
57 62.0(51.7,71.3)
0.97 0.77,1.22
ART Baseline
Yes 181 57.1 (51.6,62.4)
0.93 0.81,1.07
181 43.7(39.0,48.5)
0.94 0.80,1.10
216 52.2(47.4,57.0)
0.92 0.80,1.05
No 143 61.1 (54.7,67.2)
REF 143 46.7(41.2,52.3)
REF 174 56.9(51.3,62.3)
REF
ART Baseline+ 12 months
Yes 294 60.5 (56.1,64.8)
1.31 0.998,1.72
294 46.2(42.4,50.1)
1.29 0.96,1.75
357 56.1(52.3,59.9)
1.43 1.09,1.88
No 30 46.2 (34.5,58.3)
REF 30 35.7(26.2,46.5)
REF 33 39.3(29.5.50.1)
REF
The ART baseline and ART baseline +12 months are defined as the participant being on ART at the start of the study and either at the start of study or the
first 12 months of the study, respectively.
Notes: The omit-participant method removes participants from the analysis who do not have a VL within the 12-month “window” (-6/+2 months) around
month 24. The set-to-failure method sets all VL for those participants without a VL measurement within the “window” to non-suppressed (failure). Lastly,
the closest-VL method uses the closest VL measurement for each participant to month 24.
doi:10.1371/journal.pone.0130090.t002
Methods for Analyzing Viral Load Data in Studies of HIV Patients
PLOS ONE | DOI:10.1371/journal.pone.0130090 June 19, 2015 8 / 16
the 95% CI width was substantially smaller using the RMVL framework repeat-continuousmethod.
Results for the methods using the SMVL and RMVL frameworks illustrate that the repeat-continuous method provided a substantial gain in power compared to all other consideredmethods (S1 and S2 Tables). We compared the VL suppression proportion’s 95% CI width forthe omit-participant, set-to-failure, closest-VL, and repeat-binary methods to the repeat-con-tinuous method as the reference. The overall proportion suppressed CI width ratio rangedfrom 1.72 (binary-repeat) to 2.12 (omit-participant). For the age and race/ethnicity subgroups,the CI width ratio ranged from 1.81 (closest-VL; Hispanic) to 3.11 (omit-participant; otherrace). In general, the proportion suppressed CI width ratios for the omit-participant, set-to-failure, closest-VL, and repeat-binary were similar to each other and the proportion suppressedCI width was substantially wider than the repeat-continuous CI width. The repeat-binary hadthe smallest CI width ratio compared to repeat-continuous method except for the comparisonof other race versus white, where it is 1.84 and the omit-participant is 1.80, which indicates therepeat-binary generally improves the precision compared to the SMVL methods. The CI widthratio ranged from 1.80 (omit-participant; other race versus white) to 5.12 (set-to-failure; 40+ versus 18–29). Set-to-failure had the highest CI width ratio (range: 3.64–5.12) in all compari-sons except for Hispanic versus white, where the omit-participant method had the highest CIwidth ratio (4.22).
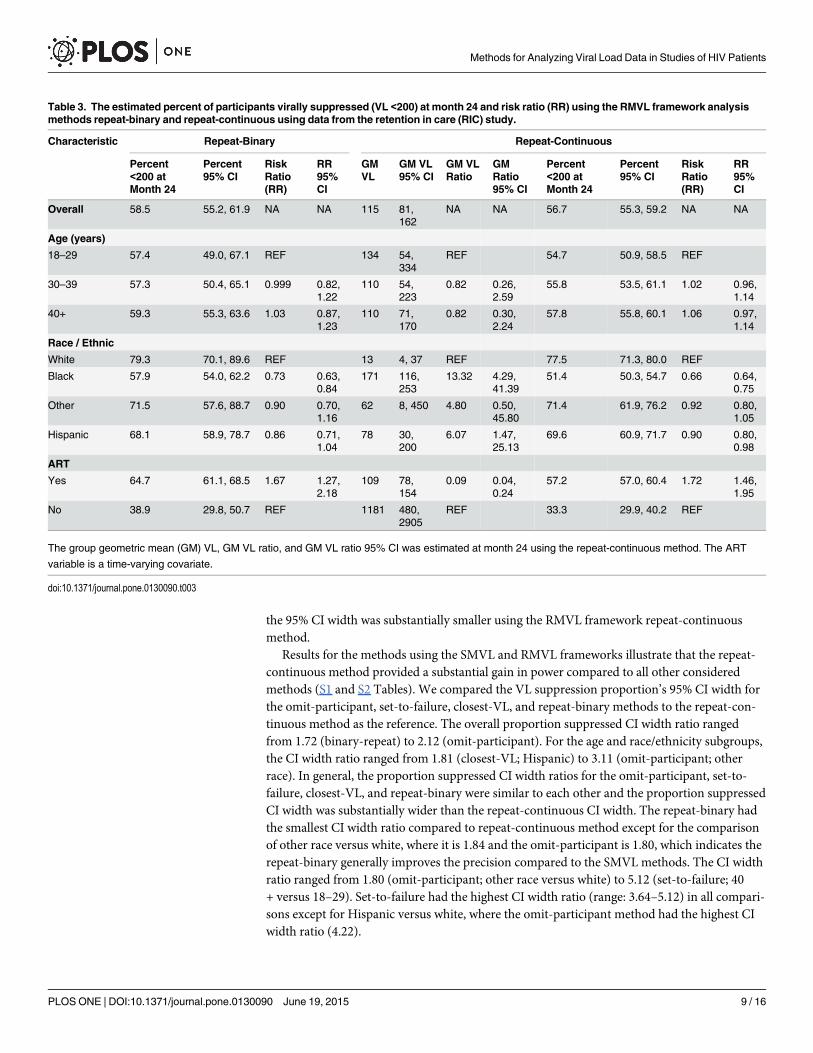
Table 3. The estimated percent of participants virally suppressed (VL <200) at month 24 and risk ratio (RR) using the RMVL framework analysismethods repeat-binary and repeat-continuous using data from the retention in care (RIC) study.
Characteristic Repeat-Binary Repeat-Continuous
Percent<200 atMonth 24
Percent95% CI
RiskRatio(RR)
RR95%CI
GMVL
GM VL95% CI
GM VLRatio
GMRatio95% CI
Percent<200 atMonth 24
Percent95% CI
RiskRatio(RR)
RR95%CI
Overall 58.5 55.2, 61.9 NA NA 115 81,162
NA NA 56.7 55.3, 59.2 NA NA
Age (years)
18–29 57.4 49.0, 67.1 REF 134 54,334
REF 54.7 50.9, 58.5 REF
30–39 57.3 50.4, 65.1 0.999 0.82,1.22
110 54,223
0.82 0.26,2.59
55.8 53.5, 61.1 1.02 0.96,1.14
40+ 59.3 55.3, 63.6 1.03 0.87,1.23
110 71,170
0.82 0.30,2.24
57.8 55.8, 60.1 1.06 0.97,1.14
Race / Ethnic
White 79.3 70.1, 89.6 REF 13 4, 37 REF 77.5 71.3, 80.0 REF
Black 57.9 54.0, 62.2 0.73 0.63,0.84
171 116,253
13.32 4.29,41.39
51.4 50.3, 54.7 0.66 0.64,0.75
Other 71.5 57.6, 88.7 0.90 0.70,1.16
62 8, 450 4.80 0.50,45.80
71.4 61.9, 76.2 0.92 0.80,1.05
Hispanic 68.1 58.9, 78.7 0.86 0.71,1.04
78 30,200
6.07 1.47,25.13
69.6 60.9, 71.7 0.90 0.80,0.98
ART
Yes 64.7 61.1, 68.5 1.67 1.27,2.18
109 78,154
0.09 0.04,0.24
57.2 57.0, 60.4 1.72 1.46,1.95
No 38.9 29.8, 50.7 REF 1181 480,2905
REF 33.3 29.9, 40.2 REF
The group geometric mean (GM) VL, GM VL ratio, and GM VL ratio 95% CI was estimated at month 24 using the repeat-continuous method. The ART
variable is a time-varying covariate.
doi:10.1371/journal.pone.0130090.t003
Methods for Analyzing Viral Load Data in Studies of HIV Patients
PLOS ONE | DOI:10.1371/journal.pone.0130090 June 19, 2015 9 / 16

The repeat-continuous method was the only method considered that can estimate the VL,both the individual and group GM, and results revealed that the lowest estimated GM VL atmonth 24 for age, race/ethnicity, and ART are age classes 30–39 and 40+ (110, 95% CI of 54–223 and 71–170, respectively), whites (13, 95% CI: 4, 37), and on ART (109, 95% CI 78–154)(Table 3). In addition, the ART “no” is the only considered characteristic with an estimatedGM VL at month 24>200 copies (1181; 95% CI: 480, 2905). We summarized the predictedparticipant-specific slopes and viral suppression at month 24 using box plots and descriptivestatistics (Fig 3). Box plots revealed that white race (compared to black and Hispanic) and ARTbaseline+12m (compared to no ART at baseline or during the first 12 months) had substan-tially lower estimated median GM VL at month 24. Those participants not on ART at baselineor within 12 months (compared to using ART during first 12 months) and black race (com-pared to the other race/ethnicity groups) had the highest percent of participants with VL>200at month 24, 66.7% and 48.6%, respectively. Box plots illustrated the percent of participants bycharacteristic that had a slope>0 (positive slope indicates their VL is increasing over time).The factors with the greatest percentage of participants with a slope>0 were black (15.0) andage 18–29 (38.7) with white (2.5) and not on ART (3.6) having the smallest percentage of par-ticipants with a positive slope. White race and not being on ART had the steepest, i.e., mostnegative, median slope, which means they had the greatest rate of change in GM VL from base-line to month 24. Lastly, we summarized the repeat-continuous model results for the GM VLchange over time by characteristic (Fig 4). There was substantial variability among the partici-pant’s estimated GM VL slopes for race/ethnicity. Furthermore, the participants who werenever on ART failed to have their estimated GM VL reach the threshold (VL<200) by month24. The estimated time to the threshold (VL< 200) for the GM VL was shortest for race white(11.6 months), Hispanic (16.3 months), and “other” race (16.9 months), whereas the longesttimes to threshold, in months, were for patients not on ART (37.3) and black (22.6).
DiscussionWe investigated two general frameworks for analyzing VL data. One was a repeated measuresviral load (RMVL) framework, and the other was a single measure viral load (SMVL) frame-work. Our investigation demonstrated the RMVL framework performed exceptionally wellusing data from a RIC trial that enrolled participants who had not been attending clinic regu-larly. Hence, the RMVL framework performed exceptionally well for participants who likelyhave more sporadic VL data, i.e., few VL measurements over time compared to participantswho are currently engaged in care, which further demonstrates the value of the RMVL frame-work. The RMVL framework has an advantage over the SMVL framework because it utilizesall available baseline and follow-up VL information for all participants. Moreover, in contrastto the three SMVL methods and the RMVL repeat-binary method, which can only estimate theproportion of participants that are virally suppressed, the repeat-continuous method of theRMVL framework can also estimate the VL for each participant as well as the GM VL. Further-more, the repeat-continuous method allows us to obtain the estimated VL change over time(slope) for each participant in addition to the GM VL slope. The RMVL framework is flexibleand nullifies the necessity of specifying an arbitrary “window” to estimate the GM VL and / orVL suppression at the specified follow-up time, which eliminates the need to define the statusof participants lacking a VL measurement within the “window.” Furthermore, the RMVLframework can provide an estimate of the GM VL or proportion virally suppressed throughoutthe range of the follow-up time period.
Methods that analyze VL suppression within the SMVL framework have few advantages butseveral disadvantages. The primary advantage of the SMVL framework using a dichotomous
Methods for Analyzing Viral Load Data in Studies of HIV Patients
PLOS ONE | DOI:10.1371/journal.pone.0130090 June 19, 2015 10 / 16

Fig 3. Box plots by characteristic for the participants predicted VLs at month 24 and rate of change (slope). The shaded box represents the 25th and75th percentiles, while the vertical line and diamond within the shaded box are the median and mean, respectively. The upper and lower arms, represented byvertical lines, are the 2.5 and 97.5 percentiles, and dots outside these arms are considered outliers.
doi:10.1371/journal.pone.0130090.g003
Methods for Analyzing Viral Load Data in Studies of HIV Patients
PLOS ONE | DOI:10.1371/journal.pone.0130090 June 19, 2015 11 / 16

outcome variable is the simplicity of the analysis using any software package. There are severaldisadvantages of the SMVL framework compared to the RMVL framework. First, when usingthe SMVL framework and analyzing a single follow-up VL measurement with a suppressionthreshold we are grouping participants marginally>200 copies/mL with participants who mayhave large values for VL, which may be clinically questionable. Second, a loss of power gener-ally results when discarding repeated VL measurements and analyzing only one VL
Fig 4. The predicted geometric mean (GM) by characteristic using the pdf-cdf random effects model plotted on the VL and log10(VL) scales. Thehorizontal line is the defined level of suppression (<200 copies/mL).
doi:10.1371/journal.pone.0130090.g004
Methods for Analyzing Viral Load Data in Studies of HIV Patients
PLOS ONE | DOI:10.1371/journal.pone.0130090 June 19, 2015 12 / 16

measurement per participant [21]. Even if all participants have only one follow-up VL mea-surement within the “window” or exactly at the ending follow-up time there would likely be aloss of power due to dichotomizing a continuous variable [22, 23]. Third, investigators have todetermine how to analyze, if at all, VL measurements outside the “window.” All methods ana-lyzing VL as a dichotomous suppressed or not suppressed outcome are limited to only estimat-ing the proportion suppressed. The repeat-binary, unlike the SMVL methods, can estimate theproportion suppressed at any point over the range of the follow-up times and estimates therate of change in viral suppression. Two additional methods recently used within the SMVLframework include time to VL suppression and viremia copy-years (VCY) [24]. However, bothof these methods either collapse multiple VL measurements per participant into a single VLmeasure (VCY) or ignore the repeated VL measurements by modeling the time to first VLsuppression.
All considered methods within the SMVL framework, whether using a “window” or not,assume that the participant’s observed VL is a reasonable prediction of the participant’s VL atthe desired follow-up time. Although not normally stated, the participant’s VL within the “win-dow” or the closest-VL is a prediction for the specified follow-up time-point. The omit-partici-pant method may appeal to analysts because of its simplicity, but the method discardsinformation on participants who lack a VL measurement within the “window.”Hence, theomit-participant method discards participants from the analysis who may have�1 follow-upVL measurements (Fig 1) but lack a VL within the “window,” which may result in an additionalloss of power due to a decrease in the sample size. In addition, the omit-participant analysisignores potential differences between participants with and without a VL within the “window,”and the resulting inference based only on participants with a VL within the “window”may notbe applicable to the entire participant population. This problem is especially important forobservational studies assessing viral suppression where participants being lost over time maybe informative. The set-to-failure method assumes all participants lacking a VL within thespecified “window” are VL suppression failures, which is likely to misclassify some participants.For example, in our data analysis there are 169 (23.5%) of the 720 participants without a VLwithin the “window” (Fig 2). However, of these 169 participants 66 (39.1%) were virally sup-pressed at their last follow-up VL measurement, which suggests that some of the 169 partici-pants would be virally suppressed if they had a VL measurement within the “window.” Inaddition, the set-to-failure method may substantially reduce the estimated proportion sup-pressed as all failure participants would contribute to the denominator but the number of suc-cessful suppressions would remain unchanged from the omit-participant method. Moreover,the set-to-failure method for our data tends to have the largest estimated SE, making themethod less likely to detect significant differences. The closest-VL method has a disadvantagein that some of the VL measurements may be far from the desired follow-up time, e.g., in ourdata the closest VL for 105 of 169 (62.1%) participants was greater than one year prior to thedesired month 24 post-enrollment follow-up. This leads to questionable validity about usingthese VL measurements as predictions at month 24. Regardless of analytical method, only hav-ing VL measurements far from the specified follow-up time for some participants may be aconcern.
The analytical method(s) selected by an investigator should be based on study question(s)and available, or to be collected, data. Our results illustrate there can be substantial differencesbased on the selected HIV VL analytical method for the estimated percent suppressed, RR, andassociated 95% CIs among the three SMVL methods, with more consistent results between thetwo RMVL methods (Tables 2 and 3). Differences in the SMVL methods results will increase asthe proportion of patients with a VL measurement outside the “window” increases. As anexample, results revealed substantial differences among the methods for the age 40+ compared
Methods for Analyzing Viral Load Data in Studies of HIV Patients
PLOS ONE | DOI:10.1371/journal.pone.0130090 June 19, 2015 13 / 16
to 18–29 RR as the set-to-failure and closest-VL are significant, borderline significance foromit-participant, and far from significant for the repeat-binary and repeat-continuous RMVLmethods (p>0.50). Given these significant results for the age 40+ compared to 18–29 RR itmay be tempting to select one or all of the SMVL methods but it is inappropriate to choose ananalysis method based on which analysis provides significant findings and the analysis methodshould be carefully determined a priori.
Use of the SMVL and RMVL frameworks may result in substantial differences for the esti-mated proportion suppressed (Tables 2 and 3). For example, the proportion of participantsages 18–29 with suppressed VL for the omit-participant (47.9), set-to-failure (33.0), and clos-est-VL (43.4) compared to repeat-binary (57.4) and repeat-continuous (54.7) are substantiallydifferent. In addition, the data selected for analysis, i.e., suppressed or not suppressed, usingthe SMVL method can be dramatically altered by changing the “window” interval and / or fol-low-up time. Results reveal there are 12 participants in the age class 18–29 who are classified assuppressed using the repeat-continuous method but are classified as not suppressed using theSMVL methods (S1 Fig). Data for these 12 participants reveal the pitfalls of the SMVL frame-work due to choosing a single VL measurement per person to summarize VL suppression. Forexample, if the specified post-enrollment follow-up time were changed to month 18 frommonth 24, then five of these 12 participants would have their VL classified as suppressed.
In summary, the RMVL framework eliminates the need to define a “window” and is a natu-ral modeling framework for characterizing VL measurements over time and predicting the pro-portion of virally suppressed participants at a specified follow-up time. The RMVL frameworkis flexible, can accommodate a wide variety of models within the frequentist and Bayesian para-digms, and generally has greater statistical power than models within the SMVL framework.We generally recommend the RMVL framework if there are multiple VL measurements perparticipant and not the SMVL framework because of a loss of power, discarding of informa-tion, subjectivity in defining a “window,” and investigators having to decide how to handle par-ticipants with VL measurements outside the “window.”
Supporting InformationS1 Appendix. Details for all models and SAS code. The statistical details for all models usingthe single measure and repeated measures viral load (VL) frameworks. The SAS code for fittingthe repeat-continuous model subject to limit of detection VL values.(DOCX)
S1 Fig. Viral load measurements over time. The 12 aged 18–29 participants for the threeSMVL framework analyses (omit-participant, set-to-failure, closest-VL) that are analyzed asnon-suppressed or set to missing and are predicted as suppressed using the RMVL repeat-con-tinuous model at month 24. The triangles represent values used for the SMVL analyses and the“window” is from 540–780 days. Triangles not within the “window” are set to missing (omit-participant) or failure (set-to-failure) or non-suppressed (closest-VL method).(TIF)
S1 Table. Viral suppression among study participants. The percent of the RIC study partici-pants with virologic suppression, percent 95% CI, 95% CI width, and CI width ratio at month24 using the SMVL (omit-participant, set-to-failure, closest-VL) and RMVL (repeat-binary,repeat-continuous) frameworks.(DOCX)
S2 Table. Viral suppression risk ratios by method. The estimated viral suppression riskratio (RR), RR 95% CI, RR 95% CI width, and CI width ratio at month 24 using the SMVL
Methods for Analyzing Viral Load Data in Studies of HIV Patients
PLOS ONE | DOI:10.1371/journal.pone.0130090 June 19, 2015 14 / 16

(omit-participant, set-to-failure, closest-VL) and RMVL (repeat-binary, repeat-continuous)frameworks.(DOCX)
AcknowledgmentsWe are grateful to the interventionists, coordinators, and support staff listed in the S1 Appen-dix, without whom the study would not have been possible.
Disclaimer: The findings and conclusions in this manuscript are those of the authors and donot necessarily represent the views of the Centers for Disease Control and Prevention.
Author ContributionsConceived and designed the experiments: CR LG GM. Performed the experiments: CR LGGM. Analyzed the data: CR LG GM. Wrote the paper: CR LG JC SG AJWMD J. Davila J.DeHovitz JK AOWGM.
References1. Clumeck N, Molina JM, Henry K, Gathe J, Rockstroh JK, DeJesus E, et al. A randomized double-blind
comparison of single-tablet regimen elvitegravir/cobicistat/emtricitabine/tenofovir DF vs ritonovir-boosted atazanavir plus emtricitabine/tenofovir DF for initial treatment of HIV-1 infection: analysis ofweek 144 results. J Acquir Immune Defic Syndr. 2013; 65: e121–e124.
2. Zolopa A, Sax PE, DeJesus E, Mills A, Cohen C, Wohl D, et al. A randomized double–blind comparisonof coformulated elvitegravir/cobicistat/emtricitabine/tenofovir disoproxil fumarate versus efavirenz/emtricotabine/tenofovir disoproxil fumarate for initial treatment of HIV-1 Infection: analysis of week 96results. J Acquir Immune Defic Syndr. 2013; 63(1): 96–100. doi: 10.1097/QAI.0b013e318289545cPMID: 23392460
3. Koenig L, Pals S, Palmore M, Stratford D, Ellerbrock T. Randomized controlled trial of an intervention toprevent adherence failure among HIV-infected patients initiating antiretroviral therapy. Health Psychol-ogy. 2008; 27: 159–169. doi: 10.1037/0278-6133.27.2.159 PMID: 18377134
4. Gill V, Lima V, ZhangW, Wynhoven B, Yip B, Hogg R, et al. Improved virological outcomes in BritishColumbia concomitant with decreasing incidence of HIV type 1 drug resistance detection. Clinical Infec-tious Diseases. 2010; 50(2):98–105.
5. Moore R, Bartlett J. Dramatic decline in the HIV RNA level over calendar time in a large urban HIV prac-tice. Clinical Infectious Diseases. 2011; 53: 600–604. doi: 10.1093/cid/cir467 PMID: 21844006
6. Yehia B, Fleishman J, Metlay J, Moore R, Gebo K. Sustained viral suppression in HIV-infected patientsreceiving antiretroviral therapy. JAMA. 2012; 308: 339–342. doi: 10.1001/jama.2012.5927 PMID:22820781
7. Mugavero M, Westfall A, Zinski A, Davila J, Drainoni M, Gardner LI, et al. Measuring Retention in HIVCare: The elusive gold standard. J Acquir Immune Defic Syndr. 2012; 61: 574–580. doi: 10.1097/QAI.0b013e318273762f PMID: 23011397
8. Buscher A, Mugavero M, Westfall A, Keruly J, Moore R, Drainoni ML, et al. The association of clinicalfollow-up intervals in HIV-infected persons with viral suppression on subsequent viral suppression.AIDS Pt Care and STDs. 2013; 27: 459–466. doi: 10.1089/apc.2013.0105 PMID: 23886048
9. Howard A, Arnsten J, Lo Y, Vlahov D, Rich J, Schuman P, et al. A prospective study of adherence andviral load in a large multi-center cohort of HIV-infected women. AIDS. 2002; 16(16): 2175–2182. PMID:12409739
10. Lucas G, Chaisson R, Moore R. Highly active antiretroviral therapy in a large urban clinic: risk factorsfor virologic failure and adverse drug reactions. Ann Intern Med. 1999; 131: 81–87. PMID: 10419445
11. Ledergerber B, Efer M, Opravil M, Telenti A, Hirschel B, Battegay M, et al. Clinical progression and viro-logical failure on highly active antiretroviral therapy in HIV-1 patients: a prospective study. Lancet.1999; 353: 863–868. PMID: 10093977
12. Gale HB, Rodriguez MD, Hoffman HJ, Benator DA, Gordin FM, Labriola AM, et al. Progressed realized:Trends in HIV-1 viral load and CD4 cell count in a tertiary-care center from 1999 through 2011. PLoSOne. 2013; 8(2): e56845. doi: 10.1371/journal.pone.0056845 PMID: 23437255
Methods for Analyzing Viral Load Data in Studies of HIV Patients
PLOS ONE | DOI:10.1371/journal.pone.0130090 June 19, 2015 15 / 16

13. Centers for Disease Control and Prevention (CDC). Vital signs: HIV prevention through care and treat-ment—United States. MMWRMorb Mortal Wkly Rep. 2011; 60:1618–1623. PMID: 22129997
14. Dombrowshi J, Kent J, Buskin S, Stekler J, Golden M. Population-based metrics for the timing of HIVdiagnosis, engagement in HIV care, and virologic suppression. AIDS. 2012; 26: 77–86. doi: 10.1097/QAD.0b013e32834dcee9 PMID: 22008656
15. Thiebaut R., Jacqmin-Gadda H. Mixed models for longitudinal left-censored repeated measures. Com-puter Methods and Programs in Biomedicine. 2004; 74: 255–260. PMID: 15135576
16. Tobin J. Estimation of relationships for limited dependent variables. Econometrica. 1958; 26: 24–36.
17. Amemiya T. Regression analysis when the dependent variable is truncated normal. Econometrica.1973; 41: 997–1016.
18. Efron B. Bootstrap methods: Another look at the jackknife. The Annals of Statistics. 1979; 7 (1): 1–26.
19. Gardner LI, Giordano TP, Marks G, Wilson TE, Craw JA, Drainoni ML, et al. Enhanced personal contactwith HIV patients improves retention in primary care: a randomized trial in 6 US HIV Clinics. ClinicalInfectious Diseases. 2014; 59(5): 725–734. doi: 10.1093/cid/ciu357 PMID: 24837481
20. SAS Institute Inc. SAS/STAT 9.3 user’s guide. Cary, NC: SAS Institute Inc., 2011.
21. Borkowf CB, Lee Johnson L, Albert PS. Power and Sample Size Calculations. In: Gallin JI, OgnibeneFP. Principles and Practice of Clinical Research. Elsevier Inc.: Academic Press; 2012. pp. 271–283.
22. Wiegand RE, Rose CE, Karon JM. Comparison of models for analyzing two-group, cross-sectionaldata with a Gaussian outcome subject to a detection limit. Stat Methods Med Res. 2014;epubMay.
23. Altman DG, Royston P. The cost of dichotomising continuous variables. British Medical Journal. 2006;332: 1080. PMID: 16675816
24. Mugavero MJ, Amico KR, Westfall AO, Crane HM, Zinski A, Willig JH, et al. Early retention in HIV careand viral load suppression: Implications for a test and treat approach to HIV prevention. J AcquirImmune Defic Syndr. 2012; 59(1): 86–93. doi: 10.1097/QAI.0b013e318236f7d2 PMID: 21937921
Methods for Analyzing Viral Load Data in Studies of HIV Patients
PLOS ONE | DOI:10.1371/journal.pone.0130090 June 19, 2015 16 / 16