Comparison of human immunodeficiency virus assays in window phase and elite controller samples:...
15
HIV Comparison of human immunodeficiency virus assays in window phase and elite controller samples: viral load distribution and implications for transmission risk Marion Vermeulen, Charl Coleman, Josephine Mitchel, Ravi Reddy, Harry van Drimmelen, Tracy Fickett, Michael Busch, and Nico Lelie BACKGROUND: After 3 years of individual-donation nucleic acid test (ID-NAT) screening by the South African National Blood Service (SANBS), a repository of 73 human immunodeficiency virus antibody (anti-HIV)- negative window period (WP)-yield samples and 28 anti-HIV–positive, HIV-RNA–negative elite controllers (ECs) became available for comparison of a p24 antigen (p24 Ag) assay (Innogenetics), two viral load assays (Siemens branch DNA [bDNA] 3.0 and Abbott real-time polymerase chain reaction [RT-PCR]), and three triplex NAT assays (Novartis Diagnostics Ultrio and Ultrio-Plus and Roche TaqScreen) by replicate testing of dilutions. STUDY DESIGN AND METHODS: Viral loads were assessed by bDNA and RT-PCR assays and if below 100 copies (cps)/mL, by Ultrio limiting dilution probit analysis. The probability of virus transmission by WP and EC donations was estimated for different levels of the 50% minimum infectious dose (ID50) using Poisson distribution statistics. RESULTS: The equal distribution of WP donations plotted by log HIV-RNA levels indicated a random appearance of donors in the ramp-up phase. The HIV p24 Ag assay detected 45% of WP samples and the cutoff crossing point was estimated at 8140 (bDNA)/ 22,710 (RT-PCR) cps/mL. On replicate retesting of 40 HIV p24 Ag–negative ID-NAT WP-yield samples Ultrio minipool (MP)8, Ultrio-Plus MP8, and TaqScreen MP6 detected 79, 81, and 78%, respectively. Modeling with an estimated ID50 of 31.6 virions/RBC indicated that 15% of p24 Ag–negative ID-NAT WP-yield donations would have transmitted HIV if MP6-8 NAT had been used. Only 2% of RBC transfusions from ECs are esti- mated to be infectious with a worst-case ID50 estimate of 316 virions. CONCLUSION: Our analysis of viremia and infectivity of WP and EC donations enables comparison of the efficacy of NAT options in preventing HIV transmission risk. S imultaneous screening of 2,147,446 South African blood donations over a 3-year period for human immunodeficiency virus (HIV)-RNA by individual-donation nucleic acid testing (ID- NAT) and anti-HIV by chemiluminescence immunoassay has detected a total of 3067 HIV-positive donations, which can be distinguished into three categories of infections: 1 1) 2965 concordantly HIV-RNA and antibody-reactive donors (96.7%); 2) 81 antibody-negative, HIV-RNA– positive window period (WP) donations (2.6%); and 3) 21 anti-HIV–positive donors with undetectable HIV-RNA, so-called elite controllers (ECs; 2 0.7%). The latter two cat- egories of infection require further confirmatory testing, that is, ideally ID-NAT and anti-HIV on a follow-up sample along with viral load and p24 antigen (Ag) testing as well as replicate triplex NAT or discriminatory (d)HIV assays for the NAT-yield samples and Western blot assay and ABBREVIATIONS: bDNA = branch DNA; cps = copies; dHIV = discriminatory human immunodeficiency virus (assay); EC(s) = elite controller(s); ID = individual donation; ID50 = 50% minimum infectious dose; LOD(s) = limit(s) of detection; MP = minipool; N50 = 50% minimum infectious dose; p24 Ag = p24 antigen; SANBS = South African National Blood Service; S/CO = signal-to-cutoff ratio; SIV = simian immunodeficiency virus; WP(s) = window period(s). From the South African National Blood Service (SANBS), Johannesburg, South Africa; BioQControl, DDL Laboratories, Rijswijk, the Netherlands; Creative Testing Solutions, Tampa, Florida; Blood Systems Research Institute, San Francisco, California; and Lelie Research Paris, Paris, France. Address reprint requests to: Marion Vermeulen, 1 Constantia Boulevard, Constantiakloof, Roodepoort 1709, South Africa; e-mail: [email protected]. This study was funded by Novartis Diagnostics. Received for publication June 29, 2012; revision received December 4, 2012, and accepted December 4, 2012. doi: 10.1111/trf.12117 TRANSFUSION 2013;53:2384-2398. 2384 TRANSFUSION Volume 53, October 2013
-
Upload
independent -
Category
Documents
-
view
0 -
download
0
Transcript of Comparison of human immunodeficiency virus assays in window phase and elite controller samples:...

H I V
Comparison of human immunodeficiency virus assays in windowphase and elite controller samples: viral load distribution and
implications for transmission risk
Marion Vermeulen, Charl Coleman, Josephine Mitchel, Ravi Reddy, Harry van Drimmelen,
Tracy Fickett, Michael Busch, and Nico Lelie
BACKGROUND: After 3 years of individual-donationnucleic acid test (ID-NAT) screening by the SouthAfrican National Blood Service (SANBS), a repository of73 human immunodeficiency virus antibody (anti-HIV)-negative window period (WP)-yield samples and 28anti-HIV–positive, HIV-RNA–negative elite controllers(ECs) became available for comparison of a p24antigen (p24 Ag) assay (Innogenetics), two viral loadassays (Siemens branch DNA [bDNA] 3.0 and Abbottreal-time polymerase chain reaction [RT-PCR]), andthree triplex NAT assays (Novartis Diagnostics Ultrioand Ultrio-Plus and Roche TaqScreen) by replicatetesting of dilutions.STUDY DESIGN AND METHODS: Viral loads wereassessed by bDNA and RT-PCR assays and if below100 copies (cps)/mL, by Ultrio limiting dilution probitanalysis. The probability of virus transmission by WPand EC donations was estimated for different levels ofthe 50% minimum infectious dose (ID50) using Poissondistribution statistics.RESULTS: The equal distribution of WP donationsplotted by log HIV-RNA levels indicated a randomappearance of donors in the ramp-up phase. The HIVp24 Ag assay detected 45% of WP samples and thecutoff crossing point was estimated at 8140 (bDNA)/22,710 (RT-PCR) cps/mL. On replicate retesting of 40HIV p24 Ag–negative ID-NAT WP-yield samples Ultriominipool (MP)8, Ultrio-Plus MP8, and TaqScreen MP6detected 79, 81, and 78%, respectively. Modeling withan estimated ID50 of 31.6 virions/RBC indicated that15% of p24 Ag–negative ID-NAT WP-yield donationswould have transmitted HIV if MP6-8 NAT had beenused. Only 2% of RBC transfusions from ECs are esti-mated to be infectious with a worst-case ID50 estimateof 316 virions.CONCLUSION: Our analysis of viremia and infectivityof WP and EC donations enables comparison of theefficacy of NAT options in preventing HIV transmissionrisk.
Simultaneous screening of 2,147,446 SouthAfrican blood donations over a 3-year period forhuman immunodeficiency virus (HIV)-RNA byindividual-donation nucleic acid testing (ID-
NAT) and anti-HIV by chemiluminescence immunoassayhas detected a total of 3067 HIV-positive donations, whichcan be distinguished into three categories of infections:1
1) 2965 concordantly HIV-RNA and antibody-reactivedonors (96.7%); 2) 81 antibody-negative, HIV-RNA–positive window period (WP) donations (2.6%); and 3) 21anti-HIV–positive donors with undetectable HIV-RNA,so-called elite controllers (ECs;2 0.7%). The latter two cat-egories of infection require further confirmatory testing,that is, ideally ID-NAT and anti-HIV on a follow-up samplealong with viral load and p24 antigen (Ag) testing as well asreplicate triplex NAT or discriminatory (d)HIV assaysfor the NAT-yield samples and Western blot assay and
ABBREVIATIONS: bDNA = branch DNA; cps = copies;
dHIV = discriminatory human immunodeficiency virus (assay);
EC(s) = elite controller(s); ID = individual donation; ID50 = 50%
minimum infectious dose; LOD(s) = limit(s) of detection;
MP = minipool; N50 = 50% minimum infectious dose;
p24 Ag = p24 antigen; SANBS = South African National Blood
Service; S/CO = signal-to-cutoff ratio; SIV = simian
immunodeficiency virus; WP(s) = window period(s).
From the South African National Blood Service (SANBS),
Johannesburg, South Africa; BioQControl, DDL Laboratories,
Rijswijk, the Netherlands; Creative Testing Solutions, Tampa,
Florida; Blood Systems Research Institute, San Francisco,
California; and Lelie Research Paris, Paris, France.
Address reprint requests to: Marion Vermeulen, 1
Constantia Boulevard, Constantiakloof, Roodepoort 1709, South
Africa; e-mail: [email protected].
This study was funded by Novartis Diagnostics.
Received for publication June 29, 2012; revision received
December 4, 2012, and accepted December 4, 2012.
doi: 10.1111/trf.12117
TRANSFUSION 2013;53:2384-2398.
2384 TRANSFUSION Volume 53, October 2013

replicate ID-NAT assays for the EC samples on the indexplasma bag. To enable this supplemental testing on poten-tial WP and EC samples, aliquots are taken from the fresh-frozen plasma (FFP) units when available and are frozen at-80°C in a biorepository.
The South African National Blood Service (SANBS)collects and tests between 700,000 and 800,000 donationsper annum of which the majority, 80%, are from regularrepeat donors. The HIV prevalence in repeat donors(0.019%) is 50-fold lower than that in first-time donors(0.98%). The majority of HIV infections in South Africa areof the Clade C subtype.3 Upon testing of 76 WP donationswith sufficient viral load for sequence analysis, 72 (95%)were of Clade C, two of Clade B, one of Clade A, and one ofCRF02_AG (unpublished data). Of the 81 WP donationsconfirmed by anti-HIV seroconversion and/or p24antigen (p24 Ag) and viral load testing, 73 had sufficientquantity of plasma available for further characterizationby 1) a p24 Ag assay (Innogenetics, Ghent, Belgium); 2)two viral load assays (Siemens Versant branch DNA[bDNA] 3.0 assay; Abbott real-time polymerase chainreaction [RT-PCR] assay); and 3) three NAT blood screen-ing assays, that is, the Ultrio and Ultrio Plus assays (Novar-tis Diagnostics, Emeryville/Gen-Probe, San Diego, CA)and the TaqScreen assay (Roche Molecular Systems, Pleas-anton, CA). Twenty-eight WP samples with a viral loadbelow 500 copies/mL (cps/mL) in the bDNA assay wereused for preparing twofold dilution panels, which weretested in multiple replicates using the Ultrio and UltrioPlus assays and the TaqScreen assay (testing performed byCreative Testing Solution, Tampa, FL). The parallel testingof the WP sample dilution panels against HIV-1 Subtype Band C standard dilution panels calibrated in cps/mLallowed us to 1) estimate the HIV-RNA concentration ineach of 23 WP samples with viral load below the detectionlimit of the bDNA assay, 2) compare the relative sensitivityof the three NAT blood screening assays, and 3) comparethe sensitivity of p24 antigen testing with that of ID andminipool (MP)-NAT options for the three assays, that is,MP4, MP8, and MP16 for the Ultrio and Ultrio Plus assaysand MP6 for the TaqScreen assay.
The mathematical risk analysis methods currentlyused4,5 assume that donors present randomly during theearly WP at the blood bank. However, so far there are nostudies confirming that HIV-infected blood donors indeedappear randomly over time in the seronegative windowphase. The accurate estimation of the viral loads in theindividual WP samples, even below the detection limit ofthe quantitative HIV-RNA assays, enabled us to examinewhether or not the viral loads in the ramp-up phase ofviremia are equally distributed relative to the previouslydocumented doubling time.
During 4 years of ID-NAT screening SANBS also iden-tified 28 EC donations for which plasma samples wereavailable in enough volume for testing in multiple repli-
cate Ultrio and Ultrio Plus assays. The comparison of theproportion of reactive results, relative to detection rateson HIV-1 Subtype B and C standard dilution panels,enabled us to estimate the very low concentrations ofHIV-RNA in the plasma of these ECs.
In this study, we also estimate the probability of infec-tivity of the individual WP and EC donations using formu-las published by Weusten and coworkers,5 taking thetransfused plasma volume, different assumptions for 50%minimum infectious dose (ID50), and the observed viralload distributions of WP and EC donations into account.This made it possible to estimate the transmission risk ofthe actual WP donations for each of six screening optionsthat were evaluated in the study, that is, p24 Ag, ID-NAT,MP4, MP6, MP8, and MP16 NAT and compare this withthe probability of EC donations to be infectious in a theo-retical testing scenario based on ID-NAT alone withoutscreening of anti-HIV and p24 Ag.
MATERIALS AND METHODS
The following paragraphs describe the testing algorithmsemployed by SANBS from October 2005 to September2008, to confirm presence of HIV in the samples that wereselected for the preparation of test panels used for thecomparison of HIV assays. Thereafter, the assays and sta-tistical analyses are described. The flow diagram inFigure 1 summarizes the different HIV assays that wereperformed on the undiluted and diluted NAT- andserology-yield samples. For this study approval wasobtained from the SANBS Human Research EthicsCommittee
Testing algorithm and selection of samplesSANBS tests all donations in parallel for HIV-1 using theAbbott Prism HIV-1/2 antibody assay (Abbott Diagnostics,Delkenheim, Germany) and the Procleix Ultrio assay(Novartis Diagnostics) on the Tigris instrument. Any reac-tive results are repeated in duplicate on Prism and Tigris-Ultrio assays as well as in singlate on the dHIV assaydeveloped to resolve and confirm Ultrio-reactive dona-tions. Concordantly reactive donations in Ultrio, dHIV,and anti-HIV Prism assay are considered confirmed infec-tions and were not part of this study.
HIV WP NAT yieldsA potential HIV WP NAT yield is a donation that is Ultriorepeat-reactive and/or dHIV reactive, but anti-HIV nonre-active on Prism. The potential yield case becomes a con-firmed HIV-NAT–yield case when the recalled donorseroconverts to anti-HIV and/or p24 Ag in follow-upsamples, and/or the index donation plasma is reactive inthe p24 Ag assay and/or a viral load assay. Of 81 confirmedWP NAT yields in 3 years of ID-NAT screening 75 samples
HIV ASSAYS TO DETECT WP AND EC INFECTION
Volume 53, October 2013 TRANSFUSION 2385

were tested for both p24 Ag (Innotest, Innogenetics) andviral load in either Siemens Versant bDNA 3.0 or RocheTaqMan PCR assays, as well as in replicate Ultrio and dHIVassays. Forty-two of the 75 WP samples (56%) were nega-tive for p24 Ag and 19 (25%) were also negative in the viralload assay routinely used for confirmation. For these 19bDNA- or qPCR-negative samples, the presence of HIV-RNA could be confirmed by five replicate Ultrio and dHIVassays on samples taken from the frozen plasma unit. Ofthe 75 samples two HIV p24 antigen–negative WP samplescould not be used for the study because of lack of samplein one case and because of double infection with HBV inanother case. Hence, of the 75 p24 antigen and viral loadtested WP samples, 73 samples were available for compar-ing different NAT blood screening options and the p24 Agassay. Of these samples 70 samples were available forcomparison of two viral load assays (Fig. 1).
ECsA potential “serology-yield” case is a donation that isrepeat reactive for HIV antibody on Prism and nonreactiveor non–repeat reactive on NAT. Such a donor was classi-fied as an EC when he or she was established to not be onantiviral therapy and when the Western blot was positivebut qPCR is negative or yielded a very low viral load.Although the definition of an EC is an HIV-infected personwho is not on antiretroviral therapy and has a viral load offewer than 50 cps/mL for a period of 2 years while anti-HIV is confirmed positive in Western blot,2 we could notfollow these donors for 2 years to confirm persistent low-
level viremia but nonetheless believe classification as ECsis reasonable. The samples from the plasma units (whenavailable) from ECs were tested in qPCR and in 10 to 30replicate dHIV and/or Ultrio assays to confirm whetherHIV-RNA was detectable. After 4 years of testing 28 con-firmed EC cases had available FFP units from whichplasma samples were prepared for estimating viral load onthe basis of the proportion of dHIV reactive assays. Ofthese 14 samples were also available in enough quantityfor comparison of the reactivity rates in the Ultrio andUltrio Plus assays.
Preparation of HIV-positive donation samples anddilution panelsSANBS maintains a national plasma repository, which ali-quots and stores each virus-positive FFP unit detectedduring routine blood screening. The frozen plasma bags ofthe NAT and serology yields are thawed and aliquoted into3.5-mL aliquots and stored at -80°C. Seventy-three WPsamples were available for the comparison studies of HIVviral load and triplex NAT blood screening assays. EachWP NAT–yield plasma sample had already been tested onthe bDNA quantitative assay or Roche TaqMan assay byToga Laboratories (Edenvale, Gauteng, South Africa).Twenty-eight samples that had a viral load less than500 cps/mL were used to make dilution panels. A dou-bling dilution was made from 1:1 to 1:64 for each dilutionpanel. In addition a 1:6 dilution was made of each of the 28WP donations with a viral load below 500 cps/mL. The
Fig. 1. Overview of HIV assays performed on HIV WP and EC samples. VL = viral load.
VERMEULEN ET AL.
2386 TRANSFUSION Volume 53, October 2013

dilutions were made with negative human plasma thatwas filtered through a 113-mm strengthened 24-cm filter(Whatman, Catalog No. 1113-240, GE Healthcare, Wauke-sha, WI). Each twofold dilution panel comprised of sevenmembers and the 1:6 diluted samples were divided intomultiple vials each containing 4.5 mL of plasma. Thepanels were frozen at -80°C until replicate testing in theNAT assays.
Standard dilution panelsTwo commercially available panels with dilution serieswith known viral concentrations of HIV-RNA Subtype Band Subtype C were supplied by Biologicals QualityControl (BioQControl, DDL Laboratories, Rijswijk, theNetherlands). The HIV-1 RNA concentrations in thesepanels have been calibrated using multiple replicate testsin the Versant bDNA 3.0 assay (Siemens, Tarrytown, NY).
HIV assays performed on study panels
Viral load assaysThe two highest concentrations of each DDL panel weretested in three replicates on the bDNA assay to confirmthe quantification of the BioQControl panels in cps/mL.The WP NAT yields that had sufficient plasma stored(n = 70) were tested in one replicate on the bDNA assay.One aliquot of these WP samples was shipped to AbbottLaboratories (Chicago, IL) for testing in the Abbott HIVRT-PCR assay (Abbott Diagnostics).
Triplex NAT assaysThe sample Members 3 to 10 of the BioQControl GenotypeB and C panel were tested in 24 replicates on the Ultrioand Ultrio Plus assays (Novartis Diagnostics). Each of 28WP NAT–yield samples that had a viral load below500 cps/mL was made into a dilution panel and eachpanel member was tested in 12 replicates on the Ultrioand Ultrio Plus assay. Twenty-eight EC samples weretested undiluted in 10 to 30 replicates in the Ultrio assay.Fourteen of these samples in enough supply were alsotested undiluted in 10 to 30 replicate assays in the UltrioPlus assay. All Ultrio and Ultrio Plus testing was performedat the SANBS virology laboratory.
Thirteen of the twofold dilution panels of the WP NATyields with the lowest viral loads also had each panelmember tested in six replicates with the TaqScreen assayon the s201 system (Roche Molecular Systems), along withthe 1:6 dilutions (recommended MP size for the TaqScreenassay) of 25 HIV WP samples with viral loads below100 cps/mL. To enable sixfold replicate TaqScreen assaystwo 4.5-mL aliquots of the samples were shipped on dryice to CTS Laboratories (Tampa, FL). Each aliquot wastested in three separate TaqScreen test runs performed
within 48 hours after thawing of the samples. To allow forreplicate tests on the MPX s201 TaqScreen system eachsample needed to be relabeled before testing with dona-tion bar code and test series numbers.
HIV p24 Ag assayEach of the WP NAT–yield donations samples were testedon the Innogenetics Innotest mAB p24 Ag assay (Innoge-netics) as part of the routine confirmatory assays duringoperational supplemental testing. This assay is known tobe one of the most sensitive p24 Ag assays.6
Statistical analyses and risk modelingUsing the data of all HIV assays entered into spreadsheetswe performed a series of statistical analyses described inthe following paragraphs.
Sensitivity of NAT optionsFor each of the 28 WP NAT–yield samples tested by Ultrioand Ultrio Plus in twofold dilutions (undiluted, 1:2, 1:4, 1:8,1:16, 1:32, and 1:64) we counted the number of reactiveresults out of 12 replicate assays per sample for ID, MP4,MP8, and MP16 test options. Samples containing viralloads above 500 cps/mL were not tested in dilutions, sinceit was assumed they would be 12 of 12 (100%) reactive at allMP sizes including MP16 (this assumption was confirmedin dilution panels of WP samples with viral loads between100 and 500 cps/mL in the bDNA assay). For each of the ID-and MP-NAT options the sum of the total number of reac-tive results in the 73 anti-HIV–negative WP samples wascalculated and divided by the total number of replicates(73 ¥ 12) tested. The same was also done for the ID andMP6 NAT options for the TaqScreen assay, but in thismethod each undiluted and 1:6 dilution was tested in sixreplicates. The proportion of reactive results in each of theten evaluated NAT options was also calculated for the 40HIV p24 Ag–negative samples to mimic a situation wherethe anti-HIV screening assay would be replaced by ap24 Ag/anti-HIV combo assay. The proportions of reactiveresults between the test options were compared by chi-square test. Differences were considered significant whenthe p value was below 0.05.
Probit analysisWe used probit analysis in a statistical package (SPSS,SPSS, Inc., Chicago, IL) to determine the 95 and 50%detection limits of the NAT methods on the HIV Subtype Band C standard dilution panels that were tested in 24 rep-licate assays at each concentration of the standards (seeAppendix, Table A1). We compared the relative sensitivi-ties of Ultrio, Ultrio Plus, and TaqScreen assays by parallelline probit analysis. For each of the WP samples the sen-sitivity of Ultrio and Ultrio Plus relative to TaqScreen wasdetermined. If the 95% confidence limits overlap the value
HIV ASSAYS TO DETECT WP AND EC INFECTION
Volume 53, October 2013 TRANSFUSION 2387
1.0 the difference between the two assays was not signifi-cant for that particular sample. For WP donation samplesthat had RNA levels below the limit of quantitation by theviral load assays the HIV-RNA concentrations were esti-mated from the replicate qualitative NAT results based onthe shift in probit curves in parallel line probit analysis.The very low viral loads in EC samples were estimated bycomparing the percentage of Ultrio reactives on the undi-luted samples with the probit curve of either the HIVSubtype B or Subtype C standard dilution panels. Finally,parallel line probit analysis was used as a way to estimatethe viral load (in cps/mL) at the 50 and 95% HIV p24 Agseroconversion points based on the results from 75 WPsamples. This was done to obtain limit of detection (LOD)estimates for the p24 Ag assay, similar to those used forNAT systems, to enable using the risk analysis methodaccording to Weusten and colleagues5 for comparison ofresidual risk for the NAT options and p24 Ag testing in theSouth African donor population.
Transmission risk analysisWe calculated the probability of infection by red bloodcells (RBCs) and FFP units with inferred 50% minimuminfectious dose (N50) of 3.16, 31.6, 316, and 3160 virions.The infectivity is determined by Poisson statistics and cal-culated by the formula:
Pr(infectious) = 1 – exp(–N.pv),with N the expected number of viral particles in the bloodproduct and pv the individual probability of a viral particleto cause infection. From this equation a simple relationcan be derived between the viral load corresponding to aN50 and pv:
N50.pv = ln(2) ª 0.69.From this equation it can be estimated that pv is 0.22,
0.022, 0.0022, and 0.00022 when the ID50 (or N50) is 3.16,31.6, 316, and 3160 virions, respectively. For RBCs and FFPunits we assumed that the transfused plasma volume was20 and 200 mL, respectively. So, if the viral load in a dona-tion was estimated at 0.5 cps/mL by probit analysis for anRBC unit N was (0.5 ¥ 20)/2 or 5 virions. The probabilitythat an RBC transfusion is infectious can then be calcu-lated using the equation above. For example, for an ID50 of3.16 virions and 5 transfused virions
Pr exp . . %infectious( ) = − − ×( ) =1 5 0 22 66 9
for RBC units. However, for a FFP unit from the samedonation with N = 50 virions in 200 mL plasma,
Pr exp . %.infectious( ) = − − ×( ) =1 50 0 22 100
For each of the 73 WP donations the probability ofan RBC unit to be infectious was estimated using the for-mulas described above. However, to determine the prob-ability that the lower viral load WP donations wouldindeed transmit HIV to a recipient the probability of
infectivity (calculated as described above) was multipliedwith the probability of nondetection in the NAT optionevaluated. For this latter variable we did not use theobserved proportion of nonreactives in the NAT option,but used the normalized probability of detectiondeduced from the HIV Subtype C standard probit curveat the viral load that was found by parallel line probitanalysis. Hence, for each of the estimated viral loads theprobability of nondetection was determined from theprobit formula that was entered in a spreadsheet. Theproduct of the two probabilities of infectivity and of non-detection was then calculated for RBC units (20 mL ofplasma) for each of the NAT options and for ID50 valuesof 3.16, 31.6, and 316 virions. We then calculated the sumof the probabilities of each WP donation to be infectiousand not detected by the NAT option to estimate thenumber of undetected transmission cases for these ID50
values. One has to bear in mind that this is the transmis-sion risk on retest of the ID-NAT WP donations by thedifferent NAT options and does not include the residualtransmission risk of the WP donations with viral loadsbelow the Ultrio detection limit that were not detectedduring the 3 years of ID-NAT screening.
For the 28 ECs undetected by routine ID-NAT we usedthe equation above using ID50 levels of 31.6, 316, or 3160virions for each individual case for which the HIV-RNAconcentration was determined by probit analysis. Theoverall risk of all EC donations to be infectious is the sumof the probabilities, so it becomes possible to estimate anaverage probability of a random EC transfusion to beinfectious for different ID50 values.
Comparison of quantitative HIV-RNA andp24 Ag assaysThe log values of the HIV-RNA concentration reported bythe bDNA and Abbott RT assay were plotted against eachother, and the slope, correlation coefficient, and interceptwere determined by linear regression analysis. The con-version factor between the copy numbers reported by thetwo assays was deduced from the difference between theintercepts. Similarly, the logit-transformed7 p24 Ag signal-to-cutoff ratio (S/CO) values were plotted against the logof bDNA cps/mL. The sensitivity of the p24 Ag assay, orthe S/CO = 1 cutoff crossing point, in cps/mL of WPramp-up samples was calculated from the point where thelinear regression line intersected with the log HIV-RNAscale.
RESULTS
Comparison of quantitative HIV-RNA assaysin WP samplesOf 70 SANBS NAT-yield (WP) samples 51 (72.8%) werebDNA reactive and 65 (92.9%) were reactive in the Abbott
VERMEULEN ET AL.
2388 TRANSFUSION Volume 53, October 2013

RT assay, of which seven had viral loads below the 40cps/mL quantification limit. For 23 WP samples below100 cps/mL in the bDNA assay, the viral loads were quan-tified by replicate Ultrio assays on twofold dilutions. Par-allel line probit analysis against the DDL HIV Subtype Cstandards showed that the viral loads in these samplesvaried between 0.78 and 97.1 cps/mL. The Abbott RTassay reported 2.8 (1.9-4.0)-fold higher concentrations onthe quantifiable HIV WP samples than the bDNA assay,according to linear regression analysis (Fig. 2). Apart froma probable systematic underquantification in the bDNAassay for Subtype C according to limiting dilution analysis(see standardization details in the Appendix), there wasgood agreement between the two viral load assays(r2 = 0.99), which indicates that the WP samples were effi-ciently detected by both the Siemens bDNA and theAbbott RT assays.
Comparison of quantitative HIV-RNA and p24 Agassays on WP samplesOf 73 WP samples, 33 (45%) were reactive in the Innoge-netics p24 Ag assay. We performed a linear regressionanalysis plotting the logit-transformed S/CO values of thep24 Ag assay against the log HIV-RNA concentration andfound a cutoff crossing point at 8140 cps/mL (Fig. 2). Thiscrossing point was influenced by one positive p24 Agresult (S/CO, 1.71) on a sample with 5988 cps/mL in thebDNA assay that might have been false reactive on thep24 Ag assay. The two samples with the closest viral loadsto this sample had 7394 and 8689 cps/mL and were p24 Ag
nonreactive with S/CO values of 0.49and 0.59. The three samples with thenearest higher viral loads of 14,333,16,123, and 22,365 cps/mL were border-line p24 Ag reactive, with S/CO values of1.06, 1.00, and 1.17, respectively. We alsoapproached estimation of the p24 Agdetection limit in the WP ramp-upsamples differently by performing a par-allel line probit analysis against the HIVSubtype C standard dilution series. The95% LOD was 64,000 cps/mL and the50% LOD was 10,000 cps/mL, which isin good agreement with the cutoff cross-ing point (S/CO, 1.0) of 8140 cps/mLfound by regression analysis. The p24 AgS/CO of 1 cutoff crossing point in theHIV Subtype C WP ramp-up sampleswould be 22,710 cps/mL when con-verted to Abbott RT cps/mL (Fig. 2).
Random appearance of donors inthe WP
For the analysis of the viral load distribution and therelated time that donors donate blood during the WPramp-up phase we decided to exclude the majority (29/33) of HIV p24 Ag–positive WP samples and restrict theanalysis to 47 donations with a bDNA test result below27,000 cps/mL, which is the end of log linear ramp-upstage according to seroconversion panel studies pub-lished by Fiebig and colleagues.8 Up to this level it isassumed that the HIV-RNA growth curve is exponentialand not attenuated by the antibody response or lack oftarget cells to sustain maximal viral replication. The viralloads of the 47 ID-NAT yields in the early ramp-up phasevaried from 0.8 to 84 cps/mL for the 25 donors with unde-tectable viral load in the bDNA assay and from 96 to26,157 cps/mL in 22 donors with measurable viral load inthe bDNA assay. The 15 donors with the lowest viral loadsincreasing from 0.8 to 17.0 cps/mL were detected with49.3% to 99.6% probability by replicate ID-NAT testing,according to interpolation based on the HIV Subtype Cstandard probit curve. To correct for the nondetectedcases each donor case with low viral load was divided bythe probability of detection. The HIV-RNA concentrationwas converted into days by using an HIV doubling time of0.85 days (95% confidence interval [CI], 0.76-0.98) accord-ing to Fiebig and colleagues.8 Since each virion particlehas two HIV-RNA copies, a concentration of 2 cps/20 mLin an RBC unit or 0.1 cps/mL was arbitrarily set as the startof the infectious WP or t = 0. By translating the viral loadinto the time of appearance based on the log linearincrease of viremia, the number of corrected donorappearances per day (whereby Day 1 was defined as
Fig. 2. Log-linear correlation between HIV-RNA concentration in 70 ID-NAT
WP–yield samples measured in cps/mL by Siemens bDNA 3.0 assay (>100 cps/mL) or
by Ultrio limiting dilution probit analysis on DDL HIV Subtype C standards cali-
brated in bDNA cps/mL (<100 cps/mL) and viral load in cps/mL found by Abbott
RT-PCR assay (green circles) and Logit S/CO values in Innogenetics HIV p24 Ag assay
(blue diamonds).
HIV ASSAYS TO DETECT WP AND EC INFECTION
Volume 53, October 2013 TRANSFUSION 2389
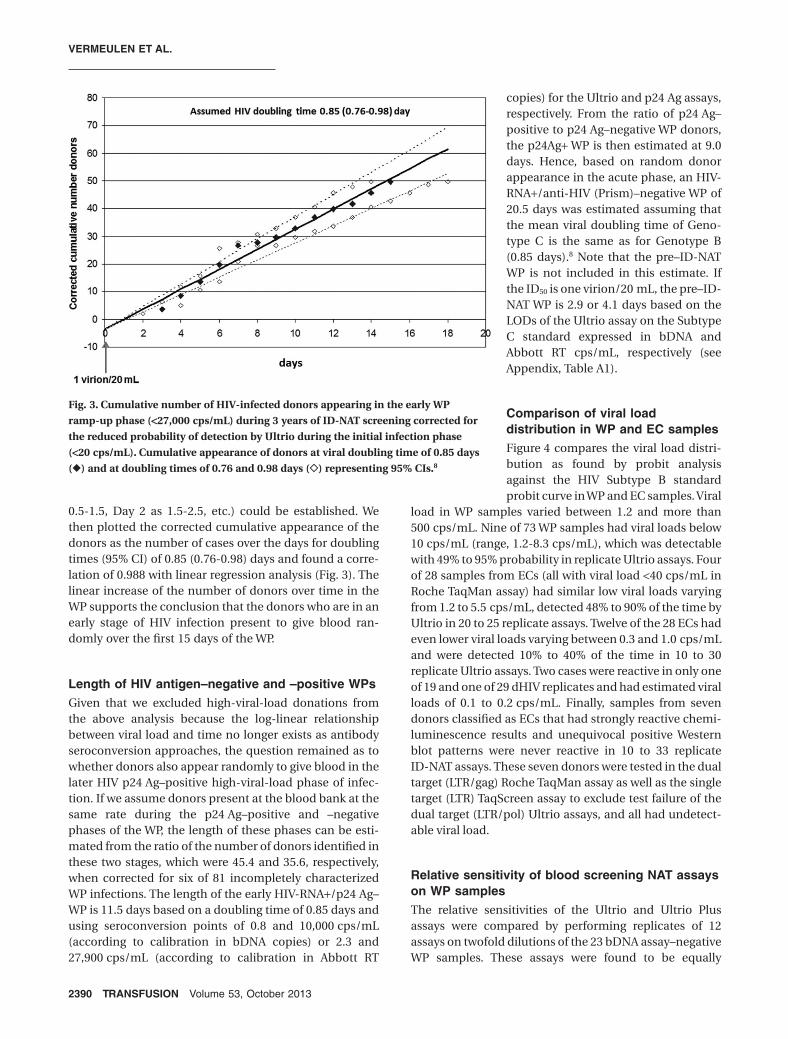
0.5-1.5, Day 2 as 1.5-2.5, etc.) could be established. Wethen plotted the corrected cumulative appearance of thedonors as the number of cases over the days for doublingtimes (95% CI) of 0.85 (0.76-0.98) days and found a corre-lation of 0.988 with linear regression analysis (Fig. 3). Thelinear increase of the number of donors over time in theWP supports the conclusion that the donors who are in anearly stage of HIV infection present to give blood ran-domly over the first 15 days of the WP.
Length of HIV antigen–negative and –positive WPsGiven that we excluded high-viral-load donations fromthe above analysis because the log-linear relationshipbetween viral load and time no longer exists as antibodyseroconversion approaches, the question remained as towhether donors also appear randomly to give blood in thelater HIV p24 Ag–positive high-viral-load phase of infec-tion. If we assume donors present at the blood bank at thesame rate during the p24 Ag–positive and –negativephases of the WP, the length of these phases can be esti-mated from the ratio of the number of donors identified inthese two stages, which were 45.4 and 35.6, respectively,when corrected for six of 81 incompletely characterizedWP infections. The length of the early HIV-RNA+/p24 Ag–WP is 11.5 days based on a doubling time of 0.85 days andusing seroconversion points of 0.8 and 10,000 cps/mL(according to calibration in bDNA copies) or 2.3 and27,900 cps/mL (according to calibration in Abbott RT
copies) for the Ultrio and p24 Ag assays,respectively. From the ratio of p24 Ag–positive to p24 Ag–negative WP donors,the p24Ag+ WP is then estimated at 9.0days. Hence, based on random donorappearance in the acute phase, an HIV-RNA+/anti-HIV (Prism)–negative WP of20.5 days was estimated assuming thatthe mean viral doubling time of Geno-type C is the same as for Genotype B(0.85 days).8 Note that the pre–ID-NATWP is not included in this estimate. Ifthe ID50 is one virion/20 mL, the pre–ID-NAT WP is 2.9 or 4.1 days based on theLODs of the Ultrio assay on the SubtypeC standard expressed in bDNA andAbbott RT cps/mL, respectively (seeAppendix, Table A1).
Comparison of viral loaddistribution in WP and EC samplesFigure 4 compares the viral load distri-bution as found by probit analysisagainst the HIV Subtype B standardprobit curve in WP and EC samples. Viral
load in WP samples varied between 1.2 and more than500 cps/mL. Nine of 73 WP samples had viral loads below10 cps/mL (range, 1.2-8.3 cps/mL), which was detectablewith 49% to 95% probability in replicate Ultrio assays. Fourof 28 samples from ECs (all with viral load <40 cps/mL inRoche TaqMan assay) had similar low viral loads varyingfrom 1.2 to 5.5 cps/mL, detected 48% to 90% of the time byUltrio in 20 to 25 replicate assays. Twelve of the 28 ECs hadeven lower viral loads varying between 0.3 and 1.0 cps/mLand were detected 10% to 40% of the time in 10 to 30replicate Ultrio assays. Two cases were reactive in only oneof 19 and one of 29 dHIV replicates and had estimated viralloads of 0.1 to 0.2 cps/mL. Finally, samples from sevendonors classified as ECs that had strongly reactive chemi-luminescence results and unequivocal positive Westernblot patterns were never reactive in 10 to 33 replicateID-NAT assays. These seven donors were tested in the dualtarget (LTR/gag) Roche TaqMan assay as well as the singletarget (LTR) TaqScreen assay to exclude test failure of thedual target (LTR/pol) Ultrio assays, and all had undetect-able viral load.
Relative sensitivity of blood screening NAT assayson WP samplesThe relative sensitivities of the Ultrio and Ultrio Plusassays were compared by performing replicates of 12assays on twofold dilutions of the 23 bDNA assay–negativeWP samples. These assays were found to be equally
Fig. 3. Cumulative number of HIV-infected donors appearing in the early WP
ramp-up phase (<27,000 cps/mL) during 3 years of ID-NAT screening corrected for
the reduced probability of detection by Ultrio during the initial infection phase
(<20 cps/mL). Cumulative appearance of donors at viral doubling time of 0.85 days
(�) and at doubling times of 0.76 and 0.98 days (�) representing 95% CIs.8
VERMEULEN ET AL.
2390 TRANSFUSION Volume 53, October 2013

sensitive for detection of low-level HIV-RNA in parallelline probit analysis, except for one sample containing28 cps/mL that was detected with 2.7 (1.0-7.4)-fold highersensitivity by the Ultrio Plus assay. The 13 samples withthe lowest viral loads were also tested on the same twofolddilution panels in six replicate TaqScreen assays. Foursamples were detected at 2.3- to 3.0-fold lower concentra-tions by Ultrio Plus than by TaqScreen, whereas in ninesamples the difference in sensitivity was not significant.When all 13 samples were analyzed together in a parallelline probit analysis, the difference in analytical sensitivitybetween the Ultrio and TaqScreen assays in ID-NAT con-figuration was not significant, whereas Ultrio Plus wasmarginally but significantly (p < 0.05) more sensitive(Table 1).
Sensitivity of blood screening NAT assays onEC samplesTable 2 shows the proportion of reactive results on mul-tiple replicate Ultrio and Ultrio Plus assays on 14 ECsamples. Ultrio and Ultrio Plus detected the samples withequal sensitivity. Overall Ultrio Plus detected 32% andUltrio 28% of replicates as reactive (p = 0.31).
Sensitivity of ID- and MP-NAT options onWP samplesTable 3 shows the proportion of 73 anti-HIV–negative WPsamples that tested reactive on 12 or six replicate tests persample in each of 10 NAT options evaluated. On retest ofthe eight lowest viral load samples (1.2-12.5 cps/mL) theID-NAT options detected them 17% to 92% of the time.This explains why the three NAT assays in ID-NAT con-figuration detected all 73 ID-NAT–yield samples with97.2% to 97.8% sensitivity on 12 replicate Ultrio and Ultrio
Plus assays and six replicate TaqScreenassays per WP sample. However, ondiluted samples that mimicked MP4,MP8, and MP16 NAT on Ultrio andUltrio Plus and MP6 NAT on TaqScreen,the proportions of reactive results onWP samples declined significantly.TaqScreen MP6 detected 88.1% of repli-cates and had comparable sensitivity toUltrio MP8 and Ultrio Plus MP8 thatdetected 88.6 and 89.7% of replicates,respectively. Ultrio MP16 and UltrioPlus MP16 were significantly less sensi-tive (82.4 and 85.3%), but were signifi-cantly more sensitive than the Innotestp24 Ag assay, which detected 45.2% ofsamples as reactive. To evaluate a situa-tion in which SANBS would introduce ap24 Ag/anti-HIV assay for serologictesting reducing the incremental yield
of NAT, we also compared the relative proportions of reac-tive assays on replicate testing of 40 samples that werenonreactive on the p24 Ag assay (Fig. 5). Not surprisinglythe differences in the proportions of reactive replicateassays between the pool sizes became larger, ranging from87% for Ultrio MP4, to 79% for Ultrio MP8, and to 68% forUltrio MP16.
Modeling transmission risk of NAT options in WPWe estimated the probability of HIV transmission from theprobability of nondetection and the probability of infec-tivity given the amount of virus infused by 20 mL ofplasma in RBC transfusions using Poisson distributionformulas (see example described under Materials andMethods). The graphs in Figure 6 show the probability ofvirus transmission on retest of the 40 p24 Ag–negativeID-NAT–yield cases with increasing viral loads rangingfrom 1.2 to 8689 cps/mL by the different ID- and MP-NAToptions for different assumed minimum infectious doses.Table 4 gives the sum of the total number and percentageof HIV transmissions by RBC transfusions that areexpected on retest of the 40 p24 Ag–negative WP cases forthese ID50 values. For example with a not unlikely scenarioof an ID50 of 31.6 virions (see Discussion), MP16 NATwould allow 9.1 transmissions derived from the 40ID-NAT–positive but p24 Ag–negative donations (23%) tooccur. With Ultrio MP8 or TaqScreen MP6 this numberwould reduce to 5.4 of 40 cases (15%). This implies that 5.4of 8.9 (66%) and 5.4 of 8.3 (71%) of ID-NAT–yield cases thatwere not detected by Taqscreen MP6 and Ultrio MP8,respectively, are expected to be infectious with an ID50 of31.6 virions. With this infectivity level the risk of p24 Ag–negative WP samples transmitting HIV on retest by UltrioID-NAT would be 2.0%. Note that the predicted numbers
Fig. 4. Equal distribution of HIV-RNA load (bDNA cps/mL) in samples from WP dona-
tions and ECs observed during 3 years of ID-NAT screening.
HIV ASSAYS TO DETECT WP AND EC INFECTION
Volume 53, October 2013 TRANSFUSION 2391

of HIV transmissions in the modeling of Table 4 start from40 p24 Ag–negative WP samples with viral loads rangingfrom 1.2 to 8700 cps/mL and do not include the risk oflower viral load WP donations missed by ID-NAT screen-ing. In 2,190,836 donations screened during the 3-yearID-NAT screening period, the risk modeling4 predicts3.3 undetected HIV transmission cases with an ID50 of31.6 virions (1.5 ID-NAT–negative infectious RBC units/million).
Modeling infectivity of EC bloodAs described under Materials and Methods the viral loadof each of the ECs can be translated to a probability ofinfectivity by transfusion of 20 mL of plasma by RBC unitsor 200 mL of plasma by FFP units using Poisson distribu-
tion formulas. When the sum of the probabilities isdivided by the 28 cases for different assumptions of theminimum infectious dose one can calculate the meanprobability of an EC RBC unit being infectious. Table 4shows the probability of EC transfusions transmitting HIVmodeled for different ID50 values. If the ID50 is 316 virionsthe probability of HIV transmission would be 2.2% for RBCtransfusions and 15.5% for FFP transfusions. If, however,the ID50 is 3160 virions, the infectivity would only be 0.2and 2.2% for RBC and FFP transfusions, respectively. Evenif the ID50 of EC blood was similar to the estimated infec-tivity of HIV by WP transfusions, that is, 31.6 virions (seeDiscussion), the probability of virus transmission by RBCtransfusions of ECs would be only 15.5%.
DISCUSSION
The first objective of our study was to compare the sensi-tivity of the HIV p24 Ag assay with the currently usedtriplex ID- and MP-NAT systems for detection of anti-HIV–negative WP donations in South Africa. It was reassuringto establish that there were no important differences inanalytical sensitivity between the currently used commer-cial NAT methods (Ultrio, Ultrio Plus, and TaqScreen)when applied in ID-NAT configuration (Table 1). Only 33of 73 (45%) ID-NAT WP–yield donations were detected bythe Innogenetics p24 Ag assay and 82% to 90% weredetectable by MP6- to MP16-NAT (Table 3). This latterproportion reduced to 68% to 81% when only p24 Ag–negative ID-NAT yields were assessed (Fig. 5).
The testing of relatively large numbers of HIV WP andEC donor samples using either undiluted or dilutedsamples in the different NAT methods allowed us also to
TABLE 1. Sensitivity of Ultrio and Ultrio Plus relative to TaqScreen on twofold dilution panels of the 13 HIV WPsamples with the lowest viral load as determined by parallel line probit analysis from the proportions of
reactive results on 12 Ultrio (Plus) and six TaqScreen replicate assays
WP NAT yield samplecps/mL to Subype
B standardcps/mL to Subtype
C standard
Relative sensitivity (95% CI)
Ultrio relative to TaqScreen Ultrio Plus relative to TaqScreen
1 1.2 0.8 1.04 (0.3-3.7) 1.15 (0.4-4.4)2 1.6 1.0 2.88 (0.3-346) 1.73 (0.1-88.3)3 3.2 2.0 0.61 (0.2-1.5) 1.23 (0.5-3.2)4 3.8 2.4 0.88 (0.5-1.7) 1.42 (0.8-2.3)5 5.7 3.6 1.74 (0.5-9.0) 1.16 (0.3-5.0)6 5.8 3.7 0.85 (0.4-1.7) 1.38 (0.7-2.8)7 8.3 5.3 2.43 (1.3-5.7) 1.17 (0.6-2.2)8 11.4 7.3 1.42 (0.7-3.1) 2.98 (1.4-7.9)9 12.5 8.0 2.95 (1.4-7.5) 2.29 (1.1-5.4)
10 17.1 10.9 0.39 (0.2-0.8) 0.85 (0.4-1.7)11 23.0 14.7 1.24 (0.7-2.3) 1.28 (0.7-2.4)12 25.9 16.5 1.64 (0.8-3.6) 2.46 (1.2-6.2)13 26.2 16.7 2.93 (1.4-7.9) 2.36 (1.1-6.0)Overall all panels 1.08 (0.86-1.37)* 1.34 (1.06-1.69)†
* Difference not significant.† Difference significant (p < 0.05).
TABLE 2. Proportion of reactive results in 14samples from ECs tested in 10 to 30 replicate
Ultrio and Ultrio Plus assays
Samplecps/mL
Ultrio Ultrio Plus
Reactive Number Percent Reactive Number Percent
1 0.1 1 30 3 2 30 72 0.1 1 19 5 2 20 103 0.1 0 20 0 2 20 104 0.2 2 20 10 1 20 55 0.2 2 20 10 3 20 156 0.2 2 20 10 4 20 207 0.2 3 20 15 5 20 258 0.2 4 25 16 3 20 159 0.3 5 25 20 4 20 20
10 0.3 5 20 25 8 20 4011 0.9 13 25 52 13 20 6512 1.6 7 10 70 10 10 10013 3.5 20 23 87 15 20 7514 4.3 18 20 90 17 20 85All 83 297 28 89 280 32
VERMEULEN ET AL.
2392 TRANSFUSION Volume 53, October 2013

determine the viral load distribution in these two catego-ries of HIV-infected donors with discrepant results in NATand serology assays (Fig. 4). The viral loads in p24 Ag–negative WP samples ranged from 1.2 to 8700 cps/mL,whereas it ranged from 6000 to more than 500,000 cps/mLin p24 Ag–reactive WP samples. By contrast, the viral loadin the EC samples was extremely low and ranged from lessthan 0.1 to 5.5 cps/mL. There was a good correlationbetween the Siemens bDNA and Abbott RT assays indetecting the Clade C WP samples, but the latter assayreported 2.8-fold higher copy numbers (Fig. 2 and Appen-dix). However, when IU/mL values are compared the levelof consensus between the two viral load assays improves(see Standardization details, Appendix).
The examination of the viral load distribution andcomparison of different methods for HIV-RNA quantifica-tion provided insight into the fundamentals of the cur-rently used mathematical models for estimation ofresidual transmission risk,4,5 that is, 1) strong evidencethat recently infected donors present randomly over timeduring the infectious WP (Fig. 3) and 2) accurate quantifi-cation in HIV-RNA copies,9 which have a direct relation-ship with potentially infectious virions (see Appendix). Inthis context Kleinman and coworkers10 recently reviewedinfectivity studies that are relevant for transmission risk
analyses.5 The ID50 of HIV-1 in the early WP was estimatedto be 3.1 (1-10) virions or 6.2 (2-20) RNA copies if theresults obtained by experimental inoculation of simianimmunodeficiency virus (SIV) in macaques11 are appli-cable to human infection. In the anti-SIV–positive phase(viral set point) the infectivity was approximately 100-foldless, due to the neutralizing effect of SIV antibody.11 Theseauthors proposed that for worst-case risk analyses mod-eling should use an ID50 of 3.1 (1-10) virions in plasma forseronegative WP donations and of 316 (100-1000) virionsin plasma for EC donations. However, there are data fromhuman HIV transmission cases by transfusion of storedblood components not detected by MP-NAT that wouldindicate that the minimum infectious dose of HIV instored components prepared from WP donations couldvery well be 10- or even 100-fold higher than the ID50
established in the SIV model, that is, 31.6 (10-100) oreven 316 (100-1000) plasma virions per transfusedcomponent.12
The p24 Ag concentration in plasma is known to cor-relate with the logit-transformed S/CO ratios6 and linearregression analysis of results on the SANBS Clade C WPsamples showed a parallel increase with the viral load inthe ramp-up phase starting at 10,000 cps/mL according toquantification in the bDNA assay9 and 28,000 cps/mL inthe Abbott RT assay (Fig. 2). When applying the math-ematical formulas for the infectivity of individual WPdonations of known viral load in cps/mL as determined inthis study, we were able to predict that 15 and 23% ofp24 Ag–negative WP donations or 66% to 71% of WP dona-tions missed by MP6-16NAT options are likely to transmitthe virus (Fig. 5, Table 4), even if the minimum infectiousdose in stored RBC transfusions is 10-fold higher than 3.16(1-10) virions established in a macaque-SIV infectivitymodel.11 This analysis confirms the utility of ID-NATscreening for HIV in a high-incidence setting like SouthAfrica, which has interdicted low-level viremic donationsat an increasing rate as the donor pool has expanded toinclude larger proportions of first-time and black donorswho are at increased risk of HIV infection.
Our comparative analysis indicates that if MP16-NATinstead of ID-NAT had been used by SANBS 12.8 of 40(32%) of the p24 Ag–negative WP donations identified
TABLE 3. Proportion of ID-NAT WP samples detectable by HIV p24 Ag assay and on retest of several ID-NATand MP-NAT options*
Pool size
Number of 73 WP samples reactive† (%) in replicate assays
HIV p24 Ag (single) Ultrio (12 replicates) Ultrio Plus (12 replicates) TaqScreen (six replicates)
IDT 33.0 (45.2) 71.4 (97.8) 71.4 (97.8) 70.8 (97.2)MP4 67.9 (93.0) 67.4 (92.3)MP6 64.1 (88.1)MP8 64.7 (88.6) 65.5 (89.7)MP16 60.2 (82.4) 62.2 (85.3)
* Data are reported as number (%).† Number of replicates reactive divided by 12 for Ultrio and Ultrio Plus and divided by six forTaqScreen.
Fig. 5. Proportion of ID- or MP-NAT reactives on retest in 12
or six replicate assays per sample in Ultrio (Plus) and
TaqScreen, respectively, of 40 HIV p24 Ag–negative WP dona-
tions found during 3 years of ID-NAT screening.
HIV ASSAYS TO DETECT WP AND EC INFECTION
Volume 53, October 2013 TRANSFUSION 2393

during the initial 3 years of ID-NAT screening wouldhave gone unrecognized, and 9.1 of 40 (23%) wouldlikely have transmitted HIV if the ID50 is 31.6 virions.If the infectivity of HIV in stored RBCs from WP donationsis 10-fold lower (ID50 of 316 virions), as roughly estimatedby Kleinman and colleagues,10 on only a few MP-NATbreakthrough transmission cases, the modeling predictsthat only 2.5 of 40 (6%) of p24 Ag–negative ID-NAT–yielddonations missed by MP16-NAT would have beeninfectious.
Not surprisingly, the correct estimation of theminimum infectious dose is crucial for HIV transmissionrisk analysis and therefore we also looked at data fromthe United States to shed some light on this issue: Overthe past decade MP16-NAT has been used to screen 66million donations by the American Red Cross, and 32HIV WP donations have been interdicted.13 Recently theviral load distribution of 29 of these donations wasstudied in the Abbott RT assay14 and 17 had viral loadsbelow 10,000 cps/mL, which is the level of viremia abovewhich p24 Ag is detectable. If, like in SANBS, 32% of theprojected p24 Ag–negative ID-NAT–yield cases would beundetectable by MP16-NAT, an additional eight WPdonations would have been detectable had ID-NAT beenemployed. During the past decade only three donationshave been implicated as MP16-NAT breakthrough infec-
tions after lookback investigations ofseroconverting donors documented bythe American Red Cross.15-17 Hence, 3of 25 (11%) (2/17 [11%] according toARC data of Dr Susan Stramer, personalcommunication) projected to bep24 Ag–negative ID-NAT yields in theUnited States were documented tobe infectious. So, if the observedMP16-NAT breakthrough cases in theUnited States would represent all cases(assuming that no additional unre-cognized transmission events haveoccurred) one could predict that theID50 of HIV is somewhere between 31.6virions and 316 virions as can bededuced from our modeling data(compare with Table 4). If, however,half of the MP16-NAT breakthroughHIV transmissions were not recog-nized, the ID50 is expected to be closerto 31.6 (10-100) virions.
We, therefore, believe that the ID50
of 3.16 (with a range of 1-10) virions, asdeduced from the SIV-macaque model11
could be used for worst-case WP riskanalysis, but that an ID50 of 31.6 (rangeof 10-100) virions is probably a betterestimate for HIV infectivity in stored
blood components from WP donations. With this infectiv-ity level, the residual pre–ID-NAT WP transmission riskestimated according to the method of Weusten and col-leagues5 based on 5 years of SANBS data18 is 5.5 and 1.5transmissions per million donations with ID50 estimates of3.16 or 31.6 virions, respectively (and Ultrio LODs onSubtype B standard; see Appendix). If p24 Ag testingwould have been still in use instead of ID-NAT the riskmodeling predicts that 31 HIV transmissions would haveoccurred per million RBC transfusions with an ID50 of 31.6virions. To date, after 7 years of screening of 5.3 milliondonations no HIV transmission events have been estab-lished in South Africa following lookback investigationsand recipient hemovigilance. Before ID-NAT was intro-duced the lookback program identified on average twodocumented transfusion transmissions per year. Thisobserved transmission rate is approximately 15-fold lowerthan the current risk estimate in case NAT would not havebeen implemented. The relatively low number of estab-lished transmission events before implementing NAT maybe due to several factors: 1) the fact that transfusion ofblood from black donors known to be at higher risk wasavoided at that time, 2) lack of efficiency of lookback pro-grams in general, and 3) a lower infectivity level than theID50 of 31.6 (10-10) virions used in the risk modelingabove. Obviously the introduction of ID-NAT has reduced
Fig. 6. Probability of RBC transfusions from 40 HIV p24 Ag–negative ID-NAT
WP–yield donations with increasing viral load from 1.2 to 8700 cps/mL to be infec-
tious and not detected on retest by ID and MP-NAT options calculated for three
levels of the minimum infectious dose.
VERMEULEN ET AL.
2394 TRANSFUSION Volume 53, October 2013

HIV transmission risk more than 10-fold, documentingthe value of this intervention for blood safety on theAfrican continent.
The simultaneous detection of HIV infection by sero-logic and ID-NAT screening showed that 0.7% of mainlyfirst-time donations in South Africa that tested confirmedHIV antibody positive were negative by ID-NAT. Theseseropositive donors had viral loads below the 95% LOD ofthe Ultrio assay and hence were confirmed as ECs. TheseECs have been identified among HIV-infected blooddonors in several countries and the proportion variesbetween 1 and 4% depending on the sensitivity of the NATscreening systems employed.19 None of these EC dona-tions in South Africa had quantifiable viral load results inthe Roche TaqMan dual target (LTR/gag) viral load assay,confirming that the Ultrio dual target (LTR/pol) assay didnot fail to detect any strains of HIV-1.20,21 In a considerableproportion (25%) of EC donors HIV-RNA could not bedetected despite 10 to 33 replicate Ultrio assays. Theoreti-cally, these replicate Ultrio-nonreactive donors couldhave aborted the infection, and further studies arerequired to examine whether proviral DNA is detectable intheir peripheral blood mononuclear cells. Quantificationof HIV-RNA by probit analysis showed that the viral load ofthese ECs varied between 0 and 80 virions/20 mL plasmain RBC units. Although the blood of these donors is nottransfused because they are anti-HIV reactive, onewonders whether blood from ECs would be infectious.This question is relevant for a theoretical testing scenarioin which p24/anti-HIV combo assays would be replacedby ID-NAT alone (a scenario not likely to be approved of byregulators). Indeed, blood of anti-HIV–positive individu-als is not 100% infectious, as shown in studies lookingback into recipients of seropositive components beforeintroduction of antibody testing in the United States.22
Eleven percent of antibody-positive transfusions were notinfectious, and low viral loads (<1000 cps/mL) and longerstorage times (>2 weeks) of RBCs at 4°C were significantlyassociated with nontransmission. Since the viral load inECs is extremely low (<10 cps/mL) one could predict thatthe risk of infection would also be low because the infec-
tivity of the virus in plasma is expected to be 100-foldreduced by neutralizing antibody.11 However, lymphocytesfrom ECs have been demonstrated to harbor integrated,intact proviral genomes and virus has been isolated fromEC lymphocytes using sensitive coculture methods;23
indeed SANBS has been able to detect proviral DNAin blood lymphocytes in a few EC cases (unpublishedobservations).
To support efficacy and cost-effectiveness analysis ofalternative screening scenarios, we thought that it wasuseful to estimate the potential infectivity of RBC and FFPunits of ECs based on the low plasma viral loads found inthese infected donors. The mean probability of HIV trans-mission of the individual EC donations can then be usedin further transmission risk modeling and efficacy analysisof different screening scenarios, such as 1) p24 Ag/anti-HIV combo assay, 2) anti-HIV/MP-NAT, 3) anti-HIV/ID-NAT, and 4) ID-NAT alone. Our infectivity modeling studyassuming a 100-fold reduced ID50 of 316 virions, as estab-lished for transfusions of seropositive blood in the SIV-macaque model,11 estimated an overall probability of 2.2%that HIV in RBCs from ECs is infectious. We propose thatthis probability be used in modeling the efficacy of alter-native screening scenarios comparing p24 Ag/anti-HIVcombo assay with and without MP-NAT versus the optionof using ID-NAT alone. Since the vast majority of ECs arefirst-time donors, the latter option of using a dual-targetID-NAT–only screening strategy in repeat and lapseddonors deserves consideration in cost effectivenessmodels.
APPENDIX
Standardization details
HIV-RNA quantification
The viral loads of the ECs and WP samples of fewer than100 cps/mL used for the transmission risk analysis in thisstudy were determined by parallel line probit analysisagainst the BioQControl HIV-1 Subtype B and C referencepanels. The manufacturer of these reference panels has
TABLE 4. Modeling of the number (and percentage) of HIV transmission cases by RBCs from 40p24 Ag–negative ID-NAT WP–yield donations and 28 ECs as a function of the viral load, the screening option,
and the minimum infectious dose*
RBC fromRange HIV-RNA
cps/mL Number Screening option
Estimated number (%) of transmissioncases according to ID50 in virions
3.16 31.6 316 3160
p24 Ag–negativeID-NAT–positive WP
1-10,000 40 Anti-HIV + Ultrio IDT 1.9 (4.8) 0.8 (2.0) 0.1 (0.2)Anti-HIV + Ultrio MP4 6.4 (16.0) 3.5 (8.8) 0.7 (1.7)Anti-HIV + Ultrio MP8 9.8 (24.5) 5.9 (14.8) 1.4 (3.5)Anti-HIV + TaqScreen MP6 9.8 (24.5) 5.9 (14.8) 1.4 (3.5)Anti-HIV + Ultrio MP16 13.6 (34.0) 9.1 (22.8) 2.5 (6.2)
Ultrio NR EC 0.1-10 28 Ultrio IDT alone 4.3 (15.5) 0.6 (2.2) 0.06 (0.23)
* Data are reported as number (%).
HIV ASSAYS TO DETECT WP AND EC INFECTION
Volume 53, October 2013 TRANSFUSION 2395
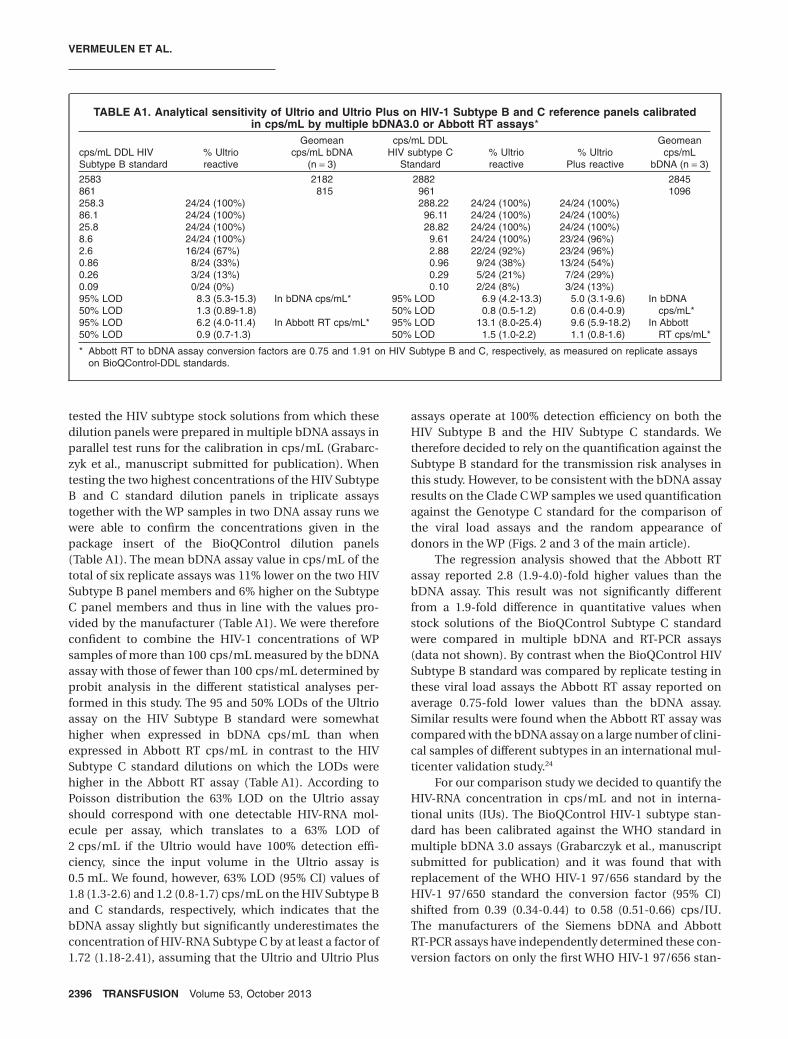
tested the HIV subtype stock solutions from which thesedilution panels were prepared in multiple bDNA assays inparallel test runs for the calibration in cps/mL (Grabarc-zyk et al., manuscript submitted for publication). Whentesting the two highest concentrations of the HIV SubtypeB and C standard dilution panels in triplicate assaystogether with the WP samples in two DNA assay runs wewere able to confirm the concentrations given in thepackage insert of the BioQControl dilution panels(Table A1). The mean bDNA assay value in cps/mL of thetotal of six replicate assays was 11% lower on the two HIVSubtype B panel members and 6% higher on the SubtypeC panel members and thus in line with the values pro-vided by the manufacturer (Table A1). We were thereforeconfident to combine the HIV-1 concentrations of WPsamples of more than 100 cps/mL measured by the bDNAassay with those of fewer than 100 cps/mL determined byprobit analysis in the different statistical analyses per-formed in this study. The 95 and 50% LODs of the Ultrioassay on the HIV Subtype B standard were somewhathigher when expressed in bDNA cps/mL than whenexpressed in Abbott RT cps/mL in contrast to the HIVSubtype C standard dilutions on which the LODs werehigher in the Abbott RT assay (Table A1). According toPoisson distribution the 63% LOD on the Ultrio assayshould correspond with one detectable HIV-RNA mol-ecule per assay, which translates to a 63% LOD of2 cps/mL if the Ultrio would have 100% detection effi-ciency, since the input volume in the Ultrio assay is0.5 mL. We found, however, 63% LOD (95% CI) values of1.8 (1.3-2.6) and 1.2 (0.8-1.7) cps/mL on the HIV Subtype Band C standards, respectively, which indicates that thebDNA assay slightly but significantly underestimates theconcentration of HIV-RNA Subtype C by at least a factor of1.72 (1.18-2.41), assuming that the Ultrio and Ultrio Plus
assays operate at 100% detection efficiency on both theHIV Subtype B and the HIV Subtype C standards. Wetherefore decided to rely on the quantification against theSubtype B standard for the transmission risk analyses inthis study. However, to be consistent with the bDNA assayresults on the Clade C WP samples we used quantificationagainst the Genotype C standard for the comparison ofthe viral load assays and the random appearance ofdonors in the WP (Figs. 2 and 3 of the main article).
The regression analysis showed that the Abbott RTassay reported 2.8 (1.9-4.0)-fold higher values than thebDNA assay. This result was not significantly differentfrom a 1.9-fold difference in quantitative values whenstock solutions of the BioQControl Subtype C standardwere compared in multiple bDNA and RT-PCR assays(data not shown). By contrast when the BioQControl HIVSubtype B standard was compared by replicate testing inthese viral load assays the Abbott RT assay reported onaverage 0.75-fold lower values than the bDNA assay.Similar results were found when the Abbott RT assay wascompared with the bDNA assay on a large number of clini-cal samples of different subtypes in an international mul-ticenter validation study.24
For our comparison study we decided to quantify theHIV-RNA concentration in cps/mL and not in interna-tional units (IUs). The BioQControl HIV-1 subtype stan-dard has been calibrated against the WHO standard inmultiple bDNA 3.0 assays (Grabarczyk et al., manuscriptsubmitted for publication) and it was found that withreplacement of the WHO HIV-1 97/656 standard by theHIV-1 97/650 standard the conversion factor (95% CI)shifted from 0.39 (0.34-0.44) to 0.58 (0.51-0.66) cps/IU.The manufacturers of the Siemens bDNA and AbbottRT-PCR assays have independently determined these con-version factors on only the first WHO HIV-1 97/656 stan-
TABLE A1. Analytical sensitivity of Ultrio and Ultrio Plus on HIV-1 Subtype B and C reference panels calibratedin cps/mL by multiple bDNA3.0 or Abbott RT assays*
cps/mL DDL HIVSubtype B standard
% Ultrioreactive
Geomeancps/mL bDNA
(n = 3)
cps/mL DDLHIV subtype C
Standard% Ultrioreactive
% UltrioPlus reactive
Geomeancps/mL
bDNA (n = 3)
2583 2182 2882 2845861 815 961 1096258.3 24/24 (100%) 288.22 24/24 (100%) 24/24 (100%)86.1 24/24 (100%) 96.11 24/24 (100%) 24/24 (100%)25.8 24/24 (100%) 28.82 24/24 (100%) 24/24 (100%)8.6 24/24 (100%) 9.61 24/24 (100%) 23/24 (96%)2.6 16/24 (67%) 2.88 22/24 (92%) 23/24 (96%)0.86 8/24 (33%) 0.96 9/24 (38%) 13/24 (54%)0.26 3/24 (13%) 0.29 5/24 (21%) 7/24 (29%)0.09 0/24 (0%) 0.10 2/24 (8%) 3/24 (13%)95% LOD 8.3 (5.3-15.3) In bDNA cps/mL* 95% LOD 6.9 (4.2-13.3) 5.0 (3.1-9.6) In bDNA
cps/mL*50% LOD 1.3 (0.89-1.8) 50% LOD 0.8 (0.5-1.2) 0.6 (0.4-0.9)95% LOD 6.2 (4.0-11.4) In Abbott RT cps/mL* 95% LOD 13.1 (8.0-25.4) 9.6 (5.9-18.2) In Abbott
RT cps/mL*50% LOD 0.9 (0.7-1.3) 50% LOD 1.5 (1.0-2.2) 1.1 (0.8-1.6)
* Abbott RT to bDNA assay conversion factors are 0.75 and 1.91 on HIV Subtype B and C, respectively, as measured on replicate assayson BioQControl-DDL standards.
VERMEULEN ET AL.
2396 TRANSFUSION Volume 53, October 2013

dard and report 0.306 and 0.58 cps/IU, respectively, inthe package inserts. Hence if we would have compared thecorrelation between the two viral load assays on theSANBS Clade C WP samples in IU/mL the 2.8 (1.9-4.0)-folddifference would decrease 1.9-fold to a 1.5 (1.0-2.1)-folddifference. Likewise, the 1.9-fold difference in the concen-tration in cps/mL in the BioQControl HIV Subtype C stan-dard would disappear when IU/mL values are compared.However, when quantifying the BioQControl Genotype Bstandard by the two viral load assays in IU/mL the level ofconsensus would diminish from an Abbot RT/bDNAfactor of 0.75 with cps/mL to 0.40 when IU/mL are com-pared. Further studies are required to confirm that there isa difference in the level of consensus between the two viralload assays for Subtype B and C, a phenomenon that wasalso observed in another performance evaluation study.24
Nevertheless, in our study on a large number of CladeC WP samples, quantification in IU/mL would haveimproved the level of consensus between the two viralload assays, showing the value of using a common inter-national standard for quantification.
Importance of accurate quantification of HIV-RNA incps/mL for transmission risk analysis
Although the introduction of the WHO standard for HIV-1RNA has improved the comparability of quantitativeresults between laboratories using different NAT methods,many clinical and blood screening laboratories stillexpress viral load in cps/mL. For blood safety testing thereis an important reason why quantification of HIV-RNA incps/mL is preferred above quantification in arbitrary IUs.There is a direct relationship between HIV-RNA copiesand potentially infectious virions. The risk of virus trans-mission in the early WP ramp-up phase starts when oneinfectious virus is present in the plasma of a transfusedblood component and is determined by the Poisson dis-tribution of infectious viruses in the blood of the earlyinfected donor and the probability that units with thatlevel of viremia would not be detected by the screeningassays employed. Weusten and colleagues4 used Poissondistribution statistics to develop a mathematical modelfor calculating the transmission risk of a WP donation tocause infection in a recipient, which is determined by 1)the amount of plasma in the transfused component, 2) the95 and 50% LOD of the ID-NAT assay and the MP size, 3)the doubling time of the virus in the WP ramp-up phase,and 4) the estimated infectivity of the virus expressed asthe 50% minimum infectious dose (ID50). For this riskmodel it is essential that both the 95 and 50% lower LODsof the NAT system and the minimum infectious dose (ID50)are expressed in the same RNA copy numbers. Theauthors are well aware of the fact that the viral load assaysare not 100% precise and accurate in the measurement ofthe number of HIV-RNA molecules, but the in vitro RNAstandards used for calibration of the bDNA 3.0 assay have
been thoroughly quantified by three different physico-chemical methods.9 Since HIV is a diploid virus weassumed in the risk calculations that one virion carriestwo genome copies as measured by the bDNA assay. To beable to quantify HIV-RNA in WP and EC samples with viralloads below the detection limit of the bDNA assay we usedHIV Genotype B and C standard dilution panels (BioQ-Control, DDL Laboratories, Rijswijk, the Netherlands) thatwere calibrated in cps/mL using multiple bDNA 3.0 assaysand were also quantified by the Abbott RT-PCR assay. Ourdata indicate that the Siemens bDNA assay underesti-mates the viral load for HIV Subtype C RNA copies morethan 1.7-fold and that the Abbott RT assay is likely toslightly overestimate true genome copy numbers 1.6-foldbased on limiting dilution analysis of the Ultrio assay.However, there was no indication of a significant under-detection of the true viral load in cps/mL by the bDNAassay for HIV Subtype B (Table A1). Probably the quanti-fication of viral load in cps/mL by probit analysis againstthe BioQControl standard dilution panels in our articledeviates less than a factor of 2 from true values. Bearingthe limitations of standardization of HIV-RNA in truegenome copies in mind, we believe that the estimates ofthe 95 and 50% LODs and ID50 in this article are accurateenough for the purpose of the transmission risk analysesperformed in this article.5
ACKNOWLEDGMENT
We thank Novartis Diagnostics for funding this study.
CONFLICTS OF INTEREST
NL is contracted by Novartis Diagnostics. The other authors have
no conflict of interest.
REFERENCES
1. Vermeulen M, Lelie PN, Sykes W, Crookes R, Swanevelder
J, Gaggia L, le Roux M, Kuun E, Gulube S, Reddy R. Impact
of individual donation nucleic acid testing on the risk of
human immunodeficiency virus, hepatitis B virus and
hepatitis C virus transmission in South African donors.
Transfusion 2009;49:1115-25.
2. Deeks SG, Walker BD. Human immunodeficiency virus
controllers: mechanisms of durable viral control in the
absence of antiretroviral therapy. Immunity 2007;27:406-
16.
3. Bredell H, Martin DP, Van Harmelen J, Varsani A, Shep-
pard HW, Donovan R, Gray CM; HIVNET028 Study Team,
Williamson C. HIV type 1 subtype C gag and nef diversity
in Southern Africa. AIDS Res Hum Retroviruses 2007;23:
477-81.
4. Busch MP, Glynn SA, Stramer SL, Strong DM, Caglioti S,
Wright DJ, Pappalardo B, Kleinman SH; NHLBI-REDS NAT
HIV ASSAYS TO DETECT WP AND EC INFECTION
Volume 53, October 2013 TRANSFUSION 2397

Study Group. A new strategy for estimating risks of
transfusion-transmitted viral infections based on rates of
detection of recently infected donors. Transfusion 2005;45:
254-64.
5. Weusten J, Vermeulen M, Van Drimmelen H, Lelie N.
Refinement of a viral transmission risk model for blood
donations screened by NAT in different pool sizes
and repeat test algorithms. Transfusion 2011;
51:203-15.
6. Ly TD, Ebel A, Faucher V, Fihman V, Laperche S. Could the
new HIV combined p24 antigen and antibody assays
replace p24 antigen specific assays? J Virol Methods 2007;
143:86-94.
7. Plikaytis BD, Turner SH, Gheesling LL, Carlone GM. Com-
parison of standard curve-fitting methods to quantitate
Neisseria meningitides group A polysaccharide antibody
levels by enzyme-linked immunosorbent assay. J Clin
Microbiol 1991;29:1439-46.
8. Fiebig EW, Wright DJ, Rawal BD, Garrett PE, Schumacher
RT, Peddada L, Heldebrant C, Smith R, Conrad A, Klein-
man SH, Busch MP. Dynamics of HIV viremia and anti-
body seroconversion in plasma donors: implications for
diagnosis and staging of primary HIV infection. AIDS
2003;17:1871-9.
9. Collins ML, Zayati C, Detmer JJ, Daly B, Kolberg JA, Cha
TA, Irvine BD, Tucker J, Urdea MS. Preparation and char-
acterization of RNA standards for use in quantitative
branched DNA hybridization assays. Anal Biochem 1995;
226:120-9.
10. Kleinman SH, Lelie PN, Busch MP. Infectivity of human
immunodeficiency virus-1, hepatitis C virus, and hepatitis
B virus and risk of transmission by transfusion. Transfu-
sion 2009;49:2454-89.
11. Ma ZM, Stone M, Piatak M Jr, Schweighardt B, Haigwood
NL, Montefiori D, Lifson JD, Busch MP, Miller CJ. High
specific infectivity of plasma virus from the pre-ramp up
and ramp up stages of acute simian immunodeficiency
virus infection. J Virol 2009;83:3288-97.
12. Kleinman SH, van Drimmelen H, Lelie N, Busch MP.
Minipool NAT HIV-breakthrough transmission case and
probability of interdiction by current small pool or indi-
vidual NAT screening systems [abstract]. Vox Sang 2009;
96(Suppl 1):3D-S23-03 p53.
13. Zou S, Dorsey KA, Notari EP, Foster GA, Krysztof DE,
Musavi F, Dodd RY, Stramer SL. Prevalence, incidence,
and residual risk of human immunodeficiency virus and
hepatitis C virus infections among United States blood
donors since the introduction of nucleic acid testing.
Transfusion 2010;50:1495-504.
14. Tobler LH, Vermeulen M, Stramer SL, Wu S, Busch MP.
Distribution of viral loads in US (Clade B) and South
Africa (Clade C) NAT yield donors [abstract]. Transfusion
2010;50(Suppl):3A S1-010A.
15. Stramer SL, Eder AF, Foster GA, Dy BA, Krysztol D,
Trouen-Trend J, Dorsey K, Zou S, Benjamin RJ, Dodd RY.
Investigation of reported cases of transfusion transmission
of HIV [abstract]. Transfusion 2009;49(Suppl):4A S2-010A.
16. Laffoon B, Levi M, Bower WA, Kuehnert M, Brooks JT,
Selik RM, Switzer WM, Heneine W, Shankar A, Iuliano AD.
HIV transmission through transfusion. Missouri and Colo-
rado, 2008. MMWR Morb Mortal Wkly Rep 2010;59:1335-6.
17. Stramer S, Wend U, Candotti D, Foster GA, Hollinger FB,
Dodd RY, Allain JP, Gerlich W. Nucleic acid testing to
detect HBV infection in blood donors. N Engl J Med 2011;
364:236-47.
18. Vermeulen M, Coleman C, Gaggia L, Sykes W, Crookes R,
Lelie N, Gulube S, Busch M, Reddy R. The effect of change
in testing strategy and increasing the black donor base on
the HIV window period transmission risk in South Africa:
a five year analysis [abstract]. Vox Sang 2011;101
(Suppl 1):41 3D-S12-01.
19. Laperche S, Morel P, Deschaseaux M, Bouchardeau F, Ali-
mardani G, Guillaume N, Rouger P, Lefrère JJ. HIV anti-
body screening remains indispensable for ensuring viral
safety of blood components despite NAT implementation.
Transfusion 2003;43:1428-32.
20. Assal A, Barlet V, Deschaseaux M, Dupont I, Gallian P,
Guitton C, Morel P, David B, De Micco P. Comparison of
the analytical and operational performance of two viral
nucleic acid test blood screening systems: Procleix Tigris
and cobas s 201. Transfusion 2009;49:289-300.
21. Chudy M, Weber-Schehl M, Pichl L, Jork C, Kress J, Heiden
M, Funk MB, Nübling CM. Blood screening nucleic acid
amplification tests for human immunodeficiency virus
type 1 may require two different amplification targets.
Transfusion 2012;52:431-9.
22. Busch MP, Operskalski EA, Mosley JW, Lee TH, Henrard D,
Herman S, Sachs DH, Harris M, Huang W, Stram DO.
Factors influencing human immunodeficiency virus type 1
transmission by blood transfusion. Transfusion Safety
Study Group. J Infect Dis 1996;174:26-33.
23. Blankson JN, Bailey JR, Thayil S, Yang HC, Lassen K, Lai J,
Gandhi SK, Siliciano JD, Williams TM, Siliciano RF. Isola-
tion and characterization of replication-competent
human immunodeficiency virus type 1 from a subset of
elite suppressors. J Virol 2007;81:2508-18.
24. Schutten M, Peters D, Back NKT, Beld M, Beuselinck K,
Foulongne V, Geretti A-M, Pandiani L, Tiemann C,
Niesters HGM. Multicenter evaluation of the new Abbott
RealTime assays for quantitative detection of human
immunodeficiency virus Type 1 and hepatitis C virus RNA.
J Clin Microbiol 2007;45:1712-7.
VERMEULEN ET AL.
2398 TRANSFUSION Volume 53, October 2013