A COMPARATIVE STUDY TO EVALUATE THE QUALITY OF INSTALLATION AND PERFORMANCE OF SOME COLLECTORS IN...
24
Egypt.J.of Appl. Sci. , 20(6 B) 682-700,(2005) A COMPARATIVE STUDY TO EVALUATE THE QUALITY OF INSTALLATION AND PERFORMANCE OF SOME COLLECTORS IN SUBSURFACE DRAINAGE SYSTEM IN SANDY SOILS M.A.M.Abdalla;A.A.M.Mohamedin;M.H.E.Salem and M.K.Abdel Aleem Soils; Water and Env. Res. Inst. ,Agric. Res. Center , Giza , Egypt KEYWORDS: collector performance, hydraulic gradient, regularity, alignment , collector installation, implementation, discharge, overpressure ABSTRACT An attempt has been made in a field study to evaluate the quality of installation of three selected plastic collectors implemented in sandy soils and to verify the validity of the design slope, design hydraulic gradient and design discharge of the collectors under study. Moreover, the evaluation of the hydraulic collector’s performance has been carried out. One collector was constructed at Harrara area which is situated in the north west of the Nile Delta, near Damanhour city, El Behaira Governorate. Its design discharge is 4.0 mm/day. The second collector was chosen from Meet Kennana area, which is located 40 km. north of Cairo, Qualiubia Governorate. The design discharge of this collector is 2.0 mm/day. While the third collector was at Sarabiom area which is located about 20 km south Ismailia city , near the Suez Canal. The design discharge of this collector is 10 mm/day. The implementation of the collectors at both Meet Kennana area and Sarabiom area was performed with a Masten Broke trencher, with depth control by laser. While the collector of Harrara area
Transcript of A COMPARATIVE STUDY TO EVALUATE THE QUALITY OF INSTALLATION AND PERFORMANCE OF SOME COLLECTORS IN...
Egypt.J.of Appl. Sci. , 20(6 B) 682-700,(2005)
A COMPARATIVE STUDY TO EVALUATE THE QUALITY OFINSTALLATION AND PERFORMANCE OF SOME COLLECTORS IN
SUBSURFACE DRAINAGE SYSTEM IN SANDY SOILSM.A.M.Abdalla;A.A.M.Mohamedin;M.H.E.Salem and
M.K.Abdel AleemSoils; Water and Env. Res. Inst. ,Agric. Res.
Center , Giza , Egypt
KEYWORDS: collector performance, hydraulic gradient,regularity, alignment , collector installation, implementation, discharge, overpressure
ABSTRACTAn attempt has been made in a field study to
evaluate the quality of installation of threeselected plastic collectors implemented in sandysoils and to verify the validity of the design slope,design hydraulic gradient and design discharge of thecollectors under study. Moreover, the evaluation ofthe hydraulic collector’s performance has beencarried out. One collector was constructed at Harraraarea which is situated in the north west of the NileDelta, near Damanhour city, El Behaira Governorate.Its design discharge is 4.0 mm/day. The secondcollector was chosen from Meet Kennana area, which islocated 40 km. north of Cairo, Qualiubia Governorate.The design discharge of this collector is 2.0 mm/day.While the third collector was at Sarabiom area whichis located about 20 km south Ismailia city , near theSuez Canal. The design discharge of this collector is10 mm/day. The implementation of the collectors atboth Meet Kennana area and Sarabiom area wasperformed with a Masten Broke trencher, with depthcontrol by laser. While the collector of Harrara area
Egypt.J.of Appl. Sci. , 20(6 B) 682-700,(2005)
was almost performed manually with a Hoess draintrencher. The installation of this collector tookplace under wet conditions so, the laser control fordepth was frequently unused at Harrara area.
The obtained results revealed that, mostsections of the collector at Harrara area have analignment which always higher than the designed one.The actual slope in many sections was 2-3 timeshigher than the design value or even about 4 times insome sections (MH 10-11). The overall actual slope issteep. However, some individual intermediate sectionsare either steep or flat and some even have aninverse slope. Many sections of the collector wasclassified as poor regularity due to the manualinstallation under wet conditions and the laserfrequently unused during the installation of thiscollector
The results of the investigated plasticcollector at Meet Kennana area showed that theoverall weighted average actual slope is almost equalto the design value. In general, the qualificationsof both slope and regularity of Meet Kennanacollector are good. Concerning Sarabiom area, theresults indicated that the actual slope is higherthan the design one. So, the slope of the collectoris steep. Whereas the regularity of the collectoraccording to the obtained results is good.
Generally, the alignment of the three selectedcollectors deviates from their design. The slope issteeper than the design one but the degree of thisdeviation was more pronounced in the collector ofHarrara area as compared with the other twocollectors of Meet Kennana and Sarabiom areas. Thiscould be referred to using the laser technique andthe dry conditions of the trench during theimplementation of the collectors of both Meet Kennana
Egypt.J.of Appl. Sci. , 20(6 B) 682-700,(2005)
and Sarabiom areas. While, the laser frequentlyunused and the prevailing wet conditions of thetrench during the installation at Harrrara area whichexplains the poor alignment of the collector.
Concerning the performance of the collectors,the obtained results emphasized that the collector ofHarrara area suffers from overpressure and theoverpressure increases in the upstream direction. Theperformance of Meet Kennana and Sarabiom collectorsis much better than that of Harrara area. This may bedue to the irregularities and mis-alignment ofHarrara collector as compared with the othercollectors under study.
On the other side, comparing the hydraulicgradient value with the design slope of Meet Kennanaand Sarabiom collectors, the obtained results showedthat the variations between the actual and the designvales are not pronounced as compared with thecollector of Harrara area.
The measured collector discharges during the study period indicated that the mean and Q90 values never exceeded the design discharge values for all collectors under study.
INTRODUCTIONThe well functioning drainage systems in
irrigated arid and semi-arid regions are essential to maintain soil productivity at a certain level. The collector drains are designed in a composite subsurface drainage system to collect the outflow of lateral drains and evacuate them to the open drain in the area. They are also designed to work without overpressure; not restricting the lateral outflow and the flow of ground water from the soil to the drainage system. Consequently, the main
Egypt.J.of Appl. Sci. , 20(6 B) 682-700,(2005)
function of collector pipe is to transport the lateral discharges to the main drain.
Monitoring of a drainage system after installation is essential and the poor installationis the major cause of the failure of the drainage system. Therefore, continuous careful through detailed inspection for all aspects of the installation proper must be carried out in order toobtain a well functioning of the drainage system ( Dierickx , 1990 ). On the other hand, Van Someren, 1984 stated that , the function of drain system after installation may depend to a large extent on the carefulness of the backfilling operation immediately after the installation of drains, especially in irrigated areas , where the loose trenchfill has no time to settle and stabilize sufficiently before a new layer of irrigation watercover the field. Therefore, he recommended that thebackfilling operation of the drain trench should becompleted soon after installation. On the other side, both Cavelaars, 1985 and Van Someren , 1984 recommended a dry period for the installation of the drainage system and avoid the wet conditions toget a well functioning of the drainage system .
In the past, manual construction of drainage systems caused severe siltation problems due to poor quality of installation. With the introductionof collector and lateral laying machines in the construction of drainage networks in Egypt, the quality of installation was improved as well as theperformance of subsurface drainage systems. Moreover, laser technology was also introduced later to control pipe levels and slopes of both lateral and collector drains. In subsurface land
Egypt.J.of Appl. Sci. , 20(6 B) 682-700,(2005)
drainage, considerable attention should be paid to the precision of the grading of installed drains. Past experience showed that it was difficult to attain acceptable precision by manual means. Poor grades badly influence the drains performance and limit their efficiency. Every deviation from the straight grade line can cause a large or small increase in flow resistance (Omara , 2003).
Standards for both depth and grade control of subsurface drains vary from one country to another , however , there is general agreement thatthe deviation of the drain pipe from the desired grade line may not be more than half of the internal pipe diameter . The ICID guidelines on subsurface drain construction (Schultz, 1990) require that the maximum allowable deviation for grades per 100 m should not be more than 20 % of the inside pipe diameter. Accuracy of grades controlled by laser can reach +/- 5 mm per 100 m. About five depth checks per second are normally made by laser automatic control during drainage machine operation. The areas with sandy subsoil mayface difficulties and many problems during the implementation of subsurface drainage projects. So,it is important to test the flexible perforated plastic tubes in such areas.
The objective of this paper is to highlight the findings related to the evaluation of the installation quality of plastic collectors in subsurface drainage system in sandy soils and to check the performance of these collectors.
MATERIALS AND METHODSAreas description:
Egypt.J.of Appl. Sci. , 20(6 B) 682-700,(2005)
Three collectors have been chosen from threeareas to carry out this study. The selectedcollectors were Polyethylene plastic pipes (HDPE).The pipes were perforated and pre-wrapped with athin synthetic envelope material. The pipes of thethree collectors are perforated to avoid uplift andfloating effects encountered with shallow watertable. The three collectors are implemented insandy to loamy sand soils (> 80 % sand).
One collector was selected from Harrara areawhich is situated in the north west of the NileDelta, near Damanhour city , El-Behaira Governorate. The area is approximately 130 Fedddans. The maincrops in the area are maize, cotton, rice, wheatand clover. The design discharge of this collectoris 4.0 mm/day according to EPADP standards forareas where rice is grown in summer. The clay, siltand sand percentages for the top 2 m are 10, 10 and80 %, respectively. The texture can be described asloamy sand. The hydraulic conductivity of the topsoil down to 2.5 m varied between 0.4 –1.97 m / day.
Another collector was chosen from MeetKennana area which is located 40 km. north of Caironear Shebein El-Kanater town, QualiubiaGovernorate. It represents an area of 830 Feddans.The main crops in the area are maize, clover, wheatand vegetables beside fruit crops .The soil textureof the top 2 m is classified as sandy. The clay,silt and sand percentages are 2, 8 and 90 %,respectively. The hydraulic conductivity of the topsoil down soil down to 2 m varied between 4.3 –10.1 m / day .The design discharge of thiscollectors is 2.0 mm / day according to EPADP
Egypt.J.of Appl. Sci. , 20(6 B) 682-700,(2005)
standards for areas where rice is not grown insummer.
The third collector was at Sarabiom area whichis located near Sarabiom village, about 20 km southIsmailia city , near the Suez Canal .The size ofthe area is 10 Feddans. On the east it is borderedby recently reclaimed lands beside Suez Canal, onwhich the elevation is up to 6 m higher than thisarea .The soil texture is loamy sand. Thepercentages of clay, silt and sand are 5, 10 and 85%, respectively. The hydraulic conductivity up to1.1 m is 9.7 m/day. The auger holes deeper than1.25 m could not be made due to the instability ofthe soil. The design discharge of this collector is10 mm/day. The main crops in the area are fruittrees and vegetables .The locations of the threeareas are presented in (Fig. 1).
The implementation of the collectors at bothMeet Kennana area and Sarabiom area was performedwith a Masten Broke trencher, with depth control bylaser. While the collector of Harrara area wasalmost performed manually with a Hoess draintencher. The installation of this collector tookplace under wet conditions so the laser control fordepth was frequently unused.
Procedure of collector quality of installation evaluation:
The differences in hydraulic performance between the three selected collectors are expected to be due to differences in design, material and implementation. In this study the quality of construction and accuracy of implementation will be
Egypt.J.of Appl. Sci. , 20(6 B) 682-700,(2005)
classified and evaluated by comparing the actual longitudinal profile of collectors with the design slope.
In order to compare the design and actual slope of the collectors, a fixed point, or reference level, has to be chosen. The section between the outlet of the collector drain and the first manhole has been excluded because in this short section the collector pipe often drops sharply to the level in the open drain irrespectively of the design slope.a- Slope evaluation
The first step in the evaluation procedure of thealignment is to check and qualify the overall regularity of the slope of the collectors under this study. The concept and method of analysis is described by Oosterbaan et al, 1982. For each section between two adjacent manholes the actual slope has been calculated using the measured levelsat the intermediate survey points. Both of the actual and design slopes were calculated as weighted average slopes. The following formula was used to calculate the weighted average actual slope:
Sa = 1/N * Hi / Li
(1)Where: Sa = weighted average actual slope,( m / m )
Hi = difference in level between collector pipe at L= 0 and L = Li , (m)
Li = distance from downstream manhole (accumulated length, m)
Egypt.J.of Appl. Sci. , 20(6 B) 682-700,(2005)
N = number of levels in this section
In the calculations, the slope between two successive survey points was assumed to be constant. A parameter (U) is introduced to test therelation between the actual slope and the design slope according to (Oosterbaan et al, 1982).
U = ( Sd – Sa ) / Sd = 1 – ( Sa / Sd )(2)
Where: Sd = design slope, (m / m) Sa = actual slope, (m / m) U = parameter qualifying the
actual slope of the collector pipe according to :
U < - 0.20 (Steep) - 0.20 < U < 0.20 (Reasonably accurate slope) U > 0.20 (Flat)b- Regularity and accuracy qualification:
The second step in the evaluation is to check accuracy of laying the collector (the accuracy of the drain machine driver), by evaluating the regularity of the longitudinal drain alignment along the weighted average actual slope. In other words, position of pipe above or below the average longitudinal center line.
In this case the deviation (d) from the actualslope has been calculated using:
di = ( Hi ) – ( Sa * Li ) (3)
Where:
Egypt.J.of Appl. Sci. , 20(6 B) 682-700,(2005)
di = absolute deviation in point (i) , (m)
A parameter (R) is introduced also by (Oosterbaan et al , 1982 ) to test the regularity of the longitudinal drain alignment along the weighted average actual slope .The regularity ( R )of the collector pipe is defined as :
R = dmean + 2 * STD (4)In which: dmean = mean value of
deviations , ( m ) STD = standard deviation of
( d ) R = parameter qualifying the
regularity according to :
R < D / 2 ( Good )
D / 2 < R < D ( Moderate )
R >D ( Poor ) In which (D) is the diameter of collector pipe (m)
Methods of soil analysis and discharge measurements:
- Soil mechanical analysis was carried out bythe international pipette method, according toPiper, 1950.
- Soil hydraulic conductivity was determined inthe field by using the Auger hole method,according to Van Beers, 1976.
Egypt.J.of Appl. Sci. , 20(6 B) 682-700,(2005)
- Collector discharge was measured, according toILRI, 1974 and Luthin, 1978.
RESULTS AND DISCUSSIONQuality of installation evaluation:
Slope is an indication for the accuracy the ofsight – line , set out by the surveyor and used by the operator to keep the trench box of the pipe laying machine on grade whereas , the regularity isan indication of the operator and his capability tokeep the trench box within certain limits of the sight-line. The calculations of the slope qualification, the accuracy of the regularity and analysis of the quality construction for the collectors under this study are summarized in Table(1). Moreover, both actual and design slopes of thecollectors are illustrated in Fig. (2), whereas thelongitudinal alignment of the collectors is illustrated in Fig. (3).
It can be deduced from the table and figures that, most sections of the collector at Harrara area (almost manually installed and the laser frequently unused) have an alignment which always higher than the designed one. Regarding the design slope is 6.0 cm/100 m between manholes No.1 and No. 4 and 8.0 cm/100m between manholes No. 4 and No. 11. The weighted average actual slope is 9.5 cm/100 m compared with the weighted average design slope of 7.4 cm /100 m.
Concerning the slope qualification of the collector located at Harrara area , it can be concluded that all sections , except two sections , have been laid at a slope which either steep or flat . On the other hand, two sections
Egypt.J.of Appl. Sci. , 20(6 B) 682-700,(2005)
have an inverse slope. Most sections of the collector have steep slope and the upstream parts of the collectors have steep slope. Generally, the overall actual slope is steep. However, some individual intermediate sections are either steep or flat and some even have an inverse slope.
On the other side, the regularity of Harrara collectors is evaluated and presented in Table (1).The data showed that many sections of the collectorwere classified as poor regularity according to Oosterbaan et al., 1982. This poor regularity can be due to the fact that the collector of Harrara area was almost manually installed under wet conditions and the unstable collapsing soils so, the laser frequently unused. These results are in agreement with that emphasized by Cavelaars, 1985 ;Van Someren , 1984 and Omara , 2003 . Regarding the collectors of both Meet Kenana and Sarabiom areas, the results in Table (1) and Figs. (2 and 3)revealed that the actual slope of Meet kennana collector is higher than the design slope between manhole No. 1 and manhole No. 4, whereas it was below the design value in the upstream part of the collector between manhole No.5 and manhole No. 6. However, both the design and the actual slopes between manhole No.4 and manhole No. 5 are almost coincided. Generally the overall weighted average actual slope is 4.2 cm/100 m which almost equal to the design value (4.1 cm/100 m). In general, the qualifications of both slope and regularity of MeetKennana collector are good.
Concerning Sarabiom area, the resultsindicated that the actual slope is higher than thedesign one. So, the slope of the collector is
Egypt.J.of Appl. Sci. , 20(6 B) 682-700,(2005)
steep. The overall actual slope is 7.5 cm/100 mwhile the design slope is 5.0 cm/100 m. On theother hand, the regularity of the collectoraccording to the obtained results is good.
As a general conclusion, the alignment of thethree selected collectors deviates from theirdesign. The slope is steeper than the design onebut the degree of this deviation was morepronounced in the collector of Harrara area ascompared with the other two collectors of MeetKennana and Sarabiom areas. The interpretation ofthese findings could be referred to using the lasertechnique and the dry conditions of the trenchduring the implementation of the collectors of bothMeet Kennana and Sarabiom areas. On contrast, thelaser frequently unused and the prevailing wetconditions of the trench during the installation atHarrrara area which explains the poor alignment ofthe collector.Collector performance evaluation a- Overpressure:
The height of water level above the top levelof the collector pipe determines the overpressure,which appeared in the collector manholes andconsequently determines the collector performance.Therefore, the overpressure must be taken intoconsideration when the performance of collectorsunder study was determined.
The overpressure for manholes of the maincollector was calculated and classified every 0.10m into: no overpressure, 0.0 m, to more than 0.50m. These results are illustrated in Fig. (4), and
Egypt.J.of Appl. Sci. , 20(6 B) 682-700,(2005)
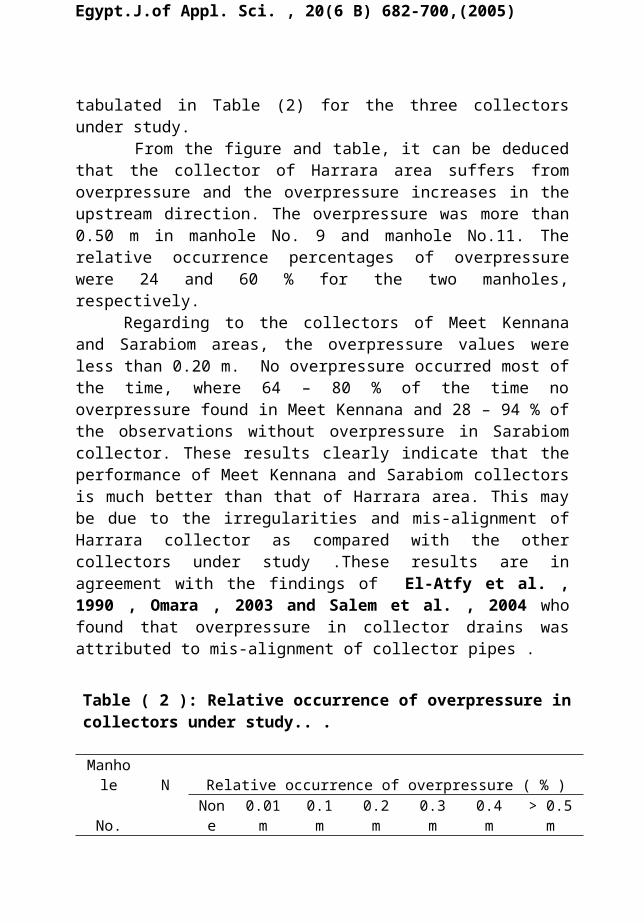
tabulated in Table (2) for the three collectorsunder study.
From the figure and table, it can be deducedthat the collector of Harrara area suffers fromoverpressure and the overpressure increases in theupstream direction. The overpressure was more than0.50 m in manhole No. 9 and manhole No.11. Therelative occurrence percentages of overpressurewere 24 and 60 % for the two manholes,respectively.
Regarding to the collectors of Meet Kennanaand Sarabiom areas, the overpressure values wereless than 0.20 m. No overpressure occurred most ofthe time, where 64 – 80 % of the time nooverpressure found in Meet Kennana and 28 – 94 % ofthe observations without overpressure in Sarabiomcollector. These results clearly indicate that theperformance of Meet Kennana and Sarabiom collectorsis much better than that of Harrara area. This maybe due to the irregularities and mis-alignment ofHarrara collector as compared with the othercollectors under study .These results are inagreement with the findings of El-Atfy et al. ,1990 , Omara , 2003 and Salem et al. , 2004 whofound that overpressure in collector drains wasattributed to mis-alignment of collector pipes .
Table ( 2 ): Relative occurrence of overpressure in collectors under study.. . Manhole N Relative occurrence of overpressure ( % )
No. None
0.01m
0.1m
0.2m
0.3m
0.4m
> 0.5m
Egypt.J.of Appl. Sci. , 20(6 B) 682-700,(2005)
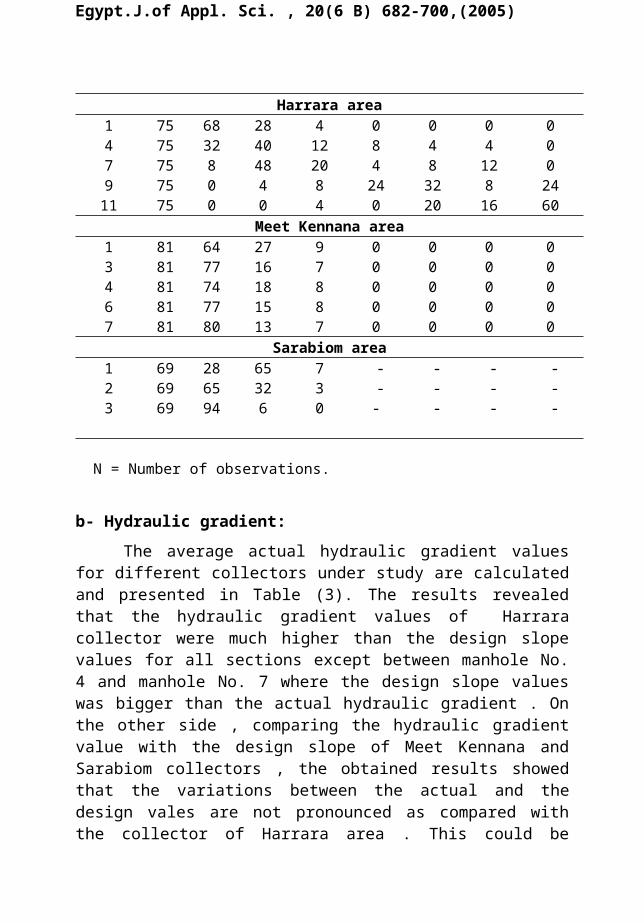
Harrara area1 75 68 28 4 0 0 0 04 75 32 40 12 8 4 4 07 75 8 48 20 4 8 12 09 75 0 4 8 24 32 8 2411 75 0 0 4 0 20 16 60
Meet Kennana area1 81 64 27 9 0 0 0 03 81 77 16 7 0 0 0 04 81 74 18 8 0 0 0 06 81 77 15 8 0 0 0 07 81 80 13 7 0 0 0 0
Sarabiom area1 69 28 65 7 - - - -2 69 65 32 3 - - - -3 69 94 6 0 - - - -
N = Number of observations.
b- Hydraulic gradient:The average actual hydraulic gradient values
for different collectors under study are calculatedand presented in Table (3). The results revealedthat the hydraulic gradient values of Harraracollector were much higher than the design slopevalues for all sections except between manhole No.4 and manhole No. 7 where the design slope valueswas bigger than the actual hydraulic gradient . Onthe other side , comparing the hydraulic gradientvalue with the design slope of Meet Kennana andSarabiom collectors , the obtained results showedthat the variations between the actual and thedesign vales are not pronounced as compared withthe collector of Harrara area . This could be
Egypt.J.of Appl. Sci. , 20(6 B) 682-700,(2005)
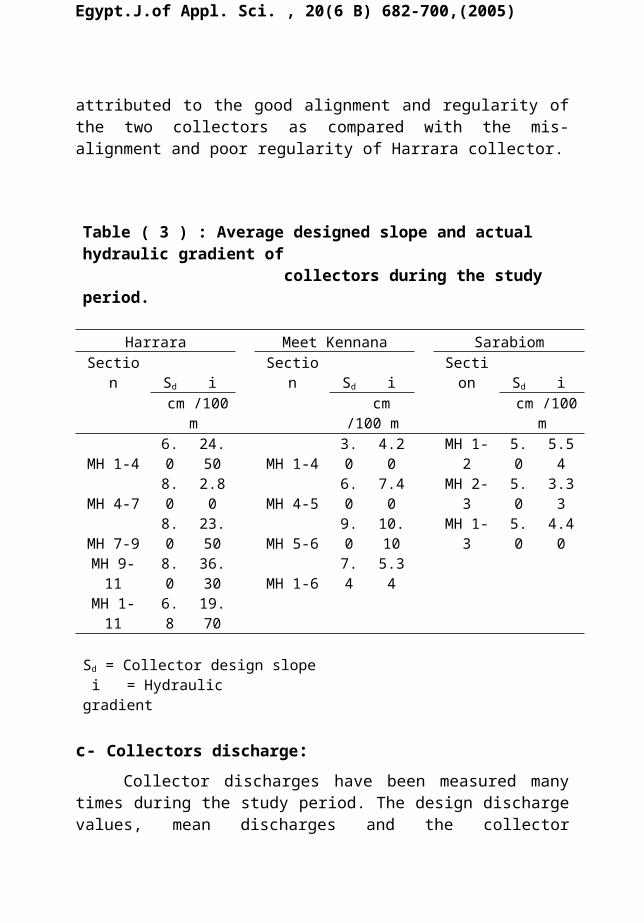
attributed to the good alignment and regularity ofthe two collectors as compared with the mis-alignment and poor regularity of Harrara collector.
Table ( 3 ) : Average designed slope and actual hydraulic gradient of collectors during the study period.
Harrara Meet Kennana SarabiomSectio
n Sd i Sectio
n Sd i Section Sd i
cm /100
m cm
/100 m cm /100
m
MH 1-46.0
24.50 MH 1-4
3.0
4.20
MH 1-2
5.0
5.54
MH 4-78.0
2.80 MH 4-5
6.0
7.40
MH 2-3
5.0
3.33
MH 7-98.0
23.50 MH 5-6
9.0
10.10
MH 1-3
5.0
4.40
MH 9-11
8.0
36.30 MH 1-6
7.4
5.34
MH 1-11
6.8
19.70
Sd = Collector design slope
i = Hydraulic gradient
c- Collectors discharge:Collector discharges have been measured many
times during the study period. The design dischargevalues, mean discharges and the collector
Egypt.J.of Appl. Sci. , 20(6 B) 682-700,(2005)
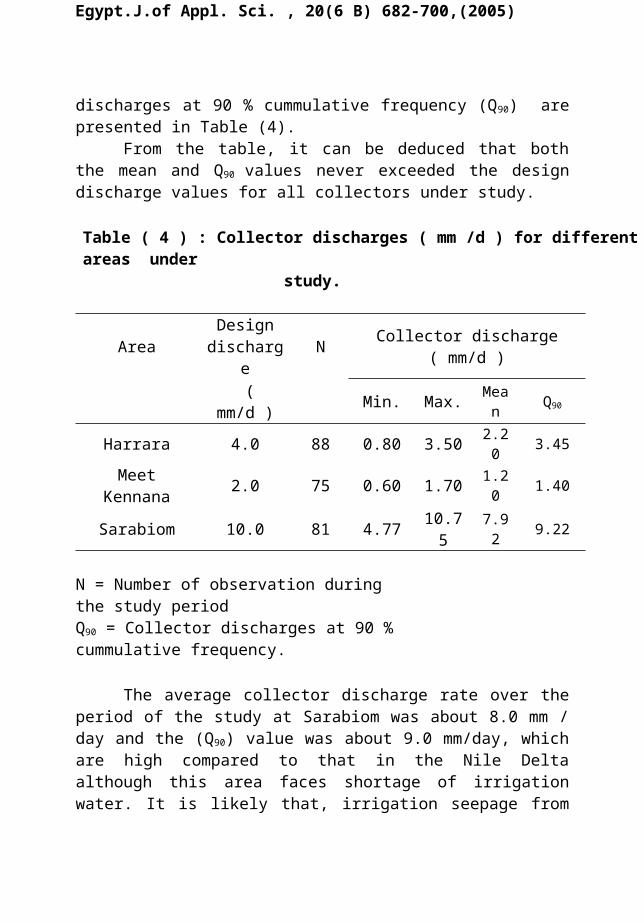
discharges at 90 % cummulative frequency (Q90) arepresented in Table (4).
From the table, it can be deduced that boththe mean and Q90 values never exceeded the designdischarge values for all collectors under study.
Table ( 4 ) : Collector discharges ( mm /d ) for differentareas under study.
AreaDesigndischarg
eN Collector discharge
( mm/d )
(mm/d ) Min. Max. Mea
n Q90
Harrara 4.0 88 0.80 3.50 2.20 3.45
MeetKennana 2.0 75 0.60 1.70 1.2
0 1.40
Sarabiom 10.0 81 4.77 10.75
7.92 9.22
N = Number of observation during the study periodQ90 = Collector discharges at 90 % cummulative frequency.
The average collector discharge rate over theperiod of the study at Sarabiom was about 8.0 mm /day and the (Q90) value was about 9.0 mm/day, whichare high compared to that in the Nile Deltaalthough this area faces shortage of irrigationwater. It is likely that, irrigation seepage from
Egypt.J.of Appl. Sci. , 20(6 B) 682-700,(2005)
surrounding higher areas with sandy soils canattributed to the drain discharge
Bearing in mind that the discharge was smallerthan the designed rates, as general for the threecollectors under study, and as the actual hydraulicgradient exceeded the design slope, the performanceof subsurface drainage system over the project lifetime depends to a great extent on the quality ofinstallation of collector drains. These findingsare coincided with Abdalla , 1991 ; Abdel-Dayem andEl-Atfy , 1992 and Salem et al. , 2001.
CONCLUSIONS AND RECOMMENDATIONSThe analysis of the data collected in this
study have lead to the following conclusions and recommendations:1- Use of laser equipment in the execution of
collectors resulted in improving the alignment, quality of pipe installation and consequently thehydraulic performance of the collectors.
2- The laser equipment should be commonly used in the implementation of subsurface drainage. It should be also included in EPADP tenders for drainage construction.
3- Pre-wrapped perforated polyethylene collectorpipes are recommended in unstable collapsingsoils and under wet conditions of trench toprevent pipe floating during the execution of thecollectors. Moreover, it is helpful to lower thewater table in the trench before implementing thecollector.
Egypt.J.of Appl. Sci. , 20(6 B) 682-700,(2005)
4- Future implementation needs more careful and close supervision. Furthermore, training of operators and supervisors should be seriously considered and more strict quality assurance measures should be adopted.
5- All collectors under the study have an averagedischarge that is below the design value, so thedesign discharge values should be adjustedaccording to the actual field measurements.
REFERENCESAbdalla. M.A.M., (1991). The collectors performance
for subsurface drainage system as related to physical properties of some Egyptian soils. A thesis submitted in partial fulfillment of Master Degree (Soil science), Dept. of Soils, Fac. of Agric, Ain Shams Univ.
Abdel-Dayem, M.S. and H.El-Atfy, (1992). Quality checking of subsurface drains using Rodding techniques. Proc. of 5th Int. Drainage Workshop,Lahore, Pakistan, Vol.1.
Cavelaars, J.C., (1985). Survey and design for subsurface drainage in Egypt. Report on a consultancy mission in Feb.-March, 1985, Code 5-09.023- Arnhem , The Netherlands , pp. 1-34 .
Dierickx, W., (1990). Development and shortcomings in drainage technology. Symp. on land drainage for salinity control in arid and semi-arid regions, Vol.1, held in Cairo , Feb. 25th – March 2nd , 1990, Cairo , Egypt , pp: 93-109 .
El-Atfy , H. ; O. Wahid El-Din ; H. El-Gamal and H.P. Ritzema, (1990). Hydraulic performance of
Egypt.J.of Appl. Sci. , 20(6 B) 682-700,(2005)
subsurface collector drains in Egypt. Proc. of the Symp. on Land Drainage of Salinity Control in Arid and Semi-arid Regions , held in Cairo ,Feb. 25th – March 2nd , 1990, Cairo , Egypt , pp: 393-404.
ILRI., (1974). Discharge measurement structures. Pub. No. 20, ILRI, Wageningen , The Netherlands.
Luthin , J. N., (1978). Drainage Engineering. R.E. Krieger Publishing Co. , Huntigton , New York ,515 – 707 .
Omara , M. A ., (2003). Assessment of laser technology application on the performance of subsurface drainage systems. Paper presented atthe 9th International Drainage Workshop, Sept. 10-13, Utrecht. The Netherlands.
Oosterbaan , R. J. and V.Sorbello-Herrendorf, (1982). Programmed guide for evaluation of drainage techniques in standarized experimentalfields , ILRI , Wageningen , The Netherlands .
Piper ,C. (1950) . Soil and plant analysis .InterScience Publishers Inc., New York .
Salem M.H.E; M.K.Abdel Aleem; N.M.Badr and S.A.Abdel Mawgoud. (2001). Drainage pipe cloggingand need for a suitable envelope material ofthe existed drainage projects at the Nile Delta, Egypt. J. App . Sci. 16 ( 1 ) : 250-261 .
Salem M.H.E ; M.A.M.Abdalla ; N.M.Badr andM.K.Abdel Aleem . (2004) . Verification of somedrainage parameters and the performance ofcollector drains in northwest of the NileDelta, Egypt . Minufia J. of Agric. Res. ,
Egypt.J.of Appl. Sci. , 20(6 B) 682-700,(2005)
Menufia University , Shibin El-Kom , Egypt .Vol. 29 ( 6 ) : 1503-1521.
Schultz , B., (1990) . ( Editor ) . Guidelines onthe construction of horizontal subsurfacedrainage systems . Working Group on DrainageConstruction , International Commission onIrrigation and Drainage ( ICID ) .
Van Beers , W.F.J . (1976) . The auger holemethod . Bull. No. 1 , ILRI , Wageningen , TheNetherlands .
Van Somern , O.L. (1984) . Drain installation . Drainage and salinity control for agricultural lands in Egypt , Lecture no.16 Training course , March 24 – April 19 , 1984 . Advisory Panel on Land Drainage in Egypt / ILRI , The Netherlands , pp: 1-5 .
م م�دى ي� ي� ق ة ل�ت ارن�� اء دراسة م�ق ش� ن�� ودة ا� �عض� ج� �معات ال�صرف#� ب� �امم�ج ظ. ى ن�� ة ف� سي� ي� ال�رئ�6ة ى ال�رم�لي� ى الاراض� لها ف� ي� غ� ش� اءة ن� م م�دى ك�ق� ي� ي� ق طى وب� ال�صرف#� ال�مع�
د ال�لة و �عم م�جمد# ع�ي د ال�مت� �نN عم�جمد ع�ي �Pي ح�مد م�جمد# م�جمد د ال�لة ا6 �د س�ال�م و م ب نN ال�سي� �ى حمد ح�شي� Zرن ى ق� و م�صطف�م د ال�علي� �ع�ي
ة ي� bcب ة م�صر ال�عر مهورن�� �ة ، ح� ر� ي� �ة ، ال�ج راع�ي� حوت� ال�ر� �ة ، مرك�ر� ال�ب ي6 rي �اة وال�ي ى وال�مي� راض� حوت� الا6 �م�عهد ب�
ى �vن ض ال�عر ال�ملخ�
Egypt.J.of Appl. Sci. , 20(6 B) 682-700,(2005)
ي�Pت ر �ة اج###� د� ة ال�دراس###ة ه###� لي###� م ك�محاول###ة ال�حق ي� ي� ق### دى ل�ت ودة م###� �اء ج###� ش###� ن�� مع###ات ا� �ال�ص###رف� م�جة س####ي� ي� وعة ال�رئ�6 ك� م�نN ال�مص####ن� ي� ي لاس####� �ى ال�ي ى ف� ة الاراض� ل�ك� ال�رم�لي####� د� ق وك####� حق#### دى م�نN ال�ب� ة م####� ق#### �م�ظاب�
م ي� ة ال�ق علي� ول م�نN ل�كل ال�ق� مع#ات م�ن#� �درجN ال�مج كى وال�ي## درول�ي� ات ال�هي##� ص##رف�� مع##ات ون� �م ال�مج ي� ل�لق
ة مي� ص##مي� د� ال�ت ق##� ها ع�لى ال�مت� س�اس##� ة ا6 د� مع##ات ه##� �ى ال�مج ل ف� ة م�ي� د� ى ه##� ة ، الاراض� اف� الاض##�� �م الى ب� ي� ي� ق## دى ب� م##�اءة داء ك�ق� كى الا6 درول�ي� ة ال�هي� معات ل�هد� �حت ال�مج . ال�دراسة ب�
د م ول�ق ار ت� ي� ي لات� اخ�� معات ب�� �ة م�ج س##ي� ي� ة رئ�6 كي� ي� ي لاس##� �ة ب� د� ق##� ى م�ت� ى ف� راض� ة ا6 مع رم�لي##� �ول : ال�مج الا6م ارة ت� ي##� ي ة اخ�� طق## مت� �رارة ب� ى ج##� ت ع ال##� ق مال ب� رت� ن��ش##� ا غ##�� دل�ي رت� ال##� ة ق##� ي##� ب±� ه##ور م�د ى دم�ن� ت ع وال##� ق منN ب� ض##��
ام م###� ة ر� ظ###. رة م�حاف�� ج###ي� �ص####رف� ، ال�ب مى وال�ت ص###مي� وم م�م4 لة ال�ت ما ، / ي###�� ي� rي bم ئ� ار ت� ي###� ي مع اخ�� ��ى ال�مج Zان ى ال�ي###� ف�ة طق### ت م�ت� ة م�ي� ان###�� ى ك�ي� ت ع ال###� ق ة ع�لى ب� والى م�ش###اف� ة م�نN ك�م40 ج###� ي###� ب±� اه�رة م�د منN ال�ق### ام ض###�� م###� ة ر� ظ###. م�حاف��
ة ي###� b±ب و لن� ص###رف� ، ال�ق مى وال�ت ص###مي� ا ال�ت مع ل�ه###د� �وم م�م2 ال�مج ا ، / ي###�� د� ة ه###� اف� ض###�� الا� �مع الى ب� �ال�ت� ال�مج ال�ي###�ى د� ع ال##� ق ة ب�� طق## مت� �وم ب� ن� bPب ى س##را ت عد ال##� �ت ة ع�نN ب� ي##� ب±� ة م�د لي� ماع�ي� ح##والى الاس##� �ا ك�م20 ب� �وب� ن� �ص##رف� ، ح� وال�ت
مى ص#########مي� وم م�م10 لة ال�ت د / ي#########�� م . وف� د� ت� ي#########� ق� ت� مع#########ات ب�� �لات� ال�مج ات ال�ي� ي#########� ماك�ي� �اص#########ة ال�حف�ر ب� ال�ح�مع##ات �ال�مج �ة ب� س##ي� ي� در ال�رئ�6 �ح## ارة . وب� ة الى الاس##�� ن�� م ا6 د� ت� ي##� ق� ت� مع##ات ب�� �ى م�ج ت طق## ت م�ت� ة م�ي� ان##�� وم ك�ي� ن� bPب وس##را
Nع�ن ق �c###ي حكم ط�ر ى ال�ب� ت� ع�م###ق ف� ي� اس###� ر ال�مص###ارف� وم�ي� ر� ال�لي� �ما ب###� ي� rي bر ئ� ع###د� دامة ب� ح� ت مرار اس###� ي اس###� �ى ب� ف�مع �ة م�ج طق را ج�رارة م�ت� ظ#. د� ن�� ي#� ق� ت� ى ل�لي� روف� ف� ة ط##�. �ت� رط�ي## انN ح�ي� دق ك##� ن##� ا ال�حف�ر ح�� ق م�عرض�� دف� ال�م#اء ل�ي#
ى مرار الارض� اس�ي �اء ب� ي� ÙPب د� ا ي� ق� ت� صغت� م�ما ال�ي� حكم ن�� ى ال�ب� ت� ف� اس�ي� . ال�مي�
Egypt.J.of Appl. Sci. , 20(6 B) 682-700,(2005)
د ه#######رت وف� ظ�. جN ا6 6Zاب ي####### خصل ال�ي� ها ال�مب� ى ع�لن� ة ف� د� نN ال�دراس#######ة ه#######� م ا6 ات م�عظ. ظاع#######� مع ف� �م�ج
ة طق####### رارة م�ت� انN ج#######� ل ك#######� على ال�مي� ط ال�ق� مع ل�خ� �ع�لى ال�مج ل م�نN ا6 مى ال�مي� ص#######مي� ل ووض�ل ، لة ال�ت ال�مي�على ال3 – 2 الى ال�ق� م�ي#####� ل ا6 مى ال�مي� ص#####مي� ى وض�ل ك�ما ال�ت عض� ف� �اء ب� ر� �ج#####� مع ا6 �ال4 الى ال�مج م�ي#####� ا6م#####ة ي� ة ال�ق مي� ص#####مي� ة ال�ت ص#####ق� �انN ع�ام#####ة . ون� ل ك#####� على ال�مي� د ال�ق� �Zدب ح#####دار س#####�� ى الاب�� عض� وف� �ات ب� ظاع#####� ال�ق
وى ى م�س###ن ات وف� ظاع###� رى ف� مع م�نN اج###�� �انN ال�مج ل ك###� ا وع�لى ، م�عكوس�ا ال�مي� د� اس ه###� د الاس###� ق ام�كنN ف��ف� ت� ص###ي� مع ن� �ة ع�لى ال�مج ن�� ف� ا6 غت� ى ض###�� ة ف� �ام درج### ظ###. ت اregularity الاب�� ق �ة ط�ت ق### �Pب ع###ة ل�لظر �ت ى ال�مي ف�
م ي� ي� ق ة ال�ت هد� �ع ، ال�دراسة ب� �ل�ك� وي�Zرج� د� الى د� ي� ق� ت� دوى ال�ي� م ال�ي#� اء ل�معظ. ر� �ج#� مع ا6 �حت ال�مج روف� ب� ال�ظ#.ة �دق ال�رط�ي ن� درة ع�دم ع�لى ع�لاوة ال�حف�ر ل�ح� دام ع�لى ال�ق ح� ر اس�ت ر� حكم ال�لي� ى ل�لب� ة ف� ت� دف اس�ي� را ال�مي� ظ##. ن��
ة روف� ل�هد� . ال�ظ.م�ا ة ا6 �س###ي ال�ي� �مع ب� �ة ل�مج طق### ت م�ت� ة م�ي� ان###�� د ك�ي� ق حت ف�� وض###�� نN ال�دراس###ة ا6 وس�ط ا6 ل م�ن على ال�مي� ال�ق�
مع �انN ل�لمج ا ك#####� �ي rvب فر ا ب� م#####ة م�ش#####اوب�� ي� ة ل�لق مي� ص#####مي� ما ، ال�ت ي� rي bئ� Nان ل ك#####� على ال�مي� مع ال�ق� �ود ل�لمج �ة ال�موج#####� طق##### مت� �ب�وم ن� bPب ة س###را لي� ماع�ي� س###� الا� �ر ب� �ي ا اك###� ي� bش###ي م###ة م�نN ن�� ي� ة ال�ق مي� ص###مي� ت� ال�ت انN ح�ي� ل ك###� د ال�مي� �Zدب ح###دار س###�� م�ا الاب�� ا6
ة �ام درج ظ. ت ب�� دة الا� ي� �" . " ح�ة صق� �نN ع�امة ون� ا� اة ا ف�� ة ل�محاد� معات ال�طول�ي� �ة ل�لمج �Z##لان حت ال�ي� alignment ال�دراس##ة ب�
ة �س##ي ال�ي� �ل ب� على ل�لمي� اي��ت لة ال�ق� ل##ف� ك##� ن ح� م##ة ع�نN ب� ي� ة ال�ق مي� ص##مي� ة ول�كنN ال�ت �لاف� درج# ن ل##ف� الاح�� ن ح� ب�Nمع م�ن �ر م�ج ج�� öد لا ق انN ف�� لاف� ك###� ن م###ة ع�نN الاح�� ي� ة ال�ق مي� ص###مي� ي�ر ال�ت ك###± وخ�ا ا6 ى وض###�� مع ف� �د� ال�مج ق###� ة ال�مت� طق### مت� �ب�
ا ج�رارة ورنN م�ا اد� معات ف �مج �ى ب� ت طق ت م�ت� ة م�ي� ان�� وم ك�ي� ن� bPب . وسرا

Egypt.J.of Appl. Sci. , 20(6 B) 682-700,(2005)
ة �سي ال�ي� �م وب� ي� ي� ق كى الاداء ل�ت درول�ي� معات ال�هي� �ة ل�لمج �Zلان حت ال�ي� كZدت ال�دراسة ب� ا6 جN ف�� 6Zاب ي ال�ي�خصل ها ال�مب� نN ع�لن� مع ا6 �د� ال�مج ق####� ة ال�مت� طق#### مت� �رارة ب� انN ج####� �ى ك####� Zع####ان ص####ورة ب�� �جة ن� ود م�نN واض####�� �ط وج####� اغ�� ض####��
كى درول�ي� د ه�ي######� اب�6 دادoverpressure ر� ر� �Z######ى وي اة ف� �ح###### ات اب� هاب######�� ا ال�ن� مع ال�علي� �ما ل�لمج ي� rي bئ� Nان ك######�كى الاداء درول�ي� مع##ات ال�هي##� �ى ل�مج ت طق## ت م�ت� ة م�ي� ان##�� وم ك�ي� ن� bPب ل وس##را ص� ف�� مع م�نN ا6 �ة م�ج طق## . م�ت� رارة ج##�
يت ك�ما �ي �Zئ جN ا6 6Zاب ي####### نN ال�ي� روق ا6 يrنN ال�ف#######� �م ئ� ي� درجN ق� كى ال�ي####### درول�ي� م ال�هي#######� ي� ة وال�ق مي� ص#######مي� ل ال�ت ل�لمي�مع##ات �مج �ى ب� ت طق## ت م�ت� ة م�ي� ان##�� وم ك�ي� ن� bPب اي��ت وس##را ر ك##� ي� جة ع##� ا واض##�� وري��ت م�ا اد� مع ف## �ال�مج �د� ب##� ق##� ة ال�مت� طق## مت� �ب�رارة دت . ك�ما ج#####� P#####ك ات ا6 اس#####� ي� ة ال�ق لي#####� ات ال�حق ص#####رف�� مع#####ات ل�ت �ة ال�مج �Z#####لان حت ال�ي� نN ال�دراس#####ة ب� ا6
ات ص####رف�� ة ال�ت علي� ل ال�ق� م م�نN اف� ي� ة ال�ق مي� ص####مي� ات ال�ت ص####رف�� ى ل�لت ت ممت ال####� ها ع�لى ض####� س�اس####� ة ا6 د� ه####�معات �. ال�مج