a commodity subsector approach to the design of agricultural
376
, , A COMMODITY SUBSECTOR APPROACH TO THE DESIGN OF AGRICULTURAL RESEARCH: THE CASE OF MAIZE IN MALI By Duncan Harvey Boughton A DISSERTATION Submitted to Michigan State University in partial fulfillment of the requirements for the degree of DOCTOR OF PHILOSOPHY Department of Agricultural Economics 1994
-
Upload
khangminh22 -
Category
Documents
-
view
2 -
download
0
Transcript of a commodity subsector approach to the design of agricultural
, ,
A COMMODITY SUBSECTOR APPROACH TO THE DESIGN OF AGRICULTURALRESEARCH: THE CASE OF MAIZE IN MALI
By
Duncan Harvey Boughton
A DISSERTATION
Submitted toMichigan State University
in partial fulfillment of the requirementsfor the degree of
DOCTOR OF PHILOSOPHY
Department of Agricultural Economics
1994
ABSTRACT
A COMMODITY SUBSECTOR APPROACH TO THE DESIGN OF AGRICULTURALRESEARCH: THE CASE OF MAIZE IN MALI
By
Duncan Harvey Boughton
This study examines the potential contribution of a commodity subsector
approach to the design of agricultural research programs through a case study of
agricultural production, processing, and demand for maize in Mali. The framework
stresses how conditions at one level of a subsector influence constraints and
opportunities for technical and institutional innovations at other levels.
The study examines the historical impact of maize technology development
and diffusion in Mali. Farm-level adoption of intensive maize was rapid, given
guaranteed prices and a vertically integrated technology delivery and output
marketing system provided by Mali's cotton parastatal. Subsequent cereal market
liberalization and !ncreased aggregate cereal production resulting from improved
rains caused maize prices to fall. Farmers adopted more extensive cultivation
techniques in response.
A rapid interdisciplinary appraisal of the maize subsector confirmed that
expansion was hindered by "thin market" characteristics. Only a small proportion of
maize is traded through the market, and quantity and quality are unpredictable. The
rapidly growing urban population is a potential source of increased demand for
maize to broaden the market. Processing difficulties and unfamiliarity with maize
were identified as the main constraints for urban consumers.

Opportunities to expand urban demand for processed maize products are
explored in detail. A one-year study of cereal procurement and consumption was
undertaken in the capital city, Bamako. The potential dema~d for maize flour was
estimated with a Tobit model using contingent valuation data obtained through
household consumption tests of different quality flours (dehulled and whole grain).
Demand for maize flour appears adequate to support financially viable processing
units, but is unlikely to significantly increase aggregate urban demand for maize
because of low household processing costs, which reflect the low opportunity cost
of women's time. Increased maize processing costs following the January 1994
devaluation of the CFA franc will further dampen short-run demand. Whole grain
flour is significantly cheaper than dehulled flour, which suits the need of poor urban
consumers.
Given the significant increase in fertilizer prices following devaluation,
opportunities for technological innovations to improve farm-level productivity are
also studied.
Copyright by
DUNCAN HARVEY BOUGHTON
1994

In memory of fellow students David W. Makanda and F. Kapola Sipula
v
ACKNOWLEDGMENTS
When it takes as long to reach a certain stage of intellectual development as
it has taken me, one has accrued debts to many individuals who deserve to be
acknowledged. I have indeed benefited immeasurably from the opportunity to be a
part of the community of graduate students, faculty and support staff that make up
the Department of Agricultural Economics at Michigan State University.
I am especially thankful to Professor Eric Crawford, my major professor, and
Professor John Staatz, my thesis adviser. During the five years I spent in The
Gambia as a hatchling agricultural economist prior to coming to MSU, I longed for a
professional mentor. Eric Crawford and John Staatz have exceeded all possible
expectations, and I am very grateful for their encouragement, guidance, humor and
steadfastness throughout my program, and for reminding me that my family is more
important than academic achievement. I am thankful to each of my committee
members, Professors Jack Meyer, Thomas Reardon, Jim Shaffer and Jeff
Wooldridge for their expert and unique contributions. Professor Meyer patiently
enabled me, through his excellent teaching skills and an untold number of office
visits, to achieve functional numeracy. Professor Reardon brought a consumption
dimension to the field research phase, both theoretically and gastronomically.
Professor Shaffer reminded me what my dissertation was about when I could no
longer see the wood for the trees, and Professor Wooldridge guided me safely
through the minefields of econometrics. I am also very thankful to Professor
vi
Michael Weber for helping me to appreciate the importance of market demand for
agricultural technology development, and for providing valuable insights from
studies in Eastern and Southern Africa of relevance to this study.
The study is the result of a collaborative effort between many individuals in
the private and 'Public sectors and the donor community in Mali. I am grateful to
the United States Agency for International Development (USAID), Mali country
mission, Africa Bureau and Research and Development Bureau, and to the
multidonor Mali Cereal Market Restructuring Program (PRMC) for funding this
research. ' The intellectual contributions and encouragement provided by David
Attwood, Amadou Camara, Dr. Charles May and Catherine McIntyre of the USAID
Mali mission were especially valuable. I am also particularly grateful to Dr. Josue
Dione and Bakary Kante of the food security program of the Institut du Sahel
(PRISASIINSAH) for assistance with the design and funding of the reconnaissance
phase of the study. The technical committee of the PRMC made valuable
contributions to the design and implementation of the study, and their keen interest
at all stages is much appreciated.
The study benefitted from the strongest possible support from the Institut
d'Economie Rurale (IER), and IER's Departement Planification Agricole et Economie
Rurale (DPAER) which undertook the study. I am thankful to Dr. Mamadou Go"ita
and Dr. Oumar Niangado, former and present Director General of IER respectively,
for their commitment to the incorporation of marketing studies into IER's research
, USAID funding was provided through the Food Security in Africa CooperativeAgreement (No. DAN-1190-A-00-4092-00) and the Food security II CooperativeAgreement (No. AEP-5459-A-OO-2041-00).
vii
program. As head of DPAER, Fousseyni Mariko, and his successor Bakary
Coulibaly, provided valuable administrative and technical oversight.
A very special word of thanks must go to my counterparts, Bino Teme (now
Director of Research at IER), and his successor Ousmane Sanogo. Bino Tame took
a lead role in conceptualizing and implementing all phases of the maize subsector
study, in establishing vital links with other research programs, ministries and
parastatals, and in convincing our technical colleagues and donors of the study's
merit and promise. Without him, the study would have accomplished only a small
fraction of what it set out to do. In addition, his wit and energy made every task
more agreeable and turned every problem into a challenge rather than a
disappointment. Throughout the study, he provided valuable insights on Malian
culture that enriched my understanding and enabled me to avoid, for the most part,
giving offense as a consequence of either my cultural ignorance or arrogance.
Ousmane Sanogo took over this challenging role with equal commitment and humor.
I especially commend him for his great patience and good will in correcting my
appalling French.
The study benefitted from active collaboration with several of IER's research
programs. I am grateful to the late Ibrahim Goita and Madame Assa Bora Kante of
the Food Technology Laboratory, N'tji Coulibaly of the Maize program, and Johann
Brons, Abdoulaye Camara, M. Doucoure, Toon Defoer and Margo Kooijman of the
Sikasso Farming Systems team. I am also grateful to Lloyd Rooney of Texas A&M
University, Domien Bruinsma, independent consultant, and Christian Mestres,
Genevieve Fliedel, and Jacques Faure of the Cereals Technology Laboratory, CIRAD,
for assistance with the design and evaluation of the food technology component of
viii
the maize subsector study. Georges Raymond, Jean-Louis Fusillier and Alain
Leplaideur, economists with CIRAD, also provided valuable orientation en route to
Mali.
My heartiest thanks go to the study's unflagging team of enumerators and
supervisors - Awa Berthe, Rokia Cisse, Sidi Diallo, Abdou Diarra, Naman Ke"ita,
Hadaidja Ma·iga, Malado Sangare and Maimouna Tounkara - who completed an
intricate year..long study with distinction. M. Traore provided stoic data entry
services, Odette Kalambry lively secretarial support, and the infallible Adama Kante
made the photocopier work. Martine Keita kept our project accounts in impeccable
order. Thanks also to Mamadou Ke"ita for his safe driving.
Many individuals in the private sector made important contributions to the
study. I am grateful to the members of the Groupement d'interet Economique
SAMA; who processed the maize flour samples for the consumer tests, and the
management and technical staff of Grands Moulins du Mali who patiently explained
the technical intricacies of industrial maize milling and provided processing cost
estimates. I am especially grateful to the 120 Bamako households who endured a
one-year survey of their cereal consumption patterns with generous hospitality and
humor. Farmers, transporters, cereal traders, poultry producers, mill operators,
fresh maize growers and wholesalers all responded to our innumerable questions in
a friendly and constructive way.
The study benefited from strong collaboration with several public sector
organizations. The initial rapid appraisal of the subsector was undertaken in early
1992 by an interdisciplinary team comprised of Bakary Go·ita from the Compagnie
Malienne pour Ie Developpement des Textiles (CMDT), Francis Ke·ita, Abdramane
ix

Traore, Pierre Traore and Jim Tefft of the cereals Market Information System (SIM),
Modibo Diarra of the National Institute for Public Health Research (INRSP), and
Bakary Sanogo of the National School of Higher Education (ENSUP). The Direction
Nationale de la Statistique et de l'lnformatique (DNSI) provided the sampling frame
for the formal survey. The SIM provided valuable advice and price information
throughout the life of the study, and Jim Tefft generously responded to many
requests for assistance with computer software and hardware. M. Niang and
Franr;:ois Giraudy of the CMDT's monitoring and evaluation unit shared data
resources and made possible the farm-level survey of varietal adoption.
I would also like to sincerely thank the administrative staff of the Department
of Agricultural Economics, Vicky Branstetter, Nancy Fair and Janet Munn, for their
painstaking work on travel itineraries, procurement of equipment, processing of
accounts, and taking care of the many details necessary to effective field research.
I am also deeply indebted to present and former staff of the Department's Computer
Service, Elizabeth Bartilson, Margaret Beaver, Lisa Besko, Jeff Wilson and Chris
, Wolf for their patience and expert advice.
I would like to express my profound thanks to the members of University
Reformed Church in East Lansing, who have surrounded myself and family with
generosity, love and prayer throughout our time in East Lansing. I am particularly
grateful to Pastor Tom Stark and the men's bible study group for their faithful
prayer support during the past year. In Mali too, the men's bi-weekly prayer
breakfast and our couples' bible study were a source of great encouragement.
Through the many experiences that have resulted in this volume I can now confirm
with them that "nothing is impossible for God".
x

Finally, my greatest debt is to my wife Alison, daughter Hannah and son
Matthew, who have tolerated the intolerable for far too long. Thank you for the
love you give and the joy you bring. After six years I say to you - it's your turn
now.
xi

TABLE OF CONTENTS
LIST OF TABLES .....•.•...•...........••... , ........•. , . .. xviii
LIST OF FIGURES •.•.••••••••.•••.......•••...•••••..•••.•• xxi
ABBREVIATIONS • . . . . . . • . . • • • • • • • . . . . . . . • . • • • . . . . . • • . . . • . .. xxiii
CHAPTER ONE: INTRODUCTION ••••••••......•--••• ; .•••....... 1
1.1 The challenge: increasing the payoff to investment inagricultural research in Africa . . . . • . . . . . . . . • . . . . . . . . . . . 1
1.2 The opportunity: incorporating marketing considerations intoagricultural research planning .•. . . . . • • . . . . . . • • . . . • • . . . 3
1.3 The context: Mali's national agricultural research program andthe role of the maize subsector study .....••.....•....... 5
1.4 Objectives of the dissertation • . . . • . . . . . . . . . . . . . . • . . . . • 8
1.5 Outline of the dissertation ......•................•..• 9
CHAPTER TWO: CONCEPTUAL AND METHODOLOGICAL FRAMEWORK 11
2.1 The relationship between markets and incentives fortechnology adoption •••••.••........•.......••..... 12
2.2 The food systems matrix as an integrative framework foragricultural research and development questions .••.•..•... 13
2.3 The role of demand articulation in food system innovation ... 20
2.3.1 Demand articulation and consumer theory .•....•...• 21
2.3.2 The role of public and private sector research infacilitating demand articulation •••.•.•..•••...•..• 23
2.4 Outlines of methods used ...••••••••••....•••.•.•... 26
2.5 Summary II II • II II • II II II • III •••••••••••••••••••• II 29
xii

CHAPTER THREE: HISTORICAL DEVELOPMENT PATH AND IMPACT OFFARM-LEVEL MAIZE TECHNOLOGY 30
3.1 Objectives and methods 31
3.2 History of maize research in Mali 35
3.2.1 Initial establishment of a rainfed cereal crop varietalimprovement program (1964-1980) 35
3.2.2 Towards an integrated approach to maize research(1980-present) 39
3.3 The diffusion of maize technology in Southern Mali 48
3.3.1 Development and policy background to the take-off ofmaize in Southern Mali .....•...........•....... 50
3.3.2 Technology adoption in the CMDT and OHV zones(1975-1990) 55
3.4 Costs and benefits of maize technology development anddiffusion ....•...•..•....•••.................... 61
3.4.1 Farm-level financial analysis 61
3.4.2 Economic impact of maize technology development anddiffusion in Southern Mali 76
3.5 Implications for future agricultural technology developmentand diffusion 78
CHAPTER FOUR: OVERVIEW OF THE MAIZE SUBSECTOR IN MALI ..... 83
4.1 Approach and methods for the preliminary appraisal of themaize subsector ••..•...••...........••........... 83
4.2 Descriptive analysis of the maize subsector in Mali 84
4.3 Strategic issues for the future development of the maizesubsector 95
4.4 Key research questions for further investigation 98
xiii

CHAPTER FIVE: CEREAL UTILIZATION PATTERNS AMONG BAMAKOHOUSEHOLDS:SURVEYMETHODS ..•........... 100
5.1 Urban cereal consumption patterns in West Africa: concernsfrom the literature 100
5.1.1 Rapid growth in wheat and rice consumption over timeat the expense of locally-produced coarse grains ..•.. 101
5.1.2 Degree and determinants of substitutability between riceand coarse grains ••••••••••...••••..•••..••. 102
5.2 Objectives and methods of the Bamako cereal procurementand utilization surveys ..••••••.••...•..••..•.••... 105
5.2.1 Objectives, sampling method, and content of largesample single-visit survey .•••........••.•.•... 106
5.2.2 Objectives, sampling method, and content of thesubsample frequent-visit survey ..........•....•. 11 0
5.3 Demographic characteristics of single-visit and frequent-visitsurvey households ••..............•••.....•...... 11 2
5.4 Food and non-food expenditures of frequent-visit surveyhouseholds •••••••.•••••.........•...•••....•... 11 8
5.5 Summary ....••.•••..••..••••.••••........•..... 121
CHAPTER SIX: CEREAL UTILIZATION PATTERNS AMONG BAMAKOHOUSEHOLDS: SURVEY RESULTS ..••.......•... 123
6.1 Preferences for pre-processed coarse grains expressed in thesingle shot survey ••.•.••..•....•..•••.....•••... 125
6.2 Household cereal procurement in Bamako 130
6.2.1 Evolution of cereal prices paid by sample householdsDecember 1992 - November 1993 •.••••..••..••. 132
6.2.2 Cereal quantities procured by season and income group 137
6.2.3 Form in which coarse grains procured by season andincome tercile .•...••...•••••••••.....•....• 141
6.2.4 Engel curve analysis
xiv
143
6.3 Cereal consumption patterns: mealtimes and dishes prepared . 150
6.4 Costs of preparing principal rice and coarse grain dishes 158
6.4.1 Research methods
6.4.2 Processing and preparation costs for coarse grains and
159
rice . I •• I •• I •• I ••••••••••••••••••••••• I • •• 162
6.4.3 Cost competitiveness of processed and unprocessedcoarse grains .•.........••....•.....•...... 167
CHAPTER SEVEN: URBAN DEMAND FOR COARSE GRAIN PROCESSINGSERVICES: THE POTENTIAL DEMAND FOR MAIZEFLOUR IN BAMAKO ..........•.........•.... 171
7.1 Approaches to the estimation of potential demand for maizeflour ........••............•..•.•..•.......... 172
7.2 Operationalizing the contingent valuation method: manufactureand household tests of maize flours in Bamako 174
7.2.1 Collaboration with potential maize processors ...••.. 175
7.2.2 Costs of maize flour processing with alternativetechnologies .......................•......• 178
7.2.3 Development and implementation of consumer tests 184
7.3 The demand for maize flour: hypotheses and modelspecification ••.••••••••.....••..•••.•.•.•.....• 198
7.3.1 Hypotheses concerning the demand for maize flour .•. 198
7.3.2 Choice of estimation technique and specification of theequation ....•••••••...•...••••••...•..... 201
7.4 The demand for maize flour: results of the Tobit estimation •. 204
7.4.1 Parameter estimates and significance ..•••........ 204
7.4.2 Estimated demand for dehulled and whole grain flours 209
7.4.3 Price and income elasticities for dehulled and wholegrain flours .. -.- . . . • . . • • • • . . . . . . . • . . . . • • . . . .• 217
7.4.4 Specification issues
xv
233
7.5 Commercial feasibility of maize flour 237
7.5.1 Aggregate demand for maize flour and alternativemarketing strategies 237
7.5.2 An additional option: reducing the cost of de-hullingservices . • . . . . . . . . . . . . . . . . . . .. 245
7.6 Summary findings 246
CHAPTER EIGHT: FARM-LEVEL DEMAND FOR MAIZE TECHNOLOGY ANDIMPLICATIONS FOR AGRONOMIC RESEARCH 247
8.1 Returns to fertilizer use on maize ....•.......•........ 248
8.2 Future location of expansion in maize area 259
8.2.1 Land use intensity and cropping patterns within theCMDT zone ........•...................... 260
8.2.2 Maize area growth trends 264
8.3 Opportunities to increase the productivity of maize: focusingthe agronomic research agenda 267
8.3.1 Options for reducing the cost of fertility amendments 267
8.3.2 Options for increasing the productivity of fertilityamendments 271
8.4 Implications for the organization of maize research 274
8.5 Summary .........••............................ 275
CHAPTER 9: SUMMARY, CONCLUSIONS AND IMPLICATIONS FORAGRICULTURAL RESEARCH IN MALI 277
9. 1 Background to the study •••••.........••.......... 277
9.2 Summary of results • • • • • . . . . • . . . . . . • • . . . . . . • . . . . . 278
9.2.1 Historical impact of maize technology development ... 278
9.2.2 Role of maize in urban cereal consumption ...••...... 280
9.2.3 The potential demand for pre-processed maize flours ... 283
xvi

9.2.4 Devaluation and the profitability of maize cultivation .... 286
9.3 Methodological issues and needed research 287
9.4 Implications for development of the maize subsector and maizerese.arch priorities in Mali 292
9.4.1 Implications for development of the maize subsector inMali 293
9.4.1.1 Opportunities to promote maize processing ..• 293
9.4.1.2 Opportunities to increase farm-level productivity 299
9.4.2 Implications for maize research priorities •••.....•. 302
9.4.3 Implications for research on other cereal subsectors .... 307
9.5 Implications for IER's commodity subsector economicsprogram .•.. . . . . . • . . . . . . . . . . . . • . • • • . . . . . . . . . . . . . 309
9.5.1 Methodological implications ...•.•..••......... 309
9.5.2 Organizational implications .•.....••.•......•.. 310
9.6 Conclusion ••......••.........................• 313
APPENDIX 1: Maize Recommendation Domain Partial Budgets . . . . . • . . . . 315
APPENDIX 2: Maize Subsector Study Research Planning Matrix. . . . . . . . . 322
APPENDIX 3: Milling Costs for GMM and SAMA (selected scenarios) . • • . . 327
APPENDIX 4: Conditional Price Elasticities of Demand for MaizeFlours •••••••.•••••••••.••••••••.........•... 334
BIBLIOGRAPHY
xvii
336
Table 3.1:Table 3.2:
Table 3.3:
Table 3.4:
Table 5.1:
Table 5.2:
Table 5.3:
Table 5.4:
Table 5.5:
Table 5.6:
Table 6.1:
Table 6.2:
Table 6.3:
Table 6.4:
Table 6.5:Table 6.6:Table 6.7:
Table 6.8:
Table 6.9A:
LIST OF TABLES
IRAT Maize Research in West Africa (1962-1979) 38Maize Recommendation Domain Areas (Hectares) inSouthern Mali 1975-1990 66Definitions and Characteristics of MaizeRecommendation Domains (RD) in Southern Mali •••...•... 67Input/Output Coefficients and Summary PartialBudgets for Improved Maize Compared toMillet/Sorghum in Southern Mali 1975-1990 .........•... 70Ethnic Origin of Single-visit and Frequent-visit SurveySample FCU Heads •.••••.... •. ' . . . • . . . . . . • . . . . • .. 113Age and Gender Composition of Single-visit andFrequent-visit Sample FCUs ........••.......•...... 113Primary Economic Activity of FCU Heads, Womenand Men in the Single-visit Survey (SVS) andFrequent-visit Survey (FVS) Samples •.....•..•....... 11 5Secondary Economic Activity of FCU Heads, Womenand Men in the Single-visit Survey (SVS) andFrequent-visit Survey {FVS) Samples ••. . . . . . . . . . . . . . .. 116Food and Energy Expenditures by Income Tercile forFrequent-visit Sample FCUs (CFA F per adultequivalent) ...........•.........•.............. 120Relationship between Population and Income Tercilesfor Frequent-visit Sample FCUs . . . . . • . . . . . . . . . . . . . . .. 121Percentage of Households Wishing to Purchase aGiven Processed Product to Make a Specific Dish . . . . . . . .. 131Weighted Seasonal Average Cereal Prices Paid bySample Households (CFA F/kg) ....••................ 136Seasonal Household Cereal Procurement in Bamako(kg/ae) .......•...•.......••••••......•....•.. 138Form of Procurement by Type of Coarse Grain(Percent Each Grain) ••••••••••......•..•......... 142Variables Included in the Engel Curve Regressions .......• 145Modified Engel Curve Regression Results . . . • . . . . . . . . . .. 147Frequency of Cereal Consumption at PrincipalMealtimes by Income Tercile (proportions of mealsprepared) •••..••..•.•.....•..••••••.•..•...•.. 152Proportions of Coarse-grain-based Dishes Preparedfrom Flour and Grits . . . . . • • • • . • • • • . . . . . . . . . . . . . • .. 153Form in which White and Yellow Maize are Preparedby Mealtime, Cereal and Dish •••••••••...••....•...• 155
xviii
Table 6.9B:
Table 6.10:
Table 6.11:Table 6.12:
Table 7.1:
Table 7.2:
Table 7.3:Table 7.4:
Table 7.5:Table 7.6:Table 7.7:
Table 7.8A:
Table 7.8B:
Table 7.9A:Table 7.9B:
Table 7.1 OA:
Table 7.1 OB:
Table 7.11:
Table 7.12:
Table 7.13:
Table 7.14:
Table 7.15:Table 7.16:
Table 8.1:
Table 8.2A:
Form in which Millet and Sorghum are Prepared byMealtime, Cereal and Dish ..........•..•......•....Cost Items and Categories Accounted for inEstimation of the Cost of Rice and Coarse-grain-basedDishes •.......................•..............Costs of Prepared Rice and Toh (CFA F/1000 kcal) .Relative Costs of Toh Prepared from Whole Grain,Dehulled Grain and Flour (CFA F/1000 kcal) •............Cost of Maize Flour at Retail Level Manufactured byGrands Moulins du Mali (CFA F/kg) ..•••••.....•.....•Cost of Maize Flour at Retail Level Manufactured bySAMA (CFA F/kg) .••.....•.......••............•Consumer Evaluation of Maize Flours ••.•.......•.....•OLS Regression Results for Prepared Toh and BouillieQuality Criteria .......••.••.••...•......•.......Consumer Evaluation of White Maize Flours •....•.......Full Specification of the Tobit Model Estimated .Results of Standard Censored Tobit (MaximumLikelihood Estimation) ••.••••..•..........•......•Expected Demand for Maize Flour Pre-Devaluation(kg/ae/month) ..........................•.......Expected Demand for Maize Flour Post-Devaluation(kg/ae/month) ...•.•..........................•.Price Elasticities of Demand for Dehulled Maize Flours ....•.Price Elasticities of Demand for Whole Grain MaizeFlour ..............................•......•...Income Elasticities of Demand for Dehulled MaizeFlours .Income Elasticities of Demand for Whole Grain MaizeFlours ......•...................•.•...........Intention to Purchase Dehulled and Whole GrainMaize Flours at Different Prices for Use at PrincipalMealtimes (proportion each mealtime) ....•............Intention to Purchase Dehulled and Whole GrainMaize Flours by Income Tercile for Use at PrincipalMealtimes (proportion each mealtime) ...........•.....Likelihood Ratio Test Statistics for AlternativeSpecifications for Income ....•...•.......•........Likelihood Ratio Test Statistics for AlternativeSpecifications for Military Household •.•••••........•..Comparison of Tobit and Probit Coefficients •............Monthly Aggregate Flour Demand per AdultEquivalent (kg/ae) and for the Population of theDistrict of Bamako (tons) ••••...........•..••......Average Weekly Maize and Sorghum Prices Beforeand After Harvest in the CMDT Zone (CFA F/kg) ......•...Profitability of Fertilizer Use on Maize Before andAfter Devaluation: CMDT North (Sole Crop Maize) .•.....•
xix
156
161164
168
180
185190
191195205
207
213
214222
223
225
226
230
231
234
234236
240
250
254

Table 8.2B:
Table 8.2C:
Table 8.3:Table 8.4:Table A1.1:
Table A1.2:
Table A1.3:
Profitability of Fertilizer Use on Maize Before andAfter Devaluation: CMDT South (Sole Crop Maize) 255Profitability of Fertilizer Use on Maize Before andAfter Devaluation: CMDT South (IntercropMaize/Sorghum) . . . . . . . . . . . . . . . . . . . . . . . . . . . . . . . .. 256Land Use Intensity in the CMDT Region. . . . . . . . . . . .. . .. 261Cereal Cropping Patterns in the CMDT Zone. . . . . . . . . . . .. 263CMDT 1: North Intensive (pre-1980, urea topdressing only) 31 5CMDT 1: North Intensive (1980-1985, compoundfertilizer and urea) ••••••..........••......•...... 31 5CMDT 1: North Intensive (1980-1985, half fertilizer
Table A1.4:Table A1.5:Table A1.6:
Table A1.7:
Table A1.8:
Table A1.9:TableA1.10:Table A 1.11 :Table A1.12:
Table A1.13:Table A 1.14:Table A3.1A:
dose) ,. ' 0 •••••••••••
CMDT 2: North Semi-Intensive (1980-1985) .CMDT 2: North Semi-Intensive (1986 onwards) .CMDT 3: South Intensive (pre-1980, urea topdressing only) .•..•..........•....................CMDT 3: South Intensive (1980-1985, compoundfertilizer and urea) .CMDT 3: South Intensive (1980-1985, half fertilizerdose) 0 •••
CMDT 4: South Intensive intercropped (1980-1985) .CMDT 5: South Semi-Intensive (1980-1985) .CMDT 5: South Semi-Intensive (1980-1985) .CMDT 6: South Semi-Intensive intercropped (1980-1986) ..........................•.. ; .OHV 1: Intensive ..................•.............OHV 2: Semi-Intensive .Hammer mill and dehuller (SAMA) scenario 1 (CFA
316316317
317
318
318319319320
320321321
F/ton) 327Table A3.1 B: Hammer mill (SAMA) scenario 2 (CFA F/ton) 328Table A3.1 C: Hammer mill and dehuller (SAMA) scenario 3 (CFA
F/ton) ••••.•.................................. 329Table A3.1 D: Hammer mill (SAMA) scenario 4 (CFA F/ton) 330Table A3.2A: Grands Moulins du Mali (GMM) scenario 1 (CFA
F/ton) ..•.•.•.....•.•.•••..................... 331Table A3.2B: Grands Moulins du Mali (GMM) scenario 2 (CFA F/ton) ..... 332Table A3.2C: Grands Moulins du Mali (GMM) scenario 3 (CFA
F/ton) ..•..•.•................................ 333Table A4.1: Conditional Price Elasticities of Demand for Dehulled
MaizeFlours ••........................... , . . . . .. 334Table A4.2: Conditional Price Elasticities of Demand for Whole
Grain MaizeFlours ...................••.......... 335
xx
Figure 2.1:Figure 2.2:
Figure 3.1:Figure 3.2:
Figure 4.1:Figure 5.1:
Figure 5.2:
Figure 6.1:
Figure 6.2A:
Figure 6.28:
Figure 6.3A:
Figure 6.38:
Figure 6.4:
Figure 6.5:
Figure 6.6:Figure 6.7:
Figure 7.1:
Figure 7.2:
Figure 7.3: ..
LIST OF FIGURES
Food Systems Matrix . . . . . • . . . . • . • . . . . . . . . • . . . . . . .. 15Effect of Food System Innovations on Consumer andProducer Surplus ...•..•...•..••........•.......... 18Map of Mali • . . . . • . . . . • . • • • • • • • . . . . . . . • . . . . . . • . . . . 34Adoption of Improved Maize in the CMDT and OHVZones. ; .•.........••........................... 56The Maize Subsector in Mali ...........••......•...... 86Food and Non-Food Expenditures per Adult Equivalentper Year by Income (Y) Tercile for Frequent-VisitSample FCUs . . . . . . . . . . . . . . . • . . . . • . • • • . . . . • . . . . . • 118Food Expenditure Shares for Frequent-Visit SampleFCUs ..•............••..•.••..•............... 120Percentage of 640 Households Having PurchasedSpecific Processed Coarse Grain Products .....••......•. 127Percentages of 640 Households Wishing to PurchaseSpecific Processed Coarse Grain Products 129Number of Dishes to be Prepared by Households-Wishing to Purchase Specific Processed Coarse GrainProducts ...............•...............•... . . . . 129Weighted Average Coarse Grain Prices Paid bySample Households December 1992 - November1993 ...............................•......... 133Weighted Average Rice Prices Paid by SampleHouseholds December 1992 - November 1993 133Ratio of Weighted Average Prices for Rice andSorghum Paid by Sample Households December 1992to November 1993 . . • • . • . . • • • • • . • . • • . . . . . . . . . . . . . . 134Average Daily Calorie Availability from Cereals perAdult Equivalent by Income Tercile .......•.•.......•.. 140Cost Components for Rice and Toh ...•.•••.. . . . . . . . . . . 163Isocost Lines for Rice- and Coarse Grain-Based Mealsfor Different Cereal Prices . . . . • . . . . . • . . . . . . . • • . . . . . . . 166Hammer Mill Unit Costs of Production for Dehulledand Whole Grain Flour Before and After Devaluation 183Contingent Valuation Questionnaire for WhiteDehulled (A) and Whole Grain (B) Maize Flour . . . . . . . . . . . . . 197Male Respondent (Household Head) Demand forMaize Flours Pre- and Post-Devaluation .....:. ~ . . . . . . . . . 21 5
xxi
Figure 7.4: Male and Female Demand for Different Quality MaizeFlours Post-Devaluation ...•........................ 21 8
Figure 7.5: Female Demand for Different Quality Maize FloursPre- and Post-Devaluation . . • . . . . . . . . . . . . . . . . . . . . . . . . 21 9
Figure 7.6: Aggregate Demand for Maize Flour for the District ofBamako, Mali (Tons/month) ..........•.............. 239
Figure 8.1 A: Actual and Projected Improved Maize Area in theNorthern CMDT Zone .•.•.........••.....•....•.... 266
Figure 8.1 B: Actual and Projected Improved Maize Area in theSouthern CMDT Zone ..•.•.......••................ 266
xxii
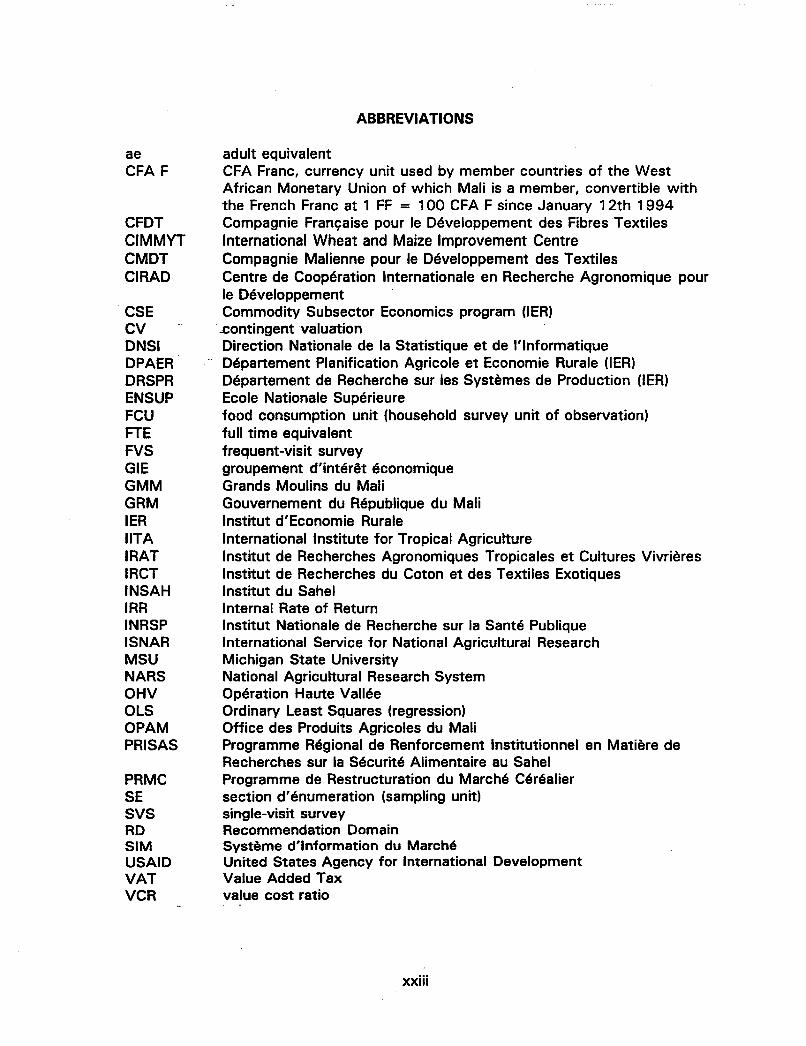
aeCFA F
CFDTCIMMYTCMDTCIRAD
CSECVDNSIDPAERDRSPRENSUPFCUFTEFVSGIEGMMGRMIERIITAIRATIRCTINSAHIRRINRSPISNARMSUNARSOHVOLSOPAMPRISAS
PRMCSESVSRDSIMUSAIDVATVCR
ABBREVIATIONS
adult equivalentCFA Franc, currency unit used by member countries of the WestAfrican Monetary Union of which Mali is a member, convertible withthe French Franc at 1 FF = 100 CFA F since January 12th 1994Compagnie FranCfaise pour Ie Developpement des Fibres TextilesInternational Wheat and Maize Improvement CentreCompagnie Malienne pour Ie Developpement des TextilesCentre de Cooperation Internationale en Recherche Agronomique pourIe DeveloppementCommodity Subsector Economics program (IER)
...contingent valuationDirection Nationale de la Statistique et de l'lnformatique
.. Departement Planification Agricole et Economie Rurale (IER)Departement de Recherche sur les Systemes de Production (IER)Ecole Nationale Superieurefood consumption unit (household survey unit of observation)full time equivalentfrequent-visit surveygroupement d'interet economiqueGrands Moulins du MaliGouvernement du Republique du MaliInstitut d'Economie RuraleInternational Institute for Tropical AgricultureInstitut de Recherches Agronomiques Tropicales et Cultures VivrieresInstitut de Recherches du Coton et des Textiles ExotiquesInstitut du SahelInternal Rate of ReturnInstitut Nationale de Recherche sur la Sante PubliqueInternational Service for National Agricultural ResearchMichigan State UniversityNational Agricultural Research SystemOperation Haute ValleeOrdinary Least Squares (regression)Office des Produits Agricoles du MaliProgramme Regional de Renforcement Institutionnel en Matiere deRecherches sur la Securite Alimentaire au SahelProgramme de Restructuration du Marche Cerealiersection d'enumeration (sampling unit)single-visit surveyRecommendation DomainSysteme d'information du MarcheUnited States Agency for International DevelopmentValue Added Taxvalue cost ratio
xxiii
CHAPTER ONE
INTRODUCTION
This chapter sets out the objectives of the dissertation in relation to current
agricultural research policy concerns and the context of the Malian national
agricultural program within which the dissertation research was undertaken.
1.1 The· challenge: increasing the payoff to investment in agricultural research in
Africa
Adequate funding for African national agricultural research systems (NARS) is
at risk despite the relatively early stage of their development. This situation has
arisen due to increased competition for aid funds and donor perceptions of the
historical performance of investments in African NARS.
Increased competition for donor funds reflects supply and demand-side
factors. The economic recession in North America and Western Europe that began
in the late 1980s severely aggravated the budget deficits of donor countries. This
makes it politically very difficult to defend and maintain foreign aid budgets in real
terms. At the same time there been a rapid growth in the demand for aid funds.
The reunification of Germany, and market reform programs in Eastern Europe and
Russia, have generated huge demands for both capital investment and structural
adjustment funds.
Increased competition for aid funds is forcing donor administrations to
become more critical in their evaluation and use of aid funds. At the same time,
donor resources for monitoring and evaluation are also being cut back.
ConseqUEfhtly, countries· and/or sectors of the economy that show positive
1

2
economic impacts will have a competitive advantage in securing aid flows. Thus it
is important for African NARS to demonstrate that donor investments in agricultural
research are productive.
In contrast to the need for clear signals to donors that agricultural research is
an effective use of funds, investment in African NARS since independence is widely
perceived as unproductive. These perceptions appear to have been generated more
by the problems encountered in implementing agricultural research projects than by
'empirical results. A review by Daniels et al. (1992) found only 4 empirical studies
of returns to investment in African agricultural research, compared to 66 in Latin
America and 25 in Asia. Yet donors are very aware of the difficulties encountered
by agricultural research projects. These include a shortage of and inability to retain
qualified national staff, inadequate level and timely availability of recurrent local
funds, and poor linkages with agricultural extension services (Eicher, 1991).
Recent empirical evidence indicates that agricultural research investments in
specific commodities in Africa can be profitable. A set of agricultural research
impact studies funded by USAID found a wide range in rates of return (from
negative to 135%), but comparable in several cases to those obtained in Asia and
Latin America (Oehmke and Crawford, 1993). However, evidence that investment
in specific commodity research programs has been profitable does not necessarily
imply that investment in African agricultural research systems has generated a
satisfactory overall return.' Furthermore, the profitability of investments in a
, A 'research system can be viewed as a portfolio of investments. High returnsto some research projects are necessary to compensate for low or negative returnson others. The overall return to investments in a research system over time istherefore a more valid measure of whether good use has been made of public funds.
3
particular commodity in the past is not a reliable guide to the profitability of future
investments (Maredia, 1993).
While considerable efforts have been made to strengthen NARS, through the
establishment of organizations such as the International Service for National
Agricultural Research (ISNAR), little consideration has yet been given to the role of
systemic studies of factors upstream and downstream from farm-level production
that affect ·returns to investment in agricultural research (Fox, 1987; Henry de
Frahan, 1990; .USAID, 1992).
1 .2 The opportunity: incorporating marketing considerations into agricultural
research planning
Historically, agricultural research has tended to focus on a single stage (often
farm-level production) for a single commodity (Staatz and Bernsten, 1992).
Interactions with other stages in the commodity subsector, or other commodities at
the same stage, were frequently overlooked. Since the mid-1970s, farming
systems researchers have stressed the need for a holistic approach to the design of
farm-level technology in order to take account of the range of constraints and
interactions confronting the farmer (Collinson, 1982). This concern has not been
limited solely to the farm-level production stage. Other stages with which the
farmer as client is concerned (e.g. own consumption taste preferences, on-farm
processing technology) have also been taken into account. But is this enough?
Agricultural development beyond semi-subsistence requires specialization,
and this inevitably draws the farmer into a greater degree of exchange with other
stages in the food system (Staatz, 1994). An increasing proportion of inputs (tools,
4
fertilizers, labor, technical information) is obtained off-farm, and an increasing
proportion of farm-level products and services is sold or exchanged. Farmers may
even choose to purchase food in the market place rather than produce it themselves
in order to devote their limited time to other agricultural or non-agricultural activities
(Staatz and Bernsten, 1992). The adoption of technology at farm-level will
increasingly depend on the extent to which it enables farmers to respond to
evolving off-farm client preferences for different product characteristics (e.g.
quality, seasonal availability, lot size) as expressed by market prices.
Agricultural product and input markets have an increasingly important
influence on the incentives for adoption of farm-level production technology as
agricultural specialization and development occurs.2 The rate of adoption of farm-
level production technology in turn is an important contributory factor affecting the
level of returns to investment in research (Henry de Frahan, 1990). Furthermore,
innovation in product and input markets can directly generate benefits for farmers
and consumers as well as having a positive impact on farm-level incentives.
But if the linkages between markets, technology adoption and returns to
investment in agricultural research are so important, why have they not been
considered explicitly in agricultural research planning by African NARS? First, from
before independence until to the recent past, agricultural product and input prices
have been officially set by the state in most African countries. Second, pricing
policy for agricultural products and inputs is often formulated in a different ministry
from that responsible for agricultural research, and possibly with different objectives
2 The conceptual relations between markets and farm~level incentives fortechnology adoption will be examined more closely in the next chapter.

5
that mayor may not encourage farm-level technology adoption. Third, agricultural
economists trained in market analysis procedures are rarely found in African NARS.
Although institutional and human resource constraints remain, the market
and macroeconomic policy environment of NARS has changed dramatically over the
last decade. For most African countries it is no longer true that the state retains
control over-agricultural product and input prices. Market liberalization and
structural adjustment policies have radically altered incentives for technology
adoption, and the mechanism that generates those incentives. There is a real need
to consider not only how changes in the market and macroeconomic policy
environment have affected the impact of agricultural research, but how agricultural
research design can anticipate and adjust to policy changes to improve its impact.
The potential contribution of systemic analysis of market considerations in the
planning of agricultural research programs is the central issue of this dissertation.
1.3 The context: Mali's national agricultural research program and the role of the
maize subsector study·
The Malian Agricultural Research service was established in 1961 with
responsibility for ensuring coordination among organizations undertaking agricultural
research in Mali. Prior to this date, most agricultural research had been carried out
under the auspices of the Centre Federal de Recherches Agronomiques de Bambey
(in Senegal) and the Office du Niger. 3 During the first decade or so after
independence, agronomic research continued to be implemented primarily by the
3 The two exceptions to this generalization are cotton research, conducted atM'Pessoba by IRCT from 1925 onwards, and livestock research, begun in 1927with the establishment of a livestock farm at Sotuba, which subsequently grew intoa major livestock research station for the Sahel by 1950 (Shetty et al., 1991).
6
French Institut de Recherches Agronomiques Tropicales et des Cultures Vivrieres
(fRAT), under a technical assistance agreement with the Malian government (GRM)
which ran through 1974. As more and more nationals were trained, the research
program was increasingly designed and managed by' national staff. Today,
livestock, crop and social science research are all managed by a national agricultural
research institute, the Institut d'Economie Rurale (lER).
Since 1989, IER has implemented three major initiatives to improve its
productivity. First, it has developed (with ISNAR) a twelve-year strategic plan that
provides the technical programming framework for agricultural research activities.
Second, it is in the process of implementing a structural re-organization that
decentralizes research planning and financial management on a regional basis.
Research user committees will also be established to help ensure the relevance of
the research program for its intended beneficiaries. Finally, the legal status of IER
has changed from a service in the Ministry of Rural Development to a parastatal
institution with financial and personnel management autonomy. IER has received
financial commitments from USAID and the World Bank in order to implement the
organizational restructuring and the first six-year phase of its strategic research
plan.
Commodity subsector studies were included in the strategic plan, but their
role, content and relationship to technical research programs were not defined. The
inclusion of subsector studies was motivated by a growing realization among
research program managers that agricultural research was only useful if it resulted
in technologies that were adopted, and that farmers would only adopt technology if
it was profitable. Recent changes in cereal marketing policy, in particular the
7
removal of guaranteed prices, have given rise to fears concerning the profitability of
existing crop production technologies (Staatz, 1989).4
Maize is a case in point. In the course of an historical assessment of the
impact of maize research and extension carried out in collaboration with IER,
Boughton and Henry de Frahan (1994) found the prevailing view among research
and extension program managers to be that the area and production of intensive
maize expanded very rapidly when a guaranteed price was in effect; a boom that
evaporated after cereal markets were liberalized in 1986.5 In order to address
these concerns, the study was expanded to consider opportunities and constraints
for development of the maize subsector as a whole.
From IER's perspective, the primary role of the maize subsector study was to
provide a learning experience to define more clearly the role of subsector studies
within the overall research program, and identify and develop the necessary
organizational linkages and methods for implementing them. Maize is very
appropriate as a "pilot" study for three reasons. First, as stated above, changes in
the organization of cereal marketing over the last decade have had an important
impact on the incentives to adopt farm-level maize production technology. Second,
lessons from the maize study can be expected to have important implications for
other cereals in regard to both utilization and farm-level production. Finally, the
limited geographical scope of maize production reduces the logistical complexity of
implementing a study.
4 Staatz challenged the view that changes in marketing policy were responsiblefor the lack of profitability of farm-level technology, and urged researchers toexamine options for reducing unit costs of farm-level production.
5 This prevailing view turned out to be an oversimplification, as will be shown inchapter 3.
8
The maize subsector study was implemented in two phases. An initial
interdisciplinary appraisal of the whole subsector was carried out between February
and April 1992 in order to identify constraints and opportunities for innovation. On
the basis of this appraisal, funding proposals for an in-depth study of opportunities
for increased urban utilization of maize were prepared and defended. The in-depth
study was implemented over an 18-month period July 1992 through December
1993. The initial appraisal was funded by the Programme Regional de
Renforcement Institutionnel en Matiere de Recherches sur la Securite Alimentaire au
Sahel (PRISAS) of the Institut du Sahel (INSAH) and the Agricultural Technology
Impact Assessment add-on to the USAID-MSU Food Security in Africa Cooperative
Agreement. For the in-depth studies, local costs were funded by the Programme de
Restructuration du Marche Cerealier (PRMC), and MSU participation by USAID/Mali
and the Agricultural Technology Impact Assessment add-ons to the USAID-MSU
Food Security II Cooperative Agreement.
1.4 Objectives of the dissertation
The goal of the dissertation is to demonstrate the potential contribution of a
commodity subsector or marketing systems approach to the design of agricultural
research programs through a case study of maize in Mali. The study uses this
systemic approach to understanding constraints and opportunities for technological,
policy and institutional innovation in the maize subsector. Opportunities to expand
urban demand for maize through the supply of processed products with attributes
that match consumer preferences are explored in detail. In light of the significant,
increase "in fertilizer prices following devaluation in January 1994, opportunities for
9
complementary technological innovations to improve productivity at farm-level are
also studied.
The specific objectives of the dissertation are:
1) to apply a commodity subsector approach to the analysis of constraints to
and opportunities for technological, institutional and policy innovation in the
Malian maize subsector;
2) to examine the economic impact of, and interaction between, maize
technology development and diffusion in Southern Mali and institutional and
policy change over the period 1969 - 1990;
3) to analyze the role of maize in cereal consumption in the capital city,
Bamako, a potentially important source of demand growth to overcome the
"thin market" impediment to further development of the maize subsector;
4) to quantify potential demand for pre-processed maize flour, and estimate the
magnitude of demand at retail prices that reflect the costs of existing
processing technology;
5) to evaluate the impact of fertilizer price increases on the profitability of maize
cultivation, and identify opportunities for increased farm-level productivity.
1.5 Outline of the dissertation
The dissertation is organized as follows. The next chapter develops a
conceptual and methodological framework for the application of a commodity
subsector perspective to the design of agricultural research.
The third chapter illustrates the relevance of a commodity subsector
perspective -to the -design" of agricultural research by an examination of factors that
10
affected the historical payoff to farm-level maize technology development and
diffusion in Mali. The results of the initial subsector appraisal are presented in
chapter 4 in the form of an overview of the maize subsector, together with the
rationale for the choice of in-depth studies.
The next three chapters are concerned with urban demand for cereals and
the potential to expand demand for maize through the supply of processed maize to
urban consumers. Chapter 5 describes the survey instruments, sampling method
and characteristics of sample households in Bamako. Chapter 6 provides an
empirical descr.iption of cereal procurement and utilization, including an analysis of
the cost of meals prepared from different cereals and processing methods. Chapter
7 examines a key opportunity for expansion of urban demand for maize (of
relevance to millet and sorghum as well) by a quantitative analysis of the potential
market for maize flour of different qualities.
Increases in the price of imported fertilizers following devaluation in 1994,.
motivate a search for opportunities to increase farm-level productivity. Chapter 8
evaluates the impact of fertilizer prices on profitability of the maize enterprise, and
identifies geographical and technical foci for future agronomic research.
The final chapter draws out the implications of the study for maize
technology development and diffusion in Mali, and reflects on the methodological
lessons for use of a subsector approach to inform research design in African NARS.
CHAPTER TWO
CONCEPTUAL AND METHODOLOGICAL FRAMEWORK
The previous chapter noted that despite the importance of the rate of farm
level technology adoption for the rate of return to research investments, factors
affecting incentives to adopt farm-level production technology other than the
technical parameters of the innovation itself are usually considered as exogenous in
the design of agricultural research. A better understanding of constraints and
opportunities upstream and downstream from farms could contribute to more
effective farm-level technology development by a better match between farm-level
technology and market conditions, or through the identification of interventions that
make those conditions more conducive to technology adoption.
This chapter examines the potential contribution of the commodity subsector
approach as a means to understand how conditions upstream and downstream
affect farm-level technology adoption incentives, and to assess whether they can be
modified to encourage innovation and increase productivity. The first section briefly
reviews factors that affect incentives for farmers to adopt technology. Section two
presents a conceptual framework for examining the relationship between incentives
to adopt technology at farm level, innovation at other stages of the food system
involved in the production of goods and services, and the payoff to research
investments as measured by benefits to farmers and consumers. Section three
discusses the problem of demand articulation (the communication of consumer
preferences for products and services) in the early stages of agricultural
transformation, often characterized by high transactions costs. The final section
outlines the approach and methods used for the maize subsector case study.
11
12
2.1 The relationship between markets and incentives for technology adoption
The incentives for farmers to adopt technology are determined in large part
by the expected profitability of an innovation. There are certainly other factors that
enter into the adoption decision, such as how adoption would be perceived by peers
or family members, but profitability remains important (Coulibaly, 1987).'
Profitability can be defined as the difference between the value of additional output
(or outputs) and the cost of the additional input (or inputs) required to generate it.2
In a market economy, financial profitability can be measured by multiplying outputs
and inputs by their respective prices and calculating the difference. The greater the
difference between the sum of additional costs and additional benefits resulting
from adoption, the greater the incentive to do so, ceteris paribus.
In addition to the expected or average amount of profit, the degree of risk
has an important effect on the incentives to adopt farm-level technology. Risk
refers to uncertainty concerning outcomes. Of particular concern in regard to farm-
level technology adoption is uncertainty concerning revenues (i.e., output levels
and/or prices) and costs (i.e., input quantities and/or prices). Because of
diminishing marginal utility of income, farmers prefer lower to higher variability for
any given average level of income (Robison and Barry, 1987). Variability in product
and input prices affects the variability in the profits to be derived from farm-level
technology adoption. Thus, variability in input and product prices, and the way in
1 During the 1950s and 1960s, a considerable amount of attention was devotedto non-profit related factors such as the characteristics associated early or lateadopters (summarized by Rogers and Shoemaker, 1971).
.2 Proponents of social capital theory (e.g., Robison and Schmid, 1994) wouldargue that factors such as peer group approval enter directly into the calculation ofprofitability,along with input and output prices. We focus on the financialdimension of profitability for simplicity.

13
which they interact with each other and with physical input and output levels, have
important effects on incentives.3
Price levels and price variability for farm products and inputs reflect
constraints and opportunities in the off-farm economy, as communicated through
agricultural input and output markets. These constraints and opportunities change
in response to policy, institutional and (off-farm) technological innovation (e.g., the
development of additional uses for a farm product, or processing technologies that
permit greater substitution between products). Since institutional, policy and
technical changes in product and input markets can have important repercussions
on farm-level technology adoption incentives, they should not be ignored at the
design stage. The only exception to this would be a static, purely subsistence
agrarian economy. Market considerations are irrelevant to such an economy since
all inputs and products are supplied and consumed by the household. In most
cases, however, markets have an important role to play in facilitating agricultural
development in general, and the adoption of improved technology in particular. The
next section sets out a conceptual framework for including these considerations.
2.2 The food systems matrix as an integrative framework for agricultural
research and development questions
The purpose of this section is to describe a conceptual framework that
relates farm households to relevant components of the rest of the economy. This is
3 Product price variability does not necessarily have a negative effect onincentives for technology adoption. If product prices are negatively correlated withproduction levels, price variability can have a stabilizing -effect on net returns. Theimportant principle is to identify what the effect "Of variability is in a given context,and to ask whether or not there exist ways to enhance the positive and/or mitigatethe negative effects of variability.
14
a first step toward the identification of constraints and opportunities off-farm. that
do, or could, have an impact on incentives for farm-level technology adoption.
The relationships between farming and marketing systems can best be
understood in relation to the food system as a whole. The food system has been
defined 'ils lithe entire set of actors and institutions involved in input supply,
farming, and the processing and distribution of agricultural products (including their
links with international trade)" (Staatz and Bernsten, 1992, p. 4). Both farming and
marketing systems are components (or subsystems) of the food system.
A simple but effective tool for organizing analysis of a food system is a
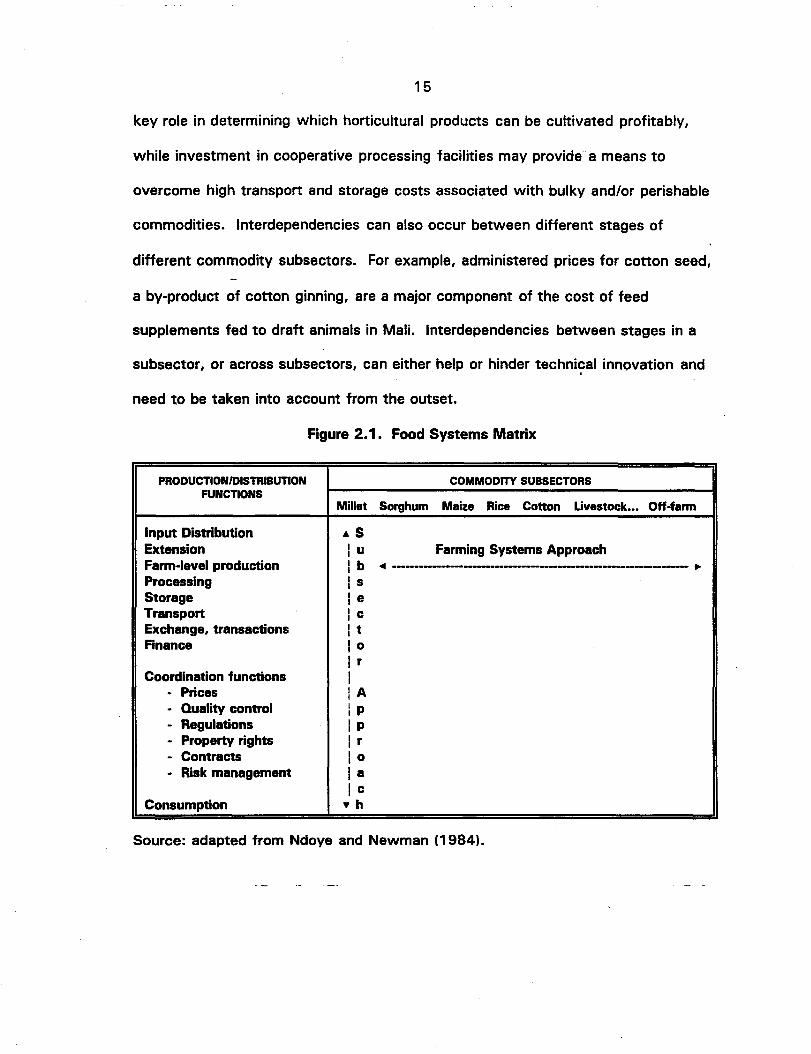
matrix of agricultural products and functions (Figure 2.1). Originally conceptualized
by Shaffer (1970), and further developed by Holtzman (1986), each column of the
matrix represents a commodity subsector (i.e., the entire range of productive
processes and services associated with a specific commodity or group of closely
related commodities).4 The rows of the matrix represent individual stages or
functions in the production and transformation of commodities.
Interdependencies, or system interactions, are common to both vertical and
horizontal dimensions. At the farm-level production stage (horizontal dimension),
different crop enterprises compete for limited household resources of land, labor and
capital, while livestock enterprises enhance crop productivity through increased soil
fertility. Similarly, in the vertical dimension, transport costs to urban centers playa
.. Although some authors (e.g. Holtzman 1986) have advocated that the term"commodity subsystem" is more appropriate than "commodity subsector" in viewof the interdependencies between different stages, we use commodity subsector inorder to avoid confusion with the frequent use of the terms crop or livestocksubsystems in reference to components of farming systems. Fundamental to theconcept of a commodity subsector is the recognition that productive activity occursnot only at the farm level, but at every stage as inputs are supplied and value addedto a product as it moves from field to cooking pot.
15
key role in determining which horticultural products can be cultivated profitably,
while investment in cooperative processing facilities may provide·a means to
overcome high transport and storage costs associated with bulky and/or perishable
commodities. Interdependencies can also occur between different stages of
different commodity subsectors. For example, administered prices for cotton seed,
a by-product of cotton ginning, are a major component of the cost of feed
supplements fed to draft animals in Mali. Interdependencies between stages in a
subsector, or across subsectors, can either help or hinder techni~al innovation and
need to be taken into account from the outset.
Figure 2.1. Food Systems Matrix
PRODUCTIONIDISTRIBUTION COMMODITY SUBSECTORSFUNCTIONS
Millet Sorghum Maize Rice Cotton Uvestock... Off-farm
Input Distribution .SExtension lu Farming Systems ApproachFarm-level production lb ... -------------------------------------- ..Processing IsStorage IeTransport IcExchange, transactions I tFinance 10
I rCoordination functions I- Prices IA
- Quality control Ip- Regulations lp- Property rights I r- Contracts 10- Risk management la
IcConsumption • h
Source: adapted from Ndoye and Newman (1984).
16
In the context of increasing specialization and exchange that characterizes
agricultural development, a commodity subsector perspective broadens the scope
for productivity gains. Instead of limiting the search for possibilities to drive down
unit costs of production to the farm level, researchers can examine possibilities at
several or all stages in the commodity subsector. As Staatz and Bernsten (1992)
observe, if marketing costs represent 50% of the final product value (as is
commonly the case in developing countries) then a 10% reduction in marketing
costs has the same effect on the overall productivity of the subsector as a costless
10% increase in crop yield. For farmers, a reduction in marketing costs would be
preferable to a yield increase since it requires no additional inputs or risk and would
have an upward rather than a downward effect if any on farm gate prices.5 In the
case of export crops such as cotton and groundnut, driving down unit costs at
multiple stages may be the only way to maintain real incomes in the face of
declining real world market prices.
A commodity subsector perspective provides researchers with additional
options in the search for innovations. Increasing specialization and exchange in the
food system requires coordination between economic agents at different stages in
the subsector. Technological innovation by itself may fail to achieve all potential
productivity gains within a given commodity subsector because of inadequate
coordination. Institutional and policy innovations can complement technological
innovation by reducing barriers to the effective communication of consumer
5 A reduction in marketing costs would result in a shift in the farm gate demandcurve to the right, and hence an increase in farm-gate price unless supply wereperfectly elastic, in which case the farm gate price would remain constant. Anincrease in yield would result in a shift in the farm gate supply curve to the right,and hence a decrease -in farm gate price unless demand were perfectly elastic, inwhich case the farm gate price would again remain constant.

17
preferences and market opportunities to farmers, and by increasing the ability of
private sector participants at all stages of a commodity subsector to respond to
those opportunities.
The potential payoff to research that integrates commodity subsector and
farming systems perspectives to identify innovations at multiple stages can be
illustrated by a frequently used analytical framework that measures the effects on
consumers' and producers' welfare of changes in technology (Norton and Davis,
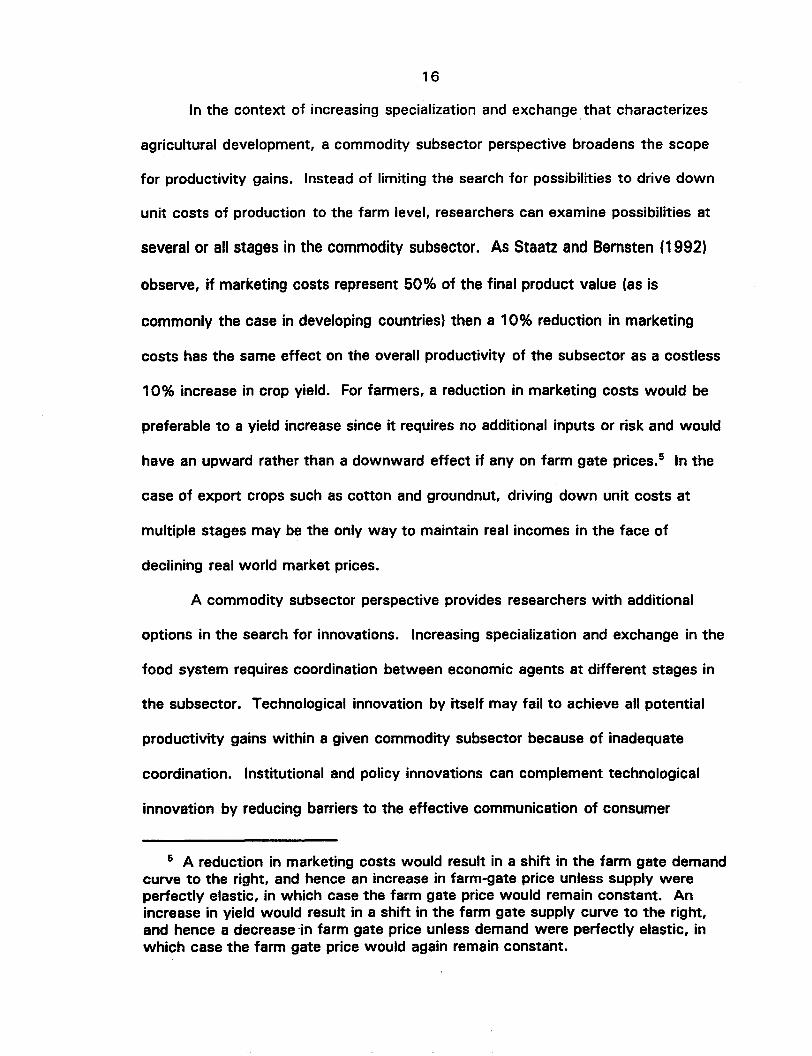
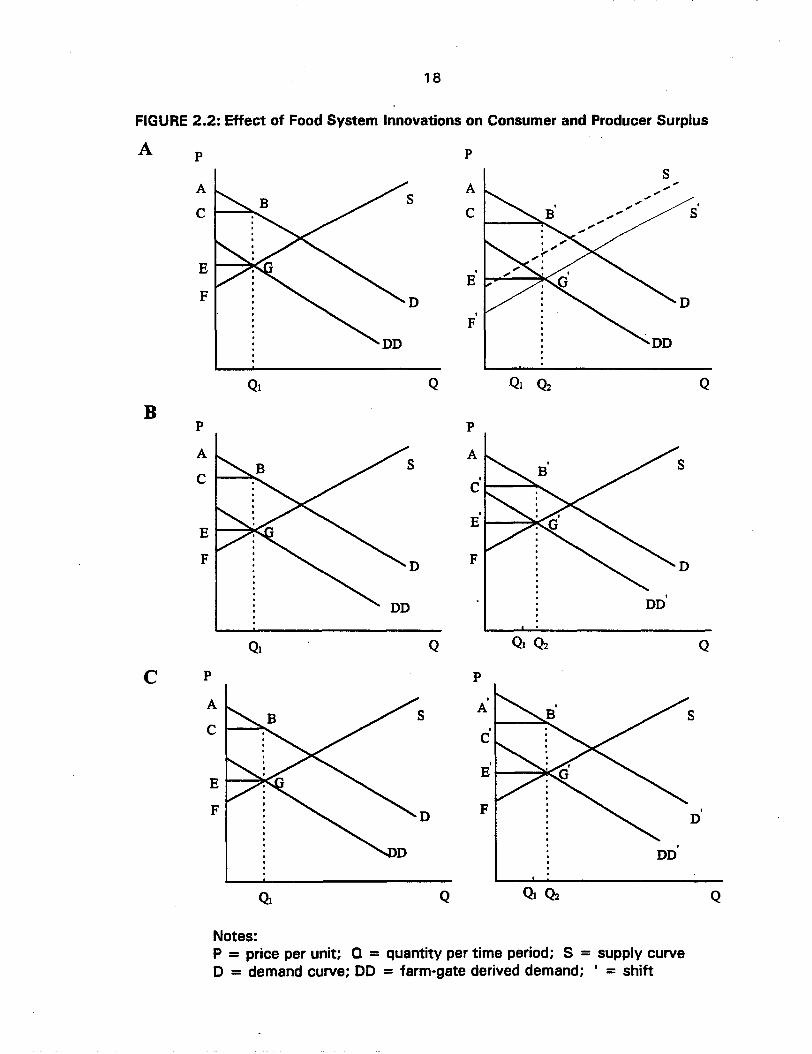
1981 ).6 Figure 2.2 depicts three scenarios: 1) a farm-level production innovation
with a fixed marketing margin per unit of output (e.g., a higher yielding variety or
breed of livestock); 2) an innovation that reduces marketing costs (e.g. a reduction
in processing losses); and 3) an innovation that improves the quality of the product
for the consumer without increasing marketing costs (e.g., by a better match
between the attributes of the product and those sought by consumers).
Consumers' welfare, or 'consumer surplus', is represented by the area below the
demand curve and above consumer price.7 Producers' welfare, or 'producer
surplus' is represented by the area above the supply curve and below farm-gate
price (where the derived demand curve DO or DO' intersects the supply curve).
Within the limitations of a partial equilibrium framework (i.e., effects on welfare
from changes in the production and consumption of other goods and services in the
6 This approach assumes that the conditions for Pareto optimality are met.While they never are in the real world, due to violations such as the presence oftransactions costs, this does not pose a serious problem for the present purpose ofillustration.
7 The downward sloping demand curves imply a non-marginal increase insupply. This need not be the case for a small-country exporter, or if a farm-levelinnovation is relevant to only a small proportion of producers, or if the product hasmany possible substitutes.
18
FIGURE 2.2: Effect of Food System Innovations on Consumer and Producer Surplus
A p p
SA A ~
..~~
~~ .
C C ... ... S~~
~
E I
EF D D.
F
Ql Q 01 Q2 Q
Bp P
A A
C .C
.E
E
F D F D
I
DD
Ql Q Ql Q2 Q
C p P
A.
A
C .C
.E
E
F D F .D
,DD
Ot Q Ql 02 Q
Notes:P = price per unit; Q = quantity per time period; S = supply curveo = demand curve; 00 = farm-gate derived demand; • = shift

19
economy as a result of innovation in the commodity subsector of interest are
ignored), welfare gains can be illustrated by changes in producer and consumer
surplus.
In Figure 2.2 A, a farm-level production innovation results in a rightward shift
of the supply function (i.e., the marginal cost of production is lower for any given
level of output). At market-clearing prices, the price paid by consumers remains
higher than that received by producers by an amount equal to the marketing margin
(C-E) or 'wedge'. Consumer surplus increases from triangle ABC to triangle AB'C'.
Producer surplus changes from triangle EDF to triangle E'D'F'.8 The gross benefit
(i.e., ignoring the costs of innovation development and diffusion) is equivalent to the
sum of the differences between the two pairs of triangles. Consumers
unambiguously gain. Whether producers gain or not depends on the relative
elasticities of the supply and demand curves.
In Figure 2.2 B, an innovation reduces marketing costs (represented by a
smaller wedge C'-E' as opposed to C-E). Both consumers and producers are
unambiguously better off as a result of the increase in quantity produced and
consumed from 0 1 to O2 in response to lower marketing costs.9
Finally, consider the payoff to an innovation that improves the quality of the
consumer product without increasing per unit marketing costs, illustrated in Figure
2.2 C. As a result of the quality improvement, demand shifts to the right and more
is purchased at every price than before. Producer surplus increases unambiguously
8 In the diagrams, the presence of an apostrophe after a letter indicates that thecorresponding location has changed as a result of the innovation.
9 Exceptions occur if either the demand curve or the supply curve is perfectlyelastic. In this case the entire surplus accrues to the group with less than perfectlyelastic price response.
20
from triangle EDF to triangle E'D'F. Consumer surplus also increases
unambiguously from triangle ABC to A'B'C', the size of the consumer gain
depending on the elasticity of farm-level supply.'o
An important consideration is that, in general, the benefits from the three
types of innovation are additive. With development, an increasing share of total
costs is incurred, and an increasing share of value added is created, off farm. In
order to avoid diminishing returns to research effort, it may be necessary to devote
research resources to opportunities to reduce oft-farm unit costs of producing
complementary goods and services as well as reducing farm-level costs of
production. This raises the issue of the respective roles of the private and public
sectors in funding agricultural research, addressed in the following section.
2.3 The role of demand articulation in food system innovation
In order to shift the farm-gate demand curve for a given commodity, other
than through relative prices, or population or income growth, there has to be an
increase in the value of the product to the consumer. This can be accomplished
through the incorporation of additional services such as processing, improvements
in product quality, or by changing consumers' knowledge or desire for the product
(e.g., through extension programs or advertising). For existing goods and services,
prices act as signals of value. For potential products that are not currently
available, additional means for eliciting· and communicating consumer preferences
are needed. .Demand articulation is the process whereby consumer preferences are
10 An unambiguous consumer gain is dependent on the per unit marketingmargin remaining constant as quantity demanded increases, implying a perfectlyelastic supply of marketing services.
21
communicated to potential suppliers at different stages in a commodity subsector.
We first relate the concept of demand articulation to existing consumer theory, and
then consider the implications of demand articulation for private and publicly-funded
research to promote food system innovation.
2.3.1 Demand articulation and consumer theory
Senauer et al. (1991) observe that "The traditional economic theory of the
consumer is virtually worthless for analyzing the potential demand for a new
product, since it has not previously entered consumers' preferences (utility
functions)" (p 160). Lancaster (1 991) extended the standard neoclassical treatment
of consumer theory by conceptualizing consumer demands for attributes, with
different products containing different combinations of attributes. Since most
"new" food products are in fact new combinations of basic attributes about which
consumers already have well-formed preferences, consumer theory as extended by
Lancaster can accommodate the demand for new products (Senauer et al., 1991).
In the case of alternative cereals, or cereals with different degrees of
processing, attributes are present in fixed proportions. Consumers vary their
consumption of those attributes through the choice of meals they consume. In the
present context, the demand for a meal is defined as the demand for a particular
dish at a particular mealtime (breakfast, lunch, dinner or lunch/dinner combined). In
a modified neoclassical framework" households would be expected to equate:
MUmi = MUmj
Pi Pj
where MUmi is the marginal utility of a given meal and Pi is the marginal cost of
providing it (including the cost of grain, processing services, fuel and
22
complementary sauce ingredients). 11 The invention of a new dish, or a change in
the marginal utility of a particular dish arising from a better match between the
product and attributes sought by consumers, would result in a shift in the derived
demand for the cereal and/or form from which it can be prepared. 12 Similarly, a
reduction in the cost of complementary processing services necessary to transform
the cereal into the dish would also result in a shift in the derived demand for the
cereal and form concerned. The hypothesis, maintained but not tested in this
dissertation, that demands for cereals and for processing services are jointly derived
from the household demand for meals is consistent with neoclassical theory as
extended by Lancaster. Whether some or all of a set of processing services
required to prepare a given dish are already embedded in the cereal (Le., as
processed cereal), or whether they are supplied by the household, will depend on
the relative costs of supplying the services.
11 The purpose here is not to claim that the theory as discussed is an adequaterepresentation of reality, but that conceptually it can be extended to the demand fornew products. The notion that a household equates utility at the margin isobviously a gross simplification given the complexity of household decision-makinginstitutions in urban MaiL Responsibility for the provision of grain and responsibilityfor processing cereals is divided among family members on the basis of gender andseniority. A household head seeking to provide family cereal requirements atminimum cost has an objective that conflicts with a food preparer seeking toprepare meals with minimum labor input. The extent to which these conflictingobjectives are reconciled through interdependence of individual utility functions (e.g.the extent to which household heads derive benefit from a reduction in their wives'workload) could have an important effect on the choice of cereal and processingtechnology. In practice, the potential complexity of the decisions relating to foodconsumption appears to be overcome through the use of standard operatingprocedures. This implies that non-marginal changes in prices of raw materials oralternative processing technologies may be necessary to provoke a shift in thequantity or form in which cereals are purchased.
12 For example, the marginal utility of a particular dish could vary due toconsumer preferences for light versus heavy meals at different times of day.
23
2.3.2 The role of public and private sector research in facilitating demand
articulation
The transition from an agricultural sector that supplies only unprocessed
products, with all subsequent value added by consuming households, to one that
supplies products with at least some of the subsequent services already
incorporated, is fundamental to the process of agricultural transformation. In order
to make correct decisions as to whether and/or when it is profitable to provide
these services and/or quality improvements, private sector participants need
information concerning:
1) consumer preferences in regard to processing and quality (i.e., in what form
consumers want to purchase the product, including packaging, and what
attributes enhance or degrade quality in the eyes of the consumer);
3) how much consumers are willing to pay for different quantities of product
with the desired attributes;
2) appropriate technology (type of equipment and scale) and the costs of
providing products with desired attributes.
In developed countries, much of the research necessary to generate the
information required by economic agents engaged in agricultural transformation
activities is generated by the private sector. Virtually all food processing companies
have a product development section, which in turn may contract out parts of the
product development process to specialized firms (e.g., package design and test
marketing). Similarly, many farmer cooperatives such as Ocean Spray in the USA,
or the Milk Marketing Board (MMB) in the UK, seek to increase demand for raw
agricultural products through the development of new products with a high
24
proportion of value added off-farm (e.g., cranberry juice in the case of Ocean Spray,
imitation French cheeses in the case of the UK MMB).
The higher the level of average consumer incomes the greater the
opportunity for marketing products with processing services and quality attributes
incorporated. This is partly because incomes are correlated with the opportunity
cost of consumers' time, and hence with their willingness to pay for products that
save time by incorporating processing services (Hull et aI., 1983), and partly
because consumers enjoy variety in the food products they consume.
The lower consumer income levels, the more restricted will be the set of
products with value added that consumers are willing to buy, and the more limited
the quantities. The smaller the set of products for which effective demand exists,
the greater the risk of new product failure. For entrepreneurs, the riskiest point in
the agricultural transformation process is right at the beginning when incomes are
lowest and the existing and potential product space is smallest. One way to reduce
risk is through the provision of information that increases the probability of making a
correct decision about what product specifications consumers are willing to pay for
in quantities sufficient to be profitable to supply. But is this an appropriate task for
publicly funded research?13
The justifications for providing information partly or wholly through publicly
funded research are the public good character of, and externalities generated by,
such information. Information on consumer preferences for product attributes is a
public good because once a product has been successfully launched the information
13 This argument could be formulated in terms of the need to redl:Jcetransactions costs facing potential entrepreneurs in order to stimulate agriculturaltransformation (Staatz et aI., 1994).
25
concerning the attributes consumers are willing to pay for is literally on the shelf.
Unless there is an enforceable system of patent rights to protect manufacturers of
new products, effectively granting a monopoly to the patent-owning firm, firms will
underinvest in seeking the required information. Even if legislation exists, it may be
difficult to enforce in the food industry because of the wide variety of potential
products (hence the tendency to product proliferation in developed country food
industries). Second, the invention of a new product or process frequently generates
positive externalities. The acceptance of a new consumer product expands the
opportunity set for similar products or processes.
Publicly funded agricultural research aimed at promoting agricultural
transformation will not necessarily be limited to the consumer-processor interface.
The specific attributes required by consumers, and the technology employed to
provide them, may in turn require certain attributes in the raw material. Wheat for
bread-making, for example, must attain certain minimum protein levels in order for
the dough to be sufficiently elastic to be processed industrially. The same
characteristic is irrelevant for wheat used as livestock feed. How is the raw
material with the necessary qualities to be identified? Do the varieties currently
available to farmers have the required characteristics? Do these varieties require
different husbandry and/or storage practices to enhance or preserve those
attributes? Will farmers require contracts in order to manage the risk arising from
higher cash outlays? How can farmers identify seed with the necessary attributes?
Is the demand for raw product with these characteristics likely to be sufficiently
great to justify breeding for a specific characteristic? The successful articulation of
consumer demand for a particular product may have implications for the technology,
26
institutions and policies conditioning productive activity at multiple stages in a
commodity subsector. Failure at anyone stage will drive up costs at all subsequent
stages, possibly to the point of choking off demand for the final product.
The next section outlines methods used to identify constraints and
opportunities to technological and related innovation in the maize subsector in Mali.
2.4 Outline of methods used
The previous sections described the potential contribution of a commodity
subsector approach to the identification of constraints and opportunities for
development of the food system, and the role of demand articulation in the process
of technological innovation in food systems that use markets to coordinate
production and consumption activities. This section provides an outline of the
methods used to accomplish the objectives set out in chapter 1. More detailed
explanations are reserved for the chapters dealing with specific research questions.
A combinatio'n of methods was used to measure the impact of, and assess
-the contribution of institutional and policy changes to, the development and
diffusion of maize technology at farm level over the period 1974 - 1990. Following
Traxler and Byerlee (1991), a careful historical review was undertaken to trace the
link between research and extension activities and farm-level of adoption of new
technology over time, using annual reports from the organizations involved
supplemented by numerous interviews with researchers, extension managers and
farmers. Financial impacts were measured using partial budgets, and economic
impacts by benefit-cost analysis.
27
The study of constraints and opportunities upstream and downstream from
farms was motivated by significantly reduced incentives for intensive maize
cultivation after the removal of guaranteed prices in 1986. A rapid subsector
appraisal (Holtzman, 1986) was carried out by an interdisciplinary team using
informal interviews with economic agents at different stages of the subsector,
including researchers, extension workers, farmers, rural and urban wholesalers and
retailers, transporters, processors, poultry rearers, as well as rural and urban
consumers. These interviews were supplemented by literature review and
descriptive analysis of marketing margins. Descriptive information, constraints and
research questions for different stages of the maize subsector was organized using
a Research Planning Matrix (Tefft et aI., 1990). The large and rapidly growing
urban population of Bamako was identified as an important source of potential
demand growth, and the difficulty of processing maize as a constraint to increased
urban consumption.
The main focus of subsequent research was to determine the potential
demand for processed maize and whether, given the costs of existing processing
technology, supplying that demand could be a means to overcome the "thin market"
dilemma (Tomek and Robinson, 1990). Short of large-scale market tests, there are
two possible approaches to the issue. One is to infer potential demand from
existing household consumption patterns. The other is to ask household decision
makers about hypothetical purchasing intentions. The approaches are obviously
complementary, and both were employed.
To determine existing cereal utilization patterns in the capital city, a year
long survey of cereal procurement by a sample of Bamako households was

28
undertaken. Given the maintained hypothesis that the demands for cereals and
processing services are jointly derived from the demand for meals, careful attention
was given to the dishes prepared, and the processing techniques employed.
Modified Engels curves were estimated by regression to determine the effects of
income and demographic factors, including proxy variables for the opportunity cost
of women's time, on the demand for processed and unprocessed cereals. To
complete the picture of existing household utilization of cereals, the cost of meals
prepared from rice and coarse grains was calculated on the basis of detailed
observations of processing and meal preparation activities in a subset of sample
households.
To estimate the potential demand for maize flour, a contingent valuation
experiment was designed in conjunction with consumer tests of two qualities of
maize flour prepared by a local processing firm. A demand equation was estimated
using a standard censored tobit model. The results were used to derive, for six
population subgroups, expected demands, and price and income elasticities for each
flour quality before and after devaluation. 14 Estimated retail prices for each type
of flour were calculated on the basis of the pre- and post-devaluation costs of
processing with existing technologies. Aggregate demand for the population of
Bamako was also estimated at retail prices, and compared to existing levels of
maize consumption.
Devaluation also affects maize growers. Partial budget analysis is used to
assess the effect of fertilizer price increases following devaluation on incentives to
cultivate intensive maize. Opportunities for improved productivity are identified by
14 At midnight on January 12th, 1994, the government announced a 50%devaluation of the CFA franc.

29
comparing the cost of existing fertilizers to alternative sources, and examining the
level of adoption of improved varieties. Since varietal performance and fertilizer
response is environment-specific, logistic curves are fitted to historic adoption data
to predict the geographic locus of future maize area expansion.
The results from consumption and farm-level production analyses are used to
identify a combination of technology, policy and institutional innovations needed for
accelerated development of the maize subsector.
2.5 Summary
This chapter has argued that a commodity subsector approach offers
possibilities to improve the design of agricultural research through a better
understanding of factors upstream and downstream from farms that structure farm
level technology adoption incentives. The argument was developed within a food
systems framework, emphasizing the need for attention to demand-side constraints
and opportunities for innovation. A roadmap of methods used was also presented.
The next chapter explores how conditions upstream and downstream from farms,
including the organization of agricultural research and extension activities and their
interaction with cereal pricing policy over time, have affected farm-level maize
technology adoption in southern Mali in the past.
CHAPTER THREE
HISTORICAL DEVELOPMENT PATH AND IMPACT OF FARM-LEVEL
MAIZE TECHNOLOGY'
The central thesis of this dissertation is that the use of a commodity
subsector perspective to incorporate market considerations into the design of
agricultural research programs can improve the payoff to investment in African
NARS. This can be illustrated by an historical analysis of the development path and
impact of farm-level maize technology in Southern Mali over the period 1969 -
1990. Careful attention is given to the role of institutional and policy factors, and
their effect on farm-level technology adoption incentives. The first section
describes specific objectives and methods used for this component of the study.
Section 2 traces the history of maize research, and section 3 the diffusion of maize
technology in Southern Mali. Section 4 examines the financial and economic
impacts of investment in maize technology development and diffusion. The final
section looks at implications for future maize research and technology development.
The choice of maize for a case study of agricultural research impact in Mali
was motivated by four considerations. First, maize is the only rainfed cereal with
potential for intensification. Second, a number of improved maize varieties had
been made available to farmers by extension services. Third, maize is grown in a
well-defined geographical area, reducing the logistical complexity and cost of the
study. Finally, there was considerable concern among Malian researchers and
, This chapter is based primarily on Boughton and Henry de Frahan (1994), oneof seven agricultural research impact studies undertaken in Africa for USAID(AFR/ARTS/FARA) under the Food Security in Africa Cooperative Agreement.
30

31
extension workers conce:rning the negative effects of cereal market reform during
the 1980s on technology adoption at the farm level (Staatz, 19891.
The prevailing view among Malian research and extension staff was that the
cultivation of intensive maize experienced a boom during the early 1980s when
there was a guaranteed market, that subsequently collapsed when the cereal market
was liberalized. Since this was an experience that might occur in the future for
other commodities, given the commitment to market reform in Mali, the historical
assesSment of the financial and economic impact of maize research and technology
diffusion was broadened to include an assessment of constraints and opportunities
for further development of the subsector. This would not only enable the team to
understand better the historical constraints to the impact of maize research and
extension in southern Mali, but also to identify the kinds of technological,
institutional and policy-related innovations that could enhance the future
contribution of the maize subsector to agricultural and economic development in
Mali.
The impact assessment study was initiated in July 1991 in collaboration with
IER's Farming Systems Department (DRSPR). The study benefitted from strong
collaboration with the two regional development organizations in the study area, the
Compagnie Malienne pour Ie Developpement des Textiles (CMDT) and the Operation
Haute Vallee (OHV).
3.1 Objectives and methods
In collaboration with DRSPR researchers, the study objectives were
formulated as a logical sequence of questions:
32
1) What technologies have been developed and diffused for maize over the last
ten to fifteen years?
2) What technologies have been accepted, rejected or modified by farmers, and
why?
3) What has been the impact of maize technology adoption at the farm
household level?
4) What factors have encouraged and what factors have constrained the
adoption of maize technology at the farm household level?
5) What is the profitability, or rate of return, to investment in maize research
and diffusion at the national level?
6) What factors have encouraged and what factors have constrained the rate of
return to investment in maize research and diffusion?
With only slight modifications (such as the historical time span of maize technology
development) these six questions provided a valuable guide throughout the duration
of the study.
The first question involved documenting maize research and extension
activities since the late 1970s through literature review (annual reports of research
and extension agencies in particular), and in-depth interviews with the researchers
and extension workers involved.
Questions two through four focus on the farm-level impact of maize
technology, and were addressed using secondary data from extension agencies,
complemented by informal surveys with farmer groups and detailed interviews with
extension workers. Topics discussed included:

33
• existing varieties and cultural practices for maize, changes that have
occurred over time and source of the changes, advantages and
disadvantages of new varieties/practices, modifications to recommended
practices that farmers have made and reasons for those changes;
• changes in area cultivated and cropping pattern, availability and mix of food
grains, changes in cash income, changes in food preferences, effects on soil
fertility;
• how has adoption of technology been affected by climatic changes,
availability of animal traction, availability of seed and other inputs, price
supports, access to markets, storage and processing facilities.
Subsequently, financial crop budgets for different recommendation domains were
developed using secondary data on the adoption of husbandry practices in the
CMDT and OHV zones (see map, Figure 3.1 ).2
Once the farm-level impacts had been determined, questions five and six on
the economic impact of maize technology development and extension could be
addressed. A benefit/cost analysis was undertaken, whereby economic prices were
applied to the different crop enterprise budgets and then net benefits were
aggregated over the area of improved maize cultivated in each recommendation
domain over time. Costs were estimated by examining the historical expenditures
of relevant institutions (IER, OHV, CMDT), and the proportion of expenditures that
could be attributed to maize.
2 A recommendation domain refers to a group of farmers utilizing similarhusbandry practices for maize under similar agro-climatic conditions.
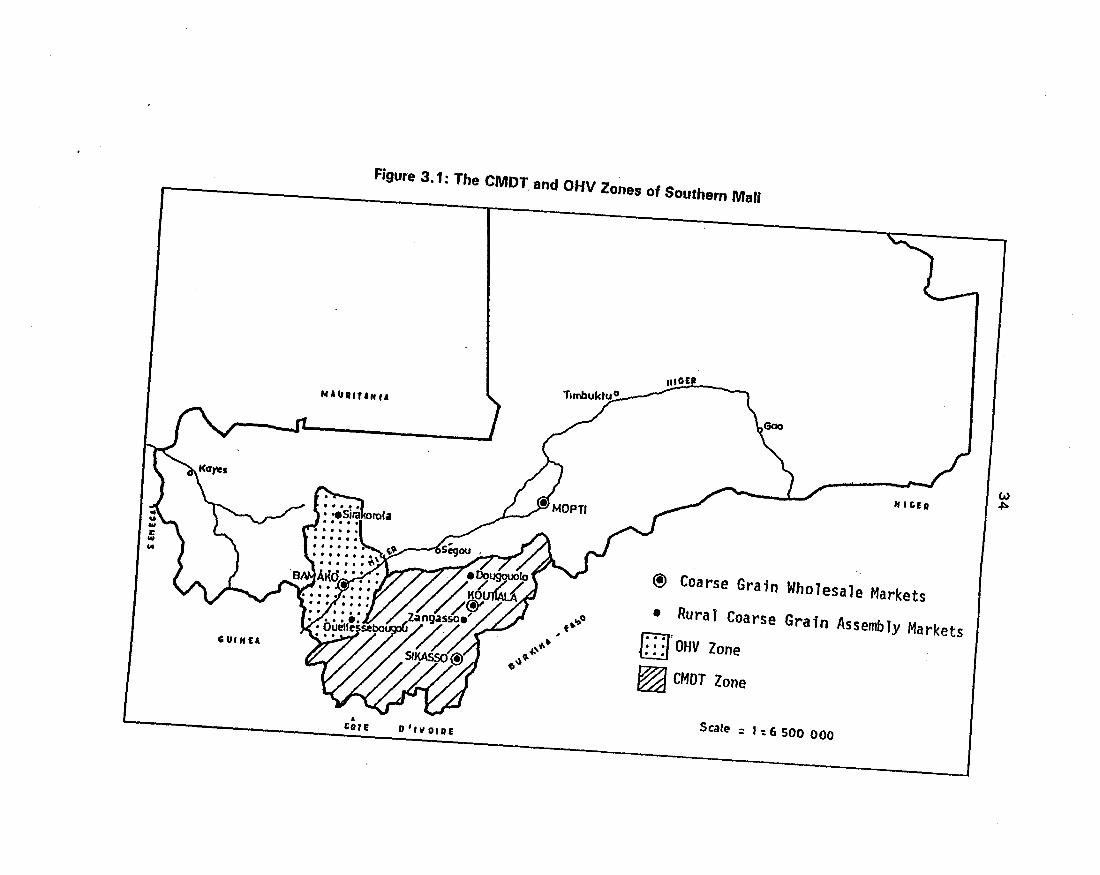
Figure 3.1: The CMDT. and OHV Zones of Southern Mali
GUIHU
MAURltlft U
•totE 0 'III OIAE
•-..,t>~-.)~
ot"-'
"It;ER
@ Coarse Grain Wholesale Markets• Rural Coarse Grain Assembly Markets
:::"OHV Zone...~ CMOT Zone
Scale = ,,: 6500 000
to>~
35
3.2 History of maize research in Mali
A careful examination of the historical development path of maize technology
is instructive for three reasons. First, the evolution from a single discipline applied
to a single crop, to multiple disciplines working on a single crop, to multiple
disciplines working on cropping systems (intercropping), and finally to farming
systems research, increases the complexity of the research organization task.
Mali's experience with maize shows that when organizational development (both
within research and between research and other organizations such as extension)
lags behind the complexity of research activity, the consequence is wasted
resources as a result of duplication and/or technical error.3 Since the addition of a
commodity subsector perspective increases the complexity of research still further,
this experience underlines the need to consider how to minimize the organizational
"transactions costs" for NARS. Second, the study reveals that research program
decisions often involve implicit judgments about subsector conditions upstream and
downstream even when those conditions have not been explicitly verified. Finally,
the examination reveals the importance of accurately tracing the technology
development and diffusion process to identify research impacts correctly.
3.2.1 Initial establishment of a rainfed cereal crop varietal improvement
program (1964-1980)
In 1962, a technical assistance agreement was concluded between GRM and
the Institut de Recherches Agronomiques Tropicales et des Cultures Vivrieres
3 Bonnen (1990) refers to the development of organizational capacity asinstitutional capital. He argues that increases in human, physical, and institutionalcapital must accompany technological development for sustained economic growth.
•
36
(IRAT), a French tropical research institute created in 1960. IRAT was to take
responsibility for soil science, rice and wheat varietal improvement, and research on
industrial crops and sugar cane. In 1964, this agreement was amended to include
the creation of a varietal improvement program for millet, sorghum and maize.4
The human and financial resources devo~ed to IRAT's program in Mali appear to
have been small relative to other West African countries (in particular Senegal and
Burkina Faso). Maize was allocated only a small part of these resources in view of
the limited area cultivated relative to other rainfed cereals (lRAT, 1974).
Research on maize was largely confined to varietal testing, with a limited
amount of work on fertilizer use in the context of a broader study of the fertilization
of rainfed cereals.5 Interest in anything more than a token effort to develop maize
production first became apparent at the annual meeting of the National Agronomic
Research Committee in April 1969. At that time, maize cultivation was limited to
small plots around the farm household, and a limited area of flood recession
cultivation in the Senegal river valley, with yields estimated to be in the range 600 -
1000 kg/ha. The committee's interest appears to have been stimulated in part by a
project proposal from the Direction des Industries to consider a range of possible
4 Prior to the inception of the rainfed cereal improvement program that remainedunder IRAT management until 1974, maize varietal work had been limited to theapplication of mass selection procedures to local ecotypes (Le Conte, 1965). Thisactivity had resulted in the standardization of a local, early, yellow-grained varietycalled Zanguereni (85 days).
5 Analysis of the fertilizer trials indicated that, given prevailing prices of cerealsand fertilizer, moderate doses of nitrogen and phosphate had every chance of beingprofitable on maize, marginally profitable on sorghum, and not profitable on millet.For maize, a binary formulation of nitrogen and phosphate was recommended (Pieri,1973). In the view of IER's fertilizer agronomist this approach remains valid todaydespite the fact that the CMDT uses a complete formula (A. Traore, personalcommunication) .

37
industrial uses of maize. The project was considered premature because oT
uncertainty surrounding the feasibility of large-scale intensive maize cultivation.
Nevertheless, given the value of maize as a food crop, its agronomic potential, and
the lack of progress made in regard to the intensification of millet and sorghum, the
committee considered that greater effort should be devoted to maize research than
had been the case hitherto (lRAT, 1974). The main thrust of the research effort
throughout the 1970s continued to be varietal improvement.6
The varietal selection criteria in use at the time reveal researchers' judgments
about product demand and input supply. The criteria stated in annual reports of the
period are (i) flint or semi-flint, yellow or white maize; (ii) duration 80 - 120 days;
(iii) high yielding open pollination; (iv) resistant to lodging or shattering; (v) average
height of 2 - 2.5 meters. Since virtually any maize cultivar will satisfy criteria (i)
and (ii), researchers were effectively implying that consumers had no preference in
regard to color, processing characteristics or time of maturity. The dominant
criterion is (iii), since (iv) and (v) are simply instrumental in achieving high yields.
The insistence on open-pollinated varieties resulted from researchers' perceptions
that hybrid seed multiplication was too costly to establish, despite the absence of
any formal economic analysis. The primary goal of intensification through open-
pollinated varieties remains in place to this day despite the widespread adoption of
hybrids by smallholders in Eastern and Southern Africa.
The strategy of focusing most of the maize research effort during the 1970s
on varietal improvement failed to result in any significant breakthrough. By the end
6 Details of IRAT's strategy, which involved exploiting the genetic potential ofWest African ecotypes to the maximum extent possible (Le Conte, 1965), are givenin Boughton and Henry de Frahan (1994).
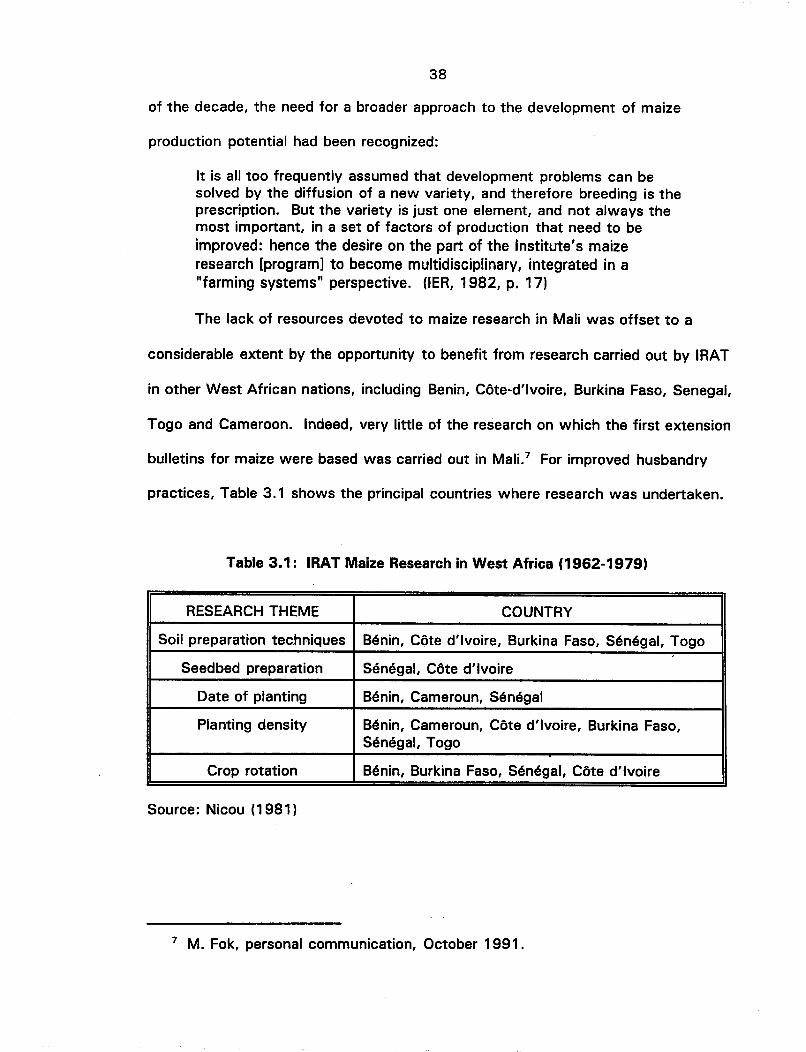
38
of the decade, the need for a broader approach to the development of maize
production potential had been recognized:
It is all too frequently assumed that development problems can besolved by the diffusion of a new variety, and therefore breeding is theprescription. But the variety is just one element, and not always themost important, in a set of factors of production that need to beimproved: hence the desire on the part of the Institute's maizeresearch [program] to become multidisciplinary, integrated in a"farming systems" perspective. (lER, 1982, p. 17)
The lack of resources devoted to maize research in Mali was offset to a
considerable extent by the opportunity to benefit from research carried out by IRAT
in other West African nations, including Benin, Cote-d'ivoire, Burkina Faso, Senegal,
Togo and Cameroon. Indeed, very little of the research on which the first extension
bulletins for maize were based was carried out in Mali. 7 For improved husbandry
practices, Table 3.1 shows the principal countries where research was undertaken.
Table 3.1: IRAT Maize Research in West Africa (1962-1979)
RESEARCH THEME COUNTRY
Soil preparation techniques Benin, Cote d'ivoire, Burkina Faso, Senegal, Togo
Seedbed preparation Senegal, Cote d'ivoire
Date of planting Benin, Cameroun, Senegal
Planting density Benin, Cameroun, Cote d'ivoire, Burkina Faso,Senegal, Togo
Crop rotation Benin, Burkina Faso, Senegal, Cote d'ivoire
Source: Nicou (1981)
7 M. Fok, personal communication, October 1991.
39
In sum, while the 1970s did not produce the varietal breakthroughs hoped
for, the availability of research findings from other parts of the region, combined
with the high potential of local varieties (particularly Tiemantie), meant that the
elements of a technical package were nevertheless in place by the end of the
decade.
3.2.2 Towards an integrated approach to maize research (1980-present)
While varietal improvement remained a key component of maize research,
the 1980s saw a substantial increase in the scope of maize research activities, the
number of disciplines involved, and linkages with national and international
organizations. Research into improved maize-based intercropping systems was
initiated on-station by a team of ICRISAT and local scientists, and packages were
subsequently tested on-farm by the SAFGRAD project and farming systems teams.
A serious outbreak of maize streak virus in southern Mali in 1983 prompted an
intense collaborative effort between researchers from varietal development and crop
protection departments of IER, and staff of the CMDT's Cellule Recherche
d'Accompagnement.
The increase in complexity of the research agenda was the result of both
demand and supply-side factors. On the demand-side, researchers became more
aware of (what they perceived to be) farmers' needs for improved maize
technology, rather than crop yield performance as an end in itself. On the supply
side, there was a considerable increase in the number of trained national scientists

40
and external donor support. 8 This increase in complexity involved a corresponding
increase in organizational demands, primarily for communication among researchers
and between researchers and extension. Whereas personnel and financial resources
were the binding constraints on research output during the 1970s, organizational
capacity (or organizational capital) became the major constraint on the effectiveness
of maize research during the 1980s.
a) Varietal development
During the 1980s, emphasis was increasingly placed on disease resistance
and early maturity as varietal selection criteria. Disease resistance became
prominent as a criterion following a dramatic outbreak of maize streak virus in the
southern part of the CMDT zone in 1983. The emphasis on early maturity was a
response to the needs of farmers in the central and western parts of the country
where rainfall is lower, and non-mechanized farmers for whom early harvested
maize remains a key part of their hungry season food security strategy. The
importance of early maturity was also emphasized in feedback from the first on-farm
tests of promising varieties, initiated by the Semi-Arid Food Grains Research and
B USAID became a major donor to the Malian NARS during the 1980s, fundingthe ICRISAT and SAFGRAD projects, as well as part of the farming systemsprogram. This support has continued into the 1990s, with a shift in emphasis fromFSR to supporting research on key commodities and IER's restructuring program.Other major donors during the 1980s were the Dutch government (farming systemsresearch), the French aid program (mainly in the form of resident scientificpersonnel), and the Ciba-Geigy Foundation (for the establishment and operation of arainfed cereal research station at Cinzana).
41
Development (SAFGRAD) project in collaboration with regional development
agencies.9
In contrast to effective communication between the SAFGRAD and maize
varietal improvement programs of IER, the CMDT's maize promotion project (Projet
Ma"is) undertook on-station and on-farm varietal evaluation independently of IER.
This project began in 1980 with funding and technical assistance from the French
cooperation program.10 The project management saw researchers as academic,
citing as an example fertilizer recommendations made without regard to the
formulations actually available to farmers. 11 IER researchers were unaware of the
project's varietal selection activities until they accidentally discovered them in the
course of a tour of the project's seed farm!12
The project's autonomy in regard to research was abruptly terminated by the
1983 maize streak virus outbreak. IER responded rapidly to the crisis and a
cooperative program of plant pathology studies, together with screening for varietal
resistance, was mounted by IER and the CMDT's Research and Development
Liaison Unit at Sikasso (the unit which evolved out of the Projet Ma"is). Within four
years, the pathology of the virus was understood and early planting was identified
9 The fact that the head of the maize varietal improvement program participatedin the SAFGRAD project during his early career, and received MS training underSAFGRAD projec"t funds, probably contributed to the effectiveness of the feedbackbetween the two programs.
10 The role of this project will be discussed more fully in the next section.
11 M. Fok, personal communication, October 1991.
12 O. Niangado, personal communication, November 1991.

42
as a cultural practice liable to reduce incidence of the disease. More importantly,
since early planting of maize aggravates the labor bottleneck and increases the risk
of drought at flowering time, an early-maturing streak-resistant variety of white
maize had been identified, multiplied and made available to farmers. The success of
this collaboration had an important impact on the relationship between IER and the
CMDT, which has continued to contribute financially to the IER maize research
program ever since.
The adjustment of varietal selection criteria to reflect farmers' needs better
was accompanied by a diversification of the sources of maize germplasm that began
at the end of the 1970s with the arrival of CIMMYT material. Compared to the
previous decade, an impressive list of ten varieties was nominally available to the
farming community by the end of the 1980s. However, of these, three were
extended directly by the CMDT (Tuxpeno 1, Molobala 2, E211) without IER
involvement, and two (Across 7844 and Golden Crystal) have yet to be
disseminated in the OHV zone because registered seed is not available from the
national seed multiplication service. Furthermore, all external introductions (except
Golden Crystal, which is not available) are white, whereas the preference of urban
consumers and poultry rearers is for yellow.
Despite these weaknesses, progress made in varietal development during the
1980s was dramatic compared to that made during the 1970s. In particular, the
identification and release of the streak resistant, early-maturing TZESR-W in less
than four years was an astounding achievement, and the result of intense
collaboration between both disciplines and structures (CMDT and IER). Informal
43
discussions with farmers reveal that while TZESR-W was primarily selected for
streak resistance, it is particularly appreciated for its early duration and ability to
perform relatively well with only moderate doses of fertilizer. The robust
performance of TZESR-W went unrecognized by the formal research system until
1993, however, when the first farmer-managed maize varietal tests were conducted
by the Sikasso farming systems team (DRSPR, 1994). Lack of effective
collaboration between on-station and on-farm research is also evident in the case of
maize-based intercropping research.
b) Maize-based intercropping research
Maize-based intercropping systems have long been a part of the farming
systems indigenous to southern Mali (Dolo, 1987). Efforts to improve maize/millet
intercropping were initiated on-station by ICRISAT during the early 1980s, and
subsequently tested on-farm by the SAFGRAD project. Further on-farm testing was I,
undertaken by the Farming Systems Research programs based at Sikasso and
Bougouni for the CMDT zone, and at Sotuba for the OHV zone. The CMDT's
Cellule Recherche d'Accompagnement also conducted demonstrations of improved
maize-late millet packages.13 Contrary to the prevailing wisdom that the rapid
expansion of intercropped maize in Southern Mali in recent years is a consequence
13 Initially the CMDT's maize project was against intercropping, promoting onlya sole maize package. After the dramatic outbreak of maize streak virus in 1983,and the drought spells of 1983 and 1984, CMDT staff realized that intercroppedmaize was more resistant to drought and disease problems than sale maize. In thecase of streak virus, intercropped maize was less severely attacked than sale maize(which often suffered a complete wipeout). In the case of drought, the intercroppedlate millet yields would compensate for the loss of maize yield to some extent.

44
of this research14, and despite the significant personnel and financial resources
devoted to the improvement of this traditional practice, no concrete evidence of
farm-level impact has been established. It is important to understand the reasons
for this lack of impact in order to identify ways of improving the effectiveness of
future research endeavors.
The ICRISAT research on maize/millet intercropping was initiated in 1982
after staff observed that farmers' traditional intercropping practices suffered lower
yield reductions than sole maize in the event of drought or disease attack (Shetty et
al., 1991).15 The goal was to intensify the system (increase total yield per unit
area) while preserving its robustness. The agronomic research led to a spacing
recommendation of two rows of maize (equivalent to a full sole maize stand) to one
of millet, the latter sown when the maize plants reach the 3-4 leaf stage. This
recommendation implies an increase in the population of millet from 10,000
plants/ha (farmer.g' practice) to 30,000 plants/ha. 16 The varietal and fertilization
research confirmed that the existing recommendations for sole maize were
(agronomically) appropriate for the intensified system.
The improved maize-millet intercropping system was tested on-farm for four
consecutive years from 1984 to 1987, first by the SAFGRAD project and
14 D. Attwood, personal communication, November 1991.
15 Maize and millet are a good combination from an agronomic perspectivebecause the two cereals have complementary growth cycles which reducecompetition for soil moisture, spread drought risk, and make full use of the longerrainy season experienced in southern Mali.
16 S. Shetty, personal communication, October 1991.

45
subsequently by its successor unit, the Cellule des Essais Multilocaux et
Prevulgarisation (CEMP). After three years of on-farm tests, SAFGRAD researchers
concluded that the maize/millet intercropping system was higher yielding and more
stable than either sole maize or millet, and that the improved method of planting in
alternate rows was higher yielding than the traditional practice of mixing the crops
in the row. They noted that the system of planting in alternate rows was more
difficult to weed mechanically and recommended that additional research be
undertaken to facilitate mechanical weeding of the alternate row system (Traore et
al. 1987).17 The CMOT's Cellule Recherche d'Accompagnement encountered the
same difficulty of mechanical weeding in their program of on-farm demonstrations
(Dolo, 1987).
As a result of the difficulties encountered in mechanical weeding, the
"improved" system was never extended by the CMOT.18 Two key questions
remain unanswered: first, why was the mechanical weeding problem caused by the
narrow between-row spacing never corrected, and second, why has the improved
system not yet been extended to non-mechanized farmers in the CMOT zone?
A considerable amount of effort was also devoted to maize/millet
intercropping by all three farming systems research units in operation at the time.
The team based at Bougouni undertook on-farm trials between 1981 and 1985, and
17 The establishment of a research program to address issues relating to themechanization of intercropping systems in general was a recommendation anintercropping workshop held in Mali in 1987 IA. Diarra, personal communication).
18 As one CMOT extension worker expressed it, with more than a little irony,"Having taken so many years to reach the stage of mechanized farming, are wesupposed to go and tell the farmer to pick up the hand hoe again?"
46
pre-extension tests during 1986 and 1987 following a workshop on maize-millet
intercropping held in Sikasso in 1985. This research focussed on the two planting
methods as well as different levels and types (mineral versus organic) of fertilizer
application. In many cases the team found it difficult to draw definitive conclusions
from the on-farm trials and tests because of operational difficulties. In general,
fertilizer doses lower than those recommended by the CMDT were most profitable
given farmers' practices. The team based at Sikasso began work on maize-millet
intercropping somewhat later than the Bougouni team, but focussed on similar
technical themes (fertilization in particular). A synthesis of this work is currently
being prepared. The farming systems team at Sotuba was not established until
1986, and hence was in a position to benefit from the work previously undertaken.
The farming systems team at Sotuba, anxious to avoid duplication of effort
and reduce the time taken to deliver technology to the farmer, chose to go straight
into pre-extension of a maize-millet intercropping package. They did so on the basis
there was already a proven package available. This was clearly a false premise
given the fact that the Sikasso farming systems team had not yet completed a
definitive analysis of their on-farm research, the on-farm testing undertaken by
SAFGRAD and the CMDT had identified difficul~ies in mechanical weeding, and the
CMDT was not actively extending any package for maize-millet intercropping. In
the course of three years of on-farm tests the team ran into a number of setbacks
which left them bemused and discouraged:
Maize/millet intercropping, which performs well in the Southern Mali[CMDT] zone, has not lived up to expectations in the OHV zone. Theintercrop was introduced because of the similarity between the twozones. The lack of positive results shows that a direct transfer of
47
technology does not always work. A diagnostic study of the reasonsfor the failure of this intercrop in the OHV zone is necessary tounderstand the principal constraints and provide feedback tocommodity researchers. (JER, 1992, p. 55)
The fact that one farming systems team could proceed with a pre-extension
campaign on the basis that a proven package was available when other researchers
had already encountered difficulties and/or had not yet completed a definitive
analysis illustrates the organizational constraints encountered as the scope and
complexity of the research agenda increased.
Two important conclusions can be drawn from this review. First, while the
on-station and on-farm research conducted to date has confirmed the strengths of
the traditional practice of intercropping maize with late millet in southern Mali, there
is no evidence of any farm-level adoption of an improved maize-millet intercropping
system. The only distinctive element of the "improved" maize-millet intercropping
system is the plant density/spatial arrangement, which has not been promoted by
the CMDT because it cannot be weeded using animal traction. Rather than being
attributable to any improved technology package, the rapid expansion of
intercropped maize area in southern Mali in recent years reflects the traditional
system's suitability to uncertain climatic and market conditions. 19 Such
improvements in husbandry practices that have taken place at farm level appear to
be primarily a spillover frqm earlier extension efforts to promote improved sole
maize (e.g., plowing, fertilizer use, mechanical sowing).
19 Following the liberalization of cereal markets in 1986, maize prices fell bothabsolutely and relative to millet and sorghum. Since 1986, millet prices have beenconsistently higher than maize prices in southern Mali, in part due to the exportdemand for millet from Cote-d'ivoire.
48
The second conclusion that can be drawn is that there has been a
considerable amount of duplication of research effort at the on-farm testing and
"pre-extension" stages due to overlapping functions between different sections, and
a lack of timely and effective communication of results. The CEMP, the CMDT's
Cellule Recherche d'Accompagnement, and the three farming systems teams
operating in southern Mali all have mandates for on-farm research. 20 The
difficulties in effective communication of results between units is in part a reflection
of the former program review process that was organized according to program
boundaries and emphasized disciplinary critique. These weaknesses are currently
being addressed by the restructuring of IER, which seeks to decentralize the
planning and review process and emphasize development-oriented review criteria.
The addition of a commodity subsector perspective will increase the
complexity of the research agenda still further, at least in terms of the number of
variables to be taken into consideration. It will therefore be important to identify
organizational linkages that will avoid duplication or communication failure. Further,
this review suggests that a careful assessment of the current state of technology
development and diffusion would be a useful component of the initial subsector
appraisal phase.
3.3 The diffusion of maize technology in Southern Mali
The development of new technologies is not by itself sufficient for
investments in research and extension to generate benefits for society. Farmers
20 This dupJication has been noted by other observers. See Dembele (1990).

49
must adopt the technologies that flow from these investments. This requirement in
turn implies that technological innovation must both enable farmers to further their
objectives (e.g., income generation and/or enhanced food security), and be
technically feasible and financially viable to implement. The high potential yields
and early maturity of maize compared to sorghum or millet might lead one to
consider the attraction of intensive maize production to be self-evident.
Maize offers no "free lunch", however. The husbandry requirements of a
successful maize crop are demanding. The preparation of an adequate seedbed
requires plowing, for example, and the growing crop must be weeded regularly in
the crucial early stages. In order to provide this level of husbandry, either a tractor
or trained draft animals must be available. Intensive maize is also very demanding
of soil nutrients, whereas the region's soils are generally infertile. The cultivation of
maize on a scale beyond garden plots therefore requires the use of chemical
fertilizer, which must be accessible in an appropriate form and profitable to use.
This implies the development of input delivery, credit and crop marketing systems.
In sum, a set of complementary investments in physical and human capital,
together with institutional and policy innovations, must be in place before farmers
can adopt intensive maize technology on a wide scale. The critical role played by
these factors is confirmed by a comparison of maize technology adoption in two
areas of southern Mali that differ in their levels of physical and human capital
investment (the OHV and CMDT zones), and within the same zone over time as the
institutional and policy environment changes (the CMDT zone).
50
The remainder of this section is divided into two parts. The first reviews the
institutional background (organizations and policy) to the development of maize
production in southern Mali. The second part documents the adoption process over
time. Three distinct phases in the diffusion of maize technology are identified: the
first phase concerns the period prior to any large-scale extension effort focussed on
maize; the second the period from the launch of the CMDT's "Projet Ma'is" in 1980
until the liberalization of cereal markets in 1986; and the final phase covers the
period from price liberalization up until the present day. The chapter concludes with
an assessment of the contribution of agricultural research to this process.
3.3.1 Development and policy background to the take-off of maize in
Southern Mali
Two types of institutions play an important role in the development of maize
production in southern Mali. The first are the Operations de Developpement Rurale
(ODRs), government parastatals charged with rural development in a defined
geographical area and generally having a particular cash commodity focus. The two
ODRs charged with rural development in southern Mali are the Operation Haute
Vallee (OHV) and the Compagnie Malienne pour Ie Developpement des Textiles
(CMDT). In both areas, cotton has been the vehicle for generating a cash surplus
with which to mechanize and develop farming systems. The second dimension is
government policy toward the production and marketing of cereals, which has
undergone profound change in recent years. The two dimensions overlap in so far
51
as the ODRs have historically been an important instrument for the implementation
of food production and marketing policy.
a) Rural development in Southern Mali: the CMDT zone
The development of agricultural extension activities in southern Mali began in
1952, under the auspices of the Compagnie Franc;:aise pour Ie Developpement des
Fibres Textiles (CFDT) (de Wilde, 1969). Extension activities were confined to the
promotion of cotton using a diffuse network of itinerant "moniteurs". Following an
agreement with GRM in 1960, which made the CFDT responsible for agricultural
extension work in the greater part of southern Mali,21 a denser, residential
extension network was established. Although the CFDT's mandate was not
confined to cotton, the company continued to focus on this crop: " .•. it is clear that
for the most part the improved production of cotton has been introduced without
significantly affecting farming as a whole" (de Wilde, 1969, p. 333).
The supply of agricultural equipment became an important part of the
program, and over 13,000 plows and 3,000 carts were in use by 1964. This
process of "capitalization" of the farming system, i.e., using the profits from cotton
to pay for draft animals and equipment that subsequently permit an expansion of
the cultivated area, is the hallmark of agricultural development in southern Mali.
The Compagnie Malienne pour Ie Developpement des Textiles (CMDT) was
created in 1974 to take over the activities of the CFDT, while retaining close
21 The CFDT was made responsible for the greater part of eight districts(cercles) in the administrative regions of Bamako (Diona, Fana), Segou (Segou, Sanand Tominian), and Sikasso (Koutiala, Yorosso and Kadiolo).

52
technical and commercial links with the latter. The CMDT was charged with a
broader rural development mission than its predecessor. Specifically, its objectives
include (CMDT, 1990):
(i) to increase production of cotton and all crops grown in rotation with cotton,
in order to promote a biologically and economically balanced cropping
system;
(ii) to provide an effective agricultural extension service, and credit for the
purchase of equipment and other inputs necessary to raise income and
improve food self-sufficiency;
(iii) to improve the integration of livestock in farming systems;
(iv) to train and educate the rural population by means of literacy training and the
promotion of rural artisans and young farmers;
(v) to encourage the development of a network of village organizations (pre
cooperatives) to undertake tasks currently performed by resident extension
workers;
(vi) to enable advanced village associations to become independent cooperatives;
(vii) to modernize farms through the gradual introduction of motorized equipment
(small tractors);
(viii) to promote farm management skills through the development of simple
accounting methods;
(ix) to process cotton and market the fiber;
(x) to develop the profitable use of agricultural by-products;
(xi) to stock and market agricultural products according to policies in effect;

53
(xii) to develop and promote appropriate technology for processing agricultural
products.
The existence of a competent development administration has encouraged a high
level of donor support for the CMDT, including three World Bank financed rural
development projects. This investment has facilitated the development of a
network of rural roads, while at the farm level the earnings from cotton have
continued to permit the mechanization of farming systems and a rapid expansion of
the cultivated area.
b) Rural development in Southern Mali: the OHV zone
The Operation Haute Vallee (OHV) is a smaller and younger organization,
created in 1964. The comparative strengths and weaknesses of the OHV and the
CMDT have been well documented by Dione (1989, pp 41-45). He cites the
following reasons for the superior performance of the CMDT compared to the OHV:
1) higher participation of farmers in rural development activities through the
transfer of marketing functions to village organizations;
2) linkages with the French cotton development organization (CFDT) facilitates
access to research results, marketing channels and credit;
3) after the dismantling of the agricultural credit and rural equipment parastatal
(SCAER), the CMDT was the only ODR with direct access to purchased farm
inputs and agricultural equipment.
Dione reports that an estimated 75 % of the CMDT farms have animal traction
equipment against only 43 % in OHV, and that the CMDT ensures an equipment

54
replacement rate of 10 - 15% as compared with virtually no replacement in the
OHV zone. The CMDT also has a stronger extension program. In sum, the process
of human and physical capital development necessary as a complement to rapid
technological innovation was much further advanced in the CMDT zone than the
OHV when maize was first identified as an important potential lever for raising
cereal self-sufficiency in Mali. This brings us to the second dimension necessary to
understanding the background to maize development, that of national cereals policy.
c) National food strategy and cereal marketing policy
In response to chronic food deficits during the 1970s and early 1980s,
government policy has consistently stressed self sufficiency in cereals as a policy
objective. While the goal has remained essentially unchanged, there have been
radical changes in the policies used to seek to achieve this objective. Steffen
(1992) identifies three main phases in cereals marketing policy over the last twenty
five years: 1) a period of official state monopoly over cereals marketing (1967-81);
2) the coexistence of official and private marketing channels (1981-85); and 3) an
effectively liberalized cereal market (1985 to present). During the period 1965
1985, producer and consumer prices were fixed by decree. In general, official
producer prices were held low in order to protect real urban wages (Steffen, 1992).
Competition from parallel market channels made it increasingly difficult for the
national grain board (OPAM) to obtain cereals, which resorted to forcing producers
to make deliveries. Nevertheless, OPAM rarely handled more than 20% of the total
55
marketed surplus of cereals in Mali, with its market share of rice being higher than
that of coarse grains (Humphreys, 1986).
The growing financial deficits of OPAM were unsustainable, and in 1981
GRM and donors put together a Cereals Market Reorganization Project (PRMC) with
three objectives: 1) rapid increases in producer prices; 2) cereal market liberalization
through legalized participation of cereal traders; 3) the reduction of costly subsidies
by allowing consumer prices to rise to the point where OPAM's costs were covered
(Steffen, 1992). Minimum producer prices replaced "official" producer prices and
OPAM in effect became a buyer of last resort. Responsibility for the purchase of
cereals from farmers on OPAM's behalf was transferred to the OORs. It was this
combination that enabled the CMOT, from 1981 onwards, to offer farmers an
attractive guaranteed maize price. In 1985, however, there was a large cereal
surplus which exhausted OPAM's financial reserves. With OPAM unable to make
payments on grain the CMOT, in turn, was forced to suspend guaranteed prices to
farmers.
3.3.2 Technology adoption in the CMDT and OHV zones (1975 - 1990)
The decision by the CMOT to promote intensive maize production, in rotation
with cotton, was taken against a background of chronic food deficits experienced
during the early 1970522• Initially promoted among farmers using small tractors,
the program was quickly expanded to include farmers using animal traction.
22 The term "intensive" here refers to the use of improved varieties andhusbandry practices together with chemical fertilizers.

56
Adoption was rapid (Figure 3.2). The factors that underpin this phenomenon clearly
demonstrate the significance for the rate of technology adoption at farm level of
interactions between the stage of development of farming systems and market
opportunities.
Figure 3.2: Adoption of Improved Maize in the CMDT and OHV Zones
.--. • • • • • * • • •10000
80000..,..------------------,
~ 30000Q:
« 20000
60000-VI
~ 50000....~ 40000......
70000
198919871983
1981 1985YEAR
19791977
O-'-r-..,.---,..--,--.,---r-............,---.--r----r---,..--,--.,--.........--,--J1975
1--- CMDT ZONE ...... OHV ZONE
Source: CMDT and OHV Annual Reports
The stage of development of farming systems of Southern Mali had an
important bearing on the rate of technology adoption. Since the late 1950s, the
CMDT's predecessor (the CFDT) had been introducing mechanization as part of its
program to expand cotton production. By the mid-1970s there were an estimated
110,000 draft oxen, 37,500 plows, 1400 seeders, and 20,000 weeders in service.
In 1990, the level of mechanization had increased to ~05,000 draft oxen, 112,000

57
plows, 39,000 seeders and 74,000 weeders. Farmers were able to pay for this
equipment out of their profits from cotton production. Mechanization is crucial to a
farmer's capacity to adopt intensive maize because of need to plow and weed
frequently in a timely manner. Not surprisingly, the area of improved maize is highly
correlated with level of mechanization over the period 1975-90.23
A second factor encouraging the adoption of maize was the availability of
residual fertilizer on the previous year's cotton fields. Maize is the most fertilizer-
responsive rainfed cereal, and the presence of residuals implies a lower cash outlay
for farmers.
While the level of mechanization and fertilizer residuals from cotton certainly
facilitated adoption of maize at the outset, the process was greatly accelerated by
the provision of an attractive guaranteed market price. With the transfer of
responsibility for the purchase of cereals from the national grain board (OPAM) to
rural development agencies, the CMDT was in a position to apply to maize the same
integrated approach to technology delivery that it was already using so successfully
for cotton. This approach ensured that all stages in the subsector both prior to
farm-level production (seed multiplication and distribution, fertilizer and credit
delivery, extension advice) and post harvest (purchase and collection, transport,
storage, wholesaling) were coordinated through the administrative decisions and
technical resources of a single organization.
23 Bivariate correlations between the area of improved maize and the number ofdraft animals and equipment in service over the period 1975-1990 gives thefollowing results (all significant at the .01 level): number of draft oxen 0.98; numberof plows 0.99; number of weeders 0.98; number of seeders 0.98.
58
The implementation of an integrated approach was strengthened by the
launch of a maize development project in 1980. Financed by French aid, this
project included the establishment and operational budget for a seed multiplication
farm, a large-scale program of maize demonstrations (varieties and cultural
practices), a program of first-equipment loans for non-mechanized farmers,24 and
the construction of maize storage silos at CMDT regional depots. As discussed in
the review of maize technology development, the Projet Ma"is gave little attention to
linkages with research. With the exception of the variety promoted, package
components were based on research findings from elsewhere in the region.25
The joint impact of a coordinated subsector interacting with farming systems
characterized by a high level of mechanization and a profitable cash crop on farmer
adoption can be clearly demonstrated by comparison of the CMDT and OHV zones.
The OHV did not put an integrated maize technology development program in place,
and farming systems have considerably lower levels of mechanization.
24 The "Projet Ma"is" was conceived in part as a means to facilitate thedevelopment of farming systems in the less-developed southern part of the CMDTwhere cotton was not being promoted. Maize is preferable to cotton as a cash cropin low population density areas because of its lower labor requirements. Farmers inareas with low population density would find it difficult to organize sufficient laborto harvest cotton. In addition, as a dual-purpose crop, maize has advantage ofreinforcing food security. While the objective of capitalizing the farming systemthrough maize alone was doomed with the liberalization of cereal markets in 1986,even today farmers who receive first equipment loans (prats premier equipements)are obliged to cultivate one hectare of maize in order to release labor from cereal tocotton cultivation without undermining food security.
25 M. Fok (formerly head of the Projet Ma"is), personal communication, October1991.
59
Consequently, the adoption curve for intensive maize in the OHV zone is almost flat
(Figure 3.2).
Although dramatically effective in terms of adoption rates, the integrated
approach to maize production and marketing implemented by CMDT was not
financially sustainable. It required high subsidies on the part of the national grain
board (which purchased the maize from CMDT), and the CMDT itself was
subsidizing village-level collection of maize. With the removal of guaranteed prices
for maize in 1986 (accompanied by the withdrawal of credit for maize inputs)
farmers were exposed to highly variable market prices. The farmers' response to
this situation also underlines the importance of interactions between commodity
subsector and farming systems.
While the combination of technology delivery in the context of a highly
coordinated subsector and mechanized farming systems had a dramatic effect on
the rate of technology adoption, the withdrawal of marketing services and
guaranteed prices after 1986 primarily affected farmers' choice of production
techniques. Although the area of improved maize quickly resumed its growth
trajectory, there is a consensus among farmers and extension workers that the
choice of technology and degree of interaction with the market changed in the
following ways:26
26 Time series data are not available to confirm or refute farmer and extensionworker observations. However, Giraudy (1993) has confirmed that for farmers whouse fertilizer on maize, rates applied are close to half those recommended byextension. The issue of fertilizer use is discussed in detail in chapter 8.

60
1) reduction in fertilization levels, substitution of manure for chemical fertilizer,
and re-allocation of cotton fertilizer to maize;
2) substitution of early maturing varieties tolerant of low soil fertility conditions
for medium or long-duration varieties with high fertilization requirements;
3) in the southern part of the CMDT zone, a rapid shift from sole cropping back
to the traditional practice of maize-millet intercropping (a system more
tolerant of lower soil fertility and drought, and with a higher gross margin
because millet sold at a higher price than maize);
4) changes in marketing strategy: if the early maize harvest is good, and if the
prospects for the millet/sorghum also look good, farmers will off-load their
old millet and sorghum stocks on the market while prices are still high and
eat maize instead.
In the face of erratic maize prices, and without a line of credit to purchase fertilizer,
farmers effectively chose those technology options which enabled them to insulate
themselves from the uncertainties of the market. Nevertheless, the continued
expansion of maize production for on-farm consumption is an important contribution
to improved food security in rural areas.
It would be difficult, if not heroic, to attempt to isolate the contribution of
research from that of extension. Clearly in terms of initiative and resources
devoted, the promotion of maize has been primarily an extension effort. Probably
the most important contribution of research to date has been the identification of
61
the streak-resistant early-maturing variety TZESR-W,27 which according to farmers
is early maturing and performs relatively well with lower fertilizer doses. There is
no evidence that the intercropping research carried out by IER has had any impact
at farm level since the package was not promoted by the CMDT (because the
farmers found the row-spacing to narrow for mechanical weeding). Nevertheless,
the productivity of the traditional maize-millet intercropping system has undoubtedly
been increased by the application of husbandry techniques initially learned by
farmers through the earlier adoption of the sole maize package.
3.4 Costs and benefits of maize technology development and diffusion
This section assesses the impact of maize technology development and
diffusion by comparing the costs incurred with the benefits derived. The analysis is
conducted at two levels. The primary focus is on farm-level costs and benefits of
improved maize technology in financial terms, and the effect of marketing policy
changes on technology adoption incentives. Aggregate costs and benefits of maize
technology development and diffusion in economic terms are presented in summary
form.
3.4.1 Farm-level financial analysis
An appropriate way to evaluate farm-level incentives to adopt technology
and the impact of adoption over time is to measure the additional costs incurred and
27 A yellow counterpart to this variety, incorporating downy mildew as well asstreak virus resistance (DMRESR-Y), was released in 1993.
62
benefits derived from the farmer's perspective. This requires the use of prices
actually paid by farmers for inputs, and received for marketed produce. These
prices are referred to as financial prices, and analysis based on them' is referred to
as financial analysis. Financial prices differ from those used in economic analysis
by the value of any taxes paid or subsidies received by farmers, including, in the
case of traded commodities, those implicit in the official exchange rate.
Many inputs used by farmers, and much if not all of the additional maize
produced, may not be exchanged in the marketplace. Inputs may be provided, or
produce consumed, by members of the farm household. In this case, a financial
opportunity price is used to value the input or output. An opportunity price reflects
the amount of money the household would have had to pay for an input, or could
have received for produce, if it had been exchanged on the market.
Some benefits and costs may not be measurable in financial terms. Take
increased food security, for example. Many farmers state that the adoption of
maize as a field crop28 has reduced the likelihood of food shortage. The value of
reduced risk of hunger to the farmer cannot be estimated in financial terms,
although it probably a major factor explaining the continued expansion of maize area
after cereal market liberalization in 1986. On the cost side, farmers widely agree
that maize is much more arduous for women to process than other cereals. Indeed
28 Prior to the promotion of maize as a field crop in the early 1970s, it wasconfined to small plots around the house called "champs de case" which werecultivated entirely by hand. These plots benefitted from a high level of organicmatter, receiving kitchen waste and sweepings from the compound yard.

63
it is often said that "maize causes divorce". This may be a contributory factor to
lower prices for maize on rural markets at certain periods.
The analysis of farm-level financial benefits is carried out with partial
budgets. A partial budget is a simple tool for estimating the net effect of a change
in technology on household income. It is "partial" in the sense th.at only those
elements of the farm household's production and marketing activities which have
changed as a result of technology adoption are compared. A partial budget used to
estimate the net effect of fertilizer use on a given crop, for example, might include
the additional cost of fertilizer, the additional cost of labor for applying fertilizer,
harvesting and marketing a greater amount of produce, and the value of the
additional output obtained. In the present case, the task is a little more complex
because the change involves the adoption of a technical package (i.e., a
combination of practices) rather than a single component of a package, but the
same principle applies. Only the aspects of crop production that have changed as a
result of the adoption of the technology enter into the calculation of net benefits.
The first step in preparing a partial budget therefore is to identify what physical
changes in husbandry practices and production levels have occurred as a result of
the adoption of improved maize technology.
The physical and financial results of adopting a technical package are time
and location-specific. The additional yield obtained by using fertilizer, for example,
varies according to soil type and rainfall. The value of additional production
depends on market prices, which vary over time according to supply and demand
conditions. Given the agro-"cIimatic diversity of Southern Mali, and the important
64
changes in marketing arrangements that have taken place during the period under
study, it is clear that the impact of maize technology adoption in Southern Mali
cannot be accurately captured by a single partial budget. On the other hand,
attempting to reflect every possible variation in physical and market conditions
would require so many partial budgets that the analysis would become
unmanageable. The challenge facing the analyst is to identify those factors that
have an important effect on the financial outcome of technology adoption, and that
can be captured in a manageable number of budgets. Furthermore, in order to be
able to aggregate farm-level benefits for the region as a whole (a necessary step for
economic analysis), the area of maize cultivated under each set of defined agro
climatic and market conditions over time must be known.
In the analysis which follows, an area with more or less similar maize
production characteristics is referred to as a "Recommendation Domain", a concept
widely used in farming systems research. Each recommendation domain (RD) is
represented by one or more partial budge'ts that correspond to a set of production
practices and prices applicable during a specified period of time.
A total of eight RDs have been identified for the farm-level financial analysis,
six in the CMDT zone and two in the OHV zone. The criteria used to distinguish
RDs include geographical location (northern versus southern parts of the study
area), level of crop management (intensive versus semi-intensive), and cropping
system (pure stand versus intercropping). Geographical location is an important
criterion because the higher average rainfall in the southern part of the study area
permits a fuller expression of yield potential. The level of management is an

65
important criterion because maize is responsive to improved husbandry in general,
and fertilizer use in particular. The choice of pure stand versus intercropping is
relevant not because of any expected difference in total grain yield, but because
millet has generally commanded a price premium in rural grain markets since
liberalization in 1986. The estimated area of each recommendation domain over the
period 1975 - 1990 is provided in table 3.2, and a summary of their characteristics
in table 3.3.
Different partial budgets are constructed to represent a given RD over time in
order to take account of changes in variables that affect profitability, such as a
change in fertilizer recommendations or use levels, or changes in input and output
prices. For example, maize prices at harvest were lower following cereal price
liberalization in 1986 compared to previous years.
Only one partial budget is used to represent each of the two OHV zone RDs.
A partial budget for the years prior to 1980 is not included because no data are
available on either area cultivated or production techniques during this period. A
separate budget for the years after price liberalization is not included given the small
area of improved maize, and farmers reports in interviews that virtually all of the
improved maize area is cultivated for the purpose of assuring food self-sufficiency
rather than for sale.
The issue of fertilizer residuals from the previous cotton crop is not reflected
in the partial budgets for two reasons. First, there is a lot of controversy about the
effective contribution of such residuals. This controversy explains, in part, the
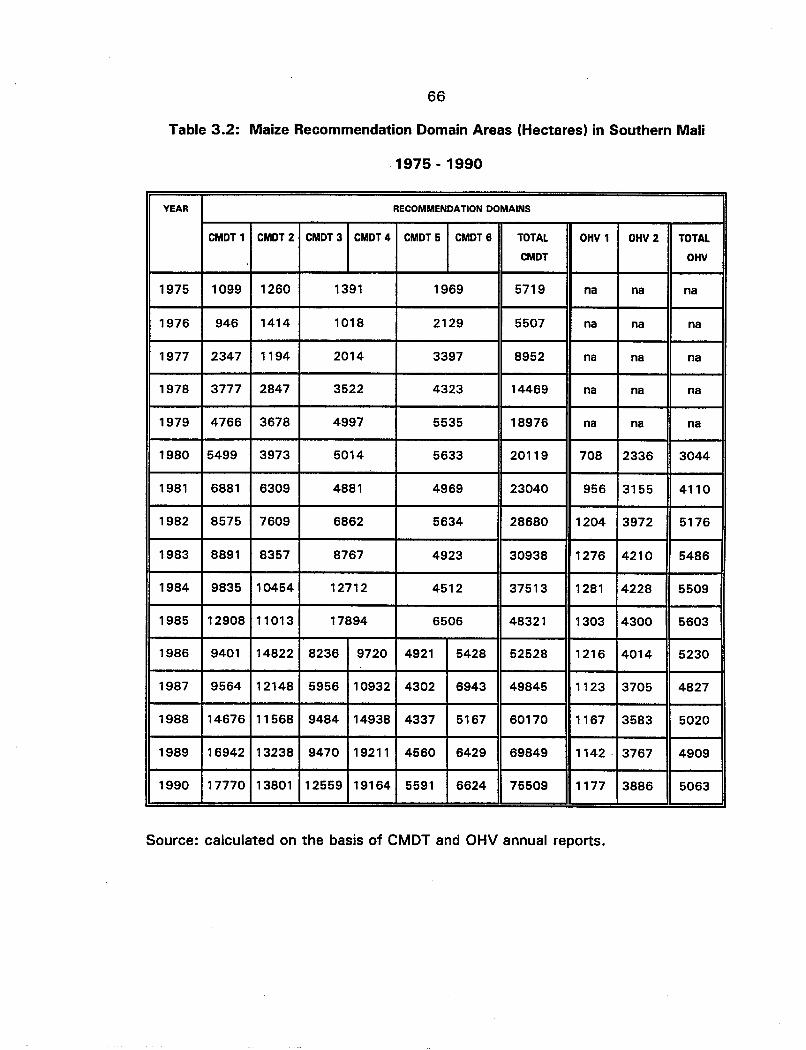
66
Table 3.2: Maize Recommendation Domain Areas (Hectares) in Southern Mali
1975 - 1990
YEAR RECOMMENDATION DOMAINS
CMOT 1 CMOT 2 CMOT3 CMOT4 CMOT 5 CMOT6 TOTAL OHV 1 OHV 2 TOTAL
CMOT OHV
1975 1099 1260 1391 1969 5719 na na na
1976 946 1414 1018 2129 5507 na na na
1977 2347 1194 2014 3397 8952 na na na
1978 3777 2847 3522 4323 14469 na na na
1979 4766 3678 4997 5535 18976 na na na
1980 5499 3973 5014 5633 20119 708 2336 3044
1981 6881 6309 4881 4969 23040 956 3155 4110
1982 8575 7609 6862 5634 28680 1204 3972 5176
1983 8891 8357 8767 4923 30938 1276 4210 5486
1984 9835 10454 12712 4512 37513 1281 4228 5509
1985 12908 11013 17894 6506 48321 1303 4300 5603
1986 9401 14822 8236 9720 4921 5428 52528 1216 4014 5230
1987 9564 12148 5956 10932 4302 6943 49845 1123 3705 4827
1988 14676 11568 9484 14938 4337 5167 60170 1167 3583 5020
1989 16942 13238 9470 19211 4560 6429 69849 1142 . 3767 4909
1990 17770 13801 12559 19164 5591 6624 75509 1177 3886 5063
Source: calculated on the basis of CMDT and OHV annual reports.

67
Table 3.3: Definitions and Characteristics of Maize Recommendation Domains (RD)
in Southern Mali
CMDT 1
CMDT 2
CMDT 3
CMDT4
CMDT 5
CMDT 6
OHV 1
OHV 2
CMDT North Intensive: refers to the maize area supervised by the
extension service in the Fana and Koutiala regions of CMDT which
was plowed, received chemical fertilizer, and possibly organic
fertilizer as well.
CMDT North Semi-intensive: refers to the maize area supervised by
the extension service in the Fana and Koutiala regions of CMDT
which was plowed and received organic fertilizer only.
CMDT South Intensive: refers to the maize area supervised by the
extension service in the Bougouni and Sikasso regions of CMDT
which was plowed, received chemical fertilizer, and possibly organic
fertilizer as well.
CMDT South Intensive (intercropped): refers to the maize area
supervised by the extension service in the Bougouni and Sikasso
regions of CMDT which was plowed, received chemical fertilizer,
possibly organic fertilizer as well, and which was intercropped with a
long-cycle cereal (usually millet).
CMDT South Semi-intensive: refers to the maize area supervised by
the extension service in the Bougouni and Sikasso regions of CMDT
which was plowed and received organic fertilizer only.
CMDT South Semi-intensive (intercropped): refers to the maize area
supervised by the extension service in the Bougouni and Sikasso
regions of CMDT which was plowed and received organic fertilizer
only, and which was intercropped with a long-cycle cereal (usually
millet).
OHV Intensive: refers to the maize area supervised by the extension
service in the OHV zone receiving chemical fertilizer.
OHV Semi-intensive: refers to the maize area supervised by the
extension service in the OHV zone receiving organic fertilizer.
68
CMDT's rationale for abandoning separate fertilizer recommendations for maize after
cotton versus maize after a~other cereal from 1980 onwards. Second, no
secondary data are available that record the area grown after cotton compared to
other crops after 1980. The same problem arises in regard to the diversion of
cotton fertilizer to maize reported by extension workers after the removal of maize
fertilizer credit in 1986. Theoretically, the gain in terms of increased maize
production should be offset by a reduction in cotton yields. There is no way of
measuring either the yield consequences or the area affected by the practice.
The purpose of each partial budget is to estimate the additional gain to the
farm household from the cultivation of maize in a particular RD. This gain, termed
incremental net benefit (INS), is measured in francs per hectare of maize cultivated.
The use of terms such as additional or incremental implies a comparison with some
alternative enterprise or technique. What is the appropriate alternative against
which improved maize should be compared?
Prior to the promotion of maize as an outer field crop in the mid-1970s,
maize was confined to small parcels around the household. These parcels, called
"champs de case", benefit from very high levels of organic matter that cannot be
replicated over a large area. Since expansion of maize on the champs de case is not
feasible, it would not be valid to compare improved maize production on outer fields
with traditional maize production on household plots. The two enterprises are

69
closer to being complements than alternatives.29 The most widely cultivated
cereals on outer fields in southern Mali are millet and sorghum. For farmers who
choose not, or who are not adequately equipped to grow maize on their outer fields,
these represent the alternative rainfed cereal crops. Since virtually all farmers who
grow maize on outer fields are mechanized (the majority with draft animals, a few
with small tractors), we compare improved maize to millet or sorghum cultivated on
outer fields with the use of animal traction.
The technical input/output relations for improved maize production, and the
profitability of the enterprise over the last fifteen years, are summarized for each RD
in Table 3.4.30 The top half of the table presents the incremental inputs used and
output obtained for maize as compared to millet or sorghum, .while the bottom half
presents the incremental net benefit (INS) obtained, together with measures of the
sensitivity of the INS to changes in the price of maize. We first discuss the
technical relationships in more detail, and then turn to the financial aspects.
a) Incremental production and input use
The top row of Table 3.4 presents the estimated yields of maize and the
alternative rainfed cereal (millet/sorghum) for each recommendation domain. These
yields are based on the opinions of research and extension workers, and yield data
29 Many farmers who grow maize on outer fields continue to grow maize ontheir champs de case as well, the latter providing fresh maize during the "hungryseason" while the outer fields provide grain maize for consumption and/or saleduring the dry season. .
30 The reader should bear in mind that Table 3.2 presents a summary of thefinancial analysis. Detailed partial budgets for each recommendation domain arepresented in Appendix 1.

Table 3.4: Input/Output Coefficients and Summary Partial Budgets for Improved Maize Compared to Millet/Sorghum in. Southern Mali 1975 - 1990
CMDT 1 CMDT 2 CMDT 3 CMDT4 CMDT 5 CMDT6 OHVl OHV 2
PARAMETER UNITS pre- 1980- post pre- post pre- 1980- post post pre- post post post post1980 1986 1986 1986 1986 1980 1986 1986 1986 1986 1986 1986 1980 1980
INCREMENTAL PRODUCTIONMAIZE YIELD KG/HA 1500 2000 1750 1400 1500 2000 2500 2250 2250 1750 1750 1750 1750 1500MILLET/SORGHUM YIELD KG/HA 800 900 900 900 900 1000 1100 1100 1100 1100 1100 1100 900 900INCREMENTAL YIELD KG/HA 700 1100 850 500 600 1000 1400 1150 1150 650 650 650 850 600
INCREMENTAL INPUT USESEED KG/HA 15 15 15 15 15 15 15 15 15 15 15 15 15 15SEED DRESSING KG/HA 0.025 0.025 0.025 0.025 0.025 0.025 0.025 0.025 0.025 0.025 0.025 0.025 0.025 0.025COMPOUND FERTILIZER KG/HA 0 100 50 0 0 0 100 50 50 0 0 0 50 0UREA FERTILIZER KG/HA 100 150 75 0 0 100 150 75 75 0 0 0 50 0
INCREMENTAL INCOMEINCREMENTAL BENEFIT CFA F/HA 31500 Q0500 20500 27500 10500 45000 77000 29500 40750 35750 9500 17000 46750 33000INCREMENTAL COST CFA F/HA 6861 27620 16976 1670 1226 6861 27620 16976 16976 1670 1226 1226 18426 1676
INCREMENTAL NET BENEFIT CFA F/HA 24639 32880 3524 25830 9274 38139 49380 12524 23774 34080 8274 15774 28324 31324
NET BENEFIT SENSITIVITYMAIZE YIELD/PRICE +/- 20% CFA F/HA 13500 22000 14000 15400 12000 18000 27500 18000 12000 19250 14000 10000 19250 16500MAIZE YIELD/PRICE +/- 20% %INB 55% 67% 397% 60% 129% 47% 56% 144% 50% 57% 169% 63% 79% 53%
Source: Boughton and Henry de Frahan (1994)Notes:1) For intercropped recommendation domains (CMDT 4 and CMDT 6) the maize yield includes the yield of the late cereal intercrop (Le., the figure
given represents the combined grain yield);2) A maize price .of 45 CFA F/kg is used prior to 1980, 55 CFA F/kg for the period 1980 to 1986, and 40 CFA F/kg thereafter (with the exception of
the OHV zone). Millet/sorghum prices are the same as for maize prior to 1986, but remain at 55 CFA F/kg after 1986.3) Changes in output or input prices will result in changes to the incremental net benefit even though physical input/output coefficients have not
changed.
'-Jo

71
Table 3.4 (cont.): Maize Recommendation Domain (RD) Partial Budgets
CMDT 1 CMDT North Intensive: refers to the supervised maize area in the Fana and Koutiala regionsof CMDT which was plowed, received chemical fertilizer, and possibly organic fertilizer aswell. This RD is represented by three partial budgets: one for the period before 1980 whenonly urea fertilizer was recommended by the extension service; one for the period 1980 to1985 when compound and urea fertilizers were recommended and a guaranteed price of 55CFA F/kg was in effect for maize; and one for the period since 1986 when guaranteedprices have not been available.
CMDT 2 CMDT North Semi-intensive: refers to the supervised maize area in the Fana and Koutialaregions of CMDT which was plowed and received organic fertilizer only. This RD isrepresented by two partial budgets: one for the period before 1985 when a guaranteedprice of 55 CFA F/kg was in effect for maize; and one for the period since 1986 when theguaranteed price has not been available.
CMDT 3 CMDT South Intensive: refers to the supervised maize area in the Bougouni and Sikassoregions of CMDT which was plowed, received chemical fertilizer, and possibly organicfertilizer as well. This RD is represented by three partial budgets: one for the period before1980 when only urea fertilizer was recommended by the extension service; one for theperiod 1980 to 1985 when compound and urea fertilizers were recommended and aguaranteed price of 55 CFA F/kg was in effect for maize; and one for the period since 1986when the guaranteed price has not been available.
CMDT 4 CMDT South Intensive (intercropped): refers to the supervised maize area in the Bougouniand Sikasso regions of CMDT which was plowed, received chemical and possibly organicfertilizer, and which was intercropped with a long-cycle cereal (usually millet). This RD isrepresented by a single partial budget for the period after 1986 when maize prices werelower than millet. Prior to 1986 the sole and intercropped areas are combined since thetotal grain yield is similar and the same guaranteed price was available for all coarse grains.
CMDT 5 CMDT South Semi-intensive: refers to the supervised maize area in the Bougouni andSikasso regions of CMDT which was plowed and received organic fertilizer only. This RD isrepresented by two partial budgets: one for the period before 1985 when a guaranteedprice of 55 CFA F/kg was in effect for maize; and one for the period since 1986 when theguaranteed price has not been available.
CMDT 6 CMDT South Semi-intensive (intercropped): refers to the supervised maize area in theBougouni and Sikasso regions of CMDT which was plowed and received organic fertilizeronly, and which was intercropped with a long-cycle cereal (usually millet). This RD isrepresented by a single partial budget for the period after 1986 when maize prices werelower than millet. Prior to 1986 the sole and intercropped areas are combined since thetotal grain yield is similar and the same guaranteed price was available for all coarse grains.
OHV 1 OHV Intensive: refers to the supervised area in the OHV zone receiving chemical fertilizer.This RD is represented by a single partial budget since a high proportion of maize isconsumed on the farm, and the value of output to the farm household (opportunity price)has not therefore significantly affected by the withdrawal of guaranteed prices.
OHV 2 OHV Semi-intensive: refers to the supervised area in the OHV zone receiving organicfertilizer. This RD is represented by a single partial budget since a high proportion of maizeis consumed on the farm, and the value of output to the farm household (opportunity price)has not therefore significantly affected by the withdrawal of guaranteed prices.
72
published in CMOT and OHV annual reports. Estimated yields of both maize and
millet/sorghum are higher for southern ROs (CMOT 3 - 6) than northern ROs (CMOT
1,2 and OHV 1,2). Estimated yields of maize are higher for management-intensive
ROs (CMOT 1,3,4 and OHV 1) than for semi-intensive ROs (CMOT 2,5,6 and OHV
2), within the same geographical zone. Millet/sorghum yields are higher for post-
1980 budgets, to reflect the improvement in crop husbandry as a result of
extension efforts for these 'cereals.
The second row of Table 3.4 presents the additional inputs required to
cultivate maize in Southern Mali as opposed to millet/sorghum. The distinction
between intensive and semi-intensive ROs is important here. Farmers considered to
follow an intensive management regime use chemical fertilizer (and possibly organic
fertilizer as well), while farmers considered to follow a semi-intensive regime are
entirely dependent on organic fertilizer. 31 The difference is more than one of the
source and amount of plant nutrients applied to the crop. In contrast to semi-
intensive management, the farmer who chooses an intensive management regime
has to make an investment in the crop that requires a cash outflow in an economy
where cash is scarce. The application of chemical fertilizer is therefore indicative of
a degree of commitment to the crop that will likely be reflected in a higher standard
of husbandry practices, in order to ensure an acceptable return on the farmer's
investment. In all ROs, it is assumed that farmers do not use chemical fertilizer on
millet or sorghum.32
31 In both cases, plowing is a requirement to qualify as improved.
32 For both the CMOT and OHV zones, data published in annual reports indicatethat chemical fertilizer use on millet and sorghum is negligible, due to the limitedyield response with existing varieties.

73
Maize cultivation in intensive RDs is modeled by three partial budgets that
represent the evolution of extension recommendations and fertilizer use over time.
Prior to 1980, the CMDT recommended only urea top dressing at the rate of 100
kg/ha. This was due to the high fertilizer rate recommended for cotton, designed to
ensure that the cereal crop following cotton in the rotation would benefit from
residual nutrients. After 1980, the CMDT changed its extension policy from one of
allowing cotton to "subsidize" cereal production, to one where each crop was
expected to bear its own costS. 33 The reason for this policy change was the
increased profitability of maize production following the dramatic cereal price rises
of the late 1970s. Recommended fertilizer doses were accordingly reduced for
cotton and increased for cereals. For maize, the recommended amount of urea top
dressing was raised from 100 kg/ha to 150 kg/ha, and a basal application of 100
kg/ha of compound fertilizer was added. Following the liberalization of cereal
markets in 1986, when maize prices fell even more sharply than other cereals,
farmers reduced the amounts of fertilizer applied even though recommended doses
were unchanged. With the termination of CMDT's specific credit program for
maize, many farmers began to divert part of their cotton fertilizer to the maize crop.
Giraudy (1993) found that, for the 1992 growing season, farmers who use fertilizer
on maize apply half the recommended dose.
Aside from fertilizer, the only additional inputs required are seed and seed
dressing, to account for the higher seeding rate for maize compared to sorghum.
No incremental labor has been budgeted for maize cultivation. Although
maize requires plowing (whereas millet/sorghum is direct seeded), and the harvested
33 A. Dolo (Cellule Recherche d'Accompagnement, CMOT), personalcommunication, November 1991.
74
ears are harder to thresh, the crop is easier to weed and harvest. The high
variability in data on labor inputs for cereal production does not justify the
assumption of a significant difference in labor requirement between maize and other
cereals cultivated on outer fields. Sensitivity analysis was carried out to assess the
effect of a 10 person-day per hectare difference in labor requirements on the
profitability of maize production. At between 5,000 CFA F and 7,500 CFA F per
hectare (depending on the opportunity cost of labor in the RO), the effect is small
compared to that of variability in the price of maize (discussed below).
b) Incremental income and sensitivity
The third row of Table 3.4 presents the calculation of incremental net benefit
(INS), measured in CFA F per hectare of maize cultivated. This is determined by
subtracting the incremental cost of maize production from the incremental benefit.
The incremental cost of maize production is determined by multiplying the additional
inputs used for maize cultivation by their respective financial or opportunity prices.
The incremental benefit of maize production is calculated by subtracting the value of
millet or sorghum from the value of maize produced (where value is determined by
multiplying cereal yields by their respective financial or opportunity prices). Only
the results of these calculations are presented in Table 3.4.
The most striking result manifested in Table 3.4 is the dramatic fall in the
profitability of maize cultivation following the liberalization of cereal markets in
75
1986.34 The fall is estimated to be most severe in the sole-cropped intensive
management RDs (89% in CMDT 1 and 75% in CMDT 3) and in the sole-cropped
semi-intensive southern RD (77% in CMDT 5). The fall is less severe in the semi-
intensive northern RD (64% in CMDT 2). This result is at odds with the reported
pattern of expansion of area cultivated to improved maize in recent years.
According to the data in Table 3.2, growth has been more rapid in management-
intensive RDs (CMDT 1,3,4) compared to semi-intensive RDs (CMDT 2,5,6). The
reasons for this apparent contradiction are not clear.35 The fall in profitability is
estimated to be least severe for the RDs where maize is intercropped (61 % in
CMDT 4 and 55% in CMDT 6), reflecting the higher price for the late millet
intercrop after 1986. This is consistent with the increasing popularity of
intercropped versus sole maize (compare CMDT 4 and 3 in Table 3.2).
The vulnerability of incremental net benefits to fluctuations in the price of
maize is further illustrated by sensitivity analysis. The bottom row of Table 3.4
indicates the absolute effect on incremental net benefits of a 20% change in maize
price (Le., an increase in the price will increase profits by the amount or percentage
shown and a decrease in price will decrease profits by the amount or percentage
34 This result is based on a market price of 55 CFA F/kg prior to liberalizationand 40 CFA F/kg afterwards. The post-liberalization price approximates the averageprice reported by the Systeme d'information du Marche for markets in producingareas during the four months after harvest (October - January). Assuming 50% ofhouseholds consume additional maize production instead of purchasing from themarket, and 50% of households sell the additional grain, additional transport costsfor marketed produce are offset by transport savings of purchased foodgrains.
35 There are several possible explanations. It is possible that extension workersare inflating the area receiving fertilizer in order to please their superiors. It is alsopossible that farmers are diverting more fertilizer from the cotton crop to maize inresponse to food security concerns and relatively stagnant cotton prices during the1980s.
76
shown). It is salutary to note that for every sole cropped RD in the CMDT zone
today, a drop in maize prices of 20% would result in a loss for the farmer. Only
intercropped RDs would avoid loss, testifying to the value of this system as a
means of mitigating the risk of price fluctuations.
3.4.2 Economic impact of maize technology development and diffusion in
Southern Mali36
Unlike financial analysis, an economic assessment of the impact of maize
technology development and diffusion is concerned with the benefits to society as a
whole rather than for specific groups. Estimation of the economic benefit of the
program involves comparison of the time-valued aggregate economic costs and
benefits over the relevant period. Economic costs and benefits are arrived at by
valuing costs and benefits at economic prices. These differ from financial prices by
the value of any taxes or subsidies including, for traded commodities, those implicit
in official exchange rates.
Additional maize from each recommendation over time was valued at its
import parity price (the economic cost of importing maize) since the country was in
a food-deficit situation for most of the period under study, and maize becomes
available when food shortages are at their most acute. The use of an import parity
price for maize (considerably higher than financial price) reflects its contribution to
improved food security. On-farm costs associated with the adoption of maize
36 The economic analysis of the impact of maize technology development anddiffusion is presented in summary form only. For a detailed analysis see Boughtonand Henry de Frahan (1994).
77
technology, including millet/sorghum production foregone, are also valued at import
parity prices.
The economic impact assessment also takes account of the cost of
resources allocated to research and extension services in order to develop and
diffuse maize technology. Research costs include the number of research person
years devoted to maize over the period 1969 - 1990, multiplied by the economic
cost per person year. Neither the costs of research carried out prior to 1969 (e.g.,
selection and/or improvement of local germplasm by the colonial administration), nor
the costs of research undertaken in other West African countries or regional and
international centers are included.
Extension costs include total salary and operational expenses of extension
service multiplied by the proportion of maize in total cultivated area (after giving the
cotton area a weight of 2 to account for the greater attention devoted to this crop)
for the period 1975 - 1990.
The overall economic return (ROR) to maize research and extension over the
period 1969 - 1990 was very high at 135%. The main factors accounting for this
high rate of return are the high value of maize in a food-deficit situation, the I,?w
cost of maize research (germplasm and technical recommendations were borrowed
from other countries or regional/international centers), and the rapid farm-level
adoption rate. Sensitivity analysis indicates that this return is robust with respect to
adverse changes in assumptions concerning overvaluation of the exchange rate,
research costs, extension costs, and total area of improved maize. The estimated
return is' moderately sensitive to price and yield reductions (a 20% reduction pulls
the ROR down to 106%, and a 38% reduction pulls the ROR down to 12%,
78
equivalent to the assumed opportunity cost of capital). The ROR is also sensitive to
the start date of the research cost stream. A 1962 start date as opposed to 1969
(Le., an additional seven year lag between the start of the cost and benefit
streams) pulls the ROR down to 54%.
3.5 Implications for future agricultural technology development and diffusion
The weaknesses and the accomplishments identified by this historical
analysis of the development path and impact of maize technology have implications
for the future development of the maize research program.
The weaknesses relate to organizational constraints encountered in three
areas: 1) linkages between research and extension, 2) monitoring of technology
adoption, and 3) the lack of economic analysis underpinning technical research
findings and extension recommendations. Each will be briefly considered in turn.
During the initial stages of maize technology diffusion, and particularly with
the advent of the "Projet Ma·is", there was very little interaction between research
and extension. Although collaboration improved dramatically following the 1983
maize streak virus outbreak, the failure to develop an adoptable maize-millet
intercropping package raises some difficult questions. Whereas the CMDT took the
initiative to improve and promote sole-cropped maize, the initiative to improve the
traditional system of maize-millet intercropping was taken by research. After on-
station researchers had developed an "improved" system (planting maize and millet
in separate rows), the package was tested on-farm and concluded to be sound.
despite complaints by farmers that the narrow between-row spacing made
mechanical weeding difficult. Subsequently, the CMDT felt obliged to abandon
79
attempts to extend the system for this very reason. Yet no attempt was made by
researchers to modify the package. The reasons for the failure of feedback on
technology performance to be translated into improvements are not clear.
One contributing factor may be that current mechanisms for monitoring
technology adoption do not provide the kind of information that can help focus
research. For example, while new maize varietal introductions have been the most
dynamic component of the package, no information is collected concerning their
levels of adoption in the various agro-climatic zones. The CMDT's monitoring and
evaluation unit, which 1S designed to provide information of a more diagnostic
nature to CMDT management, with a staff of 40 e·numerators and 5 supervisors in
the field, has until recently operated largely in isolation from IER.
Effective evaluation of technology development requires the integration of
economic analysis into the research program. The decisions by IER and CMDT not
to multiply and distribute hybrid seed to farmers on the grounds that it was too
costly were taken without any financial analysis. Similarly, none of the several
changes that have been made to maize fertilizer recommendations in the CMDT
zone has been subject to financial analysis. The decisions taken are not necessarily
wrong, but they are uninformed.
The strengths of the maize experience are reflected in the high economic rate
of return that can be attributed to three main factors: 1) the low cost of research, 2)
the high economic value of the crop, and 3) the rapid rate of technology adoption.
We will briefly review what lies behind each of these factors in turn, with particular
attention to the issue of replicability in the future.
80
~
The low cost of research reflects the limited personnel resources allocated to
maize since the inauguration of a cereals crop research program in 1964, under the
management of IRAT. The low priority accorded to maize was justified by the small
area cultivated relative to millet and sorghum.37 It was only in 1969 that the
decision was taken to give more emphasis to maize on the grounds of its potential
contribution to increasing food security, and in any case this decision was not
backed by any tangible increase in resources for almost a decade. The very limited
resources allocated to maize research did not have a negative impact on the
promotion of maize starting in the mid-1970s. In formulating recommendations for
cultural practices, the CMDT was able to use the results of research undertaken
elsewhere in West Africa. An emphasis on making the fullest possible use of
research conducted elsewhere in the region will continue to be justified in the
future, and is reflected in the proposal for collaborative regional research programs
under the INSAH/SPAAR framework for action (Weijenberg et al., 1993).
The high economic value of maize, measured in terms of an import parity
price, reflects the role of increased maize production in substituting for food
imports. Throughout the 1970s and early 1980s Mali faced a chronic food deficit.
Although Mali's aggregate cereal balance improved significantly in the second half
of the 1980's, a large proportion of the maize crop continues to be consumed
during the hungry season before the longer-cycle millet and sorghum crops are
harvested. Informal discussions with cereal traders confirm that maize imports from
Cote d'ivoire during the hungry season are a frequent occurrence. Nevertheless,
37 The principle of allocating resources between commodities according to theirexisting economic importance is referred to as the principle of congruity (Norton andPardey, 1987).

81
such a situation will not persist indefinitely in the face of increasing cereal
production. Eventually, if increased area and improved production techniques lead
to increased cereal production per caput, there will be cereal surpluses. These
surpluses will have a lower economic value than earlier increments in production,
either because of the additional delivery costs in the case of export markets, or
lower value in use in the case of domestic markets (as livestock feed for example).
Thus, high historic economic returns to investment in research and extension are
not necessarily a guide to the future, which will depend in part on market
opportunities.
The high rate of maize technology adoption during the 1980s reflects
complementary investments in physical capital, organizational capacity, and
incentive policies. In terms of physical capital, high levels of mechanization greatly
facilitated the adoption of maize as a field crop. The policy of allowing rural
development agencies to purchase grain from farmers at an attractive guaranteed
price allowed the CMDT to apply the same integrated approach to maize technology
delivery that it had already successfully developed, over the course of many years,
for cotton. This approach ensured that all stages in the subsector both prior to
production (seed multiplication and distribution, fertilizer and credit delivery,
extension advice) and post harvest (purchase and collection, transport, storage,
wholesaling) were coordinated through the administrative decisions and technical
resources of a single organization.
In the very different policy context of liberalized cereal markets, the
coordination of investments over time, and between stages in the overall production
process from input manufacture and distribution through to final consumption, has

82
to be achieved through the interaction of a large number of independent decision
makers. In seeking to respond to market signals, each of these decision makers
faces its own set of resource, information and technological constraints, risks, and
transaction costs. In this context, technology adoption at the farm-level production
stage for a given commodity will depend on the circumstances facing producers at
other stages of a subsector, such as the availability of appropriate equipment for
processors, the enforceability of contracts to assure appropriate quality for industrial
uses, or the tax structure facing exporters. In the future, the agricultural research
system will therefore need to develop a capacity to assess the needs of a much
broader set of clients.
CHAPTER FOUR
OVERVIEW OF THE MAIZE SUBSECTOR IN MALI
The previous chapter showed how, in the past, rapid farm-level adoption of
intensive maize production practices was closely associated with the institutional
innovation of a vertically integrated system for input delivery and output marketing.
The purpose of this chapter is to provide a descriptive analysis of the maize
subsector today. The picture that emerges is one of a thin and weakly coordinated
subsector by contrast with the pre-market liberalization period.' Strategic issues
related to the future development of the subsectorare defined and explored. The
chapter concludes by identifying specific topics for in-depth study in order to
evaluate opportunities for market expansion and improvements in vertical
coordination consistent with the existing government policy of cereal market
liberalization.
4.1 Approach and methods for the preliminary appraisal of the maize subsector
The objective of the preliminary subsector appraisal was to describe the
organization and functioning of the maize subsector, and identify major constraints
to, and opportunities for, increasing its contribution to the economy. The appraisal
was carried out by an interdisciplinary team during the period February to April
1992. IER core researchers carried out literature review, and secondary data and
market margin analysis for group discussion. All team members took part in the
design and implementation of an informal survey of participants at different stages
, A thin market is one where only a small proportion of total produce passesthrough the spot market, which may result in unstable prices (Tomek and Robinson,1993).
83
84
in the subsector. 2 An important output of the preliminary subsector appraisal was
a Research Planning Matrix (lER, 1992b). This set out, for each stage of the
subsector, the principal constraints, research questions and information needed (see
Appendix 2). IER researchers used this matrix to identify key stages and questions
to focus on for the in-depth phase of the study, which was divided into two
components: a primary emphasis on urban consumption and a secondary emphasis
on farm-level production. The potential for reducing marketing costs was not
included as the Market Information System (S1M) is better placed to conduct the
necessary investigations and analysis. The research proposal for in-depth study of
opportunities to expand urban maize consumption was funded by the Cereal Market
Restructuring Program (PRMC) and USAID/Mali (IER, 1992a).
4.2 Descriptive analvsis of the maize subsector in Mali
As explained in chapter 3, maize research has historically been a very minor
part of the total agronomic research effort (Figure 4.1 ).3 Since the early 1970s,
the primary focus has been on varietal selection, initially based on linkages with
French-operated research stations in West Africa, and more recently on linkages
with regional and international centers/networks. By the end of the 1980s, several
2 The team comprised representatives from IER, the Market Information System,The National Institute for Research in Nutrition and Public Health, the Ecole NormaleSuperieure, and the CMDT. Participation of members from different organizationswas encouraged in order to lay down foundations for longer-term collaboration. ThePRISAS program of INSAH provided both financial support and technical advice onpreparing the informal survey guidelines.
3 An activity or function that is boldfaced in the text refers to a stage in themaize subsector diagram (Figure 4.1).
85
improved varieties had been released, but there is a dearth of empirical information
on adoption rates.
Extension services are provided by two parastatal organizations, the OHV
and the CMDT. The supply of agricultural inputs has been liberalized, although the
CMDT remains the main supplier of inputs because bulk purchasing and back
haulage (lorries returning from cotton delivery to the Ivory Coast) permit lower input
delivery costs than the private sector. Consequently, the CMDT's policy on what
inputs to provide (varieties, fertilizer compositions) largely determines what is
available. Credit for the purchase of inputs is supplied by an agricultural bank, and
the supervision of disbursement and recovery is increasingly being undertaken by
village associations.
At the farm-level production stage, maize represents about 5 - 10% of the
total cereal area in Mali, and about 10- 15% of cereal production. At a 7% rate of
growth of output, it is the most rapidly growing cereal subsector, which could
eventually have an effect on relative cereal prices (Holtzman et at., 1991).
Approximately 80% of the total Malian maize crop is grown in southern Mali, where
rainfall ranges from an average of 1200 mm in the south to 700 mm in the north.
For non-mechanized farmers, lack of equipment, high cost of fertilizer and drought
risk are the major constraints cited. For mechanized farmers (72% in the CMDT
zone), the lack of a guaranteed price for maize is a key constraint. They are
unwilling to layout cash for fertilizer without a guaranteed price because of the risk
of ending up in debt. Some farmers expressed that they were more concerned
about the uncertainty of maize prices than rainfall. Quantitative information about
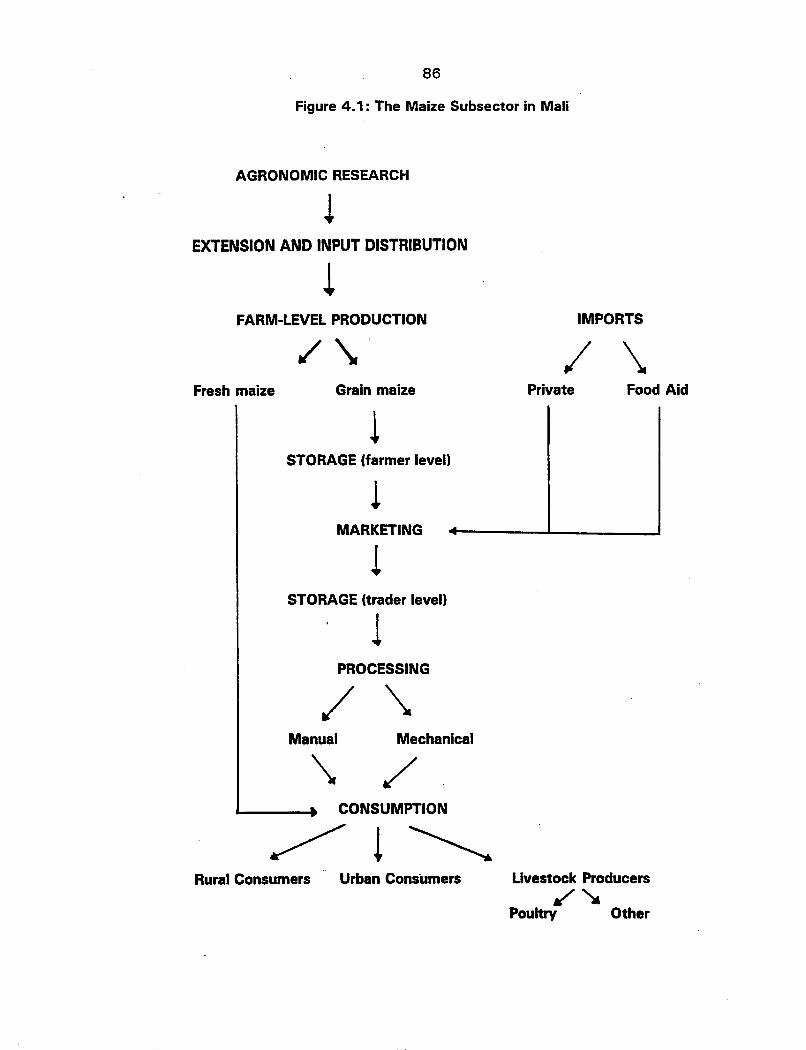
86
Figure 4.1: The Maize Subsector in Mali
AGRONOMIC RESEARCH
lEXTENSION AND INPUT DISTRIBUTION
!FARM-LEVEL PRODUCTION IMPORTS
/ \Fresh maize Grain maize
1STORAGE (farmer level)
1MARKETING
1STORAGE (trader level)
1PROCESSING
Manual Mechanical
\ ./CONSUMPTION
Private Food Aid
Rural Consumers Urban Consumers Livestock Producers,/'~
Poultry Other
87
costs of production and variability in returns is extremely scanty (Holtzman et al.,
1991).
Fresh maize plays a vital role as a hungry season food source as early as
mid-July, and is very popular in roasted form among urban dwellers. Consequently,
it can be a valuable cash crop for farmers in peri-urban areas with good access to
urban markets. In urban areas, fresh maize is marketed through the fresh vegetable
subsector. Fresh maize wholesalers are exposed to high risks because of its
perishability. Grain maize, available from the end of September, continues to be a
key food source for rural consumers through to the arrival of the millet/sorghum
harvest in November. Maize stover is generally left in the field and consumed by
livestock during the dry season.
Farm-level storage is generally not a problem, partly because most of the
crop is consumed in a relatively short period of time and partly because it is stored
on the cob, making it more difficult for insects to penetrate the grain. A significant
expansion of maize production might require changes in storage methods since the
current practice is demanding in the amount of storage space required in relation to
grain weight. The Large Grain Borer (Prostephanus truncatus), until recently
confined to the Americas, is a potentially serious future storage pest. Outbreaks
have been reported in Togo and Benin (GASGA, 1987).
The marketing of grain maize takes place through the same network of rural
collectors and wholesalers, transporters, and urban wholesalers and retailers as
other coarse grains.4 The limited availability of quantitative information on cereal
marketings permits only qualitative impressions. According to traders, the volume
4 The term coarse grains refers in this context to the following cereals: millet,sorghum, maize and fonio.
88
of maize is small relative to millet and sorghum, and relative to the total maize
harvest since much is consumed by farm households themselves. According to
farmers, the tendency to consume increasing amounts of maize on-farm is due to
the fact that millet and sorghum commands a higher price than maize in local
markets. Given the relatively low coarse grain prices in recent years, and the high
costs farmers incur to bring their cereal to market because of poor roads, even a
small difference in selling price such as 5 CFA F/kg represents a big difference in
net margin. 5 Traders report that most maize marketed beyond rural markets goes
to the capital city of Bamako.
The quantities marketed also vary considerably from year to year according
to the size of the maize and millet/sorghum harvest. Maize production is more
variable than other cereals. Over the period 1971-72 to 1990-91 the coefficient of
variation was 0.56 for maize production, compared to 0.34 for other coarse grains
and 0.32 for paddy (Holtzman et al., 1991). Furthermore, if the millet/sorghum
harvest is poor, then maize marketings will be low even if the maize harvest was
good as rural producers replace millet or sorghum with maize in their diet.
Marketing margins between rural producers and urban consumers are
substantial. The pre-devaluation marketing margin of 35 CFA F/kg between
Koutiala and Bamako is roughly 50% of the average retail price in Bamako during
the study period. However, the high correlation between prices in rural markets and
Bamako retail prices suggests that this margin is not due to a lack of competition
5 The effect of differences in prices for maize and sorghum, before and after themain coarse grain harvest, on incentives to grow and to market maize are examinedin detail in chapter 8.
89
among traders.6 It is more likely due to high assembly and transportation costs
that result from small, dispersed quantities of marketed produce, poor rural
infrastructure, and the high cost of vehicles, fuel, and spare parts. Although the
marketing margin is substantial, the lack of information concerning the components
of this margin, and quantities traded, makes in-depth analysis difficult. From
January 1993, the Market Information System began to collect cereal prices at
different levels in the system, as well as quantities transacted, to permit such
analysis.
Only very limited quantities of maize appear to be stored off-farm. The
majority of traders do not use formal credit, and cash constraints oblige them to
seek earnings through turnover rather than speculative storage. Furthermore,
storage of maize at merchant level presents more difficulties than farm-level storage
because it is more vulnerable to insect infestation in grain form than it is on the ear.
Finally, the possibility of imports from Ivory Coast (where the maize harvest is
earlier) effectively places a price ceiling on maize, limiting potential profits to
storage.
Processing represents a constraint to maize consumption. The processing of
coarse grains involves four main stages: 1) threshing to remove grains from the ear
or cob; 2) dehulling to separate the pericarp from the endosperm (involving
significant loss of the thin layers of protein between them); 3) milling to reduce the
endosperm to flour and/or grits and 4) sieving to grade the milled endosperm into
particles of different sizes. Between each of these stages cleaning activities will be
6 Theoretically, a high correlation between cereal prices at urban and ruralmarkets could arise from monopoly power. The large number of independentwholesalers engaged in the domestic cereal trade makes this a highly unlikelypossibility.

90
undertaken (e.g., winnowing after threshing, washing after dehulling). In rural
areas, coarse grains are threshed, dehulled and milled using pestle and mortar, since
mechanical processing is very costly relative to rural women's incomes (Fischer et
a!., 1992). In urban areas coarse grains are usually purchased in grain form,
dehulled manually and then taken to a custom plate mill for grinding into flour
(Holtzman et al., 1991).
One disadvantage of maize compared to sorghum and millet is that it has to
be soaked for several hours after dehulling in order to obtain the fine flour preferred
by Bamako housewives. This means that dehulling for the mid-day meal would
have to be done very early in the morning, and for the evening meal in the early
afternoon. Neither time is particularly convenient since early in the morning women
are preparing breakfast, and in the early afternoon they are cleaning utensils used to
prepare the mid-day meal and/or taking a rare opportunity to rest.
The milling of maize also involves additional cost. Urban mill operators
charge more for processing maize than millet or sorghum because it is harder. But
the additional financial costs of milling maize, approximately 2.5 CFA F/kg or 5 - 10
CFA F per meal, are small relative to the cost of grain. Since this amount
represents only about 1% of daily expenditures on sauce ingredients for an average
family, it is hard to believe that the additional milling cost for maize is a serious
impediment.
Although negligible in financial terms, the higher milling costs can give rise
to additional transactions costs within the household. The household head is
responsible for the provision of cereals and money for the purchase of condiments
(meat, fish, cooking oil, spices etc.). Most commonly, household heads buy cereals

91
in bulk and provide a daily sum of money ("nassongo") to cover the cost of
condiments to the woman responsible for preparing food on a given day.
Alternatively, the household head provides a sum intended to cover both cereal and
condiment purchases. Cereal processing costs are paid for out of the daily sum
allotted for the purchase of condiments. Some household heads report that their
wives resent the additional processing costs of maize because it reduces the
amount available to purchase ingredients for the sauce and demand an increase in
the "nassongo" if the household head purchases maize. It may be difficult for a
household head to increase the nassongo by an amount equal to the additional
processing cost for two reasons. First, the household head usually has only a
vague notion of what it costs to mill the daily quantity of cereals. Second, it is
difficult to increase the nassongo by a trivial amount. It usually increases by at
least 100 CFA F per day.7 Thus even if a household head could realize financial
savings by purchasing maize (the difference between the price of maize and the
price of sorghum or millet is greater than the additional processing costs), the costs
of re-negotiating the nassongo may outweigh the benefits.
While the effect of transaction costs that arise from the interaction between
maize processing difficulties and the prevailing institutions for household economic
management should not be overemphasized, the cumulative effect of such
"inconvenience factors" is to reduce the cross-price elasticity of substitution
between maize and other cereals.
The availability of pre-processed products such as flour that could avoid the
additional time, cash and transactions costs associated with maize processing is
7 A frequency distribution of nassongo reveals that most households aregrouped in increments of 500 FCFA per day.

92
very limited. The same is true for millet and sorghum. Small quantities of flour are
offered for sale by women retailers in urban markets, but consumers are very wary
of such products. Housewives expressed concern about hygiene, since the flour is
sold from open containers and cannot be washed prior to use like whole or dehulled
grain. Furthermore, there is the always the possibility that flour has been mixed
with the cleanings from custom mills. Finally, women cannot be certain how fresh
the flour is. In short, housewives who might wish to purchase coarse grain flour
believe they run a high risk of adverse selection.8
The only other processed maize product available in urban markets is yellow
maize grits. For the most part this product is manufactured artisanally and sold in
clear plastic sachets as a high quality breakfast cereal or desert for relatively
wealthy urban consumers. In contrast to flour, the grits can be washed prior to
use, and their freshness can be judged by the color of the product. A donor-
financed project called CERECOM that sought to promote urban consumption of
grits manufactured in rural areas using hammer mills met with limited success.9
This is partly due to the high cost of the product. Only a small fraction of grits
obtained from the hammer mill are of the desired size, leaving a high proportion of
8 A situation where effective demand for a product is frustrated by adverseselection begs the question as to why individual suppliers have not established areputation for selling a quality product. One possible reason is that, to obtain thefine flour preferred by urban consumers, the grain must be moist at the time ofmilling. Consequently, the flour obtained has a very short shelf life. This wouldlead reputable suppliers of quality flour to enter into contracts with householdsrather than run the risk of being left with unsold stock in the marketplace. Thisdoes not explain the fact that the total quantity of flour procured by Bamakohouseholds from all sources is very small. The issue of effective demand for flour,and the processing services embodied in the prDduct, is the central analytical focusof the dissertation.
9 CERECOM is a truncation of "commercialisation des cereales", which meanscereal marketing.

93
by-products that can be sold only at relatively low prices. Apart from the high cost
of the product, a further constraint on demand is the long cooking time.
Housewives report that maize grits take two to three times as long as rice to cook.
Attempts to market white maize grits as a rice substitute were unsuccessful in
Bamako, where consumers regarded the product as inferior ("poor man's rice")
since the substitution of white maize grits for rice is a common practice in rural
maize growing areas.
Human consumption of maize in the form of traditional millet and sorghum-
based dishes is a relatively recent phenomenon. Prior to the 1970s, most maize
was consumed in the form of boiled or roasted ears. For some Malians, their first
encounter with grain maize was during the famines of the early 1970s and 1980s,
as food aid, and hence the cereal is associated with difficult times. Traditional
coarse grain-based dishes include toh (a thick porridge made from flour and usually
consumed in the evening), bouillie and seri (thin porridges, made from flour and grits
respectively, and consumed at breakfast or supper), or couscous (made from
steamed flour). Bamako consumers prefer yellow maize, in contrast to urban
consumers in most other African countries. This is because of the relatively high
proportion of maize presently consumed in the form of seri, a grits-based porridge
that urban consumers traditionally prepare from yellow maize.10
Consumption of maize grain by livestock is mainly limited to the urban
poultry subsector. 11 These enterprises are almost entirely confined to egg-laying
10 The processed form of the grain required to prepare a given dish is veryimportant for the development of commercial coarse grain processing, and isdiscussed in detail in chapter 6.
11 Maize is also used in small quantities for the manufacture of pre-mixed feedfor dairy cows.

94
units, since intensive broiler production cannot compete with free range birds from
rural areas. Poultry rearers also have a strong preference for yellow maize since this
affects the color of egg yolks. Discussions with poultry unit operators indicate that
flock health management is the major constraint, followed by low egg prices
associated with imports from Senegal and Ivory Coast. With the closure of the
government-subsidized hatchery, chicks have to be imported by air from France,
adding further to costs. Until farmers can stabilize their flock numbers through
effective health care, they are unlikely to enter into contracts for feedstock maize
even if this institutional innovation permits them to secure supplies more cheaply.
In contrast to Bamako consumer preferences for yellow maize, whether for
human consumption or for poultry, rural grain collectors were often observed not to
make any special effort to separate maize by color. Urban consumer preferences
were also irrelevant to farmers' choice of variety, which was exclusively based on
agronomic characteristics. The one variety that seemed to be growing in popularity
on the basis of its early maturity and lower fertilizer demand, TZESR-W, is a white
variety. The failure to communicate consumer preferences through the different
stages of the subsector is also a reflection of the relatively small volumes moving
through the market.
Potential quantities of maize required for industrial use are limited. These
include flour as a source of starch in battery and glue manufacture, and grits for
brewing. Although small in volume terms, industrial demand could nevertheless
represent a relatively stable source of revenue for processing units. Unfortunately,
all these products require maize to be de-germed prior to milling, for which no small
scale equipment exists.
95
4.3 Strategic issues for the future development of the maize subsector
The initial subsector appraisal reveals many characteristics associated with a
thin market (Holtzman et aI., 1991). Farmers appear to produce maize primarily in
order to achieve food self-sufficiency, not for the market. Urban consumers tend to
buy maize only when it is significantly cheaper than other cereals, due in part to the
difficulty and/or higher cost of processing and in part to lack of familiarity with this
cereal. Traders consequently have little incentive either to assure a regular year
round supply of maize, or to meet urban consumer preferences for color or quality.
The development of the maize subsector therefore requires an increase in
both demand and supply, as well as an increase in their predictability (i.e., improved
coordination). For demand to increase, consumers need to perceive an
improvement in the value of the product and/or a reduction in cost (taking account
of additional processing activities necessary to get the grain into a useable form
such as flour or grits). An increase in marketed supply requires a higher and/or
more stable profit margin for farmers. Improvements in net margins could be
achieved through reductions in marketing costs (e.g., by vertical integration of
farmers' organizations into the marketing of cereals), and/or by a reduction in unit
costs of production at farm level. Stability in margins could be improved through
contracts between maize producers "and users. Such an innovation would require
sufficiently strong effective demand for final products to induce the suppliers of
those products to assure access to specific Quantities and Qualities of grain maize
by planting time.
Development of the maize subsector, particularly through urban demand for
processed maize products, could contribute to improved food security in both the
96
short and the long run. In the short run, increased availability of maize will help
ease late rainy season coarse grain prices, and thereby reduce costs for food deficit
rural families, because it is harvested up to two months earlier than millet and
sorghum. It will also provide a hedge against the risk of an early end to the rains
causing poor millet and sorghum yields. The availability of processed maize
products could improve food security by increasing the substitutability between rice
and coarse grains in urban cereal consumption patterns. Greater substitutability
between rice and coarse grains will result in smaller cereal price fluctuations in
response to stochastic rice and coarse grain production and import levels (Boughton
and Sanogo, 1994).
In the long run, demand-led expansion of the maize subsector will improve
food security through soil conservation and more rapid agricultural sector
transformation. Land degradation is a serious problem in the middle to high
potential areas of Mali where maize is cultivated because extensification has been
the primary source of increased rainfed cereal production over the last decade
(World Bank, 19931. Increasing the proportion of maize in total rainfed cereal
production is one way to slow down degradation of the land resource base in
Southern Mali because of the possibility to increase output per unit of land through
fertilizer use.
In so far as demand-led expansion takes the form of processed products this
will contribute to accelerated agricultural sector transformation and economic
growth. The set of processed coarse grain products currently available to urban
consumers is extremely limited in terms of product type, quality and price. The
successful introduction of a processed maize product would expand the potential
97
product demand space, through the possibility to market the same product type
using a different cereal base or bases, or different price/quality versions of the
product using the same cereal base. 12
The question as to whether maize will continue to be produced and
consumed primarily as a rural food source (either for consumption during the hungry
season -or as a dry season staple), or whether alternative market opportunities will
develop that will entail an expansion of maize production and consumption via the
marketplace over time, is also strategic for the purpose of defining an agricultural
research agenda.
The question is strategic because different answers imply quite different
research agendas and disciplinary mixes. In the case of maize for consumption
during the hungry season, appropriate criteria for varietal selection will include
marginal improvements in earliness and drought tolerance. If required for
consumption during the dry season, yield, storage quality and ease of processing
may also be important. In the case of maize required for commercial flour or grit
manufacture on the other hand, selection criteria could include factors such as the
proportion of pericarp and grain hardness. Selection criteria that include manual or
mechanical processing characteristics imply much greater involvement of food
technologists than the former. While these technology development paths for maize
are not mutually exclusive, differences in disciplinary mix and criteria in a context of
12 Although apparently more severe for maize, processing costs are also aconstraint on urban demand for coarse grains generally in West Africa (Reardon,1993). Hence analysis of the possibilities for overcoming these constraints may begeneralizable beyond the case of maize in Mali.
98
limited research resources require that the objectives for maize research need to be
prioritized over time.
The sequencing of research objectives over time may have important
implications for the economic impact of investments in maize research. Investment
in the selection and promotion of varieties with desirable processing characteristics
will not generate an attractive economic return if low consumer incomes severely
constrain effective demand for processed products in the short and medium term. It
might be more rewarding to focus research resources on expanding the availability
of maize during the hungry season in the short run, and shift priorities toward
processing objectives when incomes have risen sufficiently.
4.4 Key research questions for further investigation
The earlier sections of this chapter provided a descriptive analysis of the
maize subsector in Mali today and identified strategic questions that need to be
answered to determine appropriate directions for future maize research and identify
necessary complementary innovations in regard to policy and institutional
arrangements. This section lays out specific questions that will be the analytical
focus of the remaining chapters.
The overall goal of the consumption component of the study is to assess the
potential for expanding consumption of domestically produced maize through urban
consumption of processed products. To achieve this goal, empirical information
about both existing urban cereal utilization and consumer willingness-to-pay for
processed products is required. Gaps in regard to -empirical knowledge of existing
urban cereal utilization include:

99
(i) the type, quantity and form (processed or unprocessed) of cereals procured
by households, and the role of income and demographic factors as
determinants of demand;
(ij) the relative importance of different forms of processed grain required by
households, as implied by the dishes they prepare;
(iii) the cost of processing and preparation of rice and coarse grain-based dishes
using different processing methods.
The next chapter describes the survey instruments and sampling methods used to
obtain this information from households in Bamako, the capital city. Bamako is an
appropriate choice because of its size and the fact that it is already the main
destination "for marketed maize. Chapter 6 provides the results of the surveys, and
justifies the choice of flour as a key potential processed product.
Gaps in regard to knowledge about consumer willingness-to-pay for flour
include:
(i) the quantity of flour consumers would be willing to buy at different prices,
their willingness to trade quality for price, and the role of income and
demographic factors as determinants of "demand;
(ii) the cost of supplying such products for different processing technologies.
Chapter 7 describes the methods used to determine consumer willingness-to-pay for
different qualities of flour, the costs of alternative processing techniques, and the
magnitude of demand at estimated retail prices before and after devaluation.
Chapter 8 examines the implication of p9st-devaluation fertilizer prices increases for
ingentives to supply maize, and the implications for agronomic research priorities.
CHAPTER FIVE
CEREAL UTILIZATION PATTERNS AMONG BAMAKO HOUSEHOLDS:
SURVEY METHODS
Chapter 4 argued that increases in the demand and supply of maize could
enhance urban and rural food security in the short and long term, and enumerated
the 'advantages of effective demand growth for processed products. The chapter
concluded by identifying a set of empirical information gaps concerning urban cereal
consumption patterns. This chapter has two objectives: 1) to present the survey
instruments and sampling methods used to obtain information to fill those gaps, and
2) to describe sample household demographic characteristics and expenditures. The
chapter begins with a brief review of cereal consumption studies in the Sahel to set
the study in the context of current regional food policy issues.
5.1 Urban cereal consumption patterns in West Africa: concerns from the
literature
Recent literature on urban cereal consumption patterns in West Africa has
concentrated on describing and attempting to understand major structural changes
in the demand for cereals. The two major themes treated are 1) factors underlying
the rapid growth in wheat and rice consumption over time !itt the expense of ~ocally
produced coarse grains, and 2) the degree and determinants of substitutability
between rice and coarse grains. The main findings are summarized below.
100

101
5.1.1 Rapid growth in wheat and rice consumption over time at the expense
of locally-produced coarse grains
The most notable trend in cereal consumption in West Africa has been the
secular growth of mainly imported wheat and rice at the expense of locally
produced coarse grains. Delgado and Reardon (1987) report that between 1960
and 1983 per caput consumption of rice and wheat in Sahelian countries increased
by 16 kg whereas coarse grains decreased by 22 kg. Gabas and Giri (1987), cited
by Reardon (1993), report that imports of rice and wheat into the Sahel have been
increasing at 10% per year since independence. Reardon (1993) states that
virtually all of the increase in consumption of rice and wheat into the region over the
previous ten years was accounted for by imports.
The balance of payments burden imposed by rice and wheat imports led
policymakers to examine the desirability of import tariffs as a means to discourage
consumption of imported cereals in favor of locally-produced cereals. Research
consequently focussed on understanding the determinants of wheat and rice
consumption to evaluate the likely effectiveness of such a policy and its welfare
consequences. Key parameters of interest were own-price, cross-price, and income
elasticities. Price elasticities are important because they indicate to what extent
tariffs on imported rice will achieve policymakers' objectives of reducing imported
rice and wheat consumption and increasing consumption of locally-produced coarse
grains. Income elasticity is important because it indicates whose welfare is likely to
be affected.
Imported rice and wheat are consumed primarily, but not exclusively, in
urban areas of the -Sahel (Reardon, 1993). Since incomes in urban areas are higher

102
on average than incomes in rural areas it was assumed that the burden of tariffs on
imported cereals would largely fall on the wealthier segment of Sahelian society. In
Ouagadougou, Reardon et aI., (1992) found that, while this assumption was true for
wheat products (primarily bread), rice expenditure was unrelated to income level.
Furthermore, incomes of the lowest tercile in the urban community were on a par or"
lower than average rural incomes. Consequently, a tariff on imported rice would
likely be injurious to the urban poor.
5.1.2 Degree and determinants of substitutability between rice and coarse
grains'
Reardon et al. (1988) report negative cross-price elasticities between rice
(grain and prepared form) and coarse grains for Ouagadougou (Burkina Faso),
implying that an increase in the price of rice leads to a fall in the quantity of coarse
grains purchased rather than an increase as desired by policymakers. For urban
centers in Mali, Rogers and Lowdermilk (1 988) found no significant effect of rice
prices on coarse grain procurement.
The apparent low substitutability between wheat or rice and coarse grains is
a matter of concern for policy makers, rural and urban consumers, and farmers.
First, low substitutability undermines the effectiveness of fiscal policy as an
instrument to discourage consumption of imported wheat and rice in favor of locally
grown cereals. While higher prices for imported cereals would discourage their
consumption through the negative effect on consumers' real incomes, consumption
of local cereals might also decrease. Even for countries such as Mali with the
, This section is drawn from Dibley, Boughton and Reardon (1994).
103
potential to be self-sufficient in rice, achieving self sufficiency involves a balance of
payments burden as a result of imported fertilizer, fuel, and spare parts. Second,
the counterpart to low substitutability between grains is own-price inelasticity for
each type of grain. Inelastic demand discourages the adoption of improved
technology and constrains growth in marketed surpluses because small shifts in
supply result in sharp price falls. Third, lack of substitution between rice and coarse
grains in large urban centers will tend to increase price instability in cereal markets,
undermining rural food security (Boughton and Sanogo, 1994). Finally, inability to
switch to lower-priced coarse grains will aggravate the negative real incomes
effects of the recent 50% devaluation of the CFA F for urban consumers. Thus,
understanding the determinants of low substitutability between wheat or rice and
coarse grains to design appropriate policies is a high priority.
Attempts to measure and explain the degree of substitution between rice and
coarse grains are usually predicated on neoclassical consumption theory which
predicts that consumption of different goods and services will depend on their
relative costs. The cost of consuming a given cereal is made up of four
components: (i) the cereal purchase price, (ii) processing costs, (iii) preparation
costs, and (iv) complementary ingredients to make a sauce.2 While many authors
who seek to explain constraints to higher urban consumption of coarse grains in the
Sahel emphasize that coarse grains are more costly and time consuming to process
and prepare than rice (e.g., Thiombiano, 1986; Bricas and Sauvinet, 1989;
2 Processing costs include all resources used to convert raw grain into the formin which it goes into the cooking pot (cleaning, dehulling, washing, milling, sieving),and preparation costs include all resources used to transform fully-processed graininto an edible dish.
104
Holtzman et a!., 1991), there is no published empirical study that compares the
complete set of costs for rice- and coarse grain-based dishes.
Rogers and Lowdermilk (1992) examine the relative cost of cooked rice and
coarse grains for urban areas of Mali. They take account of milling costs and
processing losses, but leave out fuel costs and the opportunity cost of women's
time. Kennedy and Reardon (1994) incorporate proxy variables for the opportunity
cost of women's time in quantitative analysis of cross-section determinants of
household rice expenditures for Kenya and Burkina. They find that as opportunity
cost of women's time rises, so does consumption of convenience foods (rice and
wheat). This correlation implies that processing and preparation costs make rice
more attractive and coarse grains less attractive as the opportunity cost of women's
time rises.
But would a full accounting of rice and coarse grain processing and
preparation costs confirm these explanations for low observed substitution? If
complementary sauce costs are much higher for coarse grains than for rice, then a
policy emphasis on reducing processing costs might be misplaced. Alternatively, if
complementary sauce costs are lower for coarse grains, perhaps even more
emphasis should be accorded to processing issues. If processing costs are not a
major component when the opportunity cost of women's time is accounted for,
perhaps more research on the way consumer preferences evolve in the urban
environment is needed. If processing costs are a major component, then attention
can be directed to opportunities to provide processing services at a lower cost. At
the very least,- a detailed breakdown of actual costs will help tailor the design of
research "and policy initiatives to the underlying structure of disincentives to
105
increased utilization of coarse grains. This gap in empirical studies to date
underlines the need for the estimation of processing and preparation costs for rice
and coarse grain-based dishes in the next chapter.
5.2 Objectives and methods of the Bamako cereal procurement and utilization
surveys
The surveys had two closely related objectives: 1) to respond 1.0 the needs
for detailed empirical information on cereal procurement and utilization identified in
the last chapter, and 2) to provide a context for the design, implementation, and
interpretation of results from consumer tests of processed maize products. This
"context" can be broken down into three components. First, there was a need to
identify a sample of respondent households diverse in the characteristics that could
potentially influence d~mand for processed coarse grains in an important way (e.g.,
income leven, and yet manageable in regard to the logistical requirements of
consumer tests. Second, there was a need for preliminary information on household
preferences that could help narrow down the range of processed products to be
tested. Third, there was a need to establish rapport and confidence between the
research team and the test households to improve the reliability of responses to
questions concerning consumers' qualitative evaluation of and intentions to
purchase test products.
To achieve these objectives a two-stage survey procedure was adopted.
First, a single-visit survey of a representative sample of 640 urban consumption
units3 was undertaken to obtain broad descriptive information on household
3 A formal definition of the unit of observation for the surveys is presented inthe next section.

106
structure, demographic composition and cereal procurement and use. The second
stage involved establishing a frequent-visit (weekly) survey of cereal procurement
and utilization by 140 households selected to represent the range of variation in
three key characteristics relevant to the potential demand for processed maize
products: income, household size, and level of maize consumption. The methods
for these two surveys are briefly described below. Empirical results are drawn
primarily from the frequent-visit survey. Results from the first round survey are
presented only where they usefully complement the frequent-visit survey.
5.2.1 Objectives, sampling method, and content of large sample single-visit
survey4
The single-visit formal survey had three objectives:
1) to provide a sampling frame for the purposive selection of households to be
included in consumer tests and the frequent-visit survey;
2) to obtain preliminary information on actual and potential use of pre-processed
cereal products to inform the choice of products to be included in the
consumer tests;
3) to obtain an initial but representative understanding of how maize fits into
Bamako household cereal consumption patterns to serve as a benchmark for
comparison with results from the smaller purposively selected frequent-visit
survey sample.
The unit of observation for the survey is the. "unite alimentaire" or food
consumption unit (FCU). An FCU is defined by the Direction Nationale de la
4 This section draws heavily on Teme and Boughton (1993).

107
Statistique et de l'lnformatique (DNSI) as the group of individuals who share at least
one meal together per day (DNSI, 1991). This definition is an adaptation to the
urban context of the traditional social unit "goua" (Bambara term for kitchen),
comprising the group of individuals, usually related by blood, who eat from the
same kitchen (Teme and Boughton, 1993). Thus an FCU could consist of a single
individual (at the limit), or a single conjugal family unit (a married man with his wife
or wives, his Children and other dependents), or more than one conjugal unit.
Regardless of the size of an FCU there is always a single acknowledged FCU head
("goua-tigi") responsible for ensuring the provision of cereals and condiments for
the kitchen.5
The sampling frame for the single-visit survey was adapted from that
developed by the DNSI for the national Enquete Budget Consommation conducted
over 12 months during 1988 and 1989. In preparation for the 1987 population
census, the entire country was mapped by the DNSI into geographical units termed
"section d'enumeration" (SE), encompassing 800 to 1000 inhabitants in rural areas
and 1000 to 1500 inhabitants in urban areas (DNSI, 1991). Of the 560 SE that
comprise the District of Bamako, 36 were randomly selected for the Enquete Budget
Consommation; The reasons for adopting this sampling frame were twofold. The
first was to avoid the enormously time consuming and costly task of creating one.
The second was to be able to eventually compare results from the maize subsector
-5 The term condiments refers to all the ingredients that are purchased to make
the sauce to go with the cooked cereal. Such items include oil, tomato paste,onions, seasoning, herbs and spices, meat, dried fish and vegetables. Such itemsare generally purchased daily, in the morning, on neighborhood markets.

108
study with those of the Enquete Budget Consommation conducted five years
previously.6
Although our single-visit survey was conducted in the same SE as the
Enquete Budget Consommation, no attempt was made to interview the same FCUs.
This was considered impractical in view of the high mobility of households within
the District of Bamako, and between Bamako and rural areas. At the SE level,
households were selected on a fixed interval. The interval was determined by
dividing the estimated population of FCUs in the SE by the target number of FCUs
to be interviewed. The target number of interviews was set at 18 FCUs per SE, the
minimum considered necessary to be able to test for statistical differences between
SE. The FCU population for a given SE was estimated as the average of the number
of dwellings and the number of conjugal units in the SE (recorded by the DNSI for
the 1987 census).' Having determined the sampling interval, the first dwelling was
selected at random and then all subsequent dwellings were selected on the basis of
the fixed interval. All FCUs in a selected dwelling were interviewed. The process
continued until the target number had been reached.
The questionnaire was divided into 7 sections as follows:
• organization and management of the FeU, including which meals are shared
each day, daily expenditure on condiments (income proxy), and who
contributes to food expenditures;
6 Definitive results from the Enquete Budget Consommation were not availableat the time as the data were still in the process of being cleaned.
, This crude approach to estimating of the number of FCUs was based on thesimple logic that there could be more FCUs than the number of dwellings but notfewer, and there could be fewer FCUs but not more than the number of conjugalunits.
109
• demographic composition, including age, sex, education, employment for
each FCU member;
• inventory of dishes consumed, and frequency of consumption using different
cereals by season;
• -actual and desired purchases of-pre-processed cereals, for each type of
coarse grain and product;
• cereal procurement strategies, type of cereal, frequency of consumption,
source, and whether purchased in bulk or in small quantities for each cereal;
• -- cereal processing strategies, type .and method of processing undertaken for
different cereals, and whether coarse grains are ever consumed without de-
hulling;
• type of dwelling, durable goods and kitchen equipment inventory
A total of 642 FCUs were interviewed in the 36 SE by a team of 4
female enumerators and two male supervisors in six weeks. Two DNSI
cartographers also participated in delimiting the boundaries of the SE on the ground.
The survey fulfilled the objective of providing a sampling frame for the
purposive selection of households for the consumer tests and in helping to focus
the choice of products to include in the tests. In terms of generating jln
understanding of cereal consumption patterns, however, the survey proved difficult
to analyze in a definitive way. Respondents, mainly housewives since the
predominantly male household heads were usually absent, could not recall cereal
procurement and use by season. Questions such as how frequently a given dish
was prepared from a particular cereal were difficult to answer in general terms,
because the woman prepared the dish using whatever cereal was in stock at the
110
time. It would have been better to focus on the specifics of consumption during the
previous week, say, rather than trying to get an overview. Although there is an
obvious risk of seasonal bias with such an approach, the results would have been
more easy to interpret.
5.2.2 Objectives, sampling method, and content of the subsample frequent-
visit survey
The frequent-visit survey had two objectives:
1) to provide a detailed understanding of cereal procurement in terms of type,
form, quantities and sources of cereals procured over a 12-month period,
and the utilization of cereals in terms of dishes prepared and processing
methods employed;
2) to establish rapport and confidence between households and the survey
team to improve the reliability of qualitative and quantitative responses to
test products.
A purposive cluster sampling procedure was used for the selection of
frequent-visit survey FCUs. A purposive approach was used to be able to estimate
demand for groups of consumers with specific identifiable characteristics relevant to
purchase decisions•. A cluster sampling technique was appropriate to reduce the
logistical demands of consumer tests of processed products. The natural cluster
unit of selection is the SE, since by definition all FCUs belonging to a given SE are
in close geographical proximity to one other.
With 4 female enumerators and an average of 18 FCUs per SE, it was
considered that a maximum of 8 SE (i.e., 2 SE, or approximately 36 FCUs, per

111
enumerator) could be included in the frequent-visit survey out of the 36 SE covered
by the single-visit survey.
The eight SE were selected as follows. FCUs in all 36 SE were classified
according to level of daily condiment expenditure (income proxy), population, and
frequency of maize -consumption; SE were then classified according-to whether
.. ~ -they were comprised primarily of FCUs with high, medium, or low levels of these
criteria. SE were then selected to represent the different combinations of income
levenmCl household size (with the exception of high income and high population
that did not oc(~ur). Where more than one SE could represent a particular
income/population combination, the SE with the higher frequency of. maize
consumption was chosen.
Information _on cereal purchases and meals prepared was collected weekly.
Quantity, type, form and cost information for all cereal, tuber, and fuel inflows,
together with daily expenditures on condiments, were recorded from recall since the
previous visit. All meals prepared during the preceding two days were recorded in
terms of dish, staple, quantity used, form, processing methods and costs, and
visitors/absentee family members. The household was visited every sixth day to
avoid collecting information on meals prepared for the same days every week. FCU
demographic information was updated monthly, except for two months when maize
flour tests were in progress. Following the discovery of a correlation between daily
condiment expenditures per adult equivalent and FCU total adult equivalent size, all
non-food and away-from-home prepared food expenditures were recorded on a
monthly recall basis after the third month to improve estimates of income.
112
5.3 Demographic characteristics of single-visit and frequent-visit survey
households
This section compares the demographic characteristics of the single-visit and
frequent-visit sample FCUs. Demographic characteristics include ethnic
background, length ~f residence in Bamako, population,-and employment. It will be'
seen that, .with-the exception of the proportion of household heads employed in the
military, the small sample is very similar to the large sample in regard to most
characteristics.- The degree-of similarity between the two samples is important for
extrapolation of the potential demand for maize flour estimated in chapter 7.
Food consumption habits can vary according to ethnic group. Table 5.1
compares the ethnic background of FCU heads in the two samples. In both cases
Sambara are the most prevalent, accounting for 39 %. Peulh and Malinke follow,
accounting for approximately a quarter in each sample. Soninke, Sonrai, Senoufo
and Dogon together make up a fifth. FCU heads have lived in Bamako for an
average of 19.2 years in the frequent-visit, and 19.1 years in the single-visit
sample.
Table 5.2 presents the demographic characteristics for the large and
frequent-visit samples in terms of total population, age and gender breakdown, and
total adult equivalents. The only significant difference between the two groups is in
regard to the mean number of children. Frequent-visit sample households have 0.8
more children on average. There is no evidence to suggest that there is any
difference in the population variances for the two samples in regard to any
demographic characteristic (Levene test).
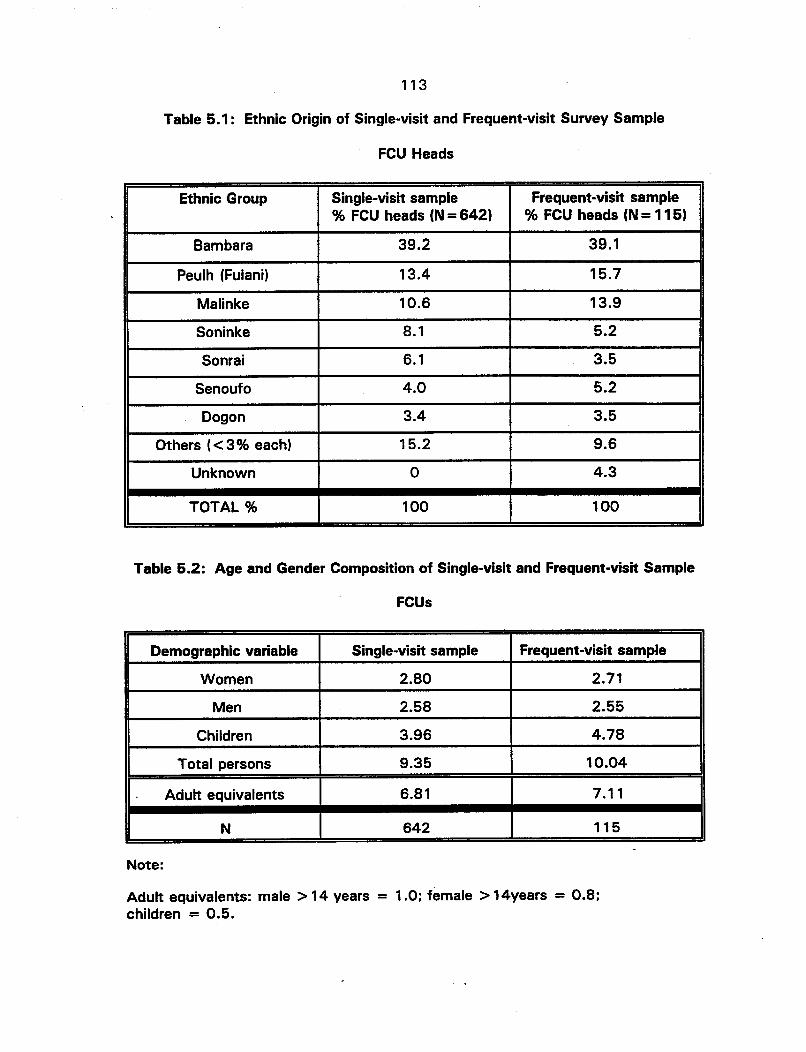
113
Table 5.1: Ethnic Origin of Single-visit and Frequent-visit Survey Sample
FCU Heads
Ethnic Group Single-visit sample Frequent-visit sample% FCU heads (N = 642) % FCU heads (N = 115)
Bambara 39.2 39.1
Peulh (Fulani) 13.4 15.7
Malinke 10.6 13.9
Soninke 8.1 5.2
Sonrai 6.1 3.5
Senoufo 4.0 5.2
Dogan 3.4 3.5
Others « 3% each) 15.2 9.6
Unknown 0 4.3
TOTAL % 100 100
Table 5.2: Age and Gender Composition of Single-visit and Frequent-visit Sample
FCUs
Demographic variable Single-visit sample Frequent-visit sample
Women 2.80 2.71
Men 2.58 2.55
Children 3.96 4.78
Total persons 9.35 10.04
Adult equivalents 6.81 7.11
N 642 115
Note:
Adult equivalents: male> 14 years = 1.0; female> 14years = 0.8;children = 0.5.

114
Table 5.3 presents the primary economic activity for household heads,
women and men, for the single-visit and frequent-visit samples. Eighty primary
economic activities were grouped into 13 categories for the analysis: none/retired,
student, homemaker, unskilled labor, agriculture, technician, artisan/service, civil
servant, military, professional, commerce, food seller and other. The most
important categories for household heads are civil servant, military, merchant,
none/retired, artisan/service and technician. The employment profile of household
heads in the frequent-visit sample is similar to the single-visit sample with one
exception. The frequent-visit sample has three times as many household heads in
the military as the single-visit sample, but only two thirds the number of merchants.
This is due to the fact that one of the frequent-visit survey SE incorporates a
military base. The difference could have an impact on cereal consumption patterns
as the military procures cereals for their employees, deducting the cost from their
salary.
Excluding female heads of household, almost 80% of women are engaged in
non-revenue generating primary activities. Among these, the most important
category is homemaker, with student and none/retired accounting for the remainder.
For the 20% of women engaged in revenue-generating activities, artisan/service,
merchant and civil service are the most important. Frequent-visit survey households
have proportionately 50% more women in the merchant category and 50% less in
the artisan/service category, which could affect earnings. This may be related to
the higher proportion of household heads with civil service posts. The stable
income stream arising from this employment category could be a source of working
capital for the purchase of women's inventory.
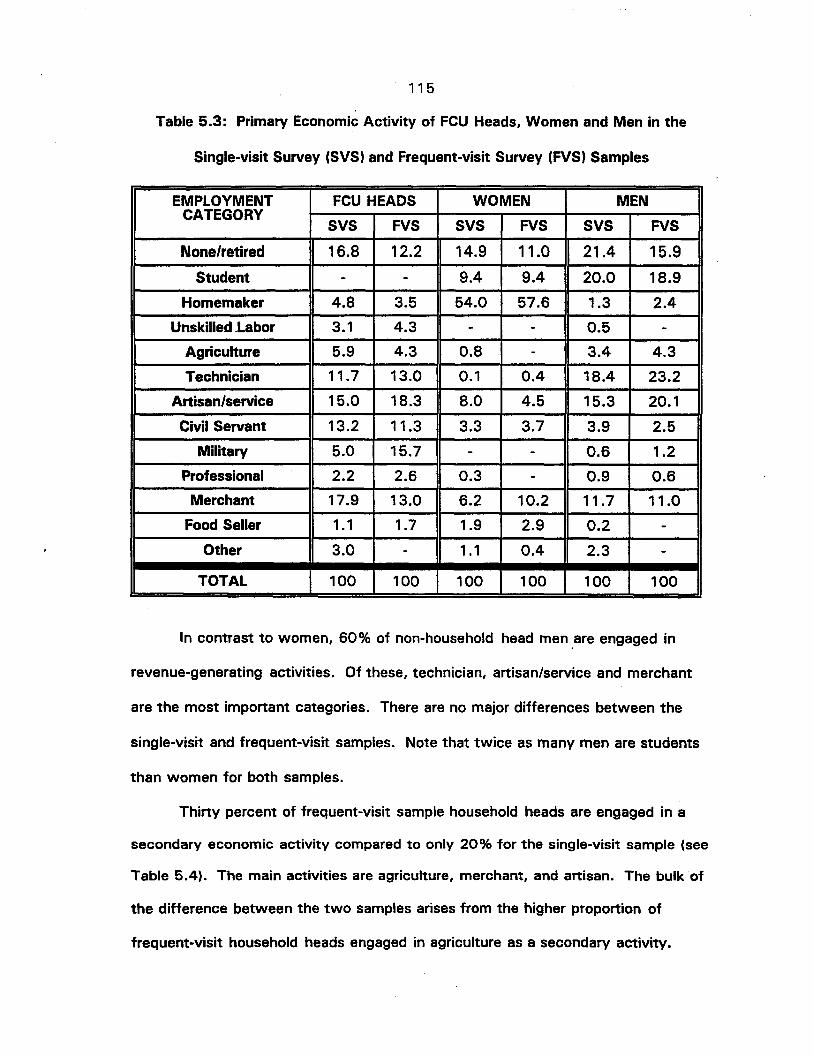
115
Table 5.3: Primary Economic Activity of FCU Heads, Women and Men in the
Single-visit Survey (SVS) and Frequent-visit Survey (FVS) Samples
EMPLOYMENT FCU HEADS WOMEN MENCATEGORY
SVS FVS SVS FVS SVS FVS
None/retired 16.8 12.2 14.9 11.0 21.4 15.9
Student - - 9.4 9.4 20.0 18.9
Homemaker 4.8 3.5 54.0 57.6 1.3 2.4
Unskilled _Labor 3.1 4.3 - - 0.5 -Agriculture 5.9 4.3 0.8 - 3.4 4.3
Technician 11.7 13.0 0.1 0.4 18.4 23.2
Artisan/service 15.0 18.3 8.0 4.5 15.3 20.1
Civil Servant 13.2 11.3 3.3 3.7 3.9 2.5
Military 5.0 15.7 - - 0.6 1.2
Professional 2.2 2.6 0.3 - 0.9 0.6
Merchant 17.9 13.0 6.2 10.2 11.7 11.0
Food Seller 1.1 1.7 1.9 2.9 0.2 -Other 3.0 - 1.1 0.4 2.3 -
TOTAL 100 100 100 100 100 100
In contrast to women, 60% of non-household head men ,are engaged in
revenue-generating activities. Of these, technician, artisan/service and merchant
are the most important categories. There are no major differences between the
single-visit and frequent-visit samples. Note that twice as many men are students
than women for both samples.
Thirty percent of frequent-visit sample household heads are engaged in a
secondary economic activity compared to only 20% for the single-visit sample (see
Table 5.4). The main activities are agriculture, merchant, and artisan. The bulk of
the difference between the two samples arises from the higher proportion of
frequent-visit household heads engaged in agriculture as a secondary activity.
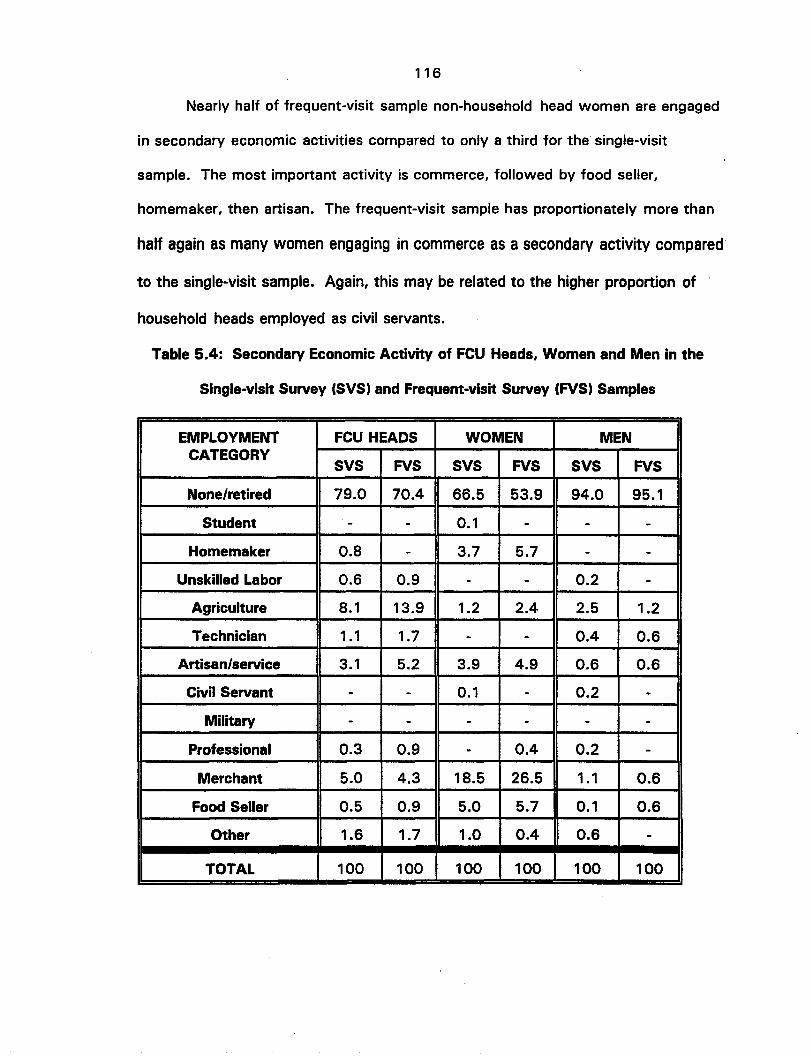
116
Nearly half of frequent-visit sample non-household head women are engaged
in secondary economic activities compared to only a third for the single-visit
sample. The most important activity is commerce, followed by food seller,
homemaker, then artisan. The frequent-visit sample has proportionately more than
half again as many women engaging in commerce as a secondary activity compared
to the single-visit sample. Again, this may be related to the higher proportion of
household heads employed as civil servants.
Table 5.4: Secondary Economic Activity of FCU Heads, Women and Men in the
Single-visit Survey (SVS) and Frequent-visit Survey (FVS) Samples
EMPLOYMENT FCU HEADS WOMEN MENCATEGORY
SVS FVS SVS FVS SVS FVS
None/retired 79.0 70.4 66.5 53.9 94.0 95.1
Student - - 0.1 - - -Homemaker 0.8 - 3.7 5.7 - -
Unskilled Labor 0.6 0.9 - - 0.2 -Agriculture 8.1 13.9 1.2 2.4 2.5 1.2
Technician 1.1 1.7 - - 0.4 0.6
Artisan/service 3.1 5.2 3.9 4.9 0.6 0.6
Civil Servant - - 0.1 - 0.2 -Military - - - - - -
Professional 0.3 0.9 - 0.4 0.2 -Merchant 5.0 4.3 18.5 26.5 1.1 0.6
Food Seller 0.5 0.9 5.0 5.7 0.1 0.6
Other 1.6 1.7 1.0 0.4 0.6 -TOTAL 100 100 100 100 100 100
117
In sharp contrast to women, only 6 % of non-household head men are
engaged in a secondary economic activity. Agriculture is the most important.
Twice as many men in the single-visit sample are engaged in agriculture compared
to the frequent-visit sample. Combining household heads and other men, the
difference in the proportions of all males engaged in agriculture as a secondary
activity is Jess m~rked:_6.5% f9r the frequent-visit survey and 4.7% for the single-
visit survey-: ." _._~' . - ._- --........ ..--.-' ,.. . .
An -importanteonsideration:is whether the difference in employment--patterns
is likely to have a significant impacts on income between the two samples. Daily
expenditures on condiments (non-cereal ingredients) per adult equivalent (ae) were
used as a proxy for income in the single-visit survey. Average daily condiment
expenditures per ae were marginally lower for frequent-visit FCUs: 109.1 CFA F/ae
compared to 114.6 CFA F/ae for the single-visit sample. Neither the difference in
mean daily condiment expenditures between the two samples, nor in their
variances, is statistically significant.
The small arithmetic difference in condiment expenditures between the two
samples is due in part to the slightly larger family size of the frequent-visit sample.
There exists a negative correlation between daily condiment expenditure per adult
equivalent and household size, implying condiment cost economies in family size.
This does not necessarily undermine the effectiveness of the proxy since income
estimated on the basis of total expenditure per adult equivalent is also negatively
correlated with family size.
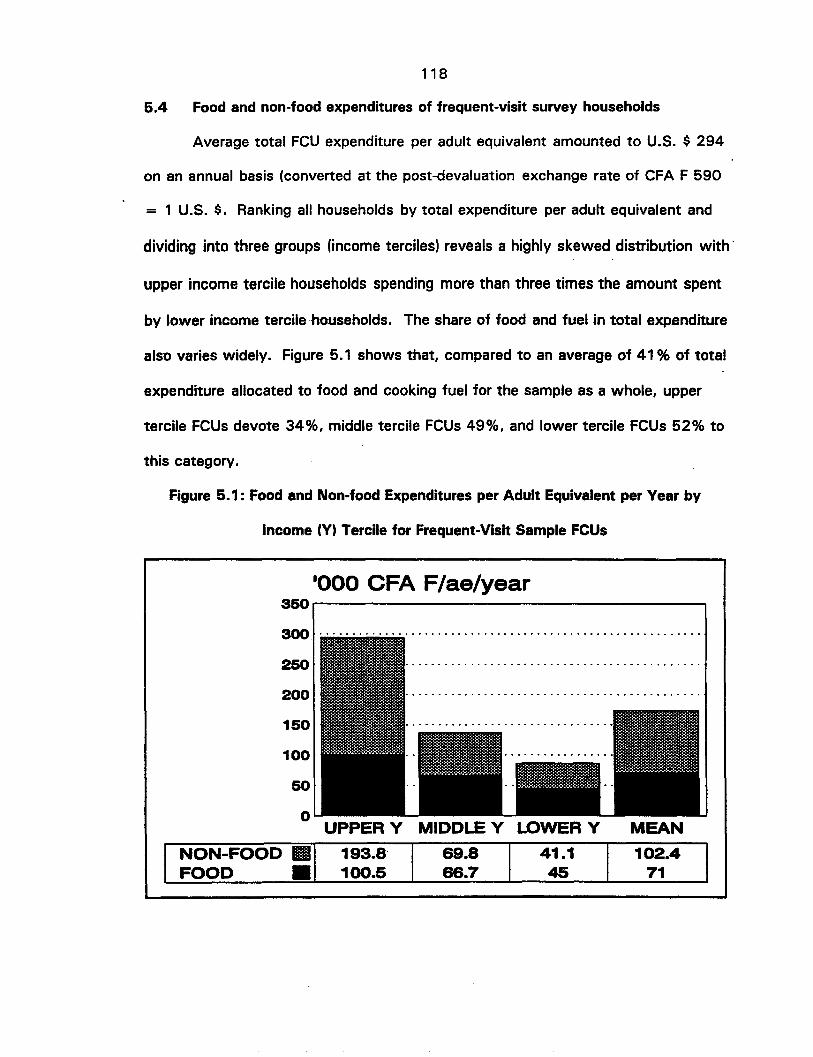
118
5.4 Food and non-food expenditures of frequent-visit survey households
Average total FCU expenditure per adult equivalent amounted to U.S. $ 294
on an annual basis (converted at the post-devaluation exchange rate of CFA F 590
= 1 U.S. $. Ranking all households by total expenditure per adult equivalent and
dividing into three groups (income terciles) reveals a highly skewed distribution with·
upper income tercile households spending more than three times the amount spent
by lower income tercilehouseholds. The share of food and fuel in total expenditure
also varies widely. Figure 5.1 shows that, compared to an average of 41 % of total
expenditure allocated to food and cooking fuel for the sample as a whole, upper
tercile FCUs devote 34%, middle tercile FCUs 49%, and lower tercile FCUs 52% to
this category.
Figure 5.1: Food and Non-food Expenditures per Adult Equivalent per Vear by
Income (V) Tercile for Frequent-Visit Sample FeUs
'000 CFA F/ae/year350r---------------------...,
MEAN
50
oUPPER Y MIDDLE Y LOWER Y
100
300 .
250 .
200 .
150
NON-FOOD fill 193.8 69.8 41.1 102.4FOOD • 100.5 66.7 45 71
119
Expenditure shares for specific types of food also vary widely between
income terciles (Figure 5.2 and Table 5.5). Average food and cooking fuel
expenditures can be broken down as follows: cereals 34.5%, tubers 1%, bread 4%,
condiments 50%, away from home meals 4%, and cooking fuel 7.5%. The
expenditure share for cereals is highest for lower income tercile FCUs at nearly
50%, and declines to less than 30% for upper tercile FCUs, indicating that cereals
are income-inelastic. On the other hand, average expenditure on condiments, bread
and tubers rises with income tercile. Expenditure on condiments rises from less
than 40% of all food and fuel expenditures for lower tercile FCUs to 55% for upper
tercile FCUs. In absolute terms, expenditure on condiments rises dramatically with
income, upper income tercile households spending three times as much per adult on
condiments as lower tercile FCUs. Expenditure on vendor (away-from-home) meals
rises with income in absolute terms, but the share decreases slightly from middle
income to upper income tercile FCUs. These results are consistent with findings of
urban studies elsewhere in the Sahel (e.g., Reardon et aI., 1988).
Part of the reason why total expenditure is so skewed may be due to an
interaction between income and FCU population. Table 5.6 presents the number of
FCUs in each income tercile in relation to the number in each population tercile.
Over half of all lower income tercile FCUs are in the upper population tercile.
Similarly, half of all upper income tercile FCUs are in the lower population tercile.
This distribution may have been accentuated by the fact that the respondent
for the questionnaire on FCU expenditures was the FCU head. He or she may not
be aware of all expenditures by family members, particularly those from
independent and possibly undisclosed income sources. The larger the size of the
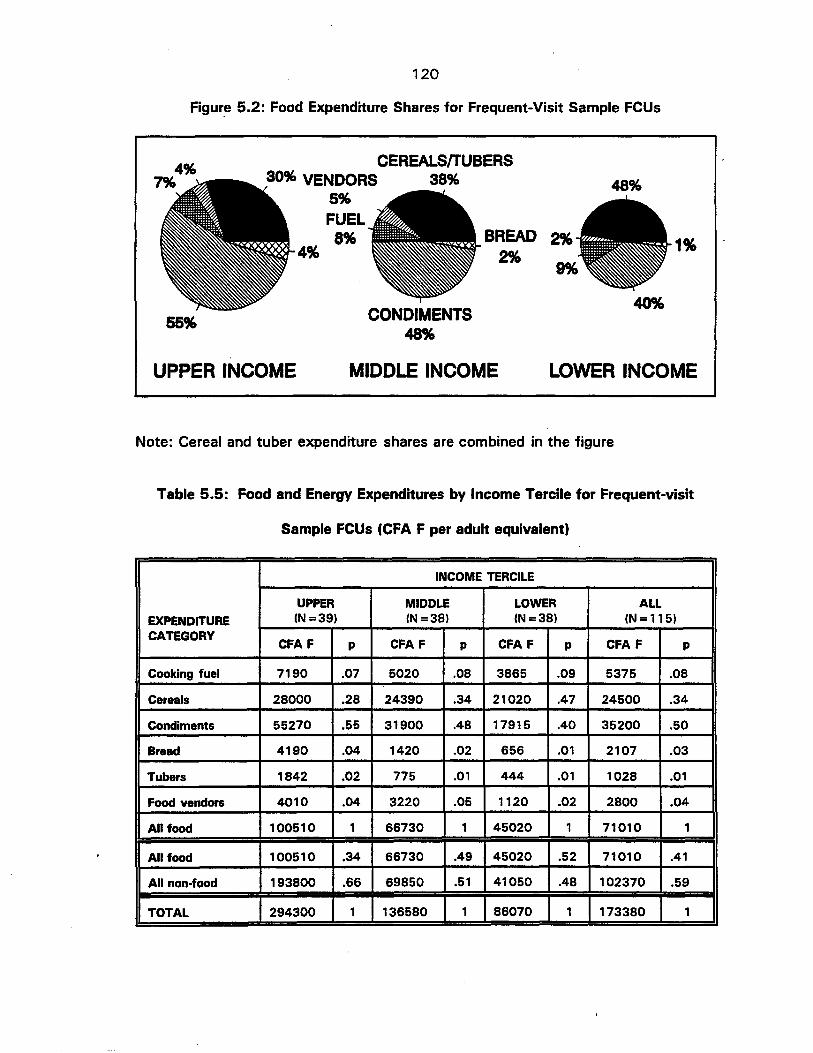
120
Figur~ 5.2: Food Expenditure Shares for Frequent-Visit Sample FCUs
1%
48%
BREAD2%
:;~
-CONDIMENTS
48"
4%
CEREALSITUBERS30% VENDORS 38%
5%
FUEL
8"
55"
UPPER INCOME MIDDLE INCOME LOWER INCOME
Note: Cereal and tuber expenditure shares are combined in the figure
Table 5.5: Food and Energy Expenditures by Income Tercile for Frequent-visit
Sample FCUs (CFA F per adult equivalent)
INCOME TERCILE
UPPER MIDDLE LOWER ALL
EXPENDITURE (N=39) (N =38) (N=38) (N = 115)CATEGORY
CFA F CFA F CFA F CFA Fp p p p
Cooking fuel 7190 .07 5020 .08 3865 .09 5375 .08
Cereals 28000 .28 24390 .34 21020 .47 24500 .34
Condiments 55270 .55 31900 .48 17915 .40 35200 .50
Bread 4190 .04 1420 .02 656 .01 2107 .03
Tubers 1842 .02 775 .01 444 .01 1028 .01
Food vendors 4010 .04 3220 .05 1120 .02 2800 .04
All food 100510 1 66730 1 45020 1 71010 1
All food 100510 .34 66730 .49 45020 .52 71010 .41
All non-food 193800 .66 69850 .51 41050 .48 102370 .59
TOTAL 294300 1 136580 1 86070 1 173380 1

121
Table 5.6: Relationship between Population and Income Terciles for Frequent-visit
Sample FCUs
INCOME POPULATION TERCILETERCILE
UPPER MIDDLE LOWERTOTAL
UPPER 4 16 19 39
MIDDLE 14 14 10 38
LOWER 21 8 9 38
TOTAL 39 38 38 115
family the more likely it is that expenditures take place without the knowledge of
the FeU head. If true, this would introduce a downward bias in the estimation of
total expenditure for large FCUs. However, the total expenditure per adult
equivalent income proxy remains valid for the purpose of analyzing food expenditure
and cereal procurement and utilization patterns since the FCU head is primarily
responsible for providing the financial and/or in-kind resources to nourish the FCU
regardless of its size. Thus, total expenditure per adult equivalent reflects the
available resources for communal food provision even if it underestimates total
disposable income of FCU members as FCU population increases.
5.5 Summary
This chapter described the survey instruments and sampling methods for the
urban cereal procurement and utilization surveys in Bamako, and described the
sample characteristics. From a demographic standpoint, the purposively selected
frequent-visit survey sample is broadly representative of the characteristics in the
larger random sample, with the exception of the higher proportion of military
122
households. This factor must be controlled for in estimates of demand for
processed products. The sample varies widely in terms of total expenditure and
food expenditure per ae, and especially in regard to expenditure on condiments.

CHAPTER SIX
CEREAL UTILIZATION PATTERNS AMONG BAMAKO HOUSEHOLDS:
SURVEY RESULTS
Chapter 5 described the survey methods used to capture cereal utilization
patterns in Bamako, together with the characteristics of sample households. This
chapter presents the principal results. The first section presents information from
the large-sample single-visit survey on preferences for pre-processed coarse grain
products. Respondents were asked about processed coarse grain products the
household had purchased in the past, products they would like to purchase in the
future, and the dishes to be prepared from those products. This information was
the basis for the maize subsector team's decision to focus on urban demand for
flour, estimated in the next chapter, as a means to broaden the market for maize
grain.
The remaining sections provide an empirical description of household cereal
procurement and utilization during the period December 1992 to November 1993,
based on results from the frequent-visit survey. The analyses are guided by the
maintained hypothesis that the demands for cereals and complementary processing
services are jointly derived from the demand for meals (chapter 2). Section two
provides an empirical overview of household cereal procurement by season and
income group, and the form (unprocessed or processed) in which coarse grains are
procured. The third section examines coarse-grain-based dishes consumed at
principal mealtimes, and the processed form (flour or grits) required for
123
124
preparation.' Finally, the costs of household preparation of rice and toh (the
principal coarse-grain-based dish), are estimated taking account of labor
requirements, and processing costs and losses. For toh, the cost of the prepared
dish using the modal practice of manual dehulling and custom milling is compared to
the cost using grain purchased in dehulled form or as flour at estimated retail prices;
Together the analyses confirm that while the majority of coarse-grain-based
dishes are prepared from flour, virtually all coarse grains are purchased in
unprocessed form: The processed coarse grain products that consumers expressed
a hypothetical demand for in the large-sample survey are for the preparation of
traditional principal coarse-grain-based dishes rather than novelty or luxury
products, or direct rice substitutes.2 The detailed study of the costs of dish
preparation reveals that household processing of coarse grains is cheaper than
procurement of pre-processed coarse grains at the prevailing opportunity cost of
women's time. Together these analyses provide a context for interpreting the
econometric analysis of maize flour demand presented in chapter 8.
As background for the chapter it is useful to recall the steps required to
prepare a typical coarse-grain-based dish from unprocessed grain. To make toh, for
, Grits are particles of flinty endosperm that vary in size according to thedesired use. The proportions of grits and flour obtained from milling depends on thecereal and variety, and how closely the plates on the grinding mill are adjusted.
2 The term "direct rice substitute" in this context implies the use of a processedcoarse grain product in place of rice in a rice-based dish. The Cereals TechnologyLaboratory of IER developed a dehulled parboiled sorghum product called "SORI", atruncation of the French words for sorghum and rice, with support from.INTSORMIL. Test marketed as a direct substitute for rice, it was regarded as aninferior product by consumers. An alternative strategy to facilitate substitution forrice would be to encourage the consumption of a higher proportion of coarse-grainbased dishes in the diet through the availability of cheap processed coarse grainproducts.
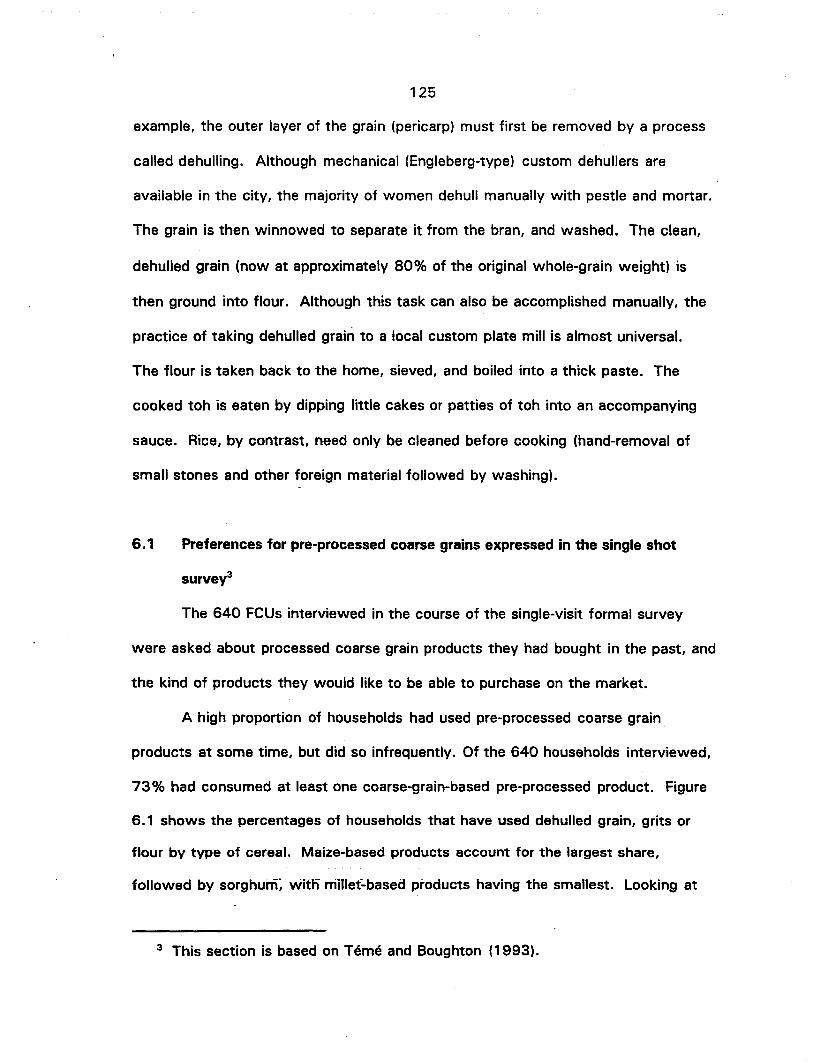
125
example, the outer layer of the grain (pericarp) must first be removed by a process
called dehulling. Although mechanical (Engleberg-type) custom dehullers are
available in the city, the majority of women dehull manually with pestle and mortar.
The grain is then winnowed to separate it from the bran, and washed. The clean,
dehulled grain (now at approximately 80% of the original whole-grain weight) is
then ground into flour. Although this task can also be accomplished manually, the
practice of taking dehulled grain to a local custom plate mill is almost universal.
The flour is taken back to the home, sieved, and boiled into a thick paste. The
cooked toh is eaten by dipping little cakes or patties of toh into an accompanying
sauce. Rice, by contrast, need only be cleaned before cooking (hand-removal of
small stones and other foreign material followed by washing).
6.1 Preferences for pre-processed coarse grains expressed in the single shot
survey3
The 640 FCUs interviewed in the course of the single-visit formal survey
were asked about processed coarse grain products they had bought in the past, and
the kind of products they would like to be able to purchase on the market.
A high proportion of households had used pre-processed coarse grain.
products at some time, but did so infrequently. Of the 640 households interviewed,
73% had consumed at least one coarse-grain-based pre-processed product. Figure
6.1 shows the percentages of households that have used dehulled grain, grits or
flour by type of cereal. Maize-based products account for the largest share,
followed by sorghum~ witn rriillet:based products having the smallest. Looking at
3 This section is based on Teme and Boughton (1993).
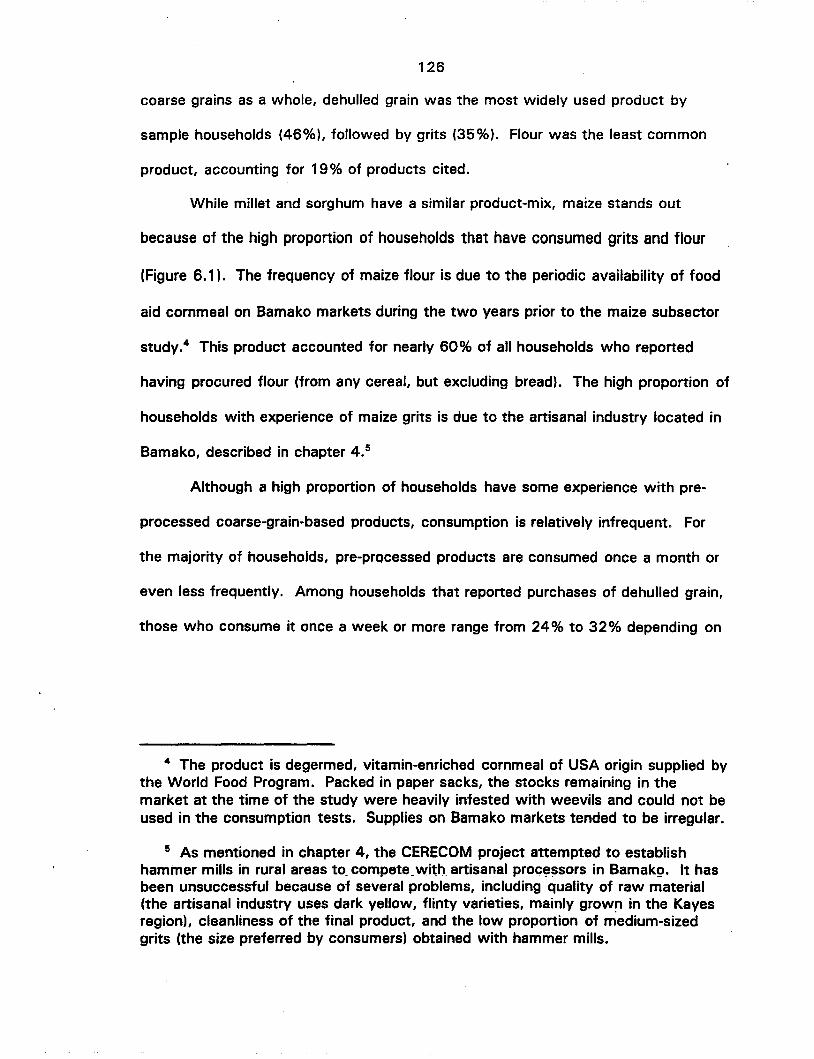
126
coarse grains as a whole, dehulled grain was the most widely used product by
sample households (46%), followed by grits (35%). Flour was the least common
product, accounting for 19% of products cited.
While millet and sorghum have a similar product-mix, maize stands out
because of the high proportion of households that have consumed grits and flour
(Figure 6.1). The frequency of maize flour is due to the periodic availability of food
aid cornmeal on Bamako markets during the two years prior to the maize subsector
study.4 This product accounted for nearly 60% of all households who reported
having procured flour (from any cereal, but excluding bread). The high proportion of
households with experience of maize grits is due to the artisanal industry located in
Bamako, described in chapter 4.5
Although a high proportion of households have some experience with pre-
processed coarse-grain-based products, consumption is relatively infrequent. For
the majority of households, pre-processed products are consumed once a month or
even less frequently. Among households that reported purchases of dehulled grain,
those who consume it once a week or more range from 24% to 32% depending on
4 The product is degermed, vitamin-enriched cornmeal of USA origin supplied bythe World Food Program. Packed in paper sacks, the stocks remaining in themarket at the time of the study were heavily infested with weevils and could not beused in the consumption tests. Supplies on Bamako markets tended to be irregular.
5 As mentioned in chapter 4, the CERECOM project attempted to establishhammer mills in rural areas to_ compete_with artisanal proc~~sors in Bamakg. It hasbeen unsuccessful because of several problems, including quality of raw material(the artisanal industry uses dark yellow, flinty varieties, mainly grow~ in the Kayesregion), cleanliness of the final product, and the low proportion of medium-sizedgrits (the size preferred by consumers) obtained with hammer mills.
o
127
the cereal. Among households who purchase maize grits, 30% claimed to consume
them once a week or more.6
Figure 6.1: Percentage of 640 Households Having Purchased Specific Processed
Coarse Grain Products
% HOUSEHOLDS50..-----------------.
40
30
20
10 ..
MAIZE MILLET SORGHUM
IIDEHULLED GRAIN II GRITS ~ FLOUR
Source: IER-MSU Maize subsector survey of 640 households (FCUs)
Information about constraints to the consumption of pre-processed products
was difficult to obtain through the formal-survey instrument, with many
respondents simply saying that they were not familiar with a given product. Flour
provoked the strongest reactions, however, with 25 % of respondents reporting a
"lack of confidence" in flour sold in the market. The corresponding figure for the
6 This estimate proved to be somewhat high compared to results from thefrequent-visit .survey. This may be related.tothe..seasonal nature of the artisanalmaize grit industry. Maize grits from the new crop harvest were just arriving on themarket at the time of the single-visit survey.

128
food aid cornmeal was less than 5%. For dehulled grains and grits, cost was the
most commonly cited constraint after lack of familiarity.
In addition to providing an overview of current use of pre-processed coarse
grain products, the survey also sought to find out the kinds of product consumers
would like to procure. Respondents were asked the following open-ended question:'
"If good quality processed products were available on the market which would you
like to buy?~_.. Those specifying a product were also asked what type of cereal the
product should be made from, and the kind of dish that would be prepared from it.
Respondents were free to cite as many products as they wished. A total of 1840
product/dish combinations were enumerated by 570 respondents (89%). Figure
6.2A shows the percentage of respondents indicating a desire to purchase a
specific product. With the exception of sorghum and millet flour, which show a
significant increase over current utilization patterns, the results are similar to Figure
6.1. For dehulled grain, the proportion of respondents desiring to purchase is
slightly higher than the current situation for all three grains. For maize grits, the
proportion is slightly lower.
Processed products vary in the number and type of dishes that can be made
from them. A respondent may indicate a desire to use one product for two or more
dishes. Figure 6.28 shows the total number of dishes that respondents indicated
they would prepare from different products. Flour and dehulled grain account for a
higher proportion of dishes relative to grits.7
7 For flour, the number of dishes per respondent averaged 1.42, 1.49 and 1.43for maize, millet and..sQrghurruespe.c;:tiv.ely.~For denuUed,,,gfain, the correspondingaverages are 1.75, 1.64, and 1.82. For maize and sorghum grits, the averagenumber of dishes was 1.16 and 1.24.
129
Figure 6.2A: Percentages of 640 Households Wishing to Purchase Specific
Processed Coarse Grain Products
% HOUSEHOLDS40.....----------------,
30
20
oMAIZE MILLET SORGHUM
III DEHULLED GRAIN IIGRITS ~ FLOUR
Figure 6.28: Number of Dishes to be Prepared by Households Wishing to Purchase
Specific Processed Coarse Grain Products
NUMBER OF DISHES400.--------------.,
300
200 ..
100 .,
o MAIZE MILLET SORGHUM
IIDEHULLED GRAIN • GRITS ~ FLOUR
Source: IER-MSU Maize Subsector Study single-visit survey.
130
Perhaps the most surprising finding was that, in the majority of cases,
respondents wishing to purchase dehulled grains and those wishing to purchase
flour intended to use them to make the same dishes. Table 6.1 shows a breakdown
of the percentage of households willing to purchase a given product (cereal and
form) for the preparation of a specific dish. In the majority of cases, dehulled grains·
are intended for the preparation of flour-based dishes rather than grits-based dishes.
This implies that the total (or latent) demand for flour is much higher than that
indicated by the percentage of respondents indicating a willingness to purchase
flour.
Two main reasons for the purchase of dehulled grains to make flour-based
dishes emerged in the course of informal discussions. The first is a concern for
product cleanliness. Dehulled grains, like grits, can be washed thoroughly prior to
preparation. Flour cannot. Second, many housewives prefer to prepare meals from
freshly milled flour. The implications for the potential demand for pre-processed
flour are difficult to quantify. Casual observation suggests that packaging goes a
long way to alleviating concerns about product cleanliness, as in the case of food
aid cornmeal. The implications of preferences for freshly milled flour are much
harder to quantify a priori, and therefore freshness was included as a criterion in the
evaluation of test flours (chapter 7).
6.2 Household cereal procurement in Bamako
This section provides an overview of cereal procurement, including the type,
amount and form of cereals procured by season and income group.8 The evolution
8 Procurement here refers to all sources, including purchases, gifts, remittancesfrom family in the rural areas, and own-production. -
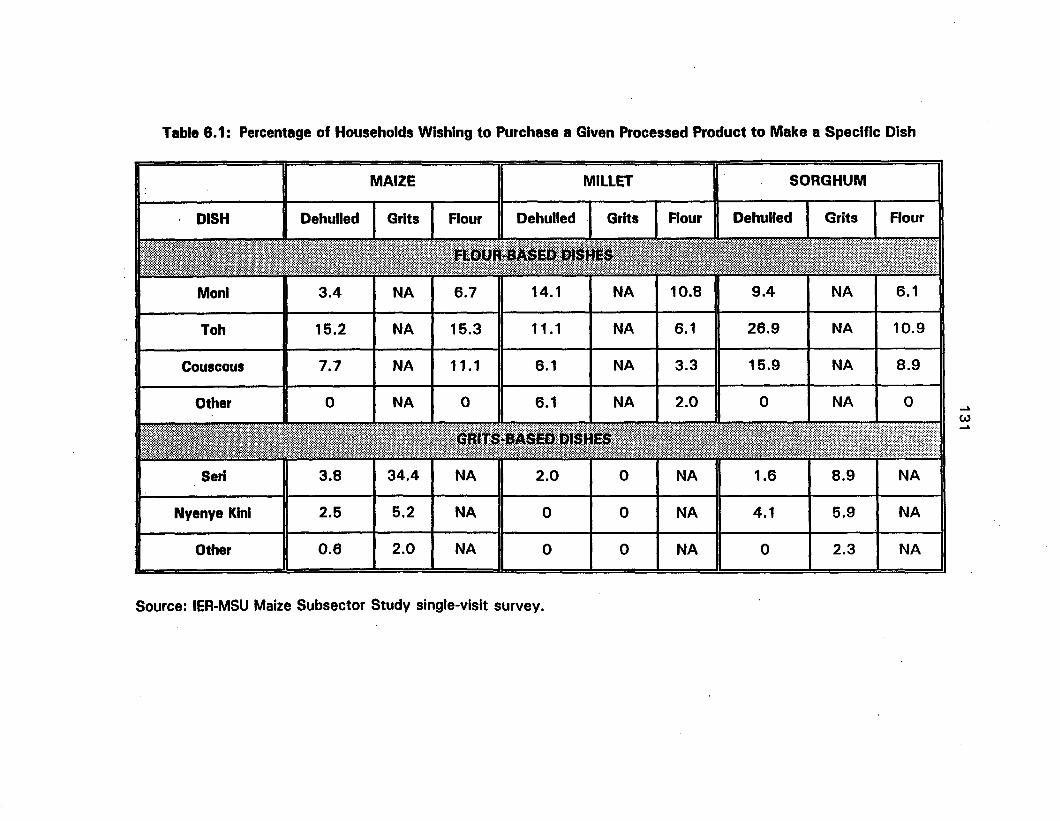
Table 6.1: Percentage of Households Wishing to Purchase a Given Processed Product to Make a Specific Dish
MAIZE MILLET SORGHUM
, DISH Dehulled I Grits I Flour Dehulled Grits I Flour Dehulled Grits Flour
, , n , 'Ii • •Moni
Yoh
Couscous
Other
3.4
15.2
7.7
o
NA
NA
NA
NA
6.7
15.3
11.1
o
14.1
11.1
6.1
6.1
NA
NA
NA
NA
10.8
6.1
3.3
2.0
9.4
26.9
15.9
o
NA
NA
NA
NA
6.1
10.9
8.9
o~
(.oJ
Sen ~Nyenye Klni
Other
2.5
0.6
5.2
2.0
NA
NA
o
o
o
o
NA
NA
4.1
o
5.9
2.3
NA
NA
Source: IER-MSU Maize Subsector Study single-visit survey.
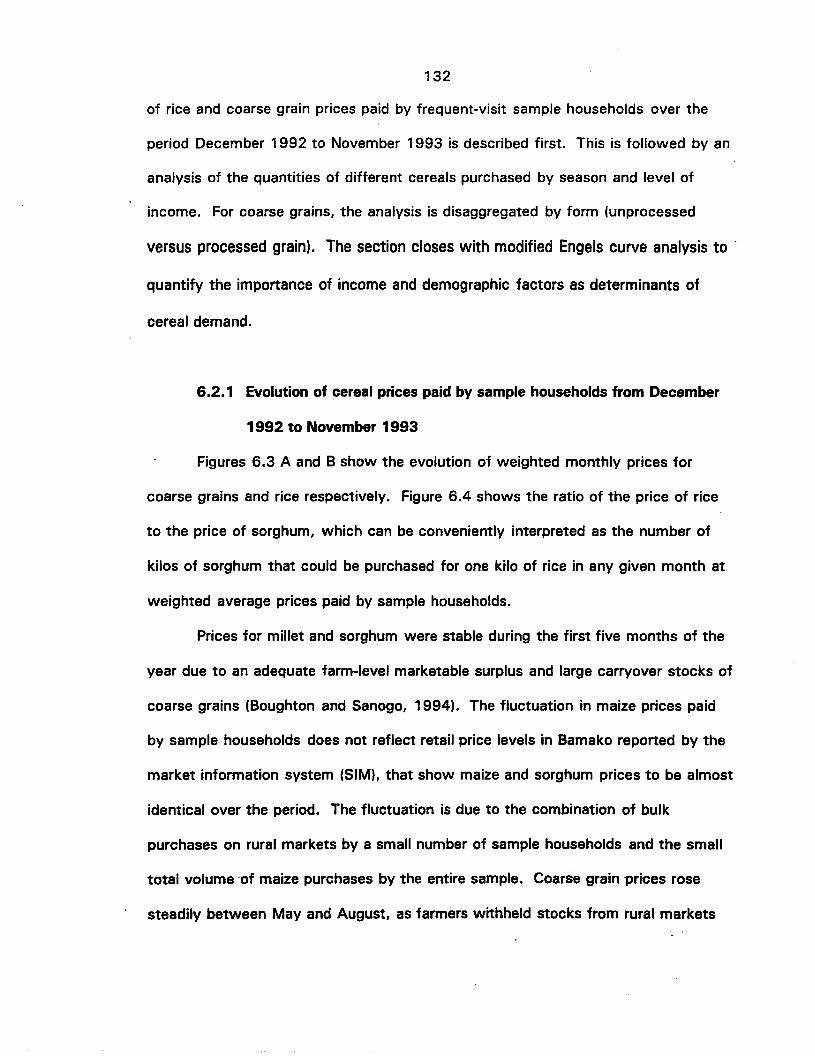
132
of rice and coarse grain prices paid by frequent-visit sample households over the
period December 1992 to November 1993 is described first. This is followed by an
analysis of the quantities of different cereals purchased by season and level of
income. For coarse grains, the analysis is disaggregated by form (unprocessed
versus processed grain). The section closes with modified Engels curve analysis to .
quantify the importance of income and demographic factors as determinants of
cereal demand.
6.2.1 Evolution of cereal prices paid by sample households from December
1992 to November 1993
Figures 6.3 A and B show the evolution of weighted monthly prices for
coarse grains and rice respectively. Figure 6.4 shows the ratio of the price of rice
to the price of sorghum, which can be conveniently interpreted as the number of
kilos of sorghum that could be purchased for one kilo of rice in any given month at
weighted average prices paid by sample households.
Prices for millet and sorghum were stable during the first five months of the
year due to an adequate farm-level marketable surplus and large carryover stocks of
coarse grains (Boughton and Sanogo, 1994). The fluctuation in maize prices paid
by sample households does not reflect retail price levels in Bamako reported by the
market information system (SIM), that show maize and sorghum prices to be almost
identical over the period. The fluctuation is due to the combination of bulk
purchases on rural markets by a small number of sample households and the small
total volume 'of maize purchases by the entire sample. Coarse grain prices rose
steadily between May and August, as farmers withheld stocks from rural markets
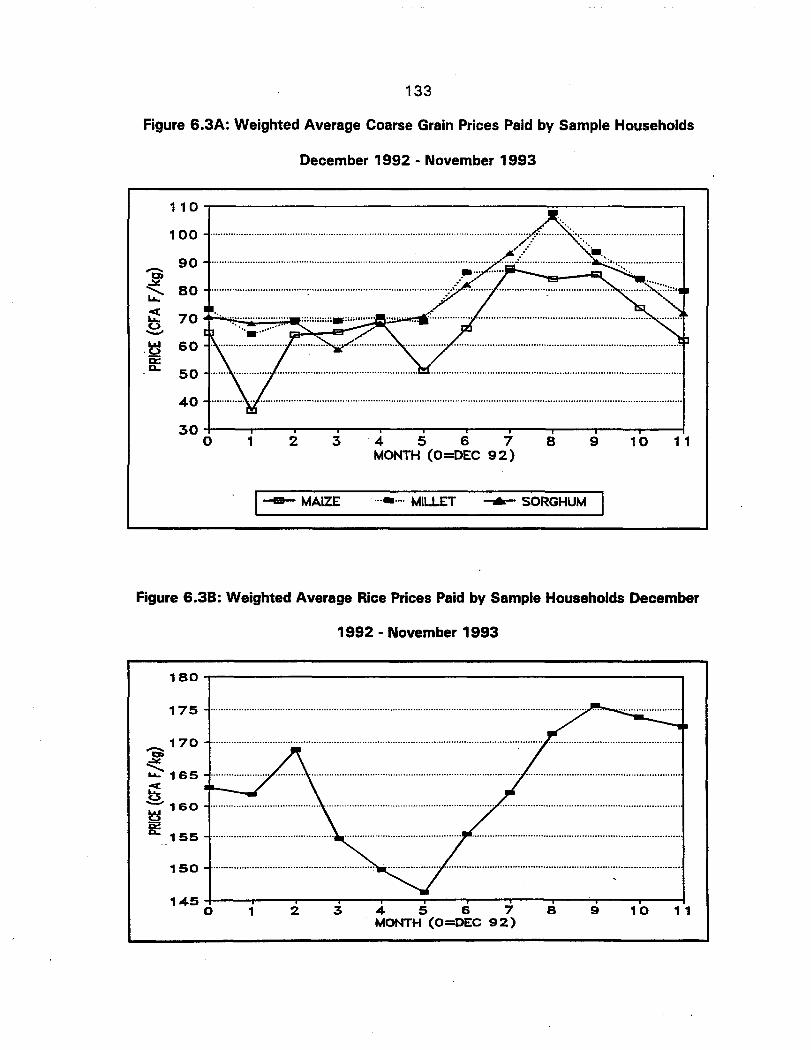
133
Figure 6.3A: Weighted Average Coarse Grain Prices Paid by Sample Households
December 1992 - November 1993
110
100
90"0»~ 80.....~ 70~
,~ 60D::Q,.
50
40
1 110984 5 6 7MONTH (O=DEC 92)
32130 +-----r"--~-__r_-__,~-_r_-__r--~-__r_-__,r__-_._-_i
o
I~MAIZE ........ MILLET ....- SORGHUM
Figure 6.38: Weighted Average Rice Prices Paid by Sample Households December
1992 - November 1993
180..,.----------------------------,
175
170~.::.:';::::- 165
S......... 160
i 155
150
1 45 +-----r"--~-__r_-__,--_r_-...,..--~-""T""-__,,..---_r_---1
o 1 2 3 4 5 6 7 8 9 10 11MONTH (O=OEC 92)
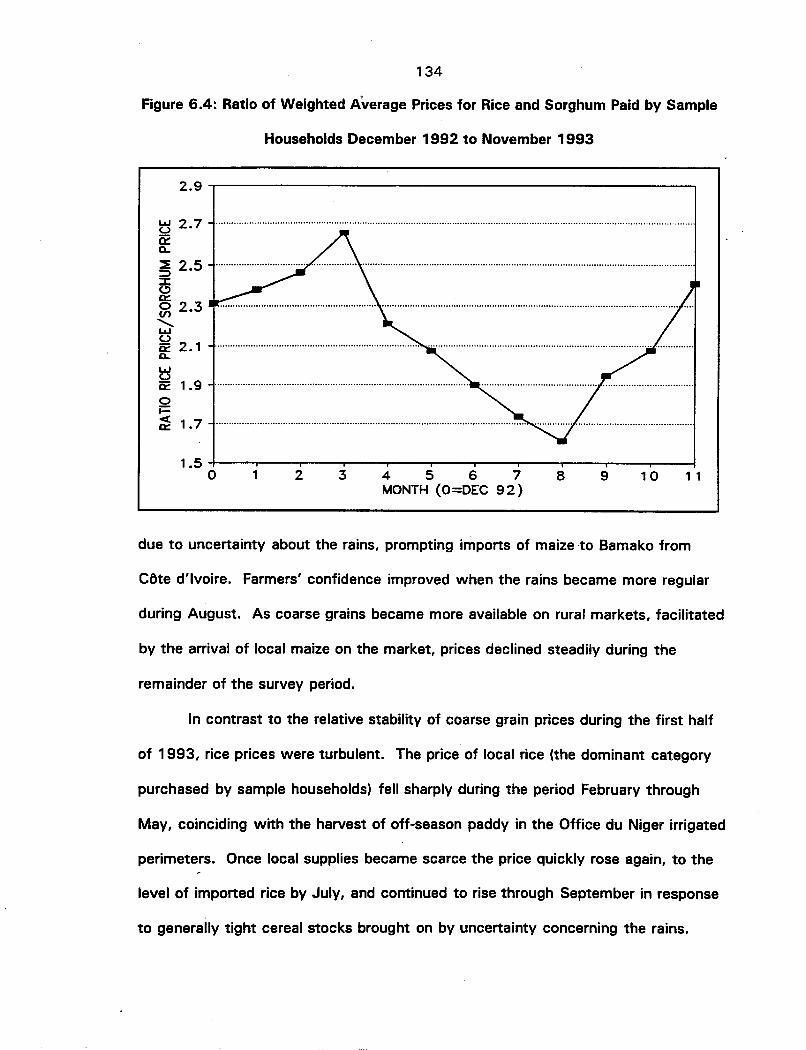
134
Figure 6.4: Ratio of Weighted Average Prices for Rice and Sorghum Paid by Sample
Households December 1992 to November 1993
2.9 .,....---------------------------,
tj 2.7
g:~ 2.5:I:
~~ 2.3.........LoJU0:::: 2.1c..LoJU0:::: 1.9oi=c:(0:::: 1.7
1 110984 5 6 7MONTH (O=DEC 92)
3211.5+----r---r--"""T'"--,.....---r-----,---r--~--.,....---r-_1
o
due to uncertainty about the rains, prompting imports of maize to Bamako from
Cote d'ivoire. Farmers' confidence improved when the rains became more regular
during August. As coarse grains became more available on rural markets, facilitated
by the arrival of local maize on the market, prices declined steadily during the
remainder of the survey period.
In contrast to the relative stability of coarse grain prices during the first half
of 1993, rice prices were turbulent. The price of local rice (the dominant category
purchased by sample households) fell sharply during the period February through
May, coinciding with the harvest of off-season paddy in the Office du Niger irrigated
perimeters. Once local supplies became scarce the price quickly rose again, to the
level of imported rice by July, and continued to rise through September in response
to generally tight cereal stocks brought on by uncertainty concerning the rains.
135
As a result of considerable variation in rice prices throughout the year, and
coarse grain prices during the rainy season, the ratio of the price of rice to the price
of sorghum fluctuated widely (Figure 6.4). Rice initially became more expensive
compared to sorghum until March, and then became progressively cheaper due to
the availability of local rice. Despite increases in local rice prices from June
onwards, rice continued to become relatively cheaper because sorghum prices rose
even faster due to uncertainty about the rains. Only in September, when the local
rice price peaked and the new maize harvest started to enter the urban market, did
rice start to become relatively more expensive again.
In anticipation of the seasonal analysis of cereal procurement in the next
section, Table 6.2 provides a synthesis of weighted average cereal prices by season
for small and large volume purchases. The cold season refers to the four-month
period November to February, coinciding with the arrival of the new coarse grain
harvest on urban markets.9 The hot season is the four-month period March to
June, which included most of the month of Ramadan.10 The wet season is the
four-month period July to October. Viewed in a seasonal perspective, the price of
sorghum relative to rice was about 14% lower during the cold season, and 13%
higher during the wet season, compared to an average of 2.09 kg sorghum per kilo
9 Because the first full month of data was collected in December 1992, coldseason analyses are based on the four months December 1992 until February 1993plus November 1993. Although maize entering consumption in November 1993 isfrom a different crop year than that entering consumption in December 1992, thecrop years were sufficiently similar as to justify this combination of months.
10 Ramadan is the lunar month when Moslems fast, neither eating nor drinkingbetween dawn and dusk. Millet porridge (moni) is a traditional pre-dawn breakfastmeal during this period.

Table 6.2: Weighted Seasonal Average Cereal Prices Paid by Sample Households (CFA F/kg)
CEREAL COLD % TOTAL HOT % TOTAL WET % TOTAL ANNUAL % TOTALSEASON SEASON SEASON AVERAGE
WHITE MAIZEQ < 25 kg 63.6 12.2 74.4 3.8 76.4 3.6 68.2 6.3Q > 25 kg 55.1 87.8 53.1 96.2 74.3 96.4 58.3 93.7Mean 56.1 100 53.9 100 74.4 100 58.9 100
YELLOW MAIZEa < 25 kg 62.7 18.9 68.5 13.3 79.9 8.0 68.4 13.1a > 25 kg 57.0 81.1 58.0 86.7 78.0 92.0 67.0 86.9Mean 58.1 100 59.4 100 78.2 100 67.2 100
MILLETa < 25 kg 75.1 11.5 74.7 18.6 89.1 15.8 78.4 14.9a > 25 kg 70.5 88.5 70.4 81.4 92.9 84.2 75.7 85.1Mean 71.0 100 71.2 100 92.3 100 76.1 100
SORGHUMa < 25 kg 72.9 24.4 74.5 27.4 93.8 34.6 81.6 28.8a > 25 kg 69.0 75.6 66.5 72.6 93.9 65.4 75.6 71.2Mean 70.0 100 68.7 100 93.9 100 77.3 100
RICE (RM 40)a < 25 kg 176.7 27.3 156.8 33.1 180.5 33.5 169.9 31.6a > 25 kg 162.7 72.7 148.0 66.9 165.3 66.5 157.9 68.4Mean 166.5 100 150.9 100 170.4 100 161.7 100
RICE/SORGHUMa < 25 kg 2.42 2.10 1.92 2.08a > 25 kg 2.36 NA 2.23 NA 1.76 NA 2.09 NAMean 2.38 2.20 1.81 2.09
Source: IER-MSU Maize Subsector Study frequent-visit survey.
~
W0>

137
of rice for the year as a whole. For both sorghum and rice, prices were
approximately 8% higher for small quantities than for large (more than 25 kg).
Approximately 70% of sorghum and rice was purchased in large quantities, and
85% or more for millet and maize.
6.2.2 Cereal quantities procured by season and income group
Despite seasonal variation in the absolute and relative prices of sorghum and
rice, there was little variation in total household cereal procurement of coarse grains
or rice between seasons (Table 6.3). The share of coarse grains by weight
remained close to the year-round average of 44.6%. While the cold season peak
share of 48 % coincided with a period when coarse grain prices were low in
absolute terms and relative to rice, it also coincided with the harvest of home
produced millet by sample households.
There is greater seasonal variation in the mix of coarse grains than between
coarse grains and rice. The share of millet in total coarse grains is highest during
the cold season at 32%, and declines to almost half that level in the wet season.
Sorghum rises from 58% in the cold season to 68% in the hot and wet seasons.
Grain maize reached a peak of almost 13% of coarse grain procurement during the
wet season in response first to imports of maize from Cote d'ivoire, and
subsequently to the arrival of domestically produced maize on Bamako markets
ahead of the millet and sorghum harvest. With the arrival of newly harvested millet
and sorghum at the end of the wet season, the share of maize declined to 9 % in the
cold and 5% in the hot seasons, by which time grain maize supplies were relatively
scarce.
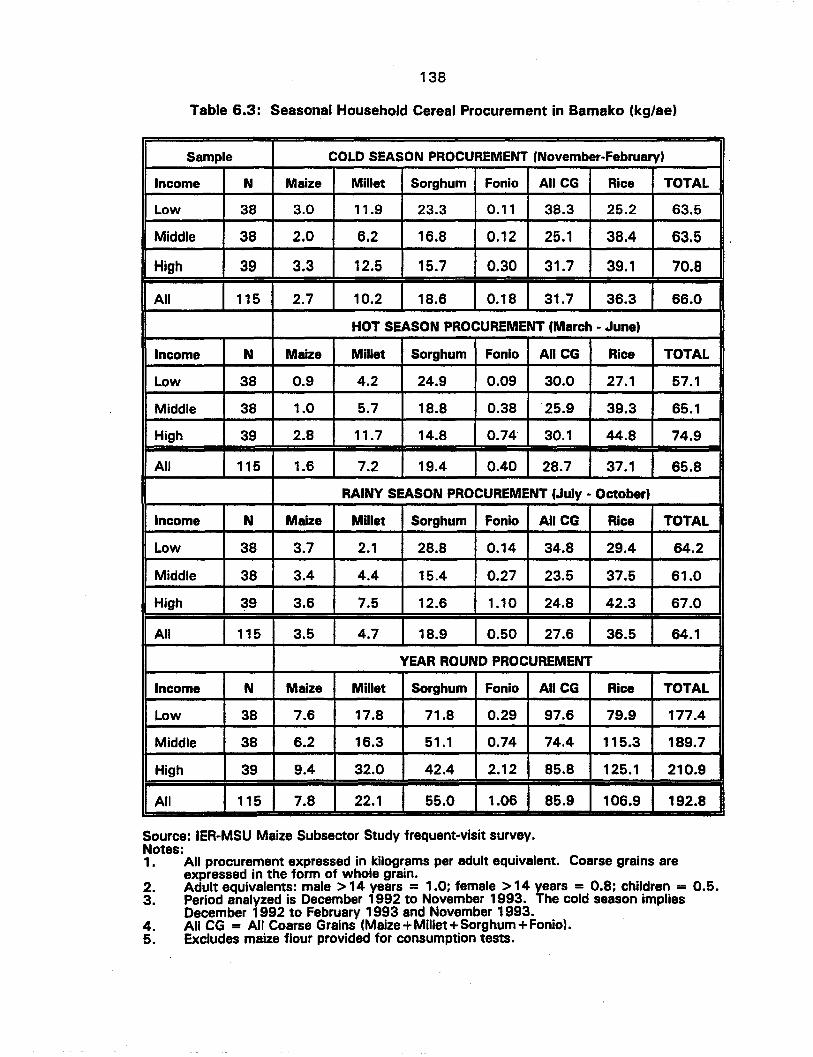
138
Table 6.3: Seasonal Household Cereal Procurement in Bamako (kg/ae)
Sample COLD SEASON PROCUREMENT (November-February)
Income N Maize Millet Sorghum Fonio All CG Rice TOTAL
Low 38 3.0 11.9 23.3 0.11 38.3 25.2 63.5
Middle 38 2.0 6.2 16.8 0.12 25.1 38.4 63.5
High 39 3.3 12.5 15.7 0.30 31.7 39.1 70.8
All 115 2.7 10.2 18.6 0.18 31.7 36.3 66.0
HOT SEASON PROCUREMENT (March - June)
Income N Maize Millet Sorghum Fonio All CG Rice TOTAL
Low 38 0.9 4.2 24.9 0.09 30.0 27.1 57.1
Middle 38 1.0 5.7 18.8 0.38 ·25.9 39.3 65.1
High 39 2.8 11.7 14.8 0.74· 30.1 44.8 74.9
All 115 1.6 7.2 19.4 0.40 28.7 37.1 65.8
RAINY SEASON PROCUREMENT (July - October)
Income N Maize Millet Sorghum Fonio All CG Rice TOTAL
Low 38 3.7 2.1 28.8 0.14 34.8 29.4 64.2
Middle 38 3.4 4.4 15.4 0.27 23.5 37.5 61.0
High 39 3.6 7.5 12.6 1.10 24.8 42.3 67.0
All 115 3.5 4.7 18.9 0.50 27.6 36.5 64.1
YEAR ROUND PROCUREMENT
Income N Maize Millet Sorghum Fonio AIICG Rice TOTAL
Low 38 7.6 17.8 71.8 0.29 97.6 79.9 177.4
Middle 38 6.2 16.3 51.1 0.74 74.4 115.3 189.7
High 39 9.4 32.0 42.4 2.12 85.8 125.1 210.9
All 115 7.8 22.1 55.0 1.06 85.9 106.9 192.8
Source: IER-MSU Maize Subseetor Study frequent-visit survey.Notes:1• All procurement expressed in kilograms per adult equivalent. Coarse grains are
expressed in the form of whole grain.2. Adult equivalents: male >14 years = 1.0; female >14 years = 0.8; children = 0.5.3. Period analyzed is December 1992 to November 1993. The cold season implies
December 1992 to February 1993 and November 1993.4. All CG = All Coarse Grains (Maize+Millet+Sorghum +Fonio).5. Excludes maize flour provided for consumption tests.
139
There is notable variation in both the quantity and mix of cereal procurement
between income terciles (Table 6.3). Total cereal procurement from all sources,
including own production and gifts, was 6% less for lower income tercile
households compared to the average of 193 kg per adult equivalent (ae), and 11 %
greater among households in the upper tercile. The share of coarse grains in total
cereal procurement is highest for the lower income tercile at 55%, compared to
roughly 40% for the middle and upper terciles.
The mix of coarse grains also varies between income terciles. Sorghum
accounts for 74% of coarse grain procurement by households in the lower income
tercile, compared to 49% for the upper tercile. Millet shows the reverse tendency.
Millet accounts for 37% of upper income tercile coarse grain procurement,
compared to 22% and 18% for the middle and lower terciles respectively.
According to consumers, the main reason given for the dominance of sorghum
relative to millet is the lower losses incurred in processing sorghum (Teme and
Boughton, 1993). Maize does not show any consistent trend between income
terciles.
Differences in the proportions of coarse grains and rice in total cereal
procurement between income terciles result in larger differences in calorie
availability than differences in total cereal procurement might suggest. This is due
to processing losses incurred in the preparation of coarse grains for human
consumption. Figure 6.5 shows average calorie availability per adult equivalent by
cereal type for each income tercile. Whereas the low income tercile have 6% less
ce.realsper adult equivalent than the sample average in terms of weight, they have
10.5% less when measured in available calories.
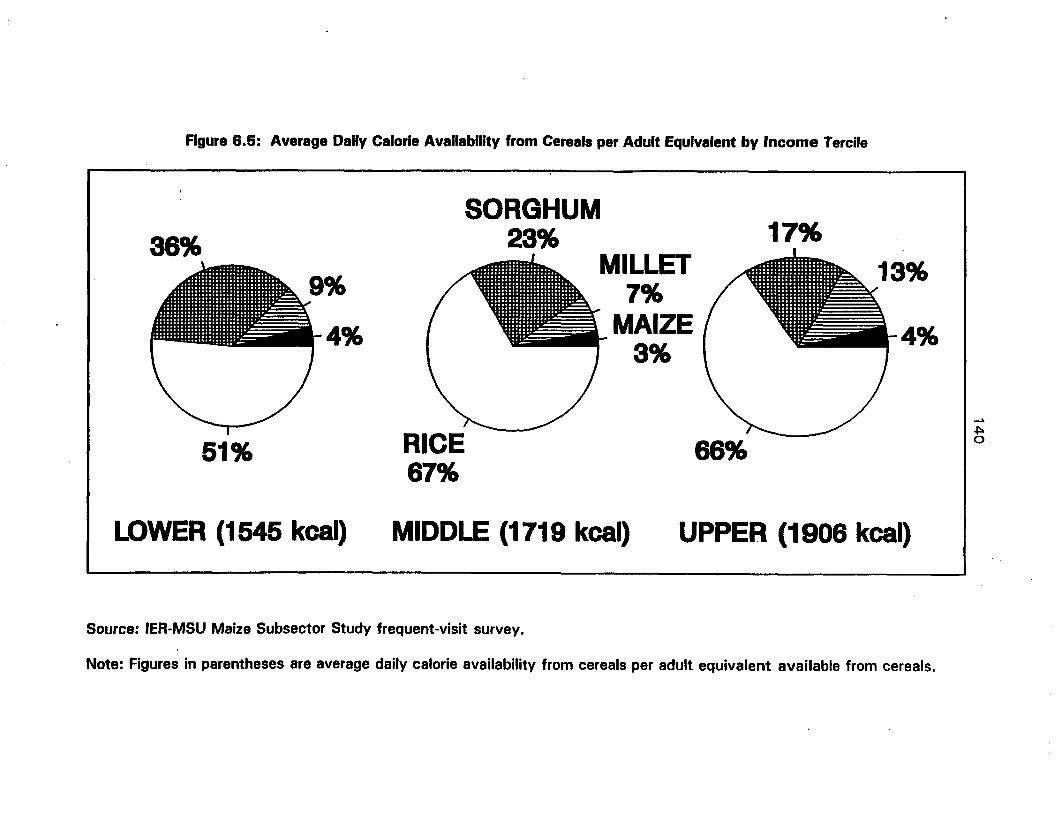
Figure 6.5: Average Dally Calorie Availability from Cereals per Adult Equivalent by Income Terel'e
RICE67%
~
.J:ooo
4%
13%
17%
66%
MILLET7%
MAIZE3%
SORGHUM23%
4%
51%
36%
LOWER (1545 kcal) MIDDLE (1719 kcal) UPPER (1906 kcal)
Source: IER-MSU Maize Subsector Study frequent-visit survey.
Note: Figures in parentheses are average daily calorie availability from cereals per adult equivalent available from cereals.
141
The relative contribution of rice and coarse grains also changes when cereal
procurement is measured in calorie terms. The share of rice in total cereal calorie
availability rises to two thirds for the middle and upper income terciles, and to half
for the lower tercile. Maize falls to 4% for the lower and upper terciles, and 3% for
the middle income tercile.
6.2.3 Form in which coarse grains are procured by season and income
tercile
In order to prepare coarse-grain-based dishes, cereals must first be
processed into flour and/or grits. Households can either purchase cereals in a semi
processed (dehulled) or fully-processed (grits or flour) form in the market, or
purchase unprocessed grain and organize processing at the household level. A very
high proportion of coarse grains are purchased in unprocessed form.
Table 6.4 shows the proportion of different cereals purchased in processed
or unprocessed forms by season and income tercile. Proportions for processed
products are expressed in whole-grain equivalent terms. Average proportions for a
given cereal are weighted by the amount of that cereal procured by each household
in the income tercile. For millet and sorghum, unprocessed and dehulled grains
account for 99% of annual procurement. Other processed products (accounting for
the remaining 1%) are not included in the table.
Looking at year-round procurement for all coarse grains, 91 % are obtained in
unprocessed form. The proportion varies considerably with income. Upper income
tercile households procure double, and lower tercile households half, the sample
averageproportion of cereals in processed form. The proportion also varies

142
Table 6.4: Form of Procurement by Type of Coarse Grain (Percent Each Grain)
Sample COLD SEASON PROCUREMENT (November - February)
Income N Maize Sorghum Millet All CS
Grain Dehull Grits Flour Grain Dehull Grain Dehull Grain Dehull
Lower 38 .87 .01 0 .13 .97 .03 .97 .03 .96 .03
Middle 38 .73 .12 .14 .01 .93 .07 .95 .05 .92 .07
Upper 39 .88 .02 .09 .02 .89 .11 .86 .14 .88 .11
All 115 .83 .04 .06 .07 .94 .06 .93 .07 .93 .06
HOT SEASON PROCUREMENT (March - June)
Income N - '-Maize .Sorghum Millet All CS
Grain Dehull Grits Flour Grain Dehull Grain Dehull Grain Dehull
Lower 37 .82 .02 0 .16 .99 .01 .90 .02 .97 .01
Middle 37 .89 .02 0 .09 .90 .08 .88 .11 .90 .08
Upper 37 .97 .03 0 0 .82 .18 .79 .21 .82 .18
All 111 .91 .025 0 .07 .94 .06 .84 .13 .91 .07
RAINY SEASON PROCUREMENT (July - October)
Income N Maize Sorghum Millet All CG
Grain Dehull Grits Flour Grain Dehull Grain Dehull Grain Dehull
Lower 37 .91 .0 .02 .07 .94 .06 .91 .01 .94 .05
Middle 37 .68 .20 .12 .01 .93 .05 .88 .12 .88 .08
Upper 37 .89 .03 .08 .0 .83 .17 .86 .14 .85 .14
All 111 .82 .08 .07 .03 .92 .07 .88 .11 .90 .08
YEAR ROUND PROCUREMENT
IncQme N Maize Sorghum Millet All CG
Grain Dehull Grits Flour Grain Dehull Grain Dehull Grain Dehull
Lower 38 .88 .01 .01 .10 .97 .03 .94 .02 .96 .03
Middle 38 .73 .15 .10 .02 .92 .06 .91 .09 .90 .08
Upper 39 .91 .03 .06 .01 .85 .15 .83 .17 .85 .15
All 115 .84 .06 .05 .05 .93 .06 .89 .10 .91 .07
Note: 8% of millet procured by low income households in hot season, and 9% in rainyseason, was procured in the form of flour (3.3% year round average).

143
considerably between cereals. Maize has the highest proportion of processed
products at 16%, followed by millet with 12%, and sorghum the smallest at 7%.
This is the reverse order to the total quantity consumed for each cereal.
There is no marked seasonal trend in the procurement of all processed
products. Rather, seasonal effects appear to be cereal- or income tercile-specific.
Demand for processed millet was highest in the hot season, when Ramadan took
place, and particularly high among upper income tercile households. In contrast, no
purchases of maize grits were recorded..during the same.period, compared to 6% of
all maize in the cold season and 7 % in the wet season. Middle income tercile
households purchased the highest proportion of maize in this form. Demand for
maize flour was highest among the lower income tercile, but almost 60% of all
purchases were made by a single household. This indicates the particular difficulty
of drawing inferences about a minor commodity with a .smaJl sample.
The principal conclusions from this analysis are that a very high proportion of
coarse grains are obtained in unprocessed form, and dehulled products account for
the majority of the remainder. As for total quantity and mix of coarse grains,
income appears to play an important role in the form in which coarse grains are
procured. The next section undertakes a quantitative analysis of the role of income
in the demand for coarse grain products.
6.2.4 Engel curve analysis
An Engel curve can be defined as "the relationship between total income and
the quantity-purchased-or-amount-spent 'On a particular food orcommodity group"
(Tomek ·and Robinson, p. 19). In this section we use regression analysis to
:::

144
construct modified Engels curves similar to the procedure used by Kennedy and
Reardon (1993). The dependent variable is the quantity of a given cereal/form
procured in a given season (kg per adult equivalent). As in the previous section,
processed coarse grains are measured in terms of whole grain equivalent. The
independent variables include, in addition to income, the same demographic
variables that will be used in the analysis of flour demand in the next chapter,
together with seasonal dummy variables. Demographic variables include household
size and composition, employment characteristics of the household head, and proxy
variables for the opportunity cost of women's time. A full list of variable names and
definitions is given in Table 6.5.
Since Ordinary least Squares (OlS) regression gives biased estimates when
the dependent variable has zero value for some observations, modified Engels
curves are estimated using maximum likelihood estimation of a standard censored
Tobit mode!." The only exception to this is for rice where, because the product is
consumed by almost all households in all seasons, OlS regression is appropriate.
Models were estimated with and without squared income terms. The decision on
which model to present was based on the value of the Likelihood Ratio test statistic
for the explanatory power of the squared income term, using the .05 level of
significance as a threshold. For OlS estimation of rice, the corresponding F-statistic
was borderline significant and results for models with and without the squared
income term are presented.
11 The statistical structure of the Tobit model, and its application to the demandfor cereal products, is discussed in detail in the next chapter. The reader shouldnote, however, that because of the model's latent variable structure the estimatedcoefficients cannot be directly interpreted as partial effects.

Table 6.5: Variables Included In the Engel Curve Regressions
VARIABLE NAME VARIABLE DEFINITION TYPE UNIT
C Constant
EXPTOTAE Income per ae continuous CFA F/ae
EXPTOTSQ Income per ae squared continuous CFA F
MEANAE Household size continuous ae
MEANAESQ Household size squared continuous ae
FEMRATIO Women ratio proportion
KIDRATIO Child ratio proportion
MAID Domestic employee present dummy Maid employed = 1
FINACT Women with primary cash activity proportion
CHEFSEXE Household head gender dummy Female HH head = 1
REGION Region of origin dummy Sikasso region = 1
CIVSERV Civil servant dummy Household head CS = 1
MILITARY Military dummy HH head military = 1
MILXYAE Military by income interaction CFA F/ae
MILXY2AE Military by income squared interaction CFA F
HOT SEAS Hot season dummy dummy Hot season = 1
WET SEAS Wet season dummy dummy Wet season = 1
-'~U1
146
Regression results are presented in Table 6.6. We look first at the results for
rice, then unprocessed coarse grains, and finally processed coarse grains.
Unlike coefficients estimated using the Tobit model, the OLS estimates for
rice can be interpreted as partial effects. In the model with only a linear income
term, household rice procurement increases by 0.6 kg/ae/season (1.8 kg/ae/year)
for each additional 10,000 CFA Flaelyear increase in household income as
measured by total expenditure. In the model with a quadratic income term, the
corresponding estimate for the linear component of income is 0.816 kg/ae/season
(2.45 kg/ae/year). The quadratic income term itself is not significantly different
from zero, however. The model's additional explanatory power, just significant at
the .05 level, comes from the interaction between squared income and the dummy
variable indicating a household head in the military, which procures rice for
employees and their families. Households where the head is employed in the
military procure 11.3 kg/ae/season more than non-military house,holds.
Tobit regression estimates of the relationship between income and the
procurement of different types of unprocessed coarse grains closely reflects the
earlier empirical description by income tercile. The addition of demographic
variables reveals some striking differences between millet and sorghum, however.
For sorghum the linear income term is negative and highly significant.
Sorghum procurement is positively related to family size (significant at the .01
leven. Procurement is also positively related to employment of a maid, which can
be thought of as putting a ceiling on the opportunity cost of women's time in the

Table 6.6: Modified Engel Curve Regression Results
VARIABLE MAIZE MAIZE MAIZE MILLET MILLET SORGHUM SORGHUM RICE RICEGRAIN DEHULlED GRITS GRAIN DEHULLED GRAIN DEHULLED RZ= .26 RZ= .25
CONSTANT -16.29·" -10.4" -7.969"· 17.92·· -5.111 4.882 0.798 41.31··· 40.24""·
EXPTOTAE 0.045 0.543· 0.095·· 0.617··· 0.815··· -1.148··· 0.122 0.604" 0.816"""
EXPTOTSQ ) tjii ... -0.014 > NA·· ······NA -0.008" 0.0143* >NA •.... 0.003 NA..'." ....
MEANAE 0.348 -0.07 0.443 -0.712 -0.048 2.424*"· -0.231 -2.006*" -1.848"··
MEANAESQ -0.023 -0.015 -0.042 0.016 0.002 -0.497··· 0.005 0.04·"" 0.038"""
FEMRATIO 9.74 -0.958 0.697 -30.85*· -16.3··· 16.732 -15.59·· -19.589·· -24.71··"
KIDRATIO 15.77"· 5.488 4.858" -16.15" -6.618" 8.7187 -4.592 1.369 -1.561
MAID -0.01 -0.407" -0.016 -0.014 -0.005 0.03"" 0.021 -0.001 0.001
FINACT -0.01 0.001 0.778*" 0.015"" 0.007" -0.003 0.013"· 0.001 0.001
CHEFSEXE 1.154 2.16 1.88 -9.831 -1.547 -10.697" 5.495" -4.973 1.15
REGION 0.007 -0.002 -0.001 -0.013 -0.005 3.637" 0.027 0.002 0.001
CIVSERV -1.246 -0.797 -2.134· 2.934 -1.96 6.758" 0.358 -5.175· -2.877
MILITARY~
0.011 87.78"· 2.885 6.973 3.672 0.251 -6.123 11.31" 0.05
MILXYAE 0.039 -92.95·· -3.487 -0.687 -0.99 1.22 0.0893 -1.907 0.838"
MILXAESQ .UNA.L 3.699" .... . NA .. ... NA 0.018 -0.048 ···iN.A .... 0.119·" NA.{ ..............
HOT_SEAS -3.798" -1.177 -3.838"· -1.083 1.198 0.741 0.525 3.123 3.124
WET_SEAS 2.352 1.111 1.345"" -10.86""" -1.416 -3.132 0.92 1.045 1.024
otes:1.Regresslon models are Standard Censored Tobit except rice which is Ols.2.1ncluslon or exclusion of squared Income terms Is based on Likelihood Ratio test.3.For rice, the equivalent F·test Is borderline at the .05 level and therefore specifications with and without squared income terms are reported.4.Coefficients significant at the .01 level are denoted .... ", at the .05 level .... , and at the .10 level ".
-".f:>.'-l

148
household. '2 The small proportion of female-headed households in the sample
procure less sorghum (significant at the .10 level). Households where the head is
from the Sikasso region (sorghum is the region's dominant cereal in area and
production terms) procure more, as do households where the head is employed in
the civil service (both coefficients significant at the .01 level).
Millet procurement patterns stand in sharp contrast to sorghum, despite very
similar market prices during the year. With the exception of seasonal dummy
variables, the sign on most coefficients is reversed from the estimates for sorghum.
The linear income term is positive and highly significant. Whereas sorghum
procurement is positively (but not significantly) related to the proportion of women
in the household, an indicator of the opportunity cost of women's time, millet is
negatively related to the proportion of women and children in the household
(significant at the .05 and .01 levels respectively). This is consistent with the
positive coefficient on the proportion of women in the household with a cash-
earning primary activity (significant at the .01 level). The sharp differences
observed between millet and sorghum raise a warning signal for interpretation of the
results of urban consumption analyses that combine millet and sorghum into a
single dependent variable (e.g., Rogers and Lowdermilk, 1991).
Other than the expected signs on the seasonal dummy, the regression for
unprocessed maize provides few insights. The highly significant coefficient on the
ratio of children in the household may reflect a common belief that maize is more
12 In the last section we estimate the opportunity cost of a maid, generously, at50 CFA F/hour (approximately 0.70 US dollars per day at the post-devaluation rateof exchange).

149
nutritious than other coarse grains, but with such low levels of maize grain
consumption any attempt at inference would be heroic.
The regression results for processed coarse grains lend support to the
hypothesis that demand for processed cereals (including rice) is positively related to
the opportunity cost of women's time (e.g., Kennedy and Reardon, 1993). As in
the case of rice, demand for dehulled millet and sorghum is negatively related to the
proportion of women in the household (significant at the .01 level for millet, and at
the .05 level for sorghum). Kennedy and Reardon argue that the higher the
proportion of women in the household the greater the availability, and hence lower
the opportunity cost, of labor for processing household cereals. Thus a negative
coefficient indicates a positive relationship between opportunity cost of women's
time and purchase of processed cereals that take less time to prepare. 13 Further
evidence in support this relationship is the positive coefficient on the proportion of
women in the household with a primary cash-earning activity (significant at the .05
level for "both millet and sorghum). For dehulled millet the coefficient on the -linear
component of income is positive and highly significant. The coefficient on the
quadratic income component is negative (significant at the .05 level) indicating that
demand eventually peaks and subsequently falls as income progressively rises.
Procurement of processed maize shows similar traits to that of millet and
sorghum, although the small proportion of households with non-zero procurement
suggests a need for caution in regard to inference. The linear income term is
positive (significant at the .05 level for grits, and at the .10 level for dehulled grain).
The proportion of women with a primary cash-earning activity is positive and highly
13 In the last section we show that the preparation of toh from dehulled coarsegrain can be accomplished as quickly as cooked rice.
150
significant for women. Employment of a maid in the household is negatively related
to procurement of dehulled maize (significant at the .05 level). Procurement of
dehulled maize was focussed among military households, a variable which also has
a significant effect on estimated demand for maize flour (chapter 7).
In general, the regression results confirm the role of income observed in the
empirical description of procurement by income tercile. Incorporation of
demographic variables lends support for the hypothesis that the demand for
processed cereals is positively correlated with the opportunity cost of women's time
in the household.
6.3 Cereal consumption patterns: mealtimes and dishes prepared
Households have a choice in the procurement of processing services for
coarse grains. One option is to purchase products with those services already
embedded in the product, as in the case of maize grits. Another option is to
procure whole grain in the market and process it at the household level, buying
some manual or mechanical custom services outside the household for certain
stages (e.g., dehulling, milling). Still another option is to purchase semi-processed
products such as dehulled millet or sorghum in the market, and complete the
remaining processing stages under household supervision.
Whatever option for the provision of processing services households choose
from the available opportunity set, the services necessary are implicit in the choice
of dish. Some coarse-grain-based dishes are flour-based, others are grits-based.
The difference lies in the fineness with which the endosperm is ground. This
section will examine the dishes consumed at different mealtimes in order to derive
151
the proportions in which coarse grains are required in particular forms. This is
important information given that the maize subsector was diagnosed as a thin
market (chapter 4). If demand for a processed maize product is to have a
significan~ impact on broadening the subsector (i.e. increasing the proportion of
farm-level production that is marketed), it must by definition address a volume
rather than a "niche" market.
The analysis proceeds as follows. First, the proportion of each main meal
prepared from different cereals is presented by income tercile. Coarse grains are
dominant at breakfast and dinner. Next the analysis focuses on the coarse grains
group. An overview of the proportion of different coarse-grain-based dishes
prepared from flour and grits is calculated for each type of coarse grain. Flour is
dominant for all coarse grain types. The analysis is disaggregated further to identify
key dishes prepared from grits and flour at different meals, the latter informing the
design of consumer tests of maize flour in the next chapter. The section concludes
with a reflection on the historical emphasis of donor efforts on the promotion of
maize grits.
Table 6.7 presents the percentage of main meals prepared by frequent-visit
survey households from different cereals over a one-year period .by income tercile.
For the sample as a whole, maize and other coarse grains combined represent the
primary source of cereal calories for breakfast and dinner meals, accounting for
61 % and 56% respectively. Taken on its own, maize accounts for-6% ·ofbreBkfBst
meals and 7% of dinner meals. Analysis by income tercile reveals, as expected
from coarse grain procurement, that the share of coarse grains at breakfast and
dinner declines consistently as income rises. Rice is the primary source of cereal
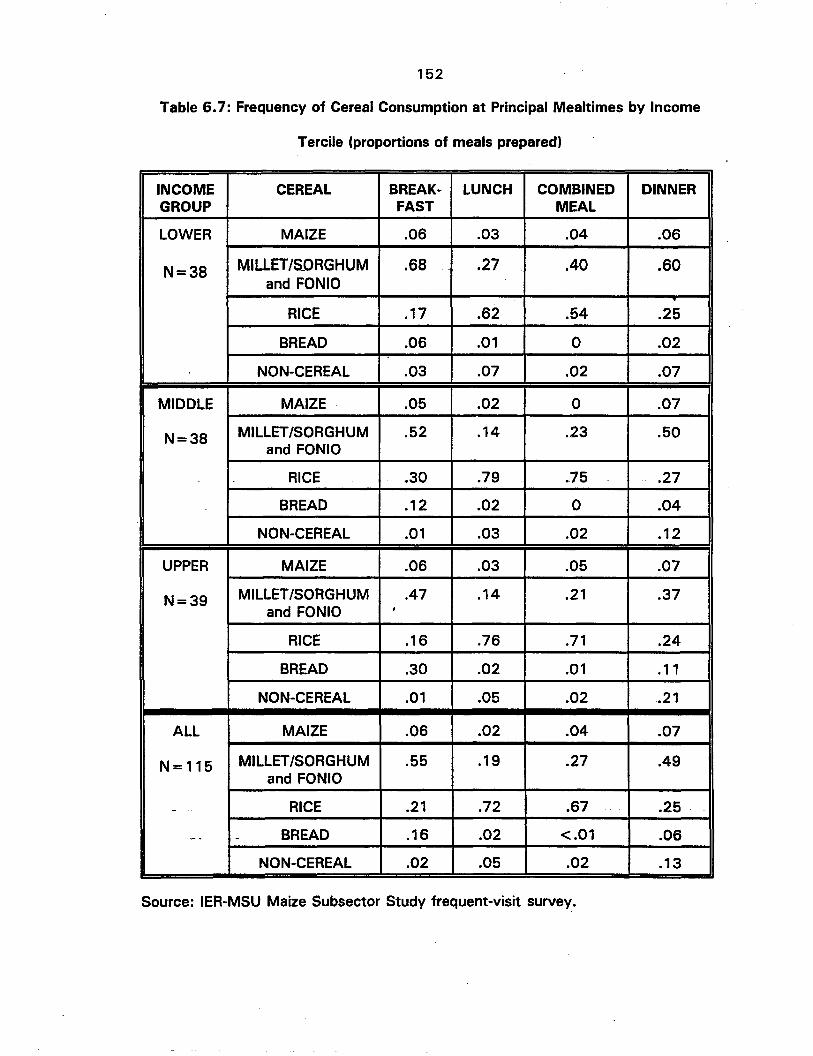
152
Table 6.7: Frequency of Cereal Consumption at Principal Mealtimes by Income
Tercile (proportions of meals prepared)
INCOME CEREAL BREAK- LUNCH COMBINED DINNERGROUP FAST MEAL
LOWER MAIZE .06 .03 .04 .06
N=38 MILLETIS_ORGHUM .68 .27 .40 .60and FONIO
RICE .17 .62 .54 .25
BREAD .06 .01 0 .02
NON-CEREAL .03 .07 .02 .07
MIDDLE MAIZE .05 .02 0 .07
N=38 MILLET'SORGHUM .52 .14 .23 .50and FONIO
RICE .30 .79 .75 .27
BREAD .12 .02 0 .04
NON-CEREAL .01 .03 .02 .12
UPPER MAIZE .06 .03 .05 .07
N=39 MILLET'SORGHUM .47 .14 .21 .37and FONIO •
RICE .16 .76 .71 .24
BREAD .30 .02 .01 .11
NON-CEREAL .01 .05 .02 .21
ALL MAIZE .06 .02 .04 .07
N= 115 MILLET'SORGHUM .55 .19 .27 .49and FONIO
- RICE .21 .72 .67 .25 .
-_.. - BREAD .16 .02 <.01 .06
NON-CEREAL .02 .05 .02 .13
Source: IER-MSU Maize Subsector Study frequent-visit survey.
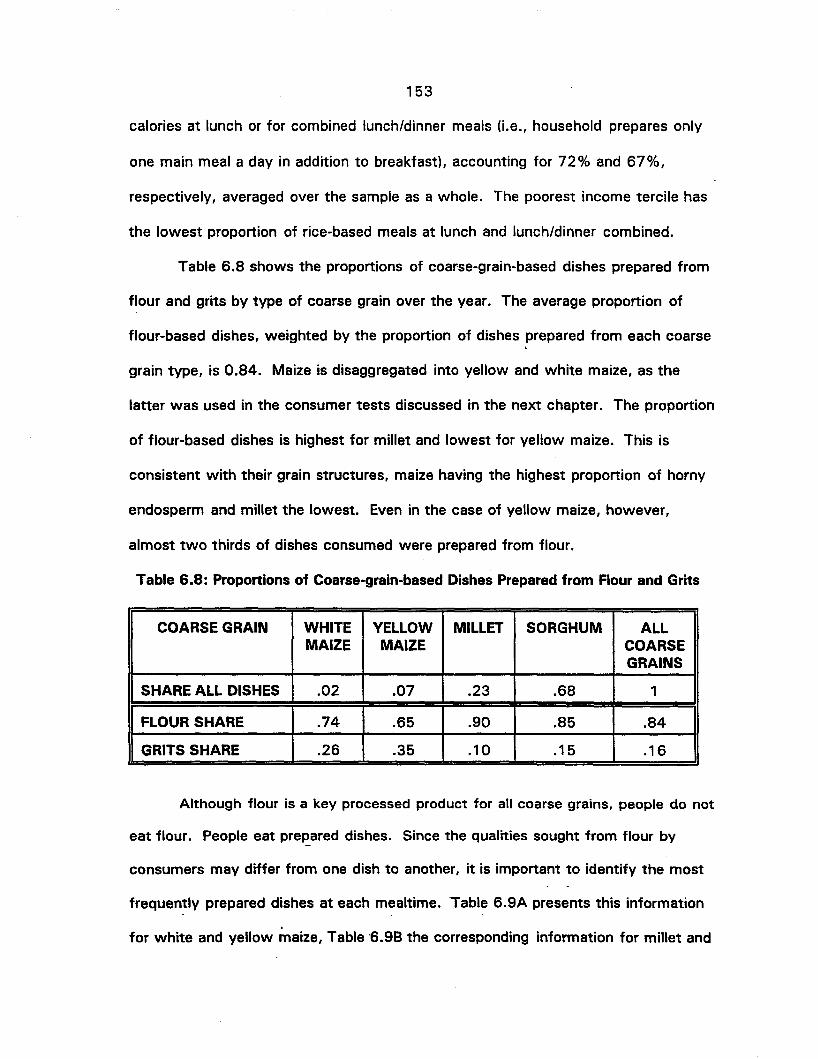
153
calories at lunch or for combined lunch/dinner meals (i.e., household prepares only
one main meal a day in addition to breakfast), accounting for 72% and 67%,
respectively, averaged over the sample as a whole. The poorest income tercile has
the lowest proportion of rice-based meals at lunch and lunch/dinner combined.
Table 6.8 shows the proportions of coarse-grain-based dishes prepared from
flour and grits by type of coarse grain over the year. The average proportion of
flour-based dishes, weighted by the proportion of dishes prepared from each coarse
grain type, is 0.84. Maize is disaggregated into yellow and white maize, as the
latter was used in the consumer tests discussed in the next chapter. The proportion
of flour-based dishes is highest for millet and lowest for yellow maize. This is
consistent with their grain structures, maize having the highest proportion of horny
endosperm and milletthe lowest. Even in the case of yellow maize, however,
almost two thirds of dishes consumed were prepared from flour.
Table 6.8: Proponions of Coarse-grain-based Dishes Prepared from Flour and Grits
COARSE GRAIN WHITE YELLOW MILLET SORGHUM ALLMAIZE MAIZE COARSE
GRAINS
SHARE ALL DISHES .02 .07 .23 .68 1
FLOUR SHARE .74 .65 .90 .85 .84
GRITS SHARE .26 .35 .10 .15 .16
Although flour is a key processed product for all coarse grains, people do not
eat flour. People eat prepared dishes. Since the qualities sought from flour by
consumers may differ from one dish to another, it is important to identify the most
frequently prepared dishes at each mealtime. Table 6.9A presents this information
.for white and yellow maize, Table ·6.9B the corresponding information for millet and

154
sorghum. At breakfast, moni, a thin porridge with small flourballs in it, is the most
common dish for all coarse grain types. At lunch, dinner or combined lunch/dinner,
toh, a thick porridge served as round patties that can be dipped in a sauce, is the
most common dish for all coarse grain types. Couscous, made from small steamed
flourballs, is also frequently consumed at these mealtimes, accounting for up to
19% for millet or sorghum. The concentration of flour use on a few key dishes
greatly facilitates consumer tests.
But if flour is so important, why have past donor efforts focussed on maize
grits? Donors have been attracted by maize grits and parboiled dehulled sorghum as
potential substitutes for higher-priced rice. 14 Grits-based dishes can be made from
either coarse grain grits or broken rice. In Bamako, competition is focused on
"seri", a thicker form of porridge than moni. Rice is virtually never used in Bamako
to make "Nyenye kini", popular in rural areas where rice is more expensive relative
to coarse grains than in Bamako, or other coarse-grain-based dishes prepared from
grits. But rice dominates in the preparation of seri, .accounting for 55 % of seri
dishes consumed at dinner, and 62% of seri dishes consumed at breakfast time.
Although a higher proportion of maize is used for the preparation of seri than other
coarse grains, the small total quantity of maize procured leaves it with a diminutive
market share of only 8% of all seri dishes.
The constraints to successful penetration of the household market for seri by
maize grits appear to be threefold. First, it takes considerably longer to cook maize
grits than rice. Second, because there is always a small proportion of grits in flour
14 In French, the word "brisures" can be used for either coarse grain grits orbroken rice, encouraging the idea that the two are potentially close substitutes.
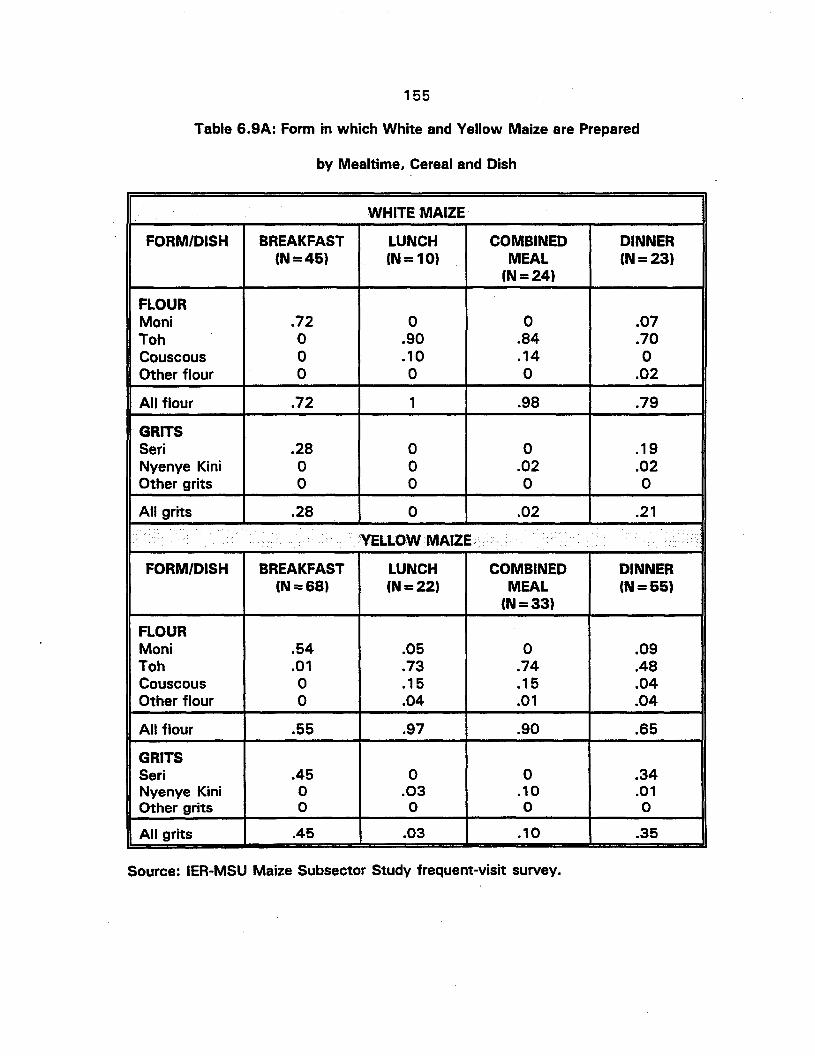
155
Table 6.9A: Form in which White and Yellow Maize are Prepared
by Mealtime, Cereal and Dish
WHITE MAIZE
FORM/DISH BREAKFAST LUNCH COMBINED DINNER(N=45) (N= 10) MEAL (N=23)
(N=24)
FLOURMoni .72 0 0 .07Toh 0 .90 .84 .70Couscous 0 .10 .14 0Other flour 0 0 0 .02
All flour .72 1 .98 .79
GRITSSeri .28 0 0 .19Nyenye Kini 0 0 .02 .02Other grits 0 0 0 0
All grits .28 0 .02 .21..
.... ·'YELLOWMAIZE··· . .. \
FORM/DISH BREAKFAST LUNCH COMBINED DINNER(N=68) (N=22) MEAL (N=55)
(N=33)
FLOURMoni .54 .05 0 .09Toh .01 .73 .74 .48Couscous 0 .15 .15 .04Other flour 0 .04 .01 .04
All flour .55 .97 .90 .65
GRITSSeri .45 0 0 .34Nyenye Kini 0 .03 .10 .01Other grits 0 0 0 0
All grits .45 .03 .10 .35
Source: IER-MSU Maize Subsector Study frequent-visit survey.
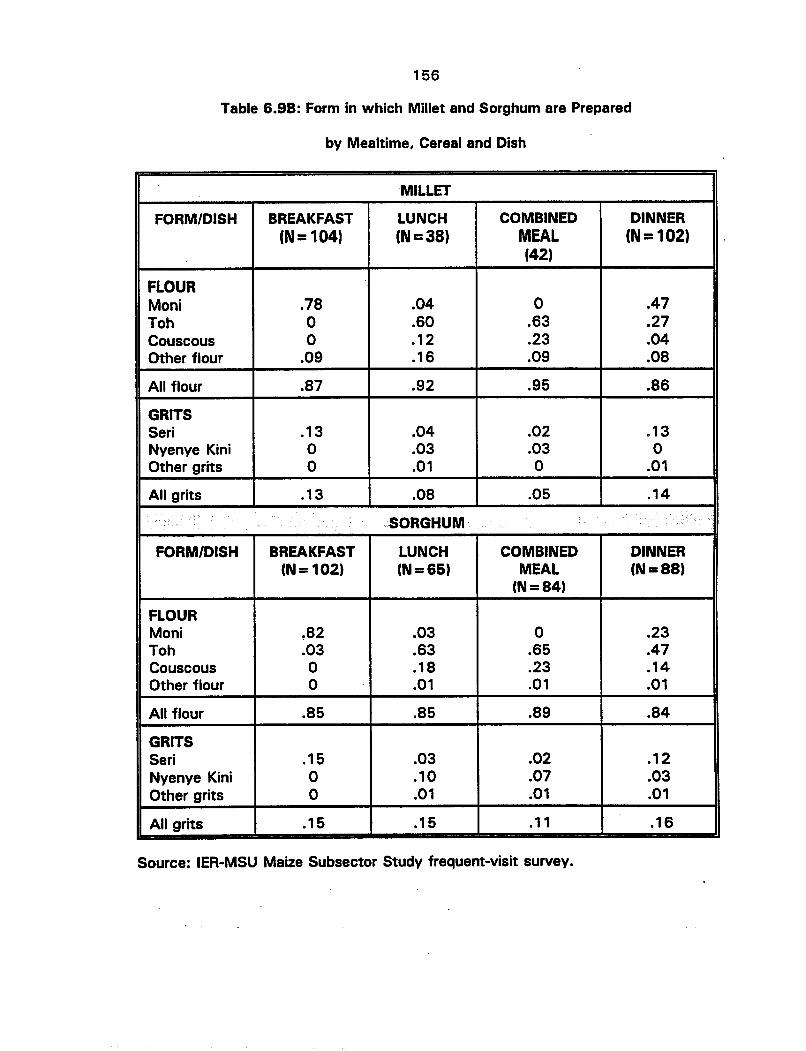
156
Table 6.9B: Form in which Millet and Sorghum are Prepared
by Mealtime, Cereal and Dish
MILLET
FORM/DISH BREAKFAST LUNCH COMBINED DINNER(N= 104) (N=38) MEAL (N= 102)
(42)
FLOURMoni .78 .04 0 .47Toh 0 .60 .63 .27Couscous 0 .12 .23 .04Other flour .09 .16 .09 .08
All flour .87 .92 .95 .86
GRITSSeri .13 .04 .02 .13Nyenye Kini 0 .03 .03 0Other grits 0 .01 0 .01
All grits .13 .08 .05 .14
.SORGHUM ,.. .
FORM/DISH BREAKFAST LUNCH COMBINED DINNER(N= 102) (N=65) MEAL (N=88)
(N=84)
FLOURMoni ~82 .03 0 .23Toh .03 .63 .65 .47Couscous 0 .18 .23 .14Other flour 0 .01 .01 .01
All flour .85 .85 .89 .84
GRITSSeri .15 .03 .02 .12Nyenye Kini 0 .10 .07 .03Other grits 0 .01 .01 .01
All grits .15 .15 .11 .16
Source: IER-MSU Maize SUbsector Study frequent-visit survey.
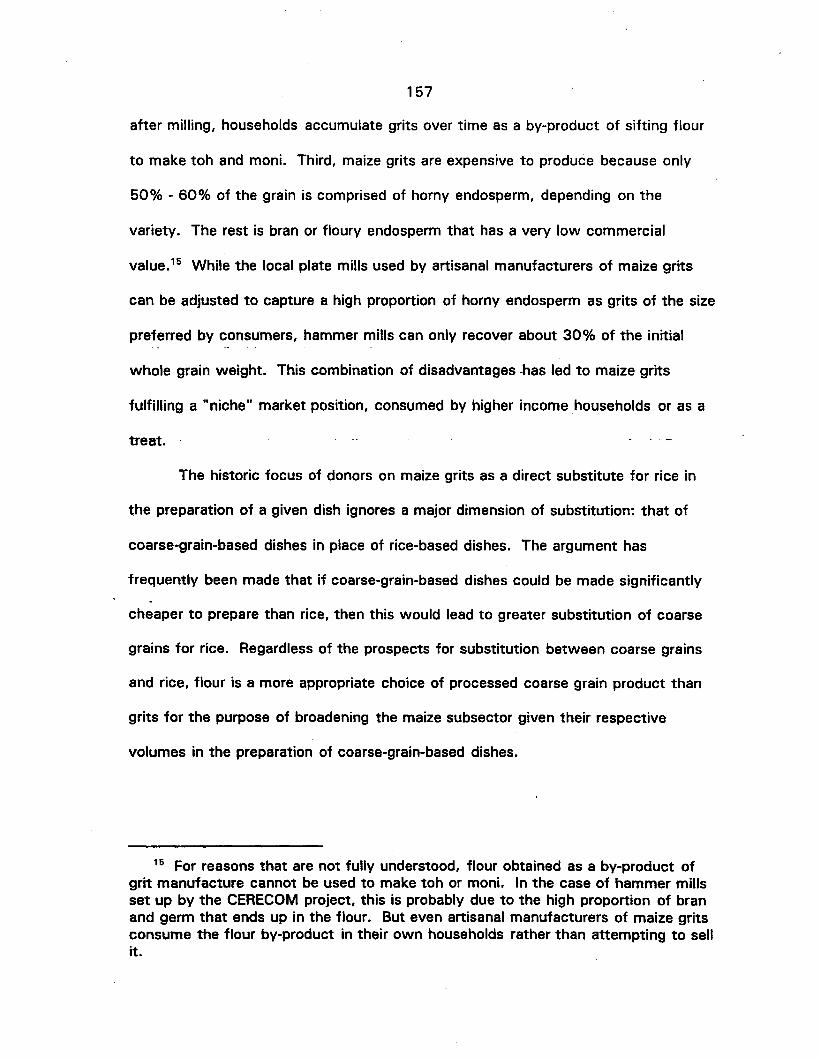
157
after milling, households accumulate grits over time as a by-product of sifting flour
to make toh and moni. Third, maize grits are expensive to produce because only
50% - 60% of the grain is comprised of horny endosperm, depending on the
variety. The rest is bran or floury endosperm that has a very low commercial
value.15 While the local plate mills used by artisanal manufacturers of maize grits
can be adjusted to capture a high proportion of horny endosperm as grits of the size
preferred by consumers, hammer mills can only recover about 30% of the initial
whole grain weight. This combination of disadvafltages -has led to maize grits
fulfilling a "niche" market position, consumed by higher income households or as a
treat.
The historic focus of donors on maize grits as a direct substitute for rice in
the preparation of a given dish ignores a major dimension of substitution: that of
coarse-grain-based dishes in place of rice-based dishes. The argument has
frequently been made that if coarse-grain-based dishes could be made significantly
cheaper to prepare than rice, then this would lead to greater substitution of coarse
grains for rice. Regardless of the prospects for substitution between coarse grains
and rice, flour is a more appropriate choice of processed coarse grain product than
grits for the purpose of broadening the maize subsector given their respective
volumes in the preparation of coarse-grain-based dishes.
15 For reasons that are not fully understood, flour obtained as a by-product ofgrit manufacture cannot be used to make toh or moni. In the case of hammer millsset up by the CERECOM project, this is probably due to the high proportion of branand germ that ends up in the flour. But even artisanal manufacturers of maize gritsconsume the flour by-product in their own households rather than attempting to sellit.
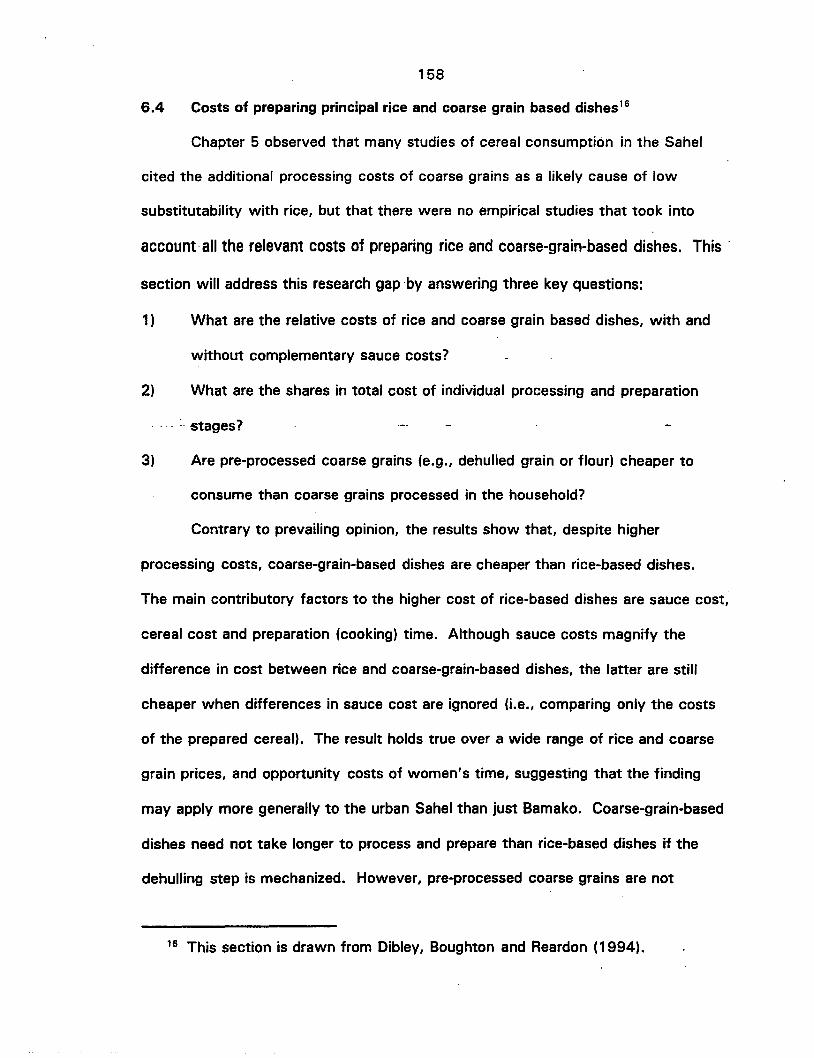
158
6.4 Costs of preparing principal rice and coarse grain based dishes16
Chapter 5 observed that many studies of cereal consumption in the Sahel
cited the additional processing costs of coarse grains as a likely cause of low
substitutability with rice, but that there were no empirical studies that took into
account· all the relevant costs of preparing rice and coarse-grain-based dishes. This'
section will address this research gap by answering three key questions:
1) What are the relative costs of rice and coarse grain based dishes, with and
without complementary sauce costs?
2) What are the shares in total cost of individual processing and preparation
. :- stages?
3) Are pre-processed coarse grains (e.g., dehulled grain or flour) cheaper to
consume than coarse grains processed in the household?
Contrary to prevailing opinion, the results show that, despite higher
processing costs, coarse-grain-based dishes are cheaper than rice-based dishes.
The main contributory factors to the higher cost of rice-based dishes are sauce cost,
cereal cost and preparation (cooking) time. Although sauce costs magnify the
difference in cost between rice and coarse-grain-based dishes, the latter are still
cheaper when differences in sauce cost are ignored (i.e., comparing only the costs
of the prepared cereal). The result holds true over a wide range of rice and coarse
grain prices, and opportunity costs of women's time, suggesting that the finding
may apply more generally to the urban Sahel than just Bamako. Coarse-grain-based
dishes need not take longer to process and prepare than rice-based dishes if the
dehulling step is mechanized. However, pre-processed coarse grains are not
16 This section is drawn from Dibley, Boughton and Reardon (1994).
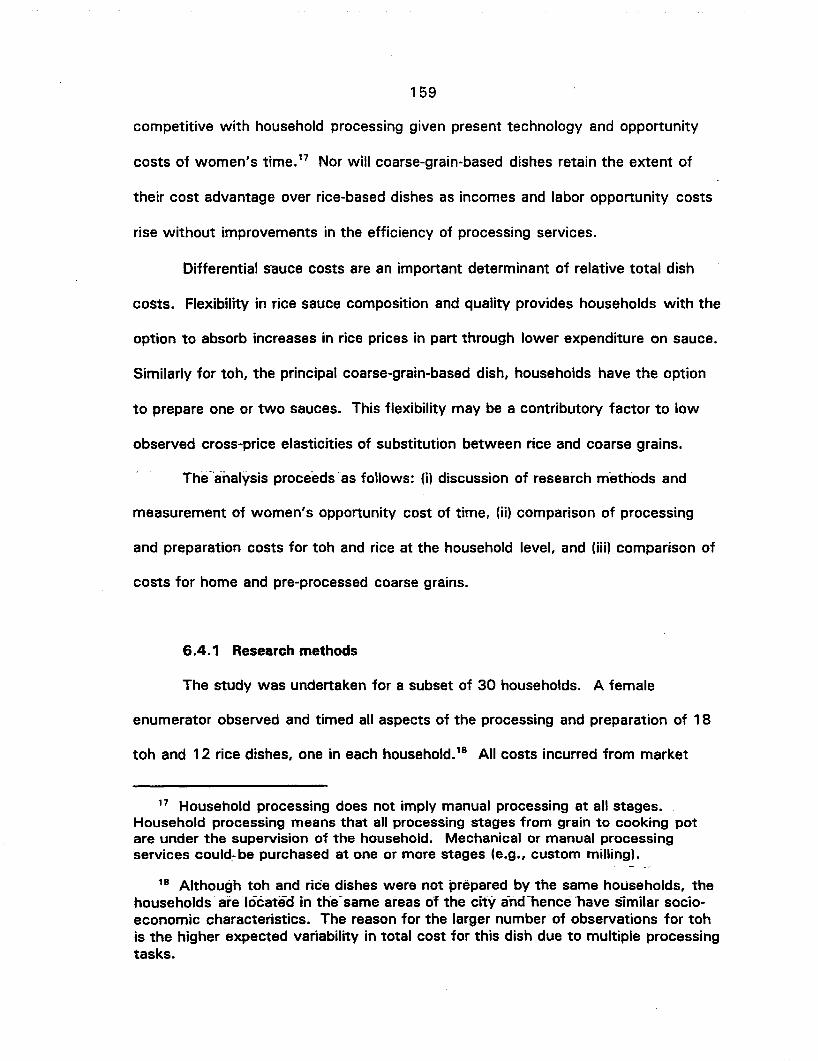
159
competitive with household processing given present technology and opportunity
costs of women's time. 17 Nor will coarse-grain-based dishes retain the extent of
their cost advantage over rice-based dishes as incomes and labor opportunity costs
rise without improvements in the efficiency of processing services.
Differential s"auce costs are an important determinant of relative total dish
costs. Flexibility in rice sauce composition and quality provides households with the
option to absorb increases in rice prices in part through lower expenditure on sauce.
Similarly for toh, the principal coarse-grain-based dish, households have the option
to prepare one or two sauces. This flexibility may be a contributory factor to low
observed cross-price elasticities of substitution between rice and coarse grains.
The-"analysis proceeds "as foJlows: (i) discussion of research m-ethods and
measurement of women's opportunity cost of time, (ii) comparison of processing
and preparation costs for toh and rice at the household level, and (iii) comparison of
costs for home and pre-processed coarse grains.
6.4.1 Research methods
The study was undertaken for a subset of 30 households. A female
enumerator observed and timed all aspects of the processing and preparation of 18
toh and 12 rice dishes, one in each household.18 All costs incurred from market
17 Household processing does not imply manual processing at all stages.Household processing means that all processing stages from grain to cooking potare under the supervision of the household. Mechanical or manual processingservices could"-be purchased at one or more stages (e.g., custom milling).
18 Although toh and rice dishes were not prepared by the same households, thehouseholds are located in the-same areas of the city a-nd-hence"l1ave similar socioeconomic characteristics. The reason for the larger number of observations for tohis the higher expected variability in total cost for this dish due to multiple processingtasks.
160
purchase to final consumption were measured in terms of money and time. These
include the cost of grain, potash,19 sauce ingredients, fuelwood used to prepare
the dish, dehulling, cleaning, milling, sifting, and cooking. Transport costs were
recorded but are ignored in the analysis because all cereals and ingredients are
available in the same local market and hence do not vary by dish. These costs are
grouped into four cost categories for the analysis: cereal, processing, preparation"
and sauce.20 A summary of costs accounted for is given in Table 6.10.
For each dish and component of expenditure the average time or cash outlay
per kilogram of cereal prepared is calculated for the whole sample, weighted by the
quantity of cereal prepared in each household. Labor input (time) per kilo of cereal
prepared is valued at the opportunity cost of women's time (see below). The sauce
consists of a base made from water, tomato paste, onions and seasoning, to which
meat and fish can be added according to the level of the household income. Only
expenditures for the basic sauce are included.
Toh was prepared from sorghum in 10 cases, maize in 6, and millet in 2.
The purchase price and processing costs did not differ widely among the three
cereals.21 Observations on toh prepared from different coarse grains are therefore
19 Potash is used to improve and preserve the consistency of toh, a portion ofwhich may be kept overnight for consumption the following morning.
20 Differences in the amortization of kitchen equipment used to prepare rice andtoh are insignificant and therefore ignored. Additional equipment needed for coarsegrains are a wooden mortar, pestle and sieves. Sieves are replaced annually at acost of 200 CFA F, while a mortar and pestle lasts a minimum of ten years,replaced at 2000 CFA F. Differential amortization amounts to less than one CFA Fper meal.
---21 "Maize must-be soaked for approximately four hours after dehulling and beforethe grain is milled. This does not preclude other activities and hence is not countedas a time cost. Nevertheless, the added inconvenience is one factor limiting morewidespread consumption of maize in urban areas.
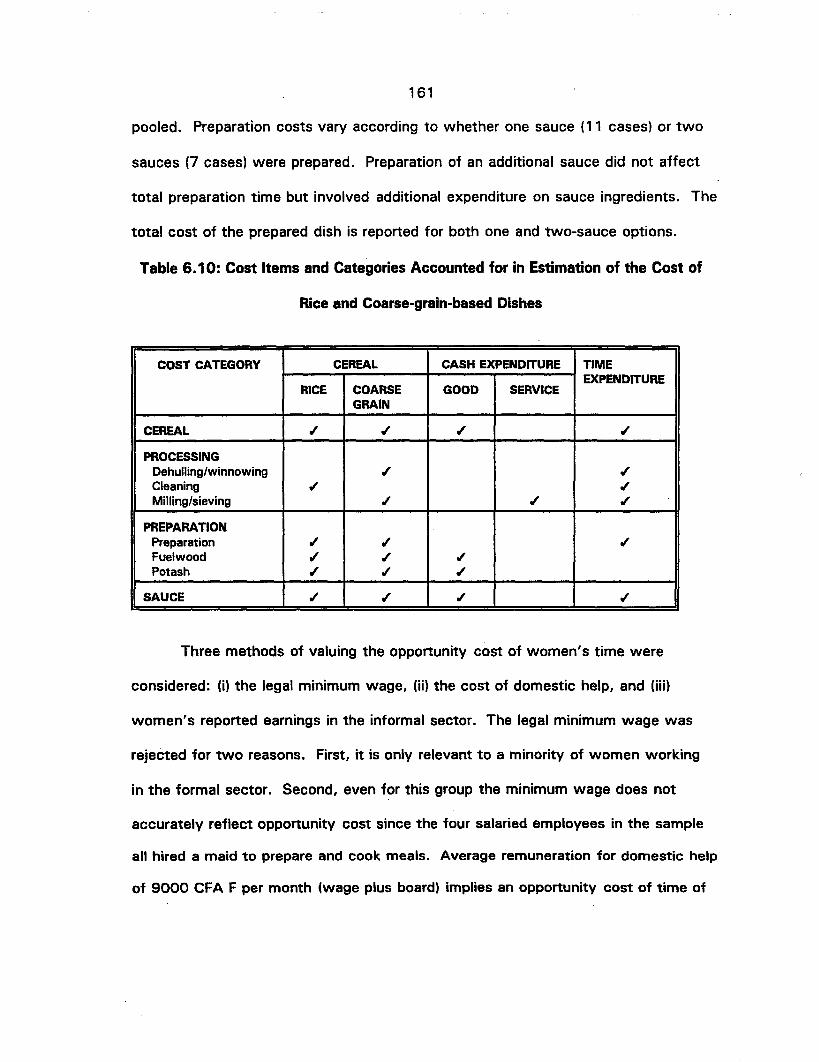
161
pooled. Preparation costs vary according to whether one sauce (11 cases) or two
sauces (7 cases) were prepared. Preparation of an additional sauce did not affect
total preparation time but involved additional expenditure on sauce ingredients. The
total cost of the prepared dish is reported for both one and two-sauce options.
Table 6.10: Cost Items and Categories Accounted for in Estimation of the Cost of
Rice and Coarse-grain-based Dishes
COST CATEGORY CEREAL CASH EXPENDITURE TIMEEXPENDITURE
RICE COARSE GOOD SERVICEGRAIN
CEREAL .t .t .t .t
PROCESSINGDehulling/winnowing .t .tCleaning .t .tMilling/sieving .t .t .t
PREPARATIONPreparation .t .t .tFuelwood .t .t .tPotash .t .t .t
SAUCE .t .t .t .t
Three methods of valuing the opportunity cost of women's time were
considered: (i) the legal minimum wage, (ii) the cost of domestic help, and (iii)
women's reported earnings in the informal sector. The legal minimum wage was
rejected for two reasons. First, it is only relevant to a minority of women working
in the formal sector. Second, even for this group the minimum wage does not
accurately reflect opportunity cost since the four salaried employees in the sample
all hired a maid to prepare and cook meals. Average remuneration for domestic help
of 9000 CFA F per month (wage plus board) implies an opportunity cost of time of
162
50 CFA F per hour. 22 This figure is similar to earnings in the informal sector more
generally. Sample women engaged in petty commerce, for example (the most
common secondary activity), reported an average daily income of 300 CFA F (range
125 CFA F to 500 CFA F). Assuming six hours of commerce daily, the opportunity
cost of time is again 50 CFA F per hour. Thus, whether a maid is hired to prepare
food or whether income from informal sector activities is foregone, an estimate of
50 CFA F/hour seems reasonable.
6.4.2 Processing and preparation costs for coarse grains and rice
The computation of the costs for prepared rice and toh was carried out in
two steps. First, average cash and labor costs per kg of rice or unprocessed coarse
grain were calculated, weighted according to the quantity of cereal prepared by the
household. Second, weighted average costs per kg were converted into costs per
1,000 kcal assuming an energy content of 3630 kcal/kg for rice and 2810 kcal/kg
unprocessed coarse grains (Kelly et al., 1993).23 Figure 6.6 displays the shares in
total dish cost of cereal, processing, preparation and sauce costs for toh and rice.
22 Wages are 4000 CFA F per month. We value board at 200 CFA F per day,the cost of two meals. Assuming 25 days worked per month, the total wage is9000 CFA F per month, or 45 CFA F per hour based on eight hours work per day.We adjust up to 50 CFA F per hour. 9000 CFA F per month is roughly equal toone-third of the minimum wage.
23 The denominator of consumable energy is the most objective basis ofcomparison. Comparing the costs of cooked rice and toh per kilo of raw grainconsumed would ignore the processing losses for coarse grains and underestimatetheir true cost. Comparing the costs of cooked rice and toh per kilo of cookedcereal would be determined in part by relative water absorption rather thannutritional content. The estimate of 2810 kcal/kg of unprocessed coarse grainsincorporates an adjustment for 20% processing losses.
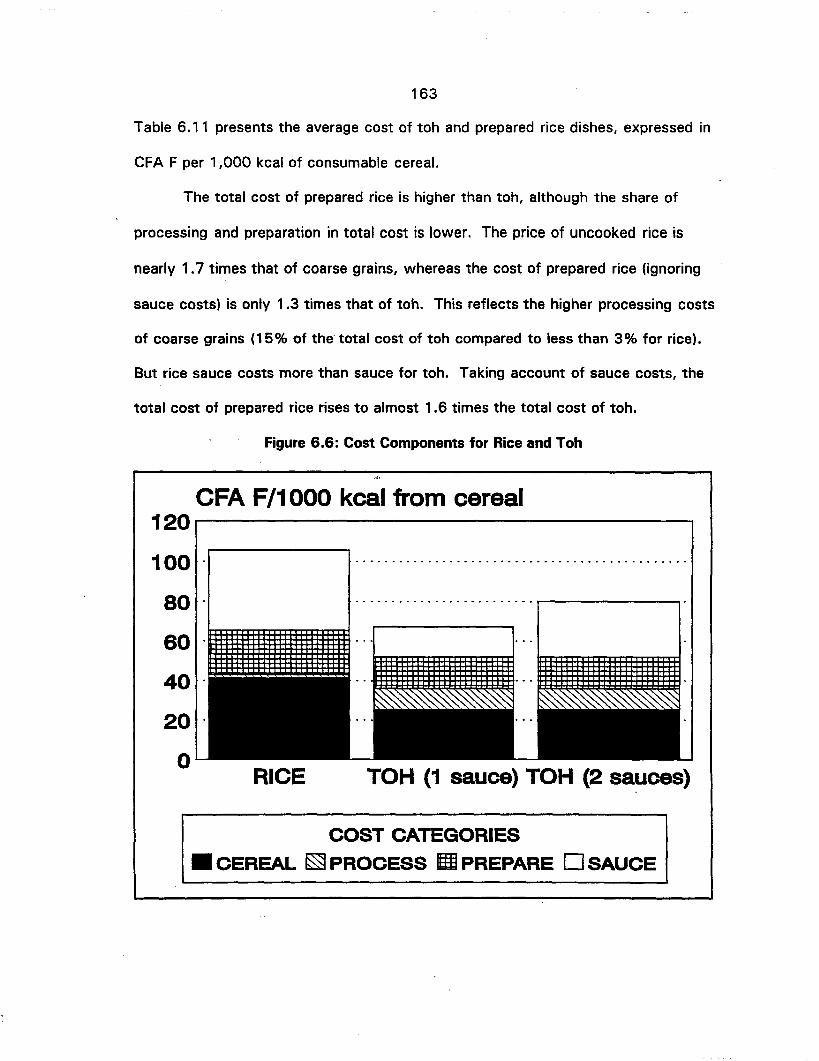
163
Table 6.11 presents the average cost of toh and prepared rice dishes, expressed in
CFA F per 1,000 kcal of consumable cereal.
The total cost of prepared rice is higher than toh, although the share of
processing and preparation in total cost is lower. The price of uncooked rice is
nearly 1.7 times that of coarse grains, whereas the cost of prepared rice (ignoring
sauce costs) is only 1.3 times that of toh. This reflects the higher processing costs
of coarse grains (15% of the total cost of toh compared to less than 3% for rice).
But rice sauce costs more than sauce for toh. Taking account of sauce costs, the
total cost of prepared rice rises to almost 1.6 times the total cost of toh.
Figure 6.6: Cost Components for Rice and Toh
TOH (1 sauce) TOH (2 sauces)
........ '" r-----------------~
RICE
CFA F/1000 kcal from cereal120r------------------~
100
80
60
40
20
o
COST CATEGORIES
• CEREAL ~ PROCESS 1m PREPARE 0 SAUCE

164
Table 6.11: Costs of Prepared Rice and Toh (CFA F/1000 kcal)
Cost Item RICE TOH RICEITOH .(N = 12) (N = 18)
CEREAL COST 41.3 25.3 1.66
PROCESSING COSTSDehulling time 0 3.6Cleaning time 1.6 0.9Milling time 0 2.7Milling cost 0 3.6
SUB-TOTAL PROCESSING COST 1.6 10.7 0.15
PREPARATION COSTSPreparation time 13.1 7.4Fuelwood cost 9.4 7.5Potash cost 0 1.1
SUB-TOTAL PREPARATION COSTS 22.5 16.0 1.41
TOTAL COST PREPARED STAPLE 65.4 51.9 1.26
Sauce cost <r.;: 40.2 15.3 2.63(with optional second toh sauce) 40.2 28.1 1.43
TOTAL COST PREPARED Dish 105.6 67.2 1.56(with optional second toh sauce) 105.6 80.0 1.32
Notes:
1. All costs are converted from CFA F/kg to CFA F/1 ,000 kcal assuming anenergy content of 3630 kcal/kg for rice and 2810 kcal/kg for unprocessedcoarse grains, adjusted for processing losses (Kelly et al., 1993)
2. Costs are based on the following average household labor time (minutes) andcash expenses (CFA F) per kilo of cereal prepared:
RICE TOHCereal purchase price (CFA F) 150 71Milling charges (CFA F) 10Firewood (CFA F) 34 21Potash (CFA F) 3Sauce ingredients (CFA F) 146 432nd toh sauce ingredients (CFA F) - 36Dehulling time (minutes) 12Cleaning time (minutes) 7 3Milling time (minutes) 9Preparation time (minutes) 57 25
3. The large difference between rice and toh in regard to preparation time perkilo is primarily a reflection of the average quantity of cereal prepared (2.1kilos for rice and 3.5 kilos for toh). Also, milling time is deducted frompreparation time for toh to avoid double counting the time cost for taskscarried out concurrently.
165
The finding that prepared rice is more expensive than toh is robust with
respect to sensitivity analyses for changes in the opportunity cost of labor and
relative cereal prices. A doubling of the opportunity cost of labor reduces, but does
not eliminate, the cost disadvantage of prepared rice from 1.26 to 1.21. Halving
the opportunity of labor (appropriate to the availability of unemployed family
members or children for processing tasks) increases the cost disadvantage to 1.31.
Sensitivity analysis for relative cereal prices reveals that prepared rice is
more expensive than toh for all combinations of cereal prices observed during the
period December 1992 to November 1993 (the cereal marketing year). Following
devaluation in January 1994, rice prices in Bamako rose sharply to nearly 200 CFA
F/kg for high quality and 170 CFA F/kg for low quality rice by March. Coarse grain
prices ranged from 70 - 75 CFA F/kg, close to their level at the time of our study
(OPAM/SIM, 1994).
Figure 6.7 illustrates results of the sensitivity analyses graphically. The two
lines represent all combinations of rice and coarse grain prices that equate the cost
of prepared rice and toh (the lower line including, and the upper line excluding sauce
cost). For all combinations of prices above and to the left of a given line, prepared
rice is more expensive than toh. For prices below and to the right, prepared toh is
more expensive than rice. The shaded area above and to the left of the upper line is
the region in which retail prices for rice and coarse grains in Bamako fluctuated
during the 1992/1993 cereal marketing year. The entire area is above and to the
left of the upper line, indicating that at no time in the 1992/1993 cereal marketing
year was prepared rice less expensive than toh, even excluding the higher sauce
costs of rice.
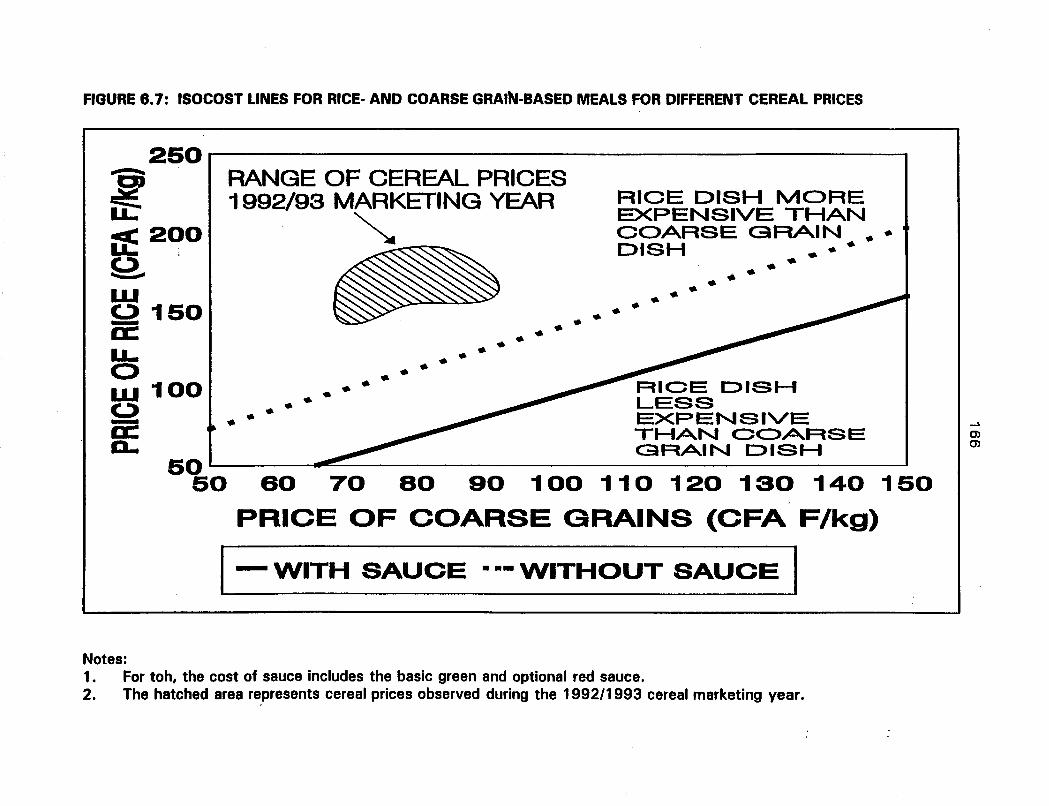
FIGURE 8.7: ISOCOST LINES FOR RICE- AND COARSE GRAI"-BASED MEALS FOR DIFFERENT CEREAL PRICES
~
0)0)
RIOE DISHLESSEXPENSIVETHAN OC>A.RSEGRAIN DISH
RANGE OF CEREAL PRICES1992/93 MARKETING YEAR
~~
-
RICE DISH MOREEXPENSIVE THANCOARSE GRAIN .. "DISH .....
• •.. .... ... .... ... .... .... .... ... ... .... .... ... ... ..50' ..........- '
50 60 70 80 90 100 110 120 130 140 150
PRICE OF COARSE GRAINS (CFA F/kg)
1-WITH SAUCE ••• WITHOUT SAUCE I
260 rl ----------------------------.____ I
~~
~200u.;;;; .O·.............w(.) 160-II:LIow 100(.)-a:D...
Notes:1. For toh, the cost of sauce includes the basic green and optional red sauce.2. The hatched area represents cereal prices observed during the 1992/1993 cereal marketing year.
167
The wide difference between the two lines reflects the difference in the cost
of ingredients for the base sauce. The sauce for rice dishes was generally richer
(inclusion of oil, peanut butter, tomato concentrate), and the quantity prepared
greater, than sauce for toh. Households can vary the quality of sauces, and this
provides an option to keep the relative cost of rice and coarse grain based dishes
stable· in the face of fluctuating relative cereal prices, contributing to low
substitutability between rice and coarse grains.
A "snapshot" of the costs of rice and coarse-grain-based dishes at a
particular point in time is not sufficient to explain the secular decline in consumption
of traditional cereals in the urban environment over the past two decades, but it
does challenge the notion that processing costs for coarse grains offset the lower
price of unprocessed coarse grains compared to rice. Although the present cost
advantage of prepared coarse grains is unlikely to be reversed by rising opportunity
costs of women's time in the short run, it will be gradually eroded unless processing
costs can be reduced. This leads us to examine the competitiveness of pre
processed versus household processing of coarse grains under varying opportunity
costs of women's time.
6.4.3 Cost competitiveness of processed and unprocessed coarse grains
Table 6.12 presents the cost of toh prepared from home and pre-processed
coarse grains. Two pre-processed products are included in the analysis: grain
purchased in dehulled form and grains purchased in the form of flour. Purchasing
grain in dehulled form enables the consumer to avoid the time and processing losses
incurred in dehulling and cleaning. Purchasing flour enables the consumer to avoid
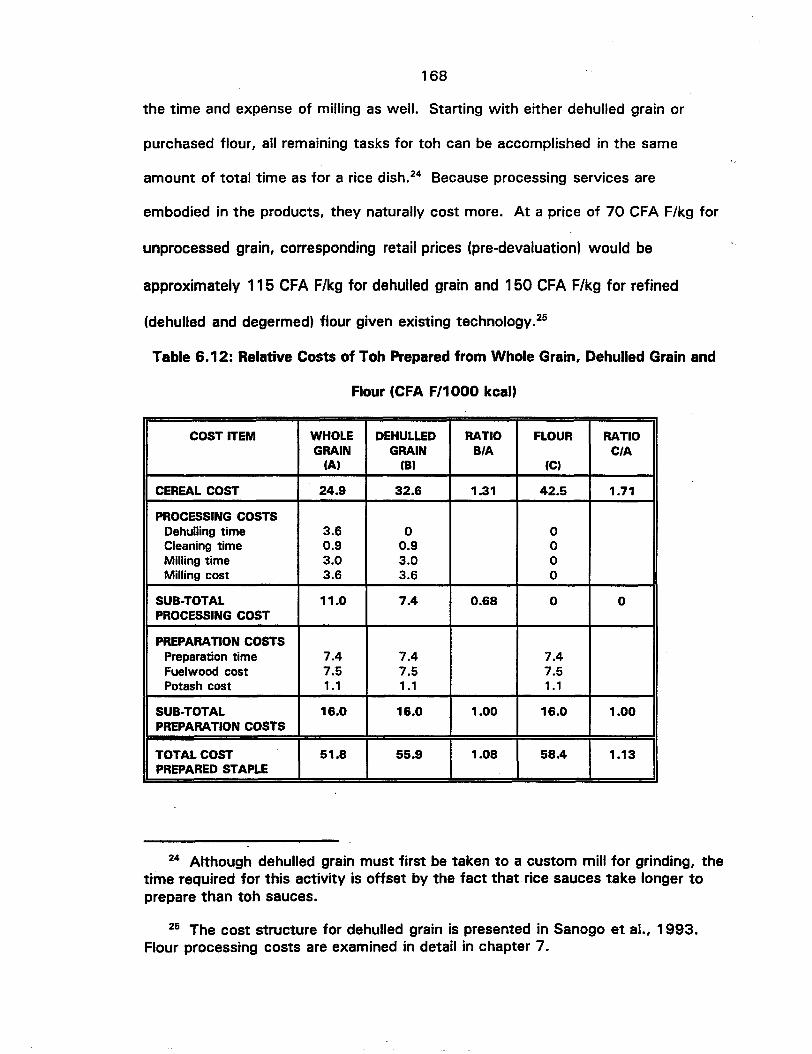
168
the time and expense of milling as well. Starting with either dehulled grain or
purchased flour, all remaining tasks for toh can be accomplished in the same
amount of total time as for a rice dish.24 Because processing services are
embodied in the products, they naturally cost more. At a price of 70 CFA F/kg for
unprocessed grain, corresponding retail prices (pre-devaluation) would be
approximately 115 CFA F/kg for dehulled grain and 150 CFA F/kg for refined
(dehulled and degermed) flour given existing technology.25
Table 6.12: Relative Costs of Toh Prepared from Whole Grain, Dehulled Grain and
Flour (CFA F/1000 kcal)
COST ITEM WHOLE DEHULLED RATIO FLOUR RATIOGRAIN GRAIN BIA CIA
fA) fB) fC)
CEREAL COST 24.9 32.6 1.31 42.5 1.71
PROCESSING COSTSDehulling time 3.6 0 0Cleaning time 0.9 0.9 0Milling time 3.0 3.0 0Milling cost 3.6 3.6 0
SUB-TOTAL 11.0 7.4 0.68 0 0PROCESSING COST
PREPARATION COSTSPreparation time 7.4 7.4 7.4Fuelwood cost 7.5 7.5 7.5Potash cost 1.1 1.1 1.1
SUB-TOTAL 16.0 16.0 1.00 16.0 1.00PREPARATION COSTS
TOTAL COST 51.8 55.9 1.08 58.4 1.13PREPARED STAPLE
24 Although dehulled grain must first be taken to a custom mill for grinding, thetime required for this activity is offset by the fact that rice sauces take longer toprepare than toh sauces.
25 The cost structure for dehulled grain is presented in Sanogo et al., 1993.Flour processing costs are examined in detail in chapter 7.
169
At the estimated opportunity cost of women's time (50 CFA F/hour), toh
prepared from grain purchased in dehulled form is 8%, and from purchased flour
13 %, more expensive than toh prepared from home-processed grain (bottom line of
Table 6.12). At a lower opportunity cost of 25 CFA F/hour for women's time
(applicable to families with unemployed members or children available to perform
processing tasks), toh prepared from grain purchased in dehulled form is 13% more
expensive, and from purchased flour 23% more expensive, than toh prepared from
home-processed grain. The opportunity cost of labor would have to rise to 100
CFA F/hour for grain purchased in dehulled form to become competitive with home
processed grain given existing dehulling technology.26
Three conclusions can be drawn from this analysis. First, pre-processed
coarse grains are not competitive with household processing at the prevailing
opportunity cost of women's time. Second, pre-processed coarse grains will
become more attractive compared to household processing of coarse grains as the
opportunity cost of women's time increases. Third, assuming constant relative
prices for rice and coarse grains, the cost advantage of coarse-grain-based dishes
will be eroded as the opportunity cost of women's time rises unless there are
improvements in the efficiency of coarse grain processing services.
Achieving reductions in the cost of coarse grain processing services is
important if the urban market share of coarse grains is to be maintained in the
medium to long run. Sanogo et al. (1993) estimated that costs savings of 10% in
the provision of dehulling services are possible through technological innovation and
26 Given generally higher incomes in urban areas, this finding is consistent withthat of a 1991 study of coarse grain processing in rural areas of Mali which foundthat milling charges were three times the opportunity cost of women's-time (Fischeret ai., 1992).
170
changes in market organization. 27 Analyses presented in'the next chapter indicate
that the only opportunity to significantly reduce the cost of flour in the near term is
through the use of whole grain maize (which avoids the cost of dehulling and has a
98% extraction rate). Although presently used only in exceptional circumstances in
Mali, this product is gaining widespread acceptance in urban areas of southern and .,
eastern Africa (Jayne and Rubey, 1993; Mukumbu and Jayne, 1994). It was
therefore included in the consumer tests of maize flour presented in the next
chapter.
27 Holtzman et a!. (1991) recommend the promotion of more efficient abrasivedisc dehullers in place of Engleberg dehullers (designed for rice). 5anogo et a!.(1993) further advocate the re-Iocation of dehulling services to the wholesalerinstead of retail level to save on transport and energy costs, and permit moreeffective utilization of by-products for livestock feed.
CHAPTER SEVEN
URBAN DEMAND FOR COARSE GRAIN PROCESSING SERVICES: THE POTENTIAL
DEMAND FOR MAIZE FLOUR IN BAMAKO
Chapter 4 discussed how development of the maize subsector could
contribute to improved food security in both the short and the long run. In addition,
demand-led expansion in the form of processed products would contribute to
accelerated agricultural sector transformation and economic growth. Chapters 5
and 6 presented the methods and results of surveys of current cereal utilization
patterns among urban households, the main source of potential demand for
processed cereal products. These surveys reveal that most coarse-grain-based
dishes require flour, yet cereals are purchased in raw form. Only very small
quantities of coarse grains are purchased in dehulled form or as flour.
This chapter will estimate potential demand for maize flours of different
quality, derive demand schedules, and compare them to estimates of retail prices
based on existing processing technologies. The chapter proceeds as follows. The
first section justifies the choice of the contingent valuation approach. Section 7.2
describes how the approach was implemented in collaboration with potential maize
processors and urban households. The first part of 7.2 describes existing firms that
could be potential sources of maize flour, and the estimated costs of flour using
alternative technologies. The second part describes the household test procedure
and the results of housewives' qualitative evaluation of alternative flours. Section
7.3 presents a set of hypotheses relevant to maize flour demand, and specifies an
econometric model. Section 7.4 derives demand schedules for dehulled and whole
grain flour using the results of the econometric model, and computes price and
171

172
income elasticities of demand. The final section estimates aggregate maize flour
demand for the District of Bamako and, in view of the high cost of flour relative to
the opportunity cost of women's time, briefly reviews opportunities for encouraging
the market in dehulled grains as an intermediate product.
7.1 Approaches to the estimation of potential demand for maize flour
The problem faced by the study is how to estimate the demand for a product
not currently available in the marketplace, and hence for which cross-section and/or
time series data on quantities purchased at different prices by households with
different income and demographic characteristics are unavailable. Approaches to
this problem have been developed separately by economists and business schools.
Approaches developed by business schools have focussed primarily on
markets for private goods. One of the most frequently used tools is conjoint
analysis (Green and Wind, 1975; Louviere, 1988). Conjoint analysis is used to
estimate consumer's willingness to pay for particular product attributes (e.g.,
quality, size, safety). Consumers are presented with a product available with
different attribute combinations, such as a car with two doors, four doors or a
station wagon, and with a large or a small engine. Each of these attribute
combinations is listed with several prices. Consumers are asked to rank a list of N
attribute combinations by M prices in order of preference. The consumer will
obviously start with the preferred attribute combination at the lowest price and end
with the least preferred combination at the highest price. Intermediate rankings will
involve a compromise between attribute combination and price. Algorithms are
173
applied to rankings supplied by a sample of consumers to estimate the average
value of an attribute to the consumer group in question.
Conjoint analysis is usually applied where consumers have some familiarity
with the basic product, often a durable good. Thus, they are being asked to value
some incremental utility from the services provided. The approach is appealing for
business applications because the (incremental) attribute value can be compared
directly to the (marginal) cost of supplying it. The approach is also valuable for
identifying relevant consumer target groups in designing marketing strategies.
Approaches developed by economists have focussed primarily on the
demand for public goods and services. The two principal methods used by
economists are hedonic pricing and contingent valuation (Hoehn and Krieger, 1988).
Hedonic pricing involves estimation of the value of a good or service by
aggregating the values of the attributes embodied in it (Senauer et a!., 1991). The
values of these attributes are derived from their value embodied in other goods or
services. For the purpose of estimating maize flour demand in urban Mali, hedonic
pricing is not feasible because attributes do not exist in alternative products used
for the same purpose. 1
Contingent valuation (CV) involves estimation of the value of a good or
service on the basis of individuals' willingness to pay for, or not to lose, a good or
Wheat flour is available, but virtually all of it is sold to bakers for bread.Cases where wheat flour was used to prepare principal household meals wereextremely rare, although it can be used to prepare couscous (couscous marocain).As reported in the next section, however, couscous is the least technicallydemanding meal to prepare "and can even be made from dehulling residues. Even ifwheat flour were used widely to prepare household meals, it would be difficult tovalue the convenience attribute because of price distortions (the Grands Moulins duMali (GMM) obtains most of its wheat in the form of commodity aid from"'the USA,Canada and France, and until recently benefitted from high external tariffs onimported flour).
174
service. Willingness to pay can be estimated on the basis of individuals' self
reports, observations of what resources they currently give up to obtain a good
(e.g., travel and/or costs), or some combination of these methods. The principal
difficulty when asking consumers or potential consumers to express their
willingness to pay is how to verify the accuracy of such responses. The two
principal sources of inaccuracy are cognitive difficulties encountered by respondents
in giving an accurate response to a hypothetical situation, and strategic bias (lying).
The extent of inaccuracy due to these sources can vary considerably depending on
the nature of the good or service being valued and the way the CV experiment is
structured (Mitchell and Carson, 1991):
Although conjoint analysis is intuitively appealing because of its extensive
application to private goods markets, the contingent valuation approach has been
selected because it can generate the data necessary to calculate price and income
elasticities relevant to the proposed hypotheses and potential demand estimates.
The way in which the CV experiment was structured to minimize inaccuracy is
discussed in the next section.
7.2 Operationalizing the contingent valuation method: manufacture and
household tests of maize flours in Bamako
The in-depth maize subsector research proposal called for IER food
technologists and economists to work with urban consumers and potential maize
processors to develop technologically feasible and financially viable products (i.e.,
products adapted to consumer preferences and for which they would be willing to
pay a price in excess of the costs of manufacture and distribution). Wefirst

175
describe potential maize processing firms and the costs of production for alternative
technologies. Second, we describe the development of household testing
procedures and housewives' evaluation of alternative flours in terms of their
suitability for different dishes.
7.2.1 Collaboration with potential maize processors
Two potential private-sector maize processors currently operate
in or near Bamako: the Grands Moulins du Mali (GMM) and a groupement d'interet
economique (GIE) operating under the trade name of SAMA.2 Both potential
collaborators had limitations due to technological scale and versatility, respectively.
The principal activities of GMM are wheat milling and rice dehulling. GMM
has the only wheat mill in Mali, and has historically benefitted from high import
tariffs on imported wheat flour on the one hand and monopsony purchase of
commodity aid wheat from the USA, Canada and France on the other.3 GMM also
has the technical capacity to produce dehulled and degermed grits of a range of
sizes (including coarse and fine flour) from maize, millet and sorghum. An attempt
to market maize flour in 1986 failed because of the use of poor quality maize (old
imported food aid stock). Malian maize, which is considered to be of high quality
2 A groupement d'interet economique is a form of cooperative.
3 GMM's margins on wheat flour milling have been squeezed in recent yearsthrough the reduction of external tariffs on wheat flour, illegal imports of wheatflour from Mauritania, and most recently by coordinated selling of commodity aidwheat by donors. When Canadian commodity aid wheat flour was auctioned byOPAM in late 1993, GMM shut down its wheat milling operations and laid off mostof its employees for a week to bring pressure on the government (Le ReDublicain,December 1st, 1993). This continuing squeeze on historically fat milling margins, inexcess of the average farm-gate price of maize, has made GMM management morereceptive to new possibilities such as maize flour. .
176
by the chief miller of GMM, has never been processed by this state-of-the-art plant.
Neither has millet or sorghum.4
The principal drawback to market testing of GMM products is the minimum
quantity of maize that must be processed. Because the equipment has been idle for
so long, it would be necessary to process at least ten tons in order to ensure a
clean, uniform set of processed products. The team considered the financial and
logistical hurdles too great and decided to "simulate" the GMM product range using
food aid cornmeal. If consumer evaluation of this simulated product range
suggested that processing by GMM could be profitable, then a market test using the
necessary quantity of raw material could be proposed as a follow-on activity to the
maize subsector study. Unfortunately, all stocks of food aid cornmeal were
exhausted and the closest substitute that could be found was dehulled (but not
degermed) flour manufactured by SAMA.
SAMA started out as a groupement d'interet economique (GIE) that
marketed processed maize products in Bamako supplied by ten small-scale hammer
mills set up in rural areas by the CERECOM project. The mills had been set up with
heavy subsidies to provide farmers with additional market opportunities for maize
following the liberalization of cereal markets in 1986. The products included
medium and small grits, and flour obtained as a by-product of grit manufacture.
SAMA began to process its own products in Bamako using equipment loaned by
4 GMM was obliged to install coarse grain milling equipment together with thewheat mill by the Malian 'government, which has underwritten GMM's capital debt.GMM management had no ~nterest in, or intention to use, this equipment at thetime.
177
CERECOM after experiencing a number of shortages of stocks due to village mill
liquidity and pricing problems. 5
Only the medium-sized grits used to make "seri", a porridge eaten for
breakfast or as a desert, found a ready market.6 The flour obtained as a byproduct
of grit manufacture proved very difficult to sell, and often became rancid in store
(Holtzman et aI., 1991). The scope for improving existing SAMA products is limited
by the processing equipment available to the GIE. Due to the non-spherical shape
of the maize grain, the abrasive disk dehuller cannot remove a high proportion of
either pericarp or germ without also losing a high proportion of endosperm, resulting
in a low yield of marketable product. The hammer mill produces grits in a range of
sizes, with little flexibility for increasing the proportion of grits of the preferred size.
Only a radical change in the type of equipment used could overcome these
constraints (e.g., introduction of roller mill and degermer), the same kind of
equipment already available, but not utilized, at GMM. It appeared unlikely that
SAMA, assuming a market for products made from improved equipment could be
successfully developed, would be able to survive competition from GMM once the
latter decided to enter the market.
5 Village mills provided SAMA with processed products at fixed prices. If localgrain maize prices rose above a certain level, the mills had to stop processing inorder to avoid financial losses. The mills had neither the liquidity nor the storagecapacity to purchase an entire year's stock at harvest time when prices aregenerally lower (B.Go·ita, personal communication). The reason for the fixedprocessed product price policy is not clear.
6 Even in the relatively small market for medium-sized grits, SAMA faced stiffcompetition from artisanal manufacturers who produce a bright, clean product byselecting hard endosperm yellow maize kernels and repeatedly washing and sievingthe product during processing.
178
Three avenues of collaboration with SAMA were feasible given the existing
equipment. These were:
1) identify possibilities for improving the quality and marketability of flour
obtained as a by-product of grit manufacture;
2) contrast consumer evaluation of flour obtained as a by-product of grit
manufacture with flour obtained as a primary product from dehulled grains;7
3) assess whether there is a market niche for flour obtained from whole grains.
7.2.2 Costs of maize flour processing with alternative technologies
The main components of flour cost are raw material (grain), transport of
grain to the site of processing, fixed and variable processing costs, cleaning and
processing losses (adjusted for the value of any marketable by-products), and retail
distribution. The total cost for any given process can vary widely depending on the
assumptions made for each component. For refined flour (dehulled and degermed),
cost estimates were developed in collaboration with GMM's accountant. For
dehulled and whole grain flour produced with a hammer mill, estimates are based on
Mali-specific secondary sources (Holtzman et aI., 1991; Ashraf, 1992; Freud and Le
Moigne, 1992).
a) Grands Moulins du Mali (industrial mill)
Table 7.1 presents pre- and post-devaluation estimated costs of refined
maize flour at retail level. Cost estimates are based on three alternative prices for
grain maize and the following scenarios: with and without overhead costs and value
7 This idea was first proposed by Holtzman et al.; 1991, in their study ofopportunities to expand coarse grain utilization with a focus on urban consumption.

179
added tax (VAT), large (50kg) and small (5kg) packaging options, and two levels of
milling efficiency (75% and 80% yield).8 Fixed parameters include 3% cleaning
losses, a 10% net margin for GMM and a 15% gross margin for the retailer (a
detailed breakdown of these calculations can be found in appendix 3). In the body
of the table, underlined figures indicate scenarios within the range of prices used in
the contingent valuation questionnaire.
Flour costs are sensitive to the cost of raw material. A 10 CFA F/kg
increase in the price of maize results in a 20 CFA F/kg increase in the price of flour.
Costs of flour are also sensitive to the type of packaging. Small packages increase
the retail price of flour by roughly 10 CFA F/kg before and 15 CFA F/kg afteY -
devaluation. Improvements in milling efficiency bring price reductions roughly
proportionate to the gain in flour yield, but the scope for improvement is limited to
around 5% without noticeably altering the quality of the product.
It should be possible to persuade the government to rescind value added tax
(VAT) on maize processing for two reasons. First, the government has already
done so for rice dehulling to promote the use of locally produced rice. Thus there is
a precedent for suspending a tax to promote domestic cereal production and
consumption. Second, the tax is generating no revenue anyway at the present
time, so there would be no revenue loss in the short run. GMM would be willing to
ignore overhead costs in the short run, since these are joint with wheat milling and
rice dehulling activities. Theoretically, it should also be willing to overlook
- 8 - Overhead costs refer to administrative costs that are joint with other activitiessuch as wheat milling and rice dehulling (e.g., management salaries and benefits,office rents and electricity, property taxes). Depreciation on equipment specific tothe maize processing line is a separate cost item (see appendix 3).
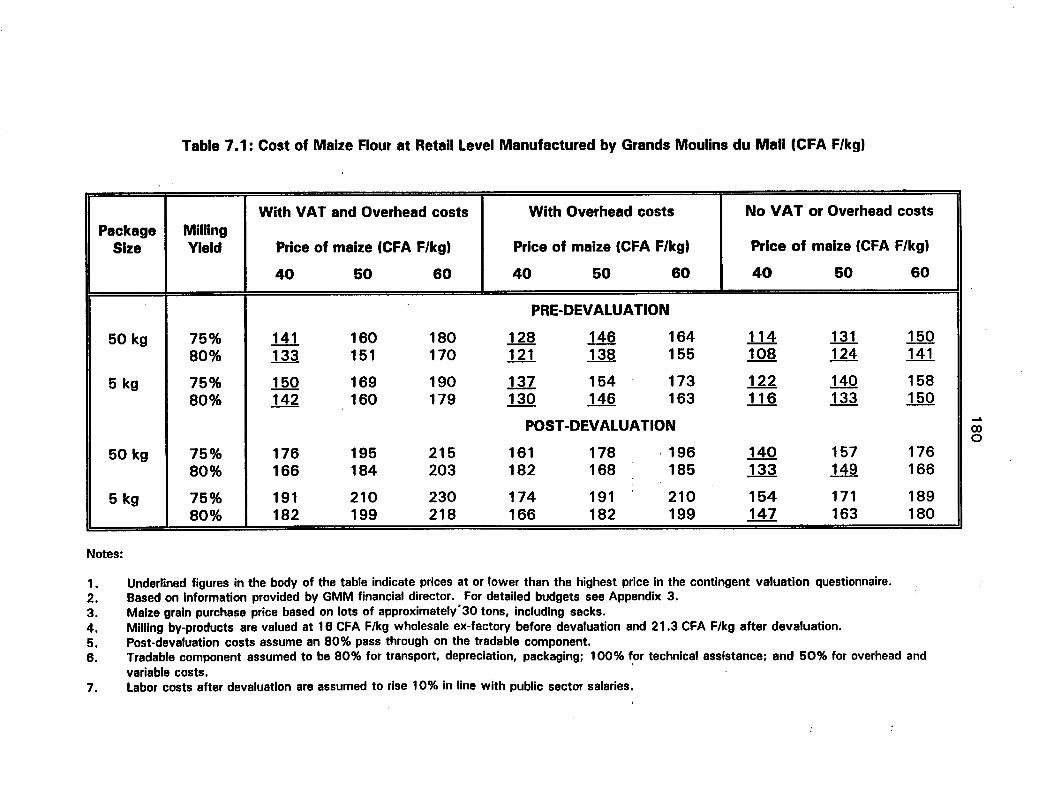
Table 7.1: Cost of Maize Flour at Retail Level Manufactured by Grands Moulins du Mall (CFA F/kg)
With VAT and Overhead costs With Overhead costs No VAT or Overhead costsPackage Milling
Size Yield Price of maize (CFA F/kg) Price of maize (CFA F/kg) Price of maize (CFA F/kg)
40 50 60 40 50 60 40 50 60
PRE-DEVALUATION
50 kg 75% 141 160 180 128 146 164 114 131 15080% 133 151 170 121 138 155 108 124 141
5 kg 75% 150 169 190 137 154 173 122 140 15880% 142 160 179 130 146 163 116 133 150
POST-DEVALUATION
50 kg 75% 176 195 215 161 178 ·196 140 157 17680% 166 184 203 182 168 185 133 149 166
5 kg 75% 191 210 230 174 191 210 154 171 18980% 182 199 218 166 182 199 147 163 180
Notes:
1. Underlined figures in the body of the table indicate prices at or lower than the highest price in the contingent valuation questionnaire.2. Based on information provided by GMM financial director. For detailed budgets see Appendix 3.3. Maize grain purchase price based on lots of approximately'30 tons, including sacks.4. Milling by-products are valued at 16 CFA F/kg wholesale ex-factory before devaluation and 21.3 CFA F/kg after devaluation.5. Post-devaluation costs assume an 80% pass through on the tradable component.6. Tradable component assumed to be 80% for transport, depreciation, packaging; 100% for technical assistance; and 50% for overhead and
variable costs. .7. labor costs after devaluation are assumed to rise 10% in line with public sector salaries.
.....00o
181
depreciation in the short run, but it is not clear whether this cost category includes
some allowance for replacement parts (e.g., rollers). In the long run, for maize
milling to be sustainable, fixed costs such as depreciation would also have to be
covered.
Given a short-run marketing scenario of small packages (to encourage
consumer experimentation with the product), a maize price of 50 CFA F/kg
(implying a farm-gate price of 40 - 45 CFA F/kg after rural assembly), and no
overhead or VAT,-the pre-devaluation price to the consumer would be
approximately 140 CFA F/kg. Were it not for devaluation, this price could have
been maintained in the longer run, even 'with overhead costs included, by a
combination of bulk packaging combined with small gains in milling efficiency.
A significant increase in the retail-price of flour following devaluation is
inevitable. Post-devaluation cost estimates are based on an 80% increase in price
for the tradable component. 9 The-tradable-component is assumed to be 80% for
transport, depreciation and packaging, and 50% for overhead and variable costs.
Although coarse grain prices have not changed significantly since devaluation, even
a 10 CFA F/kg increase in maize prices would not compensate farmers for the likely
increase in fertilizer prices (chapter 8). Assuming even this minimal price increase
for raw material, the retail price of flour would rise to 189 CFA F/kg under the
short-run scenario, and could again be maintained or reduced slightly with overhead
costs included by small gains in milling efficiency combined with bulk packaging.
9 A 50% devaluation implies a doubling of prices of imported goods in terms ofthe local currency. However, it is unlikely that the full amount of the increasewould be paid by consumers. Some overseas exporters will reduce prices in orderto maintain sales in the face of importers' lower purchasing power.
182
If it is difficult to predict with accuracy the effect of devaluation on flour
prices, it is even more so to·predict the effect of post-devaluation flour prices in
demand. On the one hand, the price of rice has increased very substantially. On
the other hand, coarse grain prices and the opportunity cost of labor in the informal
sector have not changed. These changes will affect the potential demand for flour"
in opposite directions, but with unknown magnitudes. Nevertheless, it is clear that
the increase occurs at the most price-sensitive portion of the estimated demand
schedule and will therefore most likely result in a decrease in the quantity
demanded.
b) SAMA (hammer mill)
Cost estimates for the production of dehulled and whole grain flour using a
hammer mill are also based on three alternative prices for grain maize, for ease of
comparison with industrial production. The scenarios are adapted to the specific
opportunities and constraints facing small-scale maize milling, in particular the
sensitivity of unit costs to throughput. The before- and after-devaluation costs of
each type of flour are estimated for volumes of 100 tons, 200 tons and 300 tons
per annum. Fixed parameters include 3% cleaning losses, a milling efficiency of
75% for dehulled flour and 98% for whole grain, and 50 kg packaging. We assume
margins of 15% for both processor and retailer on dehulled flour, to compensate the
processor for the risk of possible losses in storage due to rancidity. For whole grain
flour, margins of 12.5% are assumed because the lower price is likely to result in a
higher sales volume, reducing risks of stock loss for the processor and handling

183
costs for the retailer. Post-devaluation assumptions are the same as for GMM
except that we accord rent and electricity a 33% import content.10
Costs of flour production are sensitive to throughput, particularly for
volumes below 200 tons (Figure 7.1). Dehulled flour is more sensitive than whole
grain flour because of the additional equipment and space required. Devaluation
increases the sensitivity of flour costs to volume for the same reason (increased
equipment cost), and magnifies the difference between dehulled and whole grain.
Figure 7.1: Hammer Mill Unit Costs of Production for Dehulled and Whole "Grain
Flour Before and After Devaluation
200 ~-----------------------,r-----~
190'~
180: ~
~ 170 ---------------_l«b 160:; [ .u 150 l!!l
~ 140 ··· ..·· ···· ..····l!!l··..• · e·..······..· e [J<,l'-~----- Lt::i 130a::
..·s..·DehulledWholeDehulled-D-Whole-D
120
110 - ..
400350200 250 300THROUGHPUT (tons/year)
150100 -l----.....-----.-----r----...------.-----l
100
Notes:1. Dehulled: flour made from dehulled grains pre-devaluation.2. Whole: flour made from whole grains pre-devaluation.3. Dehulled-D: flour made from dehulled grains post-devaluation.4. Whole-D: flour made from dehulled grains post-devaluation.5. Assumed grain purchase price of 50 CFA F/kg
10 This lower import content reflects the fact that land in the capital city is ahigher proportion of building value than in Koulikoro where GMM's factory islocated, and electricity is from an hydroelectric source not requiring imported fuel.

184
In the body of Table 7.2, underlined figures indicate scenarios that generate
a retail price for dehulled flour at or below 150 CFA F/kg (the highest price in the
contingent valuation survey instrument), and 115 CFA F/kg for whole grain flour
(the price that induces a similar percentage of respondents to purchase whole grain
flour as would purchase dehulled flour at 150 CFA F/kg).
SAMA cannot produce dehulled flour more cheaply than GMM can produce
refined flour in either the short or long run, even assuming a throughput of 300
tons. In addition, the unit is vulnerable to stock losses from rancidification and high
unit costs during the initial market development phase. The unit can produce whole
grain flour at a considerably lower price, however (ranging from a minimum of 27
CFA F/kg before devaluation to a maximum of 62 CFA F/kg after depending on the
scenario). Unit costs of whole grain flour are more robust (less sensitive) to both
volume and devaluation.
7.2.3 Development and implementation of consumer tests
The third point of the action research triangle was the urban consumers.
Housewives were asked to prepare the most common coarse-grain-based meals
using flour made by SAMA, and then to evaluate the flour's suitability." Both
housewives and household heads were separately asked about the quantity of flour
they would be willing to purchase at specific prices. This approach evolved in three
stages: a pre-test with a limited number of households, an initial large-scale test
with four products (each household randomly allocated one of the four), and finally
a large-scale comparative test of two products. Significant improvements were
" All flours used in the test were processed by SAMA, although modificationsto processing methods were made progressively to respond to consumer criticisms.
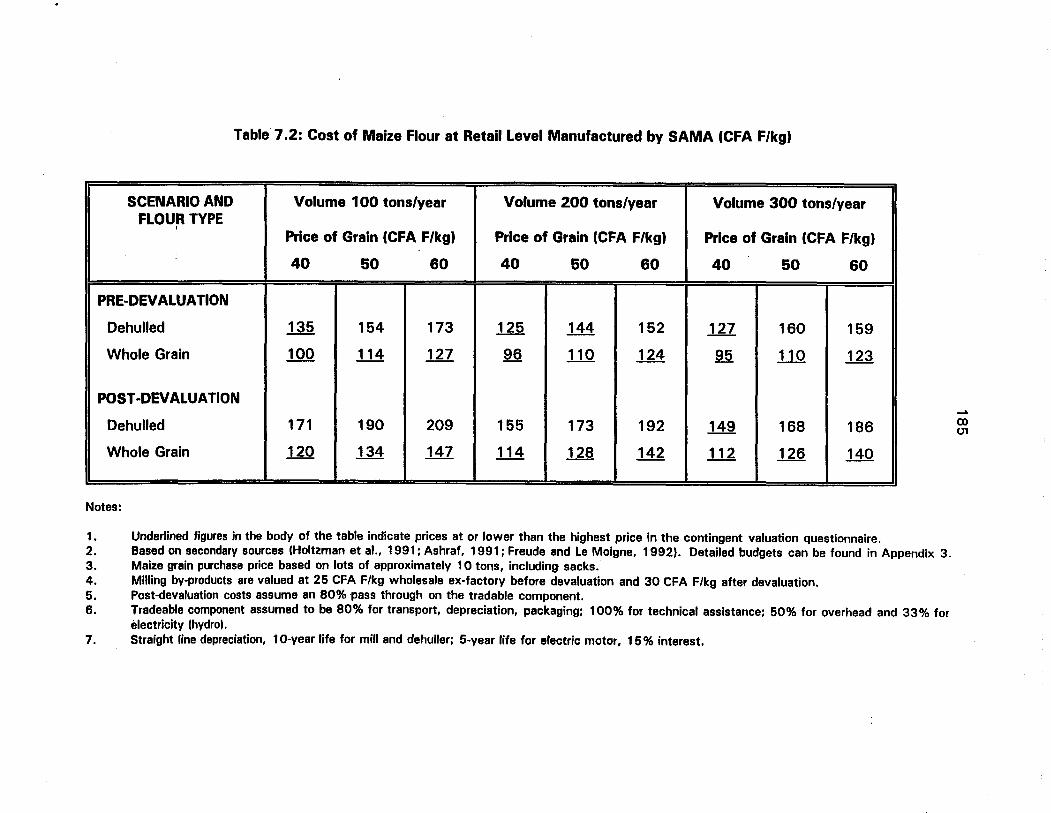
Table 7.2: Cost of Maize Flour at Retail Level Manufactured by SAMA (CFA F/kg)
SCENARIO AND Volume 100 tons/year Volume 200 tons/year Volume 300 tons/yearFLOUR TYPE
I
Price of Grain (CFA F/kg) Price of Grain (CFA F/kg) Price of Grain (CFA F/kg)
40 50 60 40 50 60 40 50 60
PRE-DEVALUATION
Dehulled 135 154 173 125 144 152 127 160 159
Whole Grain 100 114 127 96 110 124 95 110 123
POST-DEVALUATION
Dehulled 171 190 209 155 173 192 149 168 186
Whole Grain 120 134 147 114 128 142 112 126 140
Notes:
1. Underlined figures in the body of the table indicate prices at or lower than the highest price in the contingent valuation questionnaire.2. Based on secondary sources (Holtzman et al., 1991; Ashraf, 1991; Freude and Le Moigne, 1992). Detailed budgets can be found in Appendix 3.3. Maize grain purchase price based on lots of approximately 10 tons, including sacks.4. Milling by-products are valued at 25 CFA F/kg wholesale ex-factory before devaluation and 30 CFA F/kg after devaluation.5. Post-devaluation costs assume an 80% pass through on the tradable component.6. Tradeable component assumed to be 80% for transport, depreciation, packaging; 100% for technical assistance; 50% for overhead and 33% for
electricity (hydro).7. Straight line depreciation, 10-year life for mill and dehuller; 5-year life for electric motor, 15% interest.
~
coU1
186
made to the qualitative and contingent valuation instruments after the pre-test and
initial large-scale test. These are described below. For each test; the food
technology laboratory undertook a set of analyses in order to relate housewives'
qualitative evaluations to measurable parameters such as particle size (Bruinsma,
1993; Mestres, 1993).
a) The pre-test
A pilot test with ten households was carried out in January 1993 with
assistance from a consultant food technologist (Bruinsma, 1993). Two types of
flour supplied by SAMA were compared in the test: a standard flour obtained as a
by-product of grit manufacture and a finer version obtained by sieving the standard
flour using a 150 micron mesh.12 Each household was given sufficient quantities
of the two flours to make toh, couscous and bouillie (the three principal coarse grain
dishes), and 250 CFA F per meal to defray additional firewood and condiment
expenses13• Housewives were asked to evaluate the flour qualitatively before
preparation, and the quality of the dish after preparation. Following the test,
researchers met with all the female participants in two focus groups to discuss in
detail the problems encountered with using the flours for different meals. These
discussions proved very insightful to the researchers, and considerably deepened
their understanding of the qualities necessary for preparing different dishes.
12 Laboratory tests had shown the SAMA flour to be considerably coarser thanflour obtained from custom plate mills used by the majority of urban households.
13 Condiments is a general term for the ingredients of a sauce such as Maggicubes, spices, onions, leaves, pepper, oil, meat or dried fish.
187
A contingent valuation component was included in the questionnaire but
could not be rigorously tested because of time limitations and the serious quality
problems encountered with the flours chosen for the pre-test.
In light of the pre-test experience, and laboratory analyses, it was decided
not to attempt to improve the flour obtained as a by-product of grit manufacture.
The flour contained high levels of lipids and ash, implying that a large part of the
germ 'and pericarp separatedlrom the grits-had ended up in the flour (the residual'
. -product obtained from the sieving process). Furthermore, housewives stated that
the flour was either itself old stock or had been made from old maize. The women
claimed that it is not.possible to make a good toh from old maize, confirming the
finding of GMM in its 1986 experiment. A number-of flour samples were found to
contain insect larvae.
The pilot test permitted several improvements to be made to the qualitative
evaluations of the product by adopting a standard five-point hedonic scale for each
criterion, as well as a reduction in the number of dishes that need to be prepared
(only toh and bouillie, for which flour quality has a significant effect on the prepared
dish, were retained).
b)' First large-scale test
The first large-scale test was carried out in February 1993 with 130
households. Each household was randomly allocated 2kg of one of four qualities of
maize flour (white and yellow, de-hulled and whole grain) manufactured by SAMA
expressly for the tests. The flours were manufactured from grain purchased from
Bamako wholesalers. Each household prepared toh and bouillie using the flour, and
188
received 500 CFA F (250 CFA F per meal) to defray additional firewood and
condiment costs. The housewife was asked to keep part of the dish to. one side in
order to see how well it can be conserved. 14 The housewife was also asked to
make sure the household head, often absent from family meals due to work, tasted
the prepared dish.
Housewives evaluated tbeflour in regard to pre-cooking attributes.(such as
color, texture,· cleanliness--ancl-freshness) and-attributes-specific to the prepared
dishes.. For each criterion, respondents were asked to give a score on an hedonic
scale of 1 (very poor) to 5 (very good). The results are presented in Table 7.3.
Since each household received only one type of flour, the scores do not represent adirect comparison-between test flours. Each flour is implicitly compared to the
respondents home--prepared flour. 15
In regard to pre-cooking attributes (top section in Table 7.3), whole grain
flours have a lower score than their dehulled counterparts for all criteria, including
freshness. Given that these flours were manufactured from the same grain at the
same time, this reveals the strength of consumer perceptions of the quality
difference.-Whole grain yellow flour has-a-noticeably -lower score than its dehulled
counterpart in regard to odor. For dehulled flours, white flour generally received
similar scores to yellow flour, while for whole grain flours white generally
outperformed yellow. The only criterion for which scores gave rise to serious
14 Toh from the mid-day meal can often be re-heated in the evening, and tohfrom the evening meal can often be re-heated for the following breakfast.
15 Respondents were not asked to score home-prepared flour for the differentcriteria. In retrospect, this was an important omission since such scores wouldhave provided an empirical benchmark against which to evaluate the manufacturedproduct.

189
quality concerns was for texture. Most respondents considered the flours to be
coarse compared to their own flour, regardless of color or dehulling. This is due to
the use of a hammer mill to manufacture the flour rather than the plate mills
universally found in residential areas of the city.16
Scores for prepared toh are presented in the middle section of Table 7.3.
For dehulled flours, the gap between white and yellow maize scores is generally
small. In the case of whole grain flour, white out-performed yellow in regard to
most criteria. As in the pre-cooking evaluation, yellow whole grain maize flour had
a less pleasant odor than its dehulled counterpart. For prepared bouillie (breakfast
porridge), white dehulled flour out-performed its yellow counterpart, and equalled it
for whole grain flour (bottom section of Table 7.3). The main problem encountered
by respondents was that the small flour balls that characterize this dish often
disintegrated during cooking. This appeared to be even more of a problem in the
case of whole grain flour made from yellow maize.
To indicate which evaluation criteria are important to consumers, ordinary
least squares regressions were estimated with the overall scores for toh and bouillie
as dependent variables. The results are presented in Table 7.4. For toh (adjusted
R2 = .43), color, consistency, conservation and taste are all significant at the .05
level or higher. Smell, yield and cooking time did not significantly affect the overall··
score. For bouillie (adjusted R2 = .35), taste, ease of preparation, and color are all
significant at the .05 level or higher. Ease of sifting, conservation, sweetness, and
16 Plate mills are not suitable for commercial flour manufacture because theprocess involves wetting the dehulled grain prior to grinding. This makes the flourimpossible to preserve unless the flour is subsequently dried, adding time and costto the process.
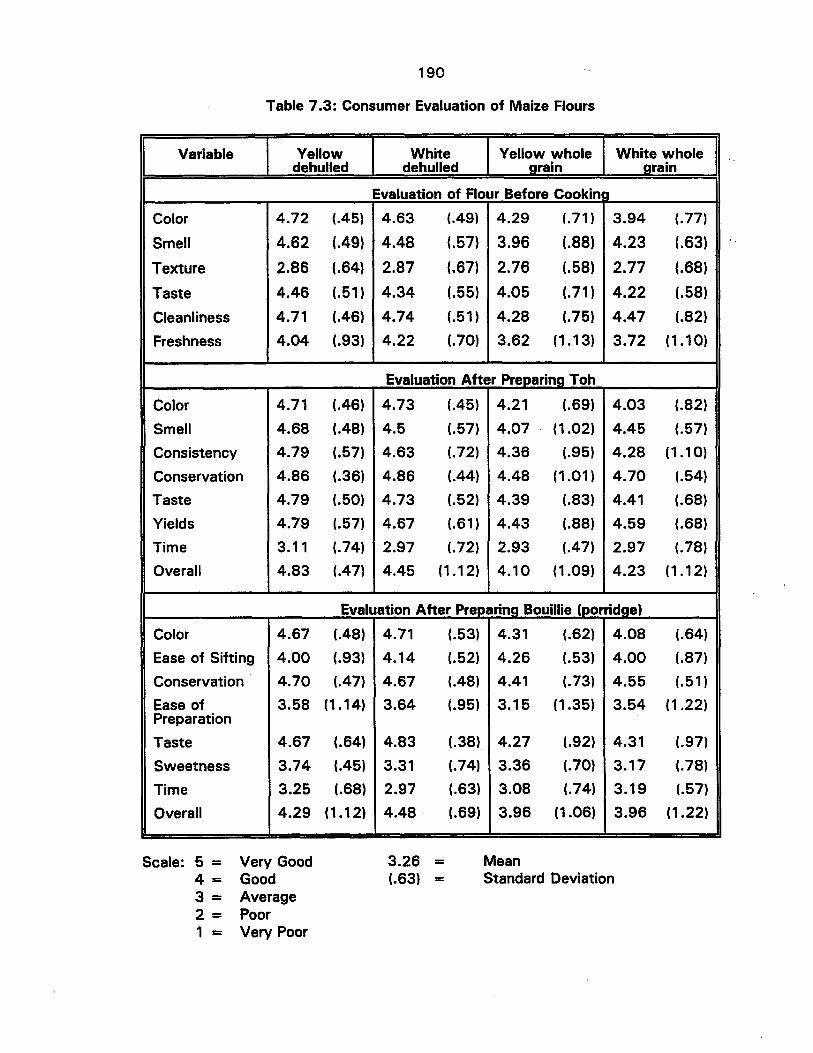
190
Table 7.3: Consumer Evaluation of Maize Flours
Variable Yellow White Yellow whole White .dehulled dehulled arain arain
Evaluation of Flour Before Cookin ]
Color 4.72 (.45) 4.63 (.49) 4.29 (.71 ) 3.94 (.77)
Smell 4.62 (.49) 4.48 (.57) 3.96 (.88) 4.23 (.63)
Texture 2.86 (.64) 2.87 (.67) 2.76 (.58) 2.77 (.68)
Taste 4.46 (.51 ) 4.34 (.55) 4.05 (.71 ) 4.22 (.58)
Cleanliness 4.71 (.46) 4.74 (.51 ) 4.28 (.75) 4.47 (.82)
Freshness 4.04 (.93) 4.22 (.70) 3.62 (1.13) 3.72 (1.10)
Evaluation After Preparing Toh
Color 4.71 (.46) 4.73 (.45) 4.21 (.69) 4.03 (.82)
Smell 4.68 (.48) 4.5 (.57) 4.07 (1.02) 4.45 (.57)
Consistency 4.79 (.57) 4.63 (.72) 4.36 (.95) 4.28 (1 .10)
Conservation 4.86 (.36) 4.86 (.44) 4.48 (1.01 ) 4.70 (.54)
Taste 4.79 (.50) 4.73 (.52) 4.39 (.83) 4.41 (.68)
Yields 4.79 (.57) 4.67 (.61 ) 4.43 (.88) 4.59 (.68)
Time 3.11 (.74) 2.97 (.72) 2.93 (.47) 2.97 (.78)
Overall 4.83 (.47) 4.45 (1.12) 4.10 (1.09) 4.23 (1.12)
Evaluation After Preparing Bouillie (porridge)
Color 4.67 (.48) 4.71 (.53) 4.31 (.62) 4.08 (.64)
Ease of Sifting 4.00 (.93) 4.14 (.52) 4.26 (.53) 4.00 (.87)
Conservation 4.70 (.47) 4.67 (.48) 4.41 (.73) 4.55 (.51 )
Ease of 3.58 (1.14) 3.64 (.95) 3.15 (1.35) 3.54 (1.22)Preparation
Taste 4.67 (.64) 4.83 (.38) 4.27 (.92) 4.31 (.97)
Sweetness 3.74 (.45) 3.31 (.74) 3.36 (.70) 3.17 (.78)
Time 3.25 (.68) 2.97 (.63) 3.08 (.74) 3.19 (.57)
Overall 4.29 (1.12) 4.48 (.69) 3.96 (1.06) 3.96 (1.22)
Scale: 5 = Very Good 3.26 = Mean4= Good (.63) = Standard Deviation3 = Average2= Poor1 = Very Poor
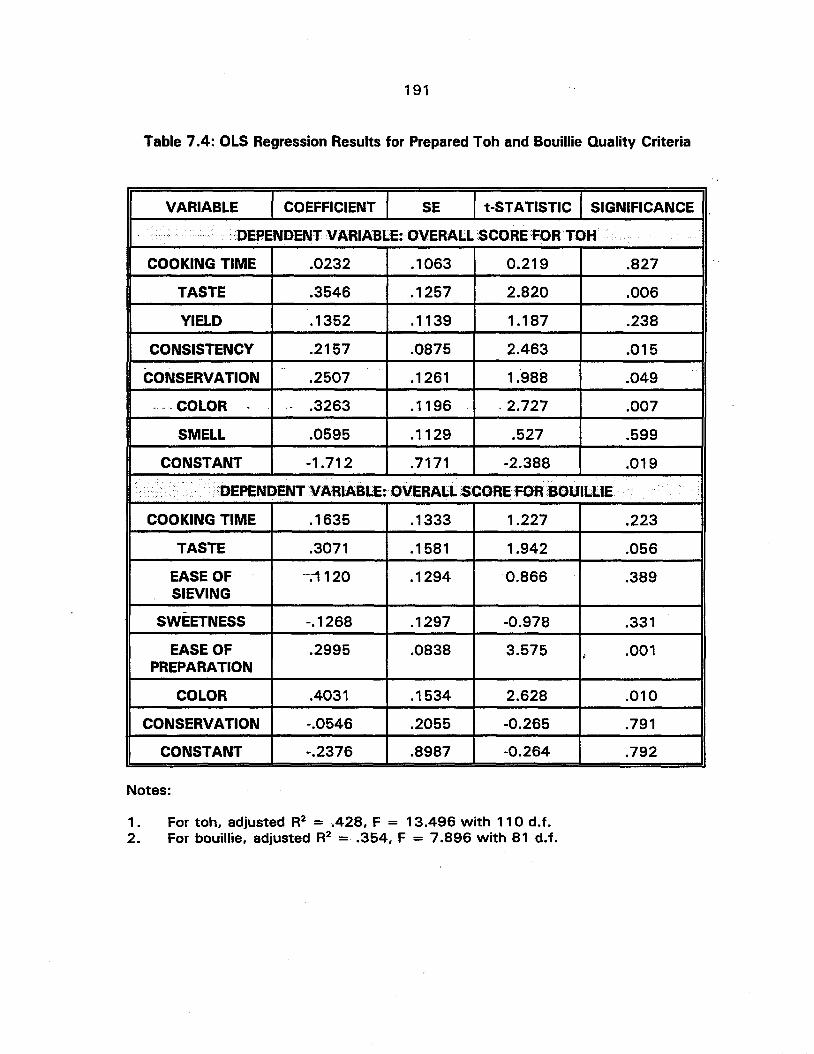
191
Table 7.4: OLS Regression Results for Prepared Toh and Bouillie Quality Criteria
VARIABLE COEFFICIENT SE t-STATISTIC SIGNIFICANCE
·'DEPENDENTVARIABLE:OVERALLSCOREFORTOH
COOKING TIME .0232 .1063 0.219 .827
TASTE .3546 .1257 2.820 .006
YIELD .1352 .1139 1.187 .238
CONSISTENCY .2157 .0875 2.463 .015--
CONSERVATION .2507 .1261 1.988 .049
--. COLOR - .- .3263 .1196 .- - 2.727 .007
SMELL .0595 .1129 .527 .599
CONSTANT -1.712 .7171 -2.388 .019
;, ..... <DEPENDENT·'VARIABLE:·.OVERALL.SCORE·FOR.·.SOUILLIE
COOKING TIME .1635 .1333 1.227 .223
TASTE .3071 .1581 1.942 .056
EASE OF --:1120 .1294 ·0.866 .389SIEVING
-SWEETNESS -.1268 .1297 -0.978 .331
EASE OF .2995 .0838 3.575 , .001PREPARATION
COLOR .4031 .1534 2.628 .010
CONSERVATION -.0546 .2055 -0.265 .791
CONSTANT -.2376 .8987 -0.264 .792
Notes:
1. For toh, adjusted R2 = .428, F = 13.496 with 110 d.f.2. For bouillie, adjusted R2 = .354, F = 7.896 with 81 d.f.
192
cooking time did not significantly affect the score. These results should be
interpreted with caution for two reasons. First, the dependent and independent
variables are discrete rather than continuous. Second, there is a high probability of
missing variables, such as consumer preferences for toh and bouillie in general, and
the level of experience in preparing those dishes. The results are merely indicative. "
The contingent valuation part of the questionnaire was designed as follows.
In order to confine measurement error to the dependent variable (quantity) as far as
possible':it was-decided that respondents should be aski!d how -much they would
buy in relation to a specific price. But who should determine the price - the
respondent or the researcher? The (male) researchers decided that respondents
should first be asked at what price they would be willing to purchase flour and then,
having announced a price, how much they would be willing to buy each week. The
rationale for letting the respondent choose the price was that consumers usually
have some reference price for a particular good that they consider to be reasonable
(hence the frequently' heard statements in everyday conversation about something
being a bargflin or expensive). The question relating to how much the respondent
would buy each week was repeated for two price reductions of 10 CFA F/kilo
relative to the first price announced by the respondent.
Two main problems were encountered with this approach. First (contrary to
the researchers' expectations), some women found it hard to propose a.price since
they had never purchased flour before. Second, women found it difficult to
estimate the quantity of flour required to prepare a given number of meals in terms
of kilos. For household heads, the problem was one of access. Household heads
often leave home very early in the morning and return after dark when it is not
193
appropriate for female enumerators to be in the field. While the data obtained might
have some value, there was clearly considerable scope for improving the method.
c) Second large-scale test
A second large scale test in which households directly compared two
qualities of white maize flour (dehulled and whole grain) was undertaken in
April/May. White maize was chosen -for two reasons. First, consumers appeared to
have fewer problems with white whole grain flour than yellow, finding the latter to
have an unpleasant odor and causing cooked toh to have a distinct orange color.
Second, varieties of white maize suited to both kinds of flour production were
available on the market. In order to reduce losses in dehulling, a round-grained
variety is preferred (e.g., TZESRW), whereas many maize varieties tend to have flat
surfaces that force a trade-off between degree of bran removal and endosperm
10ss.17 For whole grain maize flour, a soft variety (e.g., Tuxpeno) is desirable in
order to avoid a coarse-textured product. Furthermore, Tuxpeno is noted for its
high proportion of peric~rp (Go'ita, 1991). This would serve to heighten the
contrast between dehulled and whole grain flour. If consumers found whole grain
flour made from a Tuxpeno-type variety satisfactory then they would likely find any
white whple-grain maize flour satisfactory.18
17 The abrasive disk dehullers were originally designed for sorghum, which hasa spherical grain.
18 Both Tuxpeno and TZESRW are varieties introduced since 1980 (chapter 3).Tuxpeno is CIMMYT material originally obtained from Ghana and introduced by theCMDT. It is a long-duration fertilizer-responsive variety that was very popular whenthere was a guaranteed price. TZESRW (Tropical Zea Early Striga-Resistant White)is an liTA variety introduced following striga outbreaks in the early 1980s. Farmersappreciate the variety because it is early maturing and does reasonably well undermoderate soil-fertility conditions.

194
A number of changes were made to SAMA's processing methods to improve
the quality of flour. To improve the cleanliness of the product, mechanical and
manual pre-cleaning was undertaken to remove stones, and shrivelled or off-color
grains. To improve flour texture, a 1 mm screen was fitted and the rate of
processing slowed down. Manual sieving, using the same sieves as those used by
housewives, was introduced. Grits retained by the sieves were recycled in order to
reduce processing losses.
Minor changes were also made to the qualitative evaluation questions. For
evaluation pre-cooking, texture was evaluated in relation to each dish, and taste and
smell were dropped. Cooking time was dropped for toh, and ease of sifting for
bouillie. Whereas in the first test housewives evaluated one flour, in the second
they made a direct comparison between two qualities, dehulled and whole grain,
prepared from white maize grain.
The results of the qualitative evaluation are presented in Table 7.5. Texture
scores, which ranged from 2.76 to 2.87 in the first test, were considerably
improved as a result of the changes made in SAMA's processing techniques. The
scores are significantly higher for toh than for bouillie, reflecting the difference in
flour fineness required by the two dishes. Housewives traditionally sieve flour
obtained from custom plate mills through a very fine mesh sieve, keeping the finer
portion for bouillie and the coarser portion for toh. The scores are significantly
lower for whole grain compared to dehulled grain, which may be due to a less
complete disintegration of the endosperm in the hammer mill due to the presence of
the protective pericarp layer.
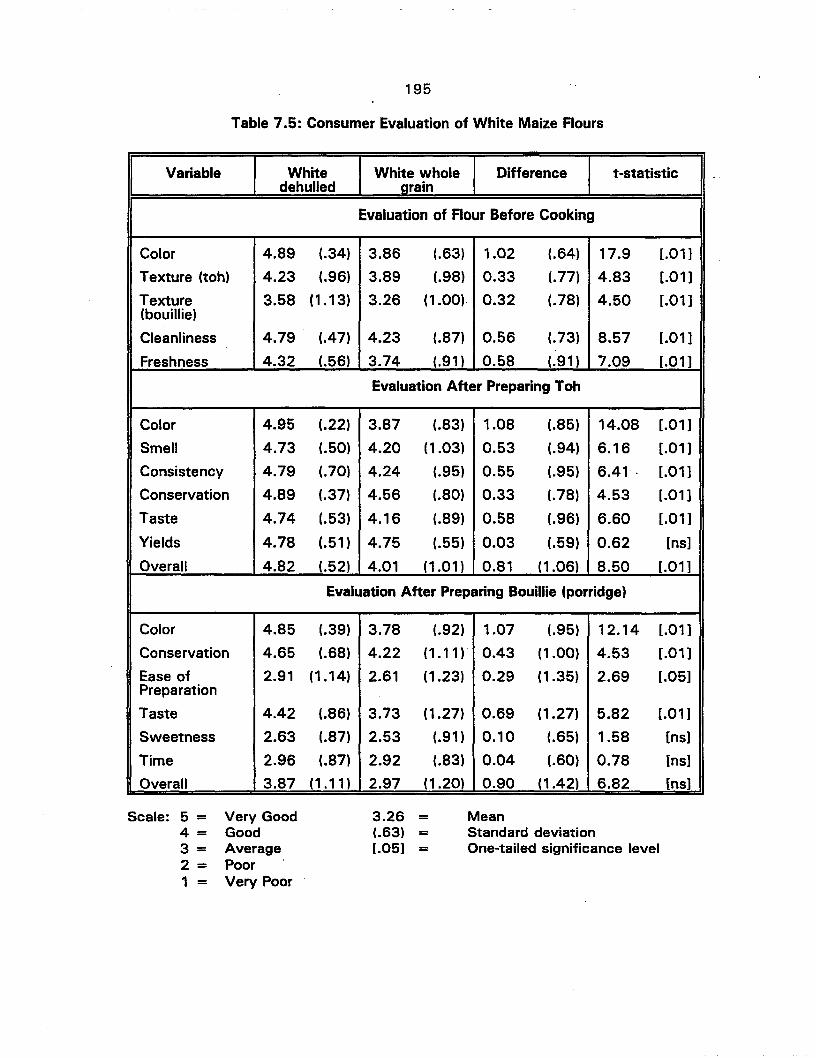
195
Table 7.5: Consumer Evaluation of White Maize Flours
Variable White White whole Difference t-statisticdehulled arain
Evaluation of Flour Before Cooking
Color 4.89 (.34) 3.86 (.63) 1.02 (.64) 17.9 [.01 ]
Texture (toh) 4.23 (.96) 3.89 (.98) 0.33 (.77) 4.83 [.01 ]
Texture 3.58 (1 .13) 3.26 (1.00). 0.32 (.78) 4.50 [.01 ](bouillie)
Cleanliness 4.79 (.47) 4.23 (.87) 0.56 (.73) 8.57 [.01 ]
Freshness 4.32 (.56) 3.74 (.91 ) 0.58 (.91 ) 7.09 [.01 ]
Evaluation After Preparing Toh
Color 4.95 (.22) 3.87 (.83) 1.08 (.85) 14.08 [.01 ]
Smell 4.73 (.50) 4.20 (1.03) 0.53 (.94) 6.16 [.01 ]
Consistency 4.79 (.70) 4.24 (.95) 0.55 (.95) 6.41 . [.01 ]
Conservation 4.89 (.37) 4.56 (.80) 0.33 (.78) 4.53 [.01 ]
Taste 4.74 (.53) 4.16 (.89) 0.58 (.96) 6.60 [.01 ]
Yields 4.78 (.51 ) 4.75 (.55) 0.03 (.59) 0.62 [ns]
Overall 4.82 <'52) 4.01 (1.01) 0.81 (1.06) 8.50 [.01 ]
Evaluation After Preparing Bouillie (porridge)
Color 4.85 (.39) 3.78 (.92) 1.07 (.95) 12.14 [.01 ]
Conservation 4.65 (.68) 4.22 (1.11 ) 0.43 (1.00) 4.53 [.01 ]
Ease of 2.91 (1.14) 2.61 (1.23) 0.29 (1.35) 2.69 [.05]Preparation
Taste 4.42 (.86) 3.73 (1.27) 0.69 (1.27) 5.82 [.01 ]
Sweetness 2.63 (.87) 2.53 (.91 ) 0.10 (.65) 1.58 [ns]
Time 2.96 (.87) 2.92 (.83) 0.04 (.60) 0.78 [ns]
Overall 3.87 (1.11 ) 2.97 (1.20) 0.90 (1.42) 6.82 [ns]
Scale: 5 = Very Good 3.26 = Mean4= Good (.63) = Standard deviation3= Average [.05] = One-tailed significance level2= Poor1 = Very Poor

196
The direct comparison of dehulled and whole grain flour generated quite
large differences compared to average scores on the first test. For all three
components of the evaluation (before cooking, after preparing toh and after
preparing bouillie), the largest differences are observed for color. In focus group
discussions after the pre-test, women explained that color is an indicator of
cleanliness and freshness. It is the brightness as much as the tint that is important.
White maize flour made from whole grains has a slightly grayish appearance. Flour
from dehulled grains scored significantly higher than whole grain flour for all criteria
except yield of cooked toh, and sweetness and time required to prepare bouillie. An
important question that needs to be addressed is to what extent are consumers
willing to give up preferences for flour from dehulled grain in return for a cheaper
product?
The intention-to-purchase portion of the questionnaire was also revised to
address problems encountered with the quantitative demand estimation procedure in
the first test (Figure 7.2). First, a grid of prices was proposed: 150 CFA F/kg
(corresponding to the retail price of milled rice at the time of the test), 115 CFA
F/kg, 90 CFA F/kg, and 70 CFA F/kg (corresponding to the retail price of
unprocessed coarse grains). The housewife was asked first whether she would be
prepared to buy maize flour at 150 CFA F/kg (the enumerator pointing out that this
is equivalent to the price of milled rice). If she replied no, then the question was
repeated for 115 CFA F/kg. If the housewife replied yes, then she was asked how
many times per week she would prepare the principal coarse-grain-based dishes
(toh, couscous, bouillie) with this flour. Since the quantity of flour required by each

Figure 7,2: Contingent Valuation Questionnaire for White Dehulled (A) and Whole grain (B) Maize Flour
TEST DES FARINES A BASE DE MAIS BLANC: L'INTENTIONS D'ACHATCommune: __ SE: _ UA: __ DADAE: . Date de I'entrevue: _Statut: CHEF UA Saxe: Nom: _
A.FARINE DECORTIQUEESi ce produit vous est propos6 sur Ie marcM, est-ce que vous allezle payer pour pr6parer pour la famille?
PREPARATION DU TO PREPARATION DU COUSCOUS PREPARATION DELA BOUllLiE
PRIX/KILO OUI/NON M/S FREQ DEJ DIN DJD M/S FREQ DEJ DIN DJD M/S FREQ
150CFA
115 CFA
90CFA
70CFA
B.FARINE NON-DECORTIQUEESi ce produit vous est propos6 sur Ie marcM, est-ce que vous allez Ie payer pour pr~parer pour la famille?
I PREPARATION DU TO PREPARATION DU COUSCOUS PREPARATION DELA BOUILLIE
PRIX/KILO OUI/NON M/S FREQ DEJ DIN DJD M/S FREQ DEJ DIN DJD M/S FREQ
150 CFA
115 CFA
90CFA
70CFA
......(0
-..J
198
household to prepare each dish could be estimated from the consumption survey, it
was not necessary to pose the quantity question explicitly.
In order to increase the household head response rate, male enumerators
engaged in the collection of monthly expenditure data were assigned the task of
obtaining contingent'valuation responses using the same questionnaire. This
enabled a much higher proportion of male household heads to be interviewed
compared to the first test.
7.3 The demand for maize flour: hypotheses and model specification
This section is divided into two parts. The first briefly defines hypotheses of
interest. The second justifies the choice of a standard censored Tobit model and
specifies the model to be estimated. The next section presents the results of
maximum likelihood estimation of the Tobit model, and derives price and income
elasticities and demand schedules for the two flour types. Section 7.5 compares
the costs of different qualities of flour to demand and determines the approximate
magnitude of equilibrium flour quantities, and considers appropriate marketing
strategies.
7.3.1 Hypotheses conceming the demand for maize flour
The principal objective of the contingent valuation household tests is to
estimate the potential effective demand for maize flours of different quality. In
order to capture the broader policy implications of the tests for coarse grain
processing, four hypotheses are specified. With one exception, these cannot be
tested in a formal statistical sense because the non-linear estimation procedure does
199
not generate single-valued expectations upon which to construct conventional
confidence intervals. The values generated by the model can nevertheless be
evaluated for their economic rather than statistical significance.
(i) the demand for maize flour is more price- and income-elastic than the
demand for maize grain at estimated retail prices;
This hypothesis is motivated by the fact that if the demand for maize flour is more
price-elastic than the demand for maize grain, then the aggregate demand for maize
grain will become more elastic with the introduction of commercial maize flour
manufacture. A more price-elastic demand schedule for maize implies that a larger
proportion of the benefits of farm-level production technology will remain with
maize growers (ceteris paribus), and will reduce inter-annual supply-induced price
fluctuation (chapter 2). A higher income elasticity of demand implies that producers
will derive benefits from improved farm-level production technology over a longer
period of time as incomes rise with economic development than would be the case
without the introduction of commercial flour manufacture.
(ii) consumers are willing to purchase more whole grain flour than flour made
from dehulled grain at retail prices that reflect their respective costs of
manufacture and distribution;

200
This hypothesis is contrary to the prevailing opinion in Mali, since coarse grains are
generally dehulled prior to milling in urban and rural areas of MaIL '9 Flour made
from whole grains appears contaminated by dirt in the eyes of urban consumers and
hence they are willing to purchase less at any given price. Nevertheless whole
grain maize flour is significantly cheaper to manufacture than dehulled maize flour,
and could be a cheap source of ready-to-prepare cereal for low-income households.
Thus it is important to evaluate willingness to pay for refined and whole grain flour
at their respective costs of manufacture in order to determine whether there is a
market niche for whole grain maize flour.
(iii) the demand for whole grain maize flour has a negative income elasticity;
A negative income elasticity of demand for whole maize flour would suggest its use
as a self-targeting food aid commodity.
(iv) men are willing to purchase less maize flour than women at any given price;
Differences between men's and women's willingness to pay arise because of
differences in the intra-household allocation of benefits and costs from procurement
19 There are two exceptions to this generalization. First, certain dishes in thePays Dogon (in the fifth Region of Mali) are prepared from whole millet. Second,toh prepared from hungry season maize is made with whole maize because thepericarp cannot be separated from the endosperm of the immature grain prior tomilling. Even in this case, the larger particles of pericarp are often removed fromthe flour by sieving.
201
of processed grain under prevailing household management institutions (chapter
4).20 For planning purposes, estimates of current demand should· be based on
household head willingness to pay. As these institutions evolve over time with
economic development, and specifically with higher levels of education for and
workforce participation by women, these differences may narrow. Thus women's
willingness to pay may be a better indicator of long-run potential demand for maize
flour.
7.3.2 Choice of estimation technique and specification of the equation
The key statistical property of the variable of interest, quantity of maize flour
a household will purchase at a given price, is that it displays both discrete and
continuous characteristics. Specifically, flour demand takes the value zero with
positive probability, but is essentially continuous over positive values. Given these
characteristics, ordinary least squares (OLS) estimators are biased (Kmenta,
1986).21
Censored regression models have a common statistical structure that can
provide consistent estimators under certain assumptions. Specifically, the standard
censored Tobit model can be defined in the population as:
20 Under prevailing institutional arrangements, the household head is responsiblefor purchasing coarse grains and women are responsible for processing them.Procurement of processed coarse grains would increase costs for the householdhead and reduce costs for women. The point should not be pushed too far,however. The Engels curve regressions in chapter 6 showed that demand forprocessed coarse grains rises with income independently from the proportion ofwomen with primary cash earning activities. This suggests that household headsderive some utility from reducing women's workload.
21 This is true whether or not the estimation is restricted to positive non-zerovalues of the dependent variable -{Wooldridge, 1994a). ..,- --
202
y. = xB + u
y = max (0, yO)
u I x - Normal (0, 02)
The problem at hand can be formulated with this structure.
The objective is to estimate an equation:
where cl is the amount of flour household i is willing to purchase in a specified time
period. The problem can be cast as a monthly flour demand model.22 In order to
simplify the algebra, utility is maximized for the household rather than for the
household head.23
maxc,g
where:Uj
cgp
Equivalently,
U j (c, g) subject to pc + g = Yi
= utility of household i= monthly consumption of flour= monthly consumption of other goods and services= price of flour· (price of other goods and services normalized to
unity)= income of household i
max Uj (c, Yi - pc)c~O
Let rj (c) E Uj (c, Yi - pc). Then the solution can be ci = 0 if dr/dc (0, Yi) S 0, or cj
> 0 if dr/dc (O'Yi) > O. But,
22 The following parallels the example of a model of household charitablecontributions set out by Wooldridge (1994b).
23 This is consistent with utility maximization by a household head whose utilityfunction includes the utility of household members derived from consumption paidfor out of the household head's income (chapter 2) so long as the household utilityfunction is a positive monotonic transformation of the household head's utilityfunction. ." " . " -
203
so dr/dc > 0 can be expressed as (mujc/mujg) > p. Accordingly, the solution can
be cj = 0 if (mujc/mujg) ~ p, or C j > 0 if (mujc/mujg
) > p. The foregoing permits us
to write a statistical model in the form of a standard censored Tobit as:
.xjB + uj uj I xj - Normal (0, 02)cij =
cij == max (0, cijO)
and xj E (Zi' Yi' Pj)
where Pj = price of flour quality j
Yi = income of household i
Zj = a vector of demographic variables for household i
The dependent variable is quantity of flour (kg per adult equivalent per
month). It is estimated by multiplying the number of meals that the respondent
indicated would be prepared from maize flour at a given price by the average
quantity of flour per adult equivalent used by the household to prepare the meal in
question during the 12 months duration of the frequent-visit survey, and
aggregating over the different meals (toh, couscous, bouillie).
The core independent variables (and expected signs) include price (-), income
(+), flour quality (+ for dehulled), respondent gender (+ for females), demographic
variables, and interaction terms among core variables (e.g., gender by income).
Demographic variables include household size (-), sex of household head (+ for
females), region of origin (+ for maize growing area), current level of maize
consumption (+), and proxy variables for women's opportunity cost of time.
Following Kennedy and Reardon (1994), these proxy variables include proportion of
women in the household (-), proportion of children in the household (-), proportion
204
of women with primary and secondary income generating activities (+), and the
presence of a maid in the household (-). An additional demographic variable
identifies whether the household head is employed in the civil service or the
military, organizations that frequently provide interest-free credit for the purchase of
cereals, either directly to the employee or through employee cooperatives. Finally,
the housewife's overall evaluation scores for toh and bouillie quality (discussed in
the previous section) are included as independent variables. A list of variable names
and definitions is provided in Table 7.6.
7.4 The demand for maize flour: results of the Tobit estimation
This section presents the results of the Tobit estimation of maize flour
demand. The first part presents the parameter estimates and discuses their
significance. The second part calculates expected demand for maize flour (kg per
adult equivalent per month). Part three presents price and income elasticities of
demand for maize flour and compares them to elasticities of demand for cereals for
the urban Sahel from secondary sources. The final part briefly reviews specification
issues relating to the Tobit model estimated. Section 7.5 then examines the
implications of these results for the commercial feasibility of maize flour in Bamako.
7.4.1 Parameter estimates and significance
The estimated coefficients and significance levels for independent variables
are presented in Table 7.7. Since the maximum likelihood estimation procedure is
non-linear, these coefficients cannot be interpreted directly as partial effects. The
derivation of expected values for the dependent variable, and partial effects and
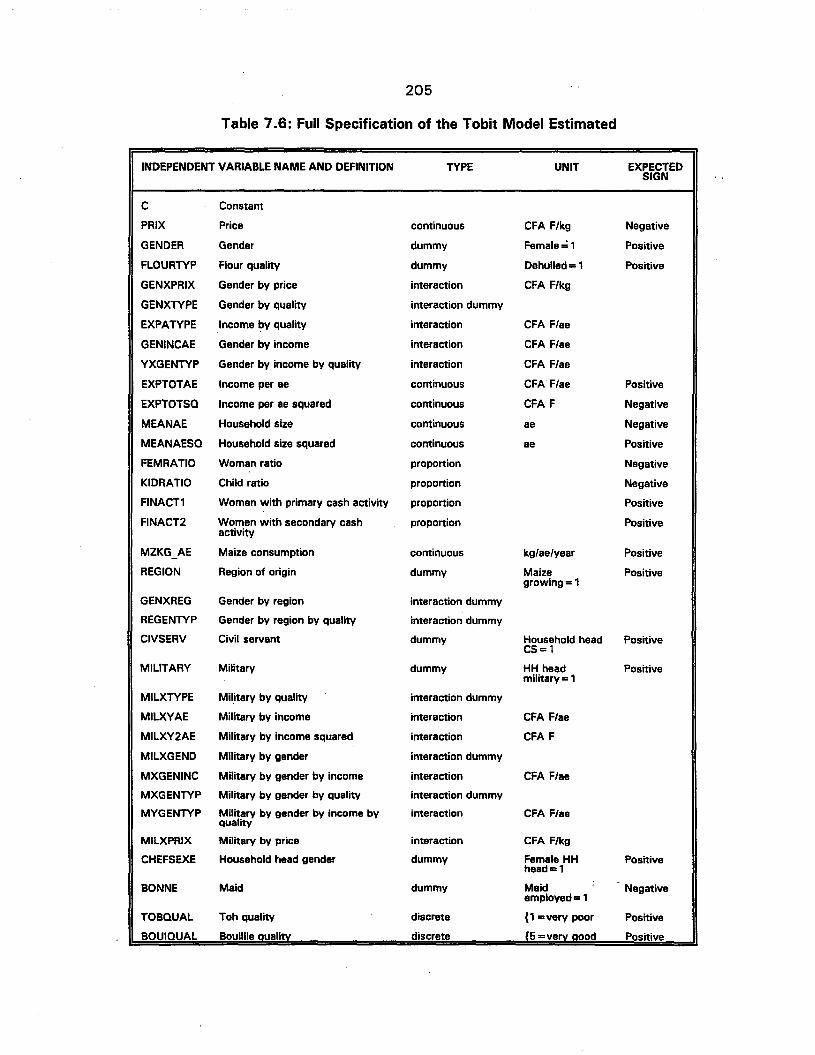
205
Table 7.6: Full Specification of the Tobit Model Estimated
INDEPENDENT VARIABLE NAME AND DEFINITION TYPE UNIT EXPECTEDSIGN
C Constant
PRIX Price continuous CFA F/kg Negative
GENDER Gender dummy Female~1 Positive
FLOURTYP Flour quality dummy Dehulled=1 Positive
GENXPRIX Gender by price interaction CFA F/kg
GENXTYPE Gender by quality interaction dummy
EXPATYPE Income by quality interaction CFA F/ae
GENINCAE Gender by income interaction CFA F/ae
YXGENTYP Gender by income by quality interaction CFA F/ae
EXPTOTAE Income per ae continuous CFA F/ae Positive
EXPTOTSQ Income per ae squared continuous CFA F Negative
MEANAE Household size continuous ae Negative
MEANAESQ Household size squared continuous ae Positive
FEMRATIO Woman ratio proportion Negative
KIDRATIO Child ratio proportion Negative
FINACn Women with primary cash activity proportion Positive
FINACT2 Women with secondary cash proportion Positiveactivity
MZKG_AE Maize consumption continuous kg/ae/year Positive
REGION Region of origin dummy Maize Positivegrowing = 1
GENXREG Gender by region interaction dummy
REGENTYP Gender by region by quality interaction dummy
CIVSERV Civil servant dummy Household head PositiveCS=1
MILITARY Military dummy HH head Positivemilitary = 1
MILXTYPE Military by quality interaction dummy
MILXYAE Military by income interaction CFA F/ae
MILXY2AE Military by income squared interaction CFA F
MILXGEND Military by gender interaction dummy
MXGENINC Military by gender by income interaction CFA F/ae
MXGENTYP Military by gender by quality interaction dummy
MYGENTYP Military by gender by income by interaction CFA F/aequality
MILXPRIX Military by price interaction CFA F/kg
CHEFSEXE Household head gender dummy Female HH Positivehead=1
BONNE Maid dummy Maid Negativeemployed = 1
TOBQUAL Toh quality discrete {1 = very poor Positive
BOUIQUAL Bouillie aualitv discrete 15 =verv aoad Positive
206
elasticities for independent variables of interest, are presented below. We first
briefly compare the sign and significance level of estimated coefficients with
predicted values.
The coefficient on price (PRIX) has the expected sign and is highly significant
(t =-13.99). The coefficient on income (EXPTOTAE) is not significantly different
from zero, but the coefficient on the squared income term (EXPTOTSQ) is negative
and significant.
The coefficient on flour quality (FLOURTYP) is not significantly different from
zero, while the coefficient on gender (GENDER) is highly significant (t = -3.99) but
not with the expected sign. In both cases the expected effects are captured
through interaction terms. The coefficient on the income by flour quality interaction
term (EXPXTYPE) is positive and significant, indicating that there is a positive
demand response to income for dehulled flour. The gender by income interaction
(GENINCAE) is also positive and significant, while the significant coefficient for the
gender by income by quality interaction term (YXGENTYP) is of similar magnitude
with the opposite sign. This implies that women have a higher demand response to
income than men for whole grain flour, but this response is not significantly
affected by flour quality. The coefficient on the gender by price (GENXPRIX)
interaction term is positive and significant, indicating that women's demand is less
price-responsive than men's.
Among demographic variables of interest, the coefficient on household size
(MEANAE) is negative and significant at the .05 level (t = -2.27). The coefficient
on the squared household size term (MEANAESQ) is not significantly different from
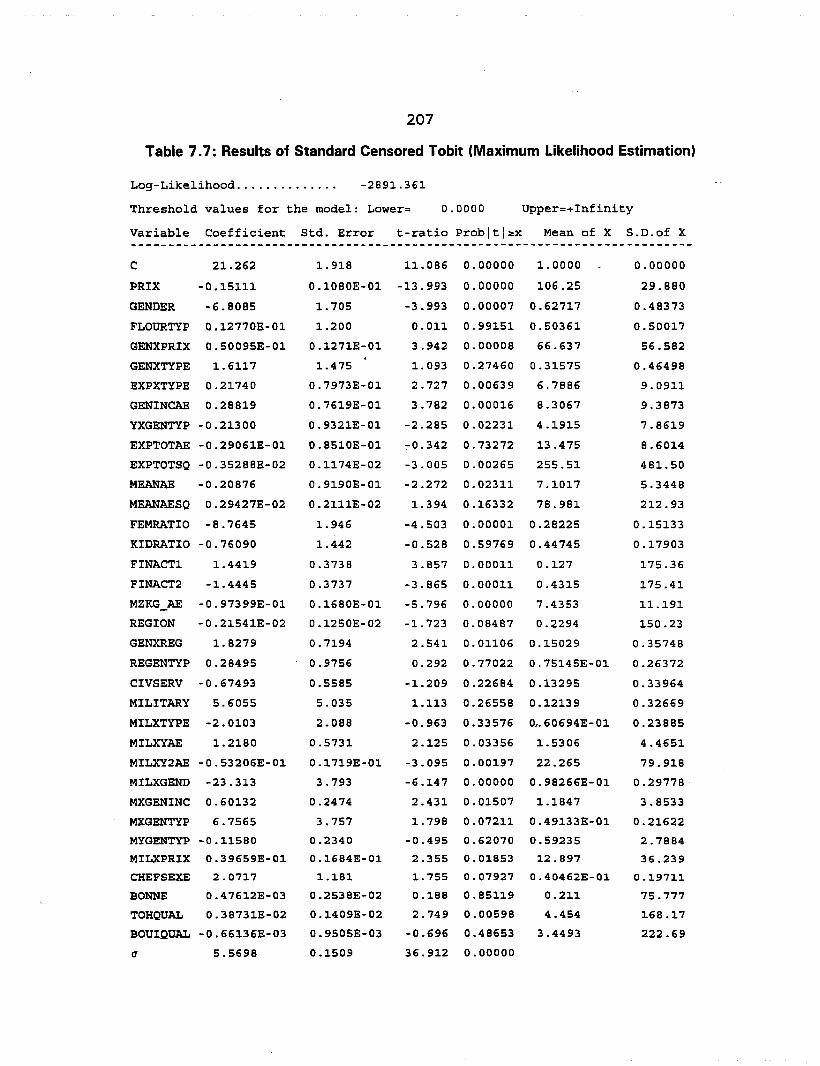
207
Table 7.7: Results of Standard Censored Tobit (Maximum Likelihood Estimation)
Log-Likelihood........•..... -2891.361
Threshold values for the model: Lower= 0.0000 Upper=+Infinity
Variable Coefficient Std. Error t-ratio Probltl~x Mean of X S.D.of X----------------------------------------------------------------------------C 21.262 1. 918 11. 086 0.00000 1. 0000 0.00000
PRIX -0.15111 0.1080E-Ol -13.993 0.00000 106.25 29.880
GENDER -6.8085 1.705 -3.993 0.00007 0.62717 0.48373
FLOURTYP 0.12770E-01 1.200 0.011 0.99151 0.50361 0.50017
GENXPRIX 0.50095E-01 0.1271E-Ol 3.942 0.00008 66.637 56.582
GENXTYPE 1.6117 1.475 1. 093 0.27460 0.31575 0.46498
EXPXTYPE 0.21740 0.7973E-Ol 2.727 0.00639 6.7886 9.0911
GENINCAE 0.28819 0.7619E-Ol 3.782 0.00016 8.3067 9.3873
YXGENTYP -0.21300 0.9321E-Ol -2.285 0.02231 4.1915 7.8619
EXPTOTAE -0.29061E-Ol 0.8510E-0l ~0.342 0.73272 13.475 8.6014
JJ:XPTOTSQ -0.35288E-02 0.1174E-02 -3.005 0.00265 255.51 481.50
MEANAE -0.20876 0.9190E-Ol -2.272 0.02311 7.1017 5.3448
MEANAESQ 0.29427E-02 o.2111E-02 1.394 0.16332 78.981 212.93
FEMRATIO -8.7645 1.946 -4.503 0.00001 0.28225 0.15133
KIDRATIO -0.76090 1.442 -0.528 0.59769 0.44745 0.17903
FINACT1 1.4419 0.3738 3.857 0.00011 0.127 175.36
FINACT2 -1.4445 0.3737 -3.865 0.00011 0.4315 175.41
MZKG_AE -0.97399E-01 o .l680E-Ol -5.796 0.00000 7.4353 11.191
REGION -0.21541E-02 0.1250E-02 -1.723 0.08487 0.2294 150.23
GENXREG 1. 8279 0.7194 2.541 0.01106 0.15029 0.35748
REGENTYP 0.28495 0.9756 0.292 0.77022 0.75145E-Ol 0.26372
CIVSERV -0.67493 0.5585 -1.209 0.22684 0.13295 0.33964
MILITARY 5.6055 5.035 1.113 0.26558 0.12139 0.32669
MILXTYPE -2.0103 2.088 -0.963 0.33576 0,. 60694E- 01 0.23885
MILXYAE 1.2180 0.5731 2.125 0.03356 1.5306 4.4651
MILXY2AE -0.53206E-Ol o.1719E-Ol -3.095 0.00197 22.265 79.918
MILXGEND -23.313 3.793 -6.147 0.00000 0.98266E-Ol 0.29778
MXGENINC 0.60132 0.2474 2.431 0.01507 1.1847 3.8533
MXGENTYP 6.7565 3.757 1.798 0.07211 0.49133E-Ol 0.21622
MYGENTYP -0.11580 0.2340 -0.495 0.62070 0.59235 2.7884
MILXPRIX 0.39659E-01 0.1684E-01 2.355 0.01853 12.897 36.239
CHEFSEXE 2.0717 1.181 1.755 0.07927 0.40462E-01 0.19711
BONNE 0.47612E-03 tl.2538E-02 0.188 0.85119 0.211 75.777
TOHQUAL 0.38731E-02 0.1409E-02 2.749 0.00598 4.454 168.17
BOUIQUAL -0.66136E-03 0.9505E-03 -0.696 0.48653 3.4493 222.69
(1 5.5698 0.1509 36.912 0.00000
208
zero. The proportion of women in the household (FEMRATIO) has a large and highly
significant (t = -4.5) negative coefficient as expected. The proportion of children in
the household (KIDRATIO) is not significantly different from zero. The proportion of
women with primary cash-earning activities (FINACT1) has a positive and highly
significant coefficient, but the proportion of women with secondary cash-earning
activities (FINACT2) has a negative and highly significant coefficient of roughly
equal magnitude. A possible explanation for these apparently conflicting results is
that coarse grain processing tasks do not compete for time with secondary activities
but do in the case of primary activities. The coefficient on employment of a maid
(MAID) is not significantly different from zero. The coefficient on the variable
representing female-headed households (CHEFSEXE) is positive and significant at
the .10 level.
The characteristics of households where the household head is in the military
give rise to a substantially different demand pattern. Military by income (MILXYAE),
military by gender by income (MXGENINC), and military by gender by flour quality
(MXGENTYP) are all positive and significant at the .10 level or higher. The military
by price (MILXPRICE) interaction term is positive and significant at the .02 level (t
= 2.36). These results imply that flour demand for military households is more
income-responsive and less price-responsive than civilian households. Possible
explanations for this are that the army provides interest-free credit for the purchase
of cereals, and male household heads are frequently absent for long periods of time
on training or other military duties, making these households, in effect, female
headed for a large part of the time. This suggests that military bases located in and
near Bamako (e.g., Kati) could be an important market segment to target during the

209
initial market development phase. In contrast to military households, the coefficient
for households where the head is employed in the civil service (CIVSERV) is not
significantly different from zero.
The coefficient on the dummy variable representing a household from a
maize -growing area (REGION~ is negative (significant at the .0-1 level),· but very·· -
small. The coefficient for women from a maize growing area (REGENTYP) is
positive, significant at the .01 level, and very large compared to the coefficient for
men. The coefficient on the quality of toh prepared from flour (TOHOUAL) is
positive and significant, but the magnitude of the coefficient is very small. The
coefficient on the quality of porridge prepared from flour (BOUIOUAL) is not
significantly different from zero. This suggests that most of the total variation .in
flour quality relevant to consumer demand has been captured by the flour quality
and flour quality ·interaction terms: It does not imply that flour quality is
unimportant.
I
7.4.2 Estimated demand for dehulled and whole grain flours
The objective of the Tobit model specified is to estimate the expected
monthly purchase of maize flour (of specific quality) per adult equivalent per month.. .
at a given price, income and set of demographic variable values. We distinguish
between conditional and unconditional demand for the sample. Conditional demand
refers to the expected quantity of flour purchased per adult equivalent by those
sample households consuming a positive quantity. Unconditional demand refers to
the expected quantity of flour purchased per adult equivalent for all sample
households, including those that do not consume any. In this section we calculate
210
expected demand for maize flours of different quality before and after devaluation,
and use that information to evaluate hypotheses (ij) and (ivl.
We are primarily interested in unconditional demand, but calculate
conditional demand as an intermediate step. The conditional demand for a given
flour type can be estimated-by:' ._. -..-
E (c I x, c>0) = xP + (J i(x8!o)¢'(x/llal
where t/J(x/Jla) is the standard normal density, and ¢'(x/llo) the cumulative normal
density, evaluated at the expression in parentheses.24 The unconditional demand
can be obtained by multiplying the expression for conditional demand by the
probability that consumption is positive:
E (c I x) = ¢,(x/lla) {x/l + aA(x/lla)}
where A(x/lla), the inverse Mills ratio, equals t/J(X/Jla)/¢'(X/Jla). For the remainder of
the chapter, expected demand refers to unconditional expected demand unless
specifically stated otherwise.
In order to determine expected demand the sample is divided into six sub-
groups: military and civilian, each with three income terciles. The reason for
dividing the sample into military and civilian is to be able to correct for the over-
representation of military personnel in the sample compared to the population. For
frequent-visit survey sample households participating in flour consumption tests,
15.5% of household heads are in the military, compared to 5% in the single-shot
representative sample of 640 households. The reason for dividing the sample into
income terciles is that household size, a key determinant of demand, is negatively
correlated with income (chapter 6). Thus, when estimating expected demand we
24 For the derivation of these formulae see Wooldridge (1994b).

211
want to take account of the fact that high-income households are of smaller than
average size, and low-income households are of larger than average size. For each
of the six sub-groups, the quantity xP is evaluated for male respondents (i.e., all
gender interaction terms restricted to zero) at the sub-group mean value of each
independent variable. Evaluation of expected demand for male respondents reflects··
the prevailing household economic institution that the household head is responsible
for cereal purchases (chapter 4). An average expected demand for the whole
sample can be calculated as a weighted sum of the individual sub-group expected
demands.
The expected demand for each flour type and sub-group is calculated before
and after devaluation of the CFA franc to take account of the short-run income
effect of this policy change.25 On the basis of average price increases in the first
three months following devaluation, we assume a 40% decline in real income for
civilian sub-groups, and a 33% for military (civil servants received a 10% pay
increase to compensate for the rise in cost of living).26 The estimates of demand
for the post-devaluation scenario must be interpreted with great caution, however.
The implicit reference prices (e.g., the price of rice) to which consumers are
comparing hypothetical flour prices have changed since the time of the survey. It is
quite conceivable that, if the survey was repeated in the post-devaluation
environment, a different set of results would be obtained.
25 The long-run intended outcome of devaluation is that real incomes will risefaster than they would have otherwise.
26 At-a-workshop on the impact-of the devaluation of the CFA franc on incomesand food security in the Sahel, organized by the Institut du Sahel (PRISAS) in July1994, the representative of the West African Central Bank (BCEAO) reported thatthe post-devaluation annual rate of inflation was 38%. J. Staatz, personalcommunication, August 1994.
212
Expected demands for each flour type, sub-group, and the sample as a whole
are presented in Table 7.8. Part a of Table 7.8 presents pre-devaluation expected
demand and part b post-devaluation expected demand. Expected demand for
military households is substantially higher than civilian at all income levels, before
and after devaluation. This justifies the decision to correct for their over-
representation in the sample.
Demand for each flour type for the sample as a whole is presented
graphically in Figure 7.3 for both pre- and post-devaluation scenarios. Expected
demand for dehulled flour is greater than for whole grain flour at any given price.
However, it is clear that consumer preferences are sensitive to price. Before
devaluation, if whole grain flour is approximately 20 CFA F/kg cheaper than
dehulled, consumers would be willing to buy similar quantities of either flour.21
With devaluation, the demand for dehulled flour shifts to the left (decrease in
quantity demanded at any given price), while the demand for whole grain flour
shifts to the right (increase in quantity at any given price), implying that dehulled
flour is a normal good, and whole grain flour an inferior one. For the post-
devaluation scenario, a price discount in the order of only 10 CFA F is adequate
incentive for consumers to be willing to buy similar quantities of either flour. Thus
consumer preferences are even more sensitive to price following devaluation. This
willingness of consumers to trade quality for price is consistent with maize flour
21 This is obviously an approximation. The price difference at which consumerswill be indifferent between dehulled and whole grain flour will vary with the price ofdehulled flour, and the income and other demographic characteristics of any givensub-group (see Table 7.8). Given that the results are based on a contingentvaluation test rather than observed behavior in the marketplace, it is realistic toconsider orders of magnitude rather than exact differences. '
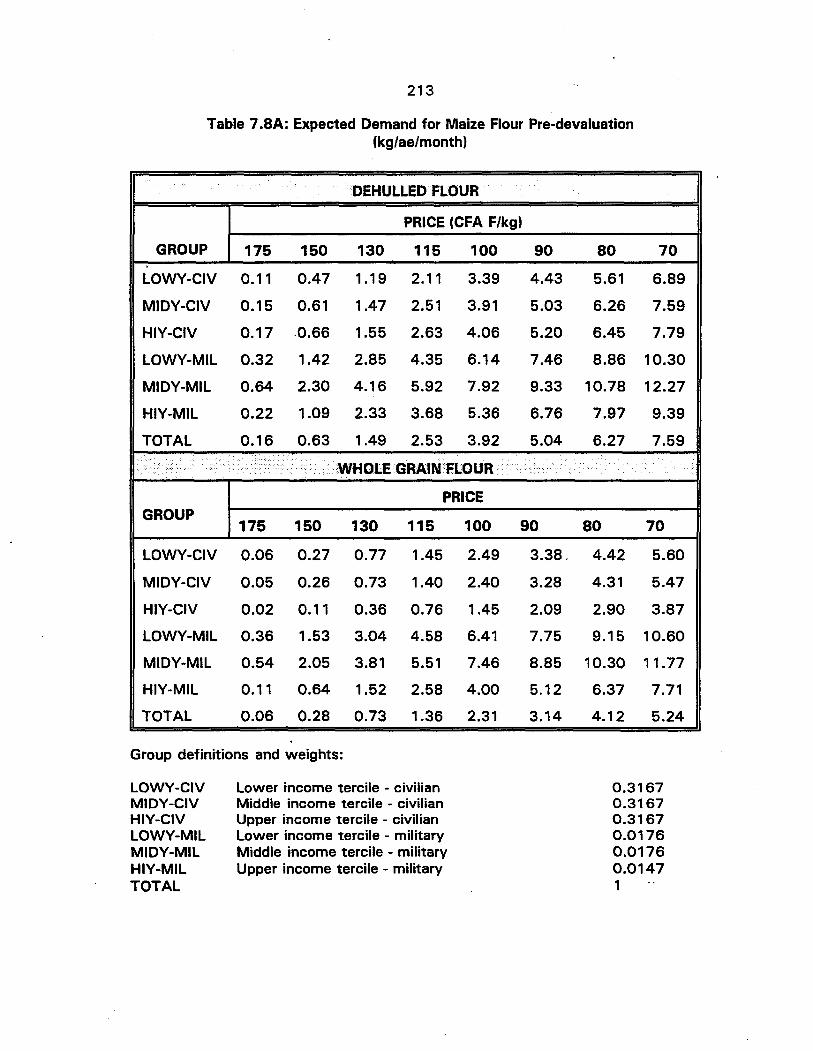
213
Table 7.8A: Expected Demand for Maize Flour Pre-devaluation(kg/ae/month)
I DEHUlLED.FlOUR IPRICE (CFA F/kg)
GROUP 175 150 130 115 100 90 80 70
LOWY-CIV 0.11 0.47 1.19 2.11 3.39 4.43 5.61 6.89
MIDY-CIV 0.15 0.61 1.47 2.51 3.91 5.03 6.26 7.59
HIY-CIV 0.17 .0.66 1.55 2.63 4.06 5.20 6.45 7.79
LOWY-MIL 0.32 1.42 2.85 4.35 6.14 7.46 8.86 10.30
MIDY-MIL 0.64 2.30 4.16 5.92 7.92 9.33 10.78 12.27
HIY-MIL 0.22 1.09 2.33 3.68 5.36 6.76 7.97 9.39
TOTAL 0.16 0.63 1.49 2.53 3.92 5.04 6.27 7.59
<>. WHOLE GRAIN fLOUR ..••••
PRICEGROUP
175 150 130 115 100 90 80 70
LOWY-CIV 0.06 0.27 0.77 1.45 2.49 3.38. 4.42 5.60
MIDY-CIV 0.05 0.26 0.73 1.40 2.40 3.28 4.31 5.47
HIY-CIV 0.02 0.11 0.36 0.76 1.45 2.09 2.90 3.87
LOWY-MIL 0.36 1.53 3.04 4.58 6.41 7.75 9.15 10.60
MIDY-MIL 0.54 2.05 3.81 5.51 7.46 8.85 10.30 11.77
HIY-MIL 0.11 0.64 1.52 2.58 4.00 5.12 6.37 7.71
TOTAL 0.06 0.28 0.73 1.36 2.31 3.14 4.12 5.24
Group definitions and weights:
LOWY-CIVMIDY-CIVHIY-CIVLOWY-MILMIOY-MILHIY-MILTOTAL
Lower income tercile - civilianMiddle income tercile - civilianUpper income tercile - civilianLower income tercile - militaryMiddle income tercile - militaryUpper income tercile - military
0.31670.31670.31670.01760.01760.01471
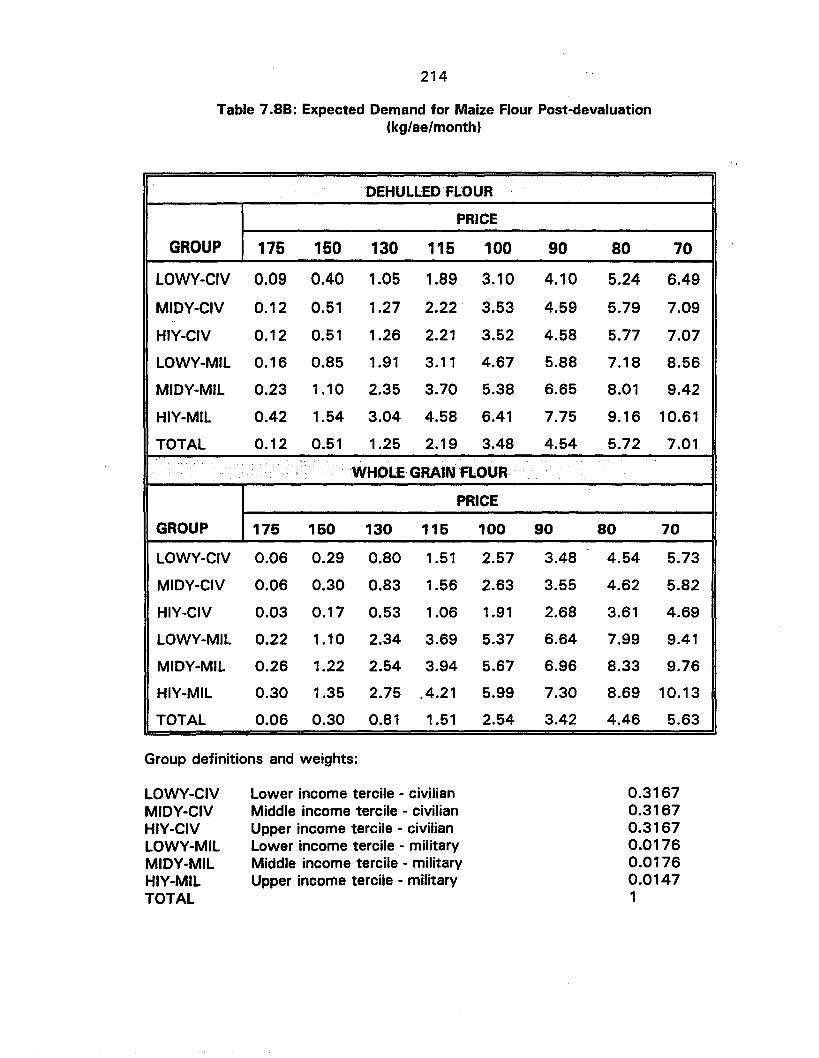
214
Table 7.88: Expected Demand for Maize Flour Post-devaluation(kg/ae/month)
DEHULLEDFLOUR
PRICE
GROUP 175 150 130 115 100 90 80 70
LOWY-CIV 0.09 0.40 1.05 1.89 3.10 4.10 5.24 6.49
MIDY-CIV 0.12 0.51 1.27 2.22 3.53 4.59 5.79 7.09
HIY-CIV 0.12 0.51 1.26 2.21 3.52 4.58 5.77 7.07
LOWY-MIL 0.16 0.85 1.91 3.11 4.67 5.88 7.18 8.56
MIDY-MIL 0.23 1.10 2.35 3.70 5.38 6.65 8.01 9.42
HIY-MIL 0.42 1.54 3.04 4.58 6.41 7.75 9.16 10.61
TOTAL 0.12 0.51 1.25 2.19 3.48 4.54 5.72 7.01
WHOLE· GRAIN fLOUR
PRICE
GROUP 175 150 130 115 100 90 80 70
LOWY-CIV 0.06 0.29 0.80 1.51 2.57 3.48 4.54 5.73
MIDY-CIV 0.06 0.30 0.83 1.56 2.63 3.55 4.62 5.82
HIY-CIV 0.03 0.17 0.53 1.06 1.91 2.68 3.61 4.69
LOWY-MIL 0.22 1.10 2.34 3.69 5.37 6.64 7.99 9.41
MIDY-MIL 0.26 1.22 2.54 3.94 5.67 6.96 8.33 9.76
HIY-MIL 0.30 1.35 2.75 .4.21 5.99 7.30 8.69 10.13
TOTAL 0.06 0.30 0.81 1.51 2.54 3.42 4.46 5.63
Group definitions and weights:
LOWY-CIVMIDY-CIVHIY-CIVLOWY-MILMIDY-MILHIY-MILTOTAL
Lower income tercile - civ.ilianMiddle income tercile - civilianUpper income tercile - civilianLower income tercile - militaryMiddle income tercile - militaryUpper income tercile - military
0.31670.31670.31670.01760.01760.01471
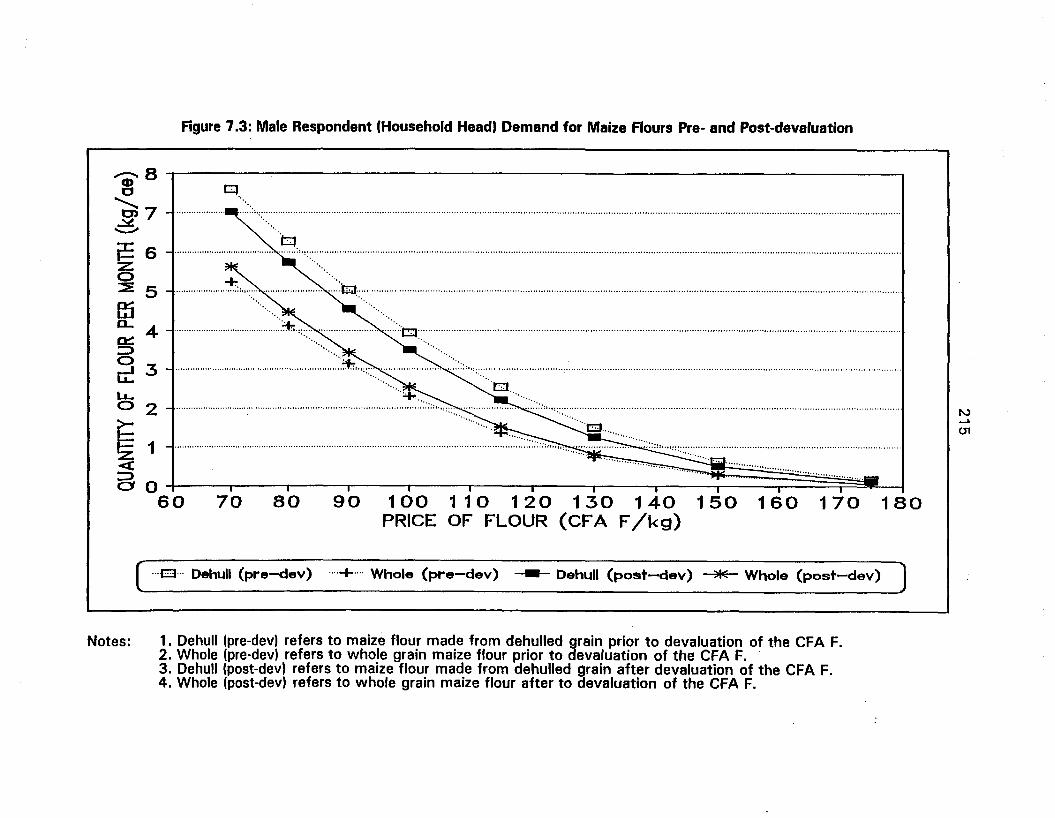
Figure 7.3: Male Respondent (Household HeadJ Demand for Maize Flours Pre- and Post-devaluation
l'-J....(J'1
90 100 110 120 130 140 150 160 170 180PRICE OF FLOUR (CFA F/kg)
80
.~ ~.::t;;): .
70
~ 6t;~'5
E5~ 4 ~ ±.~ ~:::t=l: .
~ 3 ~ ~::+,.~ ~::: .. ,;:: .
.... 8
'=' J" CJC) ".~ 7 ·IIIIl.. ·:::'·~ :: .. .............................................................................................................................................................................
~ 2 -I ~.:::::::,~ ~, ,;::: .
i 1lmmmmmm~:mlo 0 iii iii i i ·····11
60
..·EJ..· Dehull (pre-dev) ....+ .... Whole (pre-dev) --- Dehull (post-dev) -*- Whole (post-dev)
Notes: 1. Dehull (pre-dev) refers to maize flour made from dehulled grain prior to devaluation of the CFA F.2. Whole (pre-dev) refers to whole grain maize flour prior to devaluation of the CFA F. .3. Dehull (post-dev) refers to maize flour made from dehulled grain after devaluation of the CFA F.4. Whole (post-dev) refers to whole grain maize flour after to devaluation of the CFA F.

216
demand in other countries undergoing structural adjustment in Eastern and Southern
Africa (Rubey, 1993; Mukumbu and Jayne 1994).
In order to evaluate hypothesis (ii), that consumers are willing to purchase
more whole grain flour than flour made from dehulled grain at prices that reflect
. their costs of production, we need to compare the differences in willingness to pay .
in the preceding paragraph to differences in cost of manufacture. Prior to
devaluation, whole grain flour would retail at between 110 CFA F/kg and 114 CFA
F/kg, depending on annual throughput and assuming a grain purchase price of 50
CFA F/kg (Table 7.2). Dehulled flour would retail at between 138 CFA F/kg and
146 CFA F/kg depending on milling efficiency, including overhead costs but not
VAT, and 50 kg packaging (Table 7.1). A difference in retail price between flour
qualities of 28 - 32 CFA F/kg is half as much again as the difference in price at
which consumers are on average indifferent between them as measured by the
quantity they would be willing to buy (20 CFA F/kg). This finding supports the
hypothesis that consumers would be willing to purchase more whole grain flour
than dehulled at pre-devaluation prices.
Post-devaluation costs of manufacture add further support to the hypothesis.
With the same assumptions as for the pre-devaluation case, whole grain flour would
retail at between 128 CFA F/kg and 134 CFA F/kg, while dehulled flour would retail
at between 168 CFA F/kg and 178 CFA F/kg depending on milling efficiency. This
difference of 40 - 44 CFA F/kg is substantially greater than the approximate 10 CFA
F/kg difference in price at which consumers are on average indifferent between the
two flour qualities as measured by the quantity they would be willing to buy.

217
In order to evaluate hypothesis (iv) we contrast gender differences in
demand for each flour type post-devaluation for the middle-income tercile (Figure
7.4). At any given price, women clearly have a higher level of demand than men
for both whole grain and dehulled flour. Indeed, women would buy more whole
grain flour than men would buy dehulled flour at the same price.
Figure 7.5 contrasts women's demand for whole grain and dehulled flour
before and after devaluation. The demand schedules for both types of flour shift to
the left (decrease in quantity purchased at any given price). This suggests that, for
women, both whole grain and dehulled flours are normal goods. The fact that
whole grain flour is a normal good for women and an inferior good for men is an
indicator of the potential improvement in wellbeing for women from not having to
perform arduous and repetitive processing tasks. The results lend strong support to
hypothesis (iv), and suggest that changes in household economic institutions as a
result of increased full-time participation by women in the workforce would lead to a
significant increase in effective demand for processed products.
7.4.3 Price and income elasticities for dehulled and whole grain flours
In this section we compute price and income elasticities of demand for male
respondents to evaluate hypotheses (i) and (iii). Although cross-price elasticities to
evaluate whether processed maize products can improve substitutability with rice
cannot be calculated, analysis of the meals at which maize flour would be used
provides a preliminary indication. As maize flour price decreases, increased
consumption occurs primarily at meals where coarse grains are already predominant
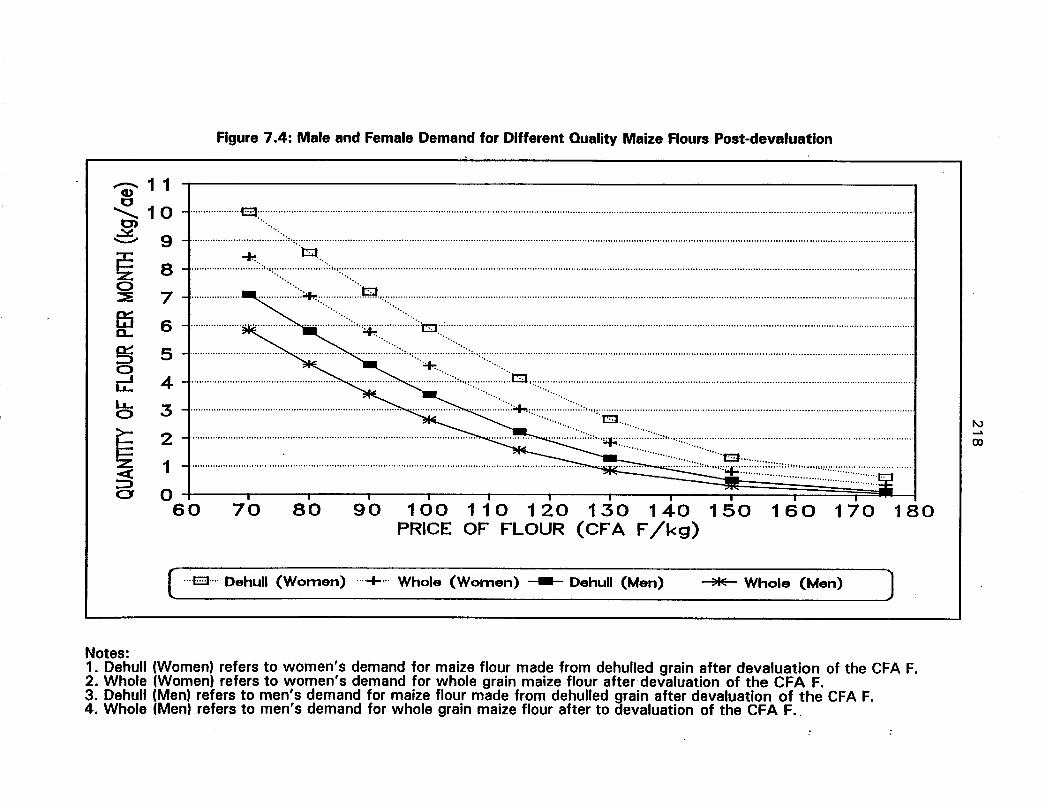
Figure 7.4: Male and Female Demand for Different Quality Maize Flours Post-devaluation
f'J...&
(X)
180170160150100 110 120 130 140PRICE OF FLOUR (CFA F/kg)
908070
..-.11o~ 1 0 G:J::: ....::s:: '".......... 9 ::: ::t;J .2:; +'.~ 8 :::, ..::::::::::: :::,..::::::::: .
:::::e 7 . :+::::: ~.,::::::: .
60
....EJ.... Dehull (Women) ....+ ... Whole (Women) -- Dehull (Men) --*- Whole (Men)
Notes:1. Dehull (Women) refers to women's demand for maize flour made from dehulled grain after devaluation of the CFA F.2. Whole (Women) refers to women's demand for whole grain maize flour after devaluation of the CFA F.3. Dehull (Men) refers to men's demand for maize flour made from dehulled grain after devaluation of the CFA F.4. Whole (Men) refers to men's demand for whole grain maize flour after to devaluation of the CFA F.
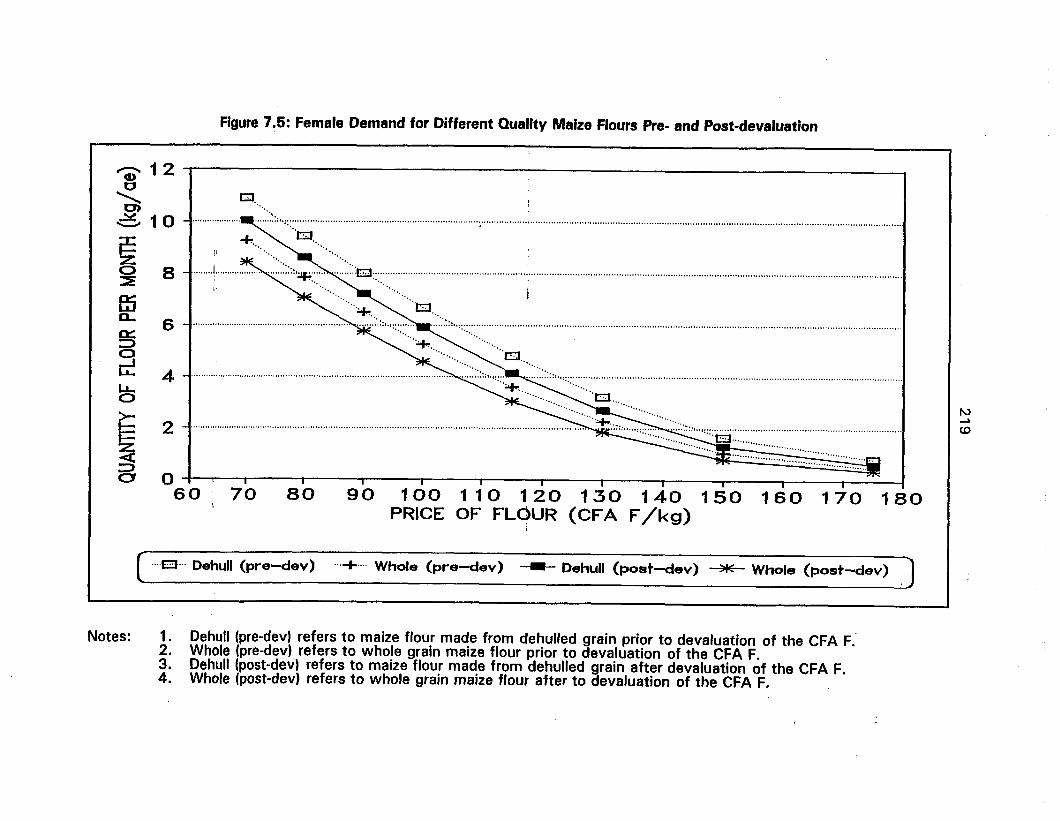
Figure 7.5: Female Demand for Different Qualitv Maize Flours Pre- and Post-devaluation
N~
(,0
............................... '"
..... ::::::1.. :::: .
I ~:: •• :: , .
90 100 110 120 130 140 150 160 170 180PRICE OF FLOUR (CFA F/kg)
80
" .CI.
70
"
.... ·r· ·..·1IIl·····:.:::, .:: : ..
"'0.
6 -4 ~
2-l······ ..· ··.. ···· .. ······ ..·..······················· ~
o I I I I I I Iii iii i I60
4 -l ~
~ 8=:E
f5a..
~
~~
,....-...12 I IQ)o
'ci;C 10
io
....EJ..· Dehull (pre-deY) ...+ .... Whole (pre-dey) --- Dehull (post-dey) --*- Whole (post-dev)
Notes: 1. Detlull (pre-devl refers to maize flour made from dehulled grain prior to devaluation of the CFA F.'2. Whole (pre-dev) refers to whole grain maize flour prior to devaluation of the CFA F.3. Dehull (post-dev) refers to maize flour made from dehulled grain after devaluation of the CFA F.4. Whole (post-dev) refers to whole grain maize flour after to devaluation of the CFA F. .
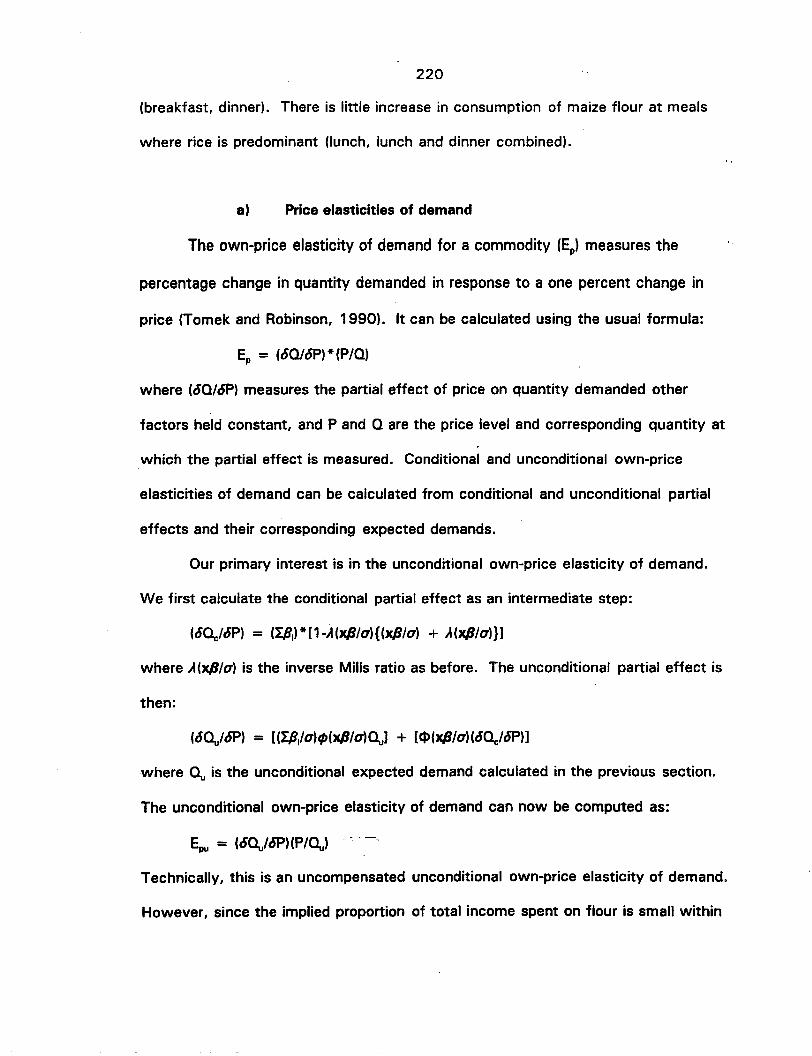
220
(breakfast, dinner). There is little increase in consumption of maize flour at meals
where rice is predominant (lunch, lunch and dinner combined).
a) Price elasticities of demand
The own-price elasticity of demand for a commodity (Ep) measures the
percentage change in quantity demanded in response to a one percent change in
price (Tomek and Robinson, 1990). It can be calculated using the usual formula:
Ep = (6Q/OP)*{P/Q)
where (6Q/OP) measures the partial effect of price on quantity demanded other
factors held constant, and P and Q are the price level and corresponding quantity at
which the partial effect is measured. Conditional and unconditional own-price
elasticities of demand can be calculated from conditional and unconditional partial
effects and their corresponding expected demands.
Our primary interest is in the unconditional own-price elasticity of demand.
We first calculate the conditional partial effect as an intermediate step:
(6QcI6P) = (I,Bj)*[1-A(xPlo){(xPlo) + ,t(xPlo)}l
where ,t(xPlo) is the inverse Mills ratio as before. The unconditional partial effect is
then:
(60u/OP) = [(IP/o)(j)(xPlo)OuJ + [$(xPlo)(60e16P))
where Ou is the unconditional expected demand calculated in the previous section.
The unconditional own-price elasticity of demand can now be computed as:
Epu = (60u/OPHP/Oul
Technically, this is an uncompensated unconditional own-price elasticity of demand.
However, since the implied proportion of total income spent on flour is small within
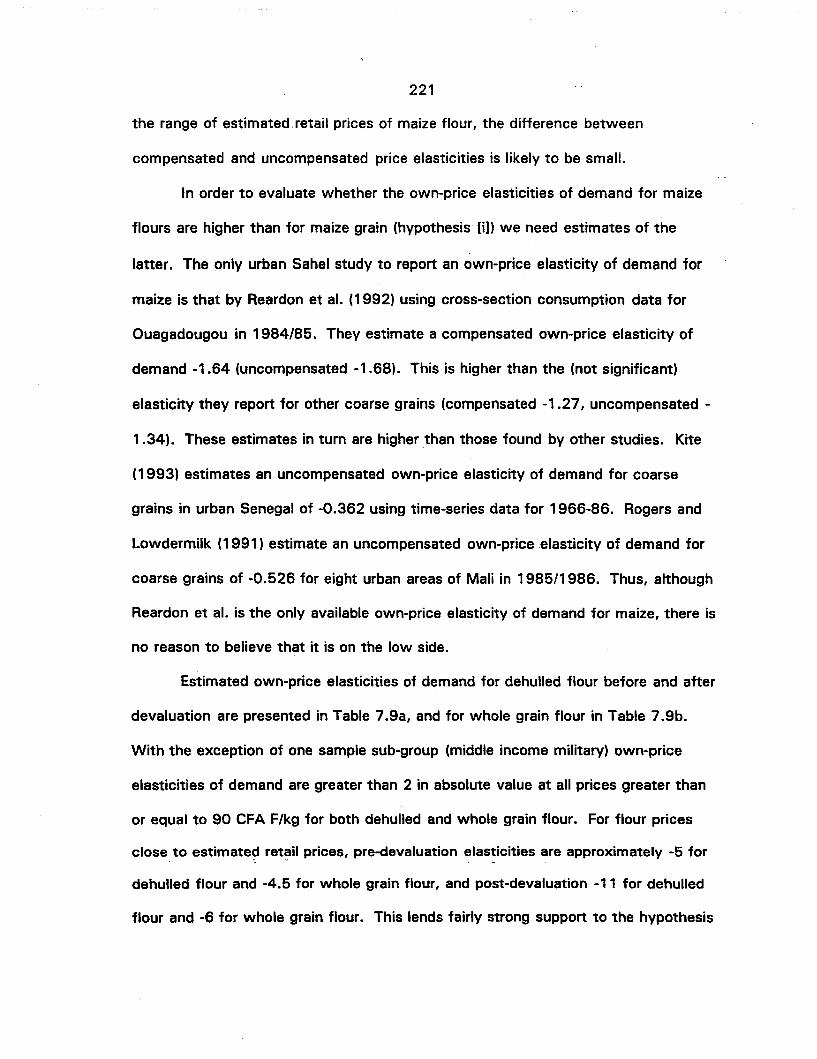
221
the range of estimated ,retail prices of maize flour, the difference between
compensated and uncompensated price elasticities is likely to be small.
In order to evaluate whether the own-price elasticities of demand for maize
flours are higher than for maize grain (hypothesis [i)) we need estimates of the
latter. The only urban Sahel study to report an own-price elasticity of demand for
maize is that by Reardon et al. (1992) using cross-section consumption data for
Ouagadougou in 1984/85. They estimate a compensated own-price elasticity of
demand -1.64 (uncompensated -1.68). This is higher than the (not significant)
elasticity they report for other coarse grains (compensated -1 .27 I uncompensated
1.34). These estimates in turn are higher than those found by other studies. Kite
(1993) estimates an uncompensated own-price elasticity of demand for coarse
grains in urban Senegal of -0.362 using time-series data for 1966-86. Rogers and
Lowdermilk (1991) estimate an uncompensated own-price elasticity of demand for
coarse grains of -0.526 for eight urban areas of Mali in 1985/1986. Thus, although
Reardon et al. is the only available own-price elasticity of demand for maize, there is
no reason to believe that it is on the low side.
Estimated own-price elasticities of demand for dehulled flour before and after
devaluation are presented in Table 7.9a, and for whole grain flour in Table 7.9b.
With the exception of one sample sub-group (middle income military) own-price
elasticities of demand are greater than 2 in absolute value at all prices greater than
or equal to 90 CFA F/kg for both dehulled and whole grain flour. For flour prices
close to estimate~ ret~i1 prices, pre-devaluation elas~icities are approximately -5 for
dehulled flour and -4.5 for whole grain flour, and post-devaluation -11 for dehulled
flour and -6 for whole grain flour. This lends fairly strong support to the hypothesis
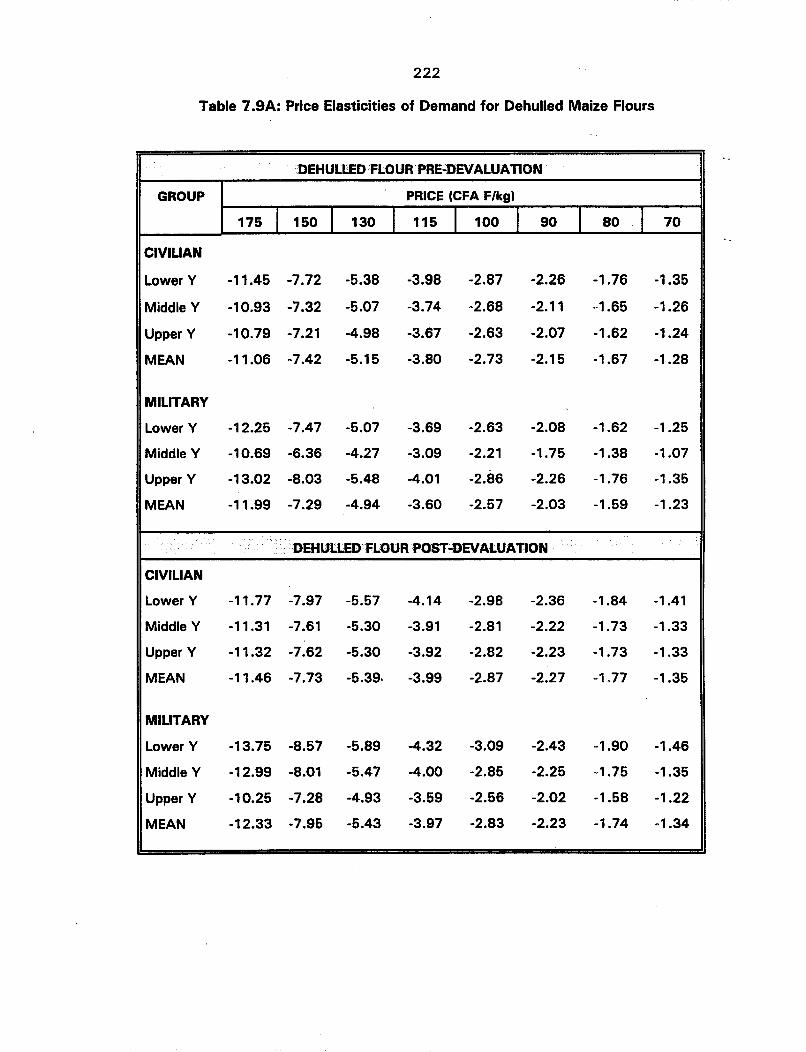
222
Table 1.9A: Price Elasticities of Demand for Dehulled Maize Flours
'DEHULLEDFLOURPRE;;;OEVALUATION
GROUP PRICE (CFA F/kg)
175 I 150 I 130 I 115 I 100 I 90 I 80 I 70
CIVILIAN
Lower Y -11.45 -7.72 -5.38 -3.98 -2.87 -2.26 -1.76 -1.35
Middle Y -10.93 -7.32 -5.07 -3.74 -2.68 -2.11 -1.65 -1.26
Upper Y -10.79 -7.21 -4.98 -3.67 -2.63 -2.07 -1.62 -1.24
MEAN -11.06 -7.42 -5.15 -3.80 -2.73 -2.15 -1.67 -1.28
MILITARY
Lower Y -12.25 -7.47 -5.07 -3.69 -2.63 -2.08 -1.62 -1.25
Middle Y -10.69 -6.36 -4.27 -3.09 -2.21 -1.75 -1.38 -1.07
Upper Y -13.02 -8.03 -5.48 -4.01 -2.86 -2.26 -1.76 -1.35
MEAN -11.99 -7.29 -4.94 -3.60 -2.57 -2.03 -1.59 -1.23
DEHULLEO'FLOURPOST.;DEVALUATION,
CIVILIAN
Lower Y -11.77 -7.97 -5.57 -4.14 -2.98 -2.36 -1.84 -1.41
Middle Y -11.31 -7.61 -5.30 -3.91 -2.81 -2.22 -1.73 -1.33
Upper Y -11.32 -7.62 -5.30 -3.92 -2.82 -2.23 -1.73 -1.33
MEAN -11.46 -7.73 -5.39, -3.99 -2.87 -2.27 -1.77 -1.35
MILITARY
Lower Y -13.75 -8.57 -5.89 -4.32 -3.09 -2.43 -1.90 -1.46
Middle Y -12.99 -8.01 -5.47 -4.00 -2.85 -2.25 -1.75 -1.35
Upper Y -10.25 -7.28 -4.93 -3.59 -2.56 -2.02 -1.58 -1.22
MEAN -12.33 -7.95 -5.43 -3.97 -2.83 -2.23 -1.74 -1.34
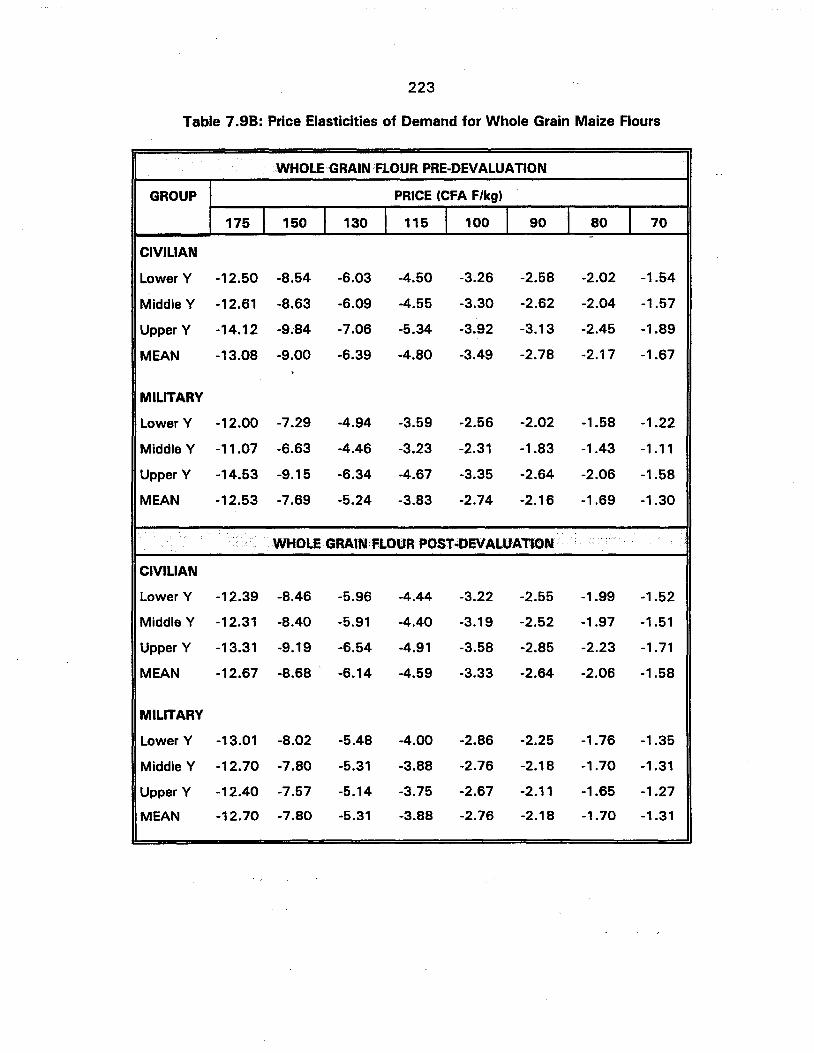
223
Table 7.98: Price Elasticities of Demand for Whole Grain Maize Flours
WHOLE GRAIN FLOURPRE-DEVALUAnON
GROUP PRICE (CFA F/kg)
175 I 150 I 130 I 115 I 100 I 90 I 80 I 70-
CIVILIAN
Lower Y -12.50 -8.54 -6.03 -4.50 -3.26 -2.58 -2.02 -1.54
Middle Y -12.61 -8.63 -6.09 -4.55 -3.30 -2.62 -2.04 -1.57
Upper Y -14.12 -9~84 -7.06 -5.34 -3.92 -3.13 -2.45 -1.89
MEAN -13.08 -9.00 -6.39 -4.80 -3.49 -2.78 -2.17 -1.67
MILITARY
Lower Y -12.00 -7.29 -4.94 -3.59 -2.56 -2.02 -1.58 -1.22
Middle Y -'1.07 -6.63 -4.46 -3.23 -2.31 -1.83 -1.43 -1.11
Upper Y -14.53 -9.15 -6.34 -4.67 -3.35 -2.64 -2.06 -1.58
MEAN -12.53 -7.69 -5.24 -3.83 -2.74 -2.16 -1.69 -1.30
WHOLEGRA1NFLOURPOST~DEVALUATION
CIVILIAN
Lower Y -12.39 -8.46 -5.96 -4.44 -3.22 -2.55 -1.99 -1.52
Middle Y -12.31 -8.40 -5.91 -4.40 -3.19 -2.52 -1.97 -1.5'
Upper Y -13.31 -9.19 -6.54 -4.91 -3.58 -2.85 -2.23 -, .71
MEAN -12.67 -8.68 -6.14 -4.59 -3.33 -2.64 -2.06 -1.58
MILITARY
Lower Y -13.01 -8.02 -5.48 -4.00 -2.86 -2.25 -1.76 -1.35
Middle Y -12.70 -7.80 -5.31 -3.88 -2.76 -2.18 -1.70 -1.31
Upper Y -12.40 -7.57 -5.14 -3.75 -2.67 -2.11 -1.65 -1.27
MEAN -12.70 -7.80 -5.31 -3.88 -2.76 -2.18 -1.70 -1.31
224
that the demand for maize flour is more elastic than for maize grain. Only when the
price of maize flour is more or less equal to the price of grain (70CFA F/kg) are
own-price elasticities of demand in the vicinity of the value reported by Reardon et
al.
The high unconditional price elasticity of demand at estimated retail prices is ..
a reflection of the small quantity purchased. This small quantity reflects the small
proportion of buyers in the population and the smaller quantities purchased by those
buyers at higher prices. As prices fall, both the number of buyers and quantity
purchased per buyer increase. Conditional price elasticities of demand, which
measure only the change in quantity purchased by existing buyers in response to a
change in price, are smaller than unconditional price elasticities (see Appendix 4).
b) Income elasticities of demand
Income elasticities are computed in the same way as own-price elasticities,
with the coefficients on income variables and interaction terms replacing those for
price, and income levels replacing price levels. Reardon et al. (1992) report an
expenditure elasticity of demand of 1.2 for maize in Ouagadougou. Kite (1993)
reports 0.8 for coarse grains in urban Senegal. Rogers and Lowdermilk (1991)
report 0.52 for coarse grains in urban Mali.
Income elasticities of demand for dehulled flour before and after devaluation
are presented in table 7.1 Oa, and for whole grain flour in table 7~'1 Ob. For dehulled
flour, income elasticities of demand are generally less than one for the civilian
population before devaluation, and less than 0.35 after devaluation. For military

225
Table 7.1 OA: Income Elasticities of Demand for Dehulled Maize Flours
....
DEHULLEDFLOURPRE~DEVALUATJON
GROUP PRICE (CFA F/kg)
175 I 150 I 130 I 115 I 100 I 90 I 80 1 70
CIVILIAN
Lower Y 0.56 0.44 0.30 0.23 0.18 0.16 0.14 0.13
Middle Y 0.85 0.67 0.46 0.35 0.28 0.25 .0.22 0.20
Upper Y 1.64 1.28 0.88 0.68 0.54 0.48 0.43 0.39
MEAN 1.02 0.79 0.55 0.42 0.34 0.30 0.27 0.24
MILITARY
Lower Y 3.74 2.66 1.81 1.42 1.16 1.04 0.95 0.87
Middle Y 4.81 3.34 2.30 1.83 1.52 1.38 1.25 1.15
Upper Y 8.87 6.38 4.36 3.39 2.75 2.48 2.22 2.03
MEAN 5.81 4.13 2.82 2.21 1.81 1.63 1.47 1.35
.... .... DEHULLEDFLOURPOST;;,DEVALUATION··· ..
CIVILIAN
Lower Y 0.18 0.14 0.10 0.07 0.06 0.05 0.05 0.04
Middle Y 0.28 0.22 0.15 0.11 0.09 0.08 0.07 0.07
Upper Y 0.54 0.42 0.29 0.22 0.18 0.16 0.14 0.13
MEAN 0.33 0.26 0.18 0.14 0.11 0.10 0.09 0.08
MILITARY
Lower Y 1.80 1.31 0.90 0.69 0.56 0.50 0.45 0.41
Middle Y 2.51 1.81 1.23 0.96 0.78 0.70 0.63 0.58
Upper Y 3.00 2.49 1.70 1.33 1.09 0.98 0.89 0.82
MEAN 2.44 1.87 1.28 0.99 0.81 0.72 0.66 0.60

226
Table 7.1 OB: Income Elasticities of Demand for Whole Grain Maize Flours
WHOLE GRAIN FLOUR PRE-DEVALUATION
GROUP PRICE (CFA F/kg)
175 I 150 I 130 I 115 I 100 I 90 I 80 I 70
CIVILIAN
Lower Y -0.12 -0.10 -0.07 -0.05 -0.04 -0.04 -0.03 -0.03
Middle Y -0.20 -0.16 -0.11 -0.08 -0.07 -0.06 -0.05 -0.05
Upper Y -0.43 -0.35 -0.25 -0.19 -0.15 -0.13 -0.11 -0.10
MEAN -0.25 -0.20 -0.14 -0.11 -0.09 -0.07 -0.06 -0.06
MILITARY
Lower Y 3.04 2.16 1.47 1.16 0.95 0.85 0.77 0.71
Middle Y 4.14 2.89 1.98 1.57 1.31 1.18 1.07 0.98
Upper Y 8.24 6.05 4.16 3.21 2.56 2.26 2.03 1.85
MEAN 5.14 3.70 2.54 1.98 1.61 1.43 1.29 1.18
.... ··WHOLE GRAIN FLOUR POST.;;DEVALUAnON ..
CIVILIAN
Lower Y -0.07 -0.06 -0.04 -0.03 -0.02 -0.02 -0.02 -0.02
Middle Y -0.11 -0.09 -0.06 -0.05 -0.04 -0.03 -0.03 -0.03
Upper Y -0.24 -0.20 -0.14 -0.11 -0.08 -0.07 -0.06 -0.06
MEAN -0.14 -0.11 -0.08 -0.06 -0.05 -0.04 -0.04 -0.03
MILITARY
Lower Y 1.41 1.02 0.69 0.54 0.44 0.39 0.35 0.32
Middle Y 2.04 1.46 1.00 0.78 0.63 0.57 0.51 0.47
Upper Y 3.01 2.14 1.46 1.14 0.94 0.84 0.76 0.70
MEAN 2.15 1.54 1.05 0.82 0.67 0.60 0.54 0.50

227
households, income elasticities of demand are generally greater than the Reardon et
al. estimate before devaluation, but fall sharply with devaluation. For civilian
households, the evidence suggests that the demand for flour is not more income-
elastic than the demand for grain.
For whole grain flour, income elasticities of demand are negative before and, .
albeit smaller. in absolute value,. after devaluation.. This is fairly strong evidence that
for the oivilian-population whole grain flour is an inferior good (hypothesis- (jim. -
However, ins unlikely that it issufficiently-inferior to make it a self-targeting food-
aid commodity.28 At prices that food insecure urban families could afford to pay,
there would likely be significant demand from better-off segments of the population.
For military personnel, whole grain flour has positive income elasticities of demand
before and after devaluation, but smaller than for dehulled .grain.
The combination of relatively high own-price elasticities of demand and
relatively low or negative income elasticities of demand for maize flour suggests
that, at least for male respondents, the primary objective is to obtain processing
services at the lowest cost possible. There is nothing inherently superior in buying
a pre-processed product compared to a home-processed product.
The relatively high income elasticities of demand for military households
warrant further examination. In contrast to the positive and significant coefficient
on the interaction term between military and income for maize flour, the same term
in the Engels curve regressions presented in chapter 6 is insignificant for
unprocessed grain and grits, and negative for dehulled grain. Thus, there is no
statistical evidence that military households have learned to like maize more than
28 Yellow whole grain maize flour would be more suitable for this purposebecause of its unpleasant odor and distinct orange coloration when prepared as toh.
228
civilian households (e.g., as a result of assistance with procurement), although the
possibility should not be discounted given the very small sample size (18
households). The high income elasticities of demand could be related to the fact
that household heads are often away from home for long periods for training or
duties related to the civil war in the north of the country. Given the large number of '
military households in and near Bamako (there is a large military base at Kati, about
20,km..from.Bamako), and the geographic concentration of this market (Jow
distribution costs), itwould be worth studying in detail with a larger'sample,
perhaps in conjunction with a market test of the products.
c) Substitution between maize flour and other cereals
In the contingent valuation test, the reference prices of rice (150 CFA F/kg)
and coarse grains (70 CFA F/kg) were held constant as the price of flour was
varied.. Thus it is not possible to formally compute a cross-price elasticity between
maize flour and rice, which is generally considered to be low or even negative for
coarse grains (implying that rice and coarse grains are complements rather than
substitutes). However, we can make an informed guess by comparing the meals at
which maize flour will be used as the price of flour falls and the quantity of flour
consumers are willing to purchase increases with current cereal use patterns.
Table 6.7 presented the percentage of main meals prepared by frequent-visit
survey households from different cereals over a one-year period by income tercile.
Recall that coarse grains are the primary source of cereal calories for breakfast and
dinner, accounting for 61 % and 56% respectively averaged over the sample as a
whole. Taken on its own, maize accounts for 6% of breakfast meals and 7% of

229
dinner meals. Analysis by income tercile reveals that the share of coarse grains at
breakfast and dinner declines consistently as income rises. Rice is the primary
source of cereal calories at lunch or for combined lunch/dinner meals (Le.,
household prepares only one main meal a day in addition to breakfast), accounting
for 72% and 67% respectively averaged over the sample as a whole. The poorest
income tercile has the lowest proportion of rice-based meals at lunch and
lunch/dinner combined. Thus, if maize flour is more substitutable for rice than
coarse grains generally, we would hope to see an increasing proportion of lunch and
lunch/dinner combined meals made from maize flour as its price decreases,
particularly among the middle and high-income terciles.
Table 7.11 presents the percentage of main meals that would be prepared
from dehulled and whole grain maize flour at different prices. Figures in
parentheses are for female respondents. For both male and female respondents and
for both types of flour, expansion of consumption in response to price is most
marked at breakfast and dinner, meals where coarse grains are already the primary
source of calories. Expansion of consumption at lunch, where rice is predominant,
is negligible. There is considerably more expansion in maize flour consumption for
the combined lunch/dinner meal than for lunch, but even here the proportion of
meals prepared from maize flour never exceeds the proportion currently prepared
from coarse grains, even at the lowest flour price.
Table 7.12 presents the percentage of main meals that would be prepared
from dehulled and whole grain maize flour by income tercile averaged over all
prices. Again, consumption of maize flour follows rather than challenges the
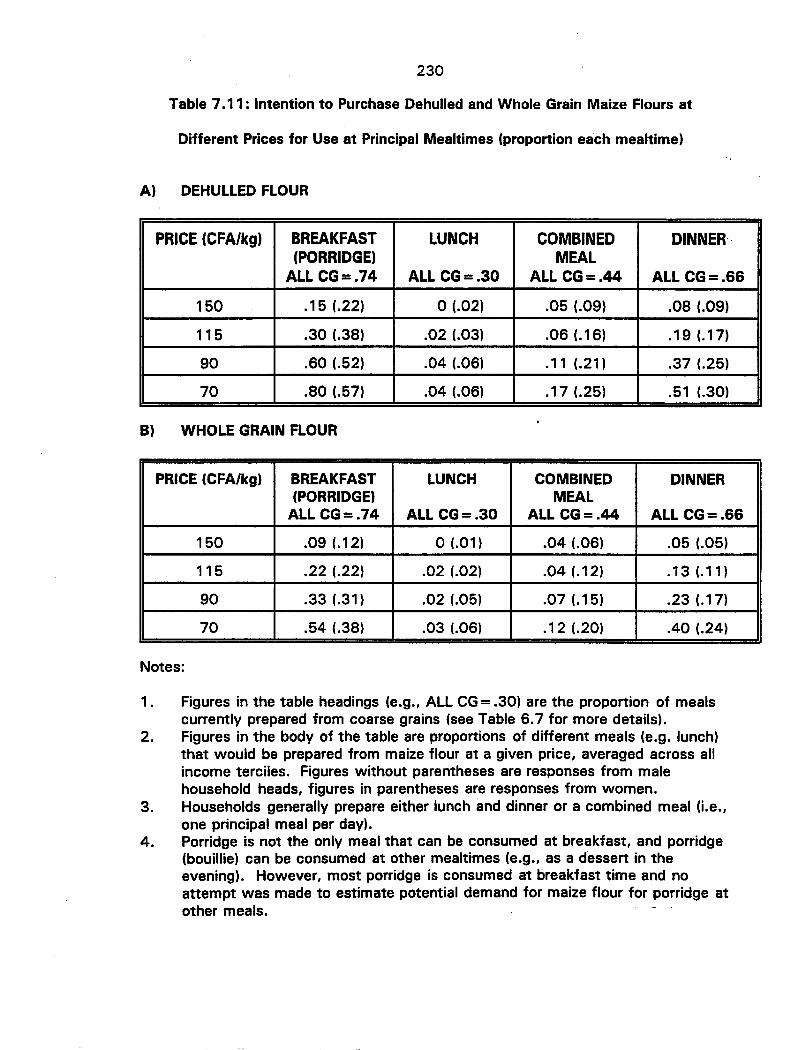
230
Table 7.11: Intention to Purchase Dehulled and Whole Grain Maize Flours at
Different Prices for Use at Principal Mealtimes (proportion each mealtime)
A) DEHULLED FLOUR
PRICE (CFA/kg) BREAKFAST LUNCH COMBINED DINNER(PORRIDGE) MEAL
ALL CG=.74 ALL CG=.30 ALL CG=.44 ALL CG=.66
150 .15 (.22) o (.02) .05 (.09) .08 (.09)
115 .30 (.38) .02 (.03) .06 (.16) .19 (.17)
90 .60 (.52) .04 (.06) .11 (.21) .37 (.25)
70 .80 (.57) .04 (.06) .17 (.25) .51 (.30)
B) WHOLE GRAIN FLOUR
PRICE (CFA/kg) BREAKFAST LUNCH COMBINED DINNER(PORRIDGE) MEAL
ALL CG=.74 ALL CG=.30 ALL CG=.44 ALL CG=.66
150 .09 (.12) o (.01) .04 (.06) .05 (.05)
115 .22 (.22) .02 (.02) .04 (.12) .13 (.11)
90 .33 (.31) .02 (.05) .07 (.15) .23 (.17)
70 .54 (.38) .03 (.06) .12 (.20) .40 (.24)
Notes:
1. Figures in the table headings (e.g., ALL CG = .30) are the proportion of mealscurrently prepared from coarse grains (see Table 6.7 for more details).
2. Figures in the body of the table are proportions of different meals (e.g. lunch)that would be prepared from maize flour at a given price, averaged across allincome terciles. Figures without parentheses are responses from malehousehold heads, figures in parentheses are responses from women.
3. Households generally prepare either lunch and dinner or a combined meal (i.e.,one principal meal per day).
4. Porridge is not the only meal that can be consumed at breakfast, and porridge(bouillie) can be consumed at other mealtimes (e.g., as a dessert in theevening). However, most porridge is consumed at breakfast time and noattempt was made to estimate potential demand for maize flour for porridge atother meals.
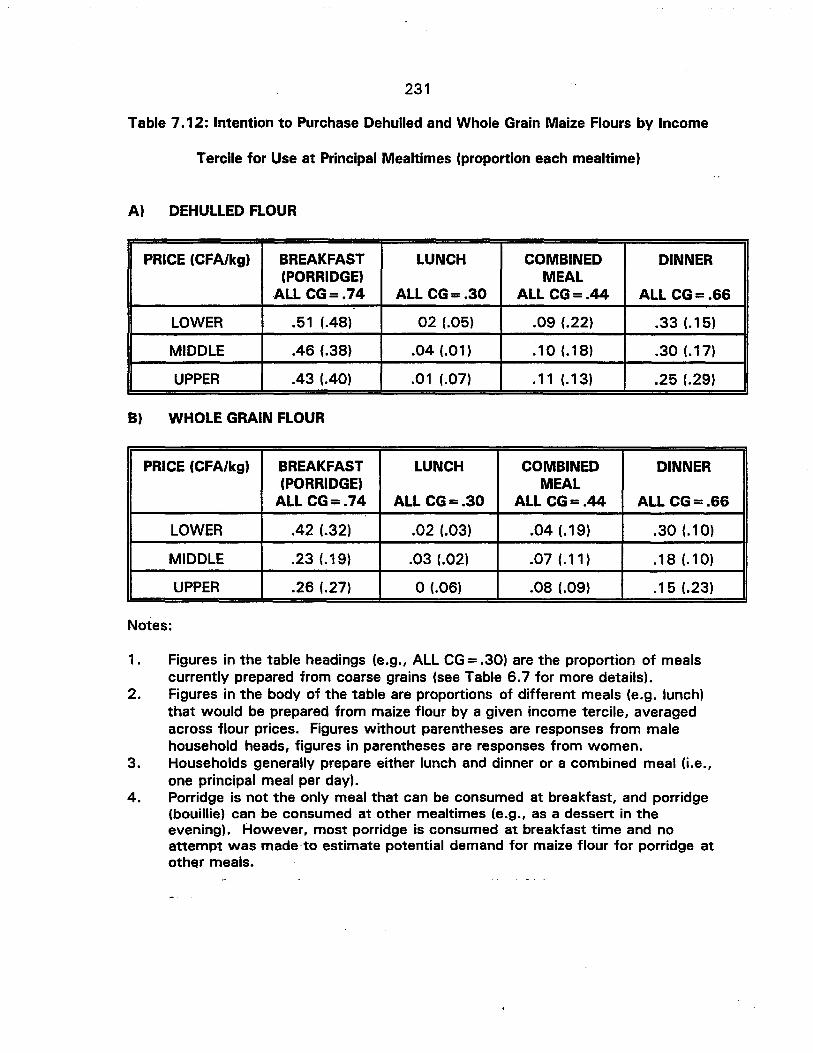
231
Table 7.12: Intention to Purchase Dehulled and Whole Grain Maize Flours by Income
Tercile for Use at Principal Mealtimes (proportion each mealtime)
A) DEHULLED FLOUR
PRICE (CFA/kg) BREAKFAST LUNCH COMBINED DINNER(PORRIDGE) MEAL
·ALL CG=.74 ALL CG=.30 ALL CG=.44 ALL CG=.66
LOWER .51 (.48) 02 (.05) .09 (.22) .33 (.15)
MIDDLE .46 (.38) .04 (.01) .10 (.18) .30 (.17)
UPPER .43 (.40) .01 (.07) .11 (.13) .25 (.29)
B} WHOLE GRAIN FLOUR
PRICE (CFA/kg) BREAKFAST LUNCH COMBINED DINNER(PORRIDGE) MEAL
ALL CG=.74 ALL CG=.30 ALL CG=.44 ALL CG=.66
LOWER .42 (.32) .02 (.03) .04 (.19) .30 (.10)
MIDDLE .23 (.19) .03 (.02) .07 (.11) .18 (.10)
UPPER .26 (.27) o (.06) .08 (.09) .15 (.23)
Notes:
1. Figures in the table headings (e.g., ALL CG =.30) are the proportion of mealscurrently prepared from coarse grains (see Table 6.7 for more details).
2. Figures in the body of the table are proportions of different meals (e.g. lunch)that would be prepared from maize flour by a given income tercile, averagedacross flour prices. Figures without parentheses are responses from malehousehold heads, figures in parentheses are responses from women.
3. Households generally prepare either lunch and dinner or a combined meal (i.e.,one principal meal per day).
4. Porridge is not the only meal that can be consumed at breakfast, and porridge(bouillie) can be consumed at other mealtimes (e.g., as a dessert in theevening). However, most porridge is consumed at breakfast time and noattempt was made to estimate potential demand for maize flour for porridge atother meals.

232
prevailing cereal utilization patterns. Consumption of maize flour is highest for the
low-income tercile and declines as income rises. The only important exceptions to
this trend are women respondents for dinner and male respondents for the
combined lunch/dinner meal (although the increase across income terciles is very
small in the latter case).
In sum, the response of maize flour consumption to price appears to follow
prevailing coarse grain utilization patterns by meal and income group. There is little
evidence to suggest that maize flour is significantly more substitutable with rice
than unprocessed coarse grains generally.29 This is consistent with the finding of
low or negative income elasticities for maize flour. It is also consistent with the
high observed own-price elasticities of demand, suggesting that the primary concern
of (male household-head) consumers is to obtain processing services at lowest cost.
The possibility that maize flour may not improve substitutability with rice
should not deter policymakers from seeking to reduce coarse grain processing
costs. The significantly higher, but presently ineffective, demand for maize flour for
women is indicative of the high social returns to mechanizing labor-intensive cereal
processing tasks. This is reinforced by the finding that even whole-grain maize flour
has a positive income elasticity for women consumers. Possibilities for reducing the
cost of coarse grain dehulling services, as an additional option, are briefly reviewed
in section 7.5.
29 The apparent lack of substitutability of maize flour for rice does not implythat this is also the case for other processed maize products. In chapter six it wasreported that both maize grits and rice can be used for seri, although the mixture offloury and horny endosperm makes maize an expensive source of grits, andhousewives report that they take considerably longer than rice to prepare.
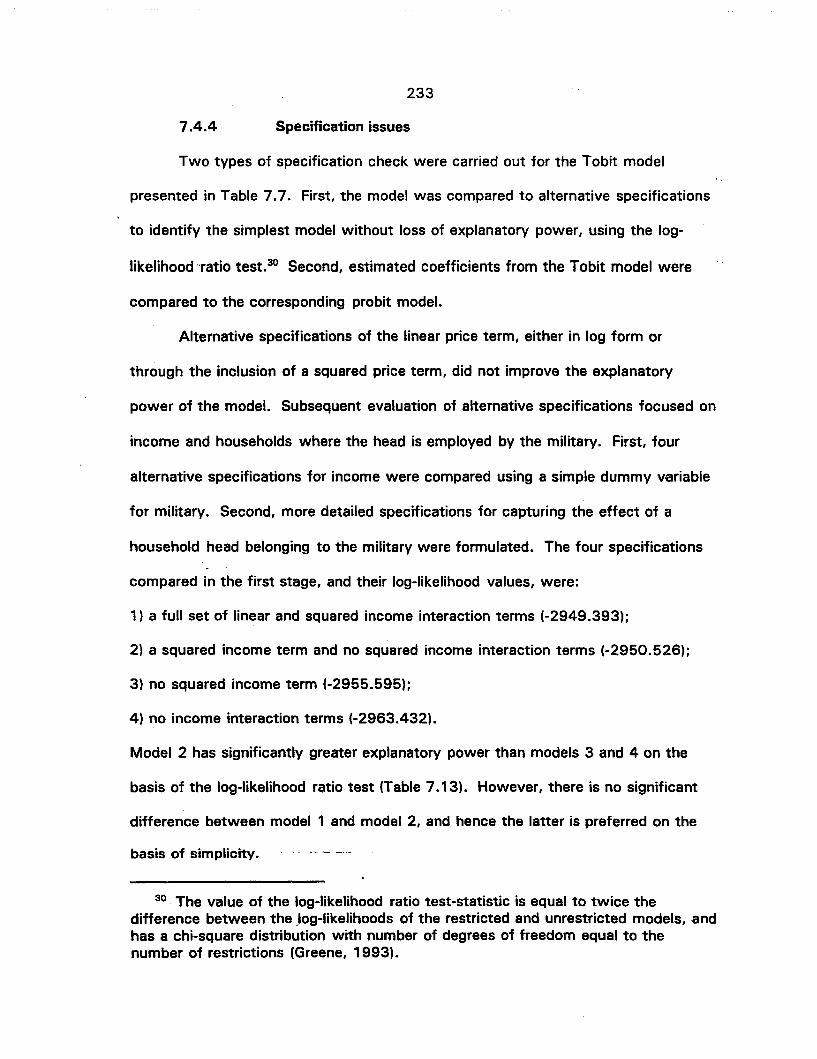
7.4.4
233
Specification issues
Two types of specification check were carried out for the Tobit model
presented in Table 7.7. First, the model was compared to alternative specifications
to identify the simplest model without loss of explanatory power, using the log-
likelihood "ratio test.30 Second, estimated coefficients from the Tobit model were
compared to the corresponding probit model.
Alternative specifications of the linear price term, either in log form or
through the inclusion of a squared price term, did not improve the explanatory
power of the model. Subsequent evaluation of alternative specifications focused on
income and households where the head is employed by the military. First, four
alternative specifications for income were compared using a simple dummy variable
for military. Second, more detailed specifications for capturing the effect of a
household head belonging to the military were formulated. The four specifications
compared in the first stage, and their log-likelihood values, were:
1) a full set of linear and squared income interaction terms (-2949.393);
2) a squared income term and no squared income interaction terms (-2950.526);
3) no squared income term (-2955.595);
4) no income interaction terms (-2963.432).
Model 2 has significantly greater explanatory power than models 3 and 4 on the
basis of the log-likelihood ratio test (Table 7.13). However, there is no significant
difference between model 1 and model 2, and hence the latter is preferred on the
basis of simplicity.
30 The value of the log-likelihood ratio test-statistic is equal to twice thedifference between the _log-likelihoods of the restricted and unrestricted models, andhas a chi-square distribution with number of degrees of freedom equal to thenumber of restrictions (Greene, 1993).

234
Table 7.13: Likelihood Ratio Test Statistics for Alternative Specifications for Income
Model 2 3 4
1 2.27 (ns) 12.4 (.025) 28.08 (.005)
2 .. ,10.1 (.005) 25.8 (.005)
'.'
3 I .••.. >•..•.... .:. ...: .:::::: 15.67 (.005)
Note: chi-square significance level in parentheses
A similar procedure was the used to determine the appropriate specification
for capturing the effect of a military household, using model 2 above as the simplest
version. The four specifications compared in the second stage, and their log-
likelihood values, were:
5) price, income and flour quality interaction terms with military (-2891.316);
6) no complex price interaction term (military by gender by price) (-2891.338);
7) no price or quality interaction terms (-2899.254);
8} no interaction terms, equivalent to model 2 above (-2950.526).
Model 6 has equivalent explanatory power to model 5 but significantly greater
explanatory power than models 7 and 8 on the basis of the log-likelihood ratio test
(Table 7.14) and was used to derive estimated demand for maize flours.
Table 7.14: Likelihood Ratio Test Statistics for Alternative Specifications for
Military Household
Model 6 7 8
5
6
7
0.09 (ns) 15.9 (.01)
I . .': '.:., .':. ':":.. ': ........• : .I', ··r~. : .... .:' .... < .. " •• '.::
118.4 (.005)
118.3 (.005)
102.0 (.005)
Note: .chi-square significance level in parentheses
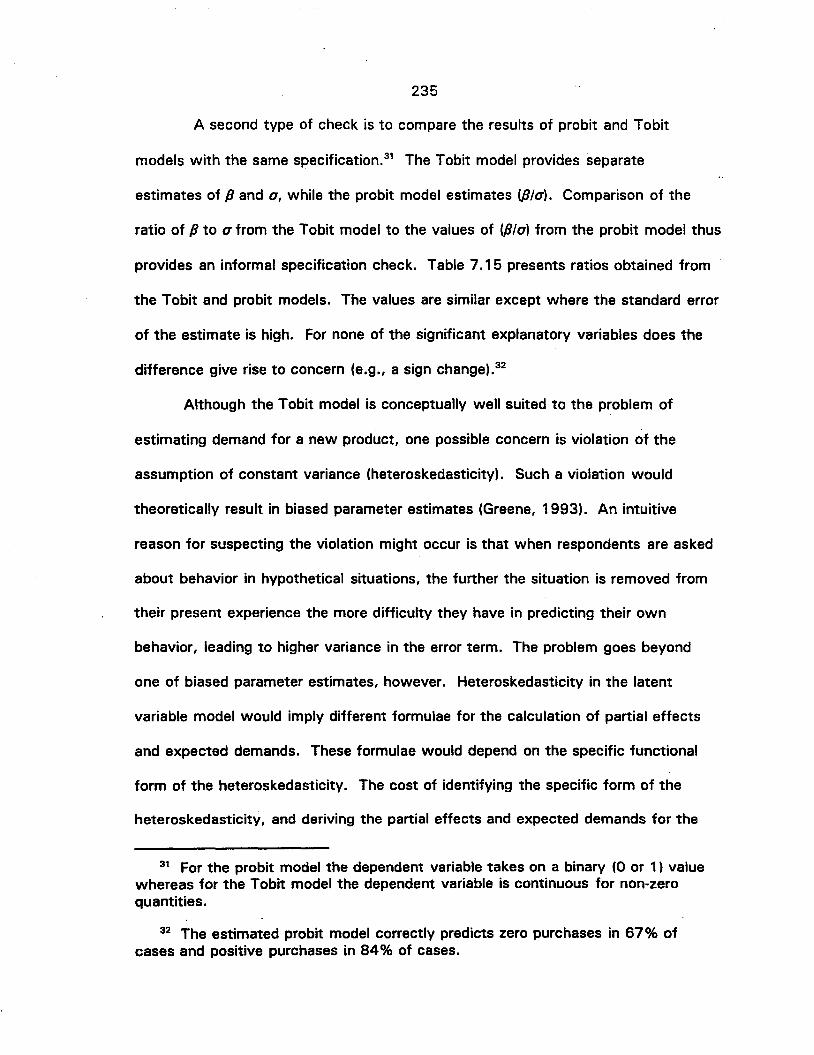
235
A second type of check is to compare the results of probit and Tobit
models with the same specification.31 The Tobit model provides separate
estimates of P and 0, while the probit model estimates (pIa). Comparison of the
ratio of P to a from the Tobit model to the values of (pIa) from the probit model thus
provides an informal specification check. Table 7.15 presents ratios obtained from
the Tobit and probit models. The values are similar except where the standard error
of the estimate is high. For none of the significant explanatory variables does the
difference give rise to concern (e.g., a sign change).32
Although the Tobit model is conceptually well suited to the problem of
estimating demand for a new product, one possible concern is violation of the
assumption of constant variance (heteroskedasticity). Such a violation would
theoretically result in biased parameter estimates (Greene, 1993). An intuitive
reason for suspecting the violation might occur is that when respondents are asked
about behavior in hypothetical situations, the further the situation is removed from
their present experience the more difficulty they have in predicting their own
behavior, leading to higher variance in the error term. The problem goes beyond
one of biased parameter estimates, however. Heteroskedasticity in the latent
variable model would imply different formulae for the calculation of partial effects
and expected demands. These formulae would depend on the specific functional
form of the heteroskedasticity. The cost of identifying the specific form of the
heteroskedasticity, and deriving the partial effects and expected demands for the
31 For the probit model the dependent variable takes on a binary (0 or 1) valuewhereas for the Tobit model the dependent variable is continuous for non-zeroquantities.
32 The estimated probit model correctly predicts zero purchases in 67% ofcases and positive purchases in 84% of cases.
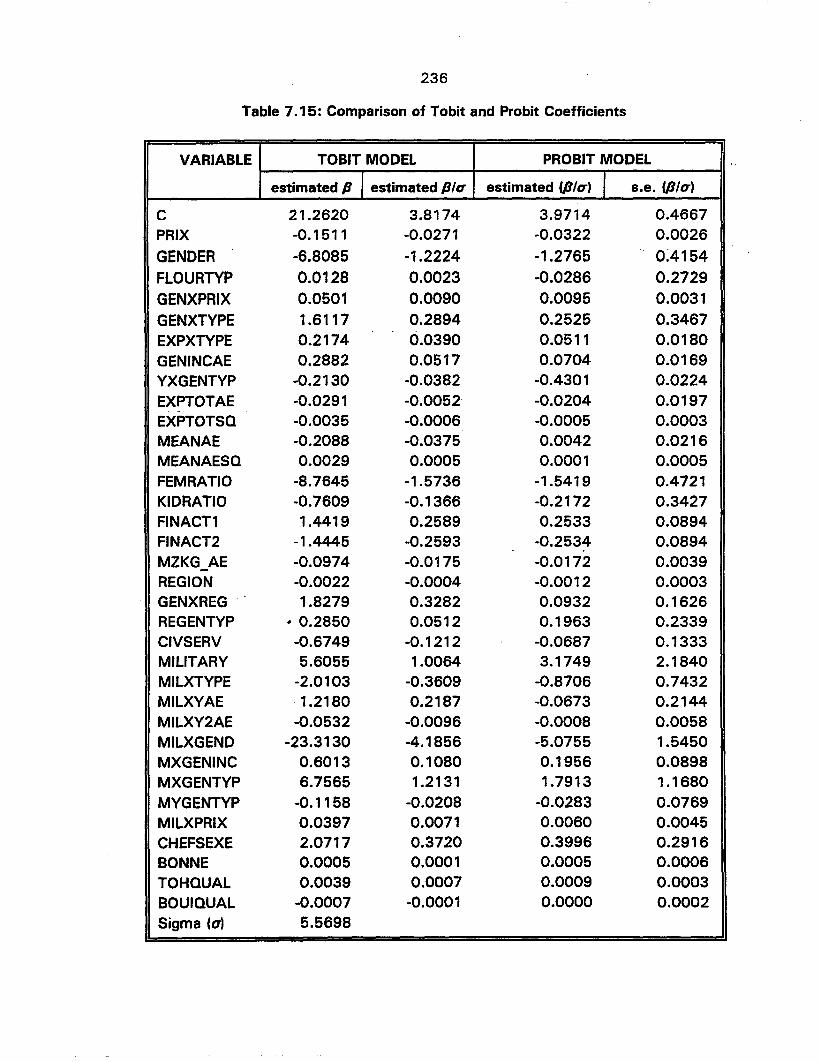
236
Table 7.15: Comparison of Tobit and Probit Coefficients
VARIABLE TOBIT MODEL PROBIT MODEL
estimated p Iestimated PItT estimated f/JltT) I s.e. f/JltT)
C 21.2620 3.8174 3.9714 0.4667PRIX -0.1511 -0.0271 -0.0322 0.0026
GENDER -6.8085 -1.2224 -1.2765 0.4154
FLOURTYP 0.0128 0.0023 -0.0286 0.2729
GENXPRIX 0.0501 0.0090 0.0095 0.0031
GENXTYPE 1.6117 0.2894 0.2525 0.3467EXPXTYPE 0.2174 0.0390 0.0511 0.0180GENINCAE 0.2882 0.0517 0.0704 0.0169YXGENTYP -0.2130 -0.0382 -0.4301 0.0224EXPTOTAE -0.0291 -0.0052 -0.0204 0.0197
-EXPTOTSQ -0.0035 -0.0006 -0.0005 0.0003MEANAE -0.2088 -0.0375 0.0042 0.0216MEANAESQ 0.0029 0.0005 0.0001 0.0005FEMRATIO -8.7645 -1.5736 -1.5419 0.4721KIDRATIO -0.7609 -0.1366 -0.2172 0.3427FINACT1 1.4419 0.2589 0.2533 0.0894FINACT2 -1.4445 -0.2593 -0.2534 0.0894MZKG_AE -0.0974 -0.0175 -0.0172 0.0039REGION -0.0022 -0.0004 -0.0012 0.0003GENXREG - 1.8279 0.3282 0.0932 0.1626REGENTYP • 0.2850 0.0512 0.1963 0.2339CIVSERV -0.6749 -0.1212 -0.0687 0.1333MILITARY 5.6055 1.0064 3.1749 2.1840MILXTYPE -2.0103 -0.3609 -0.8706 0.7432MILXYAE 1.2180 0.2187 -0.0673 0.2144MILXY2AE -0.0532 -0.0096 -0.0008 0.0058MILXGEND -23.3130 -4.1856 -5.0755 1.5450MXGENINC 0.6013 0.1080 0.1956 0.0898MXGENTYP 6.7565 1.2131 1.7913 1.1680MYGENTYP -0.1158 -0.0208 -0.0283 0.0769MILXPRIX 0.0397 0.0071 0.0060 0.0045CHEFSEXE 2.0717 0.3720 0.3996 0.2916BONNE 0.0005 0.0001 0.0005 0.0006TOHQUAL 0.0039 0.0007 0.0009 0.0003BOUIQUAL -0.0007 -0.0001 0.0000 0.0002Sigma (0) 5.5698
237
heteroskedasticity-robust case, would be high. On the other hand, since both the
estimated coefficients and the formulae for deriving partial effects and expected
demands change, the results obtained may not differ greatly from those generated
by a model that ignored the violation.33 In view of the increasing use of
contingent valuation techniques in forward-looking policy analysis, the question of
the magnitude of error in predictions of the actual rather than latent dependent
variable is one that requires further research.
7.5 Commercial feasibility of maize flour
This section is divided into two parts. The first part estimates the magnitude
of aggregate demand for dehulled and whole grain flours at estimated retail prices,
and discusses possible market development strategies. The second part briefly
discusses alternative options for alleviating coarse-grain processing constraints,
specifically the possibility to reduce the cost of mechanical dehulling services.
7.5.1 Aggregate demand for maize flour and alternative marketing strategies
In order to project aggregate demand for dehulled and whole-grain maize
flour we first need to estimate the adult equivalent population for the District of
Bamako. The last population census, conducted April 1 - 14th, 1987 reported
186,375 men, 184,066 women, and 284,889 children aged 14 or less (DNSI,
1990). This represents 476,072 adult equivalents using the same weights used for
the cereal and flour consumption analyses (adult male = 1; adult female = 0.8;
33 The extent of the difference would depend on the range of independentvariable values for which predictions are of interest, with differences becomingincreasingly important toward extreme values.
238
child = 0.5). Urban population growth rates are believed to be between 3% and
4% per annum. At the lower bound, the population for the District of Bamako
would be 585,508 ae in 1994; at the higher rate 626,478 ae. For the purposes of
this analysis we will assume a population of 600,000 ae. Each kg/ae/month
translates into an aggregate projected demand of 600 tons per month.
Figure 7.6 and Table 7.16 present aggregate monthly demand for dehulled
and whole grain flour at different prices before and after devaluation. Devaluation
affects quantity demanded in two ways. First, it reduces consumer real incomes in
the short run. Second, it increases processing costs and therefore retail prices.
Given relatively low income- and relatively high price-elasticities of demand for
maize flour, the increase in processing costs has a more significant effect on
aggregate demand than the reduction in real incomes. Prior to devaluation,
assuming prices of 150 CFA F/kg for dehulled and 115 CFA F/kg for whole grain
flour, projected demand would be approximately 380 tons per month for dehulled
and 815 tons per month for whole grain flour.
Post-devaluation, assuming a price of 175 CFA F/kg for dehulled and 130
CFA F/kg for whole grain flour, projected demand falls sharply to 70 tons per month
for dehulled and 490 tons per month for whole grain flour. For whole grain flour,
this is approximately equal to current levels of maize grain consumption. However,
these prices assume bulk (50 kg) packaging. During the promotional phase, with
small (S kg) packages, prices would be approximately 10 CFA F/kg higher unless
subsidized. This would reduce demand still further to (interpolating using the
elasticities for the civilian sample in section 7.4.3.a) 26 tons per month for dehulled
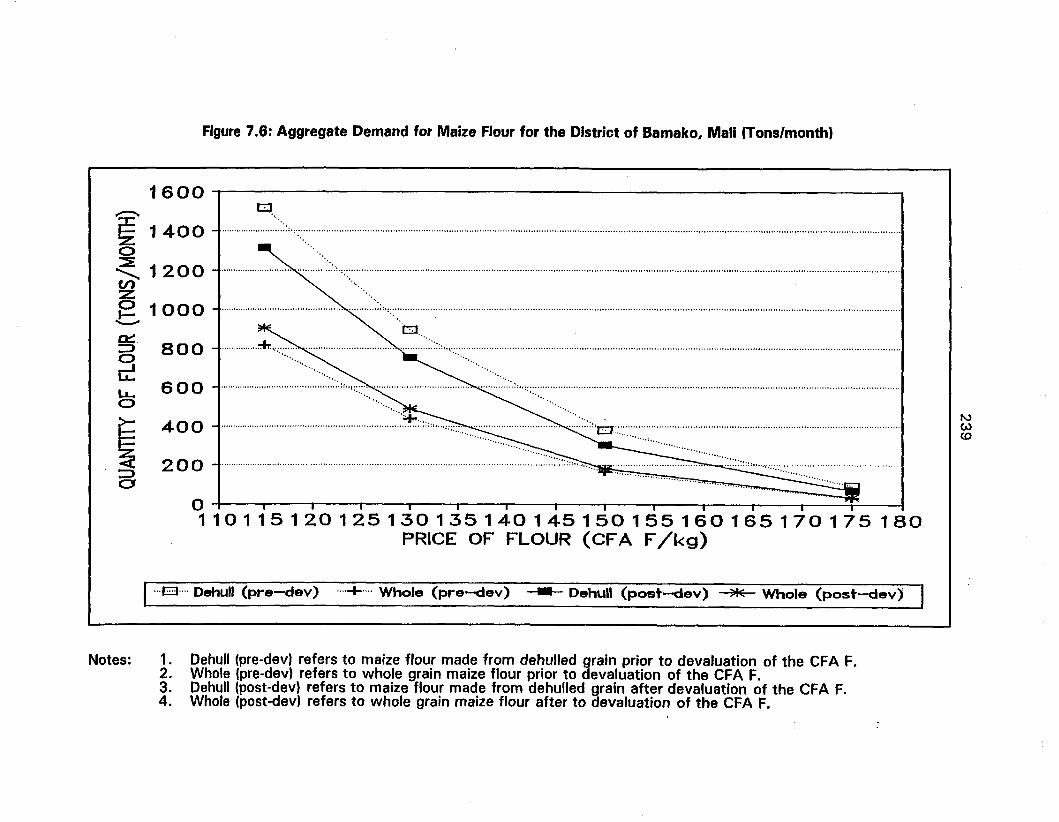
Figure 7.6: Aggregate Demand for Maize Flour for the District of Bamako, Mali (Tons/month)
'"W<0
~ :~;::::".."'..:::::::: .
0 ..
...............::fr. :::~ ~ ::::: ::: .
······.······ .. ············:·1························· .
................................................................··· ..: ±:::::~··················~::::::'S·:::.· ·.· ; : .
200
400
600u..o
i::>o
1600 I I
....-.~ 1400o I ~ .~ 1 200 -I ~ ::.:: .Ul
~ 1 00 0 1····· ·.. ···· .. ·······.. ·····················~·······:·:::.: .- *..... "'" 't:;]..
~' 800
~
o I I I I I I I I I I I I Ii I110115120125130135140145150155160165170175180
PRICE OF" FLOUR (CFA F/kg)
I;..£3.... Dehu" (pre-dey) ....+ .... Whole (pre-dev) --- Dehull (post-dey) ~ Whole (post-dey) I
Notes: 1. Oehu" (pre-dev) refers to maize flour made from dehulled grain prior to devaluation of the CFA F.2. Whole (pre-dev) refers to whole grain maize flour prior to devaluation of the CFA F.3. Oehull (post-dev) refers to maize flour made from dehulled grain after devaluation of the CFA F.4. Whole (post-dev) refers to whole grain maize flour after to devaluation of the CFA F.
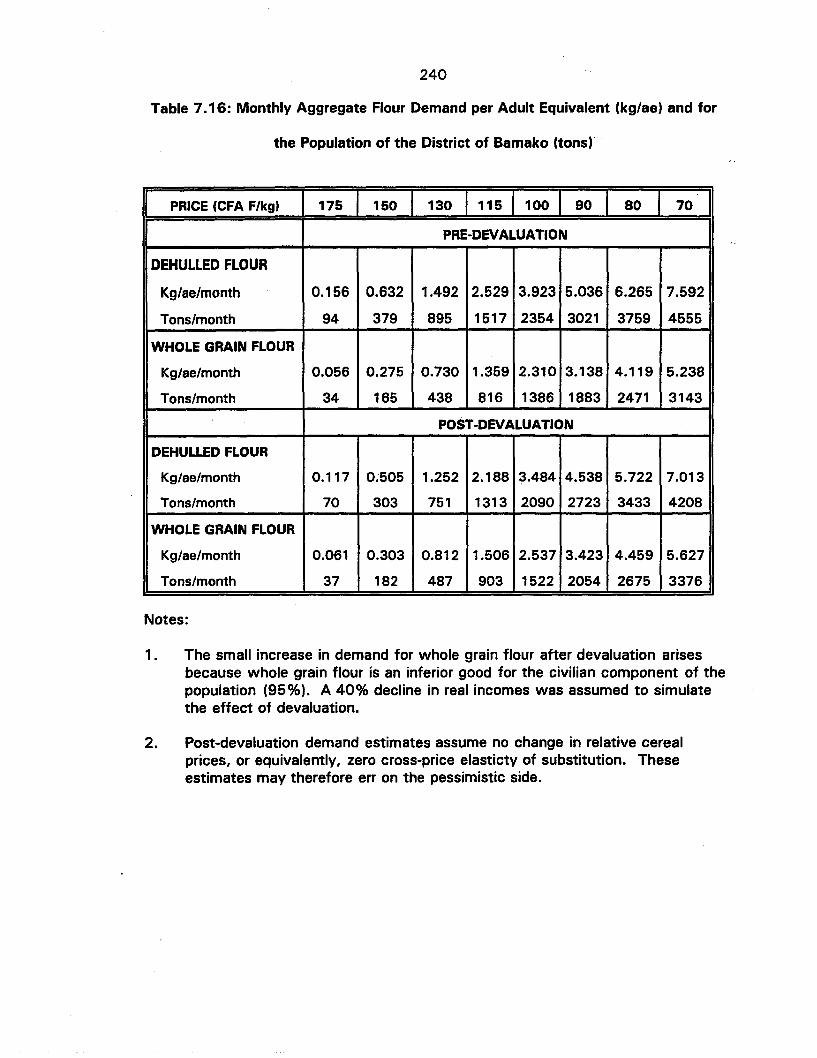
240
Table 7.16: Monthly Aggregate Flour Demand per Adult Equivalent (kg/ae) and for
the Population of the District of Bamako (tons) .
PRICE (CFA F/kg) 175 150 130 115 100 90 80 70
PRE-DEVALUAT'ON
DEHULLED FLOUR
Kg/se/month 0.156 0.632 1.492 2.529 3.923 5.036 6.265 7.592
Tons/month 94 379 895 1517 2354 3021 3759 4555
WHOLE GRAIN FLOUR
Kg/ae/month 0.056 0.275 0.730 1.359 2.310 3.138 4.119 5.238
Tons/month 34 165 438 816 1386 1883 2471 3143
POST-DEVALUATION
DEHULLED FLOUR
Kg/ae/month 0.117 0~505 1.252 2.188 3.484 4.538 5.722 7.013
Tons/month 70 303 751 1313 2090 2723 3433 4208
WHOLE GRAIN FLOUR
Kg/ae/month 0.061 0.303 0.812 1.506 2.537 3.423 4.459 5.627
Tons/month 37 182 487 903 1522 2054 2675 3376
Notes:
1. The small increase in demand for whole grain flour after devaluation arisesbecause whole grain flour is an inferior good for the civilian component of thepopulation (95%). A 40% decline in real incomes was assumed to simulatethe effect of devaluation.
2. Post-devaluation demand estimates assume no change in relative cerealprices, or equivalently, zero cross-price elasticty of substitution. Theseestimates may therefore err on the pessimistic side.
241
and 260 tons per month for whole grain flour. Even for whole grain flour, this is
approximately half the present level of maize grain consumption in Bamako.
These estimates of the impact of devaluation need to be treated with some
caution. Estimated consumer response is contingent upon a reference price of 150
CFA F/kg for rice and 70 CFA F/kg for coarse grains. Rice prices are likely to rise
significantly in the medium-term, both absolutely and relative to coarse grains. The
CIF cost of imported rice has doubled in CFA franc terms, and the cost of
domestically-produced rice will also rise due to increases in the price of imported
inputs such as fertilizer and fuel. However, given the high sensitivity of maize flour
demand to retail prices, and the lack of any obvious improvement in substitutability
with rice, it is difficult to conclude that devaluation has not had a major negative
impact in the short run on potential demand for maize flour.
There are three main options open in terms of market development
strategies. Option 1 is first to promote refined maize flour to build consumer
confidence and then introduce whole grain flour as a low-cost competitor. Option 2
is to forget about refined flour and push whole meal flour, possibly with subsidies in
connection with an urban food aid distribution program. Option 3 would be to push
both flours simultaneously without direct subsidies.
The first option has three advantages and one major draWback. The first
advantage is that Grands Moulins du Mali already has a state-of-the-art maize mill
installed. Since the investment is a sunk cost, GMM is likely to be willing to price
the product very competitively in the short run in order to obtain at least some
return on the investment. This is especially true as milling margins on wheat are
progressively squeezed by the removal of tariffs on flour imports and coordinated

242
donor selling of commodity-aid wheat. Second, GMM would be willing to purchase
maize from farmers on a forward contract basis if the PRMC would be willing to
finance a maize flour promotion campaign. Farmers repeatedly stated that the lack
of a guaranteed price was the principal reason for not investing in fertilizer for maize
production. Since improved returns for cereal growers is a major objective of the
PRMC, there would be solid justification for using PRMC funds to promote maize
flour marketing if linked to maize procurement contracts from maize grower
associations. Third, there are other industrial needs for maize products that are
currently being met through imported products (e.g., starch for glue, batteries and
conserves; grits for brewing) that could be supplied locally once GMM's maize
production line was up and running.
The main disadvantage with this option is that the volume of demand at
estimated post-devaluation retail prices may too small to make it worthwhile. One
possible way to overcome this problem option would be to incorporate maize flour
with wheat flour intended for baking bread. For example, a mix of 95% wheat and
5% maize flours would generate a requirement of 1500 tons of maize flour per year,
based on pre-devaluation demand for wheat flour. If the technical and financial
feasibility of maize flour incorporation with wheat flour can be confirmed, the next
step would be to undertake a test of consumer acceptability.34 In view of the
acrimonious history of relations between GMM and the bakers, it would be useful to
have some outside encouragement and supervision of such a test (e.g., by the
PRMC) to ensure that it is undertaken and evaluated in good faith.
34 According to GMM's CEO, maize flour can be incorporated with wheat flourup to 5% without affecting bread quality. R.Achkar, personal communication,January 1994.
243
The second option has two key advantages. First, it would involve small
scale processors immediately rather than after a delay. Second, consumers need
and are receptive to lower-cost products as a result of the fall in real incomes
following devaluation. Even the lower post-devaluation level of demand of 490 tons
per month is sufficient to keep up to 20 hammer mills in business. Nevertheless,
this strategy also has disadvantages that must be overcome. First, there may be
strong consumer resistance, at least initially, to purchasing flour from retailers
unless it is in sealed packages. This'would drive up the cost significantly,
undermining the very basis on which the product could compete - cheapness.
Second, whole grain flour has a relatively short shelf life. It can become rancid in
as little as three weeks. Unless a very rapid and effective distribution system is
established, the product could quickly lose credibility with consumers. Third,
owners and/or operators of coarse-grain processing equipment currently have very
little experience in combining processing and product marketing operations (vertical
integration) .
The difficulties associated with the promotion of a whole grain' flour
processing and distribution could be overcome through innovative form~ of
organization. For example, rapid low-cost distribution could be achieved by
networks of women retailers residing in the densely populated suburbs ("quartiers
populaires"). Through their detailed knowledge of households in their locality, such
retailers could establish a regular clientele. Knowing their clients personally, and
being in a position to verify the quality of flour supplied to them and distribute it
quickly, they could avoid the need for costly disposable packaging and deliver the
product in re-usable containers instead. These retailers could be supplied on a
244
regular basis either by an existing GtE such as SAMA, or purchase grain and have it
milled at a hammer mill installed alongside an existing custom plate mill, or form
their own GIE for processing the flour. Such an approach would create badly
needed part-time informal sector employment opportunities for women, as well as
providing households with a low-cost ready-to-use coarse grain product.
The third option is the most ambitious, seeking to capture the advantages of
options 1 and 2. Option 3 has the advantage that the costs of a promotional
campaign would not necessarily be significantly higher for two types of flour than
for one, and could be designed to target the flours to different market segments. It
would difficult to promote whole grain flour using subsidies without undercutting
GMM, however, since whole grain flour is only weakly self-targeting.
Whichever option is chosen, there will be a need to for strong technical
backstopping. For both types of flour it will be necessary to monitor flour storage
quality at different times of year. For potential hammer mill operators, there is a
need to identify mills that can provide sufficiently fine flour without having to
manually sieve the product as carried out for the second large-scale consumption
test. Recommendations have been made by Mestres (1993), but consideration
should also be given to machinery suppliers in Zimbabwe where maize is milled
primarily for human consumption rather than for animal feed. For option 2 or 3,
organizational support from a specialized microenterprise development unit will also
be necessary. In addition to facilitating the establishment of whole grain flour
processing and distribution networks, assistance will also be needed to secure a
year-round supply of maize grain of appropriate quality (floury endosperm) from
urban wholesalers or farmer associations.

245
7.5.2 An additional option: reducing the cost of de-hulling services
An additional option for the promotion of coarse grain processing is to
reduce the cost of dehulling services. Sanogo et al. (1993) undertook a rapid
appraisal of the market for dehulled coarse grains, and costs and processing losses.
They found the existing system for marketing dehulled coarse grains to be
inefficient because of high processing losses and transport costs. Dehulled coarse
grains are supplied only at the retailer level in Bamako. Retailers purchase coarse
grain from semi-wholesalers, transport it to their stores, transport part of the grain
to a dehuller, and then transport the dehulled grain back again. The team found
average processing losses of 25%, confirming the hypothesis of Holtzman et al.
(1991) that the Engleberg-type dehullers, originally designed for dehulling rice, are
poorly suited to coarse grains. Losses were also highly variable from one machine
to another. The study estimated that the cost of dehulled grains to the retailer
could be cut by 10% through the installation of electric-powered abrasive disk
dehullers at the semi-wholesaler level.
Informal interviews with semi-wholesalers revealed that they were hesitant
to invest in dehulling equipment because of the low volume of demand. On the
basis of Tables 6.4 and 6.5, an estimated 6 kg/ae/year of coarse grains were
procured in dehulled form by sample households. If representative of Bamako,
aggregate demand for the District would be approximately 3,500 tons/year, or 10
tons per day. While this is technically adequate to keep 3 - 4 abrasive disk
dehullers operating full time, demand is highly dispersed geographically and it could
take time to build up marketing channels. Also, semi-wholesalers have no
experience in processing activities, and frequently do not have access to formal
246
bank credit. Despite the small size of the market at present, PRMC credit to
wholesalers combined with support from micro-enterprise development projects
could help it to develop more rapidly given the potential for cost reductions. This
could have positive effects on coarse grain marketing channels as a whole because
semi-wholesalers engaged in dehulling would have an incentive to pay a premium
for clean grain, and for varieties with good dehulling attributes.
7.6 Summary findings
This chapter estimated the demand for dehulled and whole-grain maize flour
before and after devaluation for male (household head) respondents. The demand
for maize flour is highly price-elastic compared to the demand for maize grain. The
demand for dehulled flour has a low income elasticity of demand relative to grain,
and for whole grain flour the income elasticity of demand is negative for the civilian
population. Demand for maize flour by women is higher than men at all prices, and
both dehulled and whole grain flour are normal goods for women. The opportunity
to purchase maize flour does not appear likely to have a significant effect on
improving substitutability with rice. In addition to price, income and gender,
demographic factors such as household size, proportion of women in the household,
and whether or not the household head is in the military have important effects on
demand. Commercial opportunities to develop urban maize flour processing exist,
although they are unlikely to have a significant effect on aggregate maize
consumption in the short run. Policies to encourage coarse grain dehulling should
also be considered in view of the potential systemic effects on coarse grain
marketing, and the potential for reductions in dehulling unit costs.
CHAPTER EIGHT
FARM-LEVEL DEMAND FOR MAIZE TECHNOLOGY AND IMPLICATIONS FOR
AGRONOMIC RESEARCH
Maize has two agronomic attributes that distinguish it from millet and
sorghum. It is early maturing and fertilizer responsive. The first attribute results in
an increase in output value because coarse grain prices are above average during
the two months before sorghum and millet are harvested. The second attribute
results in an increase in the physical product per unit of land and labor when
fertilizer is applied. For farmers, the attractiveness of the maize enterprise
compared to millet or sorghum depends on the extent to which additional benefits
generated by these attributes outweigh additional costs. The issue is important to
examine for two reasons. First, the recent 50% devaluation of the CFA franc will
result in a significant increase in the cost of imported fertilizer that may in turn lead
to reductions in the already small volume of maize coming to market (Dione, 1987).
Second, if increases in the cost of fertilizer result in a shift to more land-extensive
cropping patterns and/or crop management practices this will lead to more rapid soil
degradation, a major concern in Mali (World Bank, 1993).
The chapter is divided into three parts. The first re-visits the financial analysis
in chapter 3 to examine the consequences of increases in the price of fertilizer for
the profitability of intensive maize. The results suggest a need to focus agronomic
research effort on ways to increase the productivity of fertilizer on maize. Since the
physical and financial performance of improved technology is often site-specific, the
second part combines a descriptive analysis of land use patterns with logistic curve
247
248
analysis of maize adoption at the subzone level to project future growth in the area
of intensive maize in the CMDT zone.' The results indicate that maize research
investments, particularly on-farm agronomic and varietal testing, should be focussed
on realizing productivity gains in the high-potential southern part of the CMDT zone.
The final section briefly reviews technology options for improved farm-level
productivity of the maize enterprise that need to be explored by agronomic
research.
8.1 Retums to fertilizer use on maize
This analysis builds on the financial analysis undertaken in chapter 3 in three
ways. First, the analysis examines the impact of post-devaluation financial prices
for fertilizer on the relative profitability of maize and sorghum in different
recommendation domains. Second, it distinguishes between the profitability of
maize for net buyers and net sellers of cereals. Finally, it distinguishes between the
value of maize during the hungry season and its value after the main coarse grain
harvest, based on rural market prices in the CMDT zone.2 These distinctions are
important because they affect the incentives for farmers to adopt intensive maize
technology. The effect of these incentives on technology adoption will in turn have
repercussions for the profitability of urban commercial maize processing activities.
, The degree of yield response to added fertilizer depends on environmentalfactors (e.g., soil, rainfall, pest challenge) and their interactions with cropmanagement practices (in particular weed control and land preparation).
2 For the purposes of this analysis, the terms pre- and post-harvest are relativeto the harvest of millet and sorghum during November and December. The preharvest period is defined as August - October inclusive. These three monthscoincide with the period when maize is available for.consumption either fresh or ingrain form, and prior to the harvest of millet and sorghum. The post-harvest periodis defined as December - February.
249
For example, potential maize processors would find a reliable supply of low-cost
maize an incentive to undertake processing activities. But if maize is relatively
unattractive to grow and sell compared to sorghum at prices prevailing after the
main coarse grain harvest, farmers are unlikely to expand marketed supply.
Scarcity or unpredictability of the quantity and/or quality of marketed surpluses
would in turn constrain a maize-led expansion of the urban coarse grain processing
sector. This reflects the interdependence between incentives for adoption of farm
level technology and the development of new market opportunities for grain maize
discussed in chapter 2.
We first analyze pre- and post·harvest prices for maize and sorghum in the
CMDT zone over the four seasons 1989/90 to 1992/93, and then use the results in
an analysis of the profitability of fertilizer use on maize before and after devaluation.
Table 8.1 presents average prices for maize and sorghum in rural markets of
the CMDT zone based on weekly data collected by the Market Information System
(SIM/OPAM) for the four growing seasons between April 1989 and January 1993.
Average prices are presented for two periods (before and after the main coarse
grain harvest), and for two geographical areas (the northern and less-developed
southern parts of the CMDT zone).
In Table 8.1, prices for maize are 9.8 CFA F per kg less than for sorghum
averaged across seasons and locations (significant at the .01 level). Averaged
across locations, the difference in price between sorghum and maize is greater pre
harvest than post-harvest (12.6 CFA F/kg compared to 5.9 CFA F/kg). Even the
smaller post·harvest difference is likely to be a significant disincentive for farm
households to take maize to market. The difference may not necessarily be a

250
disincentive to grow maize, since maize can be substituted for sorghum in home
consumption and sorghum sold instead. The strategy of substituting maize for
sorghum in household consumption in order to sell more sorghum was reported by
farmers during informal interviews in both Koutiala (north) and Sikasso (south). The
financial analysis that follows accounts for this possibility.
Table 8.1: Average Weekly Maize and Sorghum Price~ Before and After Harvest in
the CMDT Zone (CFA F/kg)
Cereal MAIZE SORGHUM
Location PRE- POST- Mean PRE- POST- MeanHARVEST HARVEST HARVEST HARVEST
NORTH 41.3 41.3 41.3 54.6 46.8 51.5(14.8) (15.0) (22.2) (18.3)
SOUTH 46.4 38.7 42.6 58.6 44.6 51.6(17.7) (11.8) (19.2) (12.9)
Mean 42.9 40.3 41.7 55.5 46.2 51.5
Notes:1. Average weekly prices April 1989 - January 1993 (figures in parentheses are
standard deviations).2. The three months August - October are classified as pre-harvest, and the
three months December - February are classified as post-harvest.3. The Bougouni-Sikasso road was chosen as the dividing line between northern
and southern markets. Thus, rural markets classified as "north" are: Beleko,Bla, Dioila, Dogo, Fana, Kimparana, Kouri, Koutiala, Mass"igui, Zangasso;those classified as "south" are Kadiolo, Kolondieba, Koumantou, Loulouni, andManankoro.
Differences between pre- and post-harvest prices are larger for sorghum than
for maize, and larger in the south than the north. The higher spread between pre-
and post-harvest prices in the south (14 CFA F/kg for sorghum and 7.3 CFA F/kg
for maize) reflects the combination of a higher proportion _of net buyer households
251
relative to the northern part of the zone, and the underdeveloped road network.3
With the exception of maize in the northern part of the CMDT zone, differences
between pre- and post-harvest prices for maize grain are significant. Pooling price
data before and after harvest, there are no significant differences in average prices
for millet and sorghum between geographical zones. The prices in Table 8.1 are
used to value maize and sorghum in the analysis that follows.
Table 8.2 presents a financial analysis of the profitability of fertilizer use on
maize in the CMDT zone before and after devaluation. The three recommendation
domains presented (north sole crop, south sole crop, and south intercropped)
correspond to the three intensive recommendation domains in Table 3.3 (i.e.,
recommendation domains 1, 3, and 4). For each recommendation domain, the
profitability of fertilizer use is compared for three types of farmer: net cereal buyer
pre-harvest, net cereal seller pre-harvest, and net cereal seller post-harvest. For net
buyers, maize is valued at the pre-harvest price of maize in the respective zone plus
transport costs of 5 CFA F/kg. This reflects the opportunity price of maize for own
consumption during the "hungry season" compared to purchasing maize on the
market. For net sellers pre-harvest, maize is valued at the pre-harvest price of
sorghum, less transport costs. This reflects the strategy reported by farmers of
selling old sorghum stocks and consuming the new maize harvest instead in order to
3 The basis for the assertion that the proportion of net buyer households islikely to be greater in the southern part of the zone is that the proportion ofhouseholds without animal traction is higher than average in the two CMDT regions(Bougouni andSikasso) that make up this area (Goita, 1993). Dione (1989) found apositive correlation between level of mechanization and household food productionper person. The problems of seasonal inaccessibility are well-known, and the MaliSud III rural development project plans to construct 500 km of feeder roads in the,area (World Bank, 1990).
252
benefit from the higher price of sorghum.4 For this case, an additional processing
of 2.5 CFA F/kg is added to reflect the greater difficulty of processing maize instead
of sorghum for household consumption. For net sellers post-harvest, maize and
sorghum are valued at their respective post-harvest prices in the recommendation
domain less transport costs.
The analysis uses the same partial budget approach as chapter 3, where two
alternative farm production opportunities are compared taking account only of
parameters that differ between them (CIMMYT, 1988). For pre-harvest sole crop
scenarios, maize with fertilizer is compared to maize without fertilizer (Table 8.2 A
and B). With fertilizer, yields are the same as for the ex-post impact assessment in
Table 3.3; without fertilizer, yields are derived from a fertilizer response function
estimated by Posner and Crawford (1992) for southern Senegal, an area with similar
rainfall to Southern Mali. For post-harvest sole crop net sellers, maize is compared
to sorghum, the predominant coarse grain in terms of area cultivated. For maize
intercropped with sorghum in the south, the system is compared with and without
fertilizer, using prices appropriate to the time of sale.
A marginal rate of return of 100% on investment in cash inputs, equivalent to
a value cost ratio (VCR) of 2.0 in the present analysis, is considered necessary for
.. Farmers could sell maize rather than sorghum pre-harvest. This would applyin the case of farmers who wish to sell cereals pre-harvest but who have exhaustedtheir old sorghum or millet stocks, or who are reluctant to sell them because of ataste preference. This scenario is not explicitly examined here because, given thelower_price for maize compared to sprghum, the analysis would only serve to furtherreinforce the conclusions drawn.

253
widespread adoption of a farm-level technology.5 The analysis assumes moderate
fertilizer doses, equivalent to half the recommended rate.
Prior to devaluation, incremental net benefits to fertilizer use are generally
positive but uninspiring.6 For only one scenario, sole crop maize for net buyers in
the southern part of the CMDT zone (Table 8.2 B), does the VCR exceed this
threshold. For other scenarios, with the exception of intercropped maize for net
sellers post-harvest, VCRs are likely to provide adequate incentives for adoption
only in the case of less risk-averse farmers and/or on fields with particularly
responsive soils.
At post-devaluation fertilizer prices, incremental net benefits are still positive
but unlikely to encourage adoption except by a small minority of farmers. 7 For sole
crop maize in the northern part of the CMDT zone (Table 8.2 A), VCRs fall from a
range of 1.65 - 1.70 to a range of 1.19 to 1.26, a level that can only be
characterized as marginally profitable. For sole crop maize in the southern CMDT
(Table 8.2 B), the most profitable group of scenarios, VCRs fall from a range of
1.82 - 2.17 to a range of 1.37 to 1.57. The low VCRs for intercropped maize in
5 The marginal rate of return (MRR) is the incremental net benefit divided by theincremental cost, expressed as a percentage. The Value Cost Ratio (VCR) is theincremental output value divided by the incremental cost. Where the number oftechnology options exceeds two, the MRR between options with successivelyhigher levels of investment is the appropriate indicator of relative incentives toadopt (Boughton et al., 1990). Since only two options are compared in eachscenario, the two measures give equivalent results.
6 Incremental net benefit is the difference between additional value of outputgenerated and additional cost incurred in shifting from a less intensive to a moreintensive production opportunity.
7 Post-devaluation fertilizer prices are based on retail prices announced by theCMDT for the 1994 crop season, plus 10% short-term finance charges.
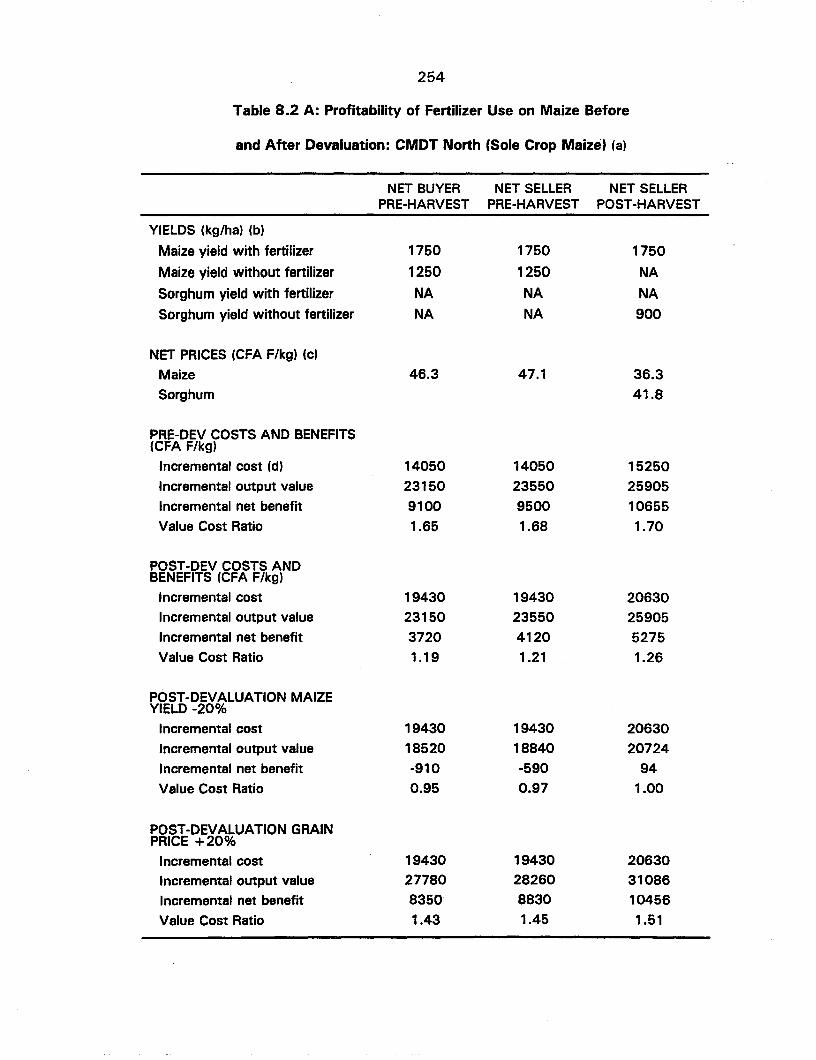
254
Table 8.2 A: Profitability of Fertilizer Use on Maize Before
and After Devaluation: CMDT North (Sole Crop Maize) (a)
NET BUYER NET SELLER NET SELLERPRE-HARVEST PRE-HARVEST POST-HARVEST
YIELDS (kg/ha) (b)
Maize yield with fertilizer 1750 1750 1750
Maize yield without fertilizer 1250 1250 NA
Sorghum yield with fertilizer NA NA NA
Sorghum yield without fertilizer NA NA 900
NET PRICES (CFA F/kg) (c)
Maize 46.3 47.1 36.3Sorghum 41.8
PRE-DEV COSTS AND BENEFITS(CFA F/kg)
Incremental cost (d) 14050 14050 15250Incremental output value 23150 23550 25905Incremental net benefit 9100 9500 10655Value Cost Ratio 1.65 1.68 1.70
POST-DEV COSTS ANDBENEFITS (CFA F/kg)
Incremental cost 19430 19430 20630Incremental output value 23150 23550 25905Incremental net benefit 3720 4120 5275Value Cost Ratio 1.19 1.21 1.26
POST-DEVALUATION MAIZEYIELD -20%
Incremental cost 19430 19430 20630Incremental output value 18520 18840 20724Incremental net benefit -910 -590 94Value Cost Ratio 0.95 0.97 1.00
POST-DEVALUATION GRAINPRICE +20%
Incremental cost 19430 19430 20630Incremental output value 27780 28260 31086Incremental net benefit 8350 8830 10456Value Cost Ratio 1.43 1.45 1.51

255
Table 8.2 B: Profitability of Fenilizer Use on Maize Before
and After Devaluation: CMDT South (Sole Crop Maize) (a)
NET BUYER NET SELLER NET SELLERPRE-HARVEST PRE-HARVEST POST-HARVEST
YIELDS (kg/ha) (b)
Maize yield with fertilizer 2250 2250 2250
Maize yield without fertilizer 1750 1750 NA
Sorghum yield with fertilizer NA NA NA
Sorghum yield without fertilizer NA NA 1200
NET PRICES (CFA F/kg) (c)
Maize 61.1 51.1 33.7
Sorghum 39.6
PRE-DEV COSTS AND BENEFITS(CFA F/kg)
Incremental cost (d) 14050 14050 15250Incremental output value 30550 25550 28305Incremental net benefit 16500 11500 13055
Value Cost Ratio 2.17 1.82 1.86
POST-DEV COSTS ANDBENEFITS (CFA F/kg)
Incremental cost 19430 19430 20630
Incremental output value 30550 25550 28305Incremental net benefit 11120 6120 7675
Value Cost Ratio 1.57 1.31 1.37
POST-DEVALUATION MAIZEYIELD -20%
Incremental cost 19430 19430 20630
Incremental output value 24440 20440 22644
Incremental net benefit 5010 1010 ... 2014.Value Cost Ratio 1.26 1.05 1.10
POST-DEVALUATION GRAINPRICE +20%
Incremental cost 19430 19430 20630Incremental output value 36660 30660 33966
Incremental net benefit 17230 11230 13336
Value Cost Ratio 1.89 1.58 1.65
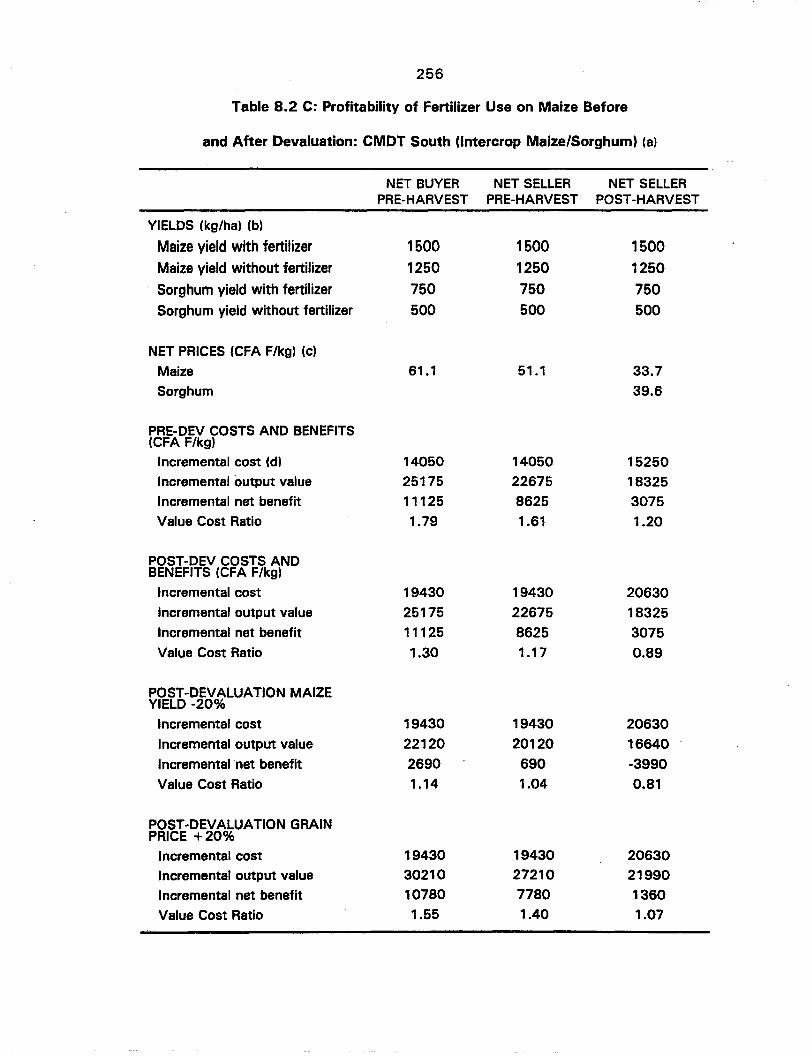
256
Table 8.2 C: Profitability of Fertilizer Use on Maize Before
and After Devaluation: CMDT South (lntercrop Maize/Sorghum) (a)
NET BUYER NET SELLER NET SELLERPRE-HARVEST PRE-HARVEST POST-HARVEST
YIELDS (kg/hal (bl
Maize yield with fertilizer 1500 1500 1500Maize yield without fertilizer 1250 1250 1250Sorghum yield with fertilizer 750 750 750Sorghum yield without fertilizer 500 500 500
NET PRICES (CFA F/kgl (c)
Maize 61.1 51.1 33.7Sorghum 39.6
PRE-DEV COSTS AND BENEFITS(CFA F/kg)
Incremental cost (d) 14050 14050 15250Incremental output value 25175 22675 18325Incremental net benefit 11125 8625 3075Value Cost Ratio 1.79 1.61 1.20
POST-DEV COSTS ANDBENEFITS (CFA F/kg)
Incremental cost 19430 19430 20630Incremental output value 25175 22675 18325Incremental net benefit 11125 8625 3075Value Cost Ratio 1.30 1.17 0.89
POST-DEVALUATION MAIZEYIELD -20%
Incremental cost 19430 19430 20630Incremental output value 22120 20120 16640Incremental net benefit 2690 690 -3990Value Cost Ratio 1.14 1.04 0.81
POST-DEVALUATION GRAINPRICE +20%
Incremental cost 19430 19430 20630Incremental output value 30210 27210 21990Incremental net benefit 10780 7780 1360Value Cost Ratio 1.55 1.40 1.07
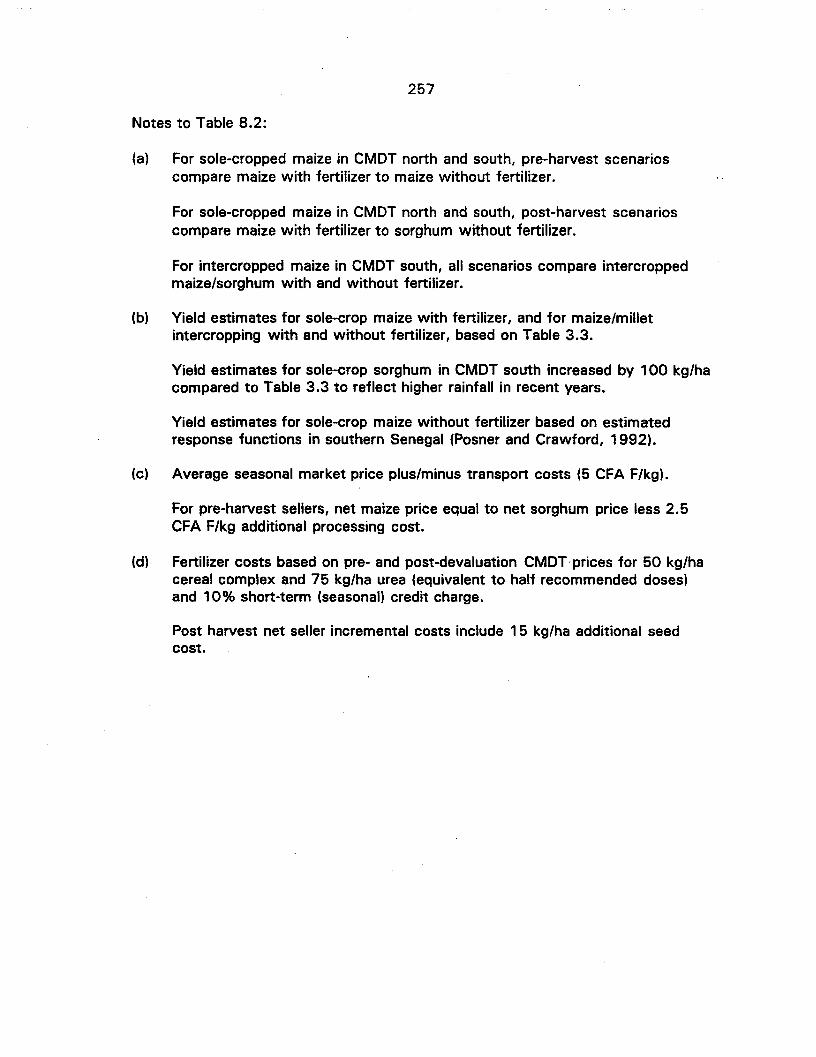
257
Notes to Table 8.2:
(a) For sole-cropped maize in CMDT north and south, pre-harvest scenarioscompare maize with fertilizer to maize without fertilizer.
For sole-cropped maize in CMDT north and south, post-harvest scenarioscompare maize with fertilizer to sorghum without fertilizer.
For intercropped maize in CMDT south, all scenarios compare intercroppedmaize/sorghum with and without fertilizer.
(b) Yield estimates for sole-crop maize with fertilizer, and for maize/milletintercropping with and without fertilizer, based on Table 3.3.
Yield estimates for sole-crop sorghum in CMDT south increased by 100 kg/hacompared to Table 3.3 to reflect higher rainfall in recent years.
Yield estimates for sole-crop maize without fertilizer based on estimatedresponse functions in southern Senegal (Posner and Crawford, 1992).
(c) Average seasonal market price plus/minus transport costs (5 CFA F/kg).
For pre-harvest sellers, net maize price equal to net sorghum price less 2.5CFA F/kg additional processing cost.
(d) Fertilizer costs based on pre- and post-devaluation CMDT-prices for 50 kg/hacereal complex and 75 kg/ha urea (equivalent to half recommended doses)and 10% short-term (seasonal) credit charge.
Post harvest net seller incremental costs include 15 kg/ha additional seedcost.
258
the south (Table 8.2 B) reflect the relatively high yields that can be obtained
without fertilizer in the short run from areas recently brought under cultivation in
this high rainfall zone.8 In none of the post-harvest net seller scenarios, the
principal source of potential surpluses for purchase by urban processors, are VCRs
adequate to encourage intensive farm-level production of maize for the market. This'
implies that urban processors must either accept considerable uncertainty
concerning price and availability of maize on urban spot markets or enter into fixed
price contracts with farmer organizations at planting time.
Sensitivity analysis was carried out for a 20% reduction in yields and a 20%
increase in price following devaluation. The 20% reduction in yields simulates the
effect of a prolonged dry spell. The 20% increase in price simulates a possible
increase in the average level of coarse grain prices as a result of the increase in the
price of imported rice.9 A 20% yield reduction predictably reinforces the negative
effect of devaluation on incremental net benefits and VCRs for fertilizer use. In the
northern CMDT zone (Table 8.2 A) farmers would break even at best (VCRs range
from 0.95 to 1.00). Sole crop maize growers in the southern CMDT zone (Table
8.2 B) barely break even, and for intercropped maize post-harvest, net sellers (Table
8.2 C) losses almost double.
A 20% price increase restores incremental net benefits to levels slightly higher
than those before devaluation, but leaves VCRs still too feeble to expect widespread
8 Only 22% of the potentially cultivable area in Bougouni was under cultivationin 1989/90, compared to 66% in Koutiala (Go"ita, 1993).
9 In the four months following devaluation, coarse grain prices initially rose butsubsequently fell back to pre-devaluation levels. The long-run equilibrium price ofcoarse grains will depend on the elasticity of supply of (locally-produced) paddy andmilling services with respect to input and product prices, and the urban cross-priceelasticity of substitution between rice and coarse grains.

259
adoption. While a 20% price increase would help to restrain an otherwise more
rapid slide to extensive cropping patterns and cultural practices, higher prices for
grain maize would lead to a significant decrease in potential demand for maize flour
(chapter 7).
In conclusion, the increase in fertilizer prices will result in a significant
decrease in the profitability of intensive maize. Unless there is an increase in the
price of maize, or a reduction in price risk via contracts, or an increase in the
productivity of fertilizer use, farmers are likely to opt for more extensive cropping
patterns or crop management practices. While an increase in maize prices would
help to restore profitability, it would also make it more difficult for maize-led
development of the urban market for processed coarse grains to occur. It is
therefore important to identify potential sources of increased productivity.
8.2 Future location of expansion in maize area
Farm-level maize productivity depends on crop management practices
(including variety) and the agro-climatic environment. Because agronomic research
is environment-specific to varying degrees, so also is the economic payoff to that
research investment. The payoff will be positively correlated with the total area
over which the improved technology is adopted, the increase in net benefits per unit
area, and the rate of adoption. But the CMDT zone covers nearly 118,000 km2 (ten
times the size of The Gambia). Average annual rainfall doubles between its
northern and southern boundaries. Given such variation it is important to identify
where within the CMDT zone lies the greatest potential for increased production.
Two simple analyses are used to address this question. The first is a

260
descriptive analysis of land use intensity and cropping patterns in different parts of
the CMDT zone. Historically, the expansion of maize has been part of an overall
expansion of area cultivated to cereals as a result of mechanization. This process is
continuing with support from the Mali-Sud III agricultural development project.
Thus, other things being equal, maize area is likely to expand fastest where land use'
intensity is low, or maize has an important share of the cropping pattern, or
particularly where both occur. The second analysis fits logistic "growth" functions
to historic maize area data to project future expansion in cultivated area in different
parts of the CMDT zone. These two approaches to analysis of the locus of future
maize area expansion can then be compared for consistency.
8.2.1 Land use intensity and cropping patterns within the CMDT zone
The CMDT zone is divided into five subzones for management purposes: San,
Fana, Koutiala, Bougouni and Sikasso. For the purposes of this analysis, we group
San, Fana, and Koutiala subzones as the northern part of the CMDT zone, and
Bougouni and Sikasso as the southern part. This division corresponds
approximately to the 1000 mm rainfall isohyet during the period 1980-1985 (Pieri,
1989).
Table 8.3 presents information on land use intensity for different subzones
within the CMDT zone. Southern subzones have on average 26% more people per
cultivated hectare, and 34% more people per hectare of cereal, than northern
subzones. Yet southern subzones cultivate only 23% of the potentially cultivable
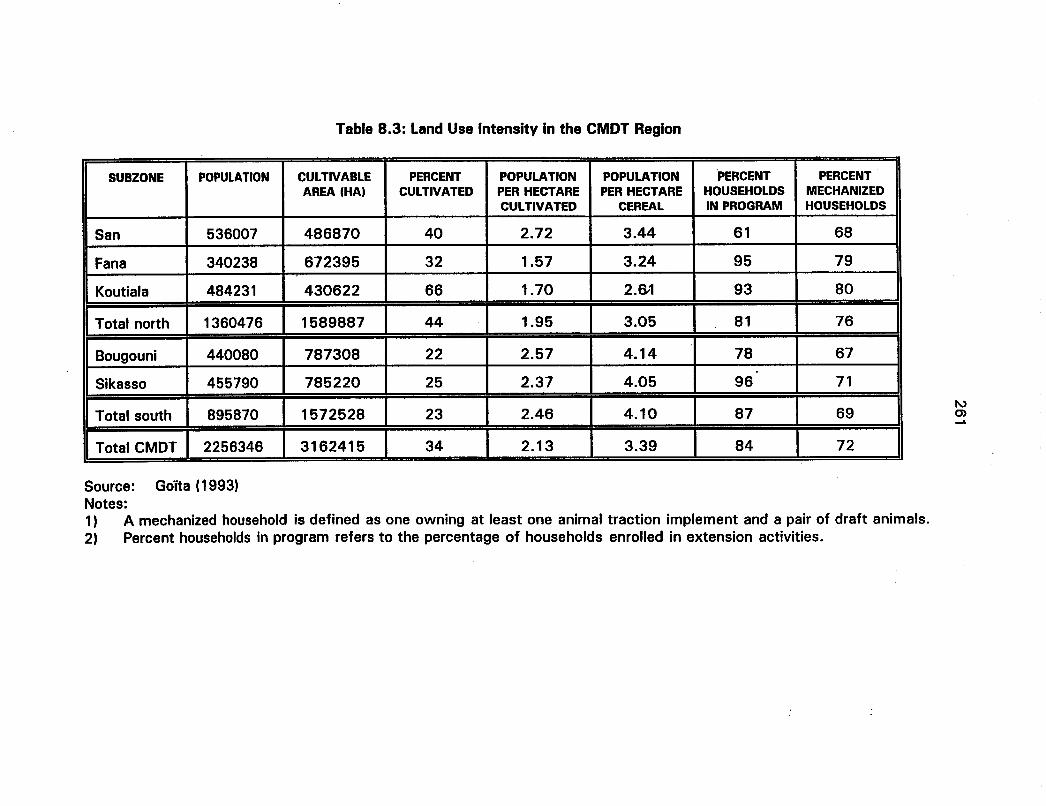
Table 8.3: Land Use Intensity in the CMDT Region
SUBZONE POPULATION CULTIVABLE PERCENT POPULATION POPULATION PERCENT PERCENTAREA (HA) CULTIVATED PER HECTARE PER HECTARE HOUSEHOLDS MECHANIZED
CULTIVATED CEREAL IN PROGRAM HOUSEHOLDS
San 536007 486870 40 2.72 3.44 61 68
Fana 340238 672395 32 1.57 3.24 95 79
Koutiala 484231 430622 66 1.70 2.&1 93 80
Total north 1360476 1589887 44 1.95 3.05 81 76
Bougouni 440080 787308 22 2.57 4.14 78 67.
Sikasso 455790 785220 25 2.37 4.05 96 71
Total south 895870 1572528 23 2.46 4.10 87 69
Total CMDT 2256346 3162415 34 2.13 3.39 84 72
Source: GoIta (1993)Notes:1) A mechanized household is defined as one owning at least one animal traction implement and a pair of draft animals.2) Percent households in program refers to the percentage of households enrolled in extension activities.
tven-'
262
area, compared to 44% in the north. 10 This is partly a reflection of lower levels of
mechanization among farming households in the Bougouni, due to lower levels of
participation in extension programs and lower levels of mechanization among
participating households (Table 8.3).11 In the case of Bougouni, the low
proportion of cultivated land reflects the fact that large parts of the subzone have
been uninhabitable until recently due to the' presence of onchocerciasis (river
blindness) (World Bank, 1990). With in-migration to the Bougouni subzone now
that onchocerciasis has been eliminated, and increasing levels of participation in
extension programs and mechanization as a result of the Mali-Sud III agricultural
development project, expansion of cropped area will be considerably more rapid in
southern subzones than in northern areas. But whether faster expansion of cropped
area in the south also implies more rapid expansion of maize in the south than in the
north depends on the relative importance of maize in cropping patterns.
Table 8.4 presents cultivated cereal area and the proportion allocated to
different cereals in the five subzones that make up the CMDT zone. Maize accounts
for almost 40% of the total cereal area in southern subzones, compared to just 12%
in the north. Thus, not only is cropped area likely to expand fastest in the southern
subzones, but maize is the single most important cereal in area terms. But while
10 Although these cropping intensities may appear low for developed countries,it should be recalled that, for farming systems in the fragile savannah ecology, ahigh proportion of the cultivable land area needs to be under fallow for the systemto be sustainable (Pieri, 1989).
11 A farm household must participate in the extension program (be "encadreen)
to be eligible for credit for the purchase of farm implements and draft animals. Ingeneral the proportion of participating households, and the percentage ofparticipating households with animal traction, are a reflection of how long the regionhas benefitted from development efforts, usually spearheaded by cotton-basedagricultural development projects. The current Mali-Sud III project, for example, istargeting the Bougouni region.

· Table 8.4: Cereal Cropping Patterns in the CMDT Zone
SUBZONE CEREAL PERCENT PERCENT PERCENT PERCENT PERCENT PERCENT TOTALAREA (ha) MAIZE MILLET SORGHUM FONIO RAINFED IRRIGATED
RICE RICE
San 155933 3.1 45.5 38.3 10.8 0.7 1.6 100
Fana 105134 17.8 16.8 60.2 0.9 3.7 0.6 100
Koutiala 185664 15.8 35.4 46.8 0.5 1.2 0.2 100
Total north 446731 11.8 34.6 47.0 4.2 1.6 0.8 100
Bougouni 106172 41.5 9.2 33.2 5.6 5.0 5.6 100
Sikasso 112500 38.6 23.4 25.1 1.7 2.8 8.5 100
Total south 218672 40.0 16.5 29.0 3.6 3.9 7.1 100
Total CMDT 665403 21.1 28.6 41.1 4.0 2.4 2.9 100
Source: Goita (1993)
1'0)
c»w
264
maize may be the dominant cereal in the south now, is it likely to expand more
rapidly in the southern subzones than in the north in the future?The next section
addresses this question by examining growth trends in maize area.
8.2.2 Maize area growth trends
In order to project future trends in the area cultivated under improved maize, a
logistic function was fitted to historical data on area adopted in the southern and
northern parts of the CMDT zone. The approach used is the same as that by Henry
de Frahan (1990) to project technology adoption in northeastern Mali.
The logistic function takes the form P(t) = K/l1 +exp-(a +bt))
where P(t) is the cumulative growth in the proportion of the potential area over
which the technology is adopted at time t; K is the adoption ceiling or potential
area; and t is time measured in years. In the present context, b can be interpreted
as a measure of the rate of acceptance of the new technology.
A simple way to fit the logistic curve is to select the value of K, the adoption
ceiling, that gives the best fit for the OLS regression:
log (A/lK-A)) = a + b (YEAR) + u
where A is the area adopted, and the dependent variable is the proportion of the
potential area over which adoption has occurred. Using the area data in table 3.1
for the period 1974 - 1990, the following results were obtained (figures in
parentheses are standard errors):
a) NORTH
log (A/lK-A)) = -610.79 + .308 (YEAR); R2 = .987 at K = 35,000 ha
(29.07) (.015)

265
b) SOUTH
log (A/lK-A)) = -443.77 + .223 (YEAR); R2 = .987 at K = 73,500 ha
(29.07) (.015)
The estimated equations were used to project area under improved maize for the
period 1991 - 2010.
Figure 8.1 shows actual and projected areas of improved maize over the
period 1974 - 2010. For the northern part of the zone, an increase of 3,800
hectares is projected for the period 1990 - 2000, rising to almost 4,000 hectares by
2010. For the southern part of the zone, the corresponding figures are 25,650
hectares for the first decade, rising to 30,400 by the end of the projection period.
What is important here is the relative rather than the exact magnitudes. Expansion
in the south is projected to be more than 6 times as great as in the north, indicating
a much higher potential return on research investments ceteris paribus.
Other factors that influence the return to research investments are also more
favorable in the south than in the north. Bougouni is the focus of investment in
farm-level mechanization and rural infrastructure development within the CMDT
zone under the Mali-Sud III agricultural development project. This will have the
effect of raising the adoption ceiling in the southern part of the zone.
The higher rainfall and longer growing season in the south create particular
opportunities and challenges for agricultural research. These are briefly reviewed in
the next section. The final section considers implications for the way maize
research is organized and implemented in Mali.

266
Figure 8.1 A: Actual and Projected Improved Maize Area in the
Northern CMDT Zone
40.,--------------------,
35 ~~~~·tEI·aB4:!tBEIS&BEHi3Se1
5
20051995YEAR
1985O+-----.r-----r----r---..------r---,----l1975
1- ACTUAL -e- PROJECTED I
Figure 8.1 B: Actual and Projected Improved Maize Area in the
Southern CMDT Zone
u?.......................•..............................·····flI················································ .
20051995YEAR
1985 .
80.,-------------------,70
~;{ 60::IL.l~ ';'50en "tJz C~ g 40~ g~ e,30a:::c(
... 20~::z:::
10
0+-----,---r---r----.------r---...,----11975
1-ACTUAL -e- PROJECTED I

267
8.3 Opportunities to increase the productivity of maize: focusing the agronomic
research agenda
The previous section highlighted technical and environmental foci for maize
research in Mali over the next decade: to increase the profitability of fertility
amendments on maize and to capture the production potential of the southern part
of the CMDT zone. Given these foci, what researchable opportunities exist? An
improvement in the profitability of fertility amendments can be achieved through a
reduction in the cost of fertility amendments, an increase in their productivity
(increased yield per unit of nutrient), or some combination. of the two. The
following sections highlight opportunities that need to be explored by research.
8.3.1 Options for reducing the cost of fertility amendments
There are three options for reducing the cost of fertility amendments in
response to increases in the cost of chemical fertilizer: (i) use less chemical
fertilizer; (ii) use less expensive formulations of chemical fertilizer; and (iii)
substitution of organic fertilizer for chemical fertilizer.
Reduction in the use of fertilizer is more a question of re-aligning extension
recommendations with financially optimal levels of fertilizer use than one of
developing new innovations. Given the quadratic term in fertilizer response
functions, Posner and Crawford (1992) found that half recommended fertilizer doses
gave farmers a considerably higher marginal rate of return than full recommended
doses in southern Senegal. Malian farmers appear to have reached the same
conclusion. Giraudy (1993) analyzed data on 394 maize parcels cultivated in 41
villages in the CMDT lone. He reports that the average dose for parcels receiving
268
the basal application of complete formula fertilizer was 46% of the recommended
rate, and 48% of the. recommended rate for parcels receiving urea top dressing. '2
Another possible revision of extension recommendations is to differentiate
fertilizer recommendations on the basis of the preceding crop (cotton or cereal).
Until 1980, the CMDT recommended only urea 'top-dressing at 100kg/ha for maize
grown after cotton because it was considered that adequate fertilizer residuals
remained to dispense with a basal application of complete formula fertilizer. With
the introduction of an attractive guaranteed price for maize in 1980, the CMOT
recommended a basal application of 100 kg/ha complete fertilizer on all fields,
regardless of the previous cropping history, and increased the urea top dressing rate
to 150 kg/ha. '3
The question of the most economic type and levels of fertilizer on maize in
different crop rotations is an empirical one. Unfortunately, there is a dearth of data
on fertilizer response at farm-level. The limited number of fertilizer trials on maize
have been carried out almost exclusively on research stations. Fertilizer
recommendations have been derived without any formal financial analysis on the
basis of on-station results and results obtained elsewhere in the region. The
exception is on-farm maize intercropping trials involving fertilizer use carried out by
the Sikasso farming systems team in the second half of the 1980s. The results
12 Complete fertilizer was used on 48% of parcels, and urea on between 30%and 79% depending on the region and level of mechanization.
13 Prior to the introduction of guaranteed prices for cereals, cotton fertilizerrecommendations were kept high asa means of ensuring that some fertilizer wasavailable to the following cereal crop. The introduction of a guaranteed price formaize was seen as opportunity to dispense with this "subsidy" from one crop toanother (Abdoulaye Dolo, Cellule Liaison Recherche-Oeveloppement, CMOT,personal communication).
269
have been presented on an annual basis, but no synthesis has been undertaken
across years.
Since farmers already appear to be adapting fertilizer levels to their local
circumstances (Giraudy, 1993), and given the large number of other research
questions discussed below, a formal verification of optimal recommendations
through on-farm trials is probably not the best use of limited personnel. However,
there is equally no basis for assuming that existing recommendations are an
appropriate background level for maize varietal trials and on-farm demonstrations.
Where practical, the incorporation of multiple fertilizer levels in on-farm and on
station factorial trials as a secondary objective would help build up a database over
time to derive economically appropriate recommendations.
An opportunity to use less expensive types of chemical fertilizer exists for the
basal application of complete formula fertilizer. The purpose of a basal. application
at planting time is to promote root growth and early vegetative development. The
current recommendation 0'1 100 kg/ha complete formula 'cereal fertilizer, costing
165 CFA F/kg, provides 15kg N, 15kg P and 15 kg K. 14 Yet complete formula
cotton fertilizer, costing just 10 CFA F/kg more, provides 14kg N, 22kg P and 12kg
K (nearly 50% more P for almost the same price). Farmers with fields that are
primarily deficient in phosphorus would find this option more cost-effective. It is
not entirely surprising, therefore, that Giraudy (1993) reports that 17% of maize
fields receive complete formula cotton fertilizer! For soils that are not deficient in K,
particularly newly cleared land or land coming out of fallow, di-ammonium
phosphate (18kg N, 46kg P and Okg K per 100kg) would be an even cheaper source
14 N stands for nitrogen, P for phosphorus and K for potassium.
270
of phosphorus. Although 40% more expensive than complete cereal fertilizer, this
binary formula provides three times as much phosphorus.
The issue of complete versus binary formula fertilizers is a long-standing
controversy (Gigou, 1989). A maize crop removes a total of 20kg N, 7kg P and
5kg K per ton of grain from the soil, or 26kg N, 12kg P and 21 kg K including the
straw. Researchers have argued about the dangers of a steadily increasing K
deficiency over time if complete formula fertilizers are not used. But Gigou points
out that researchers find K deficiency on research stations because they remove
straw from the research plots whereas farmers leave it in place. He argues that a
net trend in K deficiency, after allowing for recycling of straw, and replenishment
from rain and subsoil strata, cannot be proven. Furthermore, if a farmer chooses to
grow sorghum instead of maize because fertilizer is too expensive, the rate of
removal of nutrients could be even higher. Sorghum exports similar quantities of
nutrients to maize in the grain, and significantly more when straw is included (30kg
N, 22kg P and 53kg K) because of sorghum's lower grain to straw ratio. Finally,
Gigou (1989) points out that physical erosion of soil may be a more serious problem
than chemical nutrient losses.
The objective here is not to resolve the complex issues between short-run and
long-run benefits and costs from the use of alternative fertilizers. But the question
requires careful economic analysis that takes account of the effect of fertilizer
prices on farmer incentives to adopt intensive versus extensive cropping patterns or
husbandry practices rather than just hypothetical soil nutrient balances.15
Furthermore, what is appropriate in the southern part of the zone, with higher
15 For long-run analysis of the economics of fertilizer use it is important toinclude the production effects of residual nutrients.

271
rainfall and a lower proportion of cultivated to cultivable area, may be quite different
to what is appropriate .in northern zone where most of the agronomic research on
food crop crops has been undertaken. '6
A third approach to reducing the cost of fertilizer is greater use of organic
fertilizer amendments. A considerable amount of research has been undertaken on
the use of "parc amelion§", where manure is concentrated by penning cattle at night
on straw. But only one in four farm households has a herd of more than six cattle,
and only one in five of those had adopted the "parc ameliore" by 1993 (Go·ita,
1993). But the 40% increase in the cost of chemical fertilizer will make labor-
intensive organic sources relatively less expensive. The majority of farmers have
some draft animals, and opportunities to fatten cattle before export to the south
may further increase the availability of manure for composting. Thus, incentives to
adopt composting technologies will likely become more attractive.
In addition to exploring opportunities to reduce the cost of fertilizer
amendments, it is equally important to find ways to increase the productivity of
fertilizer use.
8.3.2 Options for increasing the productivity of fertility amendments
Just as the southern part of the CMDT zone has specific considerations that
will affect the most cost-effective source of additional nutrients, there are also
locale-specific factors that affect improvements in the productivity of nutrient use.
Hi Most on-station research has been carried out at Sotuba, N'Tarla and, morerecently Cinzana. All are in the northern part of the CMDT zone. N'Tarla, wheremost of the research on cotton is undertaken, carried out a multi-year program oncereals, but dropped" maize·after the first year. Most of the research in the southhas been carried out by farming systems teams at Bougouni and Sikasso.
272
They derive from the high rainfall and length of the growing season. First, the
higher rainfall inc~eases the weed challenge. Unless weeds can be effectively
controlled in the early phases of crop growth, the productivity of fertilizer nutrients
will be reduced. Second, the longer growing season permits the use of longer cycle
varieties with higher yield potential, and intercropping of maize with millet,
sorghum, legumes, or horticultural products. These factors increase the scope and
complexity of research in the southern subzone.
Varietal development remains an underexploited source of potential
productivity gains in two ways. First, available maize varieties have not been
marketed aggressively enough. A survey of varietal use designed by the IER maize
subsector team and implemented by CMDT enumerators in 1992 in the ·same 41
villages for which Giraudy (1993) reported fertilizer use, found that adoption was
considerably lower than expected (Boughton, 1993). Of 627 varieties sown in 532
fields, only 31 % were reported to be improved varieties. 17
Further research by the Sikasso farming systems teams has confirmed that at
least some improved varieties consistently outperform farmers' varieties under
farmers' management (DRSPR, 1994). The streak-resistant TZESR-W was
particularly noted for performing well even in low management environments. Yet
while this variety accounted for 50% of improved varieties used by farmers in
Sikasso, it accounted for only 16% in Bougouni.
A major reason for low and patchy adoption is the loss of momentum in
varietal promotion following cereal market liberalization. The CMDT's Cellule
Liaison Recherche-Developpement greatly reduced the size of its on-farm
17 For the 95 fields sown to 2 varieties, at least one was an improved varietyin 50% of cases.

273
demonstration program after 1986. Bose and Freud (1994) note that maize seed
production by the CMDT is low compared to the area under cultivation. For the
1992 growing season, the CMDT distributed the equivalent of 1 kg of seed for each
hectare planted, enough to cover just 4% of the maize area (Go'ita, 1993). The
exception to.this downward trend in promotional efforts is the Mali-Sud III
investment program focusing on Bougouni. In 1993, 55% of all maize seed
distributed in the CMDT zone went to the Bougouni subzone~
Given the availability of improved varieties, the low and geographically
unbalanced levels of adoption, and the rapidly growing area under maize, there
would appear to be a high potential payoff to more aggressive promotion of
improved varieties through on-farm demonstrations, This promotion should take
account of both the need for early-maturing varieties as a hungry season food
source and for intercropping, as well as long-duration high potential varieties. Given
the rapid introduction of varieties (three new varieties were made available to the
CMDT by research in 1993), it is important to monitor adoption. CMDT extension
agents continue to record the area that has been mechanically plowed or weeded,
practices that reached near universal adoption many years ago, but record no
information about varietal use.
A second area in which varietal development is underexploited is hybrid
varieties. Historically, the research service has considered hybrid seed to be too
expensive to justify multiplication. The CMDT, which runs the seed farm, has not
opposed this view. Yet this opinion has never been subject to empirical scrutiny,
and hybrid seed production by both the public and private sector has been found
profitable in other African countries. Furthermore, the conventional wisdom that

274
hybrids only perform well under high management is increasingly under challenge
(Byerlee and Heisey, 1993). In view of the high potential of southern Mali it is
important that the cost effectiveness of hybrid seed under different levels of
fertilizer use be verified empirically through on-farm trials.
There are no maize varieties that do well in a field of weeds. That is why the
expansion of the maize area is highly correlated with mechanization. The high
rainfall in southern part of CMDT zone increases weed challenge, often causing
farmers to apply fertilizer late. Weed management practices should be considered in
conjunction with fertilizer application. For example, pre-emergence herbicide and
moderate fertilizer doses may be more cost-effective than high fertilizer doses
applied without adequate weed control.
8.4 Implications for the organization of maize research
The technical content and environmental specificity of the research challenges
discussed in the previous section have important implications for the disciplinary
mix, geographical location and organization of maize research.
In terms of disciplinary mix, there is a need for greater emphasis on fertilizer
agronomy than hitherto. Economics, hitherto almost absent from the determination
of fertilizer recommendations or decisions such as whether to promote hybrid
varieties, also needs to be systematically integrated into the design and evaluation
of agronomic research. An important potential contribution of social scientists is to

275
identify whether farmers with different resource endowments have different
technology needs, particularly in relation to varieties. '8
In both varietal development and agronomy there needs to be a much closer
linkage between on-farm and on-station research efforts. The new decentralized
organization of the research service, where both on-station and on-farm researchers·
are located at the same centers, should theoretically facilitate such collaboration.
Unfortunately, the maize research program is based at the Sotuba research center
near Bamako, just outside the northwestern edge of the CMDT zone. Most of the
on-farm research is being undertaken by the farming systems team operating from
the Sikasso research center. Finally, there is a logistical problem of how to serve
the Bougouni subzone adequately, which, while located in the same agro-ecological
zone as Sikasso, is nearly as far from the Sikasso station as Sotuba.
8.5 Summary,
This chapter has analyzed the implications of increased fertilizer prices as a
result of devaluation on farm-level incentives to cultivate intensive maize. The
results suggest that increasing the productivity of fertilizer use is an urgent priority
for the maize program in order to avoid a shift to more extensive (and soil mining)
cropping patterns and husbandry techniques. The technological opportunities for
increased productivity and the likely geographical locus of future expansion of maize
call for changes in the disciplinary mix and organization of the program. In regard to
both varietal development and fertilizer agronomy there is a need for close
18 For example, a recent study of farmer varietal preferences for maizeconcluded that earliness was low on farmers' list of priorities overall, but failed todistinguish between farmers on the basis of whether they were food deficit orsurplus (DRSPR, 1994).

276
collaboration between on-farm and on-station research, and between research and
extension.

CHAPTER NINE
SUMMARY, CONCLUSIONS AND IMPLICATIONS FOR AGRICULTURAL RESEARCH
IN MALI
This chapter summarizes the principal results of the study, implications for the
future development of Mali's maize subsector, and implications for the future size,
scope and priorities of maize research within IER. In view of the pilot nature of the
maize subsector study, methodological and organizational implications for IER's new
Commodity Subsector Economics Program are also considered.
9.1 Background to the study
In order to compete effectively for shrinking donor and government funds,
African National Agricultural Research Systems (NARS) must demonstrate that
agricultural research is a worthwhile public investment. The rate of adoption of
improved technology at the farm level is an important factor affecting the level of
economic returns to agricultural research. Farm-level technology adoption rates are
determined in part by constraints and opportunities in the off-farm economy,
communicated through agricultural input and output markets. The introduction of
market liberalization and structural adjustment policies in many African countries
over the past decade has dramatically changed farm-level adoption opportunity sets
(e.g., through withdrawal of guaranteed producer prices and subsidized marketing
services, and/or currency devaluation). Thus, the methodological and organizational
challenge of how NARS take account of market opportunities and constraints in the
design of agricultural research has become a critical issue.
277

278
The dissertation has addressed this issue through a pilot study of the maize
subsector in Mali, undertaken within the Institut d'Economie Rurale (JER), one of the
first African NARS to include both farming systems research and commodity
subsector studies in its strategic plan as a means to improve the economic impact
of agricultural research programs. The dissertation presented a conceptual
framework that integrates market and farm-level dimensions of the food system and
used a commodity subsector approach to analysis of agricultural production and
processing technologies for maize. The framework and results demonstrate how
conditions at one level of a subsector influence constraints and opportunities for
innovation at other levels, and the need to integrate technology, policy and
institutional innovations.
9.2 Summary of results
9.2.1 Historical impact of maize technology development
The application of a commodity subsector approach to the analysis of
constraints to and opportunities for technological, institutional and policy innovation
in the Malian maize subsector was motivated by an examination of the historical
impact of maize research and extension in Mali. The initiative to promote maize as
a field crop instead of its traditional place as a garden crop was taken by the cotton
parastatal (CMDT) in response to chronic food deficits during the mid-1970s. The
CMDT promoted a sole crop maize package consisting of an improved local variety
and a set of husbandry practices (land preparation, row seeding, fertilization) based
on research findings generated in other West African countries (Senegal, Burkina

279
Faso, Cote d'ivoire). Additional varieties were released over time, including a
streak-resistant variety from liTA (TZESR-W).
Transfer of responsibility for cereal procurement from the national grain board
(OPAM) to area development authorities enabled the CMDT to use, during the
period 1980 - 1986, the same integrated technology delivery system for maize that
it was already successfully using for cotton (including the provision of seed,
fertilizer, credit, extension, crop purchase and evacuation). Adoption of the
improved maize package was particularly rapid during this period when an attractive
guaranteed price was offered, and extension activities were reinforced by a maize
project that included the establishment of a seed multiplication program. Following
cereal market liberalization in 1986, maize prices fell in absolute terms and relative
< to millet and sorghum prices, and have experienced considerable variability. The
area cultivated to maize continued to expand, but farmers reduced fertilizer use,
switched back to maize-late millet or sorghum intercropping, and substituted robust,
early maturing varieties such as TZESR-W in place of long-duration varieties with
higher yield potential.
The estimated internal rate of return (IRR) to investment in maize research and
extension in southern Mali over the period 1969 to 1990 is 135%. This high rate
can be attributed to low research costs (much of the technical package was
borrowed from research conducted elsewhere in West Africa), rapid farm-level
adoption, and the high economic value of maize as an import substitute. Sensitivity
analysis indicates that the IRR is robust with respect to adverse changes in
assumptions concerning overvaluation of the exchange rate, research costs,
extension costs, and area of improved maize. It is moderately sensitive to price and

280
yield reductions. A seven-year delay in the farm-level adoption profile causes the
largest decrease in IRR, to 57%.
The high IRR achieved in the past to a focussed, integrated maize technology
delivery program in Mali is not necessarily a guide to future returns. These depend
on whether market opportunities exist that can offer farmers an attractive return to
farm-level maize technology adoption. The subsectorstudy therefore focussed on
the identification of demand-side constraints and opportunities, and their
implications for agricultural research and related policy and institutional innovation.
9.2.2 Role of maize in urban cereal consumption
In accordance with the findings of an earlier coarse-grain study by Holtzman
et a!. (1991), a rapid appraisal of the maize subsector revealed many characteristics
usually associated with a thin market. Farmers appear to produce maize primarily in
order to achieve food self-sufficiency, not as a cash crop. Urban consumers tend to
buy maize grain mainly when it is significantly cheaper than other cereals (i.e., the
wet season), due in part to the difficulty and/or higher cost of processing and in
part to lack of familiarity with the cereal. Traders consequently have little incentive
either to assure a regular year-round supply of maize, or to meet urban consumer
preferences for color or quality.
Given the importance of the rapidly growing urban population as a potential
source of future demand growth for maize, subsequent in-depth studies focussed on
possibilities for overcoming constraints to increased urban consumption through the
supply of pre-processed maize products. A formal survey of 640 households in the
capital city of Bamako revealed that, in direct contrast to the exclusive donor
281
emphasis on the promotion of maize grits and parboiled sorghum as substitutes for
rice, consumers also want to buy dehulled grains and/or flour in order to make
traditional coarse-grain-based dishes more easily. In regard to quality criteria,
housewives attached high priority to the cleanliness of processed coarse grain
products.
A frequent-visit survey of a sub-sample of 115 households was undertaken
over one year to quantify cereal procurement and use. Household income has an
important effect on the types, quantity and form of cereal procured. Rice
procurement is positively correlated with household income, accounting for 51 % of
cereal calorie procurement by lower-income and 67% by upper-income terciles.
Among the coarse grains, sorghum accounts for 64% of procurement by weight,
millet 26% and maize 9%. Sorghum is more heavily consumed by lower-, and
millet by upper-income tercile households. The share of maize is relatively even
across terciles. Ninety-two percent of coarse grains are procured in unprocessed
and 7% in dehulled form. Upper- and middle-income terciles procure a higher
proportion of coarse grains in dehulled form compared to the lower income tercile.
Modified Engels curves were estimated to quantify the effect .of income and
demographic variables on the amount of each cereal type and form procured per
adult equivalent. The statistical significance of the effect of income on procurement
was confirmed except in the case of dehulled sorghum. The quantity of sorghum
procured in grain form was found to be positively correlated, and the quantity of
rice negatively correlated, with household size. Procurement of dehulled millet and
sorghum was negatively correlated with the proportion of women household
members, and positively correlated with the proportion of women in the household

282
having a cash-earning primary activity. This is fairly strong evidence that
procurement of coarse grains with processing services already embodied is
positively correlated with the opportunity cost of women's time. Procurement of
maize grits is also positively correlated with the proportion of women in the
household with a cash-earning primary activity, and shows strong seasonality. Like
dehulled sorghum and millet, the quantity of rice procured is negatively correlated
with the proportion of women household members, but bears no relation to the
proportion of women with cash-earning primary activities.
The frequent-visit survey also recorded dishes prepared at different mealtimes.
Coarse-grain-based dishes are dominant at breakfast and dinner, rice at lunch and
also for households that prepare only one main meal a day. Eighty-four percent of
all coarse-grain-based dishes are prepared from flour. Even for yellow maize, whose
grits are commercially processed by women and by hammer mills, two-thirds of all
dishes are prepared from flour. For the purpose of overcoming the thin market
impediment to development of the maize subsector, flour is the most appropriate
processed product to promote because of the high potential volume of demand.
A detailed study of the cost of preparing rice and toh (the most frequently
prepared coarse-grain-based dish at main meals) was undertaken for a subset of
frequent-visit survey households. Toh is cheaper to prepare than rice, with or
without sauce costs included. Using either dehulled grain or flour, toh can be
prepared as quickly as rice. But at prevailing opportunity costs of women's time,
both dehulled grain and flour are more expensive than coarse grain processed under
household supervision. The search for lower cost processing. technologies is
important if the present cost advantage of prepared coarse-grain-based dishes is not
283
to be eroded as the opportunity cost of women's time rises with economic growth.
This component of the study helps to fill an important empirical gap in the literature
on urban cereal consumption in the Sahel.
9.2.3 The potential demand for pre-processed maize flours
The study of the cost of prepared toh also provides a benchmark for the
estimation of potential flour demand. There are considerations that would lead
households to purchase pre-processed flour even if it were more expensive than the
estimated cost of flour processed under household supervision. First, there are the
inconvenience factors described in chapter 4 that are difficult to cost in a budget.
These include the need to soak maize for several hours after dehulling before it is
milled,1 and the difficulty of finding good quality maize on the market at certain
times of year. Second there is the higher milling cost for maize. Although only 2.5
CFA F/kg, and insignificant in the total prepared dish cost, some household heads
explained that it was a source of friction with their wives because it reduces the
amount of money available for condiments. Third, there is a novelty effect. Some
households which do not consume maize might buy maize flour occasionally asa
change from eating sorghum or millet every day. Finally, every household
encounters periods when the opportunity cost of women's time rises significantly
(e.g., if someone is ill, or if there is a social event). Nevertheless, one would not
1 It will be recalled that it is not the labor requirement that creates theinconvenience. It takes only a few moments to fill a bucket with water and tip themaize in. The problem is that it must -be done four to five hours ahead of time. Leftfor too long, the maize starts to ferment.- Left for not long enough, the flourobtained from milling will not be as fine as desired.
284
expect demand for pre-processed flour to be much greater than existing
consumption levels at prices that exceed the cost of flour prepared by households.
To estimate the potential demand for pre-processed maize flour, a contingent
valuation experiment was conducted with the participation of frequent-visit sample
households using two qualities of flour (dehulled and whole grain) manufactured by
a local hammer mill. A standard censored Tobit model was estimated with monthly
flour demand as the independent variable. Price, income, flour quality, gender,
household size and composition, the opportunity cost of women's time,
employment in the military, and familiarity with maize were all found to have
statistically significant effects on quantity demanded.
The results of the Tobit estimation were used to calculate, for each flour type
before and after devaluation, expected quantity demanded, and price and income
elasticities of demand for male household heads. Price elasticities of demand are
high within the range of estimated retail prices for flour, reflecting the small quantity
demanded at those prices. Income elasticities of demand are low for dehulled flour,
and negative for whole-grain flour. In contrast to the pre-devaluation situation,
demand for whole-grain flour is greater than for dehulled flour at prices that reflect
their respective post-devaluation processing costs. For women, expected quantity
demanded is higher than for men at any given price, and both flour types are normal
goods.
The design of the contingent valuation experiment does not permit the
calculation of cross-price elasticities between maize flour and rice. Nevertheless,
analysis of the meals at which sample households intend to use maize flour
indicates that the product would be used primarily at mealtimes where coarse grains

285
are already widely consumed (breakfast and dinner), and rarely at mealtimes where
rice is predominant (noon). This indicates that the availability of maize flour, even
at very low prices relative to the price of unprocessed coarse grains, will have only
a modest impact on substitution of coarse grains for rice.
To estimate aggregate demand schedules for dehulled and whole-grain maize
flour for the district of Bamako, expected demand per adult equivalent for six
population sub-groups (civilian and military households each with three income
levels) was weighted according to each group's demographic share and multiplied
by the total number of adult equivalents in the population. Aggregate demand for
dehulled flour pre-devaluation, at an estimated retail price of 150 CFA F/kg, implies
a slightly higher consumption of maize grain than at present (380 tons per month,
equivalent to 10.1 kg/ae/year in grain equivalent terms,2 compared to 7.8
kg/ae/year in the frequent-visit survey).3 For whole-grain flour (significantly
cheaper at 115 CFA F/kg), aggregate demand is 815 tons per month, equivalent to
16.3 kg/ae/year of maize grain. Aggregate demand post-devaluation is significantly
smaller, at least in the short run. For the more expensive dehulled flour (175 CFA
F/kg), monthly aggregate flour demand of 70 tons per month implies a derived
demand for maize grain equal to only one-quarter the existing level of urban
consumption. For whole-grain flour (130 CFA F/kg post-devaluation), monthly
2 To account for processing losses, dehulled flour consumption must be inflatedby one third to arrive at the derived demand for maize grain. Thus 10.1 kg/ae/yearin grain equivalent terms represents dehulled flour consumption of 7.2 kg/ae/year.For whole-grain flour, processing losses are negligible.
3 Although the monthly aggregate demand for maize flours is compared toexisting maize grain consumption on an annual basis for convenience, theseasonality of potential demand for maize flour is unknown. This depends on theunderlying causes of seasonality in the demand for maize grain, and the pricingbehavior adopted by maize processors and retailers.

286
aggregate demand of 490 tons per month is still, at 9.7 kg/ae/year, slightly higher
.than existing levels of maize grain consumption. The reduction in quantities of flour
demanded as a result of devaluation is primarily attributable to increased processing
costs. In the medium.term, these estimates could prove to be conservative because
they do not take account of the intended increase in urban incomes in response to
economic opportunities made possible by devaluation, or increases in the cost of
processing under household supervision (e.g., as a result of increased charges at
custom plate mills). Estimated aggregate demands for maize flours using contingent
valuation responses are consistent with existing levels of maize procurement and
household costs of flour preparation. Results from probit and Tobit models with the
same independent variables are also highly consistent.
9.2.4 Devaluation and the profitability of maize cultivation
Fertilizer prices increased by 40% following devaluation. Partial budget
analysis was used to assess the impact of devaluation on the profitability of
intensive maize cultivation for three types of maize cultivation and three marketing
scenarios. The increase in fertilizer prices results in a marked decrease in the
profitability of intensive maize. Unless there is either an increase in the price of
maize, or an increase in the productivity of fertilizer use, or a reduction in price risk
through contracts, or some combination of such changes, farmers are likely to opt
for more extensive cropping patterns or crop management practices. While an
increase in maize prices would help to restore profitability, it would also make it
considerably more difficult for maize-led development of the urban market for
287
processed coarse grains to occur. It is therefore important to identify potential
sources of increased productivity (discussed further in section g.4).
9.3 Methodological issues and needed research
This section deals with research questions of more general interest. Research
questions specific to maize in Mali or to IER's commodity subsector economics
progral'11 are discussed in subsequent sections.
For a given commodity subsector study, researchers face difficult trade-offs
between the amount of resources devoted.to different stages in a subsector, the
number of issues at anyone level and the depth with which they are studied. For
example, urban household consumption systems are as complex as farming
systems, and large multidisciplinary teams can spend years studying them. Over
time, there is a parallel trade-off between the number of commodities studied, and
the depth with which anyone subsector is studied. In the longer run, there is a
further trade-off between more and/or more detailed subsector studies and studies
that seek to synthesize ~he implications of the results from individual subsector
studies for overall food system development. Thus, the methodological challenge is
to determine the trade-off between accuracy and cost of alternative methods. With
the exception of the literature on sampling methods, information about these trade-
offs is, in general, very limited.4 Both the contingent valuation and conventional
consumption survey components of this study generate such questions.
4 This lack of information raises questions about the incentive structure facingresearchers in developed countries where most research is undertaken, but thatquestion is beyond the scope of this dissertation.
288
Researchers are increasingly making use of contingent valuation methods to
predict the consequences of changes in policy and/or institutions (Rubey, 1993,
Mukumbu and Jayne, 1994). Limited dependent variable models will frequently be
used to analyze the data generated. An important empirical question that needs to
be answered is what are the implications of the violation of the assumed error
distribution and variance? For example, heteroskedasticity may be a likely
occurrence when asking consumers or producers to predict how they will behave in
alternative scenarios that increasingly depart from their present frame of reference.
While heteroskedastic models can easily be computed, search costs for the correct
form of heteroskedasticity and derivation of the partial effects and expected values
will be very time consuming. Furthermore, the predictions may not necessarily
change greatly. What are the implications of ignoring violations of the underlying
assumptions concerning the distribution of the error term for the magnitude of the
prediction error?
A related issue is the trade-off between cost and error in the degree of
disaggregation into population sub-groups. The derivation of expected values and
partial effects is very labor intensive when there are many potential target groups of
interest.5 The problem can be overcome by using a matrix programming language
such as GAUSS, but many researchers will not have the time to invest.in becoming
proficient in the use of this kind of specialized research tool. Are there rules 'of
thumb that can be developed for approximating values for different groups rather
than explicitly deriving values for each?
5 For example, the derivation of aggregate demand schedules in chapter 7required 24 linked spreadsheets (6 population sub-groups times 2 flour types times2 income levels), each with 8 blocks of coefficients (one for each price level) tocalculate partial effects and expected demands.
289
While economists have tended to use contingent valuation or hedonic pricing
models in private goods markets, the business schools and industry have used
mainly conjoint analysis. From the literature, there does not appear to have been
any cross-fertilization between these two disciplinary branches. What are the costs
and benefits of the information generated by these techniques in relation to different·
policy questions? Under what circumstances is one to be preferred over another?
This is an important methodological issue to pursue given policymakers' needs for
timely and reliable information.
Turning to the subject of detailed household consumption studies, while these
are demonstrably rich in the information that can be generated, they are extremely
costly to undertake. This is particularly true in regard to data management and
analytical resources. 6 Even the simplified version undertaken for the current study
came close to overwhelming the relatively generous (by African NARS standards)
resources available, crowded out analysis of important questions at other stages of
the subsector, seriously reduced time for interaction with private sector and donor
clients, caused tardy report submission, and did little to improve the quality of
interaction among team members. There has to be a way to keep the elephant,
even a baby elephant, out of the row-boat. What would be the consequences for
accuracy if households were interviewed once a month instead of once a week,
using one-month recall for bulk cereal purchases and one-week recall for small
purchases? What would be the consequences if households were interviewed once
every three months instead of once a week, using the same recall pattern? What
6 For example, the SPSS program to compute the proportion of dishes preparedfrom flour and grits at different mealtimes for each type of coarse grain is 75 pageslong.

290
would be the effect if daily condiment expenditures, a relatively easy figure to
obtain, were used instead of estimates of total expenditure? If reasonably accurate
results can be obtained, the marginal benefits from allocating resources to more
timely analysis and reporting of data, and more interaction with clients, would be
high.
In regard to the debate over substitutability between rice and coarse grains in
the S~hel, an important dimension has received little attention. Economists have
focussed almost exclusively on relative grain prices and, more recently,
complementary processing and preparation costs (Dibley et aI., 1994). But this is
to look only at the denominator of the neoclassical equilibrium condition (see
chapter 2, p. 21). Little effort has been made to understand the nature of
preferences for rice and coarse grains. Why is rice so widely consumed at mid-day
and coarse grains in the evening? Is it because the rice and coarse-grain-based
dishes give greater satisfaction at particular times of day (e.g., because rice is more
filling and coarse-grain-based dishes more digestible), or does the relative cost of
preparing them change with the time of day (e.g., because the opportunity cost of
women's time is higher at noon than at dinner)? Another way to phrase the
question is to ask whether the lack of substitutability is a reflection of highly convex
indifference curves (and if so, what attributes are generating that form, and can
they be manipulated to improve substitutability?) or are rice and coarse grains
instead complements so that an increase in the consumption of one increases the
marginal satisfaction of the other? In seeking to understand the relationship
between cereal attributes and preferences, the results of this study suggest that it
291
is important to distinguish between different coarse grain types and not lump them
together.
An important dimension of household consumption that this study has ignored
is the restaurant sector. Reardon et a!. (1988) report that a high proportion of total
rice expenditures for low income households in Ouagadougou is on prepared rice
purchased from street vendors. Reardon (1993) further argues that street vendors
are influential in promoting innovation in household consumption habits.
Incorporating the restaurant sector appeared less important when estimating the
potential demand for maize flour, since flour is already widely used by households.
Information on prepared food expenditures was sought as part of the survey of total
household expenditures, including the dish purchased. Consumption of prepared
food outside the household is a sensitive issue, however, since it could be
construed as a criticism of what is prepared at home as well as revealing the extent
of an individual earnings. Thus, information obtained from household heads is
unlikely to be an accurate reflection of aggregate household expenditures on
prepared food.
Since the baby elephant did climb aboard this row-boat, there are numerous
ways in which the analyses could be extended. Subject to the assumption of
strong separability between cereal and non-cereal expenditures, a rough
approximation of cross-price elasticities could be attempted. However, given the
limitation of the data (incomplete time-series for non-food expenditures, lack of
price data for non-cereal food expenditures), and the large number of studies that
have already been undertaken at different times using different methods (bemoaned
by Kite, 1993), it is not clear how valuable the additional information would be.
292
Furthermore, the assumption of strong separability between cereal and non-cereal
expenditures is contradictory to the finding that sauce cost varies with the choice of
cereal (chapter 6). This assumption also contradicts the maintained hypothesis
(chapter 2) that the demand for cereals is derived from the demand for dishes.
A unique aspect of the consumption data collected is the detail on dishes
prepared, processing methods and costs, and complementary condiment
expenditures. A cereal demand system could be formulated to estimate the derived
demand for different cereals at different mealtimes from the demand for dishes.
The cross-price elasticities of demand between rice and coarse grains for specific
meals would be more informative than standard cross-price elasticities of demand.
Examples of hypotheses that could be tested on the basis of meal and dish analyses
presented in chapter 6 are 1) that sorghum and maize have a greater cross-price
elasticity of substitution for rice at breakfast than at lunch or dinner, and 2)
sorghum and maize have a greater cross-price elasticity of substitution for rice than
millet at any meal. The analysis would require an assumption of strong separability
between food and non-food expenditures, which is more credible than an
assumption of strong separability between cereal and non-cereal food expenditures.
9.4 Implications for development of the maize subsector and maize research
priorities in Mali
This section focusses on the implications of the study's results for future
development of the maize subsector in Mali, and for maize research priorities.

293
9.4.1 Implications for development of the maize subsector in Mali
Development opportunities for the maize subsector are discussed at two
levels: 1) opportunities to promote maize processing, and 2) opportunities to
increase farm-level productivity. Opportunities to reduce marketing costs are not
explicitly addressed, although possibilities to improve coordination between farm
level supply and potential processors are.
9.4.1.1 Opportunities to promote maize processing
Despite devaluation of the CFA franc, the present (albeit modest) level of
potential urban demand for maize flour is adequate to initiate private-sector
involvement in coarse grain processing activities if facilitative actions are taken by
the PRMC and GRM. It is important to seize this opportunity to launch the process
of transformation of the urban coarse grain distribution system. Structural changes
in the broader urban economy over time will lead to an increasing demand for a
range of coarse-grain products with different amounts of processing services
embodied rather than just unprocessed grain. For example, household demand for
dehulled millet, dehulled sorghum, and maize flour and grits are all positively related
to the proportion of women in the household with a cash-earning primary activity.
This proportion will increase over time as more women participate in economic
activity and household size declines. Similarly, the demand for dehulled maize,
dehulled millet, maize grits and maize flour (dehulled) are all positively related to
income. In the long run, the recent devaluation will lead to increased real incomes if
the policy succeeds in its objective of stimulating productivity growth.
294
An efficient coarse grain processing industry will facilitate this broader
process of economic development, while an underdeveloped one will hinder it.
Because development of the coarse grain processing industry and that of the
broader urban economy are synergistic, the rate of transformation will depend on
how quickly the cost of processing services relative to the opportunity cost of labor
in urban households can be brought down through technical innovation to reduce
processing costs and losses, and organizational innovation to capture economies of
scale.
Aside from the opportunity to improve the efficiency of coarse grain dehulling
services (Sanogo et al., 1993; Holtzman et aI., 1991), there are three potential
market development strategies for maize flour. Each has advantages and each has
obstacles that need to be overcome. Option 1 is first to promote refined maize flour
to build consumer confidence and then introduce whole-grain flour as a low-cost
competitor. Option 2 is to forget about refined flour and promote whole meal flour,
possibly with subsidies in connection with an urban food aid distribution program.
Option 3 would be to promote both flours simultaneously without direct (i.e.
production cost) subsidies. Given the complementarity between dehulled and
whole-grain flour in regard to markets niches and economic linkage effects, option 3
is preferred.
The promotion of dehulled maize flour has three advantages and one major
obstacle to overcome. The first advantage is that the Grands Moulins du Mali
(GMM) already has a state-of-the-art maize mill installed•.Since the investment is a
sunk cost, and many overhead costs are joint with wheat and -paddy processing,
GMM has a rationale to price the product at below average total cost in the short

295
run to obtain at least some return on the investment. Furthermore, GMM
management is becoming more responsive to opportunities for innovation as milling
margins on wheat are progressively squeezed by the removal of tariffs on flour
imports and coordinated donor selling of commodity-aid wheat. Second, GMM has
stated that it would be willing to purchase maize from farmers on a forward
contract basis if the PRMC would be willing to finance a maize flour promotion
campaign. Farmers repeatedly stated that the lack of a guaranteed price was their
principal reason for not purchasing fertilizer for maize production. Since improved
returns for cereal growers are a major objective of the PRMC, there would be solid
justification for using PRMC funds to promote maize flour marketing if linked to
maize procurement contracts from maize grower associations. Third, there are
other industrial needs for maize products that are currently being met through
imported products (e.g., starch for glue, batteries and conserves; grits for brewing)
that could be supplied locally once GMM's maize production line was up and
running.
The main constraint is that the volume of demand at estimated post
devaluation retail prices may too small to make it worthwhile. One possible way to
overcome this problem would be to incorporate maize flour with whec:'t flour
intended for baking bread. For example, a mix of 95% wheat and 5% maize flours
would generate a requirement of 1500 tons of maize flour per year, based on pre
devaluation demand for wheat flour. If the technical and financial feasibility of
maize flour incorporation with wheat flour can be confirmed, the next step would be
to undertake a test of consumer acceptability. In view of the acrimonious history of
relations between GMM and the bakers, it would be useful to have some outside
296
encouragement and supervision of such a test (e.g., by the PRMC) to ensure that it
is undertaken and evaluated in good faith.
An additional policy measure required is to rescind VAT on processed maize
products. This tax only applies to GMM since it is not enforced upon the informal
sector. It currently generates no revenue, and its continued existence is
inconsistent with previous legislation that rescinded VAT on rice dehulling to
promote consumption of domestically produced paddy.
The promotion of whole grain maize flour has two key advantages. First, it
would involve small-scale processors immediately rather th~n after a delay.
Second, consumers need and are receptive to lower-cost products as a result of the
fall in real incomes following devaluation. Even the lower post-devaluation level of
demand of 490 tons per month is sufficient to keep up to 20 hammer mills in
business. Nevertheless, this strategy also has disadvantages that must be
overcome. First, there may be strong consumer resistance, at least initially, to
purchasing flour from retailers unless it is in sealed packages. Such packaging
would drive up the cost significantly, undermining the very basis on which the
product could compete - cheapness.7 Second, whole-grain flour has a relatively
short shelf life. It can become rancid in as little as three weeks. Unless a very
rapid and effective distribution system is established, the product could quickly lose
credibility with consumers. Third, owners and/or operators of coarse-grain
processing equipment currently have very little experience in combining processing
and product marketing operations (vertical integration).
7 Assuming a 10 CFA F/kg cost of packaging, demand would fall by nearly halfto 260 tons per month.

297
The difficulties associated with the promotion of a whole-grain flour
processing and' distribution could be overcome through innovative forms of
organization. For example, rapid low-cost distribution might be achieved by
networks of women retailers residing in the densely populated suburbs ("quartiers
populaires")., Through their detailed knowledge of households in their locality, such
retailers could establish a regular clientele. Knowing their clients personally, and
being in a position to verify the quality of flour supplied to them and distribute it
quickly, they could avoid the need for costly disposable packaging and deliver the
product in re-usable containers instead. Such an approach would create badly
needed part-time informal-sector employment opportunities for women, as well as
providing households with a low-cost ready-to-use coarse grain product.
Several options exist for supplying retailers with whole-grain flour on a regular
basis. These include 1) an existing GIE such as SAMA, 2) an urban wholesaler or
group of wholesalers who combine a hammer mill with dehulling equipment, 3)
women could purchase grain themselves and have it milled at a hammer mill
installed alongside an existing custom plate mill, or 4) women retailers could form
their own GIE for processing flour. Option 2 is particularly promising since urban
wholesalers are well-placed to procure maize of appropriate quality (soft endosperm,
white) on a regular basis from their rural counterparts. Furthermore, fixed costs
could be reduced in the early stages as the dehuller and hammer mill could be run
alternately by a single electric motor.
A promotion campaign is even more necessary for whole-grain flour than for
dehulled flour. Consumer awareness of the product will facilitate rapid distribution
and reduce the risk of rancidity. Furthermore, 'consumers need to be made aware

298
that the discoloration of whole-grain flour is due to the presence of bran, not
impurities, and that whole-grain flour has nutritional advantages oVer refined flour.
The third option is the most ambitious, seeking to capture the advantages of
options 1 and 2. Option 3 has the advantage that the costs of a promotional
campaign would not necessarily be significantly higher for two types of flour than
for one, and could be designed to target the flours to different market segments.
The results of the survey suggest that dehuJled flour can be most effectively
promoted in higher income suburbs, and dehulled flour in low income suburbs.
Smaller households and households where women have cash-earning activities will
generally be more receptive to promotional efforts. Military households in Bamako
and nearby Kati represent a key opportunity to establish a regular source of demand
at an early stage in market development.8 Institutional sources of demand, such as
school feeding programs, could also be used as a vehicle to promote maize flour
consumption. If option 3 is chosen, whole:-grain flour cannot be promoted using
subsidies without undercutting GMM, however, since whole-grain flour is only
weakly self-targeting.
Promotion of maize flour should be accompanied by technical backstopping
for maize processors. For both types of flour it will be necessary to monitor flour
storage quality at different times of year. For potential hammer mill operators, there
is a need to identify mills that can provide sufficiently fine flour without having to
8 To maximize the long-run effectiveness of any promotion campaign it isimportant to develop a better understanding of the reasons for higher demand formaize flour among military households. Is this because household heads arefrequently absent for long periods of time so that military households' demandpatterns are similar to those of female-headed households? Or did militaryhouseholds simply become more familiar with maize during the period when OPAMsupplied cereals to the military prior to cereal market liberalization?
299
manually sieve the product as carried out for the second large-scale consumption
test (e.g., from machinery suppliers in Zimbabwe where maize is milled primarily for
human consumption). Hammer mill operators also require organizational support
from a specialized microenterprise development unit. In addition to facilitating the
establishment of whole-grain flour processing and distribution networks, assistance ..
will be needed to secure a year-round supply of maize grain of appropriate quality
from urban wholesalers or farmer associations.
9.4.1.2 Opportunities to increase farm-level productivity
There are two related technological themes for improving maize productivity
and reducing unit costs of production at farm level: fertilizer use efficiency and
varietal adoption. As a result of devaluation of the CFA franc in January 1994,
fertilizer prices in the CMDT zone will increase by 40% on average in the coming
season. Yet, because of aggregate cereal self-sufficiency in 1993, maize prices did
not increase significantly between 1993 and 1994. If farmers are to have an
incentive to use fertilizer it is essential to improve the financial return to fertilizer
use. This can be accomplished by an increase in yield response to fertilizer use
and/or a reduction in fertilizer cost. Potential avenues for a reduction in the cost of
fertilizer that could be explored through on-farm agronomic trials include:
300
• urea top dressing only for maize grown after cotton instead of the present
universal recommendation of basal application of complete-formula fertilizer at
planting as well as urea top dressing;9
• investigation of the marginal rate of return to moderate as opposed to full
recommended fertilizer doses, the former shown to be much higher in similar
agro-climatic conditions in Senegal (Posner and Crawford, 1992);
• investigation of the financial returns to less expensive basal fertilizer sources
(i.e. binary or single-nutrient sources as opposed to the complete-formula
fertilizers currently recommended).
An important potential source of improved yield response to fertilizer is the
use of hybrid maize varieties. The current policy of not producing and distributing
hybrid maize seed on the grounds that it is too costly, which has never been subject
to a careful financial analysis, should be urgently reviewed. If hybrid varieties can
produce a better return to the farmers' investment including the higher cost of seed,
they should be promoted. Since an important component of the additional cost of
hybrid seed compared to open-pollinated varieties is labor, the relative cost of hybrid
seed to fertilizer will be lower following devaluation. A careful study of the costs
and returns to hybrid varieties under farmers' management with different fertilizer
regimes and cropping systems is an urgent agronomic research theme.
Farm-level surveys conducted by IER in collaboration with the CMDT suggest
that adoption rates for existing improved varieties could be significantly increased
9 The application of a 100 kg/ha urea (46% N) top dressing only for maizegrown after cotton was recommended prior to the implementation of a guaranteedprice of 55 CFA F/kg in 1980. In 1980, and without financial analysis, therecommendation was changed to 200 kg/ha complete-formula fertilizer at planting,followed by 100 kg/ha urea top dressing at first weeding, and has not been revisedto reflect the radically changed market circumstances.

301
by an extension policy that tailors varietal promotion to farmer needs and
circumstances. In trying to encourage intensification of rainfed cereal production,
the CMDT promoted only long-duration varieties with high yield potential in the
high-rainfall areas. Nevertheless, a significant proportion of farm families are food
deficit due to low levels of mechanization and the absence of a cash crop. Their
first need IS for early maturing varieties, even if the yield is lower than could be
obtained with long duration varieties. Similarly, farmers who intercrop maize with
late millet to take advantage of the longer rainy season in the southern part of the
CMDT zone are interested in early-maturing maize varieties. Improved early-
maturing varieties of maize are available but, due in part to CMDT's policy of
distributing mainly long-duration varieties in high rainfall areas, are not yet widely
accessible to farmers in the southern part of the CMDT zone.
Complementary innovations to reduce financial risk will also facilitate fertilizer
adoption at farm level. In the course of informal interviews conducted during the
ex-post impact assessment study and the rapid maize subsector appraisal, farmers
repeatedly stated that the lack of a guaranteed price was the principal reason for
not purchasing fertilizer for maize production.10 GMM has stated that it would be
willing to purchase maize from farmers on a forward contract basis if the PRMC
would be willing to finance a maize flour promotion campaign. Since improved
returns for cereal growers is a major objective of the PRMC, there would be solid
justification for using PRMC funds to promote maize flour marketing if linked to
maize procurement contracts from maize grower associations.
10 These interviews took place prior to devaluation of the CFA franc. Whileincreases in fertilizer prices are certainly a major disincentive to fertilizer use,removal or reduction in the uncertainty concerning output prices is a valid objectiveto pursue since it would serve to mitigate the effect of fertilizer price increases.

9.4.2
302
Implications for maize research priorities
An important potential contribution of commodity subsector studies
undertaken by NARS is to inform research priority-setting within and between
commodities. We do not imply that this should be the major focus of the research
of commodity subsector study teams, nor that their contribution should necessarily
carry more weight than the views of other stakeholders in the research system.
However, assessment of the longer-term prospects for development of a particular
subsector will inevitably generate information useful to the design of, and allocation
of resources to, agricultural research programs. We first look at the focus of
research effort within the maize subsector, and then at implications for other
commodities.
The maize program is of appropriate size but needs to be more focussed
geographically, and with greater integration between on-station and on-farm
research. In justifying this conclusion, we briefly review the past and then look at
the future.
Boughton and Henry de Frahan (1994) report that during the 1970's an
average 0.73 full time equivalent (FTE) person years went into maize research, all
for on-station varietal selection. During the 1980's, this rose to an average of 6
FTEs per year (including research-extension liaison personnel in the development
agencies), 70% for sale maize research (evenly split between on-farm and on
station) and 30% for intercropped maize research (90% on-farm). During the
1970's the program was arguably too small to be effective. During the 1980's the
program achieved a critical mass of researchers, and effectively dealt with the
maize streak virus problem through close collaboration between research and
303
development agencies, and between different research disciplines. Intercropping
research activities were by contrast geographically and organizationally diffuse,
suffered from poor coordination, and were inconclusive. The contrasting
experiences of intercropping research and action to combat maize streak virus
provide an important clue as to how to improve program effectiveness in the future.·
As of June 1994, the maize program has 5.35 FTEs (1.5 agronomists, 1
breeder, 1 pathologist, 1 entomologist and 1 weed scientist). All but 1 FTE are
based at Sotuba, a location agro-climatically representative of the northern half of
the CMDT zone. At present, the Sikasso farming systems team is also devoting
approximately 2 FTEs to on-farm maize research (1 agronomist and 1 economist).
The total of 7.35 FTEs represents 2.5% of total research personnel, 3.3% after
excluding those on long-term training or in full-time administration.
Expansion of the varietal improvement component from a testing program to a
breeding program is not justified. Maredia (1993) estimates that, for wheat in
developing countries, a threshold annual production level of 150,000 tons is
necessary for a varietal testing program to achieve an IRR in excess of 12%. For a
breeding program to be more profitable than just testing varieties from elsewhere
(e.g., CIMMYT), the threshold is 780,000 tons." Even after haggling over
differences between maize and wheat, maize production in Mali, which peaked in
1986 at 232,000 tons, will remain significantly less than 780,000 tons per annum
for many years to come. The varietal evaluation component of the maize program
11 Based on a scientific personnel requirement of 1 FTE for a testing programand 3 FTEs for a breeding program at a cost of (1992) US $35,000 per FTE peryear.
304
has proved extremely effective at borrowing material from outside and there is no
reason to think that this strategy will not continue to bear fruit in the future.
The effectiveness of the varietal improvement component of the program
could be sharpened in three ways. First, as the geographical focus of future area
.expansion, the southern part of the CMDT zone, should be given more emphasis in
regard to screening efforts. Second, parallel on-farm testing of improved varieties
should be undertaken by the farming systems program in southern Mali for both
sole and intercropped maize systems. The recent reorganization of IER into regional
centers with both on-station and farming systems research activities could greatly
facilitate this collaboration. However, to serve the high potential area where future
expansion of maize production is likely to occur more effectively, the main location
of the maize program should be moved from the Sotuba regional center to the
Sikasso regional center. Third, in view of the increased cost of fertilizer, more
attention should be given to a careful evaluation of the economic feasibility of
hybrids, and on-station and on-farm research on fertilizer application levels should
be conservative. Approximately 2 research FTEs, one each on-station and on-farm,
could undertake such a program.
Aside from continued varietal selection, the single most important challenge
facing the maize research program is to re-establish the profitability of fertilizer use.
Without the use of added fertility amendments, maize is no less land-degrading than
millet or sorghum. A number of avenues for reducing the cqst and/or increasing
yield response to fertilizer have been enumerated above. A critical organizational
innovation is that the research again be carried out in parallel on-station (to measure
agronomic response and soil fertility effects of alternative treatments accurately)

305
and on-farm (to assess economic feasibility and risk under farmers' management
accurately). Again, this work should be focussed in the southern part of the CMDT
zone where yield potential is highest. Fertility research should be conducted for
both sole and intercropped maize research. Approximately 2 research FTE's would
be required to undertake the on-farm and on-station programs. In view of the weed
challenge in the high potential southern part of the CMDT zone, and the interaction
between weed control and fertilizer us~, both fertilizer agronomy and weed science
disciplines need to be represented on the team.
In view of the importance of assessing the economic feasibility of alternative
varietal and fertilizer treatments in both sole and intercropped systems, the
availability of an economist to the maize program is crucial. There is also a need to
assess the marketing difficulties faced by farmers in the southern part of the CMDT
zone due to poor transport infrastructure, and the extent to which different
technology-development strategies are appropriate for farm households with
different resource endowments (in particular for food-insecure households). The
maize program could absorb 1 FTE economist in order to undertake marketing and
food security research in the high potential zone in addition to economic analysis of
on-farm and on-station trials.
In addition to core disciplines of varietal selection, agronomy and economics,
limited contributions (up to 0.25 FTEs) from support services in soil science,
pathology, and entomology would be required. Entomology inputs may need to
expand to 1 FTE if increased storage pest problems are encountered as a result of
expanded production or migration of the Large Grain Borer (Prostephanus truncatus)
from neighboring countries.

306
There is no indication that industrial maize processing requirements show
strong varietal specificity. For whole grain maize flour, a soft-endosperm white
variety such as Tuxpeno would be preferred. This variety is readily identified by its
flat shape and indented outer face. Farmers prefer it as a commercial variety
because it is high yielding but difficult to process manually. For refined flour, a
medium-textured grain of either color would be suitable. Separation of grain lots by
variety would marginally improve flour yield12, and hence provides a further motive
for GMM to enter into forward contracts with farmers that specify the variety to be
grown. However, there is no need to select varieties specifically for their
mechanical processing characteristics. The difficulty of manual processing
(dehulling and milling) can vary considerably from one variety to another (DRSPR,
1994) and should, along with culinary tests, become an integral part of varietal
evaluation in collaboration with the food technology laboratory and rural
households. Up to 0.5 food technology FTEs could be absorbed by this component,
depending of the extent of work with rural households.
If PRMC and GOM decide to adopt facilitative measures in support of maize
processing, then additional research input from a food technologist and social
scientist would be advisable. The role of the food technologist would be twofold:
1) to develop instructions for use in promotional materials on how to prepare
principal dishes (bouillie, toh, couscous), focussing on differences in technique
between dry and moist flour; 13 2) monitoring the cooking and storage quality of
processed flours and diagnosis of the cause of any problems that emerge. The
12 Christian Mestres, personal communication.
13 In Bamako, housewives are used to flour milled in custom plate mills. Wateris added to dehulled grain prior to milling to produce a finer flour.
307
social scientist would monitor sales to different population sub-groups and
recommend improvements in marketing and promotional strategies. In view of the.
short-term nature of this activity, personnel could be provided from a local
consulting firm or micro-enterprise support project rather than from IER.
Taking account of the need for limited additional inputs from supporting
scientific personnel such as plant pathologists and soil scientists, the near to
medium-term priorities described above imply a program of similar size to that
prevailing during the 1980s, but with sharper geographic and agronomic focus on
production opportunities (area expansion in the high potential southern part of the
CMDT zone) and constraints (high fertilizer costs), and closer collaboration between
on-station and on-farm activities. This could be accomplished more effectively if
the principal location of the maize program were moved from Sotuba to the Sikasso
regional center. In terms of disciplinary mix, up to one full-time economist and one
half-time food technologist need to be available to the program. It is not clear that
the program needs full-time input from a pathologist and an entomologist at present,
although the situation could change if there were a resurgence of maize streak virus
or an outbreak of storage pests.
9.4.3 Implications for research on other cereal subsectors
In regard to other foodgrain subsectors two main points emerge. First, rice
dominates cereal calorie supply to the population of Bamako. Yet the rice subsector
in Mali is undergoing traumatic changes as a result of devaluation and the
withdrawal of the state from rice processing and marketing, and credit and input
delivery. This coincides with a period of political tension following the 1991 coup,
308
attempted coups in 1991 and 1992, and sharp increases in the cost of living
following devaluation in 1994. A breakdown in the supply of rice to the capital's
population would clearly result in serious social distress and political instability.
Careful monitoring of the subsector activity, focussed on private sector decision
makers' intentions, is a top priority in the short run. In the medium to longer term
there are numerous issues that need to be investigated to increase productivity in
the rice subsector, close the gap remaining between domestic consumption and
production, and drive down costs of rice delivered to the urban consumer. These
have been enumerated for the irrigated rice subsector at the Commodity Subsector
Economics Program design workshop (lER, 1994), but need to be augmented for
rainfed rice production systems.
For millet and sorghum, there exists a window of opportunity to increase the
efficiency of mechanical dehulling services through improvements in technology and
changes in market organization. The introduction of abrasive disk dehullers at
wholesaler level would reduce processing losses, reduce distribution costs, and
permit more efficient use of by-products by livestock rearers. Since sorghum
varieties vary considerably in their dehulling characteristics, growth in demand for
dehulled products would eventually lead to a price premium for varieties with
appropriate criteria (harder textured and without red discoloration of the outer layer
of endosperm). This in turn would encourage adoption of improved varieties with
these characteristics (e.g. some of the Malisor series of improved sorghums).

309
9.5 Implications for IER's commodity subsector economics program
Although addressed primarily to IER's commodity subsectoreconomics
program, the conclusions drawn in this chapter are broadly applicable to African
NARS seeking to take account of market opportunities and constraints in the design
of agricultural research programs.
9.5.1 Methodological implications
The flexibility of the commodity subsector approach means that the depth and
focus of studies can be adjusted to a wide range of personnel and financial
resources. For any study, the initial subsector appraisal is a critical first step. It will
have the following objectives: 1) to bring together existing information about the
nature and functioning of the commodity subsector; 2) to bring together different
subsector participants and make that information available to them; 3) to identify
constraints and potential solutions at different stages of the subsector; and 4) to
identify and define the role of different subsector participants (including researchers)
in overcoming identified problems.
For small NARS, or for less important commodities, the initial appraisal may be
the only subsector research activity for a given commodity. Large NARS may
consider using initial appraisal methods extensively as a means to set priorities for
long-term subsector development programs. For either situation, high priority
should be attached during the initial subsector appraisal to the identification of
innovations that can be implemented (or at least initiated) rapidly (e.g., repeal of
redundant fiscal or regulatory legislation, supplying information needs of subsector
participants)•
310
Where problems or issues are identified that require more in-depth study,
great care must be given to the amount of quantitative data collected (Tefft et aI.,
1990). Large-scale formal data collection efforts such as consumption, cost-of
production, or market information studies may best be confided to specialized
projects or units (e.g. Mali's Market Information System or the national statistical
agency). In many cases, less quantitative and/or less frequent data collection will
be adequate for the pragmatic objectives in view.
Of critical importance to the payoff to commodity subsector programs is a
system to monitor the implementation of recommendations. For both innovations
that can be implemented rapidly and for longer term activities (such as setting up
cooperative marketing programs, testing of improved technology, or in-depth
research' activities), a monitoring system must be designed that identifies and tracks
intermediate and final outcomes against expected progress, and circulates
information in a timely way to interested parties. Like any research activity,
commodity subsector programs will need to demonstrate their economic impact.
9.5.2 Organizational implications
Critical to success of a commodity subsector economics program is the
identification and involvement of "stakeholders" in the private sector (e.g., farmers,
traders, consumers, bankers) and the public sector (e.g, the research organization
and its donors, extension agencies, and other government or non-government
organizations). An important role for a commodity subsector research program will
be to help build and motivate coalitions, or networks (Juska and Busch, not dated),
that can integrate the actions of different participants.
311
The type and degree of involvement of each stakeholder will vary over time.
Representatives of relevant technical research programs and the farming systems
research programs must participate (i.e. a human resource investment "stake" must
be taken) in the initial subsector appraisal and identification of available innovations
and/or necessary in-depth studies. Researchers and representatives of the private
sector and government or non-government extension agencies should agree about
the need for, and approach to, in-depth research on constraints or problems
identified during the initial assessment (including the time required to achieve
intermediate and final objectives). Representatives of the private sector and
government or non-government extension agencies must participate, and in many
cases take a lead role, in the design and implementation of action programs to test
and/or implement potential solutions to identified constraints.
A key step is to strengthen linkages between agricultural research and
planning and policy units within ministries of agriculture, planning and finance. The
optimal set of technologies needed ten to fifteen years hence depends on
complementary investments in physical, financial and communications
infrastructure. For example, the decision as to whether or not to invest in a
domestic fertilizer industry could have a profound effect on which kind of crop
research strategy to pursue. Similarly, a decision to devote a major proportion of
investment resources to the development of irrigated perimeters as a hedge against
drought would have important implications for the allocation of research resources
between rainfed and irrigated cropping systems. Thus, in terms of the allocation of
resources between different commodity areas, the allocation of resources to
different types of problems within a commodity group, and even in the approach
312
taken to. a specific problem (e.g., farm-level pest management for cocoa), decisions
taken by NARS need to be consistent with those taken by the public and the private
sector to promote specific economic development paths. One method for achieving
this is to set up joint task forces for key commodity subsectors that include
representatives from the private sector, planning units and agricultural research.
The establishment of effective linkages between NARS and private and public
sector clients will require investment in human capital. If NARS are to contribute to,
and interpret the implications of, policy and institutional innovation they will require
additional types of skill. To support linkages with the broader public sector, for
example, NARS will need to include some macro and marketing economists on their
staffs as well as farming systems economists. Similarly, in their interaction with
private sector clients, social scientists will need to be able to grasp and respond to
a broad range of financial and legal concerns (e.g., contractual design). Often,
mutual suspicion will need to be overcome to build collaborative relationships
between researchers and the private sector.
Regional organizati.ons such as INSAH and SACCAR have important roles to
play in building capacity, helping to strengthen organizational linkages, and
providing analytical support. Regional organizations can provide a constructive
forum for building consensus on the need for, and exchanging experiences
concerning, the establishment of effective linkages between research and policy
units (e.g., CILSS, 1994). Regional organizations also have a comparative
advantage in providing certain types of analyses that affect the region as a whole,
such as analysis of economic trends or comparative analyses of structural
adjustment processes in several countries within a region.

313
Finally, effective external linkages will be of little value unless there are
equally effective linkages within the NARS itself. For example, monitoring the
impact of liberalization of livestock feed markets will involve both marketing and
farming systems dimensions. Research on these impacts witl need to be designed
and implemented jointly. Similarly, because of significant changes in the demand
for technology as a result of devaluation, there witl need to be more effective
linkages between technology development and technology testing activities than
have been the norm hitherto. Again, joint task forces organized around particular
commodities can provide a means to bring together thematic researchers, farming
systems research, and marketing economists in order to develop commodity
research strategies.
9.6 Conclusion
The development of an agricultural policy and technology design process that
brings together different private and public sector actors, and different groups of
scientists within the NARS, cannot be achieved by a cookbook method. A
commodity subsector approach can provide a framework for organizing analysis of
food system problems in such a way as to promote dialogue between different
groups of participants, each of which has a contribution to make to solving those
problems. A commodity subsector approach can improve the potential payoff to
investments in agricultural research by identifying ways of driving down costs
throughout the subsector by a combination of appropriately· sequenced
technological, institutional and policy innovations that better match the supply of
agricultural technology to market demand over time. The Institut d'Economie Rurale
314
has included subsector studies in its strategic plan to ensure that its efforts are
relevant to the needs, circumstances and opportunities of clients at all stages from
farm-level production to final consumer. The maize subsector study was the first in
~ this series, and contributes to both a methodological foundation for future studies
and directly useable results to enhance the performance of Mali's cereal subsectors.

APPENDICES

APPENDIX 1
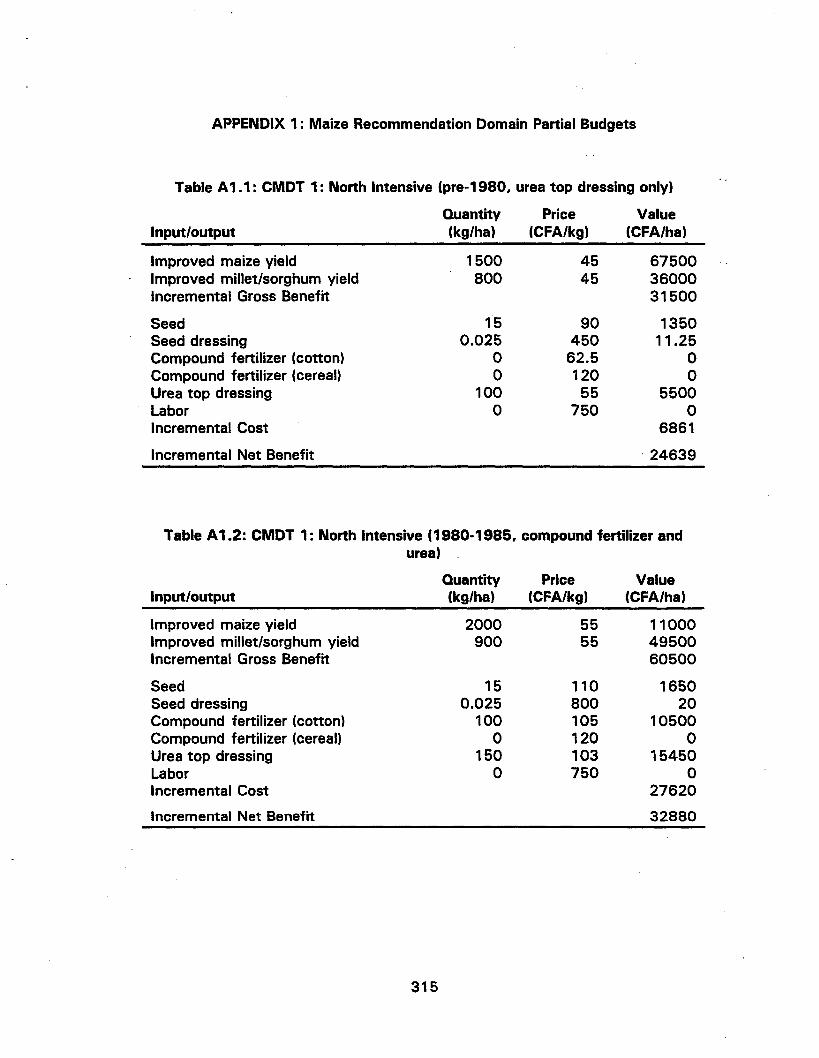
APPENDIX 1: Maize Recommendation Domain Partial Budgets
Table A1.1: CMDT 1: North Intensive (pre-1980, urea top dressing only)
Input/output
Improved maize yieldImproved millet/sorghum yieldIncremental Gross Benefit
SeedSeed dressingCompound fertilizer (cotton)Compound fertilizer (cereal)Urea top dressingLaborIncremental Cost
Incremental Net Benefit
Quantity(kg/ha)
1500800
150.025
oo
100o
Price(CFA/kg)
4545
90450
62.5120
55750
Value(CFA/ha)
675003600031500
135011.25
oo
5500o
6861
·24639
Table A1.2: CMDT 1: North Intensive (1980-1985, compound fertilizer andurea)
Quantity Price ValueInput/output (kg/ha) (CFA/kg) (CFA/ha)
Improved maize yield 2000 55 11000Improved millet/sorghum yield 900 55 49500Incremental Gross Benefit 60500
Seed 15 110 1650Seed dressing 0.025 800 20Compound fertilizer (cotton) 100 105 10500Compound fertilizer (cereal) 0 120 0Urea top dressing 150 103 15450Labor 0 750 0Incremental Cost 27620
Incremental Net Benefit 32880
315

316
Table A1.3: CMDT 1: North Intensive (1980-1985, half fertilizer dose)
Input/output
Improved maize yieldImproved millet/sorghum yieldIncremental Gross Benefit
SeedSeed dressingCompound fertilizer (cotton)Compound fertilizer (cereal)Urea top dressingLaborIncremental Cost
Incremental Net Benefit
Quantity(kg/ha)
1750900
150.025
o5075o
Price(CFA/kg)
4055
801040
140120130750
Value(CFA/ha)
700004950020500
120026o
60009750
o16976
3524
Table A1.4: CMDT 2: North Semi-Intensive (1980-1985)
Input/output
Improved maize yieldImproved millet/sorghum yieldIncremental Gross Benefit
SeedSeed dressingCompound fertilizer (cotton)Compound fertilizer (cereal)Urea top dressingLaborIncremental Cost
Incremental Net Benefit
Quantity(kg/ha)
1400900
150.025
oooo
Price(CFA/kg)
.5555
110800105120103750
Value(CFA/ha)
770004950027500
165020oooo
1670
25830
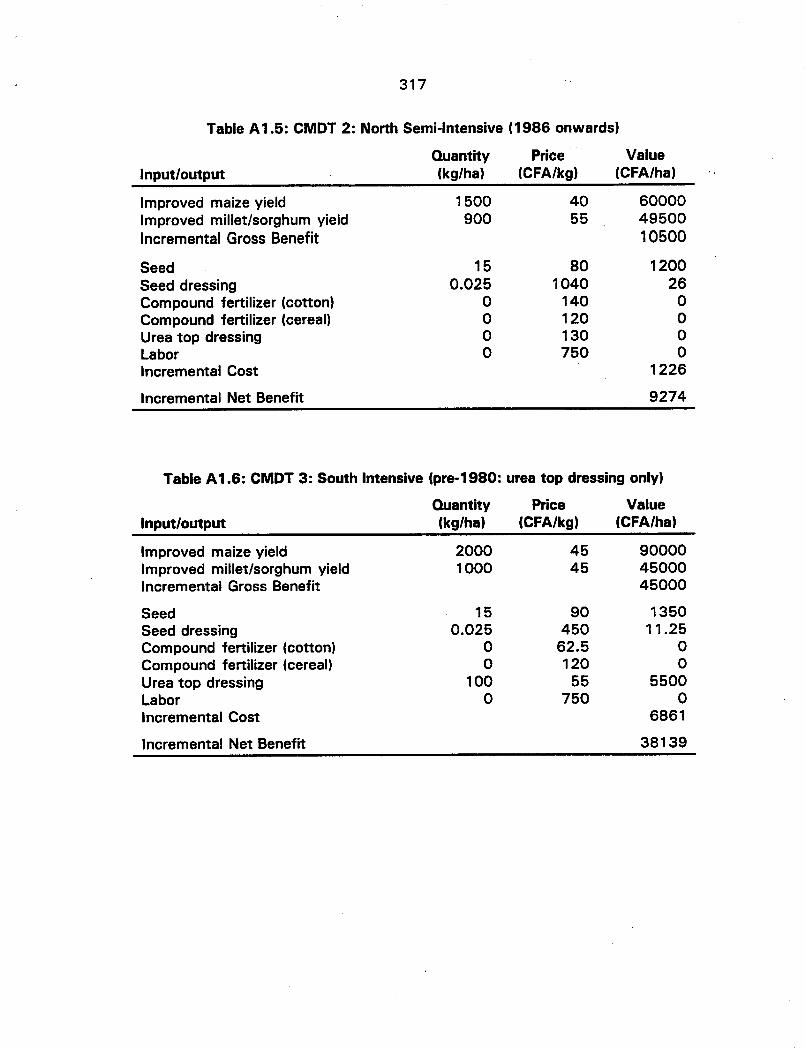
Input/output
317
Table A1.5: CMDT 2: North Semi-Intensive (1986 onwards)
Quantity Price ValueInput/output (kg/ha) (CFA/kg) (CFA/ha)
Improved maize yield 1500 40 60000Improved millet/sorghum yield 900 55 49500Incremental Gross Benefit 10500
Seed 15 80 1200Seed dressing 0.025 1040 26Compound fertilizer (cotton) 0 140 0Compound fertilizer (cereal) 0 120 0Urea top dressing 0 130 0Labor 0 750 0Incremental Cost 1226
Incremental Net Benefit 9274
Table A 1.6: CMDT 3: South Intensive (pre-1980: urea top dressing only)
Quantity Price Value(kg/ha) (CFA/kg) (CFA/ha)
Improved maize yieldImproved millet/sorghum yieldIncremental Gross Benefit
2000 45 900001000 45 45000
45000
SeedSeed dressingCompound fertilizer (cotton)Compound fertilizer (cereal)Urea top dressingLaborIncremental Cost
Incremental Net Benefit
150.025
oo
100o
90450
62.5120
55750
135011.25
oo
5500o
6861
38139
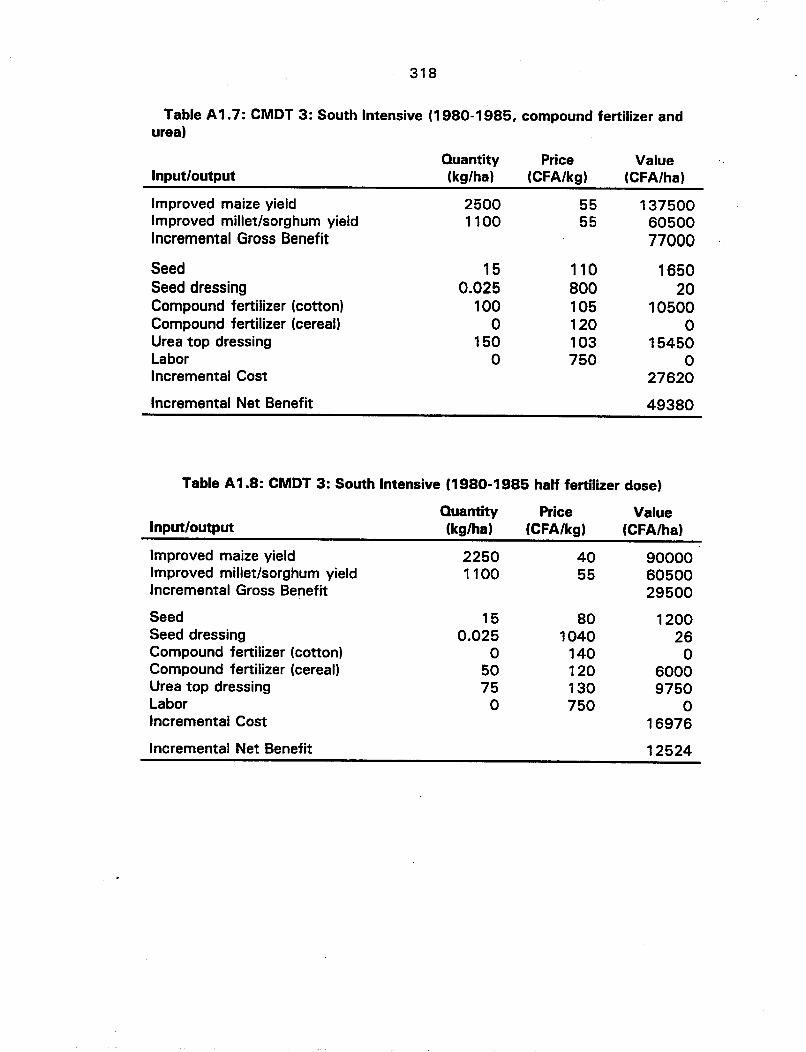
318
Table A 1.7: CMDT 3: South Intensive (1980-1985. compound fertilizer andurea)
Quantity Price ValueInput/output (kg/hal (CFA/kg) (CFA/ha)
Improved maize yield 2500 55 137500Improved millet/sorghum yield 1100 55 60500Incremental Gross Benefit 77000
Seed 15 110 1650Seed dressing 0.025 800 20Compound fertilizer (cotton) 100 105 10500Compound fertilizer (cereal) 0 120 0Urea top dressing 150 103 15450Labor 0 750 0Incremental Cost 27620
Incremental Net Benefit 49380
Table A1.8: CMDT 3: South Intensive (1980-1985 half fertilizer dose)
Input/output
Improved maize yieldImproved millet/sorghum yieldIncremental Gross Benefit
SeedSeed dressingCompound fertilizer (cotton)Compound fertilizer (cereal)Urea top dressingLaborIncremental Cost
Incremental Net Benefit
Quantity(kg/ha)
22501100
150.025
o5075o
Price(CFA/kg)
4055
801040
140120130750
Value(CFA/ha)
900006050029500
120026o
60009750
o16976
12524
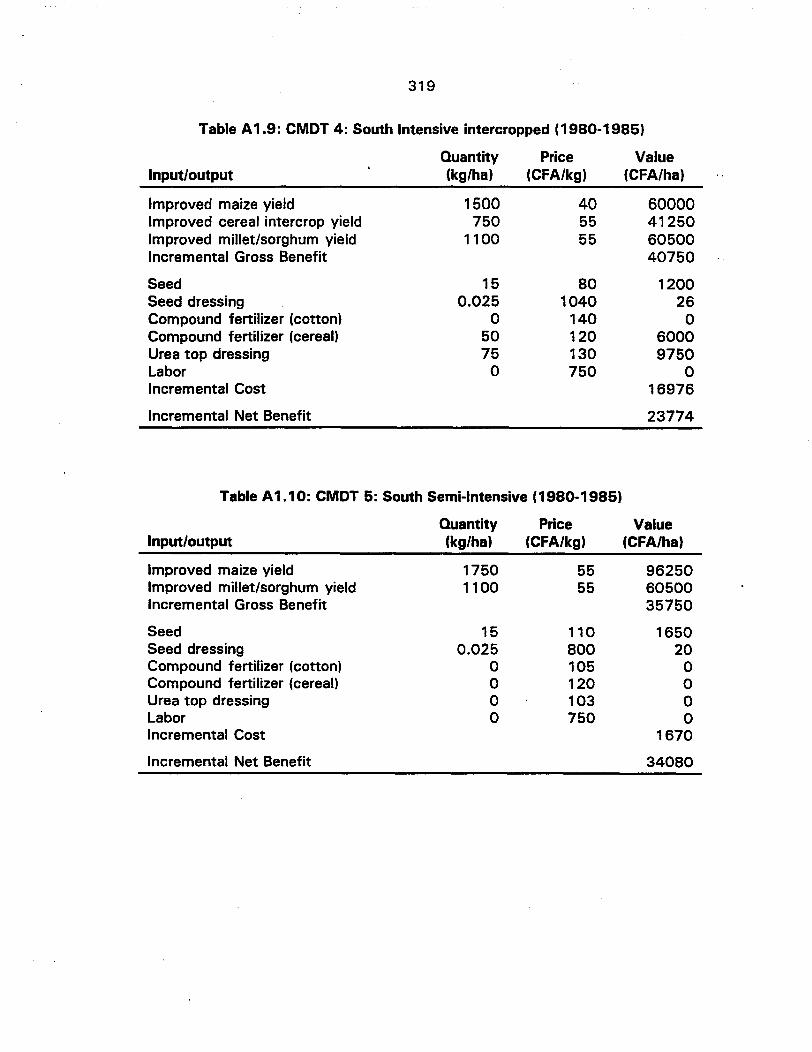
319
Table A 1.9: CMDT 4: South Intensive intercropped (1980-1985)
Quantity Price ValueInput/output (kg/ha) (CFA/kg) (CFA/ha)
Improved maize yield 1500 40 60000Improved cereal intercrop yield 750 55 41250Improved millet/sorghum yield 1100 55 60500Incremental Gross Benefit 40750
Seed 15 80 1200Seed dressing 0.025 1040 26Compound fertilizer (cotton) 0 140 0Compound fertilizer (cereal) 50 120 6000Urea top dressing 75 130 9750Labor 0 750 0Incremental Cost 16976
Incremental Net Benefit 23774
Table A1.10: CMDT 5: South Semi-Intensive (1980-1985)
Input/output
Improved maize yieldImproved millet/sorghum yieldIncremental Gross Benefit
SeedSeed dressingCompound fertilizer (cotton)Compound fertilizer (cereal)Urea top dressingLaborIncremental Cost
Incremental Net Benefit
Quantity(kg/ha)
17501100
150.025
oooo
Price(CFA/kg)
5555
110800105120103750
Value(CFA/ha)
962506050035750
165020oooo
1670
34080
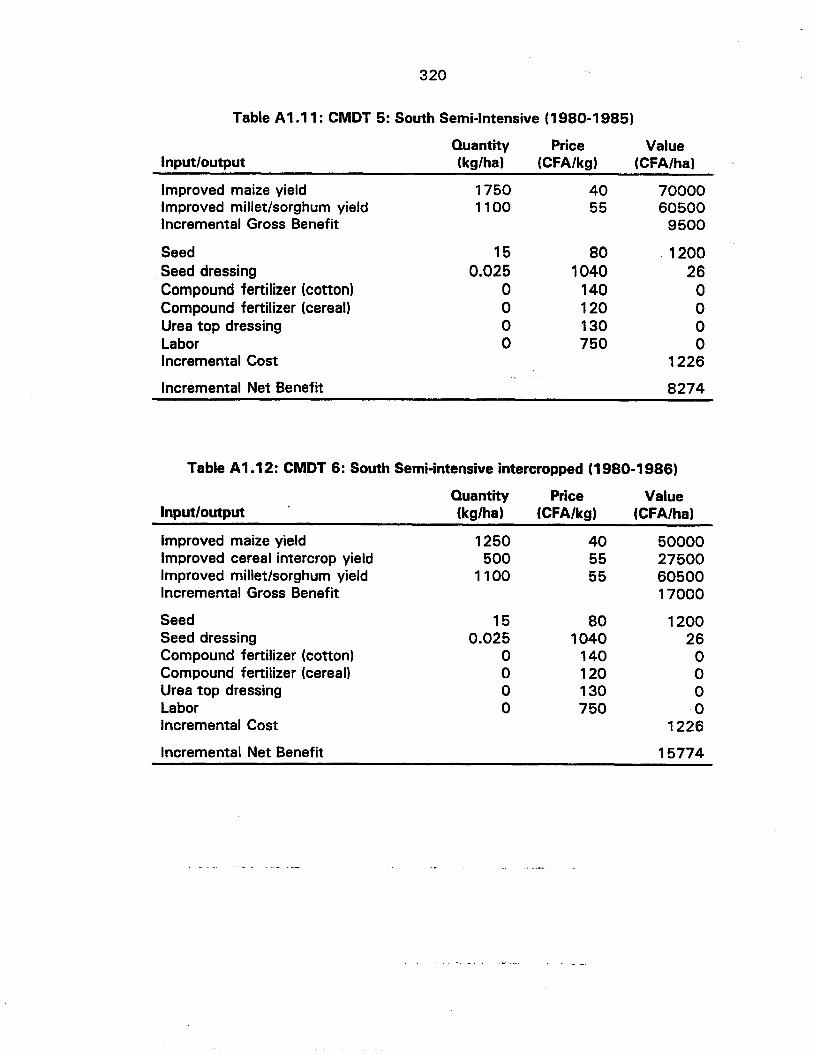
320
Table A1.11: CMDT 5: South Semi-Intensive (1980-1985)
Input/output
Improved maize yieldImproved millet/sorghum yieldIncremental Gross Benefit
SeedSeed dressingCompound fertilizer (cotton)Compound fertilizer (cereal)Urea top dressingLaborIncremental Cost
Incremental Net Benefit
Quantity(kg/ha)
17501100
150.025
oooo
Price(CFA/kg)
4055
801040
140120130750
Value(CFA/ha)
7000060500
9500
120026oooo
1226
8274
Table A1.12: CMDT 6: South Semi-intensive intercropped (1980-1986)
Input/output
Improved maize yieldImproved cereal intercrop yieldImproved millet/sorghum yieldIncremental Gross Benefit
SeedSeed dressingCompound fertilizer (cotton)Compound fertilizer (cereal)Urea top dressingLaborIncremental Cost
Incremental Net Benefit
Quantity(kg/ha)
1250500
1100
150.025
oooo
Price(CFA/kg)
405555
801040
140120130750
Value(CFA/ha)
50000275006050017000
120026oooo
1226
15774
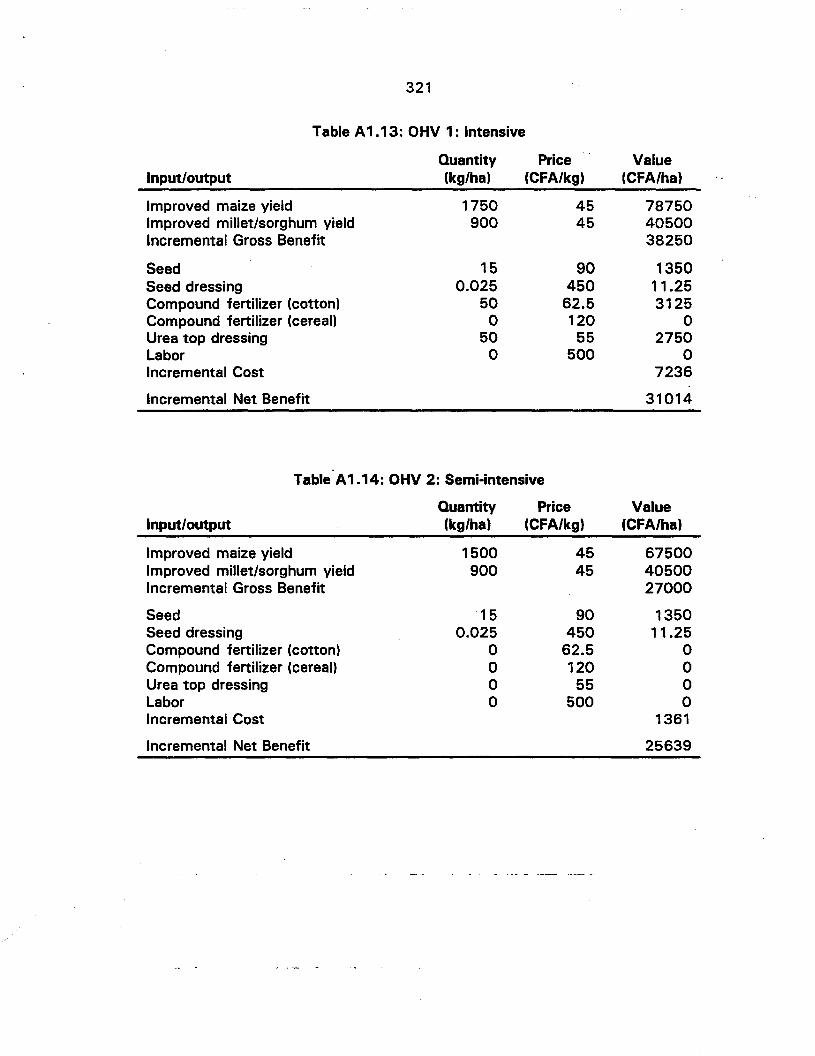
321
Table A1.13: OHV 1: Intensive
Quantity Price ValueInput/output (kg/ha) (CFA/kg) (CFA/ha)
Improved maize yield 1750 45 78750Improved millet/sorghum yield 900 45 40500Incremental Gross Benefit 38250
Seed 15 90 1350Seed dressing 0.025 450 11.25Compound fertilizer (cotton) 50 62.5 3125Compound fertilizer (cereal) 0 120 0Urea top dressing 50 55 2750Labor 0 500 0Incremental Cost 7236
Incremental Net Benefit 31014
Table A1.14: OHV 2: Semi-intensive
Quantity Price ValueInput/output (kg/hal (CFA/kg) (CFA/ha)
Improved maize yield 1500 45 67500Improved millet/sorghum yield 900 45 40500Incremental Gross Benefit 27000
Seed 15 90 1350Seed dressing 0.025 450 11.25Compound fertilizer (cotton) 0 62.5 0Compound fertilizer (cereal) 0 120 0Urea top dressing 0 55 0Labor 0 500 0Incremental Cost 1361
Incremental Net Benefit 25639

APPENDIX 2
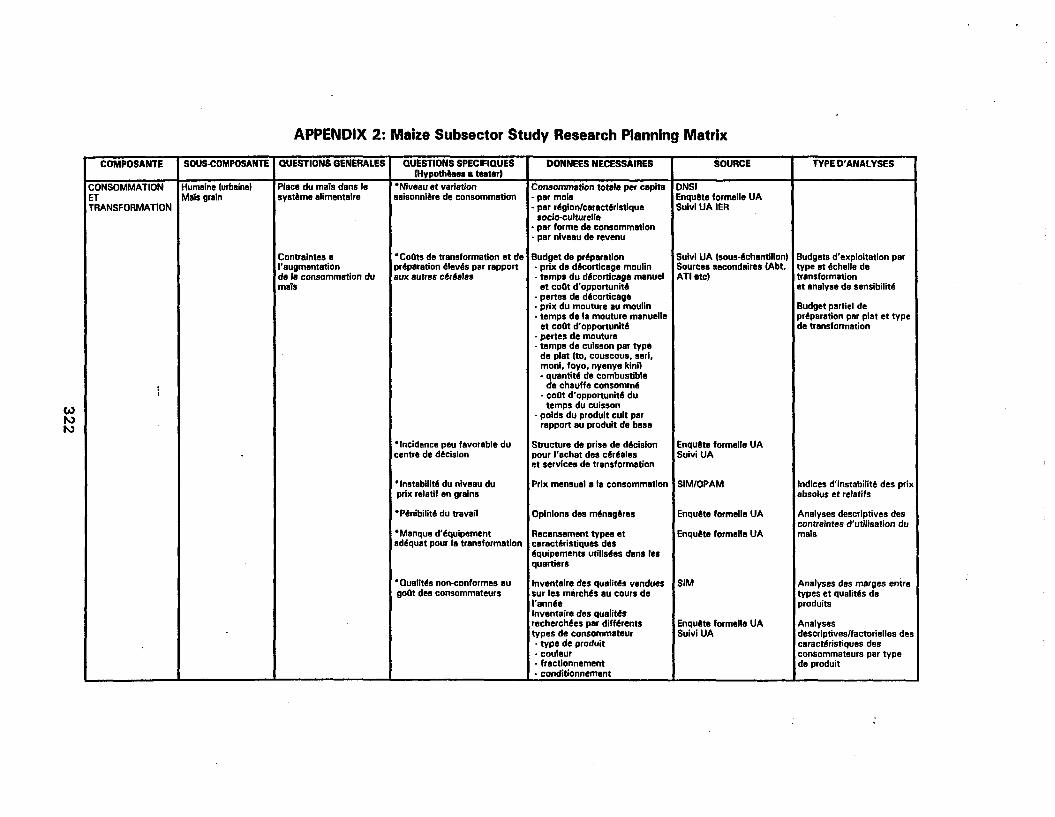
WNN
APPENDIX 2: Maize Subsector Study Research Planning Matrix
COMPOSANTE SOUS·COMPOSANTE QUESTIONS GENERALES QUESTIONS SPECIFIQUES DONNEES NECESSAIRES SOURCE TYPE D'ANALYSESIHypothtslIs • tllstllrl
CONSOMMATION Humaine lurbaine' Place du mais dans Ie •Niveau et variation Consommation totale per capita DNSIET MaTs grain systeme alimentaire saisonniere de consommation o par mois Enqulte formelle UATRANSFORMATION • par r6gion/caract6ristlque Sulvl UA IER
aocio-culturelle• par forme de consommatlono par niveau de revenu
Contraintes a 'CoOts de transformation et de Budget de prllparation Suivl UA Isous·6chantlllon) Budgets d'exploitation parI'augmentation prllpatation Illevlls par rapport o prix de d6cortlcage moulin Sources secondaires IAbt, type et Ilchelle dede la consommation du aux autres cllr6ales o temps du dllcorticage manuel ATllItc) transformationmaTs et coOt d'opportunitll et analyse de sensibilitll
• pertes de dllcorticagll• prix du mouture au moulln Budget partiel deo temps de la mouture manuelle prllparation par plat et type
et coOt d'opportunlt6 de transformationo pertes de mouture• temps de cuisson par type
de plat (to, couscous, seri,monl, foyo, nyenye kinl)• quantlt6 de combustible
!de chauffe consomm6
o coOt d'opportunitll dutemps du cuisson
- poids du prodult cuit parrapport au produit de base
• Incidence peu favorable du Structure de prise de dllcislon Enqulte formelle UA. centre de dllcision pour I'achat des cllrllales Suivi UAet services de transformation
'Instabilit6 du niveau du Prix mensuel a la consommation SIM/OPAM Indices d'instabilitll des prixprix relatif en grains abso/us et relatifs
• P6nibilitll du travail Opinions des m6nageres Enqulte formelle UA Analyses descriptives descontraintes d'utilisation du
'Manque d'llquipement Recensement types et Enqulte formelle UA maisadllquat pour la transformation caractllristiques des
Ilquipements utills6es dans lesquartiers
• Qualltlls non-conformes au Inventaire des qua/jtlls vendues SIM Analyses des marges entregoOt des consommateurs sur les marchl!s au cours de types et qualitlls de
I'annlle produitsInventaire des qualitllsrecherchl!es par diffl!rents Enqulte formelle UA Analysestypes de consommateur SulviUA descriptiveslfactorielles des
o type de produit caractllristiques des• couleur consommateurs par typeo fractionnement de produit• conditionnement
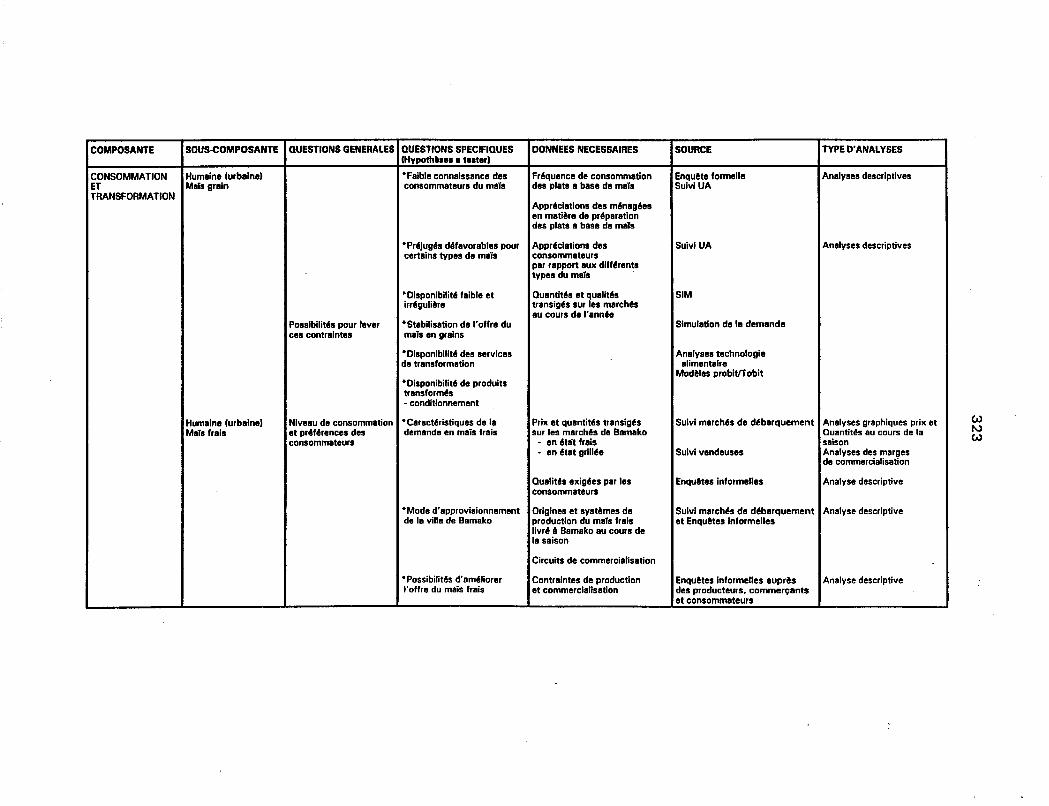
COMPOSANTE SOUS-eOMPOSANTE QUESTIONS GENERALES QUESTIONS SPECIFIQUES OONNEES NECESSAIRES SOURCE TYPE D'ANALYSESCHypoth••••• t••t.r)
CONSOMMATION Humein. Curbein.' ·Faible connaissance des Fr6quence de consommatlon Enqu8t. formelle Analyses descriptivesET Mais grain consommateurs du meis des plats a base de mais Suivi UATRANSFORMATION
Appr6ciations des m6nag6esen matilJre de pr6parationdes plats a base de mais
·Pr6jug6s d6favorables pour Appr6clations des SuivlUA Analyses descriptivescertains types de mais consommateurs
par rapport aux dlff6rentatypes du mais
·Disponibilit' faible et Quantit6s et qualitb SIMirr6gulilJre transig6s sur les march6s
au cours de I'ann'ePossibilit6s pour lever • Stabilisation de I'offre du Simulation de la demandeces contralntes mais en grains
·Disponlblllt' des services Analyses technologlede transformation alimentalre
Modllles probltITobit·Disponibilit' de produitstransform6s- conditionnement
Humaine Curbalne' Niveau de consommation • Caract6ristiques de la Prix et quantit's transigb Suivl march6s de d6barquement Analyses graphiques prix etMaTs frais et pr.f'rences des demande en mais frais sur les march's de Bamako QuantiMs au cours de la
consommateurs - en 'tlit frais saison• en 6tat grill6e Sulvi vendeuses Analyses des marges
de commercialisation
Qualitb exig'es par las Enqu8tes informelles Analyse descriptiveconsommateura
• Mode d'approvisionnement Origines et systllmes de Suivl march6s de d6barquement Analyse descriptivede la ville de Bamako production du mais frais et Enqu8tes Informelles
livr6 ABamako au coura dala saison
Circuits de commercialisation
• Possibilit6s d'am6liorer Contraintes de production Enqu8tes informelles aupr6s Analyse descriptiveI'offre du mais frais et commercialisation des producteurs, commerCiants
et consommateurs
WNW

COMPOSANTE SOUS-eOMPOSANTE QUESTIONS GENERALES QUESTIONS SPECIF,QUES DONNEES NECESSA'RES SOURCE TYPE D'ANALVSESIHypoth..... t••t.r)
CONSOMMATION Animale laviculture! Quelles sont les synergies *Quelle est la demande pour Recensement des exploitations Reconnaissance raplde des Analyse descriptiveET pC)tentlelles entre les Ie mais de la fili6re avlcole et avicoles, leurs tallies et aviculteursTRANSFORMATION fili6res mais et avicole quelle est sa tendance date d'ltablissement(suite!
Part du maTs dans la ration Reconnaissance rapide Estimation des courbesalimentafre et Ivolution au Sulvi eviculteurs de demande et simulationcours de .'ennle
Analyse descriptive*Quelle sont les contralntes Syst'me d'approvlslonnement Reconnaissance raplde desde la fili're avicole, y en composantes de la ration avlculteurscomprls approvlslonnement alimentalre et contralntesen mais Analyse descriptive
Maladies et mesures Reconnaissance raplde desprophylactlques: contralntes avlculteursde santll avicole
*Quelles sont les posslbilitlls Modalitls de contrat qui Discussions entre avlculteurs,de contrats entre "eveurs conviennent aux participants producteurs du mais et la CMDTet producteurs du mais, et Budgets d'exploitation etavec quels modalitb de Flux de trlsorerle dea Suivlavlculteurs analyse des flux deflnancement aviculteurs trlsorerie
Analyse descriptiveAnlmale lautre! Tendances dans la *Quelle est la consommatlon Quantitls des difflrents types Reconnaissance raplde
consommation du mais actuelle du mais et sa d'aliments consommles et Sources secondalresdans 'a r.tion bltail tendance pourcentage du maTs dans
la ration
Tendances dans la productionet commercialisation d'aliments
Analyse descriptiveIndustrlella Les difflrentes formes *Quelle est la consommation Recensement des entreprlses Reconnaissance rapide
d'utilisation du mais actuelle du mais et ses qui utilisent Ie mais Sources secondairesdans "Industrie perspectives et quantltlls consommles
w'"~

COMPOSANTE SOUS-eOMPOSANTE QUESTIONS GENERALES QUESTIONS SPECIFIQUES DONNEES NECESSAIRES SOURCE TYPE D'ANALYSESIHypoth'slI • tllter)
COMMERCIAL- FONCTIONS PHYSIOI,IESISATION
Transport Conditions et strat~gies *Frais de transport Ouantit~s transport~es par axe Reconnaissance raplde BUdget d'exploitationde transport de commercialisation Enqu&te approfondie IIU nlveau pour les commen;;ants
Frais de trensport des commen;;entsFrais de location v6hlcule
Stockage Types et conditions de * Avantllges et inconv~nients Inventaire des types de Enqu&te epprofondle lIupr's Analyse comparative desstockege des diff6rents types de stockage des producteurs et types de stockage
stockage Dur6e/pertes de stockage commert;;ants
Op6ratlons d'achet et de Mode d'orgenisetlon des *Strat~gies de mise en Surplus vendable Reconnaissance rapide Analyse descriptive desvente producteurs Icollectif et march6 des producteurs Ouantit6s vendus et prix Enqu&te IIpprofondie lIuprb strat6gies de vente
individul pour IIccroltre leur marge pllr p6riode des producteursMn6ficialre
Modll d'organisatlon des * Strllt~gies de mise en R~seau de relations entre Reconnaissance raplde Analyse descriptive descommert;;ants march6 des commert;;ants cat~gories de commert;;ants strat~gies de vente
pour eccroltre leur margeb~n6ficiaire Marges de commercialisetion Enqu&te approfondie aupr's Analyse des marges
des commert;;ants
CoOts et marges de SIM Analyse de la structure ducommerclalisetion ~I~mentaires MSU/CESA march~
Elaboration et analyses descomptes de filillre
FONCTIONS DECOORDINATION
Financement Modes de financement et • Avantages comparatifs des Inventaire des cr~dlts BCEAO Analyse descriptivecontraintes diff~rents modes de effectu~s
financement -conditions de remboursement·taux d'int6r&t-montants accordes
Partage des rlsques Modes de gestion des Strat6gles et mise en oeuvre Inventaire des dlff~rents types Enqu&te auprlls des Analyse descriptiverisques de contrats formels et commert;;ants
informelsInformation Mode de circulation de Acteurs et canaux Enqu&te auprlls des Analyse descriptive
l'lnformatlon Types d'informatlon commert;;antsSourcesMoyens de communication
WN(]I

COMPOSANTE SOUS·COMPOSANTE QUESTIONS GENERALES QUESTIONS SPECIFIQUES DONNEES NECESSAIRES SOURCE TYPE D'ANALYSESIHypothlsll • te.terl
PRODUCTION Mars grain Placa de mais dans la °Niveau et variat/on inter· Production totale elr6ali~re DNA/DNSI Analyse des tendancesbilan c6r6alier national ann6e de la production du • par an ODRs ICMDT,OHV,ODIMUI
mais par rapport aux autres - par e6r6alec6r6ales - par n§glon
- par capita
Place de mais dans les • Superllcle de maTs par Superllcle cultlv6e pour Enquete Permanente CMDT Analyse descriptive dusystemes de product/on rapp,ort aux autres c6r6ales chaque c6r6ale sous-systeme c6rblier desau Sud-Mali dans les sysMmes da - par unit6 de production syst~mes de production
production au Sud-Mali - par actil• par r6glon- selon Ie niveau de
m6canisationAnalyse descriptive des
Possibilit6s d'augmenter • Quels sont les pratiques Pratiques culturales Enquete Permanente CMDT techniques de productionla productivlt6 (r6dulre culturales utilises pour • rotation IIlche parcellaire) du maisIe coat unitalre de Ie mais - pr6parat/on du solproduction) du maTs au - entretienSud-Mall - lertlllsation
Analyse descriptive des• Que's sont les taux et Superlicie cultiv6e par Enquete sur I'adoption taux d'adoption par vari6t6contraintes d'adoptlon varl6t6 et par r6glon des vari6t6s en zone CMDT et par r6glondes varl6t6s am6lior6es,au nlveau paysan Analyse lactorlelle/cluster
Appr6ciation des caract6ristiques des caract6ristiques et tauxdes verl6tb d'adoption
Budgets partlels par c6r6ale• Quels sont les coOts de Quantit6s et prix des DRSP/Sikasso et par r6gionproduction du mais par intrants par c6r6ale Analyse de senslbilit6 pourrapport aux autres c6rbles Temps des travaux culturales Ie coat d'opportunit6 dus~ches par e6r6ale main d'oeuvre
R6gression/analyseo Que's sont les 6carts Pratiques culturales CMDT Recherche·D6veloppement lactorielle des rendementsde productivit6 au Rendements D6monstrations sur la du maTs par rapport auxniveau paysan Situation agro-6cologique lertillsatlon du maTs techniques culturales
- sols adopt6s• pluviom6trle
WNm

APPENDIX 3
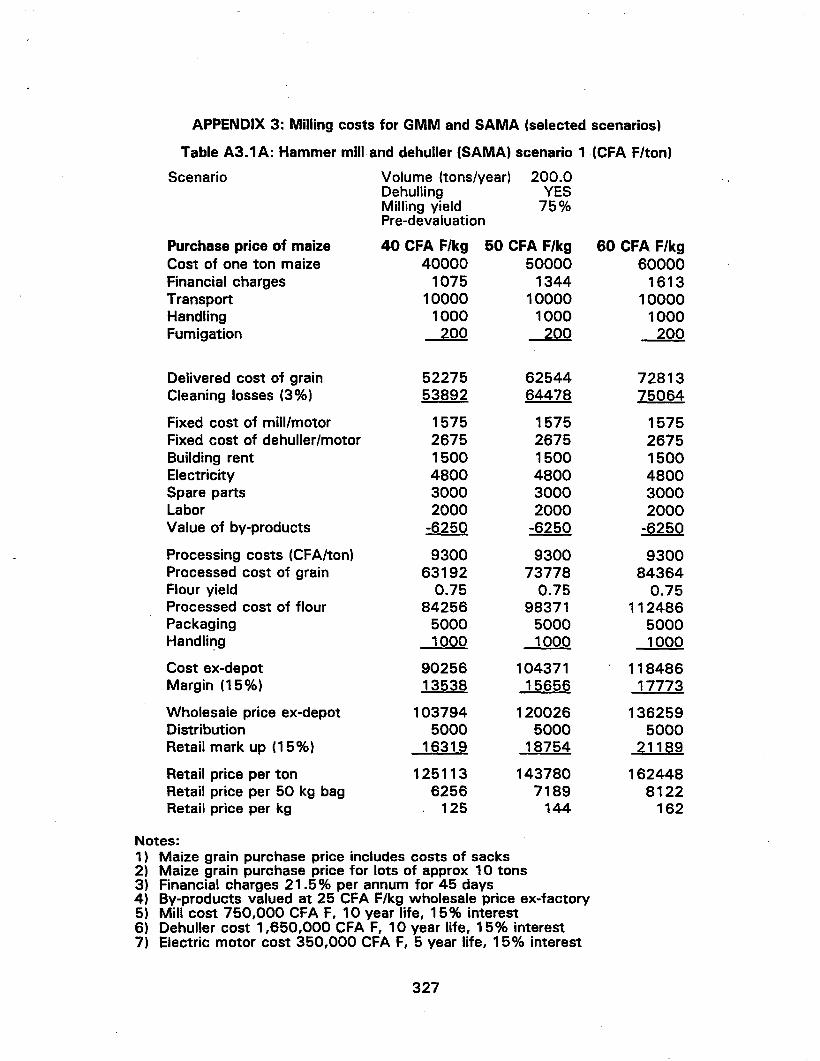
APPENDIX 3: Milling costs for GMM and SAMA (selected scenarios)
Table A3.1A: Hammer mill and dehuller (SAMA) scenario 1 (CFA F/ton)
Scenario Volume (tons/year) 200.0Dehulling YESMilling yield 75%Pre-devaluation
Purchase price of maize 40 CFA F/kg 50 CFA F/kg 60 CFA F/kgCost of one ton maize 40000 50000 60000Financial charges 1075 1344 1613Transport 10000 10000 10000Handling 1000 1000 1000Fumigation 200 200 200
Delivered cost of grain 52275 62544 72813Cleaning losses (3%) 53892 64478 75064
Fixed cost of mill/motor 1575 1575 1575Fixed cost of dehuller/motor 2675 2675 2675Building rent 1500 1500 1500Electricity 4800 4800 4800Spare parts 3000 3000 3000Labor 2000 2000 2000Value of by-products -6250 -6250 -6250
Processing costs (CFA/ton) 9300 9300 9300Processed cost of grain 63192 73778 84364Flour yield 0.75 0.75 0.75Processed cost of flour 84256 98371 112486Packaging 5000 5000 5000Handlir:-g 1000 1000 1000
Cost ex-depot 90256 104371 118486Margin (15%) 13538 15656 17773
Wholesale price ex-depot 103794 120026 136259Distribution 5000 5000 5000Retail mark up (15%) 16319 18754 21189
Retail price per ton 125113 143780 162448Retail price per 50 kg bag 6256 7189 8122Retail price per kg 125 144 162
Notes:1) Maize grain purchase price includes costs of sacks2) Maize grain purchase price for lots of approx 10 tons3) Financial charges 21.5% per annum for 45 days4) By-products valued at 25 CFA F/kg wholesale price ex-factory5) Mill cost 750,000 CFA F, 10 year life, 15% interest6) Dehuller cost 1,650,000 CFA F, 10 year life, 15% interest7) Electric motor cost 350,000 CFA F, 5 year life, 15% interest
327
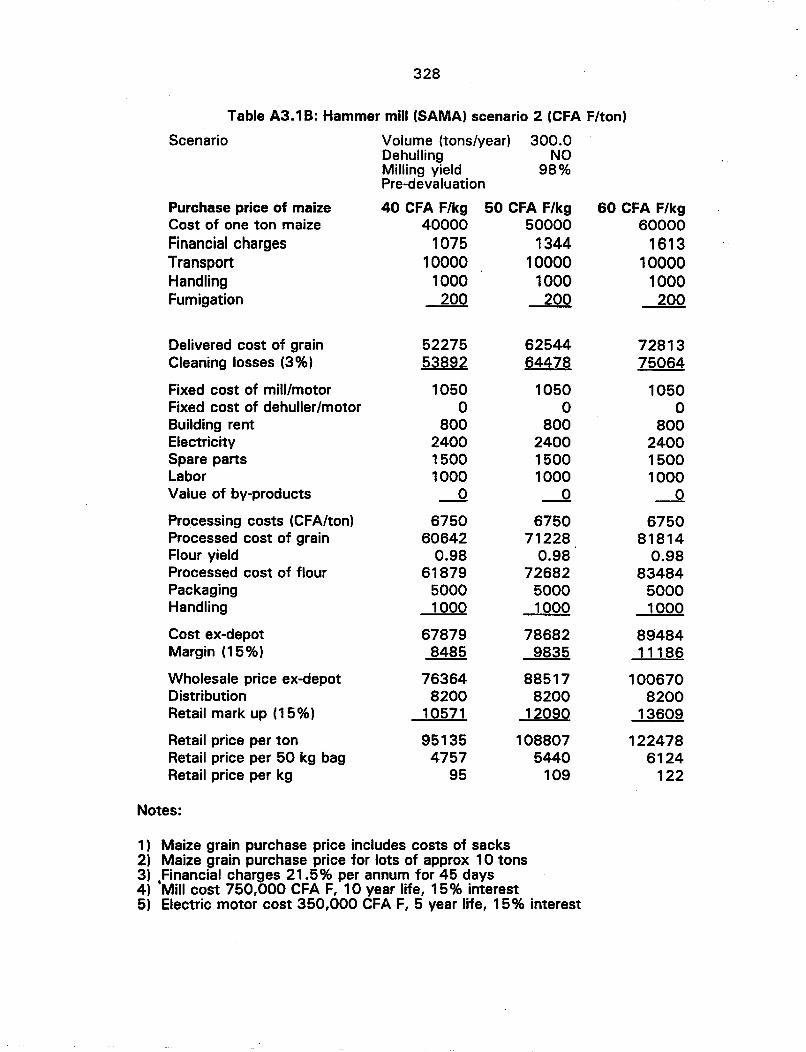
328
Table A3.1B: Hammer mill (SAMA) scenario 2 (CFA F/ton)
Scenario Volume (tons/year) 300.0Dehulling NOMilling yield 98%Pre-devaluation
Purchase price of maize 40 CFA F/kg 50 CFA F/kg 60 CFA F/kgCost of one ton maize 40000 50000 60000Financial charges 1075 1344 1613Transport 10000 10000 10000Handling 1000 1000 1000Fumigation 200 200 200
Delivered cost of grain 52275 62544 72813Cleaning losses (3 %) 53892 64478 75064
Fixed cost of mill/motor 1050 1050 1050Fixed cost of dehuller/motor 0 0 0Building rent 800 800 800Electricity 2400 2400 2400Spare parts 1500 1500 1500Labor 1000 1000 1000Value of by-products ---.Q ---.Q ---.Q
Processing costs (CFA/ton) 6750 6750 6750Processed cost of grain 60642 71228 81814Flour yield 0.98 0.98 0.98Processed cost of flour 61879 72682 83484Packaging 5000 5000 5000Handling 1000 1000 1000
Cost ex-depot 67879 78682 89484Margin (15%) 8485 9835 11186
Wholesale price ex-depot 76364 88517 100670Distribution 8200 8200 8200Retail mark up (1 5%) 10571 12090 13609
Retail price per ton 95135 108807 122478Retail price per 50 kg bag 4757 5440 6124Retail price per kg 95 109 122
Notes:
1) Maize grain purchase price includes costs of sacks2) Maize grain purchase price for lots of approx 10 tons3) Financial charges 21.5% per annum for 45 days4) 'Mill cost 750,000 CFA F, 10 year life, 15% interest5) Electric motor cost 350,000 CFA F, 5 year life, 15% interest

329
Table A3.1 C: Hammer mill and dehuller (SAMA) scenario 3 (CFA F/ton)
Scenario Volume (tons/year) 100.0Dehulling YESMilling yield 75 %Post-devaluation
Purchase price of maizeCost one ton maizeFinancial chargesTransportHandlingFumigation
40 CFA F/kg40000
107516400
1000200
50 CFA F/kg50000
134416400
1000200
60 CFA Flkg60000
161316400
1000200
1734848200
27253
20893610447
209
68944 7921371076 81662
5670 56709630 96303792 37926067 60674920 49202000 2000
-7500 -7500
24579 2457995655 106242
0.75 0.75127540 141655
8200 82001000 1000
136740 15085520511 22628
1572518200
24818
1902699513
190
5867560490
567096303792606749202000
-7500
2457985069
0.75113425
82001000
12262518394
1410198200
22383
1716028580
172
Delivered cost of grainCleaning losses (3%)
Fixed cost of mill/motorFixed cost of dehuller/motorBuilding rentElectricitySpare partsLaborValue of by-products
Processing costs (CFA/ton)Processed cost of grainFlour yieldProcessed cost of flourPackagingHandling
Cost ex-depotMargin (15%)
Wholesale price ex-depotDistributionRetail mark up (15%)
Retail price per tonRetail price per 50kg bagRetail price per kg
Notes:1) Maize grain purchase price includes costs of sacks2) Maize grain purchase price for lots of approx 10 tons3) Financial charges 21.5% per annum for 45 days4) By-products valued at 30 CFA F/kg wholesale price ex-factory5) Mill cost 1,350,000 CFA F, 10 year life, 15% interest6} Dehuller cost 2,970,000 CFA F, 10 year life, 15% interest7) Electric motor cost 630,000 CFA F, 5 year life, 15% interest8) Devaluation 80% pass though, rent 33% imported component, electric 32%,
spares 80%, transport and distribution 80%, sacks 80%
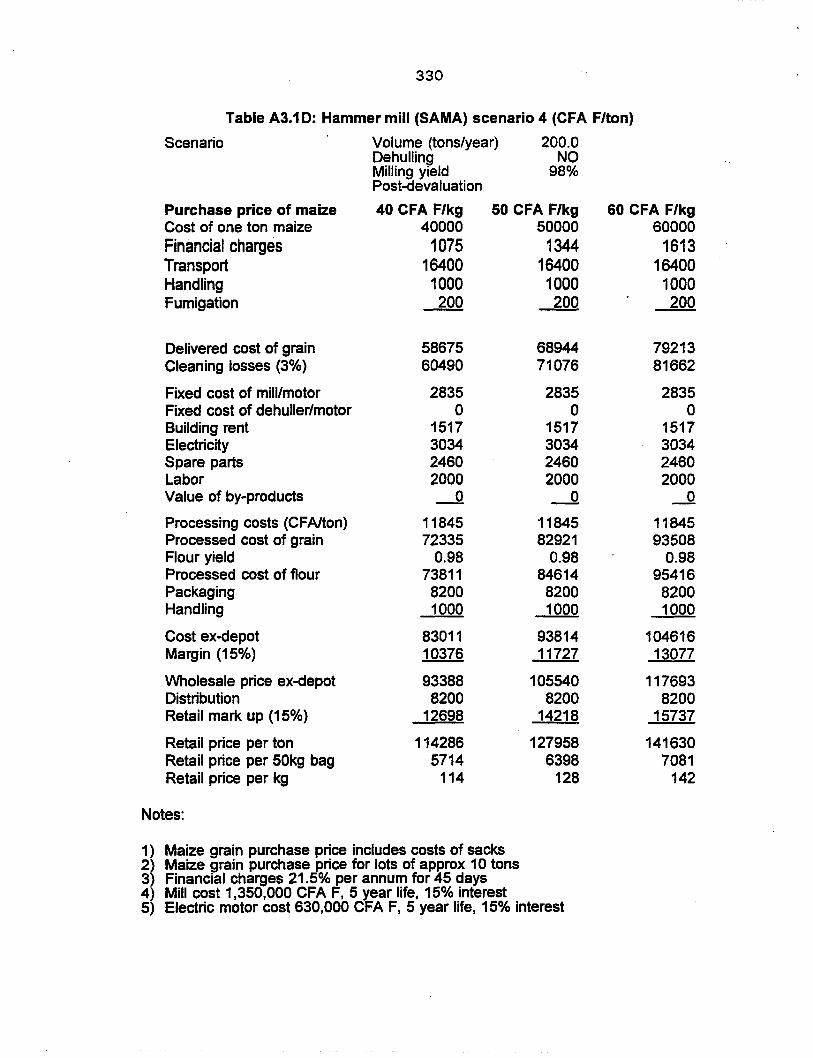
330
Table A3.1 D: Hammer mill (SAMA) scenario 4 (CFA F/ton)
Scenario Volume (tons/year) 200.0Dehulling NOMilling yield 98%Post-devaluation
Purchase price of maize 40 CFA F/kg 50 CFA F/kg 60 CFA F/kgCost of one ton maize 40000 50000 60000Financial charges 1075 1344 1613Transport 16400 16400 16400Handling 1000 1000 1000Fumigation 200 200 200
Delivered cost of grain 58675 68944 79213Cleaning losses (3%) 60490 71076 81662
Fixed cost of mill/motor 2835 2835 2835Fixed cost of dehuller/motor 0 0 0Building rent 1517 1517 1517Electricity 3034 3034 3034Spare parts 2460 2460 2460Labor 2000 2000 2000Value of by-products -.Q ---.Q --.2Processing costs (CFAlton) 11845 11845 11845Processed cost of grain 72335 82921 93508Flour yield 0.98 0.98 0.98Processed cost of flour 73811 84614 95416Packaging 8200 8200 8200Handling 1000 1000 1000
Cost eX-depot 83011 93814 104616Margin (15%) 10376 11727 13077
Wholesale price eX-depot 93388 105540 117693Distribution 8200 8200 8200Retail mark up (15%) 12698 14218 15737
Retail price per ton 114286 127958 141630Retail price per 50kg bag 5714 6398 7081Retail price per kg 114 128 142
Notes:
1) Maize grain purchase price includes costs of sacks2) Maize grain purchase price for lots of approx 10 tons3) Financial charges 21.5% per annum for 45 days4) Mill cost 1,350,000 CFA F, 5 year life, 15% interest5) Electric motor cost 630,000 CFA F, 5 year life, 15% interest

331
Table A3.2A: Grands Moulins du Mali (GMM) scenario 1 (CFA F/ton)
Scenario Value added tax 0.0Overhead costs 0Packaging 5 kgMilling yield 75%Pre-devaluation
Purchase price of maize 40 CFA F/kg 50 CFA F/kg 60 CFA F/kgCost of one ton maize 40000 50000 60000Financial charges 2150 2688 3225Transport 10000 10000 10000Handling 230 230 230Fumigation 200 200 200
Delivered cost of grain 52580 63118 73655Cleaning losses (3%) 54206 65070 75933Overhead costs 0 0 0Depreciation 4076 4076 4076Variable costs 3907 3907 3907Value of by-products -3992 -3992 -3992
Processed cost of grain 58197 69061 79924Flour yield 0.75 0.75 0.75Processed cost of flour 77596 92081 106565Packaging 10000 10000 10000Technical Assistance 1500 1500 1500Handling and transport 3011 3011 3011
Cost delivered Bamako 92107 106592 121076Margin (10%) 9211 10659 12108
Wholesale price ex-depot 101318 117251 133184Value added tax (10%) --!2 --!2 --.QWholesale price 101318 117251 133184Distribution 5000 5000 5000Retail mark up (15%) 15948. 17588 19978
Retail price per ton 122266 139839 158162Retail price per 50 kg bag 611 699 791Retail price per kg 122 140 158
Notes:
1) Maize grain purchase price includes costs of sacks2) Maize grain purchase price for lots of approx 30 tons3) Financial charges 21.5% per annum for 90 days4) By-products valued at 16 CFA Flkg wholesale price ex-factory
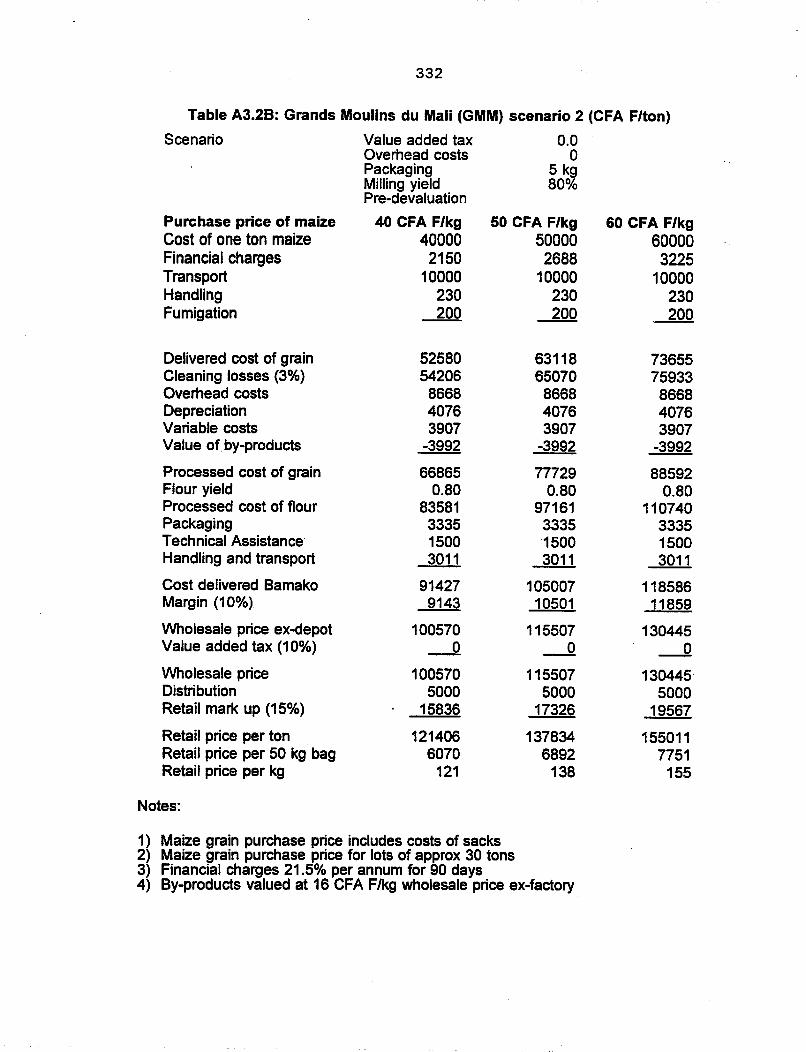
332
Table A3.2B: Grands Moulins du Mali (GMM) scenario 2 (CFA F/ton)
Scenario Value added tax 0.0Overhead costs 0Packaging 5 kgMilling yield 80%Pre-devaluation
Purchase price of maize 40 CFA F/kg 50 CFA F/kg 60 CFA F/kgCost of one ton maize 40000 50000 60000Financial charges 2150 2688 3225Transport 10000 10000 10000Handling 230 230 230Fumigation 200 200 200
Delivered cost of grain 52580 63118 73655Cleaning losses (3%) 54206 65070 75933Overhead costs 8668 8668 8668Depreciation 4076 4076 4076Variable costs 3907 3907 3907Value of. by-products -3992 -3992 -3992
Processed cost of grain 66865 77729 88592Flour yield 0.80 0.80 0.80Processed cost of flour 83581 97161 110740Packaging 3335 3335 3335Technical Assistance 1500 1500 1500Handling and transport 3011 3011 3011
Cost delivered Bamako 91427 105007 118586Margin (10%) 9143 10501 11859
Wholesale price ex-depot 100570 115507 130445Value added tax (10%) _0 _0 ---.Q
Wholesale price 100570 115507 130445Distribution 5000 5000 5000Retail mark up (15%) 15836 17326 19567
Retail price per ton 121406 137834 155011Retail price per 50 kg bag 6070 6892 7751Retail price per kg 121 138 155
Notes:
1) Maize grain purchase price includes costs of sacks2) Maize grain purchase price for lots of approx 30 tons3) Financial charges 21.5% per annum for 90 days4) By-products valued at 16 CFA F/kg wholesale price ex-factory

333
Table A3.2C: Grands Moulins du Mali (GMM) scenario 3 (CFA F/ton)
Scenario Value added tax 0.1Overhead costs 1Packaging 5 kgMilling yield 80%Post-devaluation
Purchase price of maizeCost of one ton maizeFinancial chargesTransportHandlingFumigation
40 CFA F/kg40000
215016400
253344
50 CFA F/kg500002688
16400253344
60 CFA F/kg60000
322516400
253344
80222827031213566855470
-5309
1016830.80
1271041640027004697
15090115090
16599216599
1825918200
27389
2181791091218
199284996199
69685718401213566855470
-5309
908200.80
1135251640027004697
13732213732
15105415105
1661608200
24924
59147609761213566855470
-5309
799570.80
999461640027004697
12374312374
13611713612
1497298200
23689
181618908182
Delivered cost of grainCleaning losses (3%)Overhead costsDepreciationVariable costsValue of by-products
Processed cost of grainFlour yieldProcessed cost of flourPackagingTechnical AssistanceHandling and transport
Cost delivered BamakoMargin (10%)
Wholesale price ex-depotValue added tax (10%)
Wholesale priceDistributionRetail mark up (15%)
Retail price per tonRetail price per 50 kg bagRetail price per kg
Notes:1) Maize grain purchase price includes costs of sacks2) Maize grain purchase price for lots of approx 30 tons3) Financial charges 21.5% per annum for 90 days4) By-products valued at 21.3 CFA F/kg wholesale price ex-factory5) Devaluation pass through 80%6) Transport, depreciation, and packaging import component 80%7) Technical assistance import component 100%8) Overhead and variable cost import component 50%9) Domestic labor costs up 10% in line with public sector pay increase

APPENDIX 4

APPENDIX 4: Conditional Price Elasticities of Demand for Maize Flours
Table A4.1 Conditional Price Elasticities of Demand for Dehulled Maize Flours
DEHULLED FLOUR PRE-DEVALUATION
GROUP PRICE (CFA F/kg)
175 I 150 I 130 I 115 I 100 I 90 I 80 I 70
CIVILIAN
Lower Y -1.56 -1.55 -1.49 -1.41 -1.29 -1.19 -1.06 -0.92
Middle Y -1.61 -1.59 -1.53 -1.44 -1.31 -1.19 -1.06 -0.91
Upper Y -1.62 -1.60 -1.54 -1.45 -1.31 -1.19 -1.06 -0.91
MEAN -1.60 -1.58 -1.52 -1.43 -1.30 -1.19 -1.06 -0.91
MILITARY
Lower Y -2.18 -2.22 -2.08 -1.91 -1.67 -1.49 -1.28 -1.07
Middle Y -2.35 -2.35 -2.16 -1.93 -1.64 -1.42 -1.20 -0.99
Upper Y -2.11 -2.15 -2.04 -1.89 -1.68 -1.53 -1.31 -1.10
MEAN -2.21 -2.24 -2.09 -1.91 -1.66 -1.48 -1.26 -1.05
. .. .·DEHULLEDFLOUR POST;;DEVALUATION
CIVILIAN
Lower Y -1.53 -1.52 -1.47 -1.39 -1.28 -1.18 -1.06 -0.93
Middle Y -1.57 -1.56 -1.50 -1.42 -1.30 -1.19 -1.06 -0.92
Upper Y -1.57 -1.56 -1.50 -1.42 -1.30 -1.19 -1.06 -0.92
MEAN -1.56 -1.54 -1.49 -1.41 -1.29 -1.19 -1.06 -0.92
MILITARY
Lower Y -2.04 -2.09 -1.99 -1.86 -1.67 -1.51 -1.33 -1.13
Middle Y -2.11 -2.15 -2.04 -1.89 -1.68 -1.50 -1.31 -1.10
Upper Y NA -2.24 -2.10 -1.92 -1.67 -1.48 -1.27 -1.06
MEAN NA -2.16 -2.04 -1.89 -1.67 -1.50 -1.30 -1.10
Notes:1) A meaningful estimate cannot be obtained for the high income military group
at 175 CFA F/kg.
334
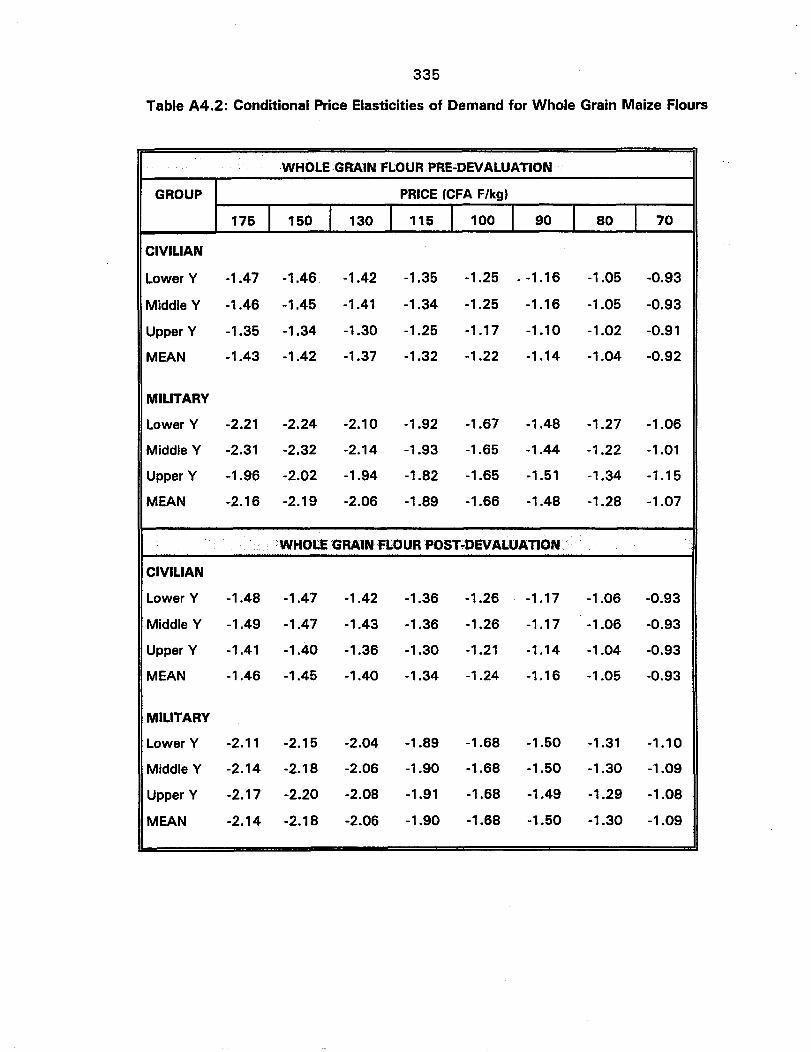
335
Table A4.2: Conditional Price Elasticities of Demand for Whole Grain Maize Flours
WHOLE GRAIN FLOUR PRE-DEVALUATION
GROUP PRICE (CFA F/kg)
175 I 150 I 130 I 115 I 100 I 90 I 80 I 70
CIVILIAN
Lower Y -1.47 -1.46 -1.42 -1.35 -1.25 . -1.16 -1.05 -0.93
Middle Y -1.46 -1.45 -1.41 -1.34 -1.25 -1.16 -1.05 -0.93
Upper Y -1.35 -1.34 -1.30 -1.25 -1.17 -1.10 -1.02 -0.91
MEAN -1.43 -1.42 -1.37 -1.32 -1.22 -1.14 -1.04 -0.92
MILITARY
Lower Y -2.21 -2.24 -2.10 -1.92 -1.67 -1.48 -1.27 -1.06
Middle Y -2.31 -2.32 -2.14 -1.93 -1.65 -1.44 -1.22 -1.01
Upper Y -1.96 -2.02 -1.94 -1.82 -1.65 -1.51 -1.34 -1.15
MEAN -2.16 -2.19 -2.06 -1.89 -1.66 -1.48 -1.28 -1.07
WHOLEGRA1NFLOURPOST.;DEVALUATlON.··
CIVILIAN
Lower Y -1.48 -1.47 -1.42 -1.36 -1.26 -1.17 -1.06 -0.93
Middle Y -1.49 -1.47 -1.43 -1.36 -1.26 -1.17 -1.06 -0.93
Upper Y -1.41 -1.40 -1.36 -1.30 -1.21 -1.14 -1.04 -0.93
MEAN -1.46 -1.45 -1.40 -1.34 -1.24 -1.16 -1.05 -0.93
MILITARY
Lower Y -2.11 -2.15 -2.04 -1.89 -1.68 -1.50 -1.31 -1.10
Middle Y -2.14 -2.18 -2.06 -1.90 -1.68 -1.50 -1.30 -1.09
Upper Y -2.17 -2.20 -2.08 -1.91 -1.68 -1.49 -1.29 -1.08
MEAN -2.14 -2.18 -2.06 -1.90 -1.68 -1.50 -1.30 -1.09

BIBLIOGRAPHY
BIBLIOGRAPHY
Ashraf, Malik. 1991. Economics Of Coarse Grains Milling In Mali. Coarse GrainsMarketing Study, Phase II. Bethesda, Maryland: Abt Associates.
Bonnen, James T. 1990. Agricultural Development: Transforming Human Capital,Technology, and Institutions. In Agricultural Development in the Third World,ed. Carl K. Eicher and John M. Staatz. Second Edition. Baltimore: The JohnsHopkins University Press.
Bose, Pierre-Marie and Ellen Hanak Freud. 1994. Agricultural Innovation in theCotton Zone of Francophone West and Central Africa: Progress Achieved andChallenges Ahead. Paper to be presented at the liTA/FAD workshop onsustainable cropping systems for the moist savanna zones, September 19-23,1994, Ibadan, Nigeria.
Boughton, Duncan H. 1993. The Relevance of a Commodity Subsector Approach tothe Design of Agricultural Research: The Case of Maize in Mali. Paperpresented to USAID/Mali, May 26th 1993.
Boughton, Duncan, Eric Crawford, Mark Krause and Bruno Henry de Frahan. 1990.Economic Analysis Of On-Farm Trials: A Review Of Approaches AndImplications For Research Program Design. Staff Paper No.90-78. Departmentof Agricultural Economics, Michigan State University.
Boughton, Duncan H. and Bino Teme. 1992. Farming Systems and MarketsCombining Analytical Frameworks for the Development of CommoditySubsectors: The Case of Maize in Southern Mali. Staff Paper 92-67.Department of Agricultural Economics, Michigan State University.
Boughton, Duncan and John Staatz. 1993. Using the Commodity SubsectorApproach to Design Agricultural Research: The Case of Maize in Mali. StaffPaper No.93-82. Department of Agricultural Economics, Michigan StateUniversity.
336

337
Boughton, Duncan H. and Bruno Henry de Frahan. 1994. Agricultural ResearchImpact Assessment: The Case of Maize Technology Adoption in SouthernMali. International Development Working Paper No.41. Department ofAgricultural Economics, Michigan State University.
Boughton, Duncan and Ousmane Sanogo. 1994. Analyse de la ConsommationCerealiere iJ Bamako: Effets Eventuels de la Devaluation du FCFA. Etude sur la Filiere Ma'is: Note d'information No.5. IER/DPAER. Bamako: Ministere duDeveloppement.
Boughton, Duncan, John M. Staatz and James D. Shaffer. 1994. From Pilot StudyTo Commodity Subsector Economics Program: Institutionalizing A MarketOriented Approach To Agricultural Research In Mali. Paper presented atUSAID (Africa Bureau/ARTS/FARAITDT) Seminar on Strengthening LinkagesBetween Demand and Supply of Agricultural Technology in Africa, June 21st,1994.
Bricas, N., and R. Sauvinet. 1989. The Trend Towards Diversification in SahelianFood Habits. Paper presented at Seminar on Regional Cereals Markets in WestAfrica at Lome: CILSS/Club du Sahel,6-11 November 1989.
Bruinsma, Domien. 1993. Draft Report of a Food Technology Consultancy.
Byerlee, D. and P. Heisey. 1993. Performance of hybrids under low-input conditionsin Eastern and Southern Africa. Draft Paper. Mexico, D.F.: CIMMYT.
CIMMYT. 1988. From Agronomic Data to Farmer Recommendations: An EconomicsTraining Manual. Mexico, CIMMYT.
Collinson, Michael P. 1982. Farming Systems Research in Eastern Africa: TheExperience of CIMMYT and Some National Agricultural Research Services,1976-81. International Development Paper No.3. Department of AgriculturalEconomics, Michigan State University.
Compagnie Malienne pour Ie Developpement des Textiles. 1990. Rapport Annuel.Bamako: Ministere de I'Agriculture.

338
Coulibaly, Ousmane N. 1987. Factors Affecting Adoption of AgriculturalTechnologies by Small Farmers in Subsaharan Africa: The Case of NewVarieties of Cowpeas Around the Agricultural Research Station of Cinzana,Mali. M.S. thesis, Michigan State University.
Daniels, Lisa, Julie Howard, Mywish Maredia, Jim Oehmke and Richard Bernsten.1992. Assessment of Agricultural Research: Ex-post, Ex-ante, and NeededMethodologies. Staff Paper No. 92-52. Department of AgriculturalEconomics, Michigan State University.
Delgado, Christopher and Thomas Reardon. 1987. Policy Issues Raised by ChangingFood Patterns in the Sahel. In Cereals Policies in Sahel Countries: Acts of theMindelo Conference. Paris: CILSS/Club du Sahel/OECD.
Dembele, Mamadou Augustin. 1990. Regard sur "Adoption de TechnologiesAgricoles au Mali. Bamako: USAID.
Dibley, David, Duncan Boughton and Thomas Reardon. 1994. Processing andPreparation Costs for Rice and Coarse Grains in Urban Mali: Subjecting an IpseDixit to Empirical Scrutiny. Staff Paper No.94-34. Department of AgriculturalEconomics, Michigan State University.
•Dione, Josue. 1989. Informing Food Security Policy in Mali: Interactions between
Technology, Institutions and Market Reforms. Ph.D. dissertation, MichiganState University.
Dione, Josue. 1987. Production et Transactions Cerealieres des ProducteursAgricoles Campagne 1985/86. Bamako, Ministere de I'Agriculture: MSU-CESAWorking Paper No. 87-02.
Direction National de la Statistique et de l'lnformatique. 1991. Enquete BudgetConsommation 1988-1989: Analyse Preliminaire. Bamako: Ministere du Plan.
Direction National de la Statistique et de l'lnformatique. 1990. RecensementGenerale de la Population et de "Habitat 1987. Volume 8: Bamako. Bamako:Ministere du Plan.
339
Dolo, Abdoulaye. 1987. PerspecTive de I'Association en Zone CMDT. In LesCultures Associees au Mali. IER/ICRISAT.
DRSPR. 1994. Rapport: Le Mars dans les Systemes de Production de Sikasso. Draft.Sikasso: DRSPR.
Eicher, C.K. 1991. Building Agricultural Research Capacity for the Next Generation..Paper presented at the conference on "Institutional Innovations for SustainableAgricultural Development: Into 21 st Century," Rockefeller FoundationConference Center, Bellagio, Italy, 14-18 October 1991.
Fischer, Dieter, Karen Schoonmaker-Freudenberger, Carl Bielenberg and MakikAshraf. 1992. Coarse Grain Processing in Mali: Opportunities forImprovement. Washington, D.C.: Appropriate Technology International.
Fox, Glenn. 1987. Models Of Resource Allocation In Public Agricultural Research: ASurvey. Journal Of Agricultural Economics 38, no.3 (Sept) 449-462
Freud, C. and M. Le Moigne. 1992. Projet de Transformation Artisanale DesCereales Locales En Zone Mali-Sud. Marche Ministere de la Cooperationno.0068/92/00130. Montpelier:CIRAD.
Gabas, J.-J. and J. Giri. 1987. The Food Situation in the Sahel: Anassessment. In CILLS/Club du Sahel, Cereals Policies in Sahel Countries:Acts of the Mindelo Conference. Paris: CILSS/Club du Sahel/DECD.
GASGA. 1987. Larger Grain Borer. Technical Leaflet No.1. Eschborn: GTZ.
Gigou, J. 1989. Optimisation de la Fertilisation des Cultures dans la Region MaliSud. Commal'1de No.89-801 du Ministere de la Cooperation. Montpellier:CIRAT.
Giraudy, Franc;:ois. 1993. L'Utilisation d'intrants sur les Cereales dans la Zone MaliSud. Mars, Mil et Sorgho. CMDT, Suivi-Evaluation, Octobre 1993.
340
Go"ita, Bakary. 1991. Les Minoteries Villageoises: Une Experience deDeveloppement rural inregre en zone Mali-Sud. Mimeo.
____. 1993. Projet Filiere Cerealiere: Rapport Annuel 1992/1993. Bamako:CMDT, Direction Technique Development Rural.
Green, Paul E. and Yoram Wind. 1975. New Way to Measure Consumers'Judgements. In HaNard Business Review, (July-August 1975):107-117.
Greene, William H. 1993. Econometric Analysis. 2d ed. New York: MacmillanPublishing Company.
Henry de Frahan, Bruno. 1990. The Effects of Interactions between Technology,Institutions and Policy on the Potential Returns to Farming Systems Researchin Semi-Arid Northeastern Mali. Ph.D. dissertation, Michigan State University.
Hoehn, John P. and Douglas Krieger. 1988. Methods for Valuing EnvironmentalChange. Staff Paper No.88-30. Department of Agricultural Economics,Michigan State University.
Holtzman, John S. 1986. Rapid Reconnaissance Guidelines for AgriculturalMarketing and Food System Research in Developing Countries. InternationalDevelopment Working Paper No.30. Department of Agricultural Economics,Michigan State University.
Holtzman John S., John A. Lichte, James F. Tefft, Bagotigui Bagayoko, and FantaM. Diarra. 1991. Expanding Coarse Grain Utilization in Mali: Current Situation,Constraints, Opportunities and Program Options. Bethesda, Maryland: AbtAssociates Inc.
Hull, D.B., O. Capps Jr. and J. Havlicek Jr. 1983. Demand for convenience foods inthe United States. In Proc. 29th Annu. Conf. American Council on ConsumerInterest, Mar. 16-19 1993, ed. K.P.Goebel: 44-50. Kansas City, Mo.
Humphreys, Charles P. 1986. Cereal Policy Reform in Mali. Alexandria, Virginia:Elliot Berg Associates.

341
Institut d'Economie Rurale, Division de la Recherche Agronomique. 1982. Bilan deTravaux du Seminaire /ERI/RAT: Tome 1. Bamako, Mali: Ministere deI'Agriculture. .
Institut d'Economie Rurale, Division de Recherches sur les Systemes de Production(Sotuba). 1992. Comite Technique Regional sur /es Systemes de ProductionRura/e, Centre de Sotuba, Resu/tats Campagne 1991-92.
IER/DPAER. 1992a. Etude sur /a Fi/iere-MaTs: Requete de Financement au PRMCpour Couvrir Ie Volet Consommationltransformation. Bamako: Ministere duDeveloppement Rural et de l'Environnement.
. 1992b. Etude sur la Filiere MaTs: Reconnaissance Rapide et Matrice de--~Planification des Recherches Approfondies. Serie Recherches Collaboratives.
Document de Travail No.1. Bamako: Ministere du Developpement Rural et del'Environnement.
__""'::""'::':"". 1994. Programme de Recherche and Economie des Filieres. Bamako:Ministere du Developpement Rural.
International Sorghum and Millet Collaborative Research Support Program. Undated.INTSORMIL: Fighting Hunger with Research. .. Making Headway. Lincoln,Nebraska: INTSORMIL.
IRAT. 1974. Bilan Technique et Financier des Recherches en Matiere d'AgronomieGenerale et de Cultures Vivrieres Conduites par /'IRA T de 1962 au 1974 auMali. Bamako: Direction IRAT Mali.
Jayne, T.S. and Lawrence Rubey. 1993. Maize Milling, Market Reform and UrbanFood Security: The Case of Zimbabwe. World Development 21, no.6: 975988.
, ,
Juska, Arunas and Lawrence Busch. no date. The Production of Knowledge and theProduction of Commodities: The Case of Rapeseed Technoscience. Draftpaper.
342
Kelly, Valerie, Thomas Reardon, A. Abdoulaye Fall, Bocar Diagana, and LisaMcNeilly. 1993. Consumption and Supply Impacts of Agricultural PricePolicies in the Peanut Basin and Senegal Oriental. Final Report for theIFPRI/ISRA Study. September.
Kennedy, Eileen and Thomas Reardon. 1994. Shift to Non-Traditional Grains in theDiets of East and West Africa: Role of Women's Opportunity Cost of Time.Food Policy, (February).
Kite, Rod. 1993. Senegal: Implications For The Rice Policy Dialogue. Dakar: USAID.
Kmenta, Jan. 1986. Elements of Econometrics. Second Edition. New York:Macmillan Publishing Company.
Lancaster, Kelvin. 1991. Modern Consumer Theory. Aldershot, England: EdwardElgar Publishing Limited.
Le Conte, J. 1965. Les Travaux dans Ie Domaine de I'Amelioration du Ma'is.Agronomie Tropical 20, no.10: 981-986.
Louviere, Jordan J. 1988. Analysing Decision Making: Metric Conjoint Analysis.Quantitative Applications in the Social Sciences Series, no.67. Newbury Park,California: Sage Publications.
Maredia, Myshish K. 1993. The Economics of the International Transfer of WheatVarieties. Ph.D. dissertation, Michigan State University.
Mestres, Christian. 1993. Rapport de Mission 4 au 18 Juillet 1993 au Mali.Montpellier: CIRAD-CA.
Mitchell, Robert Cameron and Richard T. Carson. 1991. Using Surveys to ValuePublic Goods: The Contingent Valuation Method. Washington D.C.: ResourcesFor the Future.
343
Mukumbu, Mulinge and T.S. Jayne. 1994. Urban Maize Meal ConsumptionPatterns: Strategies for Improving Food Access for Vulnerable UrbanHouseholds in Kenya. Paper presented at the Symposium on AgriculturalPolicies and Food Security in Eastern Africa, 19-20 May, 1994.
Ndoye, Ousseynou and Mark Newman. 1984. Approche Methodologique pourI'Etude de la Commercialisation des Produits Agricoles et Alimentaires auSenegal. Document de Travail No.84-2. Bureau d'AnalysesMacro-economique. Dakar: Institut Senegalais de Recherches Agricoles.
Nicou, R. 1981. Les Techniques Culturales du Mai"s en Afrique de l'Ouest.Agronomie Tropicale 36, no.4:356-363.
Norton, G.W. and J.S. Davis. 1981. Evaluating Returns to Agricultural Research: AReview. American Journal of Agricultural Economics 63, no.4:685-99.
Norton, George W. and Philip G. Pardey. 1987. Priority-Setting Mechanisms forNational Agricultural Research Systems: Present Experience and Future Needs.Working Paper No.7. The Hague: International Service for National AgriculturalResearch.
Oehmke, James F. and Eric W. Crawford. 1993. The Impact of AgriculturalTechnology in Sub-Saharan Africa: A Synthesis of Symposium Findings.International Development Paper No.14. Department of AgriculturalEconomics, Michigan State University.
OPAM/SIM. 1994. Rapport Mensuel: March, 1994. Bamako: Ministare des Financeset du Commerce.
Pieri, C. 1973. La Fumures des Cereales de Culture Sache en Republique du Mali:Premier Essai de Synthese. Agronomie Tropicale 28, no.8: 751-767 .
. 1989. Ferti/ite des Terres de Savanes: Si/an de Trente Ans de Recherche----et de Deve/oppement Agricoles au Sud du Sahara. Paris: Ministere de laCooperation et CIRAD-IRAT.
344
Posner, Joshua L. and Eric W. Crawford. 1992. Improving FertiliserRecommendations for Subsistence Farmers in West Africa: The Use of AgroEconomic Analysis of On-farm Trials. Fertiliser Research 32:333-342.
Reardon, Thomas. 1993. Cereals Demand in the Sahel and Potential Impacts ofRegional Cereals Protection. World Development 21, no.1 (January).
Reardon, Thomas, Christopher Delgado and Taladidia Thiombiano. 1992.Substitution By Urban Sahelian Consumers Between Coarse Grains AndImported Rice And Wheat: The Case Of Ougadougou. Draft Report/IFPRI.
Reardon T., T. Thiombiano and C. Delgado. 1988. La Substitution des CerealesLocales par les Cereales Importees: La Consommation Alimentaire desMenages a Ouagadougou, Burkina Faso. Ouagadougou: CEDRES, University ofOuagadougou.
Robison, Lindon J. and Peter J. Barry. 1987. The Competitive Firm's Response toRisk. New York: Macmillan Publishing Company.
Robison, Lindon and Allan Schmid. 1994. Can Agriculture Prosper in the 21 stCentury Without Social Capital? Forthcoming in Choices. Ames, Iowa: AAEA.
Rogers, Beatrice Lorge and Melanee Lowdermilk. 1991. Price Policy and FoodConsumption in Urban Mali. Food Policy 16, no.6:461-473.
Rogers, B.L and M.L. Lowdermilk. 1988. Food Prices and Food Consumptionin Urban Mali. Final Report of the Tufts/DNSIIAID Food Price Project.
Rogers, Everett, and Floyd Shoemaker. 1971. Communication of Innovations: ACross Cultural Approach. New York: The Free Press.
Rubey, Lawrence. 1993. Consumer Maize Meal Preferences in Zimbabwe: SurveyResults and Policy Implications. Report prepared for Ministry of Lands,Agriculture and Water Development and USAID/Harare.
345
Sanogo, Ousmane, Ibrahima Go"ita, Niama Nango Dembele and Duncan Boughton.1993. Composante Technologie Alimentaire et Perspectives sur laTransformation des Caraales Seches: Note d'information No.3. IER/DPAER.Bamako, Mali: Ministere du Developpement Rural.
Senauer, Ben, Elaine Asp and Jean Kinsey. 1991. Food Trends and the ChangingConsumer. St.Paul, Minnesota: Eagan Press.
Shaffer, James Duncan. 1970. On The Concept Of Subsector Studies. Paperpresented at the Technical Seminar on Subsector Modeling of Food andAgricultural Industries, Department of Ag.Economics, University of Florida,March 30, 1970.
___. 1973. On the Concept of Subsector Studies. American Journal ofAgricultural Economics 55: 333-335.
Shetty, S.V.R., N.F. Beninati, and S.R. Beckerman.1991. Strengthening Sorghumand Pearl Millet Research in Mali. Patancheru, India: ICRISAT.
Staatz, John M. 1989. The Role of Market Conditions in Influencing the Adoption ofNew Agricultural Technologies in Mali. Staff Paper 89-109. Department ofAgricultural Economics, Michigan State University.
__~' 1994. The Stategic Role Of Food And Agriculture Systems In FightingHunger Through Fostering Sustainable Economic Growth. Staff Paper 94-39.Department of Agricultural Economics, Michigan State University.
Staatz, John M. and Richard H. Bernsten. 1992. Technology Development andHousehold Food Security. Staff Paper 92-39. Department of AgriculturalEconomics, Michigan State University.
Staatz, John M., T.S. Jayne, David Tschirley, James D. Shaffer, Josue Dione,James Oehmke, and Michael T. Weber. 1994 (forthcoming). RestructuringFood Systems to Support a Transformation of Agriculture in Sub-SaharanAfrica: Experience and Issues. In Post-Green Revolution AgriculturalDevelopment Strategies in the Third World: What Next?, ed. C. Delgado, D.Colyer, and M. Rosegrant. Baltimore: Johns Hopkins University Press.
346
Steffen, Philip. 1992. The Roles and Limits of the Cereals Market in Assuring FoodSecurity in Northeastern Mali. Draft Ph.D. Dissertation. Michigan StateUniversity.
Tefft, James F., with Michael T. Weber and John M. Staatz. 1990. ResearchMethods in the MSU Food Security in Africa Project: Conceptualizing andImplementing Policy Relevant Studies. International Development WorkingPaper No. 38. Department of Agricultural Economics, Michigan StateUniversity.
Teme, Bino and Duncan Boughton. 1992a. Analyse Preliminaire sur la Filiere Mats etPrincipales Interrogations. Paper presented at the Comite Technique duProgramme Systeme de Production et Economie Rurale, Sotuba, April 1992.
Teme, Bino and Duncan Boughton. 1992b. Deroulement de I'Enquete sur lesCaracteristiques et les Habitudes de Consommation des Unites Alimentairesdu District de Bamako et Organisation du Suivi et des Tests de Produits iJBase de Mats. Etude sur la Filiere Mais: Note d'information No.1. Bamako,Mali: IER/DPAER.
Teme, Bino and Duncan Boughton. 1993. Caracteristiques des Unites Alimentairedu District de Bamako et Place du Mats dans les Habitudes de Consommation.Bamako: IER/DPAER, Ministere du Development Rural et de l'Environnement.
Thiombiano, Anhadi. 1986. Modele Socio-Economique de ComportementAlimentaire en Milieu Urbain (Cas des Menages de Ouagadougou). Diplomed'Etudes Approfondies, Universite de Ouagadougou.
Tomek, William G. and Kenneth L. Robinson. 1990. Agricultural Product Prices. 3ded. Ithaca: Cornell University Press.
Traore, L., H. Daou and A. Sangare. 1987. Synthese des Resultats dePrevulgarisation sur les Cultures Associees au Mali. In Les Cultures Associeesau Mali. IER/ICRISAT.
Traxler, Greg and Derek Byerlee. 1991. The Economic Returns to Crop ManagementResearch in a Post-Green Revolution Setting. Draft paper.
347
USAID. 1992. Strategic Framework For Agricultural Technology Development AndTransfer In Sub-Saharan Africa. Draft. Washington, D.C.: USAID.
de Wilde, John C. 1969. Experiences with Agricultural Development in TropicalAfrica Volume II: The Case Studies. Baltimore: Johns Hopkins.
Weijenberg, Jan, Josue Dione, Michael Fuchs-Carsch, Adolphe Kere and JacquesLefort. 1993. Revitalizing Agricultural Research in the Sahel: A ProposedFramework for Action. World Bank Discussion Papers. Africa TechnicalDepartment Series. Washington, D.C.: The World Bank.
Wooldridge, Jeffrey M. 1994a. Binary Choice Models. Unpublished Lecture Notes.Department of Economics, Michigan State University.
Wooldridge, Jeffrey M. 1994b. Censored Regression Models. Unpublished LectureNotes. Department of Economics, Michigan State University.
World Bank. 1990. Report and Recommendation of the President of the InternationalDevelopment Association to the Executive Directors for a ProposedDevelopment Credit in the Amount of SDR 40.7 Million to the Republic of Malifor an Agricultural Sector Adjustment/Investment Project. Washington, D.C.:World Bank.
World Bank. 1993. Mali National Agricultural Research Project: Staff AppraisalReport. No.12190-MLI. Washington, D.C.: World Bank.