Using selection functions to describe changes in environmental variables
www.elsevier.com/locate/JMGM
Journal of Molecular Graphics and Modelling 25 (2006) 296–303
A combined in silico strategy to describe the variation
of some 3D molecular properties of b-cyclodextrin
due to the formation of inclusion complexes
Giuseppe Ermondi, Claudio Anghilante, Giulia Caron *
Dipartimento di Scienza e Tecnologia del Farmaco, Universita di Torino, Via P. Giuria 9, I-10125 Torino, Italy
Received 1 December 2005; received in revised form 16 January 2006; accepted 18 January 2006
Available online 21 February 2006
Abstract
A powerful in silico strategy based on the combined use of two computational tools (MLP and MIFs) able to calculate and visualize 3D
molecular fields can give useful information about surface properties of macromolecules involved in the mechanisms of formation of complexes. In
particular, this study investigated the variation in polar/hydrophobic pattern induced on the b-CD alone (i.e. =without the ligand) by the inclusion of
four ligands having different lipophilicities and small size. Results indicate that, in the presence of guests with log P > 0, the hydrophobicity of b-
CD increases in the cavity and its surroundings on the primary face.
# 2006 Elsevier Inc. All rights reserved.
Keywords: b-Cyclodextrin; Inclusion complexes; In silico; Molecular fields; MLP; MIF; Lipophilicity; Hydrophobicity
1. Introduction
Modern drug design requires that ADME-Tox (Absorption,
Distribution, Metabolism, Excretion and Toxicity) be addressed
early in drug discovery [1]. Molecular host-guest based systems
are well-known tools to optimize drug release in the body. A
widely used hosts family is the cyclodextrins (CDs), which are
cyclic oligosaccharides composed of 6, 7 or 8 dextrose units (a,
b, and g-CDs, respectively) joined through 1–4 bonds [2,3]
(Fig. 1A). Because of their structural features (truncated-cone-
shaped molecules with a hollow, tapered cavity of depth 7.9 A,
the top and bottom diameters of the cavity being 6.0 and 6.5 A
for b-CD [4], Fig. 1B), CDs tend to form inclusion complexes,
and these have been used to improve solubility and
bioavailability of poorly water-soluble compounds [5]. For
this reason complexation with CDs is a very useful strategy for
drug delivery [6,7].
An increased understanding of the forces and mechanisms
involved in complexes formation of drugs with CDs should
* Corresponding author. Tel.: +39 0116707282; fax: +39 0116707687.
E-mail address: [email protected] (G. Caron).
1093-3263/$ – see front matter # 2006 Elsevier Inc. All rights reserved.
doi:10.1016/j.jmgm.2006.01.005
provide criteria enabling pharmaceutical scientists to design
more efficacious inclusion complexes [8,9]. This study aimed
to design and apply a combined in silico strategy, so as to shed
light on modifications induced in some 3D molecular properties
by four ligands (2–5 in Fig. 1C) having different lipophilic
properties and small size. It should be pointed out that such
modifications are monitored on the b-CDs alone (=without the
ligand).
In order to describe the properties of 3D b-CDs in qualitative
and quantitative terms, two molecular fields were used [10]: the
Molecular Lipophilicity Potential (MLP) [11] and the
Molecular Interaction Fields (MIFs) [12–15].
The MLP spreads the molecular lipophilicity of a molecule
over the Solvent-Accessible Surface (SAS) and thus its
integration enables the virtual log P (i.e. the computed
lipophilicity of a single conformer) to be calculated. The
MIFs yield a map of the property distribution of attractive and
repulsive forces between selected probes (here OH2 and DRY)
and the b-CD based on energy criteria. Because of their
different features, the combination of MLP with MIFs has been
found to produce a more powerful computational tool to
investigate 3D molecular properties than is provided by the
separate application of the two methods [7,16].

G. Ermondi et al. / Journal of Molecular Graphics and Modelling 25 (2006) 296–303 297
Fig. 1. (A) 2D chemical structures of b-CD; (B) diagram of 3D structure of the CD molecule. The secondary hydroxyls at positions 2- and 3- exist on the wider rim of
the cone and the primary hydroxyls occupy the narrower face; (C) 2D chemical structures of ligands forming inclusion complexes with b-CDs (see text).
2. Methodology
2.1. b-CD structures retrieved from the cambridge
structural database (CSD)
The following compounds were found in the Cambridge
Structural Database (CSD, version 5.25; data updates April
2004): b-CD (code BCDEXD03), the complex of b-CD with
butyrophenone (code DOQPOO), the complex of b-CD with
naphthyloxy acetic acid (code ODEJOW), the complex of b-
CD with trans-cinnamic acid (code XERTET) and the complex
of b-CD with diethanolamine (code YIYSII). These com-
pounds were checked with Mercury [17], saved in the Tripos
mol2 format (necessary for subsequent calculations) and read in
MOE [18] to carefully check the coordinates, delete co-
crystallized water molecules, separate the b-CD from the
ligand and add hydrogen atoms when necessary.
For b-CD alone (=obtained from BCDEXD03) two
conformations were stored: 1a, which was not minimized,
and 1b, which was minimized under MMFF94x in GB-SA
conditions [9,19,20].
2.2. Conformational analysis
The conformational hypersurface of b-CDs was explored by
the Hybrid Monte Carlo (HMC) module implemented in MOE
[19]. The effect of solvation was taken into consideration since
the solvation energy associated with the molecule’s being in a
continuum solvent model was included in the minimization
step; in practice, a set of electrostatic corrections were
calculated with the GB/SA method [20] and applied to the
MMFF94x force field as implemented in MOE.
The conformer with the lowest energy resulting from the
conformational analysis (1c) was the third conformation of b-
CD (besides 1a and 1b, see above) stored for calculations
(Table 1).
2.3. Molecular lipophilicity potential (MLP)
The Molecular Lipophilicity Potential (MLP) was calcu-
lated with Vega [21] by projecting the Broto-Moreau
lipophilicity atomic constants on the solvent-accessible surface
(SAS) [11]. Since MLP (see below) was designed to be applied

G. Ermondi et al. / Journal of Molecular Graphics and Modelling 25 (2006) 296–303298
Table 1
Virtual log P values of b-CD in different conformations (see text) and of the
ligands investigated, obtained by back calculation of the MLP
No. Compound Virtual log P
1a b-CD X-ray structure (no minimization)a �10.19
1b b-CD X-ray structure (MMFF94x and GB-SA)b �9.98
1c b-CD lowest-energyc �10.18
1d b-CD extracted from the complex with
butyrophenoned
�6.51
2 Butyrophenone 2.88
1e b-CD extracted from the complex with
naphthyloxyacetic acidd
�7.22
3 Naphthyloxyacetic acid 2.30
1f b-CD extracted from the complex with
trans-cinnamic acidd
�7.05
4 Trans-cinnamic acid 1.55
1g b-CD extracted from the complex
with diethanolamined
�9.84
5 Diethanolamine �0.66
a The crystallographic structure of b-CD without minimization (see Section 2
for details).b The crystallographic structure of b-CD after minimization under MMFF94x
and GB-SA conditions.c The lowest-energy b-CD conformer resulting from conformational analysis
performed by HMC simulation.d Calculations were performed on b-CD alone (=without any ligand).
to the neutral species, ionizable ligands (3 and 4) were analyzed
in their undissociated state. This approximation is acceptable
because the negative charge of 3 and 4 is localized almost
entirely on one side of the molecules.
2.4. Molecular interaction fields (MIFs)
A MIF is a collection of energy values calculated from the
sum of the attractive and repulsive forces between a molecule
(the target) and an interacting partner (the probe), positioned in
a lattice of points (or nodes) surrounding the target. Nodes with
negative energy values correspond to favorable interactions
between the molecule and the probe, and vice-versa; using
different probes the predisposition of the target toward various
interaction types can be evidenced.
Two probes were chosen for this study, water (OH2) and the
hydrophobic probe (DRY), and the corresponding MIFs were
calculated using the program GRID [22] and default
parameters, except for the number of planes of grid points
per Angstrom (NPLA directive) which was set to two for both
probes.
The MIFs were then exported using readable format and
submitted to an in-house program to obtain some numerical
descriptors (the Volsurf software [10] automatically extracts
numerical information present in MIFs but it is not specifically
designed for the molecular visualization of these data, see
below).
Briefly, our program counts the number of points (known as
final points) with energy equal to or below a selected energy
cutoff value (always negative). These points are located around
the target molecule and determine regions of favorable
interactions with the probe; the choice of appropriate cutoffs
enables different information to be obtained, see Section 3. The
number of points is proportional to the volume of the
interaction region and can thus be used as a numerical
descriptor. For improved visualization of the results in MOE
(and for applications other than that reported here) final points
that are close together in the original grid are joined together to
form cubes; a cluster is assumed to form when at the least two
cubes have a common side. Lastly, the software lists the number
of final points, cubes and clusters in a text file and the
information necessary for their visualization is stored in a .pdb
file easily readable by any molecular modelling package. The
in-house program was written in PERL and can run on either
Linux or Windows (equipped with the CYGWIN environment
[23]) based machines.
All calculations were performed on a Linux based
dualprocessor Appro1124 server and on standard PCs operating
with Microsoft Windows XP.
3. Results
3.1. b-CD
The first step of this study consisted in determining relevant
conformations for b-CD. In particular, three conformations
were considered: (a) the crystallographic structure without
minimization (1a), (b) the crystallographic structure after
minimization under MMFF94x and GB-SA conditions (to take
the solvent into account) (1b) and (c) the conformer of lowest
energy resulting from a conformational analysis (1c) performed
by an HMC simulation (the method used is similar to one of
those cited by Lipkowitz [24]). This preliminary operation is
required since the active conformation at any receptor (for
example b-CD) is unknown, and thus more than one possibility
must be explored. In particular, X-ray data might be affected by
packaging artifacts and the minimum energy structure (defined
as the structure with the 3D geometry placing the molecule at
the lowest point on the potential energy hypersurface) depends
on a number of factors, such as starting conformations features
and calculation tool adopted.
Similar values of virtual log P (about �10) were obtained
for 1a–1c (Table 1). In addition the limited variability of the
lipophilicity was confirmed by virtual log P data calculated for
the 51 conformers obtained from the HMC simulation (data not
shown). It must be pointed out that the MLP by Gaillard et al.
[11] has not been validated for very low log Ps (<�3) and thus
its application to b-CDs may be of doubtful validity. However,
this study only analyzed a small number of molecular
geometries of the same compounds (b-CD) and thus the
difference in log P among conformations was of more interest
than its absolute value.
At visual analysis, the lipophilicity pattern given by MLP
(Fig. 2A) is fairly similar to the results described by
Lichtenthaler and Immel [7], since the 2-OH/3-OH side of
the macrocycles is distinctively hydrophilic (blue dots), the
opposite narrower opening made up of the 6-CH2OH groups
shows few hydrophobic points (yellow dots) and the cavity
surface is partially hydrophobic rather than being fully
hydrophobic as has often been reported [4,8].

G. Ermondi et al. / Journal of Molecular Graphics and Modelling 25 (2006) 296–303 299
Fig. 3. GRID validation for 1a: red balls represents crystallized water mole-
cules, blue cubes indicate the GRID hydrophilic regions (=obtained with the
water probe) at �5.0 kcal/mol. The structure is shown perpendicular to the
mean ring plane of the macrocycle and is viewed through the large opening of
the conically-shaped molecule.
Fig. 2. MLP representation. Color coding follows a scale from the most polar
regions (blue) to the most hydrophobic region (yellow). Side view with the 2-
OH/3-OH side pointing downwards (larger opening of the torus) and the 6-
CH2OH upwards (smaller opening of the torus). (A) 1a; (B) 1d.
A validation run was performed to check the efficacy of
MIFs in investigating CDs; this determined whether the
presence of water molecules in their observed crystallographic
position in the b-CDs would be detected as favorable in
energy terms, when GRID was applied using the OH2 probe
[25]. The results are given in Fig. 3, which shows a good
superposition in the cavity between crystallized water
molecules (red balls) and GRID minima (blue cubes, for
cubes definition see Section 2).
Table 2
MIFs numerical results for b-CD in its different conformations (see text). Calcula
No. OH2 (�5 kcal/mol) D
Final points Cubes Clusters F
1a 1863 74 28
1b 1984 106 31 1
1c 1893 120 24
1d 1969 64 42 4
1e 1900 62 40 3
1f 1844 58 34 3
1g 1731 52 28 1
a Ratio between number of dry points and number of water points.
To obtain results comparable with MLP data, two MIFs were
used: the hydrophilic field generated by the OH2 probe and the
hydrophobic field generated by the DRY probe. Hydrophilic
regions are defined as the molecular envelope which is
accessible to and attracts water molecules. In general,
hydrophilic descriptors computed from molecular fields of
�0.2 to�1.0 kcal/mol account for polarizability and dispersion
forces, whereas descriptors computed from molecular fields of
�1.0 to �6.0 kcal/mol account for polar and H-bond donor–
acceptor regions. Hydrophobic regions may be defined as the
molecular envelope generating attractive hydrophobic interac-
tions. The usual energy range of hydrophobic interactions is
from 0.0 to �2.0 kcal/mol [10].
Since the volume of MIFs varies with the energy cutoff value
(see Section 2), �5.0 kcal/mol was taken as a cutoff for the
hydrophilic field and�0.05 kcal/mol for the hydrophobic field,
and a specific in-house program (see Section 2) was used to
tion were performed on b-CD alone (=without any ligand)
RY (�0.05 kcal/mol) r (DRY/OH2)a
inal points Cubes Clusters
59 0 0 0.03
20 1 1 0.06
78 0 0 0.04
04 54 14 0.21
80 54 8 0.20
56 45 7 0.19
41 14 2 0.08
G. Ermondi et al. / Journal of Molecular Graphics and Modelling 25 (2006) 296–303300
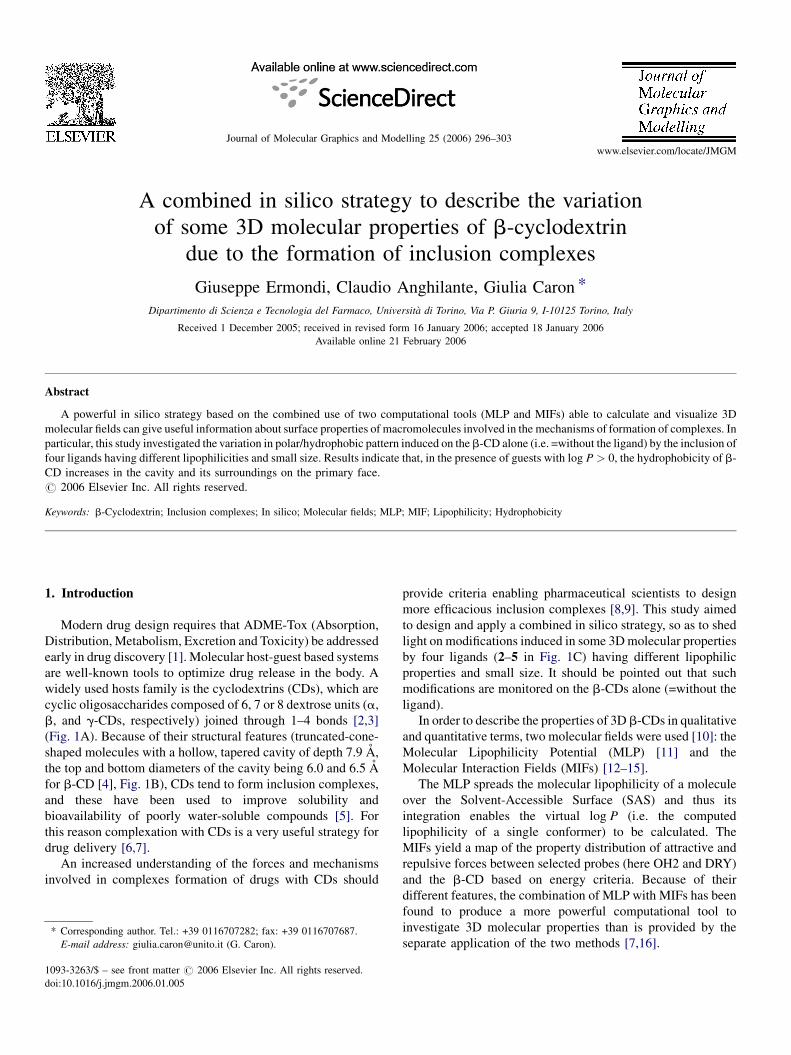
Fig. 4. MIFs visualization: hydrophilic regions (blue) at �5.0 kcal/mol and
hydrophobic regions (yellow) at �0.05 kcal/mol. The orientation is such that
the 2-OH/3-OH side points downwards (larger opening of the torus) and the 6-
CH2OH points upwards (smaller opening of the torus): (A) 1a; (B) 1d.
compute the hydrophobic and hydrophilic contributions at the
chosen energy levels. MIFs analysis was both numerical and
graphic (Table 2, Fig. 4A) and showed that hydrophobic
(yellow) regions were very small and located around the
primary face (Fig. 1B), blue regions were widely dispersed
around the secondary face and also inside the cavity [8].
The balance between the hydrophobic and the hydrophilic
regions was evaluated from the ratio between the number of
final dry points and the number of final water points (r (DRY/
OH2)). The higher this ratio, the larger the extension of the
hydrophobic regions. Again no significant difference was found
between 1a, 1b and 1c, since their r (DRY/OH2) values were
very similar (Table 2).
3.2. b-CD in inclusion complexes
The complexes of b-CD with butyrophenone (2), naphthy-
loxyacetic acid (3), trans-cinnamic acid (4) and diethanolamine
(5) were selected from the CSD database because of the
different lipophilicities of the ligands. Virtual log P indicates
that ligands 2–5 cover a lipophilicity range of about 3.5
logarithm units, as shown in Table 1 (CLOGP and other
softwares also gave the same results, data not shown). In
particular compounds 2, 3 and 4 are lipophilic (log P > 0) and 5is hydrophilic (log P < 0).
On the basis of previous results (see above), the crystal-
lographic structures of the b-CDs in selected inclusion
complexes were used without further minimization. The
following codes were adopted: b-CD extracted from the
complex with butyrophenone = 1d, with naphthyloxyacetic
acid = 1e, with trans-cinnamic acid = 1f and with diethanola-
mine = 1g.
Log P values for 1a–1c were lower than those for 1d–1g(Table 1) and the more lipophilic the ligand, the higher the log P
of the corresponding b-CD. In particular visual inspection of
the lipophilicity potential showed the cavity of 1d (Fig. 2B) to
be more lipophilic than that of 1a (Fig. 2A). The same was true
for 1e and 1f (to a lesser extent), but not for 1g, which had about
the same MLP profile as did 1a–1c (not shown).
MIFs data for 1d–1g are given in Table 2. In agreement with
MLP data (Table 1), the extension of the hydrophobic regions
(as expressed by r (DRY/OH2)) was larger for CDs extracted
from the complexes with lipophilic ligands than for 1a–1c, but
for 1g (the corresponding ligand, 5, had a negative log P value)
r (DRY/OH2) was similar to those of 1a–1c.
Graphic analysis of MIFs gave similar information as did
MLP (Fig. 4B reports molecular fields for 1d): the zone of the
primary face around the cavity was hydrophobic in the presence
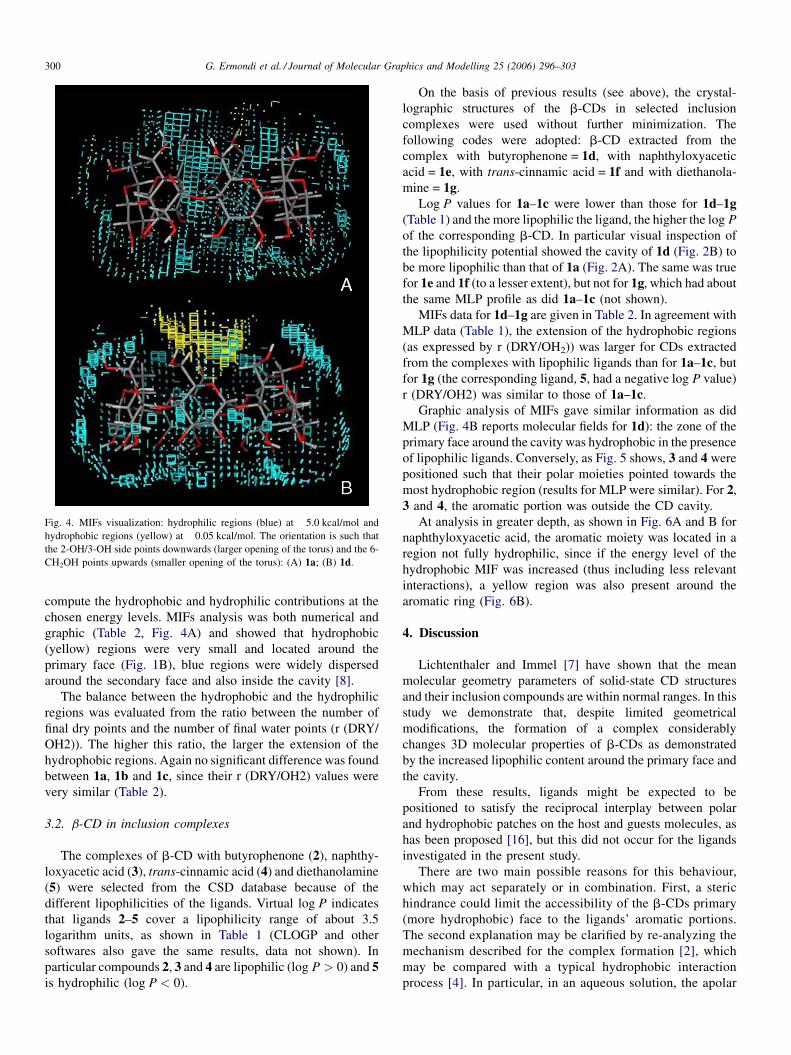
of lipophilic ligands. Conversely, as Fig. 5 shows, 3 and 4 were
positioned such that their polar moieties pointed towards the
most hydrophobic region (results for MLP were similar). For 2,
3 and 4, the aromatic portion was outside the CD cavity.
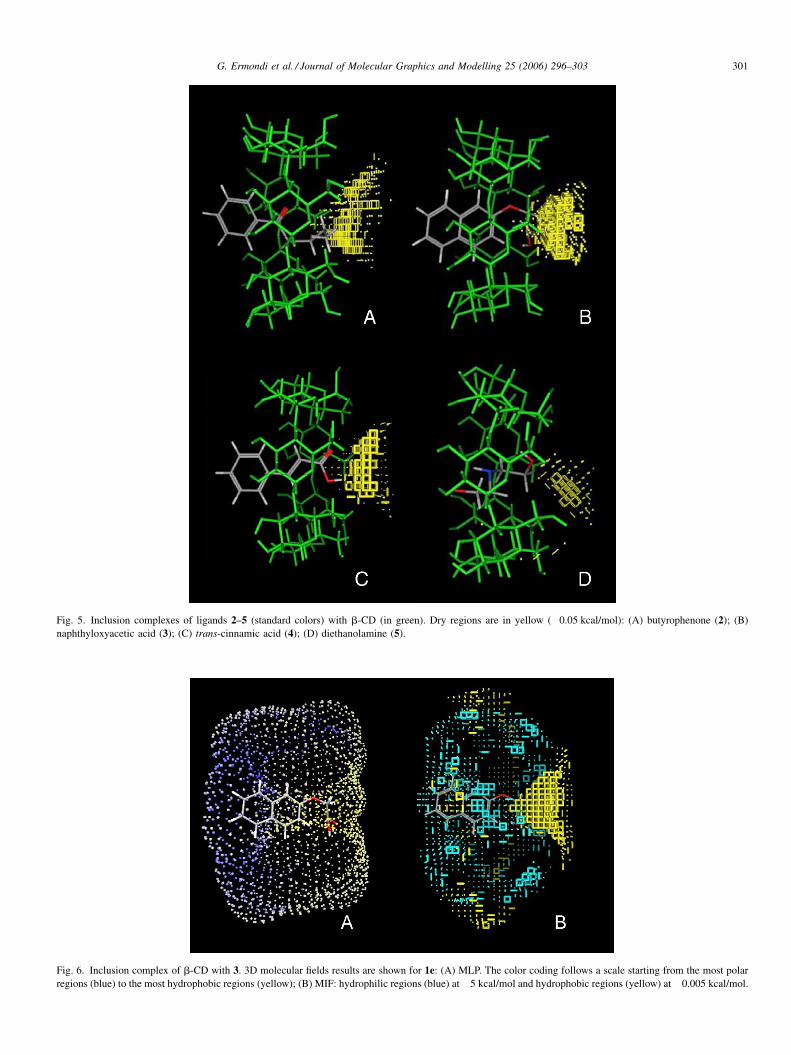
At analysis in greater depth, as shown in Fig. 6A and B for
naphthyloxyacetic acid, the aromatic moiety was located in a
region not fully hydrophilic, since if the energy level of the
hydrophobic MIF was increased (thus including less relevant
interactions), a yellow region was also present around the
aromatic ring (Fig. 6B).
4. Discussion
Lichtenthaler and Immel [7] have shown that the mean
molecular geometry parameters of solid-state CD structures
and their inclusion compounds are within normal ranges. In this
study we demonstrate that, despite limited geometrical
modifications, the formation of a complex considerably
changes 3D molecular properties of b-CDs as demonstrated
by the increased lipophilic content around the primary face and
the cavity.
From these results, ligands might be expected to be
positioned to satisfy the reciprocal interplay between polar
and hydrophobic patches on the host and guests molecules, as
has been proposed [16], but this did not occur for the ligands
investigated in the present study.
There are two main possible reasons for this behaviour,
which may act separately or in combination. First, a steric
hindrance could limit the accessibility of the b-CDs primary
(more hydrophobic) face to the ligands’ aromatic portions.
The second explanation may be clarified by re-analyzing the
mechanism described for the complex formation [2], which
may be compared with a typical hydrophobic interaction
process [4]. In particular, in an aqueous solution, the apolar
G. Ermondi et al. / Journal of Molecular Graphics and Modelling 25 (2006) 296–303 301
Fig. 5. Inclusion complexes of ligands 2–5 (standard colors) with b-CD (in green). Dry regions are in yellow (�0.05 kcal/mol): (A) butyrophenone (2); (B)
naphthyloxyacetic acid (3); (C) trans-cinnamic acid (4); (D) diethanolamine (5).
Fig. 6. Inclusion complex of b-CD with 3. 3D molecular fields results are shown for 1e: (A) MLP. The color coding follows a scale starting from the most polar
regions (blue) to the most hydrophobic regions (yellow); (B) MIF: hydrophilic regions (blue) at �5 kcal/mol and hydrophobic regions (yellow) at �0.005 kcal/mol.

G. Ermondi et al. / Journal of Molecular Graphics and Modelling 25 (2006) 296–303302
Fig. 7. Diagram of hypothesized entrance of a generic compound into the b-CD
cavity, as deduced from the results reported here. In particular the presence of a
polar group (P) in the ligand structure might facilitate entry. Entrance is
facilitated if it is from the secondary face, which is the largest. Once the ligand
has entered, the cavity space might be increased by opening the primary
oxygens, thus extending the hydrophobic region and facilitating accommoda-
tion of the hydrophobic (H) portion of the ligand.
cyclodextrin cavity is assumed to be occupied by water
molecules, which are unfavorable from the energy standpoint
(polar–apolar interaction) and therefore can be readily
substituted by appropriate less polar guest molecules. Indeed,
the CD cavity is mainly hydrophilic and thus the presence of
a polar group in the ligand structure could help entry into the
cavity. Entrance is facilitated if it occurs from the secondary
face, which is the largest face. Once the ligand has entered,
the CD cavity space would be increased if the oxygen
opened, extending the hydrophobic region. This would
enable a hydrophobic ligand to be accommodated more
easily.
Fig. 7 shows a schematic representation of this hypothesis
which is also in agreement with the experimental results
recently published by Uccello-Barretta et al. [9] who found that
molsidomine preferentially binds b-CD by the morpholine
moiety (more polar) rather than the ethylic group (more
hydrophobic).
We also sought stability constants (log K) for 1:1 inclusion
complexes of pairs of compounds that differ only in the
presence of a polar substituent (i.e. benzene and phenol). If our
assumption is correct, these experimental data should show that
the presence of a polar moiety allows the derivative (i.e. phenol)
to have a higher log K than the parent (i.e. benzene). Among the
data listed by Rekharsky and Inoue in their comprehensive
review [4], we found log K data for two pairs of compounds:
benzene (about 2.1) and phenol (about 3.4) and naphthalene
(about 2.8) and 1-naphtol (about 3.1). The hypothesis we put
forward here was verified in each case. Unfortunately, since the
paucity of reliable data (the quality of experimental log K is
often not comparable when obtained in different laboratories)
we cannot extend our demonstration to more pairs of
compounds.
Lastly, these results are of additional significance because
they are the result of the combination of two different
computational tools, each having its own weakness and
strengths. In particular, the MLP approach is much simpler
than the GRID based tool and can furnish good preliminary
indications about the topic under investigation, but for deeper
insight into the problem the use of GRID is mandatory, chiefly
because it can be tailored to specific requirements.
5. Conclusions
This study demonstrates the need for new computational
methodologies in molecular modelling based on the combina-
tion of two or more existing methods. The combined use of two
in silico strategies cannot of course replace experimental
proofs, but it does provide a more powerful tool than the
separate use of any one software package.
The efficacy of this approach is demonstrated here by
applying it to the study of interactions of b-CDs with a series of
four ligands. Work is in progress to extend the study to larger
ligands for which no crystallographic data have yet been
published, in order to extract information on their log K values.
The final step of the study will be to apply the new strategy to
derivatized non-ionic and ionic b-CDs.
Acknowledgement
GE and GC are indebted to the University of Turin for
financial support.
References
[1] H. van de Waterbeemd, D.A. Smith, K. Beaumont, D.K. Walker, Property-
based design: optimization of drug absorption and pharmacokinetics, J.
Med. Chem. 44 (2001) 1313–1333.
[2] J. Szejtli, Introduction and general overview of cyclodextrin chemistry,
Chem. Rev. 98 (1998) 1743–1753.
[3] V.J. Stella, R.A. Rajewski, Cyclodextrins: their future in drug formulation
and delivery, Pharm. Res. 14 (1997) 556–567.
[4] M.V. Rekharsky, Y. Inoue, Complexation thermodynamics of cyclodex-
trins, Chem. Rev. 98 (1998) 1875–1917.
[5] D.O. Thompson, Cyclodextrins-enabling excipients: their present and
future use in pharmaceuticals, Criti. Rev. Ther. Drug Carr. Syst. 14
(1997) 1–104.
[6] S. Baboota, R. Khanna, S.P. Agarwal, J. Ali, A. Ahuja, Cyclodextrins in
drug delivery systems: an update, Pharma Articles, NET, 2003.
[7] F.W. Lichtenthaler, S. Immel, On the hydrophobic characteristics of
cyclodextrins: computer-aided visualization of molecular lipophilicity
patterns, Liebigs Ann. (1996) 27–37.
[8] G. Uccello-Barretta, F. Balzano, G. Sicoli, C. Friglola, I. Aldana, A.
Monge, D. Paolino, S. Guccione, Combining NMR and molecular mod-
elling in a drug delivery context: investigation of the multi-mode inclusion
of a new NPY-5 antagonist bromobenzenesulfonamide into b-cyclodex-
trin, Bioorg. Med. Chem. 12 (2004) 447–458.
[9] G. Uccello-Barretta, F. Balzano, D. Paolino, R. Ciaccio, S. Guccione,
Combined NMR-crystallographic and modelling investigation of the
inclusion of molsidomine into a-, b-, and g-cyclodextrins, Bioorg.
Med. Chem. 13 (2005) 6502–6512.
[10] G. Cruciani, P. Crivori, P.A. Carrupt, B. Testa, Molecular fields in
quantitative structure-permeation relationships: the volsurf approach, J.
Mol. Struct. (Theochem.) 503 (2000) 17–30.
[11] P. Gaillard, P.A. Carrupt, B. Testa, A. Boudon, Molecular lipophilicity
potential, a tool in 3D-QSAR. Method and applications, J. Comput. Aid.
Mol. Des. 8 (1994) 83–96.
G. Ermondi et al. / Journal of Molecular Graphics and Modelling 25 (2006) 296–303 303
[12] P.J. Goodford, A computational procedure for determining energetically
favorable binding sites on biologically important macromolecules, J. Med.
Chem. 28 (1985) 849–857.
[13] D.N.A. Boobbyer, P.J. Goodford, P.M. McWhinnie, R.C. Wade, New
hydrogen-bond potentials for use in determining energetically favorable
binding sites on molecules of known structure, J. Med. Chem. 32 (1989)
1083–1094.
[14] R.C. Wade, K.J. Clark, P.J. Goodford, Further development of hydrogen
bond functions for use in determining energetically favorable binding sites
on molecules of known structure. 1. Ligand probe groups with the ability
to form two hydrogen bonds, J. Med. Chem. 36 (1993) 140–147.
[15] R.C. Wade, P.J. Goodford, Further development of hydrogen bond functions
for use in determining energetically favorable binding sites on molecules of
known structure. 2. Ligand probe groups with the ability to form more than
two hydrogen bonds, J. Med. Chem. 36 (1993) 148–156.
[16] F.W. Lichtenthaler, S. Immel, Towards understanding formation and stabi-
lity of cyclodextrin inclusion complexes: computation and visualization of
their molecular lipophilicity patterns, Starch/Starke 48 (1996) 145–154.
[17] Mercury, version 1.3, 2005, CCDC, Cambridge, UK, http://www.ccdc.ca-
m.ac.uk/products/csd_system/mercury/.
[18] MOE, version 2005.06, 2005, Chemical Computing Group, Montreal,
Quebec Canada, http://www.chemcomp.com/.
[19] G. Caron, G. Ermondi, A. Damiano, L. Novaroli, O. Tsinman, J.A. Ruell,
A. Avdeef, Ionization, lipophilicity, and molecular modeling to investigate
permeability and other biological properties of amlodipine, Bioorg. Med.
Chem. 12 (2004) 6107–6118.
[20] D. Qiu, P.S. Shenkin, F.P. Hollinger, W.C. Still, The GB/SA continuum
model for solvation. a fast analytical method for the calculation of
approximate born radii, J. Phys. Chem. A 101 (1997) 3005–3014.
[21] Vega, Version 2.0.5, 2006, http://www.ddl.unimi.it/
[22] GRID, Version 22b, 2004, Molecular Discovery Ltd., West Way House,
Elms Parade, Oxford, http://www.moldiscovery.com.
[23] CYGWIN, Version 1.5.18-1, 2004, http://www.cygwin.com/.
[24] K.B. Lipkowitz, Applications of computational chemistry to the study of
cyclodextrin, Chem. Rev. 98 (1998) 1829–1873.
[25] M. Pastor, G. Cruciani, K.A. Watson, A strategy for the incorporation of
water molecules present in a ligand binding site into a three-dimensional
quantitative structure-activity relationship analysis, J. Med. Chem. 40
(1997) 4089–4102.
Copyright © 2022 FDOKUMEN