Effect of nitrogen or phosphorus starvation on pigment composition of cultured Heterocapsa sp
Upload
independentCategory
view
0download
0
A Central Regulatory System Largely ControlsTranscriptional Activation and Repression Responses toPhosphate Starvation in ArabidopsisRegla Bustos¤a, Gabriel Castrillo, Francisco Linhares, Marıa Isabel Puga, Vicente Rubio, Julian Perez-
Perez¤b, Roberto Solano, Antonio Leyva, Javier Paz-Ares*
Department of Plant Molecular Genetics, Centro Nacional de Biotecnologıa-CSIC, Madrid, Spain
Abstract
Plants respond to different stresses by inducing or repressing transcription of partially overlapping sets of genes. InArabidopsis, the PHR1 transcription factor (TF) has an important role in the control of phosphate (Pi) starvation stressresponses. Using transcriptomic analysis of Pi starvation in phr1, and phr1 phr1-like (phl1) mutants and in wild type plants,we show that PHR1 in conjunction with PHL1 controls most transcriptional activation and repression responses tophosphate starvation, regardless of the Pi starvation specificity of these responses. Induced genes are enriched in PHR1binding sequences (P1BS) in their promoters, whereas repressed genes do not show such enrichment, suggesting thatPHR1(-like) control of transcriptional repression responses is indirect. In agreement with this, transcriptomic analysis of atransgenic plant expressing PHR1 fused to the hormone ligand domain of the glucocorticoid receptor showed that PHR1direct targets (i.e., displaying altered expression after GR:PHR1 activation by dexamethasone in the presence ofcycloheximide) corresponded largely to Pi starvation-induced genes that are highly enriched in P1BS. A minimal promotercontaining a multimerised P1BS recapitulates Pi starvation-specific responsiveness. Likewise, mutation of P1BS in thepromoter of two Pi starvation-responsive genes impaired their responsiveness to Pi starvation, but not to other stress types.Phylogenetic footprinting confirmed the importance of P1BS and PHR1 in Pi starvation responsiveness and indicated thatP1BS acts in concert with other cis motifs. All together, our data show that PHR1 and PHL1 are partially redundant TF actingas central integrators of Pi starvation responses, both specific and generic. In addition, they indicate that transcriptionalrepression responses are an integral part of adaptive responses to stress.
Citation: Bustos R, Castrillo G, Linhares F, Puga MI, Rubio V, et al. (2010) A Central Regulatory System Largely Controls Transcriptional Activation and RepressionResponses to Phosphate Starvation in Arabidopsis. PLoS Genet 6(9): e1001102. doi:10.1371/journal.pgen.1001102
Editor: Joseph R. Ecker, The Salk Institute for Biological Studies, United States of America
Received June 22, 2009; Accepted July 29, 2010; Published September 9, 2010
Copyright: � 2010 Bustos et al. This is an open-access article distributed under the terms of the Creative Commons Attribution License, which permitsunrestricted use, distribution, and reproduction in any medium, provided the original author and source are credited.
Funding: This research was supported by grants from the Spanish Ministry of Science and Innovation (MICINN; grants CONSOLIDER 2007-28317, BIO2008-04715)and the French-German-Spanish Trilateral program on Plant Genomics (also funded by MICINN; grants REGULATORS and TRANSNET). The funders had no role instudy design, data collection and analysis, decision to publish, or preparation of the manuscript.
Competing Interests: The authors have declared that no competing interests exist.
* E-mail: [email protected]
¤a Current address: CBGP, Pozuelo de Alarcon, Madrid, Spain¤b Current address: SECUGEN, Madrid, Spain
Introduction
Plants have evolved adaptive responses to cope with growth
under a variety of stress conditions. These responses involve
changes that are specific to particular types of stress or shared
by different stress types. A specific response to phosphate (Pi)
starvation, for example, is increased Pi uptake capacity from
the soil, whereas the induction of anthocyanin accumulation
and acceleration of senescence are shared responses to many
different kinds of stress [1–3]. In line with the overlap among
physiological and developmental responses to different stress
types, transcriptional responses overlap as well [4,5]. An
important question regarding transcriptional responses to
stress is how specific and shared responses are regulated -
are they controlled by the same regulatory systems or are there
generic stress response regulators? A second question is the
biological significance of transcriptional repression in stress
responses. Is it mostly an integral part of the adaptive system or
is it mainly an indirect consequence of plant malfunction due
to stress?
We addressed these two questions, focussing on the Pi starvation
stress response as a model in Arabidopsis. The importance of
transcriptional control in the regulation of Pi starvation responses
has already been established. The expression of a large number of
genes is altered in response to Pi starvation (between 900 and
3000, depending on the study) [6–11]. The transcription factor
(TF) PHR1 is a key regulatory component of Pi starvation
responses in Arabidopsis [12]; PHR1 binds to an imperfect
palindromic motif present in the promoters of many Pi starvation-
induced genes. Loss of function mutation of PHR1 affects several
Pi starvation responses, including alteration of root to shoot
growth ratio, anthocyanin accumulation, and the expression of
several Pi starvation-induced genes. Nonetheless, the extent of the
role of PHR1 in Pi starvation responses has yet to be established.
PHR1 is part of a family of 15 genes in Arabidopsis (MYB-CC
family). Some functional redundancy among family members has
PLoS Genetics | www.plosgenetics.org 1 September 2010 | Volume 6 | Issue 9 | e1001102
been suggested, based on the fact that the phr1 effect on some Pi
starvation-responsive genes is only partial [12].
In addition to PHR1, members of bHLH, WRKY, Zinc finger
and R2R3 MYB families of TF are involved in the control of Pi
starvation responses, although their exact positions in the
signalling pathway have not been established [13–17]. Whereas
PHR1 is weakly transcriptionally responsive to Pi starvation, these
other TF genes are highly responsive to Pi stress, suggesting that
they act downstream of PHR1.
Additional mechanisms other than TF operate to regulate Pi
starvation signalling. These include sumoylation [18], degradation
by the proteosome, which probably involves the E2 ubiquitin
conjugase-related enzyme (PHO2) [19–21], and control of Pi
uptake efficiency via a phosphate transporter traffic facilitator
(PHF1) [22], as well as several miRNA and antagonists (IPS1 and
related genes) of miRNA MiR399, which controls PHO2 activity
[20,23–27]. There is also a Pi starvation-induced gene family that
encodes nuclear SPX domain-containing proteins, which affects
responsiveness of several Pi starvation-induced genes through an
unknown mechanism [28,29]. MiR399, IPS1 and PHF1 are all
under the control of PHR1, which itself is sumoylated in vitro by
SIZ1, further strengthening the central role of PHR1 in the
control of Pi starvation responses [12,18,20,22].
Here we performed a physiological and transcriptomic analysis
of Pi starvation responses in plants with altered PHR1(-like)
activity, comparing mutants of phr1, phr1-like1 (phl1) and phr1
phl1, and PHR1-overexpressing transgenic lines. Results showed
that PHR1 and PHL1 are partially redundant and have a central
role in the control of physiological and molecular responses to Pi
starvation, independent of whether these responses are specific to
Pi starvation stress. They also indicate that a large proportion of
the transcriptional repression responses to Pi starvation are part
of the adaptive response to this stress, and that their control by
PHR1(-like) is indirect. We also show the importance of the
PHR1 binding sequence (P1BS) as an integrating cis-regulatory
motif associated with genes that are highly induced by Pi
starvation.
Results
Functional redundancy between PHR1 and PHR1-LIKE1(PHL1) and their central role in the control of Pistarvation responses
PHR1 mutants show distinct degrees of impairment of different
Pi starvation responses, as evident in expression analyses of a set of
Pi starvation-responsive genes [12]. Incomplete impairment of
these responses could reflect partial gene redundancy, as PHR1
belongs to a transcription factor family with 15 close members
(Figure 1A and Figure S1). It is also possible that more than a
single regulatory system controls Pi starvation responses. To study
the relationships between these possibilities, we searched for T-
DNA mutations at PHR1-related genes in public databases; the
two phylogenetically most closely related Arabidopsis genes for
which a mutant was available were At5g29000 and At5g06800. We
selected At5g29000, which we term PHR1-LIKE1 (PHL1) for
further analysis, as it displayed a higher degree of amino acid
identity with PHR1, and the T-DNA mutation disrupted the
coding region of PHL1 mRNA (Figure S1 and Figure S2A). We
examined whether expression of PHR1 and PHL1 overlapped.
Northern analysis showed that PHL1 expression overlapped with
that of PHR1 in both shoots and roots under any Pi regime (Figure
S2B). This observation was confirmed by the large overlap in
PHR1 and PHL1 expression at different developmental stages,
according to GENEVESTIGATOR gene expression data
(https://www.genevestigator.com) [30] (Figure S2C). After gener-
ating a homozygous double mutant phr1 phl1, functional
redundancy between PHR1 and PHL1 was shown by northern
analysis (Figure 1B). Whereas the effect of the phl1 mutation on Pi
starvation responsiveness was barely detectable, we observed a
synergistic effect of phr1 and phl1 mutations for expression of all
genes examined. To be noted is the limited effect of these
mutations on expression of Pi starvation induced genes in plants
grown under a high Pi regimen, as shown by northern analysis and
also using quantitative reverse transcription PCR (Q-RT-PCR)
(Figure 1B and Figure S3).
For comparative purposes, we produced transgenic plants with
the phr1 background, overexpressing PHR1 fused to the rat
glucocorticoid receptor domain (GR:PHR1) to allow dexameth-
asone (DEX)-inducible control of its activity [31]. Northern
analysis showed that three independent lines overexpressing the
GR:PHR1 fusion had DEX-dependent PHR1 activity (Figure S4).
The effect of GR:PHR1 overexpression on gene expression was
detected even when plants were grown under Pi sufficient
conditions (Figure S4). These results are in agreement with
previous reports [32,33], and indicate that PHR1 overexpression
can override, at least to some extent, the negative regulatory
control that occurs at much more limited PHR1 levels in wild type
plants.
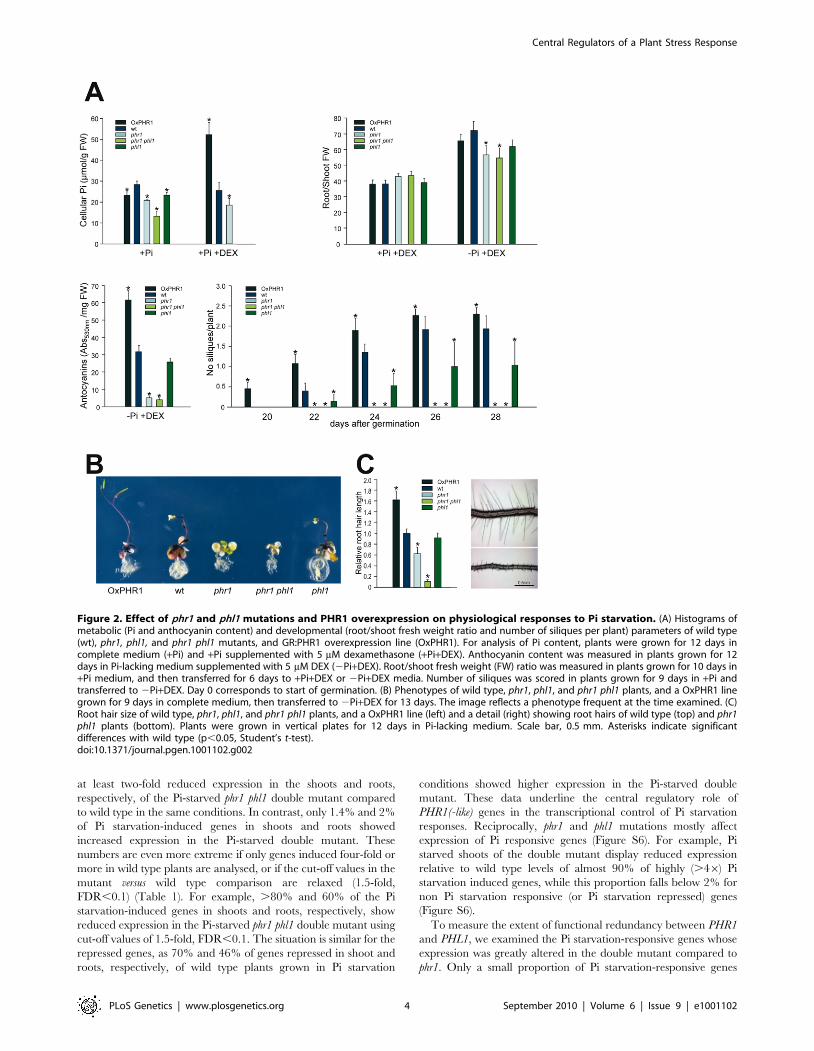
Physiological tests were performed on wild type, phr1, phl1 and
phr1 phl1 mutants, and transgenic plants overexpressing GR:PHR1
(Figure 2). In accordance with previous results [12], Pi
accumulation in plants grown under Pi sufficient conditions was
reduced in the phr1 mutant (compared to wild type plants;
Figure 2A). The phl1 mutant had slightly, but significantly reduced
Pi levels, and a further decrease in Pi accumulation was observed
in the phr1 phl1 double mutant, indicating partial functional
redundancy between these two MYB-CC family genes. Conversely,
Pi accumulation in DEX-treated GR:PHR1-overexpressing plants
(OxGR:PHR1) was greatly increased with respect to that in wild
type plants (Figure 2A). After Pi starvation, anthocyanins
accumulate in leaves and stems of wild type plants; much less
anthocyanin accumulated in the phr1 mutant (Figure 2A). The
Author Summary
As sessile organisms, plants are often exposed to stressconditions, and have evolved adaptive responses toprotect themselves from different types of stress. Someresponses are stress type-specific whereas others arecommon to different stress types. Understanding howthese responses are controlled is crucial for rationalimprovement of stress tolerance, a limiting factor in cropproductivity. Here we examined the physiological andmolecular responses to phosphate starvation and foundthat a single transcription factor family, represented byPHOSPHATE STARVATION RESPONSE REGULATOR 1(PHR1), has a central role in the control of specific andshared phosphate starvation stress responses. In conso-nance with the importance of PHR1, we found that thePHR1-binding sequence, present in most PHR1 directtargets, is a crucial cis motif for Pi starvation responsive-ness. An artificial promoter controlled by PHR1 recapitu-lates responsiveness to Pi starvation and to modulators ofthis response, qualifying PHR1 family members as centralintegrators in Pi starvation signalling. This central integra-tor system also controls most transcriptional repressionresponses to Pi starvation, indicating that they are anintegral part of the adaptive response, and not aconsequence of plant malfunction due to stress.
Central Regulators of a Plant Stress Response
PLoS Genetics | www.plosgenetics.org 2 September 2010 | Volume 6 | Issue 9 | e1001102

effect on anthocyanin accumulation was negligible for phl1,
however, and did not differ significantly between phr1 and the
phr1 phl1 double mutant (Figure 2A). In contrast, anthocyanin
accumulation was enhanced in OxGR:PHR1 plants. Following Pi
starvation, wild type plants show an increase in root to shoot
growth ratio; this increase was significantly reduced in phr1
mutants, whereas the phl1 mutation had a negligible effect alone or
in combination with phr1. In DEX-treated phr1 GR:PHR1-
overexpressing plants, the root to shoot growth ratio was similar
to that of wild type plants in Pi starvation conditions (Figure 2A).
The effect of phl1, and in particular, of phr1 and phr1 phl1
mutations on senescence and silique formation was evident on
plants grown in Pi starvation conditions, as these plants died
before flowering (Figure 2A and 2B). In contrast, DEX-treated
OxGR:PHR1 plants showed slightly accelerated flowering and
higher silique production. These findings concur with the idea that
cell death in the mutants reflects a lack of correct protection
against the stress inherent in Pi starvation, and that increased
PHR1 activity results in increased reproductive success in these
stress conditions.
The effect on root hair length was quite obvious when plants
where grown in Pi-lacking medium in vertical plates; the phr1
mutation affected root hair length, which was enhanced when
combined with the phl1 mutation (Figure 2C).
PHL1 and PHR1 have similar in vitro DNA-bindingproperties
Given the partial functional redundancy between PHR1 and
PHL1, as shown by our analyses of phr1 and phl1 single and double
mutants, we examined whether these two proteins had similar
DNA binding properties and whether they were able to
heterodimerise. For these studies, we used two N-terminally
truncated versions of each protein obtained by in vitro translation,
since a previous study with PHR1 showed that in vitro-translated
N-terminally truncated PHR1 protein had similar DNA binding
specificity but higher affinity than the full length protein [12]. The
two deletions removed 99 or 198 N-terminal amino acids of PHR1
and 103 or 210 residues of PHL1 (Figure 3A). Electrophoretic
mobility shift assays (EMSA) indicated that both PHL1 versions
could interact with P1BS sequences, the prototype PHR1 binding
site (Figure 3B). EMSA with the two cotranslated truncated PHL1
versions showed the appearance of a band of intermediate
mobility, in addition to those corresponding to the medium and
short versions of truncated PHL1; this was indicative of the self-
dimerisation properties of PHL1 [34], as also observed for PHR1
[12]. Intermediate mobility bands were also observed when the
medium size PHL1 version was cotranslated with the short PHR1
version, indicating that they can form heterodimers (Figure 3C).
The ability of PHL1 and PHR1 to heterodimerise was
confirmed by identification of PHL1 as a PHR1-interacting
protein in a yeast two-hybrid assay (Figure S5).
Broad effects of phr1 and phr1 phl1 mutants ontranscriptional responsiveness to Pi starvation
To examine the correspondence between the effects of phr1 and
combined phr1 phl1 mutations on physiological responses and
transcriptional responses to Pi starvation, we performed tran-
scriptomic analysis in wild type, as well as single phr1 and double
phr1 phl1 mutants. For these assays, wild type plants were
germinated and grown for 7 days in Pi-sufficient and -starvation
conditions, and mutant plants were grown in Pi starvation
conditions. The use of long-term stress treatment for the analysis
was aimed to identify the long-term effects of these mutations.
For transcriptomic analyses, we collected RNA separately from
shoots and roots in three independent replicates obtained over a
two-month interval. A total of 1873 and 704 genes were
upregulated, and 1795 and 326 downregulated in Pi-starved
shoots and roots, respectively (cut-off values 2-fold, false discovery
rate (FDR),0.05; Table 1 and Table S1). The effect of the phr1
mutation, particularly when combined with phl1, on the expression
of these Pi starvation-responsive genes was striking (Table 1). Of
the genes whose expression was induced two-fold or more in the
wild type plants in response to Pi starvation, 68% and 47% showed
Figure 1. Functional redundancy of PHR1 and PHL1 in Pistarvation responsiveness of gene expression. (A) Phylogram ofMYB-CC proteins from Arabidopsis, constructed using the Phylogeny-frplatform (www.phylogeny.fr) [70]. In addition to the AGI number,names are given for the functionally characterized members: PHOS-PHATE STARVATION RESPONSE REGULATOR 1 (PHR1) [12]; PHR1-LIKE1(PHL1; this study) ALTERED PHLOEM DEVELOPMENT (APL) [71]. Thebootstrap value of each node is indicated (100 samples); nodes withbootstrap value ,50 were collapsed. Only the conserved MYB andcoiled-coil domains were used for alignment (Figure S1) and treeconstruction. (B) Northern analysis of the effect of phr1 and phl1mutations on the expression of Pi starvation-responsive marker genes.Plants were grown for 7 days in Pi-rich or -lacking medium; RNA fromroots and shoots was isolated separately and blots were hybridisedsequentially to the probes PHT1;1, RNS1, IPS1, and SPX1. Ethidiumbromide-stained rRNA was used as loading control.doi:10.1371/journal.pgen.1001102.g001
Central Regulators of a Plant Stress Response
PLoS Genetics | www.plosgenetics.org 3 September 2010 | Volume 6 | Issue 9 | e1001102
at least two-fold reduced expression in the shoots and roots,
respectively, of the Pi-starved phr1 phl1 double mutant compared
to wild type in the same conditions. In contrast, only 1.4% and 2%
of Pi starvation-induced genes in shoots and roots showed
increased expression in the Pi-starved double mutant. These
numbers are even more extreme if only genes induced four-fold or
more in wild type plants are analysed, or if the cut-off values in the
mutant versus wild type comparison are relaxed (1.5-fold,
FDR,0.1) (Table 1). For example, .80% and 60% of the Pi
starvation-induced genes in shoots and roots, respectively, show
reduced expression in the Pi-starved phr1 phl1 double mutant using
cut-off values of 1.5-fold, FDR,0.1. The situation is similar for the
repressed genes, as 70% and 46% of genes repressed in shoot and
roots, respectively, of wild type plants grown in Pi starvation
conditions showed higher expression in the Pi-starved double
mutant. These data underline the central regulatory role of
PHR1(-like) genes in the transcriptional control of Pi starvation
responses. Reciprocally, phr1 and phl1 mutations mostly affect
expression of Pi responsive genes (Figure S6). For example, Pi
starved shoots of the double mutant display reduced expression
relative to wild type levels of almost 90% of highly (.46) Pi
starvation induced genes, while this proportion falls below 2% for
non Pi starvation responsive (or Pi starvation repressed) genes
(Figure S6).
To measure the extent of functional redundancy between PHR1
and PHL1, we examined the Pi starvation-responsive genes whose
expression was greatly altered in the double mutant compared to
phr1. Only a small proportion of Pi starvation-responsive genes
Figure 2. Effect of phr1 and phl1 mutations and PHR1 overexpression on physiological responses to Pi starvation. (A) Histograms ofmetabolic (Pi and anthocyanin content) and developmental (root/shoot fresh weight ratio and number of siliques per plant) parameters of wild type(wt), phr1, phl1, and phr1 phl1 mutants, and GR:PHR1 overexpression line (OxPHR1). For analysis of Pi content, plants were grown for 12 days incomplete medium (+Pi) and +Pi supplemented with 5 mM dexamethasone (+Pi+DEX). Anthocyanin content was measured in plants grown for 12days in Pi-lacking medium supplemented with 5 mM DEX (2Pi+DEX). Root/shoot fresh weight (FW) ratio was measured in plants grown for 10 days in+Pi medium, and then transferred for 6 days to +Pi+DEX or 2Pi+DEX media. Number of siliques was scored in plants grown for 9 days in +Pi andtransferred to 2Pi+DEX. Day 0 corresponds to start of germination. (B) Phenotypes of wild type, phr1, phl1, and phr1 phl1 plants, and a OxPHR1 linegrown for 9 days in complete medium, then transferred to 2Pi+DEX for 13 days. The image reflects a phenotype frequent at the time examined. (C)Root hair size of wild type, phr1, phl1, and phr1 phl1 plants, and a OxPHR1 line (left) and a detail (right) showing root hairs of wild type (top) and phr1phl1 plants (bottom). Plants were grown in vertical plates for 12 days in Pi-lacking medium. Scale bar, 0.5 mm. Asterisks indicate significantdifferences with wild type (p,0.05, Student’s t-test).doi:10.1371/journal.pgen.1001102.g002
Central Regulators of a Plant Stress Response
PLoS Genetics | www.plosgenetics.org 4 September 2010 | Volume 6 | Issue 9 | e1001102

showed more than two-fold altered expression in the phr1 phl1
double mutant compared to phr1 (200 Pi starvation-induced and
82 Pi starvation-repressed genes displayed more than two-fold
reduced and increased expression, respectively, in phr1 phl1 vs.
phr1; Table S2). Of the genes showing altered expression in phr1
phl1 compared to phr1, only 30% did not show altered expression
in Pi-starved single phr1 mutant vs. Pi-starved wild type plants,
indicating a large functional overlap between phr1 and phl1.
We used MAPMAN ontology tools to obtain an overview of Pi
starvation-responsive genes involved in metabolism and regulation
(http://mapman.gabipd.org/web/guest/home) [35] (Figure S7).
Pi starvation had a broad effect on genes involved in all aspects of
metabolism. In particular, induced genes were greatly enriched in
secondary metabolism biosynthetic genes, especially those of
phenylpropanoids (Figure S7A). There was also an increase in
biosynthetic genes of sulpholipids and galactolipids, which replace
phospholipids under Pi-limiting conditions as previously reported
[36–38], and of tetrapyrroles. Pi starvation also had a large effect
on transcriptional repression of genes involved in light reactions of
photosynthesis and in photorespiration (Figure S7A). These are
likely protective responses as they would reduce the potential
generation of reactive oxygen species. Pi starvation-triggered
changes in the transcription of regulatory components showed
notable effects on genes encoding transcription factors, compo-
nents of protein degradation machinery, hormone biosynthesis
and signalling, and calcium-based regulation, with induction more
prominent than repression (Figure S7B). Our findings are
qualitatively similar to those in previous reports [9,10].
We compared our set of Pi starvation-induced and -repressed
genes with the sets of genes responsive to different types of stress or
hormones available at the GENEVESTIGATOR database [30]
(Table S3). In most cases, there were significant overlaps between
the set of genes responsive to Pi starvation and those responsive to
other types of stress and, as reported, there were also many
significant overlaps with hormone-responsive gene sets [39]. To
infer whether control of shared genes, i.e., responsive to Pi
starvation and other stresses, could occur through independent
regulatory systems (involving different stress type-specific TF) or,
alternatively, could in part use common regulatory components,
we examined the representation of TF genes in the sets of shared
genes that respond to Pi starvation and to other stress types. In
most cases, we found that TF genes were equally over-represented
relative to non-TF genes in the sets of shared genes (Table S3); this
favours the idea that transcriptional control of genes that respond
to two stress types in part uses common regulatory components.
Two exceptions corresponded to hydrogen peroxide treatment
and low nitrate growth conditions, whose induced genes are
significantly enriched in Pi starvation-induced genes; enrichment
was much weaker or non-existent for Pi starvation-induced TF,
however, raising the possibility that in these cases, part of the
shared response is controlled by independent TF.
Finally, we studied the effect of Pi starvation on general stress
response (GSR) genes. Two independent studies recently identified
sets of general stress-induced genes [4,5]. There is considerable
overrepresentation of these genes in our set of Pi starvation genes
induced two-fold or more (.44% vs. a predicted 9%) (Table 2). A
large proportion of these general stress-induced genes responsive
to Pi starvation show reduced expression in the Pi-starved phr1 phl1
double mutant (,70%), indicating that general stress responses
associated to Pi starvation are controlled by PHR1(-like) TF.
Direct targets of PHR1 are greatly enriched in P1BS-containing Pi starvation-induced genes
To examine direct targets of PHR1, we followed the strategy
originally described by Galaktionov and Sablowski [40,41], which
is based on the use of a transgenic phr1 mutant plants expressing
the GR:PHR1 fusion (OxGR:PHR1 phr1), whose activity is
postranslationally controlled by DEX. Gene expression analysis
following DEX-mediated PHR1 activation and the concomitant
inhibition of translation with cycloheximide (CHX), which
prevents PHR1 effects on the expression of secondary targets,
will inform on PHR1 direct targets. For this study, OxGR:PHR1
phr1 and phr1 plants were grown in complete (+Pi) liquid medium
for 7 days, then transferred for 2 days to phosphate-lacking (2Pi)
medium. Plants were then supplemented with 5 mM DEX and
10 mM CHX, and incubated for 6 h before harvest. Total RNA
was isolated from 3 independent samples of OxGR:PHR1 phr1 and
phr1 plants and transcriptomic analysis was performed. Using
standard cut-off values (two-fold, FDR,0.05), 319 and 21 genes
showed increased or decreased expression in OxGR:PHR1 phr1 vs.
phr1 mutant plants, respectively. A considerable overlap was found
between the set of genes with increased expression in CHX-treated
OxGR:PHR1 phr1 plants with the set of Pi starvation-induced genes
(210 out of 319), whereas there was almost no overlap between
genes with reduced expression in CHX-treated OxGR:PHR1 phr1
plants and Pi starvation-repressed genes (1 gene; Table 3 and
Table S4). This finding indicates that PHR1 is a bona fide
Figure 3. DNA-binding and dimerisation properties of PHL1. (A)Diagram showing the PHR1 and PHL1 proteins, including MYB (black)and the predicted coiled-coil domains (grey), indicating the start of theN-terminally truncated versions of PHR1 (medium-length PHR1, R1-M;short PHR1, R1-S) and PHL1 (medium-length PHL1, L1-M; short PHL1,L1-S) used (left). The core sequence of the oligonucleotide containingthe PHR1 binding sequence (P1BS) and the mutated version (P1BS mut)are shown (right). (B) EMSA showing binding to P1BS, but not to itsmutant version, of N-terminal forms of PHL1. (C) PHL1 dimerisationdetermined by EMSA with the two N-terminally truncated versions ofPHL1 and PHR1. Proteins were translated in vitro alone or incombination. Arrows show the position of the homodimers formedwith short (closed arrows) and medium-length proteins (open arrows);asterisks show the position of homo- or heterodimers formed by thecombination of short and medium-length proteins. A mock translationmixture (Mock) was used as control.doi:10.1371/journal.pgen.1001102.g003
Central Regulators of a Plant Stress Response
PLoS Genetics | www.plosgenetics.org 5 September 2010 | Volume 6 | Issue 9 | e1001102

transcriptional activator and that PHR1 control of Pi starvation-
repressed genes is indirect.
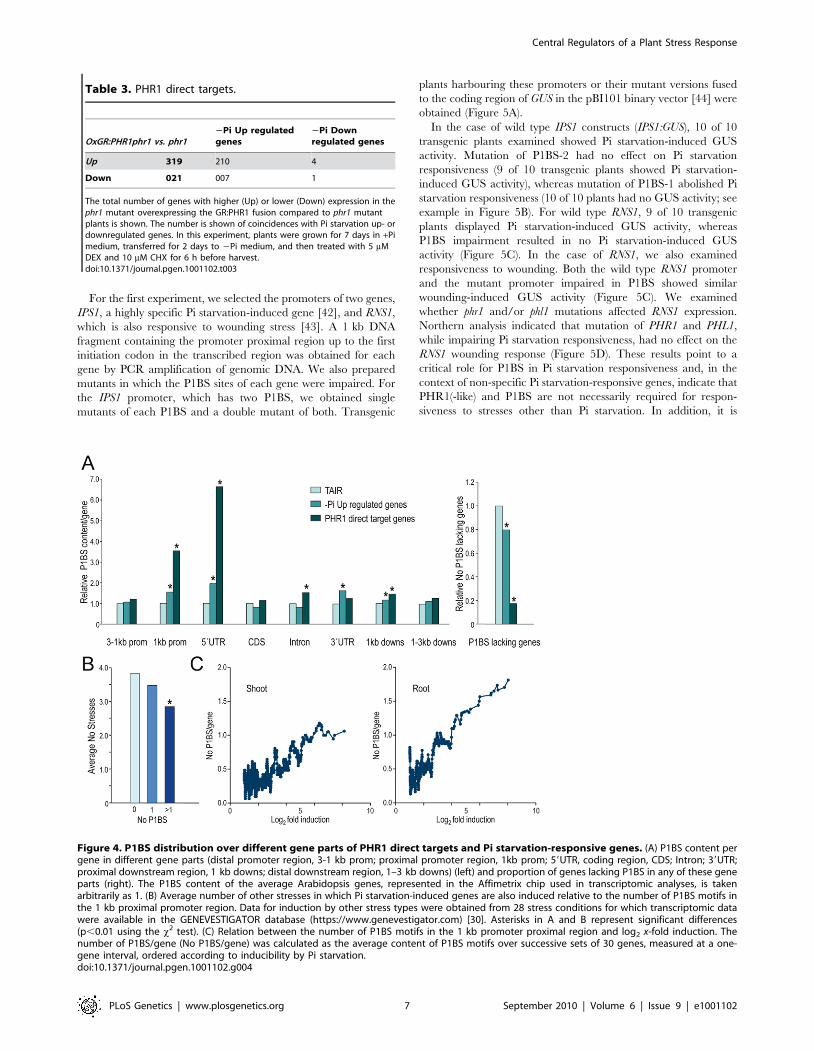
To substantiate the conclusion that PHR1 control of Pi
starvation-repressed genes is indirect, we tested for P1BS in
different parts of the Pi starvation-responsive genes and in PHR1
direct targets. Direct targets were enriched in P1BS sequences in
all parts of the gene compared to average Arabidopsis genes. As a
result, only 3% of PHR1 direct targets did not have a P1BS site in
the region encompassing 3 kb of the promoter region to 3 kb
downstream, compared to 17% for average Arabidopsis genes.
Enrichment was especially high in the 1 kb proximal promoter
region and even higher in the 59UTR. Although the 39UTR of
direct targets was only weakly enriched in P1BS sequences, P1BS
was significantly enriched in the 39UTR of the whole set of Pi
starvation-induced genes (Figure 4 and Table S5).
We next tested whether specificity of Pi starvation inducibility
correlated with P1BS content in the promoter. We examined the
average number of other stresses in which Pi starvation-induced
genes are also induced relative to the presence of none, one, or
more than one P1BS in the 1 kb proximal promoter region,
59UTR, 39UTR, introns or 1 kb proximal downstream region, or
in any combination of these, in which the set of Pi starvation-
induced genes and/or PHR1 direct targets showed a significantly
higher P1BS levels compared to average Arabidopsis genes
(Figure 4A and Table S5). P1BS content in the proximal promoter
region, the 59UTR or introns was associated with slightly higher
specificity of Pi starvation-responsiveness; however, the difference
in specificity was insufficient to ascribe specificity to the class of
genes containing P1BS (Figure 4B and Figure S8A).
We examined whether genes with P1BS in their promoters,
59UTR, 39UTR, introns and the 1 kb downstream region were
induced at a higher level by Pi starvation. Analysis of P1BS
representation relative to the x-fold induction showed a striking
correlation between inducibility and P1BS content in the 1 kb
proximal promoter region, whereas P1BS content in other gene
regions showed no correlation with inducibility (Figure 4C and
Figure S8B).
The P1BS sequence is a key cis-regulatory motif in Pistarvation signalling
To confirm the importance of P1BS as key cis-regulatory motifs
in Pi starvation signalling, we performed two types of experiments:
i) evaluation of the effect of P1BS mutation on Pi starvation-
responsive genes and ii) analysis of Pi starvation responsiveness
mediated by a minimal promoter containing multimerised P1BS.
Table 1. Transcriptomic responses to Pi starvation and effect of phr1 and phl1 mutations.
Reduced expression in Pi-starved mutants vs. wt Increased expression in Pi-starved mutants vs. wt
phr1 phr1 phl1 phr1 phr1 phl1
wt FDR,0.05 No of genes26FDR,0.05
1.56FDR,0.1
26FDR,0.05
1.56FDR,0.1
26FDR,0.05
1.56FDR,0.1
26FDR,0.05
1.56FDR,0.1
Shoot Up 26 1873 57.1 73.9 68.1 81.5 1.5 2.8 1.4 1.9
46 656 82.8 87.8 89.2 93.1 0.9 1.1 0.6 0.9
Root Up 26 704 22.0 39.1 46.9 62.5 2.6 4.3 2.0 4.3
46 184 42.4 60.9 78.8 83.7 0.5 2.7 1.1 1.6
Increased expression in Pi-starved mutants vs.wt Reduced expression in Pi-starved mutants vs. wt
phr1 phr1-phl1 phr1 phr1-phl1
wt FDR,0.05 No of genes26FDR,0.05
1.56FDR,0.1
26FDR,0.05
1.56FDR,0.1
26FDR,0.05
1.56FDR,0.1
26FDR,0.05
1.56FDR,0.1
Shoot Down 26 1795 41.7 60.2 49.9 69.5 0.8 1.4 0.8 1.2
46 215 61.9 73.0 69.3 80.5 0.0 0.0 0.0 0.0
Root Down 26 326 25.2 34.4 37.1 46.0 1.5 3.1 2.5 5.5
46 65 49.2 53.8 47.7 52.3 3.1 9.2 6.2 9.2
Total number of Pi starvation-induced (Up) and -repressed (Down) genes in wild type shoots and roots. The percentage is indicated of these Pi starvation-responsivegenes that show reduced or increased expression in Pi-starved single phr1 and double phr1 phl1 mutants. Analysis was done using two different cut-off values for Pistarvation-responsive genes in wild type (two-fold (26) and four-fold (46), FDR,0.05) and in mutants (26, FDR,0.05; 1.5-fold (1.56), FDR,0.1).doi:10.1371/journal.pgen.1001102.t001
Table 2. Pi starvation responsiveness of general stress response (GSR) genes and their control by PHR1(-like).
Experiment No GSR genes PSI-GSR genes % PSI-GSR genes affected in phr1 phl1
Ma and Bohnert (2007) 277 127 67.2
Walley et al. (2007) 161 069 75.4
The number of GSR genes reported in two previous studies [4,5], as well as the number of GSR genes induced by Pi starvation (PSI-GSR; cut-off value 26, FDR,0.05) isgiven. The number is also shown of Pi starvation-induced GSR genes that display lower expression after Pi starvation in phr1 phl1 double mutant versus wild type plants(cut-off value 1.56, FDR,0.1).doi:10.1371/journal.pgen.1001102.t002
Central Regulators of a Plant Stress Response
PLoS Genetics | www.plosgenetics.org 6 September 2010 | Volume 6 | Issue 9 | e1001102
For the first experiment, we selected the promoters of two genes,
IPS1, a highly specific Pi starvation-induced gene [42], and RNS1,
which is also responsive to wounding stress [43]. A 1 kb DNA
fragment containing the promoter proximal region up to the first
initiation codon in the transcribed region was obtained for each
gene by PCR amplification of genomic DNA. We also prepared
mutants in which the P1BS sites of each gene were impaired. For
the IPS1 promoter, which has two P1BS, we obtained single
mutants of each P1BS and a double mutant of both. Transgenic
plants harbouring these promoters or their mutant versions fused
to the coding region of GUS in the pBI101 binary vector [44] were
obtained (Figure 5A).
In the case of wild type IPS1 constructs (IPS1:GUS), 10 of 10
transgenic plants examined showed Pi starvation-induced GUS
activity. Mutation of P1BS-2 had no effect on Pi starvation
responsiveness (9 of 10 transgenic plants showed Pi starvation-
induced GUS activity), whereas mutation of P1BS-1 abolished Pi
starvation responsiveness (10 of 10 plants had no GUS activity; see
example in Figure 5B). For wild type RNS1, 9 of 10 transgenic
plants displayed Pi starvation-induced GUS activity, whereas
P1BS impairment resulted in no Pi starvation-induced GUS
activity (Figure 5C). In the case of RNS1, we also examined
responsiveness to wounding. Both the wild type RNS1 promoter
and the mutant promoter impaired in P1BS showed similar
wounding-induced GUS activity (Figure 5C). We examined
whether phr1 and/or phl1 mutations affected RNS1 expression.
Northern analysis indicated that mutation of PHR1 and PHL1,
while impairing Pi starvation responsiveness, had no effect on the
RNS1 wounding response (Figure 5D). These results point to a
critical role for P1BS in Pi starvation responsiveness and, in the
context of non-specific Pi starvation-responsive genes, indicate that
PHR1(-like) and P1BS are not necessarily required for respon-
siveness to stresses other than Pi starvation. In addition, it is
Table 3. PHR1 direct targets.
OxGR:PHR1phr1 vs. phr12Pi Up regulatedgenes
2Pi Downregulated genes
Up 319 210 4
Down 021 007 1
The total number of genes with higher (Up) or lower (Down) expression in thephr1 mutant overexpressing the GR:PHR1 fusion compared to phr1 mutantplants is shown. The number is shown of coincidences with Pi starvation up- ordownregulated genes. In this experiment, plants were grown for 7 days in +Pimedium, transferred for 2 days to 2Pi medium, and then treated with 5 mMDEX and 10 mM CHX for 6 h before harvest.doi:10.1371/journal.pgen.1001102.t003
Figure 4. P1BS distribution over different gene parts of PHR1 direct targets and Pi starvation-responsive genes. (A) P1BS content pergene in different gene parts (distal promoter region, 3-1 kb prom; proximal promoter region, 1kb prom; 59UTR, coding region, CDS; Intron; 39UTR;proximal downstream region, 1 kb downs; distal downstream region, 1–3 kb downs) (left) and proportion of genes lacking P1BS in any of these geneparts (right). The P1BS content of the average Arabidopsis genes, represented in the Affimetrix chip used in transcriptomic analyses, is takenarbitrarily as 1. (B) Average number of other stresses in which Pi starvation-induced genes are also induced relative to the number of P1BS motifs inthe 1 kb proximal promoter region. Data for induction by other stress types were obtained from 28 stress conditions for which transcriptomic datawere available in the GENEVESTIGATOR database (https://www.genevestigator.com) [30]. Asterisks in A and B represent significant differences(p,0.01 using the x2 test). (C) Relation between the number of P1BS motifs in the 1 kb promoter proximal region and log2 x-fold induction. Thenumber of P1BS/gene (No P1BS/gene) was calculated as the average content of P1BS motifs over successive sets of 30 genes, measured at a one-gene interval, ordered according to inducibility by Pi starvation.doi:10.1371/journal.pgen.1001102.g004
Central Regulators of a Plant Stress Response
PLoS Genetics | www.plosgenetics.org 7 September 2010 | Volume 6 | Issue 9 | e1001102

evident from the case of IPS1 that not all P1BS motifs in a
promoter are equally relevant for Pi starvation responsiveness.
Other architectural determinants such as nucleosome positioning
and P1BS organisation with respect to additional cis motifs might
determine P1BS function.
To analyse the capacity of P1BS to mediate Pi starvation
responsiveness, we fused four tandem copies of P1BS to the 246
minimal 35S promoter from CaMV (4xP1BS:GUS) [45]. Trans-
genic plants harbouring this construct were fully responsive to Pi
starvation (9 of 10 independent lines). We chose one of these lines
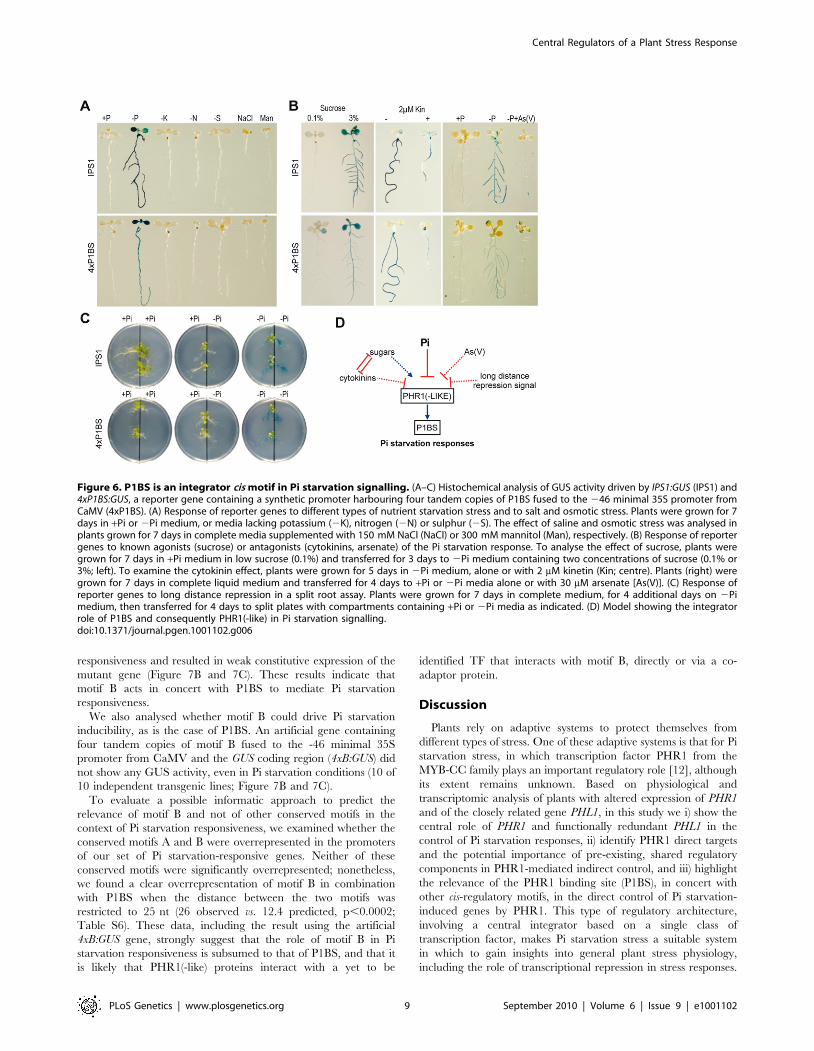
to study the specificity of Pi starvation responsiveness and the
effect of known agonists (sucrose) [46–48] or antagonists
(cytokinins and arsenate) [39,46,49]. As in the case of IPS1:GUS,
the 4xP1BS:GUS construct was highly responsive to Pi starvation,
but not to other types of stress (nitrogen, potassium and sulphur
starvation, and salt and osmotic stress); in addition, it was
responsive to the stimulatory effects of sucrose and the repressing
effect of arsenate and cytokinins (Figure 6A and 6B).
Systemic repression is a characteristic type of control in
nutrient physiology; it stands for the fact that most responses to
nutritional deficiency are determined by shoot nutritional status
rather than by the local nutrient concentration in the vicinity of
the root system [50]. To evaluate whether systemic repression is
signalled through P1BS, we used a split root assay in which part
of the root system of Pi-starved plants was placed in Pi-lacking
medium and the other part in Pi-rich medium. GUS activity was
not detected in the Pi-lacking parts of the roots in the split root
assay (Figure 6C). These results define P1BS and, consequently,
PHR1(-like) TF as central integrators in Pi starvation signalling
(Figure 6D).
Phylogenetic footprinting shows combinatorial action ofP1BS in Pi starvation responsiveness of wild typepromoters
To examine whether P1BS sequences are sufficient in the
context of a natural promoter to mediate Pi starvation respon-
siveness, we performed phylogenetic footprinting analysis to search
for conserved cis-regulatory regions that could be relevant in the
control of gene expression. For this analysis, we examined the
promoter of the highly specific Pi starvation- responsive IPS1 gene.
Using oligo-adapted PCR amplification with a conserved region of
IPS1, we amplified fragments containing the promoter region of
orthologous genes from four different Brassicaceae species (Figure
S9). Sequence alignment showed two highly conserved regions,
spanning from nt 2626 to 2527 and from nt 2280 to 2109 from
the first ATG in the transcribed region of IPS1 (Figure S9). As this
analysis did not provide sufficient resolution to identify cis-
regulatory motifs, we included At4 in the alignment, as it is also
responsive to Pi starvation and is the most closely related IPS1
homologue in Arabidopsis [25]; we thus delimited the candidates
for cis-regulatory sequences to six short motifs (motifs A to E and
P1BS1; Figure 7 and Figure S9). Further inspection of additional
members of the family in Arabidopsis and other species such as
tomato, medicago, maize and poplar showed that two of these six
conserved motifs were also conserved outside the Brassicaceae family
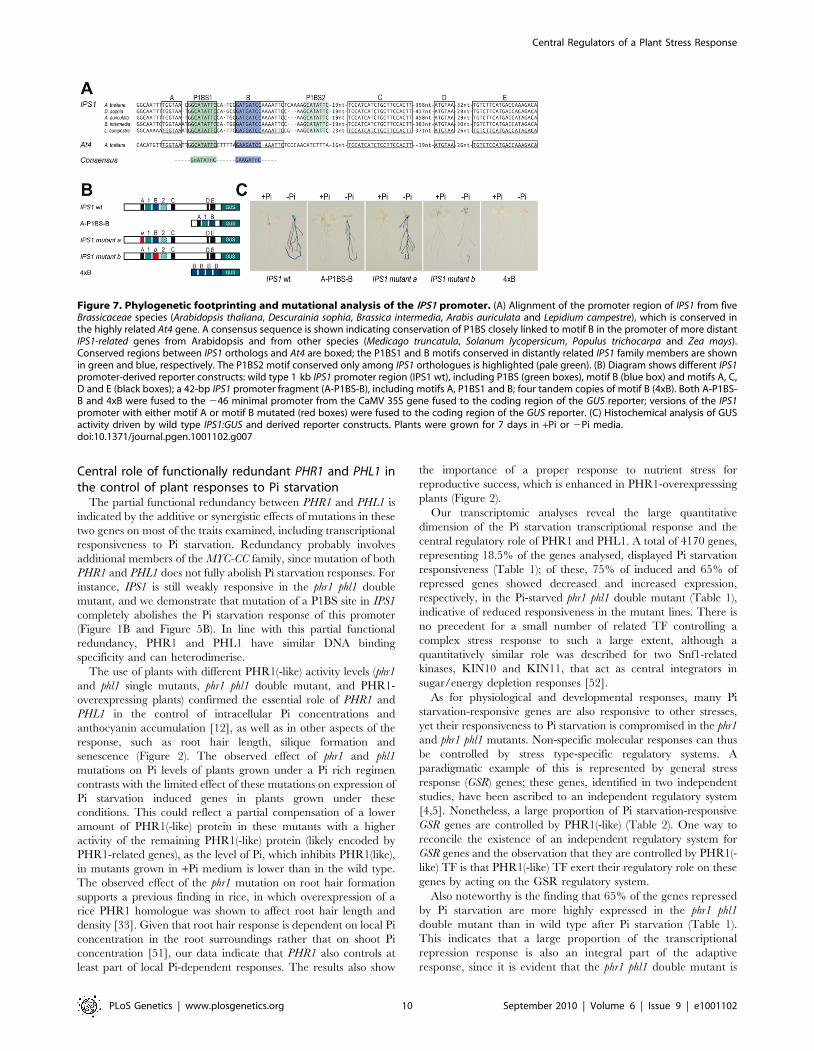
(P1BS1 and B motifs; Figure 7A). Fusion of the region
encompassing motifs A-P1BS-B to the 246 minimal 35S promoter
(A-P1BS-B:GUS) showed that this region is sufficient to mediate Pi
starvation responsiveness of a GUS reporter gene (Figure 7B and
7C). Mutational analyses indicated that whereas impairment of
motif A had no effect, mutation of motif B abolished Pi starvation
Figure 5. P1BS is a key cis-regulatory motif in Pi starvation responsiveness. (A) Diagram shows IPS1:GUS and RNS1:GUS reporter genes andmutated versions thereof. The P1BS motifs in each gene are highlighted with a vertical bar (wild type, black; mutant, red). (B,C) Histochemical analysisof GUS activity driven by wild type and mutated versions of the IPS1:GUS reporter gene in plants grown in +Pi or 2Pi media (B), or driven by wild-typeand a mutated version of the RNS1:GUS reporter gene in plants grown in +Pi and +Pi media after wounding (C). (D) Northern analysis of RNS1 geneexpression in wild type and phr1, phl1, and phr1 phl1 mutants in response to Pi starvation or wounding. Ethidium bromide-stained rRNA was used asloading control. For the Pi starvation experiment, plants were grown for 7 days in +Pi or 2Pi media and RNA prepared from shoots. For the woundingexperiment, plants were grown for 14 days, and wounded and unwounded control leaves were harvested for histochemical analysis of GUS activityand for RNA isolation 8 h after wounding.doi:10.1371/journal.pgen.1001102.g005
Central Regulators of a Plant Stress Response
PLoS Genetics | www.plosgenetics.org 8 September 2010 | Volume 6 | Issue 9 | e1001102
responsiveness and resulted in weak constitutive expression of the
mutant gene (Figure 7B and 7C). These results indicate that
motif B acts in concert with P1BS to mediate Pi starvation
responsiveness.
We also analysed whether motif B could drive Pi starvation
inducibility, as is the case of P1BS. An artificial gene containing
four tandem copies of motif B fused to the -46 minimal 35S
promoter from CaMV and the GUS coding region (4xB:GUS) did
not show any GUS activity, even in Pi starvation conditions (10 of
10 independent transgenic lines; Figure 7B and 7C).
To evaluate a possible informatic approach to predict the
relevance of motif B and not of other conserved motifs in the
context of Pi starvation responsiveness, we examined whether the
conserved motifs A and B were overrepresented in the promoters
of our set of Pi starvation-responsive genes. Neither of these
conserved motifs were significantly overrepresented; nonetheless,
we found a clear overrepresentation of motif B in combination
with P1BS when the distance between the two motifs was
restricted to 25 nt (26 observed vs. 12.4 predicted, p,0.0002;
Table S6). These data, including the result using the artificial
4xB:GUS gene, strongly suggest that the role of motif B in Pi
starvation responsiveness is subsumed to that of P1BS, and that it
is likely that PHR1(-like) proteins interact with a yet to be
identified TF that interacts with motif B, directly or via a co-
adaptor protein.
Discussion
Plants rely on adaptive systems to protect themselves from
different types of stress. One of these adaptive systems is that for Pi
starvation stress, in which transcription factor PHR1 from the
MYB-CC family plays an important regulatory role [12], although
its extent remains unknown. Based on physiological and
transcriptomic analysis of plants with altered expression of PHR1
and of the closely related gene PHL1, in this study we i) show the
central role of PHR1 and functionally redundant PHL1 in the
control of Pi starvation responses, ii) identify PHR1 direct targets
and the potential importance of pre-existing, shared regulatory
components in PHR1-mediated indirect control, and iii) highlight
the relevance of the PHR1 binding site (P1BS), in concert with
other cis-regulatory motifs, in the direct control of Pi starvation-
induced genes by PHR1. This type of regulatory architecture,
involving a central integrator based on a single class of
transcription factor, makes Pi starvation stress a suitable system
in which to gain insights into general plant stress physiology,
including the role of transcriptional repression in stress responses.
Figure 6. P1BS is an integrator cis motif in Pi starvation signalling. (A–C) Histochemical analysis of GUS activity driven by IPS1:GUS (IPS1) and4xP1BS:GUS, a reporter gene containing a synthetic promoter harbouring four tandem copies of P1BS fused to the 246 minimal 35S promoter fromCaMV (4xP1BS). (A) Response of reporter genes to different types of nutrient starvation stress and to salt and osmotic stress. Plants were grown for 7days in +Pi or 2Pi medium, or media lacking potassium (2K), nitrogen (2N) or sulphur (2S). The effect of saline and osmotic stress was analysed inplants grown for 7 days in complete media supplemented with 150 mM NaCl (NaCl) or 300 mM mannitol (Man), respectively. (B) Response of reportergenes to known agonists (sucrose) or antagonists (cytokinins, arsenate) of the Pi starvation response. To analyse the effect of sucrose, plants weregrown for 7 days in +Pi medium in low sucrose (0.1%) and transferred for 3 days to 2Pi medium containing two concentrations of sucrose (0.1% or3%; left). To examine the cytokinin effect, plants were grown for 5 days in 2Pi medium, alone or with 2 mM kinetin (Kin; centre). Plants (right) weregrown for 7 days in complete liquid medium and transferred for 4 days to +Pi or 2Pi media alone or with 30 mM arsenate [As(V)]. (C) Response ofreporter genes to long distance repression in a split root assay. Plants were grown for 7 days in complete medium, for 4 additional days on 2Pimedium, then transferred for 4 days to split plates with compartments containing +Pi or 2Pi media as indicated. (D) Model showing the integratorrole of P1BS and consequently PHR1(-like) in Pi starvation signalling.doi:10.1371/journal.pgen.1001102.g006
Central Regulators of a Plant Stress Response
PLoS Genetics | www.plosgenetics.org 9 September 2010 | Volume 6 | Issue 9 | e1001102
Central role of functionally redundant PHR1 and PHL1 inthe control of plant responses to Pi starvation
The partial functional redundancy between PHR1 and PHL1 is
indicated by the additive or synergistic effects of mutations in these
two genes on most of the traits examined, including transcriptional
responsiveness to Pi starvation. Redundancy probably involves
additional members of the MYC-CC family, since mutation of both
PHR1 and PHL1 does not fully abolish Pi starvation responses. For
instance, IPS1 is still weakly responsive in the phr1 phl1 double
mutant, and we demonstrate that mutation of a P1BS site in IPS1
completely abolishes the Pi starvation response of this promoter
(Figure 1B and Figure 5B). In line with this partial functional
redundancy, PHR1 and PHL1 have similar DNA binding
specificity and can heterodimerise.
The use of plants with different PHR1(-like) activity levels (phr1
and phl1 single mutants, phr1 phl1 double mutant, and PHR1-
overexpressing plants) confirmed the essential role of PHR1 and
PHL1 in the control of intracellular Pi concentrations and
anthocyanin accumulation [12], as well as in other aspects of the
response, such as root hair length, silique formation and
senescence (Figure 2). The observed effect of phr1 and phl1
mutations on Pi levels of plants grown under a Pi rich regimen
contrasts with the limited effect of these mutations on expression of
Pi starvation induced genes in plants grown under these
conditions. This could reflect a partial compensation of a lower
amount of PHR1(-like) protein in these mutants with a higher
activity of the remaining PHR1(-like) protein (likely encoded by
PHR1-related genes), as the level of Pi, which inhibits PHR1(like),
in mutants grown in +Pi medium is lower than in the wild type.
The observed effect of the phr1 mutation on root hair formation
supports a previous finding in rice, in which overexpression of a
rice PHR1 homologue was shown to affect root hair length and
density [33]. Given that root hair response is dependent on local Pi
concentration in the root surroundings rather that on shoot Pi
concentration [51], our data indicate that PHR1 also controls at
least part of local Pi-dependent responses. The results also show
the importance of a proper response to nutrient stress for
reproductive success, which is enhanced in PHR1-overexpresssing
plants (Figure 2).
Our transcriptomic analyses reveal the large quantitative
dimension of the Pi starvation transcriptional response and the
central regulatory role of PHR1 and PHL1. A total of 4170 genes,
representing 18.5% of the genes analysed, displayed Pi starvation
responsiveness (Table 1); of these, 75% of induced and 65% of
repressed genes showed decreased and increased expression,
respectively, in the Pi-starved phr1 phl1 double mutant (Table 1),
indicative of reduced responsiveness in the mutant lines. There is
no precedent for a small number of related TF controlling a
complex stress response to such a large extent, although a
quantitatively similar role was described for two Snf1-related
kinases, KIN10 and KIN11, that act as central integrators in
sugar/energy depletion responses [52].
As for physiological and developmental responses, many Pi
starvation-responsive genes are also responsive to other stresses,
yet their responsiveness to Pi starvation is compromised in the phr1
and phr1 phl1 mutants. Non-specific molecular responses can thus
be controlled by stress type-specific regulatory systems. A
paradigmatic example of this is represented by general stress
response (GSR) genes; these genes, identified in two independent
studies, have been ascribed to an independent regulatory system
[4,5]. Nonetheless, a large proportion of Pi starvation-responsive
GSR genes are controlled by PHR1(-like) (Table 2). One way to
reconcile the existence of an independent regulatory system for
GSR genes and the observation that they are controlled by PHR1(-
like) TF is that PHR1(-like) TF exert their regulatory role on these
genes by acting on the GSR regulatory system.
Also noteworthy is the finding that 65% of the genes repressed
by Pi starvation are more highly expressed in the phr1 phl1
double mutant than in wild type after Pi starvation (Table 1).
This indicates that a large proportion of the transcriptional
repression response is also an integral part of the adaptive
response, since it is evident that the phr1 phl1 double mutant is
Figure 7. Phylogenetic footprinting and mutational analysis of the IPS1 promoter. (A) Alignment of the promoter region of IPS1 from fiveBrassicaceae species (Arabidopsis thaliana, Descurainia sophia, Brassica intermedia, Arabis auriculata and Lepidium campestre), which is conserved inthe highly related At4 gene. A consensus sequence is shown indicating conservation of P1BS closely linked to motif B in the promoter of more distantIPS1-related genes from Arabidopsis and from other species (Medicago truncatula, Solanum lycopersicum, Populus trichocarpa and Zea mays).Conserved regions between IPS1 orthologs and At4 are boxed; the P1BS1 and B motifs conserved in distantly related IPS1 family members are shownin green and blue, respectively. The P1BS2 motif conserved only among IPS1 orthologues is highlighted (pale green). (B) Diagram shows different IPS1promoter-derived reporter constructs: wild type 1 kb IPS1 promoter region (IPS1 wt), including P1BS (green boxes), motif B (blue box) and motifs A, C,D and E (black boxes); a 42-bp IPS1 promoter fragment (A-P1BS-B), including motifs A, P1BS1 and B; four tandem copies of motif B (4xB). Both A-P1BS-B and 4xB were fused to the 246 minimal promoter from the CaMV 35S gene fused to the coding region of the GUS reporter; versions of the IPS1promoter with either motif A or motif B mutated (red boxes) were fused to the coding region of the GUS reporter. (C) Histochemical analysis of GUSactivity driven by wild type IPS1:GUS and derived reporter constructs. Plants were grown for 7 days in +Pi or 2Pi media.doi:10.1371/journal.pgen.1001102.g007
Central Regulators of a Plant Stress Response
PLoS Genetics | www.plosgenetics.org 10 September 2010 | Volume 6 | Issue 9 | e1001102
more sensitive to Pi starvation, as it cannot mount a correct
response (Figure 2B).
Direct and indirect control of the molecular response toPi starvation by PHR1(-like) TF
Here we show that PHR1(-like) regulation of Pi starvation-
responsive genes involves both direct and indirect control. Direct
control is essentially exerted on induced genes containing the
P1BS (GNATATNC) sequence [12], whereas transcriptional
repression is essentially indirect. Indeed, it can be noted that
genes identified as direct targets (in which activation is
independent of protein translation) are highly enriched in Pi
starvation-induced genes containing P1BS sequences in different
parts of the gene, particularly in the promoter proximal region and
even to a higher extent in the 59UTR. This indicates that PHR1
acts most prominently as a transcriptional activator, and that
control of transcriptional repression is mostly, if not completely
indirect (e.g., via activation of a transcriptional repressor). A large
proportion of the Pi starvation-induced genes (more than 70%) are
also probably controlled indirectly by PHR1, since only about
30% of Pi starvation-induced genes have a P1BS motif in their
promoter proximal region, 59UTR or 39UTR, where P1BS
content is significantly higher than in an average Arabidopsis gene.
Another finding is the strong association between P1BS content
in the promoter and the degree of Pi starvation inducibility
(Figure 4). It is interesting that although other regions are also
P1BS-enriched, particularly the 59UTR, but also the 39UTR,
introns and 1 kb proximal downstream region of Pi starvation-
responsive genes, P1BS content in these regions does not correlate
with inducibility. This suggests that the role of P1BS differs
qualitatively in these regions compared to its role in the promoter.
The correlation between P1BS content in the promoter and
gene inducibility is not strict, however; for IPS1, we show that one
of the P1BS motifs in its promoter is in fact dispensable for Pi
starvation responsiveness. In any case, the higher P1BS content of
highly upregulated genes suggests that bioinformatic searches for
stimulus-specific cis-regulatory motifs will be more efficient if
performed in highly responsive genes.
Taken together, these observations suggest a simple evolution-
ary path to construct a complex adaptive response to a specific
stress type, under the control of a central regulatory system. Our
data are in agreement with a central regulator that controls pre-
existing, shared genetic networks by acting on the regulators of
those networks, as it is probably the case of GSR genes, rather than
on each individual gene. In line with this idea, we found that in
most cases, TF genes and non-TF genes are equally over-
represented in the sets of genes responsive to Pi starvation and to
any other type of stress (Table S3); we would predict under-
representation of TF genes if shared genes were exclusively
controlled by independent stress type-specific regulators. Genes for
which the transcription rate obtained via this indirect route was
insufficient, as could be the case of RNS1 (see below), might have
been recruited under the direct control of the central regulator,
similar to the situation in Pi starvation-specific networks.
Importance of P1BS cis-regulatory element as anintegrator in the response to Pi starvation: concertedaction in vivo with other cis-regulatory motifs
Here we demonstrate the key importance of P1BS in Pi
starvation gene inducibility, reinforcing the importance of PHR1.
In addition to the fact that P1BS is overrepresented in phosphate
starvation-induced genes, as shown here and elsewhere [9,11],
P1BS is highly conserved in a Pi starvation-responsive gene (IPS1).
Mutation of critical P1BS motifs in promoters of Pi-responsive
genes abolishes Pi starvation responsiveness in dicots and
monocots (Figure 5) [53], and a minimal promoter containing
four tandem copies of P1BS is specifically responsive to Pi
starvation (Figure 6).
The fact that a minimal promoter containing P1BS specifically
responds to Pi starvation allowed us to examine the effect of
several modulators of the Pi starvation response, and to show that
this element can recapitulate Pi starvation-specific responsiveness
(Figure 6); this includes the effect of all the best known modulators
of this response, such as sugars, cytokinins, arsenate and long
distance systemic repression [11,46–50]. These data qualifys P1BS
and, consequently, PHR1(-like) TF as central integrators of the Pi
starvation response (Figure 6D).
By analysing the function of a promoter responsive to Pi
starvation and wounding (RNS1) [43], we show that the P1BS
motif is necessary only for Pi starvation responsiveness and not for
responsiveness to other types of stress. Conversely, mutation of
PHR1 and PHL1 affect only RNS1 responsiveness to Pi starvation
and not to other stress types (Figure 5). Independent multisignal
responsiveness can thus also be attained through independent cis
motifs in the promoter.
Although our data indicate the importance of P1BS as a Pi
starvation response cis motif, we also show that P1BS function is
dependent on sequence context, and that P1BS alone is insufficient
to drive Pi starvation responsiveness in the context of a natural
promoter such as that of IPS1 (Figure 5 and Figure 7). Indeed, our
phylogenetic and mutational analysis of IPS1 identified a second
motif, motif B (GAWGATNC), necessary for correct Pi starvation
responsiveness of IPS1. The conditional overrepresentation of
motif B, dependent on the presence of P1BS (Table S6), and the
finding that motif B is unable to drive Pi starvation responsiveness
strengthens the idea that PHR1 and P1BS represent a central
integrator module in Pi starvation responsiveness.
ConclusionsThe results of this study show that PHR1 and a functionally
related member of its family comprise a central integrator system
for the Pi starvation response. Pi limitation is a common condition
in many natural soils, which implies that selective pressure against
this stress has been very strong throughout evolution, underlining
the adaptive value of this simple regulatory system of such a
complex response. A consequence of our finding that a single TF
family largely controls a stress response is that transcriptionally
overlapping programs in response to different stress types can
ultimately be controlled by independent regulatory systems. Such
systems act indirectly, using (pre-existing) shared regulatory
components in many targets, and directly on the remaining small
proportion of target genes on average highly enriched in P1BS.
The finding that the 59UTR of PHR1 primary targets and of Pi
starvation induced genes shows the highest overrepresentation in
P1BS sequences, raises the possibility of an important role of this
region in transcriptional control, in addition to its most commonly
associated role in translational control. The fact that a large
proportion of the transcriptionally repressed genes are controlled
by PHR1(-like) TF indicates that transcriptional repression is an
integral part of the Pi starvation response, and not merely a
consequence of plant malfunction under stress.
Materials and Methods
Plant material and growth conditionsAll Arabidopsis thaliana plants used in this study, including
mutants and transgenic plants, were on the Columbia (Col-0)
Central Regulators of a Plant Stress Response
PLoS Genetics | www.plosgenetics.org 11 September 2010 | Volume 6 | Issue 9 | e1001102

background. phl1 was obtained from the SAIL collection
(SAIL_731_B09) [54]. Growth conditions and the complete
Johnson medium containing 2 mM Pi (KH2PO4) and 2% sucrose
were as described [22,55]. For specific experiments, the concen-
tration of Pi, sucrose, kinetine or arsenate (NaH2AsO4?7H2O) is
indicated.
Physiological measurementsAnthocyanin was extracted from rosettes of plants grown on Pi-
lacking medium supplemented with 5 mM DEX for 12 days.
Anthocyanin content was measured as described [56]. The
method of Ames [57] was used to determine the cellular phosphate
content of seedlings grown on complete medium for 12 days
(supplemented with 5 mM DEX when specified). Mean values
were compared using Student’s t-test.
Constructs for expression in plants and planttransformation
Plants were transformed by the vacuum infiltration method
[58]. Routine molecular work was performed as described [12,59],
except where indicated. Sequences of primers used for PCR
amplification and construction of genomic DNA/cDNA fragments
are given in Table S7.
A NcoI-SpeI fragment containing the ORF of PHR1 was
amplified by PCR from the PHR1 cDNA [12] purified and
digested with NcoI and SpeI. This fragment was introduced into the
binary vector pBHAGR, which contains the CaMV 35S
promoter, the 3xHA epitope and a fragment of the rat
glucocorticoid receptor (GR) cDNA encoding the receptor-
binding domain, generating the recombinant expression cassette
35S:HA:GR:PHR1 (pBHAGRPHR1). The pBHAGR vector was
generated introducing a BamHI-NcoI cDNA fragment codifying for
the 277 carboxy-terminal amino acids of the rat glucocorticoid
receptor [60] into a binary vector pBHA kindly supplied by Dr. F.
Parcy (Institut National de la Recherche Agronomique, Grenoble,
France).
The HindIII-BamHI 1kb fragment containing the IPS1 promot-
er and the XbaI-blunt 1kb fragment containing the RNS1 promoter
were amplified by PCR. The mutated promoter sequences were
generated as overlapping PCR products using semi-complemen-
tary primers with the mutated sequences. The PCR products were
purified, digested with HindIII-BamHI (IPS1) or XbaI (RNS1) and
inserted between HindIII-BamHI or XbaI-SmaI sites into the
pBI101 vector [44].
The four tandem copies of P1BS (4xP1BS:GUS), the B motif
(4xB:GUS) constructs, and the 42bp IPS1 promoter fragment (A-
P1BS-B:GUS) were generated by annealing semi-complementary
primers, resulting in DNA fragments with HindIII and XbaI
overhangs. The over-hanged DNA fragments were inserted
between HindIII and XbaI sites at the 59 end of a minimal 35S
promoter in the pTi0046 plasmid. The pTi0046 plasmid contains
a 246bp truncated version of the CaMV 35S promoter [45] into
the BamHI site of the pBI101 vector.
Real-Time PCRQuantitative PCR (Q-RT-PCR) was performed on three
independent biological samples as described [61]. The pairs of
primers used are described in Table S7.
Protein synthesis, DNA binding reactions and EMSAanalysis
PHR1 and PHL1 deletion derivatives were generated by in vitro
translation (or cotranslation in the dimerization experiments) using
the TnT T7 Quick System for PCR DNA (Promega), as described
[62]. PCR and labeling of promoter fragments and oligonucleo-
tides, DNA binding reactions and EMSA were performed as
described [63].
Yeast two-hybrid assaysA cDNA fragment corresponding to a deletion derivative of
PHR1, D-PHR1, encompassing amino acid residues 208–362, that
lacks transactivation domain was cloned into the pGBKT7 (Gal4
DNA binding domain, BD; Clontech). We used this to screen a
whole seedling cDNA library prepared in the pGADT7 vector
(Gal4 activation domain, AD, Clontech) to detect PHR1-
interacting proteins. One of these was D-PHL1 (lacking amino
acids 1–60, details to be described elsewhere). To confirm protein
interactions, the plasmids were cotransformed in Saccharomyces
cerevisiae AH 109 cells following standard heat-shock protocols
[64]. Successfully transformed colonies were identified on yeast
synthetic drop-out lacking Leu and Trp; these colonies were
resuspended in 30 mM NaCl and transferred to the same media
plus b-gal or to selective media lacking Ade, His, Leu and Trp.
Plates were incubated (30uC, 2–4 days). The empty vector
pGADT7 was also cotransformed with the pGBKT7-DPHR1
construct as a negative control.
Transcriptome analyses of Pi starvation response and ofPHR1 direct targets
Transcriptomic analyses were performed using the Affymetrix
ATH1 platform. For the phosphate starvation response analysis,
wt, phr1 and phr1 phl1 plants were grown for 7 days in complete
(+Pi) or phosphate-lacking (2Pi) solid media, and roots and shoots
were processed separately. For PHR1 direct target analysis,
complete OxGR:PHR1 phr1 and phr1 plants were grown for 7 days
in +Pi liquid media, then for 2 days in 2Pi liquid media and
harvested after 6 h treatment with 5 mM DEX and 10 mM CHX.
In each experiment, RNA was isolated from three independent
biological samples using the RNeasy plant mini kit (Quiagen).
Biotin-labeled cRNA was synthesized using One-Cycle target
labelling and control reagents (Affymetrix, Santa Clara, CA) and
fragmented into 35–200 bases in length. Three replicates for each
condition were hybridized independently to the Arabidopsis
ATH1 Genome array following manufacturer’s recommendations
(Affymetrix). Each microarray was washed and stained with
streptavidin-phycoerythrin and scanned at 2.5 mm resolution in a
GeneChip Scanner 3000 7G System (Affymetrix). Data analyses
were performed using GeneChip Operating Software (GCOS) and
analyzed using the affylmGUIR package [65]. Robust Muti-array
Analysis (RMA) algorithm was used for background correction,
normalization and expression levels summarization [66]. Differ-
ential expression analysis was performed with the Bayes t-statistics
from the linear models for Microarray data (limma). P-values were
corrected for multiple-testing using the Benjamini-Hochberg
method (False Discovery Rate) [67]. Except where indicated,
genes were considered to be differentially expressed if corrected P
values were ,0.05, and only genes with a signal log ratio more
than one or less than minus one were considered for further
analysis.
Transcriptome comparisonsFor transcriptome comparisons we used microarray data for
different treatments/stresses available in the GENEVESTIGA-
TOR database (https://www.genevestigator.com) [30]. The two-
fold up- and down-regulated genes were identified by the Meta-
Analyser tool included in this platform. Transcription factor genes
Central Regulators of a Plant Stress Response
PLoS Genetics | www.plosgenetics.org 12 September 2010 | Volume 6 | Issue 9 | e1001102
for transcriptomic analysis were identified in the RARTF
Database (http://rarge.psc.riken.jp/rartf/) [68].
Mapman ontology displayAverage expression signals for the Pi starvation treatment were
expressed relative to those in complete media, converted to a log2
scale and imported into the MapMan software, which showed
values in colour scale diagrams (http://mapman.gabipd.org/web/
guest/home) [35].
Isolation of promoter regionsThe promoters regions of gene orthologs were obtained using
commercially available GenomeWalker technology (Clontech),
following manufacturer’s recommendations. Sequences of interest
were obtained by two rounds of PCR amplification using as
template the adapter-ligated genomic DNA from different
Brassicaceae species, an IPS1-specific primer and the adaptor
primer. Primary PCR was performed with seven cycles of 25 sec
at 94uC and 4 min at 72uC, followed by 32 cycles of 25 sec at
94uC and 4 min at 67uC, with a final extension of 4 min at 67uC.
Secondary PCR was performed using a 1:50 dilution of the
primary reaction product as a template and similar PCR cycling
parameters, with 5 and 22 cycles of the first and second steps,
respectively. PCR products were cloned into the pCRII-TOPO
TA system (Invitrogen). Sequences were aligned using DiAlign
(http://www.genomatix.de/cgi-bin/dialign/dialign.pl) [69].
Phylogenetic analysis of the MYB-CC familyThe analysis was performed on the Phylogeny.fr platform (www.
phylogeny.fr) [70]. Sequences were aligned with MUSCLE (v3.7)
configured for highest accuracy. After alignment, ambiguous
regions were removed with Gblocks (v0.91b). The phylogenetic
tree was reconstructed using PhyML program (v3.0 aLRT). The
default substitution model was selected assuming an estimated
proportion of invariant sites (of 0.021) and 4 gamma-distributed
rate categories to account for rate heterogeneity across sites. The
gamma shape parameter was estimated directly from the data
(gamma = 1.044). Reliability for internal branch was assessed using
the bootstrapping method (100 bootstrap replicates). The tree was
represented withTreeDyn (v198.3).
Accession NumbersArabidopsis Genome Initiative locus identifiers for the genes
mentioned in this article are At5g29000 (PHL1), At4g28610
(PHR1), At5g43350 (PHT1;1), At2g02990 (RNS1), At3g09922
(IPS1), At5g20150 (SPX1), At5g03545 (At4), At4g33030 (SQD1)
and At3g17790 (ACP5). The GenBank accession numbers for the
sequences of the proximal promoter region of IPS1 orthologs are
GQ184774 (Descurainia sophia, DsIPS1), GQ184775 (Arabis auricu-
lata, AaIPS1), GQ184776 (Brassica intermedia, BiIPS1) and
GQ184777 (Lepidium campestre, LcIPS1). The GEO accession
number for the array experiments are GSE16722 and GSE20955.
Supporting Information
Figure S1 Sequence comparison of MYB-CC family TF
members from Arabidopsis. Sequence alignment was done with
MUSCLE (v3.7) configured for highest accuracy using the
Phylogeny.fr platform (www.phylogeny.fr) [69]. In addition to
the AGI number, names are given for the functionally character-
ized members: PHOSPHATE STARVATION RESPONSE
REGULATOR 1 (PHR1) [12]; PHR1-LIKE1 (PHL1; this study)
ALTERED PHLOEM DEVELOPMENT (APL) [70]. Only
sequences of the conserved MYB (top) and coiled-coil (CC; lower
part) domains were considered. Amino acids conserved among
family members are shown (black boxes); amino acids identical to
PHR1 (grey). For each protein, the percentage of amino acid
identity to PHR1 in the MYB and CC domains is shown (right; %
aa identity).
Found at: doi:10.1371/journal.pgen.1001102.s001 (3.70 MB TIF)
Figure S2 Characterisation of phl1 insertional mutant. (A)
Scheme shows PHL1 and the site of T-DNA insertion in phl1
(top) and semiquantitative RT-PCR expression analysis of PHR1
(R1) and PHL1 (L1) in wild type (wt), and phr1 and phl1 mutants
(bottom). Plants were grown for 7 days in 2Pi media before
harvest. Oligonucleotides for PHL1 expression analyses flank the
T-DNA insertion site. (B) Northern analysis of PHR1 and PHL1
expression. Plants were grown for 7 days in +Pi or 2Pi media, and
northern blots were sequentially hybridised to the PHL1 and
PHR1 probes. (C) PHR1 and PHL1 expression at different
developmental stages according to GENEVESTIGATOR data-
base (https://www.genevestigator.com) [30].
Found at: doi:10.1371/journal.pgen.1001102.s002 (1.05 MB TIF)
Figure S3 Expression of Pi starvation induced genes on wt, phr1,
phl1 and phr1phl1 plants grown in a Pi-rich regimen. Quantitative
RT-PCR was performed on cDNA prepared from RNA
corresponding to three independent biological samples of wild
type (wt), phr1, phr1phl1 and phl1 plants grown for 7 days in Pi-rich
medium.
Found at: doi:10.1371/journal.pgen.1001102.s003 (0.44 MB TIF)
Figure S4 Northern analysis of expression of Pi starvation-
responsive genes in GR:PHR1 overexpressing lines. Wild type
(wt), phr1 and PHR1 overexpressing (OxPHR1) plants were grown
for 7 days in +Pi or 2Pi media alone or supplemented with 5 mM
DEX (+DEX). RNA from roots and shoots was isolated separately
and northern blots were sequentially hybridised to the probes
PHT1;1, IPS1, SPX1 and PHR1. Ethidium bromide-stained rRNA
was used as loading control.
Found at: doi:10.1371/journal.pgen.1001102.s004 (0.45 MB TIF)
Figure S5 Interaction of PHR1 and PHL1 proteins in the yeast
two-hybrid assay. Yeast cells co-transformed with pGBKT7-
DPHR1 (BD-PHR1), expressing a PHR1 deletion derivative
encompassing amino acid residues 208–362 fused to the GAL4
DNA-binding domain and pGADT7-DPHL1 (AD-PHL1), ex-
pressing a PHL1 deletion lacking amino acid residues 1–60, were
selected on yeast synthetic drop-out medium lacking Trp and Leu
(2WL), then transferred to the same media plus b-gal or to
selective media lacking Trp, Leu, His and Ade (2WLHA) to test
protein interactions. pGBKT7-DPHR1 cotransformation with
empty pGADT7 vector (AD) was included as a control.
Found at: doi:10.1371/journal.pgen.1001102.s005 (0.40 MB TIF)
Figure S6 Dendogram showing the distribution of genes whose
expression is altered in phr1 and phr1 phl1 versus wild type plants
grown in 2Pi medium, according to their Pi starvation
responsiveness. Arabidopsis genes represented in the ATH1
affymetix microarray were classified according to their Pi
starvation responsiveness in wild type plants. Pi starvation induced,
expression ratio in plants grown in 2Pi versus +Pi conditions.1.16;
High (.46, H), Medium (2–46, M), Low (2–1.56, L), Very Low
(1.5–1.16, VL); Non Pi starvation responsive (NR), expression
ratio in plants grown in 2Pi versus +Pi conditions between 1.1–
0.96; Pi starvation repressed, expression ratio in plants grown in
2Pi versus +Pi conditions ,0.96; High (,0.256, H), Medium
(0.25–0.56, M), Low (0.5–0.666, L), Very Low (0.66–0.96, VL).
The dendogram shows the percentage of the genes in each class
Central Regulators of a Plant Stress Response
PLoS Genetics | www.plosgenetics.org 13 September 2010 | Volume 6 | Issue 9 | e1001102

whose expression is altered by the phr1 and phr1 phl1 mutations
(26, FDR,0.05).
Found at: doi:10.1371/journal.pgen.1001102.s006 (0.48 MB TIF)
Figure S7 Differential expression of genes involved in metabo-
lism (A) and regulation (B) in the Pi starvation response. Transcript
levels in shoot (top) and root (bottom) from plants grown in 2Pi
conditions relative to those of plants grown in +Pi medium. Results
are the mean of three replicates, displayed on a log2 scale using
MapMan software [35]. Transcripts that increase and decrease are
shown by an increasingly intense blue and red colours,
respectively. A scale was selected in which values of 0.2 and 1
on a log2 scale gave faint and full saturation, respectively. The data
can be explored interactively by downloading the experimental
data files and MapMan software from http://mapman.gabipd.
org/web/guest/home [35].
Found at: doi:10.1371/journal.pgen.1001102.s007 (3.63 MB TIF)
Figure S8 Relationship between P1BS content in different parts
of Pi starvation-induced genes, and inducibility and specificity. (A)
Average number of other stresses in which Pi starvation-induced
genes are also induced, relative to the number of P1BS motifs
present in different parts of the gene. Data for induction by other
stress types were obtained from 28 stress conditions for which
transcriptomic data were available in the GENEVESTIGATOR
database (https://www.genevestigator.com) [30]. Asterisks repre-
sent significant differences (p,0.01 using the X2 test). (B) Relation
between the number of P1BS motifs in different parts of the gene
and log2 x-fold induction. The number of P1BS/gene (No P1BS/
gene) was calculated as the average content of P1BS motifs over
successive sets of 30 genes, measured at a one-gene interval,
ordered according to inducibility by Pi starvation.
Found at: doi:10.1371/journal.pgen.1001102.s008 (0.54 MB TIF)
Figure S9 Sequence comparison of the proximal promoter
regions of IPS1 orthologous genes from different Brasicaceae
species. Sequences of the proximal promoter regions of IPS1
orthologous genes from five Brassicaceae species (Arabidopsis thaliana,
AtIPS1; Descurainia sophia, DsIPS1; Arabis auriculata, AaIPS1; Brassica
intermedia, BiIPS1; Lepidium campestre, LcIPS1) were aligned using the
DiAlign software (http://www.genomatix.de/cgi-bin/dialign/dia-
lign.pl) [68]. Large-size conserved regions among IPS1 ortholo-
gues are shadowed in grey. Sequences shared with At4 are
highlighted in yellow, and relevant motifs are indicated.
Found at: doi:10.1371/journal.pgen.1001102.s009 (3.10 MB TIF)
Table S1 Transcriptomic data of the Pi starvation response in
wild type, phr1 and phr1 phl1 mutants.
Found at: doi:10.1371/journal.pgen.1001102.s010 (10.34 MB
XLS)
Table S2 Genes showing altered expression in Pi starved phr1
phl1 versus phr1.
Found at: doi:10.1371/journal.pgen.1001102.s011 (0.39 MB TIF)
Table S3 Overlaps among transcriptional responses to Pi
starvation and to other stimuli/conditions.
Found at: doi:10.1371/journal.pgen.1001102.s012 (2.36 MB TIF)
Table S4 Transcriptomic data of OxGR:PHR1 phr1 vs. phr1 in Pi
starvation conditions.
Found at: doi:10.1371/journal.pgen.1001102.s013 (3.23 MB
XLS)
Table S5 Distribution of P1BS sequences in different parts of
PHR1 direct target genes and of Pi starvation-responsive genes.
Found at: doi:10.1371/journal.pgen.1001102.s014 (1.48 MB TIF)
Table S6 Overrepresentation of closely linked P1BS and B
motifs in Pi starvation-induced genes.
Found at: doi:10.1371/journal.pgen.1001102.s015 (1.47 MB TIF)
Table S7 Primers used in this study.
Found at: doi:10.1371/journal.pgen.1001102.s016 (0.81 MB TIF)
Acknowledgments
We thank Profs. Cathie Martin, Carmen Castresana, Juan Antonio Garcia,
Phil Benfey and Salome Prat for critical reading of the manuscript, Dr. F.
Parcy for supplying pBHA, Marıa Jesus Benito for excellent technical
assistance and Catherine Mark for editorial assistance.
Author Contributions
Conceived and designed the experiments: RB GC JPA. Performed the
experiments: RB GC FL MIP JPA. Analyzed the data: RB GC JPA.
Contributed reagents/materials/analysis tools: VR JPP RS AL. Wrote the
paper: RB GC JPA.
References
1. Dixon RA, Paiva NL (1995) Stress-Induced Phenylpropanoid Metabolism. Plant
Cell 7: 1085–1097.2. Mol J, Jenkins G, Schafer E, Weiss D (1996) Signal perception, transduction,
and gene expression involved in anthocyanin. Crit Rev Plant Sci 15: 525–557.
3. Lim PO, Kim HJ, Nam HG (2007) Leaf senescence. Annu Rev Plant Biol 58:115–136.
4. Ma S, Bohnert HJ (2007) Integration of Arabidopsis thaliana stress-related
transcript profiles, promoter structures, and cell-specific expression. GenomeBiol 8: R49.
5. Walley JW, Coughlan S, Hudson ME, Covington MF, Kaspi R, et al. (2007)
Mechanical stress induces biotic and abiotic stress responses via a novel cis-element. PLoS Genet 3: 1800–1812.
6. Hammond JP, Bennett MJ, Bowen HC, Broadley MR, Eastwood DC, et al. (2003)
Changes in gene expression in Arabidopsis shoots during phosphate starvation andthe potential for developing smart plants. Plant Physiol 132: 578–596.
7. Wasaki J, Yonetani R, Kuroda S (2003) Transcriptomic analysis of metabolic
changes by phosphorus stress in rice plant roots. Plant Cell Environ 26:1515–1523.
8. Wu P, Ma L, Hou X, Wang M, Wu Y, et al. (2003) Phosphate starvation triggersdistinct alterations of genome expression in Arabidopsis roots and leaves. Plant
Physiol 132: 1260–1271.
9. Misson J, Raghothama KG, Jain A, Jouhet J, Block MA, et al. (2005) A genome-wide transcriptional analysis using Arabidopsis thaliana Affymetrix gene chips
determined plant responses to phosphate deprivation. Proc Natl Acad Sci USA
102: 11934–11939.10. Morcuende R, Bari R, Gibon Y, Zheng W, Pant BD, et al. (2007) Genome-wide
reprogramming of metabolism and regulatory networks of Arabidopsis in
response to phosphorus. Plant Cell Environ 30: 85–112.
11. Muller R, Morant M, Jarmer H, Nilsson L, Nielsen TH (2007) Genome-wide
analysis of the Arabidopsis leaf transcriptome reveals interaction of phosphateand sugar metabolism. Plant Physiol 143: 156–171.
12. Rubio V, Linhares F, Solano R, Martin AC, Iglesias J, et al. (2001) A conserved
MYB transcription factor involved in phosphate starvation signaling both invascular plants and in unicellular algae. Genes Dev 15: 2122–2133.
13. Yi K, Wu Z, Zhou J, Du L, Guo L, et al. (2005) OsPTF1, a novel transcription
factor involved in tolerance to phosphate starvation in rice. Plant Physiol 138:2087–2096.
14. Chen ZH, Nimmo GA, Jenkins GI, Nimmo HG (2007) BHLH32 modulates
several biochemical and morphological processes that respond to Pi starvation inArabidopsis. Biochem J 405: 191–198.
15. Devaiah BN, Karthikeyan AS, Raghothama KG (2007) WRKY75 transcription
factor is a modulator of phosphate acquisition and root development inArabidopsis. Plant Physiol 143: 1789–1801.
16. Devaiah BN, Nagarajan VK, Raghothama KG (2007) Phosphate homeostasisand root development in Arabidopsis are synchronized by the zinc finger
transcription factor ZAT6. Plant Physiol 145: 147–159.
17. Devaiah B, Madhuvanthi R, Karthikeyan AS, Raghothama KG (2009)Phosphate starvation responses and gibberellic acid biosynthesis are regulated
by the MYB62 transcription factor in Arabidopsis. Molec Plant 2: 43–
58.18. Miura K, Rus A, Sharkhuu A, Yokoi S, Karthikeyan AS, et al. (2005) The
Arabidopsis SUMO E3 ligase SIZ1 controls phosphate deficiency responses.
Proc Natl Acad Sci USA 102: 7760–7765.19. Aung K, Lin SI, Wu CC, Huang YT, Su CL, et al. (2006) pho2, a phosphate
overaccumulator, is caused by a nonsense mutation in a microRNA399 target
gene. Plant Physiol 141: 1000–1011.
Central Regulators of a Plant Stress Response
PLoS Genetics | www.plosgenetics.org 14 September 2010 | Volume 6 | Issue 9 | e1001102
20. Bari R, Datt Pant B, Stitt M, Scheible WR (2006) PHO2, microRNA399, and
PHR1 define a phosphate-signaling pathway in plants. Plant Physiol 141:988–999.
21. Lin SI, Chiang SF, Lin WY, Chen JW, Tseng CY, et al. (2008) Regulatory
network of microRNA399 and PHO2 by systemic signaling. Plant Physiol 147:732–746.
22. Gonzalez E, Solano R, Rubio V, Leyva A, Paz-Ares J (2005) PHOSPHATETRANSPORTER TRAFFIC FACILITATOR1 is a plant-specific SEC12-
related protein that enables the endoplasmic reticulum exit of a high-affinity
phosphate transporter in Arabidopsis. Plant Cell 17: 3500–3512.23. Fujii H, Chiou TJ, Lin SI, Aung K, Zhu JK (2005) A miRNA involved in
phosphate-starvation response in Arabidopsis. Curr Biol 15: 2038–2043.24. Chiou TJ, Aung K, Lin SI, Wu CC, Chiang SF, et al. (2006) Regulation of
phosphate homeostasis by MicroRNA in Arabidopsis. Plant Cell 18: 412–421.25. Franco-Zorrilla JM, Valli A, Todesco M, Mateos I, Puga MI, et al. (2007) Target
mimicry provides a new mechanism for regulation of microRNA activity. Nat
Genet 39: 1033–1037.26. Hsieh LC, Lin SI, Shih AC, Chen JW, Lin WY, et al. (2009) Uncovering small
RNA-mediated responses to phosphate deficiency in Arabidopsis by deepsequencing. Plant Physiol 151: 2120–32.
27. Pant BD, Musialak-Lange M, Nuc P, May P, Buhtz A, et al. (2009) Identification
of nutrient-responsive Arabidopsis and rapeseed microRNAs by comprehensivereal-time polymerase chain reaction profiling and small RNA sequencing. Plant
Physiol 150: 1541–1555.28. Duan K, Yi K, Dang L, Huang H, Wu W, et al. (2008) Characterization of a
sub-family of Arabidopsis genes with the SPX domain reveals their diversefunctions in plant tolerance to phosphorus starvation. Plant J 54: 965–975.
29. Wang C, Ying S, Huang H, Li K, Wu P, et al. (2009) Involvement of OsSPX1 in
phosphate homeostasis in rice. Plant J 57: 895–904.30. Zimmermann P, Hirsch-Hoffmann M, Hennig L, Gruissem W (2004)
GENEVESTIGATOR. Arabidopsis microarray database and analysis toolbox.Plant Physiol 136: 2621–2632.
31. Aoyama T, Chua NH (1997) A glucocorticoid-mediated transcriptional
induction system in transgenic plants. Plant J 11: 605–612.32. Nilsson L, Muller R, Nielsen TH (2007) Increased expression of the MYB-
related transcription factor, PHR1, leads to enhanced phosphate uptake inArabidopsis thaliana. Plant Cell Environ 30: 1499–1512.
33. Zhou J, Jiao F, Wu Z, Li Y, Wang X, et al. (2008) OsPHR2 is involved inphosphate-starvation signaling and excessive phosphate accumulation in shoots
of plants. Plant Physiol 146(4): 1673–1686.
34. Hope IA, Struhl K (1987) GCN4, a eukaryotic transcriptional activator protein,binds as a dimer to target DNA. EMBO J 6(9): 2781–2784.
35. Thimm O, Blasing O, Gibon Y, Nagel A, Meyer S, et al. (2004) MAPMAN: auser-driven tool to display genomics data sets onto diagrams of metabolic
pathways and other biological processes. Plant J 37: 914–939.
36. Yu B, Xu C, Benning C (2002) Arabidopsis disrupted in SQD2 encodingsulfolipid synthase is impaired in phosphate-limited growth. Proc Natl Acad Sci
USA 99: 5732–5737.37. Jouhet J, Marechal E, Baldan B, Bligny R, Joyard J, et al. (2004) Phosphate
deprivation induces transfer of DGDG galactolipid from chloroplast tomitochondria. J Cell Biol 167: 863–874.
38. Benning C, Otha H (2005) Three enzyme systems for galactoglycerolipid
biosynthesis are coordinately regulated in plants. J Biol Chem 280: 2397–2400.39. Rubio V, Bustos R, Irigoyen ML, Cardona-Lopez X, Rojas-Triana M, et al.
(2009) Plant hormones and nutrient signaling. Plant Mol Biol 69: 361–373.40. Galaktionov K, Chen X, Beach D (1996) Cdc25 cell-cycle phosphatase as a
target of c-myc. Nature 382: 511–517.
41. Sablowski RW, Meyerowitz EM (1998) A homolog of NO APICALMERISTEM is an immediate target of the floral homeotic genes APE-
TALA3/PISTILLATA. Cell 92: 93–103.42. Martin AC, del Pozo JC, Iglesias J, Rubio V, Solano R, et al. (2000) Influence of
cytokinins on the expression of phosphate starvation responsive genes in
Arabidopsis. Plant J 24: 559–567.43. LeBrasseur ND, MacIntosh GC, Perez-Amador MA, Saitoh M, Green PJ (2002)
Local and systemic wound-induction of RNase and nuclease activities inArabidopsis: RNS1 as a marker for a JA-independent systemic signaling
pathway. Plant J 29: 393–403.44. Jefferson RA, Kavanaugh TA, Bevan MW (1987) GUS fusions: beta-
glucuronidase as a sensitive and versatile gene RT fusion marker in higher
plants. EMBO J 6: 3901–3907.45. Ulmasov T, Liu ZB, Hagen G, Guilfoyle TJ (1995) Composite Structure of
Auxin Response Elements. Plant Cell 7: 1611–1623.
46. Franco-Zorrilla JM, Martın AC, Leyva A, Paz-Ares J (2005) Interaction between
phosphate-starvation, sugar, and cytokinin signaling in Arabidopsis and the rolesof cytokinin receptors CRE1/AHK4 and AHK3. Plant Physiol 138: 847–857.
47. Karthikeyan AS, Varadarajan DK, Jain A, Held MA, Carpita NC, et al. (2007)
Phosphate starvation responses are mediated by sugar signaling in Arabidopsis.Planta 225: 907–918.
48. Hammond JP, White PJ (2008) Sucrose transport in the phloem: integrating rootresponses to phosphorus starvation. J Exp Bot 59: 93–109.
49. Catarecha P, Segura MD, Franco-Zorrilla JM, Garcia-Ponce B, Lanza M, et al.
(2007) A mutant of the Arabidopsis phosphate transporter PHT1;1 displaysenhanced arsenic accumulation. Plant Cell 19: 1123–1133.
50. Liu TY, Chang CY, Chiou TJ (2009) The long-distance signaling of mineral
macronutrients. Curr Opin Plant Biol 12: 312–319.
51. Bates TR, Lynch JP (1996) Stimulation of root hair elongation in Arabidopsis
thaliana by low phosphorus availability. Plant Cell Environ 19: 529–538.
52. Baena-Gonzalez E, Rolland F, Thevelein JM, Sheen J (2007) A centralintegrator of transcription networks in plant stress and energy signalling. Nature
448: 938–942.
53. Schunmann PH, Richardson AE, Vickers CE, Delhaize E (2004) Promoter
analysis of the barley Pht1;1 phosphate transporter gene identifies regionscontrolling root expression and responsiveness to phosphate deprivation. Plant
Physiology1 36: 4205–4214.
54. Sessions A, Burke E, Presting G, Aux G, McElver J, et al. (2002) A high-
throughput Arabidopsis reverse genetics system. Plant Cell 14: 2985–2994.
55. Johnson CM, Stout PR, Broyer TC, Carlton AB (1957) Comparative chlorinerequirements of different plants species. Plant Soil 8: 337–353.
56. Swain TR, Hillis WE (1959) Phenolic constituents of Prunus domestica. I.
Quantitative analysis of phenolic constituents. J Sci Food Agr 10: 63–68.
57. Ames BN (1966) Assay of inorganic phosphate, total phosphate and
phosphatases. Methods Enzymol 8: 115–118.
58. Bechtold N, Ellis J, Pelletier G (1993) In planta Agrobacterium mediated genetransfer by infiltration of adult Arabidopsis thaliana plants. C R Acad Sci Paris Life
Sci 316: 15–18.
59. Sambrook J, Fritsch EF, Maniatis T (1989) Molecular Cloning: A Laboratory
Manual, 2nd ed. (Cold Spring Harbor, NY: Cold Spring Harbor LaboratoryPress).
60. Miesfeld R, Rusconi S, Godowski PJ, Maler BA, Okret S, et al. (1986) Genetic
complementation of a glucocorticoid receptor deficiency by expression of clonedreceptor cDNA. Cell 46: 369–399.
61. Aguilar-Martınez JA, Poza-Carrion C, Cubas P (2007) Arabidopsis
BRANCHED1 acts as an integrator of branching signals within axillary buds.
Plant Cell 19: 458–72.
62. Romero I, Fuertes A, Benito MJ, Malpica JM, Leyva A, et al. (1998) More than80R2R3-MYB regulatory genes in the genome of Arabidopsis thaliana. Plant J 14:
273–284.
63. Solano R, Nieto C, Paz-Ares J (1995) MYB.Ph3 transcription factor from Petunia
hybrida induces similar DNA-bending/distortions on its two types of binding site.Plant J 8: 673–682.
64. Chini A, Fonseca S, Fernandez G, Adie B, Chico JM, et al. (2007) The JAZ
family of repressors is the missing link in jasmonate signalling. Nature 448:666–671.
65. Wettenhall JM, Simpson KM, Satterley K, Smyth GK (2006) affylmGUI: agraphical user interface for linear modeling of single channel microarray data.
Bioinformatics 22: 897–899.
66. Irizarry RA, Hobbs B, Collin F, Beazer-Barclay YD, Antonellis KJ, et al. (2003)Exploration, normalization, and summaries of high density oligonucleotide array
probe level data. Biostatistics 4: 249–264.
67. Reiner A, Yekutieli D, Benjamini Y (2003) Identifying differentially expressed
genes using false discovery rate controlling procedures. Bioinformatics 19:368–375.
68. Iida K, Seki M, Sakurai T, Satou M, Akiyama K, et al. (2005) RARTF:
Database and Tools for Complete Sets of Arabidopsis Transcription Factors.DNA Res 12: 247–256.
69. Morgenstern B, Dress A, Werner T (1996) Multiple DNA and protein sequencealignment based on segment-to-segment comparison. Proc Natl Acad Sci USA
93: 12098–12103.
70. Dereeper A, Guignon V, Blanc G, Audic S, Buffet S, et al. (2008) Phylogeny.fr:robust phylogenetic analysis for the non-specialist. Nucleic Acids Res 36:
W465–W469.
71. Bonke M, Thitamadee S, Mahonen AP, Hauser MT, Helariutta Y (2003) APL
regulates vascular tissue identity in Arabidopsis. Nature 426: 181–186.
Central Regulators of a Plant Stress Response
PLoS Genetics | www.plosgenetics.org 15 September 2010 | Volume 6 | Issue 9 | e1001102
Copyright © 2022 FDOKUMEN