Tranche 3 Shamlaji Expressway Private Limited (Part 31 of 34)
Upload
khangminh22Category
view
0download
0
Design and Development of Vehicle Detection and Payment System
Using RFID Technology: A case of Addis Abeba to Adama
Expressway
by
Mr. Mesay Dejene Altaye W/Giorgis
ID No PGR/18078/11
A thesis submitted to the Department of Mechanical Systems and
Vehicle Engineering
Office of Graduate Studies
Adama Science and Technology University
July 2019
Adama, Ethiopia
Design and Development of Vehicle Detection and Payment System
Using RFID Technology: A case of Addis Abeba to Adama
Expressway
by
Mr. Mesay Dejene Altaye W/Giorgis
Advisor: Dr. Ramesh Babu Nallamothu & Dr. Harish Kalla
A thesis submitted to the Department of Mechanical Systems and
Vehicle Engineering
School of Mechanical, Chemical and Materials Engineering
Presented in Partial Fulfillment of the Requirements for the Degree of
Master of Science in Automotive Engineering
Office of Graduate Studies
Adama Science and Technology University
Adama
July 2019

We the undersigned, members of the Board of Examiners of the final open defense by Mesay
Dejene Altaye have read and evaluated his thesis entitled “Design and Development of Vehicle
Detection and Payment System Using RFID Technology: A case of Addis Abeba to Adama
Expressway” and examined the candidate. This is therefore to certify that the thesis has been
accepted in partial fulfillment of the requirement of the degree of Master of Science in Automotive
Engineering.
Name Signature Date
Mesay Dejene Altaye _______________ ____________
Name of Student
Ramesh Babu Nallamothu (Ph.D.) ___ _______________ ____________
Advisor
_______________________________ _______________ ____________
External Examiner
_______________________________ _______________ ____________
Internal Examiner
_______________________________ _______________ ____________
Chair Person
_______________________________ _______________ ____________
Head of the Department
_______________________________ _______________ ____________
School Dean
_______________________________ _______________ ____________
Post Graduate Dean

Declaration
I hereby declare that the work which is being presented in this thesis entitled “Design and
development of automatic vehicle detection and payment system at Addis Abeba to Adama
Expressway” in partial fulfillment for the award of the degree of master of science in automotive
engineering is an authentic record of my work carried out from February 2020 to July 2020 under
the supervision of Dr. Ramesh Babu Nalamothu (Ph.D.).
The matter embodied in this thesis has not been submitted by others for the award of any other
degree or diploma. All relevant resources of information used in this thesis have been
acknowledged.
Mesay Dejene Altaye ____________________ _______________
Candidate Signature Date
This is certifying that the above declaration made by the candidate is correct to the best of my
knowledge and belief. This thesis has been submitted for examination with my approval.
Ramesh Babu Nallamothu (Ph.D.) ________________ ________________
Major Advisor Signature Date

DEDICATION
I dedicate this research to God Almighty my heavenly creator, my strong pillar, my source of
inspiration, wisdom, knowledge, and understanding. He has been the source of my strength
throughout this program and on His wings only have I soared.
I also dedicate this research to two beloved women who have meant and continue to mean so much
to me. Although they are no longer of this world, their memories continue to regulate my life. First
and foremost, to “Enat Asres Amare and Enat Tsion Girma” whose love for me knew no bounds
and, who taught and show me the value of hard work. “እናቶቼ”, I will never forget you. May you
find peace and happiness in Paradise! Rest in peace!
Also, I am honored to commemorate my research in loving memory of my older brother, Daniel
Dejene, who died in the Ethio-Eritrean war in May 1998. The Lord, who made heaven and earth
by his word, Put your soul next to Abraham, Isaac, and Jacob in Paradise!
I want to remember the king of the past, one of the most famous and influential leaders among are,
the lion king of Judah his majesty emperor Tewodros II (መይሳው ካሳ) Ethiopia, Emperor Menelik
II (ዕምዬ ምኒልክ) Ethiopia, and History has never forgotten them our brave fathers and mothers
who sacrificed their lives for the freedom of their country Ethiopia in the battle of Adwa. I will
never forget their stories and their struggle, written in blood and gilded, will shine forever in my
heart.
However your life was short, I will make sure your adventure lives on as long as I shall live. I
proud of you all and admire you all beyond words. May grace and peace be upon me and God
Inherit the kingdom of heaven!
Amen!!!

i
ACKNOWLEDGMENT
Behind every achievement there lies an unfathomable sea of gratitude to those who activated it,
without whom it would never come into existence. To them, lay the words of gratitude imprinted
within. This research would not have been possible without the contribution and collaboration
of others. My sincere gratitude:
• To Almighty God who granted me health and long life. Without his Mercy, I could not
have finished this research. Thy stood by me at times of need when I was almost losing
it and helped me to rise back to my feet.
• I am also thankful to the most beloved women in my life, my mother, my sisters and the
begotten son “Yanni’s mother”, for their guidance which was a remarkable force that
enabled me to complete my research and encouraged me during my thesis by giving me
a meaningful tip on how to handle and approach situations throughout the days;
• My deepest and sincere thanks go to my Advisor Dr. Ramesh Babu for his extensive
guidance, encouragement, immense help, and cooperation throughout, and ASTU with
research grant number ASTU/SM-R/111/19.
• Then, I would like to thank and fortunate enough to get endless encouragement and
continuous support both financially and morally during the entire life on campus from
Texas Houston Dr. Dawit Yigletu, and Adelaide University-Australia Prof. Dr.-Ing.
Dagmawi Alemu for his valuable guidance and advise me to complete my thesis;
• I am also thankful to Mr. Sadik Siraj, General Manager, SASCO Transport and Supply,
and to ETRE Director Honor Ato Abey Woretaw, Ato Biruk, Ato Yohannes Birru
(Adama), and W/rt Semret (Adama), for permitting me to utilize all the necessary
documents and facilities at the enterprise;
Last but not least, this thesis is the product of many hands and countless hours from many
people. My special thanks go to all my family and friends for sharing their experiences, time,
and commitments.

ii
TABLE OF CONTENTS
Contents Page
ACKNOWLEDGMENT .......................................................................................................... I
TABLE OF CONTENTS ........................................................................................................ II
NOMENCLATURE ................................................................................................................. V
LIST OF FIGURES ..............................................................................................................VII
LIST OF TABLES ................................................................................................................. IX
ABSTRACT .............................................................................................................................. X
.......................................................................................................................1
INTRODUCTION .....................................................................................................................1
1.1 Background ...................................................................................................................... 1
1.2 Statement of the Problem ................................................................................................. 3
1.3 Objectives ......................................................................................................................... 3
1.3.1 General Objective......................................................................................................3
1.3.2 Specific Objectives....................................................................................................3
1.4 Significance of the Study ................................................................................................. 3
1.5 Delimitation (Scope) ........................................................................................................ 4
1.6 Beneficiaries ..................................................................................................................... 4
1.7 Limitations ........................................................................................................................ 4
1.8 Organization of the Thesis ............................................................................................... 4
......................................................................................................................6
LITERATURE REVIEW .........................................................................................................6
2.1 Introduction ...................................................................................................................... 6
2.2 A brief History of RFID ................................................................................................... 6
2.3 Evolution of Toll Collection at Toll Plaza ..................................................................... 10
2.4 RFID for Electronic Toll Process ................................................................................... 11
2.5 Concept and Categories of Vehicle Detection................................................................ 11
2.5.1 Traditional Loop Detectors .....................................................................................13
2.5.2 Global Positioning System (GPS) ...........................................................................13
2.5.3 Bluetooth Probe Technology...................................................................................15
2.5.4 Radio Frequency Identification and Detection Technology ...................................16
2.5.5 Vehicle License Plate Recognition Technology .....................................................17
2.6 RFID for Electronic Toll Collection............................................................................... 20
2.6.1 Automated Vehicle Identification Technologies ....................................................22

iii
2.6.2 Automated Vehicle Classification...........................................................................24
2.6.3 Transaction Processing ...........................................................................................27
2.6.4 Violation Enforcement System ...............................................................................27
2.7 Advantages of an Electronic Toll Collection System .................................................... 28
2.7.1 Increased Capacity ..................................................................................................28
2.7.2 Fuel-Saving .............................................................................................................29
2.7.3 Time-Saving and Tracking Objects ........................................................................29
2.7.4 Vehicle Theft Detection ..........................................................................................30
2.7.5 Tracking Over Speeding .........................................................................................30
2.7.6 Pollution in an Environment ...................................................................................32
2.7.7 Wastage of the Paper ...............................................................................................33
2.8 Why RFID ...................................................................................................................... 34
................................................................................................................35
MATERIALS AND METHODS ...........................................................................................35
3.1 Introduction .................................................................................................................... 35
3.2 Materials ......................................................................................................................... 35
3.2.1 Passive RFID ...........................................................................................................35
3.2.2 Transponder (Antenna) ...........................................................................................36
3.2.3 LCD .........................................................................................................................37
3.2.4 ATMEGA 2560 Microcontroller ............................................................................37
3.2.5 Servo SG-90 ............................................................................................................39
3.2.6 GSM ........................................................................................................................40
3.2.7 DPDT Relay Circuit ................................................................................................41
3.2.8 Buzzer .....................................................................................................................41
3.2.9 LED .........................................................................................................................41
3.2.10 Jumper Wires ........................................................................................................42
3.3 Software .......................................................................................................................... 42
3.3.1 Arduino IDE ............................................................................................................42
3.3.2 Embedded C Program .............................................................................................43
3.4 Method ............................................................................................................................ 44
3.4.1 Tollgate Location ....................................................................................................44
3.4.2 Research Approach .................................................................................................44
3.4.3 Preparation and Data Collection .............................................................................45
3.4.4 Sampling Technique................................................................................................45
iv
3.4.5 Sample Size .............................................................................................................45
3.4.6 Methods of Data Analysis .......................................................................................45
3.5 Design Aspects ............................................................................................................... 48
3.5.1 Security ...................................................................................................................48
3.5.2 Communication .......................................................................................................48
3.5.3 Safety ......................................................................................................................49
3.5.4 General Observation................................................................................................49
3.6 Tests and Results for System Design Modules .............................................................. 49
3.6.1 Automated Vehicle Identification and Classification System ................................49
3.6.2 System Design of Automatic Vehicle Detection ....................................................50
3.6.3 Design of Automated Vehicle Identification ..........................................................52
3.6.4 Design of Transaction Process ................................................................................52
3.6.5 Design of Violation Enforcement ...........................................................................53
3.6.6 Design of Vehicle Anti-Theft Detection .................................................................53
...................................................................................................................56
RESULTS AND DISCUSSION .............................................................................................56
4.1 Introduction to the Design Principles ............................................................................. 56
4.2 The Experiment Site and Data Source ........................................................................... 56
4.2.1 Tulu Dimtu Main Tollgate ......................................................................................56
4.2.2 The Transaction Delay Time (sec) ..........................................................................57
4.2.3 Feasibility Study .....................................................................................................61
4.2.4 Evaluation and Result of Designed System ............................................................63
4.2.5 Arrival Level (λ) .....................................................................................................64
4.2.6 Service Level (µ) .....................................................................................................64
4.2.7 Evaluation Scenarios ...............................................................................................67
4.2.8 Service Time Survey and Result Analysis ..............................................................67
4.3 The Results of the Field Study ....................................................................................... 68
4.4 Operating Frequency ...................................................................................................... 68
4.5 A Prototype of Electronic Vehicle Detection and Payment System .............................. 69
4.6 Circuit Diagram of the Automated System .................................................................... 71
.....................................................................................................................75
CONCLUSIONS AND RECOMMENDATIONS ................................................................75
REFERENCES ........................................................................................................................79
APPENDICES .........................................................................................................................86

v
NOMENCLATURE
AADT Annual Average Daily Traffic
AAE Addis Abeba to Adama Expressway
APNR Automatic Plate Number Recognition
ARM Advanced RISC Machine
AVI Automated Vehicle Identification Technologies
AVIS Automatic Vehicle Identification Managing
System
BAP Battery-Assisted Passive
CAEN Costruzioni Apparecchiature Elettroniche
Nucleari
CW Continuous Wave
DCE Data Circuit-terminating Equipment
DSRC Dedicated Short Range Communication
DTA Data Terminal Equipment
ELP electronic license plate
ETB Ethiopian Birr
ETC Electronic Toll Collection
ETRE Ethiopian Toll Roads Enterprise
GSM Global System for Mobile
HIS Hue-Intensity-Saturation
HOT High Occupancy Tolling
HT Hough Transform
ICSP In-Circuit Serial Programming
IFF Identification friend or Foe
IPS Information Processing System
IR Infrared Ray
ITS Intelligent Transportation Systems
IVU In-Vehicle Unit

vi
LCD Liquid Crystal Display
MAC Media Access Control
MEMS Micro-Electro-Mechanical Systems
MTC Manual Toll Collection
OBU Onboard Unit
OCR Optical Character Recognition
OECD Organization for Economic Cooperation and
Development
RADAR Radio Detection and Ranging
RFID Radio Frequency Identification
RISC Reduced Instruction Set Computer
RTA Road Traffic Authority
RTI Road Traffic Informatics
RUC Road User Costs
SCW Sliding Concentric Windows
SIM Subscriber Identity Module
SMS Short Message Service
USB Universal Serial Bus
VES Violation Enforcement System
VNR Vehicle Number Recognition
VPS-T Vehicle Positioning System technique
WLT Wireless Location Technology
λ Arrival level
µ Service level

vii
LIST OF FIGURES
Figure 1.1. Manual transaction system at the toll plaza ............................................................. 1
Figure 1.2. Working principle of an automatic toll collection system ...................................... 2
Figure 2.1. Complete RFID system............................................................................................ 8
Figure 2.2. Passive RFID ......................................................................................................... 10
Figure 2.3. Tulu Dimtu main toll plaza .................................................................................... 12
Figure 2.4. The basic configuration of the RFID system ......................................................... 13
Figure 2.5. Concept of Bluetooth detection system ................................................................. 15
Figure 2.6. The Working of RFID ........................................................................................... 24
Figure 2.7. Violated vehicle license plate number at the toll booth ......................................... 28
Figure 2.8. Toxic gas coming out from vehicles ...................................................................... 33
Figure 3.1. Passive RFID antenna and tags.............................................................................. 36
Figure 3.2. LCD Screen and Pin diagram of LCD ................................................................... 37
Figure 3.4. ART Microcontroller ............................................................................................. 38
Figure 3.5. SG 90 Servo ........................................................................................................... 39
Figure 3.6. GSM module .......................................................................................................... 40
Figure 3.7. DPDT Relay .......................................................................................................... 41
Figure 3.8. Buzzer .................................................................................................................... 41
Figure 3.9. LED lamps ............................................................................................................. 42
Figure 3.10. Jumper wires ........................................................................................................ 42
Figure 3.11. The satellite location of the expressway from Tulu Dimtu to Adama ................. 44
Figure 3.12. Work and analysis diagram ................................................................................. 47
Figure 3.13. RFID based automatic vehicle detection ............................................................. 51
Figure 3.14. Automatic vehicle detection flow chart ............................................................... 51
Figure 3.15. The automatic vehicle classification flow chart .................................................. 52
Figure 3.16. Automatic vehicle violation enforcement flow chart .......................................... 53
Figure 3.17. RFID tag installed on the vehicle ........................................................................ 54
Figure 3.18. Automatic vehicle anti-theft detection................................................................. 55
Figure 4.1. Block diagram of automatic vehicle detection ...................................................... 56
Figure 4.2. Tulu Dimtu main toll plaza, Addis Abeba ............................................................. 57
Figure 4.3. Transaction time at Tulu Dimtu Main Toll Plaza toll gate one ............................. 58

viii
Figure 4.4. Transaction time at Tulu Dimtu Main Toll Plaza toll gate two ............................. 58
Figure 4.5. Transaction time at Tulu Dimtu Main Toll Plaza toll gate three ........................... 59
Figure 4.6. Transaction time at Tulu Dimtu Main Toll Plaza toll gate four ............................ 59
Figure 4.7. Transaction time at Tulu Dimtu Main Toll Plaza toll gate five ............................. 60
Figure 4.8. Total transaction time at Tulu Dimtu Main Toll Plaza at all tollgate .................... 60
Figure 4.9. Average Transaction at the main toll plaza ........................................................... 61
Figure 4.10. Automated system delay ...................................................................................... 63
Figure 4.11. Transaction fluctuation on both system ............................................................... 68
Figure 4.12. The automatic toll collection system ................................................................... 69
Figure 4.13. The output of the proposed model ....................................................................... 70
Figure 4.14. Received text message from the system .............................................................. 70
Figure 4.15. RFID module Connection .................................................................................... 71
Figure 4.16. Transistor controlled LED ................................................................................... 72
Figure 4.17. Arduino to LCD connection ................................................................................ 72
Figure 4.18. Automated toll system schematic diagram .......................................................... 73
Figure 4.19. The ETC wiring diagram ..................................................................................... 74

ix
LIST OF TABLES
Table 2.1. Passive, semi-passive, and active tag comparison .................................................... 9
Table 2.2. Common RFID operating frequencies ...................................................................... 9
Table 2.3. Vehicle classification for toll .................................................................................. 26
Table 2.4. Addis Abeba to Adama toll road tariff.................................................................... 26
Table 3.1. Materials and specification ..................................................................................... 35
Table 3.2. The average transaction delay time (second) .......................................................... 46
Table 4.1. Total number of vehicles pass through plaza each month ...................................... 61
Table 4.2. Numbers of vehicles passed through toll plaza per day .......................................... 62
Table 4.3. Fuel consumption .................................................................................................... 63
Table 4.4. Level of service analysis and volume to capacity ratio .......................................... 64
Table 4.5. Average capacity/volume congestion ..................................................................... 65
Table 4.6. The total average transaction .................................................................................. 67
x
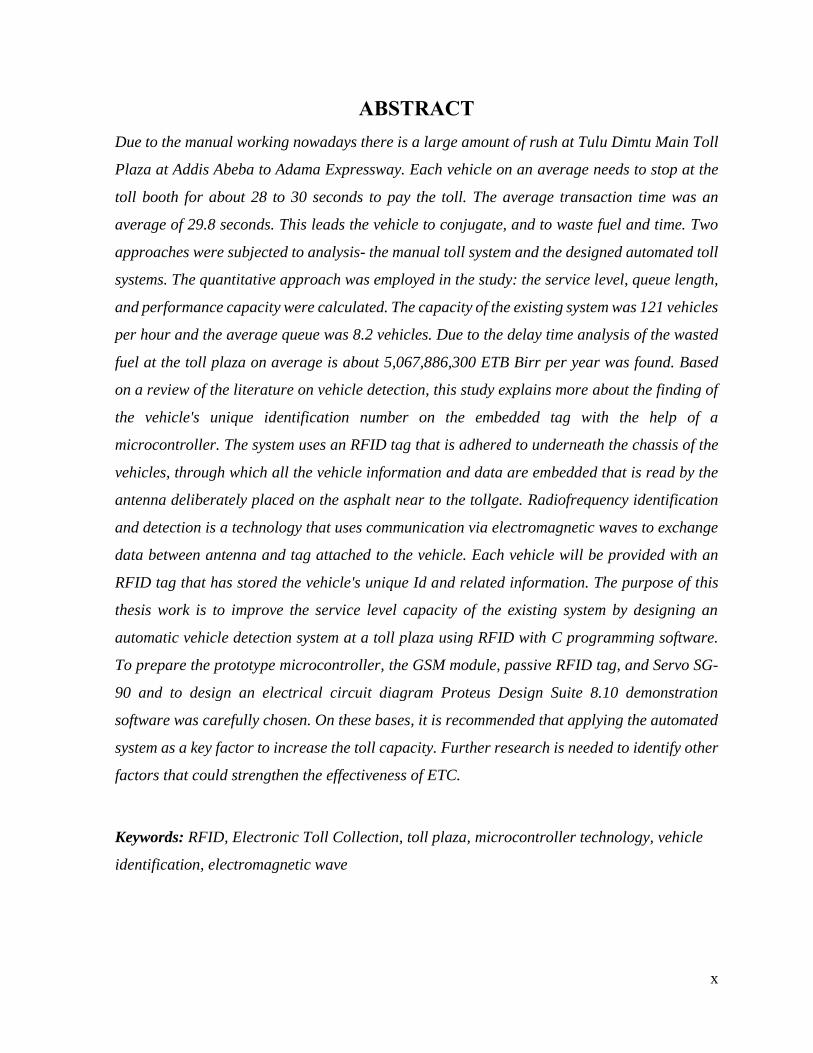
ABSTRACT
Due to the manual working nowadays there is a large amount of rush at Tulu Dimtu Main Toll
Plaza at Addis Abeba to Adama Expressway. Each vehicle on an average needs to stop at the
toll booth for about 28 to 30 seconds to pay the toll. The average transaction time was an
average of 29.8 seconds. This leads the vehicle to conjugate, and to waste fuel and time. Two
approaches were subjected to analysis- the manual toll system and the designed automated toll
systems. The quantitative approach was employed in the study: the service level, queue length,
and performance capacity were calculated. The capacity of the existing system was 121 vehicles
per hour and the average queue was 8.2 vehicles. Due to the delay time analysis of the wasted
fuel at the toll plaza on average is about 5,067,886,300 ETB Birr per year was found. Based
on a review of the literature on vehicle detection, this study explains more about the finding of
the vehicle's unique identification number on the embedded tag with the help of a
microcontroller. The system uses an RFID tag that is adhered to underneath the chassis of the
vehicles, through which all the vehicle information and data are embedded that is read by the
antenna deliberately placed on the asphalt near to the tollgate. Radiofrequency identification
and detection is a technology that uses communication via electromagnetic waves to exchange
data between antenna and tag attached to the vehicle. Each vehicle will be provided with an
RFID tag that has stored the vehicle's unique Id and related information. The purpose of this
thesis work is to improve the service level capacity of the existing system by designing an
automatic vehicle detection system at a toll plaza using RFID with C programming software.
To prepare the prototype microcontroller, the GSM module, passive RFID tag, and Servo SG-
90 and to design an electrical circuit diagram Proteus Design Suite 8.10 demonstration
software was carefully chosen. On these bases, it is recommended that applying the automated
system as a key factor to increase the toll capacity. Further research is needed to identify other
factors that could strengthen the effectiveness of ETC.
Keywords: RFID, Electronic Toll Collection, toll plaza, microcontroller technology, vehicle
identification, electromagnetic wave

1
INTRODUCTION
1.1 Background
Now a day’s traffic problem is very severe in Ethiopia. In Ethiopia, every day we have to face
traffic jams for several hours which is very annoying similarly creating huge trouble in our daily
life. Traffic jam mainly causes for reckless driving and also for the rash of the vehicles in the
road. To reduce this crowded traffic problem, the Federal Government Road Authority
constructed ring roads and expressways. Every driver has to pay toll (service tax) when he/she
passes the toll plaza by any four-wheel vehicle at the expressway. Unfortunately, in our country,
the toll system is manual which takes time to pass the vehicles and creating a traffic jam. The
following Figure 1.1 shows the manual transaction system at the toll booth.
Figure 1.1. Manual transaction system at the toll plaza
2
In this thesis work, it is aimed to develop an electronic-based automatic toll collection system
at toll plaza using RFID and microcontroller technology. With this system, there is no need for
vehicles to stop at a toll plaza. The payment will be made online from the account of the vehicle
owner and the conformation of the payments will be received.
The purpose is to provide time-saving, fuel preservation, and also provide a fast and safe
situation for the toll system and controls the vehicle movement automatically at the expressway.
To achieve the design and development of the automated system this thesis work is classified
into three units. Such units are (Kanthi et al., 2014) as follows.
1. Vehicle unit: it consists of an RFID tag
2. Toll plaza unit: it consists of Microcontroller, GSM modem, and IR receiver
3. Administration unite: it consists of a GSM modem with a host Computer
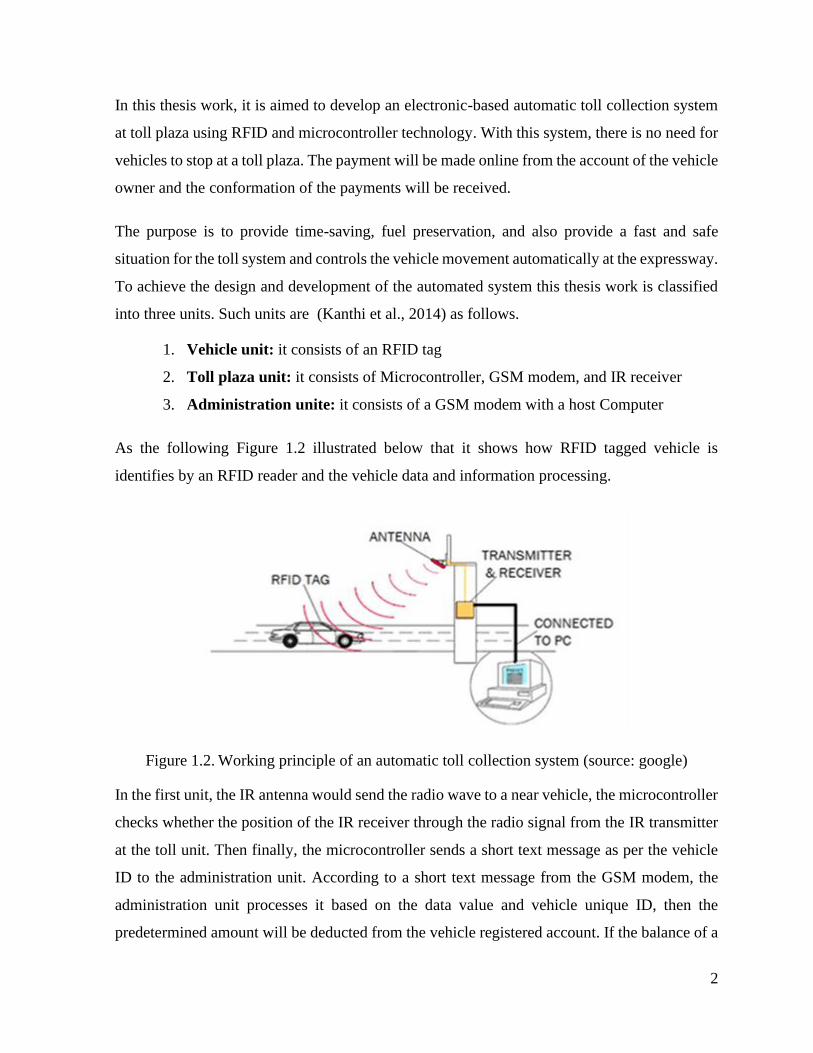
As the following Figure 1.2 illustrated below that it shows how RFID tagged vehicle is
identifies by an RFID reader and the vehicle data and information processing.
Figure 1.2. Working principle of an automatic toll collection system (source: google)
In the first unit, the IR antenna would send the radio wave to a near vehicle, the microcontroller
checks whether the position of the IR receiver through the radio signal from the IR transmitter
at the toll unit. Then finally, the microcontroller sends a short text message as per the vehicle
ID to the administration unit. According to a short text message from the GSM modem, the
administration unit processes it based on the data value and vehicle unique ID, then the
predetermined amount will be deducted from the vehicle registered account. If the balance of a

3
vehicle’s owner accounts insufficient or not yet registered means the administration center will
send a coded message towards the vehicle using GSM to halt the car immediately. Then the
vehicle owner has to pay service charge without penalty at the toll unit manually. As long as
the vehicle paid information is passed to the administration unit the system permits the tollgate
to switch on. Besides, the vehicles get decelerated at speed breakers used in this system to read
RFID tags which helps in the reduction of vehicle Overspeed driving.
1.2 Statement of the Problem
Currently, the vehicle identification system at each toll plaza in Ethiopia is entirely paper-based.
Moreover, at the manual toll gate, every vehicle has to stop and wait for about 29.8 seconds per
average to pay in cash and there should be one or two officers sit in the toll booth to collect the
service charge and verify the memo (ticket) in the system manually from the database. Due to
this reason;
• The existing system has a time-consuming
• Every vehicle has to stop to pay a toll this leads to possible road vehicle congestion
1.3 Objectives
1.3.1 General Objective
The general objective of this thesis work was to design and develop an electronic vehicle
detection and the toll system to ease the toll system and reduce congestion and improve service
capacity.
1.3.2 Specific Objectives
The Specific objectives of this thesis works are;
• To collect the details data about existing toll system
• To design and development of the control system
• To simulate the new system and analyze
• To prepare the prototype of the ETC system for demonstration
1.4 Significance of the Study
This study intended to contribute to the benefits of adopting technologies to the transport sector
in Ethiopia, and the challenges of adopting thereof. The outcomes of the study will inspire more

4
the toll road enterprise to be aware of the advantages of the tracking system and ultimately
adopt the technology.
1.5 Delimitation (Scope)
This thesis work includes the survey of the existing toll collection system, designing an
electronic-based toll system, simulation of the toll collection system using the software.
Construction of prototype for demonstration of the functionality is also included in this work.
1.6 Beneficiaries
The Electronic Toll Collection system aimed at increasing the capacity of service level by
reducing toll transaction delay time. This leads the beneficiary to the toll enterprise, all road
users, and society.
1.7 Limitations
In this thesis work, the limitations are:
Due to the global pandemic disease COVID-19:
• The road transportation Adama to Addis Abeba had been stopped for several days
• Sudden inflation and too high increment cost of electronics devices, and some devices
were not available in the market place.
1.8 Organization of the Thesis
This thesis work is organized with the following chapters.
Chapter One: Introduction, includes the basic concept and categories of vehicle detection,
Statement of the problems, Objectives, Beneficiary, Significance of the study, Delimitations
(scope), Limitations, and Organization of the thesis.
Chapter Two: Literature review, includes the introduction, RFID for electronic toll collection,
Advantages of an ETC system, why RFID, and the research gap.
Chapter Three: Materials and methods, includes the introduction, Selected hardware
materials, and the required software for the system, Methodology, Tests & results for system
design modules.

5
Chapter Four: Results and discussion, includes an introduction to the design principles, The
experiment site and data source, Results of the field study, Prototype of electronic vehicle
detection, and the automated electrical circuits diagram of the system.
Chapter Five: Conclusions and recommendations, includes the summary of the thesis,
Conclusion, Recommendations, and future work.

6
LITERATURE REVIEW
2.1 Introduction
To improve one country’s economy transportation pays a great role as backbones.
Advancement in transportation systems has created a lifestyle characterized by freedom of
movement, trade-in factory-made properties and services, high service levels, and social
mobility. The commercial prosperity of a country has been closely tied to competent means of
transport. The rapid development of a particular country especially in providing good
infrastructure facilities to the people has constantly become an important agenda to the
government. Major factors of congestion, air pollution and many other relative problems
become are increases due to the increasing number of vehicles on the road. Soon all commercial
activists at some point practice different means of carriage to work. For this reason, resolve to
enhance carriage have an instant influence on production and the economy.
The government of Ethiopia is undertaking vast and numerous developmental programs to
become a leading toll road owner in Africa on highway security and provision excellence laid
out for the all-inclusive revival of the country in 2020. Addis Abeba to Adama Expressway
(AAE) is one of the construction mega-projects developed that covers 78Km is open for road
traffic and managed through the Ethiopian Toll Roads Enterprise (ETRE, 2017).
2.2 A brief History of RFID
During the first century, Chinese were first used in magnetic fields. From the 1600s to the 1800s
was increasing the base of scientifically associated thought for electrical energy, magnetism,
and optics (Uddin et al., 2009). Charles Walton is known as the first patent holder for the RFID
device and was awarded ten patents including “portable radio frequency emitting identifier” in
1983 and was the first acronym “RFID” (Aima, 2016). Radiofrequency identification (RFID)
is rooted in discoveries made by Faraday during the mid-nineteenth century and discoveries
made between 1900 and 1940 in radio and radar technologies. Faraday discovered the concept
of mutual induction, which forms the basis for powering passive tags operating in the near field,
formulation of electromagnetic waves by Scottish physicist James Clerk Maxwell and
experimental setup by Heinrich Rudolf Hertz that was able to demonstrate the existence of

7
electromagnetic waves can be mentioned as pieces of evidence. The collaborative effects of
these discoveries have contributed a lot to the foundation of modern radio communications
(Ilyas, 2008).
In 1896, Guglielmo Marconi invented the successful transmission of radiotelegraphy across the
Atlantic, and it became very famous. In 1906, Ernst F. W. Alexanderson demonstrates the first
continuous wave (CW) radio generation and transmission of radio signals. These signals are
the beginning of modern radio communication where all aspects of radio waves can be
controlled. In the early 20th century, approximately 1922, was considered the birth of radar.
During the Second World War, The Germans, Japanese, Americans, and British were all using
radar- which had been discovered by Scottish physicist Sir Robert Alexander Watson-Watt- to
warn of approaching planes while they were still miles away; however, it was impossible to
distinguish enemy planes from allied ones. The radar sends the radio waves; detecting and
locating an object by the reflection of the radio waves. This reflection can determine the position
and speed of an object. Some people think that in 1945 the Russian Government first use real
RFID devices and it predates from that time. During the Second World War, the United
Kingdom had used RFID and they distinguished their airplanes among the German airplanes
(Landt, 2005).
Stockman (1948) stated that “considerable research and development work has to be done
before the remaining basic problems in reflected-power communication are solved, and before
the field of useful applications is explored”. His vision flourished until other developments in
the transistor, the integrated circuit, the microprocessor, and the communication networks took
place. RFID had to wait for a while to be realized “Communication by means of reflected
Power,” where Stockman laid out the basic concepts about RFID. According to the 1930s and
1940s (Vernon, 1952), the expansion of radio and radar was an era of investigation for RFID
techniques. In late 1960, Sensormatic and Checkpoint with several manufacturers such as
KNOGO established Electronic Article Surveillance (EAS) equipment to counter theft. EAS is
arguably the first and most widespread commercial use of RFID (Vernon, 1952). In 1977 one
of the first RFID systems introduced to the market was launched by Los Alamos Scientific
Laboratories in the form of an access control system. From 1963 to 1964, (Harrington, 1958)
studied the electromagnetic theory and these techniques used to RFID and made two papers

8
"Field measurements using active scatterers" and "Theory of loaded scatterers". (Golio, 2001)
In 1975, Radio Corporation of America (RCA) and Fairchild developed an electronic
identification system. Moreover, in 1977, F. Sterzer of RCA also developed an electronic
license plate for motor vehicles. Furthermore, (Meyers & Leigh, 1978) of Fairchild again
developed a new component of RFID "Passive encoding microwave transponder".
In 1980, RFID reached into the new exploration world, that time gave more attention to
enhancing tracking and access application in manufacturing and other environments. Hence,
distinguished by the execution of an RFID system (Uddin et al., 2009). The 1990s was a
significant decade for RFID innovation and it comes true application.
The RFID tag has two parts. The first is an integrated circuit for storing and processing a piece
of the given information, modulating and demodulating an (IR) wave and can also be used for
other specialized functions, and the second is an antenna for receiving and transmitting the
wave. A recent technology called a chip (Kanthi et al., 2014). When the RFID tag passes
through an electromagnetic zone it detects the reader’s activation signal. Then the reader
decodes the data encoded in the tag’s integrated circuit (silicon chip) and the data is passed to
the host computer. Figure 2.1 shows the three portions of automated toll systems including the
RFID system, the balance deduction system in the host computer, and the toll gate control
system (Attaran, 2007; Win & Myatnwe, 2014).
Figure 2.1. Complete RFID system
RS-232 is a standard for serial binary data interconnection between Data Terminal Equipment
(DTE) and a Data Circuit-terminating Equipment (DCE) in telecommunications (Priyanka et
al., 2015). A silicon chip and antenna and can be either active or passive, depending on whether
they have a power source or not. Active tags have their energy supply like long-life batteries
and are capable of initiating their communication with a reader. “Advanced active tags might
even form ad hoc peer networks with each other” (Miles, 2008). Passive tags do not have their
Data
RFID tag Computer RFID reader
RS-232 serial com

9
power source and consequently are not able to initiate communication with the reader. These
kinds of tags obtain their energy source from a reader employing inductive coupling or
capacitive coupling (Miles, 2008). Passive RFID applications that utilize low-frequency use
inductive coupling while the higher ones use capacitive coupling. These types of tags have a
short read range and are cheap to manufacture. Table 2.1 signifies the basic differences between
active and passive tags considering metrics like power source, communication type, and the
read range of the tags.
Table 2.1. Passive, semi-passive, and active tag comparison
Tag type Passive Semi-Passive Active
Power source RF energy Battery Battery
Communication Response only Response only Response or initiative
Maximum read range 10M > 100 M >100M
Relative cost Least expensive More expensive Most expensive
Typical applications EPC proximity cards Electronic tolls
Pallet tracking
Large asset tracking
Operating frequency is also important in determining the physical dimensions of an RFID tag.
Different shapes and sizes of the antenna will operate at different radio frequencies are available
in the market with different frequency ranges. The frequency ranges typically express the RF
ranges of the tags from low-frequency tag ranging from 30cm to 1m, mid-frequency ranging
from 3m to 7m, and high frequency ranging from 1.6m to 27.5m. The functioning frequency
similarly regulates how tags physically interact with each other. For instance, piling plane foil
inset tags on top of each other may interfere or prevent tags from reading properly. The price
of the radio frequency is depending on their frequency range (Ilyas, 2008). Table 2.2 lists
standard frequencies and their respective passive read distances.
Table 2.2. Common RFID operating frequencies
Frequency Range Frequencies Passive Read Distance
Low Frequency (LF) 120 to 140 kHz 10 to 30 cm
High Frequency (HF) 13.56 MHz 10 to 60 cm
Ultra-High Frequency (UHF) 868 to 928 MHz 3 meters
Microwave 2.45 to 5.8 GHz >3 meters
Ultra-Wide Band (UWB) 3.1 to 10.6 GHz >10 meters

10
Based on their attachment with an identified object there are three different kinds of RFID tags
i.e. attachable, implantable, insertion tag. Besides, Eastman Kodak Company has filed two
patented applications for monitoring the ingestion of pathologically based on a digestible RFID
tag (Tamura, 2008). Figure 2.2 illustrated the attachable type of passive RFID.
Figure 2.2. Passive RFID
2.3 Evolution of Toll Collection at Toll Plaza
The United States first deployed the electronic toll collection technology using RFID (Foote,
1981). Significant distributions contained within numerous inventions in automated tolling. In
1991, the world’s first highway electronic tolling system was opened in Oklahoma, where the
vehicles could pass at highway speed through the tolling point station. Harris County Toll Road
Authority first installed both electronic toll and traffic management systems in 1992.
Karsaman et al. (2014) the two types of electronic toll systems are namely, automatic and
electronic types. Several countries are using a semi-automatic (automatic type toll classified
into semi-automatic and fully automatic) toll system in which each vehicle has to stop to scan
the card and must wait until the gate opens. In other counties, the transaction is done whereby
a fully automated system without the vehicle to stop at the gate. Using a fully automated system
has several advantages, such as an increase in tollgate capacity, a decrease in congestion at the
toll booth, saving of transaction time, reduction in emission, leads to fuel-saving, and simplify
the toll operation.

11
2.4 RFID for Electronic Toll Process
Passive RFID tags utilize the induced antenna to induced ac voltage through the system that
rectified to provide a voltage as a source for the device. As the dc voltage reaches a certain
level, the device begins working. By providing an energizing RF signal, a reader can
communicate with a remotely located device that has no external power source or battery. Since
energizing and communication between the reader and tag is accomplished through antenna
coils, the antenna becomes one of the most significant components of RFID systems. Antennas
for RFID system usually are made of coils of magnetic wire. A current flowing into the coil
radiates a near-field magnetic field that falls off with r-3 (r is the distance away from the
antenna) (Jung & Lee, 2015). This type of antenna is called a magnetic dipole antenna.
Since around 1992, researches on an Electronic Toll Collection system using radio frequency
identification and detection (RFID) has been introduced during RFID tags that began to be
broadly used in vehicles to automate toll methods. The system uses an RFID tag that is mounted
on the windshields of vehicles, through which data embedded on the tags are read by RFID
readers; this automated system removes the needs of toll enterprises to manually perform ticket
payments and manual toll collections (Kamarulazizi, 2010).
RFID technology-based presence supervision system the study has identified and explained the
key benefits of RFID technology. RFID will open doors to a pool of applications from an excess
of industries. Although the focal challenge to thwart the adoption is its investment cost, RFID
technology provides an ocean of lucrative business opportunities that could convince several
firms to adopt it (Gaikwad et al., 2017).
2.5 Concept and Categories of Vehicle Detection
This section introduces several kinds of traffic count and data collection tools that are in wide
usage. With the development of technology, transportation engineers and researchers tend to
make utilization of more developed technologies for vehicle identification, tracking, and data
extracting. In the following section, the main characteristics and application of radio frequency
identification and detection commonly used for vehicles detecting technologies are introduced.

12
Figure 2.3. Tulu Dimtu main toll plaza
Figure 2.3 shows a toll booth in which the vehicle is required to stop before it can cross off and
continue its journey. This toll system is a time-consuming and often possible cause for
congestion on the road. The above-mentioned problems can be solved by implementing the
proposed systems which read the RFID tag and send the data to the database to recognize the
information either the information is correct or not.
RFID is programmed proof of identity technique. An excessive application of RFID technology
permits loading and understanding the data deprived of requiring either communication or a
line of sight between the tag and reader. RFID is a tracking technology used to detect and
confirm tags that are applied to any product, person, or animal. RFID (Radiofrequency
identification and detection) is a universal term used designed for detection technologies based
on wireless communication making use of radio waves, which is a part of the electromagnetic
spectrum (Boschma & Wenting, 2007). A basic arrangement contains three apparatuses.
a. Coil or an Antenna
b. A transceiver (with decoder)
c. Electronically programmed RF tag (transponder)
Homs et al. (2004) two-way radio transmitter-receiver the so-called Interrogators or Readers
have to send a radio signal to the tag and simultaneously read what the tag responses. Gupta,

13
(2004) offered RFID data that combines with the existing applications for tracking and
monitoring manufactured substances. With the help of RFID, can achieve those activities easily
through configured data management system integrated with different applications into
minimum integration cost. Nowadays, production methods are also improving, so the
trustworthiness and the read range of the passive RFID system continues to improve the cost-
effective way. The following Figure 2.4 shows the configuration of the RFID.
Figure 2.4. The basic configuration of the RFID system
2.5.1 Traditional Loop Detectors
Are fixed-location sensors, and other well-used technologies are generally in the mobile traffic
sensor area. Generally speaking, mobile traffic sensors include any monitoring or data
collection system with an appropriate device equipped with probe vehicles those equipped with
Electronic Toll Collection (ETC) tags such as cellular phones, portable GPS devices (like GPS
cellular phones), GPS navigation systems, Bluetooth Mac Address Matching, vehicles in
Vehicle Infrastructure Integration, etc. (Xuegang (Jeff), 2010). These mobile traffic sensors are
also known as probe vehicle technologies, which are typically Intelligent Transportation
Systems (ITS) applications for real-time traffic monitoring.
2.5.2 Global Positioning System (GPS)
The Global Positioning System (GPS) is a space-based global navigation satellite system
(GNSS) that sends reliable position and time data in all meteorological conditions and at all
times and anywhere on or near the earth when and where there is a free line of sight of 24
satellites placed into orbit by the U.S. Department of Defense (Garmin Ltd, 1996). Since 1973

14
the development of GPS was started to overwhelmed the restrictions of earlier navigation
systems, integrating ideas from quite a lot of precursors, together with numerous classified
engineering design studies from the 1960s. However, in 1983 president Ronald Reagan decided
to permit the system to identify a location on a map and to design identify the nearest for civilian
use of GPS technology once it becomes operational.
GPS technology-based vehicle tracking system belongs to a category of traffic time
measurement technologies called probe vehicle technologies. With an application of Global
Positioning System (GPS) technology for a vehicle, detection is widely used. The first GPS
pilot test was conducted by (Yim & Cayford, 2001) and also included the analysis of cellular
phone tracking. This study successfully proves that GPS can be used for travel time calculation
with a high frequency of reading. Besides, a GPS may be used as an emergency locator and
security feature to track vehicle locations. GPS is one way in which satellites have become part
of everyday life (Wright et al., 2013).
Cellular Probe Technology also belongs to the field probe vehicle technologies. Cellular
technology began to receive attention from the transportation research field just quite a few
years ago. It uses wireless communication signals to make vehicle identification and detection
possible. When tracking the cellular phone signal in vehicles, the timestamp, location
information of vehicles are caught. Since the detection of the phone signal in the vehicle never
tells the type of vehicles, the detection study with a cellular probe is hard to do. However, by
using Wireless Location Technology (WLT), which has been developed for mobile phone
networks, cellular probe technology can be a potentially promising technology for obtaining
vehicle travel information. There are plenty of studies on the estimation of travel time using a
cellular phone-based system (Bar-Gera, 2007) and obtaining general traffic information
(Cayford & Johnson, 2003; Fontaine & Smith, 2005) these studies receive robust results for
traffic detection purpose.
The aim of designing an ETC system is to leaves the delay time on the expressway by
automating the existing system. ETC controls whether the vehicle fleeting is registered in the
database, red alert enforcers for those that are not, and deduct the predetermined charge from
the account of registered vehicle owners without requiring them to stop.

15
2.5.3 Bluetooth Probe Technology
Bluetooth is a typical short-range wireless communication technology with its functionality
embedded in various electronic wireless devices, such as cell phones, MP3 players, PDAs,
laptops, GPS, car radios, and so on. Bluetooth-enabled devices can serve as “tags” for vehicle
tracking by a unique identifier known as Media Access Control (MAC) address. Every
Bluetooth device has a unique electronic address, used to identify it to other network devices
(Bluetooth, 2008). The traffic monitoring effort also relies on the pairwise Bluetooth readers to
take down the timestamps and location information of vehicles, the readers just get anonymous
IDs for privacy protection. This might be an essential characteristic of a potential data source.
The Bluetooth technology can be applied in freeway travel time arterial travel time and
performance measures, traffic signal studies, pedestrian travel time, airport evacuation
modeling, and transit travel time estimation. The exploration of this technology in traffic
monitoring has been quite active recently both in the academic and industry field. A case study
of estimating traveler’s route choice and travel time using Bluetooth probe vehicles have been
conducted at northwestern Indiana (Hainen et al., 2011). Some commercial companies have
been manufacturing Bluetooth based vehicle detectors and systems. The study of travel time
and speed measuring using Bluetooth carried out by Texas Transportation Institute in the
Huston area is a notable study in the AVI detecting field (Puckett & Vickich, 2010). In the
study, the Bluetooth detection system related concepts are given and shown in Figure 2.5 below.
Figure 2.5. Concept of Bluetooth detection system

16
2.5.4 Radio Frequency Identification and Detection Technology
Radio-frequency identification (RFID) is a technology that uses communication via
electromagnetic waves to interchange information between a terminal and an electronic tag
attached to an object, for identification and tracking (Kaur et al., 2011).
However, before anything like radio frequency identification began, the pioneering systems
were automatic object detection systems. One of such findings and patents was a radio
transmitter for object detection systems designed by John Loggie Baird in 1926 (Baird, 1928).
Nine years later, Robert Watson Watt was credited with a patent for his “Radio Detection and
Ranging” system or the RADAR. Henry Stockman in his seminar entitled “Communication
through Reflected Power” in 1948 had already presented the communication technology that is
used in the current RFID system (Stockman, 1948).
There are two acquisition methods, which define the method used to read tags in the field. One
is a global scroll, the primitive command method. During the operation of acquisition, the
readers just send the command to the air and every tag in the receiving area can get the request
and immediately send back its ID to the reader. Another method is called inventory. This single
high-level command transforms itself into a complex series of reader-tag interrogations that
eventually resolve themselves into a single list of tag IDs seen by the RFID Reader. Passive
RFID is now commonly used in various fields, such as warehouse management, medical,
animal identification, usages at toll stations, and parking lots that have been applied in various
countries.
Later, applications based on radio frequency began to emerge. The first official application
using radio frequency identification was during World War II when the British Royal Air Force
used radio frequency to identify friendly aircraft from an adversary one in a special
“Identification friend or Foe” (IFF) called application. IFF helped radar operators and pilots to
distinguish friendly aircraft from enemies using RF signals. IFF system has also helped in
preventing “friendly fire” incidents (Miles, 2008).
However, for objects with high-speed motion, active tags should be attached to ensure the
detecting range and tracking accuracy. Some major organizations such as Loggers use RFID
technology to track its fleet, the 915 MHz active tags are used (Swedberg, 2005). Those tags

17
are UHF tags so that the detection range can be up to 300ft (about 100m) (Kaur et al., 2011).
Although active tags needs attached power source and thus are higher in installing budget, they
are truly necessary for traffic monitoring. As the implements of RFID on freight vehicles
become more and more popular, a good vehicle identification and monitoring method becomes
realistic.
2.5.5 Vehicle License Plate Recognition Technology
In 1976, the first automated license plate detection and recognition technology were invented
by the Police Scientific Development Branch (PSDB) at the home office in the United Kingdom
(Lakshmi et al., 2011).
Bai & Zhou, (2006) identified that the Automatic Vehicle Identification Managing System
(AVIS) which has RFID technology, managing technology with electronic license plate (ELP)
communication technology acquires more scrutiny in the society. The scheme detects every
single registered vehicle and gathers the vehicle information continuously by RFID technology.
Shevale, (2014) describes the smart vehicle license plate screening system and recognition at a
toll plaza using a special-purpose surveillance camera. License plate recognition can be used in
many applications such as parking control, entrance admission, speed control, road traffic
control, and so on. To identify the vehicle by using license plate recognition the required
algorithm sequence start captures the vehicle image then makes clear the blurred image, extracts
the image of a license plate, and recognizes the vehicle from the database. Some counties like
Australia and Korea uses standard feature license plate such as the dimension of the plate, the
license plate border, and font character.
Masurekar, (2016) designed an automatic vehicle number recognition capture the vehicle image
with the help of a web camera. The system is an image processing technology that uses an
efficient algorithm to detect the vehicle captured real plate and the templet matching technique
is used for character recognition from the database. During fleet all the data information such
as passing time, date, and toll amount stored through the database to maintain the record. The
system requires four modules: i.e. image acquisition, license plate extraction, character
segmentation, and character recognition. Searching algorithm relay on the color algorithm.

18
Using number plate image communication, the technology of automated toll system for vehicle
information and the payment is done only make using number plate image via SMART CARD.
NPR (Number Plate Recognition) using photo masterminding structure orchestrated with a
completely objective of the security structure. The number plate is labeled in the database with
the client’s close to home data, ledger, and vehicle subtle elements (Prathiba et al, 2017).
Detection of a vehicle through the application of VLPDR (Vehicle License Plate Detection and
Recognition) has become a serious initiative and an advanced area of research. Hence primarily,
the system works by capturing the vehicle image and thus, interprets the license plate’s
registration number automatically. The AVDR (Automatic Vehicle Detection and Recognition)
system proves to be an operative instrument which supports to systematize the activity, too long
and the physical technique of the employees which they encounter and deal with in their regular
daily life, and aids to deliver efficiency in the identification of the vehicles from hundreds and
thousands of vehicles observed in the regular patrolling task. AVDR combines license plate
detection with vehicle shape detection to make a system more secure rather than disposed to
false intrusions.
The need for the successful implementation of the License Plate Detection and Recognition
(LPDR) system has evolved over many years and hence, many research algorithms, protocols,
and schemes have been proposed on the topic. Therefore, ALPDR (Automatic License Plate
Detection and Recognition) System can be described under two main divisions (Goswami &
Gaur, 2014).
1. Online or Active ALPDR System
2. Offline or Passive ALPDR System
2.5.5.1 Online or active ALPDR System
In an Active ALPDR System, technologies like LASER, RADAR, surveillance cameras, and
radiofrequency are implemented to carry out a successful identification of the vehicle. In the
LASER System, a barcode is positioned on the car whereas, in the case of radiofrequency
systems, a tag is installed in the vehicle. This tag includes information on the license plate along
with the other necessary information. Surveillance Cameras keep a proper track of the
positioning of the vehicles by interpreting the localized License place in an image from the

19
arriving video frames. An RFID reader is installed in a location for the identification of the
vehicle and it has the potential to interpret the information mentioned on the tag from a specific
distance. The Radiofrequency system does not require the image of the vehicle to recognize the
vehicle's identifications, which eliminates any false recognitions (Yan et al., 2001).
2.5.5.2 Offline or Passive ALPDR System
In a Passive ALPDR System, the interpretation of the vehicle license plate takes place by
capturing the images of the vehicles and then maintaining a database of these images in a
centralized information server. Here, the recognition of the vehicle takes place by processing
the image of the vehicle license plate. This process to a great extent depends upon the quality
of the image captured. Complications may arise due to noises in the image of the license plate
and hence, this may lead to generating erroneous and inaccurate results.
2.5.5.3 License Plate Recognition Based on Color
A vehicle number plate can be detected based on plate color, edge, and other features. After
applying intensity variance and edge density method license plate detection performed. An
edge-based color aided plate number detection method discussed in (Abolghasemi &
Ahmadyfard, 2009). Contain vertical edge density estimation and the Gaussian mixture is used
to emphasize the constancy of intensity value at a surrounding region along the horizontal
direction. Finally, the processing of color and structure analysis of the plate are used to the
segment license plate.
APDR systems comprise different components. The key module of this system is to recognize
the text in an image. This image contains the license plate of the vehicle which is then analyzed
to get the plate information. Each character of the license plate is recognized by this system by
comparing it with the stored templates (Zheng et al. 2008).
Yao & Yi, (2014) proposed a system of new license plate detection techniques using Adaboost
detector on many stages of data combination. This planned multiple-stage data combination
system consists of an advanced Adaboost sensor with a color sensing module and with a
Support Vector Machine (SVM) detector. These two stages also check whether the image that
is detected by the Adaboost sensor is a license plate.

20
2.5.5.4 License Plate Recognition Through Video
In Patel et al. (2013) the study considered image size from the different approaches under
camera surveillance, and the Sliding Concentric Windows (SCW) technique for faster detection
of a region of interest is developed. The analysis of the study's overall success rate is 96%. To
extract the image by using relevant features like shape, texture, and color. To detect vertical
and horizontal line from rectangular vehicle number plate used Hough Transform (HT) and
then processed it by converting Red, Green, Blue (RGB) to Hue-Intensity-Saturation (HIS).
In Cui & Huang, (1998) license plate character extraction from a video is discussed. As per the
author localization of license plate means finding a text in the image. The license plate
background with light color and the character with a dark background. To do localization,
spatial variance method is used for finding a text region and none text region as high variance
means of text region and non-low variance means non-text region.
Karande et al. (2016) the scientific research introduced detecting vehicle license plate numbers
using Optical Character Recognition (OCR) and by digital camera. Using processed data for
further processes like segmentation, image binarization, number plate extraction, and storing of
image.
2.6 RFID for Electronic Toll Collection
In 1959, the first electronic toll system for the Washington Metropolitan area was proposed by
Nobel Economics Prize-winner William Vickrey. Through the proposed system each vehicle
would be integrated with a transponder. “the transponder’s radio signal which tagged on the
vehicle would be read when the vehicle closed to the gate and at host computer would calculate
the charge at the management unit according to the time of day and add it to the vehicle’s bill”.
In the 1960s and the 1970s, the free flow toll system was tested with a fixed transponder at the
basements of the vehicle and readers, which were placed underneath the surface of the roadway
(Andurkar & Ramteke, 2015).
Norway has been the world's pioneer in the widespread implementation of this technology in
Bergen to introducing composed with a manual system in 1986. Later, Trondheim introduced
the world's leading use of fully unassisted full-speed automated tolling in 1991. Nowadays
Norway has 25 toll highways respectively working with entirely electronic fee collection, as

21
the Norwegian technology is entitled. In 1995, Portugal became the first state to implement a
single, worldwide scheme to complete fees in the country, the Via Verde, which can similarly
use in car parks lots and gas stations too. At the western, the United States of America is another
country use the widespread automated system in several states, rather than manual system toll
roads.
In the scientific research of Amol & Nawgaje, (2015) the traditional manual toll collection is
not efficient over highway transport in the modern way network thus collecting the toll and
traffic management to introduce a new system with advanced technology is electronic toll
collection. The proposed system uses radio frequency identification technology, GSM, and
computer host. The RFID is used to access the vehicle’s data and information, RFID tag with
an exclusive Id is programmed mounted on each vehicle, programmed data hold on the tag is
read by nearly RFID reader placed at toll gateway. If the vehicle belongs to the registered
person, a programmed expanse is automatically deducted from his/her account, a short text
message will send to registered cell phone number and the toll gate opens.
Automated toll collection targets to remove the delay on toll highways employing collecting
tolls electronically. The programmed structure controls the cars passing plaza which are
recorded in the database and electronically debits from the accounts of registered car owners
without requiring the vehicle to stop. In existing systems, faces numerous problems such as
there is no allowable speed limit near to the tollgate, wastage of fuel, and the time of customers,
difficult to control a crowd, and optimize the queue length of vehicles. The time delay caused
by passing through toll stations includes slowing down, accelerating waiting, and service time.
The existing system allowed all the payment types like prepaid, postpaid, and cash (Yu et al.,
2011).
Ethiopian Toll Roads Enterprise (ETRE) established under Regulation no 301/2014 issued by
the Council of Ministers in July 2014 as public enterprise according to the Public Enterprise
Proclamation No. 25/1992. All the road toll collection systems are commonly used in Ethiopia
is a manual transaction. Particularly, Addis Abeba to Adama Expressway (AAE) has 19 entries
and 29 exits. Nowadays, over 14,000 vehicles for 7 days and 24 hours are streams of traffic
flow are increased and toll gate on highways are congested (ETRE, 2017). This will cause a

22
traffic jam and a waste of time. The objective of this thesis is to transform the existing manual
system to computerized toll system with the help of RFID and microcontroller technology. The
accomplishment of the first-year strategic plan (2015/16G.C) was evidenced by servicing a
traffic flow of 5,043,463 (five million forty-three thousand four hundred sixty-three) vehicles
surpassing the estimated plan of 4,714,286 (four million seven hundred fourteen thousand two
hundred eighty-six) vehicles with (107%) success rate and the 24/7 traffic flow was nonstop
managed without any major interruption and inconvenience for the customers. Besides, the
various customer handling departments were able to deliver their services with customer
satisfaction orientation.
To implement an RFID based toll system, RFID tagged vehicle, RFID scanner equipped toll
plaza, centralized database, and laser transponders are components mainly required. Hence, the
system is categorized into four major mechanisms (Kalantri et al., 2014):
a) Automated Vehicle Identification,
b) Automated Vehicle Classification,
c) Transaction Processing, and
d) Violation Enforcement
2.6.1 Automated Vehicle Identification Technologies
Automatic vehicle identification (AVI) has recently emerged technology in numerous road
traffic administration and toll collection applications. The system made up of an in-vehicle
transponder (tag), a roadside reading unit, and a central computer system (Boyce et al., 1991).
When a vehicle having a radio frequency tag crosses a pavement antenna, the existing data on
the tag is moved to the antenna (reader unit). The appropriate data may in the range from a
simple vehicle identification number to toll account balances or the vehicle’s journey data. For
computing travel times, the central computer monitors several consecutive reader units and
matches them to the transponder identification numbers created in the central computer system.
AVI is a general traffic surveillance tool derived from auto-identification Harrison et al. (2006)
which serves institutes who want to identify items, capture information about them, and
somehow get the data into a computer automatically. AVI has been widely used in monitoring

23
the performance of Electronic Toll Collection (ETC) and High Occupancy Tolling (HOT)
systems (Lu et al., 2007).
Texas Huston was the first city in the United States of America to apply AVI technology for
monitoring traffic conditions (Puckett & Vickich, 2010). Because of the excellent performance
of AVI application in toll station monitoring, Huston's AVI monitoring system deploys the "EZ-
Tag" Embedded in the vehicles, which are used in the automatic toll collection system, to be
the transponder tags. AVI devices include tags placed in vehicles, and tag readers set along the
roadside. By recording the timestamp of a vehicle passing the two readers, the travel time
between readers can then be generated. AVI technologies have not been used widely for traffic
monitoring. The potential advantage of AVI technology over fixed-location detectors resides in
its ability to collect point data as well as point-to-point data, which are expected to provide a
better description of certain aspects of traffic conditions. Considering its higher efficiency and
accuracy and lower cost compared to a traditional plate-matching method, it is expected to fill
in the gap for traffic tracking purposes, especially in merchandise performance monitoring.
Bluetooth and Radio Frequency Identification (RFID) technologies belong to the category of
AVI technologies.
The AVI system is used to determine the identity of the vehicle which is passing through ETC
tollbooth for charging the toll to the corresponding customer. While passing through the toll
lane, a receiver communicates with the tag installed on the rear windshield of the vehicle and
reads the vehicle information (Masurekar, 2016).
Companies like SUPER RFID has developed an RFID based system for identifying a vehicle
and help control traffic management. This system includes functions like vehicle registration,
annual check, traffic statics (counting car numbers and measuring speeds), anti-theft, police
supervision, over-speed check, traffic light violation control, and so on (Mattern, 2014). To
achieve its goal, the company has used Automatic Vehicle Identification done by providing
each vehicle with a unique ID tag and traffic management approaches. The later uses a wireless
vehicle detector applied to check speed, count car numbers and work in conjunction with a
camera monitoring system to realize required functions. An automatic vehicle identification
using RFID, a firsthand experience, describe the performance of different RFID systems
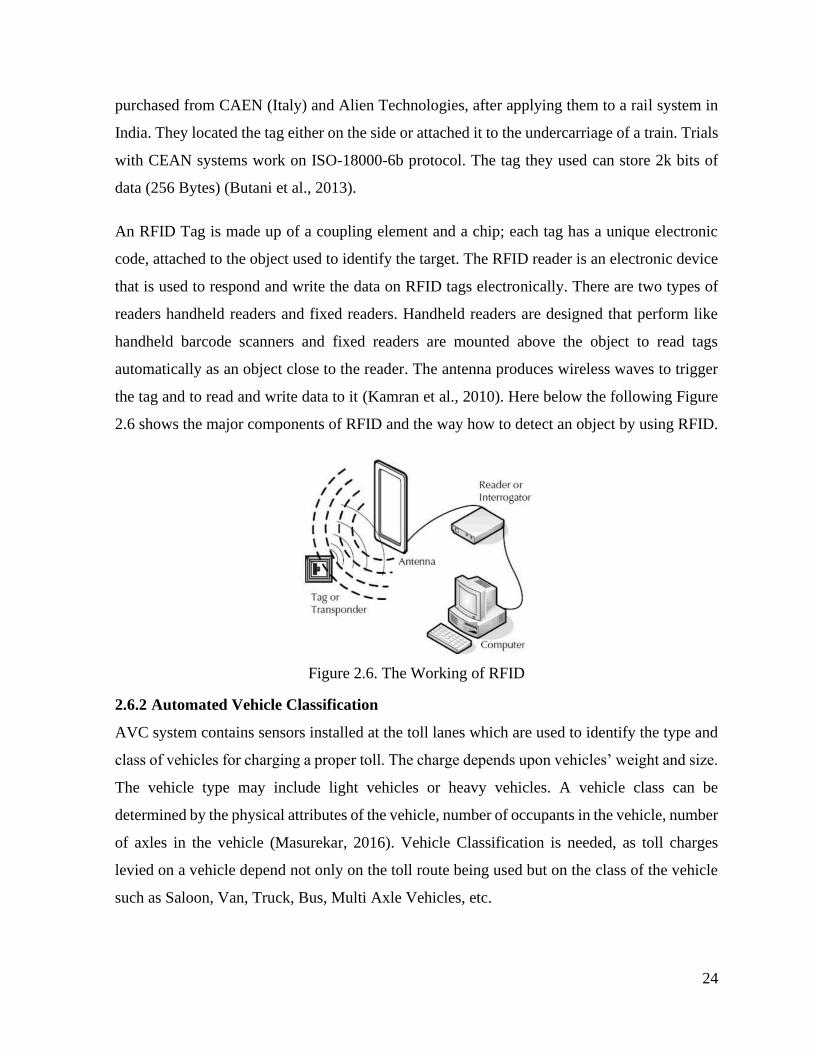
24
purchased from CAEN (Italy) and Alien Technologies, after applying them to a rail system in
India. They located the tag either on the side or attached it to the undercarriage of a train. Trials
with CEAN systems work on ISO-18000-6b protocol. The tag they used can store 2k bits of
data (256 Bytes) (Butani et al., 2013).
An RFID Tag is made up of a coupling element and a chip; each tag has a unique electronic
code, attached to the object used to identify the target. The RFID reader is an electronic device
that is used to respond and write the data on RFID tags electronically. There are two types of
readers handheld readers and fixed readers. Handheld readers are designed that perform like
handheld barcode scanners and fixed readers are mounted above the object to read tags
automatically as an object close to the reader. The antenna produces wireless waves to trigger
the tag and to read and write data to it (Kamran et al., 2010). Here below the following Figure
2.6 shows the major components of RFID and the way how to detect an object by using RFID.
Figure 2.6. The Working of RFID
2.6.2 Automated Vehicle Classification
AVC system contains sensors installed at the toll lanes which are used to identify the type and
class of vehicles for charging a proper toll. The charge depends upon vehicles’ weight and size.
The vehicle type may include light vehicles or heavy vehicles. A vehicle class can be
determined by the physical attributes of the vehicle, number of occupants in the vehicle, number
of axles in the vehicle (Masurekar, 2016). Vehicle Classification is needed, as toll charges
levied on a vehicle depend not only on the toll route being used but on the class of the vehicle
such as Saloon, Van, Truck, Bus, Multi Axle Vehicles, etc.
25
Following scientific journal Faria & Devkatte, (2017) introduced toll gate automation designed
to record the details like owner's name, registration date, vehicle model, etc. this system is
useful for tracking vehicles automatically, time management, and also for tollgate automation.
The scientific research describes the application of toll gate automation which is a step on the
way to improving the tracking & monitoring of vehicles, traveling in predetermined routes. The
system automatically detects vehicles and records the vehicle code number & time.
In the research paper of Manikandan et al. (2018) examined the RFID based toll deduction
system and how to make well-organized and perfect. The vehicle will be prepared with a radio
frequency (RF) tag which will detect RF reader located in on toll plaza. Then the particular
amount will deduct from the user’s account. This study can be a well-thought-out mountable
device in motor vehicles used today.
In the scientific paper of Blythe, (1989) offered recent experiments in Hong Kong on road-use
pricing, and Berlin and London on route-guidance, it is clear the high-tech development in the
fields of data-communications and Road Traffic Informatics (RTI) will renew the old debate as
to how the use of road system should be charged for. In particular, if vehicles can be charged
for road-use electronically, without stopping them to do so, then the government strategy
towards road-use pricing could be significantly changed, even though the solid communal and
political oppositions might continue to be overcome (Kelly, 2006). The paper is not just
centered on the technical issues posed by automatic toll collection but set within the
social/political context surrounding any widespread implementation of such a policy.
According to Ethiopian Toll Road Enterprise, at Addis Abeba to Adama Expressway user
vehicles are classified into 7 broad classes based on the number of axles, the vehicle weight,
total weight, and the number of tiers.
Suppose, if the vehicle passes the toll plaza having 4 number of tires with 2 axles, to justify the
vehicle character description and to show the result on the display unit, now the vehicle total
height and axle distance from one to the other is required as a parameter. If the vehicle height
less than 1.3 m the description will be small automobiles (class 1) or if the height becomes ≥1.3
m the description will be minibus (class 2). Table 2.3 shows the classification parameters
declared by Ethiopian Toll Road Enterprise.

26
Table 2.3. Vehicle classification for toll
Currently, the price of Tulu Dimtu toll plaza at Addis Abeba to Adama Expressway is tabulated
in Table 2.4.
Table 2.4. Addis Abeba to Adama Toll Road Tariff
In this thesis work the following vehicles are exempted from tolls: from an emergency section
Fire Brigades/Fighting and Medical Service/Ambulance, from the military section such as
National Defense Army, Regional Special Force, Traffic Police & Police Army, and the official
section such as high legislative official rank vehicles including Ministers and Diplomatic
vehicles.
Vehicles Classification Parameters
Class I-Axle
number
II-Tire
number
III-
Height of
vehicles
head(m)
IV-Axle
distance Character
description of
vehicles
Remarks
(m)
1 2 4 <1.3 <2.4
Small
Automobiles At the same time to satisfy
the parameters I, II, and
III or IV in any conditions SUV
2 2 4 ≥1.3 ≥2.4
Minibus
At the same time to satisfy
the parameters I, II, III
and IV conditions
3 2 6 - - Medium Bus,
ISUZU
4 3 - - - Big size Bus
Dump Trucks
5 4 - - - Heavy Trucks
Trailers
6 5 - - - Heavy Truck
Trailers
7 ≥6 - - - Trailers
Heavy Truck
Addis Adama Toll Road Tariff
Toll Category Vehicle Class Toll tariff per KM (ETB)
1 V1-V2 0.76
2 V3 0.82
3 V4 0.97
4 V5-V7 1.05

27
2.6.3 Transaction Processing
Once the vehicle identified, the toll charges need to be billed to the road user and the toll
collected passed to the toll concessionaire. The ETC organization has to keep this monetary
operation reliably and safely. The customer account can be post-paid (more usual), where the
client reserves a balance in his/her account which is then deducted during road service, and the
service charge bill will send to the client at the end of each month via email or cellphone
(Ananthamoorthy, 2017).
Congestion can happen at tollgate due to the manual ticket payment and transaction system.
This problem can be resolved by the implementation of an automated toll system. The country’s
toll enterprise advises that the queuing at the tollgates when exhibited traced air pollution. The
average money transaction period on the existing system was taken approximately 29.8
seconds. The study demonstrates that the automated toll system is more effective than the
manual toll system in terms of reducing the number of queuing vehicles (Karsaman et al., 2014).
2.6.4 Violation Enforcement System
VES captures images of the license plates of vehicles that pass through an ETC tollbooth
without a valid RFID tag or insufficient balance in its account. To identify violated vehicles the
system is well equipped under camera surveillance to take a picture violating vehicle license
plate. Violators are identified immediately, as the barrier will not permit the violator to proceed.
However, the tollgate barriers also might approve clients which are the huge widely held of a
vehicle passing through, to slow a near stop at the toll gate, negating much of the speed and
capacity benefits of electronic tolling. Vehicle Enforcement System (VES) helps in tracking
theft vehicles. Violator recognition and management system are important for the achievement
of an ETC without policies and systems in place for this, an ETC system will simply not work.
Larionov et al. (2017) have examined a system where Automatic vehicle identification is widely
used in traffic rules enforcement systems. Speed cameras as a crucial part of most identification
systems have high cost and rely on clear optical conditions to enable the license plate reading.
Radio identification equipment has essentially lower cost and is more reliable in terms of
weather conditions.
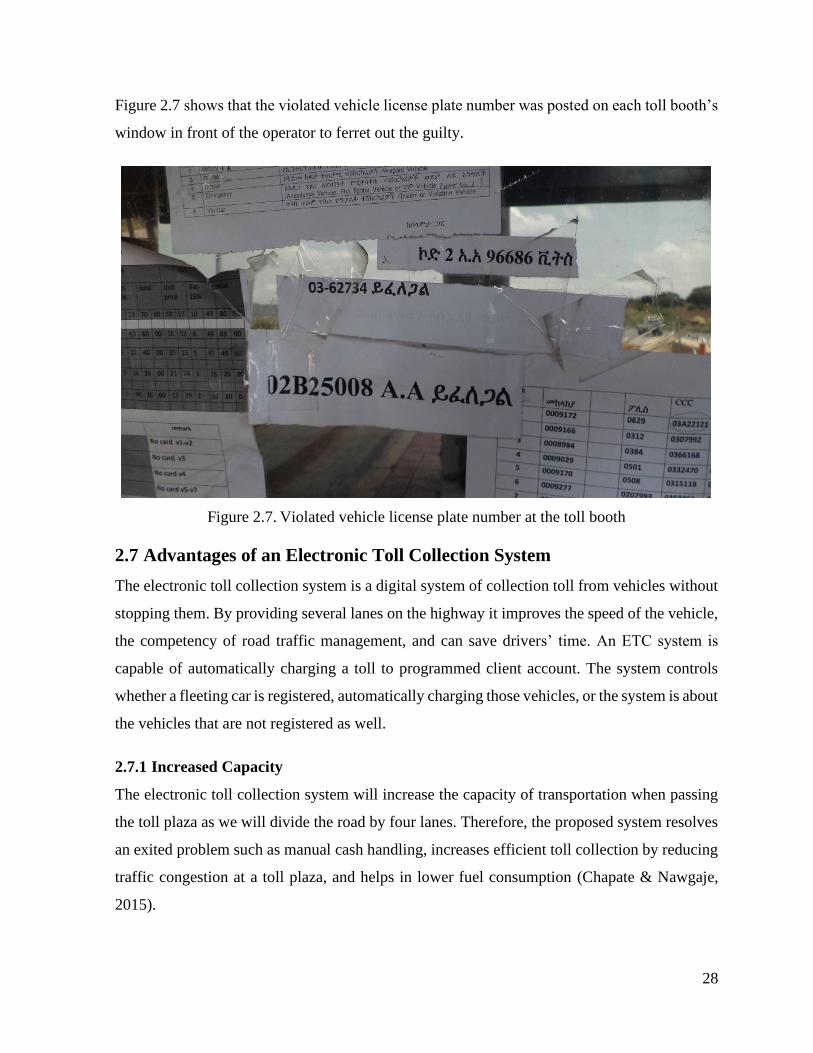
28
Figure 2.7 shows that the violated vehicle license plate number was posted on each toll booth’s
window in front of the operator to ferret out the guilty.
Figure 2.7. Violated vehicle license plate number at the toll booth
2.7 Advantages of an Electronic Toll Collection System
The electronic toll collection system is a digital system of collection toll from vehicles without
stopping them. By providing several lanes on the highway it improves the speed of the vehicle,
the competency of road traffic management, and can save drivers’ time. An ETC system is
capable of automatically charging a toll to programmed client account. The system controls
whether a fleeting car is registered, automatically charging those vehicles, or the system is about
the vehicles that are not registered as well.
2.7.1 Increased Capacity
The electronic toll collection system will increase the capacity of transportation when passing
the toll plaza as we will divide the road by four lanes. Therefore, the proposed system resolves
an exited problem such as manual cash handling, increases efficient toll collection by reducing
traffic congestion at a toll plaza, and helps in lower fuel consumption (Chapate & Nawgaje,
2015).

29
2.7.2 Fuel-Saving
The deceleration, acceleration, and idling are completely disregarded. This results in fuel saving
for the clients using the electronic toll collection system. The waive of acceleration and
deceleration consequences in a reduction in the operating cost of the vehicles.
2.7.3 Time-Saving and Tracking Objects
Radiofrequency identification (RFID) is the advanced technology with wireless use to transfer
data, to automatically identify and track tags that are attached to vehicles (Sangole et al., 2015).
ETC users do not expect to stop for paying toll, thus there is a considerable saving in the travel
time. Beside this reliability is increased as the travel time can be estimated fairly exactly. The
toll collection charge is decreased over some time. There is an absentee in the man-hour
required as the system does not involve any human interaction for the toll operation. Time
saving ETC users do not stop for paying toll, thus there is a significant time saving during pass
across. Besides the travel time, trustworthiness is improved as the travel period can be appraised
honestly precisely.
Manufacturing uses RFID for numerous applications such as access control of person or
vehicle, warehouse stock safekeeping, luggage, fast food establishments, logistics service,
departmental access control in large buildings, and automatic toll system (Ahsan, 2011).
Since RFID technology has been made with much excitement for the past few years. The major
motives for this development it had tagging with a single chip on physical objects such as
places, people or animals, and any things under the control of a computer. RFID technology is
together welcomed as the sign to the Internets of Things, and strong disapproval as hostile
observation technology, and in more thrilling, it is being scared represent as a mark of the Beast
(666) mentioned specifically in the Book of Revelation (“Book of Revelation 13:16,” 1962). An
RFID structure categorized into two infrastructures, the technical infrastructure contains the
real data capture technology embrace of tags, reader and the transmission medium or the logical
infrastructure denotes the overall identification (ID) arrangement instead of things (Fine et al.,
2006).
RFID increases two mains confidential concerns for users secret tracking and inventorying. The
tag responds to the reader's request without notifying their holders or carriers. Thus, where read

30
rang permits, secret scanning of tags is posing a threat to believable. Utmost RFID tags produce
unique identifiers, even tags that keep data with cryptographic algorisms. In consequence, an
individual implanting an RFID tag successfully begins transmission through radio wave with a
personal unique ID to close readers, as long as involving the tagged vehicle for secret tracking.
Such tracking is possible likely even if a fixed tag serial number is casual and holds no inherent
data. The thrill of privacy raises when a tag serial number is combined with personal
information (Juels, 2005).
2.7.4 Vehicle Theft Detection
Today’s biggest problem which is not solved by any system that is the stolen vehicle problem
for that case the stolen or the theft vehicle is the biggest issue. In Ethiopia, the stolen vehicle
rate is increasing day by day and police crime investigation division doesn’t find the stolen
vehicle easily hence more time taken to find the stolen vehicle and robber. (Bhore & Agre,
2017) presented the automated system avoids vehicles stolen and indicates where the location
providing security as anyone can utilize RFID. For security purposes also RFID can be used.
Kodavati et al. (2011), in his scientific research, he concluded by saying that vehicle tracking
system is necessary to prevent any vehicle theft and also allows to remotely control a vehicle
only by a text message. All vehicle information that passing the toll booth is stored in a database
for future reference. It also consists of stolen vehicle directory if that matches the incoming
vehicle then and the message will send to a registered police station (Amol & Nawgaje, 2015).
2.7.5 Tracking Over Speeding
In the developed countries road facilities are a major concern. Current studies show that one-
third of the amount of deadly or serious accidents are associated with over speeding, as well as
changes in the roadway (like the presence of roadwork or unexpected obstacles). A decrease in
the number of accidents and extenuation of their significances is a great concern for road traffic
authorities, automotive manufacturing, and transportation investigation clusters (Amol &
Nawgaje, 2015).
Radio Frequency Identification (RFID) tags are small transponders that reply to interrogations
from an antenna by wirelessly communicating a serial number or similar identifiers. They are
seriously used to trail items in manufacturing surroundings and to tag things in supermarkets.

31
They are typically assumed as an advanced barcode. However, their possible area of use is
much larger (Gurjot et al., 2012).
Singh & Teja (2013) introduced a vehicle alerting speed limit and crash detection system. The
study presents a system that uses Micro-Electro-Mechanical Systems (MEMS), Radio
Frequency (RF), GSM, and GPS technology. The main objective of the study was to introduce
the design of a smart display controller that is designed in a way to suit the car’s dashboard and
present with the alarms of approaching crash and speed limit.
Al-shabibi (2019) introduced an automobile speed violation detection system using
radiofrequency and GSM technologies. The system built with two radio frequency readers
along with a passive radio frequency tag that is attached to the vehicle via PIC 18f45k22 and
the GSM module is used to inform the current vehicle condition to the vehicle’s owner and
police station through Short Message Service (SMS). Furthermore, a picture of a vehicle is
taken via the camera and a fine is charged when the speed limit is exceeded.
Thomas et al. (2014) proposed an automatic speed control of vehicles using radiofrequency. In
this research, the speed of vehicles can be controlled within a certain limit in restricted zones
without interruption of the drivers. The RFID tags are posted at the regions and the antenna is
attached to the vehicle. The coded signal has sent from the tag when the antenna closes to the
surrounding. Whenever the vehicles arrive into these regions their receivers will receive this
code and the speed of the vehicles is controlled automatically with the help of the
microcontroller unit present inside the vehicle. The tags are placed at the beginning and the end
of the regions for which the speed should be reduced.
Hafeez et al. (2015) designed and implemented a smart vehicle speed monitoring system-using
radio frequency where the monitoring system stations are placed on different locations. Each
car has its RFID tag and each station through RFID and cameras system is saving the
information of vehicles like vehicle identity, a time when it is crossing, speed, pictures, etc. The
RFID reader will save information for all these vehicles, which are passing through this RFID
reader. Every station is connected to the main database station, which is collecting data from
all these stations.

32
Car over speed checking system using RFID module including reader and tag is another type
of application that is utilized on vehicles (Ilyas, 2008). This is achieved with the help of two
readers positioned at a distance. Each car has its RFID tag, the monitoring system stations are
placed at different locations. The RFID reader saves the information of the car such as the time
it is crossing, speed and displays the information on the LCD. The minimum time it will take
the car to pass the two readers, have already been calculated with the help of the specified speed
and the distance. Using the Arduino Uno (Monk, 2013), if it takes any car lesser time to pass
the specified time, it indicates over speeding.
If the vehicle travels above the prearranged speed limit the new system will track with 100 %
accuracy. In the research paper of (Hafeez et al., 2015) it is suggested that RFID can be used
other purposes like managing database of vehicles speed, locations, car identity, etc. the main
objective of this RFID is particularly using in access control, a navigation system, human
identification, managing database, and lot more areas. The authors have discussed one of the
possible ways of RFID based system which can manage database and generate traffic fine for
the vehicles violating speed limits all plazas are expected to equipped with an RFID reader,
speed checking camera, and snap camera. The monitoring system stations are placed on exit
and entry points respectively. In each station through RFID reader and cameras system is saving
the information of particular vehicle identity, time of vehicle crossing, speed rang, picture of
the vehicle color effectively. This intelligent system can be implemented especially for speed
monitoring of vehicles, also to identify the last location of vehicle and status of vehicle how to
monitor the speed of vehicles using RFIDs and how to take necessary action like fining based
on over speeding and violation of road sign rules.
2.7.6 Pollution in an Environment
On the manual toll booths, the vehicles are getting congested into multiple queues and the driver
of the vehicle will not turn off the engine and the carbon-di-oxide will get outside into the
environment for a long time at one place that increases county’s air pollution (Kieu et al., 2015).
With the number of vehicles increasing every year, the time and fuel wasted on waiting at the
toll plaza is ever increasing. An automated toll system used for toll collection without making
traffic congestion and waiting in a long queue with the help of RFID techniques (Bhisikar et

33
al., 2017). Due to the long queue and congestion results in toxic gas coming out from the
exhaust pipe as shown in Figure 2.8.
Figure 2.8. Toxic gas coming out from vehicles
The main atmospheric contaminants are particulate matter, carbon monoxide, Sulphur dioxide,
nitrogenous oxide, and volatile organic compounds. Also, many heavy metals are existing in
particulate matter in the air. The particulate matter in the air is a compound mixture of organic
and inorganic elements ranging from sea salt and soil atoms to dust particles produced by
burning fossil fuel. Particulate matter from the combustion can be emitted directly in the form
of elemental and organic carbon, or it can form in the atmosphere form other contaminants.
Carbon monoxide (CO) is an odorless, colorless gas that comes about because of incomplete
combustion. Sulfur dioxide (SO2) is a colorless gas that occurs because of the presence of
Sulphur in the fuel (diesel). The most important nitrogenous oxides are nitric oxide (NO) and
nitrogen dioxide (NO2). NO2 absorbs light in the visible range which lessens visibility.
2.7.7 Wastage of the Paper
The existing system is the manual system, in that the payment of the toll tax is by hand and
after the payment, the toll admin gives one paper receipts to the driver by this the paper wastage
get an increase (Priya, 2017).

34
2.8 Why RFID
Passive RFID, besides satisfying the functional requirements for transmit greater amounts of
data at much faster rates than the loop system, and is the cheapest solution available in the local
market. It is also a reliable, tested solution, despite being a relatively new technology. It is
extremely simple to use and administer, requiring no actions on the part of the user (the sticker
itself can be stuck on the vehicle by the auto vendor or maybe the manufacturer). It should be
emphasized that the most persuasive reason in favor of passive tags is the cost and low
maintenance, and requires no battery replacement or any other action on part of the user.
Summary of literature review: based on a subsequent deep study on the related scientific
analysis of the researches mainly focused on the detection, the classification, and the technique
of controlling things using RFID and microcontroller is reviewed. Besides this to bring a fast
and safe transportation system in the country, the way of increasing service capacity, efficiency,
and trustworthiness, and fuel consumption for measured results of queue length both on the
ETC system and the manual system are carefully considered into account.
Research gap: in fact, applying an RFID to automate the toll system was a recent technology
around Europe and the USA. To detect a particular vehicle the antenna was set above on
transom or it might be posted on the roadside (pavement). And the RFID tag has adhere to the
windshield at the onboard unit (OBU). Hence, the system required an active radio frequency
rather than passive radio frequency to detect vehicles from a far distance.
On both the manual and automated toll road, the minimum speed limit near a toll plaza was not
stated and the required international roadside traffic signs are ignored.
The automated system requires sufficient balance in his/her account. But the most common
widely used around Europe and the United States of America is a Postpaid system. Then the
client will receive the total service issued charge bill at the end of each month through cellphone
or email from the ETC.
From this thesis work, the outcome enables to deliver instant and efficient expressway
transaction could take place within a few seconds (not more than 6 seconds) and the system is
not yet implemented in Ethiopia as well as in Eastern Africa.
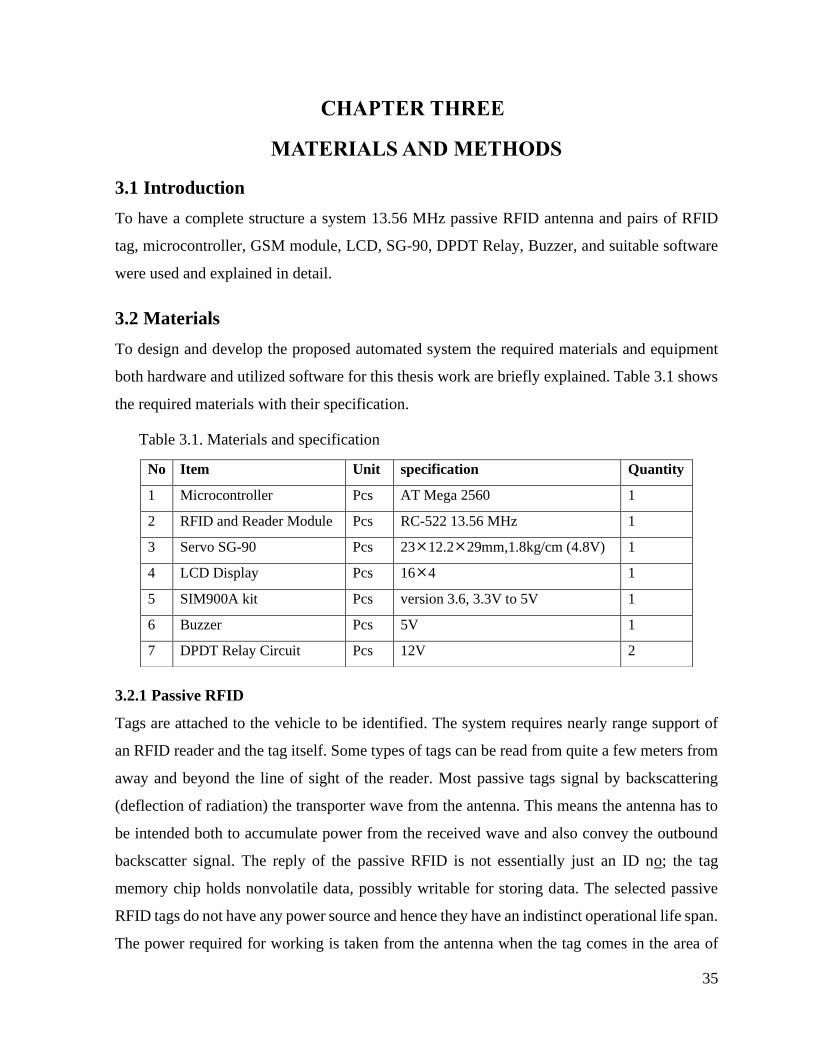
35
MATERIALS AND METHODS
3.1 Introduction
To have a complete structure a system 13.56 MHz passive RFID antenna and pairs of RFID
tag, microcontroller, GSM module, LCD, SG-90, DPDT Relay, Buzzer, and suitable software
were used and explained in detail.
3.2 Materials
To design and develop the proposed automated system the required materials and equipment
both hardware and utilized software for this thesis work are briefly explained. Table 3.1 shows
the required materials with their specification.
Table 3.1. Materials and specification
3.2.1 Passive RFID
Tags are attached to the vehicle to be identified. The system requires nearly range support of
an RFID reader and the tag itself. Some types of tags can be read from quite a few meters from
away and beyond the line of sight of the reader. Most passive tags signal by backscattering
(deflection of radiation) the transporter wave from the antenna. This means the antenna has to
be intended both to accumulate power from the received wave and also convey the outbound
backscatter signal. The reply of the passive RFID is not essentially just an ID no; the tag
memory chip holds nonvolatile data, possibly writable for storing data. The selected passive
RFID tags do not have any power source and hence they have an indistinct operational life span.
The power required for working is taken from the antenna when the tag comes in the area of
No Item Unit specification Quantity
1 Microcontroller Pcs AT Mega 2560 1
2 RFID and Reader Module Pcs RC-522 13.56 MHz 1
3 Servo SG-90 Pcs 2312.229mm,1.8kg/cm (4.8V) 1
4 LCD Display Pcs 164 1
5 SIM900A kit Pcs version 3.6, 3.3V to 5V 1
6 Buzzer Pcs 5V 1
7 DPDT Relay Circuit Pcs 12V 2

36
the reader or antenna. Tags are available in a variety of sizes ranging from sizes that can fit into
an adhesive label. The passive RFID is made up of three parts: Antenna which is in charge of
taking the energy and transferring the tag ID, Semiconductor chip attached to the antenna, and
encapsulation which keeps the tag integrity. The encapsulation keeps the antenna and chip from
severe weather conditions. These encapsulations can be made up of small glass vial or from a
laminar plastic substrate with adhesive on one side so that it can be easily attached to the goods.
Tags either may be read-only, having a factory-assigned unique serial number that is used as a
crucial into a database or maybe read/write where the object precise data can be written into the
tag by the system user. Figure 3.1 Passive RFID module and tags are shown below.
Figure 3.1. Passive RFID antenna and tags
3.2.2 Transponder (Antenna)
A transponder is generally known as RFID tags stores the data according to the application and
are available in a variety of shapes and sizes according to the application. Often, the system
consists of a slight RF transmitter and receiver. The reader transmits a programmed wireless
signal to interrogate the tag. The tag receives the inquiry and then responds with its unique
identification information. This may be unique tag encryption or maybe vehicle Id no, license
plate number, owner’s information, or other detailed data.
The antenna communicates with a tag by sending an encoded radio signal to interrogate the tag.
The tag receives a given wave then responds to the embedded message with its identification
information. The transponder can detect many different RFID tags at the same time as long as
the tags are inside the read range of the antenna. The antenna acts as the sensor as well as the
interface between RFID transponders and Information Processing System (IPS).

37
The three types of antenna/transponders are categorized as follows: Type I is (ready only) which
means all the data are read from the tag status (lost, valid, etc.), Type II is (both read/write)
means allows the information to be retrieved from or written onto the tag, Type III (both
read/write with an interface to display device or an onboard computer, also called a smart
transponder) are capable of two-way communication between the onboard unit (OBU) and the
roadside antenna. The onboard unit consists of a smart card, smart card reader, and transponder.
The smart card which has a microprocessor chip embedded in the wafer-thin plastic varies in
memory size and computing power. All smart cards can process data and store the required
information. In this thesis work read/write type II antenna has been selected.
3.2.3 LCD
It is called (Liquid Crystal Display). The 164 (A 164 LCD means it can display 16
characters per line and there are 4 such lines with 58-pixel matrix characters) LCD used to
display the present information of all in the system generated data which is coming from the
controller unit. LCD provides an interactive user interface and the unit requires +5V DC to
operate properly. The power condition is characteristically in the order of microwatts for the
LCD because it is a low power device. However, it might an external or internal light source.
It is limited to a temperature range of about 0 to 600 C and the response time in the range of 100
to 300ms. The lifetime is steadily increasing beyond 10000+hours limited and the color
generated by the LCD is dependent on the source illumination. The following Figure 3.2 and
Figure 3.3 LCD Screen and Pin diagram of LCD are shown below.
Figure 3.2. LCD Screen Figure 3.3. Pin diagram of LCD
3.2.4 ATMEGA 2560 Microcontroller
The major heart of the system is a microcontroller. ATmega is a microcontroller board based
and an open-source programmable circuit board that can be integrated into both simple and

38
complex. Entirely it has 54 digital input/output pins including 14 pins used as PWM outputs,
16 analog inputs, 4 hardware serial ports, 16-MHz crystal oscillators, a USB connection, a
power jack, an In-Circuit Serial Programming (ICSP) header, and a reset button. By receiving
input from various sensors and can interact with a large collection of outputs such as LEDs,
motors, and displays. Because of having 256 KB of flash memory for storing code, flexibility,
and low cost, the device has become a very popular choice looking to create interactive
hardware developments. The programing of an ATmega 2560 can be done with the help of the
Integrated Development Environment (IDE) and supports C-programming language. Figure 3.4
shows an ART Microcontroller below.
The board can work properly plugged in with a recommended range of 7 to 12 volts. The power
pins are as follows:
VIN= the input voltage to the ATmega board when it’s using an external power source.
5V= the regulated power supply used to power the microcontroller and other
components on the board.
3.3V= a 3.3-volt (50mA current) supply generated by the on-board regulator.
GND= ground pins.
Figure 3.4. ART Microcontroller

39
3.2.5 Servo SG-90
The name used servo the motor rotates through a fixed angle step in response to each input
current pulse received by its controller. Servo motors have an angle range of 0° to 180° and
controlled through a computer, microprocessor, and programmable controllers by sending a
pulse of variable width. The parameters for this pulse are that it has a minimum pulse, a
maximum pulse, and a repetition rate. To control the speed of the servo, the switches are open
and close at different rates to apply average voltages across the motor. The angle is determined
by the duration of a pulse that is applied to the control wire. This is called pulse width
modulation. The servo expects to see a pulse every 20ms. The length of the pulse will determine
how far the motor turns. Given the rotation constraints of the servo, neutral is defined to be the
position where the servo has the same amount of potential rotation in the clockwise direction
as it does in the counter-clockwise direction.
It is important to note that different servos will have different constraints on their rotation but
they all have a neutral position, and that position is always around 1.5 milliseconds (ms) pulse
will make the motor turn to the 90-degree position (neutral position). When a command pulse
received each time the output shaft rotates in a series of discrete angular intervals. When the
number of pulses supplied is definite then the shaft of the servo motor turns through a definite
known angle. Due to this the servo motor is suitable for open-loop position control because no
feedback needs to be taken from the shaft. The only moving part through a servo motor is a
rotor, which is brushless and has no commutator, and windings. This feature makes it quit,
strong and consistent. A servo motor is a motor that forms part of a servomechanism which
converts electrical energy into mechanical energy. It is possible to achieve very low-speed
synchronous rotation with a load that is directly coupled to the shaft. Figure 3.5 SG 90 Servo is
shown below.
Figure 3.5. SG 90 Servo

40
3.2.6 GSM
GSM stands for Global System for Mobile communication (GSM) originally from Groupe
Special Mobile the most popular standard for mobile phones in the world. It is also pioneered
to a low-cost alternative to short text messages which is now supported on all mobile standards
and it supports voice call and data transfer speeds of up to 9.6 kbps together. The idea of GSM
was developed at Bell Laboratories in 1970. It is a widely used mobile communication system
in the world. GSM is an open and digital cellular technology used for transmitting mobile voice
and data services operate either 900 MHz or 1800 MHz frequency bands. GSM system was
developed as a digital system using Time Division Multiple Access (TDMA) technique for
communication purposes.
A GSM digitizes and reduces the data, then sends it down through a channel with two different
streams of client data, each in its particular time slot. The digital system can carry 64 kbps to
120 Mbps of data rates. There are various cell sizes in a GSM system such as macro, micro,
Pico, and umbrella cells. Each cell varies as per the implementation domain. There are five
different cell sizes in a GSM network macro, micro, Pico, and umbrella cells. The coverage
area of each cell varies according to the implementation environment. Figure 3.6 GSM module
with antenna is shown below.
Figure 3.6. GSM module

41
3.2.7 DPDT Relay Circuit
DPDT stands for the double-pole double-throw relay which is an electromagnetic device used
to separate two circuits electrically and connect them magnetically. They are often used to
interface an electronic circuit, which works at a low voltage to an electrical circuit that works
at a high voltage. Figure 3.7 DPDT Relay is shown below.
Figure 3.7. DPDT Relay
3.2.8 Buzzer
A buzzer is an integrated structure of electronic messages ringers, DC voltage power supply,
bare widely used in computers, printers, copiers, alarm, electronic toys, automobile electronic
equipment, telephones, timers, and other electronic products for hair sound device. Figure 3.8
Buzzer is shown below.
Figure 3.8. Buzzer
3.2.9 LED
LED is the acronym for “Light Emitting Diode”. LEDs are semiconductor devices that produce
light. These were initially used as indicator lights but are now used extensively for indoor and
outdoor lighting. In the simplest terms, a light-emitting diode (LED) is a semiconductor device
that emits light when an electric current is passed through it. Light is produced when the

42
particles that carry the current (known as electrons and holes) combine within the
semiconductor material. Figure 3.9 LED lamp is shown.
Figure 3.9. LED lamps
3.2.10 Jumper Wires
Jumper wires are simply a wire that has connector pins at each end, allowing them to be used
to connect two points without soldering. Jumper wires are typically used with breadboards and
other prototyping tools to make it easy to change a circuit as needed. Figure 3.10 Jumper wires
are shown.
Figure 3.10. Jumper wires
3.3 Software
The microcontroller was programmed using the C programing language. The software used to
design and develop the automated vehicle detection and toll system using RFID is described
below.
3.3.1 Arduino IDE
The Arduino Integrated Development Environment (IDE) is a cross-platform application for
the various operating system that is written in functions from C language. The software allows
programmers to combine the different features of writing a computer program and used to write
and upload programs to Arduino compatible boards. The Arduino IDE supports the languages

43
C and C++ using special rules of code structuring. The Arduino IDE supplies a software library
from the wiring project, which provides many common input and output procedures. An IDE
allows developers to start programming new applications quickly because multiple utilities
don’t need to be manually configured and integrated as part of the setup process. The features
such as to save time, to organize the workflow, and solve problems.
The Arduino IDE employs the program avrdude to convert the executable code into a text file
in a hexadecimal encoding that is loaded into the Arduino board by a loader program in the
board's firmware. By default, avrdude is used as the uploading tool to flash the user code onto
official Arduino boards. Arduino IDE is a coding software that makes the programming world
more accessible to beginners with its simple interface and community-driven system. However,
Arduino IDE makes coding so much simpler for beginners. It is, in essence, a text processor
with programming-specific functions.
3.3.2 Embedded C Program
C is a general-purpose, procedural computer programming language supporting structured
programming, lexical variable scope, and recursion, while a static type system prevents
unintended operations. By design, C provides constructs that map efficiently to typical machine
instructions and has found lasting use in applications previously coded in assembly language.
Such applications include operating systems and various application software for computers,
from supercomputers to embedded systems.
C language was designed to be compiled using a relatively straightforward compiler to provide
low-level access to memory and language constructs that map efficiently to machine
instructions, all with minimal runtime support. Even with its low-level proficiencies, the
communication was intended to inspire cross-platform program design. The ideals yielding C
program written with portability in mind can be organized for a wide diversity of computer
platforms and working principle with few changes to its basic code.
The language is existing in numerous types of stages, from embedded microcontrollers to
supercomputers.

44
3.4 Method
3.4.1 Tollgate Location
This study was carried out at Addis Abeba to Adama Expressway which the country’s first high
way is situated in North West Shewa, Oromia, Ethiopia, its geographical coordinates are 9° 41'
0" North, 38° 40' 0" East near to Addis Abeba, Ethiopia. Figure 3.11 shows the satellite location
of Addis to Adama Expressway.
Figure 3.11. The satellite location of the expressway from Tulu Dimtu to Adama
3.4.2 Research Approach
This study assumed both qualitative and quantitative approaches. The qualitative research
method is valued to study as interviews with tollgate officers, system administrators, and
authorized personnel at Ethiopian Toll Road Enterprise about the existing system in words and
analyzed through interpretations and categorization.
The quantitative method is a process of collecting and analyzing numerical data. It can be used
to find patterns and averages, make to organize results of the number of vehicles that pass
through the toll plaza (per hour, per a day, per month), the time delay during a transaction and

45
to calculate the toll capacity and queue length of the vehicles per lane in numbers and graphs,
and analyzed through statistical methods of the populations.
3.4.3 Preparation and Data Collection
Data collection is a systematic process of gathering relevant observations and measurements.
The quantitative data collection consisted both of primary and secondary survey data. The
primary data namely the number of vehicles pass the gate per year, toll information, and usage
(surveyed both telephones based and internet-based) obtained from the main office system
administration officer at Ethiopian Toll Road Enterprise, Tulu Dimtu. Whereas the secondary
data were obtained from direct field observation measurements. The importance of the research
design stems from its role as a critical link between the theory and argument that inform the
research and the empirical data collected (Seem et al., 1988).
3.4.4 Sampling Technique
To draw a valid conclusion from the result, the type of sample technique used in this thesis
work is a probability sampling method of simple random sampling. The technique which
involves the random selection of all kind vehicles has an equal chance to make a statically
inferences about the whole field survey.
Simple Random Sampling- in this type every member of the population has an equal chance
of being selected including the whole population means (all types of vehicles are considered
equally).
3.4.5 Sample Size
600 various types of vehicles together with from small automobiles to heavy-duty vehicles at
both gasoline and diesel vehicles are observed and measured their transaction delay time at each
tollgate. All these samples are collected on daytime at several hours a day (3:00 to 10:00)
Monday to Friday.
3.4.6 Methods of Data Analysis
The best technique recommended for an overview interpretation of the data is descriptive
techniques. Because it aims to accurately and systematically describe a population situation or
phenomena.

46
3.4.6.1 Vehicle Arrival Times
Observation of arrival times was performed by counting the number of vehicles that enters to
the tollgate at a certain time point. All the existing tollgates are selected for each of the field
surveys operated by a different operator at different times. The first step was to determine the
point of the longest tollgate having nine-lane boundaries, where the speed of the vehicles was
still constant when they entered to the tollgate. The next step was to count the number of
vehicles every 5 minutes.
3.4.6.2 Average Transaction Time Delay
The transaction time of each vehicle incoming the booth was recorded using a stopwatch. A
total number of 600 vehicles at all tollgates were surveyed in this study, mainly at Tulu Dimtu
Main Toll Plaza. The transaction time started from the time of the driver provided the toll
payment, followed by the time the toll operator received the money and ended at the time the
driver got out to receive the change and/or receipt. The average transaction time at the toll plaza
was 29.8 seconds. The following Table 3.2 illustrated the total time transaction and delay time
at the main toll plaza.
Table 3.2. The average transaction delay time (second)
3.4.6.3 Collected Data Adequacy
The required number of vehicles was calculated based on the degree of accuracy and the level
of confidence. For each six tollgate’s 100 vehicles were surveyed respectively. The test was
performed using the following formula (Rouphail et al., 2001).
𝑁′ = [
40√𝑁𝛴𝑗2 − [𝛴𝑥𝑗]2
𝛴𝑥𝑗]
2
(1)
Where:
N’= Number of measurements required
N = Number of observations
Xj= Simulation variables
Tulu Dimtu Main Toll Plaza Total Average Transaction
Tollgates Toll
gate 1
Toll
gate 2
Toll
gate 3
Toll
gate 4
Toll
gate 5
Toll
gate 6
Average
transaction
Average Trans 29.478 30.2004 30.5251 30.3252 28.3546 29.4269 29.8
No of vehicles 100 100 100 100 100 100

47
The sample test calculation at Tulu Dimtu Main Plaza on five tollgates as follows;
𝑁′ = [40√600(29.4782 +∙∙∙ +29.42692) − (29.478 +∙∙∙ +29.4269)2
(29.478 + 30.2004 +∙∙∙ +29.4269)] 2
𝑁′ = 398.19
𝑁′ =398.19
600100 = 66.4 %
∴ the collected data are sufficient
However, if the sample size is too small, one may not be able to detect a significant present
consequence, whereas samples that are too large may waste time, resources, and money. Hence,
it is necessary to optimize the sample size. Moreover, calculating the sample size in the design
phase of the study is gradually becoming a prerequisite when looking for ethical board approval
for a research project (Noordzij et al., 2010).
3.4.6.4 Data Analysis
The descriptive technique is a better technique for this thesis for an overview interpretation of
the data. Descriptive technique statistically is the mode. Then, the model refers to the most
frequently occurring value in the data set to provide a general overview of the variables being
studied (Oates, 2006). The obtained data were analyzed to determine the length of the queue
and the capacity of the gate based on a fixed arrival level (λ) at various service times (µ) for the
payment systems at the existing (manual) system. The work program and the analysis diagram
are shown in Figure 3.11 given below.
Figure 3.12. Work and analysis diagram
Service Time Toll Booth capacity
µ=3600 Booth capacity Door
Open/close system
Input data (λ and µ)
Queueing
theory
calculation
Manual Toll
System
Length of queue for
each system
Electronic
Toll System

48
Based on the field surveyed analyzed data obey the Poisson distribution model. To obtain the
average transaction time and the service level capacity can be shown in the following formula
(Xing et al., 2016):
𝑝𝑟(𝑘) =
(𝑞𝑟𝑡)𝑘𝑒−𝑞𝑟𝑡
𝑘! (2)
Where:
𝑝𝑟(𝑘)= the probability of k car arrives within the time interval t;
qr= the arrival rate of vehicles
t= interval time
The arrival vehicles analyses obtained by the following distribution:
𝑝𝑠(𝑘) =(𝑎𝜆)𝑘
𝑘!𝑒−𝑎𝜆(𝑇−∆𝑡) 𝑘 = 0,1,2,3, …
(3)
3.5 Design Aspects
To design the new system many factors should be considered includes Security,
Communication, reliability, and safety issue.
3.5.1 Security
Once the RFID tag delivered to the client, the enterprise has a mislaid regulator over the
component and the device must be designed to prevent cause damage. The toll plaza and the
external equipment are all subjected to theft and destroy deliberately by oneself. Security at this
unit is necessary. One way to increase security is requiring that all the enterprise employee has
to use an identification badge.
3.5.2 Communication
Communication between the vehicle tag and the antenna is one of the key system elements. The
three-communication links: between toll lane and tollbooth, between tollbooths, and between
tollbooths and the host computer. The link needs to utilize easy-to-install equipment that
operates through all vehicles and under all weather conditions. The communication link must
be secure and dependable. The vehicle code is transmitted through RFID communication
between the vehicle and the toll plaza. An RFID module, in combination with a modem, is used
to transmit and receives electromagnetic signals (Sharma et al., 2016).

49
3.5.3 Safety
Safety is a very important issue. Retrofitting existing system, where automated and the manual
toll is to be placed contagiously, is usually more difficult, safety-wise than building a new
infrastructure that separates the two different payment methods.
3.5.4 General Observation
The working condition plays a very vital role while designing and realizing the RFID
applications. Metal substances (metal-foil wrappers) and wide-range electrical noise in the area
of tags, extreme working temperatures, the existence of fluids, and physical obstacles can
extremely disturb the performance of the system. To have a better and reliable system the
surrounding area must be a “clear zone” rather than obstructed.
3.6 Tests and Results for System Design Modules
1. Automatic Vehicle Identification and Classification System
2. Violation Enforcement System and Theft Identification
3.6.1 Automated Vehicle Identification and Classification System
In this section, to identify and classify the arrival vehicle authenticated by a microcontroller. In
the detection process, the detectable connection is the basic speed measurement unit. The length
of the detectable link is determined by the detection range.
Whenever any person buys a vehicle, the first thing to be done is to get his or her vehicle
registered at the Road Traffic Authority (RTA) office. RTA officials will not only dispense a
number plate to it but also will give an RFID enabled tag. This card will have a unique ID
feasible to use with that vehicle only. The vehicle owners can also create an account for the use
of that particular embedded tag and maintain transaction history in the database. All registered
user is expected to deposit some minimum amount to their account. Every time a registered
vehicle approaches the toll booth, first, the infrared sensors will detect the presence of the
vehicle. It will, in turn, activate the radio frequency circuit to read the radio frequency enable
tag fixed on the rear-windshield of the vehicle. The transaction will begin; depending upon the
balance available toll will be deducted directly from the user’s account. The software further
updates the details in the centralized database server. It also triggers a mechanism to generate
the bill and will be sent to the user as a text message.

50
3.6.2 System Design of Automatic Vehicle Detection
The designed system using RFID was classified into two modules i.e. the vehicle module which
is consisted of a passive RFID tag and the base module consisted of the host computer, the radio
frequency reader, the system, and the gate control system. The detection system set its basis on
the communication between vehicle-embedded tags and roadside readers:
➢ Every vehicle will tag with RFID Tag. Whenever the vehicle reaches the coverage area
of RFID receiver detects tagged vehicle through radio frequency signals with the help
of sensors and the data are then forward to microcontroller situated at the toll station.
➢ Then all the data corresponding to that particular vehicle will be sent to the database.
Microcontroller recognizes the code and data automatically access from a database. At
the same time toll payment will also be done.
➢ If the vehicle has its correct data and valid prepaid account at the toll station, the
appropriate toll is deducted from that account and the gate will open to allow the vehicle
to pass.
➢ If the vehicle doesn’t have a correct data and insufficient prepaid account or it is not a
daily traveler, alerts are buzz to warn and it will have to pass through a manual check
post which will be in another lane.
➢ The front-end LCD will display the details of the vehicle owner’s account on the screen
information such as Owners/Drivers Name, Vehicle ID and License Plate number, Date,
Time, and complete description of the owner’s account which is stored in a database.
Simultaneously a text message will be sent to the owner of the vehicle.
➢ As long as the RFID tag information is correct and if the account balance is sufficient,
the tollgate barrier will open to pass the vehicle easily.
The general RFID base toll system image in Figure 3.12 and the block diagram of the automatic
vehicle detection system is described in Figure 3.13.

51
Figure 3.13. RFID based automatic vehicle detection
Figure 3.14. Automatic vehicle detection flow chart
RFID
Reader Get
barrier
Detect the RFID
Installed Tag
No Yes
Start
Sufficient balance
No Update the
balance
Yes
Display the
information on LCD
Toll gate open
Deduct the
balance
Send a text
message
End
Register

52
3.6.3 Design of Automated Vehicle Identification
➢ Antenna and Mounting System: - Except for tag frequency, the antenna is also a key
for effective detection range. Certain kinds of antenna corresponding to the type of
adapters. The antennas are mounted over the road and connected to adapters. They are
an active part of the detection process.
➢ On-site Computing and Data-storing Unit and Local Database Server: - The on-
site calculation and data storage is realized with laptops. The computing and data
processing speed of a laptop is fast enough to handle the work. As taken in the real
situation, one set of the sensor has a corresponding computing and storing unit. The
vehicle’s travel information is stored and shared data with other on-site units through
the internet on a real-time basis. The calculated and processed performance data (travel
time, speed) are archived in the local database server. The following Figure 3.14 the
flow chart of the automatic vehicle classification is shown below.
Figure 3.15. The automatic vehicle classification flow chart
3.6.4 Design of Transaction Process
The transaction designs every time a registered vehicle approaches the toll booth, first the
Infrared sensors will detect the presence of the vehicle which in turn activates the RFID circuit
Start
Detect the RFID tag
System
Authentication
Tag classification To process Alert
Yes No
End

53
to read the RFID enable smart card fixed on the windscreen of the vehicle. The transaction will
begin, depending upon the balance available toll will be deducted directly or the vehicle will be
directed towards another lane to pay tax manually. The software further updates the details in
the centralized database server. It also triggers the mechanism to generate the bill and will be
sent to the user as a text message.
3.6.5 Design of Violation Enforcement
When used for electronic toll collection, the Video Enforcement System (VES) captures images
of the license plates of vehicles that pass through an ETC tollbooth without a valid ETC tag.
Although the deployment of these technologies makes the initial cost of installation very high,
there exit huge benefits accompanied by such high investment. Figure 3.15 the flow chart of
automatic vehicle violation enforcement shown below.
Figure 3.16. Automatic vehicle violation enforcement flow chart
3.6.6 Design of Vehicle Anti-Theft Detection
When a vehicle is stolen the owner might register his complaint to the local Road Traffic
Authority (RTA) reached personally with its registration ID and unique RFID tag number.
Start
Valid RFID
tag
Detect RFID
Authorization LCD displays
You can pass
LCD displays you cannot pass
+ Buzzer
Image capture
Gate open
End
Correct In Correct
Tollgate remains
closed

54
Whenever any vehicle owner registers a complaint at the RTA office regarding the theft of the
vehicle respective entry is made in the database. Now any vehicle arriving at the toll booth with
the same ID as already listed in the stolen vehicle category will be easily identified as the ID
assigned with its unique then it automatically stops the vehicle.
➢ A buzzer will be alarm and also SMS is sent to authorize mobile number, registered
police station with specifying RFID number using GSM module.
➢ LCD will display the stolen vehicle is present.
All the toll plazas will be connected along with the centralized server in the form of LAN.
Updates of any sort of transaction will be immediately updated to the local database and a
centralized server. Figure 3.16 (A) and (B) show the tag installed on the vehicle and Figure 3.17
shows the technique of detection system of complaint vehicle anti-theft from the database.
A)
B)
Figure 3.17. RFID tag installed on the vehicle
RFID tag
RFID tag

55
Figure 3.18. Automatic vehicle anti-theft detection
Update
balance
No Yes
Deduct the
toll amount
Update the balance
and database
Send a text message
to client
End
Detect RFID tag
Tag present
Registered/stollen
number
Match in
database
Alert + Red light
LCD display
stollen
Tollgate remains
closed
Sufficient
balance
Yes No
Registe
r
Start

56
RESULTS AND DISCUSSION
4.1 Introduction to the Design Principles
As per the desired proposal to enhance the automatic vehicle detection and payment system of
a low-frequency RFID within a recommended rang and the other components with their correct
specification are required. The devices to fulfill the thesis work keep on the correct place and a
source voltage for all electronic devices should be regulated accordingly. To control the process
of the embedded C language operating system the codes of a program should be written clearly.
The vehicle detection experiment with the help of RFID has been done by attached to a real
vehicle. Figure 4.1 illustrated the way of detecting a particular vehicle at a given time showed
by the flow chart diagram. Whenever the RFID tagged vehicle reaches the RF coverage area
and range, the antenna generates an electromagnetic wave then the communication takes place
between the vehicle tag and RFID antenna.
Figure 4.1. Block diagram of automatic vehicle detection
4.2 The Experiment Site and Data Source
4.2.1 Tulu Dimtu Main Tollgate
At Addis Abeba to Adama Expressway (AAE) has 19 entries, of which Adama Main 4 entries
and 7 exits, Adama West A 2 entries and 2 exits, Adama B 2 entries and 2 exit from Adama
(Nazareth), 3 entries and 3 exits booths from Modjo, 2 entries and 3 exits booths from Dukem,
2 entries and 3 exit booths from Beshoftu (Debrezeyit), Tulu Dimtu 4 entries and 9 exits to
Addis Abeba, with one special lane for heavy-duty vehicles and 29 exits vice versa. Figure 4.2
shows the expressway main toll plaza entry at Tulu Dimtu.
➢ Tag ➢ Reader
➢ Microcontroller ➢ Database (pc)
➢LCD control ➢Buzzer control ➢Gate
RFID
Signal
Processing
Control

57
Figure 4.2. Tulu Dimtu main toll plaza, Addis Abeba
4.2.2 The Transaction Delay Time (sec)
The Indonesian Highway Capacity Manual (Aly, 1995) defines capacity as the traffic flow to
be maintained in a certain highway segment at a certain condition per a certain time of period.
For a tollgate, the conditions that can affect tollgate capacity are driver behavior toll tariff, the
skill of the toll collector, and the payment or collection mechanism (Golden et al. 1982). Hence,
tollgate capacity can be defined as the maximum number of vehicles that can be serviced in a
certain period. Tulu Dimtu Toll Plaza, Addis Abeba to Adama Expressway (AAE) calculated
tollgate capacity C = 3600/service-time, with service time taken as average 29.8 seconds.
To improve the method of the manual toll transaction system, the calculation of the transaction
time and the tollgate capacity should be conducted. This thesis work presents the evaluation of
a queueing model and tollgate capacity based on vehicle arrival time and required transaction
time.
The following charts are demonstrating an example of the field observation data of the traffic
flow and the transaction delay time fluctuation (s) at Tulu Dimtu Main Toll Plaza at Addis
Abeba.

58
Figure 4.3. Transaction time at Tulu Dimtu Main Toll Plaza toll gate one
In this section, the graph located toll gate one at Tulu Dimtu. A total of 100 vehicles were
surveyed for several hours a day (one week). The transaction fluctuation between 19 to 48
seconds. The average transaction is about 29.478 seconds.
Figure 4.4. Transaction time at Tulu Dimtu Main Toll Plaza toll gate two
In this tollgate the transaction fluctuation approximately between 17 to 52 seconds for 100
vehicles and the average transaction in this gate about 30.2004 seconds.
0
10
20
30
40
50
60
1 5 9
13
17
21
25
29
33
37
41
45
49
53
57
61
65
69
73
77
81
85
89
93
97
Tran
sact
ion
Tim
e (s
)
No of Vehicles
Tollgate 1 Transaction Time (Sec)
0
10
20
30
40
50
60
1 5 9
13
17
21
25
29
33
37
41
45
49
53
57
61
65
69
73
77
81
85
89
93
97
Tran
sact
ion
Tim
e (s
)
No of Vehicles
Tollgate 2 Transaction Time (Sec)
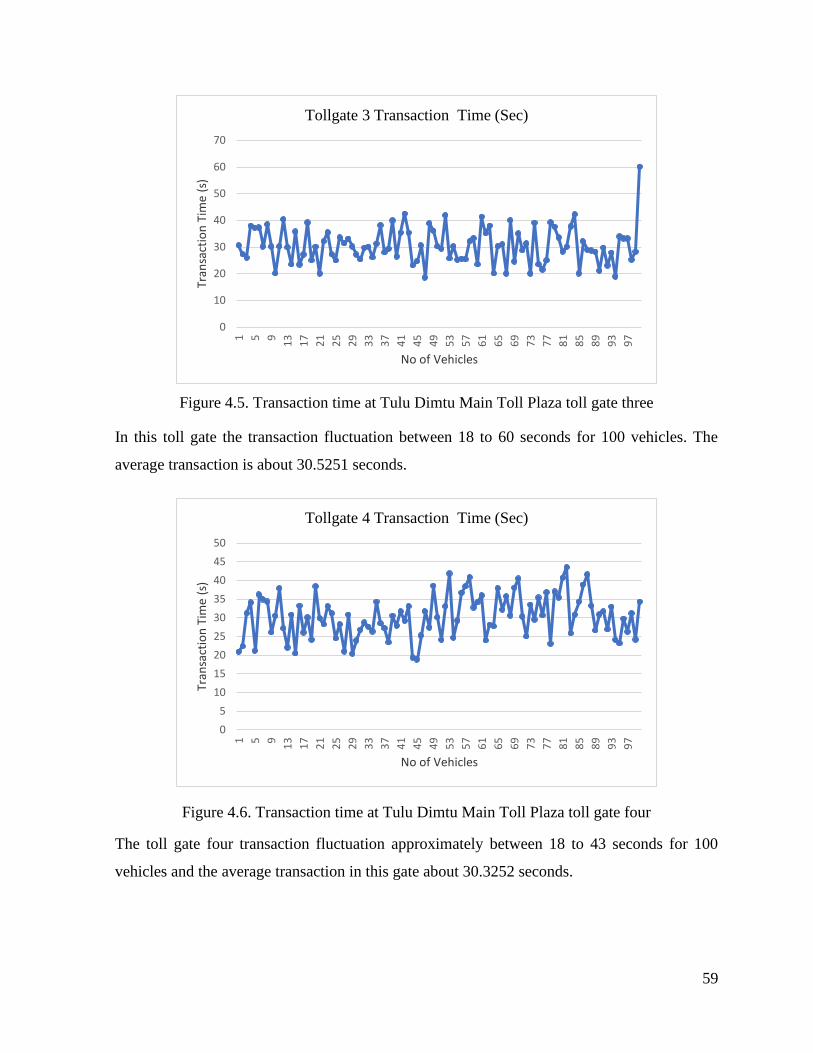
59
Figure 4.5. Transaction time at Tulu Dimtu Main Toll Plaza toll gate three
In this toll gate the transaction fluctuation between 18 to 60 seconds for 100 vehicles. The
average transaction is about 30.5251 seconds.
Figure 4.6. Transaction time at Tulu Dimtu Main Toll Plaza toll gate four
The toll gate four transaction fluctuation approximately between 18 to 43 seconds for 100
vehicles and the average transaction in this gate about 30.3252 seconds.
0
10
20
30
40
50
60
70
1 5 9
13
17
21
25
29
33
37
41
45
49
53
57
61
65
69
73
77
81
85
89
93
97
Tran
sact
ion
Tim
e (s
)
No of Vehicles
Tollgate 3 Transaction Time (Sec)
0
5
10
15
20
25
30
35
40
45
50
1 5 9
13
17
21
25
29
33
37
41
45
49
53
57
61
65
69
73
77
81
85
89
93
97
Tran
sact
ion
Tim
e (s
)
No of Vehicles
Tollgate 4 Transaction Time (Sec)

60
Figure 4.7. Transaction time at Tulu Dimtu Main Toll Plaza toll gate five
In tollgate 5 the transaction fluctuation between 16 to 41 seconds and the average transaction
was about 28.3546 seconds.
Figure 4.8. Total transaction time at Tulu Dimtu Main Toll Plaza at all tollgate
Figure 4.8 and Figure 4.9 are showing the total transaction at Tulu Dimtu Main Toll Plaza, and
the transaction fluctuation was about 16 to 60 seconds on both toll gates for 100 vehicles
respectively. A total of 600 vehicles were surveyed for 45 days. The average transaction was
about 29.8 seconds.
0
5
10
15
20
25
30
35
40
45
1 5 9
13
17
21
25
29
33
37
41
45
49
53
57
61
65
69
73
77
81
85
89
93
97
Tran
sact
ion
Tim
e (s
)
No of Vehicles
Tollgate 5 Transaction Time (Sec)
0%
10%
20%
30%
40%
50%
60%
70%
80%
90%
100%
1 6
11
16
21
26
31
36
41
46
51
56
61
66
71
76
81
86
91
96
Del
ay T
ime
(%)
No of Vehicles
Tulu Dimtu Main Toll Plaza Total Transaction
Tull Dimtu Main Toll Plaza(Addis Abeba) Tollgate 6
Tull Dimtu Main Toll Plaza(Addis Abeba) Tollgate 5
Tull Dimtu Main Toll Plaza(Addis Abeba) Tollgate 4
Tull Dimtu Main Toll Plaza(Addis Abeba) Tollgate 3
Tull Dimtu Main Toll Plaza(Addis Abeba) Tollgate 2
Tull Dimtu Main Toll Plaza(Addis Abeba) Tollgate 1

61
Figure 4.9. Average Transaction at the main toll plaza
The total number of vehicles passes through a plaza each month at Tulu Dimtu Main Toll Plaza
tabulated in Table 4.1.
Table 4.1. Total number of vehicles pass through plaza each month Year Months
2019
Jan Feb Mar Apr May June July Aug Sept Oct Nov Dec Total
723,
095
700,
428
721,
296
674,
743
738,
760
688,
790
754,
302
756,
286
714,
668
687,
065
699,
111
759,
448
34,671,
459
Source: Ethiopian Toll Road Enterprise
The electronic toll collection is more efficient than the existing toll collection systems as it
gives good management at toll plaza as well as it can save fuel. Hence, the study describes an
efficient toll collection system.
4.2.3 Feasibility Study
Consider at 6 manual toll plazas (19 entries and 29 exits) totals 34,671,459 vehicles in the year
2019 are tracked. The average value of this becomes 718,170 vehicles and 23,939 vehicles are
pass-through toll plaza per day
=𝑡𝑜𝑡𝑎𝑙 𝑛𝑢𝑚𝑏𝑒𝑟 𝑜𝑓 𝑣𝑒ℎ𝑖𝑐𝑙𝑒𝑠
𝑜𝑛𝑒 𝑚𝑜𝑛𝑡ℎ
0
20
40
60
80
100
120
Toll gate 1 Toll gate 2 Toll gate 3 Toll gate 4 Toll gate 5 Toll gate 6 Averagetransaction
The average transaction at both toll booth
Transaction time per average No of vehicles
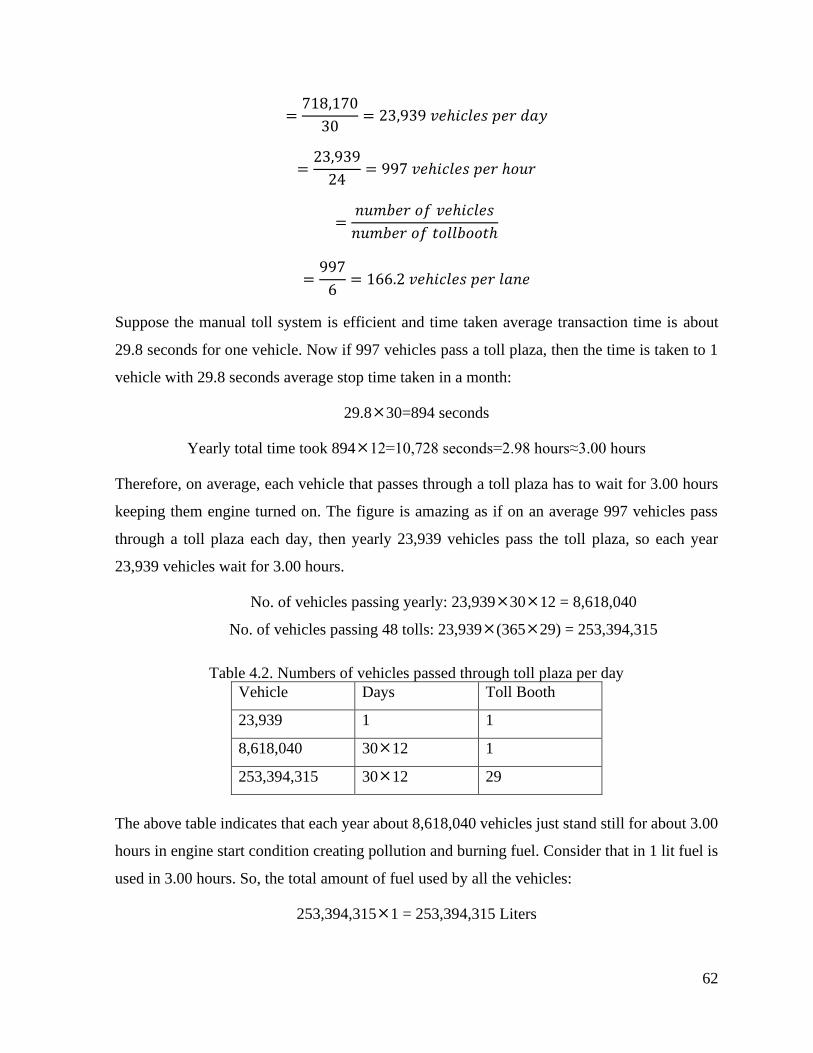
62
=718,170
30= 23,939 𝑣𝑒ℎ𝑖𝑐𝑙𝑒𝑠 𝑝𝑒𝑟 𝑑𝑎𝑦
=23,939
24= 997 𝑣𝑒ℎ𝑖𝑐𝑙𝑒𝑠 𝑝𝑒𝑟 ℎ𝑜𝑢𝑟
=𝑛𝑢𝑚𝑏𝑒𝑟 𝑜𝑓 𝑣𝑒ℎ𝑖𝑐𝑙𝑒𝑠
𝑛𝑢𝑚𝑏𝑒𝑟 𝑜𝑓 𝑡𝑜𝑙𝑙𝑏𝑜𝑜𝑡ℎ
=997
6= 166.2 𝑣𝑒ℎ𝑖𝑐𝑙𝑒𝑠 𝑝𝑒𝑟 𝑙𝑎𝑛𝑒
Suppose the manual toll system is efficient and time taken average transaction time is about
29.8 seconds for one vehicle. Now if 997 vehicles pass a toll plaza, then the time is taken to 1
vehicle with 29.8 seconds average stop time taken in a month:
29.830=894 seconds
Yearly total time took 89412=10,728 seconds=2.98 hours≈3.00 hours
Therefore, on average, each vehicle that passes through a toll plaza has to wait for 3.00 hours
keeping them engine turned on. The figure is amazing as if on an average 997 vehicles pass
through a toll plaza each day, then yearly 23,939 vehicles pass the toll plaza, so each year
23,939 vehicles wait for 3.00 hours.
No. of vehicles passing yearly: 23,9393012 = 8,618,040
No. of vehicles passing 48 tolls: 23,939(36529) = 253,394,315
Table 4.2. Numbers of vehicles passed through toll plaza per day Vehicle Days Toll Booth
23,939 1 1
8,618,040 3012 1
253,394,315 3012 29
The above table indicates that each year about 8,618,040 vehicles just stand still for about 3.00
hours in engine start condition creating pollution and burning fuel. Consider that in 1 lit fuel is
used in 3.00 hours. So, the total amount of fuel used by all the vehicles:
253,394,3151 = 253,394,315 Liters

63
Table 4.3. Fuel consumption
Vehicle Fuel consumed Amount
1 1 Lit 20,00 ETB
253,394,315 253,394,315 Lit 8,273,318,400 ETB
Assuming cost of 1liter of fuel = 20.00 ETB total cost of fuel consumed by 413,665,920
vehicles = 253,394,315 Lit20 = 5,067,886,300 ETB
The above is the money wastage under the consideration that the vehicle stops for 29.8 seconds
at the toll plaza, and 23,939 vehicles pass through the toll plaza each day and there are 29 exits
at toll plazas. The approximate CO2 emission per liter of diesel fuel is 2.68kg, and for petrol, it
is approximately 2.31kg. LPG produces around 1.51kg per liter (Fuel CO2 calculator
(Https://www.drivingtests.co.nz/resources/, 2016) which results in air pollution. These figures
are all at a minimum average.
4.2.4 Evaluation and Result of Designed System
The evaluation of ETC was too much different from the existing system. The location where
the arrival of vehicles was recoded 1 meter before the antenna. For 15 vehicles the average
delay time was 5.6 seconds. When this survey was conducted, all five tags are used at various
times and vehicles. Figure 4.10 clearly shows an example of the field observation data of
vehicle arrival at the automated system.
Figure 4.10. Automated system delay
0
1
2
3
4
5
6
7
1 2 3 4 5 6 7 8 9 10 11 12 13 14 15 16 17
Electronic system delay time
Addis Abeba Elecetronic Toll System delay time

64
4.2.5 Arrival Level (λ)
The level of arrival is the number of vehicles that arrive at manual tollgate at a certain time
(vehicle unit per hour). In some scientific research, a Poisson distribution model more suitable
for modeling the arrival pattern of vehicles under uncongested road vehicle traffic flow
conditions.
𝑝𝑛 =
(𝜆)𝑛𝑒(−𝜆)
𝑛! (4)
Where:
p(n)= probability of arrival of n vehicle within the time range
λ= vehicle arrival level at a certain time point
e= natural number (e=2.718)
4.2.6 Service Level (µ)
Aftabuzzaman, (2007) stated in his scientific research the measure of traffic congestion can be
classified into four broad categories; i.e. basic measure, ratio measures, level of service
measures, and indices. Basic measures are related to delay estimation. Delay can be defined as
the additional time experienced by a road user in comparison to the free flow travel or the
acceptable travel time. The concept of the level of service was developed (Manual, 1985). The
level of service of a facility is determined by traffic flow characteristics such as vehicle density,
volume to capacity ratio, and transaction delay. The following Table 4.4 shows the level of
service analysis and volume to capacity ratio.
Table 4.4. Level of service analysis and volume to capacity ratio
Level of
service
Description Volume/capacity
A Free- flow condition with unimpeded maneuverability,
stooped at, stooped delay at the signalized intersection is
minimal
0.00 to 0.60
B Reasonably unimpeded operations with restricted
maneuverability, stopped delays are not bothersome. 0.61to 0.70
C Stable operations with somewhat more restrictions in
making mid-block lane changes than LOS B. Motorists
will experience appreciable tension while driving.
0.71 to 0.80

65
D Approaching unstable operations where small increases
in volume produce substantial increases in delays and
low average speeds.
0.81 to 0.90
E Operations with significant intersection approach delays
and low average speeds.
0.91 to 1.10
F Extremely low speeds caused by intersection congestion,
high delay, and adverse signal progression.
Greater than 1.0
Based on Owolabi et al. (2016) the level of service measured the average capacity/volume and
congestion as tabulated in Table 4.5 below.
Table 4.5. Average capacity/volume congestion
No Average traffic volume/capacity ratio Technical interpretations
1 Less than 0.6 No congestion
2 0.6 to 0.8 Slight congestion
3 0.8 to 1.0 Congestion
4 1.0 to 1.2 Sever congestion
5 Greater than 1.2 Extreme congestion
The level of service (µ) is the number of vehicles that can be served at one or several service
points (vehicle unit per hour). Service time is the time required to serve a vehicle (minutes per
vehicle). The value of ρ is the ratio of arrival level (λ) to service level (µ), with the condition
that its value has to be less than 1 (Tamin, 2008).
𝜌 = 1 +
𝜆
µ< 1 (5)
Where:
λ= arrival level
µ= service level capacity
If ρ>1, then the arrival level is higher than the service level, which indicates a longer queue at
toll lane. Therefore, ρ must be less than 1.

66
The length of the vehicle queue and the required service time, as well as the number of
additional gates required to shorten the length of queuing, can be analyzed based on the number
of vehicle arrivals, the transaction time, and the number of existing gates.
To measure the capacity of a given toll system, the following formula is used (Karsaman &
Weningtyas, 2015).
𝜇 =3600
𝑤𝑝
Where:
µ= level of service
wp= service time
For instance, the arrival level of 997 (166 vehicles for 6 lanes) vehicles per hour and the average
transaction time is taken 29.8 sec per vehicle for each manual toll booth. The gate capacity
calculated by the following method:
𝜌 =166
29.72
= 5.6 𝑣𝑒ℎ𝑖𝑐𝑙𝑒𝑠 𝑝𝑒𝑟 𝑙𝑎𝑛𝑒
As per the above equation, the value of ρ is greater than one. This indicates the existing system
has extremely too much long queue (8.2 vehicles per lane).
The average queue length if using a manual system
𝜌 =𝜆
µ
=997
121
= 8.2 𝑣𝑒ℎ𝑖𝑐𝑙𝑒𝑠

67
The average capacity
𝜇𝑚 =3600
29.72
= 121 𝑣𝑒ℎ𝑖𝑐𝑙𝑒𝑠 𝑝𝑒𝑟 ℎ𝑜𝑢𝑟
The level service calculation of the automated system
𝜇𝑒 =3600
5.6
= 642.9 𝑣𝑒ℎ𝑖𝑐𝑙𝑒𝑠 𝑝𝑒𝑟 ℎ𝑜𝑢𝑟
The queue length if using an automated system
𝜌 =15
642
= 0.024 𝑣𝑒ℎ𝑖𝑐𝑙𝑒𝑠
∴ Therefore, it is advisable to implement an ETC system gradually rather than the existing
system considering an initial cost and total benefit analysis to account.
4.2.7 Evaluation Scenarios
In the development of automated vehicle detection and payment system using an RFID, the
different outcome at the gates should be taken into consideration for effective evaluation.
Detecting range is a fixed value in the simulation study. This variable determines the length of
the measurement link. The reasonable detection range has been pre-determined.
4.2.8 Service Time Survey and Result Analysis
In this section, a comprehensive result analysis of the study at Tulu Dimtu transaction points is
given. The following Table 4.6 shows all the average transaction fluctuation at both toll booth.
Table 4.6. The total average transaction
Tulu Dimtu Main Toll Plaza Total Average Transaction
Tollgates Toll gate
1
Toll gate
2
Toll gate
3
Toll gate
4
Toll gate
5
Toll gate
6
Average
transaction
Average Trans 29.478 30.2004 30.5251 30.3252 28.3546 29.4277 29.72
No of vehicles 100 100 100 100 100 100

68
4.3 The Results of the Field Study
The result of the queueing parameter calculation was based on the arrival level and the
transaction time at all toll plaza. Traffic queue can be measured in various ways depending on
the purpose of analysis. To measure a queue, some parameters indicate the intensity of traffic
congestion. As itemized by (Mohan & Ramachandra, 2012), measures of traffic congestion can
be categorized into four broad groups: basic measures, ratio measures, level of service
measures, and indices. Basic measures are related to delay estimation.
Based on the field survey and the study analysis, the capacity of the manual transaction system
significantly lower than the minimum service standard (450 vehicles per hour), and the
proposed ETC system was much higher than expected in the capacity of a toll plaza. Each
transaction at each tollbooth and the average transaction are almost the same. Figure 4.11 shows
the similarity of the transaction at each tollgate.
Figure 4.11. Transaction fluctuation on both system
4.4 Operating Frequency
RFID device work on a different range of frequency from 125 kHz to 5.8 GHz. The selection
of operating system range is depending on the bases of application and the requirements. To
prepare a prototype 13.56 kHz radiofrequency was selected due to having a better ability to read
near the antenna, cost orientation, and availability.
0
20
40
60
80
100
120
Adama Main Toll Plaza ETC
The average transaction delay on both system (s)
Average transaction No of vehicles

69
4.5 A Prototype of Electronic Vehicle Detection and Payment System
When a vehicle comes close to the toll plaza the GSM module will become active and
simultaneously the RFID tag read all the data of the vehicle. All the data of the specific vehicle
have been sent to both the GSM module and the PC through the program design to verifying
the balance account of the vehicle owners.
If the account balance is sufficient, the barrier opens and a text message sent to the registered
cell phone based on the IDE programming language. LCDs to the driver “you shall pass”. When
the green LED lit, the servo motor opens the gate barrier and closes after the vehicle pass.
If the account balance of the owner is insufficient or the vehicle not yet registered, he/she may
pay manually as per the location of the manual toll gate, or if the vehicle tagged incorrect RFID
tag the LCDs to the driver “You cannot pass”. These have to be done within 5.6 seconds means
the toll plaza works like a non-stoppable way. The following Figures 4.12, 4.13, and 4.14 are
illustrated the output of the automated system set up with an RFID tag.
Figure 4.12. The automatic toll collection system

70
Figure 4.13. The output of the proposed model
Figure 4.14. Received text message from the system

71
4.6 Circuit Diagram of the Automated System
The microcontroller is considered as a CPU in this thesis work prototype. The major function
of a microcontroller for this application are:
1. Read the RFID unique number from the reader
2. Send the correct data and information to the LCD
3. Send the command to motor or buzzer as per the program designed for
The external electric source for the Arduino board should be 5volts form USB or other regulated
power sources. This regulated power supply used to power the microcontroller and the other
components built on the board. A 3.3 (max 50 mA) volt supply generated by the onboard
regulator.
RC522 is a high integrated RFID card that works on non-contact 13.56 MHz communication
as low cost and compact size, read-write chip. The chip is an advanced modulation system that
fully integrated at 13.56 MHz with all kinds of non-contact communication. The module also
uses 3.3-volt power and can communicate directly with any board by connecting through SPI
protocol which ensures reliable work with good reading distance. The integration of Arduino
UNO with the RFID module illustrated below in Figure 4.15.
Figure 4.15. RFID module Connection

72
The Arduino can be powered from a 9V wall adapter. There is a buzzer and LED to indicate
either the vehicle registered correctly or not, or have a sufficient balance or insufficient balance.
The LED circuit design illustrated below in Figure 4.16.
Figure 4.16. Transistor controlled LED
Figure 4.17. Arduino to LCD connection

73
The automated vehicle detection and payment system circuit diagram of servo motor,
microcontroller, and RFID reader is illustrated in Figure 4.18 and Figure 4.19.
Figure 4.18. Automated toll system schematic diagram

74
Figure 4.19. The ETC wiring diagram

75
CONCLUSIONS AND RECOMMENDATIONS
5.1 Summery
As it has been indicated in the introduction part, the main objective of this thesis work was to
design and development of electronic vehicle detection and payment system using RFID
technology at Addis Abeba to Adama expressway. Using an ETC has advantages over the
existing system, such benefits are increasing toll capacity, fuel-saving, lower operating cost,
vehicle theft detection, tracking over speeding, pollution of an environment, and wastage of
paper are itemized detailed. The designed system mainly used Arduino UNO, GSM module,
passive RFID tag and module, and the Liquid Crystal Display.
The reliable and sufficient quantitative data are collected beginning the field survey at Tulu
Dimtu main toll plaza. The arrival level and service level of the existing system have been
conducted and analyzed.
To design automated vehicle detection, vehicle identification, vehicle anti-theft system, the
transaction process, and violation enforcement Arduino IDE with C language is preferred. And
the electrical circuit diagram has been designed by PROTEUS PRO 8 DEMONSTRATION
software. The study evaluated the design and development of vehicle detection and payment
system using RFID and microcontroller on a kid’s toy car to show the system prototype.
Based on the actual field survey and observation measurement analysis, the following main
findings are obtained.
➢ As long as the RFID tag is available on the vehicle, the effectiveness of the tollgate will
be guaranteed and significantly improved the service level capacity.
➢ Expanded the capacity of the automated systems without building more infrastructure.
➢ The designed system allows the driver to pass through the system at 20 km/h.
➢ The average delay time during transactions decreased from 29.8 to 5.6 seconds.
76
5.2 Conclusion
The grounds of this thesis work were the need for assessment of the design and develop a
vehicle detection system at a toll plaza. Based on a quantitative and qualitative analysis of the
existing toll transaction at a toll plaza, it can be concluded that a service level and capacity
performance are important factors to consider when designing and developing a new system.
The result indicated that the designed system is achieved the service level more than the
minimum standard level of vehicles per hour.
By analyzing both the arrival level, service level, and capacity performance of the existing toll
system in 2019, this thesis has shown how the designed system to be executed directly or
indirectly like a big scenario. Based on field observation and measurements, it was found that
the average delay time of the existing system was 28 to 30 seconds, while in the automated
system the delay time decreased to 5.6 seconds and the capacity was 642.9 vehicles per hour
with 0.024 vehicles queue.
The study process, therefore, designed an appropriate program to establish whether the
implementation of the technology feasible in the situation and to explain the possible problems.
Since this thesis is the first-ever duty of the groundwork technology in Ethiopia, the design and
development be faced with during the study and recommendations here will pave way for create
the circumstances to enable further studies to be done.
After doing a study on this thesis it is initiate that the introduction of the ETC system can be
more advantageous to achieve the goals of ETRE in 2020. With this a low-cost technology
implementation it will dramatically decrease time consumption, fuel savings and reduce air
pollution, traffic congestion, improves the government revenue, making the transaction process
easier and faster, increasing toll booth service rates, and leave a personal contact to avoid the
current pandemic global disease COVID-19. The traffic-free toll system will add a good
impression to road users and they can enjoy the travel on this road by a short time.
The study demonstrated that the system has sent a short text message to the vehicle’s registered
cell phone and he/she knows how much money is deducted by the system. The development
can be completed to advance a multi-vehicle amount deducted and send a text message at a

77
period of the multi vehicles. These were the major achievements met in the study among the
other objectives.
The designed system is the non-contact, non-line-of-sight nature of the technology. Tags can
be read through a change of natural phenomena such as rain, fog, and sun. Hence, this
development can be very much useful and can be implemented in real-time applications. The
detection range of the vehicle and the location of the antenna was predetermined by the
frequency. Passive radio frequency has a good ability to detect an object near to the antenna.
The amplification of passive radio frequencies detection range will explore in future studies.
5.3 Recommendations
To provide the right solution by resolving the road traffic congestion, to give safer
transportation system, and to minimize traffic destruction on human life and property at the
expressway, the enterprise should undertake the following recommendations which are
obtained based on the thesis outcome;
➢ The transport sector stakeholders should work together to make sure all the
transportation systems facilitate a healthy transportation system. Especially the driving
institutes should give serious attention to their trainees to optimizing vehicle speed and
service qualities.
➢ Driving on the expressway means meaningfully it is related to vehicle speed. According
to the Code of Ethiopia, the declared maximum allowed speed on the expressway was
100 km/hr. So, the declaration must be obeyed.
➢ The Ethiopian Toll Road Enterprise has to build several speed breakers more than 5
to10 meters far from each toll booth and the fence should be more secured.
➢ To provide the right fleet management and to enhance violation enforcement the
surveillance cameras must be placed at a specific distance from the vehicle license
number plate.
➢ To control the vehicle’s maximum speed through the expressway the radar cameras
should be installed at a certain point.

78
➢ As a temporary solution for the road users, if the enterprise provides a set of mobile
garages together it will help the traffic.
➢ The enterprise has to give attention to optimizing the level capacity of transaction time
and evaluate the performance.
In this busy world, this thesis work gives preference for time and efficiency, to fulfill this
achievement we are kindly requesting to implement the automated toll collection system.
5.4 Future work
The technology used in electronic toll collection system can be further improved for security
and safety such as:
1. Over Speeding Vehicle: The ZigBee module can be modified to transmit speed details.
The RFID antenna installed at every location will track the speed of the vehicles. If any
vehicle exceeds the defined limit the vehicle number will be stored. This system can be
used to track the vehicles as ZigBee transmitter transmits VIN which will be detected
by the nearby RFID reader. Thus, preventing serious crimes. This system provides
efficient and better ways that improve the driving experience and provide safety to
paddlers.

79
References
A Gupta, M. S. (2004). Developing auto-id solutions using sun java system RFID software.
http://java.sun.com/developer/technicalArticles/Ecommerce/rfid/sjsrfid/RFID.html
Abolghasemi, V., & Ahmadyfard, A. (2009). An edge-based color-aided method for license
plate detection. Image and Vision Computing, 27(8), 1134–1142.
https://doi.org/10.1016/j.imavis.2008.10.012
Aftabuzzaman, M. (2007). Measuring Traffic Congestion- A Critical Review 30 th Australasian
Transport Research Forum 30 th Australasian Transport Research Forum. 30th
Australasian Transport Research Forum, January 2007, 1–16.
Ahsan, K. (2011). RFID Components, Applications and System Integration with Healthcare
Perspective. In Deploying RFID - Challenges, Solutions, and Open Issues (Issue August
2011). https://doi.org/10.5772/16968
Aima, S. (2016). Automated Toll Plaza System Using Radio Frequency Identification Device
(RFID) On Highways. IOSR Journal of Mobile Computing & Application (IOSR-JMCA),
3(5), 10–14. https://doi.org/10.9790/0050-03051014
Al-shabibi, L. (2019). Automobile Speed Violation Detection System using RFID and GSM
Automobile Speed Violation Detection System Using RFID and GSM Technologies.
International Journal of Applied Information Systems (IJAIS), 02(02), 1–7.
https://doi.org/10.5120/ijais14-451181
Aly, I. M. A. (1995). Indonesian Highway Capacity Manual Part - II Interurban Roads. In
Indonesian Hcm.
Amol A. Chapate, D. D., & Nawgaje. (2015). Electronic Toll Collection System Based on
ARM. International Journal of Science, Engineering and Technology Research (IJSETR),
4(1), 46–49.
Ananthamoorthy, V. R. N. P. (2017). Automatic Toll Collection System Using RFID & GSM
Technology. International Journal of Advanced Research in Computer and
Communication Engineering, 6(10), 285–290.
https://doi.org/10.17148/IJARCCE.2017.61050
Andurkar, G. K., & Ramteke, V. R. (2015). Smart Highway Electronic Toll Collection.
International Journal of Innovative Research in Computer and Communication
Engineering, 03(05), 4087–4094. https://doi.org/10.15680/ijircce.2015.0305093
Attaran, M. (2007). RFID: An enabler of supply chain operations. Supply Chain Management,
12(4), 249–257. https://doi.org/10.1108/13598540710759763
Bai, P., & Zhou, Y. (2006). Design of Multifunctional Base Station for AVIM System.
International Conference on ITS Telecommunications Proceedings Design, 06(07), 246–
249.
Baird, J. L. (1928). An improved method of and means for producing optical images. Brit.
Patent, 285, 738. https://ci.nii.ac.jp/naid/10025347920/
Bar-Gera, H. (2007). Evaluation of a cellular phone-based system for measurements of traffic
speeds and travel times: A case study from Israel. Transportation Research Part C:
Emerging Technologies, 15(6), 380–391. https://doi.org/10.1016/j.trc.2007.06.003
80
Bhisikar, P., Umredkar, A., Vaidya, A., Samrit, S., & Warambhe, P. N. K. (2017). Automatic
Toll Plaza using RFID. International Journal of Engineering Science and Computing,
7(3), 6264–6270. http://ijesc.org/
Bhore, A., & Agre, P. G. (2017). The Survey on Automated Toll System for Number Plate
Detection and Collection. International Journal of Innovative Research in Computer and
Communication Engineering, 05(01), 299–304. https://doi.org/10.15680/IJIRCCE.2017.
Bluetooth. (2008). Learn About Bluetooth. Bluetooth. https://www.bluetooth.com/Bluetooth/
Blythe, P. T. (1989). The automation of toll-collection and road-use pricing systems.
Conference Paper, IEEE Xplore, March, 118–122.
Book of Revelation 13:16. (1962). In The Holy Bible (p. Ethiopian Orthodox Tewahedo
Church). Lapsely/Brooks Foundation.
Boschma, R. A. &, & Wenting, R. (2007). The spatial evolution of the British automobile
industry: Does location matter? Industrial and Corporate Change, 16(2), 213–238.
https://doi.org/10.1093/icc/dtm004
Boyce, D. E., Hicks, J., & Sen, A. (1991). in-vehicle navigation requirements for monitoring
link travel times in a dynamic route guidance system. In trid.trb.org (Vol. 8).
https://trid.trb.org/view/359779
Butani, P., John, J., & Dhole, A. (2013). Automatic Vehicle Identification using RFID-A first
hand experiance. International Journal of Engineering Science, 5(2).
Cayford, R., & Johnson, T. (2003). Operational parameters affecting the use of anonymous cell
phone tracking for generating traffic information. Transportation Research Board 82nd
Annual Meeting, 1–20. https://trid.trb.org/view/645521
Cui, Y., & Huang, Q. (1998). Extracting characters of license plates from video sequences.
Machine Vision and Applications, 10(5–6), 308–320.
https://doi.org/10.1007/s001380050081
ETRE. (2017). No Title. Expressway. https://etre.com.et
Faria, J., & Devkatte, A. (2017). Vehicle Tracking and Toll Collection System. International
Journal of Engineering Research & Technology (IJERT), 5(01), 1–3.
Fine, C., Fine, B. C., Klym, N., Tavshikar, M., & Trossen, D. (2006). The Evolution of RFID
Networks. A Research and Education Initiative at the MIT Sloan School of Management,
May, 1–21. http://ebusiness.mit.edu
Fontaine, M. D., & Smith, B. L. (2005). Probe-based traffic monitoring systems with wireless
location technology: An investigation of the relationship between system design and
effectiveness. Transportation Research Record, 1925(1), 3–11.
https://doi.org/10.3141/1925-01
Gaikwad, P., Narule, S., Thakre, N., & Chandekar, P. (2017). RFID Technology Based
Attendance Management System. International Journal Of Engineering And Computer
Science, June. https://doi.org/10.18535/ijecs/v6i3.10
Garmin Ltd. (1996). What is GPS? Germin. http://www8.garmin.com/aboutGPS/
Golden, T., Bridge, G., Greenshields, B. C., Shapiro, D., Haven, N., & Bridge, G. G. (1982).
Tandem Toll Collection Systems. 14–17.

81
Golio, M. “Frontmatter.” (2001). The RF and Microwave Handbook. In Engineering.
Goswami, D., & Gaur, R. (2014). Automatic License Plate Recognition System using
Histogram Graph Algorithm. International Journal on Recent and Innovation Trends in
Computing and Communication, Volume: 2(Issue: 11), 3521–3527.
Gurjot, G. S., Nancy, G., Guarav, S., & Harsimranjit, G. S. (2012). Intelligent car using RFID
Technology. International Journal of Scientific and Engineering Research, 3(7), 2229–
5518.
Hafeez, F., Shammrani, M. Al, & & Shammary, O. Al. (2015). Smart Vehicles Speed
Monitoring System Using RFID. International Journal of Advanced Research in
Electrical, Electronics and Instrumentation Engineering, 04(04), 1860–1864.
https://doi.org/10.15662/ijareeie
Hainen, A. M., Wasson, J. S., Hubbard, S. M. L., Remias, S. M., Farnsworth, G. D., & Bullock,
D. M. (2011). Estimating route choice and travel time reliability with field observations of
bluetooth probe vehicles. Transportation Research Record, 2256, 43–50.
https://doi.org/10.3141/2256-06
Harrington, R. (1958). Introduction to electromagnetic engineering. Journal of the Franklin
Institute, 266(2), 145–146. https://doi.org/10.1016/0016-0032(58)90369-7
Harrison, R., Schofield, M., Loftus-otway, L., & West, J. (2006). Developing Freight Highway
Corridor Performance Measure Strategies in Texas--TxDOT (Vol. 7).
www.utexas.edu/research/ctr
Homs, C., Metcalfe, D., & Takahashi, S. (2004). Exposing the myth of the 5-cent RFID tag.
Forrester Research Inc., Cambridge, MA, 04(04).
Https://www.drivingtests.co.nz/resources/. (2016). fuel-co2-calculator- carbon-dioxide-
emissions-in-kg. https://www.drivingtests.co.nz/resources/
Https://www.google.com/search?q=RFID+of+toll+system&tbm=isch&ved=2ahUKEwjk0Im
ByPXqAhUX-4UKHaXaD6cQ2-
cCegQIABAA&oq=RFID+of+toll+system&gs_lcp=CgNpbWcQA1DKmwtY1toLYJnm
C2gDcAB4AIABmgOIAbANkgEHMi0xLjMuMZgBAKABAaoBC2d3cy13aXotaW1n
wAEB&sclient=img&ei=oAsjX-SAAZ. (n.d.). No Title.
Ilyas, S. A. & M. (2008). RFID Handbook Applications, Technology, Security, & Privacy. CRC
Press Taylor & Francis Group. https://doi.org/10: 1-4200-5499-6
Jules, A. (2005). A research survey: RFID security and privacy issue. Computer Science, 381–
394. http://airccj.org/CSCP/vol3/csit3526.pdf
Jung, K. &, & Lee, S. (2015). A systematic review of RFID applications and diffusion: key
areas and public policy issues. Journal of Open Innovation: Technology, Market, and
Complexity, 01(09), 0–19. https://doi.org/10.1186/s40852-015-0010-z
Kalantri, R., Parekar, A., Mohite, A., & Kankapurkar, R. (2014). RFID Based Toll Collection
System. International Journal of Computer Science and Information Technologies, 5(2),
2582–2585. www.ijcsit.com
Kamarulazizi, K. (2010). electronic toll collection system using passive. Journal of Theoretical
and Applied Information Technology, 70-. www.jatit.org
82
Kamran Ahsan, H. S. &, & Kingston, P. (2010). RFID Applications : An Introductory and
Exploratory Study. International Journal of Computer Science, 07(01), 1–8.
www.IJCSI.org
Kanthi, K., Jayakumar, D., & Singh, K. J. (2014). Electronic Toll Collection System For Billing
Using Wireless Communication. International Journal of Advanced Engineering
Research and Science (IJAERS), 1(5), 33–48.
Karande, M. S., Malushte, R. A., & Dahotre, Aditi A, A. P. A. P. (2016). Number Plate
Recognition System using OCR for Automatic Toll Collection. International Journal of
Science Technology & Engineering IJSTE, 2(10), 465–471. www.ijste.org
Karsaman, R. H., Mahendra, Y., Rahman, H., & Sulaksono, S. (2014). Measuring the capacity
and transaction time of cash and electronic toll collection systems. Journal of Engineering
and Technological Sciences, 46 B(2), 180–194.
https://doi.org/10.5614/j.eng.technol.sci.2014.46.2.5
Karsaman, R. H., & Weningtyas, W. (2015). Enhancing a better operation management of
Indonesian toll road. International Journal of Economics and Financial Issues, 5(July),
296–303.
Kaur, M., Sandhu, M., Mohan, N., & Sandhu, P. S. (2011). RFID Technology Principles ,
Advantages , Limitations & Its Applications. International Journal of Computer and
Electrical Engineering, 3(1), 151–157.
Kelly, F. (2006). Road pricing. Ingenia, 29, 34-40.
Kieu, L. M., Bhaskar, A., & Chung, E. (2015). Passenger segmentation using smart card data.
IEEE Transactions on Intelligent Transportation Systems, 16(3), 1537–1548.
https://doi.org/10.1109/TITS.2014.2368998
Kodavati, B., Raju, V., Rao, S., & Prabu, A. (2011). GSM and GPS based vehicle location and
tracking system. International Journal of …, 1(3), 616–625. www.ijera.com
Lakshmi, C. J., Rani, D. A. J., Ramakrishna, D. K. S., & KantiKiran, M. (2011). A Novel
Approach for Indian License Plate Recognition System. International Journal of
Advanced Engineering Sciences and Technologies (IJAEST), 6(1), 10–14.
Landt, J. (2005). The history of RFID. IEEE Potentials, 24(4), 8–11.
https://doi.org/10.1109/MP.2005.1549751
Larionov, A. A., Ivanov, R. E., & Vishnevsky, V. M. (2017). UHF RFID in Automatic Vehicle
Identification: Analysis and Simulation. IEEE Journal of Radio Frequency Identification,
1(1), 3–12. https://doi.org/10.1109/jrfid.2017.2751592
Lu, J., Rechtorik, M., & Yang, S. (2007). Technology Applications to Toll Collection Services.
Transportation Research Record: Journal of the Transportation Research Board, 971136.
Manikandan.S, Abishek.S, Aravindhan.S, Karthikeyan.R, M. . (2018). automatic toll tax
collection system by using RFID. International Journal of Pure and Applied Mathematics,
118(20), 473–477. https://doi.org/ISSN: 1314-3395
Manual, H. C. (1985). Special report 209. Transportation Research Board, Washington, DC, 1,
985.
Masurekar, D. M. & R. (2016). A Comparative Study of Different Technologies for Electronic

83
Toll Collection System. International Journal of Innovative Research in Computer and
Communication Engineering (An ISO Certified Organization), 3297(6), 11449–11455.
https://doi.org/10.15680/IJIRCCE.2016
Mattern, J. B. and F. (2014). Super-distributed RFID Tag Infrastructures. Conference Paper in
Lecture Notes in Computer Science, 01(03l), 1–13. https://doi.org/10.1007/978-3-540-
30473-9
Meyers, T. D., & Leigh, A. P. (1978). Passive Encoding Microwave Trasponder. US Patent:
4068232, 11(45), 1–4. https://patents.google.com/patent/US4068232A/en
Miles, S. B. (2008). Introduction to RFID history and markets. RFID Technology and
Applications, 9780521880, 1–15. https://doi.org/10.1017/CBO9780511541155.002
Mohan Rao, A., & Ramachandra Rao, K. (2012). Measuring Urban Traffic Congestion – a
Review. International Journal for Traffic and Transport Engineering, 2(4), 286–305.
https://doi.org/10.7708/ijtte.2012.2(4).01
Monk, S. (2013). Programming Arduino Next Steps: Going Further with Sketches (p. 288).
https://cds.cern.ch/record/2621377
Noordzij, M., Tripepi, G., Dekker, F. W., Zoccali, C., Tanck, M. W., & Jager, K. J. (2010).
Sample size calculations: Basic principles and common pitfalls. Nephrology Dialysis
Transplantation, 25(5), 1388–1393. https://doi.org/10.1093/ndt/gfp732
Oates, B. J. (2006). (2006). Researching information systems and computing. (SAGE) London:
Okuttah,.
Owolabi, I. O., Ashaolu, T. J., & Abayomi, Y. A. (2016). Effects of Inorganic Fertilizer
Application on Plant Growth and Dry Matter Yield of Physic Nut (Jatropha Curcas L.).
International Journal of Agricultural and Food Research, 5(1).
https://doi.org/10.24102/ijafr.v5i1.587
Patel, Chirag, Dr Dipti Shah, & D. A. P. (2013). Automatic Number Plate Recognition System
( ANPR ): A Survey. International Journal of Computer Applications, 69(09), 20–33.
https://doi.org/10.5120/11871-7665
Prathiba, Sahaya Deenu, & V. A. M. A. (2017). Online Payment of Tolls and Tracking of Theft
Vehicles Using number plate image. Global Journal of Pure and Applied Mathematics,
13(7), 3005–3012. http://www.ripublication.com
Priya Thombare, & P. G. A. (2017). automated number plate detection and collection on toll
plaza using image processing. International Journal of Modern Trends in Engineering and
Research (Ijmter), 04(01), 253–256.
https://doi.org/10.21884/IJMTER.2017.4006.497NM
Priyanka, V., Punitha, S. P., & Keerthika, K. (2015). Automation of Tollgate and Vehicle
Tracking System. International Journal of Science and Research (IJSR), 4(7), 1782–1785.
www.ijsr.net
Puckett, D. D., & Vickich, M. J. (2010). Bluetooth-based travel time/speed measuring systems
development: Final Report (Issue June). http://utcm.tamu.edu
Rouphail, N., Tarko, A., & Jing, L. (2001). Traffic Flow at Signalized Intersections. Traffic-
Flow Theory, 9-1-9–28. http://web.tongji.edu.cn/~yangdy/its/tft/chap9.pdf
84
Sangole, M., Risodkar, Y., Kulkarni, S., Kushare, R., & Pawar, V. (2015). Automatic Toll
collection and Antitheft system. International Journal of Advanced Research in
Electronics and Communication Engineering (IJARECE), 4(1), 4–7.
Seem, J., Nachmias, D., & Nachmias, C. (1988). Research Methods in the Social Sciences.
Teaching Sociology, 16(2), 217. https://doi.org/10.2307/1317432
Sharma, A., Yaday, A., & Parmar, A. (2016). automatic toll e-ticketing system for
transportation systems. 3rd MEC International Conference on Big Data and Smart City,
7(16).
Shevale, K. S. (2014). Automated License Plate Recognition for Toll Booth Application.
Journal of Engineering Research and Applications, 4(10), 72–76. https://doi.org/ISSN :
2248-9622
Singh, N. & Teja, R. (2013). Vehicle Speed Limit Alerting and Crash Detection System at
Various Zones. International Journal of Latest Trends in Engineering and Technology,
2(1).
Stockman, H. (1948). Communication by Means of Reflected Power. Proceedings of the IRE,
36(10), 1196–1204. https://doi.org/10.1109/JRPROC.1948.226245
Swedberg, C. (2005). Loggers Use Tags to Track Trucks, Timber. RFID Journal LLC.
https://www.rfidjournal.com/articles/view?2007
Tamin, O. (2008). Planning, Modelling, and Transportation Engineering: Theory, Example
and Application.
Tamura, H. (2008). Wireless Communication in Underground Mines. In Journal of Chemical
Information and Modeling (Vol. 53, Issue 9). Springer Science+Business Media, LLC,
233 Spring Street, New York, NY 10013, USA.
https://doi.org/10.1017/CBO9781107415324.004
Thomas, L., James, S. A., Joseph, S., Arya, K. B., Narah, T. &, & Pangu, O. (2014). Automatic
Speed Control of Vehicles Using RFID. International Journal of Engineering and
Innovative Technology (IJEIT), 3(11), 118–120.
Uddin, M. J., Ibrahimy, M. I., Reaz, M. B. I., & Nordin, A. N. (2009). Design and application
of radio frequency identification systems. European Journal of Scientific Research, 33(3),
438–453.
Vernon, F. (1952). Measurement of High Level Microwave Power. 110–116.
Win, A., & MyatNwe, C. (2014). RFID Based Automated Toll Plaza System. International
Journal of Scientific and Research Publications, 4(1), 2250–3153. www.ijsrp.org
Wright, K. B., Rosenberg, J., Egbert, N., Ploeger, N. A., Bernard, D. R., & King, S. (2013).
Communication competence, social support, and depression among college students: A
model of facebook and face-to-face support network influence. Journal of Health
Communication, 18(1), 41–57. https://doi.org/10.1080/10810730.2012.688250
Xing, Y., Gao, Z., Qu, Z., & Hu, H. (2016). Study on Vehicle Delay Based on the Vehicle
Arriving Distribution at Entrance Lanes of Intersection. Procedia Engineering, 137, 599–
608. https://doi.org/10.1016/j.proeng.2016.01.297
Xuegang (Jeff) Ban, & M. G. (2010). Mobile Sensors as Traffic Probes: Addressing

85
Transportation Modeling and Privacy Protection in an Integrated Framework. Traffic and
Transportation Studies, 1447–1456.
Yan, D., Jilin, L., & Susu, R. (2001). A high performance license plate recognition system based
on the web technique. Institute of Information & Communication Engineering of Zhejiang
University, 05(07), 518–524. https://doi.org/10.1109/ITSC.2001.948677
Yao, Z., & Yi, W. (2014). License plate detection based on multistage information fusion.
Information Fusion, 18(1), 78–85. https://doi.org/10.1016/j.inffus.2013.05.008
Yim, Y. B. Y., & Cayford, R. (2001). Investigation of Vehicles as Probes Using Global
Positioning System and Cellular Phone Tracking: Field Operational Test (Issue
February). https://escholarship.org/uc/item/0378c1wc
Yu, M., Zhang, D., Cheng, Y., & Wang, M. (2011). An RFID electronic tag based automatic
vehicle identification system for traffic iot applications. Proceedings of the 2011 Chinese
Control and Decision Conference, CCDC 2011, 4192–4197.
https://doi.org/10.1109/CCDC.2011.5968962
Zheng, L., He, X., Wu, Q., Jia, W., Samali, B., & Palaniswami, M. (2008). A hierarchically
combined classifier for license plate recognition. Proceedings - 2008 IEEE 8th
International Conference on Computer and Information Technology, CIT 2008, 372–377.
https://doi.org/10.1109/CIT.2008.4594704

86
Appendices
Appendix I
The required materials specification
AT mega 2560 Microcontroller
Microcontroller ATmega 2560
Operating Voltage 5V
Input Voltage (recommended) 7-12V
Input Voltage (limit) 6-20V
Digital I/O Pins 54 (of which 15 provide PWM output)
Analog Input Pins 16
DC Current per I/O Pin 20 mA
DC Current for 3.3V Pin 50 mA
Flash Memory 256 KB of which 8 KB used by bootloader
SRAM 8 KB
EEPROM 4 KB
Clock Speed 16 MHz
LED_BUILTIN 13
Length 101.52 mm
Width 53.3 mm
Weight 37 g
MFRC522 RFID Module:
Voltage: DC 3.3V
Operating Current n: 13-26mA
Idle Current: 10-13mA
Sleep current: <80uA
Peak current: <30mA n
Operating Frequency: 13.56MHz
Supported card types: mifare1 S50, mifare1 S70, mifare Ultralight, mifare Pro,
mifare Desfire
Dimensions: 40mm n× n60mm n
Module Interface SPI Data Transfer Rate: Max. 10Mbit/s
Card reading distance: 0~30mm Mifare1 card
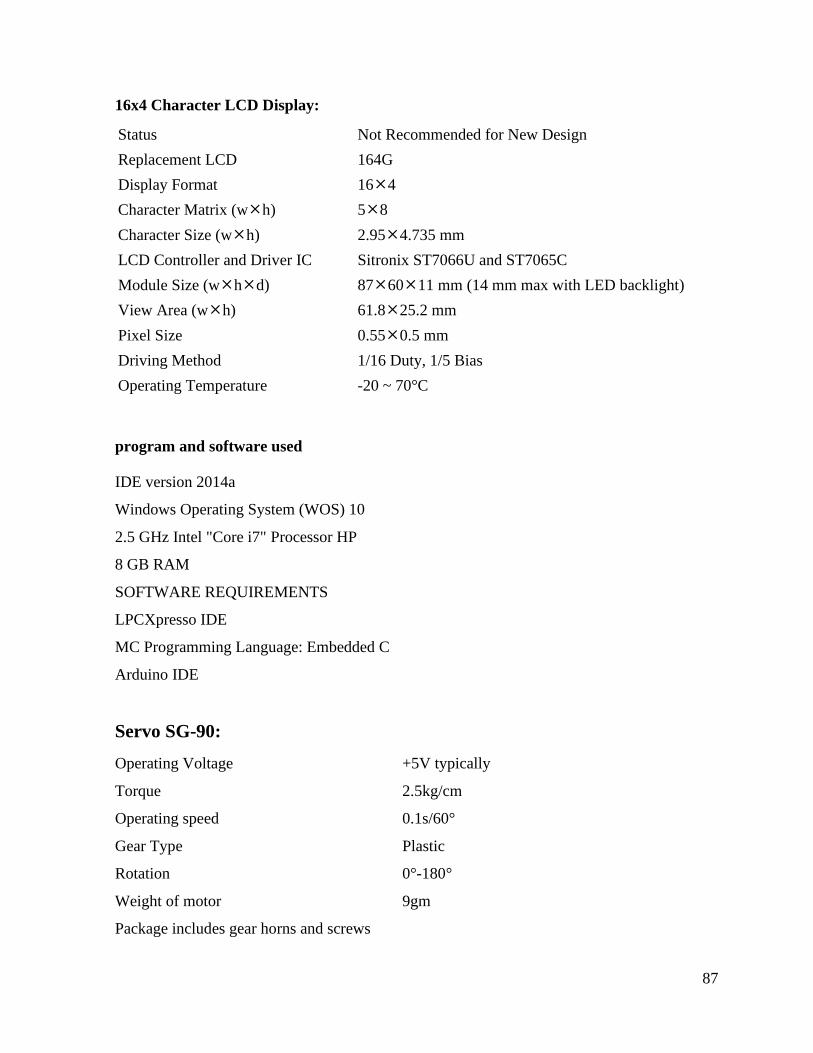
87
16x4 Character LCD Display:
Status Not Recommended for New Design
Replacement LCD 164G
Display Format 164
Character Matrix (wh) 58
Character Size (wh) 2.954.735 mm
LCD Controller and Driver IC Sitronix ST7066U and ST7065C
Module Size (whd) 876011 mm (14 mm max with LED backlight)
View Area (wh) 61.825.2 mm
Pixel Size 0.550.5 mm
Driving Method 1/16 Duty, 1/5 Bias
Operating Temperature -20 ~ 70°C
program and software used
IDE version 2014a
Windows Operating System (WOS) 10
2.5 GHz Intel "Core i7" Processor HP
8 GB RAM
SOFTWARE REQUIREMENTS
LPCXpresso IDE
MC Programming Language: Embedded C
Arduino IDE
Servo SG-90:
Operating Voltage +5V typically
Torque 2.5kg/cm
Operating speed 0.1s/60°
Gear Type Plastic
Rotation 0°-180°
Weight of motor 9gm
Package includes gear horns and screws

88
GSM Features:
Quad-Band 850/900/1800/1900 MHz
Dual-Band 900/1900 MHz
GPRS multi-slot class 10/8
Compliant to GSM phase 2/2+
Class 4(2W) Class 1 (1W)
Control via AT commands (GSM 07.07, 07.05 and SIMCOM enhanced AT Commands)
Low power consumption: 1.5mA (sleep mode)
Operation temperature: -40°C to +85 °C
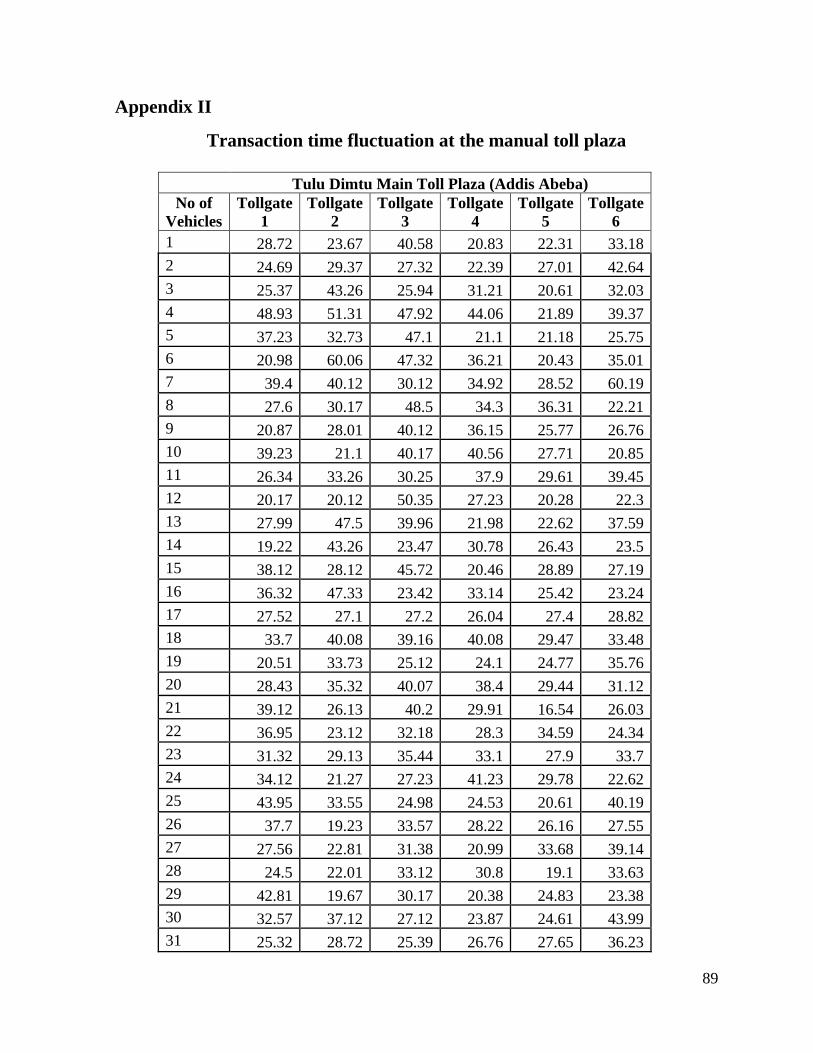
89
Appendix II
Transaction time fluctuation at the manual toll plaza
Tulu Dimtu Main Toll Plaza (Addis Abeba)
No of
Vehicles
Tollgate
1
Tollgate
2
Tollgate
3
Tollgate
4
Tollgate
5
Tollgate
6
1 28.72 23.67 40.58 20.83 22.31 33.18
2 24.69 29.37 27.32 22.39 27.01 42.64
3 25.37 43.26 25.94 31.21 20.61 32.03
4 48.93 51.31 47.92 44.06 21.89 39.37
5 37.23 32.73 47.1 21.1 21.18 25.75
6 20.98 60.06 47.32 36.21 20.43 35.01
7 39.4 40.12 30.12 34.92 28.52 60.19
8 27.6 30.17 48.5 34.3 36.31 22.21
9 20.87 28.01 40.12 36.15 25.77 26.76
10 39.23 21.1 40.17 40.56 27.71 20.85
11 26.34 33.26 30.25 37.9 29.61 39.45
12 20.17 20.12 50.35 27.23 20.28 22.3
13 27.99 47.5 39.96 21.98 22.62 37.59
14 19.22 43.26 23.47 30.78 26.43 23.5
15 38.12 28.12 45.72 20.46 28.89 27.19
16 36.32 47.33 23.42 33.14 25.42 23.24
17 27.52 27.1 27.2 26.04 27.4 28.82
18 33.7 40.08 39.16 40.08 29.47 33.48
19 20.51 33.73 25.12 24.1 24.77 35.76
20 28.43 35.32 40.07 38.4 29.44 31.12
21 39.12 26.13 40.2 29.91 16.54 26.03
22 36.95 23.12 32.18 28.3 34.59 24.34
23 31.32 29.13 35.44 33.1 27.9 33.7
24 34.12 21.27 27.23 41.23 29.78 22.62
25 43.95 33.55 24.98 24.53 20.61 40.19
26 37.7 19.23 33.57 28.22 26.16 27.55
27 27.56 22.81 31.38 20.99 33.68 39.14
28 24.5 22.01 33.12 30.8 19.1 33.63
29 42.81 19.67 30.17 20.38 24.83 23.38
30 32.57 37.12 27.12 23.87 24.61 43.99
31 25.32 28.72 25.39 26.76 27.65 36.23
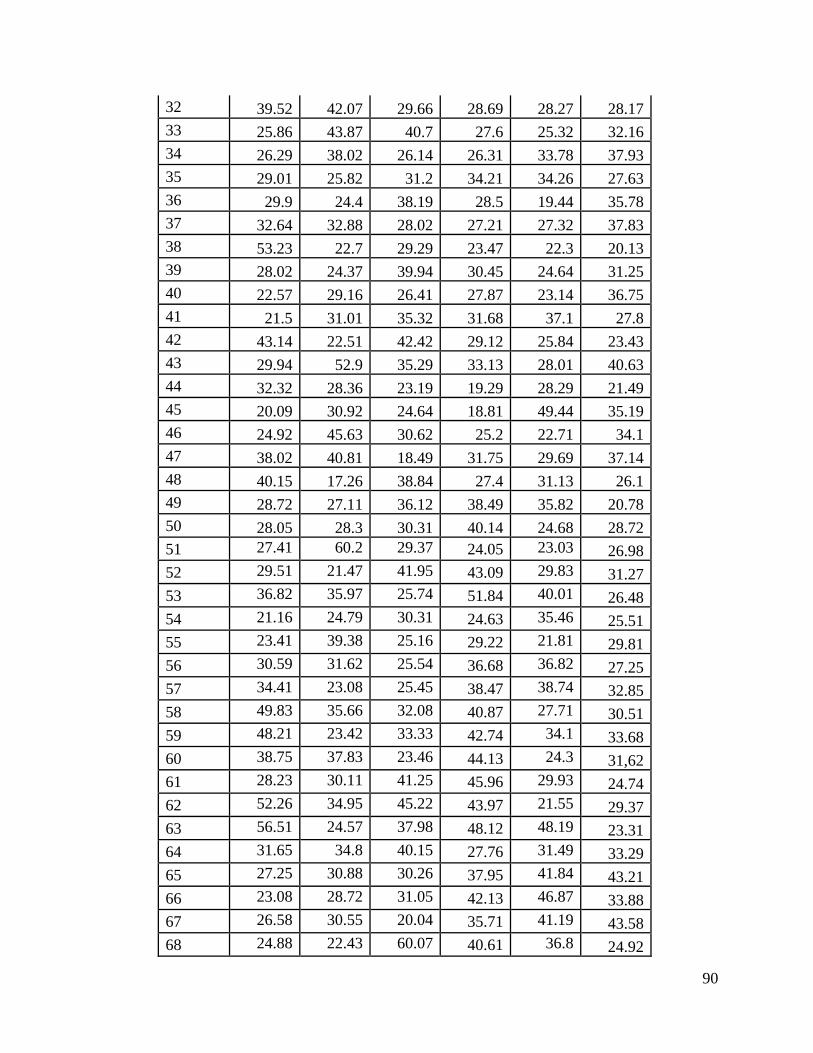
90
32 39.52 42.07 29.66 28.69 28.27 28.17
33 25.86 43.87 40.7 27.6 25.32 32.16
34 26.29 38.02 26.14 26.31 33.78 37.93
35 29.01 25.82 31.2 34.21 34.26 27.63
36 29.9 24.4 38.19 28.5 19.44 35.78
37 32.64 32.88 28.02 27.21 27.32 37.83
38 53.23 22.7 29.29 23.47 22.3 20.13
39 28.02 24.37 39.94 30.45 24.64 31.25
40 22.57 29.16 26.41 27.87 23.14 36.75
41 21.5 31.01 35.32 31.68 37.1 27.8
42 43.14 22.51 42.42 29.12 25.84 23.43
43 29.94 52.9 35.29 33.13 28.01 40.63
44 32.32 28.36 23.19 19.29 28.29 21.49
45 20.09 30.92 24.64 18.81 49.44 35.19
46 24.92 45.63 30.62 25.2 22.71 34.1
47 38.02 40.81 18.49 31.75 29.69 37.14
48 40.15 17.26 38.84 27.4 31.13 26.1
49 28.72 27.11 36.12 38.49 35.82 20.78
50 28.05 28.3 30.31 40.14 24.68 28.72
51 27.41 60.2 29.37 24.05 23.03 26.98
52 29.51 21.47 41.95 43.09 29.83 31.27
53 36.82 35.97 25.74 51.84 40.01 26.48
54 21.16 24.79 30.31 24.63 35.46 25.51
55 23.41 39.38 25.16 29.22 21.81 29.81
56 30.59 31.62 25.54 36.68 36.82 27.25
57 34.41 23.08 25.45 38.47 38.74 32.85
58 49.83 35.66 32.08 40.87 27.71 30.51
59 48.21 23.42 33.33 42.74 34.1 33.68
60 38.75 37.83 23.46 44.13 24.3 31,62
61 28.23 30.11 41.25 45.96 29.93 24.74
62 52.26 34.95 45.22 43.97 21.55 29.37
63 56.51 24.57 37.98 48.12 48.19 23.31
64 31.65 34.8 40.15 27.76 31.49 33.29
65 27.25 30.88 30.26 37.95 41.84 43.21
66 23.08 28.72 31.05 42.13 46.87 33.88
67 26.58 30.55 20.04 35.71 41.19 43.58
68 24.88 22.43 60.07 40.61 36.8 24.92

91
69 29.74 36.08 24.55 38.03 29.39 28.14
70 34.17 28.2 35.01 50.44 44.71 59.37
71 32.48 35.03 28.75 30.27 34.06 26.51
72 56.83 24.42 31.32 25.03 28.57 30.41
73 21.97 38.89 20.01 33.46 27.03 31.06
74 26.87 25.59 39.01 39.51 38.19 41.4
75 37.13 30.35 23.53 45.39 31.85 28.03
76 25.79 36.8 21.5 30.63 21.65 60.04
77 31.75 25.02 24.99 36.79 26.41 23.53
78 41.29 33.82 39.21 23.03 26.24 24.71
79 36.7 40.62 37.46 47.02 50.21 28.59
80 32.35 33.25 33.53 35.39 42.36 39.96
81 36.74 36.73 28.27 40.67 37.16 25.02
82 40.6 28.85 29.98 43.53 24.57 31.3
83 28.02 27.51 37.65 25.87 20.52 19.94
84 38.16 31.94 42.26 30.8 32.84 23.24
85 32.47 36.94 20.08 34.23 41.23 25.52
86 34.8 28.69 32.2 38.84 35.89 25.11
87 24.01 33.51 28.94 41.57 25.99 26.48
88 25.86 38.19 38.71 33.16 27.35 21.6
89 33.06 29.36 28.18 26.6 23.68 31.13
90 22.47 26.21 41.12 30.87 25.14 36.63
91 30.62 43.97 29.72 31.69 37.7 21.68
92 38.12 42.34 23.04 26.9 26.54 16.58
93 27.37 34.5 27.83 32.89 30.56 39.49
94 60.09 32.89 38.89 44.07 35.74 41.7
95 38.87 27.01 33.96 33.14 37.8 21.35
96 43.56 43.15 43.19 39.71 46.42 40.44
97 39.56 38.28 33.15 36.19 60.07 25.69
98 29.42 23.33 25.23 31.23 27.11 33.33
99 29.69 40.03 38.17 24.13 24.03 39.22
100 48.43 42.08 60.09 34.26 60.08 42.44

92
Average transaction time table (s)
Tulu Dimtu Main Toll Plaza Total Average Transaction
Tollgates Toll gate
1
Toll gate
2
Toll gate
3
Toll gate
4
Toll gate
5
Toll gate
6
Average
transaction
Average Trans
(seconds)
29.478
30.2004
30.5251 30.3252 28.3546 29.4279 29.8
No of vehicles 100 100 100 100 100 100 600
Electronic system time delay table
Electronic Toll System
Delay
time(s)
6.12 5.97 5.34 4.81 5.41 5.52 5.92 5.52 5.49 5.67 5.46 5.42 5.55 5.48 5.76
5.6
no of
vehicles 1 2 3 4 5 6 7 8 9 10 11 12 13 14 15
Comparison table
Parameters Existing system Automated system
Service time (s) 29.8 seconds 5.6 seconds
Queue length 8.2 vehicles 0.024 vehicles
Toll capacity 121 vehicles/hour 642 vehicles/hour

93
Appendix III
Programming code
#include <SPI.h>
#include <MFRC522.h>
#include <Servo.h>
#include <SoftwareSerial.h>
#include <LiquidCrystal.h> // includes the LiquidCrystal Library
#define SS_PIN 53 // RFID Reader ss pin
#define RST_PIN 5 // RFID Reader rest
LiquidCrystal lcd(6, 7, 8, 9, 10, 11); // Creates an LC object. Parameters: (rs, enable, d4, d5,
d6, d7)
//Create software serial object to communicate with the GSM Module
SoftwareSerial mySerial(3, 2); //GSM U_Tx & U_Rx is connected to Arduino #3 & #2
Servo myservo;
MFRC522 mfrc522(SS_PIN, RST_PIN); // Create MFRC522 instance.
char *Authorized[]={ "60 xx xx xx", "10 xx xx xx", "E0 xx xx xx", "A0 xx xx xx", "60 xx xx
xx"}; // regisered RFID Cards
int D_Balance = ;
int L_Balance = ;
int S_Balance =;
int K_Balance = ;
void setup()
{
mySerial.begin(9600);
lcd.begin(16,4);
SPI.begin();
mfrc522.PCD_Init();
myservo.attach(44); // Servo connetctd to pin 44
lcd.print("Welcome"); // inital welcome display
}
void updateSerial()
{
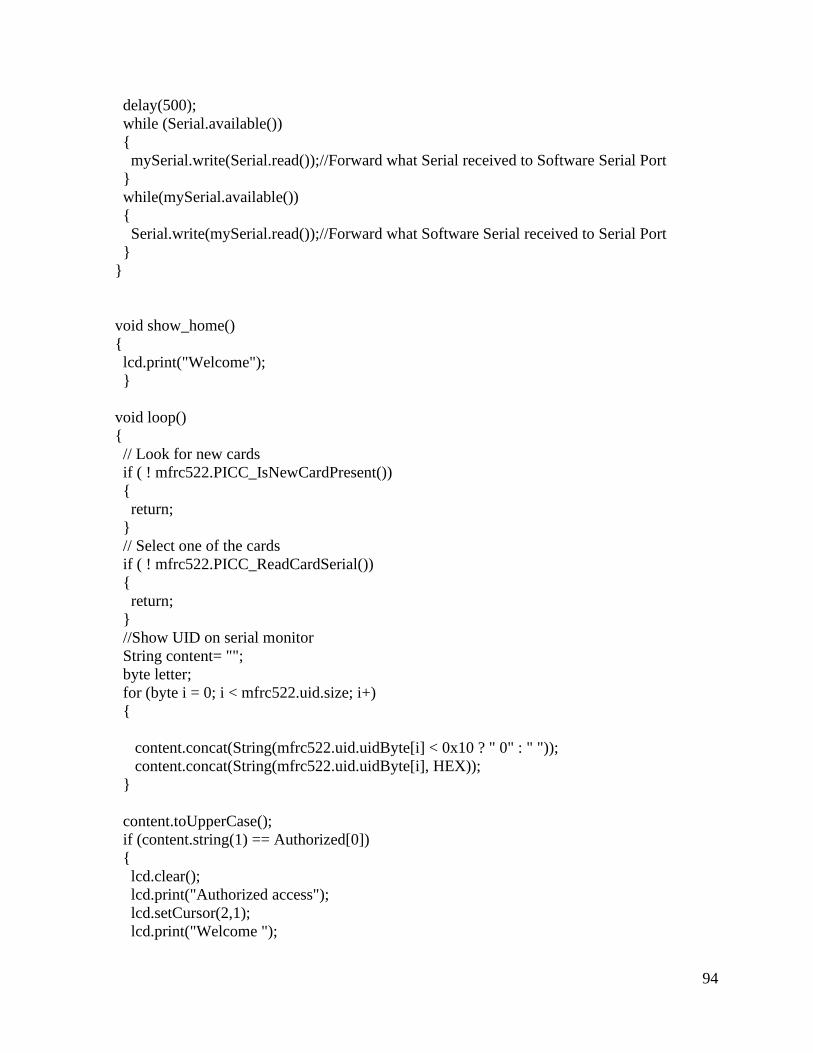
94
delay(500);
while (Serial.available())
{
mySerial.write(Serial.read());//Forward what Serial received to Software Serial Port
}
while(mySerial.available())
{
Serial.write(mySerial.read());//Forward what Software Serial received to Serial Port
}
}
void show_home()
{
lcd.print("Welcome");
}
void loop()
{
// Look for new cards
if ( ! mfrc522.PICC_IsNewCardPresent())
{
return;
}
// Select one of the cards
if ( ! mfrc522.PICC_ReadCardSerial())
{
return;
}
//Show UID on serial monitor
String content= "";
byte letter;
for (byte i = 0; i < mfrc522.uid.size; i+)
{
content.concat(String(mfrc522.uid.uidByte[i] < 0x10 ? " 0" : " "));
content.concat(String(mfrc522.uid.uidByte[i], HEX));
}
content.toUpperCase();
if (content.string(1) == Authorized[0])
{
lcd.clear();
lcd.print("Authorized access");
lcd.setCursor(2,1);
lcd.print("Welcome ");

95
myservo.write(0); // take the servo to 0 degree
delay(3000);
myservo.write(90); // return the servo to original position(90 degree)
lcd.clear();
Serial.println("AT"); //Once the handshake test is successful, it will back to OK
delay(1000);
int balance = xx;
String text;
text = String(xx);
mySerial.println("AT"); //Once the handshake test is successful, it will back to OK
updateSerial();
mySerial.println("AT+CMGF=x"); // Configuring TEXT mode
updateSerial();
mySerial.println("AT+CMGS=\"\"");c
updateSerial();
mySerial.print("Welcome xxx remaining balance is :" + text ); //text content
updateSerial();
mySerial.write(26);
}
else if(content.substring(1) == Authorized[1])
{ lcd.clear();
lcd.print("Authorized access");
lcd.setCursor(2,1);
lcd.print("Welcome");
myservo.write(0); // take the servo to 90 degree
//Serial.println();
delay(3000);
myservo.write(90); // return the servo to original position(90 degree)
lcd.clear();
int balance = xxx;
String text;
text = String(xxxx);
mySerial.println("AT"); //Once the handshake test is successful, it will back to OK
updateSerial();
mySerial.println("AT+CMGF=x"); // Configuring TEXT mode
updateSerial();
mySerial.println("AT+CMGS=\"\"");
updateSerial();
mySerial.print("Welcome remaining balance is:" + text); //text content
updateSerial();
mySerial.write(26);}

96
else if(content.substring(1) == Authorized[2])
{
lcd.clear();
lcd.print("Authorized access");
lcd.setCursor(2,1);
lcd.print("Welcome");
myservo.write(0); // take the servo to 90 degree
//Serial.println();
//delay(3000);
// myservo.write(90); // return the servo to original position(90 degree)
//lcd.clear();
int balance = -xxx;
String text;
text = String(xxx);
mySerial.println("AT"); //Once the handshake test is successful, it will back to OK
updateSerial();
mySerial.println("AT+CMGF=x"); // Configuring TEXT mode
updateSerial();
mySerial.println("AT+CMGS=\"\"");
updateSerial();
mySerial.print("welcome xxx remaining balance:"+ text); //text content
updateSerial();
mySerial.write(26);
myservo.write(90); // return the servo to original position(0 degree)
lcd.clear();
}
else if(content.substring(1) == Authorized[3])
{
lcd.clear();
lcd.print("Authorized access");
lcd.setCursor(2,1);
lcd.print("Welcome ");
myservo.write(0); // take the servo to 90 degree
//Serial.println();
delay(3000);
myservo.write(90); // return the servo to original position(90 degree)
lcd.clear();
delay(1000);
int balance = xxx;
String text;
text = String(xxx);

97
mySerial.println("AT"); //Once the handshake test is successful, it will back to OK
updateSerial();
mySerial.println("AT+CMGF=x"); // Configuring TEXT mode
updateSerial();
mySerial.println("AT+CMGS=\"\"");
updateSerial();
mySerial.print("Welcome remaining balance is: "); //text content
updateSerial();
mySerial.write(26);}
else if(content.substring(1) == Authorized[4])
{
lcd.clear();
lcd.print("Authorized access");
lcd.setCursor(2,1);
lcd.print("Welcome ");
myservo.write(90); // take the servo to 0 degree
//Serial.println();
delay(3000);
myservo.write(90); // return the servo to original position(90 degree)
lcd.clear();
Serial.println("AT"); //Once the handshake test is successful, it will back to OK
delay(1000);
int balance = -xxx;
String text;
text = String(xxx);
mySerial.println("AT"); //Once the handshake test is successful, it will back to OK
updateSerial();
mySerial.println("AT+CMGF=x"); // Configuring TEXT mode
updateSerial();
mySerial.println("AT+CMGS=\"\"");
updateSerial();
mySerial.print("welcome remaining balance is:" + text); //text content
updateSerial();
mySerial.write(26);}
else {
lcd.clear();
lcd.print(" Access denied");
delay(3000);
}
show_home();
}

98
Appendix IV
ETC System Algorithm
Start
RFID Number
Database Query
Registered Non-Registered
Database Query
Balance
Tollgate remains
Closed
Tollgate
Closed
Tollgate
Open
Deduct Balance
Y N
N Y
Send text message
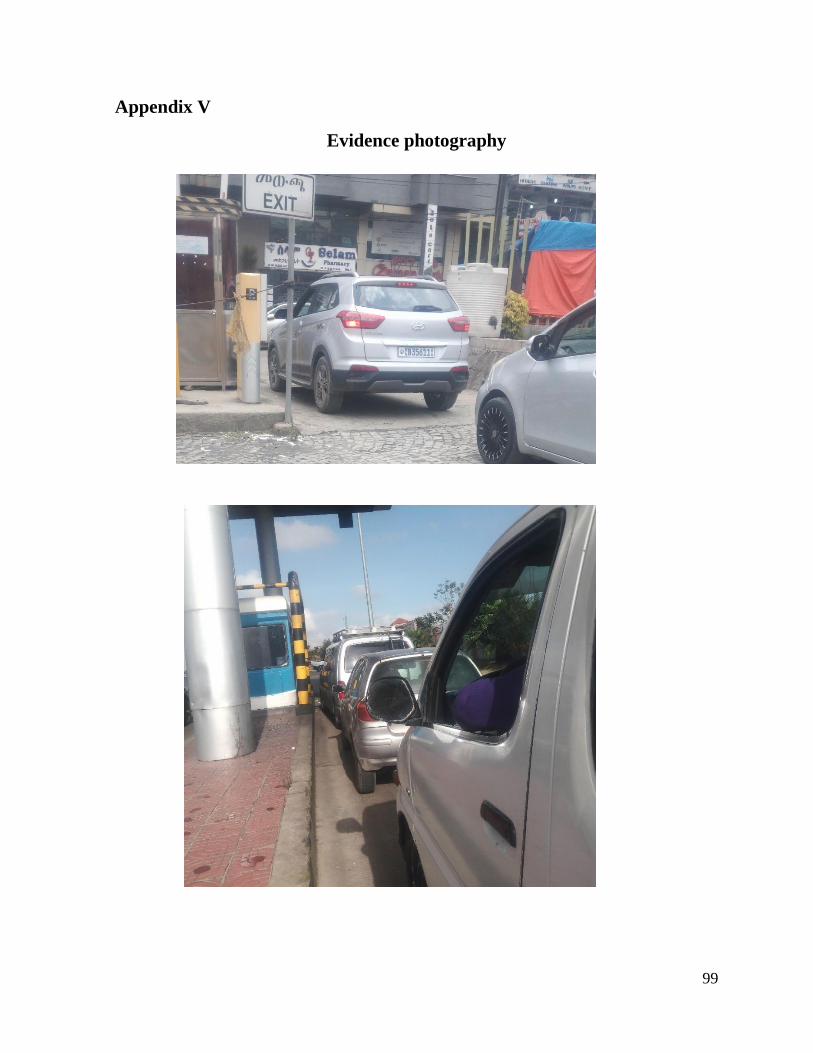
99
Appendix V
Evidence photography
Copyright © 2022 FDOKUMEN