01 P.Penh-Hochi Minh Expressway Project
231
Corner Norodom Blvd/ Street 106, Phnom Penh Royal Government of Cambodia Ministry of Public Works and Transport Road Asset Management Project Component B7 – Consulting Services for Monitoring and Evaluation for Road Asset Management Project RAMP Baseline Traffic and Road Users Survey Report on National and Provincial Road Version 2.0 September 2012
-
Upload
independent -
Category
Documents
-
view
1 -
download
0
Transcript of 01 P.Penh-Hochi Minh Expressway Project

Corner Norodom Blvd/ Street 106, Phnom Penh
Royal Government of Cambodia
Ministry of Public Works and Transport
Road Asset Management Project
Component B7 – Consulting Services for Monitoring and Evaluation for Road Asset Management Project
RAMP Baseline Traffic and Road Users Survey
Report on National and Provincial Road
Version 2.0
September 2012

ADB Loan No. 2406-CAM (SF)/ AusAID Grant No. 1004-CAM
Road Asset Management Project
Component B7 – Consulting Services for Monitoring and Evaluation for Road Asset Management Project
Document Prepared by
J.L NARAYAN
International M&E Consultant RAMP, MPWT
Corner Norodom Blvd/ Street 106, Phnom Penh
Mobile Phone: +855 16 91 75 97, Fax: +855 23 72 45 95
Email: [email protected]
Document Control
Author(s) NARAYAN JAWAHAR LAL – InternationalConsultant
Contributors Project Team
Project Name RAMP Component B7
Consulting Services for Monitoring and Evaluation for Road Asset Management Project
Document Name Baseline Traffic and Road Users Survey Report on National and Provincial
Roads under Road Asset Management Project (RAMP)
Version 2.0 Issued on 16 September
2012 Comment
Final Report for RAMP Project Director
Review
General Release
Prepared by: Reviewed by: Authorized by:
NARAYAN JAWAHAR LAL KANG Phirith PHENG Sovicheano
International M&E Consultant Project Manager Project Director
Date:________________ Date:________________ Date:_______________

CONTENTS
Subject Page Number
Project Data............................................................................................................. i
Abbreviations............................................................................................................ ii
1. Chapter 1- Executive Summary...................................................................... 1
2. Chapter 2- Introduction................................................................................. 3
3. Chapter 3- Summary of Baseline Survey Report........................................... 8
4. Chapter 4- Baseline Survey Report of NR-1.................................................. 24
5. Chapter 5- Baseline Survey Report of NR-5................................................... 42
6. Chapter 6- Baseline Survey Report of NR-7................................................... 59
7. Chapter 7- Baseline Survey Report of NR 71................................................. 76
8. Chapter 8- Baseline Survey Report of NR-72.................................................. 88
9. Chapter 9- Baseline Survey Report of NR-73.................................................. 99
10. Chapter 10- Baseline Survey Report of NR- 2714............................................ 111
11. Chapter 11- Travel and Freight Costs in Cambodia......................................... 122
12. Chapter 12- Highway Capacity and Level of Service-Travel Time Survey....... 128
Appendices:
Appendix I- Forms used for Traffic Count, OD Survey, and Community Survey
Appendix II- Vehicle Category Description
Appendix III- Baseline Traffic Counts
III (a) NR 1- Lot 1, NR 1 – Lot 2
III (b) NR 5- Lot 1, NR 5 – Lot 2
III (c) NR 7- Lot 1, NR 7 – Lot 2
III (d) NR 71
III (e) NR 72
III (f) NR 73
III (g) NR 2714
Appendix IV- OD Survey Data/ Results
Appendix V- Community Survey Data/ Results
Appendix VI- 24 Hour Adjustment Factor Calculation
Appendix VII- Approved Survey Location

Chapter 1
Page 1
Chapter 1-Executive Summary
Baseline Traffic and Road users Survey Report
1- The Road Asset Management Project (RAMP) is being implemented by the Royal
Government of Cambodia through Ministry of Public Works and Transport (MPWT). The
project is being funded by ADB, AusAID, IDA and RGC. The objective is to ensure continued
effective use of the of the rehabilitated national and provincial road network in support of
the economic development in Cambodia. It will do so by improving the institutional and
technical capacity of the MPWT for road Maintenance planning, budgeting and operation by
expending and strengthening maintenance activities.
1.1- The component B7- Monitoring and Evaluation (M&E) is part of the capacity building,
which aims at making assessment of the RAMP in terms its impact on the economic
development, outcomes and outputs.
1.2- The Baseline Traffic Counts and Road Users Survey Report is one of the major
components of the M&E Baseline Report and provide direct measure to some of the benefit
indicators. This Report provides of the direct impact of the RAMP Project in terms of Traffic
Growth, Travel comfort, Saving in travel time, increase in income of transporters, businesses
and communities in the road neighbouring areas.
1.3- The Traffic Survey was organized by the M&E Consultant with the help of local experts.
The process of survey went through the following stages:
1. Design of the Survey Manual
2. Training of the Survey Teams and Staff of the MPWT
3. Full Pilot Survey with the Survey Team and Staff of the MPWT
4. Conducting of TC, OD, and Community Survey at designated locations
5. Data Preparation
6. Analysis of the Data
7. Final Baseline Survey Report
1.4- The entire process of Traffic Survey Starting from training to completion of traffic
survey and data preparation was completed between of 19th April 2012 to 5thMay 2012 (16
days). Data preparation and conversion to Excel forms was completed in 7 days.
1.5 Separate Surveys were conducted by M&E for collection of Passenger Fares and Freight
Charges in August 2012. Passenger fares were found to be lower in 2012 at constant prices
compared to those in 2008.
1.6 A separate survey was conducted in July 2012 to record travel time and nature of traffic
movement on the roads covered under RAMP. This was carried out to compare the saving in
travel time and classify the roads according to their capacity to carry traffic.
1.7 The report is structured into chapters to facilitate detailed analysis of traffic pattern and
mode of travel on each of the 7 National Road covered in the RAMP Project. The Report

Chapter 1
Page 2
analyses traffic, community and OD survey results of each section in full length. The
Chapter3 gives the overall summary. The main findings and conclusions are given in the
Chapter3. The relevant Appendices are attached to the Report for good referencing.
1.8- Conclusions
1.8.1- The assessment of the peak hour traffic on national roads under RAMP shows that
substantial portion of the traffic flows takes place during the peak hours from 7Am to 10Am
and 3 Pm to 5Pm. The peak hour traffic varies from 35 to 85% of the total traffic counts on
the national roads under RAMP.
1.8.2- The composition of traffic shows quite a variation on the national roads, passenger
traffic is generally prevalent during the peak hours. Peak hour traffic also constitutes large
numbers in the late evenings. Late night traffic movements are few and far between.
1.8.3- The community survey shows the qualitative aspect of the impact of the project on
the lives of the people consisting of various categories of Road users and road neighbours
compared to the level in 2008-9. The indicators such as: increase in income of the people in
four categories (agriculture, business, service provider, transporters), driving comfort,
savings in travel time, reduction in travel costs, etc are moving favourably in support of
benefits of the RAMP.
1.8.4- The indicators such as excess to transport, excess to market for sale of produce and
services, better availability of goods and services, education travel, etc. are speaking in
favour of improved road infrastructure provided by RAMP.
1.8.5- The OD survey results have also touched upon the indicators such as movement of
Commodities indicating economic growth, trip purpose, trip length, etc. indicate induced
economic impact of the improved roads as a result of the RAMP.
1.8.6- The occupancy survey results of transport vehicles show fairly large movement of
people for business and commerce. This is also an indicator of the response to improved
road infrastructure development which in turn result in the increase of GDP growth.
1.8.7- Passenger fares of large buses at constant prices are lower than those prevailing
2008. Bus operators have informed that improved road infrastructure has helped them to
save on travel time, maintenance and fuel. Mini bus fares are competitive between the
destinations. Freight charges have increased over those in 2008 as volume of freight traffic
is still low.
1.8.8- There is a remarkable improvement in the travel time on the roads maintained under
RAMP. There is a saving of 21% on travel time on AWP1.1 and 17.5% on AWP1.2. Analysis of
travel movement of the vehicles on national roads under RAMP show that NR5-1, NR7,
NR11, NR71, NR72, NR2714 fall in class E and NR1, NR5-2, NR73 fall in class D.

Chapter 2
Page 3
Chapter 2-Introduction
2.1- All the National Road included in the study is open to unrestricted traffic. The evolution
the input of the RAMP project is very much dependent on the accuracy of the estimates of
the base year traffic (April- May 2012) level. Considerable effort was therefore made to
determine traffic levels accurately on each road.
2.2- Following the usual conventions, traffic levels are expressed in terms of daily traffic
flows. When expressed as total traffic over 24 hours, the term Average Daily Traffic (ADT) is
used when season variations are taken into account the term Annual Average Daily Traffic
(AADT) is used.
2.3- Manual clarified traffic counts identifying different vehicles type were carried out on all identified projects at 10 locations over 14hour period from 7 Am to 6 PM and 8 PM to 11 PM. The traffic was recorded for each hour separately. There is evidence that daily variations on Highways are not significant; therefore some counts were also made on Saturday and Sunday.
2.4- The locations of the sites were chosen as point where traffic levels were believed to be typical of the whole road as section of the road being covered by the counts. The OD survey sites were located in the market areas where vehicles usually stop for taking/dropping passengers, taking fuel, or taking meal/ drink or for commercial work. Similarly for community surveys, the target groups were chosen in the market areas and nearby villages in the road neighbourhood.
Vehicle Types:
2.5- A more extensive vehicle classification system used for other studies was adopted to enable the characteristic of the vehicle types. The vehicle categories identified in the counts are given in the Appendix II.
2.6-B7 – Monitoring and evaluation (M & E) of project outcomes (AusAID - US$0.15 million).
2.6.1-This sub-component will be financed and monitored by AusAID. Monitoring and evaluation is an integral part of good project management practice. It assists the project engineer and the project director to assess the health of the project and make corrective measures, and enables them to deliver the intended outcomes to quality, within time and within budget.
2.6.2-The sub- component will include:
(a) Reviewing current monitoring, evaluation and reporting practices in MPWT, comparison against best practices and identification of gaps. Development of an implementation plan;
(b) Developing within MPWT a permanent capacity to undertake monitoring and evaluation (M & E) of project outcomes;

Chapter 2
Page 4
(c) Designing of the monitoring program and the organizational arrangements required to undertake the baseline and initial project monitoring data collection and analysis quality management for later years; and
(d) Developing and implementing progressive annual reporting processes and reportingframework of the condition of the entire road network categorized by road categories.
RAMP Impact and Outcomes
2.7-The Project will assist in preserving the rehabilitated and maintainable national road network until adequate RGC funds become available for their upkeep. The impact will be the preservation of the MPWT roads so that they can continue to support economic development. The Project will contribute to the long-term sustainability of the MPWT by establishing a consistent and prioritized road management system that will distribute future road maintenance allocations more effectively, thus cultivating a road asset management culture within the sector.
2.8-The main purpose of the M &E technical assistance (TA) funded by AusAID is to assist MPWT in the monitoring and evaluation (M & E) of the impacts, outcomes and outputs of the project and develop permanent capacity within MPWT to undertake M&E.
2.9- The network of the Roads covered under RAMP projects are depicted in the geographical map in the Figure 1.1.

Chapter 2
Page 5
Location Map for Each Road under RAMP
Figure 1.1
Passenger Car Units
2.10- The various vehicle types having different sizes and characteristics are converted into a standard unit called Passenger Car Unit (PCU). Passenger car equivalents for various vehicles are adopted based on international practices. These factor are established on the basis of the space occupied, capacity, attain allowed travel speed, tonage vehicle can carry, number of axles particularly for trucks, motorised and non motorised etc.The Passenger Car Unit Values (PCU) used are presented in Table 2.1.1.
Table 2.1.1
PCU Factors Adopted for the Study (IRC: 64-1990)
Fast Vehicles Slow Vehicles
Vehicle Group PCU Factor Vehicle Group PCU Factor
Car, Jeep, Van and Taxi 1.0 Bicycle 0.5
Auto TukTuk / Picup/Tempo 1.0 Cycle Rickshaw 2.0
2 Wheelers( Mobike/
Scooters) 0.5 Animal Drawn 6.0

Chapter 2
Page 6
Fast Vehicles Slow Vehicles
Vehicle Group PCU Factor Vehicle Group PCU Factor
Mini Bus 1.5
Hand Cart 3.0
Standard Bus 3.0
Light Goods Vehicle (LGV)
(koyun/Etan) 1.5
2 – Axle Truck 3.0
3 – Axle Truck 3.0
Multi Axle Truck (from 4, ..) 4.5
Agriculture Tractor 1.5
Agriculture Tractor & Trailer 4.5
ESTIMATES OF BASE YEAR TRAFFIC 2.10- A number of adjustments were made to survey data to estimate the 2012 traffic flows on the Study Roads in terms of annual average daily traffic (AADT) to serve as the base year traffic figures. 24 HOUR ADJUSTMENT 2.11- The counts were for 14 hours and estimates of night-time traffic were required to adjust the results to a 24 hour basis. The ratio to adjust a count of lessthan 24 hours to an ADT basis is normally higher for inter-urban roads than on ruralroads, and on high traffic roads compared with low traffic roads. The process calculation of the adjust factor for national roads is given in AppendixVI. 24 hour Adjustment factor of 1.16 has been applied in this survey report. DAILY TRAFFIC VARIATION
2.12. Traffic counts are often carried out over a continuous period of seven days.The reason
for this is that daily traffic levels often vary in a regular pattern, reflectingthe distribution of
activities relating to work, trading and recreation over a week.When this occurs, extending
traffic counting periods progressively towards sevendays results in increasing levels of
accuracy of an estimate of ADT as more of thedaily peaks and lows are included in the count
period. In this study the emphasis isto create base line to evaluate impact on traffic as a
result of improved roads, which can be compared with the counts next year at the same
locations so seven day count is not necessary.
Seasonal factor -Annual Average Daily Traffic (AADT)
2.13 The Annual Average Daily Traffic (AADT) is calculated by multiplying ADT with a
seasonality factor. Seasonal variation factors by vehicle types are required to account for
variations in the pattern of traffic volume on the sections of project road over different
Chapter 2
Page 7
months or seasons of the year. There are various methods of determining the seasonality
factor. The most direct method is using the past traffic counts, if traffic surveys are carried
out round the year. But in Cambodia, round the year counts are seldom carried out for any
road. Continuous automatic counting carried out on National roads does show a seasonal
pattern; with peak traffic in January/ February and low traffic in August/September. There is
some effect of rain and flooding. These factors show that traffic levels are usually below the
AADT during the period July to November, with lowest traffic levels in August. Since the
traffic counts were carried out in April-May 2012, when there is no impact of the seasonal
factors, therefore the traffic counts are very close to AADT. Hence there is no need to apply
seasonal factor. This is only for creating baseline data for comparison with the count in the
same period in 2013 to know the impact of the RAMP.

Chapter 3
Page 8
Chapter 3 – Summary of Baseline Survey Report
TRAFFIC DATA ANALYSIS
3. Analysis of Traffic Volume Count
3.1- Data collected from the site was fed to the computer and compiled for the base year (2012). The various vehicle types having different sizes and characteristics were converted into a standard unit called Passenger Car Unit (PCU). Passenger car equivalents for various vehicles are adopted based on international practices. The Passenger Car Unit Values (PCU) used are presented in Table 2.1.1.
3.1.1- Traffic volume count data at each location was counted on hourly basis on both sides of the road to determine Average Daily Traffic (ADT). Traffic volume count data and summary sheets for various locations are presented in Appendix III. The location wise ADT in vehicles and PCUs are presented in the Table 3.1.2 below.
14 Hour Average Daily Traffic (ADT)
3.2- The average daily traffic was computed for various locations where the mid-block
volume count survey was done. Daily traffic volumes were added together for both sides of
the road to find the Average Daily Traffic (ADT). Further, the ADT was also converted to
PCUs using the conversion factors given in Table 2.1.1 Location wise and mode wise ADT
values are given in Table 3.1.4 below. Also the peak hour and peak hour proportion of total
daily traffic over average 14-hour volume count was identified and is given in Table 3.1.1.
Table 3.1.1:14 hour Traffic Count
Station
ID No.
Chainage
(km)
Location of
Survey
ADT
Peak Hour
Flows, 7-
10am & 4-
6Pm
Peak Hour
proportion
in daily
Vehicle
Vol.
Peak Hour
proportion
in daily
PCU Vol. Vehi. PCUs Vehi. PCUs
NR 1-
Lot1
PK:
88.266
Kampong
Trabaek 4948 5048 2346 2274 47.4% 45.0%
NR 1-
Lot2
PK:
135.650
Prasot High
School SVAY
Teap Dist.
Centre
5364 4380.5 2760 2162.5 51.5% 49.4%
NR 5-
Lot1
PM
52+200
Near Kampong
Tralach Market 10253 9837 6023 5203 58.7% 52.9%
NR 5-
Lot 2 PK 124
Punlai,
Kampong
Chahnang
5796 5958 3283 2951.5 56.6% 49.5%
NR 7 –
Lot 1
PK:
131.500
Pratheat,
TboungKhmum 10585 10011 5025 4637 47.5% 46.3%
NR 7-
Lot 2
PK:
179.530
Pratheat,
TboungKhmum 5109 6172 2303 2673.5 45.1% 43.3%

Chapter 3
Page 9
Station
ID No.
Chainage
(km)
Location of
Survey
ADT
Peak Hour
Flows, 7- 10am
& 4-6Pm
Peak Hour
proportion
in daily
Vehicle Vol.
Peak Hour
proportion
in daily PCU
Vol. Vehi. PCUs Vehi. PCUs
NR 71 PK 119 1 Km from
Boskor Market 4082 3727 1903 1643.5 46.6% 44.1%
NR 72 PK
192.900
Infront of
Grand Hotel &
Casino
3484 3404.5 1442 1334 41.4% 39.2%
NR 73 PK 167
At Bunty TV
shop, 1 km
from Dombae
Round about (
south)
4631 3869.5 2226 1715.5 48.1% 44.3%
NR
2714 PK 108
Near SPEU
Market 3190 2227 1544 1025 48.4% 46.0%
Peak Hour Traffic in 14 hour count
3.3- The analysis of the traffic flows on the 7 national road shows that peak hour
movements varies from 41.40% to 58.7% in actual 14 hour counts and in terms of PCUs
39.2% to 52.9%. Lower PCU percentage means that traffic counts constitute higher no of
motor cycles and passenger vehicles compared to heavy trucks and commercial vehicles.
52.9 % of PCUs in case of NR5-1 shows higher movement of trucks.
24 Hour Adjusted Average Daily Traffic
3.4- The traffic count of 14 hours has been adjusted by multiplying the total count of 14
hours by the adjustment factor of 1.16 (calculated on the basis of the calculations in the
Appendix VI).
Table 3.1.2: 24 hour Adjusted Average Daily Traffic
Station
ID No.
Chainage
(km)
Location of
Survey
ADT
Peak Hour
Flows, 7- 10am
& 3-5Pm
Peak Hour
proportion
in daily
Vehicle Vol.
Peak Hour
proportion
in daily
PCU Vol. Vehi. PCUs Vehi. PCUs
NR 1-
Lot1 PK 88.266
Kampong
Trabaek 5740 5856 2346 2274 40.9% 38.8%
NR 1-
Lot2
PK135.650
Prasot High
School SVAY
Teap Dist.
Centre
6222 5081 2760 2162.5 44.4% 42.6%
NR 5-
Lot1
KM
52+200
Near Kampong
Tralach Market 11894 11411 6023 5203 50.6% 45.6%
NR 5-
Lot 2 PK 124
Punlai,
Kampong
Chahnang
6723 6911 3283 2951.5 48.8% 42.7%

Chapter 3
Page 10
Station
ID No.
Chainage
(km)
Location of
Survey
ADT
Peak Hour
Flows, 7- 10am
& 3-5Pm
Peak Hour
proportion
in daily
Vehicle Vol.
Peak Hour
proportion
in daily
PCU Vol. Vehi. PCUs Vehi. PCUs
NR 7 –
Lot 1 131.500
Pratheat,
TboungKhmum 12279 11613 5025 4637 40.9% 39.9%
NR 7-
Lot 2 179.530
Pratheat,
TboungKhmum 5926 7160 2303 2673.5 38.9% 37.3%
NR 71 PK 119 1 Km from
Boskor Market 4735 4323 1903 1643.5 40.2% 38.0%
NR 72 PK
192.900
Infront of Grand
Hotel & Casino 4041 3949 1442 1334 35.7% 33.8%
NR 73 PK 167
At Bunty TV
shop, 1 km from
Dombae Round
about ( south)
5372 4489 2226 1715.5 41.4% 38.2%
NR
2714 PK 108
Near SPEU
Market 3700 2583 1544 1025 41.7% 39.7%
Peak Hour Traffic in 24 hour count
3.5- The analysis of the traffic flows on the 7 national road shows that peak hour movements varies
from 35.7% to 50.6% in 24 hour counts and in terms of PCUs 33.8% to 45.6%. Lower PCU percentage
means that traffic counts constitute higher number of motor cycles and passenger vehicles
compared to heavy trucks and commercial vehicles. 45.6 % of PCUs in case of NR.5-1 shows higher
movement of trucks.
Seasonal factor -Annual Average Daily Traffic (AADT)
3.6- Since the traffic counts were carried out in April-May 2012, when there is no impact of the
seasonal factors, therefore the traffic counts are very close to AADT. Hence there is no need to apply
seasonal factor. This is particularly relevant as this survey and analysis is only for creating baseline
data for comparison with the counts in the same period in 2013 to know the impact of the RAMP
project.
Overall Composition of Traffic
3.7- The composition of traffic in 24 hour adjusted counts for various modes was worked out from
the traffic volume count data. Along the project stretches the share of passenger traffic varies from
53.9% on NR7-2 to 79.4% NR 1-2, whereas goods traffic varies from 20.6 % on NR 1-2to 46.1 % on NR
7-2.Share of 2/3 axle truck is varying from 4.7 % (NR1-Lot2)to 31.6 % (On NR7-2) of total traffic.
Along the project stretch it can be observed that share of two wheelers traffic mainly motor cycle
alone varies from 16.8%(NR7-2) to59.6% (NR.2714). The share of car and jeep/van varies from 9.3%
(NR 2714) to 23.6% (NR5-1) of total traffic along the project RAMP roads.

Chapter 3
Page 11
TABLE 3.1.3: Composition of Traffic 14 Hour PCUs M
CC
-9 NR 73-
PK 167
At Bunty TV
shop, 1 km
from
Dombae
Round
about (
south)
1586 67 253 157 251 610 54 108 18 153 267 113 201 32 1 3870
41.0% 1.7
%
6.5
%
4.1
% 6.5% 15.8%
1.4
%
2.8
%
0.5
% 4.0% 6.9%
2.9
%
5.2
%
0.8
%
0.0
%
Stat
ion
No
.
Ch
ain
age
(km
)
Loca
tio
n o
f Su
rve
y
Mo
tor
Cyc
le
Thre
e W
he
ele
r/Tu
kTu
k
Car
Min
i Bu
s
Bu
s
LGV
(Ko
un
/ Es
tan
) sm
all
LGV
(Ko
un
/ Es
tan
) la
rge
Truck
Tota
l
Jee
p/4
wd
Pic
up
2 A
xle
lig
ht
3 A
xle
Me
diu
m
3ax
le h
eav
y
Mu
lti a
xle
4 r
igid
Mu
lti-
axle
tra
ilers
5
Mu
lti-
axle
tra
iler
he
avy
6
MC
C-1
NR 1-
Lot1 Pk
88.206
Kampong
Trabaek
1436 79 434 252 127 810.5 449 77 62 88.5 326 117 436 348 6.5
5048 28.4
%
1.6
%
8.6
%
5.0
% 2.5%
16.1
%
8.9
%
1.5
%
1.2
% 1.8% 6.5%
2.3
%
8.6
%
6.9
%
0.1
%
MC
C-2
NR 1-
Lot2
PK135.
650
Prasot High
School
SVAY Teap
Dist. Centre
1959 160 363 185 101 232.5 477 134 45 60 105 42 171 342 4.5
4381 44.7
%
3.7
%
8.3
%
4.2
% 2.3% 5.3%
10.
9%
3.0
%
1.0
% 1.4% 2.4%
1.0
%
3.9
%
7.8
%
0.1
%
MC
C-3
NR 5-
Lot1
PK52+
200
Near
Kampong
Tralach
Market
2893 327 133
9 471 507 903 747 54 198 336 864 240 234 491 234
9837
29.4% 3.3
%
13.
6%
4.8
% 5.2% 9.2%
7.6
%
0.5
%
2.0
% 3.4% 8.8%
2.4
%
2.4
%
5.0
%
2.4
%
MC
C-4
NR5 –
Lot 2
PK
131.50
0
Punlai,
Kampong
Chahnang
1651 83 608 281 397 441 681 61.5 81 100.5 645 195 198 531 4.5
5958
27.7% 1.4
%
10.
2%
4.7
% 6.7% 7.4%
11.4
%
1.0
%
1.4
% 1.7% 10.8%
3.3
%
3.3
%
8.9
%
0.1
%
MC
C-5
NR 7 –
Lot 1
PK31.5
00
Pratheat,
TboungKh
mum
2950 472 890 530 611 1561 195 86 58 703 841 359 350 347 59.5
10011 29.5%
4.7
%
8.9
%
5.3
% 6.1% 15.6%
1.9
%
0.9
%
0.6
% 7.0% 8.4%
3.6
%
3.5
%
3.5
%
0.6
%
MC
C-6
NR 7-
Lot 2-
PK
179.53
0
Pratheat,
TboungKh
mum
1039 132 496 241 405 933 81 48 32 541 1071 338 635 156 24.5
6172
16.8% 2.1
%
8.0
%
3.9
% 6.6% 15.1%
1.3
%
0.8
%
0.5
% 8.8% 17.4%
5.5
%
10.3
%
2.5
%
0.4
%
MC
C-7
NR 71
PK 119
1 Km from
Boskor
Market
1349 87 210 177 150 406.5 71 56.5 42 203 361 260 246 100 9 3727
36.2% 2.3
%
5.6
%
4.7
% 4.0% 10.9%
1.9
%
1.5
%
1.1
% 5.4% 9.7%
7.0
%
6.6
%
2.7
%
0.2
%
MC
C-8
NR 72-
PK
192.90
0
Infront of
Grand
Hotel &
Casino
1187 129 277 179 100 107 30 137 42 38 326 182 411 229 31.5 3405
34.9% 3.8
%
8.1
%
5.3
% 2.9% 3.1%
0.9
%
4.0
%
1.2
% 1.1% 9.6%
5.3
%
12.1
%
6.7
%
0.9
%

Chapter 3
Page 12
Stat
ion
No
.
Ch
ain
age
(km
)
Loca
tio
n o
f Su
rve
y
Mo
tor
Cyc
le
Thre
e W
he
ele
r/Tu
kTu
k
Car
Jee
p/4
wd
Pic
up
Min
i Bu
s
Bu
s
LGV
(Ko
un
/ Es
tan
) sm
all
LGV
(Ko
un
/ Es
tan
) la
rge
Truck
Tota
l
2 A
xle
lig
ht
3 A
xle
Me
diu
m
3ax
le h
eav
y
Mu
lti a
xle
4 r
igid
Mu
lti-
axle
tra
ilers
5
Mu
lti-
axle
tra
iler
he
avy
6
MC
C-1
0 NR
2714-
PK 108
Near SPEU
Market
1327 84 83 37 87 133 6 62 60 60.5 134 70 84 0 0
2227 59.6
%
3.8
%
3.7
%
1.7
% 3.9% 6.0%
0.3
%
2.8
%
2.7
% 2.7% 6.0%
3.1
%
3.8
%
0.0
%
0.0
%
Table 3.1.4:24 Hour Adjusted Composition of Traffic PCUs
Stat
ion
No
.
Ch
ain
age
(km
)
Loca
tio
n o
f Su
rve
y
Mo
tor
Cyc
le
Thre
e W
he
ele
r/Tu
kTu
k
Car
Min
i Bu
s
Bu
s
LGV
(Ko
un
/ Es
tan
) sm
all
LGV
(Ko
un
/ Es
tan
) la
rge
Truck
Tota
l
Jee
p/4
wd
Pic
kup
2 A
xle
lig
ht
3 A
xle
Me
diu
m
3ax
le h
eav
y
Mu
lti a
xle
4 r
igid
Mu
lti-
axle
tra
ilers
5
Mu
lti-
axle
tra
iler
he
avy
6
MC
C-1
NR 1-
Lot1 Pk
88.206
Kampong
Trabaek
1,666 92 503 292. 147 940.2 521 89.3 71 103 378 136 506 404 7.5 5,856
28.4% 1.6
%
8.6
%
5.0
%
2.5
% 16.1%
8.9
% 1.5%
1.2
%
1.8
%
6.5
%
2.3
%
8.6
%
6.9
%
0.1
%
100.0
%
MC
C-2
NR 1-
Lot2
PK135.
650
Prasot High
School
SVAY Teap
Dist. Centre
2,272 186 421 215 117 270 553 155 52 70 122 49 198 397 5 5,081
44.7% 3.7
%
8.3
%
4.2
%
2.3
% 5.3%
10.
9% 3.0%
1.0
%
1.4
%
2.4
%
1.0
%
3.9
%
7.8
%
0.1
%
100.0
%
MC
C-3
NR 5-
Lot1K
M
52+200
Near
Kampong
Tralach
Market
3,35
5
37
9
1,5
53
54
6
58
8
1,04
7
86
7 63
23
0
39
0
1,0
02
27
8
27
1
56
9
27
1
11,4
11
29.4
%
3.3
%
13.
6%
4.8
%
5.2
% 9.2%
7.6
% 0.5%
2.0
%
3.4
%
8.8
%
2.4
%
2.4
%
5.0
%
2.4
%
100.
0%
MC
C-4
NR5 –
Lot2PK
131.50
0
Punlai,
Kampong
Chahnang
1,91
5 96
70
5
32
6
46
1 512
79
0 71 94
11
7
74
8
22
6
23
0
61
6 5
6,91
1
27.7
%
1.4
%
10.
2%
4.7
%
6.7
% 7.4%
11.
4% 1.0%
1.4
%
1.7
%
10.
8%
3.3
%
3.3
%
8.9
%
0.1
%
100.
0%
MC
C-5
NR 7 –
Lot 1
PK131.
500
Pratheat,
TboungKh
mum
3,42
1
54
8
1,0
32
61
5
70
9
1,81
0
22
6 100 67
81
5
97
6
41
6
40
6
40
3 69
11,6
13
29.5
%
4.7
%
8.9
%
5.3
%
6.1
%
15.6
%
1.9
% 0.9%
0.6
%
7.0
%
8.4
%
3.6
%
3.5
%
3.5
%
0.6
%
100.
0%
MC
C-6
NR 7-
Lot 2-
PK
179.53
0
Pratheat,
TboungKh
mum
1,20
5
15
3
57
5
28
0
47
0
1,08
2 94 56 37
62
8
1,2
42
39
2
73
7
18
1 28
7,16
0
16.8
%
2.1
%
8.0
%
3.9
%
6.6
%
15.1
%
1.3
% 0.8%
0.5
%
8.8
%
17.
4%
5.5
%
10.
3%
2.5
%
0.4
%
100.
0%

Chapter 3
Page 13
MC
C-7
NR 71
PK 119
1 Km from
Boskor
Market
1,56
4
10
1
24
4
20
5
17
4 472 82 66 48
23
5
41
9
30
2
28
5
11
6 10
4,32
3
36.2
%
2.3
%
5.6
%
4.7
%
4.0
%
10.9
%
1.9
% 1.5%
1.1
%
5.4
%
9.7
%
7.0
%
6.6
%
2.7
%
0.2
%
100.
0%
MC
C-8
NR 72-
PK
192.90
0
Infront of
Grand
Hotel &
Casino
1377 150 321 208 116 124 35 158 49 45 378 211 476 266 37 3951
34.8
5%
3.8
0%
8.1
2%
5.2
6%
2.9
4%
3.14
%
0.8
9%
4.00
%
1.2
4%
1.1
4%
9.5
7%
5.3
4%
12.
05
%
6.7
3%
0.9
4%
MC
C-9
NR 73-
PK 167
At Bunty TV
shop, 1 km
from
Dombae
Round
about (
south)
1840 78 293 182 291 708 63 125 20 178 310 131 233 37 1 4490
40.9
8%
1.7
4%
6.5
3%
4.0
5%
6.4
8%
15.7
7%
1.4
0%
2.78
%
0.4
5%
3.9
6%
6.9
0%
2.9
2%
5.1
9%
0.8
2%
0.0
2%
MC
C-1
0
NR
2714-
PK 108
Near SPEU
Market
1539 97 96 43 101 154 7 72 69 70 155 81 97 0 0 2581
59.6
3%
3.7
6%
3.7
2%
1.6
7%
3.9
1%
5.97
%
0.2
7%
2.79
%
2.6
7%
2.7
1%
6.0
1%
3.1
4%
3.7
6%
0.0
0%
0.0
0%
Hourly Variation of Traffic
3.8-Traffic volume count was conducted in both directions simultaneously, for 14 hours and
converted to PCUs. The hourly count was compiled by adding traffic counts of both sides to get the
hourly variation of traffic for each survey location. The summary of hourly movements on 10
locations on 7 National Roads is given in the Table 3.1.5 the 7 roods the graph showing hourly
variation for each location is given in Fig 3.1.1). Peak hour traffic for all the locations from 7am to 10
am and 3pm to 5pm is found to be between 39.2% to 52.9% of the actual 14 hour PCU counts of
ADT, and in 24 hour adjusted PCUs. The trend of variation is quite normal for intercity roads because
of high percentage of regional traffic movement of freight traffic on the road. This results in traffic
flows to be uniformly distributed over the main 16-20 hours of the day.
Stat
ion
No
.
Ch
ain
age
(km
)
Loca
tio
n o
f Su
rve
y
Mo
tor
Cyc
le
Thre
e W
he
ele
r/Tu
kTu
k
Car
Jee
p/4
wd
Pic
kup
Min
i Bu
s
Bu
s
LGV
(Ko
un
/ Es
tan
) sm
all
LGV
(Ko
un
/ Es
tan
) la
rge
Truck
Tota
l
2 A
xle
lig
ht
3 A
xle
Me
diu
m
3ax
le h
eav
y
Mu
lti a
xle
4 r
igid
Mu
lti-
axle
tra
ilers
5
Mu
lti-
axle
tra
iler
he
avy
6

Chapter 3
Page 14
TABLE 3.1.5: SUMMARY OF HOURLY COUNTS (PCUs)
Road No. NR.5-1 NR.5-2 NR.1-1 NR.1-2 NR.7-1 NR.7-2 NR.71 NR.72 NR.73 NR.2714
Location of TC
Kampong
Trach Punlai
Kampong
Trabec
Svay Teap
Tbong Khmo
m
Pro Thead
Bos Khnor
Tropeng
Phlong
Dambae
Speu
Time Total TC
Both side
Total TC
Both side
Total TC
Both side
Total TC
Both side
Total TC
Both side
Total TC Both side
Total TC
Both side
Total TC
Both side
Total TC
Both side
Total TC Both side
6h to 7h 391.2 216.6 166.6 216.8 352.8 231.6
139.6 112.4 146.2 104.4
7h to 8h 978 541.5 416.5 542 882 579
349 281 365.5 261
8h to 9h 1137 506 530.5 473.5 1053.5 568.5
379 195 368.5 204.5
9h to 10h 909.5 627.5 552.5 393 977.5 653
379.5 236.5 347.5 224
10h to 11h 913 460 487.5 373 805 499.5
409.5 283 359 196
11h to 12h 789 463 438.5 299.5 816.5 702
213.5 277.5 356 151.5
12h to 13h 754.5 489.5 361.5 344 847 363
282 356.5 326 182
13h to 14h 703.5 452 423.5 276 811.5 717
272 319 351.5 192.5
14h to 15h 755.5 471 403 256 879.5 481
321 241.5 311.5 212
15h to 16h 726.5 424.5 454 280 712.5 503
346.5 327 293 146
16h to 17h 734.5 435 391.5 346.5 904 460
341 340.5 319.5 157.5
17h to 18h 717.5 417 383 407.5 820 413
195 281 314.5 178
Total (A) 9509.7 5503.6 5008.6 3991 9509 9862 3488 3138.5 3712.5 2105
20h to 21h 393.5 251 90 178.5 242 97
138 144 98 66
21h to 22h 187.5 230 68 104.5 164 78
67 60 43 32
22h to 23h 137.5 190 48 106.5 96 58
34 62 16 24
Total (B) 718.5 671 206 389.5 502 233 239 266 157 122
Total (A) 9509.7 5503.6 5008.6 3991 9509 9862 3488 3138.5 3712.5 2105
Grand Total
10228.2 6174.6 5214.6 4381 10011 10095 3727 3404.5 3869.5 2227

Chapter 3
Page 15
Fig 3.1.1
Overall Result of the Community Survey
3.9-The community survey questionnaire was designed to obtain information on the benefits of the
rehabilitated national roads was structured in to 10 questions. Question 1 &2 basically cover the
details of the respondents whereas questions 3 to10 are directly related to the qualitative benefits
enjoyed by the road users and road neighbours. These questions provide multiple choices. The
responses the community from the 40 samples, 10 each in 4 categories are summarised in the table
below:
0
100
200
300
400
500
600
700
800
900
1000
1100
1200
6h
to
7h
7h
to
8h
8h
to
9h
9h
to
10
h
10
h t
o 1
1h
11
h t
o 1
2h
12
h t
o 1
3h
13
h t
o 1
4h
14
h t
o 1
5h
15
h t
o 1
6h
16
h t
o 1
7h
17
h t
o 1
8h
20
h t
o 2
1h
21
h t
o 2
2h
22
h t
o 2
3h
Axi
s Ti
tle
Axis Title
NR.5-1
NR.5-2
NR.1-1
NR.1-2
NR.7-1
NR.7-2
NR.71
NR.72
NR.73
PR.2714
SUMMARY OF TRAFFIC COUNT OF RAMP (PCUs)
NR.( 1-1, 1-2, 5-1, 5-2, 7-1, 7-2, 71, 72, 73, 2714 )

Chapter 3
Page 16
Table 3.1.6: SUMMARY OF COMMUNITY DATA SURVEY
No. Question
Road No. NR.5-1 NR.5-2 NR.1-1 NR.1-2 NR.7-1 NR.7-2 NR.71 NR.72 NR.73 NR.2714
Location Kampong
Trach Punlai
Kampong Trabec
Svay Teap
Tbong Khmom
Pres Theat
Bos Khnor
Trapeng Thlong
Dambae Speu
3 In the family
Member in family
M 88 85 57 61 77 55 71 61 86 101
F 98 99 69 74 102 68 66 74 78 99
No. of Children
M 51 58 34 30 67 41 50 30 45 70
F 54 63 50 35 95 36 57 23 44 70
4 Vehicle ownership Motorbike 23 28 32 35 24 23 21 19 33 27
Car 7 3 1 1 8 5 3 2 2 3
Scooter 0 4 1 0 6 0 16 1 0 11
Lorry / Etan 1 1 0 0 1 1 1 6 2 0
Others, (bicycle)
11 17 13 15 0 20 0 14 21 0
Km/mon. 8620 14820 4650 3900 11050 6900 7560 8940 5870 8940
5 Use of Public/Private Transport
Bus 6 2 38 1 3 6 10 10 1 1
Car 33 38 2 30 14 28 12 25 19 32
Others ( Motor taxi,
3 0 38 0 5 12 1 7 37 3
6 Main Occupation of family
Agriculture 9 7 8 6 11 18 15 17 14 10
Service 15 20 21 22 16 7 13 13 19 16
Business 16 13 11 12 13 15 12 10 7 13
7 Family income (Monthly) USD/Riels
Minimum $ 50 $ 50 $ 50 $ 50 $ 75 $ 50 $ 120 $ 50 $ 100 $ 100
Maximum $ 5,000 $ 2,250 $ 1,625 $ 2,250 $ 3,000 $ 2,250 $ 5,000 $ 5,750 $ 750 $ 7,000
Average $ 725 $ 408 $ 319 $ 443 $ 365 $ 996 $ 748 $ 232 $ 689

Chapter 3
Page 17
No. Question
Road No. NR.5-1 NR.5-2 NR.1-1 NR.1-2 NR.7-1 NR.7-2 NR.71 NR.72 NR.73 NR.2714
Location Kampong
Trach Punlai
Kampong Trabec
Svay Teap
Tbong Khmom
Pres Theat
Bos Khnor
Trapeng Thlong
Dambae Speu
8 Benefit of the road project
Quality Travel
(comfort level)
Excellent 12 1 3 0 6 11 0 12 2 1
very Good 19 21 33 35 30 21 36 17 27 30
Good 7 18 4 5 4 5 3 11 11 9
Poor 2 0 0 0 0 3 1 0 0 0
Saving in transportati
on cost
compared to 2008
Lower 18 45% 33 83% 30 75% 37 93% 11 28%
15 38% 5 13% 17 43% 29 73%
5 13%
Some what lower
17 43% 7 18% 10 25% 3 8% 14 35%
10 25% 1 3% 14 35% 10 25%
13 33%
No Change 5 13% 0 0% 0 0% 0 0% 2 5% 1 3% 5 13% 9 23% 1 3% 8 20%
Over 0 0% 0 0% 0% 0 0% 13 33%
14 35% 29 73% 0 0% 0 0% 14 35%
Excess to public
transport compared to
2008
Better 34 40 40 40 21 31 1 28 33 32
Some what better
2 0 0 0 18 6 38 10 7 7
No Change 4 0 0 0 1 3 1 2 0 1
9 Travel of school
children by
Distance (km)
Minimum 0.01 0.1 0.02 0.2 0.4 0.3 0.3 0.2 0.25 0.14
Maximum 17 5 2 20 18 6 10 5 3 6
Mean 1.7 0.5 0.7 1.3 2.5 1.7 2.47 0.78 0.93 1
By Walk Percentage 23.10% 24.00% 11.50% 27.60% 6.50% 4.00% 11.50% 16.00% 3.30% 17.20%
By Personal vehicle
including bicycle
Yes 64.10% 76.00% 88.50% 62.10% 74.10% 88.00% 88.50% 84.00% 96.70% 79.40%
By Bus Yes 2.60% 0.00% 0.00% 3.40% 6.50% 4.00% 0.00% 0.00% 0.00% 0.00%
By Others Yes 10.20% 0.00% 0.00% 6.90% 12.90% 4.00% 0.00% 0.00% 0.00% 3.40%

Chapter 3
Page 18
No. Question
Road No. NR.5-1 NR.5-2 NR.1-1 NR.1-2 NR.7-1 NR.7-2 NR.71 NR.72 NR.73 NR.2714
Location Kampong
Trach Punlai
Kampong Trabec
Svay Teap
Tbong Khmom
Pres Theat
Bos Khnor
Trapeng Thlong
Dambae Speu
10 How road project
benefited your family business?
Availability of goods
in the market
Better 39 39 39 39 40 40 39 40 40 31
Somewhat better
1 1 1 1 0 0 1 0 0 9
Easy to carry goods
for sale in the market
Better 37 39 39 40 40 40 39 39 39 36
Somewhat better
3 1 1 0 0 0 1 1 1 4
Easy excess to market
Better 37 39 39 40 40 40 39 40 39 33
Somewhat better
3 1 1 0 0 0 1 0 1 7

Chapter 3
Page 19
Response to Vehicle ownership and Km Travel
3.9.1- Each of the target groups interviewed show that on an average every family had one
motorised vehicle (motor cycle or car, scooter, lorry or Etan) and large number of them had bicycles
as an alternate. 40 samples interviewed show extensive total travel of 3900Kms to 14820 kms per
month. The average travel at the individual level is of the order of 98 kms.
Use of Public and Private Transport
3.9.2- In the sample 40, it has been observed that at least 1-2 Kms of distance is usually covered by
using public/private transport, which shows niche demand for local transporters. This shows that
private transporters are making good margin in transport business.
Main occupation of Road Neighbours
3.9.3- It has been observed that nearly 20% of the population in the road neighbouring areas at the
study locations were in agriculture, about 40% in business and balance 40% in service (as an
employee or running service centres, repairs of vehicles., petrol pumps etc.).
Family Income
3.9.4- Most of the respondents reported increase income in their income levels compared to level in
2008-9. The average monthly income of neighbouring families is reported to be in the range US$232
to US$996 at different national roads. However, it varies from a minimum of US$50 to a maximum of
US$7000 per month.
Benefit of the Road Rehabilitation Project
Quality of Travel
3.9.5.1- 5 % of the people rated quality of travel as excellent, %have rated quality of travel as very
good , % have rated good, and only % have rated poor. Poor rating by some respondents are
obvious as the rehabilitation work is still in progress in some sections of the on-going projects.
Saving in Transportation Cost
3.9.5.2- compared to the travel costs in 2008-9, 46 % of the respondents have reported lower travel
costs, 24 % have reported somewhat lower travel costs and 10 % have reported no change in travel
cost. Keeping in view increase in cost of petroleum products no change is also a good indicator.
Quite few respondents have also reported increase in costs may they are not aware of the
percentage increase in their income vis a vis percentage of income spent on travel.
Excess to Public Transport
3.9.5.3- Most roads surveyed, respondents have reported good availability of public transport,
except on NR71 leading to the Vietnam border as most of the vehicles on the road take goods across
the border and as this point does not allow passenger movement.

Chapter 3
Page 20
Travel of School Children
Distance Travelled
3.9.6.1-On the overall, children living in the neighbourhood of the national roads travel from
minimum of 0.01 km to a maximum of 20 Kms for going to their schools. This gives an average
distance of about 1 km, the school children travel.
Children Walking to School
3.9.6.2-Out of the total school going childrenliving in the neighbourhood of various nation roads
about 3.35 to 24% travels to their schools by walk.
Children Using Personal Vehicles
3.9.6.3-Out of the total school going children living in the neighbourhood of various nation roads
about 66.17 to 96.7travels to their schools by their personal vehicles.
Children going to School by Bus
3.9.6.4- Out of the total school going children living in the neighbourhood of various nation roads
about 0 to 6.5travels to their schools by bus.
Travel by other means
3.9.6.5-Out of the total school going children living in the neighbourhood of various nation roads
about 0 to 12.9% travel to their schools by other means.
How Road Project Benefited Family Business
Availability Good in the Market
3.9.7.1- Majority of the respondents reported better availability of goods and services.
Easy to carry Goods to the Market
3.9.7.2- Most respondents have reported better availability of transport means to carry goods to the
market because of good roads.
Easy Excess to Market
3.9.7.3- Majority of the respondents have reported better excess to market.
Analysis of the OD Survey Results
Origin and Destination survey was done at 10 designated locations along the RAMP project road.
Data collected from the site was fed to the computer and compiled for the base year (2012), using
the povincial zoning system for the study. Modewise OD matrices for each location was prepared
from the data collected to find the travel characteristics of the traffic.
Chapter 3
Page 21
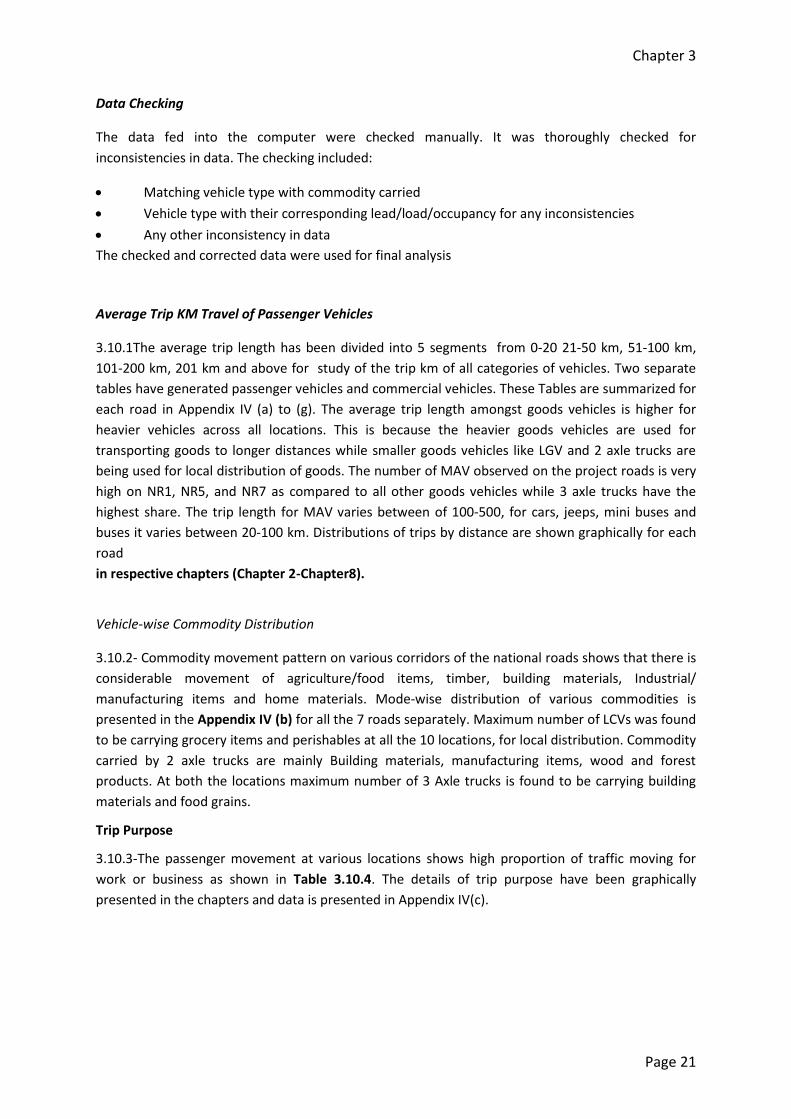
Data Checking
The data fed into the computer were checked manually. It was thoroughly checked for
inconsistencies in data. The checking included:
Matching vehicle type with commodity carried
Vehicle type with their corresponding lead/load/occupancy for any inconsistencies
Any other inconsistency in data
The checked and corrected data were used for final analysis
Average Trip KM Travel of Passenger Vehicles
3.10.1The average trip length has been divided into 5 segments from 0-20 21-50 km, 51-100 km,
101-200 km, 201 km and above for study of the trip km of all categories of vehicles. Two separate
tables have generated passenger vehicles and commercial vehicles. These Tables are summarized for
each road in Appendix IV (a) to (g). The average trip length amongst goods vehicles is higher for
heavier vehicles across all locations. This is because the heavier goods vehicles are used for
transporting goods to longer distances while smaller goods vehicles like LGV and 2 axle trucks are
being used for local distribution of goods. The number of MAV observed on the project roads is very
high on NR1, NR5, and NR7 as compared to all other goods vehicles while 3 axle trucks have the
highest share. The trip length for MAV varies between of 100-500, for cars, jeeps, mini buses and
buses it varies between 20-100 km. Distributions of trips by distance are shown graphically for each
road
in respective chapters (Chapter 2-Chapter8).
Vehicle-wise Commodity Distribution
3.10.2- Commodity movement pattern on various corridors of the national roads shows that there is
considerable movement of agriculture/food items, timber, building materials, Industrial/
manufacturing items and home materials. Mode-wise distribution of various commodities is
presented in the Appendix IV (b) for all the 7 roads separately. Maximum number of LCVs was found
to be carrying grocery items and perishables at all the 10 locations, for local distribution. Commodity
carried by 2 axle trucks are mainly Building materials, manufacturing items, wood and forest
products. At both the locations maximum number of 3 Axle trucks is found to be carrying building
materials and food grains.
Trip Purpose
3.10.3-The passenger movement at various locations shows high proportion of traffic moving for
work or business as shown in Table 3.10.4. The details of trip purpose have been graphically
presented in the chapters and data is presented in Appendix IV(c).

Chapter 3
Page 22
Table3.1.7: Trip Purpose of Passenger Vehicles in Number of Vehicles Count
National Road No. Type
Work/business (code1)
To/from work(code2)
Social/Private (code3)
School (code 4)
Recreation/ Holiday/Tourism (code5)
Others (code6)
NR1 210 19 103 2 12 0
NR5 331 37 258 3 38 0
NR7 213 112 214 4 0 0
NR71 71 33 37 2 11 0
NR 72 37 5 12 0 12 0
NR73 83 29 44 157 0 0
NR2417 59 9 50 5 7 0
Provincial Movements
3.10.4-In order to assess the movement pattern on the project influence area the province and
adjoining province were studied keeping in view the major generation and attraction points in the
area. Following O-D movements on the national roads are given in the Appendix IV (d).
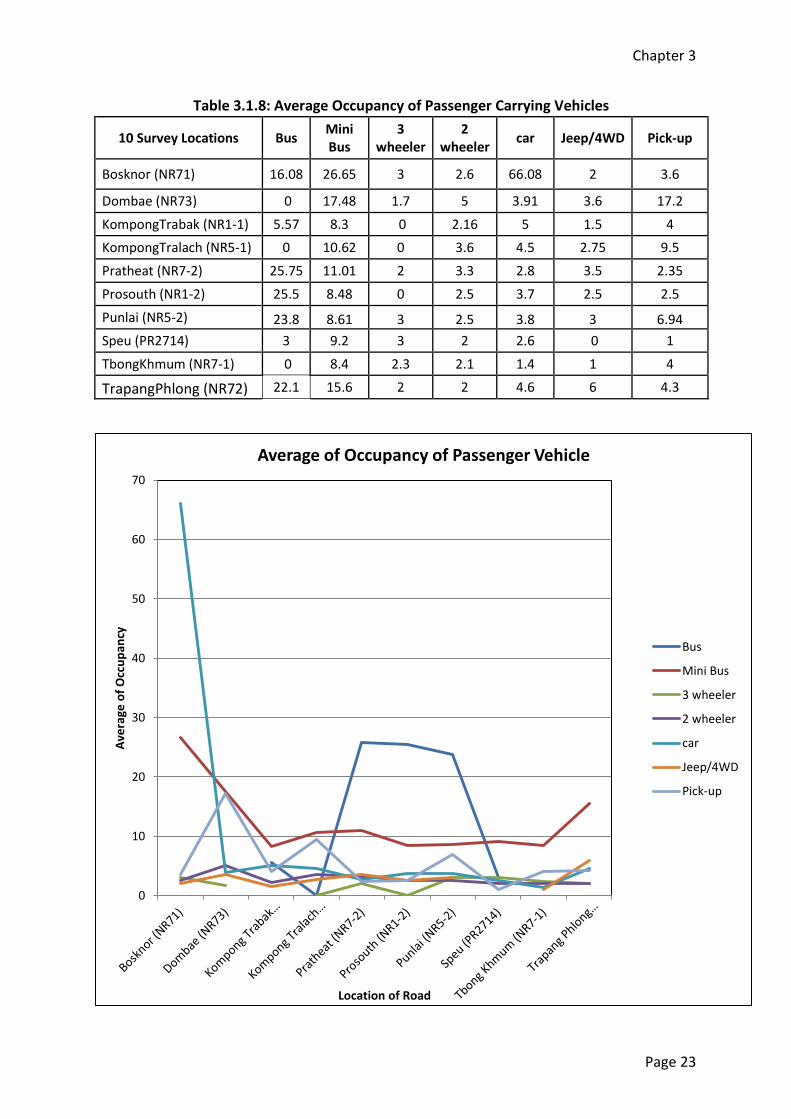
Occupancy Survey
3.10.5- Passenger Occupancy survey was done for 14 hour duration (from 7:00 am to 6:00 pm and
8pm to 11pm) for each location. Table 3.1.8 gives the mode-wise average occupancy at survey
location. Table shows fairly above average occupancy, thus a good capacity utilization.
0
50
100
150
200
250
300
350
NR1 NR5 NR7 NR71 NR 72 NR73 NR2417
Pas
sen
ger
Ve
hic
le
Road Number
The Structure of Trip Purpose
Work/business (code1)
To/from work(code2)
Social/Private(code3)
School(code 4)
Recreation/ Holiday/Tourism(code5)
Others(code6)
Chapter 3
Page 23
Table 3.1.8: Average Occupancy of Passenger Carrying Vehicles
10 Survey Locations Bus Mini Bus
3 wheeler
2 wheeler
car Jeep/4WD Pick-up
Bosknor (NR71) 16.08 26.65 3 2.6 66.08 2 3.6
Dombae (NR73) 0 17.48 1.7 5 3.91 3.6 17.2
KompongTrabak (NR1-1) 5.57 8.3 0 2.16 5 1.5 4
KompongTralach (NR5-1) 0 10.62 0 3.6 4.5 2.75 9.5
Pratheat (NR7-2) 25.75 11.01 2 3.3 2.8 3.5 2.35
Prosouth (NR1-2) 25.5 8.48 0 2.5 3.7 2.5 2.5
Punlai (NR5-2) 23.8 8.61 3 2.5 3.8 3 6.94
Speu (PR2714) 3 9.2 3 2 2.6 0 1
TbongKhmum (NR7-1) 0 8.4 2.3 2.1 1.4 1 4
TrapangPhlong (NR72) 22.1 15.6 2 2 4.6 6 4.3
0
10
20
30
40
50
60
70
Ave
rage
of
Occ
up
ancy
Location of Road
Average of Occupancy of Passenger Vehicle
Bus
Mini Bus
3 wheeler
2 wheeler
car
Jeep/4WD
Pick-up

Chapter 4
Page 24
Chapter4-Baseline Survey Report of NR-1
Road and Location-wise Traffic Counts and Composition of Traffic
NR1 Lot 1- PK 88+266- Kampong Trabaek and NR 1-Lot2 PK135+650 Prasot High School SVAY Teap
Dist. Centre
Average Daily Traffic (ADT)
4.1- The average daily traffic was computed for two locations one eachon NR1-1 and NR1-2
where the mid-block volume count survey was done. Daily traffic volumes were arrived at by adding
counts of both sides of the road at each location find the Average Daily Traffic (ADT). Further, the
ADT was also converted to PCUs using the conversion factors given in Table 2.1.1. Location wise and
mode wise ADT values are given in Table 4.1.1 below. Also the peak hour and peak hour proportion
of total daily traffic (over average 14-hour volume count) was identified and is given in Table 4.1.1.
4.1.1- Traffic volume count data at each location was counted on hourly basis on both sides of the road to determine Average Daily Traffic (ADT). Traffic volume count data and summary sheets for various locations are presented in Appendix III (a). The location wise ADT in vehicles and PCUs are presented in the Table 4.1.1 below.
Table 4.1.1: 14 hour Traffic Count
Station
ID No.
Chainage
(km)
Location of
Survey
ADT Peak Hour Flows,
7- 10am & 4-6Pm Peak
Hour
proportio
n in daily
Vehicle
Vol.
Peak
Hour
proporti
on in
daily
PCU
Vol.
Vehi. PCUs Vehi. PCUs
NR 1-
Lot1 PK 88.266
Kampong
Trabek 4948 5048 2346 2247 47.4% 45.0%
NR 1-
Lot2
PK135.650
Prasot High
School SVAY
Teap Dist.
Centre
5364 4381 2760 2163 51.5% 49.4%
Peak Hour Traffic in 14 hour count
4.1.2- The analysis of the traffic flows on the NR1 national road shows that peak hour movements
varies from 47.4% to 51.5% in actual 14 hour counts and in terms of PCUs 45.0% to 49.4%. Lower
PCU percentage means that traffic counts constitute higher number of motor cycles and passenger
vehicles compared to heavy trucks and commercial vehicles. In case of NR1-1 lot 2, 49.4% PCUs
shows higher movement of trucks.
Chapter 4
Page 25
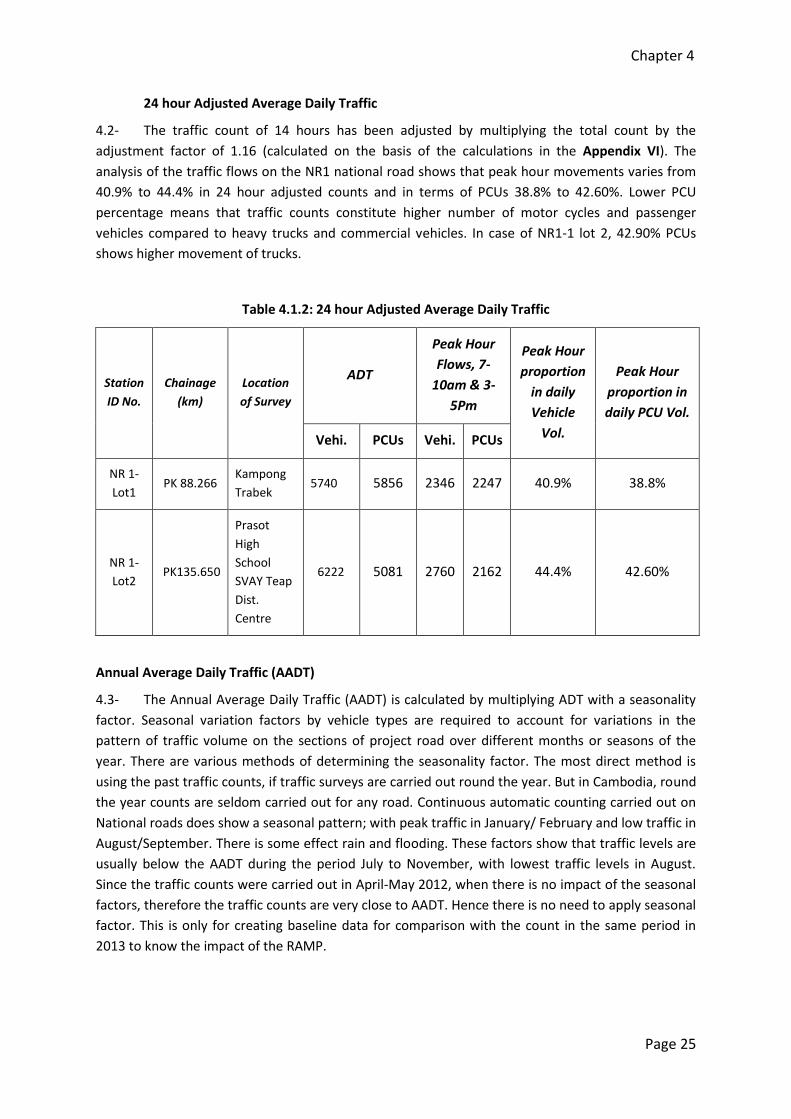
24 hour Adjusted Average Daily Traffic
4.2- The traffic count of 14 hours has been adjusted by multiplying the total count by the
adjustment factor of 1.16 (calculated on the basis of the calculations in the Appendix VI). The
analysis of the traffic flows on the NR1 national road shows that peak hour movements varies from
40.9% to 44.4% in 24 hour adjusted counts and in terms of PCUs 38.8% to 42.60%. Lower PCU
percentage means that traffic counts constitute higher number of motor cycles and passenger
vehicles compared to heavy trucks and commercial vehicles. In case of NR1-1 lot 2, 42.90% PCUs
shows higher movement of trucks.
Table 4.1.2: 24 hour Adjusted Average Daily Traffic
Station
ID No.
Chainage
(km)
Location
of Survey
ADT
Peak Hour
Flows, 7-
10am & 3-
5Pm
Peak Hour
proportion
in daily
Vehicle
Vol.
Peak Hour
proportion in
daily PCU Vol.
Vehi. PCUs Vehi. PCUs
NR 1-
Lot1 PK 88.266
Kampong
Trabek 5740 5856 2346 2247 40.9% 38.8%
NR 1-
Lot2 PK135.650
Prasot
High
School
SVAY Teap
Dist.
Centre
6222 5081 2760 2162 44.4% 42.60%
Annual Average Daily Traffic (AADT)
4.3- The Annual Average Daily Traffic (AADT) is calculated by multiplying ADT with a seasonality
factor. Seasonal variation factors by vehicle types are required to account for variations in the
pattern of traffic volume on the sections of project road over different months or seasons of the
year. There are various methods of determining the seasonality factor. The most direct method is
using the past traffic counts, if traffic surveys are carried out round the year. But in Cambodia, round
the year counts are seldom carried out for any road. Continuous automatic counting carried out on
National roads does show a seasonal pattern; with peak traffic in January/ February and low traffic in
August/September. There is some effect rain and flooding. These factors show that traffic levels are
usually below the AADT during the period July to November, with lowest traffic levels in August.
Since the traffic counts were carried out in April-May 2012, when there is no impact of the seasonal
factors, therefore the traffic counts are very close to AADT. Hence there is no need to apply seasonal
factor. This is only for creating baseline data for comparison with the count in the same period in
2013 to know the impact of the RAMP.

Chapter 4
Page 26
Table 4.1.3: 24 hour Adjusted Annual Average Daily Traffic
Station
ID No.
Chainage
(km)
Location of
Survey
ADT
Peak Hour
Flows, 7- 10am
& 3-5Pm
Peak Hour
proportion
in daily
Vehicle
Vol.
Peak Hour
proportion
in daily
PCU Vol. Vehi. PCUs Vehi. PCUs
NR 1-
Lot1 PK 88.266
Kampong
Trabek 5740 5856 2346 2247 40.9% 38.8%
NR 1-
Lot2 PK135.650
Prasot High
School SVAY
Teap Dist.
Centre
6222 5081 2760 2162 44.4% 42.60%
Composition of Traffic
4.4- In 24 hours adjusted traffic counts, the composition of traffic, for various modes, was worked
out from the traffic volume count data. Along the project stretch the share of passenger traffic
varies from 71.1% to 79.4%, whereas goods traffic varies from 20.6% to 28.9%. Share of 2/3 axle
truck is varying from 4.7% to 10.5% of total traffic. Along the project stretch it can be observed that
share of two wheelers alone varies from 28.4% to 44.7%. The share of car and jeep/van varies from
14.8% to 16.1% of total traffic along the project stretch.
Table 4.1.4: 14 Hour Percentage Composition of Traffic (PCUs)
Stat
ion
No
.
Ch
ain
age
(km
)
Loca
tio
n o
f Su
rve
y
Mo
tor
Cyc
le
Thre
e W
he
ele
r/Tu
kTu
k
Car
Min
i Bu
s
Bu
s
LGV
(Ko
un
/ Es
tan
) sm
all
LGV
(Ko
un
/ Es
tan
) la
rge
Truck
Tota
l
Jee
p/4
wd
Pic
kup
2 A
xle
lig
ht
3 A
xle
Me
diu
m
3ax
le h
eav
y
Mu
lti a
xle
4 r
igid
Mu
lti-
axle
tra
ilers
5
Mu
lti-
axle
tra
iler
he
avy
6
MC
C-1
NR 1-
Lot1 Pk
88.206
Kampong
Trabek
1436 79 434 252 127 810.5 449 77 62 88.5 326 117 436 348
6.5 5048
28.4% 1.6% 8.6
%
5.0
%
2.5
% 16.1% 8.9%
1.5
%
1.2
%
1.8
%
6.5
%
2.3
%
8.6
% 6.9%
0.1%
MC
C-2
NR 1-
Lot2
PK135.65
0
Prasot High
School SVAY
Teap Dist.
Centre
1959 160 363 185 101 232.5 477 134 45 60 105 42 171 342 4.5 4381
44.7% 3.7% 8.3
%
4.2
%
2.3
% 5.3% 10.9%
3.0
%
1.0
%
1.4
%
2.4
%
1.0
%
3.9
%
7.8
%
0.1
%

Chapter 4
Page 27
Table 4.1.5:24 Hour Adjusted Composition of Traffic
Stat
ion
No
.
Ch
ain
age
(km
)
Loca
tio
n o
f Su
rve
y
Mo
tor
Cyc
le
Thre
e W
he
ele
r/Tu
kTu
k
Car
Min
i Bu
s
Bu
s
LGV
(Ko
un
/ Es
tan
) sm
all
LGV
(Ko
un
/ Es
tan
) la
rge
Truck
Tota
l
Jee
p/4
wd
Pic
kup
2 A
xle
lig
ht
3 A
xle
Me
diu
m
3ax
le h
eav
y
Mu
lti a
xle
4 r
igid
Mu
lti-
axle
tra
ilers
5
Mu
lti-
axle
tra
iler
he
avy
6
MC
C-1
NR 1-
Lot1 Pk
88.206
Kampong
Trabek
1,666 92 503 292
. 147 940.2 521 89.3 71 103 378 136 506
404
7.5 5,856
28.4% 1.6
%
8.6
%
5.0
%
2.5
% 16.1%
8.9
% 1.5%
1.2
%
1.8
% 6.5%
2.3
%
8.6
% 6.9%
0.1%
100.0
%
MC
C-2
NR 1-
Lot2
PK135.65
0
Prasot High
School SVAY
Teap Dist.
Centre
2,272 186 421 215 117 270 553 155 52 70 122 49 198 397 5 5,081
44.7% 3.7
%
8.3
%
4.2
%
2.3
% 5.3%
10.
9% 3.0%
1.0
%
1.4
% 2.4%
1.0
%
3.9
%
7.8
%
0.1
%
100.0
%
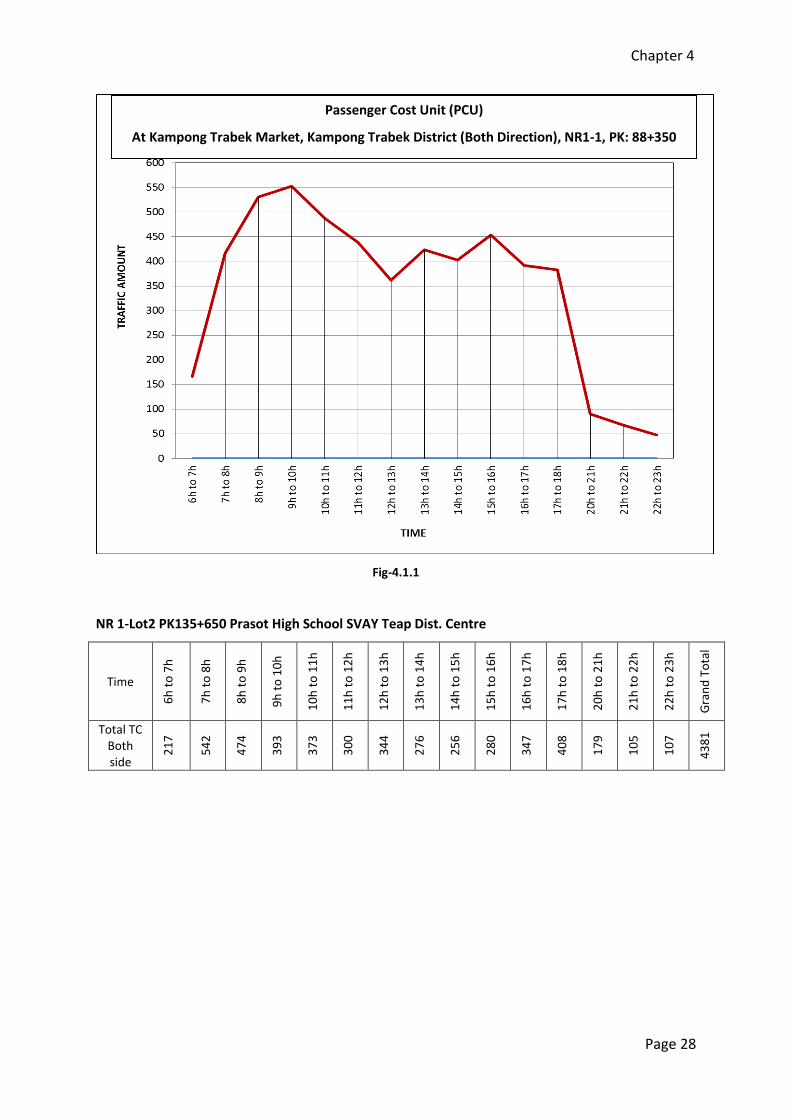
Hourly Variation of Traffic
4.5- Traffic volume count was conducted in both directions simultaneously, for 14 hours and
converted to PCUs. The hourly count was compiled by adding traffic counts of both sides to get the
hourly variation of traffic for each survey location. The summary of hourly movements on 2 locations
of NR1 National Roads is given in the Table 4.1.6. The graph showing hourly variation for each
location is given in Fig 4.1.1 and Fig 4.1.2). Peak hour traffic for all the locations from 7am to 10 am
and 3pm to 5pm is found to be 45% of the actual 15 hour PCU counts of ADT, and in 24 hour
adjusted PCUs. The trend of variation is quite normal for intercity roads because of high percentage
of regional traffic movement of freight traffic on the road. This results in traffic flows to be uniformly
distributed over the main 16-20 hours of the day.
TABLE 4.1.6: SUMMARY OF HOURLY COUNTS (PCUs)
NR1 Lot 1- PK 88+266- Kampong Trabaek
Time
6h
to
7h
7h
to
8h
8h
to
9h
9h
to
10
h
10
h t
o 1
1h
11
h t
o 1
2h
12
h t
o 1
3h
13
h t
o 1
4h
14
h t
o 1
5h
15
h t
o 1
6h
16
h t
o 1
7h
17
h t
o 1
8h
20
h t
o 2
1h
21
h t
o 2
2h
22
h t
o 2
3h
Gra
nd
To
tal
Total TC Both side
16
7
41
7
53
1
55
3
48
8
43
9
36
2
42
4
40
3
45
4
39
2
38
3
90
68
48
52
15
Chapter 4
Page 28
Fig-4.1.1
NR 1-Lot2 PK135+650 Prasot High School SVAY Teap Dist. Centre
Time
6h
to
7h
7h
to
8h
8h
to
9h
9h
to
10
h
10
h t
o 1
1h
11
h t
o 1
2h
12
h t
o 1
3h
13
h t
o 1
4h
14
h t
o 1
5h
15
h t
o 1
6h
16
h t
o 1
7h
17
h t
o 1
8h
20
h t
o 2
1h
21
h t
o 2
2h
22
h t
o 2
3h
Gra
nd
To
tal
Total TC Both side
21
7
54
2
47
4
39
3
37
3
30
0
34
4
27
6
25
6
28
0
34
7
40
8
17
9
10
5
10
7
43
81
Passenger Cost Unit (PCU)
At Kampong Trabek Market, Kampong Trabek District (Both Direction), NR1-1, PK: 88+350

Chapter 4
Page 29
Fig 4.1.2
Overall Result of the Community Survey
4.6- The community survey questionnaire was designed to obtain information on the benefits of
the rehabilitated national roads was structured in to 10 questions. Question 1 &2 basically cover the
details of the respondents whereas questions 3 to10 are directly related to the qualitative benefits
enjoyed by the road users and road neighbours. These questions provide multiple choices. The
responses the community from the 40 samples, 10 each in 4 categories are summarised in the table
below:
Table 4.1.7: SUMMARY OF COMMUNITY DATA SURVEY NR 1
No. Question
Road No. NR.1-1 NR.1-2
Location Kampong
Trabek Svay Teap
3 In the family
Member in family M 57 61
F 69 74
No. of Children M 34 30
F 50 35
4 Vehicle ownership
Motorbike 32 35
Car 1 1
Scooter 1 0
Lorry / Etan 0 0
Passenger Cost Unit (PCU)
At Svay Teap District (Both direction), NR.1-2, PK: 136+570

Chapter 4
Page 30
Others, (bicycle) 13 15
Km/mon. 4650 3900
5 Use of Public/Private
Transport
Bus 38 1
Car 2 30
Others ( Motor taxi, 0 0
6 Main Occupation
of family
Agriculture 8 6
Service 21 22
Business 11 12
7 Family income (Monthly) USD/Riels
Minimum $
50
$
50
Maximum $
1,625
$
2,250
Average $
319
$
443
8 Benefit of the road project
Quality Travel (comfort level)
Excellent 3 0
very Good 33 35
Good 4 5
Poor 0 0
Saving in transportation cost compared to 2008
Lower 30 (75%) 37 (93%)
Somewhat lower 10 (25%) 3 (8%)
No Change 0 (0%) 0 (0%)
Over 0 (0%) 0 (0%)
Excess to public transport compared to
2008
Better 40 40
Somewhat better 0 0
No Change 0 0
9 Travel of
school children by
Distance (km)
Minimum 0.02 0.2
Maximum 2 20
Mean 0.7 1.3
By Walk Percentage 11.50% 27.60%
By Personal vehicle
including bicycle Yes 88.50% 62.10%
By Bus Yes 0.00% 3.40%
By Others Yes 0.00% 6.90%
10
How road project
benefited your family business?
Availability of goods in the market
Better 39 39
Somewhat better 1 1
Easy to carry goods for sale in the market
Better 39 40
Somewhat better 1 0
Easy excess to market Better 39 40
Somewhat better 1 0

Chapter 4
Page 31
Response to Vehicle ownership and Km Travel
4.6.1- Each of the target groups interviewed show that on an average every family had one
motorised vehicle (motor cycle or car, scooter, lorry or etan) and large number of them had bicycles
as an alternate. 40 samples interviewed show extensive total travel of 3900 Kms to 4650 kms on NR1
per month. The average travel at the individual family level is of the order of 214 kms.
Use of Public and Private Transport
4.6.2- In the sample of 80 on NR1, it has been observed that majority of the families on NR1 Lot1
are using public/private transport whereas on NR-1-2, most families travel by car. A very few use
other means of travel such as motorcycle, taxi etc.
Main occupation of Road Neighbours
4.6.3- It has been observed that nearly 17.5% of the population in the road neighbouring areas at
the study locations on NR1 were in agriculture, about 28,75% in business and balance 51.25% in
service (as an employee or running service centres, repairs of vehicles., petrol pumps etc.).
Family Income
4.6.4- Most of the respondents reported increase income in their income levels compared to level
in 2008-9. The average monthly income of neighbouring families is reported to be in the range
US$319 to US$443 at different locations of the national road. However, it varies from a minimum of
US$50 to a maximum of US$2,250 per month.
Benefit of the Road Rehabilitation Project
Quality of Travel
4.6.5.1- 3.75% of the people rated quality of travel as excellent, 85%have rated quality of travel as
very good, 27.5% have rated good, and only 1.25% have rated poor. Poor rating by some
respondents are obvious as the rehabilitation work is still in progress in some sections of the on-
going projects.
Saving in Transportation Cost
4.6.5.2- Compared to the travel costs in 2008-9, 83.7% of the respondents have reported lower
travel costs, 16.25% have reported somewhat lower travel costs and 0% has reported no change in
travel cost. Keeping in view increase in cost of petroleum products no change is also a good
indicator.
Excess to Public Transport
4.6.5.3- Most roads surveyed, 100% respondents have reported good availability of public transport
Chapter 4
Page 32
Travel of School Children
Distance Travelled
4.6.6.1- On the overall, children living in the neighbourhood of the national roads travel from
minimum of 0.02 km to a maximum of 20 Kms for going to their schools. This gives an average
distance of about 1.3 km, the school children travel.
Children Walking to School
4.6.6.2- Out of the total school going children living in the neighbourhood of various nation roads
about 11.5% to 227.6 % travels to their schools by walk.
Children Using Personal Vehicles
4.6.6.3- Out of the total school going children living in the neighbourhood of various nation roads
about 62.10 to 88.5 travels to their schools by their personal vehicles.
Children going to School by Bus
4.6.6.4- Out of the total school going children living in the neighbourhood of various nation roads
about 0 to 3.4% travels to their schools by bus.
Travel by other means
4.6.6.5- Out of the total school going children living in the neighbourhood of various nation roads
about 0 to 6.9% travel to their schools by other means.
How Road Project Benefited Family Business
Availability Good in the Market
4.6.7.1- Majority of the respondents (97.5%) reported better availability of goods and services.
Easy to carry Goods to the Market
4.6.7.2- Most respondents (98.75%) have reported better availability of transport means to carry
goods to the market because of good roads.
Easy Excess to Market
4.6.7.3- Majority of the respondents (98.75%) have reported better excess to market.
Average Trip KM Travel
4.7.1- The average trip length has been divided into 5 segments from 0-20 km, 21 -50 km, 51-100
km, 101-200 km, 201 km and above for study of the trip km of all categories of vehicles. Two
separate tables have generated for passenger and commercial vehicles. These Tables are
summarized below.The trip pattern for passenger and commercial vehicles are given in Table 4.1.8
and Table 4.1.9 along with their graphical presentation.

Chapter 4
Page 33
4.7.1.1- Among the passenger vehicle samples, nearly 36.4% fall in the long range travel of 101-200
Km and above, 26.1% had average trip length of 51-100 Km, 8.42% had average trip length in the
range of 0-20 Km and 5.65% had average range of 201 Km and above.
Table 4.1.8 Distribution of Average Trip KM Travel of Passenger Vehicles
Vehicle Code
Vehicle Type 0-20 Km 21-50 Km 51-100 Km 101-200 Km
201-and Above Km
3 Motor Cycle 5 4 4 2
4 3 wheeler(TukTuk) 2 12 1 2
5 Car 1 2 4 3 4
6 Jeep/4WD 2
7 Pickup 1 1 3 1
8 Minibus 6 16 28 2
9 Bus 1
4.7.1.2- Among the commercial vehicle samples, nearly 80% fall in the range travel of 21-50 km, 10%
had average trip length of 51-100 Km, 10% had average trip length in the range of 201 Km, and
above.
0
5
10
15
20
25
30
0-20 Km 21-50Km 51-100Km 101-200Km 201-andAboveKm
No
. of
Sam
ple
of
Ve
hic
le
Kilometer Range
Trip Lenght Passenger Vehicle
Motor Cycle
3 wheeler(TukTuk)
Car
Jeep/4WD
Pickup
Minibus
Bus

Chapter 4
Page 34
Table4.1.9: Distribution of Average Trip KM Travel of Commercial Vehicles
Vehicle Code
Vehicle Type 0-20 Km 21-50 Km 51-100 Km 101-200 Km
201-and Above Km
10 Koyan small
11 Koyan large
12 Light Truck 3 1
13 Medium Truck 5 1
14 HT Rigid 3Axle
15 HT Rigid 4/5 Axle
16 HT Semi T 4/5 Axle
17 HT Semi T 6Axle
Vehicle-wise Commodity Distribution
4.7.1.3- Among the Light Goods Vehicles (LGVs), maximum number of LGVs (60%) was found to be
carrying industrial products, 20% LGVs carried raw materials and 20% carried fertilizers. No sample
was available for high tonnage vehicles (HTVs). The Table 4.1.10 summarises the movement of the
goods on NR7-1.
0
1
2
3
4
5
6
0-20 Km 21-50Km 51-100Km 101-200Km 201-andAboveKm
No
. of
Sam
ple
of
Ve
hic
le
Kilometer Range
Trip Lenght Passenger Vehicle
Koyan small
Koyan large
Light Truck
Medium Truck
HT Rigid 3Axle
HT Rigid 4/5 Axle
HT Semi T 4/5 Axle
HT Semi T 6Axle

Chapter 4
Page 35
Table 4.1.10: Classification of Vehicle-wise Commodities in percentages
Code Type of freight Description Small/Medium Commercial Vehicles (codes 10-13)
Large/heavy commercial vehicles (codes 14-17)
1 Agriculture/Food Rice/vegetables /fruits etc.
2 Timber Raw wood/ processed wood/ furniture
3. Building materials Bricks, sand cement /iron roads
4. Raw materials Ore/minerals 1
5. Industrial products Engines/ machines/steel bars etc.
3
6. Fuel/ Chemicals Petrol/diesel/ mobile oil/acids etc.
7. Fertilizers Fertilisers natural /man made 1
0 others Cloths/home articles
Trip Purpose of Passenger Vehicles
4.7.1.4- The passenger movement on NR2714 shows that 60.9% of the passenger vehicles
movement was for work and business, 34.4% movements was for social and private calls, 3.6%
movement was for daily chores, and 1% movement was for tourism. These movements of various
categories of vehicles is summarised in the Table 4.1.11.
Table4.1.11: Trip Purpose of Passenger Vehicles in Number of Vehicles Count
Vehicle type
Work/business (code1)
To/from work(code2)
Social/Private (code3)
School (code 4)
Recreation/ Holiday/Tourism (code5)
Others (code6)
MC+trailer 32 3 12
Car 15 1 11
Jeep/4WD 2
Pickup 6 5 1
Minibus 61 3 38 1
Bus 1

Chapter 4
Page 36
Provincial Movements
4.7.1.5- In order to assess the movement pattern on the project influence area the province and
adjoining province were studied keeping in view the major generation and attraction points in the
area. Following O-D movements on the national roads NR7-1 are given in the Table 4.1.12. It may be
seen that 39.1% of the samples had origin and destination with in the province whereas 60.9% had
OD outside the province by majority of them originate from Phnom Penh, Prey Veng, Svay Reang,
Kampong Cham, Kampong Speau with destinations such as Kampong Cham, Phnom Penh, Svay
Reang, Prey Veng, Kratie, Kom Pot, etc.
Table 4.1.12: Inter- Provincial Movement of Traffic
NR NR7-1 Location: Kampong Trabek
Movement within the same province Movement to other provinces
Origin Destination Origin Destination
KampongTrabek Kor Anderk Prey Veng Kratie
Krang Svay KampongTrabek Prey Veng Svay Rieng
Nak loeung KampongTrabek Battam Bong Prey Veng
Nak loeung Kor Anderk Kampong Cham Svay Rieng
Pou Laos KampongTrabek KampongSpeu Svay Rieng
Prey Veng city KompongTrabek Phnom Penh Kratie
Kampong Trabek Nak Loeung Phnom Penh Prey Veng
Kor Anderk Kampong Trabek Phnom Penh Svay Rieng
Kor Anderk Nak Loeung Prey Veng Kam Pot
Prey Veng Kampong Cham
Prey Veng Kampong Speu
Prey Veng Phnom Penh
Svay Rieng Phnom Penh
Svay Rieng Prey Veng
Occupancy Survey
4.7.1.6- Passenger Occupancy survey was done for 14 hour duration (from 7:00 am to 6:00 pm and
8pm to 11pm) at Kampong Trabek. The Table 4.1.13 gives the mode-wise average occupancy at
survey location. The passenger vehicles in the sample show lower level of occupancies and thus low
utilization of capacity.
Table 4.1.13: Average Occupancy of Passenger Carrying Vehicles
Survey Locations Bus Mini
Bus
3
wheeler
2
wheeler/trailer
car Jeep/4WD Pick-up
Kampong Trabek 5.57 8.3 2.16 5 1.5 4

Chapter 4
Page 37
NR 1-Lot2
Average Trip KM Travel
4.8.1- The average trip length has been divided into 5 segments from 0-20 km, 21 -50 km, 51-100
km, 101-200 km, 201 km and above for study of the trip km of all categories of vehicles. Two
separate tables have generated for passenger and commercial vehicles. These Tables are
summarized below.The trip pattern for passenger and commercial vehicles are given in Table 4.1.14
and Table 4.1.15 along with their graphical presentation.
4.8.1.1 Among the passenger vehicle samples, nearly 50% fall in the long range travel of 201 km and
above, 30% had average trip length of 101-200 Km, 17% had average trip length in the range of 51-
100 Km and about 3% had trip length of 21-50 Km.
Table 4.1.14: Distribution of Average Trip KM Travel of Passenger Vehicles
Vehicle Code
Vehicle Type 0-20 Km 21-50 Km 51-100 Km 101-200 Km
201-and Above Km
3 Motor Cycle 5 10 1
4 3 wheeler(TukTuk) 5 5
5 Car 3 5 1 17
6 Jeep/4WD 1 1
7 Pickup 1 1
8 Minibus 3 5 31
9 Bus 3 2
0
5
10
15
20
25
30
35
0-20 Km 21-50Km 51-100Km 101-200Km 201-andAboveKm
No
. of
Sam
ple
of
Ve
hic
le
Kilometer Range
Trip Lenght Passenger Vehicle
Motor Cycle
3 wheeler(TukTuk)
Car
Jeep/4WD
Pickup
Minibus
Bus

Chapter 4
Page 38
4.8.1.2- Among the commercial vehicle samples, nearly 50% fall in the long range travel of 201 Km
and above, 20% had average trip length of 51-100 Km, 15% had average trip length in the range of
101-200 Km, and another about 15% had trip length of 21-50 Km.
Table4.1.15 Distribution of Average Trip KM Travel of Commercial Vehicles
Vehicle Code
Vehicle Type 0-20 Km 21-50 Km 51-100 Km 101-200 Km
201-and Above Km
10 Koyan small 2 1
11 Koyan large
12 Light Truck 5 7 1
13 Medium Truck 3 2 1
14 HT Rigid 3Axle
15 HT Rigid 4/5 Axle 1
16 HT Semi T 4/5 Axle 3
17 HT Semi T 6Axle
Vehicle-wise Commodity Distribution
4.8.1.3- Among the Light Goods Vehicles (LGVs), maximum number of LGVs (62.5%) was found to be
carrying grocery and perishables, 25% LGVs carried building materials, and 12.5% LGVs carried cloths
and home articles. Among the high tonnage vehicles (HTVs), 25% each carried industrial products,
agricultural and food products, building materials and cloths and domestic goods. The Table 4.1.16
summarises the movement of the goods on NR7-2.
0
1
2
3
4
5
6
7
8
0-20 Km 21-50Km 51-100Km 101-200Km 201-andAboveKm
No
. of
Sam
ple
of
Ve
hic
le
Kilometer Range
Trip Lenght Passenger Vehicle
Koyan small
Koyan large
Light Truck
Medium Truck
HT Rigid 3Axle
HT Rigid 4/5 Axle
HT Semi T 4/5 Axle
HT Semi T 6Axle

Chapter 4
Page 39
Table4.1.16: Classification of Vehicle-wise Commodities in percentages
Code Type of freight Description Small/Medium Commercial Vehicles (codes 10-13)
Large/heavy commercial vehicles (codes 14-17)
1 Agriculture/Food Rice/vegetables /fruits etc.
1
2 Timber Raw wood/ processed wood/ furniture
3. Building materials Bricks/sand cement /iron rods
4. Raw materials Ore/minerals
5. Industrial products Engines/ machines/steel bars etc.
11 3
6. Fuel/ Chemicals Petrol/ Diesel, mobile oil/acids etc.
7. Fertilizers Fertilisers natural /man made
0 others Cloths/home articles
Trip Purpose of Passenger Vehicles
4.8.1.4- The passenger movement on NR2714 shows that 48.6% of the passenger vehicles
movement was for work and business, 33% movements was for social and private calls, 17.7%
movement was for daily chores, and 0.6% movement was for tourism. These movements of various
categories of vehicles is summarised in the Table 4.1.16.
Table4.1.17: Trip Purpose of Passenger Vehicles in Number of Vehicles Count
Vehicle type
Work/business
(code1)
To/from work
((code2)
Social/Private
(code3)
School
(code 4)
Recreation Holiday Tourism (code5)
Others
(code6)
MC+trailer 15 3 1 1
Car 27 4 5
Jeep/4WD 1 1
Pickup 1 3
Minibus 45 5 30 1 3
Bus 4 2 4

Chapter 4
Page 40
Provincial Movements
4.8.1.5- In order to assess the movement pattern on the project influence area the province and
adjoining province were studied keeping in view the major generation and attraction points in the
area. Following O-D movements on the national roads NR73 are given in the Table 4.1.18 It may be
seen that 70.2% of the samples had origin and destination with in the province whereas 29.8% had
OD outside the province by majority of them originate from Svay Rieng, Phnom Penh, Prey Veang,
and with destinations such as Svay Rieng, Phnom Penh, Siem Reap, etc.
Table4.1.18: Inter- Provincial Movement of Traffic
NR 1-2 Location –Prosot, Svay Teap District
Movement within the same province Movement to other provinces
Origin Destination Origin Destination
Kilo leak 8 Saray Kampongcham Svay Rieng
Prosouth Prey Thlouk Kandal Svay Rieng
Prosouth Saray Phnom Penh Svay Rieng
Song Kor Pupel Phnom Penh Ho Chi Ming
Svay Chrum Chan Trea Prey Veng Svay Rieng
Svay Rieng city Baveth Svay Rieng Kompong Cham
Svay Rieng city CheyPov Svay Rieng Kondal
Svay Rieng city KundeangReay Svay Rieng Phnom Penh
Svay Rieng city Prey Phneath Svay Rieng Siem Reap
Svay Rieng city Prosouth Svay Rieng Svay Rieng
Svay Rieng city PumPou Svay Rieng Phnom Penh
Svay Rieng city Roul
Ba Neay Chub
Baveth Prosouth
Baveth Svay Rieng
Chan Trea Krorl Kou
Chan Trea Svay Chrum
Chan Trea Svay Rieng
Chi Pov Kampong Cham
Chi Pov Prosouth
Chi Pov Svay Rieng
Pong Rou Prosouth
Prosouth Svay Rieng
Svay Teap Svay Rieng
Svay Rieng Baveth

Chapter 4
Page 41
Occupancy Survey
4.8.1.6 Passenger Occupancy survey was done for 14 hour duration (from 7:00 am to 6:00 pm and
8pm to 11pm) at Prosot. The Table 4.1.19 gives the mode-wise average occupancy at survey
location. The passenger vehicles in the sample show medium level of occupancies and thus about
60% utilization of capacity.
Table 4.1.19: Average Occupancy of Passenger Carrying Vehicles
Survey Locations Bus Mini
Bus
3
wheeler
2
wheeler/trailer
car Jeep/4WD Pick-up
Prosot 25.5 8.48 0 2.5 3.7 2.5 2.5

Chapter 5
Page 42
Chapter 5-Baseline Survey Report of NR5
Road and Location-wise Traffic Counts and Composition of Traffic
NR5 Lot 1- KM 52+200 and NR 5- Lot 2 PK 124
Average Daily Traffic (ADT)
5.1- The average daily traffic was computed for two locations where the mid-block volume count
survey was done. Traffic volumes of both sides added to find the Average Daily Traffic (ADT).
Further, the ADT was also converted to PCUs using the conversion factors given in Table 2.1.1.
Location wise and mode wise ADT values are given in Table 5.1.1 below. Also the peak hour and
peak hour proportion of total daily traffic (over average 14-hour volume count) was identified and is
given in Table 5.1.1.
5.1.1- Traffic volume count data at each location was counted on hourly basis on both sides of the
road to determine Average Daily Traffic (ADT). Traffic volume count data and summary sheets for
various locations are presented in Appendix III (b). The location wise ADT in vehicles and PCUs are
presented in the Table 5.1.3 below.
Table 5.1.1: 14 hour Traffic Count
Station
ID No.
Chainage
(km) Location of Survey
ADT Peak Hour Flows,
7- 10am & 4-6Pm
Peak Hour
proportion in
daily Vehicle
Vol.
Peak Hour
proportion
in daily PCU
Vol. Vehi. PCUs Vehi. PCUs
NR 5-
Lot1
KM
52+200
Near Kampong
Tralach Market 10153 9802 5302 4477 52.22% 45.67%
NR 5-
Lot 2 PK 124
Punlai, Kampong
Chhnang 5296 6001 3396 3124 64.12% 52.05%
24 hour Adjusted Average Daily Traffic
5.2- The traffic count of 14 hours has been adjusted by multiplying the total count by the
adjustment factor of 1.16 (calculated on the basis of the calculations in the Appendix VI. The lower
percentage of peak hour PCUs on NR5-1 shows high proportion of passenger vehicles compared to
commercial vehicles. This is also true in case of NR5-2.
Table 5.1.2: 24 hour Adjusted Average Daily Traffic
Station
ID No.
Chainage
(km) Location of Survey
ADT Peak Hour Flows,
7- 10am & 3-5Pm
Peak Hour
proportion in
daily Vehicle
Vol.
Peak Hour
proportion
in daily
PCU Vol. Vehi. PCUs Vehi. PCUs
NR 5-
Lot1 KM 52+200
Near Kampong
Tralach Market 11892 11254 5302 4477 44.58% 39.78%
NR 5-
Lot 2 PK 124
Punlai, Kampong
Chhnang 6725 6844 3396 3124 50.49% 49.62%

Chapter 5
Page 43
Peak Hour Traffic in 14 hour count
5.3- The analysis of the traffic flows on the NR5 national road shows that peak hour movements
varies from 44.5% to 50.49% in actual 14 hour counts and in terms of PCUs 39.78% to 49.62%. Lower
PCU percentage means that traffic counts constitute higher no of motor cycles and passenger
vehicles compared to heavy trucks and commercial vehicles. In case of NR5-1 lot 2, 49.62% PCUs
shows higher movement of trucks.
Annual Average Daily Traffic (AADT)
5.4- The Annual Average Daily Traffic (AADT) is calculated by multiplying ADT with a seasonality
factor. Seasonal variation factors by vehicle types are required to account for variations in the
pattern of traffic volume on the sections of project road over different months or seasons of the
year. There are various methods of determining the seasonality factor. The most direct method is
using the past traffic counts, if traffic surveys are carried out round the year. But in Cambodia, round
the year counts are seldom carried out for any road. Continuous automatic counting carried out on
National roads does show a seasonal pattern; with peak traffic in January/ February and low traffic in
August/September. There is some effect rain and flooding. These factors show that traffic levels are
usually below the AADT during the period July to November, with lowest traffic levels in August.
Since the traffic counts were carried out in April-May 2012, when there is no impact of the seasonal
factors, therefore the traffic counts are very close to AADT. Hence there is no need to apply seasonal
factor. This is only for creating baseline data for comparison with the count in the same period in
2013 to know the impact of the RAMP.
Table 5.1.3: 24 hour Adjusted Average Daily Traffic
Station
ID No.
Chainage
(km) Location of Survey
ADT Peak Hour Flows,
7- 10am & 3-5Pm
Peak Hour
proportion in
daily Vehicle
Vol.
Peak Hour
proportion
in daily
PCU Vol. Vehi. PCUs Vehi. PCUs
NR 5-
Lot1 KM 52+200
Near Kampong
Tralach Market 11892 11254 5302 4477 44.58% 39.78%
NR 5-
Lot 2 PK 124
Punlai, Kampong
Chhnang 6725 6844 3396 3124 50.49% 49.62%
Composition of Traffic
5.5- The composition of traffic in 24 hour adjusted counts, for various modes, was worked out
from the traffic volume count data. Along the project stretch the share of passenger traffic varies
from 69.5% to 73.1%, whereas goods traffic varies from 26.9% to 30.5%. Share of 2/3 axle truck is
varying from 14.6% to 15.8% of total traffic. Along the project stretch it can be observed that share
of two wheelers alone varies from 27.7% to 29.4%. The share of car and jeep/van varies from 21.6%
to 23.6% of total traffic along the project stretch.

Chapter 5
Page 44
Table 5.1.4: 14 Hour Percentage Composition of Traffic (PCUs) St
atio
n N
o.
Ch
ain
age
(km
)
Loca
tio
n o
f Su
rve
y
Mo
tor
Cyc
le
Thre
e W
he
ele
r/Tu
kTu
k
Car
Min
i Bu
s
Bu
s
LGV
(Ko
un
/ Es
tan
) sm
all
LGV
(Ko
un
/ Es
tan
) la
rge
Truck
Tota
l
Jee
p/4
wd
Pic
kup
2 A
xle
lig
ht
3 A
xle
Me
diu
m
3ax
le h
eav
y
Mu
lti a
xle
4 r
igid
Mu
lti-
axle
tra
ilers
5
Mu
lti-
axle
tra
iler
he
avy
6
MC
C-3
NR 5-
Lot1
PK52+20
0
Near
Kampong
Tralach
Market
5785
(56.97
%)
327
3.22%
1339
13.19
%
471
4.6
4%
507
5.19
%
602
5.93%
249
2.4
5%
36
0.3
5%
132
1.3
0%
224
2.21
%
288
2.8
3%
80
0.7
9%
52
0.5
1%
109
1.07
%
52
0.5
1%
10153
MC
C-4
NR5 – Lot
2
PK
13+.500
Punlai,
Kampong
Chhnang
1701
28.34
%
83
1.83%
608
10.13
%
281
4.6
8%
397
6.62
%
441
7.35%
581
9.6
8%
62
1.0
3%
78
1.3
0%
101
1.68
%
645
10.
75%
195
3.2
5%
198
3.3
0%
526
8.76
%
45
0.7
5%
6001
Table 5.1.5:24 Hour Adjusted Composition of Traffic
Stat
ion
No
.
Ch
ain
age
(km
)
Loca
tio
n o
f Su
rve
y
Mo
tor
Cyc
le
Thre
e W
he
ele
r/Tu
kTu
k
Car
Min
i Bu
s
Bu
s
LGV
(Ko
un
/ Es
tan
) sm
all
LGV
(Ko
un
/ Es
tan
) la
rge
Truck
Tota
l
Jee
p/4
wd
Pic
kup
2 A
xle
lig
ht
3 A
xle
Me
diu
m
3ax
le h
eav
y
Mu
lti a
xle
4 r
igid
Mu
lti-
axle
tra
ilers
5
Mu
lti-
axle
tra
iler
he
avy
6
MC
C-3
NR 5-
Lot1KM
52+200
Near
Kampong
Tralach
Market
6711
56.43
%
379
3.1
9%
1553
13.06
%
546
4.59
%
588
4.9
4%
698
5.87%
289
2.4
3%
42
0.3
5%
153
1.29
%
260
2.1
8%
334
2.81%
93
0.7
8%
60
0.5
0%
126
1.06
%
60
0.5
0%
11892
MC
C-4
NR5 –
Lot2PK
131.500
Punlai,
Kampong
Chhnang
1973 96 705 326 461 512 674 71 90 117 748 226 230 610 5 6844
28.8
3%
1.4
0%
10.3
0%
4.7
6%
6.7
4%
7.48
%
9.8
5%
1.0
4%
1.3
2%
1.7
1%
10.9
3%
3.3
0%
3.3
6%
8.9
1%
0.0
7%
Hourly Variation of Traffic
5.6- Traffic volume count was conducted in both directions simultaneously, for 14 hours and
converted to PCUs. The hourly count was compiled by adding traffic counts of both sides to get the
hourly variation of traffic for each survey location. The summary of hourly movements on 2 locations
of NR5 National Roads is given in the Table 5.1.6. The graph showing hourly variation for each
location is given in Fig 4.1.1 and Fig 4.1.2. Peak hour traffic for all the locations from 7am to 10 am
and 3pm to 5pm is found to be 45% of the actual 15 hour PCU counts of ADT, and in 24 hour
adjusted PCUs. The trend of variation is quite normal for intercity roads because of high percentage
of regional traffic movement of freight traffic on the road. This results in traffic flows to be uniformly
distributed over the main 16-20 hours of the day.

Chapter 5
Page 45
TABLE 5.1.6: SUMMARY OF HOURLY COUNTS (PCUs)
NR5 Lot 1- KM 52+200
Time
6h
to
7h
7h
to
8h
8h
to
9h
9h
to
10
h
10
h t
o 1
1h
11
h t
o 1
2h
12
h t
o 1
3h
13
h t
o 1
4h
14
h t
o 1
5h
15
h t
o 1
6h
16
h t
o 1
7h
17
h t
o 1
8h
20
h t
o 2
1h
21
h t
o 2
2h
22
h t
o 2
3h
Gra
nd
To
tal
Total TC Both side 3
91
.2
97
8
11
37
90
9.5
91
3
78
9
75
4.5
70
3.5
75
5.5
72
6.5
73
4.5
71
7.5
19
4
87
63
94
63
Fig 5.1.1
Passenger Cost Unit (PCU)
At Kampong Tralach Market, Kampong Tralach District (Both direction), NR.5-1, PK: 52+000

Chapter 5
Page 46
NR 5- Lot 2 PK 124
Time 6
h t
o 7
h
7h
to
8h
8h
to
9h
9h
to
10
h
10
h t
o 1
1h
11
h t
o 1
2h
12
h t
o 1
3h
13
h t
o 1
4h
14
h t
o 1
5h
15
h t
o 1
6h
16
h t
o 1
7h
17
h t
o 1
8h
20
h t
o 2
1h
21
h t
o 2
2h
22
h t
o 2
3h
Gra
nd
To
tal
Total TC Both side 2
16
.6
54
1.5
50
6
62
7.5
46
0
46
3
48
9.5
45
2
47
1
42
4.5
43
5
41
7
18
9
15
7
92
57
25
Fig 5.1.2
Overall Result of the Community Survey
5.7- The community survey questionnaire was designed to obtain information on the benefits of the
rehabilitated national roads was structured in to 10 questions. Question 1 &2 basically cover the
details of the respondents whereas questions 3 to10 are directly related to the qualitative benefits
enjoyed by the road users and road neighbours. These questions provide multiple choices. The
responses the community from the 40 samples, 10 each in 4 categories are summarised in the table
below:
Passenger Cost Unit (PCU)
At Punlai Market, Boribo District (Both direction), NR.5-2, PK: 125+100

Chapter 5
Page 47
Table 5.1.7: SUMMARY OF COMMUNITY DATA SURVEY NR5
No. Question
Road No. NR.5-1 NR.5-2
Location Kampong
Trach Punlai
3 In the family
Member in family M 88 85
F 98 99
No. of Children M 51 58
F 54 63
4 Vehicle ownership
Motorbike 23 28
Car 7 3
Scooter 0 4
Lorry / Etan 1 1
Others, (bicycle) 11 17
Km/mon. 8620 14820
5 Use of Public/Private
Transport
Bus 6 2
Car 33 38
Others ( Motor taxi,
3 0
6 Main Occupation
of family
Agriculture 9 7
Service 15 20
Business 16 13
7 Family income (Monthly) USD/Riels
Minimum $ 50 $ 50
Maximum $5,000 $ 2,250
Average $ 725 $ 408
8
Benefit of the
road project
Quality Travel (comfor level)
Excellent 12 1
very Good 19 21
Good 7 18
Poor 2 0
Saving in transportation
cost compared to 2008
Lower 18 (45%) 33 (83%)
Some what lower 17 (43%) 7 (18%)
No Change 5 (13%) 0 (0%)
Over 0 (0%) 0 (0%)
Excess to to public transport compared to
2008
Better 34 40
Some what better 2 0
No Change 4 0
9 Travel of
school children by
Distance (km)
Minimum 0.01 0.1
Maximum 17 5
Mean 1.7 0.5
By Walk Percentage 23.10% 24.00%

Chapter 5
Page 48
By Personal vehicle
including bicycle Yes 64.10% 76.00%
By Bus Yes 2.60% 0.00%
By Others Yes 10.20% 0.00%
10
How road project
benefited your family business?
Availability of goods in the market
Better 39 39
Somewhat better 1 1
Easy to carry goods for sale in the market
Better 37 39
Somewhat better 3 1
Easy excess to market Better 37 39
Somewhat better 3 1
Response to Vehicle ownership and Km Travel
5.7.1- Each of the target groups interviewed show that on an average every family had one
motorised vehicle (motor cycle or car, scooter, lorry or etan) and large number of them had bicycles
as an alternate. 40 samples interviewed show extensive total travel of 8620 Kms to 14820 kms on
NR5 per month. The average travel at the individual family level is of the order of 293 kms.
Use of Public and Private Transport
5.7.2- In the sample 0f 80 on NR5, it has been observed that majority of the families on NR1 are
using car (private transport) where as 10% of the families travel by bus. A very few 3.7% use other
means of travel such as motorcycle, taxi etc.
Main occupation of Road Neighbours
5.7.3- It has been observed that nearly 20% of the population in the road neighbouring areas at the
study locations on NR5 were in agriculture, about 36.25% in business and balance 43.75% in service
(as an employee or running service centres, repairs of vehicles, petrol pumps etc.).
Family Income
5.7.4- Most of the respondents reported increase income in their income levels compared to level
in 2008-9. The average monthly income of neighbouring families is reported to be in the range
US$408 to US$725 at different locations of the national road. However, it varies from a minimum of
US$50 to a maximum of US$5,000 per month.
Benefit of the Road Rehabilitation Project
Quality of Travel
5.7.5.1- 16.25 % of the people rated quality of travel as excellent, 50%have rated quality of travel as
very good ,31.25% have rated good, and only 2.5% have rated poor. Poor rating by some
respondents are obvious as the rehabilitation work is still in progress in some sections of the on-
going projects.

Chapter 5
Page 49
Saving in Transportation Cost
5.7.5.2- Compared to the travel costs in 2008-9, 63.75% of the respondents have reported lower
travel costs, 30% have reported somewhat lower travel costs and 6.25% have reported no change in
travel cost. Keeping in view increase in cost of petroleum products no change is also a good
indicator.
Excess to Public Transport
5.7.5.3- Most roads surveyed, 92.5% respondents have reported good availability of public transport,
5% have reported no change and about 2.5% have reported somewhat better.
Travel of School Children
Distance Travelled
5.7.5.4- On the overall, children living in the neighbourhood of the national roads travel from
minimum of 0.01 km to a maximum of 17 Kms for going to their schools. This gives an average
distance of about 1.1 km, the school children travel.
Children Walking to School
5.7.5.5- Out of the total school going children living in the neighbourhood of various nation road NR5
about 23.10% to 24.0 % travels to their schools by walk.
Children Using Personal Vehicles
5.7.5.6- Out of the total school going children living in the neighbourhood of various nation roads
about 64.10% to 76% travels to their schools by their personal vehicles.
Children going to School by Bus
5.7.5.7- Out of the total school going children living in the neighbourhood of various nation roads
about 0% to 2.6% travels to their schools by bus.
Travel by other means
5.7.5.8- Out of the total school going children living in the neighbourhood of various nation roads
about 0 to 10.2% travel to their schools by other means.
How Road Project Benefited Family Business
Availability Good in the Market
5.7.5.9- Majority of the respondents (97.5%) reported better availability of goods and services.
Easy to carry Goods to the Market
5.7.5.10- Most respondents (98.75%) have reported better availability of transport means to carry
goods to the market because of good roads.

Chapter 5
Page 50
Easy Excess to Market
5.7.5.11- Majority of the respondents (97.5%) have reported better excess to market.
Average Trip KM Travel
5.8.1- The average trip length has been divided into 5 segments from 0-20 km, 21-50 km, 51-100
km, 101-200 km, 201 km and above for study of the trip km of all categories of vehicles. Two
separate tables have generated for passenger and commercial vehicles. These Tables are
summarized below.The trip pattern for passenger and commercial vehicles are given in Table 5.1.8
and Table 5.1.9 along with their graphical presentation.
5.8.1.1- Among the passenger vehicle samples, nearly 64.2% fall in the long range travel of 51-100
Km, 13% had average trip length of 201Km and above, 8.5% had trip length of 0-20 Km, 7.3% had
average trip length in the range of 21-50 Km and 6.8% had average range of 101-200 Km and above.
Table 5.1.8: Distribution of Average Trip KM Travel of Passenger Vehicles
Vehicle Code
Vehicle Type 0-20 Km 21-50Km 51-100Km 101-200Km 201Km and Above, km
3 Motor Cycle 6 8 2 1
4 3 wheeler(TukTuk) 3 3 3 1
5 Car 4 2 68 6
6 Jeep/4WD 1 4 3
7 Pickup 1 5 4 5
8 Minibus 31 7 7
9 Bus 1
0
10
20
30
40
50
60
70
80
0-20 Km 21-50Km 51-100Km 101-200Km 201-andAboveKm
No
. of
Sam
ple
of
Ve
hic
le
Kilometer Range
Trip Lenght Passenger Vehicle
Motor Cycle
3 wheeler(TukTuk)
Car
Jeep/4WD
Pickup
Minibus
Bus

Chapter 5
Page 51
5.8.1.2- Among the commercial vehicle samples, nearly 13.9% fall in the range travel of 0-20 Km
23.2% had average trip length of 21-50 km, 34.8% had average trip length of 51-100 Km, 4.6% had
average trip length in the range of 101-200 km and 23.2 % had the average trip length of 201 Km,
and above.
Table5.1.9: Distribution of Average Trip KM Travel of Commercial Vehicles
Vehicle Code
Vehicle Type 0-20 Km 21-50Km 51-100Km 101-200Km 201-and Above, Km
10 Koyan small 1 1 3 1
11 Koyan large 2 2 1
12 Light Truck 3 6 9 2 3
13 Medium Truck 1 1 1
14 HT Rigid 3Axle 1
15 HT Rigid 4/5 Axle 1 2
16 HT Semi T 4/5 Axle
17 HT Semi T 6Axle 2
Vehicle-wise Commodity Distribution
5.8.1.3- Among the Light Goods Vehicles (LGVs), maximum number of LGVs (28.5%) was found to be
carrying agricultural and food products , 21.4% carried industrial products, and 7% each carried
timber, raw materials, and building material. Among the HTVs 50% carried agricultural and food
products and 255 each carried timber and building materials. The Table 5.1.10 summarises the
movement of the goods on NR5-1.
0
1
2
3
4
5
6
7
8
9
10
0-20 Km 21-50Km 51-100Km 101-200Km 201-andAboveKm
No
. of
Sam
ple
of
Ve
hic
le
Kilometer Range
Trip Lenght Passenger Vehicle
Koyan small
Koyan large
Light Truck
Medium Truck
HT Rigid 3Axle
HT Rigid 4/5 Axle
HT Semi T 4/5 Axle
HT Semi T 6Axle
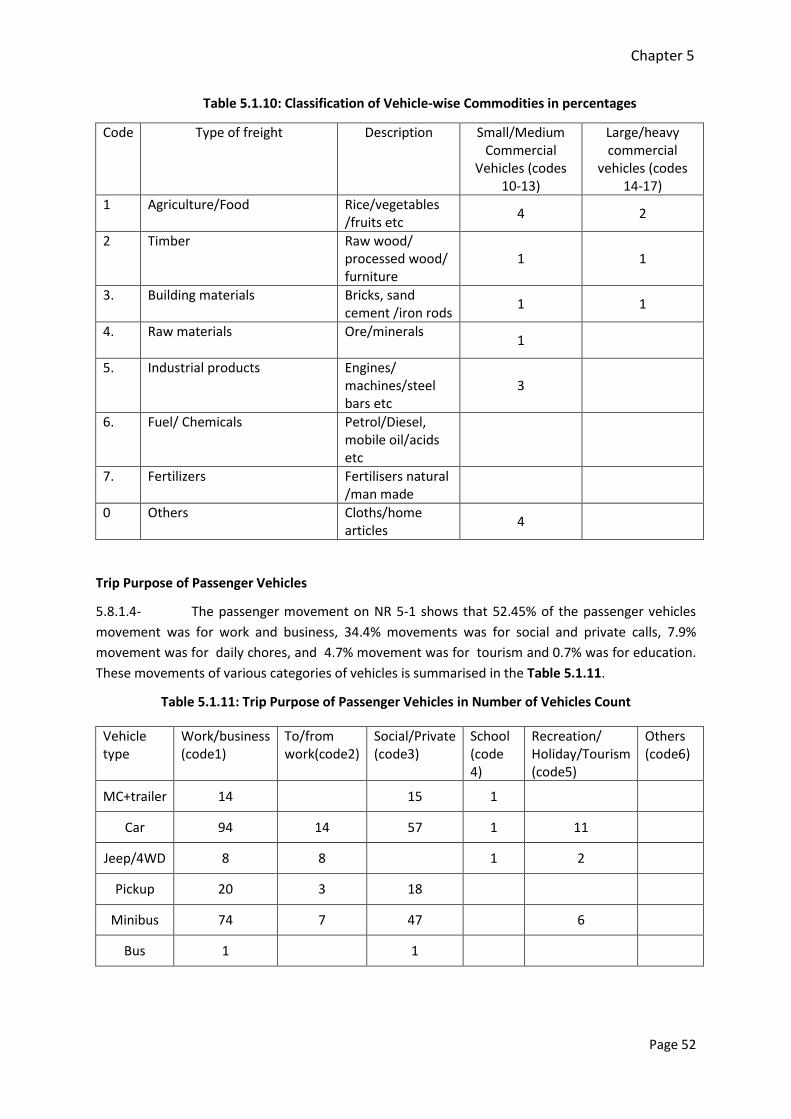
Chapter 5
Page 52
Table 5.1.10: Classification of Vehicle-wise Commodities in percentages
Code Type of freight Description Small/Medium Commercial
Vehicles (codes 10-13)
Large/heavy commercial
vehicles (codes 14-17)
1 Agriculture/Food Rice/vegetables /fruits etc
4 2
2 Timber Raw wood/ processed wood/ furniture
1 1
3. Building materials Bricks, sand cement /iron rods
1 1
4. Raw materials Ore/minerals 1
5. Industrial products Engines/ machines/steel bars etc
3
6. Fuel/ Chemicals Petrol/Diesel, mobile oil/acids etc
7. Fertilizers Fertilisers natural /man made
0 Others Cloths/home articles
4
Trip Purpose of Passenger Vehicles
5.8.1.4- The passenger movement on NR 5-1 shows that 52.45% of the passenger vehicles
movement was for work and business, 34.4% movements was for social and private calls, 7.9%
movement was for daily chores, and 4.7% movement was for tourism and 0.7% was for education.
These movements of various categories of vehicles is summarised in the Table 5.1.11.
Table 5.1.11: Trip Purpose of Passenger Vehicles in Number of Vehicles Count
Vehicle type
Work/business (code1)
To/from work(code2)
Social/Private (code3)
School (code 4)
Recreation/ Holiday/Tourism (code5)
Others (code6)
MC+trailer 14 15 1
Car 94 14 57 1 11
Jeep/4WD 8 8 1 2
Pickup 20 3 18
Minibus 74 7 47 6
Bus 1 1
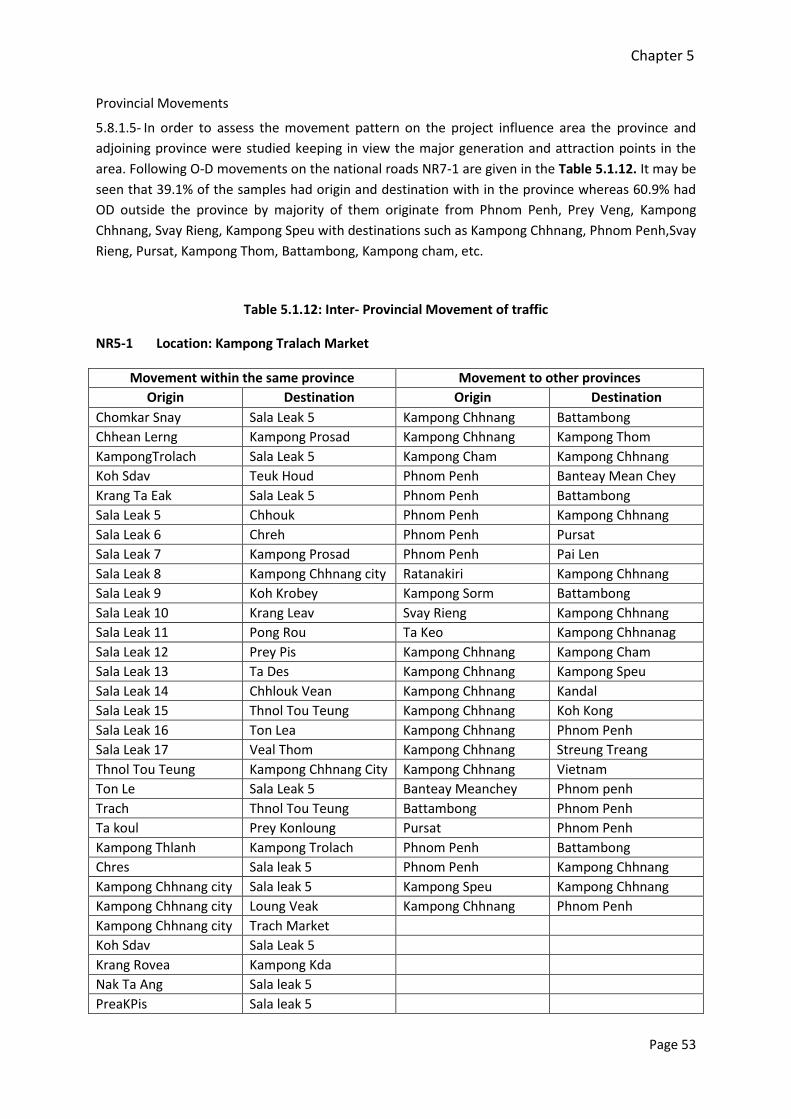
Chapter 5
Page 53
Provincial Movements
5.8.1.5- In order to assess the movement pattern on the project influence area the province and
adjoining province were studied keeping in view the major generation and attraction points in the
area. Following O-D movements on the national roads NR7-1 are given in the Table 5.1.12. It may be
seen that 39.1% of the samples had origin and destination with in the province whereas 60.9% had
OD outside the province by majority of them originate from Phnom Penh, Prey Veng, Kampong
Chhnang, Svay Rieng, Kampong Speu with destinations such as Kampong Chhnang, Phnom Penh,Svay
Rieng, Pursat, Kampong Thom, Battambong, Kampong cham, etc.
Table 5.1.12: Inter- Provincial Movement of traffic
NR5-1 Location: Kampong Tralach Market
Movement within the same province Movement to other provinces
Origin Destination Origin Destination
Chomkar Snay Sala Leak 5 Kampong Chhnang Battambong Chhean Lerng Kampong Prosad Kampong Chhnang Kampong Thom KampongTrolach Sala Leak 5 Kampong Cham Kampong Chhnang Koh Sdav Teuk Houd Phnom Penh Banteay Mean Chey Krang Ta Eak Sala Leak 5 Phnom Penh Battambong Sala Leak 5 Chhouk Phnom Penh Kampong Chhnang Sala Leak 6 Chreh Phnom Penh Pursat Sala Leak 7 Kampong Prosad Phnom Penh Pai Len Sala Leak 8 Kampong Chhnang city Ratanakiri Kampong Chhnang Sala Leak 9 Koh Krobey Kampong Sorm Battambong Sala Leak 10 Krang Leav Svay Rieng Kampong Chhnang Sala Leak 11 Pong Rou Ta Keo Kampong Chhnanag Sala Leak 12 Prey Pis Kampong Chhnang Kampong Cham Sala Leak 13 Ta Des Kampong Chhnang Kampong Speu Sala Leak 14 Chhlouk Vean Kampong Chhnang Kandal Sala Leak 15 Thnol Tou Teung Kampong Chhnang Koh Kong Sala Leak 16 Ton Lea Kampong Chhnang Phnom Penh Sala Leak 17 Veal Thom Kampong Chhnang Streung Treang Thnol Tou Teung Kampong Chhnang City Kampong Chhnang Vietnam Ton Le Sala Leak 5 Banteay Meanchey Phnom penh Trach Thnol Tou Teung Battambong Phnom Penh Ta koul Prey Konloung Pursat Phnom Penh Kampong Thlanh Kampong Trolach Phnom Penh Battambong Chres Sala leak 5 Phnom Penh Kampong Chhnang Kampong Chhnang city Sala leak 5 Kampong Speu Kampong Chhnang Kampong Chhnang city Loung Veak Kampong Chhnang Phnom Penh Kampong Chhnang city Trach Market Koh Sdav Sala Leak 5 Krang Rovea Kampong Kda Nak Ta Ang Sala leak 5 PreaKPis Sala leak 5

Chapter 5
Page 54
Prey Konlorng Krang Taleak Ro Meas Thnol Tou Teung Ro Meas Sala leak 5 Sala Leak 5 KampongTrach Sala Leak 6 Spean Por Sala Leak 7 Ta Eak Sala Leak 8 Thnol Tou Teung Sala Leak 9 Trach Seab Sala Leak 5 SreaMuth Sala leak 5 Ta Uk Sala leak 5 Teav Trach Krouk Vean Sala Leak 5 Thmor Eud Sala leak 5 Thnol Tou Teung Lung Veak
Occupancy Survey
5.8.1.6 Passenger Occupancy survey was done for 14 hour duration (from 7:00 am to 6:00 pm and
8pm to 11pm) at Kampong Tralach. The Table 5.1.13 gives the mode-wise average occupancy at
survey location. The passenger vehicles in the sample show lower level of occupancies and thus low
utilization of capacity.
Table 5.1.13: Average Occupancy of Passenger Carrying Vehicles
Survey Locations Bus Mini
Bus
3
wheeler
2
wheeler/trailer
car Jeep/4WD Pick-up
Kampong Tralach 0 10.62 0 3.6 4.5 2.75 9.5
NR 5- Lot 2
Average Trip KM Travel
5.9.1- The average trip length has been divided into 5 segments from 0-20 km, 21 -50 km, 51-100
km, 101-200 km, 201 km and above for study of the trip km of all categories of vehicles. Two
separate tables have generated for passenger and commercial vehicles. These Tables are
summarized below.The trip pattern for passenger and commercial vehicles are given in Table 5.1.14
and Table5.1.15 along with their graphical presentation.
5.9.1.1- Among the passenger vehicle samples, nearly 41% fall in the long range travel of 201 km and
above, 23% had average trip length of 101-200 Km, 21% had average trip length in the range of 51-
100 Km and about 15% had trip length of 21-50 Km.

Chapter 5
Page 55
Table 5.1.14: Distribution of Average Trip KM Travel of Passenger Vehicles
Vehicle Code
Vehicle Type 0-20 Km 21-50 Km 51-100 Km 101-200 Km
201 Km and Above
3 Motor Cycle 7 9 2
4 3 wheeler(TukTuk) 4 3
5 Car 2 1 6 11
6 Jeep/4WD 1 3
7 Pickup 5 5 13 16
8 Minibus 3 13 11 25
9 Bus 5
5.9.1.2- Among the commercial vehicle samples, nearly 19% fall in the long range travel of 201 Km
and above, 33.3% had average trip length of 51-100 Km, 8.3% had average trip length in the range of
101-200 Km, and another about 39% had trip length of 21-50 Km.
Table5.1.15: Distribution of Average Trip KM Travel of Commercial Vehicles
Vehicle Code
Vehicle Type 0-20 Km 21-50 Km 51-100 Km 101-200 Km
201 and Above, Km
10 Koyan small 1 3
11 Koyan large
12 Light Truck 13 6 3 6
13 Medium Truck 1 1
14 HT Rigid 3Axle 2
15 HT Rigid 4/5 Axle
16 HT Semi T 4/5 Axle
17 HT Semi T 6Axle
0
5
10
15
20
25
30
0-20 Km 21-50Km 51-100Km 101-200Km 201-andAboveKm
No
. of
Sam
ple
of
Ve
hic
le
Kilometer Range
Trip Lenght Passenger Vehicle
Motor Cycle
3 wheeler(TukTuk)
Car
Jeep/4WD
Pickup
Minibus
Bus
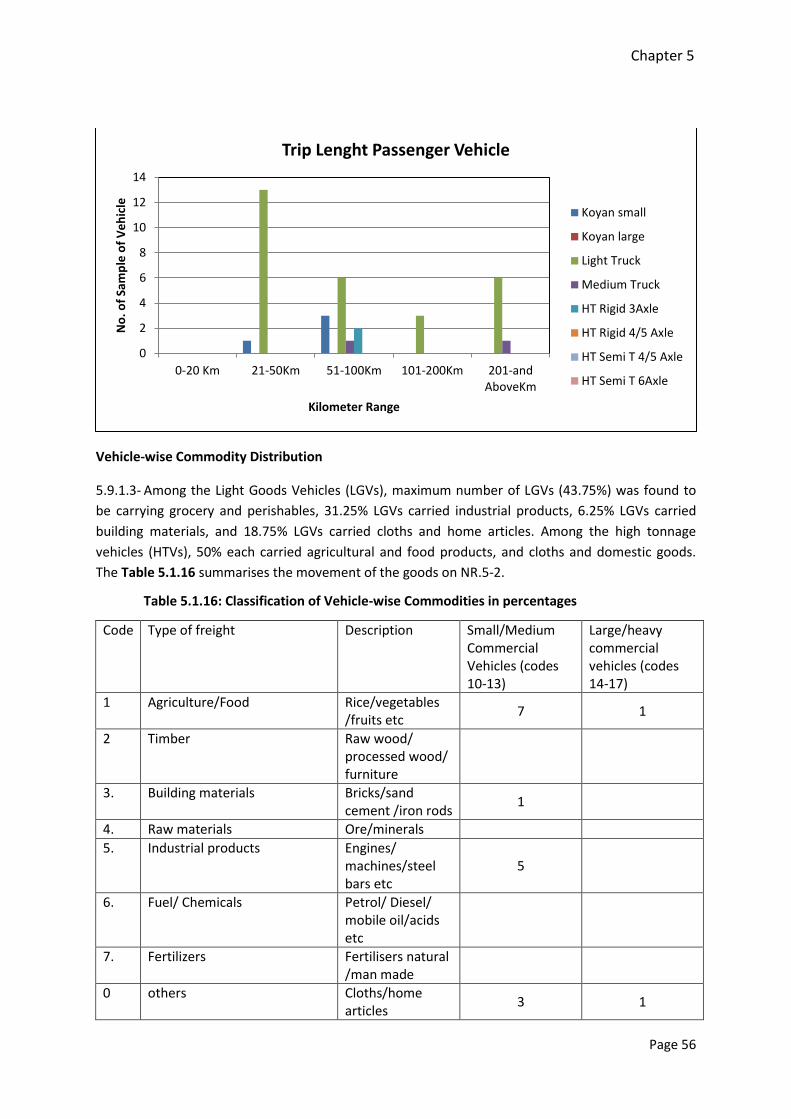
Chapter 5
Page 56
Vehicle-wise Commodity Distribution
5.9.1.3- Among the Light Goods Vehicles (LGVs), maximum number of LGVs (43.75%) was found to
be carrying grocery and perishables, 31.25% LGVs carried industrial products, 6.25% LGVs carried
building materials, and 18.75% LGVs carried cloths and home articles. Among the high tonnage
vehicles (HTVs), 50% each carried agricultural and food products, and cloths and domestic goods.
The Table 5.1.16 summarises the movement of the goods on NR.5-2.
Table 5.1.16: Classification of Vehicle-wise Commodities in percentages
Code Type of freight Description Small/Medium Commercial Vehicles (codes 10-13)
Large/heavy commercial vehicles (codes 14-17)
1 Agriculture/Food Rice/vegetables /fruits etc
7 1
2 Timber Raw wood/ processed wood/ furniture
3. Building materials Bricks/sand cement /iron rods
1
4. Raw materials Ore/minerals
5. Industrial products Engines/ machines/steel bars etc
5
6. Fuel/ Chemicals Petrol/ Diesel/ mobile oil/acids etc
7. Fertilizers Fertilisers natural /man made
0 others Cloths/home articles
3 1
0
2
4
6
8
10
12
14
0-20 Km 21-50Km 51-100Km 101-200Km 201-andAboveKm
No
. of
Sam
ple
of
Ve
hic
le
Kilometer Range
Trip Lenght Passenger Vehicle
Koyan small
Koyan large
Light Truck
Medium Truck
HT Rigid 3Axle
HT Rigid 4/5 Axle
HT Semi T 4/5 Axle
HT Semi T 6Axle

Chapter 5
Page 57
Trip Purpose of Passenger Vehicles
5.9.1.4- The passenger movement on NR5-2 shows that 46.3% of the passenger vehicles movement
was for work and business, 46.3 % movements was forsocial and private calls, 2% movement was for
daily chores, and 7.3% movement was for tourism. These movements of various categories of
vehicles is summarised in the Table 5.1.17.
Table5.1.17: Trip Purpose of Passenger Vehicles in Number of Vehicles Count
Vehicle type
Work/business (code1)
To/from work(code2)
Social/Private (code3)
School (code 4)
Recreation/ Holiday/Tourism (code5)
Others (code6)
MC+trailer 6 2
Car 12 13 3
Jeep/4WD 1 7
Pickup 39 1 42
Minibus 55 1 56 16
Bus 7 3
Provincial Movements
5.9.1.5- In order to assess the movement pattern on the project influence area the province and
adjoining province were studied keeping in view the major generation and attraction points in the
area. Following O-D movements on the national roads NR73 are given in the Table 5.1.18. It may be
seen that 56.8% of the samples had origin and destination with in the province whereas 43.2% had
OD outside the province by majority of them originate from Battambong, Banteay
Meanchey,Kampong Chhnang, Phnom Penh, Pursat with destinations such as Kampong Chhnang
,Phnom Penh, Kandal, Pursat, Battam Bong, Pai Len, Ta keo, Kampot etc.
Table5.1.18: Inter- Provincial Movement of traffic
NR 5-2 Location –Ponlai District
Movement within the same province Movement to other provinces
Origin Destination Origin Destination
Kbal Domrei Punlai Kampong Chhnang Phnom Penh Phsar Chas Punlai Banteay Meanchey Kampong Chhnang Pum Kor Punlai Banteay Meanchey Kondal Pum Rang Punlai Banteay Meanchey Phnom Penh Pulai Bror Sneum Batttombong Kampong Chhnang Pulai Derm Chrey Batttombong Kampot Pulai Kampong Chhnang Batttombong Phnom Penh Pulai Phnnom Penh Batttombong Ta Keo Pulai Prey Ampel Pursat Kampong Chhnang Pulai Sala Krorm Pursat Phnom Penh Pulai Ses Slab Pailen Phnom Penh
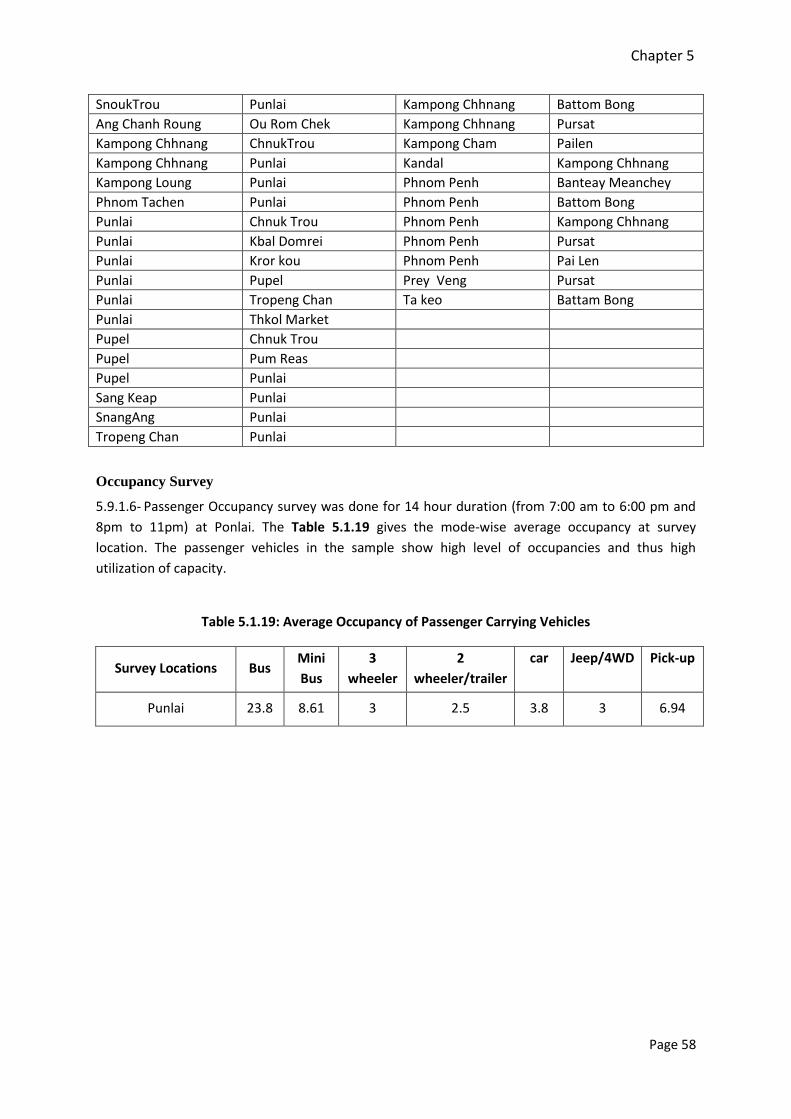
Chapter 5
Page 58
SnoukTrou Punlai Kampong Chhnang Battom Bong Ang Chanh Roung Ou Rom Chek Kampong Chhnang Pursat Kampong Chhnang ChnukTrou Kampong Cham Pailen Kampong Chhnang Punlai Kandal Kampong Chhnang Kampong Loung Punlai Phnom Penh Banteay Meanchey Phnom Tachen Punlai Phnom Penh Battom Bong Punlai Chnuk Trou Phnom Penh Kampong Chhnang Punlai Kbal Domrei Phnom Penh Pursat Punlai Kror kou Phnom Penh Pai Len Punlai Pupel Prey Veng Pursat Punlai Tropeng Chan Ta keo Battam Bong Punlai Thkol Market Pupel Chnuk Trou Pupel Pum Reas Pupel Punlai Sang Keap Punlai SnangAng Punlai Tropeng Chan Punlai
Occupancy Survey
5.9.1.6- Passenger Occupancy survey was done for 14 hour duration (from 7:00 am to 6:00 pm and
8pm to 11pm) at Ponlai. The Table 5.1.19 gives the mode-wise average occupancy at survey
location. The passenger vehicles in the sample show high level of occupancies and thus high
utilization of capacity.
Table 5.1.19: Average Occupancy of Passenger Carrying Vehicles
Survey Locations Bus Mini
Bus
3
wheeler
2
wheeler/trailer
car Jeep/4WD Pick-up
Punlai 23.8 8.61 3 2.5 3.8 3 6.94

Chapter 6
Page 59
Chapter 6-Baseline Survey Report of NR-7
Road and Location-wise Traffic Counts and Composition of Traffic
NR7-1 Lot 1- PK 131+500 and NR7-2PK 179+530
Average Daily Traffic (ADT)
6.1- The average daily traffic was computed for various locations where the mid-block volume
count survey was done. Daily traffic volumes were averaged to find the Average Daily Traffic (ADT).
Further, the ADT was also converted to PCUs using the conversion factors given in Table 2.1.1.
Location wise and mode wise ADT values are given in Table 6.1.1 below. Also the peak hour and
peak hour proportion of total daily traffic (over average 14-hour volume count) was identified and is
given in Table 6.1.1.
6.1.1- Traffic volume count data at each location was counted on hourly basis on both sides of the
road to determine Average Daily Traffic (ADT). Traffic volume count data and summary sheets for
various locations are presented in Appendix III (a). The location wise ADT in vehicles and PCUs are
presented in the Table 6.1.3 below.
Peak Hour Traffic in 14 hour count
6.2- The analysis of the traffic flows on the NR7 national road shows that peak hour movements
varies from 46.02% to 50.47% in actual 14 hour counts and in terms of PCUs 35.23% to 85.58%.
Lower PCU percentage means that traffic counts constitute higher number of motor cycles and
passenger vehicles compared to heavy trucks and commercial vehicles. In case of NR7-1 lot 2,
85.58% PCUs shows higher movement of trucks.
Table 6.1.1: 14 hour Traffic Count
Station
ID No.
Chainage
(km) Location of Survey
ADT Peak Hour Flows,
7- 10am & 4-6Pm
Peak Hour
proportion in
daily Vehicle
Vol.
Peak Hour
proportion
in daily PCU
Vol. Vehi. PCUs Vehi. PCUs
NR 7 –
Lot 1 131.500
Pratheat, Tboung
Khmum 10114 10011 5105 8568 50.47% 85.58%
NR 7-
Lot 2 179.530
Pratheat, Tboung
Khmum 5110 6172 2352 2175 46.02% 35.23%
24 Hour Adjusted Average Daily Traffic
6.3- The traffic count of 14 hours has been adjusted by multiplying the total count by the
adjustment factor of 1.16 (calculated on the basis of the calculations in the Appendix VI).
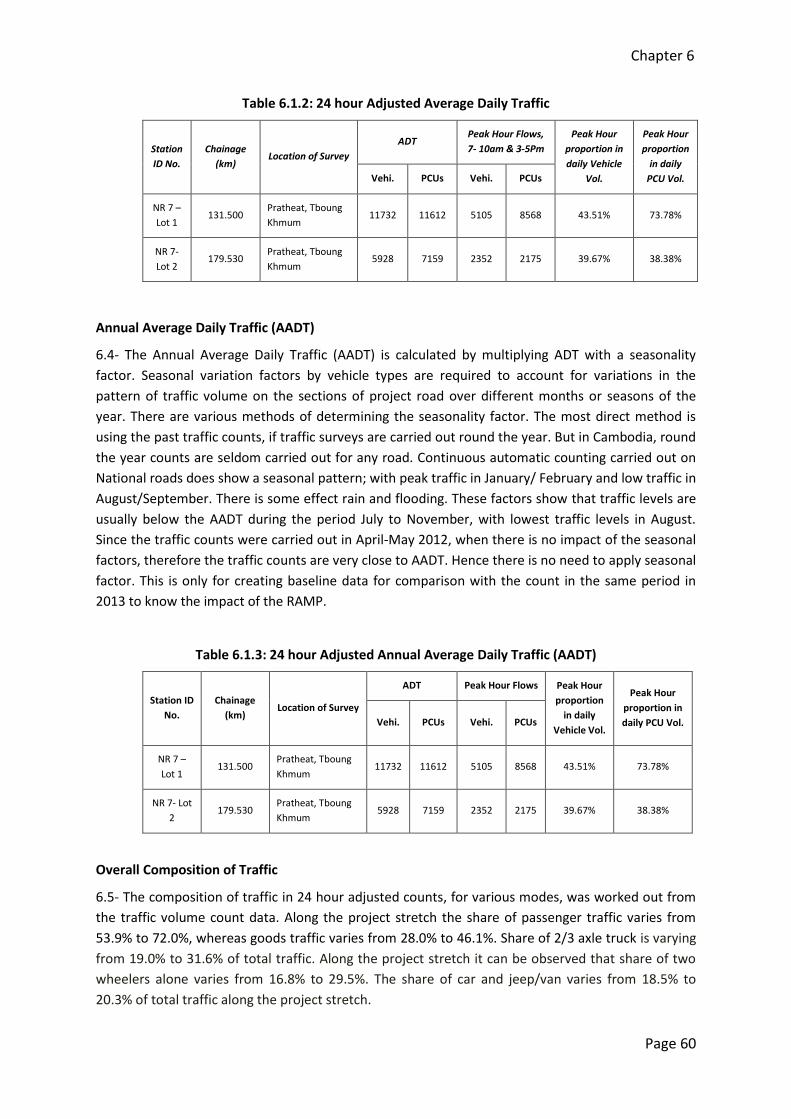
Chapter 6
Page 60
Table 6.1.2: 24 hour Adjusted Average Daily Traffic
Station
ID No.
Chainage
(km) Location of Survey
ADT Peak Hour Flows,
7- 10am & 3-5Pm
Peak Hour
proportion in
daily Vehicle
Vol.
Peak Hour
proportion
in daily
PCU Vol. Vehi. PCUs Vehi. PCUs
NR 7 –
Lot 1 131.500
Pratheat, Tboung
Khmum 11732 11612 5105 8568 43.51% 73.78%
NR 7-
Lot 2 179.530
Pratheat, Tboung
Khmum 5928 7159 2352 2175 39.67% 38.38%
Annual Average Daily Traffic (AADT)
6.4- The Annual Average Daily Traffic (AADT) is calculated by multiplying ADT with a seasonality
factor. Seasonal variation factors by vehicle types are required to account for variations in the
pattern of traffic volume on the sections of project road over different months or seasons of the
year. There are various methods of determining the seasonality factor. The most direct method is
using the past traffic counts, if traffic surveys are carried out round the year. But in Cambodia, round
the year counts are seldom carried out for any road. Continuous automatic counting carried out on
National roads does show a seasonal pattern; with peak traffic in January/ February and low traffic in
August/September. There is some effect rain and flooding. These factors show that traffic levels are
usually below the AADT during the period July to November, with lowest traffic levels in August.
Since the traffic counts were carried out in April-May 2012, when there is no impact of the seasonal
factors, therefore the traffic counts are very close to AADT. Hence there is no need to apply seasonal
factor. This is only for creating baseline data for comparison with the count in the same period in
2013 to know the impact of the RAMP.
Table 6.1.3: 24 hour Adjusted Annual Average Daily Traffic (AADT)
Station ID
No.
Chainage
(km) Location of Survey
ADT Peak Hour Flows Peak Hour
proportion
in daily
Vehicle Vol.
Peak Hour
proportion in
daily PCU Vol. Vehi. PCUs Vehi. PCUs
NR 7 –
Lot 1 131.500
Pratheat, Tboung
Khmum 11732 11612 5105 8568 43.51% 73.78%
NR 7- Lot
2 179.530
Pratheat, Tboung
Khmum 5928 7159 2352 2175 39.67% 38.38%
Overall Composition of Traffic
6.5- The composition of traffic in 24 hour adjusted counts, for various modes, was worked out from
the traffic volume count data. Along the project stretch the share of passenger traffic varies from
53.9% to 72.0%, whereas goods traffic varies from 28.0% to 46.1%. Share of 2/3 axle truck is varying
from 19.0% to 31.6% of total traffic. Along the project stretch it can be observed that share of two
wheelers alone varies from 16.8% to 29.5%. The share of car and jeep/van varies from 18.5% to
20.3% of total traffic along the project stretch.

Chapter 6
Page 61
Table 6.1.4: 14 Hour Percentage Composition of Traffic (PCUs) St
atio
n N
o.
Ch
ain
age
(km
)
Loca
tio
n o
f Su
rve
y
Mo
tor
Cyc
le
Thre
e W
he
ele
r/Tu
kTu
k
Car
Min
i Bu
s
Bu
s
LGV
(Ko
un
/ Es
tan
) sm
all
LGV
(Ko
un
/ Es
tan
) la
rge
Truck
Tota
l
Jee
p/4
wd
Pic
kup
2 A
xle
lig
ht
3 A
xle
Me
diu
m
3ax
le h
eav
y
Mu
lti a
xle
4-5
rig
id
Mu
lti-
axle
tra
ilers
4-5
Mu
lti-
axle
tra
iler
he
avy
5-6
MC
C-5
NR 7 –
Lot 1
PK31.500
Pratheat,
Tboung
Khmum
2950 472 890 530 611 1561 195 86 58 703 841 359 350 347 60 10011
29.4
7%
4.71
%
8.8
9%
5.2
9%
6.1
0%
15.5
9%
1.9
5%
0.8
6%
0.5
8%
7.0
2%
8.40
%
3.5
9%
3.5
0%
3.4
7%
0.6
0%
MC
C-6
NR 7- Lot
2-PK
179.530
Pratheat,
Tboung
Khmum
1038 132 496 241 405 933 81 48 32 541 1071 338 635 156 25 6172
16.8
2%
2.14
%
8.0
4%
3.9
0%
6.5
6%
15.1
2%
1.3
1%
0.7
8%
0.5
2%
8.7
7%
17.3
5%
5.4
8%
10.
29
%
2.5
3%
0.4
1%
Table 6.1.5 -24 Hour Adjusted Composition of Traffic
Stat
ion
No
.
Ch
ain
age
(km
)
Loca
tio
n o
f Su
rve
y
Mo
tor
Cyc
le
Thre
e W
he
ele
r/Tu
kTu
k
Car
Min
i Bu
s
Bu
s
LGV
(Ko
un
/ Es
tan
) sm
all
LGV
(Ko
un
/ Es
tan
) la
rge
Truck
Tota
l
Jee
p/4
wd
Pic
kup
2 A
xle
lig
ht
3 A
xle
Me
diu
m
3ax
le h
eav
y
Mu
lti a
xle
4-5
rig
id
Mu
lti-
axle
tra
ilers
4-5
Mu
lti-
axle
tra
iler
he
avy
5-6
MC
C-5
NR 7 – Lot
1
PK131.500
Pratheat,
Tboung
Khmum
3421 548 1032 615 709 1810 226 100 67 815 976 414 406 403 69 11613
29.4
6%
4.7
2%
8.89
%
5.3
0%
6.1
1%
15.5
9%
1.9
5%
0.8
6%
0.5
8%
7.0
2%
8.40
%
3.5
6%
3.5
0%
3.4
7%
0.5
9%
MC
C-6
NR 7- Lot 2-
PK 179.530
Pratheat,
Tboung
Khmum
1200 153 575 280 470 1082 94 56 37 628 1242 392 737 180 28 7154
16.7
7%
2.1
4%
8.04
%
3.9
1%
6.5
7%
15.1
2%
1.3
1%
0.7
8%
0.5
2%
8.7
8%
17.3
6%
5.4
8%
10.
30
%
2.5
2%
0.3
9%
Hourly Variation of Traffic
6.6- Traffic volume count was conducted in both directions for simultaneously, for 14 hours. The
hourly count was compiled by adding traffic counts of both sides to get the hourly variation of traffic
for each survey location. The graph showing hourly variation for each location is given in Fig 6.1.1
and Fig 6.1.2. Peak hour traffic for all the locations from 7am to 10 am and 3pm to 5pm is found to
be 45% of the actual 24 hour PCU counts in ADT. It is quite normal for intercity roads because of high
percentage of regional traffic movement of freight traffic on the road. This results in traffic flows to
be uniformly distributed over the main 16-20 hours of the day.
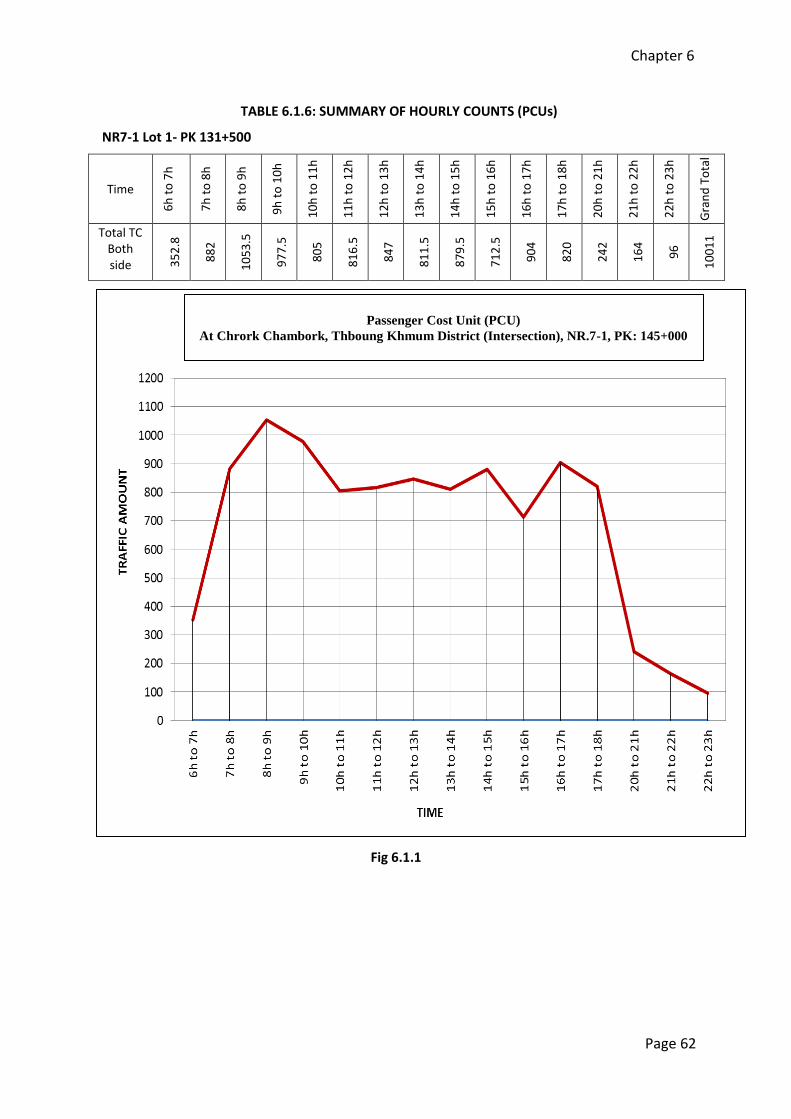
Chapter 6
Page 62
TABLE 6.1.6: SUMMARY OF HOURLY COUNTS (PCUs)
NR7-1 Lot 1- PK 131+500
Time
6h
to
7h
7h
to
8h
8h
to
9h
9h
to
10
h
10
h t
o 1
1h
11
h t
o 1
2h
12
h t
o 1
3h
13
h t
o 1
4h
14
h t
o 1
5h
15
h t
o 1
6h
16
h t
o 1
7h
17
h t
o 1
8h
20
h t
o 2
1h
21
h t
o 2
2h
22
h t
o 2
3h
Gra
nd
To
tal
Total TC Both side 3
52
.8
88
2
10
53
.5
97
7.5
80
5
81
6.5
84
7
81
1.5
87
9.5
71
2.5
90
4
82
0
24
2
16
4
96
10
01
1
Fig 6.1.1
Passenger Cost Unit (PCU)
At Chrork Chambork, Thboung Khmum District (Intersection), NR.7-1, PK: 145+000

Chapter 6
Page 63
NR7-2, PK 179+530
Time 6
h t
o 7
h
7h
to
8h
8h
to
9h
9h
to
10
h
10
h t
o 1
1h
11
h t
o 1
2h
12
h t
o 1
3h
13
h t
o 1
4h
14
h t
o 1
5h
15
h t
o 1
6h
16
h t
o 1
7h
17
h t
o 1
8h
20
h t
o 2
1h
21
h t
o 2
2h
22
h t
o 2
3h
Gra
nd
To
tal
Total TC Both side 2
31
.6
57
9
56
8.5
65
3
49
9.5
70
2
36
3
71
7
48
1
50
3
46
0
41
3
97
78
58
61
72
Fig 6.1.2
Overall Result of the Community Survey
6.7- The community survey questionnaire was designed to obtain information on the benefits of the
rehabilitated national roads was structured in to 10 questions. Question 1 &2 basically cover the
details of the respondents whereas questions 3 to10 are directly related to the qualitative benefits
enjoyed by the road users and road neighbours. These questions provide multiple choices. The
responses the community from the 40 samples, 10 each in 4 categories are summarised in the table
below:
Passenger Cost Unit (PCU)
At Pra Theat, Tboung Khmum District (Both Diection) NR.7-2, PK:
159+830

Chapter 6
Page 64
TABLE 6.1.7: SUMMARY OF COMMUNITY DATA SURVEY NR 7
No. Question
Road No. NR.7-1 NR.7-2
Location Tbong
Khmom Pres
Theat
3 In the family
Member in family M 77 55
F 102 68
No. of Children M 67 41
F 95 36
4 Vehicle owner ship
Motorbike 24 23
Car 8 5
Scooter 6 0
Lorry / Etan 1 1
Others, (bicycle) 0 20
Km/mon. 11050 6900
5 Use of Public/Private
Transport
Bus 3 6
Car 14 28
Others ( Motor taxi, 5 12
6 Main Occupation
of family
Agriculture 11 18
Service 16 7
Business 13 15
7 Family income (Monthly) USD/Riels
Minimum $ 75 $50
Maximum $3,000 $ 2,250
Average $ 365
8 Benefit of the road project
Quality Travel (comfort level)
Excellent 6 11
very Good 30 21
Good 4 5
Poor 0 3
Saving in transportation cost compared to 2008
Lower 11 (28%) 15 (38%)
Somewhat lower 14 (35%) 10 (25%)
No Change 2 (4%) 1 (2%)
Over 13 (33%) 14 (35%)
Excess to public transport compared to
2008
Better 21 31
Somewhat better 18 6
No Change 1 3
9 Travel of
school children by
Distance (km)
Minimum 0.4 0.3
Maximum 18 6
Mean 2.5 1.7
By Walk Percentage 6.50% 4.00%
By Personal vehicle
including bicycle Yes 74.10% 88.00%

Chapter 6
Page 65
By Bus Yes 6.50% 4.00%
By Others Yes 12.90% 4.00%
10
How road project
benefited your family
business?
Availability of goods in the market
Better 40 40
Somewhat better 0 0
Easy to carry goods for sale in the market
Better 40 40
Somewhat better 0 0
Easy excess to market Better 40 40
Somewhat better 0 0
Response to Vehicle ownership and Km Travel
6.7.1- Each of the target groups interviewed show that on an average every family had one
motorised vehicle (motor cycle or car, scooter, lorry or etan) and large number of them had bicycles
as an alternate. 40 samples interviewed show extensive total travel of 6900 Kms to 11050 kms on
NR7 per month. The average travel at the individual family level is of the order of 224 kms.
Use of Public and Private Transport
6.7.2- In the sample 0f 80 on NR7, it has been observed that majority of the families (70%) on NR7
Lot 2 are using private transport car whereas on NR-1-2, 35% families travel by car. About 7.55 to
15% use bus and a very few use other means of travel such as motorcycle, taxi etc.
Main Occupation of Road Neighbours
6.7.3- It has been observed that nearly 36.25% of the population in the road neighbouring areas at
the study locations on NR7 were in agriculture, about 35% in business and balance 28.75% in service
(as an employee or running service centres, repairs of vehicles., petrol pumps etc.).
Family Income
6.7.4- Most of the respondents reported increase income in their income levels compared to level
in 2008-9. The average monthly income of neighbouring families is reported to be about US$365 at
different locations of the national road. However, it varies from a minimum of US$50 to a maximum
of US$3,000 per month.
Benefit of the Road Rehabilitation Project
Quality of Travel
6.7.5.1- 21.25 % of the people rated quality of travel as excellent, 51.25 %have rated quality of travel
as very good, 11.25% have rated good, and only 3.75% have rated poor. Poor rating by some
respondents are obvious as the rehabilitation work is still in progress in some sections of the on-
going projects.
Chapter 6
Page 66
Saving in Transportation Cost
6.7.5.2- Compared to the travel costs in 2008-9, 32.5% of the respondents have reported lower
travel costs, 30% have reported somewhat lower travel costs, 3.75 % have reported no change in
travel cost and 33.75% have reported increase in travel costs.
Excess to Public Transport
6.7.5.3- On the Sections of the roads surveyed, 65% respondents have reported good availability of
public transport, 30.5% have reported somewhat better and about 5% have reported no change.
Travel of School Children
Distance Travelled
6.7.5.4- On the overall, children living in the neighbourhood of the national roads travel from
minimum of 0.3 km to a maximum of 18 Km for going to their schools. This gives an average distance
of about 21.1, the school children travel.
Children Walking to School
6.7.5.5- Out of the total school going children living in the neighbourhood of NR7 nation road about
4% to 6.5% travels to their schools by walk.
Children Using Personal Vehicles
6.7.5.6- Out of the total school going children living in the neighbourhood of various nation roads
about 74.10% to 88% travels to their schools by their personal vehicles.
Children going to School by Bus
6.7.5.7- Out of the total school going children living in the neighbourhood of various nation roads
about 4% to 6.5% travels to their schools by bus.
Travel by other means
6.7.5.8- Out of the total school going children living in the neighbourhood of various nation roads
about 4% to 12.9% travel to their schools by other means.
How Road Project Benefited Family Business
Availability Good in the Market
6.7.5.9- Majority of the respondents (100%) reported better availability of goods and services.
Easy to carry Goods to the Market
6.7.5.10- Most respondents (100%) have reported better availability of transport means to carry
goods to the market because of good roads.
Easy Excess to Market

Chapter 6
Page 67
6.7.5.11- Majority of the respondents (100%) have reported better excess to market.
NR 7-1 Tbong Khmum District
Average Trip KM Travel
6.8.1- The average trip length has been divided into 5 segments from 0-20 km, 21 -50 km, 51-100
km, 101-200 km, 201 km and above for study of the trip km of all categories of vehicles. Two
separate tables have generated for passenger and commercial vehicles. These Tables are
summarized below.The trip pattern for passenger and commercial vehicles are given in Table 6.1.8
and Table6.1.9 along with their graphical presentation.
6.8.1.1- Among the passenger vehicle samples, nearly 25% fall in the long range travel of 201 km and
above, 33.3% had average trip length of 0-20 Km, 16,6% had average trip length in the range of 21-
50 Km, 16.65% had average trip length of 51-100 Km and 8.35% had average trip length 101-200 km.
Table 6.1.8 Distribution of Average Trip KM Travel of Passenger Vehicles
Vehicle Code
Vehicle Type 0-20 Km 21-50 Km 51-100 Km 101-200 Km
201-and Above, Km
3 Motor Cycle
4 3 wheeler(TukTuk) 1 1
5 Car 2 1 2
6 Jeep/4WD 1
7 Pickup 1
8 Minibus 1 2
9 Bus
6.8.1.2- Among the commercial vehicle samples, nearly 4% fall in the long range travel of 0-20 km,
12% had average trip length of 21-50 Km, 29.3% had average trip length in the range of 51-100Km,
34.7% had trip length of101 -200 km and 205 had trip length of 200 Km and above.
0
0.5
1
1.5
2
2.5
0-20 Km 21-50Km 51-100Km 101-200Km 201-andAboveKm
No
. of
Sam
ple
of
Ve
hic
le
Kilometer Range
Trip Lenght Passenger Vehicle
Motor Cycle
3 wheeler(TukTuk)
Car
Jeep/4WD
Pickup
Minibus
Bus

Chapter 6
Page 68
Table6.1.9 Distribution of Average Trip KM Travel of Commercial Vehicles
Vehicle Code
Vehicle Type 0-20 Km 21-50Km 51-100Km 101-200Km 201-and Above, Km
10 Koyan small 1
11 Koyan large 1
12 Light Truck 2 2 2 4
13 Medium Truck 3 2 1
14 HT Rigid 3Axle 4 3 3 5
15 HT Rigid 4/5 Axle 1 7 5 3
16 HT Semi T 4/5 Axle 2 7 10 6
17 HT Semi T 6Axle 1
Vehicle-wise Commodity Distribution
6.8.1.3- Among the Light Goods Vehicles (LGVs), maximum number of LGVs (52.9%) was found to be
carrying grocery and perishables, 17 % LGVs carried timber, and 5.9 % each carried fertilizers and
building materials and cloths and home articles. Among the high tonnage vehicles (HTVs), 66%
carried agricultural, 19 carried building materials, 11.3% carried timber and 3.7% carried industrial
products. The Table 6.1.10 summarises the movement of the goods on NR7-1.
0
2
4
6
8
10
12
0-20 Km 21-50Km 51-100Km 101-200Km 201-andAboveKm
No
. of
Sam
ple
of
Ve
hic
le
Kilometer Range
Trip Lenght Passenger Vehicle
Koyan small
Koyan large
Light Truck
Medium Truck
HT Rigid 3Axle
HT Rigid 4/5 Axle
HT Semi T 4/5 Axle
HT Semi T 6Axle

Chapter 6
Page 69
Table6.1.10: Classification of Vehicle-wise Commodities in percentages
Code Type of freight Description Small/Medium Commercial Vehicles (codes 10-13)
Large/heavy commercial vehicles (codes 14-17)
1 Agriculture/Food Rice/vegetables /fruits etc
9 35
2 Timber Raw wood/ processed wood/ furniture
5 6
3. Building materials Bricks/sand cement /iron rods
1 10
4. Raw materials Ore/minerals 1
5. Industrial products Engines/ machines/steel bars etc
2 2
6. Fuel/ Chemicals Petrol/Diesel, mobile oil/acids etc
7. Fertilizers Fertilisers natural /man made
1
0 others Cloths/home articles
Trip Purpose of Passenger Vehicles
6.8.1.4- The passenger movement on NR7-1 shows that 32% of the passenger vehicles movement
was for work and business, 50 % movements was forsocial and private calls, and 18% movement was
for daily chores.These movements of various categories of vehicles is summarised in the Table
6.1.11.
Table 6.1.11: Trip Purpose of Passenger Vehicles in Number of Vehicles Count
Vehicle type Work business (code1)
To/from work
(code2)
Social Private (code3)
School
(code 4)
Recreation/ Holiday/Tourism
(code5)
Others
(code6)
MC+trailer 3 1
Car 2 2 3
Jeep/4WD 1
Pickup 4
Minibus 4 3 5
Bus

Chapter 6
Page 70
Provincial Movements
6.8.1.5- In order to assess the movement pattern on the project influence area the province and
adjoining province were studied keeping in view the major generation and attraction points in the
area. Following O-D movements on the national roads NR7-1 are given in the Table 6.1.12.It may be
seen that 48.9% of the samples had origin and destination with in the province whereas 51.1% had
OD outside the province by majority of them originate from Kampong Cham, Vietnam, Phnom Penh,
Siem Reap with destinations such as Kampong Cham, Phnom Penh, Vietnam, Kratie, Ratnakiri etc.
Table 6.1.12 Inter- Provincial Movement of traffic
NR NR7-1 Location: TbongKhmum
Movement within the same province Movement to other provinces
Origin Destination Origin Destination
Chamkar Leu Soung Kampong Cham Kratie Chamkar Leu Thbong Khmum Kampong Cham Mondul kiri Kampong Cham city Ta Borv Kampong Cham Ratanak kiri Ou Rang Ouv Soung Kampong Cham Vietnam Prey Tou Teung Chub Bateay Meanchey Kampong Cham Prey Tou Teung Memuth Kampong Thom Kampong Cham Prey Tou Teung Punnhea Kreak Kampong Thom Vietnam Prey Tou Teung Soung Kampot Kampong Cham Soung Thbong Khmum Kandal Kampong Cham Thbong Khmum Chub Phnom Penh Kampong Cham Thbong Khmum Soung Phnom Penh Kratie Chub Chub Phnom Penh Vietnam Chub Mou Ram Dek Siem Reap Memuth Chub Skun Kampong Cham Banteay Meanchey Memuth BeungKuk Kampong Cham Phnom Penh Memuth Thnol Tou Teung Kampong Cham Siem Reap PunnheaKreak Beung Kuk Vietnam Phnom Penh Soung Beung Kuk Kampon Cham Vietnam Ta Pav Soung Kampong Thom Vietnam Skun Soung Phnm Penh Kampong Cham Punnhea Kreak Preh Vihea Vietnam Memuth Kampong cham city Vietnam Kampong Cham Soung Svay Ann Tour Vietnam Phnom Penh Vietnam Siem Reap
Occupancy Survey
6.8.1.6- Passenger Occupancy survey was done for 14 hour duration (from 7:00 am to 6:00 pm and
8pm to 11pm) at Tbong Khmum. The Table 6.1.13 gives the mode-wise average occupancy at survey
location. The passenger vehicles in the sample show lower level of occupancies and thus low
utilization of capacity.

Chapter 6
Page 71
Table 6.1.13: Average Occupancy of Passenger Carrying Vehicles
Survey Locations Bus Mini
Bus
3
wheeler
2
wheeler/trailer
car Jeep/4WD Pick-up
Tbong Khmum 8.4 2.3 2.1 1.4 1 4
NR 7-2
Average Trip KM Travel
6.8.2- The average trip length has been divided into 5 segments from 0-20 km, 21 -50 km, 51-100 km, 101-200 km, 201 km and above for study of the trip km of all categories of vehicles. Two separate tables have generated for passenger and commercial vehicles. These Tables are summarized below.The trip pattern for passenger and commercial vehicles are given in Table 6.1.14 and Table6.1.15 along with their graphical presentation.
6.8.2.1- Among the passenger vehicle samples, nearly 50% fall in the long range travel of 201 km and above, 30% had average trip length of 101-200 Km, 17% had average trip length in the range of 51-100 Km and about 3% had trip length of 21-50 Km.
Table 6.1.14 Distribution of Average Trip KM Travel of Passenger Vehicles
Vehicle Code
Vehicle Type 0-20 Km 21-50 Km 51-100 Km 101-200 Km
201-and Above, Km
3 Motor Cycle 4
4 3 wheeler(TukTuk) 2 2
5 Car 8 3 9
6 Jeep/4WD 2 5 11
7 Pickup 1 1 6 8
8 Minibus 5 27 56 79
9 Bus 4
0
10
20
30
40
50
60
70
80
90
0-20 Km 21-50Km 51-100Km 101-200Km 201-andAboveKm
No
. of
Sam
ple
of
Ve
hic
le
Kilometer Range
Trip Lenght Passenger Vehicle
Motor Cycle
3 wheeler(TukTuk)
Car
Jeep/4WD
Pickup
Minibus
Bus

Chapter 6
Page 72
6.8.2.2- Among the commercial vehicle samples, nearly 50% fall in the long range travel of 201 Km and above, 20% had average trip length of 51-100 Km, 15% had average trip length in the range of 101-200 Km, and another about 15% had trip length of 21-50 Km.
Table 6.1.15 Distribution of Average Trip KM Travel of Commercial Vehicles
Vehicle Code
Vehicle Type 0-20 Km 21-50 Km 51-100 Km 101-200 Km 201-and Above, Km
10 Koyan small
11 Koyan large 1 1
12 Light Truck 2 1 6
13 Medium Truck 2
14 HT Rigid 3Axle 1
15 HT Rigid 4/5 Axle 2 1 2
16 HT Semi T 4/5 Axle 1
17 HT Semi T 6Axle
Vehicle-wise Commodity Distribution
6.8.2.3- Among the Light Goods Vehicles (LGVs), maximum number of LGVs (62.5%) was found to be
carrying grocery and perishables, 25% LGVs carried building materials, and 12.5% LGVs carried cloths
and home articles. Among the high tonnage vehicles (HTVs), 25% each carried industrial products,
agricultural and food products, building materials and cloths and domestic goods. The Table 6.1.16
summarises the movement of the goods on NR7-2.
0
1
2
3
4
5
6
7
0-20 Km 21-50Km 51-100Km 101-200Km 201-andAboveKm
No
. of
Sam
ple
of
Ve
hic
le
Kilometer Range
Trip Lenght Passenger Vehicle
Koyan small
Koyan large
Light Truck
Medium Truck
HT Rigid 3Axle
HT Rigid 4/5 Axle
HT Semi T 4/5 Axle
HT Semi T 6Axle

Chapter 6
Page 73
Table6.1.16: Classification of Vehicle-wise Commodities in Percentages
Code Type of freight Description Small/Medium Commercial Vehicles (codes 10-13)
Large/heavy commercial vehicles (codes 14-17)
1 Agriculture/Food Rice/vegetables /fruits etc
5 1
2 Timber Raw wood/ processed wood/ furniture
3. Building materials Bricks/sand cement /iron rods
2 1
4. Raw materials Ore/minerals
5. Industrial products Engines/ machines/steel bars etc
1
6. Fuel/ Chemicals Petrol/Diesel/ mobile oil/acids etc
7. Fertilizers Fertilisers natural /man made
0 others Cloths/home articles
1 1
Trip Purpose of Passenger Vehicles
6.8.2.4- The passenger movement on NR2714 shows that 48.6% of the passenger vehicles
movement was for work and business, 33% movements was for social and private calls, 17.7%
movement was for daily chores, and 0.6% movement was for tourism. These movements of various
categories of vehicles is summarised in the Table 6.1.17.
Table 6.1.17: Trip Purpose of Passenger Vehicles in Number of Vehicles Count
Vehicle type Work business (code1)
To/from work (code2)
Social Private (code3)
School (code 4)
Recreation/ Holiday/Tourism (code5)
Others (code6)
MC+trailer 3 2
Car 18 6 25
Jeep/4WD 7 12 17
Pickup 14 8
Minibus 246 87 147 1
Bus 6 3 3
Provincial Movements
6.8.2.5- In order to assess the movement pattern on the project influence area the province and
adjoining province were studied keeping in view the major generation and attraction points in the
area. Following O-D movements on the national roads NR73 are given in the Table 6.1.18. It may be

Chapter 6
Page 74
seen that 32.9% of the samples had origin and destination with in the province whereas 67.1% had
OD outside the province by majority of them originate from Kampong Cham, Kratie, Phnom Penh,
Prey Veang, Mandol kiri, and Ratnak kiri and with destinations such as Kampong Cham ,Phnom Penh,
Kratie, Siem Reap, SteungTreang, Takeo, Ratnak kiri etc.
Table 6.1.18 Inter- Provincial Movement of Traffic
NR 7-2 Location: Prothead
Movement within the same province Movement to other provinces
Origin Destination Origin Destination
Kampong Cham Memuth Kampong Cham Memuth Kampong Cham Prothead Kampong Cham Prothead Kampong Cham Punnha kreak Kampong Cham Ponhea kreak Skun Memuth Skun Memuth Skun Ponhea kreak Skun Ponhea kreak Soung Dambae Soung Dambae Soung Memuth Soung Memuth Soung Prothead Soung Prothead Soung Ponhea Kreak Soung Ponhea Kreak Tonle Bith Phnom Prech Tonle Bith Phnom Prech Dambae Ou Rang Ouv Kampong Cham Kratie Chom Peang Kampong Cham Kampong Cham MundulKiri Krouch Chmar Kampong Cham Kampong Cham Ratanakiri Memuth Kampong Cham Kampong Cham Vietnam Rundov Chrum Kampong Cham Kratie MundulKiri Steung Dambae Kratie Vietnam Steung Soung Phnom Pen Kampong Cham Pou Leas Krouch Chmar Phnom Pen Kratie Prothead Kompong Cham Phnom Pen Mundolkiri Ponhea Kreak Skun Phnom Pen Prey Veng Soung Kampong Cham Phnom Pen Ratanakiri Steung Soung Phnom Pen Steung Treang Tropeng Phlung Thnol Tou Teung Prey Veang Kratie Song Dambae Prey Veang Ratanakiri Song Ponhea Kreak SvayReang Kratie Song Memuth Kampong Cham Kandal Dambae Soung Kampong Cham Kratie Kampong Cham Phnom Penh Kampong Cham Kampong Cham Steung Treang Kampong Cham Takeo kratie kampong Cham kratie Phnom Penh kratie Prey Veang kratie Takeo Mundolkiri Kampong Cham Mundolkiri Phnom Penh Ratanakiri Kampong Cham

Chapter 6
Page 75
Ratanakiri Phnom Penh Ratanakiri Siem Reap Steung Treang Kampong Cham Steung Treang Phnom Penh Vietnam Kampong Cham Vietnam Kratie Vietnam Phnom Penh Vietnam Steung Treang Kampong Cham Kratie Kampong Cham Ratanakiri Kampong Thom SteungTreang Phnom Penh Kampong Cham Phnom Penh Kratie Phnom Penh Ratanakiri Pursat Kratie Kratie Phnom Penh Ratanakiri Kampong Thom Ratanakiri Prey Veang
Occupancy Survey
Passenger Occupancy survey was done for 14 hour duration (from 7:00 am to 6:00 pm and 8pm to
11pm) at Pratheat. The Table 6.1.19 gives the mode-wise average occupancy at survey location. The
passenger vehicles in the sample show high level of occupancies and thus high utilization of capacity.
Table 6.1.19: Average Occupancy of Passenger Carrying Vehicles
Survey Locations Bus Mini
Bus
3
wheeler
2
wheeler/trailer
car Jeep/4WD Pick-up
Prathead 25.75 11.01 2 3.3 2.8 3.5 2.35
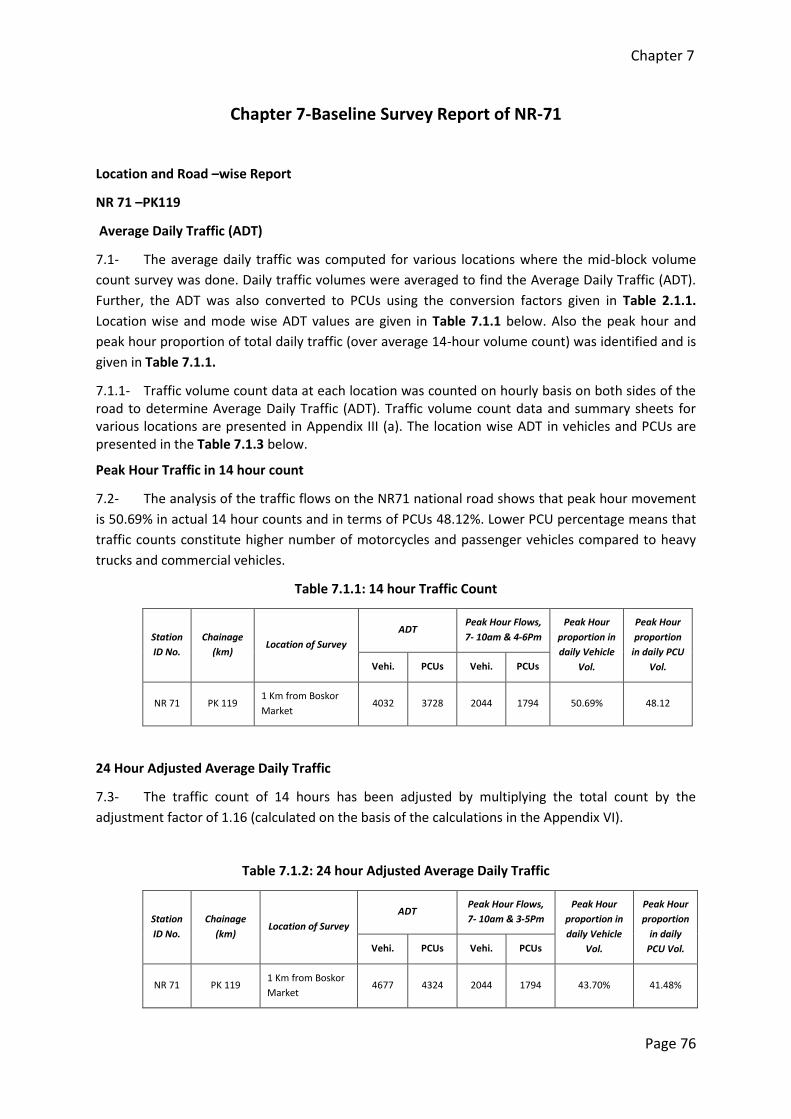
Chapter 7
Page 76
Chapter 7-Baseline Survey Report of NR-71
Location and Road –wise Report
NR 71 –PK119
Average Daily Traffic (ADT)
7.1- The average daily traffic was computed for various locations where the mid-block volume
count survey was done. Daily traffic volumes were averaged to find the Average Daily Traffic (ADT).
Further, the ADT was also converted to PCUs using the conversion factors given in Table 2.1.1.
Location wise and mode wise ADT values are given in Table 7.1.1 below. Also the peak hour and
peak hour proportion of total daily traffic (over average 14-hour volume count) was identified and is
given in Table 7.1.1.
7.1.1- Traffic volume count data at each location was counted on hourly basis on both sides of the road to determine Average Daily Traffic (ADT). Traffic volume count data and summary sheets for various locations are presented in Appendix III (a). The location wise ADT in vehicles and PCUs are presented in the Table 7.1.3 below.
Peak Hour Traffic in 14 hour count
7.2- The analysis of the traffic flows on the NR71 national road shows that peak hour movement
is 50.69% in actual 14 hour counts and in terms of PCUs 48.12%. Lower PCU percentage means that
traffic counts constitute higher number of motorcycles and passenger vehicles compared to heavy
trucks and commercial vehicles.
Table 7.1.1: 14 hour Traffic Count
Station
ID No.
Chainage
(km) Location of Survey
ADT Peak Hour Flows,
7- 10am & 4-6Pm
Peak Hour
proportion in
daily Vehicle
Vol.
Peak Hour
proportion
in daily PCU
Vol. Vehi. PCUs Vehi. PCUs
NR 71 PK 119 1 Km from Boskor
Market 4032 3728 2044 1794 50.69% 48.12
24 Hour Adjusted Average Daily Traffic
7.3- The traffic count of 14 hours has been adjusted by multiplying the total count by the
adjustment factor of 1.16 (calculated on the basis of the calculations in the Appendix VI).
Table 7.1.2: 24 hour Adjusted Average Daily Traffic
Station
ID No.
Chainage
(km) Location of Survey
ADT Peak Hour Flows,
7- 10am & 3-5Pm
Peak Hour
proportion in
daily Vehicle
Vol.
Peak Hour
proportion
in daily
PCU Vol. Vehi. PCUs Vehi. PCUs
NR 71 PK 119 1 Km from Boskor
Market 4677 4324 2044 1794 43.70% 41.48%

Chapter 7
Page 77
Annual Average Daily Traffic (AADT)
7.4- The Annual Average Daily Traffic (AADT) is calculated by multiplying ADT with a seasonality
factor. Seasonal variation factors by vehicle types are required to account for variations in the
pattern of traffic volume on the sections of project road over different months or seasons of the
year. There are various methods of determining the seasonality factor. The most direct method is
using the past traffic counts, if traffic surveys are carried out round the year. But in Cambodia, round
the year counts are seldom carried out for any road. Continuous automatic counting carried out on
National roads does show a seasonal pattern; with peak traffic in January/ February and low traffic in
August/September. There is some effect rain and flooding. These factors show that traffic levels are
usually below the AADT during the period July to November, with lowest traffic levels in August.
Since the traffic counts were carried out in April-May 2012, when there is no impact of the seasonal
factors, therefore the traffic counts are very close to AADT. Hence there is no need to apply seasonal
factor. This is only for creating baseline data for comparison with the count in the same period in
2013 to know the impact of the RAMP.
Table 7.1.3: 24 hour Adjusted Annual Average Daily Traffic (AADT)
Station ID
No.
Chainage
(km) Location of Survey
ADT Peak Hour Flows Peak Hour
proportion
in daily
Vehicle Vol.
Peak Hour
proportion in
daily PCU Vol. Vehi. PCUs Vehi. PCUs
NR 71 PK 119 1 Km from Boskor
Market 4677 4324 2044 1794 43.70% 41.48%
Overall Composition of Traffic
7.5- The composition of traffic, for various modes, was worked out from the traffic volume count
data. Along the project stretch the share of passenger traffic is 65.7%, whereas goods traffic is
34.3%.Share of 2/3 axle truck is 22.1% of total traffic. Along the project stretch it can be observed
that share of two wheelers alone is 36.2%. The share of car and jeep/van is 14.4% of total traffic
along the project stretch.
Table 7.1.4: 14 Hour Percentage Composition of Traffic (PCUs)
Stat
ion
No
.
Ch
ain
age
(km
)
Loca
tio
n o
f Su
rve
y
Mo
tor
Cyc
le
Thre
e W
he
ele
r/Tu
kTu
k
Car
Min
i Bu
s
Bu
s
LGV
(Ko
un
/ Es
tan
) sm
all
LGV
(Ko
un
/ Es
tan
) la
rge
Truck
Tota
l
Jee
p/4
wd
Pic
k-u
p
2 A
xle
lig
ht
3 A
xle
Me
diu
m
3ax
le h
eav
y
Mu
lti a
xle
4 r
igid
Mu
lti-
axle
tra
ilers
5
Mu
lti-
axle
tra
iler
he
avy
6
MC
C-7
NR 71
PK 119
1 Km from
Boskor
Market
1349 87 210 177 150 407 71 57 42 203 361 260 246 100 9 3728
36.1
9%
2.33
%
5.6
3%
4.75
%
4.0
2%
10.9
2%
1.9
0%
1.5
3%
1.1
3%
5.4
5%
9.6
8%
6.9
7%
6.6
0%
2.6
8%
0.2
4%

Chapter 7
Page 78
Table 7.1.5: 24 Hour Adjusted Composition of Traffic
Stat
ion
No
.
Ch
ain
age
(km
)
Loca
tio
n o
f Su
rve
y
Mo
tor
Cyc
le
Thre
e W
he
ele
r/Tu
kTu
k
Car
Min
i Bu
s
Bu
s
LGV
(Ko
un
/ Es
tan
) sm
all
LGV
(Ko
un
/ Es
tan
) la
rge
Truck
Tota
l
Jee
p/4
wd
Pic
k-u
p
2 A
xle
lig
ht
3 A
xle
Me
diu
m
3ax
le h
eav
y
Mu
lti a
xle
4 r
igid
Mu
lti-
axle
tra
ilers
5
Mu
lti-
axle
tra
iler
he
avy
6
MC
C-7
NR 71
PK 119
1 Km from
Boskor
Market
1565 101 244 205 174 472 82 66 49 235 419 302 285 116 10 4300
36.4
0%
2.3
5%
5.6
7%
4.7
7%
4.0
5%
10.9
8%
1.9
1%
1.53
%
1.1
4%
5.4
7%
9.74
%
7.0
2%
6.6
3%
2.7
0%
0.2
3%
Hourly Variation of Traffic
7.6- Traffic volume count was conducted in both directions for simultaneously, for 14 hours. The
hourly count was compiled by adding traffic counts of both sides to get the hourly variation of traffic
for each survey location. The graph showing hourly variation for each location is given in Fig 7.1.1.
Peak hour traffic for all the locations from 7am to 10 am and 3pm to 5pm is 46.02% of the actual 14
hour PCU counts in ADT, It is quite normal for intercity roads because of high percentage of regional
traffic movement of freight traffic on the road. This results in traffic flows to be uniformly distributed
over the main 16-20 hours of the day.

Chapter 7
Page 79
TABLE 7.1.6: SUMMARY OF HOURLY COUNTS (PCUs)
Time
6h
to
7h
7h
to
8h
8h
to
9h
9h
to
10
h
10
h t
o 1
1h
11
h t
o 1
2h
12
h t
o 1
3h
13
h t
o 1
4h
14
h t
o 1
5h
15
h t
o 1
6h
16
h t
o 1
7h
17
h t
o 1
8h
20
h t
o 2
1h
21
h t
o 2
2h
22
h t
o 2
3h
Gra
nd
To
tal
Total TC Both side 2
17
54
2
47
4
39
3
37
3
30
0
34
4
27
6
25
6
28
0
34
7
40
8
20
1
12
1
11
1
44
24
Fig 7.1.1
Overall Result of the Community Survey
7.7- The community survey questionnaire was designed to obtain information on the benefits of
the rehabilitated national roads was structured in to 10 questions. Question 1&2 basically cover the
details of the respondents whereas questions 3 to 10 are directly related to the qualitative benefits
enjoyed by the road users and road neighbours. These questions provide multiple choices. The
responses the community from the 40 samples, 10 each in 4 categories are summarised in the table
below:
Passenger Cost Unit (PCU)
At Busknor Market, Chamkar Leu District (Bidthdirecton ), NR.71, PK:118+500

Chapter 7
Page 80
TABLE 7.1.6: SUMMARY OF COMMUNITY DATA SURVEY NR 71
No. Question
Road No. NR.71
Location Bos
Khnor
3 In the family
Member in family M 71
F 66
No. of Children M 50
F 57
4 Vehicle owner ship
Motorbike 21
Car 3
Scooter 16
Lorry / Etan 1
Others, (bicycle) 0
Km/mon. 7560
5 Use of Public/Private
Transport
Bus 10
Car 12
Others ( Motor taxi, 1
6 Main Occupation
of family
Agriculture 15
Service 13
Business 12
7 Family income (Monthly) USD/Riels
Minimum $ 120
Maximum $ 5,000
Average $ 996
8 Benefit of the road project
Quality Travel (comfort level)
Excellent 0
very Good 36
Good 3
Poor 1
Saving in transportation cost compared to 2008
Lower 5 (13%)
Somewhat lower 1 (3%)
No Change 5 (13%)
Over 29 (73%)
Excess to public transport compared to
2008
Better 1
Somewhat better 38
No Change 1
9 Travel of school
children by
Distance (km)
Minimum 0.3
Maximum 10
Mean 2.47
By Walk Percentage 11.50%
By Personal vehicle including bicycle
Yes 88.50%

Chapter 7
Page 81
By Bus Yes 0.00%
By Others Yes 0.00%
10
How road project
benefited your family
business?
Availability of goods in the market
Better 39
Somewhat better 1
Easy to carry goods for sale in the market
Better 39
Somewhat better 1
Easy excess to market Better 39
Somewhat better 1
Response to Vehicle ownership and Km Travel
7.7.1- Each of the target groups interviewed show that on an average every family had one
motorised vehicle (motorcycle or car, scooter, lorry or etan) and large number of them had bicycles
as an alternate. 40 samples interviewed show extensive total travel of 6900 Kms to 11050 kms on
NR7 per month. The average travel at the individual family level is of the order of 224 kms.
Use of Public and Private Transport
6.7.2- In the sample 0f 80 on NR71, it has been observed that 25% of the families are using bus,
30% use private transport car whereas 20% use other means of travel such as motorcycle, taxi etc.
Main Occupation of Road Neighbours
6.7.3- It has been observed that nearly 37.5% of the population in the road neighbouring areas at
the study locations on NR71 were in agriculture, about 30% in business and balance 32.5% in service
(as an employee or running service centres, repairs of vehicles, petrol pumps etc.).
Family Income
7.7.4- Most of the respondents reported increase income in their income levels compared to level
in 2008-9. The average monthly income of neighbouring families is reported to be about US$996 at
the surveyed location of the national road. However, it varies from a minimum of US$120 to a
maximum of US$5,000 per month.
Benefit of the Road Rehabilitation Project
Quality of Travel
7.7.5.1- 0 % of the people rated quality of travel as excellent, 90 %have rated quality of travel as very
good, 7.5% have rated good, and only 2.5% have rated poor. Poor rating by some respondents are
obvious as the rehabilitation work is still in progress in some sections of the on-going projects.
Chapter 7
Page 82
Saving in Transportation Cost
7.7.5.2- Compared to the travel costs in 2008-9, 12.5% of the respondents have reported lower
travel costs, 2.5% have reported somewhat lower travel costs, 12.5% have reported no change in
travel cost and 72.5% have reported increase in travel costs.
Excess to Public Transport
7.7.5.3- On the Section of the road surveyed, 2.5% respondents have reported better availability of
public transport, 95% have reported somewhat better and about 2.5% have reported no change.
Travel of School Children
Distance Travelled
7.7.5.4- On the overall, children living in the neighbourhood of the national roads travel from
minimum of 0.3 km to a maximum of 10 Km for going to their schools. This gives an average distance
of about 2.47 km, the school children travel.
Children Walking to School
7.7.5.5- Out of the total school going children living in the neighbourhood of NR71 nation road about
11.5% travels to their schools by walk.
Children Using Personal Vehicles
7.7.5.6- Out of the total school going children living in the neighbourhood of various nation roads
about 88.5% travels to their schools by their personal vehicles.
Children going to School by Bus
7.7.5.7- Out of the total school going children living in the neighbourhood of nation road, no one
travels to their schools by bus.
Travel by other means
7.7.5.8- Out of the total school going children living in the neighbourhood of nation road, no one
travels to their schools by other means.
How Road Project Benefited Family Business
Availability Good in the Market
7.7.5.9- Majority of the respondents (97.5%) reported better availability of goods and services and
2.5 of the families reported somewhat better.
Easy to carry Goods to the Market
7.7.5.10- Most respondents (97.5%) have reported better availability of transport means to carry
goods to the market because of good roads and 2.5% reported somewhat better.

Chapter 7
Page 83
Easy Excess to Market
7.7.5.11- Majority of the respondents (97.5) have reported better excess to marketand 2.5%
reported somewhat better.
Average Trip KM Travel
7.8.1- The average trip length has been divided into 5 segments from 0-20 km, 21 -50 km, 51-100
km, 101-200 km, 201 km and above for study of the trip km of all categories of vehicles. Two
separate tables have generated for passenger and commercial vehicles. These Tables are
summarized below.The trip pattern for passenger and commercial vehicles are given in Table 6.1.8
and Table6.1.9 along with their graphical presentation.
7.8.1.1- Among the passenger vehicle samples, nearly 41.5% fall in the long range travel of 101-200
km, 24.4% had average trip length of 51-100 Km, 15% had average trip length in the range of 0-
20Km, and 12% had travel length of 201 Km and above and about 7% had travel length of 21-50 Km.
Table 7.1.8 Distribution of Average Trip KM Travel of Passenger Vehicles
Vehicle Code
Vehicle Type 0-20 Km 21-50 Km 51-100 Km 101-200 Km
201-and Above Km
3 Motor Cycle
4 3 wheeler(TukTuk) 1 3
5 Car 1 2 3 4 2
6 Jeep/4WD 1
7 Pickup 1 2
8 Minibus 5 1 3 8 2
9 Bus 1 1 1 1
0
1
2
3
4
5
6
7
8
9
0-20 Km 21-50Km 51-100Km 101-200Km 201-andAboveKm
No
. of
Sam
ple
of
Ve
hic
le
Kilometer Range
Trip Lenght Passenger Vehicle
Motor Cycle
3 wheeler(TukTuk)
Car
Jeep/4WD
Pickup
Minibus
Bus

Chapter 7
Page 84
7.8.1.2- Among the commercial vehicle samples, nearly 60% fall in the long range travel of 51-100 km, 25% had average trip length of 21-50 Km, 10% had average trip length in the range of 101-200 Km, and another about 5% had trip length of 0-20 Km.
Table 7.1.9 Distribution of Average Trip KM Travel of Commercial Vehicles
Vehicle Code
Vehicle Type 0-20 Km 21-50Km 51-100Km 101-200Km 201-and Above, Km
10 Koyan small
11 Koyan large 1 2 1
12 Light Truck 2 4
13 Medium Truck 1 3 2
14 HT Rigid 3Axle 1
15 HT Rigid 4/5 Axle 1
16 HT Semi T 4/5 Axle 2
17 HT Semi T 6Axle
Vehicle-wise Commodity Distribution
7.8.1.3- Among the Light Goods Vehicles (LGVs), maximum number of LGVs (35.7%) was
found to be carrying grocery and perishables, 28.5 % LGVs carried industrial products, 14% LGVs
carried cloths and home articles and 21% carried building materials. Among the high tonnage
vehicles (HTVs), 100 carried agricultural, and food products. The Table 7.1.10 summarises the
movement of the goods on NR71.
0
0.5
1
1.5
2
2.5
3
3.5
4
4.5
0-20 Km 21-50Km 51-100Km 101-200Km 201-andAboveKm
No
. of
Sam
ple
of
Ve
hic
le
Kilometer Range
Trip Lenght Passenger Vehicle
Koyan small
Koyan large
Light Truck
Medium Truck
HT Rigid 3Axle
HT Rigid 4/5 Axle
HT Semi T 4/5 Axle
HT Semi T 6Axle
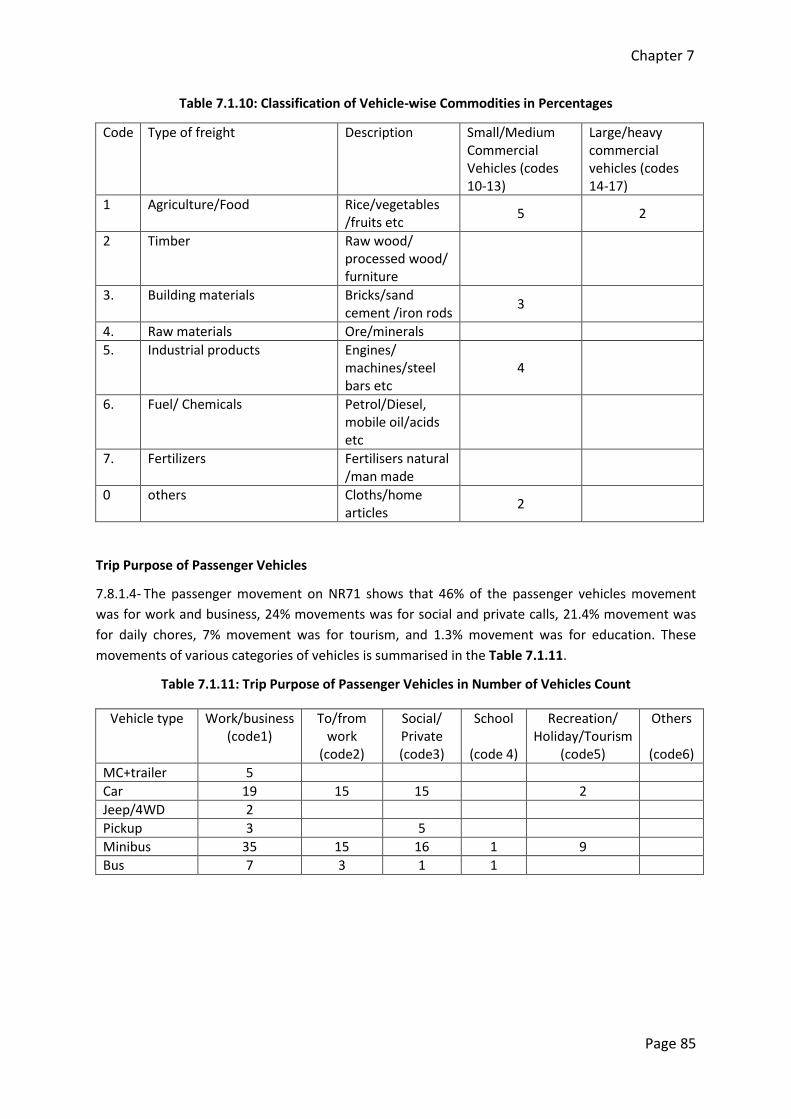
Chapter 7
Page 85
Table 7.1.10: Classification of Vehicle-wise Commodities in Percentages
Code Type of freight Description Small/Medium Commercial Vehicles (codes 10-13)
Large/heavy commercial vehicles (codes 14-17)
1 Agriculture/Food Rice/vegetables /fruits etc
5 2
2 Timber Raw wood/ processed wood/ furniture
3. Building materials Bricks/sand cement /iron rods
3
4. Raw materials Ore/minerals
5. Industrial products Engines/ machines/steel bars etc
4
6. Fuel/ Chemicals Petrol/Diesel, mobile oil/acids etc
7. Fertilizers Fertilisers natural /man made
0 others Cloths/home articles
2
Trip Purpose of Passenger Vehicles
7.8.1.4- The passenger movement on NR71 shows that 46% of the passenger vehicles movement
was for work and business, 24% movements was for social and private calls, 21.4% movement was
for daily chores, 7% movement was for tourism, and 1.3% movement was for education. These
movements of various categories of vehicles is summarised in the Table 7.1.11.
Table 7.1.11: Trip Purpose of Passenger Vehicles in Number of Vehicles Count
Vehicle type Work/business (code1)
To/from work
(code2)
Social/ Private (code3)
School
(code 4)
Recreation/ Holiday/Tourism
(code5)
Others
(code6)
MC+trailer 5
Car 19 15 15 2
Jeep/4WD 2
Pickup 3 5
Minibus 35 15 16 1 9
Bus 7 3 1 1

Chapter 7
Page 86
Provincial Movements
7.8.1.5- In order to assess the movement pattern on the project influence area the province and
adjoining province were studied keeping in view the major generation and attraction points in the
area. Following O-D movements on the national roads NR73 are given in the Table 10.1.12. It may be
seen that 71% of the samples had origin and destination with in the province whereas 29% had OD
outside the province by majority of them originate from Phnom Penh, Kampong Cham, Siem Reap
and Speu with destinations such as Kampong Cham , Phnom Penh, Rattanakiri, Vietnam, etc.
Table 7.1.12 Inter- Provincial Movement of Traffic
NR 71 Locations: Busknor
Movement within the same province Movement to other provinces
Origin Destination Origin Destination
Busknor Kampong Cham city Kampong Cham Phnom Penh
Chamkar Leu Beung Kuk Kampong Cham Rattanakiri
Chamkar Leu Busknor Kampong Thom Kampong Cham
Chamkar Leu Chub Siem Reap Phnom Penh
Chamkar Leu Kampong Cham city Kampong Cham Banteay Mean Chey
Chamkar Leu Thnol Tou Teung Kampong Cham Kampong Thom
Speu Dey Dos Kampong Cham Preah Vihea
Speu Kampong Cham Banteay Meanchey Kampong Cham
Speu Thnol TouTeung Kampong Speu Kampong Cham
Beung Kuk Busknor Phnom Penh Kampong Cham
Beung Kuk Chamkra Leu Phnom Penh Kampong Cham
Beung Kuk Speu
Beung Kuk Srea Veal
Busknor Busknor
Kampong Cham Busknor
Kampong Cham Srea Veal
Kampong Cham Ta Ung
Memuth Chamkar Leu
Andoung Chraa Busknor
Ponhea Kreak Busknor
Spean Kysona Srea Veal
Spean Kysona Busknor
Spean Kysona Chamkar Leu
Wat Angkor Chamkar Leu
Wat Angkor Srea Veal
Kampong Cham ChamKar Leu
Chamkar Leu Kampong Cham

Chapter 7
Page 87
Occupancy Survey
7.8.1.6- Passenger Occupancy survey was done for 14 hour duration (from 7:00 am to 6:00 pm and
8pm to 11pm) at Bosknor. The Table 7.1.13 gives the mode-wise average occupancy at survey
location. The passenger vehicles in the sample show high level of occupancies and thus high
utilization of capacity.
Table 7.1.13: Average Occupancy of Passenger Carrying Vehicles
Survey Locations Bus Mini
Bus
3
wheeler
2
wheeler/trailer
car Jeep/4WD Pick-
up
Bosknor 16.08 26.65 3 2.6 66.08 2 3.6

Chapter 8
Page 88
Chapter 8-Baseline Survey Report of NR-72
Location and Road – wise Survey Report
NR 72-PK K 192.900
Average Daily Traffic (ADT)
8.1- The average daily traffic was computed for various locations where the mid-block volume
count survey was done. Daily traffic volumes were averaged to find the Average Daily Traffic (ADT).
Further, the ADT was also converted to PCUs using the conversion factors given in Table 2.1.1.
Location wise and mode wise ADT values are given in Table 8.1.1 below. Also the peak hour and
peak hour proportion of total daily traffic (over average 14-hour volume count) was identified and is
given in Table 8.1.2.
8.1.1- Traffic volume count data at each location was counted on hourly basis on both sides of the road to determine Average Daily Traffic (ADT). Traffic volume count data and summary sheets for various locations are presented in Appendix III (a). The location wise ADT in vehicles and PCUs are
presented in the Table 8.1.3 below.
Peak Hour Traffic in 14 hour count
8.1.2- The analysis of the traffic flows on the NR71 national road shows that peak hour movement is 41.38% in actual 14 hour counts and in terms of PCUs 40.51%. Lower PCU percentage means that traffic counts constitute higher no of motor cycles and passenger vehicles compared to heavy trucks and commercial vehicles.
Table 8.1.1: 14 hour Traffic Count
Station
ID No.
Chainage
(km) Location of Survey
ADT Peak Hour Flows,
7- 10am & 4-6Pm
Peak Hour
proportion in
daily Vehicle
Vol.
Peak Hour
proportion
in daily PCU
Vol. Vehi. PCUs Vehi. PCUs
NR 72 PK 192.900 In front of Grand
Hotel & Casino 3484 3404 1442 1379 41.38% 40.51%
24 Hour Adjusted Average Daily Traffic
8.1.3- The traffic count of 14 hours has been adjusted by multiplying the total count by the adjustment factor of 1.16 (calculated on the basis of the calculations in the Appendix VI).
Table 8.1.2: 24 hour Adjusted Average Daily Traffic
Station
ID No.
Chainage
(km) Location of Survey
ADT Peak Hour Flows,
7- 10am & 3-5Pm
Peak Hour
proportion in
daily Vehicle
Vol.
Peak Hour
proportion
in daily
PCU Vol. Vehi. PCUs Vehi. PCUs
NR 72 PK 192.900 In front of Grand
Hotel & Casino 4041 3949 1442 1379 35.96% 34.92%

Chapter 8
Page 89
Annual Average Daily Traffic (AADT)
8.2- The Annual Average Daily Traffic (AADT) is calculated by multiplying ADT with a seasonality factor. Seasonal variation factors by vehicle types are required to account for variations in the pattern of traffic volume on the sections of project road over different months or seasons of the year. There are various methods of determining the seasonality factor. The most direct method is using the past traffic counts, if traffic surveys are carried out round the year. But in Cambodia, round the year counts are seldom carried out for any road. Continuous automatic counting carried out on National roads does show a seasonal pattern; with peak traffic in January/ February and low traffic in August/September. There is some effect rain and flooding. These factors show that traffic levels are usually below the AADT during the period July to November, with lowest traffic levels in August. Since the traffic counts were carried out in April-May 2012, when there is no impact of the seasonal factors, therefore the traffic counts are very close to AADT. Hence there is no need to apply seasonal factor. This is only for creating baseline data for comparison with the count in the same period in 2013 to know the impact of the RAMP. The Peak hour constitute 35.96% of ADT in terms of vehicles where as it is 34.92% in PCUsADT.
Table 8.1.3: 24 hour Adjusted Annual Average Daily Traffic (AADT)
Station ID
No.
Chainage
(km) Location of Survey
ADT Peak Hour Flows Peak Hour
proportion
in daily
Vehicle Vol.
Peak Hour
proportion in
daily PCU Vol. Vehi. PCUs Vehi. PCUs
NR 72 PK 192.900 Infront of Grand
Hotel & Casino 4041 3949 1442 1379 35.96% 34.92%
OverallComposition of Traffic
8.3- The composition of traffic, for various modes, was worked out from the traffic volume count
data. Along the project stretch the share of passenger traffic is 59.0%, whereas goods traffic is
41.0%. Share of 2/3 axle truck is 16.0% of total traffic. Along the project stretch it can be observed
that share of two wheelers alone is 34.9%. The share of car and jeep/van is 16.3% of total traffic
along the project stretch.
Table 8.1.4: 14 Hour Percentage Composition of Traffic (PCUs)
Stat
ion
No
.
Ch
ain
age
(km
)
Loca
tio
n o
f Su
rve
y
Mo
tor
Cyc
le
Thre
e W
he
ele
r/Tu
k Tu
k
Car
Min
i Bu
s
Bu
s
LGV
(Ko
un
/ Es
tan
) sm
all
LGV
(Ko
un
/ Es
tan
) la
rge
Truck To
tal
Jee
p/4
wd
Pic
k-u
p
2 A
xle
lig
ht
3 A
xle
Me
diu
m
3ax
le h
eav
y
Mu
lti a
xle
4 r
igid
Mu
lti-
axle
tra
ilers
5
Mu
lti-
axle
tra
iler
he
avy
6
MC
C-8
NR 72-PK
192.900
In front of
Grand Hotel
& Casino
1187 129 277 179 100 107 30 137 42 38 326 182 410 229 32 3405
34.8
6%
3.79
%
8.1
4%
5.2
6%
2.9
4%
3.14
%
0.8
8%
4.02
%
1.2
3%
1.1
2%
9.5
7%
5.3
5%
12.
04
%
6.7
3%
0.9
4%

Chapter 8
Page 90
Table 8.1.5: 24 Hour Adjusted Composition of Traffic St
atio
n N
o.
Ch
ain
age
(km
)
Loca
tio
n o
f Su
rve
y
Mo
tor
Cyc
le
Thre
e W
he
ele
r/Tu
kTu
k
Car
Min
i Bu
s
Bu
s
LGV
(Ko
un
/ Es
tan
) sm
all
LGV
(Ko
un
/ Es
tan
) la
rge
Truck
Tota
l
Jee
p/4
wd
Pic
kup
2 A
xle
lig
ht
3 A
xle
Me
diu
m
3ax
le h
eav
y
Mu
lti a
xle
4 r
igid
Mu
lti-
axle
tra
ilers
5
Mu
lti-
axle
tra
iler
he
avy
6
MC
C-8
NR 72-PK
192.900
In front of
Grand Hotel
& Casino
1377 150 321 208 116 124 35 158 49 45 378 211 476 266 37 3951
34.8
5%
3.8
0%
8.1
2%
5.2
6%
2.9
4%
3.14
%
0.8
9%
4.00
%
1.2
4%
1.1
4%
9.57
%
5.3
4%
12.
05
%
6.7
3%
0.9
4%
Hourly Variation of Traffic
8.4- Traffic volume count was conducted in both directions for simultaneously, for 14 hours. The hourly count was compiled by adding traffic counts of both sides to get the hourly variation of traffic for each survey location. The graph showing hourly variation for each location is given in Figure. Peak hour traffic for all the locations from 7am to 10 am and 3pm to 5pm is found to be between 34.92% to 73.789% of the actual 14 hour PCU counts in ADT, and in 24 hour adjusted PCU it varies between that is quite normal for intercity roads because of high percentage of regional traffic movement of freight traffic on the road. This results in traffic flows to be uniformly distributed over the main 18-20 hours of the day.
TABLE 8.1.6 -SUMMARY OF HOURLY COUNTS (PCUs)
Time
6h
to
7h
7h
to
8h
8h
to
9h
9h
to
10
h
10
h t
o 1
1h
11
h t
o 1
2h
12
h t
o 1
3h
13
h t
o 1
4h
14
h t
o 1
5h
15
h t
o 1
6h
16
h t
o 1
7h
17
h t
o 1
8h
20
h t
o 2
1h
21
h t
o 2
2h
22
h t
o 2
3h
Gra
nd
To
tal
Total TC
Both side
11
2.4
28
1
19
5
23
6.5
28
3
27
7.5
35
6.5
31
9
24
1.5
32
7
34
0.5
28
1
14
4
60
62
34
04
.5

Chapter 8
Page 91
Overall Result of the Community Survey
8.5- The community survey questionnaire was designed to obtain information on the benefits of
the rehabilitated national roads was structured in to 10 questions. Question 1&2 basically cover the
details of the respondents whereas questions 3 to 10 are directly related to the qualitative benefits
enjoyed by the road users and road neighbours. These questions provide multiple choices. The
responses the community from the 40 samples, 10 each in 4 categories are summarised in the table
below:
TABLE 8.1.7 -SUMMARY OF COMMUNITY DATA SURVEY NR 72
No. Question
Road No. NR.72
Location Trapeng Thlong
3 In the family
Member in family M 61
F 74
No. of Children M 30
F 23
4 Vehicle owner ship Motorbike 19
Car 2

Chapter 8
Page 92
Scooter 1
Lorry / Etan 6
Others, (bicycle) 14
Km/mon. 8940
5 Use of Public/Private
Transport
Bus 10
Car 25
Others ( Motor taxi, 7
6 Main Occupation
of family
Agriculture 17
Service 13
Business 10
7 Family income (Monthly) USD/Riels
Minimum $ 50
Maximum $ 5,750
Average $ 748
8 Benefit of the road project
Quality Travel (comfort level)
Excellent 12
very Good 17
Good 11
Poor 0
Saving in transportation cost compared to 2008
Lower 17 (43%)
Somewhat lower 14 (35%)
No Change 9 (23%)
Over 0 (0%)
Excess to public transport compared to
2008
Better 28
Somewhat better 10
No Change 2
9 Travel of school
children by
Distance (km)
Minimum 0.2
Maximum 5
Mean 0.78
By Walk Percentage 16.00%
By Personal vehicle including bicycle
Yes 84.00%
By Bus Yes 0.00%
By Others Yes 0.00%
10
How road project
benefited your family
business?
Availability of goods in the market
Better 40
Somewhat better 0
Easy to carry goods for sale in the market
Better 39
Somewhat better 1
Easy excess to market Better 40
Somewhat better 0
Response to Vehicle ownership and Km Travel

Chapter 8
Page 93
8.6.1- Each of the target groups interviewed show that on an average every family had one
motorised vehicle (motor cycle or car, scooter, lorry or etan) and large number of them had bicycles
as an alternate. 40 samples interviewed show extensive travel of 8940 Kms on NR72 per month. The
average travel at the individual family level is of the order of 224 km.
Use of Public and Private Transport
8.6.2- In the sample 0f 80 on NR72, it has been observed that 25% of the families are using bus,
62.5% use private transport car whereas 17.5% use other means of travel such as motorcycle, taxi
etc.
Main Occupation of Road Neighbours
8.6.3- It has been observed that nearly 42.5% of the population in the road neighbouring areas at
the study locations on NR72 were in agriculture, about 25% in business and balance 32.5% in service
(as an employee or running service centres, repairs of vehicles, petrol pumps etc.).
Family Income
8.6.4- Most of the respondents reported increase income in their income levels compared to level
in 2008-9. The average monthly income of neighbouring families is reported to be about US$748 at
the surveyed location of the national road. However, it varies from a minimum of US$50 to a
maximum of US$5,750 per month.
Benefit of the Road Rehabilitation Project
Quality of Travel
8.6.5- 30% of the people rated quality of travel as excellent, 42.5%have rated quality of travel as
very good, 27.5% have rated good, and no family has rated poor.
Saving in Transportation Cost
8.6.6- Compared to the travel costs in 2008-9, 42.5% of the respondents have reported lower
travel costs, 35% have reported somewhat lower travel costs, and 22.5% have reported no change in
travel cost.
Excess to Public Transport
8.6.7- On the Section of the road surveyed, 70% respondents have reported better availability of
public transport, 25% have reported somewhat better and about 5% have reported no change.
Travel of School Children
Distance Travelled
8.6.8- On the overall, children living in the neighbourhood of the national roads travel from
minimum of 0.2 km to a maximum of 5 Km for going to their schools. This gives an average distance
of about 0.78 km, the school children travel.

Chapter 8
Page 94
Children Walking to School
8.6.9- Out of the total school going children living in the neighbourhood of NR72 nation road about
16% travels to their schools by walk.
Children Using Personal Vehicles
8.6.10- Out of the total school going children living in the neighbourhood of various nation roads
about 84% travels to their schools by their personal vehicles.
Children going to School by Bus
8.6.11- Out of the total school going children living in the neighbourhood of nation road, no one
travels to their schools by bus.
Travel by other means
8.6.12- Out of the total school going children living in the neighbourhood of nation road, no one
travels to their schools by other means.
How Road Project Benefited Family Business
Availability Good in the Market
8.6.13- Majority of the respondents (100%) reported better availability of goods and services. Easy
to carry Goods to the Market
8.6.14- Most respondents (100%) have reported better availability of transport means to carry
goods to the market because of good roads.
Easy Excess to Market
8.6.15- Majority of the respondents (97.5) have reported better excess to marketand 2.5% reported
somewhat better.
Average Trip KM Travel
8.7.1- The average trip length has been divided into 5 segments from 0-20 km, 21 -50 km, 51-100 km, 101-200 km, 201 km and above for study of the trip km of all categories of vehicles. Two separate tables have generated for passenger and commercial vehicles. These Tables are summarized below.The trip pattern for passenger and commercial vehicles are given in Table 8.1.8 and Table8.1.9 along with their graphical presentation.
8.7.1.1- Among the passenger vehicle samples, nearly 14.3% fall in the long range travel of 201 km and above, 47.6% had average trip length of 51-100 Km, 35.7% had average trip length in the range of 0-20 Km and 2.3% fall in the range of 21-50 Km.

Chapter 8
Page 95
Table 8.1.8 Distribution of Average Trip KM Travel of Passenger Vehicles
Vehicle Code
Vehicle Type 0-20 Km 21-50 Km 51-100 Km 101-200 Km
201-and Above, Km
3 Motor Cycle 6 3
4 3 wheeler(TukTuk) 4 6
5 Car 2 4 2
6 Jeep/4WD 2 1 1
7 Pickup 2 1
8 Minibus 1 1
9 Bus 1 3 2
8.7.1.2- Among the commercial vehicle samples, nearly 60.6% fall in the long range travel of 51-100 km, 7.3% had average trip length of 0-20 Km, 6.1% had average trip length in the range of 21-50 Km, and 19.2% had average trip length of 101-200 Km and another about 6.5% had trip length of 201 Km and above.
Table8.1.9 Distribution of Average Trip KM Travel of Commercial Vehicles
Vehicle Code
Vehicle Type 0-20 Km 21-50Km 51-100Km 101-200Km 201-and Above, Km
10 Koyan small 14 3 7 1
11 Koyan large 1 2 3
12 Light Truck 1 1 19 6 2
13 Medium Truck 1 16 3
14 HT Rigid 3Axle 1 4 28 12 1
15 HT Rigid 4/5 Axle 1 46 14 4
16 HT Semi T 4/5 Axle 1 2 23 7 8
17 HT Semi T 6Axle 1 6 4 1
0
1
2
3
4
5
6
7
0-20 Km 21-50Km 51-100Km 101-200Km 201-andAboveKm
No
. of
Sam
ple
of
Ve
hic
le
Kilometer Range
Trip Lenght Passenger Vehicle
Motor Cycle
3 wheeler(TukTuk)
Car
Jeep/4WD
Pickup
Minibus
Bus

Chapter 8
Page 96
Vehicle-wise Commodity Distribution
8.7.1.3- Among the Light Goods Vehicles (LGVs), maximum number of LGVs (97%) was found
to be carrying grocery and perishables, 1.2% each LGVs carried building materials and industrial
products, 0.6% LGVs carried cloths and home articles. Among the high tonnage vehicles (HTVs), 96%
carried agricultural, and food products, 2% carried industrial products, 1.4% carried building
materials and 0.6% carried timber. The Table 8.1.10 summarises the movement of the goods on
NR72.
Table8.1.10: Classification of Vehicle-wise Commodities in Percentages
Code Type of freight Description Small/Medium Commercial Vehicles (codes 10-13)
Large/heavy commercial vehicles (codes 14-17)
1 Agriculture/Food Rice/vegetables /fruits etc
193 138
2 Timber Raw wood/ processed wood/ furniture
1
3. Building materials Bricks/sand cement /iron rods
2 2
4. Raw materials Ore/minerals 0
5. Industrial products Engines/ machines/steel bars etc
2 3
6. Fuel/ Chemicals Petrol/Diesel, mobile oil/acids etc
0
7. Fertilizers Fertilisers natural /man made
0
0 others Cloths/home articles
1
0
5
10
15
20
25
30
35
40
45
50
0-20 Km 21-50Km 51-100Km 101-200Km 201-andAboveKm
No
. of
Sam
ple
of
Ve
hic
le
Kilometer Range
Trip Lenght Passenger Vehicle
Koyan small
Koyan large
Light Truck
Medium Truck
HT Rigid 3Axle
HT Rigid 4/5 Axle
HT Semi T 4/5 Axle
HT Semi T 6Axle

Chapter 8
Page 97
Trip Purpose of Passenger Vehicles
8.7.1.4- The passenger movement on NR72 shows that 56% of the passenger vehicles
movement was for work and business, 18.5% movements was for social and private calls, 7.5%
movement was for daily chores, and 18% movement was for tourism. These movements of various
categories of vehicles is summarised in the Table 8.1.11.
Table 8.1.11: Trip Purpose of Passenger Vehicles in Number of Vehicles Count
Vehicle type
Work/business (code1)
To/from work(code2)
Social/Private (code3)
School (code 4)
Recreation/ Holiday/Tourism (code5)
Others (code6)
MC+trailer 17
Car 5 3 5
Jeep/4WD 4 1 1
Pickup 1 1 3
Minibus 3 2
Bus 7 1 12
Provincial Movements
8.7.1.5- In order to assess the movement pattern on the project influence area the province
and adjoining province were studied keeping in view the major generation and attraction points in
the area. Following O-D movements on the national roads NR73 are given in the Table 8.1.12. It may
be seen that 61% of the samples had origin and destination with in the province whereas 39% had
OD outside the province by majority of them originate from Kampong Chhnang, Phnom Penh,
Vietnam, SteungTreang, Siem Reap and Kratie, with destinations such as Kampong Thom, Siem Reap,
Phnom Penh, Vietnam, etc.
Table 8.1.12 Inter- Provincial Movement of Traffic
NR 72, Location:TrapoeungPhlong
Movement within the same province Movement to other provinces
Origin Destination Origin Destination
Chamkar Leu Tropeng Phlung Kampong Chhnang Vietnam Dambae Tropeng Phlung Kampong Thom Vietnam Chamkar Leu Vietnam Kratie Vietname Dambae Vietnam Modulkiri Vietnam Ponhea Kreak Vietnam Phnom Penh Vietnam Tropeng phlung Vietnam Preah Vihea Vietnam Tropeng Russey Vietnam Rattanakiri Vietnam Vietnam Casino Siem Reap Vietnam Vietnam Chamkar Leu Steung Treang Vietnam Vietnam Chi Kreang Vietnam Battambong Vietnam Chi Mun Market Vietnam Kampong Thom Vietnam Damae Vietnam Phnom Pehn Vietnam Kampong Cham city Vietnam Siem Reap Vietnam Ou Rang Ov Rattanakiri Vietnam Vietnam Ponhea Kreak SteungTreang Vietnam Vietnam Steung Vietnam Kampong Thom

Chapter 8
Page 98
Vietnam Soung Vietnam Siem Reap Vietnam TropengPhlung Casino Vietnam ChamkarLeu Vietnam Dabae Vietnam Kouk Char Vietnam SteungTrong Vietnam Vietnam Kampong Cham Vietnam Chi Kreang Vietnam Kampong Cham city Vietnam Soung
Occupancy Survey
8.7.1.6- Passenger Occupancy survey was done for 14 hour duration (from 7:00 am to 6:00pm and 8pm to 11pm) at Trapoeng Phlong. The Table 8.1.13 gives the mode-wise average occupancy at survey location. The passenger vehicles in the sample show higher level of occupancies and thus high utilization of capacity.
Table 8.1.13: Average Occupancy of Passenger Carrying Vehicles
Survey Locations Bus Mini
Bus
3
wheeler
2
wheeler/trailer
car Jeep/4WD Pick-
up
Trapoeung Phlong 22.1 15.6 2 2 4.6 6 4.3

Chapter 9
Page 99
Chapter 9-Baseline Survey Report of NR-73
Location and Road- wise Survey Report
NR 73 –PK167
Average Daily Traffic (ADT)
9.1- The average daily traffic was computed for various locations where the mid-block volume
count survey was done. Daily traffic volumes were averaged to find the Average Daily Traffic (ADT).
Further, the ADT was also converted to PCUs using the conversion factors given in Table 2.1.1.
Location wise and mode wise ADT values are given in Table 9.1.1 below. Also the peak hour and
peak hour proportion of total daily traffic (over average 14-hour volume count) was identified and is
given in Table 9.1.1.
9.1.1- Traffic volume count data at each location was counted on hourly basis on both sides of the road to determine Average Daily Traffic (ADT). Traffic volume count data and summary sheets for various locations are presented in Appendix III (a). The location wise ADT in vehicles and PCUs are presented in the Table 9.1.3 below.
Peak Hour Traffic in 14 hour count
9.1.2- The analysis of the traffic flows on the NR73 national road shows that peak hour movement is 50.69% in actual 14 hour counts and in terms of PCUs 48.12%. Lower PCU percentage means that traffic counts constitute higher number of motorcycles and passenger vehicles compared to heavy trucks and commercial vehicles.
Table 9.1.1: 14 hour Traffic Count
Station
ID No.
Chainage
(km) Location of Survey
ADT Peak Hour Flows,
7- 10am & 4-6Pm
Peak Hour
proportion in
daily Vehicle
Vol.
Peak Hour
proportion
in daily PCU
Vol. Vehi. PCUs Vehi. PCUs
NR 73 PK 167
At Bunty TV shop, 1
km from Dombae
Round about (
south)
4622 3870 2190 1694 47.38% 43.77%
24 Hour Adjusted Average Daily Traffic
9.1.3- The traffic count of 14 hours has been adjusted by multiplying the total count by the adjustment factor of 1.16 (calculated on the basis of the calculations in the Appendix VI).
Table 9.1.2: 24 hour Adjusted Average Daily Traffic
Station
ID No.
Chainage
(km) Location of Survey
ADT Peak Hour Flows,
7- 10am & 3-5Pm
Peak Hour
proportion in
daily Vehicle
Vol.
Peak Hour
proportion
in daily
PCU Vol. Vehi. PCUs Vehi. PCUs
NR 73 PK 167
At Bunty TV shop,
1 km from
Dombae Round
about ( south)
5361 4489 2190 1694 40.85% 37.73%
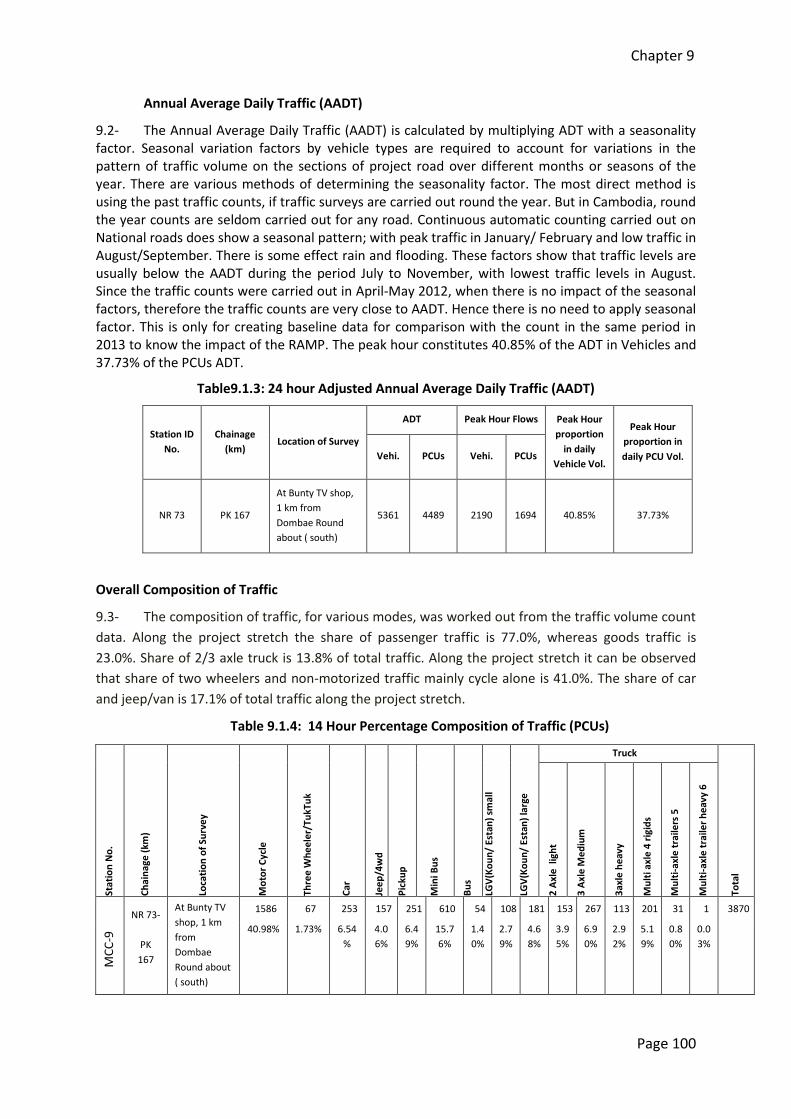
Chapter 9
Page 100
Annual Average Daily Traffic (AADT)
9.2- The Annual Average Daily Traffic (AADT) is calculated by multiplying ADT with a seasonality factor. Seasonal variation factors by vehicle types are required to account for variations in the pattern of traffic volume on the sections of project road over different months or seasons of the year. There are various methods of determining the seasonality factor. The most direct method is using the past traffic counts, if traffic surveys are carried out round the year. But in Cambodia, round the year counts are seldom carried out for any road. Continuous automatic counting carried out on National roads does show a seasonal pattern; with peak traffic in January/ February and low traffic in August/September. There is some effect rain and flooding. These factors show that traffic levels are usually below the AADT during the period July to November, with lowest traffic levels in August. Since the traffic counts were carried out in April-May 2012, when there is no impact of the seasonal factors, therefore the traffic counts are very close to AADT. Hence there is no need to apply seasonal factor. This is only for creating baseline data for comparison with the count in the same period in 2013 to know the impact of the RAMP. The peak hour constitutes 40.85% of the ADT in Vehicles and 37.73% of the PCUs ADT.
Table9.1.3: 24 hour Adjusted Annual Average Daily Traffic (AADT)
Station ID
No.
Chainage
(km) Location of Survey
ADT Peak Hour Flows Peak Hour
proportion
in daily
Vehicle Vol.
Peak Hour
proportion in
daily PCU Vol. Vehi. PCUs Vehi. PCUs
NR 73 PK 167
At Bunty TV shop,
1 km from
Dombae Round
about ( south)
5361 4489 2190 1694 40.85% 37.73%
Overall Composition of Traffic
9.3- The composition of traffic, for various modes, was worked out from the traffic volume count
data. Along the project stretch the share of passenger traffic is 77.0%, whereas goods traffic is
23.0%. Share of 2/3 axle truck is 13.8% of total traffic. Along the project stretch it can be observed
that share of two wheelers and non-motorized traffic mainly cycle alone is 41.0%. The share of car
and jeep/van is 17.1% of total traffic along the project stretch.
Table 9.1.4: 14 Hour Percentage Composition of Traffic (PCUs)
Stat
ion
No
.
Ch
ain
age
(km
)
Loca
tio
n o
f Su
rve
y
Mo
tor
Cyc
le
Thre
e W
he
ele
r/Tu
kTu
k
Car
Min
i Bu
s
Bu
s
LGV
(Ko
un
/ Es
tan
) sm
all
LGV
(Ko
un
/ Es
tan
) la
rge
Truck
Tota
l
Jee
p/4
wd
Pic
kup
2 A
xle
lig
ht
3 A
xle
Me
diu
m
3ax
le h
eav
y
Mu
lti a
xle
4 r
igid
s
Mu
lti-
axle
tra
ilers
5
Mu
lti-
axle
tra
iler
he
avy
6
MC
C-9
NR 73-
PK
167
At Bunty TV
shop, 1 km
from
Dombae
Round about
( south)
1586 67 253 157 251 610 54 108 181 153 267 113 201 31 1 3870
40.98% 1.73% 6.54
%
4.0
6%
6.4
9%
15.7
6%
1.4
0%
2.7
9%
4.6
8%
3.9
5%
6.9
0%
2.9
2%
5.1
9%
0.8
0%
0.0
3%

Chapter 9
Page 101
Table 9.1.5: 24 Hour Adjusted Composition of Traffic
Stat
ion
No
.
Ch
ain
age
(km
)
Loca
tio
n o
f Su
rve
y
Mo
tor
Cyc
le
Thre
e W
he
ele
r/Tu
kTu
k
Car
Min
i Bu
s
Bu
s
LGV
(Ko
un
/ Es
tan
) sm
all
LGV
(Ko
un
/ Es
tan
) la
rge
Truck
Tota
l
Jee
p/4
wd
Pic
kup
2 A
xle
lig
ht
3 A
xle
Me
diu
m
3ax
le h
eav
y
Mu
lti a
xle
4 r
igid
s
Mu
lti-
axle
tra
ilers
5
Mu
lti-
axle
tra
iler
he
avy
6
MC
C-9
NR 73-
PK 167
At Bunty TV
shop, 1 km
from Dombae
Round about
( south)
1840 78 293 182 291 708 63 125 20 178 310 131 233 37 1 4490
40.9
8%
1.7
4%
6.5
3%
4.0
5%
6.4
8%
15.7
7%
1.4
0%
2.78
%
0.4
5%
3.9
6%
6.90
%
2.9
2%
5.1
9%
0.8
2%
0.0
2%
Hourly Variation of Traffic
9.4- Traffic volume count was conducted in both directions for simultaneously, for 14 hours. The hourly count was compiled by adding traffic counts of both sides to get the hourly variation of traffic for each survey location. The graph showing hourly variation for each location is given in Fig 9.1.1. Peak hour traffic for all the locations from 7am to 10 am and 3pm to 5pm is 43.7 the actual 14 hour PCU counts in ADT and in 24 hour adjusted PCU.It is quite normal for intercity roads because of high percentage of regional traffic movement of freight traffic on the road. This results in traffic flows to be uniformly distributed over the main 16-20 hours of the day.
TABLE 9.1.6 -SUMMARY OF HOURLY COUNTS (PCUs)
Time
6h
to
7h
7h
to
8h
8h
to
9h
9h
to
10
h
10
h t
o 1
1h
11
h t
o 1
2h
12
h t
o 1
3h
13
h t
o 1
4h
14
h t
o 1
5h
15
h t
o 1
6h
16
h t
o 1
7h
17
h t
o 1
8h
20
h t
o 2
1h
21
h t
o 2
2h
22
h t
o 2
3h
Gra
nd
To
tal
Total TC Both side 1
46.2
365
.5
368
.5
347
.5
359
356
326
351
.5
311
.5
293
319
.5
314
.5
98
43
16
386
9.5

Chapter 9
Page 102
Overall Result of the Community Survey
9.5- The community survey questionnaire was designed to obtain information on the benefits of
the rehabilitated national roads was structured in to 10 questions. Question 1&2 basically cover the
details of the respondents whereas questions 3 to 10 are directly related to the qualitative benefits
enjoyed by the road users and road neighbors. These questions provide multiple choices. The
responses the community from the 40 samples, 10 each in 4 categories are summarized in the table
below:
TABLE 9.1.7 SUMMARY OF COMMUNITY DATA SURVEY NR 73
No. Question Road No. NR.73
Location Dambae
3 In the family
Member in family M 86
F 78
No. of Children M 45
F 44
4 Vehicle ownership
Motorbike 33
Car 2
Scooter 0
Lorry / Etan 2

Chapter 9
Page 103
Others, (bicycle) 21
Km/mon. 5870
5 Use of Public/Private
Transport
Bus 1
Car 19
Others ( Motor taxi, 37
6 Main Occupation
of family
Agriculture 14
Service 19
Business 7
7 Family income (Monthly) USD/Riels
Minimum $ 100
Maximum $ 750
Average $ 232
8 Benefit of the road project
Quality Travel (comfort level)
Excellent 2
very Good 27
Good 11
Poor 0
Saving in transportation
cost compared to 2008
Lower 29 (73%)
Somewhat lower 10 (25%)
No Change 1 (3%)
Over 0 (0%)
Excess to public transport compared to
2008
Better 33
Somewhat better 7
No Change 0
9 Travel of
school children by
Distance (km)
Minimum 0.25
Maximum 3
Mean 0.93
By Walk Percentage 3.30%
By Personal vehicle including bicycle
Yes 96.70%
By Bus Yes 0.00%
By Others Yes 0.00%
10
How road project
benefited your family
business?
Availability of goods in the market
Better 40
Somewhat better 0
Easy to carry goods for sale in the market
Better 39
Somewhat better 1
Easy excess to market Better 39
Somewhat better 1

Chapter 9
Page 104
Response to Vehicle ownership and Km Travel
9.5.1- Each of the target groups interviewed show that on an average every family had one
motorized vehicle (motorcycle or car, scooter, lorry or etan) and large number of them had bicycles
as an alternate. 40 samples interviewed show travel of 5870 Km on NR73 per month. The average
travel at the individual family level is of the order of 146 kms.
Use of Public and Private Transport
9.5.1.1- In the sample 0f 40 on NR73, it has been observed that 2.5% of the families are using
bus, 47.5% use private transport car whereas 50% use other means of travel such as motorcycle, taxi
etc.
Main occupation of Road Neighbors
9.5.1.2- It has been observed that nearly 35.5% of the population in the road neighboring
areas at the study locations on NR73 were in agriculture, about 17.5% in business and balance 47.5%
in service (as an employee or running service centers, repairs of vehicles, petrol pumps etc.).
Family Income
9.5.1.3- Most of the respondents reported increase income in their income levels compared
to level in 2008-9. The average monthly income of neighboring families is reported to be about
US$232 at the surveyed location of the national road. However, it varies from a minimum of US$100
to a maximum of US$750 per month.
Benefit of the Road Rehabilitation Project
Quality of Travel
9.5.1.4- 5% of the people rated quality of travel as excellent, 67.5%have rated quality of
travel as very good, 27.5% have rated good, and none has rated poor.
Saving in Transportation Cost
9.5.1.5- Compared to the travel costs in 2008-9, 72.5% of the respondents have reported
lower travel costs, 25% have reported somewhat lower travel costs, and 2.5% have reported no
change in travel cost.
Excess to Public Transport
9.5.1.6- On the Section of the road surveyed, 82.5% respondents have reported better
availability of public transport, 17.5% have reported somewhat better and none has reported any
change.
Travel of School Children
Distance Travelled

Chapter 9
Page 105
9.5.1.7- On the overall, children living in the neighborhood of the national roads travel from
minimum of 0.25 km to a maximum of 3Kms for going to their schools. This gives an average
distance of about 0.93 km, the school children travel.
Children Walking to School
9.5.1.8- Out of the total school going children living in the neighborhood of NR73 nation road
about 3.3% travels to their schools by walk.
Children Using Personal Vehicles
9.5.1.9- Out of the total school going children living in the neighborhood of various nation
roads about 96.7% travels to their schools by their personal vehicles.
Children going to School by Bus
9.5.1.10- Out of the total school going children living in the neighborhood of nation road, no
one travels to their schools by bus.
Travel by other means
9.5.1.11- Out of the total school going children living in the neighborhood of nation road, no
one travels to their schools by other means.
How Road Project Benefited Family Business
Availability Good in the Market
9.5.1.12- Majority of the respondents (100%) reported better availability of goods and
services.Easy to carry Goods to the Market
9.5.1.13- Most respondents (100%) have reported better availability of transport means to
carry goods to the market because of good roads.
Easy Excess to Market
9.5.1.14- Majority of the respondents (97.5) have reported better excess to market and 2.5%
reported somewhat better.
Average Trip KM Travel
9.6.1- The average trip length has been divided into 5 segments from 0-20 km, 21 -50 km, 51-100 km, 101-200 km, 201 km and above for study of the trip km of all categories of vehicles. Two separate tables have generated for passenger and commercial vehicles. These Tables are summarized below. The average trip length amongst goods vehicles is higher for heavier vehicles across the road. This is because the heavier goods vehicles are used for transporting goods to longer distances while smaller goods vehicles like LGV and 2 axle trucks are being used for local distribution of goods. The trip pattern for passenger and commercial vehicles are given in Table 9.1.8 and Table 9.1.9 along with their graphical presentation.
9.6.1.1- Among the passenger vehicle samples, nearly 59% fall in the long range travel of 201 km and above, 16% had average trip length of 101-200 Km, 13% had average trip length in the range of 51-100 km and another 135 had trip length of 20-51 km.

Chapter 9
Page 106
Table 9.1.8: Distribution of Average Trip KM Travel of Passenger Vehicles
Vehicle Code
Vehicle Type 0-20 Km 21-50 Km 51-100 Km 101-200 Km
201-and Above Km
3 Motor Cycle 2
4 3 wheeler(TukTuk) 1
5 Car 3 2 4 2
6 Jeep/4WD 6
7 Pickup 2 1 4
8 Minibus 1 5 5 25
9 Bus
9.6.1.2- Among the commercial vehicle samples, nearly 41.46% fall in the long range travel of 101-200 km and above, 24% had average trip length of 51-100 Km, 17% had average trip length in the range of 21-50 Km, 10% had trip length of 0-20 Km and another 7% had trip length of 201 Km and above.
Table 9.1.9 Distribution of Average Trip KM Travel of Commercial Vehicles
Vehicle Code
Vehicle Type 0-20 Km 21-50 Km 51-100 Km 101-200 Km
201-and Above Km
10 Koyan small 1
11 Koyan large 2
12 Light Truck 1 2 4 8 3
13 Medium Truck 2 1 3
14 HT Rigid 3Axle 2 1 1
15 HT Rigid 4/5 Axle 1 3
16 HT Semi T 4/5 Axle 1 5
17 HT Semi T 6Axle
0
5
10
15
20
25
30
0-20 Km 21-50Km 51-100Km 101-200Km 201-andAboveKm
No
. of
Sam
ple
of
Ve
hic
le
Kilometer Range
Trip Lenght Passenger Vehicle
Motor Cycle
3 wheeler(TukTuk)
Car
Jeep/4WD
Pickup
Minibus
Bus

Chapter 9
Page 107
Vehicle-wise Commodity Distribution
9.6.1.3- Among the Light Goods Vehicles (LGVs), maximum number of LCVs (59%) was found
to be carrying grocery and perishables, 17.6% LGVs carried industrial products, 12% LGVs carried
cloths and home articles, 6% carried raw materials and another 6% carried Timber. Among the high
tonnage vehicles (HTVs), 88% carried agricultural, and food products and about 12% carried
fertilizers. The Table 9.1.10 summarizes the movement of the goods on NR73.
Table9.1.10: Classification of Vehicle-wise Commodities in percentages
Code Type of freight Description Small/Medium Commercial
Vehicles (codes 10-13)
Large/heavy commercial
vehicles (codes 14-17)
1 Agriculture/Food Rice/vegetables /fruits etc
10 7
2 Timber Raw wood/ processed wood/ furniture
1 0
3. Building materials Bricks/sand cement /iron rods
0 0
4. Raw materials Ore/minerals 1 0
5. Industrial products Engines/ machines/steel bars etc
3 0
6. Fuel/ Chemicals Petrol/Diesel, mobile oil/acids etc
0 0
7. Fertilizers Fertilizers natural /man made
0 1
0 others Cloths/home articles
2 0
0
1
2
3
4
5
6
7
8
9
0-20 Km 21-50Km 51-100Km 101-200Km 201-andAboveKm
No
. of
Sam
ple
of
Ve
hic
le
Kilometer Range
Trip Lenght Passenger Vehicle
Koyan small
Koyan large
Light Truck
Medium Truck
HT Rigid 3Axle
HT Rigid 4/5 Axle
HT Semi T 4/5 Axle
HT Semi T 6Axle
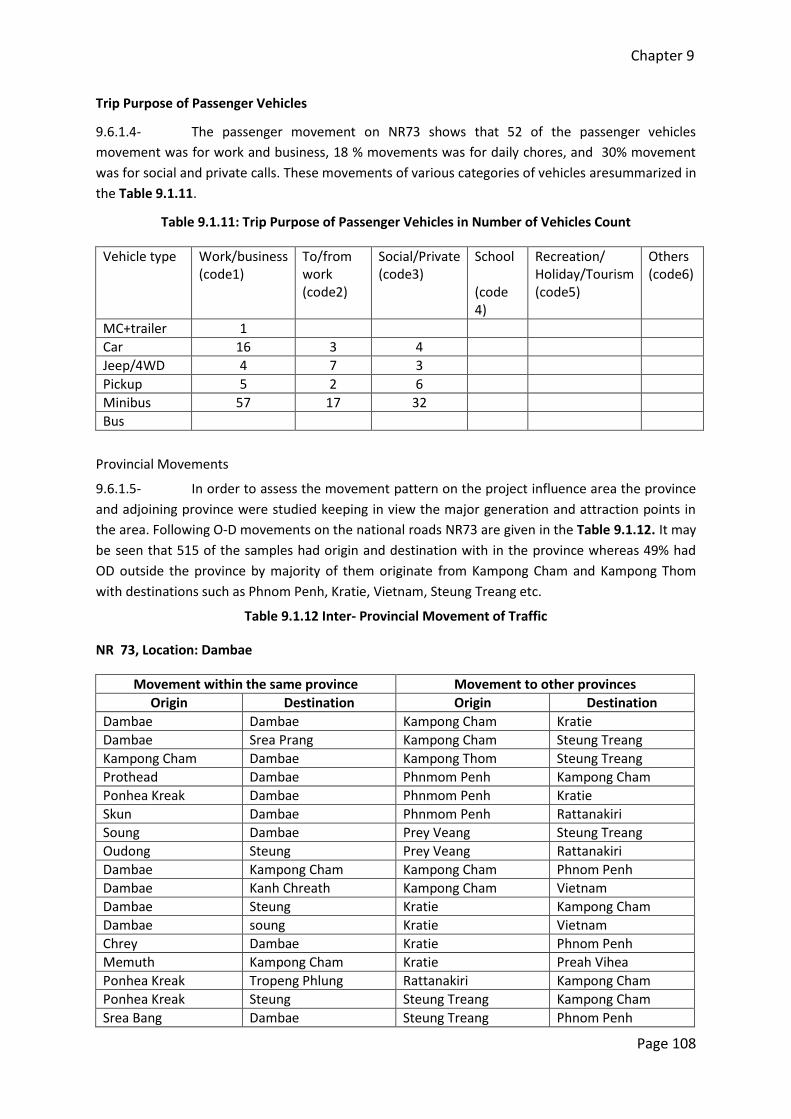
Chapter 9
Page 108
Trip Purpose of Passenger Vehicles
9.6.1.4- The passenger movement on NR73 shows that 52 of the passenger vehicles
movement was for work and business, 18 % movements was for daily chores, and 30% movement
was for social and private calls. These movements of various categories of vehicles aresummarized in
the Table 9.1.11.
Table 9.1.11: Trip Purpose of Passenger Vehicles in Number of Vehicles Count
Vehicle type Work/business (code1)
To/from work (code2)
Social/Private (code3)
School (code 4)
Recreation/ Holiday/Tourism (code5)
Others (code6)
MC+trailer 1
Car 16 3 4
Jeep/4WD 4 7 3
Pickup 5 2 6
Minibus 57 17 32
Bus
Provincial Movements
9.6.1.5- In order to assess the movement pattern on the project influence area the province
and adjoining province were studied keeping in view the major generation and attraction points in
the area. Following O-D movements on the national roads NR73 are given in the Table 9.1.12. It may
be seen that 515 of the samples had origin and destination with in the province whereas 49% had
OD outside the province by majority of them originate from Kampong Cham and Kampong Thom
with destinations such as Phnom Penh, Kratie, Vietnam, Steung Treang etc.
Table 9.1.12 Inter- Provincial Movement of Traffic
NR 73, Location: Dambae
Movement within the same province Movement to other provinces
Origin Destination Origin Destination
Dambae Dambae Kampong Cham Kratie Dambae Srea Prang Kampong Cham Steung Treang Kampong Cham Dambae Kampong Thom Steung Treang Prothead Dambae Phnmom Penh Kampong Cham Ponhea Kreak Dambae Phnmom Penh Kratie Skun Dambae Phnmom Penh Rattanakiri Soung Dambae Prey Veang Steung Treang Oudong Steung Prey Veang Rattanakiri Dambae Kampong Cham Kampong Cham Phnom Penh Dambae Kanh Chreath Kampong Cham Vietnam Dambae Steung Kratie Kampong Cham Dambae soung Kratie Vietnam Chrey Dambae Kratie Phnom Penh Memuth Kampong Cham Kratie Preah Vihea Ponhea Kreak Tropeng Phlung Rattanakiri Kampong Cham Ponhea Kreak Steung Steung Treang Kampong Cham Srea Bang Dambae Steung Treang Phnom Penh

Chapter 9
Page 109
Svay Kombeth Dambae Ta Keo Phnom Penh Thmor Dab Dambae Kratie Kampong Cham Kampong Cham Vietnam Kampong Thom Kratie
Occupancy Survey
Passenger Occupancy survey was done for 14 hour duration (from 7:00 am to 6:00 pm and 8pm to 11pm) at Dambae. The Table 9.1.13 gives the mode-wise average occupancy at survey location. The passenger vehicles in the sample show optimum utilization of capacity.
Table 9.1.13: Average Occupancy of Passenger Carrying Vehicles
Survey Locations Bus Mini
Bus
3
wheeler
2
wheeler/trailer
car Jeep/4WD Pick-
up
Dambae 17.48 1.7 5 3.91 3.6 17.2
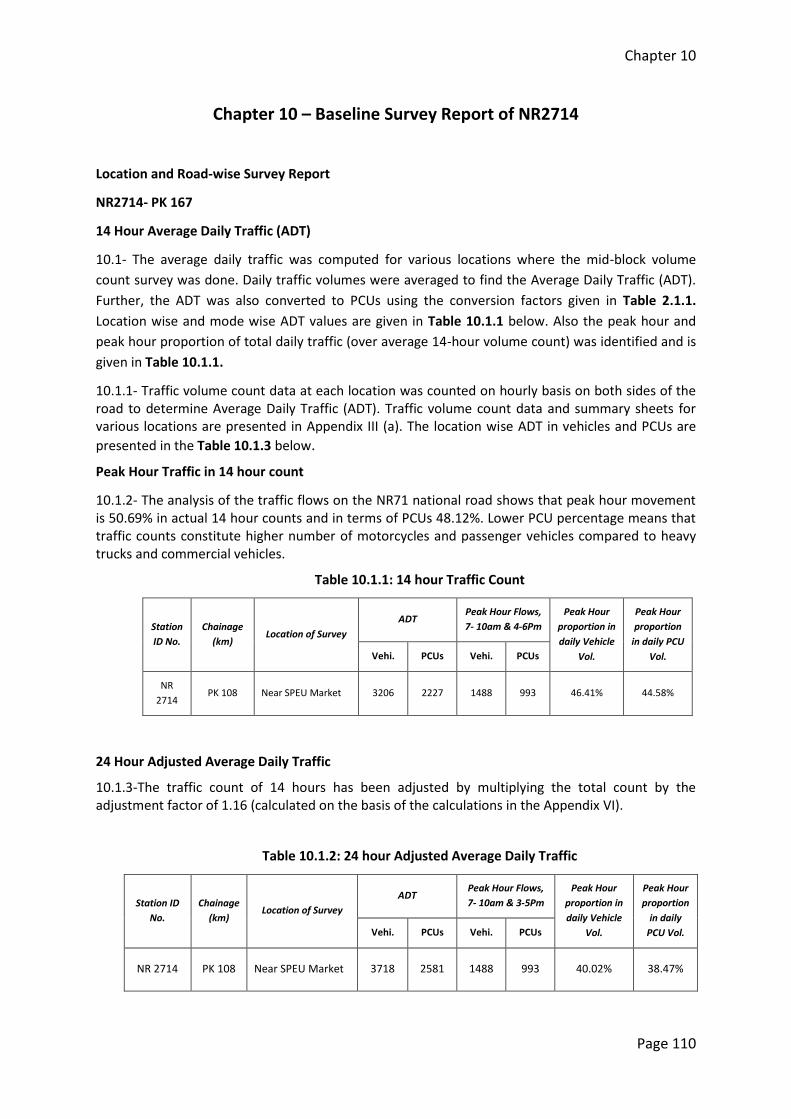
Chapter 10
Page 110
Chapter 10 – Baseline Survey Report of NR2714
Location and Road-wise Survey Report
NR2714- PK 167
14 Hour Average Daily Traffic (ADT)
10.1- The average daily traffic was computed for various locations where the mid-block volume
count survey was done. Daily traffic volumes were averaged to find the Average Daily Traffic (ADT).
Further, the ADT was also converted to PCUs using the conversion factors given in Table 2.1.1.
Location wise and mode wise ADT values are given in Table 10.1.1 below. Also the peak hour and
peak hour proportion of total daily traffic (over average 14-hour volume count) was identified and is
given in Table 10.1.1.
10.1.1- Traffic volume count data at each location was counted on hourly basis on both sides of the road to determine Average Daily Traffic (ADT). Traffic volume count data and summary sheets for various locations are presented in Appendix III (a). The location wise ADT in vehicles and PCUs are
presented in the Table 10.1.3 below.
Peak Hour Traffic in 14 hour count
10.1.2- The analysis of the traffic flows on the NR71 national road shows that peak hour movement is 50.69% in actual 14 hour counts and in terms of PCUs 48.12%. Lower PCU percentage means that traffic counts constitute higher number of motorcycles and passenger vehicles compared to heavy trucks and commercial vehicles.
Table 10.1.1: 14 hour Traffic Count
Station
ID No.
Chainage
(km) Location of Survey
ADT Peak Hour Flows,
7- 10am & 4-6Pm
Peak Hour
proportion in
daily Vehicle
Vol.
Peak Hour
proportion
in daily PCU
Vol. Vehi. PCUs Vehi. PCUs
NR
2714 PK 108 Near SPEU Market 3206 2227 1488 993 46.41% 44.58%
24 Hour Adjusted Average Daily Traffic
10.1.3-The traffic count of 14 hours has been adjusted by multiplying the total count by the adjustment factor of 1.16 (calculated on the basis of the calculations in the Appendix VI).
Table 10.1.2: 24 hour Adjusted Average Daily Traffic
Station ID
No.
Chainage
(km) Location of Survey
ADT Peak Hour Flows,
7- 10am & 3-5Pm
Peak Hour
proportion in
daily Vehicle
Vol.
Peak Hour
proportion
in daily
PCU Vol. Vehi. PCUs Vehi. PCUs
NR 2714 PK 108 Near SPEU Market 3718 2581 1488 993 40.02% 38.47%

Chapter 10
Page 111
Annual Average Daily Traffic (AADT)
10.2-The Annual Average Daily Traffic (AADT) is calculated by multiplying ADT with a seasonality factor. Seasonal variation factors by vehicle types are required to account for variations in the pattern of traffic volume on the sections of project road over different months or seasons of the year. There are various methods of determining the seasonality factor. The most direct method is using the past traffic counts, if traffic surveys are carried out round the year. But in Cambodia, round the year counts are seldom carried out for any road. Continuous automatic counting carried out on National roads does show a seasonal pattern; with peak traffic in January/ February and low traffic in August/September. There is some effect rain and flooding. These factors show that traffic levels are usually below the AADT during the period July to November, with lowest traffic levels in August. Since the traffic counts were carried out in April-May 2012, when there is no impact of the seasonal factors, therefore the traffic counts are very close to AADT. Hence there is no need to apply seasonal factor. This is only for creating baseline data for comparison with the count in the same period in 2013 to know the impact of the RAMP. The peak hour traffic constitutes 40.02% of the ADT of vehicles and 38,47% of the PCU ADT.
Table 10.1.3: 24 hour Adjusted Annual Average Daily Traffic (AADT)
Station ID
No.
Chainage
(km) Location of Survey
ADT Peak Hour Flows Peak Hour
proportion
in daily
Vehicle Vol.
Peak Hour
proportion in
daily PCU Vol. Vehi. PCUs Vehi. PCUs
NR 2714 PK 108 Near SPEU Market 3718 2581 1488 993 40.02% 38.47%
Overall Composition of Traffic
10.3- The composition of traffic, for various modes, was worked out from the traffic volume count
data. Along the project stretch the share of passenger traffic is 78.9%, whereas goods traffic is
21.1%. Share of 2/3 axle truck is 11.9% of total traffic. Along the project stretch it can be observed
that share of two wheelers alone is 59.6%. The share of car and jeep/van is 9.3% of total traffic along
the project stretch.
Table 10.1.4: 14 Hour Percentage Composition of Traffic (PCUs)
Stat
ion
No
.
Ch
ain
age
(km
)
Loca
tio
n o
f Su
rve
y
Mo
tor
Cyc
le
Thre
e W
he
ele
r/Tu
kTu
k
Car
Min
i Bu
s
Bu
s
LGV
(Ko
un
/ Es
tan
) sm
all
LGV
(Ko
un
/ Es
tan
) la
rge
Truck
Tota
l
Jee
p/4
wd
Pic
kup
2 A
xle
lig
ht
3 A
xle
Me
diu
m
3ax
le h
eav
y
Mu
lti a
xle
4 r
igid
Mu
lti-
axle
tra
ilers
5
Mu
lti-
axle
tra
iler
he
avy
6
MC
C-1
0
NR 2714-
PK 108
Near SPEU
Market
1327 84 83 37 87 133 6 62 60 60 134 70 84 0 0 2227
59.5
9%
3.77
%
3.7
3%
1.6
6%
3.9
1%
5.97
%
0.2
7%
2.7
8%
2.6
9%
2.6
9%
6.02
%
3.1
4%
3.7
7%
0.0
0%
0.0
0%

Chapter 10
Page 112
Table 10.1.5: 24 Hour Adjusted Composition of Traffic
Stat
ion
No
.
Ch
ain
age
(km
)
Loca
tio
n o
f Su
rve
y
Mo
tor
Cyc
le
Thre
e W
he
ele
r/Tu
kTu
k
Car
Min
i Bu
s
Bu
s
LGV
(Ko
un
/ Es
tan
) sm
all
LGV
(Ko
un
/ Es
tan
) la
rge
Truck
Tota
l
Jee
p/4
wd
Pic
kup
2 A
xle
lig
ht
3 A
xle
Me
diu
m
3ax
le h
eav
y
Mu
lti a
xle
4 r
igid
Mu
lti-
axle
tra
ilers
5
Mu
lti-
axle
tra
iler
he
avy
6
MC
C-1
0 NR 2714-
PK 108
Near SPEU
Market
1539 97 96 43 101 154 7 72 69 70 155 81 97 0 0 2581
59.6
3%
3.7
6%
3.7
2%
1.6
7%
3.9
1%
5.97
%
0.2
7%
2.79
%
2.6
7%
2.7
1%
6.01
%
3.1
4%
3.7
6%
0.0
0%
0.0
0%
Hourly Variation of Traffic
10.4 Traffic volume count was conducted in both directions for simultaneously, for 14 hours. The
hourly count was compiled by adding traffic counts of both sides to get the hourly variation of traffic
for each survey location. The graph showing hourly variation for each location is given in Fig 10.1.1.
Peak hour traffic for all the locations from 7am to 10 am and 3pm to 5pm is 43.7% of the actual 14
hour PCU counts in ADT and in 24 hour adjusted PCU. It is quite normal for intercity roads because of
high percentage of regional traffic movement of freight traffic on the road. This results in traffic
flows to be uniformly distributed over the main 16-20 hours of the day.

Chapter 10
Page 113
TABLE 10.1.6 -SUMMARY OF HOURLY COUNTS (PCUs)
Time 6
h t
o 7
h
7h
to
8h
8h
to
9h
9h
to
10
h
10
h t
o 1
1h
11
h t
o 1
2h
12
h t
o 1
3h
13
h t
o 1
4h
14
h t
o 1
5h
15
h t
o 1
6h
16
h t
o 1
7h
17
h t
o 1
8h
20
h t
o 2
1h
21
h t
o 2
2h
22
h t
o 2
3h
Gra
nd
To
tal
Total TC Both side 1
04
.4
26
1
20
4.5
22
4
19
6
15
1.5
18
2
19
2.5
21
2
14
6
15
7.5
17
8
66
32
24
22
27
Overall Result of the Community Survey
10.5- The community survey questionnaire was designed to obtain information on the benefits of
the rehabilitated national roads was structured in to 10 questions. Question 1&2 basically cover the
details of the respondents whereas questions 3 to 10 are directly related to the qualitative benefits
enjoyed by the road users and road neighbours. These questions provide multiple choices. The
responses the community from the 40 samples, 10 each in 4 categories are summarised in the table
below:
Passenger Cost Unit (PCU)
At Speu Market, Chamkar Leu District (Intersection), NR.2714, PK: 143+500

Chapter 10
Page 114
Table 10.1.7 SUMMARY OF COMMUNITY DATA SURVEY NR 2714
No. Question Road No. NR.2714
Location Speu
3 In the family
Member in family M 101
F 99
No. of Children M 70
F 70
4 Vehicle owner ship
Motorbike 27
Car 3
Scooter 11
Lorry / Etan 0
Others, (bicycle) 0
Km/mon. 8940
5 Use of Public/Private
Transport
Bus 1
Car 32
Others ( Motor taxi, 3
6 Main Occupation
of family
Agriculture 10
Service 16
Business 13
7 Family income (Monthly) USD/Riels
Minimum $
100
Maximum $
7,000
Average $
689
8 Benefit of the road project
Quality Travel (comfort level)
Excellent 1
very Good 30
Good 9
Poor 0
Saving in transportation
cost compared to 2008
Lower 5 (13%)
Somewhat lower 13 (33%)
No Change 8 (20%)
Over 14 (35%)
Excess to public transport compared to
2008
Better 32
Somewhat better 7
No Change 1
9 Travel of
school children by
Distance (km)
Minimum 0.14
Maximum 6
Mean 1
By Walk Percentage 17.20%
By Personal vehicle including bicycle
Yes 79.40%

Chapter 10
Page 115
By Bus Yes 0.00%
By Others Yes 3.40%
10
How road project
benefited your family business?
Availability of goods in the market
Better 31
Somewhat better 9
Easy to carry goods for sale in the market
Better 36
Somewhat better 4
Easy excess to market Better 33
Somewhat better 7
Response to Vehicle ownership and Km Travel
10.6.1- Each of the target groups interviewed show that on an average every family had one
motorised vehicle (motorcycle or car, scooter, lorry or etan) and large number of them had bicycles
as an alternate. 40 samples interviewed show extensive total travel of 8940 Kms NR2714 per month.
The average travel at the individual family level is of the order of 224 kms.
Use of Public and Private Transport
10.6.1.1- In the sample 0f 40 on NR2714, it has been observed that 2.5% of the families are using
bus, 80% use private transport car whereas 7.5% use other means of travel such as motorcycle, taxi
etc.
Main Occupation of Road Neighbours
10.6.1.2- It has been observed that nearly 25% of the population in the road neighbouring areas at
the study locations on NR2714 were in agriculture, about 32.5% in business and balance 40% in
service (as an employee or running service centres, repairs of vehicles, petrol pumps etc.).
Family Income
10.6.1.3- Most of the respondents reported increase income in their income levels compared to
level in 2008-9. The average monthly income of neighbouring families is reported to be about
US$689 at the surveyed location of the national road. However, it varies from a minimum of US$100
to a maximum of US$7,000 per month.
Benefit of the Road Rehabilitation Project
Quality of Travel
10.6.1.3.4- 2.5% of the people rated quality of travel as excellent, 32.5%have rated quality of travel
as very good, 22.5% have rated good, and none has rated poor.

Chapter 10
Page 116
Saving in Transportation Cost
10.6.1.4- Compared to the travel costs in 2008-9, 12.5% of the respondents have reported lower
travel costs, 32.5% have reported somewhat lower travel costs, 20% have reported no change in
travel cost and 35% have reported increase in travel costs.
Excess to Public Transport
10.6.1.5- On the Section of the road surveyed, 80% respondents have reported better availability of
public transport, 17.5% have reported somewhat better and about 2.5% have reported no change.
Travel of School Children
Distance Travelled
10.6.1.6- On the overall, children living in the neighbourhood of the national roads travel from
minimum of 0.14 km to a maximum of 6 Kms for going to their schools. This gives an average
distance of about 1 km, the school children travel.
Children Walking to School
10.6.1.7- Out of the total school going children living in the neighbourhood of NR2714 nation road
about 17.2% travels to their schools by walk.
Children Using Personal Vehicles
10.6.1.8- Out of the total school going children living in the neighbourhood of various nation roads
about 79.49% travels to their schools by their personal vehicles.
Children going to School by Bus
10.6.1.9- Out of the total school going children living in the neighbourhood of nation road, no one
travels to their schools by bus.
Travel by other means
10.6.1.10- Out of the total school going children living in the neighbourhood of nation road, 3.4%
travels to their schools by other means.
How Road Project Benefited Family Business
Availability Good in the Market
10.6.1.11- Majority of the respondents (77.5%) reported better availability of goods and services and
22.5% of the families reported somewhat better.
Easy to carry Goods to the Market
10.6.1.12- Most respondents (97.5%) have reported better availability of transport means to carry
goods to the market because of good roads and 2.5% reported somewhat better.

Chapter 10
Page 117
Easy Excess to Market
10.6.1.13- Majority of the respondents (90%) have reported better excess to market and 10%
reported somewhat better.
Average Trip KM Travel
10.7.1- The average trip length has been divided into 5 segments from 0-20 km, 21 -50 km, 51-100
km, 101-200 km, 201 km and above for study of the trip km of all categories of vehicles. Two
separate tables have generated for passenger and commercial vehicles. These Tables are
summarized below.The trip pattern for passenger and commercial vehicles are given in Table 10.1.8
and Table 10.1.9 along with their graphical presentation.
10.7.1.1- Among the passenger vehicle samples, nearly 37.2% fall in the long range travel of 201 km
and above, 32.5% had average trip length of 51-100 Km, 30.2% had average trip length in the range
of 0-20 Km. This pattern is obvious as this is provincial road.
Table 10.1.8: Distribution of Average Trip KM Travel of Passenger Vehicles
Vehicle Code
Vehicle Type 0-20 Km 21-50 Km 51-100 Km 101-200 Km
201-and Above Km
3 Motor Cycle 7 4 4
4 3 wheeler(TukTuk) 1 5 1
5 Car 1 1 1
6 Jeep/4WD
7 Pickup 1
8 Minibus 4 3 8
9 Bus 2
0
1
2
3
4
5
6
7
8
9
0-20 Km 21-50Km 51-100Km 101-200Km 201-andAboveKm
No
. of
Sam
ple
of
Ve
hic
le
Kilometer Range
Trip Lenght Passenger Vehicle
Motor Cycle
3 wheeler(TukTuk)
Car
Jeep/4WD
Pickup
Minibus
Bus

Chapter 10
Page 118
10.7.1.2- Among the commercial vehicle samples, nearly 52% fall in the long range travel of 21-50
km, 18.5% had average trip length of 0-20 Km, 15% had average trip length in the range of 21-50 Km,
and another about 15% had trip length of 101 -200.
Table10.1.9: Distribution of Average Trip KM Travel of Commercial Vehicles
Vehicle Code
Vehicle Type 0-20 Km 21-50Km 51-100Km 101-200Km 201-and Above Km
10 Koyan small 2 1
11 Koyan large 2 3 1
12 Light Truck 1 7
13 Medium Truck 2 1 3
14 HT Rigid 3Axle 1 1 1
15 HT Rigid 4/5 Axle 1
16 HT Semi T 4/5 Axle
17 HT Semi T 6Axle
Vehicle-wise Commodity Distribution
10.7.1.3- Among the Light Goods Vehicles (LGVs), maximum number of LGVs (58%) was found to be
carrying grocery and perishables, 17 % LGVs carried industrial products, 16 % LGVs carried cloths and
home articles and 8% carried building materials. Among the high tonnage vehicles (HTVs), 50%
carried raw materials, 25% carried agricultural, and food products and about 25% carried building
materials. The Table 10.1.10 summarises the movement of the goods on NR2714.
0
1
2
3
4
5
6
7
8
0-20 Km 21-50Km 51-100Km 101-200Km 201-andAboveKm
No
. of
Sam
ple
of
Ve
hic
le
Kilometer Range
Trip Lenght Passenger Vehicle
Koyan small
Koyan large
Light Truck
Medium Truck
HT Rigid 3Axle
HT Rigid 4/5 Axle
HT Semi T 4/5 Axle
HT Semi T 6Axle

Chapter 10
Page 119
Table10.1.10: Classification of Vehicle-wise Commodities in percentages
Code Type of freight Description Small/Medium Commercial Vehicles (codes 10-13)
Large/heavy commercial vehicles (codes 14-17)
1 Agriculture/Food Rice/vegetables /fruits etc
7 1
2 Timber Raw wood/ processed wood/ furniture
3. Building materials Bricks/sand cement /iron rods
1 1
4. Raw materials Ore/minerals 2
5. Industrial products Engines/ machines/steel bars etc
2
6. Fuel/ Chemicals Petrol/Diesel, mobile oil/acids etc
7. Fertilizers Fertilisers natural /man made
0 others Cloths/home articles
2
Trip Purpose of Passenger Vehicles
10.7.1.4-The passenger movement on NR2714 shows that 45.5% of the passenger vehicles
movement was for work and business, 38.5% movements was for social and private calls,7%
movement was for daily chores, and 5.5% movement was for tourism, and 3.8% movement was
for education. These movements of various categories of vehicles is summarised in the Table
10.1.11.
Table 10.1.11: Trip Purpose of Passenger Vehicles in Number of Vehicles Count
Vehicle type
Work/business (code1)
To/from work(code2)
Social/Private (code3)
School (code 4)
Recreation/ Holiday/Tourism (code5)
Others (code6)
MC+trailer 13 6
Car 1 8
Jeep/4WD
Pickup 1
Minibus 42 9 32 5 7
Bus 2 4
Provincial Movements
10.7.1.5-In order to assess the movement pattern on the project influence area the province and
adjoining province were studied keeping in view the major generation and attraction points in the
area. Following O-D movements on the national roads NR73 are given in the Table 10.1.12. It may be
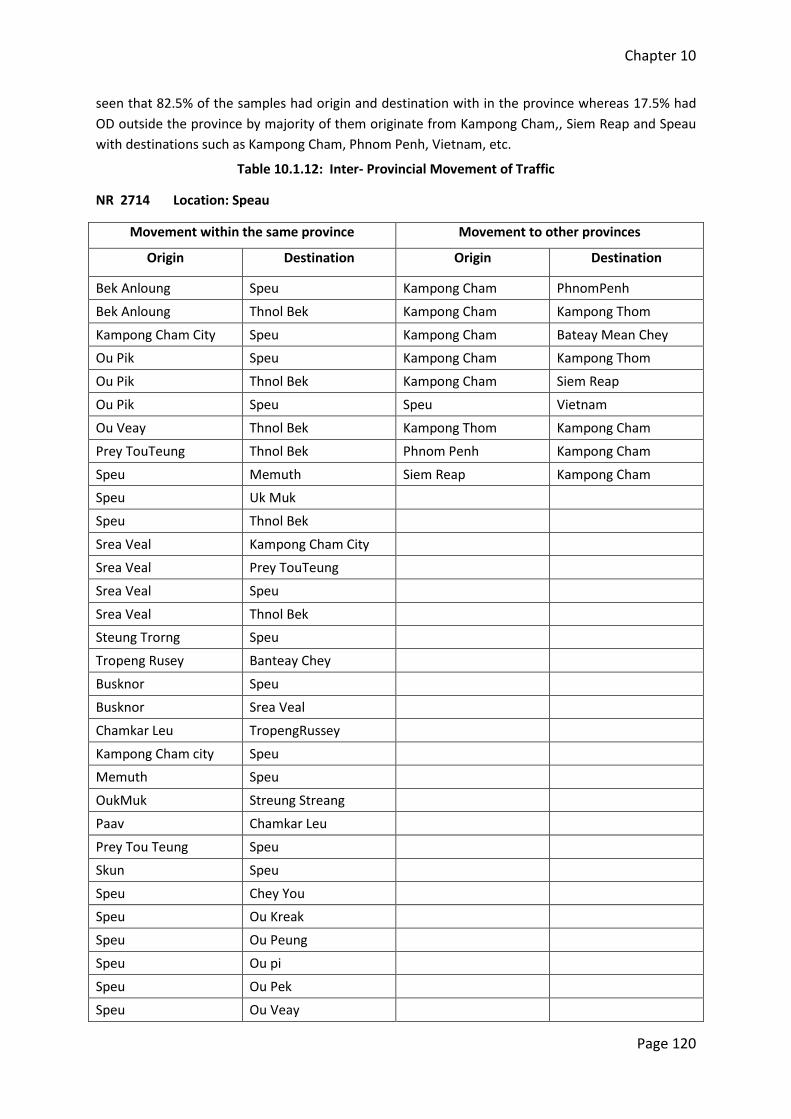
Chapter 10
Page 120
seen that 82.5% of the samples had origin and destination with in the province whereas 17.5% had
OD outside the province by majority of them originate from Kampong Cham,, Siem Reap and Speau
with destinations such as Kampong Cham, Phnom Penh, Vietnam, etc.
Table 10.1.12: Inter- Provincial Movement of Traffic
NR 2714 Location: Speau
Movement within the same province Movement to other provinces
Origin Destination Origin Destination
Bek Anloung Speu Kampong Cham PhnomPenh
Bek Anloung Thnol Bek Kampong Cham Kampong Thom
Kampong Cham City Speu Kampong Cham Bateay Mean Chey
Ou Pik Speu Kampong Cham Kampong Thom
Ou Pik Thnol Bek Kampong Cham Siem Reap
Ou Pik Speu Speu Vietnam
Ou Veay Thnol Bek Kampong Thom Kampong Cham
Prey TouTeung Thnol Bek Phnom Penh Kampong Cham
Speu Memuth Siem Reap Kampong Cham
Speu Uk Muk
Speu Thnol Bek
Srea Veal Kampong Cham City
Srea Veal Prey TouTeung
Srea Veal Speu
Srea Veal Thnol Bek
Steung Trorng Speu
Tropeng Rusey Banteay Chey
Busknor Speu
Busknor Srea Veal
Chamkar Leu TropengRussey
Kampong Cham city Speu
Memuth Speu
OukMuk Streung Streang
Paav Chamkar Leu
Prey Tou Teung Speu
Skun Speu
Speu Chey You
Speu Ou Kreak
Speu Ou Peung
Speu Ou pi
Speu Ou Pek
Speu Ou Veay

Chapter 10
Page 121
Speu Sork
Speu Srea Veal
Speu Streung Trong
Speu Trerng
Svay Teap Speu
Thnol Tou Teung Chey You
Thnol Bek Speu
Thnol Bek Srea Ma Om
Thnol Bek Srea Veal
Trobek Saphea
TroPeng Kea Speu
SteungTrong Speu
Sre Veal Vietnam
Speu Speu Kerth
Occupancy Survey
10.7.1.6- Passenger Occupancy survey was done for 14 hour duration (from 7:00 am to 6:00 pm and
8pm to 11pm) at Speu. The Table 10.1.13 gives the mode-wise average occupancy at survey
location. The passenger vehicles in the sample show lower level of occupancies and thus low
utilization of capacity.
Table 10.1.13: Average Occupancy of Passenger Carrying Vehicles
Survey
Locations Bus
Mini
Bus
3
wheeler
2
wheeler/trailer
car Jeep/4WD Pick-up
Speu 3 9.2 3 2 2.6 1

Chapter 11
Page 122
Chapter 11 - Travel and Freight Costs in Cambodia
Travel Costs in Cambodia
Land Transport cost data is not available with Land Transport Department of the Ministry of Public Works and Transport. A survey therefore was conducted to obtain information on certain important factors which determine the cost of Travel in Cambodia. These factors are:
Related to Road Infrastructure
Fuel consumption with respect to fuel price
Vehicle Travel with respect to fuel prices
Road pricing and tolls
Travel time
Road Quality
Road Infrastructure/Connectivity with neighboring countries
Cross Bother Custom and Immigration facilities other than Airports & Sea Ports.
Road Safety
Groups Insurance for passengers.
Road Sector Demand
Port Infrastructure for Import & Export
Travel Demand between specific locations
Tourism sector Demand between specific locations
Seasonal factors
Economic and Industrial Estates
Growth of Urban centres and commerce
General Costs 1. Vehicle Cost
2. Road Tax
3. Vehicle Insurance
4. Spares/maintenance costs
5. Driver/Operation Staff Costs
6. Office/ Parking rentals
Beside the factors stated above, The passenger fare in Cambodia is demand and market driven as there is no state intervention for public transport except the railways owned by the government that two is very small. Railway lines at present are closed for rehabilitation. In the road transportation only state owned a few Russians make busses are operating on NR1 and NR7. The competition has increased but level in still low.
Passenger for Large Bus Transport
The Data collected from the large bus transport companies who are operating on the roads covered in RAMP Project and personal interviews with Bus company owners reveal that passenger fare have increased by about 20 to 25% on those preventing in 2008 largely due to

Chapter 11
Page 123
increase in fuel prices. The inflation rate was 15.8% in 2008, 1.6% in 2009, 3.4% in 2010, and 6.5% in 2011. The cumulative inflation rate of these years is 29.49%. This clearly indicates that passenger fare at constant prices prevailing in 2008 have been comparatively reducing in the recent 4 years. Bus operators have in their personal interview informed that improved road infrastructure has helped them to save on fuel consumption, travel time and maintenance costs. In general, bus companies have 1.5 to 2 employees per bus. For instance, Capital Bus Transport Company has a fleet of 180 buses and employs about 310 persons. Sorya Transport Company with a fleet of 100 buses and employs 200 persons. Passenger Fare and Travel Time on National (Primary roads) obtained from the bus company is given in the TABLE-1. The comparison of Bus Passenger fares at constant prices in 2012 is lower than those in 2008 between specific destination on NR-1, NR-5, and NR-7 covered in the RAMP. This can be attributed to improved road conditions in spite of increase in fuel prices, and other costs in the transport sector.
The Cost of Bus and other related Costs
Transport cost of companies on various components which in turn determine the passenger fares are tabulated in TABLE-2.
Passenger fare of Medium and Mini Bus Transport
Medium & Mini buses are operated at the individual level. Presence of number of operators is providing fairly good competition. Due to limited resources and time with M&E only responses could be obtained from 3 individual operators regarding time, distance and package costs between specified destinations on NR1, NR7, NR5 covered under RAMP. Passenger fares in 2012 at constant prices (2008 price level) are lower than those in 2008. Individual (operators offer quite a competitive price compared to large bus per passenger fares (shared cost). For instance, Phnom Penh-Sihanouk Ville large bus fare is $5 and shared fare of 25 seated buses is $5.6 which is quite competitive compared to the Comfort of a Medium/Mini Bus. The Summary of the Survey data on passenger fare is given in the TABLE3. The costs of bus transport companies on various components which determine the passenger fares are tabulated in the TABLE-4.
Freight Charges
In order to obtain Freight Cost in Cambodia, a Survey was conducted with Freight and Truck Companies. Effort was made to collect past rates of freight movement but only few of them could provide old data. Survey also included types of freight handled by these companies, freight routes and freight cost. Most of the freight companies charge return fare To and Fro costs in one trip order. However, booking companies and commission agencies try that the trip cost is optionally utilized by booking consignment movement both ways. This helps the freight companies to save on cost and increase their profitability. Some of the commission agencies handle documentation for import and export and arrange transportation. The transportation of goods other than bulk materials/machines are handled mostly through containers. The concept of volume handled is used to charge freight cost. Normally 5 Axle Trailer Truck carry 1-20 Ft or 2-20 Ft container in one trip, charges for instance between Sihanouk Ville-Phnom Penh is US$150 to $180 for export and $200-$220 for import consignments in 2012. In 2008 these rates were $160 and $180 for export and import respectively. The Freight Costs charged by the Freight Companies has been summarized in the TABLE 5: Comparison of freight cost in 2012 at constant price (2008 price level) with those in 2008 shows higher freight costs in 2012. Personal conversation with some of the freight operator reveal that market is not competitive coupled with low demand. Major movements take place between Phnom Penh, Sihanouk Ville Port, Thai and Vietnam border.

Chapter 11
Page 124
TABLE -1 LARGE BUS TRAVEL TIME AND PASSENGER FARE (TO and FROM)
No.
Road Section Road No.
Distance
Soriya Tr. Co. Capitol Travel Co. Vireak Buntham Co. Mekong Express Co.
Travel Time
Passenger fare
in2008
Passenger fare
in2012
Passenger fair in 2012 at constant
price= ($)
Travel Time
Passenger
fare in 2008
Passenger
fare in 2012
Passenger fair in 2012 at constant
price ($)
Travel Time
Passenge
r fare in
2008
Passenger
fare in 2012
Passenger fair in 2012 at constant
price ($)
Travel Time
Passenge
r fare in
2008
Passenge
r fare in
2012
Passenger fair in 2012 at constant
price ($)
1 Phnom Penh – Vietnam (Hochiminh)
NR.1 231 6 hr 8 10.00
7.72 6hr 9.6 12.00
9.26
6 hr 10.4 13 10.04
2 Phnom Penh – Bavet Border NR.1 166 3 hr 30 10.00
7.72 3 hr 30 4 5.00 3.86 3hr30 9.6 12.00
9.26
3hr30 10.4 13 10.04
3 Phnom Penh – Prey Veng NR.1 90 2 hr 30
4 Phnom Penh – Takoe NR.2 77 2 hr 15
5 Phnom Penh – Kampot NR.3 148 3 hr 30
6 Phnom Penh – Sihanouk Ville NR.4 230 4 hr. 4 5.00
3.86 4 hr 4.8 6.00
4.63
7 Phnom Penh – Koh Kong NR.4 271 5 hr 30
8 Phnom Penh – Thailand (Bangkok)
NR.5 15 hr 14.4 18.00
13.89
9 Phnom Penh – Poi Pet NR.5 410 8 hr
10 Phnom Penh – Battanbang NR.5 291 5hr 6 hr 30 4.4 5.50 4.26 6 hr 5.6 7.00 5.40
11 Phnom Penh – Kampong Chhang
NR.5 124 2 hr 2.88 3.65 2.78
12 Phnom Penh – Siem Reap NR.6 314 6 hr. 30 4.4 5.50
4.26 6 hr 30 5.6 7.00
5.40
6 hr 7.2 9 6.95
13 Phnom Penh – Presh Vihear NR.6 256 6 hr. 40
14 Phnom Penh – Loa (Dorndet) NR.7 10 hr 17.6 22.00
16.98
15 Phnom Penh – Loa (Pakse) NR.7 12 hr. 21.6 27.00
20.84
16 Phnom Penh – Loa (Viengchan)
NR.7 23 hr 38.4 48.00
37.05
17 Phnom Penh – Kratie NR.7 315 6 hr. 30
18 Phnom Penh – Snoul NR.7 255 5 hr.
19 Phnom Penh – Mondulkiri NR.7 534 8 hr
20 Phnom Penh – Kampong Cham
NR.7 122 3 hr 00 3 hr 4 5.00 3.86

Chapter 11
Page 125
TABLE -2 Transport Cost of Bus Companies
Sl. No. Cost Items Units Sorya Transport
co.
Capitol Transport
co.
Phnom Penh Vireak Butam
Mekong Express
A Large Bus
1 Cost New Vehicle $ 150,000
2 Cost Second Hand Vehicle (96-2002)
$ 30,000 35,000
3 Tyre $ 284 350-460 350
4 Repair cost $/month 10,000
5 Salary of Driver $/month 180 130-310 120
6 Salary of Ass. Driver $/month 80 70 50
7 Trip Incentive to Driver and Assistant
$/time 15 15 17
8 Road Tax $/Year 61 61 61
9 Insurance $/Year 300 360 300
10 Rent per month
B General
1 Diesel Cost $/Ltr 1.2 1.2 1.2 1.05
2 Mobile Oil $/L 6 5 6 6
C Number of Vehicle
1 Number of Mini Bus
2 Number of Large Bus 100 60 30
E Employee
1 Manager Per. 3 2 6 1
2 Accountant Per 1 2 8 3
3 Driver Per. 120-150 200 60 30
4 Driver Assistance Per. 40 30 35 25
5 Mechanic Per. 5 20 10 3
6 Guide Per. 0 0 0 25
D Operation
1 Number of direction per day No. 42 180 27 16
2 Number of Bus a day No. 48 28 16
3 Total Bus in Company No. 100 35 30
4 Number of Diesel per day Ltr. 2000Ltr

Chapter 11
Page 126
TABLE 3 MINI/MEDIUMBUS TRAVEL TIME AND PASSENGER FARE (TO and FROM)
No. Road Section Roa
d No.
Distance Km
Mr. Dara 25 seats Bus Owner Mr. Nat 15 seats Bus Owner Mr. Sarin 12 seats Bus Owner
Travel Time
Passenger fare in
2008
Passenger fare in
2012
Passenger fare 2012
at constant
price(2008)
Travel Time
Passenger fare in
2008
Passenger fare in
2012
Passenger fare 2012
at constant
price(2008)
Travel Time
Passenger fare in
2008
Passenger fare in
2012
Passenger fare 2012
at constant
price(2008)
1 Phnom Penh –Svay Rieng NR.1 122 3hr
30minutes
160 200.00
154.60
3hr 30minute
s 80 100.00
77.20
2 Phnom Penh – Snoul NR.7 255 5 hr 152 190.00
146.68 5hr 136 170.00
131.24
3 Phnom Penh – Kampong Chhnang
NR.5 91 1hr
40minutes
104 130.00
100.36
5 Phnom Penh – Pursat NR.5 187 3 hr
30minutes
184 230.00
177.56
3hr 30minute
s 136 170.00
131.24
6 Phnom Penh – Ocdong NR.5 40 1hr 32 40.00 30.80
7 Phnom Penh – Bouk Ko ( one day) NR.3 190 3hr
30minutes
104+ 130 + 45 for village travel
100.36+
Phnom Penh – Bouk Ko ( two days)
NR.3 190 3hr
30minutes
126+ 160+45 for village travel
123.52+
8 Phnom Penh –Kampong Som(1day)
NR.4 230 4hr
30minutes
112+ 140+45for local travel
108+
Phnom Penh –Kampong Som(2day)
NR.4 230 4hr
30minutes
126+ 160+45for local travel
123.52+
9 Phnom Penh – Battanbang NR.5 296 5hr 5hr 112+ 140+45for local travel
108+
Phnom Penh – Battanbang NR.5 296 5hr 5hr 126+ 160+45for local travel
123.52+
11 Phnom Penh – Kampong Chhang NR.5 91 1hr30
minutes 76 95.00 73.34

Chapter 11
Page 127
TABLE - 4 Mini and Medium Bus Costs
Sl. No. Cost Items Units 25 seater Bus
15 seater Bus
12 seater Bus
A 1 2
3 4 5 6 7
8 10 11 12
B 1 2
Mini /Medium Bus Cost New Vehicle Cost Second Hand Vehicle (96-2002) Tire Repair cost Salary of Driver Salary of Ass. Driver Trip Incentive to Driver and Assistant(To & FRO) Road Tax Insurance Rent per Month Rent per day Diesel per 100Km General Diesel Cost Mobile Oil
$ $ $
$/month $/month $/month
$/time
$/Year $/Year
$/month $/day
Ltr.
$/Ltr. $/Ltr.
16000
200
44 210
1050 45
15-20
1.2 6
10000
110
150
36.5 140
1050 40
10-14
1.2 6
10000
100
36.5 140
1050 40
10-14
1.2 6
TABLE 5 Freight Costs in Cambodia
Sl. No.
Road section Distance (km)
Travel
time
Meng Hong Leap Logistics- started in2012 (6 employees)
VGT Transport Co.
( fleet of 8 trailer
trucks(5 axle) 22
Employees
Freight Charge 2008 (US$)
Freight Charge 2012(US$) Income
2008 Income
2012
For1- contain
er
For 2-contai
ner
For 1- contai
ner
For 1 container at consta
nt prices (2008)
For 2-contai
ner
For 2 container
at constant
prices (2008)
USD USD Freight
Charge per trip (USD)
1 Sihnouk Ville-Phnom Penh(
Import) 230 4hr 150 160 280 216.16 300
9600 36000
2 Phnom Penh- Sihanouk Ville
(export) 230 4hr 150 160 180 138.96 220
3 Phnom Penh- Sihanouk Ville
Port NR4 230 4hr 150 160
270 (208.44 at constant
prices 2008)
4 Phnom Penh-
Bavet NR1 164
3to 3.5hr
150 160
270 (208.44 at constant
prices 2008)

Chapter 12
Page 128
Chapter 12 – Highway Capacity and Level of Service – Travel Time Survey
Highway Capacity and Level of Service
Level of service (LOS) is a qualitative measure that describes traffic condition in terms of speed, travel time, freedom to maneuver, Convenience, traffic interruptions and safety. Six classifications are used to define LOS, designated by the letters A through F. LOS-A represent the best conditions, while LOS F represent heavily congested flow with traffic demand exceeding highway capacity. Under the following assumptions for Two-way, Two-Lane Rural Highway . Traffic mix 0%, trucks 0% Rvs, 0% buses . Directional Split 50/50 . Level Terrain . Lane with = 3.6m . Shoulder width = 1.82m We can describe the quality of service with two parameters i.e. Average Travel Speed and Percentage Time Spent Following vehicle in front.
LOS- Table for Two Lane Rural Highway
LOS Category Average Speed (mph) Average Travel Speed
(km/hour) Percentage Time Spent Following
A >55 >90 < 35%
B >50 >80 < 50%
C >45 >70 < 65%
D >40 >60 < 80%
E < 40 < 60 >80%
F Whenever of low rate exceed the segment capacity (design capacity-ADT)
Capacity of Highway
A class B Two Lane Highway has a base free flow as speed of 100km/h. The capacity is defined as the maximum sustained 15 minute rate of flow in PCPHPL (Passenger cars per hour per lane) that can be accommodated by a uniform freeway segment under prevailing traffic and highway condition in one direction. LOS- Level of service qualitatively measures operating conditions as a function of variance from ideal conditions. A is best, F is worst.
LOS Vehicle Density (Pc / km / Ln / 15 Minutes) A 0-7 B 7-12 C 11-16 D 16-22 E 22-28 F 28

Chapter 12
Page 129
Analysis of Average Speed, Time of Travel and LOS for RAMP Roads
Due to Limited resources and non-availability of desired data for more precise calculation of level of service, therefore calculations are made on the basis is of actual observations made during the survey.
No Road No Characteristics of
LOS
ADT (M&E Survey Report
2012 ) PCU
Peak Hour Percentage
1 NR-1-1
4 Lane (divided) 70% Following 30% Free flow
6116 36.73%
2 NR-1-2
4 Lane (divided) 50% Following 50% Free flow
5118 42.90%
3 NR-5-1
4 Lane (divided) 90% Following 10% Free flow
5302 39.78%
4 NR5-2
4 Lane (divided) 35% Following 65% Free flow
6844 49.62%
5 NR7-1
4 Lane (divided) 65% Following 35% Free flow
11612 73.78%
6 NR7-2
4 Lane (divided) 50% Following 50% Free flow
7159 38.38%
7 NR11
2 Lane (divided) 70% Following 30% Free flow
- -
8 NR71
2 Lane (undivided) 60% Following 40% Free flow
4324 41.48%
9 NR72
2 Lane (undivided) 40% Following 60% Free flow
3949 34.92%
10 NR73
2 Lane (undivided) 25% Following 75% Free flow
4489 37.73%
11 NR2714
2 Lane (undivided) 80% Following 20% Free Flow
2581 38.47%

Chapter 12
Page 130
LOS- Level of service, ADT- Average Daily Traffic PCU- Passenger, Car, Unit
LOS Classification of the RAMP Roads
4 Lane
Road Category
Average Travel Speed Kms/hour
Percentage Time
Following
Percentage Time Free
Flow
Vehicles Per 15
minutes lane
average
Vehicle per 15
minutes Peak hour
NR1-1 D 63.72 70 30 15.9 9.4
NR1-2 D 68.82 50 50 13.3 91.5
NR5-1 E 47.1 90 10 13.8 186.5
NR5-2 D 69.3 35 65 17.8 130.16
NR7-1 E 49.86 65 35 30.2 357
NR-7-2 E 55.38 50 50 18.6 90.6
2 Lane
NR11 F 43.86 70 30 NA NA
NR7-1 E 47.94 60 40 22.5 14.75
NR7-2 E 48.07 40 60 20.5 57.5
NR7-3 D 62.100 25 75 23.4 70.58
NR2714 E 42.42 80 20 13.4 41.38
Peak hour counts constitute Traffic counts between 7-10AM and 3-5 PM (6 Hours).

Chapter 12
Page 131
TRAVEL TIME
No RN AWP Starting
Point Ending Point
Length
(km)
Travel Time (mn)
Proportion
Average Speed
Achieved
Allowed
Speed
IRI 2009
IRI 2010
IRI 2011
1 NR1-1
AWP 1 Stueng Slout, Prahsdach (at 9:09am)
Prey Chhor, Kompong Trabek (9:38am)
30.8 29 mn
1mn=1.062Km
63.72 Km/hr
80 Km/h
- 2.36 3.06
2 NR1-2
AWP 1 Prey Chhor, Kompong Trabek (9:40am)
Bavet, Svay Rieng (10:43am)
65.4 57 mn
1mn=1.147Km
68.82 Km/hr
80 Km/h
- 2.36 3.06
3 NR5-1
AWP 1.1
Roessey Keo, Phnom Penh (PK3) (12:29am)
Kompong Chhnang city (2:20pm)
87.2 111 mn
1mn=0.785Km
47.1 Km/hr
60 Km/h
1.67 2.99 3.05
4 NR73
AWP 2 Prahtheat, Kompong Cham (9:16am)
Chhlong, Kratie (10:22am)
58.0 56 mn
1mn=1.035Km
62.100 Km/hr
60 Km/h
4.32 6.37 4.39
5 NR7-1
AWP 2 Prahtheat, Kompong Cham (7:29am)
Skun, Kompong Cham (9:10am)
84.0 101 mn
1mn=0.831Km
49.86 Km/hr
60 Km/h
4.01 3.53 4.37
6 NR5-2
AWP 2.1
Kompong Chhnang City (2:25pm)
Prey Nhi, Pursat (PK170.900) (3:39pm)
79.7 69 mn
1mn=1.155Km
69.3 Km/hr
90 Km/h
1.67 2.99 3.05
7 NR7-2
AWP 3 Prahtheat, Kompong Cham (2:26pm)
Snoul, Kratie (4:04pm)
90.5 98 mn
1mn=0.923Km
55.38 Km/hr
60 Km/h
4.01 3.53 4.37
8 NR72
AWP 3 Punhea Krek, Kompong (12:10am)
Trapang Phlong Border (12:27am)
13.4 17 mn
1mn=0.788Km
48.068 Km/hr
60 Km/h
- 4.26 4.55
9 NR71
AWP 3 Treung, Kompong Cham (4:47pm)
Chamkar Leu,Kompong Cham (5:26pm)
31.2 39 mn
1mn=0.799Km
47.94 Km/hr
60 Km/h
3.35 3.46 3.53
10 NR2714
AWP 3 Chamkar Leu, Kompong Cham (7:39am)
Stueng Trong, Kompong Cham (8:24am)
31.9 45 mn
1mn=0.707km
42.42 Km/hr
60 Km/h
- 4.26 -
11 NR11
AWP 4 Neak Leurng, Prey Veng (2:43pm)
Thnol Tortoeng, Kompong Cham (4:46pm)
90.0 123 mn
1mn=0.731Km
43.86 Km/hr
60 Km/h
- 3.86 -

APPENDIX

Appendix I
ADB Loan No. 2406-CAM(SF) AusAID GRANT No.0104 RAMP-M&E Project
Traffic Count Form
Province:
Road Number or Name:
Location: km from Day:
Surveyor Name: Date:
Motorised
Truck*
Small Large Light Med Heavy Heavy Heavy Heavy
Incl. 3-wheel
motorised
Max 7
Seats
Max 7
Seats Freight Use 8 - 16 Seats 16+ Seats 2-4 tonne >4 tonne
Rigid 3
Axle
Rigid 4/5
Axle
S Trailer 4/5
Axle
S Trailer 6
Axle
FROM TO
7h - 00 8h - 00
8h - 00 9h - 00
9h - 00 10h - 00
10h - 00 11h - 00
11h - 00 12h - 00
12h - 00 132h - 00
13h - 00 14h - 00
14h - 00 15h - 00
15h - 00 16h - 00
16h - 00 17h - 00
17h - 00 18h - 00
* All Trucks have double wheels on rear axles. Light and Medium Trucks have two axles, Heavy Trucks have more than two axles.
Start TimeJeep/ 4WD Pick-up Minibus Bus
Koyun/EtanMotorcycle
Motorcycle
TrailerCar
T1
I - 1

Appendix I ADB Loan No. 2406-CAM(SF) AusAID GRANT No.0104 RAMP-M&E Project
Traffic Count Form
Province:
Road Number or Name:
Location: km from Day:
Surveyor Name: Date:
Motorised
Truck*
Small Large Light Med Heavy Heavy Heavy Heavy
Incl. 3-wheel
motorised
Max 7
Seats
Max 7
Seats
Freight
Use
8 - 16
Seats 16+ Seats 2-4 tonne >4 tonne
Rigid 3
Axle
Rigid 4/5
Axle
S Trailer 4/5
Axle
S Trailer 6
Axle
FROM TO Turn Left Turn Left Turn Left Turn Left Turn Left Turn Left Turn Left Turn Left Turn Left Turn Left Turn Left Turn Left Turn Left Turn Left Turn Left
7h - 00 8h - 00
8h - 00 9h - 00
9h - 00 10h - 00
10h - 00 11h - 00
11h - 00 12h - 00
12h - 00 132h - 00
13h - 00 14h - 00
14h - 00 15h - 00
15h - 00 16h - 00
16h - 00 17h - 00
17h - 00 18h - 00
* All Trucks have double wheels on rear axles. Light and Medium Trucks have two axles, Heavy Trucks have more than two axles.
Motorcycle CarJeep/
4WDPick-up
Start Time
Motorcycle
TrailerMinibus Bus
Koyun/Etan
T2a
I - 2

Appendix IADB Loan No. 2406-CAM(SF) AusAID GRANT No.0104 RAMP-M&E Project
Traffic Count Form
Province:
Road Number or Name:
Location: km from Day:
Surveyor Name: Date:
Motorised
Truck*
Small Large Light Med Heavy Heavy Heavy Heavy
Incl. 3-wheel
motorised
Max 7
Seats
Max 7
Seats Freight Use 8 - 16 Seats 16+ Seats 2-4 tonne >4 tonne
Rigid 3
Axle
Rigid 4/5
Axle
S Trailer 4/5
Axle
S Trailer 6
Axle
FROM TO Turn Right Turn Right Turn Right Turn Right Turn Right Turn Right Turn Right Turn Right Turn Right Turn Right Turn Right Turn Right Turn Right Turn Right Turn Right
7h - 00 8h - 00
8h - 00 9h - 00
9h - 00 10h - 00
10h - 00 11h - 00
11h - 00 12h - 00
12h - 00 132h - 00
13h - 00 14h - 00
14h - 00 15h - 00
15h - 00 16h - 00
16h - 00 17h - 00
17h - 00 18h - 00
* All Trucks have double wheels on rear axles. Light and Medium Trucks have two axles, Heavy Trucks have more than two axles.
BusKoyun/Etan
Start Time
MotorcycleMotorcycle
TrailerCar Jeep/ 4WD Pick-up Minibus
T2b
I - 3

Appendix IADB Loan No. 2406-CAM(SF) AusAID GRANT No.0104 RAMP-M&E Project
Traffic Count Form
Province:
Road Number or Name:
Location: km from Day:
Surveyor Name: Date:
Motorised
Truck*
Small Large Light Med Heavy Heavy Heavy Heavy
Incl. 3-wheel
motorised
Max 7
Seats
Max 7
Seats Freight Use 8 - 16 Seats 16+ Seats 2-4 tonne >4 tonne
Rigid 3
Axle
Rigid 4/5
Axle
S Trailer 4/5
Axle
S Trailer 6
Axle
FROM TO Go Straight Go Straight Go Straight Go Straight Go Straight Go Straight Go Straight Go Straight Go Straight Go Straight Go Straight Go Straight Go Straight Go Straight Go Straight
7h - 00 8h - 00
8h - 00 9h - 00
9h - 00 10h - 00
10h - 00 11h - 00
11h - 00 12h - 00
12h - 00 132h - 00
13h - 00 14h - 00
14h - 00 15h - 00
15h - 00 16h - 00
16h - 00 17h - 00
17h - 00 18h - 00
* All Trucks have double wheels on rear axles. Light and Medium Trucks have two axles, Heavy Trucks have more than two axles.
BusKoyun/Etan
Start Time
MotorcycleMotorcycle
TrailerCar Jeep/ 4WD Pick-up Minibus
T2c
I - 4
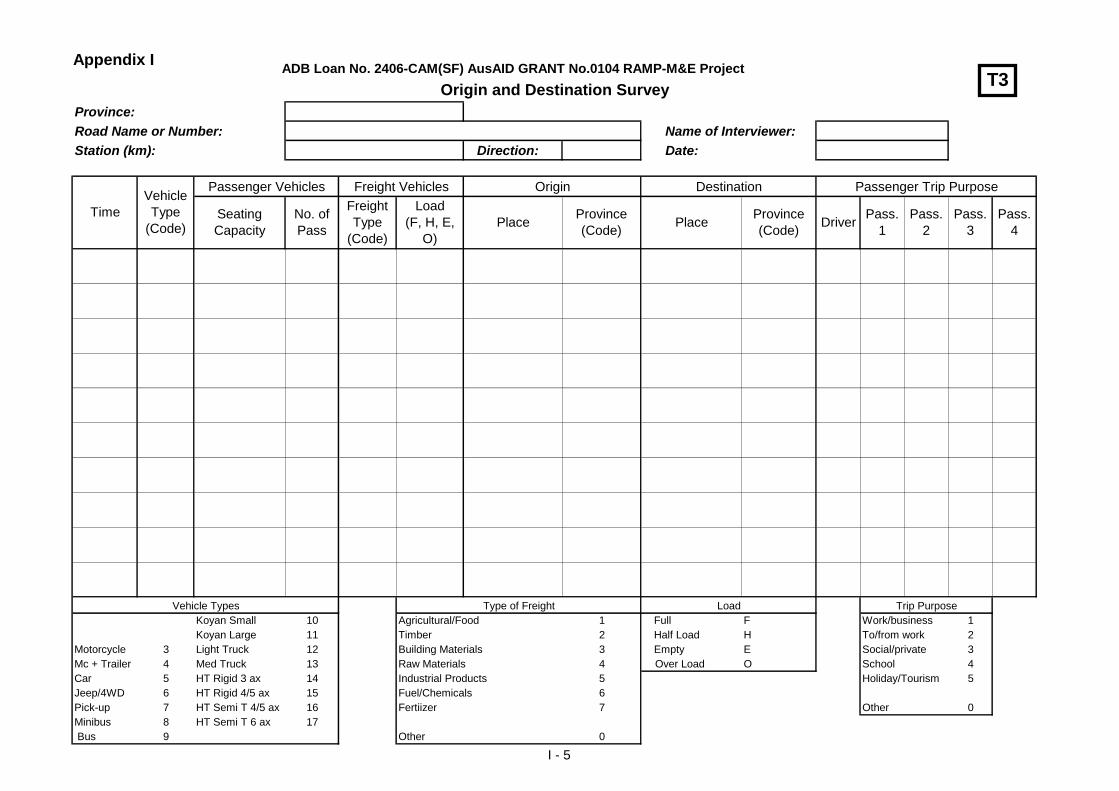
Appendix IADB Loan No. 2406-CAM(SF) AusAID GRANT No.0104 RAMP-M&E Project
Origin and Destination Survey
Province:
Road Name or Number: Name of Interviewer:
Station (km): Direction: Date:
Passenger Vehicles Freight Vehicles Origin Destination Passenger Trip Purpose
Vehicle Types Type of Freight Load Trip Purpose
Koyan Small 10 Agricultural/Food 1 Full F Work/business 1
Koyan Large 11 Timber 2 Half Load H To/from work 2
Motorcycle 3 Light Truck 12 Building Materials 3 Empty E Social/private 3
Mc + Trailer 4 Med Truck 13 Raw Materials 4 Over Load O School 4
Car 5 HT Rigid 3 ax 14 Industrial Products 5 Holiday/Tourism 5
Jeep/4WD 6 HT Rigid 4/5 ax 15 Fuel/Chemicals 6
Pick-up 7 HT Semi T 4/5 ax 16 Fertiizer 7 Other 0
Minibus 8 HT Semi T 6 ax 17
Bus 9 Other 0
Time
Vehicle
Type
(Code)Place
Province
(Code)
Seating
Capacity
No. of
Pass
Freight
Type
(Code)
Load
(F, H, E,
O)
Pass.
3
Pass.
4Place
Province
(Code)
Pass.
1
Pass.
2Driver
T3
I - 5

Appendix I
Road No: Location: Date:
1 Name:
2 Village/Town: Province:
M F M F
3 Family-No of Adults: No of Children:
4 Vehicle ownnership Number Average Monthly Travel (Km)
1 Motorbike
2 Car
3 Scooter
4 Lorry
5 Others
5 Use of Public/Private Transport
Bus
Car
Others
6 Main Occupation of family
Agriculture
Service
Business
7 Family income (Monthly)
USD/Riels
8 Benefit of the road project Excellent very Good Good Poor
a Quality Travel (comfor level)
Lower Somewhat lower No Change
b Saving in transportation cost compared to 2008
Better Somewhat better No Change
c Excess to to public transport compared to 2008
9 Travel of school children Distance (Km)
Yes No
a By walk
b Personal vehicle including bicycle
c Bus
d Others
10 How road project benifited your family/business?
Better Somewhat better
a Availability of goods in the market
b Easy to carry goods for sale in the market
c Easy excess to market
Note: As far as possible select person who have good qualification background and can understand
in proper road impact assessment perspective.
T4
ADB Loan No. 2406-CAM(SF) AusAID GRANT No.0104 RAMP-M&E Project
COMMUNITY SURVEY FORM
The sample size for four categories is 40 i.e 10 each in a categories.
1. 10 Village Community
2. 10 Service Community
3. 10 Busniness Community
4. 10 Transportor Community
I - 6

Appendix II
II - 1
APPENDIX II Vehicle Categories The vehicle categories identified in the counts were: Non-motorised
Bicycle - All two and three-wheeled non-motorised vehicles, including cyclos and those used
for carrying freight.
Animal Cart - All animal drawn-vehicles (Ox-carts, Buffalo-carts, horse and cart).
Motorised
Motorcycle - Motorcycles, scooters and any other 2-wheeled motorised vehicles, but not those
with trailers. Motorcycle traffic dominates vehicle movements on virtually all roads.
Motorcycle with Trailer - Motorcycles with a trailer (Remoque), or any 3- wheeled motorised
vehicle, used for freight or passenger transport.
Car - This type includes sedan cars and station wagons (but not 4-wheel drive vehicles) with a
maximum of 7 seats.
4-wheel Drive Vehicles - All four-wheel drive (FWD) vehicles, such as Toyota Land Cruiser or
Mitsubishi Pajero, with a maximum of 7 seats.
Pick-up - Vehicles such as the Toyota Hi-lux designed for use as light freight vehicles, but are
also used for private transport as an alternative to sedan cars. They are also known as utilities. Very small trucks are also included in this category, being distinguished from the Light Truck category in having only single wheels on the rear axle. If it appeared that a pick-up was being used for private passenger transport, especially a twin-cab model, it was counted as a Car or a
4-wheel Drive Vehicle as appropriate. If converted for public transport use, with seats and a canopy or roof over the rear section, it was counted as a Minibus.
Minibus - The minibus type is typically an 8-12 seat vehicle, such as the Mercedes MB 140D
(now replaced by the Sprinter), sometimes referred to as a microbus or van.
Bus - All buses with more than 16 passenger seats. They are distinguished from the Minibus type by having dual-wheel on the rear axle. (Very few buses operate on rural roads in Cambodia.)
Small Koyun/Etan - Small tractors made into a road vehicle by attaching a single-axle trailer, or
small, slow moving, locally-made trucks.
Large Koyun/Etan - Locally-made trucks that typically have low capacity engines not always
designed for motor vehicles. These are much slower than conventional vehicles and are normally only used for short distance freight movements.
Light Truck - These are trucks with a payload of up to 4 tonnes. They have two axles and dual-
wheels on the rear axle. If converted for passenger transport and carrying passengers they were counted as buses.
Medium Truck - These are larger trucks than the light truck, but also have two axles and dual-
wheels on the rear axle. They have a carrying capacity up to 10 tonnes. Although sometimes difficult to distinguish from the Light Truck in traffic counts most are much larger. There are significant differences between these two types, especially in terms of axle loads, and it is considered desirable to obtain information on the numbers of each for use in feasibility and pavement design studies.

Appendix II
II - 2
Heavy Truck - All 3, 4 or 5-axle rigid trucks, articulated trucks and truck trailers. A large range
of such vehicles operates in Cambodia but most have a similar ESA, and numbers are very low on most of the study roads, thus a single category was considered to be appropriate. If any vehicle did not meet one of the above descriptions, it was recorded as the vehicle type it was closest to in appearance and size (for example an ambulance would be recorded as a
Minibus). The only exceptions were graders, rollers and other equipment used in road construction or maintenance. These were excluded, but all other vehicles were included even if they did not match exactly one of the types shown on the form. Pedestrian movements can be included in an HDM-4 analysis, with benefits related to higher walking speeds on improved roads. However, it is difficult to determine appropriate levels of traffic and the benefits are minor, so pedestrian traffic was not included.

Appendix II
Code
No.Image Description
Code
No.Image Description
3 Motorcycle 10 Koyun/Etan (Small)
4
Motorcycle Trailer
(Incl. 3-wheel
motorised)
11 Koyun/Etan (Large)
5 Car (Max 7 Seats) 12Truck Small (2-4
tonnes)
6Jeep/ 4WD (Max 7
Seats)13
Truck Mid ( > 4
tonnes)
7 Pick-up (Freight Use) 14Truck Heavy ( Rigid
3 Axle )
8 Minibus (8 - 16 Seats) 15Truck Heavy ( Rigid
4/5 Axle )
9 Bus (16+ Seats) 16Truck Heavy ( S
Trailer 4/5 Axle)
17Truck Heavy ( S
Trailer 6 Axle )
Vehicle Category Description
II - 3

Appendix III (a)
Light Med Heavy Heavey Heavy Heavy
incl.3
wheel
Max
7 Seats
Max
7 seats
Freight
Use
8-16
seats16+Seats Small Large 2-4 tone >4 tone
Rigid
3 Axle
Rigid
4 Axle
S Trailer
5 Axle
Straile
6 Axle
From To
7h-00 8h-00 166 2 10 9 3 8 7 1 1 4 4 1 3 4 - 223
8h-00 9h-00 167 3 17 12 9 11 8 - - 5 9 1 6 1 - 249
9h-00 10h-00 145 1 19 10 4 19 10 - - 6 7 2 4 2 - 229
10h-00 11h-00 133 3 26 14 7 18 10 2 1 3 7 2 4 4 - 234
11h-00 12h-00 136 8 19 10 8 23 6 - - 4 2 5 4 3 - 228
12h-00 1h-00 107 7 18 7 2 17 6 - 1 5 5 1 2 5 - 183
1h-00 2h-00 113 2 15 7 3 17 5 - 2 7 5 3 3 3 - 185
2h-00 3h-00 106 4 17 3 3 26 6 1 - 6 4 1 7 4 - 188
3h-00 4h-00 105 3 20 9 8 37 12 1 - 8 2 2 5 4 - 216
4h-00 5h-00 115 - 15 9 2 40 10 1 1 3 5 2 0 3 - 206
5h-00 6h-00 76 3 20 10 3 29 11 - 3 4 3 0 6 2 - 170
1,369 36 196 100 52 245 91 6 9 55 53 20 44 35 - 2311
8h-00 9h-00 13 0 8 5 3 1 2 1 2 0 1 0 4 5 0 45
9h-00 10h-00 3 0 3 3 2 0 3 5 0 0 2 0 2 10 1 34
10h-00 11h-00 4 1 8 3 1 0 2 1 1 0 2 0 1 3 0 27
20 1 19 11 6 1 7 7 3 0 5 0 7 18 1 106
1,389 37 215 111 58 246 98 13 12 55 58 20 51 53 1 2,417
Total
each
hours
Moto-
cycle
TRAFFIC COUNT in Vehicles
Koyun/Etan
At Night
NR.1 Lot 1, Kampong Trobek District, Prey Veng Province
From Neak Leung to Kampong Trobek (Side 1)
Start Time
Moto-
cycleCar Jeep/4wd Pick-up
Motorised
Truck *
At Day
Sub-Total
Sub-Total
Total Side 1
Minibus Bus
III - 1

Appendix III (a)
Light Med Heavy Heavey Heavy Heavy
incl.3
wheel
Max
7 Seats
Max
7 seats
Freight
Use
8-16
seats16+Seats Small Large 2-4 tone >4 tone
Rigid
3 Axle
Rigid
4 Axle
S Trailer
5 Axle
Straile
6 Axle
From To
7h-00 8h-00 183 7 10 1 2 37 - 3 - 1 6 1 4 2 - 257 480
8h-00 9h-00 205 6 21 12 8 63 4 1 6 - 3 1 4 - - 334 583
9h-00 10h-00 181 5 21 10 3 71 11 6 3 1 3 3 1 4 - 323 552
10h-00 11h-00 137 4 16 12 5 36 9 3 3 - 3 2 7 - - 237 471
11h-00 12h-00 100 5 19 10 3 21 8 3 - - 6 3 7 2 - 187 415
12h-00 1h-00 67 3 6 10 10 14 3 4 4 1 6 1 4 6 - 139 322
1h-00 2h-00 118 3 21 15 8 14 5 4 1 0 7 2 8 5 - 211 396
2h-00 3h-00 90 2 25 23 3 17 4 - 4 1 5 2 3 2 1 182 370
3h-00 4h-00 122 1 26 15 11 8 2 1 4 0 4 1 4 7 - 206 422
4h-00 5h-00 140 4 10 12 5 8 4 7 2 0 5 0 3 2 - 202 408
5h-00 6h-00 80 1 25 10 5 5 4 4 1 0 5 3 5 5 - 153 323
1,423 41 200 130 63 294 54 36 28 4 53 19 50 35 1 2431 4,742 2,346
8h-00 9h-00 13 0 8 5 3 1 2 1 2 0 1 0 4 5 0 45 90
9h-00 10h-00 3 0 3 3 2 0 3 5 0 0 2 0 2 10 1 34 68
10h-00 11h-00 4 1 8 3 1 0 2 1 1 0 21 48
20 1 19 11 6 1 7 7 3 0 3 0 6 15 1 100 206
1443 42 219 141 69 295 61 43 31 4 56 19 56 50 2 2,531 4,948
2,832 79 434 252 127 541 159 56 43 59 114 39 107 103 3 4,948 47.4%
57.2% 1.6% 8.8% 5.1% 2.6% 10.9% 3.2% 1.1% 0.9% 1.2% 2.3% 0.8% 2.2% 2.1% 0.1%
3,285 92 503 292 147 628 184 65 50 68 132 45 124 119 3 5,740 40.9%
57.2% 1.6% 8.8% 5.1% 2.6% 10.9% 3.2% 1.1% 0.9% 1.2% 2.3% 0.8% 2.2% 2.1% 0.1%
Total Both side
Total % 24 hr.
Total
each
hours
Total % 14 hr.
Total Side 2
Total Both side
Moto-
cycle
At Night
NR.1 Lot 1, Kampong Trobek District, Prey Veng Province
From Kampong Trobek to Neak Leung (Side 2)
Start Time
Moto-
cycle
Sub-Total
TRAFFIC COUNT in Vehicles
Koyun/Etan
Motorised
Sub-Total
Pick-up Minibus BusTruck *
At Day
Car Jeep/4wd
731
1,615
Total
Both
side
Peak
Hour
III - 2

Appendix III (a)
Light Med Heavy Heavey Heavy Heavy
incl.3
wheel
Max
7 Seats
Max
7 seats
Freight
Use
8-16
seats16+Seats Small Large 2-4 tone >4 tone
Rigid
3 Axle
Rigid
4 Axle
S Trailer
5 Axle
Straile
6 Axle
From To
7h-00 8h-00 274 4 10 7 5 2 8 4 - 4 2 - 2 2 - 324
8h-00 9h-00 240 10 11 9 9 8 5 4 - 6 1 - 3 2 - 308
9h-00 10h-00 220 9 14 13 6 3 6 6 1 1 1 1 - 1 - 282
10h-00 11h-00 205 2 11 3 2 9 6 - - 3 4 - 2 1 - 248
11h-00 12h-00 136 4 13 15 4 11 6 - - 1 - 1 - 2 - 193
12h-00 1h-00 112 3 18 8 3 6 2 2 - 4 3 1 2 2 - 166
1h-00 2h-00 94 7 13 4 5 9 3 7 - 2 0 0 4 3 - 151
2h-00 3h-00 113 2 12 3 2 9 3 2 - 1 0 0 0 0 - 147
3h-00 4h-00 104 5 6 2 1 12 3 3 - 2 2 4 0 0 - 144
4h-00 5h-00 140 6 17 8 4 3 19 6 - 1 0 0 0 1 - 205
5h-00 6h-00 160 4 21 9 3 2 4 6 - 2 0 0 1 6 1 219
1,798 56 146 81 44 74 65 40 1 27 13 7 14 20 1 2387
8h-00 9h-00 65 0 8 5 1 2 0 1 0 3 1 0 2 3 0 91
9h-00 10h-00 29 0 4 3 3 2 0 1 0 1 0 0 0 2 0 45
10h-00 11h-00 23 0 8 3 1 0 0 0 0 1 0 1 1 2 0 40
117 0 20 11 5 4 0 2 0 5 1 1 3 7 0 176
1,915 56 166 92 49 78 65 42 1 32 14 8 17 27 1 2,563
Total
each
hours
At Night
Sub-Total
Total Side 1
Sub-Total
TRAFFIC COUNT in Vehicle
NR.1 Lot 2, Svay Teap District, Svay Rieng Province
From Svay Rieng to Svay Teap (Side 1)
Start Time
Motorised
Moto-
cycle
Moto-
cycleCar Jeep/4wd Pick-up Minibus Bus Koyun/Etan
Truck *
At Day
III - 3

Appendix III (a)
Light Med Heavy Heavey Heavy Heavy
incl.3
wheel
Max
7 Seats
Max
7 seats
Freight
Use
8-16
seats16+Seats Small Large 2-4 tone >4 tone
Rigid
3 Axle
Rigid
4 Axle
S Trailer
5 Axle
Straile
6 Axle
From To
7h-00 8h-00 315 46 12 8 4 21 8 6 - - 1 1 2 2 - 426 750
8h-00 9h-00 223 9 12 5 - 9 12 5 - 1 3 2 3 5 - 289 597
9h-00 10h-00 161 11 9 6 7 4 12 9 1 2 1 2 1 2 - 228 510
10h-00 11h-00 147 8 16 3 8 5 11 6 1 2 2 - 3 2 - 214 462
11h-00 12h-00 135 1 10 8 4 4 7 2 1 - 1 - - 5 - 178 371
12h-00 1h-00 101 4 11 6 6 10 12 10 1 2 3 - 4 6 - 176 342
1h-00 2h-00 115 4 22 17 2 4 4 4 - 0 2 0 0 0 - 174 325
2h-00 3h-00 144 8 18 6 6 5 7 - 1 0 0 0 0 3 - 198 345
3h-00 4h-00 123 1 24 11 4 4 6 - 1 0 1 0 2 5 - 182 326
4h-00 5h-00 143 7 15 7 3 3 9 3 3 0 1 0 1 3 - 198 403
5h-00 6h-00 207 5 24 5 6 2 4 1 15 1 3 1 2 5 - 281 500
1,814 104 173 82 50 71 92 46 24 8 18 6 18 38 - 2544 4,931 2,760
8h-00 9h-00 79 0 15 3 1 1 1 0 3 0 1 0 0 6 0 110 201
9h-00 10h-00 58 0 5 4 0 4 1 0 0 0 0 0 1 3 0 76 121
10h-00 11h-00 52 0 4 4 1 1 0 1 2 0 2 0 2 2 0 71 111
189 0 24 11 2 6 2 1 5 0 3 0 3 11 0 257 433
2003 104 197 93 52 77 94 47 29 8 21 6 21 49 0 2,801 5,364
3,918 160 363 185 101 155 159 89 30 40 35 14 38 76 1 5,364 51.5%
73.0% 3.0% 6.8% 3.4% 1.9% 2.9% 3.0% 1.7% 0.6% 0.7% 0.7% 0.3% 0.7% 1.4% 0.0%
4,545 186 421 215 117 180 184 103 35 46 41 16 44 88 1 6,222 44.4%
73.0% 3.0% 6.8% 3.4% 1.9% 2.9% 3.0% 1.7% 0.6% 0.7% 0.7% 0.3% 0.7% 1.4% 0.0%
Total
Both
side
Peak
Hour
1,857
903
Total % 24 hr.
Total Both side
Moto-
cycleCar Jeep/4wd Pick-up Minibus
Total
each
hours
Total % 14 hr.
Total Both side
Truck *
At Day
Sub-Total
At Night
Sub-Total
Total Side 2
Start Time
Motorised
Moto-
cycleBus Koyun/Etan
TRAFFIC COUNT in Vehicles
NR.1 Lot 2, Svay Teap District, Svay Rieng Province
from Svay Teap to Svay Rieng (Side 2)
III - 4

Appendix III (b)
Light Med Heavy Heavey Heavy Heavy
incl.3
wheel
Max
7 Seats
Max
7 seats
Freight
Use
8-16
seats16+Seats Small Large 2-4 tone >4 tone
Rigid
3 Axle
Rigid
4 Axle
S Trailer
5 Axle
Straile
6 Axle
From To
7h-00 8h-00 512 40 48 12 10 29 1 6 9 1 3 - 5 1 10 687
8h-00 9h-00 489 12 85 13 15 44 2 - 10 1 12 - - 2 11 696
9h-00 10h-00 329 12 70 12 11 49 2 5 - 1 - 2 1 1 8 503
10h-00 11h-00 279 20 58 14 28 25 6 - 9 1 14 4 2 - 2 462
11h-00 12h-00 253 14 54 20 26 24 11 5 10 13 7 1 1 2 2 443
12h-00 1h-00 203 12 49 15 27 22 15 - 11 5 3 2 - 1 3 368
1h-00 2h-00 195 6 46 24 16 15 18 1 9 2 9 3 1 1 2 348
2h-00 3h-00 156 5 47 25 32 29 26 2 15 4 13 2 1 0 - 357
3h-00 4h-00 215 3 90 16 19 16 10 - 21 2 6 7 0 1 5 411
4h-00 5h-00 255 9 50 19 26 22 5 - 15 1 9 5 0 2 2 420
5h-00 6h-00 170 7 47 26 17 14 10 - 12 2 7 3 1 6 5 327
3,056 140 644 196 227 289 106 19 121 33 83 29 12 17 50 5022
8h-00 9h-00 18 4 11 2 4 3 5 0 7 0 19 5 4 6 0 88
9h-00 10h-00 8 0 7 2 7 1 0 1 0 0 9 2 1 7 0 45
10h-00 11h-00 3 0 4 2 3 2 0 1 0 0 5 1 3 2 0 26
29 4 22 6 14 6 5 2 7 0 33 8 8 15 0 159
3,085 144 666 202 241 295 111 21 128 33 116 37 20 32 50 5,181
Minibus Bus Koyun/EtanTruck *
Sub-Total
At Night
Sub-Total
Total Side 1
Total
each
hours
At Day
TRAFFIC COUNT in Vehicles
NR5 Lot 1, Kampong Tralach District, Kampong Chhnang Province
From Phnom Penh to Kampong Chhnang (Side 1)
Start Time
Motorised
Moto-
cycle
Moto-
cycleCar Jeep/4wd Pick-up
III - 5

Appendix III (b)
Light Med Heavy Heavey Heavy Heavy
incl.3
wheel
Max
7 Seats
Max
7 seats
Freight
Use
8-16
seats16+Seats Small Large 2-4 tone >4 tone
Rigid
3 Axle
Rigid
4 Axle
S Trailer
5 Axle
Straile
6 Axle
From To
7h-00 8h-00 460 14 47 20 25 29 2 3 - 20 11 1 - 1 - 633 1,320
8h-00 9h-00 446 42 52 30 26 24 20 2 - 18 19 2 2 2 1 686 1,382
9h-00 10h-00 345 22 83 26 26 29 12 3 - 22 5 4 - 6 - 583 1,086
10h-00 11h-00 226 19 59 35 24 30 26 2 - 25 22 3 3 2 - 476 938
11h-00 12h-00 156 13 67 21 29 17 17 2 - 15 9 9 - 6 - 361 804
12h-00 1h-00 202 29 54 12 9 23 14 1 - 17 13 9 6 3 - 392 760
1h-00 2h-00 145 10 80 23 21 26 10 - - 17 15 2 3 0 - 352 700
2h-00 3h-00 114 9 71 32 23 34 7 1 3 11 13 0 2 7 - 327 684
3h-00 4h-00 140 2 55 17 17 32 9 1 - 17 7 4 5 3 1 310 721
4h-00 5h-00 201 14 39 31 26 35 10 - - 12 7 1 1 7 - 384 804
5h-00 6h-00 229 9 46 20 16 17 6 - - 7 15 4 4 10 - 383 710
2,664 183 653 267 242 296 133 15 3 181 136 39 26 47 2 4887 9,909 6,023
8h-00 9h-00 28 0 14 2 11 2 0 0 0 5 18 4 3 19 0 106 194
9h-00 10h-00 3 0 4 0 6 5 4 0 0 5 7 0 1 7 0 42 87
10h-00 11h-00 5 0 2 0 7 4 1 0 1 0 11 0 2 4 0 37 63
36 0 20 2 24 11 5 0 1 10 36 4 6 30 0 185 344
2,700 183 673 269 266 307 138 15 4 191 172 43 32 77 2 5,072 10,253
5,785 327 1,339 471 507 602 249 36 132 224 288 80 52 109 52 10,253 58.7%
56.4% 3.2% 13.1% 4.6% 4.9% 5.9% 2.4% 0.4% 1.3% 2.2% 2.8% 0.8% 0.5% 1.1% 0.5%
6,711 379 1,553 546 588 698 289 42 153 260 334 93 60 126 60 11,893 50.6%
56.4% 3.2% 13.1% 4.6% 4.9% 5.9% 2.4% 0.4% 1.3% 2.2% 2.8% 0.8% 0.5% 1.1% 0.5%
Total
Both side
Peak
Hour
(14 hr)
3,788
2,235
Total
each
hours
At Day
Sub-Total
Total % 24 hr.
Sub-Total
Total Side 2
Total Both side
Total % 14 hr.
Total Both side
At Night
From Kampong Chhnang to Phnom Penh ( Side 2)
Start Time
Motorised
Moto-
cycle
Moto-
cycleCar Jeep/4wd Pick-up Minibus Bus Koyun/Etan
Truck *
NR5 Lot 1, Kampong Tralach District, Kampong Chhnang Province
TRAFFIC COUNT in Vehicles
III - 6

Appendix III (b)
Light Med Heavy Heavey Heavy Heavy
incl.3
wheel
Max
7 Seats
Max
7 seats
Freight
Use
8-16
seats16+Seats Small Large 2-4 tone >4 tone
Rigid
3 Axle
Rigid
4 Axle
S Trailer
5 Axle
Straile
6 Axle
From To
7h-00 8h-00 262 2 19 13 23 12 - 6 2 5 9 2 - 5 - 360
8h-00 9h-00 234 5 19 6 25 14 2 2 - 6 3 2 1 5 - 324
9h-00 10h-00 264 7 37 16 33 18 16 2 1 7 13 - - 3 - 417
10h-00 11h-00 139 4 36 21 14 12 17 1 - 2 6 3 1 2 - 258
11h-00 12h-00 116 4 41 26 18 13 13 1 - 3 10 - 2 - - 247
12h-00 1h-00 77 2 18 9 15 15 19 - 1 8 5 6 2 3 - 180
1h-00 2h-00 83 4 38 11 11 12 5 4 - 6 14 5 1 5 - 199
2h-00 3h-00 102 1 30 14 21 24 10 - - 4 9 5 4 4 - 228
3h-00 4h-00 84 2 25 16 17 13 9 - - 4 5 5 2 3 - 185
4h-00 5h-00 124 2 21 13 9 3 8 1 2 1 5 1 2 11 1 204
5h-00 6h-00 150 9 15 9 9 2 7 - - 2 7 0 6 8 - 224
1,635 42 299 154 195 138 106 17 6 48 86 29 21 49 1 2826
8h-00 9h-00 52 0 11 0 3 4 2 0 4 1 7 2 0 9 0 95
9h-00 10h-00 32 2 8 4 3 3 0 0 0 4 3 2 3 4 0 68
10h-00 11h-00 7 0 4 2 5 3 4 0 1 0 2 4 2 9 0 43
91 2 23 6 11 10 6 0 5 5 12 8 5 22 0 206
1,726 44 322 160 206 148 112 17 11 53 98 37 26 71 1 3,032
Minibus Bus Koyun/EtanTruck *
Sub-Total
At Night
Sub-Total
Total Side 1
Total
each
hours
At Day
TRAFFIC COUNT in Vehicles
NR5 Lot 2, Punlai District, Pursat Province
From Kampong Chhnang to Pursat (Side 1)
Start Time
Motorised
Moto-
cycle
Moto-
cycleCar Jeep/4wd Pick-up
III - 7

Appendix III (b)
Light Med Heavy Heavey Heavy Heavy
incl.3
wheel
Max
7 Seats
Max
7 seats
Freight
Use
8-16
seats16+Seats Small Large 2-4 tone >4 tone
Rigid
3 Axle
Rigid
4 Axle
S Trailer
5 Axle
Straile
6 Axle
From To
7h-00 8h-00 275 4 19 4 9 16 1 2 3 - 5 2 3 4 - 347 707
8h-00 9h-00 223 4 22 6 18 25 3 4 - 3 4 - 1 4 - 317 641
9h-00 10h-00 170 2 26 10 20 9 12 2 6 1 14 1 - 2 - 275 692
10h-00 11h-00 126 5 20 10 12 5 14 1 1 - 4 - 3 3 - 204 462
11h-00 12h-00 89 3 33 9 18 16 15 1 1 2 7 3 - - - 197 444
12h-00 1h-00 85 1 30 14 21 18 19 - 4 1 8 1 1 6 - 209 389
1h-00 2h-00 84 3 20 6 13 7 18 2 3 2 13 1 1 2 - 175 374
2h-00 3h-00 83 3 17 12 18 11 8 1 6 1 9 5 0 4 - 178 406
3h-00 4h-00 100 2 25 18 13 12 11 - 5 1 9 3 2 1 - 202 387
4h-00 5h-00 125 3 20 15 13 7 4 6 3 1 11 2 0 5 - 215 419
5h-00 6h-00 134 7 16 10 11 8 8 4 6 1 5 2 0 1 - 213 437
1,494 37 248 114 166 134 113 23 38 13 89 20 11 32 - 2532 5,358 3,283
8h-00 9h-00 47 2 9 3 4 3 1 1 5 1 11 0 1 6 0 94 189
9h-00 10h-00 24 0 16 4 15 5 0 0 0 0 11 7 3 4 0 89 157
10h-00 11h-00 10 0 13 0 6 4 1 0 0 0 6 1 3 5 0 49 92
81 2 38 7 25 12 2 1 5 1 28 8 7 15 0 232 438
1,575 39 286 121 191 146 115 24 43 14 117 28 18 47 0 2,764 5,796
3,301 83 608 281 397 294 227 41 54 67 215 65 44 118 1 5,796 56.6%
57.0% 1.4% 10.5% 4.8% 6.8% 5.1% 3.9% 0.7% 0.9% 1.2% 3.7% 1.1% 0.8% 2.0% 0.0%
3,829 96 705 326 461 341 263 48 63 78 249 75 51 137 1 6,723 48.8%
57.0% 1.4% 10.5% 4.8% 6.8% 5.1% 3.9% 0.7% 0.9% 1.2% 3.7% 1.1% 0.8% 2.0% 0.0%
Total
Both
side
Peak
Hour
2,040
1,243
Total
each
hours
At Day
Sub-Total
Total % 24 hr.
Sub-Total
Total Side 2
Total Both side
Total % 14 hr.
Total Both side
At Night
From Pursat to Kampong Chhnang (Side 2)
Start Time
Motorised
Moto-
cycle
Moto-
cycleCar Jeep/4wd Pick-up Minibus Bus Koyun/Etan
Truck *
NR5 Lot 2, Punlai District, Pursat Province
TRAFFIC COUNT in Vehicles
III - 8

Appendix III (c)
Small Large Light Med Heavy Heavey Heavy Heavy
incl.3
wheel
Max
7 Seats
Max
7 seats
Freight
Use 8-16 seats 16+Seats 2-4 tone >4 tone
Rigid
3 Axle
Rigid
4 Axle
S Trailer
5 Axle
Straile
6 Axle
From To
7h-00 8h-00 208 24 37 14 29 53 0 0 0 25 4 3 4 4 0 405
8h-00 9h-00 221 25 39 20 30 51 1 1 1 33 6 2 2 7 6 445
9h-00 10h-00 164 21 39 14 25 60 1 1 2 29 12 4 5 4 3 384
10h-00 11h-00 164 15 35 14 14 54 5 0 1 18 5 5 1 2 0 333
11h-00 12h-00 162 19 29 14 20 42 3 3 1 19 12 3 1 1 0 329
12h-00 1h-00 133 12 30 12 24 34 4 0 2 21 14 12 3 8 0 309
1h-00 2h-00 152 16 34 16 15 24 7 2 0 14 9 10 3 4 0 306
2h-00 3h-00 172 13 21 17 30 34 1 1 1 15 6 9 3 2 1 326
3h-00 4h-00 152 11 14 13 10 34 1 0 0 10 9 6 4 6 2 272
4h-00 5h-00 211 15 32 23 15 30 5 1 0 6 13 1 3 3 0 358
5h-00 6h-00 142 12 32 19 19 22 5 1 0 8 11 0 3 2 0 276
1881 183 342 176 231 438 33 10 8 198 101 55 32 43 12 3743
20h-00 21h-00 31 0 14 7 10 9 0 0 0 3 5 4 5 5 1 94
21h-00 22h-00 21 0 13 8 6 4 0 2 0 3 9 2 0 2 0 70
22h-00 23h-00 7 0 8 3 3 4 0 0 0 2 12 4 3 1 0 47
59 0 35 18 19 17 0 2 0 8 26 10 8 8 1 211
1881 183 342 176 231 438 33 10 8 198 101 55 32 43 12 3743
1940 183 377 194 250 455 33 12 8 206 127 65 40 51 13 3954
Minibus BusKoyun/Etan Truck *
Total
each
hours
At Day
Sub Total (A)
At Night
Sub Total (B)
Sub Total (A)
Total (Side 1)
TRAFFIC COUNT in Vehicles
NR7 Lot 1, Tboung Khmum District, Kampong Cham Province
from Kompong Cham to Kratie ( Go Staight) (Side 1)
Start Time
Motorised
Motocycle
Motocycle Car Jeep/4wd Pick-up
III - 9

Appendix III (c)
Small Large Light Med Heavy Heavey Heavy Heavy
incl.3
wheel
Max
7 Seats
Max
7 seats
Freight
Use 8-16 seats 16+Seats 2-4 tone >4 tone
Rigid
3 Axle
Rigid
4 Axle
S Trailer
5 Axle
Straile
6 Axle
From To
7h-00 8h-00 77 9 6 5 3 1 0 0 0 1 0 0 1 0 0 103
8h-00 9h-00 108 7 9 6 5 3 0 0 0 7 1 0 0 0 1 147
9h-00 10h-00 92 17 6 4 1 4 0 0 1 2 0 0 1 0 0 128
10h-00 11h-00 60 2 7 5 3 9 0 1 2 1 1 0 0 0 0 91
11h-00 12h-00 62 3 10 1 6 4 0 0 1 1 2 0 0 0 0 90
12h-00 1h-00 67 4 3 5 6 2 0 0 0 2 1 1 0 0 0 91
1h-00 2h-00 44 0 2 0 5 2 0 0 1 1 3 0 0 1 0 59
2h-00 3h-00 80 7 6 1 2 3 0 0 1 5 0 0 0 0 0 105
3h-00 4h-00 84 3 3 3 5 4 0 0 0 5 1 0 0 0 0 108
4h-00 5h-00 97 5 3 5 6 11 0 0 1 1 1 0 0 0 0 130
5h-00 6h-00 105 10 8 2 7 10 0 0 0 3 6 0 0 0 0 151
876 67 63 37 49 53 0 1 7 29 16 1 2 1 1 1203
20h-00 21h-00 6 0 1 1 0 0 0 0 0 0 0 0 0 0 0 8
21h-00 22h-00 0 0 0 0 0 0 0 0 0 0 0 0 0 0 0 0
22h-00 23h-00 0 0 0 0 0 0 0 0 0 0 0 0 0 0 0 0
6 0 1 1 0 0 0 0 0 0 0 0 0 0 0 8
876 67 63 37 49 53 0 1 7 29 16 1 2 1 1 1203
882 67 64 38 49 53 0 1 7 29 16 1 2 1 1 1211
BusKoyun/Etan Truck *
Total
each
hours
from Kratie to Kampong Cham ( Go Staight)
Sub Total (A)
At Night
Sub Total (B)
Sub Total (A)
Total (Side 2)
NR7 Lot 1, Tboung Khmum District, Kampong Cham Province
from Kratie to Kompong Cham ( Go Staight) (Side 2)
Start Time
Motorised
Motocycle
Motocycle Car Jeep/4wd Pick-up Minibus
TRAFFIC COUNT in Vehicles
III - 10

Appendix III (c)
Small Large Light Med Heavy Heavey Heavy Heavy
incl.3
wheel
Max
7 Seats
Max
7 seats
Freight
Use 8-16 seats 16+Seats 2-4 tone >4 tone
Rigid
3 Axle
Rigid
4 Axle
S Trailer
5 Axle
Straile
6 Axle
From To
7h-00 8h-00 241 12 15 11 20 57 5 0 1 18 7 0 0 0 0 387
8h-00 9h-00 249 12 26 16 25 109 0 2 3 15 4 3 0 1 0 465
9h-00 10h-00 203 12 27 24 20 59 2 8 2 27 11 5 0 1 0 401
10h-00 11h-00 173 17 33 25 19 46 2 8 4 11 12 3 3 1 0 357
11h-00 12h-00 176 19 41 23 26 42 3 4 2 14 11 4 5 2 0 372
12h-00 1h-00 172 15 27 17 17 35 5 5 0 19 8 13 4 2 0 339
1h-00 2h-00 142 16 49 14 24 41 7 4 0 13 16 2 4 2 0 334
2h-00 3h-00 208 14 28 24 38 54 4 1 0 22 19 6 5 0 0 423
3h-00 4h-00 181 14 43 19 12 18 1 0 0 20 8 1 5 0 0 322
4h-00 5h-00 167 14 32 27 27 23 2 2 3 21 16 13 6 8 0 361
5h-00 6h-00 126 10 37 28 17 23 1 3 5 14 16 4 6 11 0 301
2038 155 358 228 245 507 32 37 20 194 128 54 38 28 0 4062
20h-00 21h-00 30 2 19 17 12 4 0 0 1 7 8 6 3 10 0 119
21h-00 22h-00 28 1 14 7 6 4 0 0 1 6 7 6 5 2 0 87
22h-00 23h-00 15 1 2 5 5 5 0 0 0 3 1 4 1 2 0 44
73 4 35 29 23 13 0 0 2 16 16 16 9 14 0 250
2038 155 358 228 245 507 32 37 20 194 128 54 38 28 0 4062
2111 159 393 257 268 520 32 37 22 210 144 70 47 42 0 4312
Koyun/Etan Truck *
Total
each
hours
from Kompong Cham to Kratie ( Turn Left )
Sub Total (A)
At Night
Sub Total (B)
Sub Total (A)
Total (Side 3)
from Kompong Cham to Kratie ( Turn Left ) ( Side 3)
Start Time
Motorised
Motocycle
Motocycle Car Jeep/4wd Pick-up Minibus Bus
NR7 Lot 1, Tboung Khmum District, Kampong Cham Province
TRAFFIC COUNT in Vehicles
III - 11

Appendix III (c)
Small Large Light Med Heavy Heavey Heavy Heavy
incl.3
wheel
Max
7 Seats
Max
7 seats
Freight
Use 8-16 seats 16+Seats 2-4 tone >4 tone
Rigid
3 Axle
Rigid
4 Axle
S Trailer
5 Axle
Straile
6 Axle
From To
7h-00 8h-00 111 13 3 3 10 8 0 0 0 2 1 0 0 0 0 151 1046
8h-00 9h-00 91 6 5 1 7 3 0 1 0 4 1 0 0 0 0 119 1176
9h-00 10h-00 107 6 7 4 1 0 0 2 0 2 0 0 0 0 0 129 1042
10h-00 11h-00 66 5 3 2 1 0 0 0 0 4 0 0 1 0 0 82 863
11h-00 12h-00 45 6 3 4 1 0 0 2 0 2 3 0 0 0 0 66 857
12h-00 1h-00 59 8 2 2 2 2 0 2 1 3 1 0 0 0 0 82 821
1h-00 2h-00 72 6 8 1 3 1 0 1 1 3 2 0 1 0 0 99 798
2h-00 3h-00 51 5 2 1 4 4 0 0 0 4 3 0 0 0 0 74 928
3h-00 4h-00 72 2 5 2 3 1 0 0 0 1 2 1 0 0 0 89 791
4h-00 5h-00 63 2 5 16 6 1 0 0 0 4 1 0 0 0 0 98 947
5h-00 6h-00 61 4 7 2 2 1 0 0 0 2 7 0 0 0 0 86 814
798 63 50 38 40 21 0 8 2 31 21 1 2 0 0 1075 10083 5025
20h-00 21h-00 10 0 4 2 2 1 0 0 0 1 0 0 0 1 0 21 242
21h-00 22h-00 3 0 1 1 2 0 0 0 0 0 0 0 0 0 0 7 164
22h-00 23h-00 2 0 1 0 0 1 0 0 0 0 1 0 0 0 0 5 96
15 0 6 3 4 2 0 0 0 1 1 0 0 1 0 33 502
798 63 50 38 40 21 0 8 2 31 21 1 2 0 0 1075 10083
813 63 56 41 44 23 0 8 2 32 22 1 2 1 0 1108 10585
5746 472 890 530 611 1051 65 58 39 477 309 137 91 95 14 10585 47%
54.3% 4.5% 8.4% 5.0% 5.8% 9.9% 0.6% 0.5% 0.4% 4.5% 2.9% 1.3% 0.9% 0.9% 0.1%
6665.36 547.52 1032.4 614.8 708.76 1219.16 75.4 67.28 45.24 553.32 358.44 158.92 105.56 110.2 16.24 12278.6 41%
54.3% 4.5% 8.4% 5.0% 5.8% 9.9% 0.6% 0.5% 0.4% 4.5% 2.9% 1.3% 0.9% 0.9% 0.1%
Peak
Hours
3264
1761
Start Time
Motorised
Motocycle
Motocycle
from Kratie to Kampong Cham ( Turn Righ )
Total
four side
for each
hours
Sub Total (A)
Total % of 24 hr.
Sub Total (B)
Sub Total (A)
Total (Side 4)
Total Four side
TOTAL OF 24 HOUR
Total % of 14 hr.
At Night
Pick-up Minibus Bus
Total
each
hours
Jeep/4wd Koyun/Etan Truck *
Car
From Kratie to Kompong Cham ( Turn Right ) (Side 4)
TRAFFIC COUNT in Vehicles
NR7 Lot 1, Tboung Khmum District, Kampong Cham Province
III - 12

Appendix III (c)
Small Large Light Med Heavy Heavey Heavy Heavy
incl.3
wheel
Max
7 Seats
Max
7 seats
Freight
Use 8-16 seats 16+Seats 2-4 tone >4 tone
Rigid
3 Axle
Rigid
4 Axle
S Trailer
5 Axle
Straile
6 Axle
From To
7h-00 8h-00 140 4 9 5 10 43 0 3 0 7 30 2 10 1 0 264
8h-00 9h-00 104 5 40 11 8 27 0 0 0 6 19 4 7 2 0 233
9h-00 10h-00 108 11 21 13 16 29 1 2 1 21 17 4 8 2 0 254
10h-00 11h-00 66 3 15 5 13 29 2 1 0 9 13 2 10 0 0 168
11h-00 12h-00 120 10 16 9 19 34 3 2 0 22 24 4 7 0 0 270
12h-00 1h-00 67 4 17 4 16 19 0 0 0 12 8 1 6 0 0 154
1h-00 2h-00 108 2 24 14 24 34 4 2 0 20 25 9 7 2 0 275
2h-00 3h-00 75 5 24 12 20 18 1 0 1 21 12 3 1 1 0 194
3h-00 4h-00 72 3 16 5 15 19 1 2 1 10 15 5 5 1 1 171
4h-00 5h-00 68 9 13 7 6 4 0 2 0 10 7 3 7 0 1 137
5h-00 6h-00 59 8 17 1 16 13 1 1 0 12 13 0 1 1 0 143
987 64 212 86 163 269 13 15 3 150 183 37 69 10 2 2263
20h-00 21h-00 3 0 7 5 4 3 0 0 0 0 4 3 3 0 0 32
21h-00 22h-00 4 0 3 4 2 1 0 0 0 0 3 2 2 0 1 22
22h-00 23h-00 2 0 1 1 2 0 0 0 0 2 0 3 4 3 0 18
9 0 11 10 8 4 0 0 0 2 7 8 9 3 1 72
987 64 212 86 163 269 13 15 3 150 183 37 69 10 2 2263
996 64 223 96 171 273 13 15 3 152 190 45 78 13 3 2335
TRAFFIC COUNT in Vehicles
NR. 7 Lot 2, Tbung Khum District, Kampong Cham Province
from Kompong Cham to Kratie (Side 1)
Start Time
Motorised
Motocycle
Motocycle Car Jeep/4wd Pick-up Minibus BusKoyun/Etan Truck *
Total
each
hours
At Day
Sub Total (A)
At Night
Sub Total (B)
Sub Total (A)
Total (Side 1)
III - 13

Appendix III (c)
Small Large Light Med Heavy Heavey Heavy Heavy
incl.3
wheel
Max
7 Seats
Max
7 seats
Freight
Use 8-16 seats 16+Seats 2-4 tone >4 tone
Rigid
3 Axle
Rigid
4 Axle
S Trailer
5 Axle
Straile
6 Axle
From To
7h-00 8h-00 156 6 17 6 20 49 0 0 0 20 6 1 1 0 0 282 546
8h-00 9h-00 160 2 26 14 23 49 1 1 0 9 15 1 2 0 0 303 536
9h-00 10h-00 124 14 23 7 21 53 1 0 1 16 21 3 6 3 0 293 547
10h-00 11h-00 88 11 26 10 14 29 3 0 4 15 14 7 6 0 0 227 395
11h-00 12h-00 96 8 33 15 16 38 4 1 4 28 24 7 10 0 0 284 554
12h-00 1h-00 47 4 14 10 15 23 1 5 3 9 10 5 3 0 0 149 303
1h-00 2h-00 90 6 31 17 32 36 0 3 1 29 16 11 2 5 3 282 557
2h-00 3h-00 71 5 17 15 16 23 0 2 0 15 17 7 6 4 0 198 392
3h-00 4h-00 64 4 15 13 19 19 1 1 1 25 14 16 8 1 0 201 372
4h-00 5h-00 78 2 23 9 27 11 3 1 3 17 20 4 14 2 0 214 351
5h-00 6h-00 58 5 20 20 14 13 0 3 0 15 8 10 9 5 0 180 323
1032 67 245 136 217 343 14 17 17 198 165 72 67 20 3 2613 4876 2303
20h-00 21h-00 11 0 13 4 6 6 0 0 0 5 10 2 2 6 0 65 97
21h-00 22h-00 4 0 10 4 9 1 0 0 2 2 7 0 8 9 0 56 78
22h-00 23h-00 5 1 5 1 2 4 0 0 0 10 3 1 4 3 1 40 58
20 1 28 9 17 11 0 0 2 17 20 3 14 18 1 161 233
1032 67 245 136 217 343 14 17 17 198 165 72 67 20 3 2613 4876
1052 68 273 145 234 354 14 17 19 215 185 75 81 38 4 2774 5109
2048 132 496 241 405 627 27 32 22 367 375 120 159 51 7 5109 45%
40.1% 2.6% 9.7% 4.7% 7.9% 12.3% 0.5% 0.6% 0.4% 7.2% 7.3% 2.3% 3.1% 1.0% 0.1%
2375.68 153.12 575.36 279.56 469.8 727.32 31.32 37.12 25.52 425.72 435 139.2 184.44 59.16 8.12 5926.44 39%
40.1% 2.6% 9.7% 4.7% 7.9% 12.3% 0.5% 0.6% 0.4% 7.2% 7.3% 2.3% 3.1% 1.0% 0.1%
Peak
Hours
1629
674
TRAFFIC COUNT in Vehicles
NR. 7 Lot 2, Tbung Khum District, Kampong Cham Province
from Kratie to Kompong Cham (Side 2)
Start Time
Motorised
Moocycle
Motocycle Car Jeep/4wd Pick-up Minibus BusKoyun/Etan Truck *
Total
each
hours
At Day
Total
Both side
for each
hours
TOTAL OF 24 HOUR
Total % of 14 hr.
Total % of 24 hr.
Sub Total (A)
At Night
Sub Total (B)
Sub Total (A)
Total (Side 1)
Total Both side
III - 14

Appendix III (d)
Small Large Light Med Heavy Heavey Heavy Heavy
incl.3
wheel
Max
7 Seats
Max
7 seats
Freight
Use 8-16 seats 16+Seats 2-4 tone >4 tone
Rigid
3 Axle
Rigid
4 Axle
S Trailer
5 Axle
Straile
6 Axle
From To
7h-00 8h-00 158 6 11 6 6 10 1 3 0 3 3 0 2 0 0 209
8h-00 9h-00 165 3 14 8 8 19 3 1 2 6 8 5 2 0 0 244
9h-00 10h-00 130 6 12 11 12 15 2 1 4 7 7 6 2 0 1 216
10h-00 11h-00 112 4 10 13 11 30 1 0 2 14 20 10 2 1 0 230
11h-00 12h-00 92 0 9 3 10 2 0 0 0 0 0 0 0 0 0 116
12h-00 1h-00 81 2 7 5 7 10 0 0 1 2 8 3 3 0 1 130
1h-00 2h-00 109 3 10 6 7 9 0 1 3 5 7 4 1 0 0 165
2h-00 3h-00 114 1 6 2 3 12 1 2 2 4 8 2 2 0 0 159
3h-00 4h-00 96 2 8 9 4 16 1 3 3 3 10 3 6 2 0 166
4h-00 5h-00 131 10 15 5 8 20 1 0 1 7 5 6 4 3 0 216
5h-00 6h-00 45 0 3 5 6 9 1 1 0 1 2 1 0 0 0 74
1233 37 105 73 82 152 11 12 18 52 78 40 24 6 2 1925
20h-00 21h-00 30 1 7 4 6 8 1 0 0 1 2 2 6 0 0 68
21h-00 22h-00 13 0 5 1 1 1 0 0 0 0 4 1 9 1 0 36
22h-00 23h-00 2 0 3 0 6 1 0 0 0 2 1 4 0 1 0 20
45 1 15 5 13 10 1 0 0 3 7 7 15 2 0 124
1233 37 105 73 82 152 11 12 18 52 78 40 24 6 2 1925
1278 38 120 78 95 162 12 12 18 55 85 47 39 8 2 2049
TRAFFIC COUNT in Vehicles
NR.71, Bosknor Commune, Chamkaleu District, Kampong Cham Province
from Kompong Cham to Bosknor (Side 1)
Start Time
Motorised
Motocycle
Motocycle Car Jeep/4wd Pick-up Minibus BusKoyun/Etan Truck *
Total
each
hours
At Day
Sub Total (A)
At Night
Sub Total (B)
Sub Total (A)
Total (Side 1)
III - 15

Appendix III (d)
Small Large Light Med Heavy Heavey Heavy Heavy
incl.3
wheel
Max
7 Seats
Max
7 seats
Freight
Use 8-16 seats 16+Seats 2-4 tone >4 tone
Rigid
3 Axle
Rigid
4 Axle
S Trailer
5 Axle
Straile
6 Axle
From To
7h-00 8h-00 185 6 10 5 3 17 1 2 0 11 4 2 2 1 0 249 458
8h-00 9h-00 172 6 12 10 4 10 0 3 1 6 2 2 1 0 0 229 473
9h-00 10h-00 166 3 7 5 6 7 2 0 0 7 1 6 3 2 0 215 431
10h-00 11h-00 121 4 9 8 3 4 2 3 0 9 0 4 2 1 0 170 400
11h-00 12h-00 92 7 5 8 0 11 4 2 1 1 3 5 2 2 0 143 259
12h-00 1h-00 72 7 11 7 2 9 1 5 1 6 3 7 5 0 0 136 266
1h-00 2h-00 97 1 4 6 6 7 0 3 0 7 3 3 3 1 0 141 306
2h-00 3h-00 130 7 7 12 11 21 0 1 1 11 0 3 2 2 0 208 367
3h-00 4h-00 109 3 12 10 7 10 1 2 4 9 1 4 2 2 0 176 342
4h-00 5h-00 80 0 6 10 3 0 0 2 1 6 9 2 2 3 0 124 340
5h-00 6h-00 72 2 3 10 7 11 1 2 0 7 8 2 2 0 0 127 201
1296 46 86 91 52 107 12 25 9 80 34 40 26 14 0 1918 3843 1,903
20h-00 21h-00 30 2 3 3 3 5 0 1 1 1 7 10 2 2 0 70 138
21h-00 22h-00 4 1 0 4 0 3 1 0 0 0 7 2 3 6 0 31 67
22h-00 23h-00 5 0 1 1 0 0 0 0 0 1 4 1 1 0 0 14 34
39 3 4 8 3 8 1 1 1 2 18 13 6 8 0 115 239
1296 46 86 91 52 107 12 25 9 80 34 40 26 14 0 1918 3843
1335 49 90 99 55 115 13 26 10 82 52 53 32 22 0 2033 4082
2613 87 210 177 150 277 25 38 28 137 137 100 71 30 2 4082 46.6%
64.0% 2.1% 5.1% 4.3% 3.7% 6.8% 0.6% 0.9% 0.7% 3.4% 3.4% 2.4% 1.7% 0.7% 0.0%
3031.08 100.92 243.6 205.32 174 321.32 29 44.08 32.48 158.92 158.92 116 82.36 34.8 2.32 4735.12 40.2%
64.0% 2.1% 5.1% 4.3% 3.7% 6.8% 0.6% 0.9% 0.7% 3.4% 3.4% 2.4% 1.7% 0.7% 0.0%
TRAFFIC COUNT in Vehicles
NR.71, Bosknor Commune, Chamkaleu District, Kampong Cham Province
from Bosknor to Kompong Cham (Side 2)
Start Time
Motorised
Motocycle
Motocycle Car Jeep/4wd Pick-up Minibus BusKoyun/Etan Truck *
Total
each
hours
Total % of 24 hr.
Sub Total (A)
At Night
Sub Total (B)
Sub Total (A)
Total (Side 1)
Total Both side
Peak
Hour
1,362
541
Total
Both side
for each
hours
TOTAL OF 24 HOUR
Total % of 14 hr.
At Day
III - 16

Appendix III (e)
Small Large Light Med Heavy Heavey Heavy Heavy
incl.3
wheel
Max
7 Seats
Max
7 seats
Freight
Use 8-16 seats 16+Seats 2-4 tone >4 tone
Rigid
3 Axle
Rigid
4 Axle
S Trailer
5 Axle
Straile
6 Axle
From To
7h-00 8h-00 117 3 7 10 2 0 0 2 0 1 11 2 12 8 0 175
8h-00 9h-00 123 9 8 3 2 4 0 2 0 0 1 0 4 3 0 159
9h-00 10h-00 116 3 4 3 4 3 0 2 0 1 4 4 1 0 1 146
10h-00 11h-00 89 9 9 8 2 1 0 4 1 0 4 2 3 2 1 135
11h-00 12h-00 119 2 10 9 7 6 2 6 0 2 7 0 1 2 0 173
12h-00 1h-00 117 4 27 11 7 6 2 11 3 2 12 6 0 6 0 214
1h-00 2h-00 108 5 9 11 1 3 0 7 1 1 1 3 3 0 0 153
2h-00 3h-00 78 9 8 6 4 2 0 2 1 0 2 3 0 0 0 115
3h-00 4h-00 77 8 5 7 6 3 0 2 3 0 2 6 8 3 1 131
4h-00 5h-00 89 4 9 5 2 3 0 8 5 1 3 0 4 0 1 134
5h-00 6h-00 92 4 9 5 7 5 0 1 0 1 0 0 1 1 1 127
1125 60 105 78 44 36 4 47 14 9 47 26 37 25 5 1662
20h-00 21h-00 23 2 15 3 6 1 0 0 0 0 3 1 0 1 0 55
21h-00 22h-00 3 1 6 3 3 0 0 0 0 0 3 0 3 2 0 24
22h-00 23h-00 17 1 4 2 1 0 0 0 0 0 0 0 1 0 0 26
43 4 25 8 10 1 0 0 0 0 6 1 4 3 0 105
1125 60 105 78 44 36 4 47 14 9 47 26 37 25 5 1662
1168 64 130 86 54 37 4 47 14 9 53 27 41 28 5 1767
TRAFFIC COUNT
NR.72, Tropeng Phlung District
from Kompong Cham to Vietnam border (Side 1)
Start Time
Motorised
Motocycle
Motocycle Car Jeep/4wd Pick-up Minibus BusKoyun/Etan Truck *
Total
each
hours
At Day
Sub Total (A)
At Night
Sub Total (B)
Sub Total (A)
Total (Side 1)
III - 17

Appendix III (e)
Small Large Light Med Heavy Heavey Heavy Heavy
incl.3
wheel
Max
7 Seats
Max
7 seats
Freight
Use 8-16 seats 16+Seats 2-4 tone >4 tone
Rigid
3 Axle
Rigid
4 Axle
S Trailer
5 Axle
Straile
6 Axle
From To
7h-00 8h-00 74 6 11 2 2 0 0 1 0 1 1 1 0 0 0 99 274
8h-00 9h-00 15 8 5 6 1 0 0 1 0 2 0 0 1 7 0 46 205
9h-00 10h-00 94 5 7 9 5 4 0 0 1 3 3 2 4 1 0 138 284
10h-00 11h-00 96 4 10 8 1 2 0 4 1 4 5 0 9 2 1 147 282
11h-00 12h-00 61 5 7 8 0 4 0 4 3 0 2 5 6 3 0 108 281
12h-00 1h-00 78 7 6 6 2 4 1 6 0 0 8 6 2 0 0 126 340
1h-00 2h-00 100 4 6 5 3 4 3 9 1 2 10 5 3 7 1 163 316
2h-00 3h-00 106 1 10 8 0 1 0 4 1 1 5 5 7 2 0 151 266
3h-00 4h-00 90 5 16 10 5 5 1 6 2 1 9 3 7 0 0 160 291
4h-00 5h-00 159 10 31 13 12 5 1 6 3 0 8 1 4 1 0 254 388
5h-00 6h-00 100 7 6 7 8 5 0 3 2 1 8 6 9 2 0 164 291
973 62 115 82 39 34 6 44 14 15 59 34 52 25 2 1556 3218 1,442
20h-00 21h-00 60 2 14 5 3 0 0 0 0 2 2 1 0 0 0 89 144
21h-00 22h-00 20 1 9 0 0 0 0 0 0 0 0 0 6 0 0 36 60
22h-00 23h-00 15 0 9 6 4 1 0 0 0 0 0 0 0 1 0 36 62
95 3 32 11 7 1 0 0 0 2 2 1 6 1 0 161 266
973 62 115 82 39 34 6 44 14 15 59 34 52 25 2 1556 3218
1068 65 147 93 46 35 6 44 14 17 61 35 58 26 2 1717 3484
2236 129 277 179 100 72 10 91 28 26 114 62 99 54 7 3484 41.4%
64.2% 3.7% 8.0% 5.1% 2.9% 2.1% 0.3% 2.6% 0.8% 0.7% 3.3% 1.8% 2.8% 1.5% 0.2%
2593.76 149.64 321.32 207.64 116 83.52 11.6 105.56 32.48 30.16 132.24 71.92 114.84 62.64 8.12 4041.44 35.7%
64.2% 3.7% 8.0% 5.1% 2.9% 2.1% 0.3% 2.6% 0.8% 0.7% 3.3% 1.8% 2.8% 1.5% 0.2%
763
679
Peak
Hour
TRAFFIC COUNT
NR.72, Tropeng Phlung District
from Vietnam border to Kompong Cham (Side 2)
Start Time
Motorised
Motocycle
Motocycle Car Jeep/4wd Pick-up Minibus BusKoyun/Etan Truck *
Total
each
hours
Total
Both side
for each
hours
TOTAL OF 24 HOUR
Total % of 14 hr.
Total % of 24 hr.
Sub Total (A)
At Night
Sub Total (B)
Sub Total (A)
Total (Side 1)
Total Both side
At Day
III - 18
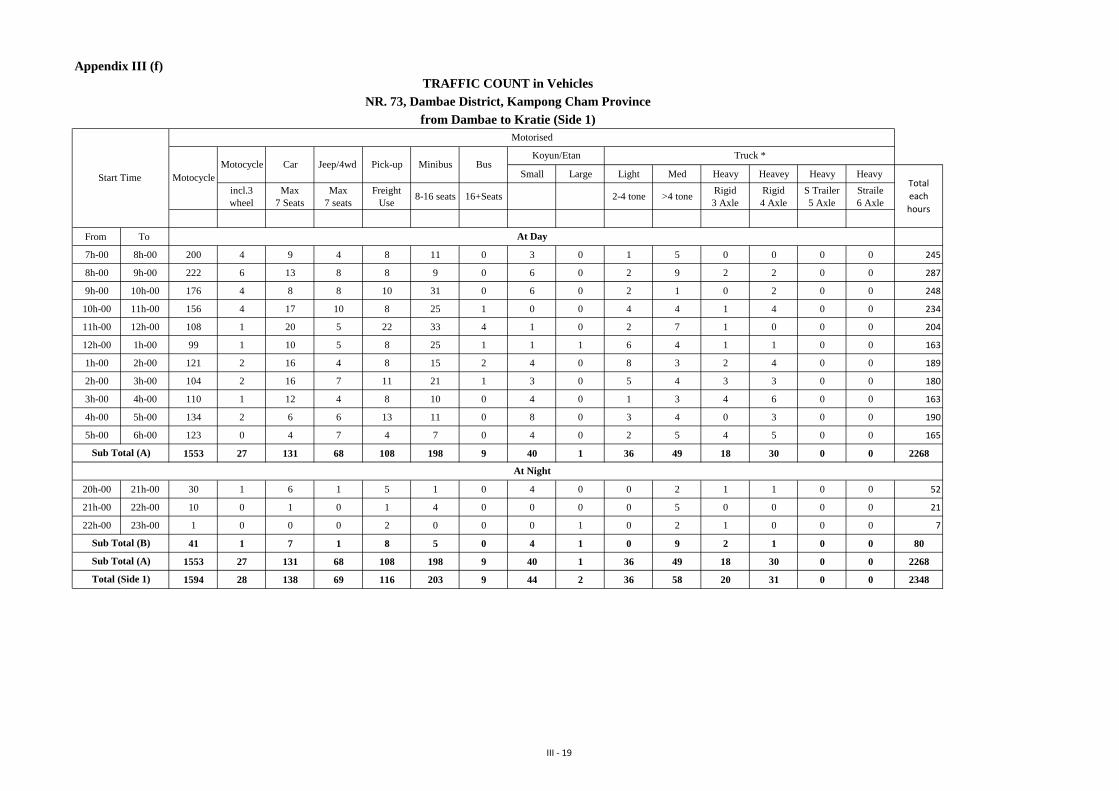
Appendix III (f)
Small Large Light Med Heavy Heavey Heavy Heavy
incl.3
wheel
Max
7 Seats
Max
7 seats
Freight
Use 8-16 seats 16+Seats 2-4 tone >4 tone
Rigid
3 Axle
Rigid
4 Axle
S Trailer
5 Axle
Straile
6 Axle
From To
7h-00 8h-00 200 4 9 4 8 11 0 3 0 1 5 0 0 0 0 245
8h-00 9h-00 222 6 13 8 8 9 0 6 0 2 9 2 2 0 0 287
9h-00 10h-00 176 4 8 8 10 31 0 6 0 2 1 0 2 0 0 248
10h-00 11h-00 156 4 17 10 8 25 1 0 0 4 4 1 4 0 0 234
11h-00 12h-00 108 1 20 5 22 33 4 1 0 2 7 1 0 0 0 204
12h-00 1h-00 99 1 10 5 8 25 1 1 1 6 4 1 1 0 0 163
1h-00 2h-00 121 2 16 4 8 15 2 4 0 8 3 2 4 0 0 189
2h-00 3h-00 104 2 16 7 11 21 1 3 0 5 4 3 3 0 0 180
3h-00 4h-00 110 1 12 4 8 10 0 4 0 1 3 4 6 0 0 163
4h-00 5h-00 134 2 6 6 13 11 0 8 0 3 4 0 3 0 0 190
5h-00 6h-00 123 0 4 7 4 7 0 4 0 2 5 4 5 0 0 165
1553 27 131 68 108 198 9 40 1 36 49 18 30 0 0 2268
20h-00 21h-00 30 1 6 1 5 1 0 4 0 0 2 1 1 0 0 52
21h-00 22h-00 10 0 1 0 1 4 0 0 0 0 5 0 0 0 0 21
22h-00 23h-00 1 0 0 0 2 0 0 0 1 0 2 1 0 0 0 7
41 1 7 1 8 5 0 4 1 0 9 2 1 0 0 80
1553 27 131 68 108 198 9 40 1 36 49 18 30 0 0 2268
1594 28 138 69 116 203 9 44 2 36 58 20 31 0 0 2348
TRAFFIC COUNT in Vehicles
NR. 73, Dambae District, Kampong Cham Province
from Dambae to Kratie (Side 1)
Start Time
Motorised
Motocycle
Motocycle Car Jeep/4wd Pick-up Minibus BusKoyun/Etan Truck *
Total
each
hours
At Day
Sub Total (A)
At Night
Sub Total (B)
Sub Total (A)
Total (Side 1)
III - 19
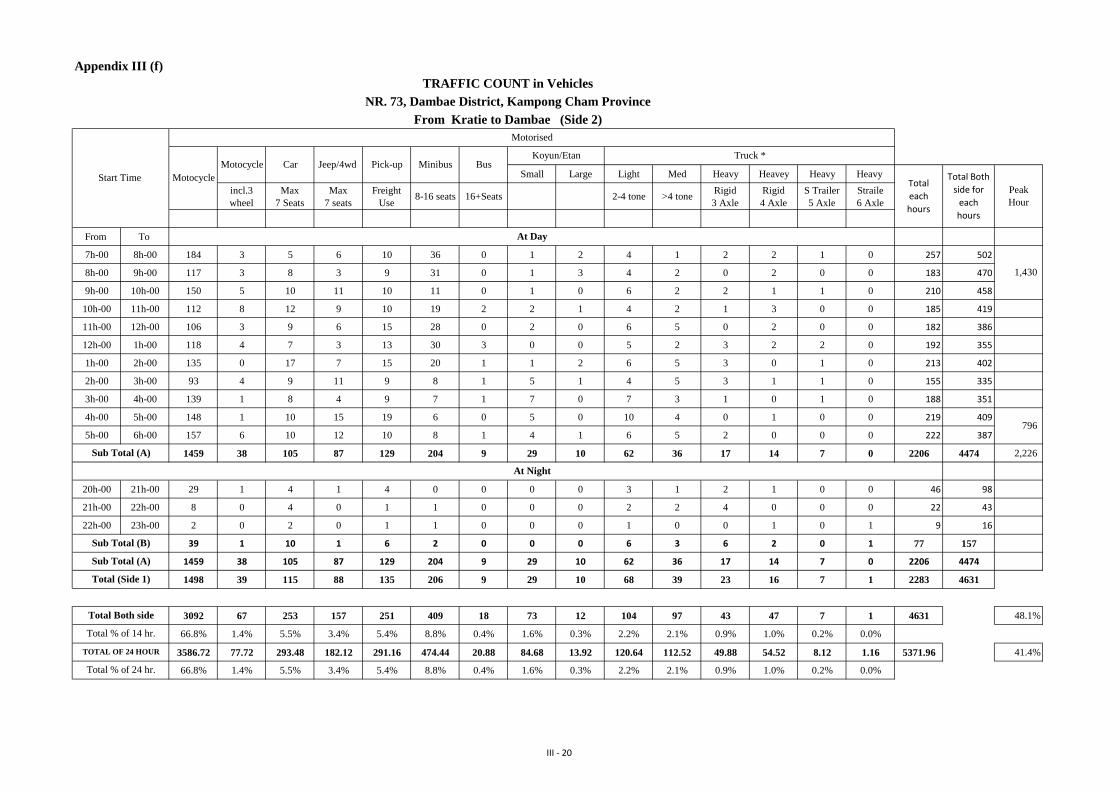
Appendix III (f)
Small Large Light Med Heavy Heavey Heavy Heavy
incl.3
wheel
Max
7 Seats
Max
7 seats
Freight
Use 8-16 seats 16+Seats 2-4 tone >4 tone
Rigid
3 Axle
Rigid
4 Axle
S Trailer
5 Axle
Straile
6 Axle
From To
7h-00 8h-00 184 3 5 6 10 36 0 1 2 4 1 2 2 1 0 257 502
8h-00 9h-00 117 3 8 3 9 31 0 1 3 4 2 0 2 0 0 183 470
9h-00 10h-00 150 5 10 11 10 11 0 1 0 6 2 2 1 1 0 210 458
10h-00 11h-00 112 8 12 9 10 19 2 2 1 4 2 1 3 0 0 185 419
11h-00 12h-00 106 3 9 6 15 28 0 2 0 6 5 0 2 0 0 182 386
12h-00 1h-00 118 4 7 3 13 30 3 0 0 5 2 3 2 2 0 192 355
1h-00 2h-00 135 0 17 7 15 20 1 1 2 6 5 3 0 1 0 213 402
2h-00 3h-00 93 4 9 11 9 8 1 5 1 4 5 3 1 1 0 155 335
3h-00 4h-00 139 1 8 4 9 7 1 7 0 7 3 1 0 1 0 188 351
4h-00 5h-00 148 1 10 15 19 6 0 5 0 10 4 0 1 0 0 219 409
5h-00 6h-00 157 6 10 12 10 8 1 4 1 6 5 2 0 0 0 222 387
1459 38 105 87 129 204 9 29 10 62 36 17 14 7 0 2206 4474 2,226
20h-00 21h-00 29 1 4 1 4 0 0 0 0 3 1 2 1 0 0 46 98
21h-00 22h-00 8 0 4 0 1 1 0 0 0 2 2 4 0 0 0 22 43
22h-00 23h-00 2 0 2 0 1 1 0 0 0 1 0 0 1 0 1 9 16
39 1 10 1 6 2 0 0 0 6 3 6 2 0 1 77 157
1459 38 105 87 129 204 9 29 10 62 36 17 14 7 0 2206 4474
1498 39 115 88 135 206 9 29 10 68 39 23 16 7 1 2283 4631
3092 67 253 157 251 409 18 73 12 104 97 43 47 7 1 4631 48.1%
66.8% 1.4% 5.5% 3.4% 5.4% 8.8% 0.4% 1.6% 0.3% 2.2% 2.1% 0.9% 1.0% 0.2% 0.0%
3586.72 77.72 293.48 182.12 291.16 474.44 20.88 84.68 13.92 120.64 112.52 49.88 54.52 8.12 1.16 5371.96 41.4%
66.8% 1.4% 5.5% 3.4% 5.4% 8.8% 0.4% 1.6% 0.3% 2.2% 2.1% 0.9% 1.0% 0.2% 0.0%
TRAFFIC COUNT in Vehicles
NR. 73, Dambae District, Kampong Cham Province
From Kratie to Dambae (Side 2)
Start Time
Motorised
Motocycle
Motocycle Car Jeep/4wd Pick-up Minibus BusKoyun/Etan Truck *
Total
each
hours
Total % of 24 hr.
Sub Total (A)
At Night
Sub Total (B)
Sub Total (A)
Total (Side 1)
Total Both side
1,430
796
Peak
Hour
Total Both
side for
each
hours
TOTAL OF 24 HOUR
Total % of 14 hr.
At Day
III - 20

Appendix III (g)
Small Large Light Med Heavy Heavey Heavy Heavy
incl.3
wheel
Max
7 Seats
Max
7 seats
Freight
Use 8-16 seats 16+Seats 2-4 tone >4 tone
Rigid
3 Axle
Rigid
4/5 Axle
S Trailer
4/5 Axle
Straile
6 Axle
From To
7h-00 8h-00 197 11 2 2 3 4 0 9 1 2 2 2 2 0 0 237
8h-00 9h-00 150 8 3 2 4 0 1 1 0 1 1 1 0 0 0 172
9h-00 10h-00 170 5 13 4 2 5 0 5 1 1 1 2 1 0 0 210
10h-00 11h-00 137 3 6 2 3 12 0 3 1 4 1 0 1 0 0 173
11h-00 12h-00 74 2 3 2 1 2 1 4 0 2 1 0 0 0 0 92
12h-00 1h-00 110 1 2 1 5 5 0 2 0 0 0 2 0 0 0 128
1h-00 2h-00 85 5 6 0 7 5 0 3 0 1 0 0 1 0 0 113
2h-00 3h-00 104 3 1 1 2 10 0 1 1 2 3 1 0 0 0 129
3h-00 4h-00 93 2 5 1 5 1 0 1 0 2 0 0 0 0 0 110
4h-00 5h-00 85 3 1 0 1 4 0 3 0 1 1 0 0 0 0 99
5h-00 6h-00 108 3 6 1 1 6 0 2 1 2 1 0 0 0 0 131
1313 46 48 16 34 54 2 34 5 18 11 8 5 0 0 1594
20h-00 21h-00 18 0 1 0 2 1 0 1 1 2 0 0 0 0 0 26
21h-00 22h-00 15 0 0 0 1 1 0 0 0 2 0 0 0 0 0 19
22h-00 23h-00 8 0 1 0 0 0 0 0 2 1 0 0 2 0 0 14
41 0 2 0 3 2 0 1 3 5 0 0 2 0 0 59
1313 46 48 16 34 54 2 34 5 18 11 8 5 0 0 1594
1354 46 50 16 37 56 2 35 8 23 11 8 7 0 0 1653
Total
each
hours
from Thnol Bek to Speu
Sub Total (A)
At Night
Sub Total (B)
Sub Total (A)
Total (Side 1)
TRAFFIC COUNT in Vehicles
NR.2714, Chamkaleu District, Kampong Cham Province
from Thnol Bek to Speu (Side 1)
Start Time
Motorised
Motocycle
Motocycle Car Jeep/4wd Pick-up Minibus BusKoyun/Etan Truck *
III - 21

Appendix III (g)
Small Large Light Med Heavy Heavey Heavy Heavy
incl.3
wheel
Max
7 Seats
Max
7 seats
Freight
Use 8-16 seats 16+Seats 2-4 tone >4 tone
Rigid
3 Axle
Rigid
4/5 Axle
S Trailer
4/5 Axle
Straile
6 Axle
From To
7h-00 8h-00 135 4 2 2 0 5 0 0 3 0 1 3 0 0 0 155 392
8h-00 9h-00 137 1 4 3 3 3 0 0 4 3 1 1 0 0 0 160 332
9h-00 10h-00 102 1 0 1 2 0 0 0 1 0 6 0 2 0 0 115 325
10h-00 11h-00 75 2 2 0 6 2 0 1 3 0 1 4 1 0 0 97 270
11h-00 12h-00 80 4 3 2 2 7 0 0 0 4 6 1 0 0 0 109 201
12h-00 1h-00 125 1 3 5 12 1 0 0 3 1 0 2 1 0 0 154 282
1h-00 2h-00 110 6 3 1 4 4 0 1 0 1 5 1 4 0 0 140 253
2h-00 3h-00 147 6 5 0 1 4 0 1 2 0 5 0 2 0 0 173 302
3h-00 4h-00 78 6 5 1 4 2 0 1 3 2 3 0 1 0 0 106 216
4h-00 5h-00 97 2 2 1 4 3 0 0 7 3 0 3 2 0 0 124 223
5h-00 6h-00 115 5 1 3 3 1 0 2 4 5 2 0 0 0 0 141 272
1201 38 30 19 41 32 0 6 30 19 30 15 13 0 0 1474 3068 1,544
20h-00 21h-00 24 0 3 2 6 2 0 0 1 0 2 0 0 0 0 40 66
21h-00 22h-00 5 0 0 0 2 0 0 0 2 0 4 0 0 0 0 13 32
22h-00 23h-00 0 0 0 0 1 0 0 1 1 0 5 1 1 0 0 10 24
29 0 3 2 9 2 0 1 4 0 11 1 1 0 0 63 122
1201 38 30 19 41 32 0 6 30 19 30 15 13 0 0 1474 3068
1230 38 33 21 50 34 0 7 34 19 41 16 14 0 0 1537 3190
2584 84 83 37 87 90 2 42 42 42 52 24 21 0 0 3190 48.4%
81.0% 2.6% 2.6% 1.2% 2.7% 2.8% 0.1% 1.3% 1.3% 1.3% 1.6% 0.8% 0.7% 0.0% 0.0%
2997.44 97.44 96.28 42.92 100.92 104.4 2.32 48.72 48.72 48.72 60.32 27.84 24.36 0 0 3700.4 41.7%
81.0% 2.6% 2.6% 1.2% 2.7% 2.8% 0.1% 1.3% 1.3% 1.3% 1.6% 0.8% 0.7% 0.0% 0.0%
Peak
Hour
1,049
495
TRAFFIC COUNT in Vehicles
NR.2714, Chamkaleu District, Kampong Cham Province
from Speu to Thnol Bek (Side 2)
Start Time
Motorised
Motocycle
Motocycle Car Jeep/4wd Pick-up Minibus BusKoyun/Etan Truck *
Total
each
hours
Total
Both side
for each
hours
from Speu to Thnol Bek
TOTAL OF 24 HOUR
Total % of 14 hr.
Total % of 24 hr.
Sub Total (A)
At Night
Sub Total (B)
Sub Total (A)
Total (Side 1)
Total Both side
III - 22

Small Large Light Med Heavy Heavey Heavy Heavy
incl.3
wheel
Max
7 Seats
Max
7 seats
Freight
Use 8-16 seats 16+Seats 2-4 tone >4 tone
Rigid
3 Axle
Rigid
4 Axle
S Trailer
5 Axle
Straile
6 Axle
0.5 1 1 1 1 1.5 3 1.5 1.5 1.5 3 3 4.5 4.5 4.5
From To
7h-00 8h-00 83 2 10 9 3 12 21 2 2 6 12 3 14 18 - 195.5
8h-00 9h-00 84 3 17 12 9 17 24 - - 8 27 3 27 5 - 234
9h-00 10h-00 73 1 19 10 4 29 30 - - 9 21 6 18 9 - 228
10h-00 11h-00 67 3 26 14 7 27 30 3 2 5 21 6 18 18 - 245.5
11h-00 12h-00 68 8 19 10 8 35 18 - - 6 6 15 18 14 - 224
12h-00 1h-00 54 7 18 7 2 26 18 - 2 8 15 3 9 23 - 189.5
1h-00 2h-00 57 2 15 7 3 26 15 - 3 11 15 9 14 14 - 188.5
2h-00 3h-00 53 4 17 3 3 39 18 2 - 9 12 3 32 18 - 212
3h-00 4h-00 53 3 20 9 8 56 36 2 - 12 6 6 23 18 - 250
4h-00 5h-00 58 - 15 9 2 60 30 2 2 5 15 6 - 14 - 215.5
5h-00 6h-00 38 3 20 10 3 44 33 - 5 6 9 - 27 9 - 206
685 36 196 100 52 368 273 9 14 83 159 60 198 158 - 2388.5
8h-00 9h-00 13 0 8 5 3 1 2 1 2 0 1 0 4 5 0 45
9h-00 10h-00 3 0 3 3 2 0 3 5 0 0 2 0 2 10 1 34
10h-00 11h-00 4 1 8 3 1 0 2 1 1 0 2 0 1 3 0 27
20 1 19 11 6 1 7 7 3 0 5 0 7 18 1 106
685 36 196 100 52 368 273 9 14 83 159 60 198 158 - 2,389
704.5 37 215 111 58 368.5 280 16 16.5 82.5 164 60 205 175.5 1 2494.5
Appendix III A (a)
TRAFFIC COUNT in PCUs
From Neak Leung to Kampong Trobek (Side 1)
Car Jeep/4wd Pick-up Minibus BusKoyun/Etan Truck *
NR.1 Lot 1, Kampong Trobek District, Prey Veng Province
Total
each
hours
Sub-Total (A)
Total Side (I)
Start Time
Motocycle
Motorised
Motocycle
Sub-Total (B)
At Day
Sub-Total (A)
At Night
III A - 1

Appendix III A (a)
Small Large Light Med Heavy Heavey Heavy Heavy
incl.3
wheel
Max
7 Seats
Max
7 seats
Freight
Use 8-16 seats 16+Seats 2-4 tone >4 tone
Rigid
3 Axle
Rigid
4 Axle
S Trailer
5 Axle
Straile
6 Axle
0.5 1 1 1 1 1.5 3 1.5 1.5 1.5 3 3 4.5 4.5 4.5
From To 166.6
7h-00 8h-00 92 7 10 1 2 56 - 5 - 2 18 3 18 9 - 221 416.5
8h-00 9h-00 103 6 21 12 8 95 12 2 9 - 9 3 18 - - 296.5 530.5
9h-00 10h-00 91 5 21 10 3 107 33 9 5 2 9 9 5 18 - 324.5 552.5
10h-00 11h-00 69 4 16 12 5 54 27 5 5 - 9 6 32 - - 242 487.5
11h-00 12h-00 50 5 19 10 3 32 24 5 - - 18 9 32 9 - 214.5 438.5
12h-00 1h-00 34 3 6 10 10 21 9 6 6 2 18 3 18 27 - 172 361.5
1h-00 2h-00 59 3 21 15 8 21 15 6 2 - 21 6 36 23 - 235 423.5
2h-00 3h-00 45 2 25 23 3 26 12 - 6 2 15 6 14 9 5 191 403
3h-00 4h-00 61 1 26 15 11 12 6 2 6 - 12 3 18 32 - 204 454
4h-00 5h-00 70 4 10 12 5 12 12 11 3 - 15 - 14 9 - 176 391.5
5h-00 6h-00 40 1 25 10 5 8 12 6 2 - 15 9 23 23 - 177 383
712 41 200 130 63 441 162 54 42 6 159 57 225 158 5 2453.5 4842 2,274
8h-00 9h-00 13 0 8 5 3 1 2 1 2 0 1 0 4 5 0 45 90
9h-00 10h-00 3 0 3 3 2 0 3 5 0 0 2 0 2 10 1 34 68
10h-00 11h-00 4 1 8 3 1 0 2 1 1 0 21 48
20 1 19 11 6 1 7 7 3 0 3 0 6 15 1 100 206
712 41 200 130 63 441 162 54 42 6 159 57 225 158 5 2,454 4842
731.5 42 219 141 69 442 169 61 45 6 162 57 231 172.5 5.5 2553.5 5048
1436 79 434 252 127 810.5 449 77 61.5 88.5 326 117 436 348 6.5 5048 45.0%
28.4% 1.6% 8.6% 5.0% 2.5% 16.1% 8.9% 1.5% 1.2% 1.8% 6.5% 2.3% 8.6% 6.9% 0.1%
1665.76 91.64 503.44 292.32 147.32 940.18 520.84 89.32 71.34 102.66 378.16 135.72 505.76 403.68 7.54 5855.68 38.8%
28.4% 1.6% 8.6% 5.0% 2.5% 16.1% 8.9% 1.5% 1.2% 1.8% 6.5% 2.3% 8.6% 6.9% 0.1%
Total % 14 hr.
Total % 24 hr.
775
Total Both
side for
each
hours
1,500
TRAFFIC COUNT in PCUs
Total
each
hours
Sub-Total (A)
Koyun/Etan Truck *
At Day
Sub-Total (A)
At Night
Sub-Total (B)
From Kampong Trobek to Neak Leung (Side 2)
Jeep/4wd Pick-up
NR.1 Lot 1, Kampong Trobek District, Prey Veng Province
Peak
Hour
Total Both side
Total Side (II)
Minibus Bus
TOTAL OF 24 HOUR
Motorised
MotocycleStart Time
Motocycle Car
III A - 2

Appendix III A, (a)
Small Large Light Med Heavy Heavey Heavy Heavy
incl.3
wheel
Max
7 Seats
Max
7 seats
Freight
Use 8-16 seats 16+Seats 2-4 tone >4 tone
Rigid
3 Axle
Rigid
4 Axle
S Trailer
5 Axle
Straile
6 Axle
0.5 1 1 1 1 1.5 3 1.5 1.5 1.5 3 3 4.5 4.5 4.5
From To
7h-00 8h-00 137 4 10 7 5 3 24 6 - 6 6 - 9 9 - 226
8h-00 9h-00 120 10 11 9 9 12 15 6 - 9 3 - 14 9 - 227
9h-00 10h-00 110 9 14 13 6 5 18 9 2 2 3 3 - 5 - 197
10h-00 11h-00 103 2 11 3 2 14 18 - - 5 12 - 9 5 - 182
11h-00 12h-00 68 4 13 15 4 17 18 - - 2 - 3 - 9 - 152
12h-00 1h-00 56 3 18 8 3 9 6 3 - 6 9 3 9 9 - 142
1h-00 2h-00 47 7 13 4 5 14 9 11 - 3 - - 18 14 - 144
2h-00 3h-00 57 2 12 3 2 14 9 3 - 2 - - - - - 103
3h-00 4h-00 52 5 6 2 1 18 9 5 - 3 6 12 - - - 119
4h-00 5h-00 70 6 17 8 4 5 57 9 - 2 - - - 5 - 182
5h-00 6h-00 80 4 21 9 3 3 12 9 - 3 - - 5 27 5 180
899 56 146 81 44 111 195 60 2 41 39 21 63 90 5 1851.5
8h-00 9h-00 33 - 8 5 1 3 - 2 - 5 3 - 9 14 - 81
9h-00 10h-00 15 - 4 3 3 3 - 2 - 2 - - - 9 - 39.5
10h-00 11h-00 12 - 8 3 1 - - - - 2 - 3 5 9 - 41.5
58.5 0 20 11 5 6 0 3 0 7.5 3 3 13.5 31.5 0 162
899 56 146 81 44 111 195 60 2 41 39 21 63 90 5 1,852
957.5 56 166 92 49 117 195 63 1.5 48 42 24 76.5 121.5 4.5 2013.5
Motocycle
Motorised
Motocycle
Sub-Total (B)
At Day
Sub-Total (A)
At Night
Total
each
hours
Sub-Total (A)
Total Side (I)
Start Time
TRAFFIC COUNT in PCUs
NR.1 Lot 2, Svay Teap District, Svay Rieng Province
From Svay Rieng to Svay Teap (Side 1)
Car Jeep/4wd Pick-up Minibus BusKoyun/Etan Truck *
III A - 3

Appendix III A, (a)
Small Large Light Med Heavy Heavey Heavy Heavy
incl.3
wheel
Max
7 Seats
Max
7 seats
Freight
Use 8-16 seats 16+Seats 2-4 tone >4 tone
Rigid
3 Axle
Rigid
4 Axle
S Trailer
5 Axle
Straile
6 Axle
0.5 1 1 1 1 1.5 3 1.5 1.5 1.5 3 3 4.5 4.5 4.5
From To 216.8
7h-00 8h-00 158 46 12 8 4 32 24 9 - - 3 3 9 9 - 316 542
8h-00 9h-00 112 9 12 5 - 14 36 8 - 2 9 6 14 23 - 247 473.5
9h-00 10h-00 81 11 9 6 7 6 36 14 2 3 3 6 5 9 - 196 393
10h-00 11h-00 74 8 16 3 8 8 33 9 2 3 6 - 14 9 - 191 373
11h-00 12h-00 68 1 10 8 4 6 21 3 2 - 3 - - 23 - 148 299.5
12h-00 1h-00 51 4 11 6 6 15 36 15 2 3 9 - 18 27 - 202 344
1h-00 2h-00 58 4 22 17 2 6 12 6 - - 6 - - - - 133 276
2h-00 3h-00 72 8 18 6 6 8 21 - 2 - - - - 14 - 154 256
3h-00 4h-00 62 1 24 11 4 6 18 - 2 - 3 - 9 23 - 162 280
4h-00 5h-00 72 7 15 7 3 5 27 5 5 - 3 - 5 14 - 165 346.5
5h-00 6h-00 104 5 24 5 6 3 12 2 23 2 9 3 9 23 - 228 407.5
907 104 173 82 50 107 276 69 36 12 54 18 81 171 - 2139.5 3991 2,163
8h-00 9h-00 40 - 15 3 1 2 3 - 5 - 3 - - 27 - 98 178.5
9h-00 10h-00 29 - 5 4 - 6 3 - - - - - 5 14 - 65 104.5
10h-00 11h-00 26 - 4 4 1 2 - 2 3 - 6 - 9 9 - 65 106.5
94.5 0 24 11 2 9 6 1.5 7.5 0 9 0 13.5 49.5 0 227.5 389.5
907 104 173 82 50 107 276 69 36 12 54 18 81 171 - 2,140 3991
1001.5 104 197 93 52 115.5 282 70.5 43.5 12 63 18 94.5 220.5 0 2367 4380.5
1959 160 363 185 101 232.5 477 133.5 45 60 105 42 171 342 4.5 4380.5 49.4%
44.7% 3.7% 8.3% 4.2% 2.3% 5.3% 10.9% 3.0% 1.0% 1.4% 2.4% 1.0% 3.9% 7.8% 0.1%
2272.44 185.6 421.08 214.6 117.16 269.7 553.32 154.86 52.2 69.6 121.8 48.72 198.36 396.72 5.22 5081.38 42.6%
44.7% 3.7% 8.3% 4.2% 2.3% 5.3% 10.9% 3.0% 1.0% 1.4% 2.4% 1.0% 3.9% 7.8% 0.1%
TOTAL OF 24 HOUR
Motorised
MotocycleStart Time
Motocycle Car
Peak
Hour
Total Both side
Total Side (II)
Minibus Bus
Total
each
hours
Sub-Total (A)
Koyun/Etan Truck *
At Day
Sub-Total (A)
At Night
Sub-Total (B)
from Svay Teap to Svay Rieng (Side 2)
Jeep/4wd Pick-up
NR.1 Lot 2, Svay Teap District, Svay Rieng Province
Total % 14 hr.
Total % 24 hr.
754
1,409
TRAFFIC COUNT in PCUs
Total
Both side
for each
hours
III A - 4

Appendix III A, (b)
Small Large Light Med Heavy Heavey Heavy Heavy
incl.3
wheel
Max
7 Seats
Max
7 seats
Freight
Use 8-16 seats 16+Seats 2-4 tone >4 tone
Rigid
3 Axle
Rigid
4 Axle
S Trailer
5 Axle
Straile
6 Axle
0.5 1 1 1 1 1.5 3 1.5 1.5 1.5 3 3 4.5 4.5 4.5
From To
7h-00 8h-00 256 40 48 12 10 44 3 9 14 2 9 - 23 5 45 517.5
8h-00 9h-00 245 12 85 13 15 66 6 - 15 2 36 - - 9 50 552.5
9h-00 10h-00 165 12 70 12 11 74 6 8 - 2 - 6 5 5 36 409
10h-00 11h-00 140 20 58 14 28 38 18 - 14 2 42 12 9 - 9 402
11h-00 12h-00 127 14 54 20 26 36 33 8 15 20 21 3 5 9 9 398
12h-00 1h-00 102 12 49 15 27 33 45 - 17 8 9 6 - 5 14 339.5
1h-00 2h-00 98 6 46 24 16 23 54 2 14 3 27 9 5 5 9 338
2h-00 3h-00 78 5 47 25 32 44 78 3 23 6 39 6 5 - - 389.5
3h-00 4h-00 108 3 90 16 19 24 30 - 32 3 18 21 - 5 23 390
4h-00 5h-00 128 9 50 19 26 33 15 - 23 2 27 15 - 9 9 363.5
5h-00 6h-00 85 7 47 26 17 21 30 - 18 3 21 9 5 27 23 338
1,528 140 644 196 227 434 318 29 182 50 249 87 54 77 225 4437.5
8h-00 9h-00 9 4 11 2 4 5 15 - 11 - 57 15 18 27 - 177
9h-00 10h-00 4 - 7 2 7 2 - 2 - - 27 6 5 32 - 92
10h-00 11h-00 2 - 4 2 3 3 - 2 - - 15 3 14 9 - 55.5
14.5 4 22 6 14 9 15 3 10.5 0 99 24 36 67.5 0 324.5
1,528 140 644 196 227 434 318 29 182 50 249 87 54 77 225 4,438
1542.5 144 666 202 241 442.5 333 31.5 192 49.5 348 111 90 144 225 4762
Sub-Total (B)
At Night
Total
each
hours
TRAFFIC COUNT in PCUs
NR5 Lot 1, Kampong Tralach District, Kampong Chhnang Province
From Phnom Penh to Kampong Chhnang (Side 1)
Motorised
Motocycle
Sub-Total (A)
Total Side (I)
Start Time
Motocycle Car Jeep/4wd Pick-up Minibus BusKoyun/Etan Truck *
from Kompong Chnang to Phnom Penh
Sub-Total (A)
III A - 5

Appendix III A, (b)
Small Large Light Med Heavy Heavey Heavy Heavy
incl.3
wheel
Max
7 Seats
Max
7 seats
Freight
Use 8-16 seats 16+Seats 2-4 tone >4 tone
Rigid
3 Axle
Rigid
4 Axle
S Trailer
5 Axle
Straile
6 Axle
0.5 1 1 1 1 1.5 3 1.5 1.5 1.5 3 3 4.5 4.5 4.5
From To 391.2
7h-00 8h-00 230 14 47 20 25 44 6 5 - 30 33 3 - 5 - 461 978
8h-00 9h-00 223 42 52 30 26 36 60 3 - 27 57 6 9 9 5 585 1137
9h-00 10h-00 173 22 83 26 26 44 36 5 - 33 15 12 - 27 - 501 909.5
10h-00 11h-00 113 19 59 35 24 45 78 3 - 38 66 9 14 9 - 511 913
11h-00 12h-00 78 13 67 21 29 26 51 3 - 23 27 27 - 27 - 391 789
12h-00 1h-00 101 29 54 12 9 35 42 2 - 26 39 27 27 14 - 415 754.5
1h-00 2h-00 73 10 80 23 21 39 30 - - 26 45 6 14 - - 366 703.5
2h-00 3h-00 57 9 71 32 23 51 21 2 5 17 39 - 9 32 - 366 755.5
3h-00 4h-00 70 2 55 17 17 48 27 2 - 26 21 12 23 14 5 337 726.5
4h-00 5h-00 101 14 39 31 26 53 30 - - 18 21 3 5 32 - 371 734.5
5h-00 6h-00 115 9 46 20 16 26 18 - - 11 45 12 18 45 - 380 717.5
1,332 183 653 267 242 444 399 23 5 272 408 117 117 212 9 4681.0 9118.5 5,203
8h-00 9h-00 14 - 14 2 11 3 - - - 8 54 12 14 86 - 216.5 393.5
9h-00 10h-00 2 - 4 - 6 8 12 - - 8 21 - 5 32 - 95.5 187.5
10h-00 11h-00 3 - 2 - 7 6 3 - 2 - 33 - 9 18 - 82 137.5
18 0 20 2 24 16.5 15 0 1.5 15 108 12 27 135 0 394 718.5
1,332 183 653 267 242 444 399 23 5 272 408 117 117 212 9 4,681 9118.5
1350 183 673 269 266 460.5 414 22.5 6 286.5 516 129 144 346.5 9 5075 9837
2892.5 327 1339 471 507 903 747 54 198 336 864 240 234 490.5 234 9837 52.9%
29.4% 3.3% 13.6% 4.8% 5.2% 9.2% 7.6% 0.5% 2.0% 3.4% 8.8% 2.4% 2.4% 5.0% 2.4%
3355.3 379.32 1553.24 546.36 588.12 1047.48 866.52 62.64 229.68 389.76 1002.2 278.4 271.44 568.98 271.44 11411 45.6%
29.4% 3.3% 13.6% 4.8% 5.2% 9.2% 7.6% 0.5% 2.0% 3.4% 8.8% 2.4% 2.4% 5.0% 2.4%
Total % 14 hr.
Total % 24 hr.
Peak
Hour
(14hr.)
3,025
2,179
TOTAL OF 24 HOUR
Motocycle
Total Both side
Total Side (II)
from Phnom Penh to Kompong Chnang
Sub-Total (A)
At Night
Sub-Total (B)
Start Time
Motocycle Car
Sub-Total (A)
NR5 Lot 1, Kampong Tralach District, Kampong Chhnang Province
From Kampong Chhnang to Phnom Penh (Side 2)
Minibus BusKoyun/Etan Truck *
Motorised
Total
each
hours
TRAFFIC COUNT in PCUs
Total
Both
side for
each
hours
Jeep/4wd Pick-up
III A - 6

Appendix III A, (b)
Small Large Light Med Heavy Heavey Heavy Heavy
incl.3
wheel
Max
7 Seats
Max
7 seats
Freight
Use 8-16 seats 16+Seats 2-4 tone >4 tone
Rigid
3 Axle
Rigid
4 Axle
S Trailer
5 Axle
Straile
6 Axle
0.5 1 1 1 1 1.5 3 1.5 1.5 1.5 3 3 4.5 4.5 4.5
From To
7h-00 8h-00 131 2 19 13 23 18 - 9 3 8 27 6 - 23 - 281
8h-00 9h-00 117 5 19 6 25 21 6 3 - 9 9 6 5 23 - 253
9h-00 10h-00 132 7 37 16 33 27 48 3 2 11 39 - - 14 - 367.5
10h-00 11h-00 70 4 36 21 14 18 51 2 - 3 18 9 5 9 - 258.5
11h-00 12h-00 58 4 41 26 18 20 39 2 - 5 30 - 9 - - 250.5
12h-00 1h-00 39 2 18 9 15 23 57 - 2 12 15 18 9 14 - 231
1h-00 2h-00 42 4 38 11 11 18 15 6 - 9 42 15 5 23 - 237.5
2h-00 3h-00 51 1 30 14 21 36 30 - - 6 27 15 18 18 - 267
3h-00 4h-00 42 2 25 16 17 20 27 - - 6 15 15 9 14 - 207
4h-00 5h-00 62 2 21 13 9 5 24 2 3 2 15 3 9 50 5 222.5
5h-00 6h-00 75 9 15 9 9 3 21 - - 3 21 - 27 36 - 228
818 42 299 154 195 207 318 26 9 72 258 87 95 221 5 2803.5
8h-00 9h-00 26 - 11 - 3 6 6 - 6 2 21 6 - 41 - 127
9h-00 10h-00 16 2 8 4 3 5 - - - 6 9 6 14 18 - 90
10h-00 11h-00 4 - 4 2 5 5 12 - 2 - 6 12 9 41 - 100
45.5 2 23 6 11 15 18 0 7.5 7.5 36 24 22.5 99 0 317
818 42 299 154 195 207 318 26 9 72 258 87 95 221 5 2,804
863 44 322 160 206 222 336 25.5 16.5 79.5 294 111 117 319.5 4.5 3120.5
TRAFFIC COUNT in PCUs
Sub-Total (A)
Total Side (I)
Sub-Total (B)
NR5 Lot 2, Punlai District, Pursat Province
From Kompong Chhnang to Pursat (Side 1)
Start Time
Motocycle Car Jeep/4wd
Motorised
Motocycle
Sub-Total (A)
Total
each
hours
Pick-up Minibus BusKoyun/Etan Truck *
At Day
At Night
III A - 7

Appendix III A, (b)
Small Large Light Med Heavy Heavey Heavy Heavy
incl.3
wheel
Max
7 Seats
Max
7 seats
Freight
Use 8-16 seats 16+Seats 2-4 tone >4 tone
Rigid
3 Axle
Rigid
4 Axle
S Trailer
5 Axle
Straile
6 Axle
0.5 1 1 1 1 1.5 3 1.5 1.5 1.5 3 3 4.5 4.5 4.5
From To 216.6
7h-00 8h-00 138 4 19 4 9 24 3 3 5 - 15 6 14 18 - 260.5 541.5
8h-00 9h-00 112 4 22 6 18 38 9 6 - 5 12 - 5 18 - 253 506
9h-00 10h-00 85 2 26 10 20 14 36 3 9 2 42 3 - 9 - 260 627.5
10h-00 11h-00 63 5 20 10 12 8 42 2 2 - 12 - 14 14 - 201.5 460
11h-00 12h-00 45 3 33 9 18 24 45 2 2 3 21 9 - - - 212.5 463
12h-00 1h-00 43 1 30 14 21 27 57 - 6 2 24 3 5 27 - 258.5 489.5
1h-00 2h-00 42 3 20 6 13 11 54 3 5 3 39 3 5 9 - 214.5 452
2h-00 3h-00 42 3 17 12 18 17 24 2 9 2 27 15 - 18 - 204 471
3h-00 4h-00 50 2 25 18 13 18 33 - 8 2 27 9 9 5 - 217.5 424.5
4h-00 5h-00 63 3 20 15 13 11 12 9 5 2 33 6 - 23 - 212.5 435
5h-00 6h-00 67 7 16 10 11 12 24 6 9 2 15 6 - 5 - 189 417
747 37 248 114 166 201 339 35 57 20 267 60 50 144 - 2483.5 5287 2,952
8h-00 9h-00 24 2 9 3 4 5 3 2 8 2 33 - 5 27 - 124 251
9h-00 10h-00 12 - 16 4 15 8 - - - - 33 21 14 18 - 140 230
10h-00 11h-00 5 - 13 - 6 6 3 - - - 18 3 14 23 - 90 190
40.5 2 38 7 25 18 6 1.5 7.5 1.5 84 24 31.5 67.5 0 354 671
747 37 248 114 166 201 339 35 57 20 267 60 50 144 - 2,484 5287
787.5 39 286 121 191 219 345 36 64.5 21 351 84 81 211.5 0 2837.5 5958
1650.5 83 608 281 397 441 681 61.5 81 100.5 645 195 198 531 4.5 5958 49.5%
27.7% 1.4% 10.2% 4.7% 6.7% 7.4% 11.4% 1.0% 1.4% 1.7% 10.8% 3.3% 3.3% 8.9% 0.1%
1914.58 96.28 705.28 325.96 460.52 511.56 789.96 71.34 93.96 116.58 748.2 226.2 229.68 615.96 5.22 6911.28 42.7%
27.7% 1.4% 10.2% 4.7% 6.7% 7.4% 11.4% 1.0% 1.4% 1.7% 10.8% 3.3% 3.3% 8.9% 0.1%
Peak
Hour
1,675
1,277
Total % 14 hr.
Total % 14 hr.
Sub-Total (B)
Start Time
Motocycle Car Jeep/4wd
TOTAL OF 24 HOUR
Total Both side
Sub-Total (A)
Total Side (II)
Truck *
At Day
TRAFFIC COUNT in PCUs
From Pursat to Kompong Chhnang ( Side 2)
NR5 Lot 2, Punlai District, Pursat Province
Total
Both
side for
each
hours
Total
each
hours
Motorised
Motocycle
Koyun/Etan
Sub-Total (A)
At Night
Pick-up Minibus Bus
III A - 8
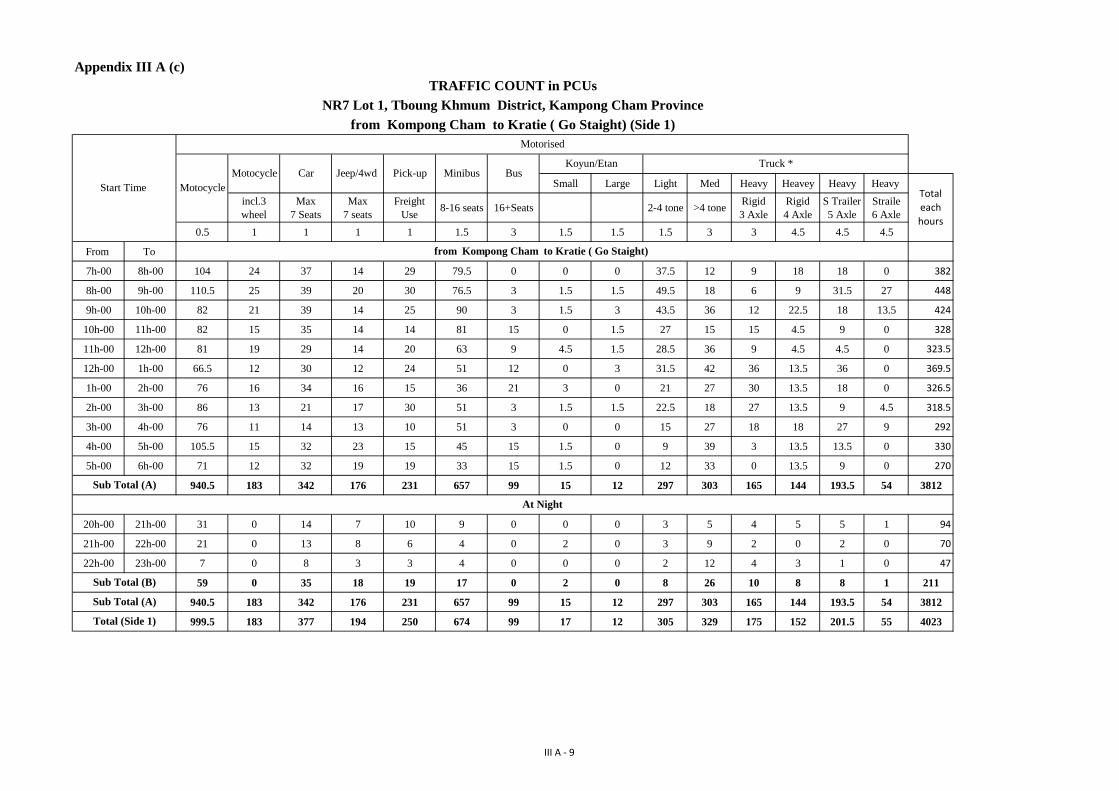
Appendix III A (c)
Small Large Light Med Heavy Heavey Heavy Heavy
incl.3
wheel
Max
7 Seats
Max
7 seats
Freight
Use 8-16 seats 16+Seats 2-4 tone >4 tone
Rigid
3 Axle
Rigid
4 Axle
S Trailer
5 Axle
Straile
6 Axle
0.5 1 1 1 1 1.5 3 1.5 1.5 1.5 3 3 4.5 4.5 4.5
From To
7h-00 8h-00 104 24 37 14 29 79.5 0 0 0 37.5 12 9 18 18 0 382
8h-00 9h-00 110.5 25 39 20 30 76.5 3 1.5 1.5 49.5 18 6 9 31.5 27 448
9h-00 10h-00 82 21 39 14 25 90 3 1.5 3 43.5 36 12 22.5 18 13.5 424
10h-00 11h-00 82 15 35 14 14 81 15 0 1.5 27 15 15 4.5 9 0 328
11h-00 12h-00 81 19 29 14 20 63 9 4.5 1.5 28.5 36 9 4.5 4.5 0 323.5
12h-00 1h-00 66.5 12 30 12 24 51 12 0 3 31.5 42 36 13.5 36 0 369.5
1h-00 2h-00 76 16 34 16 15 36 21 3 0 21 27 30 13.5 18 0 326.5
2h-00 3h-00 86 13 21 17 30 51 3 1.5 1.5 22.5 18 27 13.5 9 4.5 318.5
3h-00 4h-00 76 11 14 13 10 51 3 0 0 15 27 18 18 27 9 292
4h-00 5h-00 105.5 15 32 23 15 45 15 1.5 0 9 39 3 13.5 13.5 0 330
5h-00 6h-00 71 12 32 19 19 33 15 1.5 0 12 33 0 13.5 9 0 270
940.5 183 342 176 231 657 99 15 12 297 303 165 144 193.5 54 3812
20h-00 21h-00 31 0 14 7 10 9 0 0 0 3 5 4 5 5 1 94
21h-00 22h-00 21 0 13 8 6 4 0 2 0 3 9 2 0 2 0 70
22h-00 23h-00 7 0 8 3 3 4 0 0 0 2 12 4 3 1 0 47
59 0 35 18 19 17 0 2 0 8 26 10 8 8 1 211
940.5 183 342 176 231 657 99 15 12 297 303 165 144 193.5 54 3812
999.5 183 377 194 250 674 99 17 12 305 329 175 152 201.5 55 4023
Motocycle
At Night
Start Time
Motorised
Motocycle Car Jeep/4wd Pick-up Minibus BusKoyun/Etan Truck *
from Kompong Cham to Kratie ( Go Staight)
Sub Total (A)
Total
each
hours
Total (Side 1)
Sub Total (B)
TRAFFIC COUNT in PCUs
NR7 Lot 1, Tboung Khmum District, Kampong Cham Province
from Kompong Cham to Kratie ( Go Staight) (Side 1)
Sub Total (A)
III A - 9

Appendix III A (c)
Small Large Light Med Heavy Heavey Heavy Heavy
incl.3
wheel
Max
7 Seats
Max
7 seats
Freight
Use 8-16 seats 16+Seats 2-4 tone >4 tone
Rigid
3 Axle
Rigid
4 Axle
S Trailer
5 Axle
Straile
6 Axle
0.5 1 1 1 1 1.5 3 1.5 1.5 1.5 3 3 4.5 4.5 4.5
From To
7h-00 8h-00 120.5 12 15 11 20 85.5 15 0 1.5 27 21 0 0 0 0 328.5
8h-00 9h-00 124.5 12 26 16 25 163.5 0 3 4.5 22.5 12 9 0 4.5 0 422.5
9h-00 10h-00 101.5 12 27 24 20 88.5 6 12 3 40.5 33 15 0 4.5 0 387
10h-00 11h-00 86.5 17 33 25 19 69 6 12 6 16.5 36 9 13.5 4.5 0 353
11h-00 12h-00 88 19 41 23 26 63 9 6 3 21 33 12 22.5 9 0 375.5
12h-00 1h-00 86 15 27 17 17 52.5 15 7.5 0 28.5 24 39 18 9 0 355.5
1h-00 2h-00 71 16 49 14 24 61.5 21 6 0 19.5 48 6 18 9 0 363
2h-00 3h-00 104 14 28 24 38 81 12 1.5 0 33 57 18 22.5 0 0 433
3h-00 4h-00 90.5 14 43 19 12 27 3 0 0 30 24 3 22.5 0 0 288
4h-00 5h-00 83.5 14 32 27 27 34.5 6 3 4.5 31.5 48 39 27 36 0 413
5h-00 6h-00 63 10 37 28 17 34.5 3 4.5 7.5 21 48 12 27 49.5 0 362
1019 155 358 228 245 760.5 96 55.5 30 291 384 162 171 126 0 4081
20h-00 21h-00 30 2 19 17 12 4 0 0 1 7 8 6 3 10 0 119
21h-00 22h-00 28 1 14 7 6 4 0 0 1 6 7 6 5 2 0 87
22h-00 23h-00 15 1 2 5 5 5 0 0 0 3 1 4 1 2 0 44
73 4 35 29 23 13 0 0 2 16 16 16 9 14 0 250
1019 155 358 228 245 760.5 96 55.5 30 291 384 162 171 126 0 4081
1092 159 393 257 268 773.5 96 55.5 32 307 400 178 180 140 0 4331
TRAFFIC COUNT in PCUs
NR7 Lot 1, Tboung Khmum District, Kampong Cham Province
from Kratie to Kompong Cham ( Go Staight) (Side 2)
Sub Total (B)
from Kratie to Kampong Cham ( Go Staight)
Sub Total (A)
Start Time
Motorised
Motocycle Car Jeep/4wd Pick-up Minibus
Motocycle
At Night
Total
each
hours
BusKoyun/Etan Truck *
Total (Side 21)
Sub Total (A)
III A - 10

Appendix III A (c)
Small Large Light Med Heavy Heavey Heavy Heavy
incl.3
wheel
Max
7 Seats
Max
7 seats
Freight
Use 8-16 seats 16+Seats 2-4 tone >4 tone
Rigid
3 Axle
Rigid
4 Axle
S Trailer
5 Axle
Straile
6 Axle
0.5 1 1 1 1 1.5 3 1.5 1.5 1.5 3 3 4.5 4.5 4.5
From To
7h-00 8h-00 38.5 9 6 5 3 1.5 0 0 0 1.5 0 0 4.5 0 0 69
8h-00 9h-00 54 7 9 6 5 4.5 0 0 0 10.5 3 0 0 0 4.5 103.5
9h-00 10h-00 46 17 6 4 1 6 0 0 1.5 3 0 0 4.5 0 0 89
10h-00 11h-00 30 2 7 5 3 13.5 0 1.5 3 1.5 3 0 0 0 0 69.5
11h-00 12h-00 31 3 10 1 6 6 0 0 1.5 1.5 6 0 0 0 0 66
12h-00 1h-00 33.5 4 3 5 6 3 0 0 0 3 3 3 0 0 0 63.5
1h-00 2h-00 22 0 2 0 5 3 0 0 1.5 1.5 9 0 0 4.5 0 48.5
2h-00 3h-00 40 7 6 1 2 4.5 0 0 1.5 7.5 0 0 0 0 0 69.5
3h-00 4h-00 42 3 3 3 5 6 0 0 0 7.5 3 0 0 0 0 72.5
4h-00 5h-00 48.5 5 3 5 6 16.5 0 0 1.5 1.5 3 0 0 0 0 90
5h-00 6h-00 52.5 10 8 2 7 15 0 0 0 4.5 18 0 0 0 0 117
438 67 63 37 49 79.5 0 1.5 10.5 43.5 48 3 9 4.5 4.5 858
20h-00 21h-00 6 0 1 1 0 0 0 0 0 0 0 0 0 0 0 8
21h-00 22h-00 0 0 0 0 0 0 0 0 0 0 0 0 0 0 0 0
22h-00 23h-00 0 0 0 0 0 0 0 0 0 0 0 0 0 0 0 0
6 0 1 1 0 0 0 0 0 0 0 0 0 0 0 8
438 67 63 37 49 79.5 0 1.5 10.5 43.5 48 3 9 4.5 4.5 858
444 67 64 38 49 79.5 0 1.5 10.5 43.5 48 3 9 4.5 4.5 866
At Night
Total
each
hours
Total (Side 3)
BusKoyun/Etan Truck *
from Kompong Cham to Kratie ( Turn Left )
Sub Total (A)
Sub Total (A)
Start Time
Motorised
Motocycle Car Jeep/4wd Pick-up
TRAFFIC COUNT in PCUs
NR7 Lot 1, Tboung Khmum District, Kampong Cham Province
from Kompong Cham to Kratie ( Turn Left ) ( Side 3)
Minibus
Sub Total (B)
Motocycle
III A - 11

Appendix III A (c)
Small Large Light Med Heavy Heavey Heavy Heavy
incl.3
wheel
Max
7 Seats
Max
7 seats
Freight
Use 8-16 seats 16+Seats 2-4 tone >4 tone
Rigid
3 Axle
Rigid
4 Axle
S Trailer
5 Axle
Straile
6 Axle
0.5 1 1 1 1 1.5 3 1.5 1.5 1.5 3 3 4.5 4.5 4.5
From To 352.8
7h-00 8h-00 55.5 13 3 3 10 12 0 0 0 3 3 0 0 0 0 102.5 882
8h-00 9h-00 45.5 6 5 1 7 4.5 0 1.5 0 6 3 0 0 0 0 79.5 1053.5
9h-00 10h-00 53.5 6 7 4 1 0 0 3 0 3 0 0 0 0 0 77.5 977.5
10h-00 11h-00 33 5 3 2 1 0 0 0 0 6 0 0 4.5 0 0 54.5 805
11h-00 12h-00 22.5 6 3 4 1 0 0 3 0 3 9 0 0 0 0 51.5 816.5
12h-00 1h-00 29.5 8 2 2 2 3 0 3 1.5 4.5 3 0 0 0 0 58.5 847
1h-00 2h-00 36 6 8 1 3 1.5 0 1.5 1.5 4.5 6 0 4.5 0 0 73.5 811.5
2h-00 3h-00 25.5 5 2 1 4 6 0 0 0 6 9 0 0 0 0 58.5 879.5
3h-00 4h-00 36 2 5 2 3 1.5 0 0 0 1.5 6 3 0 0 0 60 712.5
4h-00 5h-00 31.5 2 5 16 6 1.5 0 0 0 6 3 0 0 0 0 71 904
5h-00 6h-00 30.5 4 7 2 2 1.5 0 0 0 3 21 0 0 0 0 71 820
399 63 50 38 40 31.5 0 12 3 46.5 63 3 9 0 0 758 9509 4637
20h-00 21h-00 10 0 4 2 2 1 0 0 0 1 0 0 0 1 0 21 242
21h-00 22h-00 3 0 1 1 2 0 0 0 0 0 0 0 0 0 0 7 164
22h-00 23h-00 2 0 1 0 0 1 0 0 0 0 1 0 0 0 0 5 96
15 0 6 3 4 2 0 0 0 1 1 0 0 1 0 33 502
399 63 50 38 40 31.5 0 12 3 46.5 63 3 9 0 0 758 9509
414 63 56 41 44 33.5 0 12 3 47.5 64 3 9 1 0 791 10011
2949.5 472 890 530 611 1560.5 195 86 57.5 703 841 359 350 347 59.5 10011 46%
29.5% 4.7% 8.9% 5.3% 6.1% 15.6% 1.9% 0.9% 0.6% 7.0% 8.4% 3.6% 3.5% 3.5% 0.6%
3421.42 547.52 1032.4 614.8 708.76 1810.18 226.2 99.76 66.7 815.48 975.56 416.44 406 402.52 69.02 11612.8 40%
29.5% 4.7% 8.9% 5.3% 6.1% 15.6% 1.9% 0.9% 0.6% 7.0% 8.4% 3.6% 3.5% 3.5% 0.6%
Total % of 14 hr.
Total % of 24 hr.
Peak
Hours
2913
1724
Total
four side
for each
hours
Total Four side
Sub Total (A)
BusKoyun/Etan Truck *
At Night
from Kratie to Kampong Cham ( Turn Righ )
Total
each
hours
Start Time
Motorised
Motocycle Car Jeep/4wd Pick-up Minibus
Motocycle
TOTAL OF 24 HOUR
Total (Side 4)
Sub Total (A)
Sub Total (B)
TRAFFIC COUNT in PCUs
NR7 Lot 1, Tboung Khmum District, Kampong Cham Province
From Kratie to Kompong Cham ( Turn Right ) (Side 4)
III A - 12

Appendix III A (c)
Small Large Light Med Heavy Heavey Heavy Heavy
incl.3
wheel
Max
7 Seats
Max
7 seats
Freight
Use 8-16 seats 16+Seats 2-4 tone >4 tone
Rigid
3 Axle
Rigid
4 Axle
S Trailer
5 Axle
Straile
6 Axle
0.5 1 1 1 1 1.5 3 1.5 1.5 1.5 3 3 4.5 4.5 4.5
From To
7h-00 8h-00 70 4 9 5 10 64.5 0 4.5 0 10.5 90 6 45 4.5 0 323
8h-00 9h-00 52 5 40 11 8 40.5 0 0 0 9 57 12 31.5 9 0 275
9h-00 10h-00 54 11 21 13 16 43.5 3 3 1.5 31.5 51 12 36 9 0 305.5
10h-00 11h-00 33 3 15 5 13 43.5 6 1.5 0 13.5 39 6 45 0 0 223.5
11h-00 12h-00 60 10 16 9 19 51 9 3 0 33 72 12 31.5 0 0 325.5
12h-00 1h-00 33.5 4 17 4 16 28.5 0 0 0 18 24 3 27 0 0 175
1h-00 2h-00 54 2 24 14 24 51 12 3 0 30 75 27 31.5 9 0 356.5
2h-00 3h-00 37.5 5 24 12 20 27 3 0 1.5 31.5 36 9 4.5 4.5 0 215.5
3h-00 4h-00 36 3 16 5 15 28.5 3 3 1.5 15 45 15 22.5 4.5 4.5 217.5
4h-00 5h-00 34 9 13 7 6 6 0 3 0 15 21 9 31.5 0 4.5 159
5h-00 6h-00 29.5 8 17 1 16 19.5 3 1.5 0 18 39 0 4.5 4.5 0 161.5
493.5 64 212 86 163 403.5 39 22.5 4.5 225 549 111 310.5 45 9 2737.5
20h-00 21h-00 3 0 7 5 4 3 0 0 0 0 4 3 3 0 0 32
21h-00 22h-00 4 0 3 4 2 1 0 0 0 0 3 2 2 0 1 22
22h-00 23h-00 2 0 1 1 2 0 0 0 0 2 0 3 4 3 0 18
9 0 11 10 8 4 0 0 0 2 7 8 9 3 1 72
493.5 64 212 86 163 403.5 39 22.5 4.5 225 549 111 310.5 45 9 2737.5
502.5 64 223 96 171 407.5 39 22.5 4.5 227 556 119 319.5 48 10 2809.5
from Kompong Cham to Kratie
Sub Total (A)
TRAFFIC COUNT
NR. 7 Lot 2, Prothead District
from Kompong Cham to Kratie (Side 1)
Start Time
Motorised
Motocycle Car Jeep/4wd Pick-up Minibus BusKoyun/Etan Truck *
MotocycleTotal
each
hours
Total (Side 1)
Sub Total (A)
At Night
Sub Total (B)
III A - 13

Appendix III A (c)
Small Large Light Med Heavy Heavey Heavy Heavy
incl.3
wheel
Max
7 Seats
Max
7 seats
Freight
Use 8-16 seats 16+Seats 2-4 tone >4 tone
Rigid
3 Axle
Rigid
4 Axle
S Trailer
5 Axle
Straile
6 Axle
From To 231.6
7h-00 8h-00 78 6 17 6 20 73.5 0 0 0 30 18 3 4.5 0 0 256 579
8h-00 9h-00 80 2 26 14 23 73.5 3 1.5 0 13.5 45 3 9 0 0 293.5 568.5
9h-00 10h-00 62 14 23 7 21 79.5 3 0 1.5 24 63 9 27 13.5 0 347.5 653
10h-00 11h-00 44 11 26 10 14 43.5 9 0 6 22.5 42 21 27 0 0 276 499.5
11h-00 12h-00 48 8 33 15 16 57 12 1.5 6 42 72 21 45 0 0 376.5 702
12h-00 1h-00 23.5 4 14 10 15 34.5 3 7.5 4.5 13.5 30 15 13.5 0 0 188 363
1h-00 2h-00 45 6 31 17 32 54 0 4.5 1.5 43.5 48 33 9 22.5 13.5 360.5 717
2h-00 3h-00 35.5 5 17 15 16 34.5 0 3 0 22.5 51 21 27 18 0 265.5 481
3h-00 4h-00 32 4 15 13 19 28.5 3 1.5 1.5 37.5 42 48 36 4.5 0 285.5 503
4h-00 5h-00 39 2 23 9 27 16.5 9 1.5 4.5 25.5 60 12 63 9 0 301 460
5h-00 6h-00 29 5 20 20 14 19.5 0 4.5 0 22.5 24 30 40.5 22.5 0 251.5 413
516 67 245 136 217 514.5 42 25.5 25.5 297 495 216 301.5 90 13.5 3201.5 5939 2673.5
20h-00 21h-00 11 0 13 4 6 6 0 0 0 5 10 2 2 6 0 65 97
21h-00 22h-00 4 0 10 4 9 1 0 0 2 2 7 0 8 9 0 56 78
22h-00 23h-00 5 1 5 1 2 4 0 0 0 10 3 1 4 3 1 40 58
20 1 28 9 17 11 0 0 2 17 20 3 14 18 1 161 233
516 67 245 136 217 514.5 42 25.5 25.5 297 495 216 301.5 90 13.5 3201.5 5939
536 68 273 145 234 525.5 42 25.5 27.5 314 515 219 315.5 108 14.5 3362.5 6172
1038.5 132 496 241 405 933 81 48 32 541 1071 338 635 156 24.5 6172 43%
16.8% 2.1% 8.0% 3.9% 6.6% 15.1% 1.3% 0.8% 0.5% 8.8% 17.4% 5.5% 10.3% 2.5% 0.4%
1204.66 153.12 575.36 279.56 469.8 1082.28 93.96 55.68 37.12 627.56 1242.36 392.08 736.6 180.96 28.42 7159.52 37%
16.8% 2.1% 8.0% 3.9% 6.6% 15.1% 1.3% 0.8% 0.5% 8.8% 17.4% 5.5% 10.3% 2.5% 0.4%
Total % of 14 hr.
Total % of 14 hr.
Peak
Hours
1800.5
873
Total
Both
side for
each
hours
Total Both side
Moocycle
TOTAL OF 24 HOUR
Sub Total (B)
Total
each
hours
Total (Side 1)
Sub Total (A)
BusKoyun/Etan Truck *
from Kratie to Kompong Cham
Sub Total (A)
At Night
TRAFFIC COUNT
NR. 7 Lot 2, Prothead District
from Kratie to Kompong Cham (Side 2)
Start Time
Motorised
Motocycle Car Jeep/4wd Pick-up Minibus
III A - 14

Appendix III A (d)
Small Large Light Med Heavy Heavey Heavy Heavy
incl.3
wheel
Max
7 Seats
Max
7 seats
Freight
Use 8-16 seats 16+Seats 2-4 tone >4 tone
Rigid
3 Axle
Rigid
4 Axle
S Trailer
5 Axle
Straile
6 Axle
0.5 1 1 1 1 1.5 3 1.5 1.5 1.5 3 3 4.5 4.5 4.5
From To
7h-00 8h-00 79 6 11 6 6 15 3 4.5 0 4.5 9 0 9 0 0 153
8h-00 9h-00 82.5 3 14 8 8 28.5 9 1.5 3 9 24 15 9 0 0 214.5
9h-00 10h-00 65 6 12 11 12 22.5 6 1.5 6 10.5 21 18 9 0 4.5 205
10h-00 11h-00 56 4 10 13 11 45 3 0 3 21 60 30 9 4.5 0 269.5
11h-00 12h-00 46 0 9 3 10 3 0 0 0 0 0 0 0 0 0 71
12h-00 1h-00 40.5 2 7 5 7 15 0 0 1.5 3 24 9 13.5 0 4.5 132
1h-00 2h-00 54.5 3 10 6 7 13.5 0 1.5 4.5 7.5 21 12 4.5 0 0 145
2h-00 3h-00 57 1 6 2 3 18 3 3 3 6 24 6 9 0 0 141
3h-00 4h-00 48 2 8 9 4 24 3 4.5 4.5 4.5 30 9 27 9 0 186.5
4h-00 5h-00 65.5 10 15 5 8 30 3 0 1.5 10.5 15 18 18 13.5 0 213
5h-00 6h-00 22.5 0 3 5 6 13.5 3 1.5 0 1.5 6 3 0 0 0 65
616.5 37 105 73 82 228 33 18 27 78 234 120 108 27 9 1795.5
20h-00 21h-00 30 1 7 4 6 8 1 0 0 1 2 2 6 0 0 68
21h-00 22h-00 13 0 5 1 1 1 0 0 0 0 4 1 9 1 0 36
22h-00 23h-00 2 0 3 0 6 1 0 0 0 2 1 4 0 1 0 20
45 1 15 5 13 10 1 0 0 3 7 7 15 2 0 124
616.5 37 105 73 82 228 33 18 27 78 234 120 108 27 9 1795.5
661.5 38 120 78 95 238 34 18 27 81 241 127 123 29 9 1919.5
TRAFFIC COUNT in PCUs
NR.71, Bosknor Commune, Chamkaleu District, Kampong Cham Province
from Kompong Cham to Bosknor (Side 1)
At Night
Pick-up Minibus BusKoyun/Etan Truck *
Total
each
hours
Sub Total (B)
Total (Side 1)
Sub Total (A)
Sub Total (A)
Start Time
Motocycle Car Jeep/4wd
At Day
Motorised
Motocycle
III A - 15

Appendix III A (d)
Small Large Light Med Heavy Heavey Heavy Heavy
incl.3
wheel
Max
7 Seats
Max
7 seats
Freight
Use 8-16 seats 16+Seats 2-4 tone >4 tone
Rigid
3 Axle
Rigid
4 Axle
S Trailer
5 Axle
Straile
6 Axle
0.5 1 1 1 1 1.5 3 1.5 1.5 1.5 3 3 4.5 4.5 4.5
From To
7h-00 8h-00 92.5 6 10 5 3 25.5 3 3 0 16.5 12 6 9 4.5 0 196 349
8h-00 9h-00 86 6 12 10 4 15 0 4.5 1.5 9 6 6 4.5 0 0 164.5 379
9h-00 10h-00 83 3 7 5 6 10.5 6 0 0 10.5 3 18 13.5 9 0 174.5 379.5
10h-00 11h-00 60.5 4 9 8 3 6 6 4.5 0 13.5 0 12 9 4.5 0 140 409.5
11h-00 12h-00 46 7 5 8 0 16.5 12 3 1.5 1.5 9 15 9 9 0 142.5 213.5
12h-00 1h-00 36 7 11 7 2 13.5 3 7.5 1.5 9 9 21 22.5 0 0 150 282
1h-00 2h-00 48.5 1 4 6 6 10.5 0 4.5 0 10.5 9 9 13.5 4.5 0 127 272
2h-00 3h-00 65 7 7 12 11 31.5 0 1.5 1.5 16.5 0 9 9 9 0 180 321
3h-00 4h-00 54.5 3 12 10 7 15 3 3 6 13.5 3 12 9 9 0 160 346.5
4h-00 5h-00 40 0 6 10 3 0 0 3 1.5 9 27 6 9 13.5 0 128 341
5h-00 6h-00 36 2 3 10 7 16.5 3 3 0 10.5 24 6 9 0 0 130 195
648 46 86 91 52 160.5 36 37.5 13.5 120 102 120 117 63 0 1692.5 3488 1,644
20h-00 21h-00 30 2 3 3 3 5 0 1 1 1 7 10 2 2 0 70 138
21h-00 22h-00 4 1 0 4 0 3 1 0 0 0 7 2 3 6 0 31 67
22h-00 23h-00 5 0 1 1 0 0 0 0 0 1 4 1 1 0 0 14 34
39 3 4 8 3 8 1 1 1 2 18 13 6 8 0 115 239
648 46 86 91 52 160.5 36 37.5 13.5 120 102 120 117 63 0 1692.5 3488
687 49 90 99 55 168.5 37 38.5 14.5 122 120 133 123 71 0 1807.5 3727
1348.5 87 210 177 150 406.5 71 56.5 41.5 203 361 260 246 100 9 3727 44.1%
36.2% 2.3% 5.6% 4.7% 4.0% 10.9% 1.9% 1.5% 1.1% 5.4% 9.7% 7.0% 6.6% 2.7% 0.2%
1564.26 100.92 243.6 205.32 174 471.54 82.36 65.54 48.14 235.48 418.76 301.6 285.36 116 10.44 4323.32 38.0%
36.2% 2.3% 5.6% 4.7% 4.0% 10.9% 1.9% 1.5% 1.1% 5.4% 9.7% 7.0% 6.6% 2.7% 0.2%
Total % of 14 hr.
Total % of 24 hr.
TRAFFIC COUNT in PCUs
TOTAL OF 24 HOUR
Sub Total (B)
Total
each
hours
Sub Total (A)
Total (Side 1)
Sub Total (A)
Start Time
Total Both side
Motorised
Motocycle
At Night
Motocycle Car Jeep/4wd
NR.71, Bosknor Commune, Chamkaleu District, Kampong Cham Province
from Bosknor to Kompong Cham (Side 2)
Koyun/Etan Truck *
At Day
1,108
536
Peak
Hour
Total
Both side
for each
hours
Pick-up Minibus Bus
III A - 16

Appendix III A (e)
Small Large Light Med Heavy Heavey Heavy Heavy
incl.3
wheel
Max
7 Seats
Max
7 seats
Freight
Use 8-16 seats 16+Seats 2-4 tone >4 tone
Rigid
3 Axle
Rigid
4 Axle
S Trailer
5 Axle
Straile
6 Axle
0.5 1 1 1 1 1.5 3 1.5 1.5 1.5 3 3 4.5 4.5 4.5
From To
7h-00 8h-00 58.5 3 7 10 2 0 0 3 0 1.5 33 6 54 36 0 214
8h-00 9h-00 61.5 9 8 3 2 6 0 3 0 0 3 0 18 13.5 0 127
9h-00 10h-00 58 3 4 3 4 4.5 0 3 0 1.5 12 12 4.5 0 4.5 114
10h-00 11h-00 44.5 9 9 8 2 1.5 0 6 1.5 0 12 6 13.5 9 4.5 126.5
11h-00 12h-00 59.5 2 10 9 7 9 6 9 0 3 21 0 4.5 9 0 149
12h-00 1h-00 58.5 4 27 11 7 9 6 16.5 4.5 3 36 18 0 27 0 227.5
1h-00 2h-00 54 5 9 11 1 4.5 0 10.5 1.5 1.5 3 9 13.5 0 0 123.5
2h-00 3h-00 39 9 8 6 4 3 0 3 1.5 0 6 9 0 0 0 88.5
3h-00 4h-00 38.5 8 5 7 6 4.5 0 3 4.5 0 6 18 36 13.5 4.5 154.5
4h-00 5h-00 44.5 4 9 5 2 4.5 0 12 7.5 1.5 9 0 18 0 4.5 121.5
5h-00 6h-00 46 4 9 5 7 7.5 0 1.5 0 1.5 0 0 4.5 4.5 4.5 95
562.5 60 105 78 44 54 12 70.5 21 13.5 141 78 166.5 112.5 22.5 1541
20h-00 21h-00 23 2 15 3 6 1 0 0 0 0 3 1 0 1 0 55
21h-00 22h-00 3 1 6 3 3 0 0 0 0 0 3 0 3 2 0 24
22h-00 23h-00 17 1 4 2 1 0 0 0 0 0 0 0 1 0 0 26
43 4 25 8 10 1 0 0 0 0 6 1 4 3 0 105
562.5 60 105 78 44 54 12 70.5 21 13.5 141 78 166.5 112.5 22.5 1541
605.5 64 130 86 54 55 12 70.5 21 13.5 147 79 170.5 115.5 22.5 1646Total (Side 1)
Sub Total (A)
Sub Total (B)
TRAFFIC COUNT
NR.72, Tropeng Phlung District
from Kompong Cham to Vietnam border (Side 1)
Car Jeep/4wd Pick-up Minibus BusKoyun/Etan Truck *
Motorised
MotocycleTotal
each
hours
Start Time
Motocycle
from Kompong Cham to Vietnam border
Sub Total (A)
At Night
III A - 17

Appendix III A (e)
Small Large Light Med Heavy Heavey Heavy Heavy
incl.3
wheel
Max
7 Seats
Max
7 seats
Freight
Use 8-16 seats 16+Seats 2-4 tone >4 tone
Rigid
3 Axle
Rigid
4 Axle
S Trailer
5 Axle
Straile
6 Axle
0.5 1 1 1 1 1.5 3 1.5 1.5 1.5 3 3 4.5 4.5 4.5
From To 112.4
7h-00 8h-00 37 6 11 2 2 0 0 1.5 0 1.5 3 3 0 0 0 67 281
8h-00 9h-00 7.5 8 5 6 1 0 0 1.5 0 3 0 0 4.5 31.5 0 68 195
9h-00 10h-00 47 5 7 9 5 6 0 0 1.5 4.5 9 6 18 4.5 0 122.5 236.5
10h-00 11h-00 48 4 10 8 1 3 0 6 1.5 6 15 0 40.5 9 4.5 156.5 283
11h-00 12h-00 30.5 5 7 8 0 6 0 6 4.5 0 6 15 27 13.5 0 128.5 277.5
12h-00 1h-00 39 7 6 6 2 6 3 9 0 0 24 18 9 0 0 129 356.5
1h-00 2h-00 50 4 6 5 3 6 9 13.5 1.5 3 30 15 13.5 31.5 4.5 195.5 319
2h-00 3h-00 53 1 10 8 0 1.5 0 6 1.5 1.5 15 15 31.5 9 0 153 241.5
3h-00 4h-00 45 5 16 10 5 7.5 3 9 3 1.5 27 9 31.5 0 0 172.5 327
4h-00 5h-00 79.5 10 31 13 12 7.5 3 9 4.5 0 24 3 18 4.5 0 219 340.5
5h-00 6h-00 50 7 6 7 8 7.5 0 4.5 3 1.5 24 18 40.5 9 0 186 281
486.5 62 115 82 39 51 18 66 21 22.5 177 102 234 112.5 9 1597.5 3138.5 1,334
20h-00 21h-00 60 2 14 5 3 0 0 0 0 2 2 1 0 0 0 89 144
21h-00 22h-00 20 1 9 0 0 0 0 0 0 0 0 0 6 0 0 36 60
22h-00 23h-00 15 0 9 6 4 1 0 0 0 0 0 0 0 1 0 36 62
95 3 32 11 7 1 0 0 0 2 2 1 6 1 0 161 266
486.5 62 115 82 39 51 18 66 21 22.5 177 102 234 112.5 9 1597.5 3138.5
581.5 65 147 93 46 52 18 66 21 24.5 179 103 240 113.5 9 1758.5 3404.5
1187 129 277 179 100 107 30 136.5 42 38 326 182 410.5 229 31.5 3404.5 39.2%
34.9% 3.8% 8.1% 5.3% 2.9% 3.1% 0.9% 4.0% 1.2% 1.1% 9.6% 5.3% 12.1% 6.7% 0.9%
1376.92 149.64 321.32 207.64 116 124.12 34.8 158.34 48.72 44.08 378.16 211.12 476.18 265.64 36.54 3949.22 33.8%
34.9% 3.8% 8.1% 5.3% 2.9% 3.1% 0.9% 4.0% 1.2% 1.1% 9.6% 5.3% 12.1% 6.7% 0.9%
Sub Total (A)
Total
Both side
for each
hours
Total % of 24 hr.
Peak
Hour
713
622
Total % of 14 hr.
TOTAL OF 24 HOUR
Sub Total (B)
Total
each
hours
Total (Side 1)
Sub Total (A)
BusKoyun/Etan Truck *
from Vietnam border to Kompong Cham
At Night
TRAFFIC COUNT
Total Both side
Start Time
Motocycle Car Jeep/4wd Pick-up Minibus
Motorised
Motocycle
NR.72, Tropeng Phlung District
from Vietnam border to Kompong Cham (Side 2)
III A - 18

Appendix III A (f)
Small Large Light Med Heavy Heavey Heavy Heavy
incl.3
wheel
Max
7 Seats
Max
7 seats
Freight
Use 8-16 seats 16+Seats 2-4 tone >4 tone
Rigid
3 Axle
Rigid
4 Axle
S Trailer
5 Axle
Straile
6 Axle
0.5 1 1 1 1 1.5 3 1.5 1.5 1.5 3 3 4.5 4.5 4.5
From To
7h-00 8h-00 100 4 9 4 8 16.5 0 4.5 0 1.5 15 0 0 0 0 162.5
8h-00 9h-00 111 6 13 8 8 13.5 0 9 0 3 27 6 9 0 0 213.5
9h-00 10h-00 88 4 8 8 10 46.5 0 9 0 3 3 0 9 0 0 188.5
10h-00 11h-00 78 4 17 10 8 37.5 3 0 0 6 12 3 18 0 0 196.5
11h-00 12h-00 54 1 20 5 22 49.5 12 1.5 0 3 21 3 0 0 0 192
12h-00 1h-00 49.5 1 10 5 8 37.5 3 1.5 1.5 9 12 3 4.5 0 0 145.5
1h-00 2h-00 60.5 2 16 4 8 22.5 6 6 0 12 9 6 18 0 0 170
2h-00 3h-00 52 2 16 7 11 31.5 3 4.5 0 7.5 12 9 13.5 0 0 169
3h-00 4h-00 55 1 12 4 8 15 0 6 0 1.5 9 12 27 0 0 150.5
4h-00 5h-00 67 2 6 6 13 16.5 0 12 0 4.5 12 0 13.5 0 0 152.5
5h-00 6h-00 61.5 0 4 7 4 10.5 0 6 0 3 15 12 22.5 0 0 145.5
776.5 27 131 68 108 297 27 60 1.5 54 147 54 135 0 0 1886
20h-00 21h-00 30 1 6 1 5 1 0 4 0 0 2 1 1 0 0 52
21h-00 22h-00 10 0 1 0 1 4 0 0 0 0 5 0 0 0 0 21
22h-00 23h-00 1 0 0 0 2 0 0 0 1 0 2 1 0 0 0 7
41 1 7 1 8 5 0 4 1 0 9 2 1 0 0 80
776.5 27 131 68 108 297 27 60 1.5 54 147 54 135 0 0 1886
817.5 28 138 69 116 302 27 64 2.5 54 156 56 136 0 0 1966
from Dambae to Kratie
At Night
Start Time
Motocycle Car Jeep/4wd Pick-up Minibus BusKoyun/Etan Truck *
Sub Total (A)
TRAFFIC COUNT in PCUs
NR. 73, Dambae District, Kampong Cham Province
from Dambae to Kratie (Side 1)
Motorised
MotocycleTotal
each
hours
Sub Total (A)
Total (Side 1)
Sub Total (B)
III A - 19

Appendix III A (f)
Small Large Light Med Heavy Heavey Heavy Heavy
incl.3
wheel
Max
7 Seats
Max
7 seats
Freight
Use 8-16 seats 16+Seats 2-4 tone >4 tone
Rigid
3 Axle
Rigid
4 Axle
S Trailer
5 Axle
Straile
6 Axle
0.5 1 1 1 1 1.5 3 1.5 1.5 1.5 3 3 4.5 4.5 4.5
From To 146.2
7h-00 8h-00 92 3 5 6 10 54 0 1.5 3 6 3 6 9 4.5 0 203 365.5
8h-00 9h-00 58.5 3 8 3 9 46.5 0 1.5 4.5 6 6 0 9 0 0 155 368.5
9h-00 10h-00 75 5 10 11 10 16.5 0 1.5 0 9 6 6 4.5 4.5 0 159 347.5
10h-00 11h-00 56 8 12 9 10 28.5 6 3 1.5 6 6 3 13.5 0 0 162.5 359
11h-00 12h-00 53 3 9 6 15 42 0 3 0 9 15 0 9 0 0 164 356
12h-00 1h-00 59 4 7 3 13 45 9 0 0 7.5 6 9 9 9 0 180.5 326
1h-00 2h-00 67.5 0 17 7 15 30 3 1.5 3 9 15 9 0 4.5 0 181.5 351.5
2h-00 3h-00 46.5 4 9 11 9 12 3 7.5 1.5 6 15 9 4.5 4.5 0 142.5 311.5
3h-00 4h-00 69.5 1 8 4 9 10.5 3 10.5 0 10.5 9 3 0 4.5 0 142.5 293
4h-00 5h-00 74 1 10 15 19 9 0 7.5 0 15 12 0 4.5 0 0 167 319.5
5h-00 6h-00 78.5 6 10 12 10 12 3 6 1.5 9 15 6 0 0 0 169 314.5
729.5 38 105 87 129 306 27 43.5 15 93 108 51 63 31.5 0 1826.5 3712.5 1,716
20h-00 21h-00 29 1 4 1 4 0 0 0 0 3 1 2 1 0 0 46 98
21h-00 22h-00 8 0 4 0 1 1 0 0 0 2 2 4 0 0 0 22 43
22h-00 23h-00 2 0 2 0 1 1 0 0 0 1 0 0 1 0 1 9 16
39 1 10 1 6 2 0 0 0 6 3 6 2 0 1 77 157
729.5 38 105 87 129 306 27 43.5 15 93 108 51 63 31.5 0 1826.5 3712.5
768.5 39 115 88 135 308 27 43.5 15 99 111 57 65 31.5 1 1903.5 3869.5
1586 67 253 157 251 610 54 107.5 17.5 153 267 113 201 31.5 1 3869.5 44.3%
41.0% 1.7% 6.5% 4.1% 6.5% 15.8% 1.4% 2.8% 0.5% 4.0% 6.9% 2.9% 5.2% 0.8% 0.0%
1839.76 77.72 293.48 182.12 291.16 707.6 62.64 124.7 20.3 177.48 309.72 131.08 233.16 36.54 1.16 4488.62 38.2%
41.0% 1.7% 6.5% 4.1% 6.5% 15.8% 1.4% 2.8% 0.5% 4.0% 6.9% 2.9% 5.2% 0.8% 0.0%
Koyun/EtanBus
NR. 73, Dambae District, Kampong Cham Province
TRAFFIC COUNT in PCUs
Motorised
Start Time
Motocycle Car Jeep/4wd Pick-up Minibus
From Kratie to Dambae (Side 2)
MotocycleTotal
each
hours
Truck *
Peak
Hour
1,082
634
Total % of 14 hr.
Total % of 24 hr.
Total
Both side
for each
hours
Sub Total (B)
TOTAL OF 24 HOUR
Total (Side 1)
Sub Total (A)
Total Both side
At Night
from Kratie to Dambae
Sub Total (A)
III A - 20

Appendix III A (g)
Small Large Light Med Heavy Heavey Heavy Heavy
incl.3
wheel
Max
7 Seats
Max
7 seats
Freight
Use 8-16 seats 16+Seats 2-4 tone >4 tone
Rigid
3 Axle
Rigid
4 Axle
S Trailer
5 Axle
Straile
6 Axle
0.5 1 1 1 1 1.5 3 1.5 1.5 1.5 3 3 4.5 4.5 4.5
From To
7h-00 8h-00 98.5 11 2 2 3 6 0 13.5 1.5 3 6 6 9 0 0 161.5
8h-00 9h-00 75 8 3 2 4 0 3 1.5 0 1.5 3 3 0 0 0 104
9h-00 10h-00 85 5 13 4 2 7.5 0 7.5 1.5 1.5 3 6 4.5 0 0 140.5
10h-00 11h-00 68.5 3 6 2 3 18 0 4.5 1.5 6 3 0 4.5 0 0 120
11h-00 12h-00 37 2 3 2 1 3 3 6 0 3 3 0 0 0 0 63
12h-00 1h-00 55 1 2 1 5 7.5 0 3 0 0 0 6 0 0 0 80.5
1h-00 2h-00 42.5 5 6 0 7 7.5 0 4.5 0 1.5 0 0 4.5 0 0 78.5
2h-00 3h-00 52 3 1 1 2 15 0 1.5 1.5 3 9 3 0 0 0 92
3h-00 4h-00 46.5 2 5 1 5 1.5 0 1.5 0 3 0 0 0 0 0 65.5
4h-00 5h-00 42.5 3 1 0 1 6 0 4.5 0 1.5 3 0 0 0 0 62.5
5h-00 6h-00 54 3 6 1 1 9 0 3 1.5 3 3 0 0 0 0 84.5
656.5 46 48 16 34 81 6 51 7.5 27 33 24 22.5 0 0 1052.5
20h-00 21h-00 18 0 1 0 2 1 0 1 1 2 0 0 0 0 0 26
21h-00 22h-00 15 0 0 0 1 1 0 0 0 2 0 0 0 0 0 19
22h-00 23h-00 8 0 1 0 0 0 0 0 2 1 0 0 2 0 0 14
41 0 2 0 3 2 0 1 3 5 0 0 2 0 0 59
656.5 46 48 16 34 81 6 51 7.5 27 33 24 22.5 0 0 1052.5
697.5 46 50 16 37 83 6 52 10.5 32 33 24 24.5 0 0 1111.5
Sub Total (B)
Sub Total (A)
At Night
Total (Side 1)
Sub Total (A)
Motorised
Motocycle
TRAFFIC COUNT in PCUs
NR.2714, Chamkaleu District, Kampong Cham Province
from Thnol Bek to Speu (Side 1)
Start Time
Motocycle Car Jeep/4wd Pick-up Minibus BusKoyun/Etan Truck *
Total
each
hours
At Day
III A - 21

Appendix III A (g)
Small Large Light Med Heavy Heavey Heavy Heavy
incl.3
wheel
Max
7 Seats
Max
7 seats
Freight
Use 8-16 seats 16+Seats 2-4 tone >4 tone
Rigid
3 Axle
Rigid
4 Axle
S Trailer
5 Axle
Straile
6 Axle
0.5 1 1 1 1 1.5 3 1.5 1.5 1.5 3 3 4.5 4.5 4.5
From To 104.4
7h-00 8h-00 67.5 4 2 2 0 7.5 0 0 4.5 0 3 9 0 0 0 99.5 261
8h-00 9h-00 68.5 1 4 3 3 4.5 0 0 6 4.5 3 3 0 0 0 100.5 204.5
9h-00 10h-00 51 1 0 1 2 0 0 0 1.5 0 18 0 9 0 0 83.5 224
10h-00 11h-00 37.5 2 2 0 6 3 0 1.5 4.5 0 3 12 4.5 0 0 76 196
11h-00 12h-00 40 4 3 2 2 10.5 0 0 0 6 18 3 0 0 0 88.5 151.5
12h-00 1h-00 62.5 1 3 5 12 1.5 0 0 4.5 1.5 0 6 4.5 0 0 101.5 182
1h-00 2h-00 55 6 3 1 4 6 0 1.5 0 1.5 15 3 18 0 0 114 192.5
2h-00 3h-00 73.5 6 5 0 1 6 0 1.5 3 0 15 0 9 0 0 120 212
3h-00 4h-00 39 6 5 1 4 3 0 1.5 4.5 3 9 0 4.5 0 0 80.5 146
4h-00 5h-00 48.5 2 2 1 4 4.5 0 0 10.5 4.5 0 9 9 0 0 95 157.5
5h-00 6h-00 57.5 5 1 3 3 1.5 0 3 6 7.5 6 0 0 0 0 93.5 178
600.5 38 30 19 41 48 0 9 45 28.5 90 45 58.5 0 0 1052.5 2105 1,025
20h-00 21h-00 24 0 3 2 6 2 0 0 1 0 2 0 0 0 0 40 66
21h-00 22h-00 5 0 0 0 2 0 0 0 2 0 4 0 0 0 0 13 32
22h-00 23h-00 0 0 0 0 1 0 0 1 1 0 5 1 1 0 0 10 24
29 0 3 2 9 2 0 1 4 0 11 1 1 0 0 63 122
600.5 38 30 19 41 48 0 9 45 28.5 90 45 58.5 0 0 1052.5 2105
629.5 38 33 21 50 50 0 10 49 28.5 101 46 59.5 0 0 1115.5 2227
1327 84 83 37 87 133 6 62 59.5 60.5 134 70 84 0 0 2227 46.0%
59.6% 3.8% 3.7% 1.7% 3.9% 6.0% 0.3% 2.8% 2.7% 2.7% 6.0% 3.1% 3.8% 0.0% 0.0%
1539.32 97.44 96.28 42.92 100.92 154.28 6.96 71.92 69.02 70.18 155.44 81.2 97.44 0 0 2583.32 39.7%
59.6% 3.8% 3.7% 1.7% 3.9% 6.0% 0.3% 2.8% 2.7% 2.7% 6.0% 3.1% 3.8% 0.0% 0.0%Total % of 24 hr.
Peak
Hour
690
336
TOTAL OF 24 HOUR
Sub Total (B)
Car Jeep/4wd
Total Both side
Total (Side 1)
Sub Total (A)
At Day
Sub Total (A)
At Night
Total
Both side
for each
hours
Total % of 14 hr.
NR.2714, Chamkaleu District, Kampong Cham Province
Start Time
Motocycle
TRAFFIC COUNT in PCUs
from Speu to Thnol Bek (Side 2)
BusPick-up Minibus
Motorised
MotocycleTotal
each
hours
Koyun/Etan Truck *
III A - 22

Appendix IV (a)
IV - 1
Distribution of Average Trip KM Travel of Passenger Vehicles
Vehicle Code
Vehicle Type 0-20 Km 21-50 Km51-100
Km101-200
Km201-and
Above Km
3 Motor Cycle 5 4 4 2
4 3 wheeler(TukTuk) 2 12 1 2
5 Car 1 2 4 3 4
6 Jeep/4WD 2
7 Pickup 1 1 3 1
8 Minibus 6 16 28 2
9 Bus 1
9 25 28 39 6
Distribution of Average Trip KM Travel of Commercial Vehicles
Vehicle Code
Vehicle Type 0-20 Km 21-50 Km51-100
Km101-200
Km201-and
Above Km
10 Koyan small
11 Koyan large
12 Light Truck 3 1
13 Medium Truck 5 1
14 HT Rigid 3Axle
15 HT Rigid 4/5 Axle
16 HT Semi T 4/5 Axle
17 HT Semi T 6Axle
0 8 1 0 1
ORIGIN DESTINATIONNR.1 Lot 1, Kampong Trabek District
Total
Total

Appendix IV (a)
IV - 2
Table: Classification of Commodities
Code Type of freight
1 Agriculture/Food
2 Timber
3 Building materials
4 Raw materials
5 Industrial products
6 Fuel/ Chemicals
7 Fertilizers
0 others
Table: Trip Purpose of Passenger Vehicles In Number of Vehicles Count
Work/business
To/from work
Social/Private
SchoolRecreation
HolidayTourism
Others
(code1) (code2) (code3) (code 4) (code5) (code6)
32 3 12
15 1 11
2
6 5 1
61 3 38 1
1
117 7 66 0 2 0
Raw wood/ processed wood/
furnitureBricks, sand cement
/iron rods
DescriptionSmall/Medium
Commercial Vehicles (codes 10-13)
Large/heavy commercial vehicles (codes 14-17)
Rice, vegetables /fruits etc
Petrol, Diesel, mobile oil, acids etc
Fertilisers natural /man made
1
Ore/minerals 1
Engines/ machines/steel bars
etc3
Cloths, home articles
Vehicle Type
MC+trailor
car
Total 5 0
Jeep/4WD
Pickup
Minibus
Bus
Total

Appendix IV (a)
IV - 3
Table Inter- Province Movement of traffic
NR Location:
Table 6.3.16: Average Occupancy of Passenger Carrying Vehicles
10 Survey Locations
Bus Mini Bus3
wheeler2 wheeler car Jeep/4WD Pick-up
5.57 8.3 2.16 5 1.5 4
Total people % vehicle
Prey Veng Kratie Prey Veng Svay Rieng Battam Bong Prey Veng
Kampong Trabek Kor AnderkKrang Svay Kampong Trabek Neak loeung Kampong Trabek
Origin Destination Origin Destination
Movement within the same province Movement to other provinces
Neak loeung Kor Anderk
Phnom Penh Prey Veng Phnom Penh Svay Rieng Prey Veng Kam Pot
Kampong Cham Svay Rieng Kampong Speu Svay Rieng Phnom Penh Kratie
Kor Anderk Neak loeung
Prey Veng city Kampong Trabek Kampong Trabek Neak loeung Kor Anderk Kampong Trabek
Pou Laos Kampong Trabek
Svay Rieng Phnom Penh Svay Rieng Prey Veng
9 14
Prey Veng Kampong ChamPrey Veng Kampong SpeuPrey Veng Phnom Penh

Appendix IV (a)
IV - 4
Distribution of Average Trip KM Travel of Passenger Vehicles
Vehicle Code
Vehicle Type 0-20 Km21-50
Km51-100
Km101-200
Km201-and
Above Km
3 Motor Cycle 5 10 1
4 3 wheeler(TukTuk) 5 5
5 Car 3 5 1 17
6 Jeep/4WD 1 1
7 Pickup 1 1
8 Minibus 3 5 31
9 Bus 3 2
18 26 33 21 2 10018% 26% 33% 21% 2%
Distribution of Average Trip KM Travel of Commercial Vehicles
Vehicle Code
Vehicle Type 0-20 Km21-50
Km51-100
Km101-200
Km201-and
Above Km
10 Koyan small 2 1
11 Koyan large
12 Light Truck 5 7 1
13 Medium Truck 3 2 1
14 HT Rigid 3Axle
15 HT Rigid 4/5 Axle 1
16 HT Semi T 4/5 Axle 3
17 HT Semi T 6Axle
8 9 2 5 2 2631% 35% 8% 19% 8%
ORIGIN DESTINATIONNR.1 Lot 2, Svay Teap District (Prosot)
Total
Total

Appendix IV (a)
IV - 5
Table: Classification of Commodities
Code Type of freight
1 Agricultute/Food
2 Timber
3 Building materials
4 Raw materials
5 Industrial products
6 Fuel/ Chemicals
7 Fertilizers
0 others
Table: Trip Purpose of Passenger Vehicles In Number of Vehicles Count
Work/business
To/from work
Social/Private
SchoolRecreation
HolidayTourism
Others
(code1) (code2) (code3) (code 4) (code5) (code6)
15 3 1 1
27 4 5
1 1
1 3
45 5 30 1 3
4 2 4
93 12 37 2 12 0
Raw wood/ processed wood/
furnitureBricks, sand cement
/iron rods
DescriptionSmall/Medium
Commercial Vehicles (codes 10-13)
Large/heavy commercial vehicles (codes 14-17)
Rice/vegetables /fruits etc
1
Petrol/Diesel, mobile oil/acids etc
Fertilisers natural /man made
Ore/minireals
Engines/ machines/steel bars
etc11 3
Cloths/home articles
Vehicle Type
MC+trailor
car
Total 12 3
Jeep/4WD
Pickup
Minibus
Bus
Total

Appendix IV (a)
IV - 6
Table Inter- Province Movement of traffic
NR. 1 Lot 2 Location: Prosot, Svay Teap District, Svay Rieng Province
Table 6.3.16: Average Occupancy of Passenger Carrying Vehicles
Survey Location
Bus Mini Bus3
wheeler2 wheeler car Jeep/4WD Pick-up
Prosouth 25.5 8.48 0 2.5 3.7 2.5 2.5
Total people % vehicle
Origin Destination Origin Destination
Movement within the same province Movement to other provinces
Song Kor Pupel Phnom Penh Ho Chi Ming Svay Chrum Chan Trea Prey Veng Svay Rieng
Prosouth Prey Thlouk Kandal Svay Rieng city Prosouth Saray Phnom Penh Svay Rieng city
Svay Rieng city Kundeang Reay Svay Rieng city Phnom Penh Svay Rieng city Prey Phneath Svay Rieng city Siem Reap
Svay Rieng city Baveth Svay Rieng city Kampong Cham Svay Rieng city Chey Pov Svay Rieng city Kandal
Ba Neay Chub
Svay Rieng city Prosouth Svay Rieng city Svay Rieng city Svay Rieng city Pum Pou Svay Rieng city Phnom Penh
Chan Trea Svay Chrum
Baveth Prosouth Baveth Svay Rieng city
Svay Rieng city Roul
Kilo leak 8 Saray Kampong cham Svay Rieng city
1125
Svay Teap Svay Rieng city Svay Rieng city Baveth
Pong Rou Prosouth Prosouth Svay Rieng city
Chi Pov Prosouth Chi Pov Svay Reang
Chan Trea Svay Rieng city Chi Pov Kompong Cham
Chan Trea Krorl Kou

Chapter IV (b)
IV - 7
Distribution of Average Trip KM Travel of Passenger Vehicles
Vehicle Code
Vehicle Type 0-20 Km21-50
Km51-100
Km101-200
Km201-and
Above Km
3 Motor Cycle 6 8 2 1
4 3 wheeler(TukTuk) 3 3 3 1
5 Car 4 2 68 6
6 Jeep/4WD 1 4 3
7 Pickup 1 5 4 5
8 Minibus 31 7 7
9 Bus 1
15 13 113 12 23
Distribution of Average Trip KM Travel of Commercial Vehicles
Vehicle Code
Vehicle Type 0-20 Km 21-50Km 51-100Km101-
200Km201-and
AboveKm
10 Koyan small 1 1 3 1
11 Koyan large 2 2 1
12 Light Truck 3 6 9 2 3
13 Medium Truck 1 1 1
14 HT Rigid 3Axle 1
15 HT Rigid 4/5 Axle 1 2
16 HT Semi T 4/5 Axle
17 HT Semi T 6Axle 2
6 10 15 2 10
ORIGIN DESTINATIONNR.5 Lot 1, Kampong Tralach District
Total
Total
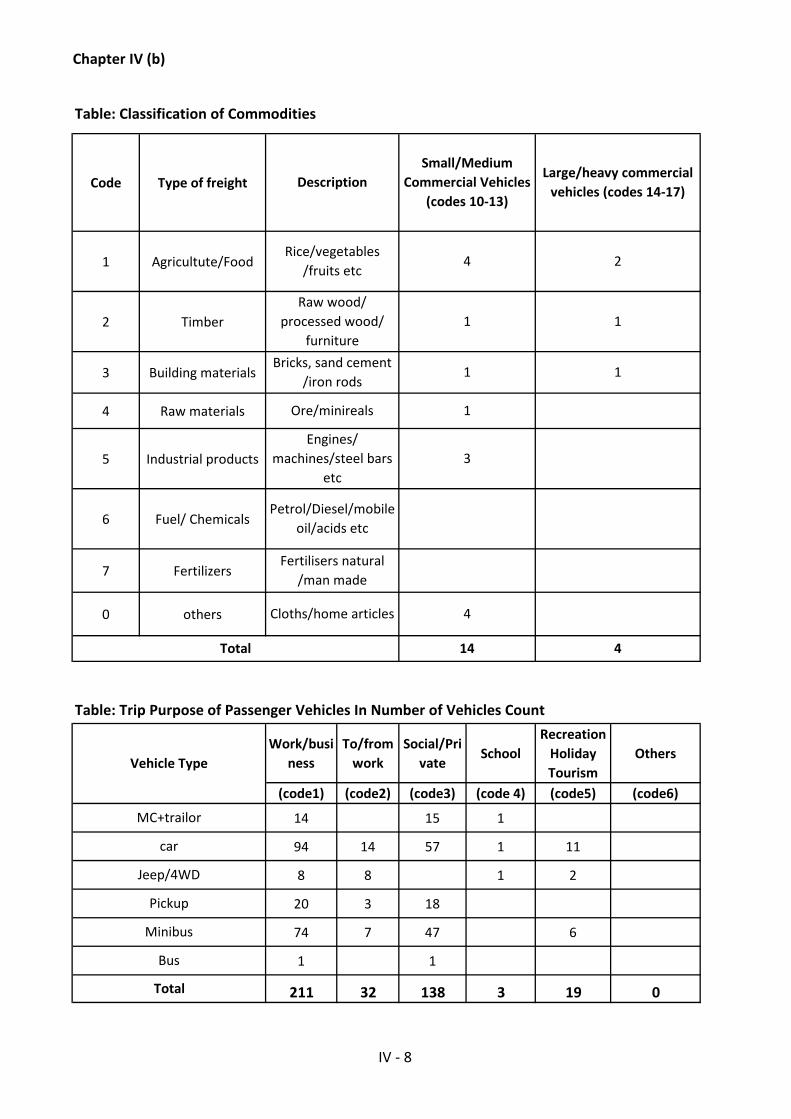
Chapter IV (b)
IV - 8
Table: Classification of Commodities
Code Type of freight
1 Agricultute/Food
2 Timber
3 Building materials
4 Raw materials
5 Industrial products
6 Fuel/ Chemicals
7 Fertilizers
0 others
Table: Trip Purpose of Passenger Vehicles In Number of Vehicles Count
Work/business
To/from work
Social/Private
SchoolRecreation
HolidayTourism
Others
(code1) (code2) (code3) (code 4) (code5) (code6)
14 15 1
94 14 57 1 11
8 8 1 2
20 3 18
74 7 47 6
1 1
211 32 138 3 19 0
Jeep/4WD
Pickup
Minibus
Bus
Total
Total 14 4
Vehicle Type
MC+trailor
car
Fertilisers natural /man made
Cloths/home articles 4
Engines/ machines/steel bars
etc3
Petrol/Diesel/mobile oil/acids etc
Ore/minireals 1
Rice/vegetables /fruits etc
4 2
Raw wood/ processed wood/
furniture1 1
DescriptionSmall/Medium
Commercial Vehicles (codes 10-13)
Large/heavy commercial vehicles (codes 14-17)
Bricks, sand cement /iron rods
1 1

Chapter IV (b)
IV - 9
Table Inter- Province Movement of traffic
NR. 5 Lot 1 Location: Kampong Tralach Market, Kampong Tralach District
Nak Ta Ang Sala leak 5
PreaK Pis Sala leak 5
Koh Sdav Sala Leak 5
Krang Rovea Kampong Kda
Ton Le Sala Leak 5 Banteay Meanchey Phnom penh
Trach Thnol Tou Teung Battambong Phnom Penh
Sala Leak 17 Veal Thom Kampong Chhnang Streung Treang
Thnol Tou Teung Kampong Chhnag Cit Kampong Chhnang Vietnam
Ta koul Prey Konloung Pursat Phnom Penh
Kampong Thlanh Kampong Trolach Phnom Penh Battambong
Kampong Chhnang city Sala leak 5 Kampong Speu
Chres Sala leak 5 Phnom Penh Kampong Chhnang
Kampong Chhnang
Kampong Chhnang city Loung Veak Kampong Chhnang Phnom Penh
Kampong Chhnang city Trach Market
Sala Leak 15 Thnol Tou Teung Kampong Chhnang Koh Kong
Sala Leak 16 Ton Lea Kampong Chhnang Phnom Penh
Sala Leak 13 Ta Des Kampong Chhnang Kampong Speu
Sala Leak 14 Chhlouk Vean Kampong Chhnang Kandal
Sala Leak 11 Pong Rou Ta Keo Kmpong Chhnanag
Sala Leak 12 Prey Pis Kampong Chhnang Kampong Cham
Sala Leak 9 Koh Krobey Kampong Sorm Batttambong
Sala Leak 10 Krang Leav Svay Rieng Kampong Chhnang
Sala Leak 7 Kampong Prosad Phnom Penh Pai Len
Sala Leak 8 Kampong Chhnang c Rattanakiri Kampong Chhnang
Sala Leak 5 Chhouk Phnom Penh Kampong Chhnang
Sala Leak 6 Chreh Phnom Penh Pursat
Krang Ta Eak Sala Leak 5 Phnom Penh Battambong
Chhean Lerng Kampong Prosad Kampong Chhnang Kampong Thom
Kampong Trolach Sala Leak 5 Kampong Cham Kampong Chhnang
Origin Destination Origin Destination
Chamkar Snay Sala Leak 5 Kampong Chhnang Battambong
Koh Sdav Teuk Houd Phnom Penh Banteay Mean Chey
Movement within the same province Movement to other provinces

Chapter IV (b)
IV - 10
Table 6.3.16: Average Occupancy of Passenger Carrying Vehicles
Survey Location
Bus Mini Bus3
wheeler2 wheeler car Jeep/4WD Pick-up
Kampong Tralach Market
0 10.62 0 3.6 4.5 2.75 9.5
Total people % vehicle
Thnol Tou Teung Lung Veak
Krouk Vean Sala Leak 5
Thmor Eud Sala leak 5
Ta Uk Sala leak 5
Teav Trach
Seab Sala Leak 5
Srea Muth Sala leak 5
Sala Leak 8 Thnol Tou Teung
Sala Leak 9 Trach
Sala Leak 6 Spean Por
Sala Leak 7 Ta Eak
Ro Meas Sala leak 5
Sala Leak 5 Kampong Trach
Prey Konlorng Krang Taleak
Ro Meas Thnol Tou Teung
46 26

Chapter IV (b)
IV - 11
Distribution of Average Trip KM Travel of Passenger Vehicles
Vehicle Code
Vehicle Type 0-20 Km 21-50 Km51-100
Km101-200
Km201-and
Above Km
3 Motor Cycle 7 9 2
4 3 wheeler(TukTuk) 4 3
5 Car 2 1 6 11
6 Jeep/4WD 1 3
7 Pickup 5 5 13 16
8 Minibus 3 13 11 25
9 Bus 5
0 21 31 33 60
Distribution of Average Trip KM Travel of Commercial Vehicles
Vehicle Code
Vehicle Type 0-20 Km 21-50 Km51-100
Km101-200
Km201-and
AboveKm
10 Koyan small 1 3
11 Koyan large
12 Light Truck 13 6 3 6
13 Medium Truck 1 1
14 HT Rigid 3Axle 2
15 HT Rigid 4/5 Axle
16 HT Semi T 4/5 Axle
17 HT Semi T 6Axle
0 14 12 3 7
ORIGIN DESTINATIONNR.5 Lot 2, Ponlai District
Total
Total
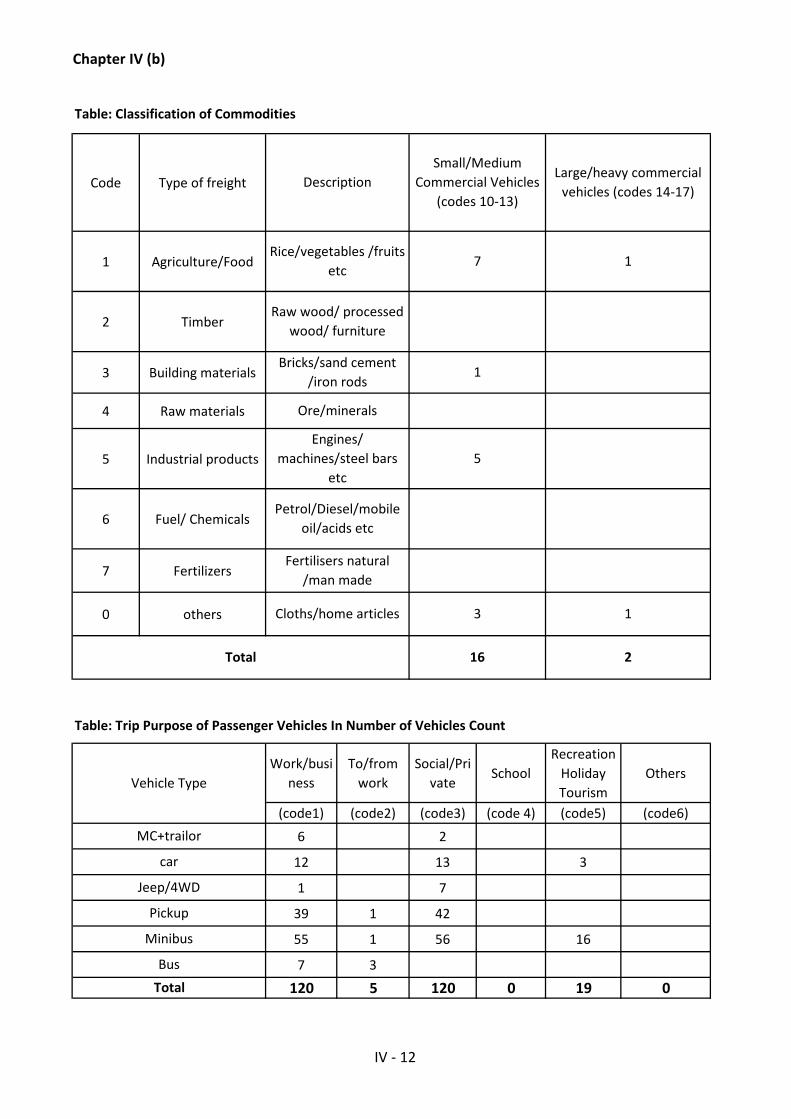
Chapter IV (b)
IV - 12
Table: Classification of Commodities
Code Type of freight
1 Agriculture/Food
2 Timber
3 Building materials
4 Raw materials
5 Industrial products
6 Fuel/ Chemicals
7 Fertilizers
0 others
Table: Trip Purpose of Passenger Vehicles In Number of Vehicles Count
Work/business
To/from work
Social/Private
SchoolRecreation
HolidayTourism
Others
(code1) (code2) (code3) (code 4) (code5) (code6)
6 2
12 13 3
1 7
39 1 42
55 1 56 16
7 3
120 5 120 0 19 0
Fertilisers natural /man made
Ore/minerals
Engines/ machines/steel bars
etc5
Raw wood/ processed wood/ furniture
Bricks/sand cement /iron rods
1
Petrol/Diesel/mobile oil/acids etc
DescriptionSmall/Medium
Commercial Vehicles (codes 10-13)
Large/heavy commercial vehicles (codes 14-17)
Rice/vegetables /fruits etc
7 1
Jeep/4WD
Pickup
Minibus
BusTotal
Cloths/home articles 3 1
Vehicle Type
MC+trailor
car
Total 16 2

Chapter IV (b)
IV - 13
Table Inter- Province Movement of TrafficNR. 5 Lot 2 Location: Punlai District
Table 6.3.16: Average Occupancy of Passenger Carrying VehiclesSurvey
LocationBus Mini Bus 3 wheeler 2 wheeler car Jeep/4WD Pick-up
Punlai 23.8 8.61 3 2.5 3.8 3 6.94
Total people % vehicle
Movement within the same province Movement to other provinces
Origin Destination Origin DestinationKbal Domrei Phsar Chas
Pum Rang
Punlai Punlai
Punlai
Kampong Chhnang Phnom PenhBanteay Meanchey Kampong Chhnang Banteay Meanchey Kandal
Pursat Kampong Chhnang
Kampong Chhnang
Pum Kor Punlai Banteay Meanchey Phnom Penh Batttombong Kampong ChhnangBror Sneum Punlai Batttombong Kampot Derm Chrey Punlai
Punlai Batttombong Phnom Penh Punlai Phnnom Penh Batttombong Ta Keo Punlai Prey Ampel
Punlai Snouk Trou Ang Chanh Roung
Pursat Phnom Penh
Kampong Chhnang Battom Bong Kampong Chhnang Pursat
Ses Slab Pai len Phnom PenhPunlai Sala Krorm
Kampong Loung Phnom Tachen
Punlai
Chnuk Trou Punlai Punlai
Kampong Chhnang Kampong Chhnang
Punlai
Phnom Penh Banteay meanchey Kampong Chhnang
PunlaiOu Rom Chek
Phnom Penh Battom Bong Phnom Penh Kampong Chhnang
Punlai Chnuk Trou
Kampong Cham Pai lenKandal
Phnom Penh Pursat
Punlai
Tropeng Chan
Pupel Punlai Tropeng Chan
Punlai Kbal DomreiKror kou
Punlai
Pupel
29 22
Phnom Penh Pai Len Prey Veng PursatTa keo Battam Bong
Punlai Sang Keap Punlai Snang Ang Punlai
Punlai Thkol Market Pupel Chnuk Trou Pupel Pum Reas

Chapter III (c)
VI - 14
Distribution of Average Trip KM Travel of Passenger Vehicles
Vehicle Code
Vehicle Type 0-20 Km21-50
Km51-100
Km101-200
Km201-and
Above Km
3 Motor Cycle
4 3 wheeler(TukTuk) 1 1
5 Car 2 1 2
6 Jeep/4WD 1
7 Pickup 1
8 Minibus 1 2
9 Bus
4 2 2 1 3
Distribution of Average Trip KM Travel of Commercial Vehicles
Vehicle Code
Vehicle Type 0-20 Km21-50
Km51-100
Km101-200
Km201-and
Above Km
10 Koyan small 1
11 Koyan large 1
12 Light Truck 2 2 2 4
13 Medium Truck 3 2 1
14 HT Rigid 3Axle 4 3 3 5
15 HT Rigid 4/5 Axle 1 7 5 3
16 HT Semi T 4/5 Axle 2 7 10 6
17 HT Semi T 6Axle 1
3 9 22 26 15
ORIGIN DESTINATIONNR.7 Lot 1, Thbong Khmum District
Total
Total

Chapter III (c)
VI - 15
Table: Classification of Commodities
Code Type of freight
1 Agriculture/Food
2 Timber
3 Building materials
4 Raw materials
5 Industrial products
6 Fuel/ Chemicals
7 Fertilizers
0 others
Table: Trip Purpose of Passenger Vehicles In Number of Vehicles Count
Work/business
To/from work
Social/Private
SchoolRecreation
HolidayTourism
Others
(code1) (code2) (code3) (code 4) (code5) (code6)
3 1
2 2 3
1
4
4 3 5
9 5 14 0 0 0
Jeep/4WD
Pickup
Minibus
Bus
Total
Total 17 53
Vehicle Type
MC+trailor
car
Fertilisers natural /man made
1
Cloths/home articles
Engines/ machines/steel bars
etc2
Petrol/Diesel/mobile oil/acids etc
Ore/minerals 1
Rice/vegetables /fruits etc
9 35
Raw wood/ processed wood/
furniture5 6
DescriptionSmall/Medium
Commercial Vehicles (codes 10-13)
Large/heavy commercial vehicles (codes 14-17)
Bricks, sand cement /iron rods
1 10

Chapter III (c)
VI - 16
Table Inter- Province Movement of traffic
NR . 7 Lot 1 Location: Tbong Khmum District
Table 6.3.16: Average Occupancy of Passenger Carrying Vehicles
Survey Locations
Bus Mini Bus3
wheeler2 wheeler car Jeep/4WD Pick-up
Thbong Khmum
8.4 2.3 2.1 1.4 1 4
Total people % vehicle
Vietnam Phnom PenhKampong Cham VietnamKampong Thom Vietnam
Kampong Cham Banteay Meanchey Kampong Cham Phnom PenhKampong Cham Siem Reap
Phnom Penh VietnamSiem Reap Memuth
Kampong Thom VietnamKampot Kampong ChamKandal Kampong ChamPhnom Penh Kampong Cham
Prey Tou Teung Memuth
Phnom Penh Kratie
Prey Tou Teung Punnhea Kreak
Ou Rang Ouv Suong Prey Tou Teung Chub
Kampong Thom Kampong Cham
23 24
Memuth Kampong Cham citySuong Svay Ann Tour
Skun Suong Punnhea Kreak
Vietnam Phnom PenhVietnam Siem Reap
Phnm Penh Kampong ChamPreah Vihea VietnamVietnam Kampong Cham
Suong Beung Kuk Ta Pav Suong
Memuth Thnol Tou Teung Ponhea Kreak Beung Kuk
Chub SkunMemuth Beung Kuk
Chub Chub Chub Mou Ram Dek
Thbong Khmum Chub Thbong Khmum Suong
Prey Tou Teung Suong Suong Thboung Khmum
Origin Destination Origin Destination
Kampong Cham VietnamBateay Meanchey Kampong Cham
Chamkar Leu Suong
Kampong Cham city Ta Borv
Kampong Cham KratieKampong Cham MondulkiriKampong Cham Rattanakiri
Chamkar Leu Thboung Khmum
Movement within the same province Movement to other provinces

Chapter IV (c)
IV - 17
Distribution of Average Trip KM Travel of Passenger Vehicles
Vehicle Code
Vehicle Type 0-20 Km21-50
Km51-100
Km101-200
Km201-and
Above Km
3 Motor Cycle 4
4 3 wheeler(TukTuk) 2 2
5 Car 8 3 9
6 Jeep/4WD 2 5 11
7 Pickup 1 1 6 8
8 Minibus 5 27 56 79
9 Bus 4
0 6 40 70 117
Distribution of Average Trip KM Travel of Commercial Vehicles
Vehicle Code
Vehicle Type 0-20 Km21-50
Km51-100
Km101-200
Km201-and
Above Km
10 Koyan small
11 Koyan large 1 1
12 Light Truck 2 1 6
13 Medium Truck 2
14 HT Rigid 3Axle 1
15 HT Rigid 4/5 Axle 2 1 2
16 HT Semi T 4/5 Axle 1
17 HT Semi T 6Axle
0 3 4 3 10
ORIGIN DESTINATIONNR.7 Lot 2, Thbong Khum District (Pratheat)
Total
Total

Chapter IV (c)
IV - 18
Table: Classification of Commodities
Code Type of freight
1 Agriculture/Food
2 Timber
3 Building materials
4 Raw materials
5 Industrial products
6 Fuel/ Chemicals
7 Fertilizers
0 others
Table: Trip Purpose of Passenger Vehicles In Number of Vehicles Count
Work/business
To/from work
Social/Private
SchoolRecreation
HolidayTourism
Others
(code1) (code2) (code3) (code 4) (code5) (code6)
3 2
18 6 25
7 12 17
14 8
246 87 147 1
6 3 3
294 107 200 0 4 0
DescriptionSmall/Medium
Commercial Vehicles (codes 10-13)
Large/heavy commercial vehicles (codes 14-17)
Bricks/sand cement /iron roads
2 1
Ore/minerals
Rice/vegetables /fruits etc
5 1
Raw wood/ processed wood/
furniture
Fertilisers natural /man made
Cloths/home articles 1 1
Engines/ machines/steel bars
etc1
Petrol/Diesel/mobile oil/acids etc
Jeep/4WD
Pickup
Minibus
Bus
Total
Total 8 4
Vehicle Type
MC+trailor
car

Chapter IV (c)
IV - 19
Table Inter- Province Movement of Traffic
NR .7 Lot 2 Location: Pratheat, Thbong Khmum District
Movement within the same province
MemuthProthead Ponhea krek
Movement to other provinces
Origin Destination Origin Destination
Memuth
Kratie Mundul Kiri Rattanakiri VietnamMundul Kiri Vietnam
Kampong Cham Kampong Cham
Ponhea krek Dambae MemuthProtheadPonhea krek Phnom Prech
Kratie Phnom Penh
Steung TreangTakeo Kampong Cham
Prey VengMundolkiriKratieKampong Cham
Phnom Penh
Skun Memuth Skun Ponhea krek Suong Dambae
Kampong Cham MemuthKampong Cham Prothead Kampong Cham Ponhea krek
Dambae Ou Rang Ouv Chom Peang Kampong Cham
Suong MemuthSuong ProtheadSuong Ponhea krek
Dambae Suong
Steung Suong Tropeng Phlung Thnol Tou Teung Suong Dambae
Prothead Kampong Cham Ponhea krek SkunSuong Kampong Cham
Kampong Cham Kampong Cham Kampong Cham Skun Skun Suong
Suong Ponhea krek Suong Memuth
Steung Dambae Steung Suong Pou Leas Krouch Chmar
Krouch Chmar Kampong Cham Memuth Kampong Cham Rundov chrum Kampong Cham
Tonle Bith Phnom Prech
Kratie Kratie Phnom Pen Phnom Pen Phnom Pen Phnom Pen
Suong Suong Suong Tonle Bith Kampong Cham Kampong Cham
Kampong Cham Kampong Cham Kampong Cham Kampong Cham Kampong Cham
Phnom Pen Phnom Pen Prey Veng Prey Veng Svay Rieng Kampong Cham
RattanakiriSteung Treang Kratie RattanakiriKratie Kandal
kratiekratie

Chapter IV (c)
IV - 20
Table 6.3.16: Average Occupancy of Passenger Carrying Vehicles
Survey Locations
Bus Mini Bus3
wheeler2 wheeler car Jeep/4WD Pick-up
Pratheat 25.75 11.01 2 3.3 2.8 3.5 2.35
Total people % vehicle
27 56
Prey Veng Takeo Kampong Cham Phnom Penh
Phnom PenhKampong Thom Prey Veng
Steung Treang Kampong Cham Kratie RattanakiriKratie
Kampong Cham KratiePhnom Penh Steung TreangKratie Rattanakiri
Kampong ChamPhnom PenhSiem Reap Kampong Cham Phnom Penh
Ratanakiri
Steung Treang Steung Treang Vietnam Vietnam Vietnam Vietnam
kratiekratieMundolkiriMundolkiri
Kampong Cham Phnom Penh Phnom Penh Phnom Penh
Kampong Cham
PursatKratie Ratanakiri
Kampong Cham
RatanakiriRatanakiriRatanakiri

Chapter IV (d)
IV - 21
Distribution of Average Trip KM Travel of Passenger Vehicles
Vehicle Code
Vehicle Type 0-20 Km 21-50 Km51-100
Km101-200
Km201-and
Above Km
3 Motor Cycle
4 3 wheeler(TukTuk) 1 3
5 Car 1 2 3 4 2
6 Jeep/4WD 1
7 Pickup 1 2
8 Minibus 5 1 3 8 2
9 Bus 1 1 1 1
8 3 10 17 5
Distribution of Average Trip KM Travel of Commercial Vehicles
Vehicle Code
Vehicle Type 0-20 Km 21-50 Km51-100
Km101-200
Km201-and
Above Km
10 Koyan small
11 Koyan large 1 2 1
12 Light Truck 2 4
13 Medium Truck 1 3 2
14 HT Rigid 3Axle 1
15 HT Rigid 4/5 Axle 1
16 HT Semi T 4/5 Axle 2
17 HT Semi T 6Axle
1 5 12 2 0
ORIGIN DESTINATIONNR.71, Chamkarleu District ( Busknor )
Total
Total

Chapter IV (d)
IV - 22
Table: Classification of Commodities
Code Type of freight
1 Agriculture/Food 2
2 Timber
3 Building materials
4 Raw materials
5 Industrial products
6 Fuel/ Chemicals
7 Fertilizers
0 others
Table: Trip Purpose of Passenger Vehicles In Number of Vehicles Count
Work/business
To/from work
Social/Private
SchoolRecreation
HolidayTourism
Others
(code1) (code2) (code3) (code 4) (code5) (code6)
5
19 15 15 2
2
3 5
35 15 16 1 9
7 3 1 1
71 33 37 2 11 0
Raw wood/ processed wood/ furniture
Bricks/sand cement /iron roads
3
Ore/minerals
DescriptionSmall/Medium
Commercial Vehicles (codes 10-13)
Large/heavy commercial vehicles (codes 14-17)
Rice/vegetables /fruits etc
5
Cloths, home articles 2
Vehicle Type
MC+trailor
car
Jeep/4WD
Total 14
Engines/ machines/steel bars
etc4
Petrol/Diesel/mobile oil/acids etc
Fertilisers natural /man made
Pickup
Minibus
Bus
2
Total

Chapter IV (d)
IV - 23
Table Inter- Province Movement of Traffic
NR. 71 Location: Busknor, Chamkar Leu District
Table 6.3.16: Average Occupancy of Passenger Carrying Vehicles
Survey Locations
Bus Mini Bus 3 wheeler 2 wheeler car Jeep/4WD Pick-up
Busknor 16.08 26.65 3 2.6 66.08 2 3.6
Total people % vehicle
Preah Vihea
Beung Kuk Thnol Tou Teung
Kampong Cham Phnom Penh
Kampong Cham Kampong Thom Kampong Cham
Kampong Cham Banteay Mean Chey Kampong Cham Kampong Thom Kampong Cham
Movement within the same province Movement to other provinces
Origin Destination Origin Destination
Busknor Kampong Cham city
Chamkar Leu Beung Kuk Chamkar Leu Busknor
Rattanakiri
Chamkar Leu Chub Chamkar Leu Kampong Cham cityChamkar Leu Thnol Tou Teung Speu Dey Dos
Siem Reap Phnom Penh
Speu Kampong Cham Kampong Cham Banteay Meanchey Kampong Speu
Beung Kuk Srea Veal
Kampong Cham Beung Kuk Busknor Beung Kuk Chamkar Leu
Phnom Penh Kampong Cham Phnom Penh Kampong Cham
Memuth Chamkar Leu
Kampong Cham Srea Veal
Busknor Busknor Kampong Cham Busknor
Beung Kuk Speu
Punnha Kreak Busknor Busknor
27 11
Kampong Cham Chamkar Leu Chamkar Leu Kampong Cham
Wat Angkor Chamkar Leu Wat Angkor Srea Veal
Spean Kysona Srea Veal Spean Kysona Busknor Spean Kysona Chamkar Leu
Andoung Chraa
Kampong Cham Ta Ung

Chapter IV (e)
IV - 24
Distribution of Average Trip KM Travel of Passenger Vehicles
Vehicle Code
Vehicle Type 0-20 Km21-50
Km51-100
Km101-200
Km201-and
Above Km
3 Motor Cycle 6 3
4 3 wheeler(TukTuk) 4 6
5 Car 2 4 2
6 Jeep/4WD 2 1 1
7 Pickup 2 1
8 Minibus 1 1
9 Bus 1 3 2
15 1 20 6 0
Distribution of Average Trip KM Travel of Commercial Vehicles
Vehicle Code
Vehicle Type 0-20 Km21-50
Km51-100
Km101-200
Km201-and
Above Km
10 Koyan small 14 3 7 1
11 Koyan large 1 2 3
12 Light Truck 1 1 19 6 2
13 Medium Truck 1 16 3
14 HT Rigid 3Axle 1 4 28 12 1
15 HT Rigid 4/5 Axle 1 46 14 4
16 HT Semi T 4/5 Axle 1 2 23 7 8
17 HT Semi T 6Axle 1 6 4 1
18 15 148 47 16
ORIGIN DESTINATIONNR.72, Ponhea Krek District ( Trapoeung Plong )
Total
Total

Chapter IV (e)
IV - 25
Table: Classification of Commodities
Code Type of freight
1 Agriculture/Food
2 Timber
3 Building materials
4 Raw materials
5 Industrial products
6 Fuel/ Chemicals
7 Fertilizers
0 others
Table: Trip Purpose of Passenger Vehicles In Number of Vehicles Count
Work/business
To/from work
Social/Private
SchoolRecreation
HolidayTourism
Others
(code1) (code2) (code3) (code 4) (code5) (code6)
17
5 3 5
4 1 1
1 1 3
3 2
7 1 12
37 5 12 0 12 0
DescriptionSmall/Medium
Commercial Vehicles (codes 10-13)
Large/heavy commercial vehicles (codes 14-17)
Bricks/sand/cement /iron roads
2 2
Ore/minerals 0
Rice/vegetables /fruits etc
193 138
Raw wood/ processed wood/
furniture0 1
Fertilisers natural /man made
0
Cloths/home articles 1
Engines/ machines/steel bars
etc2 3
Petrol/Diesel/mobile oil/acids etc
0
Jeep/4WD
Pick-up
Minibus
Bus
Total
Total 198 144
Vehicle Type
MC+trailor
car

Chapter IV (e)
IV - 26
Table Inter- Province Movement of Traffic
NR Location:
Table 6.3.16: Average Occupancy of Passenger Carrying VehiclesSurvey
LocationsBus Mini Bus
3 wheeler
2 wheeler car Jeep/4WD Pick-up
22.1 15.6 2 2 4.6 6 4.3
Total people % vehicle
Movement within the same province Movement to other provinces
Origin Destination Origin Destination
Kampong Chhnang VietnamChamkar Leu Trapoeung phlong
Dambae Vietnam Modulkiri VietnamPonhea krek Vietnam Phnom Penh Vietnam
Dambae Trapoeung phlong Kampong Thom VietnamChamkar Leu Vietnam Kratie Vietname
Vietnam Casino Siem Reap VietnamVietnam Chamkar Leu Steung Treang Vietnam
Trapoeung phlong Vietnam Ponhea krek VietnamTrapoeung Russey Vietnam Rattanakiri Vietnam
Vietnam Damae Vietnam Phnom Pehn Vietnam Kampong cham city Vietnam Siem Reap
Vietnam Chi Kreang Vietnam Battambong Vietnam Chi Mun Market Vietnam Kampong Thom
Vietnam Steung Vietnam Kampong ThomVietnam Suong Vietnam Siem Reap
Vietnam Ou Rang Ov Rattanakiri VietnamVietnam Ponhea krek Steung Treang Vietnam
Chamkar Leu VietnamDabae Vietnam
Vietnam Trapoeung phlong Casino Vietnam
27 17
Vietnam Kampong cham cityVietnam Suong
Vietnam Kampong Cham Vietnam Chi Kreng
Kouk Char VietnamSteung Trong Vietnam

Chapter IV (f)
IV - 27
Distribution of Average Trip KM Travel of Passenger Vehicles
Vehicle Code
Vehicle Type 0-20 Km21-50
Km51-100
Km101-200
Km201-and
Above Km
3 Motor Cycle 2
4 3 wheeler(TukTuk) 1
5 Car 3 2 4 2
6 Jeep/4WD 6
7 Pickup 2 1 4
8 Minibus 1 5 5 25
9 Bus
0 8 8 10 37
Distribution of Average Trip KM Travel of Commercial Vehicles
Vehicle Code
Vehicle Type 0-20 Km21-50
Km51-100
Km101-200
Km201-and
Above Km
10 Koyan small 1
11 Koyan large 2
12 Light Truck 1 2 4 8 3
13 Medium Truck 2 1 3
14 HT Rigid 3Axle 2 1 1
15 HT Rigid 4/5 Axle 1 3
16 HT Semi T 4/5 Axle 1 5
17 HT Semi T 6Axle
4 7 10 17 3
ORIGIN DESTINATIONNR.73, Dambae District
Total
Total

Chapter IV (f)
IV - 28
Table: Classification of Commodities
Code Type of freight
1 Agriculture/Food
2 Timber
3 Building materials
4 Raw materials
5 Industrial products
6 Fuel/ Chemicals
7 Fertilizers
0 others
Table: Trip Purpose of Passenger Vehicles In Number of Vehicles Count
Work/business
To/from work
Social/Private
SchoolRecreation
HolidayTourism
Others
(code1) (code2) (code3) (code 4) (code5) (code6)
1
16 3 44 7 35 2 6
57 17 32
83 29 45 0 0 0
Raw wood/ processed wood/
furniture1 0
Bricks, sand/cement/iron
roads0 0
DescriptionSmall/Medium
Commercial Vehicles (codes 10-13)
Large/heavy commercial vehicles (codes 14-17)
Rice/vegetables /fruits etc
10 7
Petrol/diesel/mobile oil/acids etc
0 0
Fertilisers natural /man made
0 1
Ore/minerals 1 0
Engines/ machines/steel bars
etc3 0
Jeep/4WDPickup
MinibusBus
Cloths/home articles
2 0
Vehicle Type
MC+trailor
car
Total 17 8
Total

Chapter IV (f)
IV - 29
Table Inter- Province Movement of TrafficNR 72 Location: Dambae
Table 6.3.16: Average Occupancy of Passenger Carrying Vehicles
Survey Locations
Bus Mini Bus3
wheeler2 wheeler car Jeep/4WD Pick-up
Dambae 17.48 1.7 5 3.91 3.6 17.2
Total people % vehicle
Kampong Cham VietnamKratie Kampong ChamKratie VietnamKratie Phnom Penh Kratie
Kampong Cham Steung Treang Kampong Thom Steung Treang
Phnmom Penh Phnmom Penh Prey Veng Prey Veng Kampong Cham
Ponhea Krek SteungSrea Bang DambaeSvay Kombeth Dambae
Rattanakiri Steung Treang Steung Treang Ta Keo
Dambae Suong Chrey Memuth Kampong Cham
Kanh Chreath
Dambae
Ponhea Krek Trapoeung Phlong
Suong DambaeOudong Steung Dambae Kampong ChamDambae Dambae Steung
Movement within the same province Movement to other provinces
Dambae
Steung Treang Rattanakiri Phnom Penh
Phnmom Penh Kampong ChamKratieRattanakiri
Origin Destination Origin DestinationKampong Cham Kratie Dambae Dambae
Dambae Srea Prang
Prothead Dambae Ponhea Krek DambaeSkun Dambae
19 21
Thmor Dab Dambae
Kratie Kampong Thom
Kratie Kampong ChamKampong Cham Vietnam
Preah ViheaKampong ChamKampong ChamPhnom PenhPhnom Penh
Kampong Cham

Chapter IV (g)
IV - 30
Distribution of Average Trip KM Travel of Passenger Vehicles
Vehicle Code
Vehicle Type 0-20 Km21-50
Km51-100
Km101-200
Km201-and
Above Km
3 Motor Cycle 7 4 4
4 3 wheeler(TukTuk) 1 5 1
5 Car 1 1 1
6 Jeep/4WD
7 Pickup 1
8 Minibus 4 3 8
9 Bus 2
13 14 16 0 0
Distribution of Average Trip KM Travel of Commercial Vehicles
Vehicle Code
Vehicle Type 0-20 Km21-50
Km51-100
Km101-200
Km201-and
Above Km
10 Koyan small 2 1
11 Koyan large 2 3 1
12 Light Truck 1 7
13 Medium Truck 2 1 3
14 HT Rigid 3Axle 1 1 1
15 HT Rigid 4/5 Axle 1
16 HT Semi T 4/5 Axle
17 HT Semi T 6Axle
5 14 4 4 0
ORIGIN DESTINATION
Total
Total
NR.2714, Chamkarleu District (Speu)

Chapter IV (g)
IV - 31
Table: Classification of Commodities
Code Type of freight
1 Agriculture/Food
2 Timber
3 Building materials
4 Raw materials
5 Industrial products
6 Fuel/ Chemicals
7 Fertilizers
0 others
Table: Trip Purpose of Passenger Vehicles In Number of Vehicles Count
Work/business
To/from work
Social/Private
SchoolRecreation
HolidayTourism
Others
(code1) (code2) (code3) (code 4) (code5) (code6)
13 6
1 8
142 9 32 5 72 4
59 9 50 5 7 0
Vehicle Type
MC+trailor
carJeep/4WD
Fertilisers natural /man made
Cloths/home articles
2
1
Ore/minerals
Engines/ machines/steel bars
etc2
Petrol/Diesel/ mobile oil/acids etc
PickupMinibus
Bus
Description
Rice/vegetables /fruits etc
7
Raw wood/ processed wood/
furnitureBricks/
sand/cement /iron roads
1
Large/heavy commercial vehicles (codes 14-17)
Small/Medium Commercial Vehicles
(codes 10-13)
1
2
Total 12 4
Total

Chapter IV (g)
IV - 32
Table Inter- Province Movement of Traffic
NR. 2714 Location: Speu Market, Chamkar Leu District
Kampong Cham Kampong Thom Kampong Cham Bateay mean Chey
Speu Speu Speu Speu Speu Speu
Chamkar Leu Kampong Cham city
Srea VealSrea VealSteung Trorng Trapoeung Rusey
Speu Srea VealSrea Veal
Speu
Origin
Movement within the same province Movement to other provinces
Speu Speu
Memuth Ouk Muk Paav Prey Tou Teung Skun
Busknor Busknor
Streung Streang Chamkar LeuSpeuSpeu
Banteay Chey Speu Srea VealTrapoeung Russey Speu
Thnol BekMemuth
SpeuThnol Bek Speu
Origin Destination
Speu
Ou Pik SpeuOu Pik Thnol Bek Ou Pi SpeuOu Veay Thnol Bek
Bek Anloung Bek Anloung
Kampong Cham
Phnom Penh
Destination
Kampong ChamKampong Cham
Kampong ChamKampong Cham Siem ReapSpeu Vietnam Kampong Thom Kampong Cham
Siem Reap
Phnom Penh
Thnol Bek
Kampong Cham City
Prey Tou Teung
Uk Muk Thnol BekKampong Cham Prey Tou Teung Speu
Speu
Chey You Ou Kreak Ou Peung
Sork Srea Veal
Ou piOu Pek
Speu
Ou Veay
Kampong Thom

Chapter IV (g)
IV - 33
Table 6.3.16: Average Occupancy of Passenger Carrying Vehicles
Survey Locations
Bus Mini Bus3
wheeler2 wheeler car Jeep/4WD Pick-up
Speu 3 9.2 3 2 2.6 1
Total people % vehicle
Thnol Bek Trobek Trapoeung Kea
Speu Spor Svay Teap
Speu Kerth
Thnol Tou Teung Thnol Bek Thnol Bek
Steung Trong Sre Veal Speu
SapheaSpeuSpeu Vietnam
Streung Trong Trerng Speu Chey You
46 9
Speu Srea Ma Om Srea Veal

V - 1
Appendix V
Road No.
Location
M
F
M
F
Motorbike
Car
Scooter
Lorry / Etan
Others, (bicycle)
Km/mon.
Bus
CarOthers ( Motor taxi)Agriculture
Service
Business
Minimum
Maximum
Average
5,000$
725$
SUMMARY OF COMMUNITY DATA SURVEY
Member in family
No. of Children
No. Question
Family income (Monthly) USD/Riels7
In the family3
4
5
6
Vehicle ownership
Use of Public/Private Transport
Main Occupation of family
Kampong Trach
NR.5-1
23
54
51
98
88
8620
11
1
0
7
9
15
16
6
33
3
50$
2
38
0
7
20
13
50$
2,250$
408$
4
1
17
14820
85
99
58
63
28
69
34
50
32
1
NR.5-2
Punlai
NR.1-1
KampongTrabek
57
3
2
38
8
21
11
1
0
13
4650
38
50$
1,625$
319$
NR.1-2
Svay Teap
61
74
30
35
35
1
0
0
15
3900
1
50$
2,250$
443$
30
0
6
22
12
14
5
11
16
13
NR.7-1
ThbongKhmom
77
102
67
95
24
8
6
1
0
11050
3
75$
3,000$
365$
NR.7-2
Pres Theat
55
68
41
36
23
5
0
1
20
6900
6
50$
2,250$
28
12
18
7
15
NR.73 NR.2714
Bos Khnor
Trapoeung Thlong
Dambae Speu
NR.71 NR.72
71 61
50 30
21 19
16 1
0 14
10
45 70
57 23 44 70
86 101
66 74 78 99
0 11
1 6 2 0
33 27
3 2 2 3
10 1 1
12 25 19 32
21 0
7560 8940 5870 8940
13 13 19 16
12 10 7 13
1 7 37 3
15 17 14 10
996$ 748$ 232$ 689$
120$ 50$ 100$ 100$
5,000$ 5,750$ 750$ 7,000$

V - 2
Appendix V
Road No.
Location
SUMMARY OF COMMUNITY DATA SURVEY
No. Question
Kampong Trach
NR.5-1 NR.5-2
Punlai
NR.1-1
KampongTrabek
NR.1-2
Svay Teap
NR.7-1
ThbongKhmom
NR.7-2
Pres Theat
NR.73 NR.2714
Bos Khnor
Trapoeung Thlong
Dambae Speu
NR.71 NR.72
Excellent
very Good
Good
Poor
Lower 18 45% 33 83% 30 75% 37 93% 11 28% 15 38% 5 13% 17 43% 29 73% 5 13%
Some what lower 17 43% 7 18% 10 25% 3 8% 14 35% 10 25% 1 3% 14 35% 10 25% 13 33%
No Change 5 13% 0 0% 0 0% 0 0% 2 5% 1 3% 5 13% 9 23% 1 3% 8 20%
Over 0 0% 0 0% 0% 0 0% 13 33% 14 35% 29 73% 0 0% 0 0% 14 35%
Better
Some what better
No Change
Minimum
Maximum
Mean
By Walk PercentageBy Personal vehicle
including bicycleYes
By Bus Yes
By Others Yes
Better
Somewhat better
Better
Somewhat better
Better
Somewhat better
How road project
benefited your family business?
Excess to public transport compared to
2008
Distance (km)
10
9Travel of school
children by
8Benefit of the road project
Easy excess to market
Easy to carry goods for sale in the market
Availability of goods in the market
Quality Travel (comfort level)
Saving in transportation cost compared to 2008
1
34
2
4
12
19
2
7
0.026
0.102
39
1
37
0.01
17
1.7
0.231
0.641
3
37
3
39
1
39
1
39
1
0
0
40
0
0
0.1
5
0.5
0.24
0.76
21
18
0
0.115
0.885
4
0
40
0
0
3
33
1
39
1
0
0
39
1
39
0.02
2
0.7
0
35
1
40
0.2
20
1.3
0.276
0.621
5
0
40
0
0
0
40
0
0.034
0.069
39
0.065
0.741
4
0
21
18
1
6
30
0
40
0
0.065
0.129
40
0
40
0.4
18
2.5
11
21
40
0
40
0.3
6
1.7
0.04
0.88
5
3
31
6
3
0
40
0
0.04
0.04
0 12 2 1
1 0 0 0
1 28 33 32
36 17 27 30
3 11 11 9
0.3 0.2 0.25 0.14
10 5 3 6
38 10 7 7
1 2 0 1
0.885 0.84 0.967 0.794
0 0 0 0
2.47 0.78 0.93 1
0.115 0.16 0.033 0.172
1 0 0 9
39 39 39 36
0 0 0 0.034
39 40 40 31
1 0 1 7
1 1 1 4
39 40 39 33

VI - 1
APPENDIX VI
Traffic Volume Count has been carried out between 7AM to 6PM and 8 PM to 11PM. It has been observed that traffic during the period 8PM to 11PM is about 3.95% of the total count between 7Am to 6 PM. In Cambodia life starts with the sunrise as most of the business community/ service class start travelling, therefore, it would be appropriate to take 40% of the traffic between 7AM-8AM. In the balance time between 6-8 pm and 11PM to 5AM, it is taken as 5% of the total estimated count which may include about 4% traffic between 6pm-8pm and about 1% between 11pm and 6pm.
Example NR1-1
(a) Traffic count between 7am to 8am=540 (b) Traffic count between 7am to 6pm=4740 (c) Traffic count between 8pm to11pm=206 (d) Traffic count between 6am to 7am as 40% of count in(a) above=210 (e) Traffic count between 6pm-8pm and 11pm -6am is taken as 5%=300 (f) Total 24 count =6002
24 hour Adjustment factor=6002 divided by 4946=1.21
Example NR1-2
(a) Traffic count between 7am to 8am=850 (b) Traffic count between 7am to 6pm=5612 (c) Traffic count between 8pm to11pm=423 (d) Traffic count between 6am to 7am as 40% of count in(a) above=340 (e) Traffic count between 6pm-8pm and 11pm -6am is taken as 5%=300 (f) Total 24 count =6265
24 hour Adjustment factor=6265 divided by 5612=1.11 Average = (1.11+1.21)/2=1.16

Appendix VII
VII - 1
Appendix VII
7.1 NR1-1 Kompong Trabek, Prey Veng Province and NR1-2 Prosot, Svay Rieng Province
NR1-Lot 2
NR 1
PK100 KROL KOUR
TC Count, in front of Prosot High School
PK69+200
BAVE
T
164.
400
Phno
m P
enh
OD Survey PK 135.65 PROSOT Market, SVAY TEAP, District Centre
OD survey PK87.550 KAMPONG TRABEK
TC count PK88.260
Neak Loeung Ferry Way MeKong River

Appendix VII
VII - 2
7.2 NR5-1 Kompong Tralach, Kompong Chhnang and NR5-2 in Punlai, Kompong Chhnang
NR 6-1
TC Count
PK 53km
Tc Count PK124
Purs
at 1
70.9
00
Thai
land
Bor
der
Phno
m P
enh
NR 5 Lot1
NR5-Lot 2
PK91.100 Kampong Chhnang
PK3.900
OD Survey Kampong Tralach Market on Petrol Pumps (PK52.700km) Kampong
Punlai, (PK 124.100- Coner to Tonle Sap & NR 5)
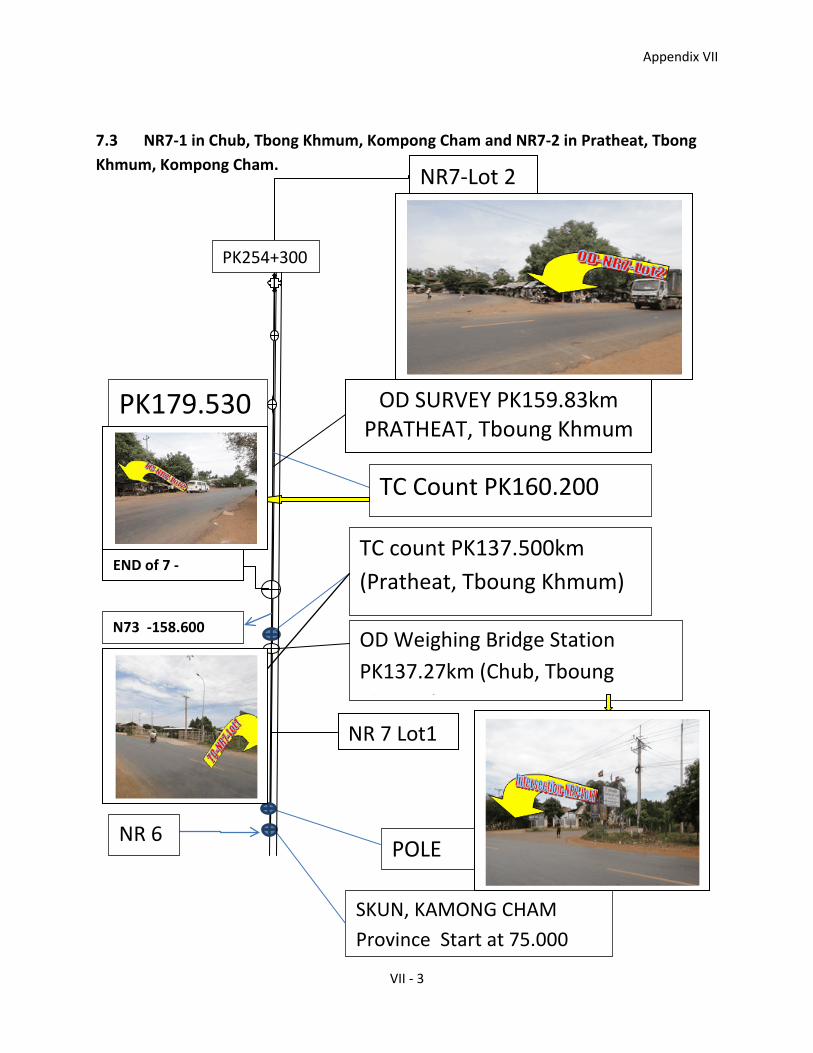
Appendix VII
VII - 3
7.3 NR7-1 in Chub, Tbong Khmum, Kompong Cham and NR7-2 in Pratheat, Tbong Khmum, Kompong Cham.
NR 7 Lot1
NR7-Lot 2
OD SURVEY PK159.83km PRATHEAT, Tboung Khmum
END of 7 -
NR 6
SKUN, KAMONG CHAM Province Start at 75.000
POLE
OD Weighing Bridge Station PK137.27km (Chub, Tboung
h )
TC count PK137.500km (Pratheat, Tboung Khmum)
PK179.530
N73 -158.600
PK254+300
TC Count PK160.200
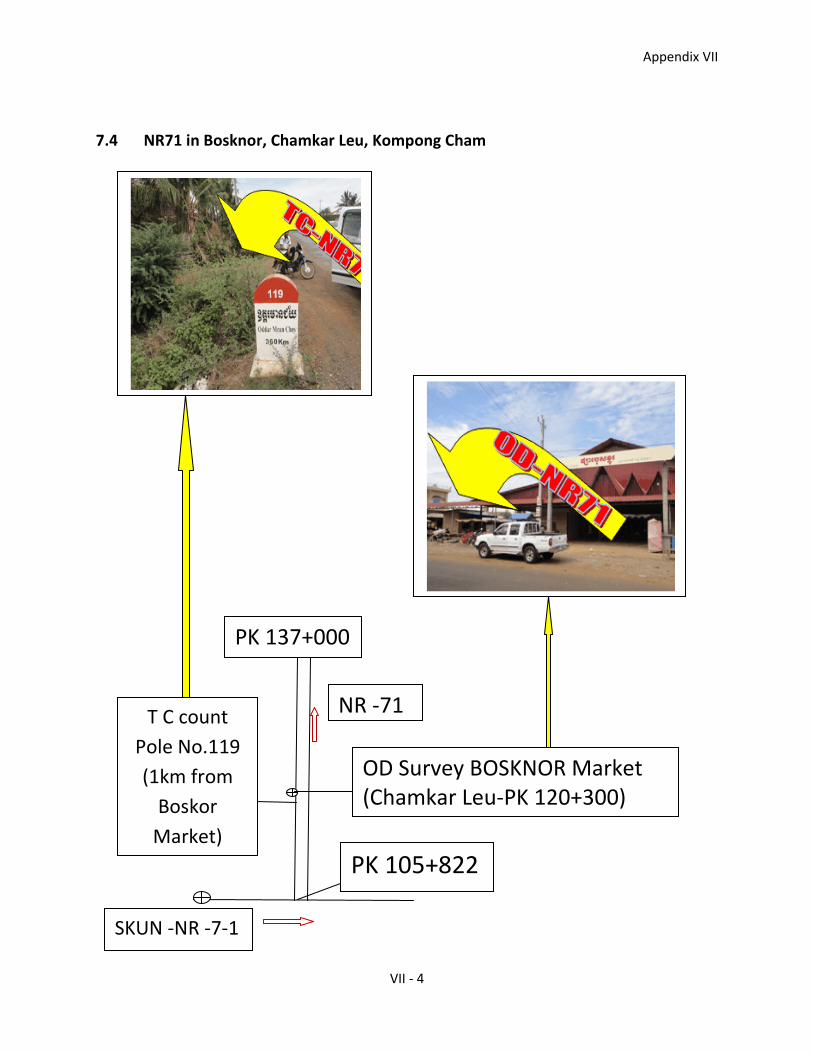
Appendix VII
VII - 4
7.4 NR71 in Bosknor, Chamkar Leu, Kompong Cham
SKUN -NR -7-1
T C count Pole No.119 (1km from
Boskor Market)
OD Survey BOSKNOR Market (Chamkar Leu-PK 120+300)
PK 137+000
NR -71
PK 105+822

Appendix VII
VII - 5
7.5 NR72 in Trapang Phlong, Punhea Kreak, Kompong Cham
PK179.53 NR
Vietnam border – (Trapang Phlongh)
OD
PK191.800 Police Check
Point
Traffic Count-PK191.400 (in front of Grand Golden Hotel & Casino)

Appendix VII
VII - 6
7.6 NR73 in Dambae Roundabout, Dambae, Kompong Cham
NR 7
NR73
PK 158+000
PK216+600
OD Survey DAMBAE-PK 185km Roundabout, District Centre
TC Count at Bunty TV shop, 1km from Dombae Roundabout (South-PK184.500km)

Appendix VII
VII - 7
7.7 PR 2714 in Speu, Chamkar Leu, Kompong Cham
NR 71
NR 2714
OD Survey-at SPEU Market (PK 142+500)
TC Count
ACLEDA Bank -
PK13