
A bridge network maintenance framework for Pareto optimization of stakeholders/users costs
15
This article appeared in a journal published by Elsevier. The attached copy is furnished to the author for internal non-commercial research and education use, including for instruction at the authors institution and sharing with colleagues. Other uses, including reproduction and distribution, or selling or licensing copies, or posting to personal, institutional or third party websites are prohibited. In most cases authors are permitted to post their version of the article (e.g. in Word or Tex form) to their personal website or institutional repository. Authors requiring further information regarding Elsevier’s archiving and manuscript policies are encouraged to visit: http://www.elsevier.com/copyright
-
Upload
independent -
Category
Documents
-
view
1 -
download
0
Transcript of A bridge network maintenance framework for Pareto optimization of stakeholders/users costs

This article appeared in a journal published by Elsevier. The attachedcopy is furnished to the author for internal non-commercial researchand education use, including for instruction at the authors institution
and sharing with colleagues.
Other uses, including reproduction and distribution, or selling orlicensing copies, or posting to personal, institutional or third party
websites are prohibited.
In most cases authors are permitted to post their version of thearticle (e.g. in Word or Tex form) to their personal website orinstitutional repository. Authors requiring further information
regarding Elsevier’s archiving and manuscript policies areencouraged to visit:
http://www.elsevier.com/copyright
Author's personal copy
A bridge network maintenance framework for Pareto optimization ofstakeholders/users costs
Andre D. Orcesi a, Christian F. Cremona b,n
a Laboratoire Central des Ponts et Chaussees, Section Durabilite des Ouvrages d’Art, 58 boulevard Lefebvre, F-75732 Paris Cedex 15, Franceb Commissariat General au Developpement Durable, Direction de la recherche et de l’innovation, Tour Pascal B, F-92055, La Defense Cedex, France
a r t i c l e i n f o
Article history:
Received 30 December 2009
Received in revised form
20 May 2010
Accepted 18 June 2010Available online 25 June 2010
Keywords:
Maintenance
Bridge network
Optimization
Genetic algorithm
Markov chains
a b s t r a c t
For managing highway bridges, stakeholders require efficient and practical decision making techniques.
In a context of limited bridge management budget, it is crucial to determine the most effective
breakdown of financial resources over the different structures of a bridge network. Bridge management
systems (BMSs) have been developed for such a purpose. However, they generally rely on an individual
approach. The influence of the position of bridges in the transportation network, the consequences of
inadequate service for the network users, due to maintenance actions or bridge failure, are not taken
into consideration. Therefore, maintenance strategies obtained with current BMSs do not necessarily
lead to an optimal level of service (LOS) of the bridge network for the users of the transportation
network. Besides, the assessment of the structural performance of highway bridges usually requires the
access to the geometrical and mechanical properties of its components. Such information might not be
available for all structures in a bridge network for which managers try to schedule and prioritize
maintenance strategies. On the contrary, visual inspections are performed regularly and information is
generally available for all structures of the bridge network. The objective of this paper is threefold (i)
propose an advanced network-level bridge management system considering the position of each bridge
in the transportation network, (ii) use information obtained at visual inspections to assess the
performance of bridges, and (iii) compare optimal maintenance strategies, obtained with a genetic
algorithm, when considering interests of users and bridge owner either separately as conflicting criteria,
or simultaneously as a common interest for the whole community. In each case, safety and
serviceability aspects are taken into account in the model when determining optimal strategies. The
theoretical and numerical developments are applied on a French bridge network.
& 2010 Elsevier Ltd. All rights reserved.
1. Introduction
Highway bridges may experience severe deterioration due tonatural hazards, ageing, and increased structural performancedemands. In a context of scarce financial resources, managers ofhighway bridges face increasing challenges in meeting publicexpectations and, in turn, have to be more efficient for theirmanagement strategies. A bridge network is part of a transporta-tion infrastructure and, consequently, plays a major role in urbanand economic development and quality of life. Unavailability ofbridges due to maintenance and repair actions may have anegative social impact. Indeed, due to their critical location, theirpartial or total closure results in major disruption such as longdiversions, additional congestion, use of the transportation
network not up to equal standards and even the total isolationof certain areas [1].
The aim of this paper is to provide stakeholders with a globaldecision making tool at the scale of a transportation network,using a probability-based formulation. Remarkable accomplish-ments have been achieved so far in the field of bridge networkmaintenance optimization. There have been several attempts tocoordinate maintenance strategies at the scale of the transporta-tion network and not for each structure considered individually.Adey et al. [2–4] propose a supply and demand system approachand focus on the ability of the transportation network as a wholeto provide an adequate LOS. They optimize the maintenancestrategies for a bridge network by balancing supply and demandcosts. Also, the use of the reliability theory, which is an excellentcandidate to capture uncertainties associated with structuraldegradation of bridges, has been investigated these last years inbridge network analyses. Liu and Frangopol [5,6] express theoverall performance of a bridge network by a time-dependentreliability of connectivity between the origin and the destination
Contents lists available at ScienceDirect
journal homepage: www.elsevier.com/locate/ress
Reliability Engineering and System Safety
0951-8320/$ - see front matter & 2010 Elsevier Ltd. All rights reserved.
doi:10.1016/j.ress.2010.06.013
n Corresponding author.
E-mail addresses: [email protected] (A.D. Orcesi),
[email protected] (C.F. Cremona).
Reliability Engineering and System Safety 95 (2010) 1230–1243

Author's personal copy
locations. This enables to determine cost-effective maintenancestrategies that are crucial to the network performance. Liu andFrangopol [7,8] use a time-dependent bridge network reliabilityand bridge reliability importance factor to take into account theimportance of each bridge in the transportation network.Frangopol and Liu [9] use a stochastic dynamic program tooptimize bridge network maintenance. Orcesi and Cremona [10]propose a reliability-based network-level framework to optimizemaintenance strategies of a bridge network. In this model, anevent-tree maintenance decisions, based on a structural perfor-mance margin considered at inspections, enables to assess theexpected maintenance and failure costs (by using also a safetymargin). In addition, the probability to have equipment main-tenance (e.g., repair activities due to pavement distress, jointdegradation) is calculated. Finally, a combination of structural andequipment maintenance is proposed.
However, a bridge network manager may not have access togeometric and material data, and may have very few informationon each bridge except the results of visual inspections (e.g.,condition rating or overall score of the bridge). In this context,proposing a bridge management framework based on visualinspection is of paramount importance for stakeholders.
The use of stochastic Markov chains for predicting theperformance of a bridge network is investigated herein. It isreminded that a Markov chain is a special case of the Markovprocess whose development can be treated as a series oftransitions between certain states. Morcous et al. [11] defineenvironmental categories associated with different bridge ele-ments adopted by existing Markov-chain models. Morcous andLounis [12] minimize the life-cycle cost of an infrastructurenetwork while fulfilling reliability and functionality requirementsover a given planning horizon. Orcesi and Cremona [13] propose aMarkov-chain framework applied to a reinforced concrete bridgestock. Their objective is to appraise the overall condition of thereinforced concrete bridge stock to assess the funding required ata national level. However, all the bridges of this bridge stock areconsidered in the same way, without taking into considerationdifferences in environmental factors, traffic or size. Also, Smilowitzand Madanat [14], Kuhn and Madanat [15], and Madanat et al.[16] propose bridge management frameworks very efficient inhandling large number of facilities. However, there is a problem ofheterogeneity among the facilities which is not addressed in thesemodels. It is noted that Robelin and Madanat [17] quantify theheterogeneity at the facility level and propose an optimizationmaintenance framework based on a history-dependent Markovchain model of bridge deck deterioration.
In this paper, the objectives are to:
(i) propose a network-level approach where the lifetime-basedindicator is available for each bridge of the network (typicallya visual inspection result). Users’ costs are assessed by anadvanced traffic assignment technique reaching an equili-brium, named Wardrop equilibrium [18], where the trafficvolume is distributed among the different routes within thetransportation network (see [10] for further details). Thistraffic assignment method is very efficient to model complexnetworks where the search of the best route is influenced bycongestion and leads to a traffic distribution on the overallnetwork.
(ii) Optimize maintenance strategies of the bridge network byusing a Markov chain model to quantify the performance ofeach bridge and also the uncertainties in the future decisionsat inspection times. To include these uncertainties in thedecisions made after each inspection, an event tree is built,based on each bridge condition that is quantified through a
Markov chain model. This event-tree enables to consider allpossible outcomes in the future inspections and calculateexpected maintenance and failure costs for users and thebridge owner. It is noted that a failure event is defined hereinas the need to perform an unexpected rehabilitation of thebridge. Optimal solutions are determined using a geneticalgorithm.
(iii) Compare optimal maintenance strategies, obtained whenconsidering interests of users and bridge owner eitherseparately as conflicting criteria, or simultaneously as acommon interest for the whole community.
The proposed probability-based methodology is applied to aFrench bridge network (see Fig. 1) that plays a strategic role in theoverall traffic distribution of the East Paris road network and isdirectly concerned by possible traffic disruption with quicktremendous consequences. This bridge network is managed bythe quality picture of structures—image qualite des ouvrages d’art(IQOA) scoring system [19]. There are five scores in this scoringsystem which are 1 for a good overall condition, 2 and 2E for non-urgent and urgent maintenance needed, respectively, in case ofequipment failures or minor structural damage, 3 and 3U for non-urgent and urgent maintenance needed, respectively, in case ofserious structural distress.
2. A Markov model for bridge scoring evolution
As mentioned previously, the objective is to quantify theperformance of each facility in the bridge network through theuse of an adequate lifetime indicator. This indicator is determinedherein by the probability for a bridge to be scored in a certaincondition with time. The scoring probability can be perfectlyforecasted if the transition matrix and the initial probabilityvector are known. Indeed, if (i) the probability of a bridge b to bequoted in any score is known at year i (for example, after a visualinspection of the bridge) and stored in a vector qb(i) and (ii) theassociated homogeneous Markov chain, associated with a transi-tion matrix Pb, is determined, the probability at year i+1 is givenby the equation qb(i+1)¼qb(i)Pb. The description of this approachis described in the following, first by investigating if thehomogeneous Markovian assumption is justified in the case ofthe French bridge stock, and, second, by determining thetransition matrices for several types of bridges.
Fig. 1. Bridge network.
A.D. Orcesi, C.F. Cremona / Reliability Engineering and System Safety 95 (2010) 1230–1243 1231
Author's personal copy
2.1. Homogeneous Markovian assumption
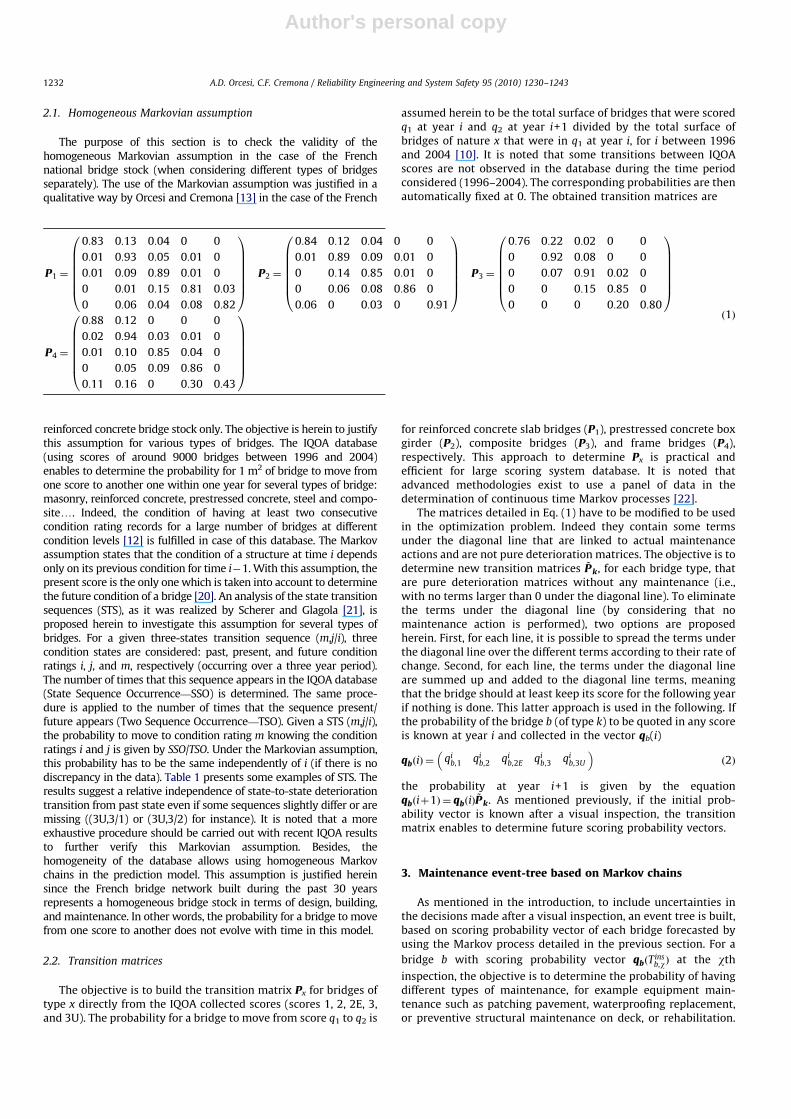
The purpose of this section is to check the validity of thehomogeneous Markovian assumption in the case of the Frenchnational bridge stock (when considering different types of bridgesseparately). The use of the Markovian assumption was justified in aqualitative way by Orcesi and Cremona [13] in the case of the French
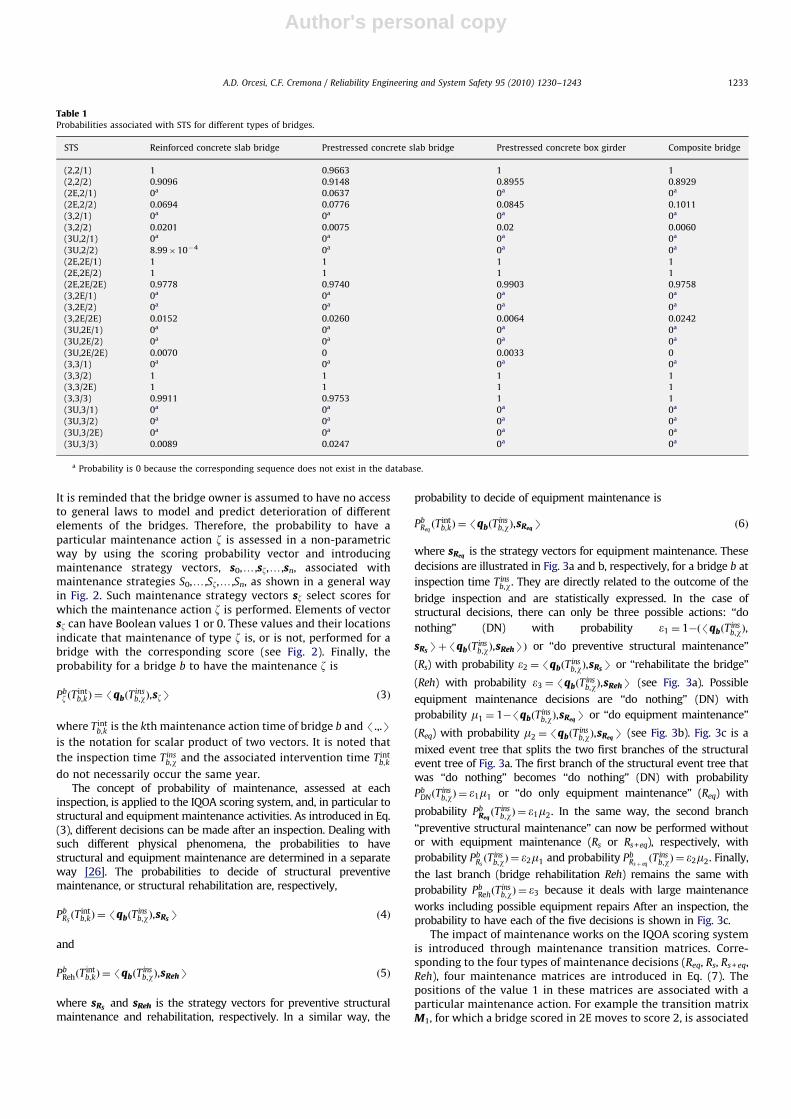
reinforced concrete bridge stock only. The objective is herein to justifythis assumption for various types of bridges. The IQOA database(using scores of around 9000 bridges between 1996 and 2004)enables to determine the probability for 1 m2 of bridge to move fromone score to another one within one year for several types of bridge:masonry, reinforced concrete, prestressed concrete, steel and compo-sitey. Indeed, the condition of having at least two consecutivecondition rating records for a large number of bridges at differentcondition levels [12] is fulfilled in case of this database. The Markovassumption states that the condition of a structure at time i dependsonly on its previous condition for time i�1. With this assumption, thepresent score is the only one which is taken into account to determinethe future condition of a bridge [20]. An analysis of the state transitionsequences (STS), as it was realized by Scherer and Glagola [21], isproposed herein to investigate this assumption for several types ofbridges. For a given three-states transition sequence (m,j/i), threecondition states are considered: past, present, and future conditionratings i, j, and m, respectively (occurring over a three year period).The number of times that this sequence appears in the IQOA database(State Sequence Occurrence—SSO) is determined. The same proce-dure is applied to the number of times that the sequence present/future appears (Two Sequence Occurrence—TSO). Given a STS (m,j/i),the probability to move to condition rating m knowing the conditionratings i and j is given by SSO/TSO. Under the Markovian assumption,this probability has to be the same independently of i (if there is nodiscrepancy in the data). Table 1 presents some examples of STS. Theresults suggest a relative independence of state-to-state deteriorationtransition from past state even if some sequences slightly differ or aremissing ((3U,3/1) or (3U,3/2) for instance). It is noted that a moreexhaustive procedure should be carried out with recent IQOA resultsto further verify this Markovian assumption. Besides, thehomogeneity of the database allows using homogeneous Markovchains in the prediction model. This assumption is justified hereinsince the French bridge network built during the past 30 yearsrepresents a homogeneous bridge stock in terms of design, building,and maintenance. In other words, the probability for a bridge to movefrom one score to another does not evolve with time in this model.
2.2. Transition matrices
The objective is to build the transition matrix Px for bridges oftype x directly from the IQOA collected scores (scores 1, 2, 2E, 3,and 3U). The probability for a bridge to move from score q1 to q2 is
assumed herein to be the total surface of bridges that were scoredq1 at year i and q2 at year i+1 divided by the total surface ofbridges of nature x that were in q1 at year i, for i between 1996and 2004 [10]. It is noted that some transitions between IQOAscores are not observed in the database during the time periodconsidered (1996–2004). The corresponding probabilities are thenautomatically fixed at 0. The obtained transition matrices are
for reinforced concrete slab bridges (P1), prestressed concrete boxgirder (P2), composite bridges (P3), and frame bridges (P4),respectively. This approach to determine Px is practical andefficient for large scoring system database. It is noted thatadvanced methodologies exist to use a panel of data in thedetermination of continuous time Markov processes [22].
The matrices detailed in Eq. (1) have to be modified to be usedin the optimization problem. Indeed they contain some termsunder the diagonal line that are linked to actual maintenanceactions and are not pure deterioration matrices. The objective is todetermine new transition matrices ~Pk, for each bridge type, thatare pure deterioration matrices without any maintenance (i.e.,with no terms larger than 0 under the diagonal line). To eliminatethe terms under the diagonal line (by considering that nomaintenance action is performed), two options are proposedherein. First, for each line, it is possible to spread the terms underthe diagonal line over the different terms according to their rate ofchange. Second, for each line, the terms under the diagonal lineare summed up and added to the diagonal line terms, meaningthat the bridge should at least keep its score for the following yearif nothing is done. This latter approach is used in the following. Ifthe probability of the bridge b (of type k) to be quoted in any scoreis known at year i and collected in the vector qb(i)
qbðiÞ ¼ qib,1 qi
b,2 qib,2E qi
b,3 qib,3U
� �ð2Þ
the probability at year i+1 is given by the equationqbðiþ1Þ ¼ qbðiÞ
~Pk. As mentioned previously, if the initial prob-ability vector is known after a visual inspection, the transitionmatrix enables to determine future scoring probability vectors.
3. Maintenance event-tree based on Markov chains
As mentioned in the introduction, to include uncertainties inthe decisions made after a visual inspection, an event tree is built,based on scoring probability vector of each bridge forecasted byusing the Markov process detailed in the previous section. For a
bridge b with scoring probability vector qbðTinsb,wÞ at the wth
inspection, the objective is to determine the probability of havingdifferent types of maintenance, for example equipment main-tenance such as patching pavement, waterproofing replacement,or preventive structural maintenance on deck, or rehabilitation.
P1 ¼
0:83 0:13 0:04 0 0
0:01 0:93 0:05 0:01 0
0:01 0:09 0:89 0:01 0
0 0:01 0:15 0:81 0:03
0 0:06 0:04 0:08 0:82
0BBBBBB@
1CCCCCCA
P2 ¼
0:84 0:12 0:04 0 0
0:01 0:89 0:09 0:01 0
0 0:14 0:85 0:01 0
0 0:06 0:08 0:86 0
0:06 0 0:03 0 0:91
0BBBBBB@
1CCCCCCA
P3 ¼
0:76 0:22 0:02 0 0
0 0:92 0:08 0 0
0 0:07 0:91 0:02 0
0 0 0:15 0:85 0
0 0 0 0:20 0:80
0BBBBBB@
1CCCCCCA
P4 ¼
0:88 0:12 0 0 0
0:02 0:94 0:03 0:01 0
0:01 0:10 0:85 0:04 0
0 0:05 0:09 0:86 0
0:11 0:16 0 0:30 0:43
0BBBBBB@
1CCCCCCA
ð1Þ
A.D. Orcesi, C.F. Cremona / Reliability Engineering and System Safety 95 (2010) 1230–12431232
Author's personal copy
It is reminded that the bridge owner is assumed to have no accessto general laws to model and predict deterioration of differentelements of the bridges. Therefore, the probability to have a
particular maintenance action z is assessed in a non-parametricway by using the scoring probability vector and introducingmaintenance strategy vectors, s0,y,sz,y,sn, associated withmaintenance strategies S0,y,Sz,y,Sn, as shown in a general wayin Fig. 2. Such maintenance strategy vectors sz select scores for
which the maintenance action z is performed. Elements of vectorsz can have Boolean values 1 or 0. These values and their locations
indicate that maintenance of type z is, or is not, performed for abridge with the corresponding score (see Fig. 2). Finally, the
probability for a bridge b to have the maintenance z is
Pbz ðT
intb,kÞ ¼/qbðT
insb,wÞ,szS ð3Þ
where T intb,k is the kth maintenance action time of bridge b and /.,.S
is the notation for scalar product of two vectors. It is noted that
the inspection time Tinsb,w and the associated intervention time T int
b,k
do not necessarily occur the same year.The concept of probability of maintenance, assessed at each
inspection, is applied to the IQOA scoring system, and, in particular tostructural and equipment maintenance activities. As introduced in Eq.(3), different decisions can be made after an inspection. Dealing withsuch different physical phenomena, the probabilities to havestructural and equipment maintenance are determined in a separateway [26]. The probabilities to decide of structural preventivemaintenance, or structural rehabilitation are, respectively,
PbRSðT int
b,kÞ ¼/qbðTinsb,wÞ,sRS
S ð4Þ
and
PbRehðT
intb,kÞ ¼/qbðT
insb,wÞ,sRehS ð5Þ
where sRSand sReh is the strategy vectors for preventive structural
maintenance and rehabilitation, respectively. In a similar way, the
probability to decide of equipment maintenance is
PbReqðT int
b,kÞ ¼/qbðTinsb,wÞ,sReqS ð6Þ
where sReq is the strategy vectors for equipment maintenance. These
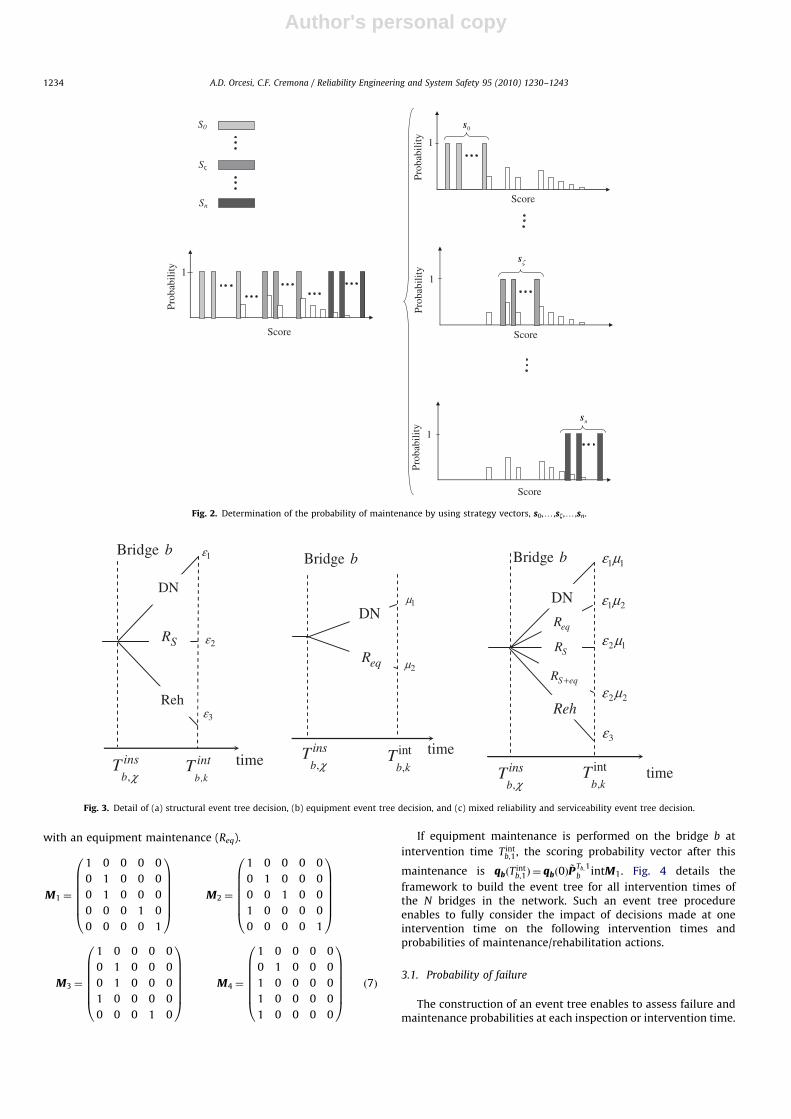
decisions are illustrated in Fig. 3a and b, respectively, for a bridge b at
inspection time Tinsb,w. They are directly related to the outcome of the
bridge inspection and are statistically expressed. In the case ofstructural decisions, there can only be three possible actions: ‘‘do
nothing’’ (DN) with probability e1 ¼ 1�ð/qbðTinsb,wÞ,
sRSSþ/qbðT
insb,wÞ,sRehSÞ or ‘‘do preventive structural maintenance’’
(Rs) with probability e2 ¼/qbðTinsb,wÞ,sRS
S or ‘‘rehabilitate the bridge’’
(Reh) with probability e3 ¼/qbðTinsb,wÞ,sRehS (see Fig. 3a). Possible
equipment maintenance decisions are ‘‘do nothing’’ (DN) with
probability m1 ¼ 1�/qbðTinsb,wÞ,sReqS or ‘‘do equipment maintenance’’
(Req) with probability m2 ¼/qbðTinsb,wÞ,sReqS (see Fig. 3b). Fig. 3c is a
mixed event tree that splits the two first branches of the structuralevent tree of Fig. 3a. The first branch of the structural event tree thatwas ‘‘do nothing’’ becomes ‘‘do nothing’’ (DN) with probability
PbDNðT
insb,wÞ ¼ e1m1 or ‘‘do only equipment maintenance’’ (Req) with
probability PbReqðTins
b,wÞ ¼ e1m2. In the same way, the second branch
‘‘preventive structural maintenance’’ can now be performed withoutor with equipment maintenance (Rs or Rs+eq), respectively, with
probability PbRsðTins
b,wÞ ¼ e2m1 and probability PbRsþ eqðTins
b,wÞ ¼ e2m2. Finally,
the last branch (bridge rehabilitation Reh) remains the same with
probability PbRehðT
insb,wÞ ¼ e3 because it deals with large maintenance
works including possible equipment repairs After an inspection, theprobability to have each of the five decisions is shown in Fig. 3c.
The impact of maintenance works on the IQOA scoring systemis introduced through maintenance transition matrices. Corre-sponding to the four types of maintenance decisions (Req, Rs, Rs+ eq,Reh), four maintenance matrices are introduced in Eq. (7). Thepositions of the value 1 in these matrices are associated with aparticular maintenance action. For example the transition matrixM1, for which a bridge scored in 2E moves to score 2, is associated
Table 1Probabilities associated with STS for different types of bridges.
STS Reinforced concrete slab bridge Prestressed concrete slab bridge Prestressed concrete box girder Composite bridge
(2,2/1) 1 0.9663 1 1
(2,2/2) 0.9096 0.9148 0.8955 0.8929
(2E,2/1) 0a 0.0637 0a 0a
(2E,2/2) 0.0694 0.0776 0.0845 0.1011
(3,2/1) 0a 0a 0a 0a
(3,2/2) 0.0201 0.0075 0.02 0.0060
(3U,2/1) 0a 0a 0a 0a
(3U,2/2) 8.99�10�4 0a 0a 0a
(2E,2E/1) 1 1 1 1
(2E,2E/2) 1 1 1 1
(2E,2E/2E) 0.9778 0.9740 0.9903 0.9758
(3,2E/1) 0a 0a 0a 0a
(3,2E/2) 0a 0a 0a 0a
(3,2E/2E) 0.0152 0.0260 0.0064 0.0242
(3U,2E/1) 0a 0a 0a 0a
(3U,2E/2) 0a 0a 0a 0a
(3U,2E/2E) 0.0070 0 0.0033 0
(3,3/1) 0a 0a 0a 0a
(3,3/2) 1 1 1 1
(3,3/2E) 1 1 1 1
(3,3/3) 0.9911 0.9753 1 1
(3U,3/1) 0a 0a 0a 0a
(3U,3/2) 0a 0a 0a 0a
(3U,3/2E) 0a 0a 0a 0a
(3U,3/3) 0.0089 0.0247 0a 0a
a Probability is 0 because the corresponding sequence does not exist in the database.
A.D. Orcesi, C.F. Cremona / Reliability Engineering and System Safety 95 (2010) 1230–1243 1233
Author's personal copy
with an equipment maintenance (Req).
M1 ¼
1 0 0 0 0
0 1 0 0 0
0 1 0 0 0
0 0 0 1 0
0 0 0 0 1
0BBBBBB@
1CCCCCCA
M2 ¼
1 0 0 0 0
0 1 0 0 0
0 0 1 0 0
1 0 0 0 0
0 0 0 0 1
0BBBBBB@
1CCCCCCA
M3 ¼
1 0 0 0 0
0 1 0 0 0
0 1 0 0 0
1 0 0 0 0
0 0 0 1 0
0BBBBBB@
1CCCCCCA
M4 ¼
1 0 0 0 0
0 1 0 0 0
1 0 0 0 0
1 0 0 0 0
1 0 0 0 0
0BBBBBB@
1CCCCCCA
ð7Þ
If equipment maintenance is performed on the bridge b at
intervention time T intb,1, the scoring probability vector after this
maintenance is qbðTintb,1Þ ¼ qbð0Þ
~PTb, 1b intM1. Fig. 4 details the
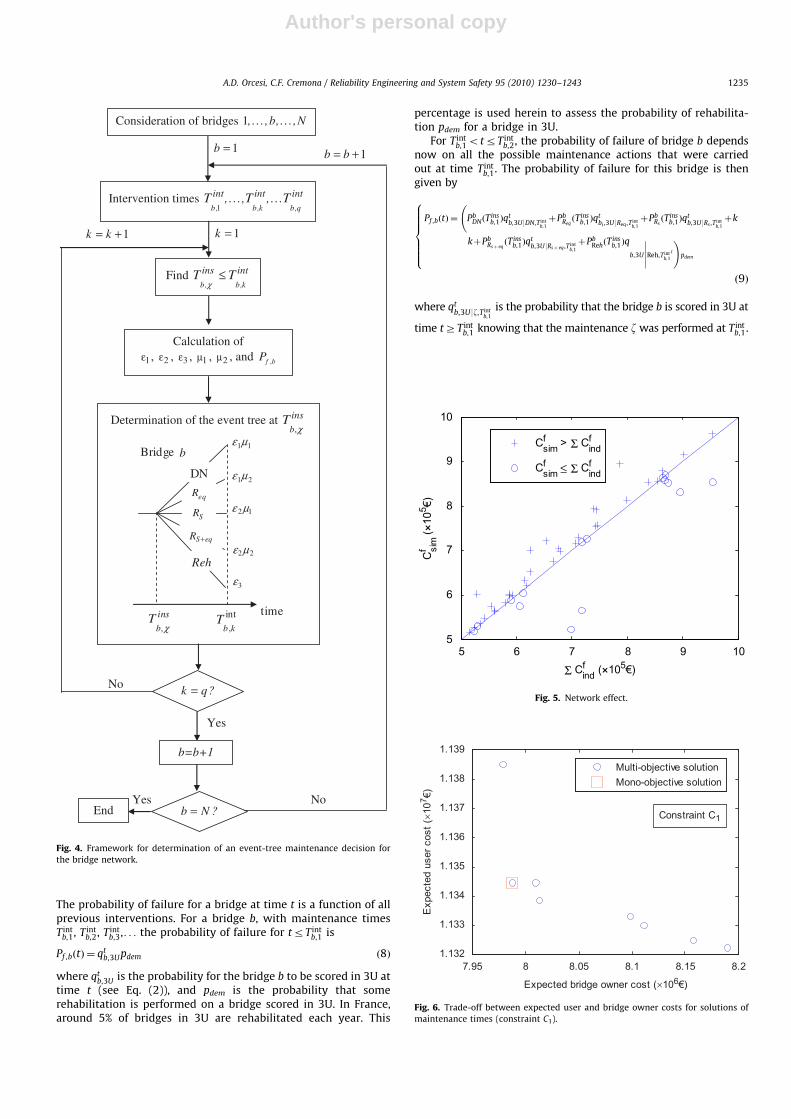
framework to build the event tree for all intervention times ofthe N bridges in the network. Such an event tree procedureenables to fully consider the impact of decisions made at oneintervention time on the following intervention times andprobabilities of maintenance/rehabilitation actions.
3.1. Probability of failure
The construction of an event tree enables to assess failure andmaintenance probabilities at each inspection or intervention time.
S0
S
Sn
Score
Pro
babi
lity
1
Prob
abil
ity
1
Prob
abili
ty
1
Prob
abili
ty
1
Score
Score
Score
s
ζs
s
Fig. 2. Determination of the probability of maintenance by using strategy vectors, s0,y,sf,y,sn.
,b
insTχ
time
Bridge b
b,k
intT
1ε
2ε
3ε
DN
SR
Reh
time
Bridge b
,b
insTχ ,
intb k
T
2μ
1μ
eqR
DNeqR
time
Bridge b
,b
insTχ ,
intb k
T
SR
S eqR +
DN
Reh
1 1ε μ
1 2ε μ
2 1ε μ
2 2ε μ
3ε
Fig. 3. Detail of (a) structural event tree decision, (b) equipment event tree decision, and (c) mixed reliability and serviceability event tree decision.
A.D. Orcesi, C.F. Cremona / Reliability Engineering and System Safety 95 (2010) 1230–12431234
Author's personal copy
The probability of failure for a bridge at time t is a function of allprevious interventions. For a bridge b, with maintenance timesT int
b,1, T intb,2, T int
b,3,. . . the probability of failure for trT intb,1 is
Pf ,bðtÞ ¼ qtb,3Updem ð8Þ
where qtb,3U is the probability for the bridge b to be scored in 3U at
time t (see Eq. (2)), and pdem is the probability that somerehabilitation is performed on a bridge scored in 3U. In France,around 5% of bridges in 3U are rehabilitated each year. This
percentage is used herein to assess the probability of rehabilita-tion pdem for a bridge in 3U.
For T intb,1otrT int
b,2, the probability of failure of bridge b dependsnow on all the possible maintenance actions that were carriedout at time T int
b,1. The probability of failure for this bridge is thengiven by
Pf ,bðtÞ ¼
Pb
DNðTinsb,1Þq
tb,3U9DN,T int
b,1
þPbReqðTins
b,1Þqtbi ,3U9Req ,T int
b,1
þPbRsðTins
b,1Þqtb,3U9Rs ,T int
b,1
þk
kþPbRsþ eqðTins
b,1Þqtb,3U9Rsþ eq,T int
b,1
þPbRehðT
insb,1Þq
b,3U Reh,T intb,1
t
�����!
pdem
8>>>>>><>>>>>>:
ð9Þ
where qtb,3U9z,T int
b,1
is the probability that the bridge b is scored in 3U at
time tZT intb,1 knowing that the maintenance z was performed at T int
b,1.
Determination of the event tree at ,b
insTχ
Intervention times 1b, b,k b,q
int int int, . . . , , . . .T T T
Find b, b,k
ins intT T≤χ
Calculation of
1ε , 2ε , 3ε , 1μ , 2μ , and ,f bP
No k q?=
Yes
1k k= + 1k =
eqR
time
Bridge b
,b
insTχ ,
intb k
T
SR
S eqR +
DN
Reh
1 1ε μ
1 2ε μ
2 1ε μ
2 2ε μ
3ε
b=b+1
b N ?=Yes
End
1b =
Consideration of bridges 1, . . . ,b, . . . ,N
1b b= +
No
Fig. 4. Framework for determination of an event-tree maintenance decision for
the bridge network.
5 6 7 8 9 105
6
7
8
9
10
Σ Cfind (×105€)
Cf si
m ( ×
105 €)
Cfsim > Σ Cf
ind
Cfsim ≤ Σ Cf
ind
Fig. 5. Network effect.
7.95 8 8.05 8.1 8.15 8.21.132
1.133
1.134
1.135
1.136
1.137
1.138
1.139
Expected bridge owner cost (×106€)
Exp
ecte
d us
er c
ost (×1
07 €)
Multi-objective solutionMono-objective solution
Constraint C1
Fig. 6. Trade-off between expected user and bridge owner costs for solutions of
maintenance times (constraint C1).
A.D. Orcesi, C.F. Cremona / Reliability Engineering and System Safety 95 (2010) 1230–1243 1235
Author's personal copy
4. Users and bridge owner costs
The road users are always assumed to take the less expensiveway. As vehicle speed is limited by traffic volume, the larger thenumber of vehicles on a link is, the more the speed will be
reduced. The speed, and consequently the travel time, dependsboth on the traffic congestion according to the Highway CapacityManual [23]. The search of the best route combined with trafficcongestion leads to an equilibrium, named Wardrop equilibrium,where the traffic volume is distributed among the different routes
5 10 15 20 250
0.2
0.4
0.6
0.8
1
Time (Years)
1-I 3
RS+eq
StMau1
0.55
5 10 15 20 250
0.2
0.4
0.6
0.8
1
Time (Years)1-
I 3
Req
StMau2
0.55
5 10 15 20 250
0.2
0.4
0.6
0.8
1
Time (Years)
1-I 3
Req
StMau3
0.55
5 10 15 20 250
0.2
0.4
0.6
0.8
1
Time (Years)
1-I 3
Req
StMau4
0.55
5 10 15 20 250
0.2
0.4
0.6
0.8
1
Time (Years)
1-I 3
RS
0.55
PtMarne1
5 10 15 20 250
0.2
0.4
0.6
0.8
1
Time (Years)
1-I 3
RS+eq
PtMarne2
0.55
5 10 15 20 250
0.2
0.4
0.6
0.8
1
Time (Years)
1-I 3
RS+eq
PtNogent1
0.55
5 10 15 20 250
0.2
0.4
0.6
0.8
1
Time (Years)
1-I 3
RS+eq
PtNogent2
0.55
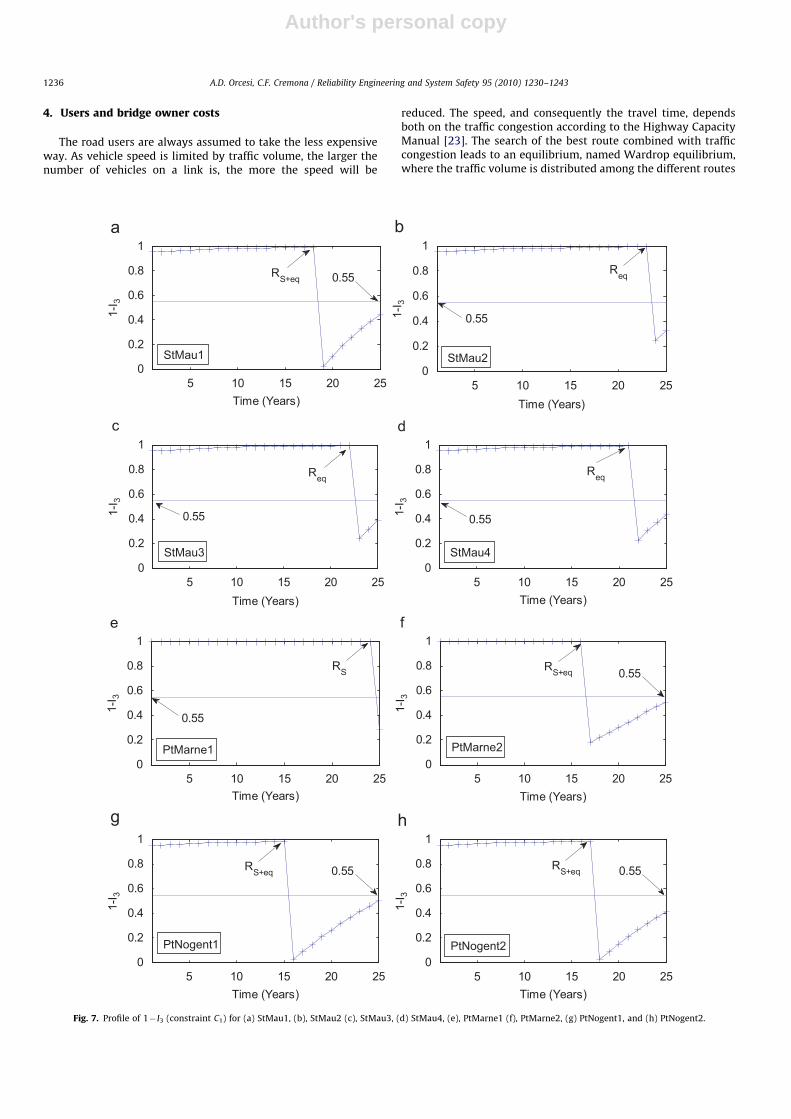
Fig. 7. Profile of 1� I3 (constraint C1) for (a) StMau1, (b), StMau2 (c), StMau3, (d) StMau4, (e), PtMarne1 (f), PtMarne2, (g) PtNogent1, and (h) PtNogent2.
A.D. Orcesi, C.F. Cremona / Reliability Engineering and System Safety 95 (2010) 1230–12431236
Author's personal copy
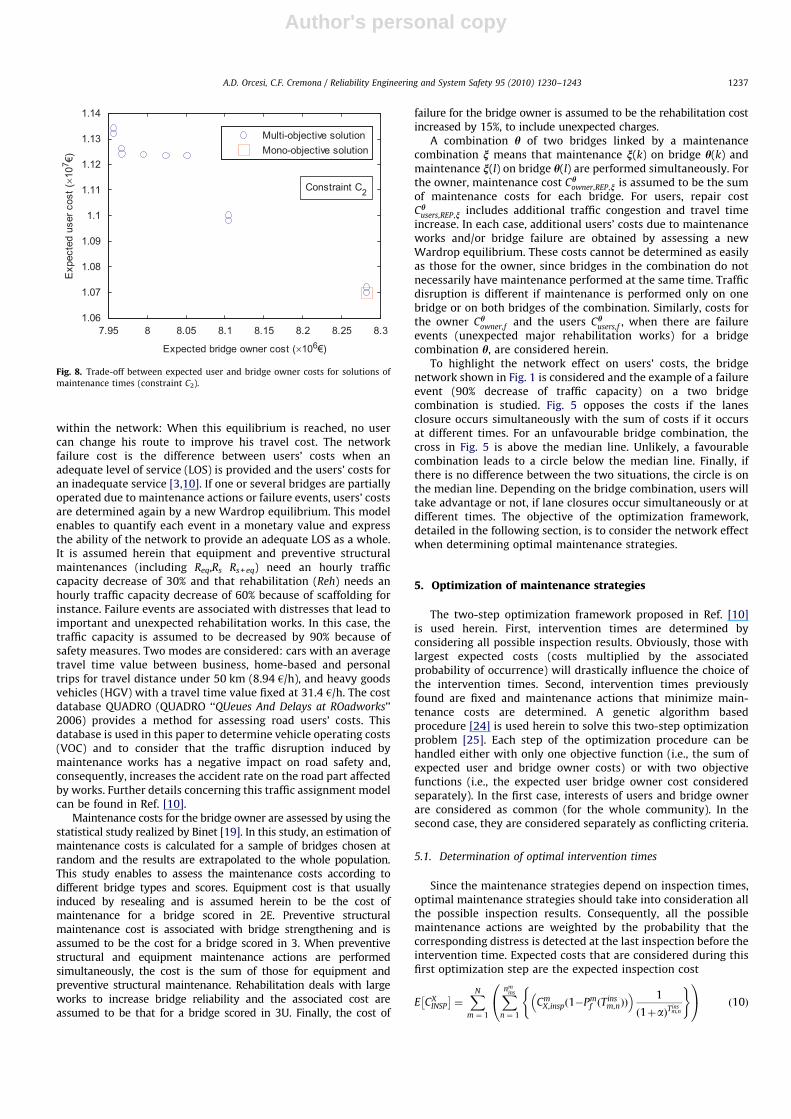
within the network: When this equilibrium is reached, no usercan change his route to improve his travel cost. The networkfailure cost is the difference between users’ costs when anadequate level of service (LOS) is provided and the users’ costs foran inadequate service [3,10]. If one or several bridges are partiallyoperated due to maintenance actions or failure events, users’ costsare determined again by a new Wardrop equilibrium. This modelenables to quantify each event in a monetary value and expressthe ability of the network to provide an adequate LOS as a whole.It is assumed herein that equipment and preventive structuralmaintenances (including Req,Rs Rs+ eq) need an hourly trafficcapacity decrease of 30% and that rehabilitation (Reh) needs anhourly traffic capacity decrease of 60% because of scaffolding forinstance. Failure events are associated with distresses that lead toimportant and unexpected rehabilitation works. In this case, thetraffic capacity is assumed to be decreased by 90% because ofsafety measures. Two modes are considered: cars with an averagetravel time value between business, home-based and personaltrips for travel distance under 50 km (8.94 h/h), and heavy goodsvehicles (HGV) with a travel time value fixed at 31.4 h/h. The costdatabase QUADRO (QUADRO ‘‘QUeues And Delays at ROadworks’’2006) provides a method for assessing road users’ costs. Thisdatabase is used in this paper to determine vehicle operating costs(VOC) and to consider that the traffic disruption induced bymaintenance works has a negative impact on road safety and,consequently, increases the accident rate on the road part affectedby works. Further details concerning this traffic assignment modelcan be found in Ref. [10].
Maintenance costs for the bridge owner are assessed by using thestatistical study realized by Binet [19]. In this study, an estimation ofmaintenance costs is calculated for a sample of bridges chosen atrandom and the results are extrapolated to the whole population.This study enables to assess the maintenance costs according todifferent bridge types and scores. Equipment cost is that usuallyinduced by resealing and is assumed herein to be the cost ofmaintenance for a bridge scored in 2E. Preventive structuralmaintenance cost is associated with bridge strengthening and isassumed to be the cost for a bridge scored in 3. When preventivestructural and equipment maintenance actions are performedsimultaneously, the cost is the sum of those for equipment andpreventive structural maintenance. Rehabilitation deals with largeworks to increase bridge reliability and the associated cost areassumed to be that for a bridge scored in 3U. Finally, the cost of
failure for the bridge owner is assumed to be the rehabilitation costincreased by 15%, to include unexpected charges.
A combination h of two bridges linked by a maintenancecombination n means that maintenance n(k) on bridge h(k) andmaintenance n(l) on bridge h(l) are performed simultaneously. Forthe owner, maintenance cost Ch
owner,REP,n is assumed to be the sumof maintenance costs for each bridge. For users, repair costCh
users,REP,n includes additional traffic congestion and travel timeincrease. In each case, additional users’ costs due to maintenanceworks and/or bridge failure are obtained by assessing a newWardrop equilibrium. These costs cannot be determined as easilyas those for the owner, since bridges in the combination do notnecessarily have maintenance performed at the same time. Trafficdisruption is different if maintenance is performed only on onebridge or on both bridges of the combination. Similarly, costs forthe owner Ch
owner,f and the users Chusers,f , when there are failure
events (unexpected major rehabilitation works) for a bridgecombination h, are considered herein.
To highlight the network effect on users’ costs, the bridgenetwork shown in Fig. 1 is considered and the example of a failureevent (90% decrease of traffic capacity) on a two bridgecombination is studied. Fig. 5 opposes the costs if the lanesclosure occurs simultaneously with the sum of costs if it occursat different times. For an unfavourable bridge combination, thecross in Fig. 5 is above the median line. Unlikely, a favourablecombination leads to a circle below the median line. Finally, ifthere is no difference between the two situations, the circle is onthe median line. Depending on the bridge combination, users willtake advantage or not, if lane closures occur simultaneously or atdifferent times. The objective of the optimization framework,detailed in the following section, is to consider the network effectwhen determining optimal maintenance strategies.
5. Optimization of maintenance strategies
The two-step optimization framework proposed in Ref. [10]is used herein. First, intervention times are determined byconsidering all possible inspection results. Obviously, those withlargest expected costs (costs multiplied by the associatedprobability of occurrence) will drastically influence the choice ofthe intervention times. Second, intervention times previouslyfound are fixed and maintenance actions that minimize main-tenance costs are determined. A genetic algorithm basedprocedure [24] is used herein to solve this two-step optimizationproblem [25]. Each step of the optimization procedure can behandled either with only one objective function (i.e., the sum ofexpected user and bridge owner costs) or with two objectivefunctions (i.e., the expected user bridge owner cost consideredseparately). In the first case, interests of users and bridge ownerare considered as common (for the whole community). In thesecond case, they are considered separately as conflicting criteria.
5.1. Determination of optimal intervention times
Since the maintenance strategies depend on inspection times,optimal maintenance strategies should take into consideration allthe possible inspection results. Consequently, all the possiblemaintenance actions are weighted by the probability that thecorresponding distress is detected at the last inspection before theintervention time. Expected costs that are considered during thisfirst optimization step are the expected inspection cost
E CXINSP
� �¼XN
m ¼ 1
Xnmins
n ¼ 1
CmX,inspð1�Pm
f ðTinsm,nÞÞ
� � 1
ð1þaÞTinsm,n
( )0@
1A ð10Þ
7.95 8 8.05 8.1 8.15 8.2 8.25 8.31.06
1.07
1.08
1.09
1.1
1.11
1.12
1.13
1.14
Expected bridge owner cost (×106€)
Exp
ecte
d us
er c
ost (×1
07 €)
Multi-objective solutionMono-objective solution
Constraint C2
Fig. 8. Trade-off between expected user and bridge owner costs for solutions of
maintenance times (constraint C2).
A.D. Orcesi, C.F. Cremona / Reliability Engineering and System Safety 95 (2010) 1230–1243 1237
Author's personal copy
the expected cost of failure
E CXf
h i¼XN
m ¼ 1
Xnmint
l ¼ 1
XOo ¼ 1
XhAY
ChX,f
Phf ðT
intm,lÞ
ð1þaÞT intm,n
)!(0@ ð11Þ
and the expected maintenance cost
E CXREP
� �¼XN
m ¼ 1
Xnmint
l ¼ 1
XOo ¼ 1
XhAYðmÞ
XnAXðhÞ
ChX,n
PhnðT
intm,lÞ
ð1þaÞTintm,l
)!8<:
0@ ð12Þ
5 10 15 20 250
0.02
0.04
0.06
0.08
0.1
0.12
Time (Years)
I 6
StMau10.10
5 10 15 20 250
0.02
0.04
0.06
0.08
0.1
0.12
Time (Years)
I 6
StMau20.10
5 10 15 20 250
0.02
0.04
0.06
0.08
0.1
0.12
Time (Years)
I 6
0.10StMau3
5 10 15 20 250
0.02
0.04
0.06
0.08
0.1
0.12
Time (Years)
I 6
StMau40.10
5 10 15 20 250
0.05
0.1
0.15
0.2
0.25
Time (Years)
I 6 0.10 Reh
PtMarne1
5 10 15 20 250
0.05
0.1
0.15
0.2
0.25
Time (Years)
I 6
0.10
PtMarne2 Reh
5 10 15 20 250
0.02
0.04
0.06
0.08
0.1
0.12
Time (Years)
I 6
PtNogent1 0.10
5 10 15 20 250
0.02
0.04
0.06
0.08
0.1
0.12
Time (Years)
I 6
PtNogent2 0.10
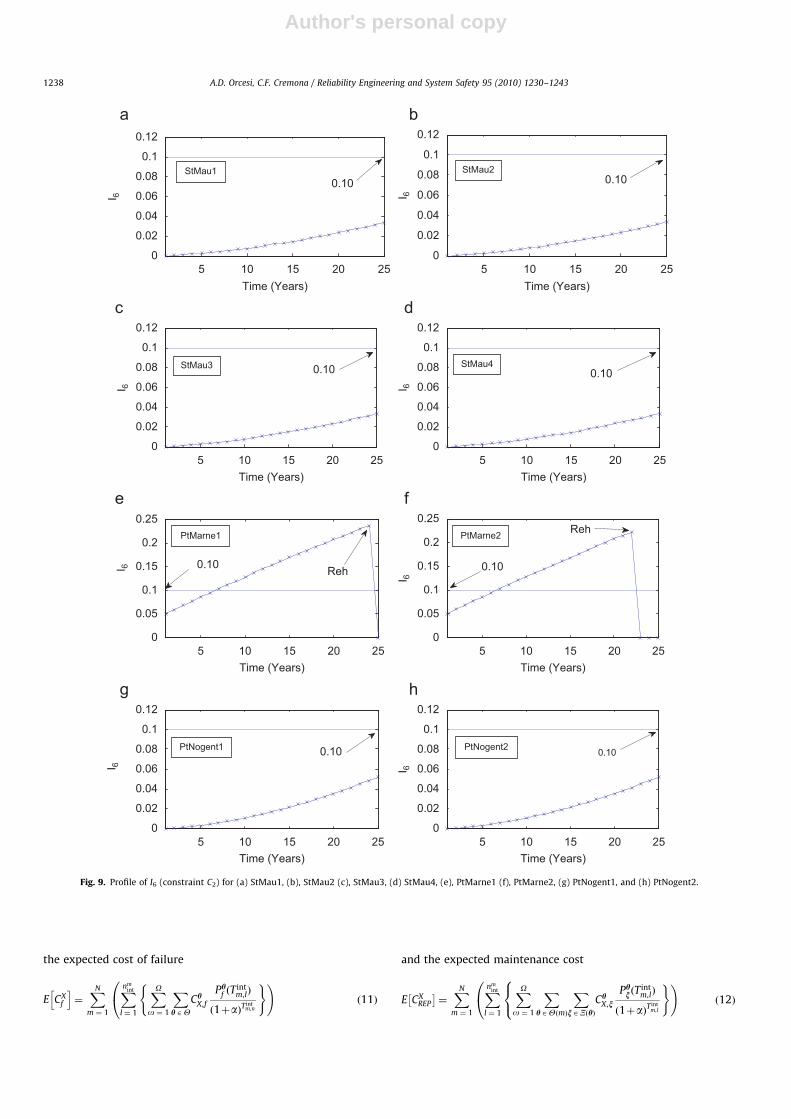
Fig. 9. Profile of I6 (constraint C2) for (a) StMau1, (b), StMau2 (c), StMau3, (d) StMau4, (e), PtMarne1 (f), PtMarne2, (g) PtNogent1, and (h) PtNogent2.
A.D. Orcesi, C.F. Cremona / Reliability Engineering and System Safety 95 (2010) 1230–12431238
Author's personal copy
where X is either the bridge owner or the users, N is the number ofbridges, nm
ins is the number of inspection times for bridge m,
Pmf Tins
m,n
� �is the probability of failure of bridge m at the nth
inspection, o is the size of the bridge combination, Y is the set of
combination bridge, Y(m) is the set of bridge combination thatincludes bridge m, N(h) is the set of all events combination for
each set h of bridges (these events can be maintenance or failure
events), nmint is the number of intervention times for bridge mAh,
Phn T int
m,l
� �is the probability of maintenance n for the bridge
combination h, at the lth intervention time for bridge mAh,
Phf T int
m,l
� �is the probability of failure of the bridge combination h,
at the lth intervention of bridge mAy, CmX,ins is the inspection cost
(for X) of bridge m, ChX,n is the cost (for X) of maintenance
combination n on bridge combination h, ChX,f is the cost of failure
(for X) of bridge combination h, and finally a is the yearly discountrate of money fixed at 4% herein.
The optimization problem for maintenance times is defined as
Find T int1,1,. . .,T int
1,n1int
,. . .,T intN,1,. . .,T int
N,nNint
ð13Þ
to minimizeX
users,owner
E½CXINSP �þE½CX
f �þE½CXREP� ð14Þ
for a mono-objective procedure and
to minimizeE½Cusers
INSP �þE½CusersREP �þE½Cusers
f �
E½CownerINSP �þE½Cowner
REP �þE½Cownerf �
(ð15Þ
for a multi-objective procedure, such that
CImðtÞoCIm0 ðtÞ, 8m¼ 1. . .N ð16Þ
where CIm(t) is the condition index of bridge m at time t and CIm0 ðtÞ
is the minimal condition index of bridge m at time t. In thefollowing, condition index is associated with IQOA annual qualityindicators 1� I3(t) and I6(t), where I3ðtÞ ¼ qt
b,1þqtb,2 and I6ðtÞ ¼ qt
b,3U
(see Eq. (2)). These indicators enable to assess the probability ofperforming preventive and urgent structural maintenance toprevent disruption and ensure safety, respectively. The samplingperiod is one year and maintenance times can get integer valuesbetween 1 and 25 years (end of the intervention horizon). Aninitial population of 51 solutions is considered in the geneticalgorithm, and crossover/mutation operations are used with
respective probabilities fixed at 85% and 10%. In case of a mono-objective procedure (Eq. (14)), optimal solution is that with thelowest expected intervention cost for the bridge owner and usersas a whole. In case of a multi-objective procedure, Paretosolutions are obtained by considering the two conflictingobjective functions in Eq. (15). Since the maintenance planningis a constraint optimization problem, the penalty method is usedto ensure that solutions satisfy the constraints. The maximumnumber of iteration is fixed at 3000 iterations. It is noted that (i)larger population sizes were also considered in the optimizationprocess, and (ii) the optimization process was performed severaltimes, to check that the optimization results remain the same andavoid local optimum.
5.2. Determination of optimal maintenance actions
Once the optimal intervention times are obtained and fixed,optimal maintenance actions can be determined. The expectedcosts for X (X being either the owner or the users), considered inthis second optimization step, are the expected cost of failure
E CX
f
h i¼XN
m ¼ 1
Xnmint
l ¼ 1
XOo ¼ 1
XhAYðoÞ
ChX,f Ph
f ðTintm,lÞ
1
ð1þaÞT intm,n
!0@ ð17Þ
and the expected maintenance cost
E CX
REP
h i¼XN
m ¼ 1
Xnmint
l ¼ 1
CmX,rm,lð1�Pf ,mðT
intm,lÞÞ
1
ð1þaÞTintm,l
0@
1A ð18Þ
where rm,l is the lth possible maintenance action for bridge m (seeEqs. (10), (11) and (12) for other notations). The maintenanceactions optimization problem is formulated as
find r1,1,. . .,r1,n1int
,. . .,rN,1,. . .,rN,nNint
ð19Þ
to minimizeX
users,owner
E½CX
REP�þE½CX
f � ð20Þ
in case of a mono-objective procedure and
to minimizeE½C
users
REP �þE½Cusers
f �
E½Cowner
REP �þE½Cowner
f �
8<: ð21Þ
in case of a multi-objective procedure such that
CImðtÞoCIm0 ðtÞ, 8m¼ 1. . .N ð22Þ
The genetic algorithm procedure, previously introduced todetermine intervention times, is used herein in a similar way todetermine optimal maintenance actions.
5.3. Case study: optimization of maintenance strategies for a bridge
network
The optimization problem, detailed in the previous section, isused to determine optimal maintenance strategies for the eightbridges shown in Fig. 1. The bridges are prestressed concretestructures (denoted PtMarne1, PtMarne2, StMau1, StMau2, StMau3,and StMau4, respectively) located on the common trunk section ofthe A4 and A86 motorways (part of the network with the highestcongestion level) and composite bridges (denoted PtNogent1 andPtNogent2, respectively). An initial scoring probability vector isintroduced for each bridge to consider the uncertainty in the IQOAscoring process. Hence, the initial probability of being in one of thefive IQOA scores is q0,1 ¼ 0 0:05 0:95 0:05 0
� �for bridges
StMau1, StMau2, StMau3 and StMau4 and the bridges PtNogent1and PtNogent2. This means that all these bridges are currently
1.73 1.735 1.74 1.745 1.75 1.755 1.761.06
1.07
1.08
1.09
1.1
1.11
1.12
1.13
Expected bridge owner cost (×107€)
Exp
ecte
d us
er c
ost (×1
07 €)
Multi-objective solutionMono-objective solution
Constraint C3
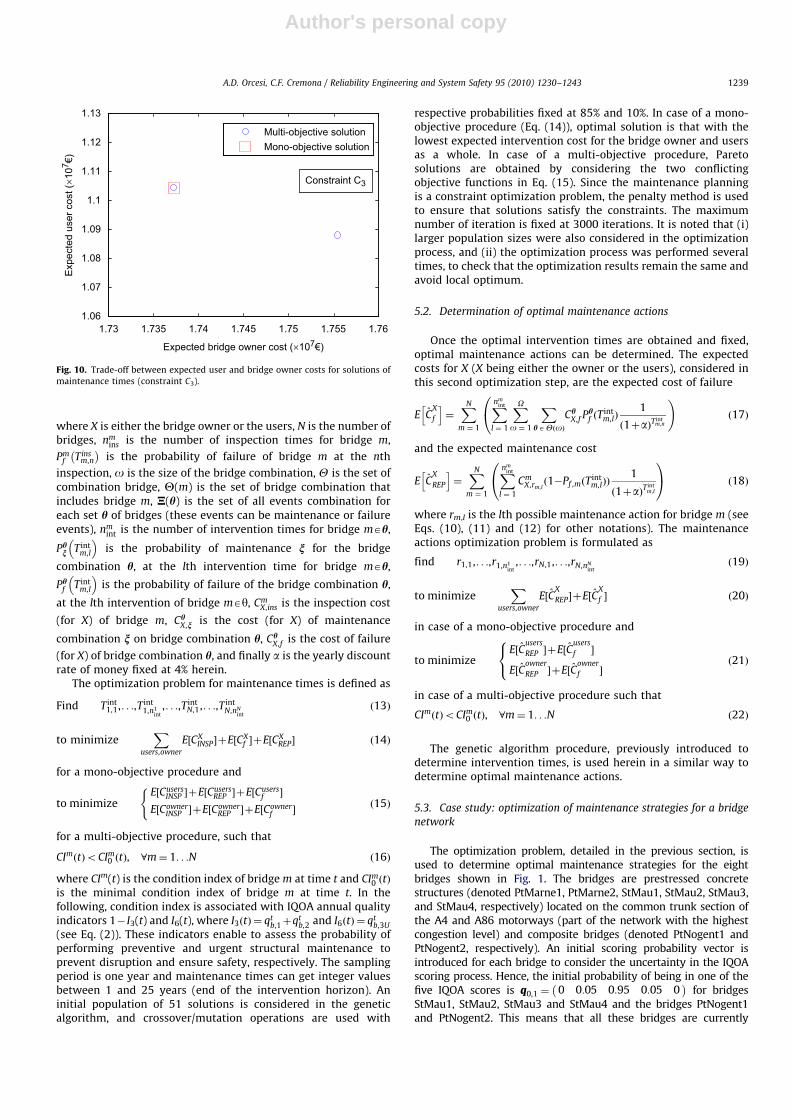
Fig. 10. Trade-off between expected user and bridge owner costs for solutions of
maintenance times (constraint C3).
A.D. Orcesi, C.F. Cremona / Reliability Engineering and System Safety 95 (2010) 1230–1243 1239
Author's personal copy
scored in 2E with a degree of uncertainty assessed at 10% (theremight be a probability of 5% to be scored either in 2 or in 3). Besides,the vector q0,2 ¼ 0 0 0:05 0:90 0 :05
� �is the initial probability
distribution for bridges PtMarne1 and PtMarne2 (with a probabilityof 5% to be scored either in 2E or in 3U). Concerning themaintenance strategy assumed to be fixed by the owner at each
inspection, the following strategy vectors, sReq ¼ 0 0 1 1 0� �
,sRS¼ 0 0 1 0 0� �
, and sReh ¼ 0 0 0 1 1� �
, are used.They define IQOA scores that will lead, respectively, to an equipmentmaintenance, a preventive structural maintenance or rehabilitationafter an inspection. For example, positions of 1 and 0 in sReq indicatethat a bridge scored 2E or 3 will receive an equipment maintenance.
5 10 15 20 250
0.2
0.4
0.6
0.8
1
Time (Years)
1-I 3
0.55
RS+eq
Req
StMau1
5 10 15 20 250
0.2
0.4
0.6
0.8
1
Time (Years)
1-I 3
StMau2
ReqRS+eq
0.55
5 10 15 20 250
0.2
0.4
0.6
0.8
1
Time (Years)
1-I 3
StMau3
Req0.55
5 10 15 20 250
0.2
0.4
0.6
0.8
1
Time (Years)
1-I 3
StMau4
0.55 Req
Req
5 10 15 20 250
0.2
0.4
0.6
0.8
1
Time (Years)
1-I 3
PtMarne1
Reh0.55
5 10 15 20 250
0.2
0.4
0.6
0.8
1
Time (Years)
1-I 3
PtMarne2
0.55Reh
Req
5 10 15 20 250.2
0.4
0.6
0.8
1
Time (Years)
1-I 3
PtNogent1
Req0.55
Req
5 10 15 20 250
0.2
0.4
0.6
0.8
1
Time (Years)
1-I 3
PtNogent2
0.55 Req
RS+eq
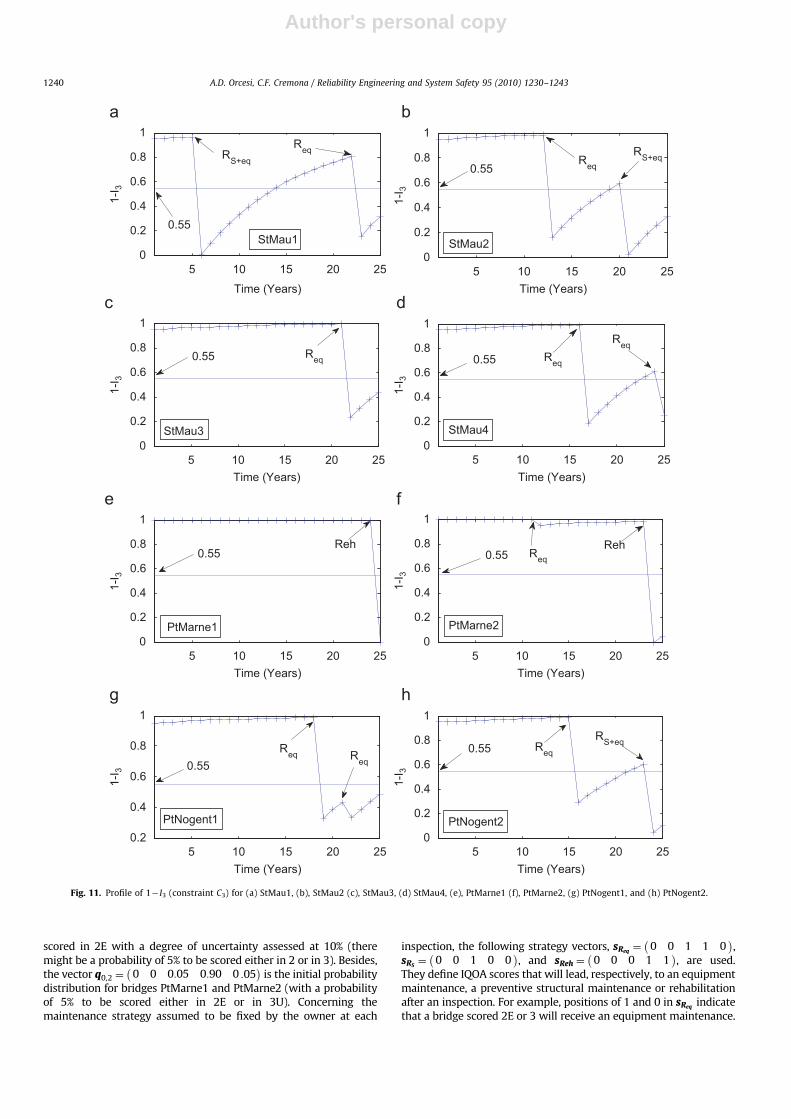
Fig. 11. Profile of 1� I3 (constraint C3) for (a) StMau1, (b), StMau2 (c), StMau3, (d) StMau4, (e), PtMarne1 (f), PtMarne2, (g) PtNogent1, and (h) PtNogent2.
A.D. Orcesi, C.F. Cremona / Reliability Engineering and System Safety 95 (2010) 1230–12431240
Author's personal copy
It is noted that 1 1 1 1 1� �
�ðsRSþsRehÞ is the strategy vector
for doing no structural maintenance (Fig. 3a). Similarly,1 1 1 1 1� �
�ðsReq Þ is the strategy vector for doing noequipment maintenance (Fig. 3b). The optimal maintenance plan-ning is determined for the three constraint cases
constraint C1: 1�I3ðTf Þo55% ð23Þ
constraint C2: I6ðTf Þo10% ð24Þ
and
constraint C3: 1�I3ðTf Þo55% and I6ðTf Þo10% ð25Þ
where Tf is the end of the planning calendar. For constraint C1, thetrade-off between the expected user and bridge owner costs for
5 10 15 20 250
0.02
0.04
0.06
0.08
0.1
0.12
Time (Years)
I 6
RS+eq
StMau1
Req
0.10
5 10 15 20 250
0.02
0.04
0.06
0.08
0.1
0.12
Time (Years)
I 6
0.10
RS+eqReq
StMau2
5 10 15 20 250
0.02
0.04
0.06
0.08
0.1
0.12
Time (Years)
I 6
Req
StMau3 0.10
5 10 15 20 250
0.02
0.04
0.06
0.08
0.1
0.12
Time (Years)
I 6
0.10StMau4
ReqReq
5 10 15 20 250
0.05
0.1
0.15
0.2
0.25
Time (Years)
I 6
0.10 Reh
PtMarne1
5 10 15 20 250
0.05
0.1
0.15
0.2
0.25
Time (Years)
I 6
PtMarne2
0.10
RehReq
5 10 15 20 250
0.02
0.04
0.06
0.08
0.1
0.12
Time (Years)
I 6
0.10PtNogent1
Req
Req
5 10 15 20 250
0.02
0.04
0.06
0.08
0.1
0.12
Time (Years)
I 6
PtNogent2 RS+eq
Req
0.10
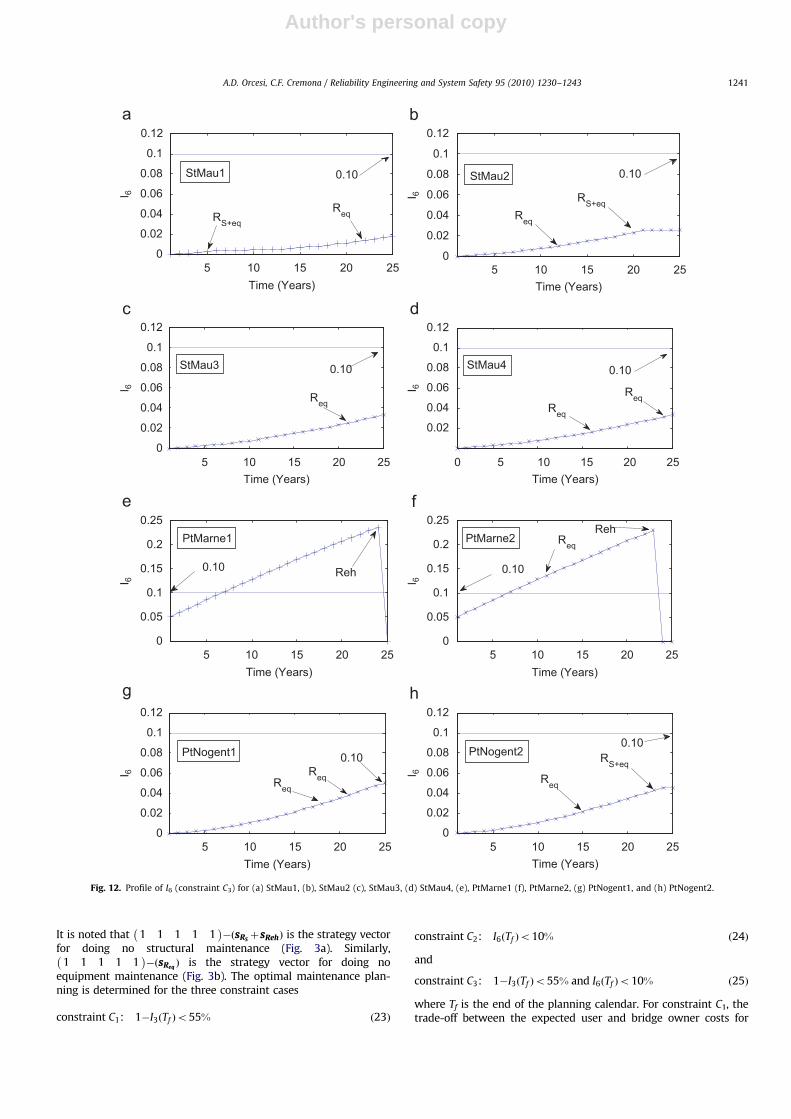
Fig. 12. Profile of I6 (constraint C3) for (a) StMau1, (b), StMau2 (c), StMau3, (d) StMau4, (e), PtMarne1 (f), PtMarne2, (g) PtNogent1, and (h) PtNogent2.
A.D. Orcesi, C.F. Cremona / Reliability Engineering and System Safety 95 (2010) 1230–1243 1241

Author's personal copy
solutions of maintenance times (first step in the optimizationprocess) is shown in Fig. 6 (after 3000 iterations). The optimalmono-objective solution is also identified in Fig. 6. It is noted thatthe mono-objective solution provides a good compromise betweenreducing the expected user cost and not increasing the expectedbridge owner cost in a significant way. The second optimization stepenables to determine optimal maintenance actions at timespreviously determined. This second step is performed herein forintervention times obtained with the mono-objective solution. Inthis second step, only one solution is obtained either with the monoor the multi-objective optimization procedure. This shows that theinterests of users and the bridge owner are not conflicting criteria (inthis example) in the second optimization step. The profiles ofindicator 1� I3 are illustrated in Fig. 7(a–h) for the eight bridges,respectively, and it is shown that the constraint C1 is satisfied at Tf.
The same procedure is performed for constraint C2. The trade-off between the expected user and bridge owner costs forsolutions of maintenance times (first step in the optimizationprocess) is illustrated in Fig. 8 (after 3000 iterations). The optimalmono-objective solution, identified in Fig. 8, is a solution of themulti-objective process with the highest cost for the bridgeowner. Therefore, the effort of the bridge owner has to be more
important than that of the users to reach the optimal solution forthe whole community, when considering constraint C2. Finally,the profiles of indicator I6 are shown in Fig. 9(a–h) for the eightbridges, respectively, to check that the constraint C2 is satisfied.
For constraint C3, there is no solution if there is only oneintervention time for each bridge. Indeed, two intervention timesfor each bridge are needed to satisfy the constraint C3 in Eq. (25).The trade-off between the expected user and bridge owner costsfor solutions of maintenance times (first step in the optimizationprocess) is illustrated in Fig. 10 (after 3000 iterations) and thereare only two solutions for the multi-objective optimization. Thiscan be justified since few solutions satisfy constraint C3 (withthresholds on 1� I3(Tf) and I6(Tf), simultaneously). The profiles ofindicators 1� I3 and I6, shown in Figs. 11(a–h) and 12(a–h),respectively, for the eight bridges, satisfy constraint C3.
It is noted that the mono-objective solution is always oneparticular solution of the Pareto front in each of the threesimulations (see Figs. 6, 8, 10) but not always located in the samearea of the Pareto front. The optimal solution for the community(the mono-objective solution) is then not necessarily the mostinteresting for users or for the bridge owner.
The cumulative expected costs, for the mono-objective solu-tions when considering constraints C1, C2, and C3, respectively, areshown in Fig. 13a for the bridge owner and in Fig. 13b for users. Itis obvious that constraint C2 leads to the lowest expectedcumulative costs for both users and the bridge owner, and thatconstraint C3 leads to the highest expected cumulative costs forboth users and the bridge owner.
In Eqs. (23)–(25), thresholds are applied only at the end of themaintenance planning Tf. Two additional constraints are consid-ered to take into account the change of constraints with time t
constraint C4: I6ðtÞo0:30�0:008t ð26Þ
and
constraint C5: I6ðtÞo0:15�0:002t ð27Þ
The three Pareto fronts for solutions of maintenance times,obtained when considering constraints C2, C4, and C5, are providedin Fig. 14. It is shown that the constraint C5 leads to the most‘‘expensive’’ optimal solutions (both for the bridge owner and theusers). Conversely, optimal solutions are less expensive whenconsidering constraint C2. Also, the mono-objective solution for
0 5 10 15 20 250
5
10
15
Time (years)
Cum
ulat
ive
expe
cted
brid
ge o
wne
r cos
t (×1
06€)
Constraint C1
Constraint C2Constraint C3
=4%
0 5 10 15 20 250
5
10
15
Time (years)
Cum
ulat
ive
expe
cted
use
r cos
t (×1
06€) Constraint C1
Constraint C2Constraint C3
=4%
α
α
Fig. 13. Cumulative expected costs, when considering the mono-objective
solutions for constraints C1, C2, and C3, respectively, for (a) the bridge owner,
and (b) users.
7.8 8.2 8.6 9 9.4 9.8 101.05
1.1
1.15
1.2
1.25
1.3
1.35
Expected bridge owner cost (×106€)
Exp
ecte
d us
er c
ost (×1
07 €)
Constraint C2
Constraint C4Constraint C5
Mono-objectivesolution for C5
for C4
for C2
Fig. 14. Trade-off between expected user and bridge owner costs for solutions of
maintenance times when considering constraints C2, C4, and C5.
A.D. Orcesi, C.F. Cremona / Reliability Engineering and System Safety 95 (2010) 1230–12431242
Author's personal copy
intervention times is identified in Fig. 14 for each case ofconstraint. Obviously, constraint C4 is more restrictive than C2,and C5 is more restrictive than C4. Since the mono-objectivesolution shifts on the left of the Pareto front when consideringsuccessively C2, C4, and C5, it is shown that the optimal solutionfor the whole community requires larger efforts from the usersand, consequently, less from the bridge manager. Finally, bycomparing mono and multi-objective optimization frameworks, itis possible to provide the bridge manager with several optimalsolutions, depending on his/her financial resources, and toindicate which solution is optimal for the whole community.
6. Conclusions
The objective of the methodology proposed in this paper is tohelp the bridge owner in scheduling its bridge maintenancestrategies at the scale of the transportation network. The originalityof this approach is to determine performance indicators through theuse of Markov chains which, in turn, enables to determine an eventtree decision at each inspection time. This allows quantifying theperformance of a bridge network even if the only informationavailable is the result of visual inspections. The homogeneousMarkovian assumption to model the ageing of the bridge score isproposed and discussed for various types of bridges. The homo-geneity of the database allows using homogeneous Markov chainsin the prediction model. Then, the transition matrices for severaltypes of bridges are estimated. This prediction model is combinedwith an advanced traffic assignment that considers congestionphenomenon and enables to quantify the LOS of the bridge networkin an accurate way. Finally it is possible to determine optimalmaintenance strategies at the scale of the transportation networkwhen considering interests of the users and the bridge ownerseparately and/or simultaneously.
Future improvements require taking into account uncertain-ties of the transition matrix elements in a more accurate way. Amore exhaustive procedure should be carried out to further justifythe use of the Markovian assumption for each type of bridge. It isnoted that new inspection results should be included in thedatabase each year to be sure that the transition matrix alwaysincludes the best information for each bridge. Also, the sametransition matrix is used before and after a maintenance action inthis paper. The consideration of two different degradationprocesses (i.e., two different transition matrices), before and aftera maintenance action in the optimization process, would increasethe accuracy of the cost analysis. Finally, different geographicalareas should be considered when determining transition matrices,to include the effect of the environment in the prediction model.
Acknowledgments
The writers are thankful to Mr. Michael Thoriel and Mr. GuyPoirier, certified Engineers, from the French Roads Directorate fortheir help in providing the bridge inspection and inventorydatabase. The opinions and conclusions are those of the writersand do not necessarily reflect the views of the French RoadDirectorate.
References
[1] PIARC. Towards performance management of bridges (and other structures)(C11), PIARC report, 11.14.B, 2004. ISBN:2-84060-162-1.
[2] Adey B, Hajdin R, Bruhwiler E. Risk-based approach to the determination ofoptimal interventions for bridges affected by multiple hazards. EngineeringStructures 2003;25:903–12.
[3] Adey B, Hajdin R, Bruhwiler E. Supply and demand system approach todevelopment of bridge management strategies. Journal of InfrastructureSystems 2003;9(3):117–31.
[4] Adey B, Hajdin R, Bruhwiler E. Effect of common cause failures on indirectcosts. Journal of Bridge Engineering, ASCE 2004;9(2):200–8.
[5] Liu M, Frangopol DM. Balancing connectivity reliability of deterioratingbridge networks and long-term maintenance cost through optimization.Journal of Bridge Engineering, ASCE 2005;10(4):468–81.
[6] Liu M, Frangopol DM. Optimizing bridge network maintenance managementunder uncertainty with conflicting criteria: life-cycle maintenance, failure,and user costs. Journal of Structural Engineering, ASCE 2006;132(11):1835–45.
[7] Liu M, Frangopol DM. Time-dependent bridge network reliability: novelapproach. Journal of Structural Engineering, ASCE 2005;131(2):329–37.
[8] Liu M, Frangopol DM. Probability-based bridge network performanceevaluation. Journal of Bridge Engineering, ASCE 2006;11(5):633–41.
[9] Frangopol DM, Liu M. Bridge network maintenance optimization usingstochastic dynamic programming. Journal of Structural Engineering, ASCE2007;133(12):1772–82.
[10] Orcesi, A, Cremona, C. Optimal maintenance strategies for bridge networkusing the supply and demand approach, Structure and InfrastructureEngineering, Taylor & Francis, in press, DOI:10.1080/15732470902978566.
[11] Morcous G, Lounis Z, Mirza MS. Identification of environmental categories forMarkovian deterioration models of bridge decks. Journal of Bridge Engineer-ing, ASCE 2003;8(6):353–61.
[12] Morcous G, Lounis Z. Maintenance optimization of infrastructure networksusing genetic algorithms. Automation in Construction 2003;14:129–42.
[13] Orcesi A, Cremona C. Optimization of management strategies applied to thenational reinforced concrete bridge stock in France. Structure and Infra-structure Engineering 2010;5(5):355–66.
[14] Smilowitz K, Madanat SM. Optimal inspection, maintenance and rehabilita-tion policies for networks of infrastructure facilities. Computer Aided Civiland Infrastructure Engineering 2000;15:1.
[15] Kuhn KD, Madanat SM. Model uncertainty and management of a system ofinfrastructure facilities. Transportation Research Part C 2005;13:391–404.
[16] Madanat SM, Park S, Kuhn KD. Adaptive optimization and systematic probingof infrastructure system maintenance policies under model uncertainty.Journal of Infrastructure Systems, ASCE 2006;12(3):192–8.
[17] Robelin C-A, Madanat SM. History-dependent bridge deck maintenance andreplacement optimization with Markov decision process. Journal of Infra-structure Systems, ASCE 2007;13(3):195–201.
[18] Wardrop, JG. Some theoretical aspects of road traffic research In: Proceedingsof the Institution of Civil Engineers, vol. II, no. 1, 1952, p. 325–78.
[19] Binet C. Condition and repair cost estimate of the French road bridge assets,recent advances in bridge engineering. In: Proceedings of the US-EuropeWorkshop on Bridge Engineering, Barcelona, 1996, p. 66–75.
[20] Bremaud P. Markov chains Gibbs fields Monte Carlo simulation and queues.Springer Verlag; 1999.
[21] Scherer WT, Glagola DM. Markovian models for bridge maintenancemanagement. Journal of Transportation Engineering 1994;120(1):37–51.January/February1994.
[22] Kalbfleisch JD, Lawless JF. The analysis of panel data under a markovassumption. Journal of the American Statistical Association 1985;80(392):863–71.
[23] Martin WA, Mc Guskin NA. Travel estimation techniques for urban planning,National Cooperative Research Program Report 365, Transportation ResearchBoard, National Research Council, Washington, D.C. 1998.
[24] Deb K, Pratap A, Agarwal S, Meyarivan T. A fast and elitist multiobjectivegenetic algorithm: NSGA-II. IEEE Transactions on Evolutionary Computation2002;6(2):182–97.
[25] Hans AE. Multicriteria optimization for highly accurate systems: multicriteriaoptimization in engineering and science. In: Stadler E, editor. Mathematicalconcepts and methods in science and engineering. New York: Plenum; 1988.p. 309–52.
[26] Orcesi, A, Cremona, C. Optimization of maintenance strategies for themanagement of the national bridge stock in France, Journal of BridgeEngineering, ASCE, in press, DOI:10.1061/(ASCE)BE.1943-5592.0000125.
A.D. Orcesi, C.F. Cremona / Reliability Engineering and System Safety 95 (2010) 1230–1243 1243