Evaluating Stakeholders Performance of ERP Systems in ...
359
Evaluating Stakeholders Performance of ERP Systems in Saudi Arabia Higher Education Submitted in fulfilment of the requirement for the degree of Doctor of Philosophy BY MONA ALTHONAYAN DEPARTMENT OF INFORMATION SYSTEMS AND COMPUTING BRUNEL UNIVERSITY MARCH 2013
-
Upload
khangminh22 -
Category
Documents
-
view
0 -
download
0
Transcript of Evaluating Stakeholders Performance of ERP Systems in ...

Evaluating Stakeholders Performance of ERP
Systems in Saudi Arabia Higher Education
Submitted in fulfilment of the requirement for the degree
of Doctor of Philosophy
BY
MONA ALTHONAYAN
DEPARTMENT OF INFORMATION SYSTEMS AND
COMPUTING
BRUNEL UNIVERSITY
MARCH 2013

I
Enterprise resource planning (ERP) systems are complex and comprehensive
software packages designed to integrate business processes and functions. Despite
the difficulties and risks of implementing such a system, the last decade has seen a
remarkable global diffusion of such systems. To cope with technical
developments, the Saudi Arabian government is starting to implement them in
both private and public organisations, including the higher education (HE). HE in
Saudi Arabia applies integrated solutions to replace existing systems, supporting
all its business functions and improving effectiveness and efficiency.
Evaluating the impact of ERP adoption on stakeholders’ performance is complex
and no single existing model was considered adequate. To overcome their various
weaknesses, this study integrates three models (Task Technology Fit, the
Information Systems Success Model and End User Computing Satisfaction) to
produce a new model which offers a comprehensive view of the most important
factors affecting stakeholders’ performance. This integration results in a
theoretical framework that is used as model for empirical investigations of the
impact of ERP systems on HE stakeholders. The aim of this research is to assess
the impact of ERP systems on Saudi academic institutions, focusing on
stakeholders’ post-implementation performance. Three case studies are examined,
using mixed methods of interviews and questionnaires to collect quantitative and
qualitative data. SPSS 20 and analytical techniques were undertaken to analyse
case studies data.
While the results varied according to the circumstances of each case, the overall
quantitative findings were that there were six significant factors in the system
quality dimension (timeliness, flexibility, ease of use, content, currency and
authorisation) and two (reliability and responsiveness) in the service quality
dimension. These results were consistent with those of the qualitative phase,
which identified a number of other factors having a significant impact on
stakeholder performance: resistance to change, continuous training and education,
appropriate systems customisation and top management support. In general, it was
found that ERP systems had a significant of positive and negative nature impact
on HE stakeholders’ performance and productivity in Saudi Arabia.
II
I Mona Althonayan declare that this research, its idea, analysis,
findings and conclusions that are included in this PhD dissertation are
entirely developed by me for the purpose of this program only and
have not been submitted for another qualification.

III
This thesis is dedicated, with deepest love and
everlasting respect, to my parents
Without your prayers, support and encouragement
I could not have reached this stage
من ابحلب مغروين وجبميل إلسجااي إدبوينن إ ىل رساهل شكر وحب وعرفا
إ ىل أ يب إلغايل... وإيم إحلنون...
إ ىل من إوصاين ريب بطاعهتام وإل حسان إلهيام
إنمت رس إلسعادة لقليب... حبكام يف قليب مكىلء الارض مبا يطاول عنان إلسامء.
وسعاديت يف إدلنيا والاخرةإ ىل سبب جنايح
أ هدي لمك رساليت هذه وإدعو ريب إن حيفظكام ويرزقكام إلفردوس الاعىل
مىن

IV
First of all, all thanks and gratitude go to Almighty ALLAH for guiding and
inspiring me during this research process.
The completion of this research would not have been possible without the help,
support and prayers of many individuals, to whom I owe a great deal of thanks.
I wish to express my deepest appreciation to my supervisor, Dr Anastasia
Papazafeiropoulou, who supported me throughout my PhD. The accomplishment
of this investigation was only possible with her valuable expertise, knowledge and
considerate guidance, without which I could not possibly have finished this work.
I would like to express my deep appreciation and gratitude to the managers of
Saudi Arabian universities, especially the KSU MADAR systems managers,
Professor Abduallah Al-Mudimigh and Mr Yahya Abdahem, who supported me
from the beginning and offered me help, advice and information when I needed it.
Also many thanks to KFUPM manager Mr Iftikar Nadeem, who helped me
through the data collection.
I am appreciative of academic members, administrative staff and colleagues at the
Brunel Information System School for all their support during my PhD
programme.
I would like to offer deep thanks to all my friends, for their understanding,
support, prayers and true and honest feelings.
I mainly want to express my acknowledgements to my entire family (my brothers
and sisters) for their unwavering love, prayers and support.
Last but not least, I can’t fully express the gratitude and appreciation that I owe
to my precious family, my husband Dr Abraham and my children, Yasmin, Juri,
Majed and Saif, for their invaluable and unconditional love, their endless
encouragement, psychological support and patient understanding during the
years of my research, which made me stronger.
Thank you all.
V
PAGE
Abstract………………………………………………….. I
Declaration ……………………………………………… II
Dedication ………………………………………............. III
Acknowledgment………………………………………... IV
Table of Contents ……………………………………….. VII
List of tables …………………………………………….. VIII
List of figures …………………………………………… IX
List of Abbreviations …………………………………… X
Publications ……………………………………………... XI
PAGE
1.1 Overview………………………………………………………………….. 2
1.2 ERP Systems in Higher Education……………………………………… 3
1.2.1 ERP Stakeholders…………………………………………………... 5
1.2.2 Evaluating the Performance of ERP Stakeholders……………… 7
1.3 Aims and Objectives……………………………………………………… 8
1.4 Research Questions………………………………………………………. 9
1.5 Research Problem………………………………………………………... 9
1.6. Research Methodology Outline………………………………………… 10
1.6.2 Field Research……………………………………………………….. 13
1.7 Novel Contribution………………………………………………………. 13
1.8 Structure of the Thesis…………………………………………………… 13

VI
PAGE
2.1 Overview………………………………………………………………......
17
2.2. Enterprise Resource Planning Systems…………………………………
18
2.2.1 The evolution of ERP systems………………………………………... 19
2.2.2 Reasons for adopting ERP systems…………………………….......... 20
2.3 Evaluation in IS………………………………………………………….. 23
2.4 Evaluation of ERP systems……………………………………………… 31
2.5 Performance measures…………………………………………………… 33
2.6 Stakeholders in IS/ERP systems………………………………………… 37
2.7 Stakeholders’ Evaluation………………………………………………… 42
2.8 ERP systems in higher education………………………………………... 46
2.9 ERP systems in Saudi Arabia……………………………………………. 54
2.10 Gap in ERPs performance evaluation, stakeholders’ Perspective… 54
2.11 Summary………………………………………………………………… 58
PAGE
3.1 Overview………………………………………………………………… 60
3.2. Evaluation of Stakeholders’ Performance…………………………… 61
3.2.1 Task-Technology Fit……………………………………………… 61
3.2.2 DeLong and McLean IS Success Model…………………………… 63
3.2.3 End-user Computing Satisfaction…………………………………. 69
3.3 Proposed Framework…………………………………………………… 71
3.4 Research Hypothesis……………………………………………………. 79
3.5 Summary………………………………………………………………… 86

VII
PAGE
4.1 Overview…………………………………………………………………… 89
4.2 Selection of an appropriate research approach…………………………. 89
4.3 Research paradigms in IS research………………………………………. 90
4.3.1 Beliefs about physical and social reality……………………………… 91
4.3.2 Beliefs about the relationship between knowledge and the empirical
world…………………………………………………………………………….. 91
4.4 The positivist philosophy in IS research………………………………….. 94
4.4.1 Beliefs about physical and social reality………………………………. 95
4.4.2 Beliefs about knowledge……………………………………………….. 95
4.4.3 Beliefs about the relationship between theory and practice…………. 95
4.4.4 Selecting the positivist research approach……………………………. 95
4.5 Quantitative and qualitative research compared………………………… 97
4.6 Quantitative research……………………………………………………… 98
4.7 The mixed-method approach……………………………………………… 100
4.7.1 Planning mixed-method procedures………………………………….. 102
4.7.2 Triangulation…………………………………………………………… 104
4.8 Data Collection method……………………………………………………………
106
4.8.1 Questionnaire…………………………………………………………... 106
4.8.1.1 Questionnaire design………………………………………………… 107
4.8.2 Interview………………………………………………………………... 108
4.8.3 Documentation………………………………………………………………… 109
4.8.4 Archives………………………………………………………………………… 110
4.8.5 Strengths and Weaknesses…………………………………………………… 110
4.9 Pilot Study………………………………………………………………………….. 111
4.9.1 Why a pilot study is important……………………………………….. 112
4.9.2 Content validity, construct validity and reliability………………….. 113
4.10 Data analysis………………………………………………………………. 113
4.11 Sample……………………………………………………………………... 113
4.11.1 Mixed-method sampling……………………………………………….. 114
4.12 Research strategy…………………………………………………………. 115
4.12.1 Case study methodology………………………………………………... 115

VIII
4.12.2 Types of case study……………………………………………………… 116
4.12.3 Multiple case studies……………………………………………………. 117
4.12.4 The reasons for choosing the cases…………………………………….. 119
4.12.5 Research strategy and design………………………………………….. 119
4.12.6 Research process………………………………………………………... 121
4.13 Summary…………………………………………………………………... 122
PAGE
5.1 Overview…………………………………………………………………… 125
5.2. Kingdom of Saudi Arabia……………………………………………… 125
5.3. Higher education in Saudi Arabia……………………………………… 127
5.3 Case study one…………………………………………………………… 128
5.3.1 King Saud University………………………………………………… 128
5.3.2 The MADAR system…………………………………………………. 129
5.3.3 Quantitative analysis………………………………………………… 130
5.3.3.1 Reverse coding of negatively worded items……………………… 130
5.3.3.2 Factor analysis……………………………………………………… 130
5.3.3.5.1 System quality…………………………………………………… 134
5.3.3.6.1 Service quality………………………………………………….. 137
5.4 Case study two ……………………………………………………………. 143
5.4.1 King Fahd University of Petroleum and Minerals………………….. 143
5.4.2 Oracle system…………………………………………………………... 143
5.4.3 Quantitative analysis………………………………………………….. 144
5.4.3.3 System quality………………………………………………………. 145
5.4.3.4 Service quality……………………………………………………… 148
5.5 Case study three…………………………………………………………… 152
5.5.1 King Faisal University………………………………………………… 152
5.5.2 Oracle system…………………………………………………………... 153
5.5.3 Quantitative analysis…………………………………………………... 154

IX
5.5.3.3 System quality ………………………………………………………. 154
5.5.3.4 Service quality ……………………………………………………… 159
5.6 Universities compared …………………………………………………….. 165
5.6.1 KSU, KFU and KFUPM………………………………………………. 166
5.6.2 KSU and KFU…………………………………………………………. 169
5.6.3 KSU and KFUPM……………………………………………………… 171
5.6.4 KFU and KFUPM……………………………………………………… 173
5.7 All universities ……………………………………………………………... 175
5.8 Summary……………………………………………………………………. 187
PAGE
6.1 Overview……………………………………………………………………. 190
6.2 Method…………………………………………………………………… 190
6.2.1 Sample………………………………………………………………… 191
6.2.2 Instrument design…………………………………………………… 191
6.2.3 Interview administration…………………………………………… 191
6.2.4 Data analysis………………………………………………………… 191
6.3 Case Study 1: King Saud University…………………………………… 191
6.3.1 Contextual factors…………………………………………………… 192
6.3.2 Improving stakeholders’ productivity and performance………… 196
6.3.2.1 Systems Quality……………………………………………………. 196
6.3.2.2 Service quality……………………………………………………… 199
6.4 Case Study 2: King Fahd University of Petroleum & Minerals……… 200
6.4.1 Contextual factors…………………………………………………… 201

X
6.4.2 Improving stakeholders’ productivity and performance………… 202
6.4.2.1 System Quality……………………………………………………….. 204
6.5 Case Study 3: King Faisal University………………………………… 207
6.5.1 Contextual factors………………………………………………… 207
6.5.3 Improving stakeholders’ productivity and performance………… 210
6.5.3.1 Systems Quality………………………………………………… 210
6.5.3.2 Service quality……………………………………………….…………… 212
6.6 Universities Compared………………………………………………….. 213
6.6.5 Improving stakeholders’ productivity and performance………… 215
6.6.5.1 Systems Quality………………………………………………… 215
6.6.5.2 Service quality…………………………………………………….. 215
6.7 Summary………………………………………………………………… 216
PAGE
7.1 Overview……………………………………………………………………. 219
7.2 Policies of the Saudi Higher Education Board…………………………… 220
7.2.1 Key definitions and policies……………………………………………. 220
7.2.2 Budget …………………………………………………………………... 221
7.3 Implementing ERP Systems in Saudi HE………………………………… 221
7.3.1 ERP implementation in Saudi HE…………………………………….. 222
7.3.2 SAP University Alliance………………………………………………... 223
7.3.3 Current situation of ERP evaluation in Saudi HE……………………. 224
7.4 Key Best Practice…………………………………………………………... 225
7.4.1 Understanding resistance to change…………………………………… 224
7.4.1.1 Employees’ characteristics………………………………………….. 225
7.4.1.2 Additional responsibility……………………………………………. 226
7.4.1.3 Loss of authority…………………………………………………….. 226

XI
7.4.1.4 Lack of preparation…………………………………………………. 226
7.4.2 Effective management support………………………………………... 227
PAGE
8.1 Overview………………………………………………………………… 247
8.2 Research Overview and Summary…………………………………… 247
8.2.1 Research aim and position………………………………………… 247
8.2.2 Literature review and theoretical framework…………………… 248
8.2.3 Research philosophy and methods………………………………… 249
8.2.4 Empirical work……………………………………………………… 249
8.2.4.1 Quantitative phase……………………………………………… 249
8.2.4.2 Qualitative phase………………………………………………… 249
8.3 Findings………………………………………………………………… 250
8.4 Contributions…………………………………………………………… 251
8.4.1 Contribution to methodology……………………………………… 251
8.4.2 Contribution to theory……………………………………………… 253
8.4.3 Contributions to policy and practice………………………………. 256
7.4.3 Appropriate customisation……………………………………………. 230
7.4.4 Intensive education/training schedule………………………………... 232
7.4.5 Better system quality………………………………………………… 236
7.4.5.1 Flexibility…………………………………………………………….. 237
7.4.5.2 Ease of use…………………………………………………………… 238
7.4.5.3 Timeliness……………………………………………………………. 239
7.4.5.4 Content………………………………………………………………. 240
7.4.5.5 Authorisation……………………………………………………… 241
7.4.5.6 Currency…………………………………………………………… 241
7.4.5.7 Section summary…………………………………………………… 242
7.4.6 Better service quality………………………………………………… 242
7.5 Summary…………………………………………………………………… 245
XII
8.5 Limitations of the research……………………………………………... 258
8.6 Recommendations for practice………………………………………… 259
8.7 Future Research………………………………………………………… 260
PAGE
Appendix: A. Ethical Approval……………………………………………. 288
Appendix: B1. Questionnaire………………………………………………. 290
Appendix: B2. Interview Form…………………………………………….. 296
Appendix: C. Literature Review…………………………………………… 299
Appendix: D. KSU………………………………………………………….. 313
Appendix: E. KFU…………………………………………………………... 323
Appendix: F. KFUof P&M………………………………………………… 327
Appendix: G. Statistics …………………………………………………….. 333

XIII
TABLE PAGE
Table 2.1: The evolution of ERP 19
Table 2.2: Examples of technical, social and financial aspects investigated in
studies of ERP systems in the literature 56
Table 2.3: Examples of pre-implementation, implementation and post-
implementation aspects used in studying ERP systems in the literature 57
Table 2.4: Aspects of ERP systems in higher education in general and KSA in
particular used in studies in the literature 58
Table 3.1: Service quality factors, D&M IS success model 67
Table 3.2: Factors from the D&M, TTF and EUCS models 72
Table 3.3: Factors selected from the three models 73
Table 3.4: Factors with the same meanings condensed into single factors 74
Table 3.5: The final factors chosen from the three models 76
Table 3.6: The literature review evaluation 77
Table 3.7: Performance impact dimension and factors Definitions 81
Table 3.8: Systems quality impact dimension and factors Definitions 82
Table 3.9: Service quality impact dimension and factors Definitions 84
Table 4.1: Basic beliefs of the three main research paradigms 92
Table 4.2: Assumptions and objectives of the three main research paradigms 92
Table 4.3: Advantages & disadvantages of quantitative & qualitative research 98
Table 4.4: Aspects to consider in planning a mixed-method design 103
Table 4.5: Strengths & weaknesses of data-gathering instruments used in this
study 111
Table 4.6: Characteristics of mixed-method sampling strategies 114
Table 4.7: Comparison between multiple and single case study 118
Table 4.8: Comparison of the case study with other forms of inquiry 118
Table 5.2: KSU Departments implementing MADAR System 129
Table 5.3: Factor analysis of the research items 131
Table 5.4: Reliability test on KSU data 133
Table 5.5: Regression models for improved stakeholder productivity and time
taken to complete task influenced by system quality at KSU 135
XIV
Table 5.6: Regression models for confidence and performance and computer
awareness influenced by system quality at KSU 136
Table 5.7: Regression models for ability to identify problems and solutions and
immediate recall of information influenced by system quality at KSU 137
Table 5.8: Regression models for improved stakeholder productivity and time
taken to complete task influenced by service quality at KSU 138
Table 5.9: Regression models for confidence and performance and computer
awareness influenced by service quality at KSU 139
Table 5.10: Regression models for ability to identify problems and solutions and
immediate recall of information influenced by service quality at KSU 140
Table 5.11: Reliability test for KFUPM 145
Table 5.12: Regression models for improved stakeholder productivity and time
taken to complete task influenced by system quality at KFU of P&M 146
Table 5.13: Regression models for confidence and performance and computer
awareness influenced by system quality at KFU of P&M 147
Table 5.14: Regression models for immediate recall of information and
identifying problems and solutions influenced by system quality at KFU of P&M 148
Table 5.15: Regression models for improved stakeholder productivity and time
taken to complete task influenced by service quality at KFU of P&M 149
Table 5.16: Regression models for confidence and performance and computer
awareness influenced by service quality at KFUPM 149
Table 5.17: Regression models for immediate recall of information and
identifying problems and solutions influenced by service quality at KFU of P&M 150
Table 5.18: Reliability test for KFU 154
Table 5.19: Regression models for improved stakeholder productivity and time
taken to complete task, influenced by system quality at KFU 156
Table 5.20: Regression models for confidence and performance and for
computer awareness influenced by system quality at KFU 158
Table 5.21: Regression models for immediate recall of information and
identifying problems and solutions influenced by system quality at KFU 159
Table 5.22: Regression models for improved stakeholder productivity and time
taken to complete task influenced by service quality at KFU 161
Table 5.23: Regression models for confidence and performance and computer
awareness influenced by service quality at KFU 161
Table 5.24: Regression models for immediate recall of information and
identifying problems and solutions influenced by service quality at KFU 162
Table 5.25: Descriptive statistics for each variable at KSU, KFUPM and KFU 167
Table 5.26: Kruskal-Wallis results for the three universities 169
Table 5.27: Mann-Whitney results (KSU and KFU) 171
Table 5.28: Mann-Whitney results (KSU and KFUPM) 172
Table 5.29: Mann-Whitney Results (KFU and KFUPM) 174
Table 5.30: Reliability test - all universities 176
Table 5.31: Regression models for improved stakeholder productivity and time
taken to complete task influenced by system quality at all universities 177
Table 5.32: Regression models for stakeholder confidence and performance and
for computer awareness influenced by system quality at all universities 178
Table 5.33: Regression models for immediate recall of information and ability to
identify problems and solutions influenced by system quality at all universities 179

XV
Table 5.34: Regression models for improved stakeholder productivity and time
taken to complete task influenced by service quality at all universities 181
Table 5.35: Regression models for stakeholder confidence and performance and
computer awareness influenced by service quality at all the universities 181
Table 5.36: Regression models for ability to identify problems and solutions and
immediate recall of information influenced by service quality at all universities 182
Table 5.37: Predicting overall stakeholder performance by ERP system quality 183
Table 5.38: Regression results for predicting overall stakeholder performance by
ERP system quality 184
Table 5.39: Predicting overall stakeholder performance by ERP service quality 185
Table 5.40: Regression results for predicting overall stakeholder performance by
ERP service quality 185
Table 6.1: the profile of the interviewees at KSU 192
Table 6.2: the profile of the interviewees KFU PM 201
Table 6.3: the profile of the interviewees at KFU 207
Table 8.1: Accomplishment of research objectives 250
Table 8.2: Theoretical contributions of this research 257

XVI
FIGURE PAGE
Figure 1.1: Structure of the Thesis 15
Figure 2.1: IS an evaluation type in the system’s lifecycle 25
Figure 2.2: The stakeholder concept. 37
Figure 2.3: Process in SAP for HEI and research. 51
Figure 3.1:The Model of Task-Technology Fit 61
Figure 3.2: TTF Model and User Evaluation 62
Figure 3.3: A structural model of TTF, ERP User Satisfaction, and Individual
Performance Impact 63
Figure 3.4: D&M IS success model 64
Figure 3.5: Updated D&M IS Success Model 66
Figure 3.6:Validated Measures of ERP 68
Figure 3.7: End-user Computing Satisfaction model 70
Figure 3.8: Conceptual model 75
Figure 3.9: ERP impact 75
Figure 3.10: ERP System Impact on Stakeholders’ Performance Framework 85
Figure 4.1: Sequential explanatory strategy 104
Figure 4.8: Research process 120
Figure 5.1: Map of the Kingdom of Saudi Arabia 126
Figure 5.2: Conceptual Model Results for KSU 142
Figure 5.3: Project schedule at KFUPM 144
Figure 5.4: Conceptual Model Results for KFUPM 151
Figure 5.5: Conceptual model of results for KFU 164
Figure 5.6: Participants’ job titles and name of ERP system, by University 166
Figure 5.7: Conceptual model of results 186
Figure 7.1: Key success factors for high stakeholder performance 219
Figure 7.2: ERP system Impact on Stakeholders’ Performance Model 244

XVII
BSC Balanced Scorecard
CBA Cost Benefit Analysis
D&M DeLong and McLean
ERP Enterprise Resource Planning
EUCS End User Computing Satisfaction
HE Higher Education
IS Information System
IT Information Technology
KFU King Faisal University
KFU of P&M King Fahd University of Petroleum and
Minerals
KSA Kingdom of Saudi Arabia
KSU King Saud University
MIS Management Information Systems
MRP Material Requirements Planning
ROI Return on Investment
ROM Return on Management
MOMC Multi-Objective, Multi-Criteria
SCM Supply Chain Management
TAM Technology Acceptance Model
TQM Total Quality Management
TTF Task Technology Fit
VOI Value on Investment

XVIII
1- Althonayan, M., Papazafeiropoulou, A. (2011) Evaluating the Performance of
ERP Systems in Saudi Arabian Higher Education: A Stakeholders’ Perspective.
Proceedings of the 2nd International Conference on Information Management and
Evaluation (ICIME 11), April 27-28, pp. 473-82.
2- Althonayan, M., Papazafeiropoulou, A. (2013) Evaluating the Performance on
ERP systems in King Saud University (KSU): A Stakeholders’ Perspective.
Proceedings of the46 Hawaii International Conference (HICSS), January 7-10

Chapter 1: Introduction 1
Evaluating Stakeholders’ Performance of ERP Systems in Saudi Arabia Higher Education Mona Althonayan
PAGE
1.1 Overview……………………………………………………………………... 2
1.2 ERP Systems in Higher Education…………………………………………. 3
1.2.1 ERP Stakeholders……………………………………………………… 5
1.2.2Evaluating the Performance of ERP Stakeholders…………………. 7
1.3 Research Problem …………………………………………………………... 8
1.4 Aim and Objectives …………………………………………………………. 10
1.5 Research Questions …………………………………………………………. 10
1.6. Research Methodology Outline…………………………………………….. 11
1.6.2 Field Research…………………………………………………………... 13
1.7 Novel Contribution…………………………………………………………... 13
1.8 Structure of the Thesis………………………………………………………. 13
CHAPTER ONE
INTRODUCTION

Chapter 1: Introduction 2
Evaluating Stakeholders’ Performance of ERP Systems in Saudi Arabia Higher Education Mona Althonayan
1.1 Overview
Enterprise resource planning (ERP) systems are complex and comprehensive
software packages designed to integrate business processes and functions (Chen and
Lin, 2008). Despite the difficulties and risk involved in their adoption, their use is
expanding rapidly. Many organisations are adopting ERP systems for different
reasons, including legacy systems replacement, cost reductions and faster
information transactions (Ifinedo and Nahar, 2006).
Unsurprisingly, universities and academic institutions are seeking to improve and
develop their functions by adopting technically advanced measures such as ERP
systems and have invested heavily in the development of infrastructure to enhance
the application of information technology (IT) in their educational policies and
procedures (Rabaa`i, Bandara, and Gable 2009a). Many academic institutions have
spent considerable time and money in implementing sophisticated IT systems
without following a systematic approach to measure their return on investment. In
the case of higher education, ERP systems affect many aspects of both internal and
external operations, and their successful deployment and use are critical to
universities’ performance (Swartez and Origall, 2000).
However, higher education is facing serious challenges in implementing new
technology such as ERP systems. Meeting stakeholders’ expectations in higher
education is one of those challenges, which relates to the unique organizational
context of universities. According to Pollock and Cornford (2004), the uniqueness of
universities is based on a combination of different characteristics, which, according
to Lockwood (1985), include: complexity of purpose; limited measurability of
outputs; both autonomy from and dependency on wider society; diffuse structure and
authority; and internal fragmentation. These characteristics are fundamental to the
implementation of ERP systems in the educational sector.
ERP system designers consider priorities and expectations on one hand, and different
stakeholders react differently to the new system on the other, by welcoming,
rejecting or adopting the new system in their organization (Boonstra, 2006). This
interaction between the systems and humans could act as an indicator to evaluate the
post-implementation performance.
Chapter 1: Introduction 3
Evaluating Stakeholders’ Performance of ERP Systems in Saudi Arabia Higher Education Mona Althonayan
Albeit the post-implementation effectiveness of ERP systems is an essential indicator
of success, organizations do not discuss whether an ERP system is needed; instead,
they focus on how to establish an effective one (Son Yu, 2005). From this viewpoint,
ERP post-implementation effectiveness in higher education can be explained by
studying the stakeholders’ performance and whether the newly adopted systems meet
their needs and expectations.
1.2 ERP Systems in Higher Education
ERP systems are used by large corporations around the world, recently replacing
management and administration computer systems in the higher education sectors
(Rabaa`I, Bandara, and Gable 2009a). ERP has played a significant role in the IT
management of higher education. It is important to define ERP systems in higher
education as being multiple in scopes, tracking a range of activities including those
of human resource systems, student information systems and financial systems
(Robert, 2004).
Higher education has always been a sector that proactively adopts advances in
technology, particularly IT (Rabaa`i Bandara, and Gable 2009a). One of the
prominent trends is the adaptation of the ERP application software (Pollock and
Cornford, 2004). Previous studies have identified many similarities between
implementing ERP system software in educational institutes and in other
organisations (Pollock and Cornford, 2004). It is therefore important to study the
implications of using ERP systems in higher education and the necessary information
required to avoid the problems caused by legacy systems, in order to address the role
of ERP in changing educational organisations and the implications of its use in
similar organizational cultures.
Chae and Poole (2005) describe the importance of IT and the role of organizational
leadership in its adoption in the education system in terms of “the value system and
long term investment not only financially but also in resources considered as one of
the main differences between higher education and other business organisations”.
Moreover, “leadership in the universities’ management is based on sharing of ideas
and decision making procedures between staff and administrators” (Okunoye and
Folick, 2006). This uniqueness in the applied system is based upon different

Chapter 1: Introduction 4
Evaluating Stakeholders’ Performance of ERP Systems in Saudi Arabia Higher Education Mona Althonayan
combinations of certain characteristics, which Okunoye and Folick (2006) identify
as: “complexity of purpose, limited measurability outputs, both autonomy and
dependency from wider society, diffused structure of authority, and internal
fragmentation”.
Pollock and Cornford (2004) state that ERP in higher education comprises a large,
complex database which has all the relevant information on the status of staff
members, students, building operations or infrastructure, equipment, documents and
financial transactions. The unique situation of universities encourages many
companies to produce software dealing with specific functions of universities, such
as finance, human resources and project management for keeping and maintaining
students’ records. While the proponents of ERP systems (e.g. Swartz and Orgill,
2000) have argued that there are many reasons to implement them, such as to
improve information access and the effectiveness of workflow within and outside the
organizations operating them, Bradley and Lee (2007) warn that universities have
problems similar to those of various other organizations, in terms of coordinating
resources, controlling costs and motivating and facilitating ERP amongst faculty and
staff members.
ERP in higher education is under increasing pressure to function because any
implementation project will involve the consideration of a wide variety of factors and
stakeholders, including the university management, administrators and software
vendors. ERP vendors have found the higher education context to be a lucrative and
profitable market for their products in the process of modernizing back offices and
administrative functions via integrated technology platforms (Wagner and Newell,
2004).
Rabaa`i (2009b) argues that the most important goal of ERP system implementation
in higher education is to integrate different administrative functions into more
systematic and cost-effective structures and so gain a strategic advantage, including
in the fields of student administration, human resource management, facilities
management and financial systems, when these have been supported separately in the
legacy systems. The main advantages of ERP for higher education, according to
Rabaa`i, Bandara, and Gable (2009a), are: (1) better access to information for

Chapter 1: Introduction 5
Evaluating Stakeholders’ Performance of ERP Systems in Saudi Arabia Higher Education Mona Althonayan
planning and managing the institution; (2) improved service for the faculty, students
and employees; (3) lower business risk and (4) increased income and decreased
expenses due to improved efficiency.
Wagner and Newell (2004) assert that stakeholders are seen as a fundamental factor
that distinguishes higher education institutions from other organizations, because
each university will have multiple users of its ERP system, varying in terms of their
backgrounds, goals, approaches to practice and epistemic culture. Another factor to
consider when implementing ERP is the ease with which stakeholders will be able to
use, control and improve the system.
1.2.1 ERP Stakeholders
All information system (IS) projects have stakeholders and it is important to define
who they are. Boonstra (2009) defines stakeholders as “any group or individual who
can affect or is affected by the achievement of the organization’s objectives”.
The individual or group of stakeholders will have different expectations, attitudes,
levels of interest and degrees of power and influence (Flower and Gilfillan, 2003).
Stakeholders play a significant role in the success of information systems and
evidence has shown that failure by stakeholders in the development of an IS can lead
directly to system failure (Blyth, 1999). As with any software project, stakeholders
are required to make an active contribution, based on their analysis and
communication of requirements, since they acquire significant knowledge of the
organization and of the new system (Ballejos and Monagna, 2008).
In the higher education context, identifying the stakeholders is important because
there is generally a lack of provision for their requirements (Wagner and Newell,
2004). Universities have varied ERP systems users, from different backgrounds, with
different goals, education levels and ability to use the system. Seng and Leoid (2003)
identify the stakeholders of ERP systems in higher education as government bodies,
academic, administrative and support staff, industry and society. However, there is
considerable disagreement on identifying all such groups in education. For instance,
students are sometimes considered to be stakeholders, because of their participation
in learning, whereas graduates are considered products of the education process.

Chapter 1: Introduction 6
Evaluating Stakeholders’ Performance of ERP Systems in Saudi Arabia Higher Education Mona Althonayan
Since any IS will influence many aspects of the organization, such as its strategic
position, cost effectiveness, job satisfaction, security, customer satisfaction and
commercial success, many parties around the IS can be considered stakeholders
(Boonstra, 2009). ERP implementation projects will thus affect various groups,
including managers, developers and users.
According to Fowler and Gilfillan (2003), the higher education sector has faced
major challenges since ERP systems began to be implemented in universities and
colleges; these include assessing the success and improvement of the project, which
has two aspects: the product (what has been delivered) and the process (how it was
delivered). While researchers such as Lyytinen and Blyth (1987) have argued for
allowing stakeholders to be involved in systems development, to reduce the risk of
failure, there is also a strong relationship between the improvement of the
organisation’s IT evaluation and the stakeholder’s role during the setting up and
successful operation of the system.
Indeed, there are two broad reasons for involving IT stakeholders in the evaluation
phase. Khalifa et al. (2001) state that the assessment must take account of costs and
advantages for both primary and secondary stakeholders, as the operations of ERP
systems are primarily identified by the stakeholders in any organization planning to
adopt them in the near future. Boonstra (2009) adds that the significance of the
involvement of stakeholders in the evaluation phase is that it strengthens the link
between the system and stakeholders, which would lead to systems’ overall success
in terms of quality of system, user satisfaction, user acceptance and system use.
When managers agree on the involvement of the stakeholders in various stages of the
project, the degree of this involvement will be crucial.
Stakeholders’ satisfaction is considered to be one of the factors affecting the success
of an ERP system and evaluating stakeholders’ performance would provide evidence
of the usefulness and success of any information system.

Chapter 1: Introduction 7
Evaluating Stakeholders’ Performance of ERP Systems in Saudi Arabia Higher Education Mona Althonayan
1.2.2 Evaluating the Performance of ERP Stakeholders
A large number of studies have evaluated various aspects of IS and ERP systems,
including consulting, negotiation, productivity, business performance, consumer
value, virtual process measurement and business value, some of them adopting acts-
oriented and postmodern approaches (Adelakun and Jennex, 2002). However, few
have evaluated the performance of ERP stakeholders and those who have done so
have categorised this element under the umbrella of IS success factors, as a facet of
user satisfaction.
According to Ballantine et al. (1996), Delone and Mclean (1992) have proposed a
model of IS success measurement, based on the work of Shannon and Weaver (1949)
and of Mason (1978). Their model recognises six dimensions on which to measure IS
success: information quality, systems quality, information use, user satisfaction,
individual impact and organizational impact. In 2003, Delone and Mclean updated
the model by making a series of recommendations for the current and future
measurement of IS success in e-commerce. The six dimensions of the updated model
are: systems quality, information quality, service quality, users, user satisfaction and
net benefits (Delone and Mclean, 2003).
The implementation of ERP systems differs from that of other IT systems in terms of
its environment, which has technological, operational, managerial, strategic and
organizational components. Therefore, a success measurement model designed for IT
systems may not be applicable to evaluate ERP systems (Ifinedo and Nahar, 2007).
For Gable, Sedera, and Chan (2003), the evaluation of ERP success should consider
five dimensions: systems quality, information quality, individual impact, workgroup
impact and organizational impact. These are based on the work of Delone and
Mclean (1992) referred to above and of Myers (1997), who considers information
quality to be the most important dimension, while organizational impact is rated
lowest. The notion of ERP success for Myers (1997) refers to the use of the system to
enhance organizational efficiency and effectiveness. Ifinedo and Nahar (2007) have
since added vendor/consultant quality to the dimensions of the Gable, Sedera, and
Chan (2003) model.
Chapter 1: Introduction 8
Evaluating Stakeholders’ Performance of ERP Systems in Saudi Arabia Higher Education Mona Althonayan
Stakeholders play an essential role in accomplishing the success of ERP systems and
in evaluating the perceived benefits arising from their use. Moreover, user
satisfaction is often used as an indicator of IS effectiveness (Somers et al., 2003).
Several researchers have validated the measurement of stakeholders’ perceptions in
the context of ERP systems; for instance, Sedera and Gable (2004) identify four
dimensions of such a measurement: individual impact, organizational impact,
information quality and system quality. Their study analysed data on the basis of a
classification of respondents into four employment groups: strategic, management,
operational and technical.
Wu and Wang (2006) used interviews and a survey to measure end user satisfaction;
their tool categorised 24 factors into four phases to evaluate ERP success. Earlier,
Zhang et al. (2005) developed critical success factors and success measures, based on
the IS research model of Ives, Olson, and Baroudi (1983) and the Delone and
McLean (1992) IS success model. This modification and combination of the two
models took organizational environment, user environment, system environment and
ERP vendor environment as the basis for independent variables, whereas Delone and
McLean (1992) had suggested that user satisfaction, individual impact,
organizational impact and intended business performance improvement should serve
as dependent variables.
Haab and Surry (2009) studied participation in the implementation of ERP systems.
They identified various modes of participation and measured their relationship with
level of satisfaction with the implementation of an ERP system in higher education,
using a modified version of the measure developed by Doll and Torkzadeh (1988),
taking account of content, accuracy, format, ease of use and timeliness (EUCS).
Their study examined the ERP systems created specifically for higher education
institutions, including BANNER, PeopleSoft and Datatel.
1.3 Research Problem
Although researchers and practitioners consider user satisfaction with information
systems to be a fundamental indicator of an information system’s success (Aladwani,
2003), the literature published to date reveals that there are significant shortcomings
to this assumption, including that IS systems can be viewed from two distinct

Chapter 1: Introduction 9
Evaluating Stakeholders’ Performance of ERP Systems in Saudi Arabia Higher Education Mona Althonayan
perspectives: the organizational viewpoint focuses on the quality of the interface and
the information provided by IS to help employees to fulfil their tasks, while the
socio-technical viewpoint is concerned with individual needs (Au et al., 2002).
Cyert and March (1963) were the researchers who first proposed the concept of user
satisfaction as a surrogate of systems success (Au et al., 2002). Recent studies (e.g.
Somers et al., 2003; Au et al., 2008; Zviran, 2003; Mohmood et al., 2000; 2002; Hsu
et al., 2008) have considered end-users’ satisfaction, but not stakeholders’
performance. Published studies also tend to focus on ERP systems in manufacturing
industry, while few have discussed ERP in academic institutions. Despite the rapid
current growth of ERP use in higher education, there is lack of scholarly research
into its implementation in the sector (Rabaa`I, Bandara and Gable 2009a).
Furthermore, investments in information systems are very costly. For instance, Saudi
Arabia spends millions of dollars on information systems every year, to develop and
improve the higher education system. Investors-particularly the state sector, which
generally foots the bill for education worldwide and offers excellent support for
innovative technological solutions, as discussed above-require a return on their
investment; thus the massive investment in ERP systems by higher education bodies
needs to be evaluated in terms of the success of their application.
Effective selection, development and improvement of information systems require
systematic evaluation methods and tools. Among the various relevant studies, there is
consensus on the need for appropriate evaluation of IS success to help organisations
to measure the return on their investments in information systems (Gable et al.,
2008). Rabaa`i, Bandara, and Gable (2009) suggest that the methodical evaluation of
each IS and of its impact on both organization and individuals is necessary to justify
its cost by its contribution to the productivity, quality and competitiveness of the
organization. Despite its importance, however, there is no accepted framework or
methodology for IS evaluation in higher education (Adelakun and Jennex, 2002).

Chapter 1: Introduction 10
Evaluating Stakeholders’ Performance of ERP Systems in Saudi Arabia Higher Education Mona Althonayan
1.4 Aim and Objectives
The overall aim of this research is to highlight the impact of the ERP systems on the
performance of an academic institution and to provide researchers, practitioners and
decision-makers with a framework to enhance their evaluation of the performance of
ERP system stakeholders in higher education.
Its objectives are:
1- To review existing evaluation frameworks for ERP systems in order to assess the
methods used to measure the system.
2- To identify applicable method to evaluate the performance of ERP system
stakeholders.
3-To develop a theoretical framework, suitable for evaluating the performance of the
ERP systems used in Saudi Arabian higher education, from the perspective of their
stakeholders.
4- To collect and analyse case studies data in order to test the theoretical framework
5- To identify the main factors having a significant impact on the ERP system
stakeholders’ performance in higher education, and offer recommendations.
1.5 Research Questions
What is the most effective method of evaluating ERP stakeholders’
performance applicable to higher education?
How does Saudi Arabian higher education evaluate ERP systems?
What are the relationships between the quality of the ERP system and
stakeholders’ performance?
What are the relationships between the quality of system technical support for
the ERP system and stakeholders’ performance?
1.6. Research Methodology Outline
This section outlines the methodology used in conducting the two phases of this
study: desk and field research, each divided into two parts.

Chapter 1: Introduction 11
Evaluating Stakeholders’ Performance of ERP Systems in Saudi Arabia Higher Education Mona Althonayan
1.6.1 Desk Research
Part I: ERP systems in general and in higher education in particular
This involves reviewing existing literature on the role of ERP systems in the higher
education sector, using case studies of Saudi Arabian universities. The aim of this
part is to gain an understanding of the role of ERP systems in higher education in
order to conceptualise the visionary context of the core part of this research: the
creation of a model linking ERP systems with stakeholders’ performance.
Part II: Evaluating stakeholders’ performance
This involves reviewing and analysing existing literature on ERP systems and the
performance of stakeholders. The aim is to establish a comprehensive understanding
of ERP systems in higher education from a stakeholders’ perspective, from which
theory-building can proceed.
The underlying epistemological approach of this research is positivist. This is
appropriate to the context for a number of reasons. First, positivist studies generally
test theory, in an attempt to increase the predictive understanding of phenomena
(Myers and Avison, 2002). Secondly, positivism assumes the existence of an
objective physical world independent of human observation and of an equivalent
social reality independent of individual perception (Orlikowski and Baroudi, 1991).
Given that the nature of this research is that it investigates the effectiveness of the
adoption of ERP in a large organizational context, in which the existential reality of
concern to the research is reflected in the organization’s output, removed from the
particular perceptions of individuals, the subjective and often highly specific and
particular data which characterizes qualitative research is in itself unable to shed
light on the problems of concern here. Thus, a mixed-method approach based on the
positivist paradigm was deemed necessary, as explained below.
Thirdly, the IS field has seen a shift from technological to managerial and
organizational questions (Benbasat et al., 1987). Meanwhile, the behavioural science
paradigm, with its roots in natural science research methods, has tried to develop and
justify theories that explain or predict organizational and human phenomena
surrounding the analysis, design, implementation, management and use of

Chapter 1: Introduction 12
Evaluating Stakeholders’ Performance of ERP Systems in Saudi Arabia Higher Education Mona Althonayan
information systems (Hevner et al., 2004). As described previously, there are many
social, professional and technical issues influencing the implementation of ERP
systems, their success and the performance of their stakeholders in the higher
education context. Therefore, a positivist approach to the analysis of the research
findings was deemed appropriate.
A case study is particularly well suited to IS research, since the aim is to study
information systems in organizations (Myers and Avison, 2002). Thus, analysing a
department, information system, systems developer and development project allows
the gathering of as much detail as possible in one case of the phenomenon under
investigation (Oates, 2006). According to Yin (2009), there are three different types
of case study: exploratory, descriptive and explanatory; the choice among them
depends on the type of research question posed, on the extent of control that the
investigator has over actual behaviour or events and on the degree of focus on
contemporary as opposed to historical events. Since the research questions presented
above are of the ‘how’ and ‘why’ types, this research can be classified as explanatory
in nature.
Identifying the appropriate research strategy is important in establishing the general
framework of the study. The present research is mainly concerned with evaluating
the performance of ERP system stakeholders in three universities in Saudi Arabia,
where the relationships among these elements is unclear. Therefore, multi-case
studies constitute the appropriate research strategy. Yin (2003) defines a case study
as: “An empirical inquiry that investigates contemporary phenomenon within its
real-life context, especially when the boundaries between phenomenon and context
are not clearly evident”.
This research takes a mixed-method approach, combining quantitative and
qualitative data collection and analysis, the principal methods of data collection
being interviews and a questionnaire. Interviews are commonly used in case studies
because they constitute one of the most common and powerful ways in which the
researcher can gather valuable data to understand human beings (Oates, 2006) and
their lived experience (Denzin and Lincoln, 2005b). As for the questionnaire method,
it is often used to enhance the quality of such research (Bryman and Bell, 2007).
Thus, the mixed approach is appropriate in seeking to understand the performance of

Chapter 1: Introduction 13
Evaluating Stakeholders’ Performance of ERP Systems in Saudi Arabia Higher Education Mona Althonayan
ERP system stakeholders within their social context (higher education) (Hirschheim,
1991). The methodology and research design are discussed in greater detail in
chapter 4.
1.6.2 Field Research
Saudi Arabian higher education: multiple case studies
The objective of Saudi educational policy is to ensure that education becomes more
efficient, in order to meet the economic and social needs of the country. The Saudi
higher education sector has witnessed a rapid expansion during the last four decades.
The study of the sector involves empirically investigating the role that technology
plays by focusing on the use of ERP systems in different universities from the
perspective of their stakeholders’ performance. The aim of this part of the field
research is to refine the visionary model created in part one of the desk research.
1.7 Novel Contribution
The final element of a doctoral thesis is concerned with aligning the importance of
the study to the development of the discipline being researched. Many organizations
and higher educational institutions in Saudi Arabia have already implemented ERP
systems. Therefore, it will be useful to investigate the post-implementation phase and
evaluate the stakeholders’ performance, thus helping researchers and practitioners to
enhance the performance satisfaction of the stakeholders. The novel contribution of
this research is to show how the outcome of ERP systems post-implementation can
be affected by the stakeholders’ performance.
1.8 Structure of the Thesis
Chapter 1 introduces the thesis, outlining the background to ERP systems and their
use in higher education, with brief reference to Saudi Arabia. It sets out the
objectives and main contributions of the research, establishes terms of reference and
outlines the methodology, while offering contextual information on the use of ERP
systems in higher education, associated problems and reasons for choosing the
research topic.

Chapter 1: Introduction 14
Evaluating Stakeholders’ Performance of ERP Systems in Saudi Arabia Higher Education Mona Althonayan
Chapter 2 assesses relevant literature covering ERP systems in general and their
implementation in various fields, illustrating the different approaches to the
evaluation of ERP systems, theories and related models.
Chapter 3 Research theoretical model chapter reviews literature concerning ERP
systems, and presents the background to each model and illustrates its relation to
ERP systems. This chapter is including the final factors chosen from the three
models to evaluate stakeholders’ performance on ERP systems in higher education.
Chapter 4 discusses the research methodology, describing and discussing the
research process, the problems associated with identifying the most appropriate
method and the design of the research, data access and collection procedures.
Chapter 5 presents the case studies of three Saudi Arabian universities, reporting
phase two of the research, during which empirical data were gathered by means of a
questionnaire. This chapter reports the analysis of data collected from the
quantitative phase of the field work (questionnaire).
Chapter 6 This chapter reports the analysis of data collected from the qualitative
phase of the field work (interviews).
Chapter 7 reports the discussions based all key sources: literature, documents,
questionnaire and interviews. This chapter presents the final evaluation of
stakeholders’ performance in using ERP systems, and then proposes a research
model based on the theoretical framework and the data analysis.
Chapter 8 summarises the research and its contribution to knowledge, theory and
contribution practice draws conclusions and offers a set of recommendations for
future research.
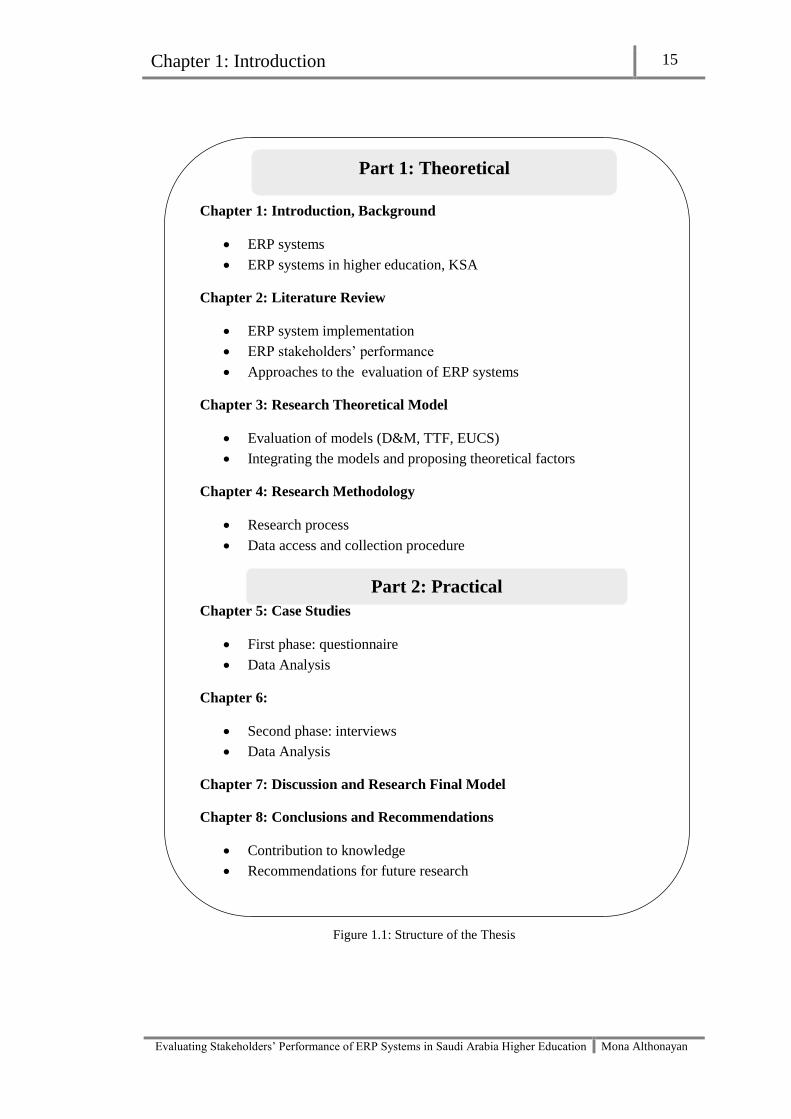
Chapter 1: Introduction 15
Evaluating Stakeholders’ Performance of ERP Systems in Saudi Arabia Higher Education Mona Althonayan
Part 1: Theoretic
Figure 1.1: Structure of the Thesis
Chapter 1: Introduction, Background
ERP systems
ERP systems in higher education, KSA
Chapter 2: Literature Review
ERP system implementation
ERP stakeholders’ performance
Approaches to the evaluation of ERP systems
Chapter 3: Research Theoretical Model
Evaluation of models (D&M, TTF, EUCS)
Integrating the models and proposing theoretical factors
Chapter 4: Research Methodology
Research process
Data access and collection procedure
Chapter 5: Case Studies
First phase: questionnaire
Data Analysis
Chapter 6:
Second phase: interviews
Data Analysis
Chapter 7: Discussion and Research Final Model
Chapter 8: Conclusions and Recommendations
Contribution to knowledge
Recommendations for future research
Part 1: Theoretical
Part 2: Practical

Chapter 2: Literature Review 16
Evaluating Stakeholders’ Performance of ERP Systems in Saudi Arabia Higher Education Mona Althonayan
PAGE
2.1 Overview………………………………………………………………….
17
2.2. Enterprise Resource Planning Systems………………………………...
18
2.2.1 The evolution of ERP systems……………………………………….. 19
2.2.2 Reasons for purchasing ERP systems………………………………. 21
2.3 Evaluation in IS………………………………………………………….. 24
2.4 Evaluation of ERP systems……………………………………………… 31
2.5 Performance measures………………………………………………….. 33
2.6 Stakeholders in IS/ERP systems………………………………………... 37
2.7 Stakeholders’ Evaluation……………………………………………….. 42
2.8 ERP systems in higher education………………………………………. 46
2.9 ERP systems in Saudi Arabia…………………………………………... 54
2.10 Gap in ERPs performance evaluation, stakeholders’ Perspective….. 54
2.11 Summary………………………………………………………………... 58
CHAPTER TWO
LITERATURE REVIEW

Chapter 2: Literature Review 17
Evaluating Stakeholders’ Performance of ERP Systems in Saudi Arabia Higher Education Mona Althonayan
2.1 Overview
Enterprise resource planning systems have been considered important in the
corporate use of information technology since the 1990s. An ERP system is one of
the most widely accepted choices to obtain competitive advantage and to enhance
organisational cross-functional efficiency and effectiveness through the seamless
integration of all information flowing through the organisation. Private and public
sector organisations often try to achieve an increase in efficiency through internal
improvement.
Despite the significant impact of ERP systems on organisational functions,
implementing them is considered complex and costly. Therefore, an organisation
needs to evaluate such a system from the stakeholders’ perspective, as well as
considering the technical aspects.
Given the limitations of previous studies of ERP systems referred to in chapter 1, this
chapter offers an analytical overview of existing literature in the five research areas
with which this research is concerned: ERP systems in general, evaluation,
stakeholders, higher education (HE) and ERP systems in HE. It seeks to position the
present research in relation to existing work, within the context of ERP systems in
higher education, and to provide the background theory for models and approaches
used in carrying out the research presented later in this thesis.
First, this literature review provides an overview of ERP systems in general,
covering their evolution, their importance and the reasons for purchasing them. Next,
it considers the evaluation of IS and then of ERP systems. There follows a review of
the literature dealing with performance measures, with stakeholders in IS/ERP
systems and with stakeholders’ evaluation. The focus then turns to ERP in HE and to
how such systems operate in an academic environment. Finally, there is brief
consideration of previous work on ERP system in the Kingdom of Saudi Arabia
(KSA).
This review identifies a gap in the literature concerning the impact of ERP systems
on stakeholders’ performance, which is a central concern of the present study. The
chapter discusses ERP systems in Saudi universities and ends with a comprehensive
identification of gaps in the research field that this thesis aims to address.

Chapter 2: Literature Review 18
Evaluating Stakeholders’ Performance of ERP Systems in Saudi Arabia Higher Education Mona Althonayan
2.2. Enterprise Resource Planning Systems
ERP systems are software packages that have been increasingly adopted by
organisations across various industries in both developed and developing counties.
Al-Mashari (2002) consider some of the range of definitions offered by various
authors; for instance, Rosemann and Wiese (1999) describes ERP systems as
“customizable, standard application software which includes integrated business
solutions for the core processes (e.g. production planning and control, warehouse
management) and the main administrative functions (e.g. accounting, human
resource management) of an enterprise”. This definition differs slightly from that of
Gable (1998), for whom an ERP system is a “comprehensive packaged software
solution seeking to integrate the complete range of business processes and functions
in order to present a holistic view of the business from single information and IT
architecture”. Alternatively, Zhu et al. (2010) define ERP systems as “configurable
information systems packages that integrate information and information-based
processes within and across functional areas in an organization”. The essential ERP
architecture is built upon one database, one application and a standard interface
across the entire enterprise (Calisir and Calisir, 2004). According to Sane (2005),
ERP systems are multi-module application software packages that serve and support
multiple business functions.
These software packages are of particular interest to management information
systems (MIS) researchers because they can have broad organisational effects, rather
than the localized individual and group task-level effects of many smaller packages.
Furthermore, ERP systems have become ubiquitous, as indicated by a growth in ERP
software licence revenue of 19 percent in 2007 (Strong and Volkoff, 2010).
However, packaged software raises important theoretical issues associated with the
fact that by definition it is designed to meet generic rather than specific requirements,
making it unlikely to be a perfect fit in any particular instance (Strong and Volkoff,
2010).
Recently, ERP systems have been in high demand with both manufacturing and
service organisations, because they provide a tightly integrated solution to an
organisation’s information system needs. During the last decade, ERP systems have
received significant attention from researchers and practitioners of IS disciplines.
Chapter 2: Literature Review 19
Evaluating Stakeholders’ Performance of ERP Systems in Saudi Arabia Higher Education Mona Althonayan
Therefore, the ERP software market has become one of the largest fields of IT
investment worldwide (Shehab et al., 2004).
The above definitions and descriptions will help to track the history of ERP and its
evolution in the following subsection.
2.2.1 The evolution of ERP systems
The origin of ERP can be traced back to material requirements planning (MRP) and
manufacturing resource planning (MRP-11). The concept of MRP, which emerged
during the 1960s, was to use IS to coordinate automatically the activities of the
production control, inventory and accounting departments, but such systems were not
practical for commercial use (Helo, Anussornnitisarn, and Phusavat, 2008). It
became viable to utilise MRP commercially when available computing power
(processing capability and storage capacity) increased (McGaughey and
Gunasegaram, 2007).
Table 2.1: The evolution of ERP
System Primary business need(s) Scope Enabling technology
MRP Efficiency Inventory management
and production planning
and control.
Mainframe computers,
batch processing,
traditional file systems.
MRP11 Efficiency, effectiveness
and integration of
manufacturing systems
Extending to the entire
manufacturing firm
(becoming cross-
functional)
Mainframe and mini
computers, real-time (time
sharing) processing,
database management
systems (relational)
ERP Efficiency (primarily back
office), effectiveness and
integration of all
organisational systems.
Entire organisation
(increasingly cross-
functional), including
manufacturing operations
Mainframe, mini and
macro computers,
mainframe networks with
distributed processing and
databases, data
warehousing and mining
knowledge management
ERP11 Efficiency, effectiveness
and integration within and
among enterprises.
Entire organisation
extending to other
organisations (cross-
function and cross-
enterprise – partners,
suppliers, etc.)
Mainframes, client server
systems, distributed
computing, knowledge
management, internet
technology (includes web
service, intranets and
extranets)
IRP, Enterprise
system,
Enterprise Suite,
or whatever
label gains
common
acceptance
Efficiency, effectiveness
and integration within and
among all relevant
constituents (business,
government, consumers
etc.) on a global scale.
Entire organisation and its
constituents
(increasingly global)
comprising supply chain
from beginning to end, as
well as other industry and
government constituents)
Internet, web service
architecture, wireless
networking, mobile,
warless, knowledge
management, grid
computing, artificial
intelligence.
Source: Adapted from McGaughey and Gunasegaram, (2007)

Chapter 2: Literature Review 20
Evaluating Stakeholders’ Performance of ERP Systems in Saudi Arabia Higher Education Mona Althonayan
ERP software packages had their roots in MRP and emerged to support a variety of
transaction-based back-office systems, because they involved activities and processes
in which the customer and general public were not typically involved. Contemporary
ERP systems have been designed to streamline and integrate operation processes and
information flows within a company in order to promote synergy (McGaughey and
Gunasegaram, 2007). Table 2.1 summarises the evolutionary history of ERP and
related systems.
Despite the potential advantages of ERP systems, they are considered costly and
complex; their implementation is so difficult that it often fails. Nevertheless, many
organisations have found numerous reasons to implement ERP systems. The
following subsection reviews accounts of these reasons.
2.2.2 Reasons for adopting ERP systems
Elmes, Strong and Volkoff (2005) explain that early ERP research focused on this
new IT artefact itself and found that it was different from the legacy systems it was
replacing. This led to an understanding of the reasons for organisations deciding to
adopt ERP systems; they are motivated to purchase such systems because, among
other benefits, they expect enhanced information capture, increased transparency and
better information flow.
Many authors (e.g. Nah, 2001; Shehab et al., 2004; Elmes, Strong and Volkoff, 2005)
have listed the most important attributes of ERP systems and their ability to improve
organisational effectiveness and efficacy, including:
- The ability to implement all variations of best business practice with a view
to enhancing productivity.
- The sharing of common data and practice across the entire enterprise in order
to reduce errors.
- The production and accessing of information in a real-time environment to
facilitate rapid and better decision making and cost reductions.
- Improved efficiency.
- Increased customer responsiveness.
- Better performance control and increased data visibility.
- The novel integration of business management and IT concepts.

Chapter 2: Literature Review 21
Evaluating Stakeholders’ Performance of ERP Systems in Saudi Arabia Higher Education Mona Althonayan
- Automation and integration of business processes across organisational
functions and locations.
Shang and Seddon (2000) classify the benefits of ERP implementation into five
groups:
- Operational: relating to cost reduction, productivity improvement, quality
improvement and customer service improvements;
- Managerial: relating to better resource management, improved decision
making and planning, and performance improvement;
- Strategic: supporting business growth, supporting business alliance, building
business innovations, building cost leadership, generating product
differentiation and building external linkages;
- IT infrastructural: building business flexibility, IT cost reduction and
increased IT infrastructural capability;
- Organisational: relating to supporting organisational changes, facilitating
business learning, empowering and building a common vision.
Despite these significant benefits that ERP systems can provide, they are very
expensive even under ideal circumstances, with costs ranging from hundreds of
thousands of dollars to several million dollars. Thus, cost is the first point listed by
Markus and Tanis (1999), when they assert that ERP implementation is an important
and challenging decision to organisations, outlining potential failures due to:
1 Financial costs and risk: installing an ERP system is an expensive and risky
venture.
2 Technical issues: ERP systems are technically challenging; therefore the most
important technical area of research around ERP is ‘development and reference
models’.
3 Managerial issues: ERP projects are managerially challenging, since they may
involve parties from many different organisations and cut across organisational
political structures. Furthermore, ERP has important implications for how
companies should organise and manage their IS functions.

Chapter 2: Literature Review 22
Evaluating Stakeholders’ Performance of ERP Systems in Saudi Arabia Higher Education Mona Althonayan
4 IT adoption, use and impacts: ERP systems have been widely adopted across
organisations and have large potential impacts at all levels of analysis, such as
individual and social, work system, organisational and inter-organizational.
5 Integration. According to Beretta (2002), in order to be effective, integration has
to be leveraged along three dimensions:
- Information integration. One dimension of integration has to do with the ability
to transfer information efficiently throughout the organisation through data and
objects; the connection of the information generated in different parts of the
organisation is a basic component of its integration capabilities.
- Cognitive integration. Effective integration requires that the different
perspectives related to the various professional realms involved in the process
are matched; so that each professional in the process is matched (i.e. each
professional should understand the points of view of other professionals). This
does not mean that any perspective has to be accepted uncritically. The point is
that in functional organisations, the simple understanding of different needs is
quite often made difficult by the cognitive filters that permeate the borders of
functional units. Reciprocal understanding may help each manager to take into
consideration solutions that can be mutually satisfactory.
- Managerial integration. The personal commitment of each manager must be
affected. The nature and relevance of the economic responsibilities assigned to
managers and of the connected incentive systems play a significant role in
enabling or opposing organisational integration.
ERP systems can be implemented in any organisation in a series of steps. Tsai et al.
(2007) list some different ways that this can be done. Some companies adopt phased
implementation, while others use a big bang implementation. Many implement pre-
packaged ERP systems, while others use non-packaged ones, derived from the
evolution of legacy systems, self-development, or outsourcing. They may select an
integrated planning approach, whilst others adopt the step-by-step planning method,
allowing the evaluation of the benefits accrued by implementing ERP systems.
According to Bakry and Bakry (2005), the objective of an ERP system is to automate
the business processes of an enterprise, in order to support e-business

Chapter 2: Literature Review 23
Evaluating Stakeholders’ Performance of ERP Systems in Saudi Arabia Higher Education Mona Althonayan
implementation, leading to better performance. Therefore, McGaughey and
Gunasekaran (2008) note that organisations nowadays seem more focused on
external aspects, as they look for ways to support and improve relationships and
integration between stakeholders (e.g. customers, suppliers and partners).
In short, the ERP phenomenon has strong conceptual links with just about every
major area of IS research. In addition, the phenomenon suggests the potential value
of entirely new research directions. Research into the adoption of new technology
must consider the evaluation phase, which is fundamental in terms of the technical,
financial and human aspects. The following section discusses published work on
evaluation in IS in general, as well as the different aspects of evaluation.
2.3 Evaluation in IS
Despite having long been recognised as a critical process for the successful adoption
and implementation of information systems, IS evaluation is an area that has received
limited attention. Nevertheless, it has been examined from different perspectives by a
number of researchers. The literature suggests that managers and IS professionals
recognise IT evaluation as one of the concerns of IS management.
Evaluating IS in organisations is not easy; it requires a clear, documented,
systematic, analytical and formal approach (Jones, 2008, p. 241). Moreover, it is
important that attention is given to the purpose, relevance and contribution of the
evaluation. The first step is therefore to understand more about the context in which
the evaluation is taking place (Farbey, Land and Targett, 1993). Stockdale et al.
(2008, p. 36) assert that the purpose of an evaluation tends to be to assess value,
measure success or identify benefits, while for Farbey, Land and Targett (1992), the
role of the evaluation is related to the time and the level at which it is carried out.
Both have a bearing on the questions that need to be answered.
Evaluation, appraisal and measurement are interrelated concepts. Farbey, Land and
Targett, (1999) distinguish between the first and second of these by noting that the
term ‘evaluation’ is often used imprecisely, sometimes referring to an event taking
place at the commencement of a project in order to decide whether it should go
ahead, but usually being reserved for a post-implementation review of benefits
achieved, whereas ‘appraisal’ tends to refer to a decision point. However, in both

Chapter 2: Literature Review 24
Evaluating Stakeholders’ Performance of ERP Systems in Saudi Arabia Higher Education Mona Althonayan
theory and practice, the concept of evaluation is much broader. Farbey, Land, and
Targett (1999) define it as “A process, or group of parallel processes, which take
place at different points in time or continuously, for searching and for making
explicit, quantitatively or qualitatively, all the impacts of an IT project and the
programme and strategy of which it is a part”. Irani and Love (2008) adopt a slightly
simplified version of the same definition.
Alyassen et al. (2008, p. 134) state that the priority in evaluation is to gauge the
direction of the IS project. Using financial and other quantitative estimates,
‘predictive evaluation’ is performed to forecast the impact of the project. Evaluation
provides support and justification for the investment by forecasting the projected
baseline indicators such as payback, net present value or internal rate of return.
‘Formative evaluation’ or, as referred to here, the ‘prior operational use’ form of
evaluation guides the project in important ways and may lead to changes in how the
system is structured and the way in which it functions. It does not, however, give any
feedback beyond the design, implementation and delivery of the project outcome.
Alyassen et al. (2008, p. 135) consider evaluation in terms of the ‘effectiveness’ of
IS. This form of evaluation draws on real rather than projected data and can be used
to justify adoption, estimate the direct cost of IS, estimate its tangible benefits,
ensure that it meets requirements, measure its effectiveness and efficiency, and
measure the quality of programs. This type of evaluation should be performed during
the operational phase of the project. This is referred to as post-implementation
evaluation. Figure 2.1 shows these forms of evaluation with respect to the lifecycle
of a system from inception to the end of its useful life.
On the basis of the definitions above, different aspects of the IS can be evaluated. For
example, Adelakun and Jennex (2002) classify the most prevalent approaches to
IS/IT evaluation into four major categories: (1) financial, usually focused on money
and quantification; (2) functional, the purpose of which is to estimate the complexity
of systems during the development process and determine a cost per unit of
complexity (technical stakeholders often employ this model to evaluate system
development projects); (3) strategic measure, based on the position that strategic IS is
indispensable and hence must be developed; and (4) subjective measure, which
emphasises the value added by IS.
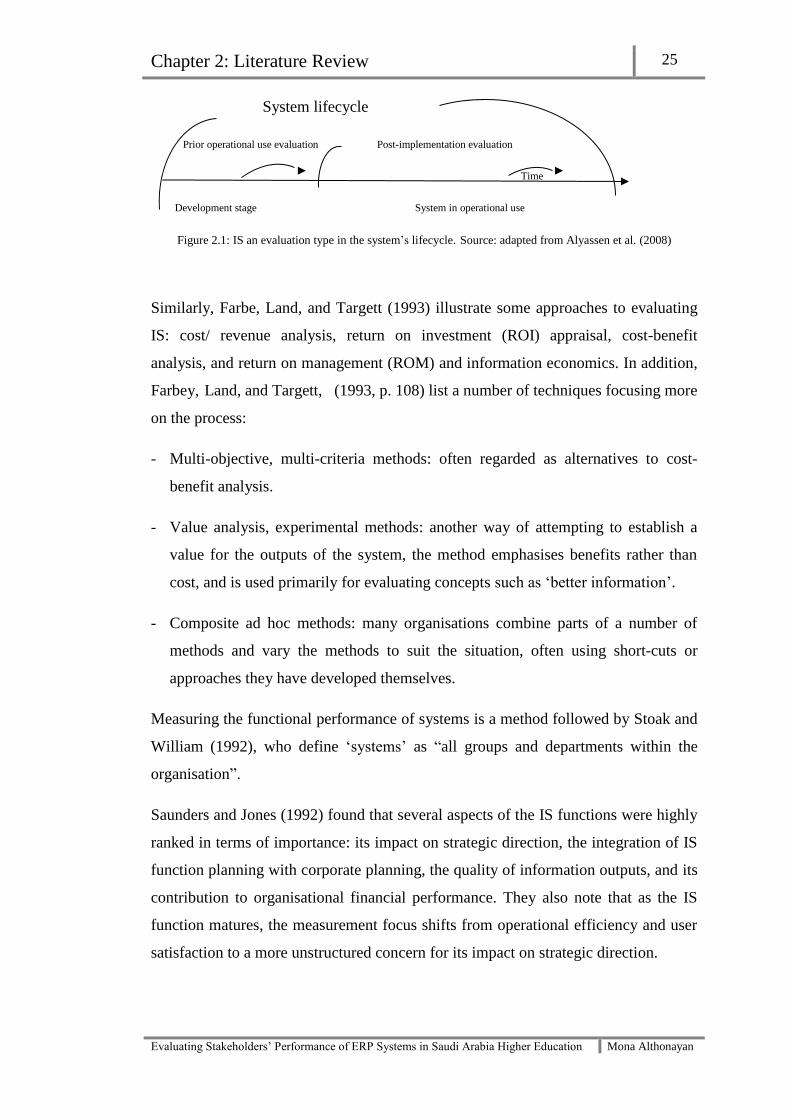
Chapter 2: Literature Review 25
Evaluating Stakeholders’ Performance of ERP Systems in Saudi Arabia Higher Education Mona Althonayan
System lifecycle
Prior operational use evaluation Post-implementation evaluation
Time
Development stage System in operational use
Figure 2.1: IS an evaluation type in the system’s lifecycle. Source: adapted from Alyassen et al. (2008)
Similarly, Farbe, Land, and Targett (1993) illustrate some approaches to evaluating
IS: cost/ revenue analysis, return on investment (ROI) appraisal, cost-benefit
analysis, and return on management (ROM) and information economics. In addition,
Farbey, Land, and Targett, (1993, p. 108) list a number of techniques focusing more
on the process:
- Multi-objective, multi-criteria methods: often regarded as alternatives to cost-
benefit analysis.
- Value analysis, experimental methods: another way of attempting to establish a
value for the outputs of the system, the method emphasises benefits rather than
cost, and is used primarily for evaluating concepts such as ‘better information’.
- Composite ad hoc methods: many organisations combine parts of a number of
methods and vary the methods to suit the situation, often using short-cuts or
approaches they have developed themselves.
Measuring the functional performance of systems is a method followed by Stoak and
William (1992), who define ‘systems’ as “all groups and departments within the
organisation”.
Saunders and Jones (1992) found that several aspects of the IS functions were highly
ranked in terms of importance: its impact on strategic direction, the integration of IS
function planning with corporate planning, the quality of information outputs, and its
contribution to organisational financial performance. They also note that as the IS
function matures, the measurement focus shifts from operational efficiency and user
satisfaction to a more unstructured concern for its impact on strategic direction.

Chapter 2: Literature Review 26
Evaluating Stakeholders’ Performance of ERP Systems in Saudi Arabia Higher Education Mona Althonayan
Serafeimidis and Smithson (2003) state that IS evaluation can be formal or informal,
can use diverse criteria (e.g. financial, technical, social), can follow rigorous
methodologies or ‘gut feeling’, and can often become a political instrument that
influences the balance of organisational power and stimulates organisational change.
In other words, formal evaluation practices are promoted by organisational rules and
structures, informal practices implemented by the stakeholders involved, and finally
academic recommendations, which in many cases recognise the delicate nature of
evaluation, but are not used in practice.
Irani et al. (2002) advocate the decoupling of relative dimensions of the project and
its division into four ranked levels of evaluation: strategic, tactical, operational and
financial. The proposed framework of Peter Irani (2004) is divided into five aspects
of information technology investment, each of which has its own set of objectives
and expectations:
1 Managers of the organisation are interested in the gains (financial and other)
generated by the investment. They seek to ensure that the project is implemented
on time, within budget and according to user requirements.
2 Users’ requirements should be met by the technology while integrating flexibility
to adapt to the changing requirements of users/customers.
3 Project team members (implementers) focus on short-term criteria set by sponsors
(used to judge their performance).
4 Supporters (subcontractors) focus on short-term criteria.
5 Stakeholders (non-benefiting, non-influencing) consist of many groups, each with
its own goals and objectives. They may support or oppose the investment,
possibly in the form of resistance.
If the evaluation of IS investment is purely financial and centred on the use of
traditional appraisal techniques, the process serves only the management objectives.
This means neglecting other objectives and accordingly failing to incorporate
important factors that might affect the willingness of the actors concerned to
cooperate in realising the objective of the investment. Jones (2008, p. 245) refers to

Chapter 2: Literature Review 27
Evaluating Stakeholders’ Performance of ERP Systems in Saudi Arabia Higher Education Mona Althonayan
formal IS evaluation methods that are primarily concerned with monetary costs and
benefits as the mechanistic approach.
Farbey (1992) affirms that multiple evaluation methods or approaches are available,
each with its own characteristics and focus. The first method is ROI, which is based
on evaluating the current value of estimated future cash flows on the assumption that
future benefits are subject to some discount factor. The main strength of this method
is that it permits decision makers to compare the estimated returns on different
investments. Its weakness is that some good investment possibilities are withheld
because the benefits are difficult to assess in cash flow terms.
Cost benefit analysis (CBA) is an approach that attempts to find (or compute) a
monetary value for each element contributing to the costs and benefits of a
development project. The main weakness of classic CBA is the artificiality of some
of the surrogate measures. In practice, the recommendations arising from CBA are
often overturned by decision makers who cannot accept the values assigned by
analysts.
Multi-objective, multi-criteria (MOMC) methods start from the assumption that the
value of a project can be measured in terms other than money. This allows decision
makers to appraise the relative value of different outcomes in terms of their own
preferences: they can rank goals by applying a preference weight to each. Another
way of applying this technique is to provide a scale with which to assess
applications.
Return on management is the value attributable to an information system as an
incremental change to an already established level of management productivity.
Value analysis attempts to evaluate a wide range of benefits, including intangible
ones. The use of experimental methods is a recent development in the context of
project evaluation. Farbey, Land, and Targett (1999) notes that information
economics is a method relying on quantitative assessment of costs, benefits and risks.
There are also ‘softer’ methods for identifying and assessing benefits, including
MOMC methods and those based on modelling and experiment, such as systems
dynamics models.
Chapter 2: Literature Review 28
Evaluating Stakeholders’ Performance of ERP Systems in Saudi Arabia Higher Education Mona Althonayan
In brief, the current and dominant IS evaluation methods are primarily based on
economic and technical factors. However, these are problematic and largely
inappropriate for use in the public sector, because of difficulties in defining
productivity, cost-saving and value in the non-profit sector, where the remit is to
serve the public (Jones, 2008, p. 237). Hence, IS researchers facing a challenge
regarding evaluation: it is difficult and considered problematic. Land (2001) argues
that the problem lies in predicting IS cost, risk, benefits, impact and lifetime. Myers
(1997) argue that IS managers are under pressure to justify the contribution of IS
expenditure to the productivity, quality and competitiveness of the organisation and
that IS evaluation/assessment is thus crucial to provide the feedback needed for the
effective management and continuous improvement of the IS function.
According to Land (2001), there is little agreement amongst researchers and
practitioners as to which approach or methodology is appropriate for IS evaluation,
especially in the public sector. Similarly, Jones (2008, p. 244) reports that many
models have been devised and developed in an attempt to evaluate and measure IS
efficiency and effectiveness in both public and private sector organisations. Irani
(1998) and Land (2001) classify more than 50 methods intended to assist with this
process. Stockdale et al. (2008, p. 36) assert that a major challenge for IS evaluation
is to develop frameworks that are sufficiently generic to be applicable to a wide
range of circumstances, but also sufficiently detailed to provide effective guidance.
Heo and Han (2003) summarise the IS evaluation literature by stating that current
evaluation approaches and practice are based on TQM, information economics,
project management, or cognitive theories. To conclude, it is obvious that IS
evaluation is focused almost exclusively on operational and transactional systems
(Stoak and William, 1992).
Agourram and Ingham (2007) asserts that the problem of measuring IS can be traced
back to many factors. The first is the mixture of technical and social aspects of IS.
Secondly, IS and work practices are now so intertwined that it is difficult to identify
their individual contributions to success. Finally, some researchers link the difficulty
to the methodological aspects of measuring IS success. On the other hand, many IS
observers (Checkland, 1981; Walsham, 1993; Introna, 1997; Mumford and Weir,
1997; Hirschheim and Smithson, 1999; Avison and Elliot, 2006) have argued that ISs

Chapter 2: Literature Review 29
Evaluating Stakeholders’ Performance of ERP Systems in Saudi Arabia Higher Education Mona Althonayan
are predominantly social systems; therefore their social aspects are significant. Some
authors (Hirschheim and Smithson, 1999; Walsham, 1999; Serafeimidis and
Smithson, 2000; Irani, Sharif1, and Love 2005) have also argued that evaluation
would be improved by adopting an approach based on interpreting and understanding
social and organisational aspects of IS.
Therefore, Serafeimidis and Smithson (2003) propose an alternative, interpretive
approach to understanding IS evaluation, based on the notion of stakeholders. Peter
et al. (2004) agree that evaluation must be multifaceted and seek to include the
various stakeholders and to consider their agendas. In other words, a limited
consideration of the organisational and institutional context in which evaluation is
integrated (e.g. the system’s development lifecycle, the IS management practices and
processes), compounded with a limited understanding of stakeholders’ behaviour
(socialisation), leads to mismatches between theory and practice.
Irani (1998) argues that much of the problem lies in the very nature of deploying IT,
as the use of prescriptive appraisal guidelines ignores the wider human and
organisational implications of developing an infrastructure. However, although such
factors are unique to companies, with an appropriate investigative methodology,
much can be researched and extrapolated from the organisation’s idiosyncratic
decision-making processes. This can contribute towards identifying criteria for
making investment decisions, which can be translated into a model that others can
use as a frame of reference.
Treating IS as a technical problem can lead to meaningless conclusions that overlook
the social activity inherent in the evaluation process and ignore the socio-political
environment of an organisation (Stockdale et al., 2008, p. 36). The benefits
associated with IT implementation tend to be qualitative and often intangible.
Consequently, the evaluation process must look beyond a narrow quantification of
cost and benefits to an analysis of opportunities presented by IT together with
potential constraints on its application.
Moreover, Alyassen et al. (2008, p. 135) caution that the study of IS evaluation has
been dominated by a positivist scientific paradigm. The traditional (formal/rational or
functionalist) conception sees evaluation as the external judgment of an IS, which is
treated as if it existed in isolation from its human effects. It also places excessive
Chapter 2: Literature Review 30
Evaluating Stakeholders’ Performance of ERP Systems in Saudi Arabia Higher Education Mona Althonayan
emphasis on the technological and accounting/financial aspects, at the expense of the
organisational and social aspects. In general, attention has been focused over the
years on prescribing how to carry out evaluations, rather than analysing and
understanding their role, interactions, effects and organisational impacts.
Irani (1998) notes that searching for a single ‘best’ appraisal technique that addresses
all project considerations is fruitless, because strategic investments in IT/IS are
aggregates of complexity and notably different from each other. The circumstances
where an appraisal technique would be applied are so wide and varied that no single
method can cope with all or even most of the possible variations. Khalifa et al.
(2001) agree that no single evaluation method can be applied to all situations in the
IT industry, while Farbey, Land, and Targett (1993) suggest that evaluation can
contribute to IT systems when the appropriate method is applied to a given
organisational context.
Many authors argue that an organisation-wide participatory stakeholder analysis is
the first essential step to the formulation of the ‘evaluation party’ and then the
evaluation itself. Most of the techniques described involve a wide range of
individuals (stakeholders) who are involved in the project as sponsors, designers,
implementers, users and operators, as well as those who are affected by the system
under review in a more indirect way. Farbey, Land, and Targett (1993) believe that
all the methods are potentially valuable. The contribution of evaluation as a social
learning mechanism is likely to be significant when objectives are relatively clear. It
is also an opportunity for stakeholders to enhance their common understanding of the
issues, and perhaps to gain new skills and competencies.
It can be concluded from the above discussion that the literature in this field has
focused on the financial and technical aspects of IS evaluation, neglecting the human
aspects. The following section discusses previous work on evaluation in ERP
systems in particular, as well as different aspects of evaluation.

Chapter 2: Literature Review 31
Evaluating Stakeholders’ Performance of ERP Systems in Saudi Arabia Higher Education Mona Althonayan
2.4 Evaluation of ERP systems
Enterprise resource planning systems are complex and comprehensive software
packages designed to integrate business processes and functions. Despite the
difficulties and risks in adopting ERP systems, their use is expanding rapidly.
Therefore, researchers have attempted to find appropriate methods to evaluate them
from various perspectives.
Chen and Lin (2008) identify two broad approaches to ERP evaluation. The first is to
investigate the financial performance of the organisation which has invested in an
ERP system and the second is that favoured by the majority of researchers: to
investigate the manipulations of critical factors/items that can be obtained in various
ways, including by literature review or by questionnaire, using the data envelopment
analysis approach to evaluate the relationship between continuous investment in ERP
and technical efficiency. Chen and Lin (2008) have also utilized regression analysis
to investigate the relationship between efficiency scores and the continuous
investment in ERP, based on the concept of total cost ownership. Another form of
heuristics is the method used in the work of Chand et al. (2005), who provide a
framework based on the balanced scorecard (BSC) to evaluate the strategic
performance of ERP systems. Wieder et al. (2006) conducted a study to identify the
impact of ERP systems from the perspective of business process performance
(organisational performance) by using an IT measure, while Argyropoulou et al.
(2008) introduce a new framework called the ‘six imperatives’, which they claim
provides a solid methodology for the identification and incorporation of the
necessary metrics for the post-implementation review of ERP systems.
Although the above methods were developed to evaluate the performance of ERP
systems, they seldom put emphasis on the extent to which training and user
familiarity with these systems influence their performance. Indeed, as was noted in
the previous section regarding IS evaluation in general, financial and technical
methods are the most popular in ERP systems evaluation. Chun-Chin Wei (2008)
lists various methods that have been applied to evaluate the performance of ERP or
other ISs, including financial analysis. However, financial analysis will seldom
suffice, as it ignores other critical qualitative factors such as the quality of the system
and its impact on the organisation and on individuals.

Chapter 2: Literature Review 32
Evaluating Stakeholders’ Performance of ERP Systems in Saudi Arabia Higher Education Mona Althonayan
According to Beretta (2002), the measurement of the financial returns of this kind of
investments is quite controversial. Despite a number of methodologies proposed to
evaluate ERP based on the calculation of the return on capital employed or on
expected cash flows, all present severe limitations and consistent drawbacks.
Nonetheless, the impact of their implementation on the operating performance of a
company can be appreciated by focusing the measurement process on the
improvements that they produce in the performance of business processes.
The output of an IS or ERP system can be measured in terms of critical success
factors (CSFs) in three areas: technical, effectiveness and users’ experience (Chun-
Chin Wei, 2008). A great deal of effort has been put into the systems and information
quality assessment of IS. Quality assessment reflects the engineering-oriented
performance characteristics of the system itself and the quality of information and
data. Information quality describes the clarity, accuracy, timeliness and content of
the IS. Researchers believe that a thorough system development process leads to a
high quality IS whose use has a positive impact on the organisation (Chun-Chin Wei,
2008).
Despite the ability of the CSF approach to assess ERP systems, it does not guarantee
success or provide a means of evaluation. Al-Mashari, Al-Mudimigh, and Zairi
(2003) believe that ERP projects can be considered successful: (1) where there is a
match between the ERP system and the stated objectives of implementation
(correspondence success); (2) when the system is implemented within time and
budget (process success); (3) when users’ attitudes toward ERP are positive
(interaction success); and (4) where the ERP systems matches users’ expectations
(expectation success). According to Sakris and Sundarraj (2000), strategic systems
need to be evaluated on strategic metrics that are linked to the organisation’s
strategy. Sakris and Sundarraj distinguish between two evaluations—operational and
financial—that organisations may apply, both of which need to be active.
The following section focuses on performance measures of IS, how they have been
investigated and from what perspectives.
Chapter 2: Literature Review 33
Evaluating Stakeholders’ Performance of ERP Systems in Saudi Arabia Higher Education Mona Althonayan
2.5 Performance measures
The terms ‘performance management’, ‘appraisal’ and ‘assessment’ tend to be used
synonymously. Lansbury (1988) presents a comprehensive definition of performance
management as “The process of identifying, evaluating and developing
organisational goals and objectives are effectively achieved, while at the same time
benefiting employees in terms of recognition, receiving feedback, catering for work
needs and offering career guidance”.
According to Beretta (2002), performance measures are relevant both to internal
decision makers (as they supply information that facilitates their decision making and
motivates their actions and behaviour) and to the whole organisation (as they address
people’s efforts in ways that promote the efficiency of the organisation).
Performance measures promote integration by facilitating communication inside the
organisation. They support vertical communication in two ways:
1- The principal, through the choice of performance measures and by determining
their standard value, exercises his/her influence by expressing his/her
expectations.
2- The subordinate can use both the objective-setting and the result measurement
phase in order to build a constructive and living dialogue with his/her principal.
Performance measures can be an important basis for internal discussions.
Performance measures also support horizontal communication, helping members of
certain units to establish useful interaction with units that provide inputs to their
activities, and with the units which are the receivers of their output, so performance
measures are conceived as a signal of requested behaviour and can be powerful
pedagogical instruments to clarify areas of responsibility for different players and
management expectation. They also stimulate players to improve their knowledge of
their sphere of activity and its economic structure. Performance measures contribute
to the accumulation of knowledge, by stimulating learning about how efficiency and
effectiveness can be improved. They also stimulate inquiry by formulating questions,
investigating problems, finding answers, and providing knowledge about the
contribution of each single unit to the firm’s goals. Moreover, they can support

Chapter 2: Literature Review 34
Evaluating Stakeholders’ Performance of ERP Systems in Saudi Arabia Higher Education Mona Althonayan
process management both on the operational side (connecting activities along the
work flow) and on the cognitive side (developing integration knowledge).
According to Umble, Haft, and Umble (2003), evaluation measures must be included
from the beginning of the project. Furthermore, performance measures that evaluate
the impact of the new system must be built carefully; the evaluation should clearly
indicate how the system is performing and encourage the desired behaviours by all
functions and individuals.
Recently, a few popular techniques for measuring the performance of an IS have
been reported. Hagood and Friedman (2002) implemented the BSC measures from
five perspectives strategic planning, finance, customers, internal business and
innovation and used learning-based performance measurement systems to assess the
performance of human resource information systems. Stensrud and Myrtveit (2003)
applied Data Envelopment Analysis to model the productivity measurement of
outstanding ERP projects. Lin et al. (2006) applied statistical methods to ERP
implementation by providing a pair of performance indicators.
As mentioned earlier, previous literature has provided many useful performance
indicator systems for IS performance evaluation. However, the most frequently
adopted performance indicators systems refer to the common indices without
developing tailor-made measures which reflect the objectives of the ERP
implementation project.
Bititci and Turner (2000) propose an integrated performance measurement systems
(IPMS) model to investigate the structure and relationships within performance
measurement systems and claim to have developed a reference model and an audit
method for IPMS. In addition, Bititci and Turner (2000) discuss a number of
performance measurement frameworks and models, such as:
- BSC (Kaplan and Norton, 1996);
- SMART- strategic measurement for world-class manufacturers (Maskel, 1989);
- Performance measurement questionnaire (Dixon et al., 1990);
- Performance criteria systems (Globerson, 1996);
- Cambridge performance measurement design process (Neely et al., 1995);

Chapter 2: Literature Review 35
Evaluating Stakeholders’ Performance of ERP Systems in Saudi Arabia Higher Education Mona Althonayan
- IPMS reference model (Bititci and Carrie, 1998; Bititci, Carrie, and McDevitt
1998a).
Heo and Han (2003) explain how a model was developed and tested to determine
which measures are appropriate in an evolving IS environment. Their objective was
to examine the relationship between IS structure and appropriate measures of IS
evaluation that stem from the rationale of the previous researchers. Chen and Lin
(2008) used a method based on a stochastic-flow network model to evaluate the
performance of an ERP system, depending upon the results of the ERP examination
of the users involved.
Chun-Chin Wei (2008) aimed to construct a framework to elaborate the development
of ERP process improvements and to link the content of ERP performance
measurement with consideration of ERP implementation. The study adopted
performance measures such as data accuracy, believability of output, system
accuracy and usefulness of output from the relevant literature. Many companies
devote their attention to selecting and implementing an ERP system, but then fail to
evaluate the effectiveness of the adopted ERP system. Unfortunately, information
managers are often swamped by the diverse requirements of users, instead of
evaluating the advantages and drawbacks of the ERP system and further improving
its performance.
The reasons why organisations should assess the performance of their ERP systems
are (Chun-Chin Wei, 2008):
- Installing an ERP system requires large investments of money, time and energy.
- The adopted system will influence all future business operations and strategies.
- Implementing an ERP system requires the work process to be customized and
tailored to the business practices of the company.
- A successful system should meet the current and future requirements in a context
of continuous upgrade; consideration of its maintenance is very important.
According to this perspective, instead of aiming at measuring the end result of an
ERP implementation at the bottom line of profit and loss statements, the impact
could be appreciated at the business process level by measuring the improvements
generated along various dimensions of performance (e.g. quality, timeliness and

Chapter 2: Literature Review 36
Evaluating Stakeholders’ Performance of ERP Systems in Saudi Arabia Higher Education Mona Althonayan
efficiency). Sometimes the measured technical improvements after ERP
implementation are quite poor, because ERP systems, like other management
systems such as total quality management (TQM) or ABM, are potential value
generators: their physical implementation is simply not enough to activate their inner
potentialities (Chun-Chin Wei, 2008).
Fraser and Fraser (2003) criticise earlier performance measurement tools that
normally depend on output measures such as completing projects on time or on
budget, meeting sales targets, or fulfilling production quotas. They argue that such
methods are not able to isolate the contribution of individuals from the effect of
inessential variables such as bad weather, market fluctuations or political events.
Ifinedo and Nahar (2007) distinguish between ERP systems and other IT
implementations, noting that ERP implementation has technological, operational,
managerial, strategic and organisational components, so success measurement
models used for the evaluation of other IT systems may not be adequate. Gattiker and
Gattiker and Goodhue (2005) are also concerned with organisational components;
they propose a model focussing on the subunit level of the organisation, assuming
that the impact of ERP systems integration and standardization will be influenced by
the interdependence and differentiation between subunits.
Kvavik et al. (2002) argue that measuring the success of ERP systems goes beyond
simple measures of efficiency, while Rabaa`i, Bandara, and Gable (2009) assert that
evaluating the impact of ERP systems is difficult, as it is often indirect and
influenced by human, organisational and environmental factors. Similarly, Fowler
and Gilfillan (2003) state that measuring the benefits achieved by a completed
project can be problematic, as many of these benefits are intangible and difficult to
quantify. Chien and Hu (2009) conducted a study designed to build a better
understanding of the social factors that contribute to successful ERP implementation
by examining the role that employee self-efficacy plays in ERP effectiveness. They
report that ERP systems training and learning significantly improved ERP
effectiveness.
Heo and Han (2003) assert that it is important to determine empirically the effects of
contingency factors suggested by previous researchers, including several potential
normative factors, such as external environmental variables (industry, competitive

Chapter 2: Literature Review 37
Evaluating Stakeholders’ Performance of ERP Systems in Saudi Arabia Higher Education Mona Althonayan
environment, culture etc.) and organisational variables (mission, size, goal, IS
maturity, structure, evaluator perspective etc.).
2.6 Stakeholders in IS/ERP systems
Freeman (2001) defines a stakeholder as “any group or individual who is affected by
or affects the achievement of an organisation’s objectives”. According to Adelakun
and Jennex (2002), stakeholders can be categorized as either internal or external to
an organisation. The concept thus covers a broad set of groups or individuals,
including customers, suppliers, owners, employees, local people and other private
and public sector bodies in the business environment. Figure 2.2 illustrates the
stakeholder concept.
Figure 2.2: The stakeholder concept. Source: adapted from Nasi (1995)
A large number of studies of IS/ERP systems focus on ‘user satisfaction’ as a
measure of the human aspect of system success; indeed, it has been described as the
most widely used indicator of IS success (Myers, Kappelman, and Prybutok 1997).
As suggested by the difficulties referred to in the previous section, directly
measuring the success of an IS has been found to be unworkable, because of the
intangibility of costs and the difficulty of first recognizing the benefits and then
converting values to their financial equivalent (Holsapple et al., 2005). Therefore,
some researchers have considered user satisfaction to be a good surrogate measure of
IS success (Seddon and Kiew, 1994). However, measuring user satisfaction in the
ERP context requires different methods from those used to develop conventional data
Stakeholders
-To affect and to be affected -Indifferent environment
-Internal, external changes
-Primary, secondary stakeholders -Internal, external conditions
Stakes
-Interest
-Rights -Ownership
Condition/
Rewards
-Money
-Goods -Information
-Status
-Power etc.
Chapter 2: Literature Review 38
Evaluating Stakeholders’ Performance of ERP Systems in Saudi Arabia Higher Education Mona Althonayan
processes; Wu and Wang (2005) distinguish between two main types of ERP system
users: (1) key users, selected from the operating department, generally familiar with
the business and having knowledge of their own domain; and (2) end-users, for
whose requirements the system was ultimately developed. Wu and Wang believe that
key users have a crucial role in the systems’ success. Therefore, they focus on them
to evaluate user satisfaction as means of determining system success, by developing
a set of 21 items in a framework of three dimensions: professional capabilities of
consultants/suppliers, technical competence of contractors/suppliers and training.
It is five decades since Cyert and March (1963) proposed the concept of user
satisfaction as a surrogate of system success (Au, Ngai and Cheng, 2002). According
to Wu and Wang (2006), user satisfaction is the extent to which users believe that the
IS available to them meets their information requirements. It is also assumed that
improved performance will automatically follow if the system meets information
needs. This does not mean that satisfaction causes performance; performance and
user satisfaction are both caused by the extent to which requirements are met.
User satisfaction and usage are still critical issues. Relevant studies have evaluated IS
performance using the experience and perspective of various users, such as
employees, middle managers, top managers and system engineers. Perceived
satisfaction is a dominant requisite for the final success of an IS, including overall
satisfaction, information satisfaction, software and hardware satisfaction and
decision-making satisfaction (Chun-Chin Wei, 2008).
The Bailey and Pearson (1983) model of end-user satisfaction (EUS) is considered
one of the oldest and most frequently used in IS studies. It consists of 39 factors that
contribute to satisfaction with IS. Mahmood et al. (2000) reviewed 45 EUS studies
published between 1986-1998, focusing on the relationship between EUS and nine
variables: perceived usefulness, ease of use, user expectations, users skills, user
involvement in systems development, organisational support, perceived attitude of
top management to the project and user attitude to IS in general. The results of this
analytical study showed a positive impact of all of the variables, but to varying
degrees.
Seddon, Graeser, and Willcocks (2002) conducted a study of IT evaluation and the
benefits that IT provides to the organisation. They elicited the views of 80 senior IT

Chapter 2: Literature Review 39
Evaluating Stakeholders’ Performance of ERP Systems in Saudi Arabia Higher Education Mona Althonayan
managers from Europe (including the UK) about IT evaluation approaches and the
benefits that IT provided for their organisations, using a custom-designed
questionnaire based on three dimensions: evaluating the overall IT portfolio,
evaluating individual projects and applications, and evaluating the IT function.
After reviewing earlier studies and identifying the strengths and weaknesses of
current IS EUS measurements, Au et al. (2002) developed a framework based on the
equity and needs theories. The purpose of this model was to generate reliable and
valid instruments to assess the performance of IS; in other words, to evaluate current
applications rather than to predict behaviour.
Moshe (2003) adopted a different point of view of user satisfaction, examining the
level of satisfaction with ERP systems and comparing them to those obtained in
traditional IS studies. Furthermore, Moshe examined a set of hypotheses regarding
possible relationships between user satisfaction and six user characteristics:
functional department, position in organisational, formal education, age, computer
experience and gender.
Bradley and Lee (2007) chose training to measure one aspect of user satisfaction, by
considering gender, educational level and job type. Moreover, the study conducted
an extension of the technology acceptance model (TAM) for ERP projects,
incorporating satisfaction with training as a factor in perceived ease of use of ERP
systems.
In a continuation of their earlier research and to extend their understanding of the
antecedents of EUS, Au, Ngai and Cheng (2008) propose a new model that integrates
three well-founded theories, namely expectation theory, need theory and equity
theory. The importance of this model is to recognize that each individual has needs
that he or she seeks to fulfil (e.g. work performance, relatedness and self-
development). The authors conducted a survey of workers in the hotel and airline
sector (n=922) and found that IS end-users have different needs, concluding that
earlier studies focusing on the technical aspects of the IS, the employees or the users
might not be sufficient.
Calisir and Calisir (2004) examine several usability factors affecting end-user
satisfaction in the ERP systems environment, including systems capability,

Chapter 2: Literature Review 40
Evaluating Stakeholders’ Performance of ERP Systems in Saudi Arabia Higher Education Mona Althonayan
compatibility, and perceived ease of use, flexibility, user guidance, learnability,
perceived usefulness and minimal memory load. Similarly, Longinidis and
Gotzamani (2009) explore the key factors that constitute users’ satisfaction
(department of employment, formal education, age, computer experience and
gender), in order to determine whether satisfaction with ERP varies according to
users’ profiles.
By integrating the innovation of diffusion theory with the DeLone and McLean
(D&M) IS success model, Hsu, Lai, and Weng (2008) attempt to measure the success
factors for ERP implementation and the extent of user satisfaction in the
measurement of system success. They report three important results concerning the
implementation of ERP systems: (1) user participation and observability strongly
influence user satisfaction; (2) user satisfaction has a strong correlation with
individual performance; (3) individual performance has a positive association with
organisational performance.
To continue their earlier research, Wu and Wang (2006) conducted a study using a
reliable and valid instrument (with 23 items) to evaluate ERP ultimate user
satisfaction, while Aladwani (2003) attempted to identify links between attitude,
behaviour and consistency of assumptions, and to explore their relevance to
information satisfaction.
Despite user satisfaction being widely used by the abovementioned researchers to
evaluate IS success; Doll, Deng, and Raghunathan (2004) argue that characteristics
of subgroups have not been adequately examined. Using their End-user Computing
Satisfaction (EUCS) model, they tested the correspondence of the factor loading and
the structural weight of the subgroups based on the positions of respondents, types of
application, hardware platforms and modes of development.
Users’ adoption is another aspect of the behaviour of IS stakeholders. Beaudry and
Pinsonneault (2005) contend that there is a need to develop a framework able to
integrate approaches to the study of antecedence, behaviours and outcomes of user
adoption. They claim to have taken the study of user adoption a step further by
developing an integrative model, the coping model of user adoption.

Chapter 2: Literature Review 41
Evaluating Stakeholders’ Performance of ERP Systems in Saudi Arabia Higher Education Mona Althonayan
Lim, Pan, and Tan, (2005) conducted a case study of users’ motivational dynamics
from an expectancy perspective, arguing that since researchers are particularly keen
to understand the utilization of ERP amongst organisational members, the study of
their expectations and motivation often remains at a perfunctory level.
Holsapple et al. (2005) empirically studied user characteristics (age, education level,
management level, IS experience) and fitness factors (package localization,
compatibility, task relevance) as determinants of ERP user satisfaction (project team,
product knowledge and involvement).
ERP systems have been studied from other perspectives. For instance, Low and Ngai
(2007) explored the relationships between the extent of business process
improvement (BPI) success and organisational performance, and those between the
outcomes of these initiatives and such organisational factors as strategic intent, as
well as the possible effects of organisational variables on these constructs. Aladwani
(2001) explored yet another aspect of ERP systems, concluding that marketing ideas
and ERP implementation strategies can together help to overcome workers’
resistance to the adoption and use of ERP systems.
Identifying the factors that lead to the success or failure of ERP systems is both
critical and very difficult. Having conducted a case study of four firms which had
implemented ERP systems, Motwani, Subramanian, and Gopalakrishna (2005)
suggest that a cautious, evolutionary, bureaucratic implementation process, change
management, network relationships and cultural readiness can all have positive
impacts on ERP implementation.
Having reviewed the relevant literature on social aspects of IS, it remains to highlight
the gaps. There is a shortcoming in the IS literature regarding user/stakeholder
performance. On the basis of the discussion above, there is need for more focus on
the social aspects in evaluating ERP systems; this is crucial not just from the
satisfaction point view, but also from the stakeholders’ performance perspective.
Chapter 2: Literature Review 42
Evaluating Stakeholders’ Performance of ERP Systems in Saudi Arabia Higher Education Mona Althonayan
2.7 Stakeholders’ Evaluation
There is a broad divergence of views in the literature as to who should be considered
stakeholders. Different researchers and practitioners use stakeholders’ analysis for
different purposes in different contexts. Thus, in education, Seng, and Leonid (2003)
argues that it is difficult to identify a unique role for a given group of people. For
example, students are sometimes seen as stakeholders because of their participation
in learning, while graduates are considered products/services of the education
process. However careful and detailed the approach to identification of stakeholders,
it will eventually come up with different groups, depending on which organisations’
or systems’ stakeholders one seeks to identify. The domain in which an organisation
or system operates will also determine to some extent the set of stakeholders.
Freeman (1984) and Eden and Heijden (1993) use the concept of stakeholders
primarily as a tool for examining the external environment of a given organisation;
this is expected to assist managers with strategic decision making.
The use of the term ‘stakeholder’ in the information systems field is relatively recent;
therefore there is some confusion about the notion in IS research (Pouloudi, 1999).
Nevertheless, the need to involve certain types of stakeholders in IS decision making
has been emphasised in the literature for some time. Among the important categories
referred to in the IS literature are primary stakeholders, internal stakeholders, system
suppliers and user groups, because IS is at the centre of their attention. Pouloudi and
Whitley (1997) state that the difference between the participants in the IS
development process and stakeholders is that the former are taken to be individuals,
groups or organisations who take part in a development process, whereas the latter
includes participants whose actions can influence or be influenced by the
development and use of the systems, whether directly or indirectly.
The most fundamental aspects of IS are the gathering and validating of requirements.
Requirements can be seen as applying to one of two domains: the technical and the
social. IS stakeholders may be involved with different aspects, such as development
or satisfaction (Blyth, 1999). Fowler and Gilfillan (2003) state that it is important to
clearly identify the stakeholders in any IS project and to ensure that their needs are
met. Similarly, Ballejos and Montagna (2008) state that stakeholders are the first
emerging challenge in any software project. In addition, they make an active

Chapter 2: Literature Review 43
Evaluating Stakeholders’ Performance of ERP Systems in Saudi Arabia Higher Education Mona Althonayan
contribution to the elicitation, analysis and communication of requirements, since
they have valuable knowledge. Therefore, identification is a critical factor in success.
Improving human performance in organisational tasks remains a primary goal for
modern organisations in order to increase competitiveness. They therefore expend
considerable resources on improving employees’ task and job performance (Marshall
et al., 2002). Despite the attempts of previous studies to show the important role of
evaluation from the perspectives of different people (Matin, 1977; Hamilton and
Charvany, 1981; Wilkes and Dickson, 1987), Stoak and William (1992) contend that
IS evaluation from the ‘people’ perspective is insufficient, because (for example)
managers in different functional areas and at different organisational levels have
divergent perspectives on IS performance.
Preston and Sapienza (1990), Freeman (1993), Goodpaster (1993), Jones (1995) and
others argue that stakeholder analysis is an ethical alternative to serving exclusively
the interests of an organisation’s shareholders. Wood et al. (1995) recommended the
use of stakeholder analysis in combination with other analytical approaches as part of
an interpretive framework for business process re-engineering. According to
Pouloudi (1999), the IS literature concentrates on how stakeholder analysis can
support planning and strategy formulation or the successful development or
implementation of information systems. It often emphasises communication
problems within the organisational environment; hence many authors refer to the
different objectives of systems developers and other user groups (the stakeholders)
that they consider.
Park, Suh, and Yang (2007) examine the effect of the absorptive capacity of users on
their use of ERP in a Korean context. The propose five measures of improved
performance when using an ERP system: the degree of improvement in job
performance, enhancing the speed of task performance, enhancing job productivity
and making it easier to perform tasks, in addition to the degree of overall satisfaction
with the system. Taking a rather different line, Zhang et al. (2005) assert that the
success of ERP implementation can be measured in four dimensions: user
satisfaction, individual impact, organisational impact and intended business
performance improvement. According to Chang et al. (2008), the methods for
evaluating ERP performance are limited by the departments of the company. They

Chapter 2: Literature Review 44
Evaluating Stakeholders’ Performance of ERP Systems in Saudi Arabia Higher Education Mona Althonayan
therefore propose a conceptual model to evaluate the performance and competitive
advantage associated with ERP systems from a supply chain management (SCM)
perspective.
Ifinedo and Nahar (2006) conducted research in two small Northern European
countries to investigate the measurement of ERP success from the perspective of top
and middle managers, adapting the model of Gable Sedera, and Chan, (2003), adding
the notion of workgroup impact derived from Myers, Kappelman, and Prybutok
(1996) and incorporating a novel dimension: vendor/consultant quality. Using a
hierarchical analytic process, Islam and Rasad (2005) conducted an evaluative study
of a service company to evaluate employee performance based on the criteria of the
quality and quantity of work, planning and organisation, initiative and commitment,
teamwork and cooperation, communication, and external factors. Wang and Huang
(2006) offer evidence from an empirical study of how engineers evaluate project
success and to what extent key project stakeholders’ performance correlates with
project success. The results show that engineers use relations with key stakeholders
as the most important criterion of project success and that stakeholders’ project
performances positively correlate with each other.
Albeit the study of Abreu and Conrath (1993) is considered old, their integrating
framework of IS implementation success remains significant. The uniqueness of this
framework is its focus on stakeholders’ expectations as predictors of IS
implementation outcomes. The framework underpins the literature on IS
implementation, especially those studies that explain or predict the outcomes of this
process. Its authors attempt to integrate the existing research streams of factor
studies, process studies and expectancy studies. Their model uses a multi-perspective
approach, taking into consideration different stakeholders’ views of the process.
Fraser and Fraser (2003) conducted a study using a multi-rater evaluation method
known as 360-degree feedback, which was developed from an innovative technique
administrated only to the most senior levels as a must-have tool for integration into
overall performance and human resources management strategy (Church and
Bracken, 1997). The 360-degree feedback method has been extensively used in
research and practice for measuring managers’ performance. It is efficient and
equitable, and is becoming increasingly widespread (Fraser and Fraser, 2003), being

Chapter 2: Literature Review 45
Evaluating Stakeholders’ Performance of ERP Systems in Saudi Arabia Higher Education Mona Althonayan
considered one of the more promising approaches to assessing subjective
competencies (Wood et al., 2004). This method is widely used to evaluate
managerial aspects of stakeholders’ performance, but not to measure that of
stakeholders in IS/ERP systems.
Boonstra (2006) asserts that “information systems are both a product of human
action and an influence on human action. People initiate, design, and use an IT
system”. Therefore, it would be of interest to study how the outcome of ERP
implementation can affect the interests of ERP stakeholders and how they might
react by influencing the project. Ifinedo and Nahar (2007) measured ERP success by
focusing on the utilization of the ERP systems to enhance organisational
effectiveness from the perspective of the two key organisational groups: business
managers and IT managers/professionals. Mehlinger (2006) observes that numerous
ERP system implementations have been unsuccessful in the past few years due to
poor preparation, planning and resistance to change. Moreover, lack of evaluation in
the post-implementation phase, of both technical and social aspects, has been highly
problematic.
2.8 ERP systems in higher education
Among the major challenges facing the HE sector has been that of updating its
systems in line with the development of new technology. Meanwhile, one of the most
noteworthy aspects of current ERP use is that it is much more than manufacturing
resource planning, having become popular with non-manufacturing operations in
service organisations such as universities, hospitals and airlines, where both the back
and front office are important, as are efficiency and effectiveness (McGaughey and
Gunasekaran, 2008).
Lockwood (1985) lists some similarities and differences between universities and
business organisations, which include: complexity of purpose, limited measurability
of output, autonomy and dependency from wider society, diffuse structure of
authority and internal fragmentation. The author classifies universities as
organisations, facing the same problems as any other, such as co-coordinating
resources, controlling costs, and simulating and facilitating enterprise among staff.

Chapter 2: Literature Review 46
Evaluating Stakeholders’ Performance of ERP Systems in Saudi Arabia Higher Education Mona Althonayan
In a university, there are multiple users of an ERP coming from varied backgrounds
with different goals and approaches to practice, including different epistemic
cultures. In Wagner and Newell’s study (2004), users included both dispersed faculty
members and central administrators. Hence, the study contrasted the cultures of
administration (both central and departmental) and faculty as the newly developing
ERP systems were implemented. This proved difficult, because of the variety of
cultures present in this context, rendering it challenging to suit the different purposes
and agendas of all the different stakeholders (Wagner and Newell, 2004).
According to Wagner and Newell (2006), the university context is a valuable
analytical focus for the study of ERP, because its structure is designed to meet the
needs of multiple stakeholders. Historically, a plethora of functional information
systems existed throughout universities with limited standardization of data, which
required aggregation and consolidation for university-wide reporting. This context
creates challenges to the adoption of an interested ERP.
Despite the similarities and differences between universities and business
organisations, over the past decade ERP systems have played a remarkable role in
both, in the recent history of IT management in higher education and in the history of
HE itself (Kvavik et al., 2002). According to Cameron (2008), today’s globally
competitive environment requires technical professionals to move beyond technical
expertise and contribute to the strategy and development of dynamic IT systems that
are able to support the chaining of business objectives. Thus, Spathis and Ananiadis
(2005) report that universities have recently turned to ERP systems as a means of
replacing existing management and administration computer systems. Kitto and
Higgins (2010) specify that such systems are aimed primarily at mitigating risks
while simultaneously enabling universities to remain competitive in a global HE
marketplace. The consequent difficulties in implementing ERP systems in HE has
led to a focus on SCM to help the education system reduce or close the existing gap
between its outcomes and job market needs (Alturki, Duffuaa, S., Demiral, 2008).
Zornada et al. (2005) assert that due to the increasing number of higher education
institutions (HEIs), there is a need to introduce ERP systems in order to improve
their operations and make them manageable and more transparent. ERP vendors are
aware of this fact, which is why they have already expanded their solutions in order

Chapter 2: Literature Review 47
Evaluating Stakeholders’ Performance of ERP Systems in Saudi Arabia Higher Education Mona Althonayan
to satisfy the needs of HEIs. The purpose for an HEI of implementing an ERP system
is to develop the direction of support for key administrative and academic services.
Moreover, ERP usually supports minimal student administration (enrolment
procedures and student enrolment, financial support for students, students’ data etc.),
human resource management (monitoring of employees) and finance (accounting,
payments, investments, budget etc.). By implemented such a system, users expect to
improve organisational efficiency and consequently to improve quality, productivity
and profitability. Kitto and Higgins (2010) contend that ERP systems play a specific
and important role in government within the HE sector; their study explores the
implementation of a type of ERP software in online educational technology at an
Australian university.
According to Rabaa`i, Bandara, and Gable (2009a), the main advantages of ERP for
HEIs are: (1) improved information access for planning and managing the institution;
(2) improved services for the faculty, students and employees; (3) lower business
risks and (4) increased income and decreased expenses due to improved efficiency.
The benefits of ERP are also the topic of a study by Spathis and Ananiadis (2005),
based on users’ expectations and perceptions, focusing on three dimensions in the
following order: managerial, operational and IT infrastructure. The research
concerned the impact in relation to accounting information and management of an
ERP system implemented at a large public university in Greece.
Indeed, numerous studies have explored the advantages for administrative systems
infrastructure to be gained from ERP, identifying criteria that need to be met by
administrative systems in terms of computing infrastructure in order to enable
successful adoption (ECAR, 2002; Pegah et al., 2003; Bologa and Romania, 2007;
Lupu et al., 2008). According to these studies, the main advantages of implementing
ERP in HEI are:
- Improved information access for planning and managing the institutions.
- Improved service for the faculty, students and employees.
- Increased income and decreased expenses due to improved efficiency.
- Secure data from the top security risks.
- Unlimited access to authorized users.
- Maintainability of the system.

Chapter 2: Literature Review 48
Evaluating Stakeholders’ Performance of ERP Systems in Saudi Arabia Higher Education Mona Althonayan
- High performance and reliability.
- Scalability/adaptability.
- Unifying information and processes related to students, faculty and staff.
- Better decision making.
- Meeting compliance and governance.
- Promoting relationships.
- Providing greater flexibility to users.
- Easier and quicker access to data for reporting and decision making.
Correspondingly, Swartz and Orgill (2001) summarise the advantages of
implementing ERP in higher education as improved access to information, improved
workflow and efficiency, and the ability to improve controls and to programme
alerts. They add that an exciting development in modern ERP systems is the
availability of easy-to-use web interfaces. Finally, they note that ERP helps the
individual within the project to develop a new work ethic and to disseminate positive
attitudes in the workplace. Therefore, universities have focused their efforts on
implementing ERP systems in response to calls for HEIs to improve operational
efficiency, to reduce duplication of resources by implementing advanced information
systems that span the institution and improve processes, to address the growing
governmental information requirements and to improve competitiveness (Allen, Kern
and Havenhand, 2002).
In a case study of Cranton University, Kittner and Slyke (2000) assess the
importance of IT support for both the academic and the administrative functions of
the university. In another study, Klaus, Rosemann and Gable (2000) argue that the
importance of ERP systems to academia lies in supporting communication amongst
researchers and practitioners, informing the development of teaching materials on
ERP and related concepts in university curricula and in commercial education and
training, and improving communication with clients, consultants and vendors.
Allen, Kern, and Havenhand, (2002) adopt Holland and Light’s CSF model to
investigate whether ERP systems offer a feasible IS strategy for HEIs, considering
four in-depth case studies conducted in HEIs that were in the process of
implementing ERP systems. Atari et al. (2008) also report a study of ERP systems in
higher education and propose a model for higher education to emulate business

Chapter 2: Literature Review 49
Evaluating Stakeholders’ Performance of ERP Systems in Saudi Arabia Higher Education Mona Althonayan
SCM. Their study focuses on the role of SCM as a solution for the HE system to
reduce or close the existing gap between its outcomes and job market needs. In
related work, Sabau et al. (2009) propose a framework to examine the technical
aspects of the application of ERP systems in Romanian universities. Another such
framework is that developed by Fowler and Gilfillan (2003), designed to help and
guide HEIs in improving the implementation and development of large and complex
ERP systems. Their aim was to provide general guidance and links for co-operation
between different stakeholder groups involved in such efforts, including senior
university management, project teams and systems vendors. Hayes and Utecht
(2009) also conducted a case study of the implementation of an ERP system by a
university, measuring the return on investment in an HEI and managing
organisational change. Taking Monash University in Australia as a case study, Seng
and Leonid (2003) present their model developed for process-oriented HEIs and
discusses the implications for information support in this environment. The elements
of this model consist of stakeholders and their objectives, resources and
products/services.
Bradley and Lee (2007) note a lack of existing studies examining the effectiveness of
training and education in ERP systems, responding with another case study, of a mid-
sized university, to explore the importance of training and to investigate the
relationship between training and satisfaction on one hand and perceptions of use,
usefulness, effectiveness and efficiency on the other. They argue that universities
face many of the same problems as for-profit organisations in installing ERP, such as
coordinating resources, controlling costs and facilitating enterprise among staff.
Many universities turn to ERP systems to improve efficiency and responsiveness to
student needs; HEIs are no more exempt from implementation difficulties than
conventional business organisations. An earlier study by Pollock and Cornford
(2004) of a particular case in the UK focuses on how the development,
implementation and use of both general and university-specific functionality are
mediated and shaped by fundamental and long-standing tension within universities.
These authors also attempt to demonstrate the value of discussing the similarity of
relationships involving universities and other organisations.

Chapter 2: Literature Review 50
Evaluating Stakeholders’ Performance of ERP Systems in Saudi Arabia Higher Education Mona Althonayan
Bologa et al. (2009) classify the success of ERP implementation under two headings:
internal, related to the duration, costs and scope of the implementation, and external,
oriented towards increasing client satisfaction and systems quality. In contrast to the
two studies reported in the previous paragraph, they point to significant differences
in implementing ERP systems between industry and universities, including those
regarding communication structures, management involvement, organisation,
implementation team competences, legacy systems, user training, interdepartmental
communication, supplier/customer partnerships and external consultants.
Notwithstanding such differences, the authors conclude that the success of any ERP
implementation project is represented by delivery on time and on budget.
Wagner and Newell (2004) analyse the strategic partnership between a multinational
software vendor and a university, which together designed a ‘best practice’ ERP
package for the higher education sector. One of the purposes of this study was to
explore the gap between the adopted theory of software design and its use within an
organisation over time.
According to Jorgenson, Ho, and Stiroh (2003), based on data on the sources of
growth for the US economy between the period 1977-2000, economic growth is
controlled by investments in IT and education, both for individual industries and the
economy as a whole. Moreover, there is a jump in IT investment and gains in the
employment of college-educated workers.
Okunoye and Folick (2006) focus on the pre-implementation phase of ERP systems
in HE, using the case study of Agora University, covering the key stages of
implementation. Particular emphasis is given to the selection of the ERP systems and
the organisational dynamics involved. The aim of a study by Rabaa`i, Bandara, and
Gable (2009a) was to advance understanding of the phenomena of ERP adoption and
evaluation in HE in the Australasian region. It presents a descriptive case study
conducted at Queensland University of Technology and covering many aspects,
including ERP selection, customisation, integration, evaluation and the role of
consultants in the HE sector. Mehlinger (2006) chose a higher education setting for
their study of the successful adoption of ERP systems from the perspective of the
characteristics of transformational leadership theory and its significance in predicting

Chapter 2: Literature Review 51
Evaluating Stakeholders’ Performance of ERP Systems in Saudi Arabia Higher Education Mona Althonayan
performance within an organisation. They found that the use of transformational
culture was a predictor of the level of success of an ERP implementation.
A few researchers have focused on ERP systems in HEI from the perspectives of
curriculum, students and teachers (e.g. Waston, 1999; Cameron, 2008). Value on
investment (VOI) is a new research tool in the HE sector, pioneered by Norris
(2003), which measures the total value of ‘soft’ or intangible benefits derived from
technology initiatives in addition to the ‘hard’ benefits measured by ROI. VOI is
critical to the kinds of competitive differentiation that will be important to colleges
and universities over the coming years.
The modules usually included in university ERP systems are illustrated in Figure 2.3,
taking as an example SAP for HE.
Figure 2.3: Process in SAP for HEI and research. Source: Bologa and Romania (2007)
Moon (2007), having reviewed work published between January 2000 and May 2006
about ERP systems in various journals, reports that there is a lack of publications on
ERP systems in education. He argues that given the existence of some vendor-
sponsored university programmes, a significant amount of experience must have
Higher
Education ERP
Procurement
Business service
Student lifecycle
management
Grants and finds
management
Governance
and
compliance
Relationship management,
institutional development
and enrolments and
management
Performance
management
Human capital
management
Financial management
budgeting and planning
Enterprise asset
management
Chapter 2: Literature Review 52
Evaluating Stakeholders’ Performance of ERP Systems in Saudi Arabia Higher Education Mona Althonayan
been collected; however, he concludes that it might take some time for teachers and
scholars to reflect on their experiences and start publishing.
Similarity, Esteves and Pastor (2001) present an annotated/interpreted bibliography
of the important journals and conferences concerning IS during the period 1997-
2000. They provide a brief summary with complete references for 189 articles and
classify the publications into phases; for example, general, adoption, acquisition,
implementation, usage, evolution, retirement and education. They note the number of
publications in each category as a percentage. The authors report that the number of
publication phases is greater than the number of other phases. Furthermore, the study
reveals a serious lack of publications concerned with stakeholders’ performance.
Finally, a high proportion of publications related to university education focused on
aspects of teaching and the curriculum. Genoulaz and Millet (2005) present an
analysis of the ERP literature for the period 2003-2004 and identify six categories of
topics: implementation of ERP systems, optimisation of ERP, management through
ERP, the ERP software, ERP for supply chain management, and case studies. To
summarise, Bologa et al. (2009) argue, based on the previous literature, that
organisational aspects are more important than technological aspects.
Chae and Poole (2005) note that ERP design and implementation in HE is
challenging and complex, due to unique factors in the public sector, including state
mandates and requirements. Similarly, Wagner and Newell (2006) argue that despite
the importance of implementing ERP systems, organisations doing so face serious
challenges, which are associated with high levels of failure. They take a narrative
approach to their study of the implementation of the IVY system in one of the largest
universities in the USA, focusing on controversial episodes during the IVY
implementation and on what helped to move the stalled project forward. Rabaa`i,
Bandara and Gable (2009a) also notes the difficulties and high failure rate in
implementing ERP systems in the HE environment which are cited in the literature.
Moreover, the critical success factors in ERP systems in HE are also limited.
Rabaa`i, Bandara and Gable (2009a) aims to contribute to developing the
understanding of ERP implementation in HE and of evaluation in HE to fill this gap
and to guide researchers and practitioners who seek to identify the reasons for the

Chapter 2: Literature Review 53
Evaluating Stakeholders’ Performance of ERP Systems in Saudi Arabia Higher Education Mona Althonayan
failure of ERP systems. Umble, Haft, and Umble (2003) summarise the reasons for
project failure in ten categories:
- Strategic goals are not clearly defined.
- Top management is not committed to the system.
- Implementation project management is poor.
- The organisation is not committed to change.
- A great implementation team is not selected.
- Inadequate education and training results in users being unable to satisfactorily
run the system.
- Data accuracy is not ensured.
- Performance measures are not adapted to measure the organisation change.
- Multi-site issues are not properly resolved.
- There are technical difficulties.
Park, Suh, and Yang (2007) support users’ demand for customisation, especially
when their tasks and business processes are different from those of the standardised
package.
2.9 ERP systems in Saudi Arabia
During the last decade in the KSA, ERP systems have been established in many
different organisations in both the private and public sectors. Some have simply
implemented packaged software systems (e.g. SAP, ORACLE, PeopleSoft), while
others have developed new local ERP systems (e.g. MADAR).
Some researchers in Saudi Arabia have focused on the area of ERP systems and their
investigations in this field have emphasised the general technical aspects (e.g. Al-
Mashari, 2001; Al-Mashari, 2003; Al-Mashari and Al-Mudimigh, 2003; Al-Mashari
and Zairi, 2006; Al-Mudimigh, Zairi and Al-Mashari, 2001). On the other hand,
researchers at King Saud University (KSU) have devoted particular efforts to
developing and implementing a local ERP system called MADAR. Prof. Abdullah
Al-Mudimigh, as project manager, has co-authored several papers on the project (Al-
Mudimigh and Ullah, 2001; Al-Mudimigh and Ullah, 2011; Al-Shamlan and Al-

Chapter 2: Literature Review 54
Evaluating Stakeholders’ Performance of ERP Systems in Saudi Arabia Higher Education Mona Althonayan
Mudimigh, 2011; Al-Mudimigh and Ullah, 2009; Al-Hossan, Al-Mudimigh, 2011;
Al-Mudimigh, Ullah, Saleem and Al Aboud, 2009). Therefore, based on the above
literature analysis, there appears to have been a shortage in Saudi Arabia of ERP
system evaluations from the stakeholders’ perspective, as of the time at which the
present evaluation was conducted.
2.10 Gap in ERPs performance evaluation, stakeholders’ prospective
The reviews of the relevant literature in this chapter and the next highlight some of
the gaps in the field of ERP evaluation studies in higher education from a stakeholder
perspective that this thesis aims to tackle. While there are available models for
measuring / evaluating IS, most of these have been used on technical rather than
social aspects.
Almshari (2002) asserts that having ERP systems frequently topping the list of
themes in major academic IS studies reflects the dire need for research in this rapidly
field. Indeed, as ERP systems continue to spread more widely, the need for new
research to address various issues in this context has become even more urgent. In
addition, Howcroft and Wagner (2004) emphasise that it is essential to focus research
on the design, implementation, use and evaluation of ERP systems within and across
contexts. Thus, researchers should examine the ways that such systems are shaped by
individuals and groups as well as by organizational and social structures and cultures.
Therefore, there is no doubt that concentrating on these aspects will affect the
development and use of ERP, which will shape the behaviour and attitudes of the
stakeholders.
On other hand, Khalifa et al. (2001) argue that there is sufficient evidence in the IT
literature to suggest that IT system users are excluded from the evaluation process,
especially when traditional methods focus on technical factors and direct costs rather
than on human aspects. Therefore, researchers like Pouloudi and Serafeimidis (1999)
argue for matching the IT evaluation approach with the culture of the organisation in
order to achieve successful development of systems in line with the needs of
stakeholders as individuals, groups, organisations and societies.
A review of the literature also suggests that most existing ERP research focuses on
selection and implementation, not on post-implementation impact, although a

Chapter 2: Literature Review 55
Evaluating Stakeholders’ Performance of ERP Systems in Saudi Arabia Higher Education Mona Althonayan
number of studies suggest that ERP systems go through a post-implementation
breaking-in phase, in which the organisation may not experience the hoped-for
performance. However, the ultimate impact of ERP systems on organisations once
implemented and ‘shaken down’ has not been as thoroughly researched (Gattiker and
Goodhue, 2005; Somers, Nelson, and Ragowsky 2000).
Despite the fact that ERP has been developed, evolved and implemented around the
world for almost two decades, Helo, Anussornnitisarn and Phusavat (2008) note that
there are still many recently published reports of difficulties in its implementation.
Many have reported that ERP implementations failed to achieve the organisation’s
targets and expectation, because a project is not complete without post-
implementation evaluation (Finney and Corbett, 2007).
Consequently, Spathis and Ananiadis (2005) identify the under-representation and
inadequacy of performance evaluation in IS in general and ERP systems in
particular, in both public and private sectors. Advancing the field of IS/ERP
evaluation requires giving appropriate attention to the evaluation of stakeholders’
performance and developing a framework for the post-implementation phase.
Tables 2.2, 2.3 and 2.4 list more than 150 studies extracted by the researcher from
the body of previous research into ERP systems, showing the different aspects
investigated in studying various related topics ERP system. In particular, Table 2.2
highlights the lack of literature on stakeholders’ performance evaluation, while Table
2.3 shows an obvious gap in post-implementation studies. Table 2.4 offers examples
of ERP systems in higher education in general and KSA in particular. This a brief
review of the literature shows that there is a gap, which the present study seeks to
address.

Chapter 2: Literature Review 56
Evaluating Stakeholders’ Performance of ERP Systems in Saudi Arabia Higher Education Mona Althonayan
Table 2.2: Examples of technical, social and financial aspects investigated in studies of ERP systems
in the literature
ERP systems evaluation Visionary
Technical Al-Mashari et al., (2002); Rosemann, (1999); Calisir and Calisir, (2004);
Strong and Volkoff, (2010); Shehab et al.,(2004); Helo, (2008);
McGaughey, (2007); Elmes, (2005); Nah, (2001); Shehab et al., (2004);
McGaughey and Gunasekaran (2008); Chun-Chin Wei (2008); Umble et
al., (2003); Stensrud and Myrtveit, (2003); Chen and Lin, (2008); Chang
et al., (2008); Sabau et al., (2009); Al-Mashari,(, 2001); Al-Mashari,
(2003); Al-Mashari and Al-Mudimigh, (2003); Al-Mashari and Zairi,
(2006); Al-Mudimigh, Zairi and Al-Mashari, (2001); Olhager and
Selldin(2003); Luo and Strong (2004); Volkoff et al (2005);Beretta,
(2002); Stefanou, (2001); Aral et al.,(2006);
Social
Satisfaction:
Wu and Wang, (2005); Wu and Wang, (2006); Moshe, (2003); Bradley
and Lee., (2007); Calisir and Calisir, (2004); Longinidis and Gotzamani,
(2009); Hsu et al., (2008); Aladwani, (2003); Ozen and, Basoglu., (2006);
Hess and Hightower, (2002); Somers et al., (2003); Rodecker and Hess,
(2001); Roses, (2011); Hsu et al., (2008); Longinidis and Gotzamani,
(2009); Zviran, (2003); Verdaasdonk and Oomen, (2001).
Stakeholders’ role in ERP system efficiency:
Chien and Hu, (2009); (utilization of the ERP systems) Ifinedo and
Nahar, (2007); explains the complexity of an (ERP) to general and project
managers, Marnewick and Labuschagne, (2005); reasons of lack of
success Skok and Legge, (2002).
Stakeholders’ performance evaluation:
Evaluate employee performance based on the criteria of the quality and
quantity of work, Islam and Rasad, (2005); ERP success from the
perspective of top and middle managers, Ifinedo and Nahar, (2006);
impact individual performance when using (ERP) systems, Kositanurit et
al., (2006).
Financial Chen and Lin, (2008); Wieder et al., (2006); Beretta, (2002); Fraser and
Fraser, (2003); Sakris and Sundarraj, (2000); Nicolaou and Bhattacharya,
(2006); Hunton et al., (2003); Wei et al., (2005); Cebeci, (2009); Nicolaou
and Bhattacharya, (2006); Hunton, (2002); Hendricks et al., (2007); Bingi
et al., (1999); Hayes et al ., (2001); Themistocleous et al., (2001);
Source: Originated by the researcher

Chapter 2: Literature Review 57
Evaluating Stakeholders’ Performance of ERP Systems in Saudi Arabia Higher Education Mona Althonayan
Table 2.3: Examples of pre-implementation, implementation and post-implementation aspects used in
studying ERP systems in the literature
Source: Originated by the researcher
ERP systems implementation
Pre- implementation Helm et al (2003); Olhager and Selldin (2003); Mandal (2003); Mabert
et al (2003).
Implementation Motwani et al., (2005); Aladwani, (2001); Low and Ngai., (2007); Yusuf et al., (2004); Umble et al., (2003); Mandal, (2003); Rajagopal,
(2002); Chang et al., (2000); Mabert et al., (2003); Aladwani, (2001);
Gyampah and Salam, (2003); Genoulaz and Millet, (2005); Zhang, et
al., (2003); Nah and Zuckweiler, (2003); Somers and Nelson,(2001);
Nah and Lau,(2001); Shanks et al., (2000); Sun et al., (2005); Olhager
and Selldin., (2003); Tsai et al., (2005); Murray and Coffin, (2001);
Donovan, (2001); Willis and Brown, (2002); Plant and Willcocks,
(2007); Joseph and Li, (2008); Osman et al., (2006); Esteves and
Pastor., (2001); Bhatti, (2005); Woo, (2007); Kamhawi, (2007);
Bradley,(2008); Kim et al., (2005); Françoise and Bourgault, (2009);
Bradford and, (2003); Al-Mudimigh, (2001); Fok et al., (2010);
Lapiedra et al., (2011); Ahmed et al., (2006).
Post- implementation Argyropoulou et al., (2008); examines the long-term financial
performance, Nicolaou and Bhattacharya, (2006); operating
effectiveness aspects Chian-Son Yu, (2005); Training users is critical
to the success of ERP, Scott, (2001).
Critical Success Factors Finney and Corbett, (2007); Møller, (2005); Motwani et al., (2005);
Umble et al., (2003); Mandal, (2003); Nah and Lau, (2001); Bingi et
a.l., (2006); Akkermans and Helden, (2002); Genoulaz and Millet,
(2005); Shanks et al., (2000); Somers and Nelson,(2001); Nah and
Zuckweiler, (2003); Zhang, et al., (2003); Sun et al., (2005); Tsai et
al., (2005); Murray and Coffin, (2001); Plant and Willcocks, (2007);
Allen et al., (2002); King and Burgess, (2006); Sumer, (2000); Soliman
et al., (2001); Huang et al., (2004); Soja, (2006); Plant and Willcocks,
(2007); Jarrar et al., (2000); Ngai, et al., (2008); Osman et al., (2006);
Mutschler and Reichert (2008); Esteves and Pastor (2001); Bhatti
(2005); Woo, (2007); Kamhawi, (2007); Olson and Zhao, (2007);
Sánchez, (2007); Gargeya and Brady, (2005); Willcocks and Sykes,
(2000); Bradley, (2008); Ehie and Madsen, (2005); Al-Fawaz et al.,
(2008); Lu et al., (2006); Spathis, (2003); Mashari et al., (2006);
Mendoza et al., (2006); Françoise and Bourgault, (2009); Buonanno et
al., (2005); Bradford and (2003); Wang et al., (2008); Remus, (2006);
Wilson et al., (2002); Par and Shanks (2003); Gyampah (2004); Chien
and Tsaur, (2007); Sedera and Gable, (2003); Sedera and Gable,
(2004).

Chapter 2: Literature Review 58
Evaluating Stakeholders’ Performance of ERP Systems in Saudi Arabia Higher Education Mona Althonayan
Table 2.4: Aspects of ERP systems in higher education in general and KSA in particular used in
studies in the literature
ERP systems in higher education
General Wagner and Newell, (2006); Wagner and Newell, (2004); Kvavik et al.,
(2002); Spathis and Ananiadis, (2005); Kitto and Higgins, (2010); Alturki
et al., (2008); Zornada et al., (2005); Spathis and Ananiadis, (2005);
Rabaa`i et al., (2009); ECAR, (2002); Pegah et al., (2003); Bologa and
Romania, (200); Lupu et al., (2008); Swartz and Orgill (2001); Allen et
al., (2002); Kittner and Slyke, (2000); Klaus et al., (2000); Atari et al.,
(2008); Sabau et al., (2009); Fowler and Gilfillan, (2003); Hayes and
Utecht (2009); Seng and Leonid, (2003); Bradley and Lee (2007);
Pollock and Cornford, (2004); Bologa et al., (2009); Jorgenson et al.,
(2003); Okunoye et al., (2006); Mehlinger (2006); Waston, (1999);
Cameron, (2008); Chae and Poole, (2005).
ERP system in Saudi
Arabia higher education
Technical
Al-Mudimigh and Ullah, (2001); Al-Mudimigh and Ullah, (2011); Al-
Shamlan and Al-Mudimigh, (2011); Al-Mudimigh and Ullah, (2009); Al-
Hossan, Al-Mudimigh, (2011); Al-Mudimigh, Ullah, Saleem and Al
Aboud, (2009).
Social
No literature available / found
Stakeholder performance
evaluation in higher
education in the KSA
No literature available / found
Source: Originated by the researcher
2.11 Summary
This chapter has given a general overview of the theoretical background to the
evaluation of the performance of ERP stakeholders and a detailed description of the
background of each separate aspect. In chapter 1, the shortage of research on the
evaluation of stakeholders who use ERP systems daily was made evident. It was also
shown that many studies have indicated the importance of the social aspects of IS
and in particular of ERP systems. This chapter has discussed the available literature
relating to IS models and ERP system models. Particular emphasis was placed on the
evaluation of stakeholders’ performance.
The review undertaken in this chapter has identified gaps in the literature that this
thesis aims to address, guided by the literature review and critical analysis of
previous work in this field, identifying the research potential around three models:

Chapter 2: Literature Review 59
Evaluating Stakeholders’ Performance of ERP Systems in Saudi Arabia Higher Education Mona Althonayan
D&M, Task Technology Fit (TTF) and EUCS. The following chapter proposes a
theoretical framework based on these models, aiming to evaluate the impact of ERP
systems on stakeholders’ performance.

Chapter 3: Research Theoretical Model 59
Evaluating Stakeholders’ Performance of ERP Systems in Saudi Arabia Higher Education Mona Althonayan
PAGE
3.1 Overview…………………………………………………………………….. 60
3.2. Evaluation of Stakeholders’ Performance……………………………… 61
3.2.1 Task-Technology Fit……………………………………………………. 61
3.2.2 DeLone and McLean IS Success Model……………………………….. 63
3.2.3 End-user Computing Satisfaction…………………………………… 69
3.3 Proposed Framework………………………………………………………. 71
3.4 Research Hypothesis……………………………………………………… 79
3.5 Summary……………………………………………………………………. 86
CHAPTER THREE
RESEARCH
THEORETICAL MODEL

Chapter 3: Research Theoretical Model 60
Evaluating Stakeholders’ Performance of ERP Systems in Saudi Arabia Higher Education Mona Althonayan
3.1 Overview
Since the value of IS evaluation and the impact of ERP systems on both organization
and individuals reflect the importance to the organization of productivity, quality and
competitiveness, the aim of this chapter is to offer a critical analysis of the literature
on the impact of stakeholders’ performance on the implementation of ERP systems,
in the context of higher education.
The review also helps in developing a conceptual framework whose theoretical
underpinnings are derived from the findings and the results of the literature synthesis.
This review attempts to integrate three models referred to in the relevant literature:
the D&M IS success model (DeLone and McLean, 1992), the TTF model (Goodhue
1995) and the EUCS model (Doll and Torkzadeh, 1988), to produce a new construct
offering a more comprehensive view of the most important factors by which to
evaluate stakeholders’ performance on ERP systems in higher education. This
chapter presents the background to each model and illustrates its relation to ERP
systems. It also illuminates the strengths, shortcomings and implications of the three
models in the current literature, identifying gaps and possible areas for further
contributions. In addition, the chapter enumerates the factors selected from the three
models for application in the present research and discusses their theoretical
background and empirical validation by previous studies.
Having summarised the main factors and the proposed framework, including the
final factors chosen from the three models to evaluate stakeholders’ performance on
ERP systems in higher education, the chapter ends with a discussion of the
contributions made by this research.

Chapter 3: Research Theoretical Model 61
Evaluating Stakeholders’ Performance of ERP Systems in Saudi Arabia Higher Education Mona Althonayan
3.2. Evaluation of Stakeholders’ Performance
The following subsections discuss the abovementioned three models and their use to
evaluate ERP system stakeholders’ performance.
3.2.1 Task-Technology Fit
Task-technology fit is defined by Goodhue (1995) as “the extent that technology
functionality matches task requirements and individual abilities”, while Goodhue and
Thompson (1995) identify it as “the degree to which a technology assists an
individual in performing his or her portfolio of tasks”. The concept was derived
originally from work adjustment theory (Dishaw and Strong, 1999).
Chang (2008) explains that the TTF model is concerned with the degree to which the
capabilities of the technology match the demand of the task and that it interrelates
four main constructs: task technology and individual characteristics together affect
the construct of TTF itself, which in turn affects the outcome variable, either
utilization or performance (Dishaw, Strong and Bandy, 2002). In addition, Goodhue,
Klein and March, (2000) state that TTF presumes that the performance impacts upon
the fit between the first three constructs: technology characteristics, task
requirements and individual abilities. The TTF model, illustrated in Figure 3.1, posits
that IT will be used if the functions available to the user support (fit) the activities of
the user.
Figure 3.1: The Model of Task-Technology Fit, Source: Goodhue, (1995)
Task
characteristics
Technology
characteristics
Individual
characteristics
Task-
Technology Fit
Performance
Impacts
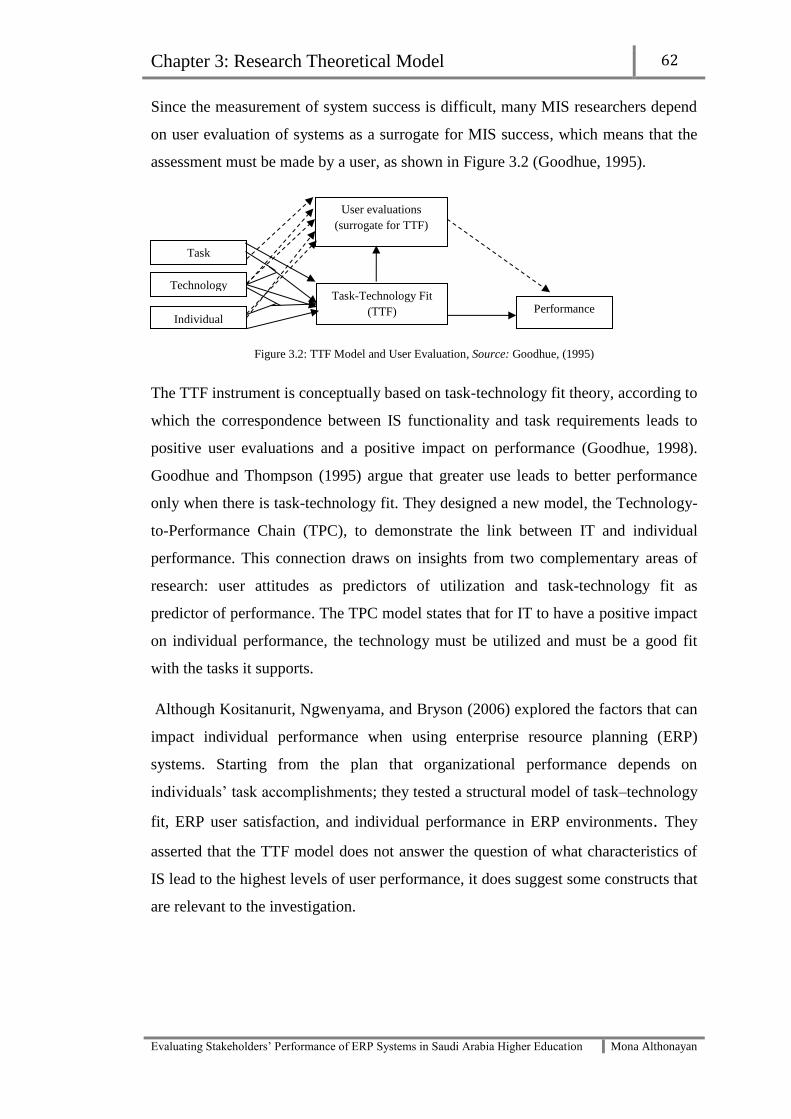
Chapter 3: Research Theoretical Model 62
Evaluating Stakeholders’ Performance of ERP Systems in Saudi Arabia Higher Education Mona Althonayan
Since the measurement of system success is difficult, many MIS researchers depend
on user evaluation of systems as a surrogate for MIS success, which means that the
assessment must be made by a user, as shown in Figure 3.2 (Goodhue, 1995).
Figure 3.2: TTF Model and User Evaluation, Source: Goodhue, (1995)
The TTF instrument is conceptually based on task-technology fit theory, according to
which the correspondence between IS functionality and task requirements leads to
positive user evaluations and a positive impact on performance (Goodhue, 1998).
Goodhue and Thompson (1995) argue that greater use leads to better performance
only when there is task-technology fit. They designed a new model, the Technology-
to-Performance Chain (TPC), to demonstrate the link between IT and individual
performance. This connection draws on insights from two complementary areas of
research: user attitudes as predictors of utilization and task-technology fit as
predictor of performance. The TPC model states that for IT to have a positive impact
on individual performance, the technology must be utilized and must be a good fit
with the tasks it supports.
Although Kositanurit, Ngwenyama, and Bryson (2006) explored the factors that can
impact individual performance when using enterprise resource planning (ERP)
systems. Starting from the plan that organizational performance depends on
individuals’ task accomplishments; they tested a structural model of task–technology
fit, ERP user satisfaction, and individual performance in ERP environments. They
asserted that the TTF model does not answer the question of what characteristics of
IS lead to the highest levels of user performance, it does suggest some constructs that
are relevant to the investigation.
Task
Technology
Individual
Task-Technology Fit
(TTF)
User evaluations
(surrogate for TTF)
Performance

Chapter 3: Research Theoretical Model 63
Evaluating Stakeholders’ Performance of ERP Systems in Saudi Arabia Higher Education Mona Althonayan
Figure 3.3: A structural model of TTF, ERP User Satisfaction, and Individual Performance Impact, Source:
Kositanurit et al. (2006).
Researchers have attempted to integrate the TTF model with others. For instance,
Dishaw and Strong (1999) conducted a study to integrate it with the TAM, with the
aim of providing a theoretical basis for exploring the factors that explain software
utilization and its link with user performance. Dishaw and Strong (2002) extended
their work by investigating the relationship between computer self-efficacy and the
combined TAM/TTF model. Continuing their effort to combine models, Dishaw and
Strong (2004) integrated TTF with the unified theory of acceptance and use of
technology, while Gros, Mueller, and Lovis, (2005) support the combination of TTF
with other models by arguing that while it is important to consider how systems help
or impede the user, this alone is not sufficient to explain a system’s success or
satisfaction with it.
3.2.2 D&M IS Success Model
DeLone and McLean’s (1992) IS success model is widely cited and has made a
valuable contribution to the literature on IS success measurement. According to
Ballantine et al. (1996), it was based largely on the work of Shannon and Weaver
(1949) and Mason (1978), although DeLone and McLean (1992) reviewed a large
number of studies (180) in the academic literature covering the period 1981-1987.
Theirs is considered the first study that tried to impose some order on developing a
comprehensive IS model and instrument for a particular context (Gable, Sedera, D.,
Assumed Organizational
Performance
pact
Task-Technology Fit
Utilization
ERP User Satisfaction
Perceived Individual
Performance Impact

Chapter 3: Research Theoretical Model 64
Evaluating Stakeholders’ Performance of ERP Systems in Saudi Arabia Higher Education Mona Althonayan
and Chan, 2008), attempting to identify those factors that contribute to the success of
information systems.
Based on these studies, six major dimensions or categories of IS successes were
defined: systems quality, information quality, use, user satisfaction, individual
impact and organisational impact. The relationships among these categories are
illustrated in Figure 3.3. The three main contributions made by DeLone and McLean
(1992) to our understanding of IS success evaluation are that they provide a method
for classifying the large number of IS success measures described in the literature
into six categories, that their approach begins to identify relevant stakeholder groups
in the process of evaluation and that they suggest a model of “temporal and causal”
interdependencies between these categories (Seddon and Kiew, 1994; Ballantine et
al., 1996., Myers, Kappelman, and Prybutok, 1997; Seddon, 1997).
Figure 3.4: D&M IS success model, Source: DeLone and McLean, (1992)
Sabherwal, Jeyaraj, and Chowa, (2006) note that DeLone and McLean (1992) did not
empirically test their proposed IS success model, but many studies have since
attempted to test, modify, develop and validate it. Seddon and Kiew (1994) were the
first to empirically test the causal/process nature of the model, then Seddon (1997)
re-specified and extended the D&M model and presented an alternative model of IS
success. Rai et al. (2002) and Sabherwal, Jeyaraj, and Chowa, later (2006) built
further on DeLone and McLean’s (1992) model.
Seddon (1997) argues that DeLone and McLean attempted to do too much by
combining both the process and causal explanation of IS success in their model and
that as a result the model is confused and mis-specified. Seddon’s (1997) study is
important because he adopts a theoretical approach to modify the D&M model,
because he distinguishes between actual impact and expected impacts, and because
he incorporates the additional construct of perceived usefulness (Sabherwal, Jeyaraj,
Individual
impact
Use
User
Satisfaction
Information
quality
Organizational
impact
System quality

Chapter 3: Research Theoretical Model 65
Evaluating Stakeholders’ Performance of ERP Systems in Saudi Arabia Higher Education Mona Althonayan
and Chowa 2006). Seddon (1997) argues that successful systems will provide
benefits such as helping the user to do more or better work in the same time, or to
take less time to achieve as much work of the same quality as was done in the past.
The focus in Seddon’s (1997) paper is on individual impact, which is defined by
DeLone and McLean (1992) as “the effect of information on the behaviour of the
recipient of all the measure of IS success”. Gable, Sedera, and Chan, (2008) identify
individual impact as the “measure of the extent to which the [IS] has influenced the
capabilities and effectiveness, on behalf of the organization, of key users”. The
reason for choosing individual impact is practicality, because impact is closely
related to performance, meaning, according to DeLone and McLean (1992), that
impact could be an indication that the information system has given the user a better
understanding of the decision context, has improved the user’s decision-making and
productivity, and has brought about a change in the user’s activity or changed the
decision-maker’s perception of the importance or usefulness of the IS. Usefulness is
the degree to which a person believes that using particular system enhances his or her
job performance (Seddon, 1997).
Pitt, Watson, and Kavan, (1995) augment DeLone and McLean’s model to include
service quality as a measure of IS success, arguing that the D&M model needs to be
expanded to reflect the IS department’s service role. Moreover, the basis of DeLone
and McLean’s categorization theory is communication; thus, the IS department is not
just a provider of products, it is also a service provider. According to Petter, Delone,
and McLean, (2008), many researchers have suggested that service quality is an
important factor to be added to DeLone and McLean’s IS success model, because it
is salient to IS success. In addition, there is a danger of mis-measuring IS
effectiveness if researchers do not include an assessment of service quality. Petter,
Delone, and McLean, (2008) define service quality as “the quality of the support that
systems users receive from the IS department and IT support personnel”. Moreover,
it measures the service quality of IT departments as opposed to individual IT
applications, by measuring and comparing user expectation and their perceptions of
the IT department (Petter, Delone, and McLean, 2008).
There is support for this argument in the IS literature. For example, Conrath and
Mignen (1990) report that the second most important component of user satisfaction,

Chapter 3: Research Theoretical Model 66
Evaluating Stakeholders’ Performance of ERP Systems in Saudi Arabia Higher Education Mona Althonayan
after general quality of service, was the match between user’s expectations and actual
IS service, while Rushinek and Rushinek (1986) found that fulfilled user
expectations had a strong effect on overall satisfaction. Pitt, Watson, and Kavan,
(1995) propose that service quality can be assessed by measuring customer
expectations and perceptions of performance level for a range of service attributes.
The difference between expectation and perceptions of actual performance can then
be calculated and averaged across attributes.
Almost a decade later, DeLone and McLean (2003) reviewed and evaluated this
argument before updating the IS success model, based on a review of more than100
articles of the empirical conceptual literature on IS success published during the
same period. Petter, Delone, and McLean, (2008) explain the utility of the updated
D&M IS model and evaluate its usefulness in light of dramatic changes in IS
practice, especially the explosive development of e-commerce. The update study was
conducted on six dimensions: systems quality, information quality, service quality,
use, user satisfaction and net benefits. The updated model is shown in Figure 3.5.
Figure 3.5: Updated D&M IS Success Model, Source: DeLone and McLean, (2003)
This research focuses on service quality, which is considered an important dimension
of IS success measurement, because it suggests that there is a correlation between
stakeholders’ expectations of service quality and their performance level. Therefore,
considering the service quality dimension for measuring stakeholders’ performance
of ERP systems in higher education is essential. Table 3.1 lists the service quality
Intention to use Use Information
quality
System quality
Service quality
User satisfaction
Net Benefits

Chapter 3: Research Theoretical Model 67
Evaluating Stakeholders’ Performance of ERP Systems in Saudi Arabia Higher Education Mona Althonayan
factors in the D&M model, as proposed by Pitt et al. (1995) and confirmed in
DeLone and McLean’s (2003) update.
Table 3.1: Service quality factors, D&M IS success model.
Service quality
-Reliability
-Assurance
-Tangibles
-Responsiveness Source: DeLone & McLean, (2003)
Sedera and Gable (2004) attempted to build upon their previous work (2003) and to
derive a standardized instrument for measuring the success of enterprise systems,
based on the research cycle developed by Mackenzie and House (1979) and McGrath
(1979), which entails two main phases: exploratory and confirmatory. They report
that the results of confirmatory factor analysis utilizing structural equation modelling
techniques confirm the existence of four distinct and individually important
dimensions of ERP systems: individual impact, organisational impact, system quality
and information quality (Figure 3.6). Chien and Tsaur (2007) later adapted and re-
examined the updated D&M model in the ERP systems environment. Their results
indicate that systems quality, service quality and information quality are the most
important success factors.

Chapter 3: Research Theoretical Model 68
Evaluating Stakeholders’ Performance of ERP Systems in Saudi Arabia Higher Education Mona Althonayan
Figure 3.6: Validated Measures of ERP, Source: Sedera and Gable, (2004)
Petter (2008) asserts that Sedera and Gable’s (2004) modified model, particularly the
instrument for evaluating IS success, is unique, for two reasons: first, the model
captures the multidimensional and complex nature of IS success by measuring four
dimensions; its second strength is that the instrument was tested within the context of
ERP systems to ensure its validity. In contrast, Darmawan (2001) argues that
combining two or more levels into a single level analysis causes the aggregation or
disaggregation of data collected at the lower (individual) to the higher (organisation)
level and could introduce bias, meaning an over- or under-estimation of the
significance of effects associated with variables that are aggregated or disaggregated.
Bernroider (2008) conducted a study to investigate the role of IT governance in
driving the success of ERP projects. Since the assessment of economic and
organizational benefits is a difficult task, Bernroider adopted DeLone and McLean’s
updated model (2003). His study examined ERP success at the usage stage, after its
implementation. Important social actors at this stage are end-users, technical,
administration, and business and IT management personnel. All of these are involved
in DeLone and McLean’s updated IS success model (2003).
Enterprise
systems
success
Individual
impact
Organizational
impact
Information
quality
System
quality - Organizational cost.
- Staff requirements.
- Cost reduction.
- Overall productivity
- Improved
outcomes/outputs
- Increased capacity
- E-government
- Learning
- Awareness/ Recall
- Decision
effectiveness
- Individual
productivity
-Availability
- Usability
- Understand ability
- Relevance
- Format
- Conciseness
- Ease of use
- Ease of learning
- User requirements
- System features
- System accuracy
- Flexibility
- Sophistication
- Integration
- Customization

Chapter 3: Research Theoretical Model 69
Evaluating Stakeholders’ Performance of ERP Systems in Saudi Arabia Higher Education Mona Althonayan
Ballantine et al. (1996) extended the work of DeLone and McLean by evaluating
their model and proposing a new one based on it. The resulting 3D model attempted
to improve the understanding of the concept of IS success by dividing success into
three levels: technical development, deployment to the user and delivery of business.
Abugabah, Sanzongni and Poropat (2010) integrate the TTF, TAM and D&M models
to evaluate the impact of IS/ERP systems on end users’ performance. While
attempting to find the most suitable factors to evaluate this performance, they
consider only the SQ and IQ dimensions from the D&M model. In other words, they
do not focus on the performance characteristics in detail.
Finally, in the work of Rabaa'i and Gable (2009) (research in progress) the authors
extend the D&M IS-impact measurement model in the context of higher education,
to describe the current state of administrative systems and to evaluate existing
practices in Australasian Universities, intending to evaluate different administrative
systems.
3.2.3 End-user Computing Satisfaction
The EUCS model designed by Doll and Torkzadeh (1988) is a potentially
measurable surrogate for utility in decision-making, whereby users interact directly
with the application software to enter information or prepare output reports. The
utility of the end-user application in decision-making is enhanced when the output
meets the user’s requirements. End-user computing satisfaction is conceptualized as
the effective attitude towards a specific computer application by someone who
interacts with the application directly (Doll and Torkzadeh, 1988).
The EUCS instrument consists of five factors: content, format, timeliness, ease of
use/efficiency and accuracy. Although this model focuses on end-user computing
satisfaction, it includes factors which could be useful for IS/ERP systems
measurement. EUCS was designed for a conventional computing environment;
therefore, performance was excluded, since, as Doll and Torkzadeh (1991) explain,
performance-related behaviours may be application-specific, making it difficult to
develop generalizable measure of EUCS success (Amoli and Farhoomand, 1996).
Doll and Torkzadeh (1991) retested the reliability of the EUCS instrument by
assessing the short- and long-range stability of a 12-item scale for measuring end-

Chapter 3: Research Theoretical Model 70
Evaluating Stakeholders’ Performance of ERP Systems in Saudi Arabia Higher Education Mona Althonayan
user computing satisfaction. The results generally confirm the stability of the 12-item
EUCS instrument in both the short and long term (Torkzadeh and Doll, 1991).
Figure 3.7: End-user Computing Satisfaction model, Source: Doll and Torkzadeh, (1988)
Interestingly, Amoli and Farhoomand (1996) attempted to find the relationship
between EUCS and user performance using structural model techniques. Twenty-
seven items were generated to explore this relationship.
In the ERP systems domain, Somers, Nelson, and Karimi, (2003) adopted the EUCS
model to measure end-user satisfaction in ERP systems, further examining the
theoretical meaning, structure, dimensionality, reliability and validity of EUCS when
used with ERP software applications. Their study confirms that the EUCS instrument
can be better understood and applied as a standardized measure of advanced
information technology, for instance in ERP systems application.
Haab and Surry (2009) studied participation in the implementation of ERP systems.
They identified various modes of participation and measured their relationship with
level of satisfaction with the implementation of an ERP system in higher education,
using a modified version of the measure developed by Doll and Torkzadeh (1988),
taking account of content, accuracy, format, ease of use and timeliness (EUCS).
End-User
Computing
Satisfaction Content
Accuracy
Format
Timeliness
Ease of
use

Chapter 3: Research Theoretical Model 71
Evaluating Stakeholders’ Performance of ERP Systems in Saudi Arabia Higher Education Mona Althonayan
3.3 Proposed Framework
Academics and practitioners have continually sought a reliable and valid measure of
IS success. Ideally, success measures focus on user behaviour or measure decision
outcome, rather than what users consider value in a system, which is linked to how it
helps them to achieve their goals (Torkzadeh, Koufterosb, and Doll, 2005). Thus,
Abugabah, Sanzongni, and Poropat (2009b) reviewed previous IS studies in terms of
the factors having the greatest impact on users’ performance and productivity.
Despite the importance of the TAM, TTF and D&M models, using these models
separately produced results which were not totally consistent or clear. Abugabah,
Sanzongni, and Poropat, (2009b) argue that the significant variables are not included
in these models; they should be integrated and need to include variables related to
technology, systems and humans at the same time.
The framework proposed for the present study therefore incorporates elements of
three existing models. The factors listed in Table 3.2 are derived from the D&M
(individual impact factors), TTF and EUCS models and are based on their relevance
to the performance and system quality. Asterisks (*) denote the factors chosen for
inclusion in the new framework. The reason for selecting the individual impact
dimension from DeLone and McLean’s IS success model (1992) and the service
quality impact from the updated model is that both dimensions can help this research
to discover whether or not ERPs improve stakeholders’ performance and how the
former meet the requirements of the latter.

Chapter 3: Research Theoretical Model 72
Evaluating Stakeholders’ Performance of ERP Systems in Saudi Arabia Higher Education Mona Althonayan
Table 3.2: Factors from the D&M, TTF and EUCS models
D&M IS success factors TTF EUCS -Time taken to complete a task*
-Improved personal productivity*
-Time efficiency of task accomplishment*
-Interpretation accuracy*
-Computer awareness*
-Confident on performance*
-User confidence*
-Quality of decision analysis
-Efficient decisions
-Time to arrive at a decision
-Time to make pricing decision
-Extent to which users analyze charges and investigate budget
variance
-Quality of career plans
-Number of objectives and alternatives generated
-User adherence to plan decision quality, forecast accuracy
-Decision quality
-Cost awareness
-Change in decision behaviour
-Value in assisting decision-making
-Number of alternatives considered
-Time to make decision
-Task performance
-Confidence in decision*
-Ability to identify solutions*
- Ability to identify strategic opportunities or problems*
-Amount of data considered
-Precision of decision maker’s forecast
- Dollar value of information
- Time to reach decision
- Management takes investigative action
-Ability to forecast firm performance*
-Worth of information system
-Quality of policy decision
- Time to solve problem*
-User understanding of inventory problem
- Power of IS department
-Influence of IS department
- Accuracy of problem solution*
- Efficiency of effort*
-Effectiveness in supporting decision
- Time savings*
-Personal effectiveness*
-Decision-making efficiency and effectiveness
- Effectiveness of personal DSS
- Problem identification*
- Generation of alternatives
- Charge in commitment of time and money
-Immediate recall of information*
-Delayed recall of information*
-Recognition and use of modern software practices
- Decision accuracy
-Decision confidence
-Lack of
confusion*
-Level of detail
-Locatability
-Meaning
-Right data*
-Accessibility*
-Assistance*
-Authorization*
-Ease of use*
-Flexibility*
-System
reliability*
-Training*
-Accuracy*
-Compatibility*
-Currency*
-Presentation
-Content*
-Format*
-Timeliness*
- Ease
of use*
-Accuracy*
Source: Originated by the researcher

Chapter 3: Research Theoretical Model 73
Evaluating Stakeholders’ Performance of ERP Systems in Saudi Arabia Higher Education Mona Althonayan
The selected factors are listed in Table 3.3, where the asterisk (*) now denotes those
factors most related to performance and (Q) marks those most closely related to the
quality of the system, while (R) refers to factors repeated in TTF, EUCS and D&M
models.
Table 3.3: Factors selected from the three models
D&M IS success factors Task technology
Fit
End-user Computing
Satisfaction -Time taken to complete a task*
-Improved personal productivity*
-Time efficiency of task
accomplishment*
-Interpretation accuracy*
-Computer awareness*
-Confident on performance*
-User confidence*
-Task performance*
-Confidence in decision*
-Ability to identify solutions*
- Ability to identify strategic
opportunities or problems*
-Ability to forecast firm performance*
- Time to solve problem*
- Accuracy of problem solution*
- Efficiency of effort*
- Time savings*
-Personal effectiveness*
- Problem identification*
-Immediate recall of information*
-Delayed recall of information*
-Lack of
confusion(Q)
-Right data(Q)
-Accessibility (Q)
-Assistance(Q)
-Authorization(Q)
-Ease of use (Q)
-Flexibility (Q)
-System reliability(R)
-Training (Q)
-Accuracy (Q)
-Compatibility (Q)
-Currency (Q)
-Content(Q)
-Format (Q)
-Timeliness(Q)
-Ease of use(R)
-Accuracy(R)
Source: Originated by the researcher
The factors in Table 3.3 derived from the TTF and EUCS models, when combined,
can help to evaluate performance from a technical perspective. Moreover, the
selected factors are the most suitable in the ERP environment and aim to measure
how ERP systems enhance individual performance. This study excludes some of the
factors in the TTF model. Goodhue (1998) asserts that ‘presentation’ and ‘level of
detail’ have similar meanings to ‘content’ and ‘format’ in the EUCS model. In
contrast, ‘locatability’ and ‘meaning’ will not help to evaluate ERP systems from the
stakeholders’ performance perspective, together with the individual impact, because
Goodhue (1998) argues that TTF measures are intended to evaluate all systems and
services of the IS department, whilst the EUCS focuses on individual applications.
Table 3.4 shows how the number of factors in the D & M IS success models were
further reduced by condensing groups of factors with similar meanings. Thus, ‘time
taken to complete task’, ‘improved stakeholder productivity’, ‘immediate recall of
information’, ‘stakeholders’ confidence in performance’ and ‘ability to identify

Chapter 3: Research Theoretical Model 74
Evaluating Stakeholders’ Performance of ERP Systems in Saudi Arabia Higher Education Mona Althonayan
problems and solutions’ are derived from factors listed in the left column of Table
3.4, initially based on a comprehensive study conducted by DeLone and McLean
(1992) under the dimension of ‘individual impact’. Computer awareness is an
important factor in measuring stakeholders’ knowledge of systems in general and
ERP in particular. When the individual has the appropriate knowledge and
experience required to use the system, better performance should result. It is
important to add service quality from DeLone and McLean’s (2003) updated IS
success model to the factors to measure the quality of support that ERP stakeholders
receive from the IT department and its impact on individual performance.
Table 3.4: Factors with the same meanings condensed into single factors
None of Source: Originated by the researcher
the three models (TTF, EUCS or D&M) provides effective evaluation of
stakeholders’ performance when applied separately, since TTF and EUCS evaluate
the technical aspects of the systems, and the individual impact in the D&M model
focuses on the human/social aspects. However, when the three models are integrated,
this will effectively evaluate the stakeholders’ performance. There is a need to
develop measures that are easy to implement and understand. Myers et al. (1997),
building on previous research, insist that any evaluation system should have a basis
of measurement that is “readily understood, simple to implement, easy to administer,
Information Systems Success Factors Condensed Factors
- Time taken to complete a task
-Time efficiency of task accomplishment
-Task performance
Time taken to complete task
-Improved personal productivity
- Efficiency of effort
-Personal effectiveness
-Effectiveness in supporting decision
Improved stakeholder productivity
-Immediate recall of information
-Delayed recall of information Immediate recall of information
-Confident on performance
-User confidence
-Confidence in decision
Stakeholders’ confidence in performance
- Ability to identify strategic opportunities or
problems
-Ability to identify solutions
- Accuracy of problem solution
- Time to solve problem
- Time savings
Ability to identify problems and solutions
-Computer awareness Computer awareness
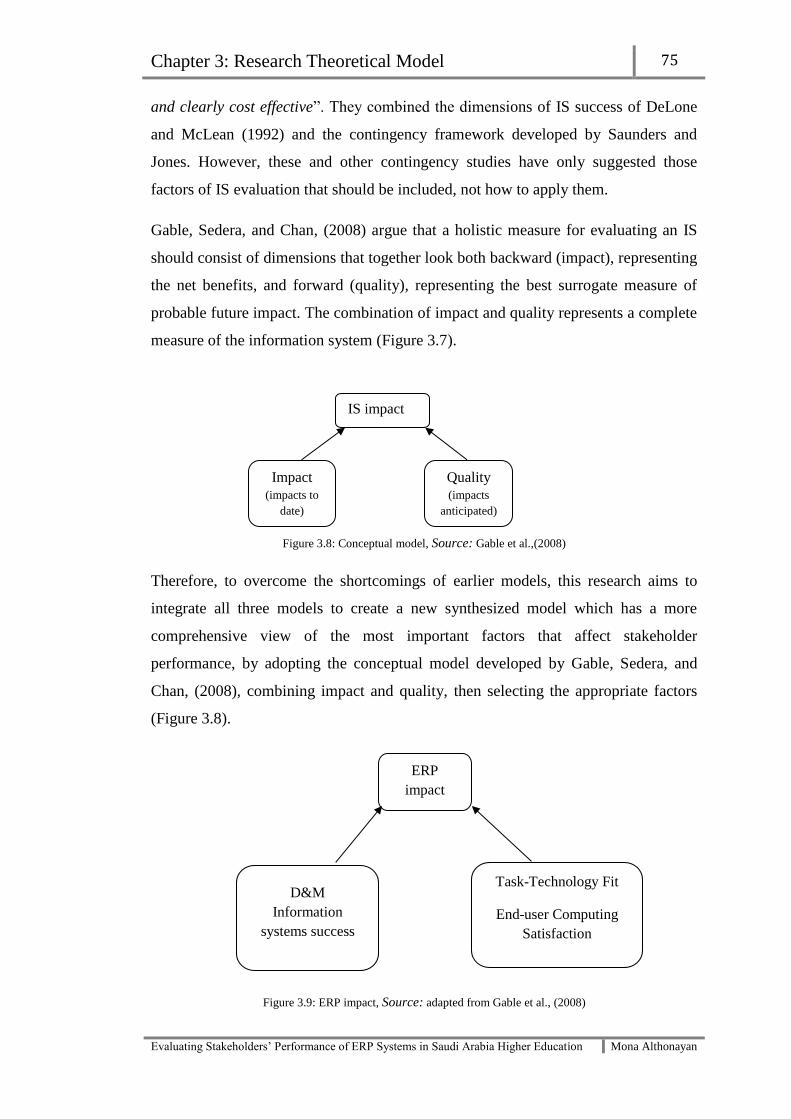
Chapter 3: Research Theoretical Model 75
Evaluating Stakeholders’ Performance of ERP Systems in Saudi Arabia Higher Education Mona Althonayan
and clearly cost effective”. They combined the dimensions of IS success of DeLone
and McLean (1992) and the contingency framework developed by Saunders and
Jones. However, these and other contingency studies have only suggested those
factors of IS evaluation that should be included, not how to apply them.
Gable, Sedera, and Chan, (2008) argue that a holistic measure for evaluating an IS
should consist of dimensions that together look both backward (impact), representing
the net benefits, and forward (quality), representing the best surrogate measure of
probable future impact. The combination of impact and quality represents a complete
measure of the information system (Figure 3.7).
Figure 3.8: Conceptual model, Source: Gable et al.,(2008)
Therefore, to overcome the shortcomings of earlier models, this research aims to
integrate all three models to create a new synthesized model which has a more
comprehensive view of the most important factors that affect stakeholder
performance, by adopting the conceptual model developed by Gable, Sedera, and
Chan, (2008), combining impact and quality, then selecting the appropriate factors
(Figure 3.8).
Figure 3.9: ERP impact, Source: adapted from Gable et al., (2008)
ERP
impact
Task-Technology Fit
End-user Computing
Satisfaction
D&M
Information
systems success
IS impact
Impact
(impacts to
date)
Quality
(impacts
anticipated)

Chapter 3: Research Theoretical Model 76
Evaluating Stakeholders’ Performance of ERP Systems in Saudi Arabia Higher Education Mona Althonayan
The outcome is that the factors derived from DeLone and McLean’s (1992) IS
success model are used to measure impact, while those derived from the TTF and
EUCS models measure quality and are used to evaluate stakeholders’ performance. It
is important and helpful to have a framework within which to classify benefits, for
two reasons: first, having such a framework helps to organise the list of benefits;
secondly, the framework acts as a prompt (Farbey, Land, and Targett, 1993).
Individual performance is an essential indicator of organizational performance;
consequently, studying the impact of ERP systems on stakeholders’ performance is a
significant way to assess the utility of this software for HEIs and its contribution to
performance, efficiency and effectiveness, as shown in Table 3.5.
Table 3.5: The final factors chosen from the three models
Source: Originated by the researcher
Moreover, the significance of the chosen factors, as apparent from Table 3.6, is
ascertained in order to highlight and analyse their impact and influence on the
satisfaction of IS/ERP system users/stakeholders; they have been used repeatedly and
accepted theoretically and empirically in many studies in IS/ERP disciplines
(Appendix: C).
Performance Systems Quality Service
quality
D&M ISS TTF EUCS D&M ISS -Time taken to complete task
-Improve stakeholders’
productivity
-Immediate recall of
information
-Stakeholders’ confidence
and performance
- Ability to identify problem
and solutions
- Computer awareness
-Lack of confusion
-Right data
-Accessibility
-Assistance
-Authorization
-Ease of use
-Flexibility
-Training
-Accuracy
-Compatibility
-Currency
-Content
-Format
-Timeliness
-Reliability
-Assurance
-Responsiveness
-Tangible

Chapter 3: Research Theoretical Model 77
Evaluating Stakeholders’ Performance of ERP Systems in Saudi Arabia Higher Education Mona Althonayan
Factors Title of the study Authors Year
Type of the
study Sample
ER
Ps
env
iro
nm
ent
Focus of the study
1
Improve stakeholders’
productivity, ease of use,
reliability, authorization,
An exploration of factors that
impact individual performance:
an analysis multiple analytical
techniques
Boontaree Kositanurit,
Ojelanki Ngwenyama and
Kweku-Muata Osei-Bryson
2006 On line survey (255) ERP users
and (95) non ERP
users
Yes TTF – User satisfaction
2
Compatibility, Training,
assistance, accuracy,
timeliness, ease of use,
accessibility.
Enterprise Resource Planning
Systems (ERP) and user
performance: A literature
Review.
Ahed Abugabah, Louise
Sanzogni. 2009 Comprehensive
literature Review
(proposed
model)
--------- Yes TAM, TTF and D&M
3
Compatibility, Training,
assistance, accuracy, ease of
use, error recovery,
currency, format,
experience, flexibility,
timeliness, accessibility
The impact of information
Systems on user Performance: A
critical review and theoretical
model
Ahed Abugabah, Louise
Sanzogni, and Arthur
Poropat
2009 Comprehensive
literature Review
(proposed
model)
--------- No TAM, TTF and D&M
4 Service quality, training,
accuracy, reliable,
timeliness, time taken to
complete task, immediate
recall, easy to use, improve
productivity.
ERP user satisfaction issues
insights from a Greek industrial
giant
Pantelis Longinidis and
Katerina Gotzamani 2009 Questionnaire
and interview
68 users and
personal interview
Yes Measure ERP users’ satisfaction using
19 items, examined the existence of
deviation in satisfaction levels among
ERP users with five different
characteristics, department of
employment, gender, age, education,
and IT experience.
5
Information quality, systems
quality, service quality
Investigating the success of ERP
systems case studies in three
Taiwanese high tech industries
Shin-Wen Chien and Shu-
Ming Tsaur
2007 Survey Multiple case study Yes Propose a success model for ERP
systems and empirically investigate the
multi-dimensional relationships among
the success measures
Table 3.6: The literature review evaluation

Chapter 3: Research Theoretical Model 78
Evaluating Stakeholders’ Performance of ERP Systems in Saudi Arabia Higher Education Mona Althonayan
Source: Originated by the researcher
6
Content, accuracy, format,
timeliness, ease of use
ERP systems adoption An
expiratory study of the
organisational factors and
impacts of ERP success
Chuck C. H. Low and Erick
W. T. Ngai
2007 Interview and
Survey
Multiple case study Yes Examine the relationship of success
factors ERP and BPI
7
System quality, training,
accuracy
A framework of ERP systems
implementation success in
China: empirical study
Zhe Zhang, Matthew
K.O.Lee, Pei Huang, Liang
Zhang, Xiaoyuan Huang
2005 Interview Multiple case study Yes Improve critical factors that affect ERP
implementation success.
8
Time, flexibility, reliability,
service
Evaluating the performance of
an ERP system based on the
knowledge of ERP
implementation objectives
Chun- Chin Wei 2008 Survey Case study Yes Evaluating the performance of an ERP
9 Task relevance,
compatibility.
Empirically Testing User
Characteristics and Fitness
Factors in Enterprise
Resource Planning.
Clyde W. Holsapple, Yu-
Min Wang and Jen- Her
Wu.
2005 Questionnaire 617 candidate Yes User characteristics and faintness
factors.
10 Ease of use, user
performance, and
support.
A structural model of end
user computing satisfaction
and user performance
Jamshid Etezadi- Amoli
and Ali Farhoomand
1996 Questionnaire 341EUC end user No EUCS and user performance

Chapter 3: Research Theoretical Model 79
Evaluating Stakeholders’ Performance of ERP Systems in Saudi Arabia Higher Education Mona Althonayan
3.4 Research Hypothesis
In order to achieve our research objectives and answer the questions of this research,
the conceptual model is introduced in table 3.5 which offers a source of foundation
for the research hypotheses. The following hypotheses are developed for testing this
research:
Performance in IS environment has been defined by Au et al. (2008) as “the
perceived outcome from IS use” for ERP systems; higher performance level of ERP
systems will lead to higher level of stakeholders’ performance. For IS to be
considered successful, it must be both effective (in terms of outcome) and efficient
(in terms of process). Both process and outcome are considered to be essential in
users’ needs. Expectable ERP Systems Performance refers to the stakeholders’
expectations and needs that can be enabled by using an ERP system at the workplace
(i.e. university). This considers basic needs that the stakeholders demand, for
example developing performance and functional effectiveness.
H1: ERP system quality variables have a significant impact on stakeholders’
performance variables.
H1.1: "Content" has a significant impact on stakeholders’ performance variables
H1.2: "Format" has a significant impact on stakeholders’ performance variables
H1.3: "Timeliness" has a significant impact on stakeholders’ performance variables
H1.4: "Accessibility" has a significant impact on stakeholders’ performance variables
H1.5: "Assistance" has a significant impact on stakeholders’ performance variables
H1.6: "Authorization" has a significant impact on stakeholders’ performance variables
H1.7: "Ease of use" has a significant impact on stakeholders’ performance variables
H1.8: "Flexibility" has a significant impact on stakeholders’ performance variables
H1.9: "Training" has a significant impact on stakeholders’ performance variables
H1.10: "Accuracy" has a significant impact on stakeholders’ performance variables
Chapter 3: Research Theoretical Model 80
Evaluating Stakeholders’ Performance of ERP Systems in Saudi Arabia Higher Education Mona Althonayan
H1.11: "Compatibility" has a significant impact on stakeholders’ performance variables
H1.12: "Currency" has a significant impact on stakeholders’ performance variables
H1.13: "Right data" has a significant impact on stakeholders’ performance variables
H1.14: "Lack of confusion" has a significant impact on stakeholders’ performance variables
In addition, some IS researchers (e.g. Pitt et al., 1995) found it important to include
service quality measure as part of the IS success, which has been considered by
Delone and Mclean (2003). The service support that stakeholders have from their
ERP system team can lead to higher performance. The service can support
stakeholders, answering their questions and solving any problems they may face, and
provide the latest hardware and software. Expectable ERP systems of technical
support performance refer to the stakeholders’ expectations and needs that are
satisfied by using ERP system in the workplace. This considers basic needs that the
stakeholders demand, for example developing performance, functional effectiveness
and service quality.
H2: ERP service quality variables have a significant impact on stakeholders’
performance variables.
H2.1: "Tangible" has a significant impact on stakeholders’ performance variables
H2.2: "Reliability" has a significant impact on stakeholders’ performance variables
H2.3: "Responsiveness" has a significant impact on stakeholders’ performance variables
H2.4: "Assurance" has a significant impact on stakeholders’ performance variables
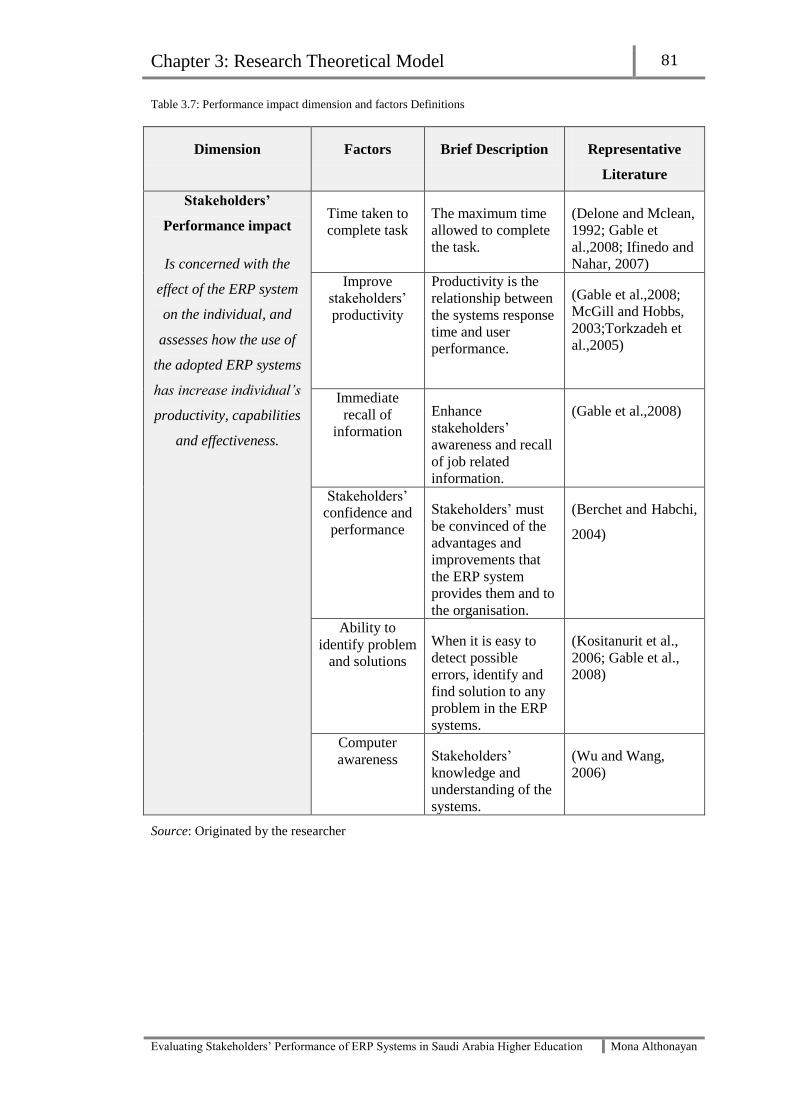
Chapter 3: Research Theoretical Model 81
Evaluating Stakeholders’ Performance of ERP Systems in Saudi Arabia Higher Education Mona Althonayan
Table 3.7: Performance impact dimension and factors Definitions
Dimension Factors Brief Description Representative
Literature
Stakeholders’
Performance impact
Is concerned with the
effect of the ERP system
on the individual, and
assesses how the use of
the adopted ERP systems
has increase individual’s
productivity, capabilities
and effectiveness.
Time taken to
complete task The maximum time
allowed to complete
the task.
(Delone and Mclean,
1992; Gable et
al.,2008; Ifinedo and
Nahar, 2007) Improve
stakeholders’
productivity
Productivity is the
relationship between
the systems response
time and user
performance.
(Gable et al.,2008;
McGill and Hobbs,
2003;Torkzadeh et
al.,2005)
Immediate
recall of
information
Enhance
stakeholders’
awareness and recall
of job related
information.
(Gable et al.,2008)
Stakeholders’
confidence and
performance
Stakeholders’ must
be convinced of the
advantages and
improvements that
the ERP system
provides them and to
the organisation.
(Berchet and Habchi,
2004)
Ability to
identify problem
and solutions
When it is easy to
detect possible
errors, identify and
find solution to any
problem in the ERP
systems.
(Kositanurit et al.,
2006; Gable et al.,
2008)
Computer
awareness Stakeholders’
knowledge and
understanding of the
systems.
(Wu and Wang,
2006)
Source: Originated by the researcher

Chapter 3: Research Theoretical Model 82
Evaluating Stakeholders’ Performance of ERP Systems in Saudi Arabia Higher Education Mona Althonayan
Table 3.8: Systems quality impact dimension and factors Definitions
Dimension Factors Brief Description Representative Literature
Systems Quality
It is refer to the
performance
characteristics of the
ERP systems.
It is measure the
performance of the
ERP systems from
technical and design
perspective
Source: Originated by
the researcher
Timeliness The ERP system
provide up- to date
information, and get
the information
stakeholders’ need in
time.
(Delone and Mclean, 2003;
McGill and Hobbs, 2003
Delone and Mclean, 1992;
Kositanurit et al., 2006;
Ifinedo and Nahar,2007;
Doll and Torkzadeh, 1988;
Somers, et al., 2003)
Format The ERP systems
output is presented in
a usual and clear
format
(Delone and Mclean, 2003;
McGill and Hobbs, 2003
Delone and Mclean, 1992;
Kositanurit et al., 2006;
Somers. et al., 2003; Doll
and Torkzadeh, 1988)
Content The ERP system
provides reports,
sufficient and precise
information to meet
stakeholders’’ need.
(Somers. et al., 2003Doll
and Torkzadeh, 1988)
Flexibility ease to change the
content or format of
the data to meet
changing task needs
(Goodhue, 1995)
Accuracy Correctness of date,
the data is accurate
enough for
stakeholders’’
purposes.
(Somers. et al.,
2003;Goodhue et al., 2000;
Goodhue, 1995)
Ease of use Ease of doing what I
want to do using the
system hardware and
software for
accessing and
analysing data.
(McGill and Hobbs, 2003;
Somers. et al., 2003;
Goodhue, 1995)
Assistance Ease of getting help
on problems with the
data.
(Goodhue, 1995)
Training Training is how to
find, understand,
access or use
corporate divisional
data.
(Bradley and lee, 2007;
Goodhue et al., 2000;
Goodhue, 1995)

Chapter 3: Research Theoretical Model 83
Evaluating Stakeholders’ Performance of ERP Systems in Saudi Arabia Higher Education Mona Althonayan
Compatibility Ease with which data
from different
sources can be
aggregated compared
inconsistencies
without
Inconsistencies.
(Somers. et al., 2003)
Currency Data is current
enough to meet
stakeholders’ needs
(Googhue, 1998)
Lack of
confusion
When it is hard to
use data effectively
because it is stored in
different files.
(Googhue, 1998)
Authorization
Getting authorization
to access to the data, (Goodhue, 1995; Somers.
et al., 2003)
Right data
Maintaining data at
the right levels of
detail
(McGill and Hobbs,
2003;Goodhue et
al.,2000;Googhue, 1998)
Accessibility Ease of access to
desired data (Goodhue et al.,
2000;Goodhue, 1995)
Source: Originated by the researcher

Chapter 3: Research Theoretical Model 84
Evaluating Stakeholders’ Performance of ERP Systems in Saudi Arabia Higher Education Mona Althonayan
Table 3.9: Service quality impact dimension and factors Definitions
Dimension Factors Brief Description Representative Literature
Service Quality
The quality of the
support that system
users receive from
the IS/ERP
department and IT
technical support
Reliability Ability to perform
the promised service
dependably and
accurately.
(Delone and Mclean, 2003;
Pitt et al.,1995; Petter et
al.,2008; Kettinger and Lee
1994)
Assurance Knowledge and
courtesy of employee
and their ability to
inspire trust and
confidence.
(Delone and Mclean, 2003;
Pitt et al.,1995; Petter et
al.,2008; Kettinger and Lee
1994)
Responsiveness Willingness to help
customers and
provide prompt
service.
(Delone and Mclean, 2003;
Pitt et al.,1995; Petter et
al.,2008; Kettinger and Lee
1994)
Tangible Tangible is measure
the update of the
hardware and the
software of the
system.
(Delone and Mclean, 2003;
Pitt et al.,1995; Petter et
al.,2008; Kettinger and Lee
1994)
Source: Originated by the researcher
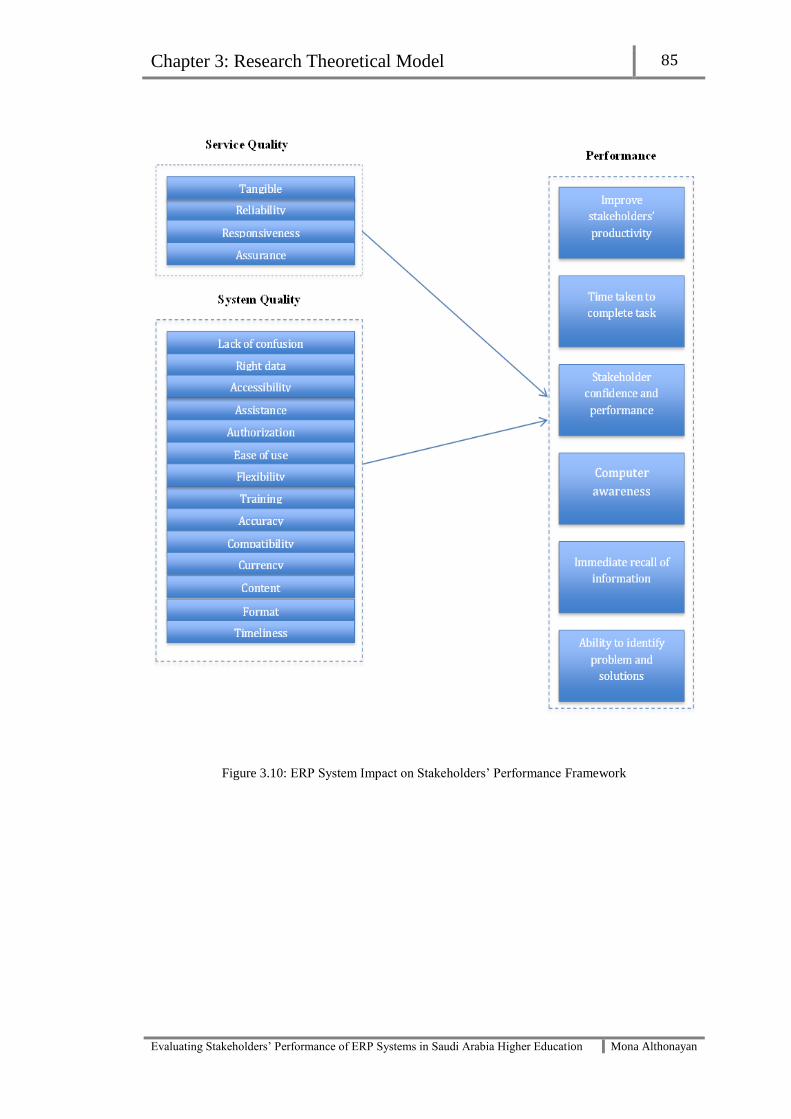
Chapter 3: Research Theoretical Model 85
Evaluating Stakeholders’ Performance of ERP Systems in Saudi Arabia Higher Education Mona Althonayan
Figure 3.10: ERP System Impact on Stakeholders’ Performance Framework

Chapter 3: Research Theoretical Model 86
Evaluating Stakeholders’ Performance of ERP Systems in Saudi Arabia Higher Education Mona Althonayan
3.5 Summary
Advancing the field of ERP studies requires that appropriate attention be given to the
evaluation of stakeholders’ performance using factors that are associated with
systems implementation in higher education. Theoretical and empirical efforts in this
domain are necessary to reduce the uncertainties and failures associated with such
systems. There are several conclusions that can be drawn from this chapter with
critical relevance to this field.
Several widely used instruments have been tested for user satisfaction in IS in
general and ERP systems in particular, although few studies have discussed ERP
systems from the stakeholders’ point of view. The literature review reveals that
many authors have addressed the importance of ERP at technical and
organisational levels, while social and individual factors have been ignored.
Stakeholders are the central elements creating value through their interaction
with ERP systems, so there is a need for ERP evaluations focusing on how
human factors influence success and how ERP systems can improve
stakeholders’ performance.
There a need to develop an integrated framework derived from the three most
widely used models, D&M, TTF and EUCS, which measure different sets of
factors affecting individual performance in the ERP environment. This study
proposes a theoretical framework that aims to evaluate the impact of ERP
systems on stakeholders’ performance. By selecting the most appropriate factors
among these models and by focusing on Saudi Arabian higher education, it will
help researchers and practitioners to evaluate stakeholders’ performance in ERP
systems.
Chapter 4: Research Methodology 87
Evaluating Stakeholders’ Performance of ERP Systems in Saudi Arabia Higher Education Mona Althonayan
PAGE
4.1 Overview…………………………………………………………………… 89
4.2 Selection of an appropriate research approach………………………… 89
4.3 Research paradigms in IS research……………………………………… 90
4.3.1 Beliefs about physical and social reality……………………………… 91
4.3.2 Beliefs about the relationship between knowledge and the empirical
world……………………………………………………………………………
91
4.4 The positivist philosophy in IS research…………………………………. 94
4.4.1 Beliefs about physical and social reality………………………………. 95
4.4.2 Beliefs about knowledge………………………………………………. 95
4.4.3 Beliefs about the relationship between theory and practice…………. 95
4.4.4 Selecting the positivist research approach……………………………. 95
4.5 Quantitative and qualitative research compared………………………... 97
4.6 Quantitative research……………………………………………………… 98
4.7 The mixed-method approach……………………………………………… 99
4.7.1 Planning mixed-method procedures………………………………….. 101
4.7.2 Triangulation…………………………………………………………... 104
CHAPTER FOUR
RESEARCH
METHODOLOGY
Chapter 4: Research Methodology 88
Evaluating Stakeholders’ Performance of ERP Systems in Saudi Arabia Higher Education Mona Althonayan
PAGE
4.8 Data Collection method……………………………………………………. 106
4.8.1 Questionnaire……………………………………………………………. 106
4.8.1.1 Questionnaire design………………………………………………….. 106
4.8.2 Interview…………………………………………………………………. 107
4.8.3 Documentation…………………………………………………………………... 108
4.8.4 Archives………………………………………………………………………….. 109
4.8.5 Strengths and Weaknesses……………………………………………………. 109
4.9 Pilot Study…………………………………………………………………………. 110
4.9.1 Why a pilot study is important…………………………………………. 110
4.9.2 Content validity, construct validity and reliability……………………. 111
4.10 Data analysis……………………………………………………………… 112
4.11 Sample……………………………………………………………………. 113
4.11.1 Mixed-method sampling…………………………………………… 113
4.12 Research strategy………………………………………………………… 114
4.12.1 Case study methodology…………………………………………… 114
4.12.2 Types of case study………………………………………………… 115
4.12.3 Multiple case studies……………………………………………….. 116
4.12.4 The reasons for choosing the cases………………………………… 118
4.12.5 Research strategy and design……………………………………… 118
4.12.6 Research process…………………………………………………… 120
4.13 Summary…………………………………………………………………. 121
Chapter 4: Research Methodology 89
Evaluating Stakeholders’ Performance of ERP Systems in Saudi Arabia Higher Education Mona Althonayan
4.1 Overview
The study of information systems is a multidisciplinary field; thus the nature of IS
research is complex and the selection of the appropriate research methods is not
straightforward. Such concerns have long preoccupied many IS researchers and have
played a major role in developing the discipline, resulting in rich discussion of
different approaches (Mathiassen, 2002). There is agreement that no single approach
will fit all studies and that a variety of research approaches, methods and techniques
can be employed in different situations.
The previous chapters have reviewed various definitions, concepts, approaches and
models associated with IS, ERP systems and related subjects. The integration of IS
success models has been discussed and the literature has been critically evaluated,
covering the key studies of ERP systems and their impact on performance evaluation.
In chapter 3, a model for ERP performance evaluation was proposed, based on the
shortcomings identified in the literature on existing models.
This chapter presents the research approach adopted in the present study. The focus
in the first part of the chapter is to highlight the research problem and main research
approaches. The next part explores the development of the research design, the
selection of research methods, the research process and its component steps.
Subsequent sections discuss the various methods of data collection and analysis,
sample composition and size. The chapter ends with a summary.
4.2 Selection of an appropriate research approach
The field of IS research has evolved over more than three decades, firmly
establishing the discipline and resulting in rich discussion about which research
paradigm and methodology are most appropriate for IS studies (Mingers, 2001).
Since there is no universally appropriate paradigm, a number of approaches, methods
and techniques should be considered, depending on the particular features of the
research at hand. Thus, Benbasat and Weber (1996) refer to a threefold diversity: “(a)
the diversity in the problems addressed, (b) theoretical foundations and reference
disciplines, (c) diversity of the methods that we use in IS research”. The major
concern has been with how diversity might affect progress in the IS field.

Chapter 4: Research Methodology 90
Evaluating Stakeholders’ Performance of ERP Systems in Saudi Arabia Higher Education Mona Althonayan
Having such a variety of approaches and diversity of backgrounds in the IS discipline
appears to divide researchers into two groups, one of which is worried about
diversity and the other of which finds it appealing. For example, Robey (1996)
argues that diversity positively strengthens and enriches IS research. He asserts that
variety creates flexibility and motivates creativity. Mingers (2001) agrees with this,
in terms of the potential for combining methods to enhance the value and benefits of
IS research. In contrast, Benbasat and Weber (1996) warn that the disciplines
involved in the IS field require uniformity, otherwise it will shatter or be taken over,
while Vessey, Ramesh, and Glass, (2002) argue that IS will continue to change and
develop year after year, so researchers must seek to build a cumulative research
tradition, because IS will progress only by developing fundamental theories that
endure.
Therefore, the following section explores the research paradigms in IS studies in
order to determine which paradigm is appropriate to guide the development of an
ontological approach to the study of ERP system stakeholders’ performance
evaluation. There is then a discussion of the rationale for the selection of the
positivist paradigm.
4.3 Research paradigms in IS research
The set of beliefs or the underlying perspective and assumptions which guide the
actions and the activities that researchers conduct throughout the research process
can be defined as the research paradigm (Denzin, 1998; Mingers, 2001). Based on
the work of Devers (1999), Orlikowski and Baroudi (1991) and Lincoln and Guba
(1994), three questions are believed to be important in defining a paradigm, as they
reflect the underlying beliefs of researchers:
- What is the form and nature of the reality that is addressed, or what is assumed?
(The ontological question);
- What is the nature of true knowledge? (The epistemological question);
- What is the best approach, or set of guidelines, to help in generating the desired
knowledge and understanding in a valid, reliable manner? (The methodological
question).

Chapter 4: Research Methodology 91
Evaluating Stakeholders’ Performance of ERP Systems in Saudi Arabia Higher Education Mona Althonayan
Thus, Orlikowski and Baroudi (1991) classify the basic beliefs underlying research
as beliefs about physical and social reality, beliefs about knowledge and beliefs about
the relationship between knowledge and the empirical world.
4.3.1 Beliefs about physical and social reality
Ontological beliefs have to do with the essence of phenomena under investigation;
that is, whether the empirical world is assumed to be objective and hence
independent of humans in creating and recreating it;
* Human rationality beliefs deal with the intentions ascribed by various researchers
to the humans they study;
Social relations beliefs refer to how people interact in organisations, groups and
society.
Beliefs about knowledge
Epistemological assumptions concern the criteria by which valid knowledge about
a phenomenon may be constructed and evaluated;
Methodological assumptions indicate which research methods and techniques are
considered appropriate for gathering valid empirical evidence.
4.3.2 Beliefs about the relationship between knowledge and the empirical world
This third set of beliefs concern the role of theory in the world of practice and reflect
the values and intentions researchers bring to their work; in other words, what
researchers believe it is appropriate to accomplish with their research work and what
they intend to achieve with a given research study.
The epistemological choice between interpretive, positivist and critical paradigms is
an important issue for IS researchers (Walsham, 1995). Various differences exist
between these approaches, as shown in Tables 4.1 and 4.2, and as identified by
researchers such as Hirschheim (1991), Orlikowski and Baroudi (1991), Walsham
(1995), Myers and Avison (2002), Chen and Hirschheim (2004) and Paré (2004).

Chapter 4: Research Methodology 92
Evaluating Stakeholders’ Performance of ERP Systems in Saudi Arabia Higher Education Mona Althonayan
Table 4.1: Basic beliefs of the three main research paradigms
Underlying
Beliefs Positivist Interpretive Critical
Physical and
social reality
-World exists
independently of
humans (ontology);
-Human action is
intentional and
(bounded) rational;
-Social relations are
generally stable,
conflict is
dysfunctional.
-World is produced and
reinforced by humans
through interaction;
-Humans interpret
(rather than discover)
the world;
-Meanings are
negotiated, so
interpretations may
shift over time.
- Social reality is
historically and
culturally constituted;
- Belief in human
potentiality;
-Social relations are
constantly undergoing
change.
Knowledge
-Universal law and
principles, lower level
hypotheses derived;
-Goals: explanation,
prediction, control
(prescription);
-Survey, experiments,
case studies.
- Explain how
meanings created and
sustained in specific
settings;
-Goals: explanation,
insight;
-Case studies.
-Phenomena can only
be understood
historically;
- Goal: critique
(interpretation is not
enough);
-Generally longitudinal
studies, ethnographies.
Relationship
between
theory and
practice
-Focus on means to
desired end;
-Aim to
inform/improve
(objective of study)
-Weak and strong
constructionist views;
-Complements
positivism or replaces
it (objective of study)
-Initiate process of
self-reflection among
actors;
- Some require
transformation of self
and social reality.
Table 4.2: Assumptions and objectives of the three main research paradigms
Assumptions
& objectives Positivist Interpretive Critical
Worldview
-Objective rational
view:
*Technology is natural;
*Value consensus on its
benefits exists.
-Subjective view:
*Addresses different
interpretations of
actors;
*A socially constructed
view.
-Based on examining
the different interests
involved:
*Oriented towards a
cause.
Aims
-Either to measure so as
to predict (predictive
intent);
- Or to describe, so as
to inform/improve
(normative/prescriptive
intent).
-Understand meanings
people assign to
phenomena;
-Use insight to inform
other settings.
-Expose deep-seated,
structural
contradictions in social
systems;
-Transform these
alienating and
restrictive social
conditions.
Accounts
-Description presented
as fact, not value
judgment
-Address how IS
influences and is
influenced by context;
-Local circumstances
are important.
-Challenges
assumptions about IS,
strategy, organisations
and management.
Chapter 4: Research Methodology 93
Evaluating Stakeholders’ Performance of ERP Systems in Saudi Arabia Higher Education Mona Althonayan
Many researchers (Orlikowski and Baroudi, 1991; Walsham, 1995; Klein and Myers,
1999; Myers and Avison, 2002; Chen and Hirschheim, 2004) have described the
three research philosophies (positivist, critical and interpretive) in relation to the IS
field research can be described as:
Positivist if there is evidence of formal propositions, hypotheses, quantifiable
measures of research variables (dependent and independent), testing and the
drawing of inferences about a phenomenon from a representative sample to a
stated population, and finally the drawing of inferences and conclusions about the
examined phenomenon from a sample representing the research population
(Orlikowski and Baroudi, 1991).
Interpretive if it is assumed that knowledge of reality is shaped through social
context; for instance, language, consciousness, shared meanings, documents and
tools. Interpretive research does not predefine dependent and independent
variables, but focuses on the complexity of human sense-making as the situation
emerges (Kaplan and Maxwell, 1994). Walsham (1993, pp. 4-5) state that
interpretive research methods in IS research aim at the “understanding of the
context of the information system and the process whereby the information
system influences and is influenced by the context”.
Critical if the main aim of the research is considered to be social critique, seeking
to assist in eliminating the causes of unwarranted alienation and domination. This
kind of research seeks to be emancipatory, in that it aims to help eliminate the
causes of unwarranted alienation and domination and thereby to enhance
opportunities for realising human potential (Hirschheim and Klein, 1994).
Critical research assumes “that social reality is historically constituted and that it
is produced and reproduced by people” (Avison and Pries-Heje, 2005, p. 244).
Chen and Hirschheim (2004) illustrate the threefold differences between positivism
and interpretivism in terms of ontology, epistemology and methodology.
Ontologically, positivists believe that reality exists objectively and independently
from human experience, whereas interpretivists emphasize the meaning of the reality
that is constructed through human and social interaction. Epistemologically,
positivists are concerned with the hypothetical deductive testability of theories and

Chapter 4: Research Methodology 94
Evaluating Stakeholders’ Performance of ERP Systems in Saudi Arabia Higher Education Mona Althonayan
researchers seek generalizable results. Moreover, a causal relationship is usually
presented, and predication and control are expected (Orlikowski and Baroudi, 1991).
In contrast, interpretivists assume that scientific knowledge should be obtained
through the understanding of human and social interaction, by which the subjective
meaning of reality is, constructed (Walsham, 1995). Methodologically, positivists
contend that to test hypothetic-deductive theory, research should take a value-free
position and employ objective measurement to collect research evidence. A typical
positivist instrument is the survey, as part of a quantitative method. Interpretivists, on
the other hand, argue that to understand the meaning in human and social
interactions, researchers need to be involved in the social setting investigated and
learn how the interaction takes place from the participants’ perspective. More
appropriate methods for generating interpretive knowledge are therefore field studies
that engage researchers in real social settings (Orlikowski and Baroudi, 1991).
Myers and Avison (2002) adopt the definition of Orlikowski and Baroudi (1991) of
positivist methods of research in IS:
“Positivists generally assume that reality is objectively given and can
be described by measureable properties, which are independent of the
observer (researcher) and his or her instruments. Positivists studies
generally attempt to test theory, in an attempt to increase the
predictive understanding of phenomena”.
Hirschheim (1991) states that positivism is an epistemology which: “seeks to explain
and predict what happens in the social world by searching for regularities and
causal relationships between its constituent elements”.
4.4 The positivist philosophy in IS research
According to Orlikowski and Baroudi (1991), the positivist research perspective is
dominant in information systems research. Using this approach, researchers examine
the effects of one or more variables on one another (Kaplan and Duchon, 1988). The
knowledge that develops through a positivist lens is based on careful observation and
measurement of the objective reality that exists ‘out there’ in the world; thus
developing numeric measures of observations and studying the behaviour of
individuals becomes dominant for a positivist (Creswell, 2009). With roots in logical
positivism, this perspective reflects the precepts informing the study of natural
Chapter 4: Research Methodology 95
Evaluating Stakeholders’ Performance of ERP Systems in Saudi Arabia Higher Education Mona Althonayan
phenomena. The following subsections examine the assumptions underlying the
positivist research philosophy.
4.4.1 Beliefs about physical and social reality
Ontologically, positivist researchers assume an objective physical and social world
that exists independently of humans and whose nature can be relatively
unproblematically apprehended, characterized and measured.
4.4.2 Beliefs about knowledge
The epistemological belief of the positivist is concern with the empirical testability
of theories, to determine whether a theory is true or false. According to Paré (2004),
positivist studies are epistemologically premised on the existence of prior fixed
relationships with the phenomena capable of being identified and tested via
hypothetic-deductive logic and analysis. Causal relationships, the basis for
generalized knowledge, can predict patterns of behaviour across situations.
Furthermore, positivist researchers believe that scientific inquiry is ‘value-free’ and
hence see themselves as impartial observers who can evaluate or predict actions or
processes objectively.
4.4.3 Beliefs about the relationship between theory and practice
The relationship between theory and practice in positivist philosophy is primarily
technical. Because positivists believe that scientific inquiry is value-free, what such a
desired state of affairs is cannot be resolved scientifically. It is believed that as
impartial observers, researchers can objectively evaluate or predict actions or
processes, but that they cannot involve themselves in moral judgments or subjective
opinions.
4.4.4 Selecting the positivist research approach
Based on the diversity of research paradigms, the selection of the appropriate
approach for the present study is a complex task. The researcher’s efforts have been
concentrated on:
Obtaining the necessary knowledge of the existing research approaches in order
to make an informed choice (Orlikowski and Baroudi, 1991; Galliers, 1992).

Chapter 4: Research Methodology 96
Evaluating Stakeholders’ Performance of ERP Systems in Saudi Arabia Higher Education Mona Althonayan
Accommodating ethical decisions by making more pragmatic choices given
time, cost and other resource constraints, rather than choices closer to the
researcher’s value systems and the phenomena studied, which require deeper
immersion in social settings for longer periods of time (Miles and Huberman,
1994).
Using the researcher’s intuitiveness to match the research problem to a particular
research approach (Walsham, 1995).
Considering the research question and the nature of the phenomenon when
choosing between the interpretive and positivist approaches (Orlikowski and
Baroudi, 1991).
From the above considerations, for the purposes of the research reported in this
thesis, the fundamental epistemology is positivist and positivism was selected as the
underlying assumption. There are two reasons for this choice. First, the review
reported in the two previous chapters illustrates the existence of many social and
technical issues related to ERP systems; as a result, the evaluation of ERP
stakeholders’ performance in Saudi HEIs cannot easily be separated from the
expectations of universities and users.
Additionally, it is important to mention the relationship between positivist and
interpretivist theories; although the emphasis in this thesis is on a positivist view of
the evaluation of stakeholders’ performance in the ERP system, the importance of the
interpretive approach is also acknowledged, as it can enhance the use of positivist
research methods. Specifically, interpretive approaches to IS evaluation that integrate
the recognition of IS in both social and technical terms have increased since the late
1980s; moreover, treating the technical aspects of IS evaluation alone leads to
pointless conclusions that overlook the social aspects of the evaluation process and
ignore the social and political environment of organisations (Stockdale and Standing,
2006).
Having established the reasons for selecting the positivist research approach, the
discussion turns to the theoretical foundations of this approach, in order to identify
their implications for the design of this research. In the next section, quantitative and

Chapter 4: Research Methodology 97
Evaluating Stakeholders’ Performance of ERP Systems in Saudi Arabia Higher Education Mona Althonayan
qualitative researches are compared; in the following section, the nature of
quantitative research is described in order to justify its relevance to the study.
4.5 Quantitative and qualitative research compared
Both qualitative and quantitative research methods have advantages and
disadvantages; consequently, researchers choose the approach (i.e. one or a
combination of both) which they believe to be more suitable to fulfil their research
purpose. The various advantages and disadvantages of the different approaches, as
identified by previous researchers (Kaplan and Duchon, 1988; Guba and Lincoln,
1994; Amaratunga and Baldry, 2002; Denzin and Lincoln, 2005; Creswell, 2009), are
shown in Table 4.3.
Table 4.3: Advantages & disadvantages of quantitative & qualitative research
Advantages of quantitative research
Methods allow accurate
measurement of variables
Methods are structured, standard
Provides wide coverage of the
range of situations
Large sample of population
Used more in IS studies
Statistical analysis
Generalisations are possible
Can be fast and economical
Disadvantages of quantitative research
Use of inflexible methods
Deterministic character
Disregards some important factors
Misses subjective aspects of human
existence
Assumption of an objective truth
Generation of incomplete
understandings
Inapplicable to some immeasurable
phenomena
Not very helpful in generating
theories
Advantages of qualitative research
Methods enhance description and
theory development
Describes theories and experience
Allows deep understanding and
insight
Holistic and humanistic
Exclusion of meaning and purpose
Flexible methods
Value placed on participants’ views
and empowering participants
Inductive data analysis
Subjective dimensions are explored
Disadvantages of qualitative research
No hard data or clear measuring
Subjective, ‘non-scientific’
Deep involvement of researchers
increases risk of bias
Small samples
Generalisation is limited to similar
contexts and conditions
Analysis and interpretation of data
may be more difficult
Policymakers may give low
credibility to results from
qualitative approach

Chapter 4: Research Methodology 98
Evaluating Stakeholders’ Performance of ERP Systems in Saudi Arabia Higher Education Mona Althonayan
4.6 Quantitative research
Qualitative methods provide less explanation of variance in statistical terms than
quantitative methods, which have greater dependence on laboratory studies and
surveys. Although practiced and advocated in IS studies, qualitative methods have
not been as visible in this field as in others (Kaplan and Duchon, 1988); quantitative
research still dominates the discipline.
Once the appropriate research approach has been identified, it is important to review
the definition and the criteria which should apply to the data in the quantitative
research method. The terms ‘positivist’ and ‘quantitative’ are frequently used
interchangeably in relation to research. Creswell (2009) defines quantitative research
as a “means for testing objective theories by examining the relationship among
variables, which, in turn, can be measured, typically on instruments, so that
numbered data can be analyzed using statistical procedures”. He adds that
quantitative researchers make “assumptions about testing theories deductively,
building in protections against bias, controlling for alternative explanations, and
being able to generalize and replicate the findings”.
The reasons for selecting the quantitative research approach for the present study
include the fact that its main assumption is that human behaviour can be explained
by what may be termed ‘social facts’, which can be investigated by methodologies
that utilise “the deductive logic of the natural” (Amaratunga and Baldry, 2002).
Additionally, quantitative research is appropriate for:
Comparison and replication studies;
Research independent of the subject being observed;
Research focusing on a subject under analysis measured through objective
methods rather than subjective inference (e.g. sensation, reflection or intuition);
Research that determines reliability and validity;
Research that measures descriptive aspects of behavioural elements;
Research emphasising the need to formulate a hypothesis for subsequent
verification.
Research that seeks causal explanations and fundamental laws, reducing the
whole to the simplest possible elements in order to facilitate analysis.

Chapter 4: Research Methodology 99
Evaluating Stakeholders’ Performance of ERP Systems in Saudi Arabia Higher Education Mona Althonayan
This study can be categorised as research that measures descriptively and formulates
hypotheses for subsequent verification (i.e. examining the impact of ERP systems on
stakeholders’ performance). Finally, it is useful to note that the quantitative approach
has been used in a number of studies related to this research, reviewed in chapters 2
and 3, examining various aspects of IS and ERP systems using quantitative methods
of data collection and analysis.
Thus, the adoption of quantitative methods seemed the most useful approach to the
evaluation of stakeholders’ performance in a large sample from three universities in
the KSA. In addition, there is a need to mix a quantitative and qualitative methods in
the data collection (interview) phase of the study; according to Yin (2009), the
interview is the most important source of case study information. The remainder of
this chapter discusses the mixed-method approach and the research strategy adopted
in the study. This design is based on the research assumptions and approaches chosen
above.
4.7 The mixed-method approach
The use of a combination of quantitative and qualitative methods within mixed-
method studies is becoming increasingly prevalent in research practice, so that mixed
methods is now considered to be the third major approach. Johnson, Onwuegbuzie,
and Turner (2007) note nineteen definitions of the approach, each of which is subtly
different, although all emphasise three points: the use of more than one approach,
data collection and data analysis.
Teddlie and Tashakkori (2006) furnish a comprehensive definition of the mixed
approach as “research in which the investigator collects and analyses data,
integrates the findings, and draws inferences using both qualitative and quantitative
approaches and methods in a single study or program of inquiry”, while Johnson,
Onwuegbuzie, and Turner, (2007) note that the mixed-methods approach combines
qualitative and quantitative methods in different aspects of the research, e.g. in
viewpoints, data collection, analysis and inferences.
Recently, the number of mixed-method studies has increased, especially when the
research questions could not be answered by one paradigm alone (Leech and
Onwuegbuzie, 2009). Kelle (2006) gives two reasons for researchers to choose

Chapter 4: Research Methodology 100
Evaluating Stakeholders’ Performance of ERP Systems in Saudi Arabia Higher Education Mona Althonayan
mixed methods. First, applying methods from the alternative methodological
tradition can help researchers to discover and to handle threats to validity arising
from the exclusive use of either qualitative or quantitative research, thus ensuring
good scientific practice by enhancing the validity of methods and research findings;
secondly, the mixed approach helps researchers to gain a fuller picture and deeper
understanding of the phenomenon being investigated by relating complementary
findings to each other, which results from the use of methods from the different
methodological traditions of qualitative and quantitative research.
Although most studies of computer systems are based on methods that measure
quantitative outcomes, information systems also need studies focusing on concepts
with attributes and meaning (Kaplan and Cincinnati, 1988). Bryman (2011) supports
the idea of using mixed methods in the field of evaluation research in general. In
particular, the evaluation of medical information systems focuses on factors such as
costs and benefits, timeliness, completeness and user satisfaction. Quantitative
methods are excellent for studying such evaluation questions. They are helpful when
evaluating computer information systems, where contextual issues include the social,
cultural, organizational and political concerns surrounding IT, the processes of IS
development, installation and use, and how all these are conceptualized and
perceived by the participants in the research setting (Kaplan and Maxwell, 2005). In
addition, Irani and Love (2008) assert that the use of qualitative and quantitative
approaches, and their mixing, involves philosophical assumptions. Thus, mixed
research is more than simply collecting and analysing both kinds of data: it also
involves the use of both approaches in tandem, so that the overall strength of the
study is greater than that of either qualitative or quantitative research.
The term ‘qualitative techniques’ is frequently used in the social sciences and there
has been growing interest in the use of qualitative techniques in the administrative
sciences; this interest has been sparked by a general dissatisfaction with the type of
data generated by quantitative techniques (Banbast, Goldstein, and Mead, 1987). In
the case of the present research, using quantitative methods in general and a mixed-
method approach in the data collection phase (triangulation) was considered helpful
to obtain a fuller picture of the three cases being studied and to gain a deeper
understanding of the phenomenon. The use of mixed methods would provide more

Chapter 4: Research Methodology 101
Evaluating Stakeholders’ Performance of ERP Systems in Saudi Arabia Higher Education Mona Althonayan
complete data about the cases, mitigating the potential biases and weaknesses
associated with using a single method; the sum of the data would increase, making it
more helpful, richer and ultimately more useful in answering the research questions
(Johnson, Onwuegbuzie, and Turner 2007). Besides, adopting a mixed-method
approach in the field of evaluation seems to lend strong support to the study and to
increase both the validity and reliability of the evaluation data (Tashakkori and
Teddlie, 2003).
Finally, according to Galliers (1992, p. 148), the IS field is essentially a pluralistic
scientific field which “can best be understood and analysed only with the help of
pluralistic models”. Hirschheim (1991) argues that information systems are
fundamentally social rather than technical. Furthermore, they are seen as social
communication systems, embedded in a cultural context; multiple perspectives and
interpretations must be taken into consideration when researching this field, where
the use of multiple of research techniques is crucial.
Additionally, the focus in IS evaluation on technical problems can led to meaningless
data and overlooking social aspects, although the benefits associated with IT
implementation tend to be qualitative and often intangible; thus, the evaluation
process must look beyond a quantification of cost and benefits (Stockdale et al.,
2008). Conducting mixed-method research in IS evaluation can cover the two aspects
simultaneously.
4.7.1 Planning mixed-method procedures
Creswell (2009) identifies four aspects that must be considered when using mixed
research methods: timing, weighting, mixing and theorizing (Table 4.4).
Timing. To conduct research, the researcher needs to consider the timing of
qualitative and quantitative data collection: whether it will be in phase (sequential) or
gathered at the same time (concurrent). It is important to identify when the data are
collected in phase and whether the qualitative or the quantitative data come first.
Weighting. Weight or priority may be given to either qualitative or quantitative
research in a particular study, or they may receive equal attention. The priority
decision depends on the interests of the researcher, the audience for the study and
what the investigator seeks to emphasize.

Chapter 4: Research Methodology 102
Evaluating Stakeholders’ Performance of ERP Systems in Saudi Arabia Higher Education Mona Althonayan
Mixing. Mixing quantitative and qualitative data is difficult, posing two questions:
‘When does a researcher mix in a mixed-method study?’ and ‘How does mixing
occur?’ Mixing the two types of data might occur at several stages: the data
collection, the data analysis, interpretation, or in all three phases. Mixing means
either that qualitative and quantitative data are kept separate but connected, that the
two datasets are integrated by actually merging the quantitative data with the
qualitative data, or that the researcher embeds a secondary form of data within a
larger study having a different form of data as primary database.
Theorizing or transforming perspective. All researchers bring theories, frameworks
and hunches to their enquiries and these theories may be made explicit, implicit or
not mentioned. In mixed-method research, theories are typically found in the opening
sections as an orienting lens that shapes the types of questions asked who participates
in the study, how data are collected and the implications of study findings.
Table 4.4: Aspects to consider in planning a mixed-method design
Timing Weighting Mixing Theorizing
No sequence:
concurrent Equal Integrated Explicit
Sequential:
qualitative first Qualitative Connecting
Implicit Sequential:
quantitative first Quantitative Embedding
Source: adapted from Creswell et al. (2003)
In the present research, the choices made were that the quantitative data would come
first, priority would be given to quantitative over qualitative research and the mixing
of data would occur in the discussion chapter. Finally, as for theory, this research is
based on the three models discussed in chapter 3: D&M, TTF and EUCS.
In general, the four factors discussed above help to shape the procedures of mixed-
method study. While there would in theory be more than fifty possible combinations
of the factors in Table 4.4, there are in practice six major strategies for inquirers to
choose from in designing research, described below.
The sequential exploratory strategy, conversely, is characterized by the collection
and analysis of qualitative data in a first phase of research, followed by the collection

Chapter 4: Research Methodology 103
Evaluating Stakeholders’ Performance of ERP Systems in Saudi Arabia Higher Education Mona Althonayan
and analysis of quantitative data in the second phase, building on the results of the
first phase.
Sequential transformative strategy. In a two-phase project with a theoretical lens,
there is an initial phase (either quantitative or qualitative) followed by a second
phase.
Concurrent triangulation strategy. The researchers collect both quantitative and
qualitative data concurrently and then compare the two datasets to determine if there
is convergence, differences, or some combination of the two.
The concurrent embedded strategy can be identified by its use of one data collection
phase, during which both quantitative and qualitative data are collected
simultaneously.
The concurrent transformative strategy is guided by the researcher’s use of a
specific theoretical perspective as well as the concurrent collection of both
quantitative and qualitative data.
The sequential explanatory strategy, illustrated in Figure 4.1, is popular for mixed-
method design and often appeals to researchers with a strong quantitative leaning. It
is characterized by the collection and analysis of quantitative data in a first phase of
research, followed by the collection and analysis of qualitative data in a second phase
that builds on the results of the first.
QUAN QUAN QUAL QUAL
Interpretation of Entire Analysis
Data Collection Data Analysis Data collection Data Analysis
Figure 4.1: Sequential explanatory strategy. Adapted from Creswell (2009)
QUAN QUAL
Case 1
Questionnaire Case 2
Case 3
Case 1
SPSS 20 Case 2
Case 3
Case 1
Interview Case 2
Case 3
Case 1
Thematic analysis Case 2
Case 3

Chapter 4: Research Methodology 104
Evaluating Stakeholders’ Performance of ERP Systems in Saudi Arabia Higher Education Mona Althonayan
The present research, in line with the sequence of Yin’s (2009) case study, follows
the sequential explanatory strategy, whereby first quantitative and then qualitative
data were collected.
4.7.2 Triangulation
Triangulation is defined by (Yin, 2009) as:
“The practice of employing several research tools within the same
research design … the procedure allows the researcher to view a
particular point in research from more than one perspective and
hence to enrich knowledge and/ or test validity. Triangulation can be
applied in all of the research process”.
Some researchers have used triangulation for one or more of the following purposes
(Sarantakos, 2005, p. 146):
- To be thorough in addressing all possible aspects of the topic;
- To increase the amount of research data and so to increase knowledge;
- To enrich the nature of research data;
- To facilitate a study where one procedure serves as a stepping stone for another;
- To allow comparisons;
- To achieve stronger validity, credibility and research utility;
- To overcome the deficiencies of single method studies.
The simple and common idea about triangulation is to use a combination of methods
in order to achieve quality in research that cannot be guaranteed by using a single
method (Sarantakos, 2005, p. 145; Bryman and Bell, 2007; Flick, 2009, p. 444).
Denzin (2005) traces the origin of the concept of triangulation to the 1970s and lists
four types of triangulation for social research. Flick (2009, p. 444) also distinguishes
four different types:
Data triangulation involves using different data sources in order to increase the
validity of a study. Moreover, Denzin (2005) makes a distinction between time and
space, suggesting that phenomena be studies on different dates and in different
places, by different people.
Investigator triangulation involves using different investigators in the analysis
process to detect or minimize biases resulting from the researchers as persons.
Chapter 4: Research Methodology 105
Evaluating Stakeholders’ Performance of ERP Systems in Saudi Arabia Higher Education Mona Althonayan
Theory triangulation means taking multiple perspectives, or what Sarantakos (2005,
p. 146) calls “paradigm triangulation”, where a study employs different paradigms
(positivist and interpretive) to study the same phenomena.
Methodological triangulation (Sarantakos, 2005 p. 146; Flick, 2009) involves the
use of multiple qualitative and quantitative methods, either between or within
methods or both. This combination allows several methods to be applied
simultaneously. Moreover, it employs a mixed-method design to investigate different
aspects of the same phenomena.
Sarantakos (2005, p. 146) describes two more commonly used types of triangulation:
Time triangulation entails the use of research at different times. It is considered a
successive approach in contrast to concurrent triangulation, where diverse methods
are used to study the same topic at one point in time.
Sampling triangulation is when two or three samples are employed within the same
project. In this kind of triangulation, experimental and control groups are treated in a
distinct manner that allows the testing of causal relationships.
To summarise the contributions of four researchers in this area (Denzin, 2005;
Sarantakos, 2005; Flick, 2009; Yin, 2012), triangulation can also be comprehensive
or multiple, meaning that the researcher uses a combination of many types of
triangulation. This was the strategy chosen for the present study, which applied the
following types of triangulation:
Between methods. The data were generated by means of semi-structured
questionnaires, semi-structured interviews, documentation and archival review.
Theory triangulation. The theoretical underpinning of this research is an integrative
conceptualisation of literature on a number of domains: ERP systems, higher
education, stakeholders’ performance and performance evaluation.
Credibility triangulation. One of the main purposes of triangulation is to test and
develop the validity of the research (Sarantakos, 2005). Therefore, this study applied
many techniques and procedures to ensure the validity and credibility of the research.
These techniques are: multiple analysts, data triangulation and methods triangulation.

Chapter 4: Research Methodology 106
Evaluating Stakeholders’ Performance of ERP Systems in Saudi Arabia Higher Education Mona Althonayan
Data triangulation. Using three case studies.
4.8. Ethical considerations
The researcher followed three steps in order to have permission to start the empirical
research. The first step was getting an authorisation letter from Saudi embassy, to
authorize the empirical research in public organisations (see Appendix A). The
researcher then contacted the Saudi Universities; KSU, KFU and KFUP&M as a
second step in order to seek their approval to facilitate and get their help to contact
participants. The final step involved filling Brunel University ethical form (see
Appendix A) including the three universities’ approval.
As part of the ethics the researcher attached the consent form with the questionnaire
and explained the role of the participants so that participants can participate
voluntarily. The researcher ensured that anonymity of the participants was
maintained; as the researcher promised that the name of the participant and identity is
ensure to be kept confidential. To make the process flexible for all participants the
researcher provided both Arabic and English versions of the questionnaire and
interview questions.
The next section explains the data collection methods used.
4.9 Data Collection methods
4.9.1 Questionnaire
According to Gable (1994), the survey approach refers to a group of methods which
emphasize quantitative analysis, whereby data on a large number of organizations are
collected through methods such as postal questionnaires, telephone interviews or
published statistics, then analysed using statistical techniques.
A questionnaire can be used to help policymakers, programme planners, evaluators
and researchers (Fink and Kosecoff, 1985). It can be described as a written form of
questioning, where the pre-defined set of questions, assembled in a pre-determined
order, may be closed (inviting e.g. yes/no answers), or open (e.g. ‘What are you
feeling?’ or ‘What is your opinion?’). Respondents are asked to answer the
questions, thus providing the researcher with data that can be analysed and
interpreted. Questionnaires can be self-administered, where participants respond

Chapter 4: Research Methodology 107
Evaluating Stakeholders’ Performance of ERP Systems in Saudi Arabia Higher Education Mona Althonayan
without the researcher being present, or researcher-administered, where the
researcher asks interviewees each question in turn and writes their responses
(Thomas, 2011; Oates, 2006).
The present research used self-administered questionnaires, which were sent to
participants and followed up by the researchers, to give them time to complete them
and return them. This was a practical decision, due to the gender separation in Saudi
Arabian universities.
4.9.1.1 Questionnaire design
The Likert scale is a means of measurement that is frequently used in survey
questionnaires as an attitude scale and for situations where agreed-upon criteria for
prediction do not exist. It consists of declarative statements and an instruction for
respondents to state the extent to which they agree with each one. Likert-type scales
have been used in IS research for over 20 years (Chin, Jonson, and Schwarz, 2008).
Based on the nature of this research, the researcher found it useful to use five-item
Likert scales (e.g. strongly agree, agree, don’t know, disagree, strongly disagree) in
questionnaire items designed to understand and measure the opinions of ERP end-
users regarding the impact of the systems on their performance.
The questionnaire (reproduced in Appendix B1) consisted of four parts: part 1
comprised demographic questions designed to solicit general information about the
respondents, their organisations (universities) and the extent of their roles in the
systems; part 2 concerned stakeholders’ impact; part 3 addressed systems quality and
part 4 was about technical support. The questionnaire can be described as semi-
structured, comprising 31 items, including 3 open questions at the end of each part,
while the remainder required responses on a five-point Likert-type scale where
1=strongly disagree and 5=strongly agree.
The questions were derived from three models used in prior studies. Thus, questions
concerning the D&M model were adapted from Gable et al. (2004) and Kositanurit,
Ngwenyama, and Bryson, (2006) for individual performance, while questions on
service quality (technical support) were adapted from the D&M update (2003). For
EUCS (Doll and Torkzadeh, 1988), questionnaire items were adapted from the work

Chapter 4: Research Methodology 108
Evaluating Stakeholders’ Performance of ERP Systems in Saudi Arabia Higher Education Mona Althonayan
of Somers, Nelson, and Karimi, (2003). Finally, items from the questionnaire on the
TTF model by Goodhue (1995) were adapted to address systems quality.
Questionnaire responses were received from a total of 169 participants at three sites:
60 in KSU, 55 in KFU OF P&M and 45 in KFU.
4.9.2 Interview
Interviews constitute one of the most important and essential sources of case study
information (Yin, 2009). Denzin and Lincoln (2005) list several different types, each
having advantages and disadvantages, depending upon the nature of the research,
including structured, unstructured, group, postmodern, gender, framing and
interpreting interviews. Thomas (2011) focuses on the most popular types: structured
interviews, which ask a determined list of questions, unstructured or open-ended
interviews, where interviewees are responsible for determining the direction of the
interview, and semi-structured interviews, a combination of the above two types,
where the researcher has the freedom to follow up points as necessary within a given
structure.
As this research follows the case study structure of Yin (2009), the researcher
decided to design interview questions according to one of the three following styles:
In-depth interview. The researcher asks participants about the facts of a matter
and their opinions; they may propose their insights into certain occurrences. The
interviews may take place over an extended period of time and interviewees can
suggest other people or sources.
Focused interview. Each person is interviewed for a short period of time (e.g. an
hour). In such cases, the interviews may remain open-ended and assume a
conversational manner, but the researcher is more likely to be following a certain
set of questions derived from the case study protocol.
Structured questions. Along the lines of a third type of formal survey, such
interviews could be designed as part of an embedded case study and produce
quantitative data as part of the case study evidence.

Chapter 4: Research Methodology 109
Evaluating Stakeholders’ Performance of ERP Systems in Saudi Arabia Higher Education Mona Althonayan
However, interviews are usually associated with the survey method. Hence,
structured questions were considered the most suitable option for this research,
because the researcher would be gathering quantitative data as part of the case study
evidence. Moreover, choosing this type of interview would clarify any quantitative
information or data emerging during the analysis of questionnaire results.
A total of 25 participants at the managements and administrative stakeholder level,
(9=KSU, 8=KFU, and 8=KFUOF P&M, discussed in detail in chapter 6), underwent
structured interviews conducted by telephone. The procedures undertaken before,
during and after each interview are detailed in Appendix B2. Each interview lasted
(on average) 30-40 minutes. Interviews were recorded and subsequently transcribed.
Validity of findings after each interview was applied (Lincoln and Guba, 1986).
4.9.3 Documentation
According to Thomas (2011, p. 164) gathering data from documents is completely
different from gathering data from people, since specialised reading skills are
necessary to understand certain kinds of words. Yin (2009, p. 101) argues that
documents are likely to be relevant to every case study topic. This source of
information can take many forms, e.g. letters, email, other personal documents,
agendas, announcements, administrative documents, formal studies or evaluations of
the same case setting.
Many types of documents were found to be helpful and interesting for this study and
added value to its data collection phase. Those reviewed were administrative
documents (concerning the first time the ERP systems were implemented, for how
long, which department implemented them and the implementation phase), annual
reports, training courses, evaluation methods and written reports of events. It is
important for the researcher to be aware of the initial aims and objectives of those
documents reviewed, as reviewing documents without recognising and considering
their purpose might result in collecting and relying on irrelevant or misleading data
(Yin, 2009, p. 105).
4.9.4 Archives
Archival records are another source of data collected in this study, especially
university records, statistical data produced by IT departments and documents

Chapter 4: Research Methodology 110
Evaluating Stakeholders’ Performance of ERP Systems in Saudi Arabia Higher Education Mona Althonayan
referring to courses conducted by the departments, indicating the numbers of
employees who had been trained.
However, using archival records sometimes causes confusion for researchers. Yin
(2009, p. 106) advises them to “ascertain the conditions under which [an archival
record] was produced as well as its accuracy. Sometimes, the archival records can be
highly quantitative, but numbers alone cannot automatically be considered a sign of
accuracy”.
4.9.5 Strengths and Weaknesses
Table 4.4 below lists the strengths and weaknesses of the types of data-gathering
instruments used in this study (Fink and Kosecoff, 1985; Gable, 1994; Yin, 2009;
Thomas, 2011; Yin, 2012).
Table 4.5: Strengths & weaknesses of data-gathering instruments used in this study
Strengths Weaknesses Use in the study
Qu
esti
on
na
ire
*Most appropriate when
information should come directly
from people
*Quick and economical
*Works better in areas where field
methods are weak
*Questionnaires can accurately
document the norm
*Identify extreme outcomes
*Delineate associations between
variables in sample
*Easy to score and summarise
*Can be sent by post, email, face to
face or presented online
*Provides generalizable statements
*Provides a snapshot of the
situation at a certain point in time
*Yields little information on the
underlying meaning of the data
*Some variables may not be
measurable by this method
*Usually low response rate if sent
by mail or email
*Responses might be subject to
response sets, such as acquiescence
*Self-
administered
questionnaire
Inte
rvie
w
*Targeted: focuses directly on case
study topics
*Insightful: provides perceived
causal inferences and explanations
*Bias due to poorly articulated
questions
*Response bias
*Inaccurate due to poor recall
*Reflexivity: interviewee gives
what interviewer want to hear
*Structured
interview
questions
Do
cum
enta
tio
n *Stable: can be reviewed repeatedly
*Unobtrusive: not as a result of the
case study
*Exact: contains exact names,
references and details of an event
*Broad coverage: long span of
time, any events and many settings
*Retrievability: can be difficult to
find
*Biased selectivity: if collection is
incomplete
*Reporting bias: reflects (unknown)
bias of author
*Access: may be deliberately
withheld
*Administrative
*Annual reports
*Training courses
*Evaluation
methods
*Written report
for events
Arc
hiv
al *Same as those for documentation
*Precise and usually quantitative
*Same as those for documentation
*Accessibility limited for privacy
reasons
*Universities’
records

Chapter 4: Research Methodology 111
Evaluating Stakeholders’ Performance of ERP Systems in Saudi Arabia Higher Education Mona Althonayan
4.10 Pilot Study
Pilot studies in social science research generally have one of two functions:
feasibility studies (“small scale versions, or trial runs, done in preparation for the
major study”), or the pre-testing of a particular research instrument (Teijlingen and
Hundley, 2001). Lancaster (2010) defines a pilot study a “small study for helping to
design a further confirmatory study”.
4.10.1 Why a pilot study is important
A pilot study is important in any research. It is considered an essential step before
going further in testing the research hypotheses, for many reasons: it refines the data
collection plan, it helps the researcher to develop a relevant line of questions and it
provides some conceptual clarification of the research. Indeed, a pilot study can be so
important that more resources may be devoted to this phase of the research than to
the collection of data from any of the actual cases during the ‘real’ research (Yin,
2009, p. 92). It provides a vital opportunity for the researcher to make modifications
and revisions before going further, investing in a large study and possibly incurring
heavy losses in terms of time, effort and money, especially when the scope of the
research is wide, the sample is large and quantitative measures are used. It is then
important to run a test with a smaller sample, to help the researcher to ensure the
validity of the study design and its ability to capture the required data, as well as to
ascertain the reliability of the measuring instruments used in testing the research
hypotheses. In addition, a pilot study may give advanced warning of where the main
research project could fail (Teijlingen and Hundley, 2001). The difference between a
pilot report and an actual study report is that the former should be clear about the
lessons learned for both research design and field procedures (Yin, 2009).
Therefore, the researcher conducted a pilot study as a preliminary ‘prototype model’,
to evaluate the efficacy of the instruments to be used in testing the hypotheses and to
evaluate the utility of the study design, with a view to changing the hypotheses to be
tested if needed, although all the questions in the research questionnaire had already

Chapter 4: Research Methodology 112
Evaluating Stakeholders’ Performance of ERP Systems in Saudi Arabia Higher Education Mona Althonayan
been validated in prior studies, albeit in different settings. The participants in the
pilot study were 15 employees of the administration and management departments of
the three participating Saudi Arabian universities: six from KSU, five from KFU and
four from KFU OF P&M. All participants were cooperative in answering the
questionnaire. The researcher intended to test and ensure the reliability of the
methods and procedures of data collection in order to be more efficient in collecting
data from the full sample, considering the comments and changes made as a result of
the pilot phase.
4.10.2 Content validity, construct validity and reliability
Although the questionnaire items were derived from previous studies and therefore
validated to some extent, they had been adapted to suit the research objectives, so it
was decided to undertake further validation. Their validity was ascertained through
pilot work on the research instrument with an academic from a Saudi university who
was expert in the field of ERP systems and who checked the relevance and
appropriateness of the instrument to achieve the research objectives, providing
evidence of face validity. Content validity was ensured by the procedures used to
develop the research instrument: (a) conducting a thorough examination of the
previous empirical and theoretical work of researchers within the field, upon which
the operational definition of each variable was based; (b) conducting a pilot study
before starting the fieldwork.
4.11 Data analysis
As this research has adopted various data-gathering approaches, data analysis was
accordingly driven by both quantitative and qualitative elements. The main analysis
of quantitative data was done by means of the SPSS program (version 20).
According to Yin (2009), research based on case studies should build clearly on
analysis and the analytical technique sometimes known as ‘thematic analysis’,
defined by Braun and Clarke (2006) “a method for identifying, analysing and
reporting patterns within data”. Therefore, this research has built its own analysis
plan and data processing practice regarding the analytical techniques applied to the
qualitative and quantitative parts of the data.

Chapter 4: Research Methodology 113
Evaluating Stakeholders’ Performance of ERP Systems in Saudi Arabia Higher Education Mona Althonayan
4.12 Sample
The researcher chose to limit data collection to three universities, while the nature of
the research into stakeholders’ experience and of the ERP systems implemented at
each university meant that the size of the sample was limited to those administrative
officials and managers who used these systems in their daily work. A major concern
in the design of any research is the sampling technique used to obtain a
representative subset of the population under study. Choosing the right technique
depends on the nature of research method; Teddlie and Yu (2007) thus list four types
of sampling. The first is probability sampling, a technique often used in quantitative
research. The second type is purposive sampling, primarily used in qualitative
studies. The third type is convenience sampling, which involves identifying
participants who are both easily accessible and willing to participate. Finally, there
are mixed-method sampling strategies, which were considered appropriate because
this research takes a mixed-method approach to data collection; these are discussed
in the following subsection.
4.12.1 Mixed-method sampling
Teddlie and Yu (2007) explain that mixed-method sampling strategies “involve the
selection of units or cases for research study using both probability sampling to
increase external validity, and purposive sampling strategies to increase
transferability”. They propose a fourfold typology of basic, sequential, concurrent
and multilevel mixed-method sampling. Given the scope of the present research, it
was decided to use concurrent mixed-method sampling, which utilizes a single
sample generated through the joint use of probability and purposive techniques to
generate data for the quantitative and qualitative strands respectively. Table 4.6 sets
out the characteristics of mixed-method sampling strategies.
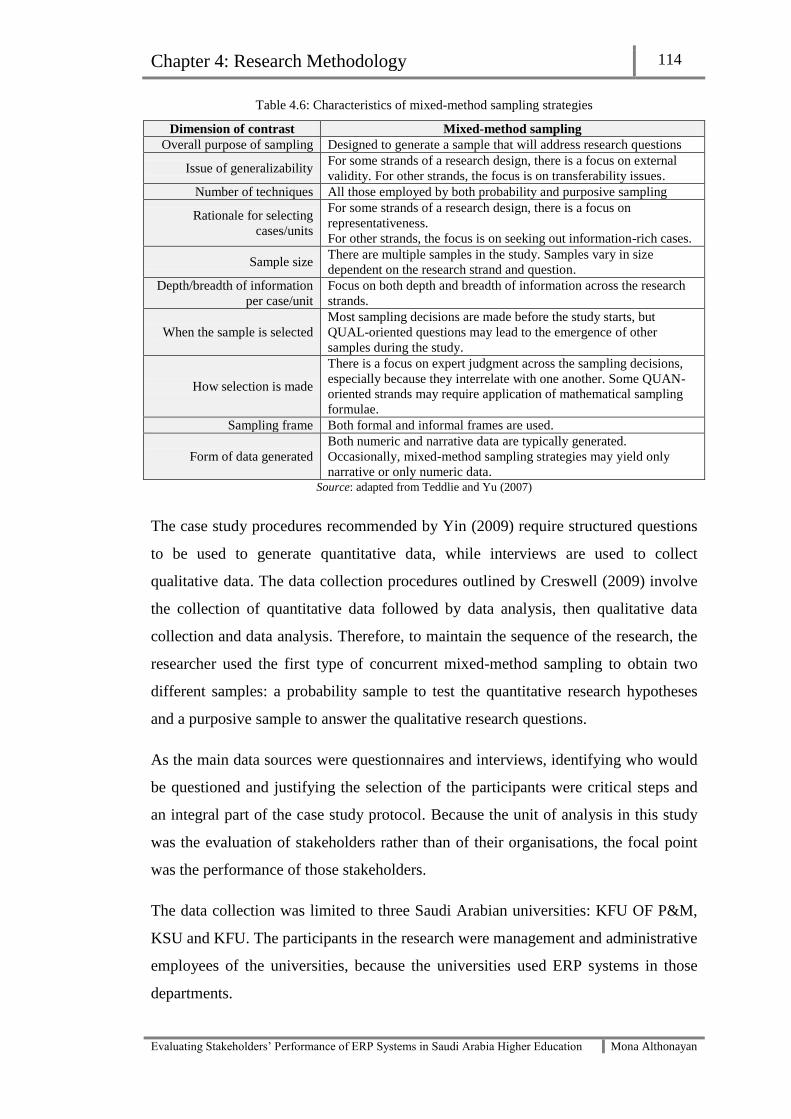
Chapter 4: Research Methodology 114
Evaluating Stakeholders’ Performance of ERP Systems in Saudi Arabia Higher Education Mona Althonayan
Table 4.6: Characteristics of mixed-method sampling strategies
Dimension of contrast Mixed-method sampling
Overall purpose of sampling Designed to generate a sample that will address research questions
Issue of generalizability For some strands of a research design, there is a focus on external
validity. For other strands, the focus is on transferability issues.
Number of techniques All those employed by both probability and purposive sampling
Rationale for selecting
cases/units
For some strands of a research design, there is a focus on
representativeness.
For other strands, the focus is on seeking out information-rich cases.
Sample size There are multiple samples in the study. Samples vary in size
dependent on the research strand and question.
Depth/breadth of information
per case/unit
Focus on both depth and breadth of information across the research
strands.
When the sample is selected
Most sampling decisions are made before the study starts, but
QUAL-oriented questions may lead to the emergence of other
samples during the study.
How selection is made
There is a focus on expert judgment across the sampling decisions,
especially because they interrelate with one another. Some QUAN-
oriented strands may require application of mathematical sampling
formulae.
Sampling frame Both formal and informal frames are used.
Form of data generated
Both numeric and narrative data are typically generated.
Occasionally, mixed-method sampling strategies may yield only
narrative or only numeric data. Source: adapted from Teddlie and Yu (2007)
The case study procedures recommended by Yin (2009) require structured questions
to be used to generate quantitative data, while interviews are used to collect
qualitative data. The data collection procedures outlined by Creswell (2009) involve
the collection of quantitative data followed by data analysis, then qualitative data
collection and data analysis. Therefore, to maintain the sequence of the research, the
researcher used the first type of concurrent mixed-method sampling to obtain two
different samples: a probability sample to test the quantitative research hypotheses
and a purposive sample to answer the qualitative research questions.
As the main data sources were questionnaires and interviews, identifying who would
be questioned and justifying the selection of the participants were critical steps and
an integral part of the case study protocol. Because the unit of analysis in this study
was the evaluation of stakeholders rather than of their organisations, the focal point
was the performance of those stakeholders.
The data collection was limited to three Saudi Arabian universities: KFU OF P&M,
KSU and KFU. The participants in the research were management and administrative
employees of the universities, because the universities used ERP systems in those
departments.

Chapter 4: Research Methodology 115
Evaluating Stakeholders’ Performance of ERP Systems in Saudi Arabia Higher Education Mona Althonayan
4.13 Research strategy
4.13.1 Case study methodology
According to Yin (2009), any research method can be used for three purposes:
exploratory, descriptive and explanatory. The present research is explanatory and
uses positivist case study techniques.
Although there is no standard definition of a case study (Benbasat, Goldstein, and
Mead, 1987), several researchers have given definitions, including Yin (2009, p. 18),
who defines it as “an empirical inquiry that investigates a contemporary
phenomenon within its real-life context, especially when the boundaries between
phenomenon and the context are not clearly evident”. Benbasa, Goldstein, and Mead
(1987) define a case study as one which “examines a phenomenon in its natural
setting, employing multiple methods of data collection to gather information from
one or a few entities (people, groups, or organizations”, while Gerring (2004)
proposes a simpler definition: “an intensive study of single unit for the purpose of
understanding a larger class of similar units”.
Gerring (2004) outlines five characteristics of the case study: (a) the method is
qualitative; (b) the research is ethnographic, clinical, participant-based or
observational in the field; (c) the research is characterised by process-tracing; (d) the
research investigates the properties of a single case; (e) the research investigates a
single phenomenon, for instance the most common usage.
For the last two decades, case study research has been increasingly accepted in IS
studies (Benbasat, Goldstein, D., and Mead, 1987; Orlikowski and Baroudi, 1991;
Klein and Myers, 1999). Therefore, IS researchers find themselves trailing behind
practitioners in proposing changes or evaluating methods for developing new
systems; they believe that the case study is well suited to capturing the knowledge of
the practitioners and developing theories from it. Moreover, the IS field has shifted
from technological to managerial and organizational questions with consequently
more interest in how context and innovation interact, according to Benbasat et al.
(1987), who, list three reasons for IS researchers to choose a case study research
strategy:

Chapter 4: Research Methodology 116
Evaluating Stakeholders’ Performance of ERP Systems in Saudi Arabia Higher Education Mona Althonayan
The researcher can study information systems in a natural setting, learn about
latest practice and generate theories from practice.
The case method allows the researcher to answer ‘how’ and ‘why’ questions; that
is, to understand the nature and complexity of processes taking place.
It is an appropriate way to research an area in which few previous studies have
been carried out.
4.13.2 Types of case study
According to Bryman and Bell (2007), before starting any research, it is important to
consider a distinction between different types of case study:
The critical case: the researcher has a clearly specified hypothesis, and a case is
chosen on the grounds that it will allow a better understanding of the
circumstances in which the hypothesis will and will not hold.
The unique case: the unique or extreme case is often the focus of clinical studies.
The revelatory case: the basis of the revelatory case exists “when the investigator
has an opportunity to observe and analyse phenomena previously inaccessible to
scientific investigation”.
The representative or typical case: this type seeks to explore a case that
exemplifies an everyday situation or form of organization.
The longitudinal case: this is concerned with how a situation changes over time.
4.13.3 Multiple case studies
There is a continuing debate among researchers concerning whether single or
multiple case studies are better. According to Yin (2009, p. 47), case study research
is not confined to the study of a single case. Nonetheless, a single case may be a
useful choice in specific situations. A single case study is appropriate if:
It is a critical case for testing a well-formulated theory;
It is a revelatory case;
It is an extreme or unique case;
It is a representative or typical case; or
It is a longitudinal case.

Chapter 4: Research Methodology 117
Evaluating Stakeholders’ Performance of ERP Systems in Saudi Arabia Higher Education Mona Althonayan
Conducting multiple-case study designs has become increasingly common in IS.
According to Benbasat, Goldstein, and Mead (1987), multiple case designs are
desirable when the intent of the research is description, theory building, or theory
testing. Moreover, multiple case designs allow for cross-case analysis and the
extension of theory. Additionally, multiple cases yield more general research results.
Yin (2009) and Komier, Cooper and Geurts (2000) explain the rationale for multiple
case studies as shown in Table 4.7, while Table 4.8 compares the case study with
other strategies.
Table 4.7: Comparison between multiple and single case study
Multiple case study Single case study
Holistic
-Each individual case may consist of
multiple holistic cases or multiple
embedded cases.
-The difference between these two
depends upon the type of phenomenon
being studied and the research questions.
- Conducting multiple case studies cannot
be taken lightly.
-The holistic design is advantageous
when no logical subunits can be
identified.
-When the relevant theory underlying
the case study is itself of a holistic
nature.
Methodology -Multiple case study is adequate to answer
when, how and why questions.
Embedded
-In embedded design, a study may call for
the conduct of a survey at each case study
site.
-When the case study focuses only on
the subunit level and fails to return to
the larger unit of analysis.
Replication
-Multi-case study design should follow
replication, not sampling logic.
-Each case must be chosen carefully.
-Replication with single case study is
not possible.
Flexibility
-Case study design should be modifiable
by new information or discovery during
data collection.
-Case study design should be
modifiable by new information or
discovery during data collection.
Resources
-Require extensive resources
-The evidence is considered more
compelling and the overall study is
therefore more robust
- Multiple experiment or multiple survey
are considered
-Extensive resources not required.
-Single experiment.
Data analysis
-Will be more powerful, substantial and
stronger in effect, because of contrasting
(comparable) situations.
- Cases do not represent a ‘sample’; they
are generalizable to theoretical
propositions, not to populations
-Single case designs are vulnerable.
-The results may be viewed with
scepticism.

Chapter 4: Research Methodology 118
Evaluating Stakeholders’ Performance of ERP Systems in Saudi Arabia Higher Education Mona Althonayan
Table 4.8: Comparison of the case study with other forms of inquiry
Case Study Experiment Survey
Investigate Single or small number
of cases
Relatively large
number of cases.
Relatively large number of
cases.
Data collected
and analysed
about
Large number of
features of each case
A small number of
features of each case. Few features of each case.
Study of
Naturally occurring
case where the aim is
not to control variables.
Case where aim is to
control important
variables
Naturally occurring case
selected to maximise sample’s
representativeness of wider
population.
Quantification
of data Not a priority. Priority. Is a priority.
Using Many methods and
sources of data. One method. One method.
Aiming to Look at relationships
and processes. Look at causation. Look for generalisation.
4.13.4 The reasons for choosing the cases
There were three main reasons for choosing the particular cases: the chosen
universities were the largest and oldest in the KSA; they are all public universities;
they had all been using ERP systems for more than three years; implemented ERP
system in similar departments; and they were similar in certain important
characteristics (e.g. number of students, staff, faculty and departments which had
implemented the systems concerned).
Source: Adapted from Thomas (2011)

Chapter 4: Research Methodology 119
Evaluating Stakeholders’ Performance of ERP Systems in Saudi Arabia Higher Education Mona Althonayan
4.13.5 Research strategy and design
This research applies a quantitative paradigm, using a multiple case studies from the
HE as a public sector in KSA as the main approach of enquiry. The researcher
therefore perceives reality as something developed through an interaction between
different variables in the context. As discussed in section 4-4.4, this ontological
stance leads to the epistemological perspective that assumes positivisting phenomena
to understand quantitatively rather than measure such an evaluation qualitatively.
The main area of the research is ERP system evaluation from stakeholders’ aspects in
KSA HE; in particular, the cases are from technological-driven changes in the public
sector. It is found that that an integrative approach based on a multi-disciplinary
review of the literature can help in developing an in-depth understanding of the
phenomenon being researched. The initial finding from this review was the need to
bridge gaps in knowledge in terms of the ERP systems evaluation from the social
aspects, and therefore, there is a need to accumulate a theory and practice in this
filed. To do so, this research applies the D&M, TTF and EUCS, models and validates
and modifies these models. Other components and the main dimensions of the
research strategy are encapsulated in Figure 4-8

Chapter 4: Research Methodology 120
Evaluating Stakeholders’ Performance of ERP Systems in Saudi Arabia Higher Education Mona Althonayan
Evaluate the performance of ERP systems in
HE of KSA from stakeholders’ perspective
Area of
study
Ontological and
Epistemological
Assumptions
Positivist epistemology
Phenomenon
Analysed
Develop a framework to help decision makers and practitioner
in HE as a public sector in KSA to evaluate their stakeholders
performance and get the benefit from ERPS implementation
Literature
Review
Multi-disciplinary and integrative literature synthesisation
based on reviewing literature in ERP system, evaluation
methods, stakeholders’ aspects in IS in general and ERPs in
particular, and HE as public sector.
Theory Applied
The D&M model, TTF and EUCS
Multiple Case studies
Empirical inquiry
Approach
Research
Process
Type of Sample
Data Collection
Data Analysis
Concurrent mixed-method sampling
Mixed Method approach: multi-informant semi-structured
questionnaire, structured interviews, and documents, archival
record.
Based on a combination of John Creswell mixed method design,
Yin‘s case study strategies and analytical techniques to analyse
case study data.
Three phases 1st phase pilot study-2nd phase Questionnaire -
3nd phase interview
Figure 4.8: Research process

Chapter 4: Research Methodology 121
Evaluating Stakeholders’ Performance of ERP Systems in Saudi Arabia Higher Education Mona Althonayan
4.13.6 Research process
The research is divided into three main sections and/or steps as shown in Figure 4-8,
starting with the main structuring of the idea and developing the ‘what’ question
about the research. The second phase was the data collection stage and the ‟how’’
part of the study, and finally comes the interpretation, explanation and analysis of the
collected data, or the ‟why’’ part of the phenomenon. The research structure begins
with a literature review of in ERP system and evaluation methods in the public sector
of KSA HE. The researcher decided to study this phenomenon by integrating three IS
models into a theoretical model. Consequently, a data collection strategy built base
on both quantitative and qualitative paradigm was developed, based on the objective
of the research, which is focused on understanding and analysing the phenomenon.
The data collection strategy was divided into a pilot exploratory stage and the main
fieldwork. Data analysis and interpretation were conducted as a final stage through
applying well-structured strategies based on the work of Creswell (2009) and (Yin
(2009; 2010).
4.14 Summary
This chapter has explained the methodology in detail. It began by considering the
ontological, epistemological and theoretical foundation of the positivist approach,
which forms the basis of this research, and the justification for its selection. The
quantitative paradigm was found to be applicable because it matched the researcher’s
ontological and epistemological stances. A hybrid data technique (mixed-method
approach) was adopted as appropriate to the research context. Focusing on a social
phenomenon that involves the performance of stakeholders in ERP systems, multiple
perspectives must be taken into account. The use within the two phases of the
research of data-gathering instruments from both quantitative and qualitative strands
was justified, including the use of a questionnaire, semi-structured interviews,
documentation and archival research.
The data analysis techniques used in the quantitative and qualitative phases were also
explained and justified. There was then a discussion of the research credibility issue,
through amplification of the triangulation method used in the research. Numerous
types of triangulation were considered for use in this research; for example, data

Chapter 4: Research Methodology 122
Evaluating Stakeholders’ Performance of ERP Systems in Saudi Arabia Higher Education Mona Althonayan
theory, methodological and multidiscipline triangulations were discussed with
reference to supporting the validity, reliability and potential for generalisation of the
research findings. This chapter also justified the use of the concurrent mixed-method
sampling technique and explained its relation to the mixed-method research
approach. Finally, the chapter justified the choice of multiple case studies and of the
specific cases.
The next chapter describes the fieldwork, including a comprehensive description of
each case study. It presents the findings of the quantitative phase and compares these
with reports from the relevant literature.
Chapter 5: Case Studies and Results of Quantitative Phase 123
Evaluating Stakeholders’ Performance of ERP Systems in Saudi Arabia Higher Education Mona Althonayan
PAGE
5.1 Overview…………………………………………………………………… 125
5.2. Kingdom of Saudi Arabia………………………………………………... 125
5.3. Higher education in Saudi Arabia………………………………………. 127
5.3 Case study one…………………………………………………………….. 128
5.3.1 King Saud University…………………………………………………. 128
5.3.2 The MADAR system………………………………………………….. 129
5.3.3 Quantitative analysis………………………………………………….. 130
5.3.3.1 Reverse coding of negatively worded items……………………….. 130
5.3.3.2 Factor analysis……………………………………………………… 130
5.3.3.5.1 System quality……………………………………………………. 135
5.3.3.6.1 Service quality…………………………………………………… 138
5.4 Case study two ……………………………………………………………. 144
5.4.1 King Fahd University of Petroleum and Minerals………………….. 144
5.4.2 Oracle system…………………………………………………………. 144
5.4.3 Quantitative analysis………………………………………………….. 146
5.4.3.3 System quality……………………………………………………… 146
5.4.3.4 Service quality……………………………………………………… 150
5.5 Case study three…………………………………………………………… 153
5.5.1 King Faisal University………………………………………………… 153
CHAPTER FIVE
CASE STUDIES AND
RESULTS OF
QUANTITATIVE PHASE

Chapter 5: Case Studies and Results of Quantitative Phase 124
Evaluating Stakeholders’ Performance of ERP Systems in Saudi Arabia Higher Education Mona Althonayan
PAGE
5.5.2 Oracle system………………………………………………………….. 154
5.5.3 Quantitative analysis………………………………………………….. 156
5.5.3.3 System quality ……………………………………………………… 156
5.5.3.4 Service quality ……………………………………………………… 161
5.6 Universities compared ……………………………………………………. 167
5.6.1 KSU, KFU and KFUPM……………………………………………… 168
5.6.2 KSU and KFU…………………………………………………………. 171
5.6.3 KSU and KFUPM……………………………………………………... 173
5.6.4 KFU and KFUPM…………………………………………………….. 175
5.7 All universities ……………………………………………………………. 177
5.8 Summary…………………………………………………………………... 189

Chapter 5: Case Studies and Results of Quantitative Phase 125
Evaluating Stakeholders’ Performance of ERP Systems in Saudi Arabia Higher Education Mona Althonayan
5.1 Overview
This chapter reports the results of the three case studies. The method of triangulation
of data is used to investigate the theory established for this research regarding the
impact of ERP systems on stakeholders’ performance. The chapter is organized as
follows: it begins with an introduction to the Kingdom of Saudi Arabia, then
discusses the growth there of higher education and of the adoption of IS in general
and ERP systems in particular in Saudi Arabian universities. Responding to the need
for a better understanding of the post-implementation impact of ERP systems, it then
reports on quantitative and qualitative case studies of three of the largest and oldest
universities in Saudi Arabia, with a brief history of each university and of the ERP
systems which they have adopted.
The quantitative method of data analysis is applied to the results in three steps:
presenting the result of each case separately, then comparing the cases and finally
considering all of the results together to assess the impact of the ERP systems on
performance in general. The chapter ends with a summary of the main results of the
quantitative phase of the study.
5.2. Kingdom of Saudi Arabia
The Kingdom of Saudi Arabia extends to approximately 2,250,000 square kilometres
between the Arabian Gulf on the east and the Red Sea on the west. With the United
Arab Emirates, Qatar and Bahrain to the east, Saudi Arabia shares borders with
Kuwait, Iraq and Jordan in the north and Yemen and Oman in the south. The largest
country in the Middle East, it occupies four-fifths of the Arabian Peninsula. More
than 95% of the territory is desert and semi-desert. Figure 5.1 shows a map of the
country.
King Abdulaziz Al Saud, who by 1932 had succeeded in unifying the country into a
Kingdom, founded modern Saudi Arabia. He died in 1953, but his legacy lives on in
his direct descendants, who rule Saudi Arabia to this day. The country has made
considerable progress under their reign and today, travellers to Saudi Arabia can
experience both new and old civilizations side by side.

Chapter 5: Case Studies and Results of Quantitative Phase 126
Evaluating Stakeholders’ Performance of ERP Systems in Saudi Arabia Higher Education Mona Althonayan
The greatest prophet of Islam, Mohammed (peace be upon him) was born in Arabia,
and Islam subsequently spread from Arabia throughout the world. Therefore, this
religion is the foundation of Saudi culture. Millions of pilgrims visit the holy cities of
Makkah and Madinah (Mecca and Medina) each year as part of their religious
observance.
Turning to the economic sphere, Saudi Arabia has played a significant role in
international trade for centuries because of its strategic location near the sea trade
routes which were used to transport goods between India, China and Europe. A
flourishing trade in incense, spices and myrrh (used in medicine and cosmetic balms)
was also conducted by the ancient inhabitants of the Arabian Peninsula, the
Egyptians and the Phoenicians.
Oil was first discovered in Saudi Arabia in 1936, and by 1950 the country had
become a major oil producer. The Kingdom has at least 25% of the world’s oil
reserves and is the undisputed leader of the international oil industry. Its oil revenues
have been used to diversify the economy, reclaiming land from the desert and
establishing the infrastructure (roads, telephone systems, modern cities, hospitals,
and power stations) needed for further development (Saudi Arabian map, 2012).
Figure 5.1: The Kingdom of Saudi Arabia

Chapter 5: Case Studies and Results of Quantitative Phase 127
Evaluating Stakeholders’ Performance of ERP Systems in Saudi Arabia Higher Education Mona Althonayan
5.3. Higher education in Saudi Arabia
Comprehensive development work is taking place across the Kingdom in all fields,
and higher education is no exception; it is a pillar of the successful development of
any country. Therefore, Saudi Arabia began focusing on higher education when the
country entered a new epoch of rapid development in the early 1970s. A royal decree
numbered 1/236 in 8/5/1395 AH (AD 1975) established the Ministry of Higher
Education to foresee the execution of the national higher education (HE) policy.
The Higher Education Council is the supreme authority for higher education affairs,
with the specific task of supervising, planning and coordinating the activities of
universities and other HE institutions, with the sole exception of military education.
It is also responsible for the execution of the government’s HE policy by formulating
rules and regulations for compliance by all institutions of higher learning in the
Kingdom, in order to achieve the goals of national development, to make sure that
the Saudi educational system provides the highly skilled manpower the Kingdom
needs to run its increasingly sophisticated economy and to prepare a national cadre
specialized in the administrative and scientific fields. The Council also proposes the
establishment of HEIs and authorizes them to offer special programmes in
accordance with the country’s needs. A further aim is to encourage scientific
departments to award higher degrees and to conduct scientific research. Finally, the
Council is charged with representing the government abroad in all educational and
cultural affairs, through various cultural and educational offices in 32 countries.
The higher education system in Saudi Arabia is, to a certain degree, similar to that of
the United States, although its patterns and procedures have been adapted in
accordance with Islamic systems, traditions and customs. Higher education in Saudi
Arabia has undergone rapid growth over the last five decades. Hence, higher
education specialists recognize that the field is characterized by continuous change,
from privatization to financing, foreign competition and the fluctuating requirements
of the labour market. This has made it necessary to prepare for change by careful
planning and well-thought handling of these parameters, resulting in expansion, self-
evaluation, the initiation of programmes and the creation of organizations that focus
on local and global endeavours. As a consequence of generous state support and

Chapter 5: Case Studies and Results of Quantitative Phase 128
Evaluating Stakeholders’ Performance of ERP Systems in Saudi Arabia Higher Education Mona Althonayan
huge budget allocations, it has been possible to establish many new universities and
colleges of science. Thus, the Saudi higher education system, which is based on
diversification, has expanded to include 24 government universities, six private
universities and colleges, 18 primary teachers’ colleges for men and 80 for women,
37 colleges and institutes of health, 18 private colleges and 12 technical colleges.
This diversity allows students to study a very wide range of disciplines, not all of
them purely academic. The Ministry of Higher Education follows contemporary
trends in scientific research and strategic planning. Most of the universities and
colleges offer graduate study programmes which grant masters and doctoral degrees
in some fields. Like other elements of the educational system in the Kingdom, higher
education is designed and evaluated in relation to the overall national development
plan, and is considered essential for fulfilling the potential of the Kingdom’s greatest
resource: its people.
5.3 Case study one
5.3.1 King Saud University
The progress of any nation has always been strongly associated with knowledge
and learning. King Saud University (KSU), the premier institution of higher
education in the Kingdom of Saudi Arabia, was established in 1957 (as the first
university in the Kingdom) to enhance the nation’s growth and respond to the
educational needs of a new generation. Through strong government support and
many highly qualified professionals and administrators, KSU has supplied the
Saudi people and market with years of invaluable service and served as a
traditional source of the skilled professionals and academics needed to meet the
nation’s growing needs in the areas of medicine, engineering, agriculture, science
and development, the humanities and language.
KSU is not limited to teaching and research, however, but extends its practical and
vital academic functions to the development of Saudi health care and the needs of
the private sector. The University seeks to become a leader in educational and
technological innovation, scientific discovery and creativity through fostering an

Chapter 5: Case Studies and Results of Quantitative Phase 129
Evaluating Stakeholders’ Performance of ERP Systems in Saudi Arabia Higher Education Mona Althonayan
atmosphere of intellectual inspiration and partnership for the prosperity of society.
It aspires to meet the educational and development needs of society by providing
high quality academic programmes, pioneering innovative research and creative
articulation, and through active involvement in the community for the cultural
development and economic prosperity of the country. Among the many
departments established since the university was founded, the Department of
Computer and Information Science, Architecture and Planning was established in
1984, (King Saud University’s history 2012).
5.3.2 The MADAR system
MADAR is an enterprise system used by King Saud University to meet all of its
administrative software needs (Al-shamlan and Al-mudimigh, 2011). The MADAR
project is responsible for developing, implementing and maintaining ERP projects
within KSU and has experience of implementing many projects for other
organisations in Saudi Arabia. Its strengths are integration and collaboration and
these organisations are very contented with the results of integration (Al-mudimigh
and Ullah, 2011). Table 5.1 lists the departments which have implemented the
MADAR system at KSU.
Table 5.1: KSU Departments implementing MADAR
System Implementation status Users Year implemented
Administration communications Implemented completely 2648 2008
Warehouse Implemented completely 341 2008
Warehouse surveillance Implemented completely 74 2008
Finance Implemented completely 49 2009
Purchases Implemented completely 252 2009
Human resources Implemented completely 927 2009
Budget Partially implemented ---- ----
Source: http://erp.ksu.edu.sa

Chapter 5: Case Studies and Results of Quantitative Phase 130
Evaluating Stakeholders’ Performance of ERP Systems in Saudi Arabia Higher Education Mona Althonayan
Table 5.2: shows in detail the number of participants (employees) at KSU and the
departments they work in.
Table 5.2: Profiles of the participants at KSU
Case Participant Role System
KSU
Employee 1to 10 Employee affairs MADAR
SYSTEM
Employee 11 to 15 Financial department
Employee 16 to 25 Human Resource
Employee 26 to 37 Procurement department
Employee 38 to 45 Warehouse department
Employee 46 to 50 Inventory management
Employee 51to 60 Purchasing department
Source: Originated by the researcher
5.3.3 Quantitative analysis
This section explains the method of data collection and the process of preparing and
analysing it so as to test the proposed hypotheses and answer the research questions.
5.3.3.1 Reverse coding of negatively worded items
Reverse coding was applied to eight items in the system quality impact section of the
questionnaire (flexibility, training, compatibility, lack of confusion; see appendix
B1). This step was essential because these questions had been negatively worded to
help prevent response bias. Therefore, their polarity had to be reversed before a total
score could be calculated for the scale (Pallant, 2010). It is important to ensure that
all questions are scored so that high scores indicate high levels of whatever is being
measured by the scale. As I indicated in chapter 4, the questionnaire responses were
on a five-point Likert-type scale, where 1=strongly disagree and 5=strongly agree.
There are two ways to apply reverse coding, either by rescoring the variables
concerned under the same names or by creating new variables, rather than
overwriting the existing data. The latter was adopted as a much safer option, which
retained the original data unchanged.
5.3.3.2 Factor analysis
Factor analysis is a technique which can be employed to investigate the ability of a
predefined factor model to fit an observed set of data. It is also used to establish the

Chapter 5: Case Studies and Results of Quantitative Phase 131
Evaluating Stakeholders’ Performance of ERP Systems in Saudi Arabia Higher Education Mona Althonayan
validity of each individual factor separately. The collected data were statistically
analysed using principal component factor analysis with a varimax orthogonal
rotation technique through SPSS. A principal component factor analysis was
executed separately on each of the research dimensions (i.e. Stakeholder
performance, System quality and Service quality) comprising 6, 14, and 4 items
respectively on each of the scores for all the universities combined together. The
items were allocated to a particular construct in case their factor loadings exceeded
50% each. It is notable that the stakeholders’ performance and service quality
dimensions of our research model were left unchanged, whereas for the system
quality dimension, three factors (system quality1, system quality2 and system
quality3) were extracted. Loadings of variables on factors, the percentage of
explained variance and eigenvalues are reported in Table 5.3.

Chapter 5: Case Studies and Results of Quantitative Phase 132
Evaluating Stakeholders’ Performance of ERP Systems in Saudi Arabia Higher Education Mona Althonayan
Table 5.3: Factor analysis of the research items
Constructs and Items Eigenvalue
%
explained
variance
Factor
loadings
STAKEHOLDER PERFORMANCE 3.906 65.105
SH1 Improve stakeholder productivity 0.8
SH2 Time taken to complete task 0.879
SH3 Confidence & performance 0.874
SH4 Computer awareness 0.833
SH5 Immediate recall of information 0.647
SH6 Ability to identify problems and solutions 0.784
SYSTEM QUALITY1 4.914 27.711
SQ1 Content 0.775
SQ2 Format 0.79
SQ3 Timeliness 0.785
SQ4 Accessibility 0.829
SQ5 Assistance 0.582
SQ7 Ease of use 0.525
SQ10 Accuracy 0.511
SQ12 Currency 0.585
SYSTEM QUALITY2 2.094 19.667
SQ6 Authorization 0.709
SQ8 Flexibility 0.7
SQ11 Compatibility 0.587
SQ13 Right data 0.668
SQ14 Lack of confusion 0.718
SYSTEM QUALITY3 1.062 10.264
SQ9 Training 0.866
SERVICE QUALITY 2.396 59.91
SVQ1 Tangible 0.729
SVQ2 Reliability 0.783
SVQ3 Responsibility 0.819
SVQ4 Assurance 0.762
As can be seen, the eigenvalue for stakeholders’ performance is equal to 3.906 and
corresponds to 65% of the variance in the original data, while the eigenvalue for
service quality is equal to 2.396, corresponding to 59.910% of the variance in the
original data. For the system quality dimension, the first eigenvalue is equal to 4.914,
corresponding to 27.711% of the variance in the original data. The second eigenvalue
is equal to 2.094 and associated with 19.667% of the variance in the original data.
The third eigenvalue is equal to 1.062 and corresponds to 10.264% of the variance in

Chapter 5: Case Studies and Results of Quantitative Phase 133
Evaluating Stakeholders’ Performance of ERP Systems in Saudi Arabia Higher Education Mona Althonayan
the original data. Together, the three factors explain 57.642% of the variance in the
original data.
It is worth mentioning that although the principal component analysis results
recommended the clustering of the system quality factors into three categories, the
original model will be kept as it is for three reasons: first, the purpose of the factor
analysis is to take a large set of variables (50 or more) and summarise or reduce them
to a smaller set of components, whereas the number of variables measured in this
research is less than this. The second reason is that the larger the research sample, the
better the results, because factors obtained from small datasets do not generalise as
well as those derived from larger samples (Pallant, 2010, p 183). Finally, all factors
under the dimension of systems quality are referred to in the literature as having been
previously used in one component (e.g. Petter et al., 2008; Abougabah et al., 2009;
DeLone & McLean, 2003; Sedera and Gable, 2003; Sedera and Gable, 2004; Zhang
et al., 2005; Ifinedo and Nahar, 2006; Calisir and Calisir, 2004; Chin and Tsaur,
2007). To conclude, for the purpose of evaluating the stakeholders’ performance in
this study, the researcher decided to keep the original model with three components:
performance impact, system quality and service quality.
5.3.3.3 Data preparation
To avoid making mistakes when entering the data, it was crucial for the researcher to
prepare the data, ensuring that it was clean and ready before proceeding with the
analysis. Hence, the researcher conducted data screening to make sure that data were
normally distributed, missing values were dealt with and outliers were omitted for all
three cases. This enhanced the accuracy and quality of the results. Missing data is
one of the most general problems in data analysis (Tabachnick and Fidell, 2007). It is
very important to examine data files for missing data, because it is very rare to find
complete data, especially if the research involves human participants. Moreover,
missing values can happen either randomly or where there is some systematic pattern
(Pallant, 2010). When the data were therefore examined carefully, three
questionnaires (5% of the 60 which were suitable for data analysis after the initial
screening) were found to have data missing from them. These missing values were
found to be distributed randomly, so no bias was to be expected; thus, the excluded

Chapter 5: Case Studies and Results of Quantitative Phase 134
Evaluating Stakeholders’ Performance of ERP Systems in Saudi Arabia Higher Education Mona Althonayan
cases pairwise method was applied to treat missing values, as recommended by
Tabachnick and Fidell (2007) and Pallant (2010).
5.3.3.4 Reliability test
Internal consistency within the research instrument was assessed by measuring the
reliability coefficient known as Cronbach’s alpha, which refers to the level of
homogeneity among the measured items in one or more sets. The items were
clustered into particular dimensional groups and Cronbach’s α was calculated. The
total questionnaire, which consisted of 24 questions, had a coefficient score of 0.931,
which is considered to represent high internal consistency. In addition, the
performance, system quality and service quality constructs had Cronbach’s α scores
of 0.899, 0.865 and 0.792 respectively, indicating strongly acceptable levels of
internal consistency. According to Nunnally (1978), reliability coefficients equal to
or exceeding 0.5 are considered sufficient for research that is exploratory in nature.
The Cronbach’s α result for the KSU questionnaire data are shown in Table 5.4.
Table 5.4: Reliability test on KSU data
Construct Number of
items
Cronbach’s
Alpha Reliability
Total KSU questionnaire 24 0.931 Excellent
Performance 6 0.899 High
System quality 14 0.865 High
Service quality 4 0.792 High
5.3.3.5 Multiple regressions
Multiple regressions is not just one technique but a set of statistical techniques,
popular in many disciplines, that can be used to explore and assess the relationship
between one continuous dependent variable and a number of independent variables
or predictions (Tabachnick and Fidell, 2007, p.117). Multiple regression is based on
correlation, but allows a more sophisticated exploration of the interrelationship
among a set of variables (Pallant, 2010).

Chapter 5: Case Studies and Results of Quantitative Phase 135
Evaluating Stakeholders’ Performance of ERP Systems in Saudi Arabia Higher Education Mona Althonayan
5.3.3.5.1 System quality
To more thoroughly test H1, multiple regressions was used to assess the relative
importance of the system quality variables in explaining differences in attitudes
towards stakeholder performance. Standard multiple regression (the Enter method)
was conducted, with the six stakeholder performance variables posited as the
dependent variables and the fourteen ERP system quality variables posited as the
independent variables.
The R2 values show that the fourteen system quality variables, as a group, explained
50.4% of the variation in improved stakeholder productivity, 68.5% of the variation
in time taken to complete task, 63.8% in stakeholder confidence and performance,
64.8% in computer awareness, 48.3% in immediate recall of information and 59.9%
in the ability to identify problems and solutions. According to Pallant (2006), these
are acceptable levels of accuracy for academic research, which rarely achieves the
high levels of variance required in real world research (e.g. medicine or marketing).
The F values show that there were highly significant relationships (p<.001) between
the fourteen ERP system quality variables and each of the stakeholder performance
variables. The model for time taken to complete a task had the largest F value, F(14,
59) = 7.004, p<.001, indicating that it was the most significant model, followed by
computer awareness F(14, 59) = 5.906, p<.001; stakeholder confidence and
performance, F(14, 59) = 5.656, p < .001; then ability to identify a problem and
solution, F(14, 59) = 4.808, p<.001; improved stakeholder productivity F(14, 59) =
3.269, p<0.01; and finally immediate recall of information F(14, 59) = 2.999, p<.01.
Turning now to the importance of each predictor, the standardised beta coefficient
(β) statistics were calculated to assess the unique contribution of each predictor to the
outcome and what effect a one standard deviation increase in each predictor would
have on the outcome.
Hypothesis 1: MADAR systems quality variables have a significant impact on
KSU stakeholders’ performance variables (H1.1 - H1.14)
Improved stakeholder productivity: Table 5.5 shows that among the 14 variables of
system quality, only timeliness had a significant impact on improving stakeholder
productivity, with a standardised beta coefficient of β = 0.501 at p<0.01. For every

Chapter 5: Case Studies and Results of Quantitative Phase 136
Evaluating Stakeholders’ Performance of ERP Systems in Saudi Arabia Higher Education Mona Althonayan
one standard deviation increase in timeliness, improved stakeholder productivity will
increase by 0.501 points. Thus, the regression equation to predict improved
stakeholder productivity is:
B1 Timeliness = 0.561 Timeliness.
Time taken to complete task: Table 5.5 also shows that only timeliness had a
significant impact on time taken to complete task (β = 0.588). For every one standard
deviation increase in timeliness, time taken to complete task will increase on average
by 0.588 points. Thus, the regression equation to predict time taken to complete task
is: B1 Timeliness = 0.691 Timeliness.
Table 5.5: Regression models for improved stakeholder productivity and time taken to complete task
influenced by system quality at KSU
Stakeholder confidence and performance: Table 5.6 shows that only two of the
fourteen system quality variables had a significant and negative impact on
stakeholder confidence and performance. These were timeliness (β = 0.399) and
flexibility (β = 0.393), indicating that for every one standard deviation increase in
timeliness and system flexibility, stakeholder confidence and performance will
increase on average by 0.399 and 0.393 points respectively. Thus, the regression
equation to predict stakeholder confidence and performance is:
B1 Timeliness + B2 Flexibility = 0.459 Timeliness + 0.364 Flexibility.
Computer awareness: Table 5.6 also shows that content and currency had a
significant positive impact on computer awareness, while format had a significant
Model STD CO Model STD CO t Sig.
ISP B Std. Error Beta TCT B Std. Error Beta
(Constant) 0.186 0.751 0.248 0.805 (Constant) -0.796 0.627 -1.269- 0.211
Accessibility -.222- 0.204 -.226- -1.089- 0.282 Accessibility -.154- 0.17 -.149- -.904- 0.371
Assistance -.084- 0.159 -.082- -.529- 0.599 Assistance -.148- 0.132 -.138- -1.119- 0.269
Ease of Use 0.29 0.178 0.245 1.629 0.11 Ease of Use 0.079 0.149 0.064 0.534 0.596
Accuracy 0.227 0.168 0.23 1.351 0.184 Accuracy 0.186 0.14 0.18 1.327 0.191
Currency 0.155 0.146 0.152 1.059 0.295 Currency 0.132 0.122 0.124 1.084 0.284
Content -.055- 0.207 -.048- -.266- 0.791 Content 0.335 0.173 0.277 1.935 0.059
Format -.164- 0.213 -.137- -.771- 0.445 Format -.160- 0.178 -.127- -.900- 0.373
Timeliness 0.561 0.2 0.501 2.807 0.007 Timeliness 0.691 0.167 0.588 4.139 0
Authorization -.029- 0.108 -.034- -.264- 0.793 Authorisation -.119- 0.09 -.133- -1.315- 0.195
Training 0.04 0.12 0.045 0.331 0.742 Training -.074- 0.1 -.080- -.738- 0.465
Right Data 0.049 0.177 0.054 0.279 0.781 Right Data 0.09 0.148 0.094 0.609 0.545
Lack of Confusion 0.054 0.142 0.062 0.384 0.703 Lack of Confusion -.097- 0.118 -.105- -.822- 0.415
Compatibility 0.048 0.207 0.041 0.232 0.817 Compatibility 0.244 0.173 0.198 1.415 0.164
Flexibility 0.157 0.149 0.174 1.053 0.298 Flexibility 0.237 0.125 0.25 1.901 0.064
UNSTD CO-Unstandardized Coefficients,STD CO-Standarized Coefficients
ISP=Improve Stakholders' Productivity, TCT= Time Tacken to Complete Task
USTD CO t Sig. USTD CO

Chapter 5: Case Studies and Results of Quantitative Phase 137
Evaluating Stakeholders’ Performance of ERP Systems in Saudi Arabia Higher Education Mona Althonayan
negative impact on it, with β = 0.308, 0.275 and -0.429 respectively at p<0.05. Thus,
the regression equation to predict computer awareness is:
B1 Content + B2 Currency + B3 Format = 0.395 Content + 0.312 Currency – 0.571
Format.
Table 5.6: Regression models for confidence and performance and computer awareness influenced by
system quality at KSU
Immediate recall of information: Table 5.7 shows that only system ease of use had a
significant impact on immediate recall of information, with a standardised Beta
coefficient of β = 0.329. Thus, the regression equation to predict immediate recall of
information is:
B1 Ease of use = 0.402 Ease of use.
Ability to identify problem and solution: Table 5.7 also shows that none of the
fourteen system quality variables had a significant impact on stakeholders’ ability to
identify problems and solutions, hence, there are no influential predictors.
Model STD CO Model STD CO t Sig.
CP B Std. Error Beta CA B Std. Error Beta
(Constant) -.083- 0.659 -.126- 0.9 (Constant) -.317- 0.704 -.450- 0.655
Accessibility 0.018 0.179 0.018 0.101 0.92 Accessibility 0.358 0.191 0.328 1.876 0.067
Assistance -.154- 0.139 -.147- -1.110- 0.273 Assistance -.168- 0.149 -.148- -1.128- 0.265
Ease of Use 0.252 0.156 0.207 1.61 0.114 Ease of Use 0.177 0.167 0.135 1.064 0.293
Accuracy -.018- 0.148 -.017- -.119- 0.906 Accuracy 0.245 0.158 0.224 1.556 0.127
Currency 0.217 0.128 0.207 1.691 0.098 Currency 0.312 0.137 0.275 2.276 0.028
Content 0.206 0.182 0.174 1.134 0.263 Content 0.395 0.194 0.308 2.034 0.048
Format -.179- 0.187 -.145- -.958- 0.343 Format -.571- 0.199 -.429- -2.866- 0.006
Timeliness 0.459 0.176 0.399 2.616 0.012 Timeliness 0.209 0.187 0.168 1.118 0.269
Authorisation -.173- 0.095 -.197- -1.816- 0.076 Authorization -.155- 0.102 -.163- -1.523- 0.135
Training -.117- 0.105 -.130- -1.112- 0.272 Training -.184- 0.112 -.189- -1.638- 0.108
Right Data 0.153 0.156 0.162 0.982 0.331 Right Data -.031- 0.166 -.030- -.184- 0.855
Lack of Confusion -.148- 0.124 -.163- -1.189- 0.241 Lack of Confusion -.148- 0.133 -.150- -1.111- 0.272
Compatibility 0.17 0.182 0.141 0.939 0.353 Compatibility 0.289 0.194 0.221 1.491 0.143
Flexibility 0.364 0.131 0.393 2.782 0.008 Flexibility 0.263 0.14 0.262 1.885 0.066
UNSTD CO-Unstandardized Coefficients,STD CO-Standarized Coefficients
CP=Confidence and Performance,CA = Computer Awareness
USTD CO t Sig. USTD CO
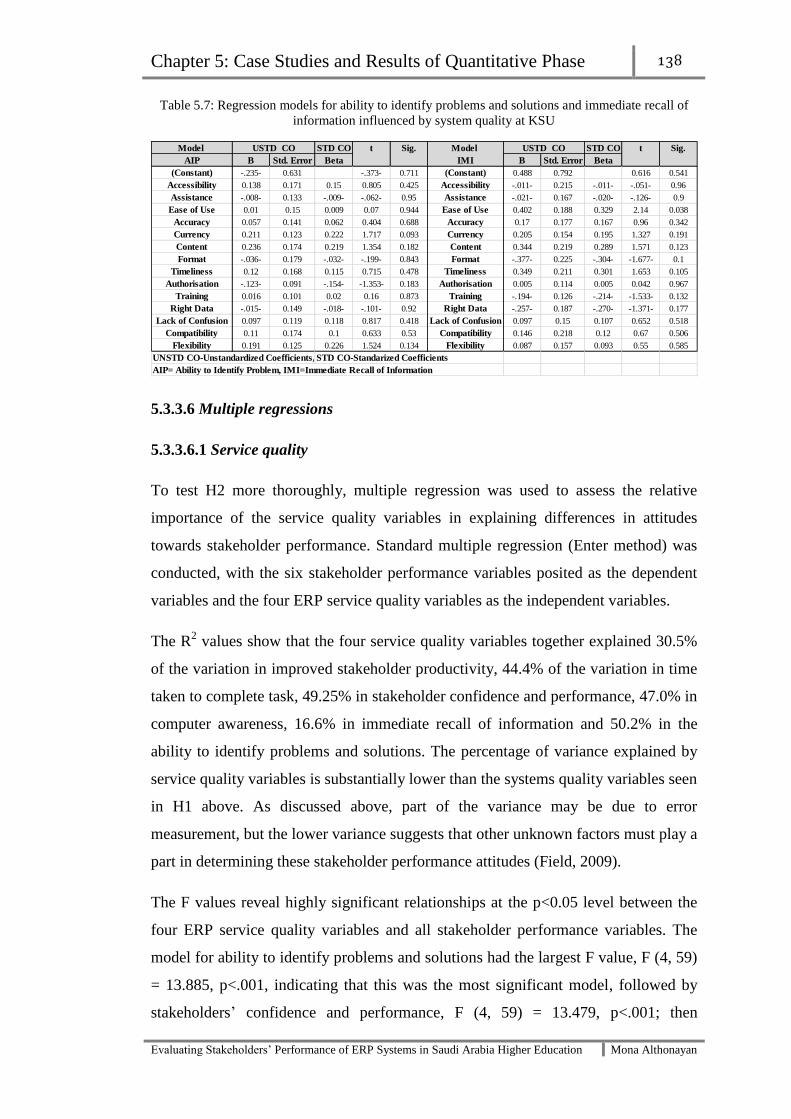
Chapter 5: Case Studies and Results of Quantitative Phase 138
Evaluating Stakeholders’ Performance of ERP Systems in Saudi Arabia Higher Education Mona Althonayan
Table 5.7: Regression models for ability to identify problems and solutions and immediate recall of
information influenced by system quality at KSU
5.3.3.6 Multiple regressions
5.3.3.6.1 Service quality
To test H2 more thoroughly, multiple regression was used to assess the relative
importance of the service quality variables in explaining differences in attitudes
towards stakeholder performance. Standard multiple regression (Enter method) was
conducted, with the six stakeholder performance variables posited as the dependent
variables and the four ERP service quality variables as the independent variables.
The R2 values show that the four service quality variables together explained 30.5%
of the variation in improved stakeholder productivity, 44.4% of the variation in time
taken to complete task, 49.25% in stakeholder confidence and performance, 47.0% in
computer awareness, 16.6% in immediate recall of information and 50.2% in the
ability to identify problems and solutions. The percentage of variance explained by
service quality variables is substantially lower than the systems quality variables seen
in H1 above. As discussed above, part of the variance may be due to error
measurement, but the lower variance suggests that other unknown factors must play a
part in determining these stakeholder performance attitudes (Field, 2009).
The F values reveal highly significant relationships at the p<0.05 level between the
four ERP service quality variables and all stakeholder performance variables. The
model for ability to identify problems and solutions had the largest F value, F (4, 59)
= 13.885, p<.001, indicating that this was the most significant model, followed by
stakeholders’ confidence and performance, F (4, 59) = 13.479, p<.001; then
Model STD CO Model STD CO
AIP B Std. Error Beta IMI B Std. Error Beta
(Constant) -.235- 0.631 -.373- 0.711 (Constant) 0.488 0.792 0.616 0.541
Accessibility 0.138 0.171 0.15 0.805 0.425 Accessibility -.011- 0.215 -.011- -.051- 0.96
Assistance -.008- 0.133 -.009- -.062- 0.95 Assistance -.021- 0.167 -.020- -.126- 0.9
Ease of Use 0.01 0.15 0.009 0.07 0.944 Ease of Use 0.402 0.188 0.329 2.14 0.038
Accuracy 0.057 0.141 0.062 0.404 0.688 Accuracy 0.17 0.177 0.167 0.96 0.342
Currency 0.211 0.123 0.222 1.717 0.093 Currency 0.205 0.154 0.195 1.327 0.191
Content 0.236 0.174 0.219 1.354 0.182 Content 0.344 0.219 0.289 1.571 0.123
Format -.036- 0.179 -.032- -.199- 0.843 Format -.377- 0.225 -.304- -1.677- 0.1
Timeliness 0.12 0.168 0.115 0.715 0.478 Timeliness 0.349 0.211 0.301 1.653 0.105
Authorisation -.123- 0.091 -.154- -1.353- 0.183 Authorisation 0.005 0.114 0.005 0.042 0.967
Training 0.016 0.101 0.02 0.16 0.873 Training -.194- 0.126 -.214- -1.533- 0.132
Right Data -.015- 0.149 -.018- -.101- 0.92 Right Data -.257- 0.187 -.270- -1.371- 0.177
Lack of Confusion 0.097 0.119 0.118 0.817 0.418 Lack of Confusion 0.097 0.15 0.107 0.652 0.518
Compatibility 0.11 0.174 0.1 0.633 0.53 Compatibility 0.146 0.218 0.12 0.67 0.506
Flexibility 0.191 0.125 0.226 1.524 0.134 Flexibility 0.087 0.157 0.093 0.55 0.585
UNSTD CO-Unstandardized Coefficients, STD CO-Standarized Coefficients
AIP= Ability to Identify Problem, IMI=Immediate Recall of Information
t Sig.USTD CO t Sig. USTD CO
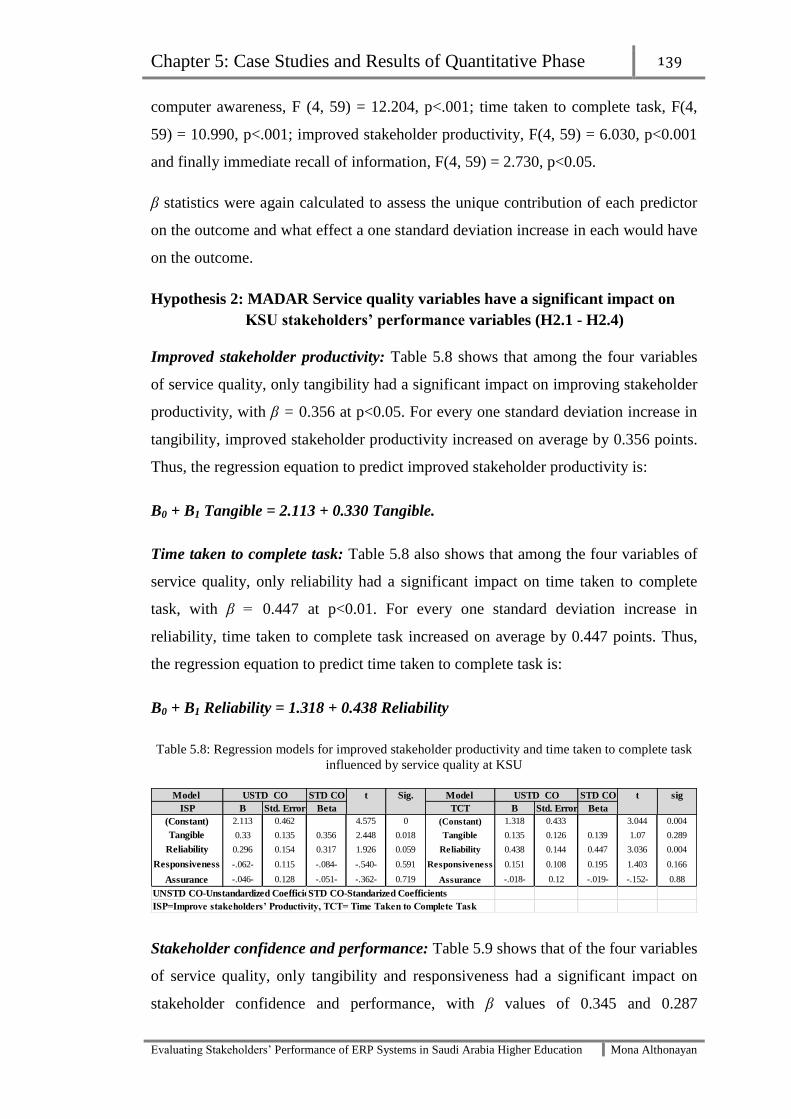
Chapter 5: Case Studies and Results of Quantitative Phase 139
Evaluating Stakeholders’ Performance of ERP Systems in Saudi Arabia Higher Education Mona Althonayan
computer awareness, F (4, 59) = 12.204, p<.001; time taken to complete task, F(4,
59) = 10.990, p<.001; improved stakeholder productivity, F(4, 59) = 6.030, p<0.001
and finally immediate recall of information, F(4, 59) = 2.730, p<0.05.
β statistics were again calculated to assess the unique contribution of each predictor
on the outcome and what effect a one standard deviation increase in each would have
on the outcome.
Hypothesis 2: MADAR Service quality variables have a significant impact on
KSU stakeholders’ performance variables (H2.1 - H2.4)
Improved stakeholder productivity: Table 5.8 shows that among the four variables
of service quality, only tangibility had a significant impact on improving stakeholder
productivity, with β = 0.356 at p<0.05. For every one standard deviation increase in
tangibility, improved stakeholder productivity increased on average by 0.356 points.
Thus, the regression equation to predict improved stakeholder productivity is:
B0 + B1 Tangible = 2.113 + 0.330 Tangible.
Time taken to complete task: Table 5.8 also shows that among the four variables of
service quality, only reliability had a significant impact on time taken to complete
task, with β = 0.447 at p<0.01. For every one standard deviation increase in
reliability, time taken to complete task increased on average by 0.447 points. Thus,
the regression equation to predict time taken to complete task is:
B0 + B1 Reliability = 1.318 + 0.438 Reliability
Table 5.8: Regression models for improved stakeholder productivity and time taken to complete task
influenced by service quality at KSU
Stakeholder confidence and performance: Table 5.9 shows that of the four variables
of service quality, only tangibility and responsiveness had a significant impact on
stakeholder confidence and performance, with β values of 0.345 and 0.287
Model STD CO Model STD CO
ISP B Std. Error Beta TCT B Std. Error Beta
(Constant) 2.113 0.462 4.575 0 (Constant) 1.318 0.433 3.044 0.004
Tangible 0.33 0.135 0.356 2.448 0.018 Tangible 0.135 0.126 0.139 1.07 0.289
Reliability 0.296 0.154 0.317 1.926 0.059 Reliability 0.438 0.144 0.447 3.036 0.004
Responsiveness -.062- 0.115 -.084- -.540- 0.591 Responsiveness 0.151 0.108 0.195 1.403 0.166
Assurance -.046- 0.128 -.051- -.362- 0.719 Assurance -.018- 0.12 -.019- -.152- 0.88
UNSTD CO-Unstandardized Coefficients,STD CO-Standarized Coefficients
ISP=Improve stakeholders’ Productivity, TCT= Time Taken to Complete Task
sigUSTD CO t Sig. USTD CO t

Chapter 5: Case Studies and Results of Quantitative Phase 140
Evaluating Stakeholders’ Performance of ERP Systems in Saudi Arabia Higher Education Mona Althonayan
respectively at p<0.05. For every one standard deviation increase in tangibility and
responsiveness, stakeholder confidence and performance increased on average by
0.345 and 0.287 points respectively. Thus, the regression equation to predict
stakeholder confidence and performance is:
B0 + B1 Tangible + B2 Responsiveness = 1.374 + 0.329 Tangible + 0.218
Responsiveness.
Computer Awareness: Table 5.9 also shows that of the four variables of service
quality, only tangibility and responsiveness had a significant impact on stakeholder
computer awareness: β = 0.265 and 0.304 respectively at p<0.05. For every one
standard deviation increase in these variables, stakeholder confidence and
performance increased on average by 0.265 and 0.304 points respectively. Thus, the
regression equation to predict computer awareness is:
B1 Tangible + B2 Responsiveness = 0.273 Tangible + 0.250 Responsiveness
Table 5.9: Regression models for confidence and performance and computer awareness influenced by
service quality at KSU
Ability to identify problem and solution: Table 5.10 shows that of the four variables
of service quality, only reliability and assurance had a significant impact on ability to
identify problems and solutions, with β values of 0.340 and 0.364 at p<0.05. For
every one standard deviation increase in reliability and assurance, ability to identify
problems and solutions increased on average by 0.340 and 0.364 points respectively.
Thus, the regression equation to predict stakeholder’s ability to identify problems
and solutions is:
B1 Reliability + B2 Assurance = 0.297 Reliability + 0.307 Assurance.
Immediate recall of information: The analysis revealed, as shown in Table 5.10, that
none of the four variables of service quality had a significant impact on immediate
Model STD CO Model STD CO
CP B Std. Error Beta CA B Std. Error Beta
(Constant) 1.374 0.404 3.399 0.001 (Constant) 0.817 0.448 1.824 0.074
Tangible 0.329 0.118 0.345 2.784 0.007 Tangible 0.273 0.131 0.265 2.085 0.042
Reliability 0.261 0.135 0.272 1.94 0.057 Reliability 0.267 0.149 0.256 1.786 0.08
Responsiveness 0.218 0.101 0.287 2.169 0.034 Responsiveness 0.25 0.112 0.304 2.241 0.029
Assurance -.094- 0.112 -.102- -.840- 0.404 Assurance 0.001 0.124 0.001 0.011 0.991
UNSTD CO-Unstandardized Coefficients,STD CO-Standarized Coefficients
CP=Confidence and Performance,CA = Computer Awareness
USTD CO t sigUSTD CO t Sig.

Chapter 5: Case Studies and Results of Quantitative Phase 141
Evaluating Stakeholders’ Performance of ERP Systems in Saudi Arabia Higher Education Mona Althonayan
recall of information and hence that there were no influential predictors of this
dependent variable.
Table 5.10: Regression models for ability to identify problems and solutions and immediate recall of
information influenced by service quality at KSU
The factors selected from the above models have been shown to provide effective
evaluation of stakeholders’ performance. KSU is a pioneer among Saudi universities
in implementing local ERP systems. Not surprisingly, the results show that six of the
14 quality system factors (flexibility, currency, ease of use, format, content and
timeliness) were positively significant, while all four service quality factors
(tangibility, reliability, responsiveness and assurance) were also found to have a
significant impact on stakeholder performance.
None of the remaining eight variables (lack of confusion, accessibility, assistance,
authorization, right data, compatibility, training and accuracy) predicted stakeholder
performance. However, the results of the significant factors (system quality and
service quality) were as expected. According to Rabaa`i, Bandara, and Gable,
(2009), the main aims of ERP system implementation in HE are to integrate different
administrative functions into a more systematic and effective approach, to improve
information access for planning and managing the institution, to improve service for
the faculty, students and employees, to increase income and to reduce expenses by
improving efficiency.
In contrast, the results regarding insignificant factors (e.g. accuracy, assistance,
training, authorization and accessibility) were unexpected. Possible reasons for these
results include the fact that MADAR was a new local ERP system which was
implemented by KSU in 2007-2008 in a limited number of departments; thus, the
system was being used only for administrative and financial tasks. However, a more
likely reason for the factors being insignificant in multiple regressions is to do with
the sample size of the study. It is also possible that those factors did not meet
Model STD CO Model STD CO
AIP B Std. Error Beta IMI B Std. Error Beta
(Constant) 0.632 0.365 0.089 (Constant) 2.558 0.523 4.894 0
Tangible 0.182 0.107 0.21 1.709 0.093 Tangible 0.17 0.153 0.178 1.114 0.27
Reliability 0.297 0.122 0.34 2.442 0.018 Reliability 0.21 0.174 0.217 1.206 0.233
Responsiveness -.026- 0.091 -.037- -.283- 0.778 Responsiveness 0.007 0.13 0.009 0.05 0.96
Assurance 0.307 0.101 0.364 3.031 0.004 Assurance 0.082 0.145 0.088 0.563 0.576
UNSTD CO-Unstandardized Coefficients,STD CO-Standarized Coefficients
AIP= Ability to Identify Problem, IMI=Immediate Recall of Information
USTD CO t Sig.USTD CO t Sig.
Chapter 5: Case Studies and Results of Quantitative Phase 142
Evaluating Stakeholders’ Performance of ERP Systems in Saudi Arabia Higher Education Mona Althonayan
stakeholders’ needs and expectations, especially those related to assistance with
working on the system, focused training rather than short sessions, and more
authorization. In general, the results are considered to constitute a substantial
achievement for KSU, since the 14 system quality factors as a group explained
50.4% of the variation in improved stakeholder productivity, 68.5% of the variation
in time taken to complete task, 63.8% in stakeholder confidence and performance,
64.8% in computer awareness, 48.3% in immediate recall of information and 59.9%
in the ability to identify problems and solutions. According to Pallant (2010), these
are acceptable levels of accuracy for academic research. The significant factor results
for the KSU case indicate that both system quality and service quality factors play
major roles in the perception of stakeholders’ performance. In addition, the MADAR
system meets stakeholders’ needs and expectations.
Based on the above discussion, Figure 5.1 shows a conceptual model of the
relationship between ERP system quality variables, ERP service quality variables
and overall stakeholder performance.

Chapter 5: Case Studies and Results of Quantitative Phase 143
Evaluating Stakeholders’ Performance of ERP Systems in Saudi Arabia Higher Education Mona Althonayan
Figure 5.2: Conceptual Model Results for KSU
Timeliness
Improve stakeholder productivity
Time taken to complete task
Reliability
Stakeholder Confidence and
performance
Tangible
Responsiveness
Flexibility
Currency Computer awarness
Content
Format
Ease of use
Immediate recall of information
Ability to identify problem and solution Assurance
ERP system Quality
Stakeholder Performance
ERP system Quality

Chapter 5: Case Studies and Results of Quantitative Phase 144
Evaluating Stakeholders’ Performance of ERP Systems in Saudi Arabia Higher Education Mona Althonayan
5.4 Case study two
5.4.1 King Fahd University of Petroleum and Minerals
The King Fahd University of Petroleum & Minerals (KFUPM) was officially
established by royal decree on 23 September 1963. Since that time, the University
has grown to a level where enrolment was expected to exceed 8,000 by the 2009-
2010 academic years. The rapid growth of KFUPM is related to the rapid economic
and technical development of the Kingdom. It also reflects the rising expectations of
the people of Saudi Arabia, the expanding opportunities for the country’s young men
and the increasing importance of the Kingdom as a major source of the world’s
energy.
The vast petroleum and mineral resources of the Kingdom pose a complex and
exciting challenge for scientific, technical and management education. To meet this
challenge, the University has adopted advanced training in the fields of science,
engineering and management as one of its goals, in order to promote leadership and
service in the Kingdom’s petroleum and mineral industries. The University also
furthers knowledge through research in these fields. In addition, because it derives a
distinctive character from being a technological university in the land of Islam, the
University is unreservedly committed to deepening and broadening the faith of its
Muslim students and to instilling in them an appreciation of the major contributions
of their people to the world of mathematics and science. All areas of KFUPM—
facilities, faculty, students and programmes—are directed to the attainment of these
goals (KFUPM history, 2012).
5.4.2 Oracle system
Oracle is an enterprise system in use at KFUPM since March 2006. The ERP system
project managers believed that implementing Oracle would be a pioneering,
visionary and creative move, bringing a positive change which would improve the
efficiency and effectiveness of KFUPM processes. In addition, through its integrated
applications, it would provide accurate and reliable data and information to all users,
in order to serve its mission to improve, enable and integrate the academic and
administrative processes of the University. The project has six declared goals:

Chapter 5: Case Studies and Results of Quantitative Phase 145
Evaluating Stakeholders’ Performance of ERP Systems in Saudi Arabia Higher Education Mona Althonayan
to improve the effectiveness and efficiency of academic and administrative
processes,
to improve support for decision making,
to enhance the availability of and access to timely and reliable information,
to enhance the professional capabilities of human resources,
to improve the quality of services for all stakeholders and
to enhance the accountability of personnel and the integrity of processes and
information.
Project 2005 2006 2007 2008 2009
Q2 Q3 Q4 Q1 Q2 Q3 Q4 Q1 Q2 Q3 Q4 Q1 Q2 Q3 Q4 Q1 Q2 Q3 Q4
Business
Systems
Student
Systems
Business
Intelligence
Planning
Implementation
Post-implementation
Figure 5.3: Project schedule at KFUPM
Table 5.11: shows in detail the number of participants (employees) at KFUPM and
the departments they work in.
Table 5.11: Profiles of the participants at KFUPM
Case Participant Role System
KFU PM
Employee 1to10 Maintenance management
ORACLE
SYSTEM
Employee 11 to 15 Procurement department
Employee 16 to 22 Human Resource
Employee 23 to 30 Financial department
Employee 31 to 37 Inventory management
Employee 38 to 41 Warehouse department
Employee 42 to 48 Purchasing department
Employee 48 to 55 Employee affairs
Source: Originated by the researcher

Chapter 5: Case Studies and Results of Quantitative Phase 146
Evaluating Stakeholders’ Performance of ERP Systems in Saudi Arabia Higher Education Mona Althonayan
5.4.3 Quantitative analysis
5.4.3.1 Data preparation: Missing values
Following the same process as in case study one, the KFUPM data were examined
carefully, revealing that data were missing from three of the 58 questionnaires (5%),
leaving 55 questionnaires suitable for data analysis after the initial screening. The
missing values were found to be distributed randomly. Therefore, no bias was to be
expected and the excluded cases pairwise method was applied to treat missing
values, as recommended by Tabachnick and Fidell (2007) and by Pallant (2010).
5.4.3.2 Reliability test
Internal consistency within the research instrument was again assessed by clustering
items into dimensional groups and calculating Cronbach’s α. The total questionnaire,
which consisted of 24 questions, had a coefficient score of 0.905, representing
impressive internal consistency. In addition, the performance, system quality and
service quality constructs had respective coefficient scores of 0.854, 0.846 and 0.727,
all of which are strongly acceptable (Nunnally, 1978). The Cronbach’s α results for
the KFUPM questionnaire are shown in Table 5.12.
Table 5.12: Reliability test for KFUPM
5.4.3.3 System quality
5.4.3.3 .1 Multiple regressions
To more thoroughly test H1, multiple regression was used to assess the relative
importance of the system quality variables in explaining differences in attitudes
towards stakeholder performance. Standard multiple regression (Enter method) was
Constructs Number of items Cronbach's Alpha Type
Total KFU of P&M questionnaire 24 0.905 Excellent reliability
Performance 6 0.854 High reliability
System Quality 14 0.846 High reliability
Service Quality 4 0.727 High reliability

Chapter 5: Case Studies and Results of Quantitative Phase 147
Evaluating Stakeholders’ Performance of ERP Systems in Saudi Arabia Higher Education Mona Althonayan
conducted, with the six stakeholder performance variables posited as the dependent
variables and the 14 ERP system quality variables as the independent variables.
The R2 values show that the fourteen system quality variables, as a group, explained
57.3% of the variation in improved stakeholder productivity, 59.6% of the variation
in time taken to complete task, 41.9% in stakeholder confidence and performance,
50.1% in computer awareness, 52.9% in immediate recall of information and 65.3%
in the ability to identify problems and solutions. According to Pallant (2006), these
are acceptable levels of accuracy for academic research.
The F values show there were highly significant relationships (p<.05) between the
fourteen ERP system quality variables and the six stakeholder performance variables.
The model for ability to identify a problem and solution had the largest F value,
F(14, 54) = 5.372, p<.001, indicating that it was the most significant model, followed
by time taken to complete tasks F(14, 54) = 4.222, p<.001, improved stakeholder
productivity F(14, 54) = 3.833, p < .001, then immediate recall of information F(14,
54) = 3.209, p<.01, computer awareness F(14, 54) = 2.87, p<.01 and finally,
stakeholder confidence and performance, F(14, 54) = 2.065, p<0.05.
As for case study one, β statistics were used to calculate the unique contribution of
each predictor to the outcome and the effect of a one standard deviation increase in
each predictor.
Hypothesis 1: Oracle system quality variables have a significant impact on
KFUPM stakeholders’ performance variables (H1.1 - H1.14)
Improved stakeholder productivity. Table 5.13 shows that among all the 14 variables
of system quality, only ease of use had a positive significant impact on improving
stakeholder productivity (β = 0.486 at p<0.01). Thus, the regression equation to
predict improved stakeholder productivity is:
B0 + B1 Ease of use = 1.408 + 0.292 Ease of use.

Chapter 5: Case Studies and Results of Quantitative Phase 148
Evaluating Stakeholders’ Performance of ERP Systems in Saudi Arabia Higher Education Mona Althonayan
Table 5.13: Regression models for improved stakeholder productivity and time taken to complete task
influenced by system quality at KFU of P&M
Time taken to complete task. Table 5.13 also shows that among the fourteen
variables of system quality, only ease of use and content had a positive significant
impact on time taken to complete task, with β values of 0.38 and 0.551 respectively
at p<0.01. For every one standard deviation increase in ease of use and content, time
taken to complete task will increase on average by 0.38 and 0.551 points
respectively. Thus, the regression equation to predict time taken to complete task is:
B1 Content + B2 Ease of use = 0.586 Content + 0.234 Ease of use.
Stakeholder confidence and performance: Table 5.14 shows that only ease of use
among the fourteen system quality variables had a significant and positive impact on
stakeholder confidence and performance, with β = 0.364, which indicates that for
every one standard deviation increases ease of use, stakeholder confidence and
performance will increase on average by 0.364 points. Thus, the regression equation
to predict stakeholder confidence and performance is:
B0 + B1 Ease of use = 1.917 + 0.212 Ease of use.
Computer Awareness: Table 5.14 also shows that none of the fourteen variables of
system quality was a significant or influential predictor of computer awareness.
Model STD CO Model STD CO
ISP B Std. Error Beta TCT B Std. Error Beta
(Constant) 1.408 0.602 2.341 0.024 (Constant) 0.866 0.602 1.437 0.159
Format -2.848 0.127 0 0 1 Format -.125- 0.127 -.164- -.980- 0.333
Timeliness 0.106 0.15 0.137 0.707 0.484 Timeliness -.116- 0.151 -.146- -.772- 0.445
Accessibility 0.001 0.149 0.001 0.004 0.997 Accessibility 0.258 0.149 0.273 1.736 0.09
Assistance 0.126 0.099 0.181 1.27 0.211 Assistance -.010- 0.099 -.014- -.098- 0.922
Ease of Use 0.292 0.083 0.486 3.511 0.001 Ease of Use 0.234 0.083 0.38 2.819 0.007
Accuracy 0.044 0.114 0.064 0.383 0.704 Accuracy -.083- 0.115 -.117- -.723- 0.474
Currency 0.076 0.099 0.114 0.768 0.447 Currency 0.12 0.1 0.174 1.205 0.235
Authorisation -.033- 0.086 -.059- -.384- 0.703 Authorisation -.113- 0.086 -.196- -1.313- 0.197
Training -.101- 0.08 -.179- -1.267- 0.212 Training -.032- 0.08 -.056- -.404- 0.688
Right Data 0.105 0.115 0.163 0.913 0.367 Right Data 0.036 0.115 0.054 0.312 0.756
Lack of Confusion 0.005 0.106 0.009 0.044 0.965 Lack of Confusion 0.077 0.106 0.152 0.73 0.47
Content 0.118 0.169 0.114 0.698 0.489 Content 0.586 0.169 0.551 3.466 0.001
Flexibility 0.019 0.107 0.026 0.176 0.861 Flexibility -.051- 0.107 -.068- -.470- 0.641
Compatibility 0.005 0.102 0.008 0.049 0.961 Compatibility 0.029 0.102 0.044 0.286 0.777
UNSTD CO-Unstandardized Coefficients,STD CO-Standarized Coefficients
ISP=Improve stakeholders’ Productivity, TCT= Time Taken to Complete Task
t Sig.USTD CO t Sig. USTD CO
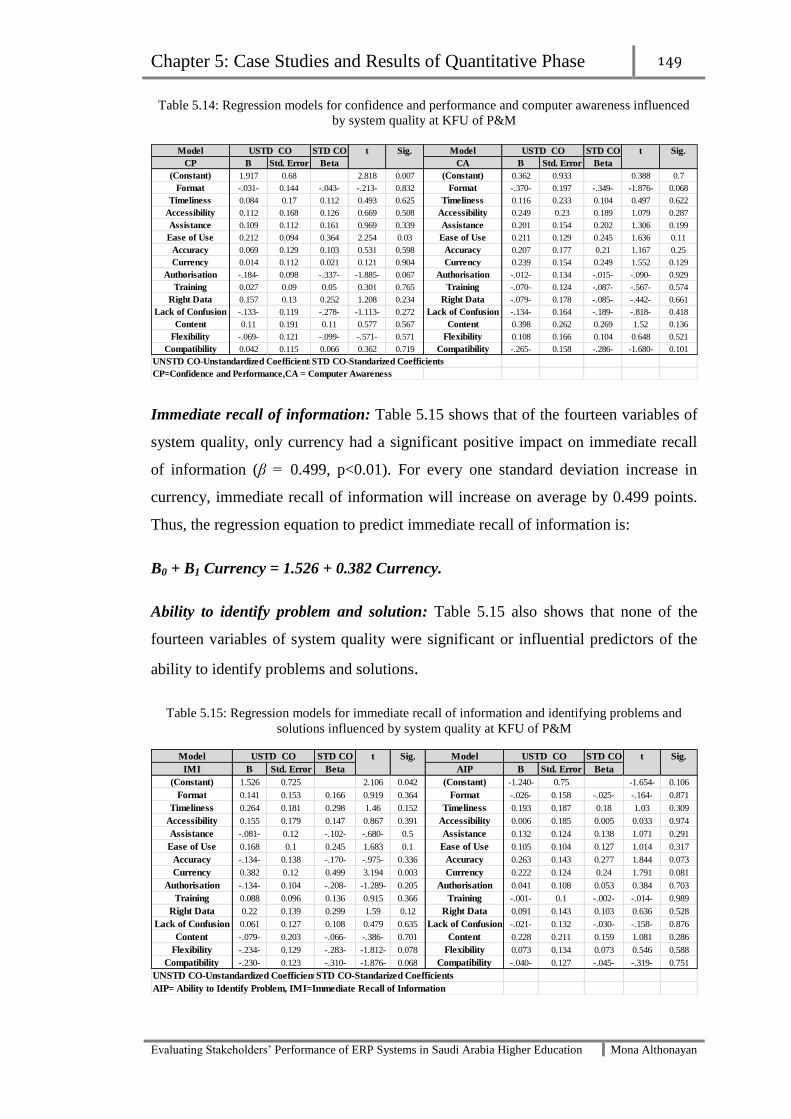
Chapter 5: Case Studies and Results of Quantitative Phase 149
Evaluating Stakeholders’ Performance of ERP Systems in Saudi Arabia Higher Education Mona Althonayan
Table 5.14: Regression models for confidence and performance and computer awareness influenced
by system quality at KFU of P&M
Immediate recall of information: Table 5.15 shows that of the fourteen variables of
system quality, only currency had a significant positive impact on immediate recall
of information (β = 0.499, p<0.01). For every one standard deviation increase in
currency, immediate recall of information will increase on average by 0.499 points.
Thus, the regression equation to predict immediate recall of information is:
B0 + B1 Currency = 1.526 + 0.382 Currency.
Ability to identify problem and solution: Table 5.15 also shows that none of the
fourteen variables of system quality were significant or influential predictors of the
ability to identify problems and solutions.
Table 5.15: Regression models for immediate recall of information and identifying problems and
solutions influenced by system quality at KFU of P&M
Model STD CO t Sig. Model STD CO t Sig.
CP B Std. Error Beta CA B Std. Error Beta
(Constant) 1.917 0.68 2.818 0.007 (Constant) 0.362 0.933 0.388 0.7
Format -.031- 0.144 -.043- -.213- 0.832 Format -.370- 0.197 -.349- -1.876- 0.068
Timeliness 0.084 0.17 0.112 0.493 0.625 Timeliness 0.116 0.233 0.104 0.497 0.622
Accessibility 0.112 0.168 0.126 0.669 0.508 Accessibility 0.249 0.23 0.189 1.079 0.287
Assistance 0.109 0.112 0.161 0.969 0.339 Assistance 0.201 0.154 0.202 1.306 0.199
Ease of Use 0.212 0.094 0.364 2.254 0.03 Ease of Use 0.211 0.129 0.245 1.636 0.11
Accuracy 0.069 0.129 0.103 0.531 0.598 Accuracy 0.207 0.177 0.21 1.167 0.25
Currency 0.014 0.112 0.021 0.121 0.904 Currency 0.239 0.154 0.249 1.552 0.129
Authorisation -.184- 0.098 -.337- -1.885- 0.067 Authorisation -.012- 0.134 -.015- -.090- 0.929
Training 0.027 0.09 0.05 0.301 0.765 Training -.070- 0.124 -.087- -.567- 0.574
Right Data 0.157 0.13 0.252 1.208 0.234 Right Data -.079- 0.178 -.085- -.442- 0.661
Lack of Confusion -.133- 0.119 -.278- -1.113- 0.272 Lack of Confusion -.134- 0.164 -.189- -.818- 0.418
Content 0.11 0.191 0.11 0.577 0.567 Content 0.398 0.262 0.269 1.52 0.136
Flexibility -.069- 0.121 -.099- -.571- 0.571 Flexibility 0.108 0.166 0.104 0.648 0.521
Compatibility 0.042 0.115 0.066 0.362 0.719 Compatibility -.265- 0.158 -.286- -1.680- 0.101
UNSTD CO-Unstandardized Coefficients,STD CO-Standarized Coefficients
CP=Confidence and Performance,CA = Computer Awareness
USTD CO USTD CO
Model STD CO t Sig. Model STD CO t Sig.
IMI B Std. Error Beta AIP B Std. Error Beta
(Constant) 1.526 0.725 2.106 0.042 (Constant) -1.240- 0.75 -1.654- 0.106
Format 0.141 0.153 0.166 0.919 0.364 Format -.026- 0.158 -.025- -.164- 0.871
Timeliness 0.264 0.181 0.298 1.46 0.152 Timeliness 0.193 0.187 0.18 1.03 0.309
Accessibility 0.155 0.179 0.147 0.867 0.391 Accessibility 0.006 0.185 0.005 0.033 0.974
Assistance -.081- 0.12 -.102- -.680- 0.5 Assistance 0.132 0.124 0.138 1.071 0.291
Ease of Use 0.168 0.1 0.245 1.683 0.1 Ease of Use 0.105 0.104 0.127 1.014 0.317
Accuracy -.134- 0.138 -.170- -.975- 0.336 Accuracy 0.263 0.143 0.277 1.844 0.073
Currency 0.382 0.12 0.499 3.194 0.003 Currency 0.222 0.124 0.24 1.791 0.081
Authorisation -.134- 0.104 -.208- -1.289- 0.205 Authorisation 0.041 0.108 0.053 0.384 0.703
Training 0.088 0.096 0.136 0.915 0.366 Training -.001- 0.1 -.002- -.014- 0.989
Right Data 0.22 0.139 0.299 1.59 0.12 Right Data 0.091 0.143 0.103 0.636 0.528
Lack of Confusion 0.061 0.127 0.108 0.479 0.635 Lack of Confusion -.021- 0.132 -.030- -.158- 0.876
Content -.079- 0.203 -.066- -.386- 0.701 Content 0.228 0.211 0.159 1.081 0.286
Flexibility -.234- 0.129 -.283- -1.812- 0.078 Flexibility 0.073 0.134 0.073 0.546 0.588
Compatibility -.230- 0.123 -.310- -1.876- 0.068 Compatibility -.040- 0.127 -.045- -.319- 0.751
UNSTD CO-Unstandardized Coefficients,STD CO-Standarized Coefficients
AIP= Ability to Identify Problem, IMI=Immediate Recall of Information
USTD CO USTD CO

Chapter 5: Case Studies and Results of Quantitative Phase 150
Evaluating Stakeholders’ Performance of ERP Systems in Saudi Arabia Higher Education Mona Althonayan
5.4.3.4 Service quality
5.4.3.4.1 Multiple regression analysis: To more thoroughly test H2, multiple
regression was used to assess the relative importance of the service quality variables
in explaining differences in attitudes towards stakeholder performance. Standard
multiple regression (Enter method) was performed, with the six stakeholder
performance variables posited as the dependent variables and the four ERP service
quality variables as the independent variables.
The R2 values show that the four service quality variables, as a group, explained
29.2% of the variation in improved stakeholder productivity, 14.0% of the variation
in time taken to complete task, 9.2% in stakeholder confidence and performance,
9.5% in computer awareness, 29.8% in immediate recall of information and 34.4% in
ability to identify problems and solutions.
The F values show that there were highly significant relationships (p<.01) between
the four ERP service quality variables and only three of the stakeholder performance
variables. The model for ability to identify a problem and solution had the largest F
value, F (4, 54) = 6.551, p<.001, indicating that it was the most significant model,
followed by immediate recall of information F (4, 54) = 5.307, p<.01, then improved
stakeholder productivity: F (4, 54) = 5.158, p <.01.
Standardised β statistics were again used to assess the unique contribution of each
predictor and the effect on the outcome of a one standard deviation increase.
Hypothesis 2: Oracle service quality variables have a significant impact on
KFUPM stakeholders’ performance variables (H2.1 - H2.4)
Tables 5.16, 5.17 and 5.18 show that none of the four service quality variables was
found to be significant and hence that none was an influential predictor of any of the
six stakeholder performance variables.

Chapter 5: Case Studies and Results of Quantitative Phase 151
Evaluating Stakeholders’ Performance of ERP Systems in Saudi Arabia Higher Education Mona Althonayan
Table 5.16: Regression models for improved stakeholder productivity and time taken to complete task
influenced by service quality at KFU of P&M
Table 5.17: Regression models for confidence and performance and computer awareness influenced
by service quality at KFUPM
Table 5.18: Regression models for immediate recall of information and identifying problems and
solutions influenced by service quality at KFU of P&M
The factors selected from the above models, however, proved able to provide an
effective evaluation of stakeholders’ performance. KFUPM is a pioneer among Saudi
universities in implementing a well-known ERP system (Oracle). Not surprisingly,
the results show that three of the 14 system quality factors (currency, ease of use and
content) were positively significant, whereas all four service quality factors
(tangibility, reliability, responsiveness and assurance) were found have an
insignificant impact on stakeholder performance. None of the remaining 11 variables
(lack of confusion, accessibility, assistance, authorization, right data, compatibility,
Model STD CO t Sig. Model STD CO t Sig.
ISP B Std. Error Beta TCT B Std. Error Beta
(Constant) 2.268 0.563 4.025 (Constant) 2.715 0.64 4.245 0
Tangible 0.028 0.109 0.035 0.256 0.799 Tangible 0.05 0.124 0.061 0.404 0.688
Reliability 0.272 0.149 0.251 1.832 0.073 Reliability 0.206 0.169 0.185 1.222 0.227
Responsiveness 0.098 0.101 0.168 0.976 0.334 Responsiveness 0.158 0.114 0.263 1.386 0.172
Assurance 0.167 0.118 0.243 1.415 0.163 Assurance -.023- 0.134 -.032- -.168- 0.867
UNSTD CO-Unstandardized Coefficients,STD CO-Standarized Coefficients
ISP=Improve stakeholders’ Productivity, TCT= Time Taken to Complete Task
USTD CO USTD CO
Model USTD CO STD CO t Sig. Model USTD CO STD CO t Sig.
CP B Std. Error Beta CA B Std. Error Beta
(Constant) 3.027 0.619 4.893 0 (Constant) 2.187 0.914 2.393 0.02
Tangible -.056- 0.12 -.074- -.470- 0.641 Tangible 0.265 0.177 0.235 1.502 0.139
Reliability 0.221 0.163 0.211 1.356 0.181 Reliability 0.168 0.241 0.108 0.696 0.49
Responsiveness 0.108 0.111 0.19 0.975 0.334 Responsiveness 0.03 0.163 0.035 0.181 0.857
Assurance 0.012 0.13 0.019 0.096 0.924 Assurance -.015- 0.191 -.015- -.077- 0.939
UNSTD CO-Unstandardized Coefficients,STD CO-Standarized Coefficients
CP=Confidence and Performance,CA = Computer Awareness
Model STD CO Model STD CO
IMI B Std. Error Beta AIP B Std. Error Beta
(Constant) 2.132 0.644 3.313 0.002 (Constant) 0.61 0.75 0.814 0.42
Tangible 0.209 0.124 0.231 1.677 0.1 Tangible 0.238 0.145 0.219 1.644 0.106
Reliability -.031- 0.17 -.025- -.181- 0.857 Reliability 0.161 0.198 0.108 0.814 0.419
Responsiveness 0.136 0.115 0.203 1.183 0.242 Responsiveness 0.142 0.134 0.176 1.06 0.294
Assurance 0.208 0.135 0.264 1.542 0.129 Assurance 0.255 0.157 0.27 1.627 0.11
UNSTD CO-Unstandardized Coefficients,STD CO-Standarized Coefficients
AIP= Ability to Identify Problem, IMI=Immediate Recall of Information
t Sig USTD CO t Sig. USTD CO

Chapter 5: Case Studies and Results of Quantitative Phase 152
Evaluating Stakeholders’ Performance of ERP Systems in Saudi Arabia Higher Education Mona Althonayan
flexibility, format and training, timeliness and accuracy) predicted stakeholder
performance.
The results for some of these system quality factors (e.g. flexibility, timeliness,
accuracy, training and authorization) were unexpected, as were those for the service
quality factors, especially given that the system had been implemented for sufficient
time for users to have gained enough experience to serve the system’s stakeholders.
Possible reasons for other results regarding insignificant factors (e.g. accuracy,
assistance, training, authorization and accessibility) are that the system did not meet
the stakeholders’ needs and expectations, and that they resisted the change to the new
system because they were more familiar with the legacy systems that they had
worked on for a long time.
Given that the Oracle system had begun to be implemented at KFUPM in 2006-2007,
the limited significance of many factors was unexpected. However, the system was
being used only by a limited number of departments. In general, the results may be
considered a substantial achievement for KFUPM, since the 14 system quality
factors as a group explained approximately 57.3% of the variation in improved
stakeholder productivity, 59.6% of the variation in time taken to complete task,
41.9% in stakeholder confidence and performance, 50.1% in computer awareness,
52.9% in immediate recall of information and 65.3% in ability to identify problems
and solutions. According to Pallant (2006), these are acceptable levels of accuracy
for academic research. In contrast, the four service quality variables, as a group,
explained only 29.2% of the variation in improved stakeholder productivity, 14.0%
in time taken to complete task, 9.2% in stakeholder confidence and performance,
9.5% in computer awareness, 29.8% in immediate recall of information and 34.4% in
ability to identify problems and solutions.
Figure 2 shows a conceptual model derived from the above results and representing
the relationships between ERP system quality variables and stakeholder performance
at KFUPM.

Chapter 5: Case Studies and Results of Quantitative Phase 153
Evaluating Stakeholders’ Performance of ERP Systems in Saudi Arabia Higher Education Mona Althonayan
Figure 5.4: Conceptual model results for KFUPM
5.5 Case study three
5.5.1 King Faisal University
King Faisal University (KFU) was established in 1395 AH, in Hofuf, Al-Ahsa
Governorate, in the Eastern Province, initially in rented premises. In subsequent
years it used prefabricated buildings to house some of its colleges, beginning with
the College of Agricultural and Food Sciences and the College of Veterinary
Medicine and Animal Resources. Following the completion and integration of the
existing colleges, it was decided to establish the College of Education in 1401/1402
AH and the College of Business Administration Sciences and Planning in 1404/1405.
The number of students has increased from 170 in 1395/1396 AH to more than
23,909 (male and female) in 1431/1432 AH.
The first batch of Saudi university graduates comprised nine students in 1398/1399
AH, increasing by the year 1430/1431 to 13,876 male and female graduates in
Ease of use
Improve Stakeholder Productivity
Time taken to complete task
Stakeholder Confidence & Performance
Content
Currency Beta = 0.499
Immediate recall of information
Stakeholder
Performance
ERP System
Quality

Chapter 5: Case Studies and Results of Quantitative Phase 154
Evaluating Stakeholders’ Performance of ERP Systems in Saudi Arabia Higher Education Mona Althonayan
disciplines including medicine, agricultural science, administration, architecture and
food, veterinary medicine and animal resources, as well as other disciplines in the
colleges of education and business.
The university has eleven independent deanships: Student Affairs; Admission and
Registration: Library Affairs; Graduate Studies; Faculty Affairs; Scientific Research;
Higher Education Development; Information Technology; E-learning and Distance
Education; Quality Assurance and Academic Accreditation; and Preparatory Year.
The university seeks to provide opportunities for graduate studies, so 505 students
were enrolled in graduate programmes for the year 1431-1432 AH. Despite the
slowness of starting these graduate programmes, the University is proud of what has
been achieved so far, seeing it as a pioneering educational achievement.
Furthermore, the number of scholarships for postgraduate studies has been increased
from 15 in 1395/1396 AH to 205 in 1431-1432 AH. These scholarships are awarded
to both males and females studying for masters’ degrees and doctorates in many
prestigious universities in Saudi Arabia and abroad.
The number of faculty members, lecturers and teaching assistants has increased from
46 to 1379, including 651 Saudis, representing 51% of the total. Meanwhile, the
number of administrators, technicians and labourers has increased from 166 to 1387
in 1431/1432 AH (2011 AD).
The University has paid special attention to conferences and scientific research,
organizing more than 66 local and global conferences and symposia at KFU, in
addition to the participation of the University in numerous local and external
conferences and seminars where it has been represented by faculty members,
including more than 300 conferences and scientific symposia at home and abroad,
(KFU history, 2012).
5.5.2 Oracle System
KFU chose to implement the Oracle enterprise system in early 2008, deploying it as
a single entity in different departments. The implementation was divided into two
phases (Appendix x details the components implemented at each stage).

Chapter 5: Case Studies and Results of Quantitative Phase 155
Evaluating Stakeholders’ Performance of ERP Systems in Saudi Arabia Higher Education Mona Althonayan
The KFU project managers believed that implementing Oracle would be a major
positive step towards improving the efficiency and effectiveness of the university’s
processes. In addition, through its integrated applications, it would provide accurate
and reliable data and information to all users, in order to serve its mission to
improve, enable and integrate KFU’s academic and administrative functions.
The project managers believed that implementation would help them to achieve the
following:
to improve the effectiveness and efficiency of academic and administrative
processes,
to support decision making,
to improve human resource capabilities,
to increase the quality of services for all stakeholders,
to improve the accountability of personnel and the integrity of processes and
information, and
to ensure timely access to reliable information.
Table 5. 19: Profiles of the participants at KFU
Case Participant Role System
KFU
Employee 1 to 7 Financial department
ORACLE
SYSTEM
Employee 8 to 17 Inventory management
Employee 18 to 25 Human Resource
Employee 26 to 35 Purchasing department
Employee 36 to 40 Employee affairs
Employee 41 to 46 Warehouse department
Employee 47 to 54 Procurement department
Source: Originated by the researcher
5.5.3 Quantitative analysis
5.5.3.1 Data preparation: Missing values
Following same process as in the other case studies, the KFU data were examined
and three of the 57 questionnaires (5%) were found to have missing data, leaving
(54) questionnaires suitable for data analysis after the initial screening. These
missing values were found to be distributed randomly, so no bias was to be expected

Chapter 5: Case Studies and Results of Quantitative Phase 156
Evaluating Stakeholders’ Performance of ERP Systems in Saudi Arabia Higher Education Mona Althonayan
and the excluded cases pairwise method was applied to treat missing values
(Tabachnick and Fidell, 2007; Pallant, 2010).
5.5.3.2 Reliability test
Internal consistency was again assessed by means of Cronbach’s alpha. The total
questionnaire, which consisted of 24 questions, had a coefficient score of 0.152,
indicating low internal consistency. In addition, the performance and service quality
constructs had respective reliability coefficient scores of 0.57 (acceptable) and 0.736
(strongly acceptable), whereas the system quality construct had a reliability
coefficient of 0.133, representing low internal consistency, well below the 0.5 cut-off
recommended by Nunnally (1978). The Cronbach’s α result for the KFU
questionnaires are shown in Table 5.20.
Table 5.20: Reliability test for KFU
5.5.3.3 System quality
5.5.3.3.1 Multiple regressions
To test H1 more thoroughly, standard multiple regression (Enter method) was again
used, to assess the relative importance of the system quality variables in explaining
differences in attitudes towards stakeholder performance, with the six stakeholder
performance variables posited as the dependent variables and the fourteen ERP
system quality variables as the independent variables.
The R2 values show that the fourteen systems quality variables, as a group, explained
28.4% of the variation in improved stakeholders’ productivity, 73.7% of the variation
in time taken to complete task, 66.8% in stakeholder confidence and performance,
61.7% in computer awareness, 66.5% in immediate recall of information and 72.8%
in ability to identify problems and solutions. According to Pallant (2006), these are
acceptable levels of accuracy for academic research. Part of the variance may be due
Constructs Number of items Cronbach's Alpha Type
Total KFU questionnaire 24 0.152 Low reliability
Performance 6 0.57 High reliability
System Quality 14 0.133 Low reliability
Service Quality 4 0.736 High reliability
Chapter 5: Case Studies and Results of Quantitative Phase 157
Evaluating Stakeholders’ Performance of ERP Systems in Saudi Arabia Higher Education Mona Althonayan
to error measurement; however, it suggests that other unknown factors must play
some role in determining these stakeholder performance attitudes (Field, 2009).
The F values show that there were highly significant relationships (p<.001) between
the fourteen ERP system quality variables and only five of the stakeholder
performance variables. The model for time taken to complete a task had the largest F
value, F(14, 53) = 7.808, p<.001, indicating that it was the most significant model,
followed by ability to identify a problem and solution, F(14, 53) = 7.459, p < .001,
then stakeholder confidence and performance, F(14, 53) = 5.602, p<.001, immediate
recall of information F(14, 53) = 5.521, p<.001 and computer awareness F(14, 53) =
4.484, p<.001, while improved stakeholder productivity was not significant: F(14,
53) = 1.106, p<0.4.
Again, β statistics were used to assess the unique contribution of each predictor and
the effect on the outcome of a one standard deviation increase.
Hypothesis 1: Oracle system quality variables have a significant impact on KFU
stakeholders’ performance variables (H1.1 - H1.14)
Improved stakeholder productivity: Table 5.21 shows that among the 14 variables of
system quality, only lack of confusion had a significant negative impact on
improving stakeholder productivity, with β = -0.409 at p<0.05. Although there was
no Spearman correlation between lack of confusion and improved stakeholder
productivity, it turned out to be a significant predictor with the existence of other
variables in the regression model. Thus, the regression equation to predict improved
stakeholder productivity is:
B0 + B1 Lack of Confusion = 7.903 – 0.17 Lack of Confusion,
Where the values of B0 and B1 are the unstandardized coefficients B in the regression
analysis as listed in Table 5.21
Time taken to complete task: Table 5.21 also shows that only six system quality
variables had a significant impact on time taken to complete task. The highest
positive significance was for format (β = 0.448), followed by content (β = 0.324),
then training (β = 0.257), while the highest negative significance was for accuracy
(β = -0.324), followed by authorization (β = -0.260), then ease of use (β = -0.239).

Chapter 5: Case Studies and Results of Quantitative Phase 158
Evaluating Stakeholders’ Performance of ERP Systems in Saudi Arabia Higher Education Mona Althonayan
Thus, for every one standard deviation increase in format, content and training
scores, time taken to complete task will increase on average by 0.448, 0.324 and
0.257 points respectively, while for every one standard deviation increase in
accuracy, authorization and ease of use, time taken to complete task will decrease on
average by 0.324, 0.260, 0.239 points respectively. It is worth mentioning that
although there was no Spearman correlation between authorisation or training and
time taken to complete task, they turned to be significant predictors with the
existence of other variable in the regression model. Thus, the regression equation to
predict time taken to complete task is:
B0 + B1 Format + B2 Content + B3 Training + B4 Accuracy + B5 Authorisation +
B6 Ease of use,
where the values of B0, B1, B2, B3, B4, B5 and B6 are 3.791, 0.282, 0.301,
0.094, -0.186, -0.098 and -0.173 respectively, as listed in Table 5.21.
Table 5.21: Regression models for improved stakeholder productivity and time taken to complete task,
influenced by system quality at KFU
Stakeholder confidence and performance: Table 5.22 shows that only two of the
fourteen system quality variables had a significant negative impact on stakeholder
confidence and performance. These were authorisation (β = -0.423) and ease of use
(β = -0.433), indicating that for every one standard deviation increase in
authorisation and ease of use, stakeholder confidence and performance will decrease
Mdel STD CO Model STD CO
ISP B Std. Error Beta TCT B Std. Error Beta
(Constant) 7.903 1.581 4.999 0 (Constant) 3.791 0.915 4.145 0
Lack of Confusion -.170- 0.076 -.409- -2.225- 0.032 Lack of Confusion -.012- 0.044 -.030- -.267- 0.791
Right Data 0.044 0.065 0.12 0.683 0.499 Right Data -.008- 0.038 -.023- -.211- 0.834
Accessibility -.088- 0.152 -.117- -.577- 0.567 Accessibility -.088- 0.088 -.122- -.997- 0.325
Assistance 0.072 0.108 0.112 0.665 0.51 Assistance -.062- 0.063 -.101- -.997- 0.325
Authorization 0.009 0.061 0.023 0.15 0.882 Authorization -.098- 0.035 -.260- -2.753- 0.009
Ease of Use -.091- 0.122 -.120- -.744- 0.461 Ease of Use -.173- 0.071 -.239- -2.451- 0.019
Flexibility -.132- 0.093 -.263- -1.419- 0.164 Flexibility 0.058 0.054 0.121 1.081 0.286
Training 0.105 0.068 0.276 1.557 0.128 Training 0.094 0.039 0.257 2.399 0.021
Accuracy -.047- 0.1 -.078- -.468- 0.642 Accuracy -.186- 0.058 -.324- -3.201- 0.003
Compatibility -.163- 0.101 -.306- -1.611- 0.115 Compatibility -.018- 0.059 -.035- -.305- 0.762
Currency 0.06 0.105 0.106 0.573 0.57 Currency 0.065 0.061 0.119 1.063 0.295
Content -.166- 0.21 -.171- -.788- 0.435 Content 0.301 0.122 0.324 2.472 0.018
Format 0.019 0.117 0.028 0.158 0.875 Format 0.282 0.068 0.448 4.154 0
Timeliness -.183- 0.148 -.244- -1.235- 0.224 Timeliness -.028- 0.086 -.039- -.324- 0.747
UNSTD CO-Unstandardized Coefficients,STD CO-Standarized Coefficients
ISP=Improve stakeholders’ Productivity, TCT= Time Taken to Complete Task
t Sig.USTD CO t Sig. USTD CO

Chapter 5: Case Studies and Results of Quantitative Phase 159
Evaluating Stakeholders’ Performance of ERP Systems in Saudi Arabia Higher Education Mona Althonayan
on average by 0.423 and 0.433 points respectively. Thus, the regression equation to
predict stakeholder confidence and performance is:
B0 + B1 Authorisation + B2 Ease of use,
Where the values of B0, B1 and B2 are 4.735, -0.191 and -0.378 respectively, as listed
in Table 5.22
Computer awareness: Table 5.22 also shows that content, assistance and currency
had significant positive effects on computer awareness, while timeliness and
accuracy had significant negative effects, with respective β values of 0.620, 0.447,
0.401, -0.333 and -0.436. It is worth mentioning that although there was no
Spearman correlation between timeliness, content or currency and computer
awareness, they turned out to be significant predictors with the existence of other
variables in the regression model. Thus, the regression equation to predict computer
awareness is: B1 Content + B2 Assistance + B3 Currency + B4 Timeliness + B5
Accuracy,
Where the values of B1, B2, B3 and B4 are 0.849, 0.405, 0.320, -0.351 and -0.368
respectively, as shown in Table 5.22

Chapter 5: Case Studies and Results of Quantitative Phase 160
Evaluating Stakeholders’ Performance of ERP Systems in Saudi Arabia Higher Education Mona Althonayan
Table 5.22: Regression models for confidence and performance and for computer awareness
influenced by system quality at KFU
Immediate recall of information: Table 5.23 shows that lack of confusion,
timeliness and compatibility had significant negative effects on immediate recall of
information, while authorization had a significant positive effect: β = -0.429, -0.295,
-0.292 and 0.277 respectively. Although there was no Spearman correlation between
authorisation or timeliness and immediate recall of information, they turned to be
significant predictors with the existence of other variables in the regression model.
Thus, the regression equation to predict immediate recall of information is:
B0 + B1 Lack of confusion + B2 timeliness + B3 compatibility + B4 authorisation,
Where the values of B0, B1, B2, B3 and B4 are 4.561, -0.315, -0.389, -0.273 and 0.192
respectively (Table 5.23)
Ability to identify problems and solutions: Table 5.23 also shows that content,
currency and assistance had significant positive effects on the ability to identify
problems and solutions, while accessibility and accuracy had significant negative
effects on it: β = 0.776, 0.281, 0.216, -0.462 and -0.438 respectively. Again,
although there was no Spearman correlation of either accessibility or assistance with
ability to identify problems and solutions, they turned to be significant predictors
with the existence of other variables in the regression model. Thus, the regression
equation to predict ability to identify problems and solutions is:
Model STD CO Model STD CO
CP B Std. Error Beta CA B Std. Error Beta
(Constant) 4.735 1.239 3.822 0 (Constant) 1.655 1.627 1.017 0.315
Lack of Confusion 0.077 0.06 0.161 1.291 0.204 Lack of Confusion -.051- 0.079 -.086- -.642- 0.524
Right Data -.001- 0.051 -.002- -.017- 0.987 Right Data 0.089 0.067 0.172 1.331 0.191
Accessibility 0.057 0.119 0.066 0.479 0.635 Accessibility -.271- 0.157 -.256- -1.731- 0.091
Assistance -.008- 0.085 -.011- -.099- 0.922 Assistance 0.405 0.111 0.447 3.641 0.001
Authorization -.191- 0.048 -.423- -3.977- 0 Authorisation 0.11 0.063 0.2 1.751 0.088
Ease of Use -.378- 0.096 -.433- -3.946- 0 Ease of Use 0.112 0.126 0.105 0.893 0.377
Flexibility 0.052 0.073 0.09 0.711 0.481 Flexibility 0.063 0.096 0.089 0.658 0.514
Training 0.102 0.053 0.233 1.929 0.061 Training 0.047 0.07 0.087 0.672 0.505
Accuracy -.139- 0.079 -.201- -1.767- 0.085 Accuracy -.368- 0.103 -.436- -3.565- 0.001
Compatibility 0.056 0.079 0.091 0.705 0.485 Compatibility -.159- 0.104 -.212- -1.524- 0.135
Currency 0.067 0.082 0.103 0.814 0.421 Currency 0.32 0.108 0.401 2.964 0.005
Content 0.065 0.165 0.058 0.391 0.698 Content 0.849 0.217 0.62 3.919 0
Format 0.183 0.092 0.242 1.995 0.053 Format -.110- 0.121 -.119- -.916- 0.365
Timeliness -.021- 0.116 -.025- -.185- 0.854 Timeliness -.351- 0.152 -.333- -2.305- 0.027
UNSTD CO-Unstandardized Coefficients,STD CO-Standarized Coefficients
CP=Confidence and Performance,CA = Computer Awareness
Sig.USTD CO t Sig. USTD CO t

Chapter 5: Case Studies and Results of Quantitative Phase 161
Evaluating Stakeholders’ Performance of ERP Systems in Saudi Arabia Higher Education Mona Althonayan
B0 + B1 Content + B2 accessibility + B3 Accuracy + B4 currency + B5 Assistance,
Where the values of B0, B1, B2, B3, B4 and B5 are 1.171, 1.114, -0.513, -0.388, 0.235
and 0.205 respectively (Table 5.23)
Table 5.23: Regression models for immediate recall of information and identifying problems and
solutions influenced by system quality at KFU
5.5.3.4. Service quality
5.5.3.4.1 Multiple regressions
To test H2 more thoroughly, standard multiple regression was again used to assess
the relative importance of the service quality variables in explaining differences in
attitudes towards stakeholder performance, with the six stakeholder performance
variables posited as the dependent variables and the four ERP service quality
variables as the independent variables.
The R2 values show that the four service quality variables together explained 12.5%
of the variation in improved stakeholder productivity, 59.8% of the variation in time
taken to complete task, 55.2% in stakeholder confidence and performance, 13.0% in
computer awareness, 39.3% in immediate recall of information and 27.3% in ability
to identify problems and solutions. The percentage of variance explained by service
quality variables is thus substantially lower than for the systems quality variables
discussed under H1 above. Again, part of the variance may be due to measurement
Model STD CO Model STD CO
IMI B Std. Error Beta AIP B Std. Error Beta
(Constant) 4.561 1.903 2.397 0.021 (Constant) 1.171 1.437 0.815 0.42
Lack of Confusion -.315- 0.092 -.429- -3.415- 0.002 Lack of Confusion 0.058 0.07 0.094 0.827 0.413
Right Data 0.034 0.078 0.052 0.433 0.667 Right Data -.068- 0.059 -.124- -1.145- 0.259
Accessibility 0.311 0.183 0.234 1.694 0.098 Accessibility -.513- 0.138 -.462- -3.706- 0.001
Assistance 0.18 0.13 0.159 1.383 0.174 Assistance 0.205 0.098 0.216 2.087 0.043
Authorization 0.192 0.074 0.277 2.595 0.013 Authorization -.090- 0.056 -.154- -1.607- 0.116
Ease of Use 0.041 0.147 0.031 0.281 0.78 Ease of Use 0.18 0.111 0.16 1.615 0.114
Flexibility -.106- 0.112 -.120- -.947- 0.349 Flexibility 0.126 0.084 0.171 1.497 0.142
Training -.094- 0.081 -.140- -1.154- 0.255 Training -.035- 0.061 -.062- -.565- 0.575
Accuracy -.232- 0.121 -.219- -1.918- 0.062 Accuracy -.388- 0.091 -.438- -4.258- 0
Compatibility -.273- 0.122 -.292- -2.243- 0.031 Compatibility 0.073 0.092 0.093 0.795 0.431
Currency 0.157 0.127 0.157 1.238 0.223 Currency 0.235 0.096 0.281 2.464 0.018
Content 0.316 0.253 0.185 1.249 0.219 Content 1.114 0.191 0.776 5.822 0
Format 0.033 0.141 0.029 0.234 0.816 Format -.157- 0.107 -.162- -1.476- 0.148
Timeliness -.389- 0.178 -.295- -2.183- 0.035 Timeliness 5.35E-05 0.134 0 0 1
UNSTD CO-Unstandardized Coefficients,STD CO-Standarized Coefficients
AIP= Ability to Identify Problem, IMI=Immediate Recall of Information
Sig.USTD CO t Sig. USTD CO t

Chapter 5: Case Studies and Results of Quantitative Phase 162
Evaluating Stakeholders’ Performance of ERP Systems in Saudi Arabia Higher Education Mona Althonayan
error, but the lower variance suggests that other unknown factors must play a part in
determining these stakeholder performance attitudes (Field, 2009).
The F values reveal highly significant relationships at the p = 0.001 level between the
four ERP service quality variables and the four stakeholder performance variables.
The model for time taken to complete a task had the largest F value, F(4, 53) =
18.250, p<.001, indicating that this was the most significant model, followed by
stakeholders’ confidence and performance, F(4, 53) = 15.108, p<.001, then
immediate recall of information, F(4, 53) = 7.943, p<.001 and ability to identify
problem and solution, F(4, 53) = 4.606, p<.001, while computer awareness, F(4, 53)
= 1.825, and improved stakeholders productivity, F(4, 53) = 1.747, were not
significant and are not influential predictors.
Again, β statistics were used to assess the unique contribution of each predictor and
the effect on the outcome of a one standard deviation increase.
Hypothesis 2: Oracle service quality variables have a significant impact on KFU
stakeholders’ performance variables (H2.1 – H2.4)
Improved stakeholder productivity: Table 5.24 shows that of the four variables of
service quality, only responsiveness had a negative significant impact on improving
stakeholder productivity (β = -0.642, p<0.05). Thus, for every one standard deviation
increase in responsiveness, improved stakeholder productivity will decrease on
average by 0.642 points and the regression equation to predict improved stakeholder
productivity is:
B0 + B1 Responsiveness = 5.917 – 0.415 Responsiveness,
where the values of B0 and B1 are the unstandardized B coefficients in the regression
analysis, as shown in Table 5.24.
Time taken to complete task: Table 5.24 also shows that assurance and reliability
were the only service quality variables to have a significant negative impact on time
taken to complete tasks, with respective β values of -0.597 and -0.568 at p<0.01,
meaning that for every one standard deviation increase in assurance and reliability,
time taken to complete a task will decrease on average by 0.597 and 0.568 points
respectively. Thus, the regression equation to predict time taken to complete task is:

Chapter 5: Case Studies and Results of Quantitative Phase 163
Evaluating Stakeholders’ Performance of ERP Systems in Saudi Arabia Higher Education Mona Althonayan
B0 + B1 Reliability + B2 Assurance,
where the values of B0, B1 and B2 are 6.139, -0.358 and -0.251 respectively, as listed
in Table 5.24.
Table 5.24: Regression models for improved stakeholder productivity and time taken to complete task
influenced by service quality at KFU
Stakeholder confidence and performance: Table 5.25 shows that only reliability
among the four variables of service quality had a significant negative impact on
stakeholder confidence and performance (β = - 0.731, p<0.001), so that for every one
standard deviation increase in reliability, stakeholder confidence and performance
will decrease on average by 0.731 points. Thus, the regression equation to predict
stakeholder confidence and performance is:
B0 + B1 Reliability = 6.66 – 0.555 Reliability,
where the values of B0 and B1 are the unstandardized B coefficients in the regression
analysis shown in Table 5.25.
Computer awareness: The analysis revealed that no service quality variable was
significant and hence an influential predictor of computer awareness (Table 5.25).
Table 5.25: Regression models for confidence and performance and computer awareness influenced
by service quality at KFU
Model STD CO Model STD CO
IMP B Std. Error Beta TCT B Std. Error Beta
(Constant) 5.917 0.562 10.537 0 (Constant) 6.139 0.363 16.906 0
Tangible -.033- 0.078 -.069- -.427- 0.671 Tangible 0.034 0.051 0.073 0.663 0.51
Reliability -.023- 0.099 -.035- -.230- 0.819 Reliability -.358- 0.064 -.568- -5.572- 0
Responsiveness -.415- 0.162 -.642- -2.555- 0.014 Responsiveness 0.16 0.105 0.26 1.528 0.133
Assurance 0.215 0.121 0.489 1.771 0.083 Assurance -.251- 0.079 -.597- -3.191- 0.002
UNSTD CO-Unstandardized Coefficients,STD CO-Standarized Coefficients
ISP=Improve stakeholders’ Productivity, TCT= Time Taken to Complete Task
Sig.USTD CO t Sig. USTD CO t
Model STD CO Model STD CO
CP B Std. Error Beta CA B Std. Error Beta
(Constant) 6.66 0.462 14.411 0 (Constant) 4.761 0.788 6.044 0
Tangible 0.013 0.064 0.024 0.203 0.84 Tangible -.054- 0.11 -.080- -.496- 0.622
Reliability -.555- 0.082 -.731- -6.791- 0 Reliability 0.089 0.139 0.096 0.637 0.527
Responsiveness 0.117 0.134 0.158 0.878 0.384 Responsiveness 0.111 0.228 0.122 0.486 0.629
Assurance -.069- 0.1 -.137- -.693- 0.492 Assurance -.270- 0.17 -.436- -1.583- 0.12
UNSTD CO-Unstandardized Coefficients,STD CO-Standarized Coefficients
CP=Confidence and Performance,CA = Computer Awareness
sigUSTD CO t Sig. USTD CO t

Chapter 5: Case Studies and Results of Quantitative Phase 164
Evaluating Stakeholders’ Performance of ERP Systems in Saudi Arabia Higher Education Mona Althonayan
Immediate recall of information: Table 5.26 shows that only responsiveness among
the variables of service quality had a significant negative impact on immediate recall
of information (β = - 0.633, p<0.01). Thus, for every one standard deviation increase
in responsiveness, immediate recall of information will decrease on average by 0.633
points and the regression equation to predict immediate recall of information is:
B0 + B1 Responsiveness = 6.213 – 0.719 Responsiveness,
where the values of B0 and B1 are the unstandardized B coefficients in the regression
analysis, as shown in Table 5.26.
Ability to identify problems and solutions: The analysis revealed that none of the
service quality variables was significant and hence an influential predictor of the
ability to identify problems and solutions, as shown in Table 5.26.
Table 5.26: Regression models for immediate recall of information and identifying problems and
solutions influenced by service quality at KFU
The factors selected from the above models proved able to provide an effective
evaluation of stakeholders’ performance. KFU is a pioneer in implementing local
ERP systems among Saudi universities. Not surprisingly, the results show that 12 of
the 14 system quality factors were positively significant; these were compatibility,
accuracy, ease of use, timeliness, accessibility, lack of confusion, content, format,
currency, assistance, training and authorization. Unexpectedly, however, the
remaining two variables, flexibility and right data, were found not to be significant
predictors of stakeholder performance, despite flexibility being an important factor in
evaluating the system.
Among the service quality factors, reliability, responsiveness and assurance were
found to have a significant impact on stakeholder performance, while only tangibility
had no significant effect.
Model STD CO Model STD CO
IMI B Std. Error Beta AIP B Std. Error Beta
(Constant) 6.213 0.822 7.555 0 (Constant) 6.026 0.755 7.984 0
Tangible -.055- 0.115 -.066- -.484- 0.63 Tangible -.031- 0.105 -.044- -.295- 0.769
Reliability 0.276 0.145 0.237 1.896 0.064 Reliability -.183- 0.133 -.188- -1.369- 0.177
Responsiveness -.719- 0.238 -.633- -3.025- 0.004 Responsiven 0.121 0.218 0.128 0.557 0.58
Assurance 0.02 0.178 0.026 0.113 0.91 Assurance -.324- 0.163 -.499- -1.983- 0.053
UNSTD CO-Unstandardized Coefficients,STD CO-Standarized Coefficients
AIP= Ability to Identify Problem, IMI=Immediate Recall of Information
Sig.USTD CO t Sig USTD CO t
Chapter 5: Case Studies and Results of Quantitative Phase 165
Evaluating Stakeholders’ Performance of ERP Systems in Saudi Arabia Higher Education Mona Althonayan
In general, the results represent a substantial achievement for KFU, since the 14
system quality factors as a group explained approximately 28.4% of the variation in
improved stakeholder productivity, 73.7% of the variation in time taken to complete
tasks, 66.8% in stakeholder confidence and performance, 61.7% in computer
awareness, 66.5% in immediate recall of information and 72.8% in the ability to
identify problems and solutions. According to Pallant (2006), these are acceptable
levels of accuracy for academic research. These results regarding the significance of
system quality and service quality factors in the KFU case indicate that they played a
major role in perceptions of stakeholders’ performance and that the Oracle system
met stakeholders’ needs and expectations.
Based on the above analysis, Figure 5.3 shows a conceptual model of the relationship
between ERP system quality variables, ERP service quality variables and stakeholder
performance at KFU.

Chapter 5: Case Studies and Results of Quantitative Phase 166
Evaluating Stakeholders’ Performance of ERP Systems in Saudi Arabia Higher Education Mona Althonayan
Figure 5.5: Conceptual model of results for KFU
Timeliness
compatibility Immmediate
recall of information
Lack of confusion
Improve Stakeholder Productivity
Responsiveness
Authorisation
Ease of use
Time taken to complete task
Reliability
Assurance
Stakeholder confidence & Performance Training
Accuracy Computer awareness
Content
Format
Assistance
Currency
Ability to identify problem and solution
Accessibilty
ERP System
Quality
Stakeholder
Performance
Service Quality

Chapter 5: Case Studies and Results of Quantitative Phase 167
Evaluating Stakeholders’ Performance of ERP Systems in Saudi Arabia Higher Education Mona Althonayan
5.6 Universities compared
In line with our research methodology, this section focuses on the differences
between KSU, KFUPM and KFU as perceived by the participants, with regard to the
variables of stakeholders’ performance, ERP system quality and service quality.
The data collected through the ERP survey were analysed using SPSS (version 20).
All tests were set at the significance level of .05. A result of 0.05 is significant, while
a result of 0.001 is highly significant. The choice of statistical methods, particularly
of non-parametric ones (Kruskal-Wallis and Mann-Whitney U) was made because
the assumption of homogeneity was violated and because the data were from ordinal
Likert scales, which in turn means that the distributions were highly skewed
(Norman, 2010), so that parametric tests such as ANOVA could not be used
(Bernstein & Bernstein, 1999). Nonparametric tests (e.g. Kruskal-Wallis) have few
constraints and allow researchers to test their hypotheses on small and poorly
distributed samples (Nachar, 2008, p.13). The non-normal distributions were not
transformed, as the value of transforming Likert-scale variables is doubtful; therefore
the researcher decided to leave the natural variability in the data (participants’ valid
responses) (Tabachnick & Fidell, 2001). Similarly, outliers found on many variables,
due to the natural variation of responses within the 1 to 5 Likert scale range, were also
left at their original values.
Next, a post hoc power analysis was conducted using the G*Power 3.1 software, to
determine if the sample size of 169 was large enough to conduct these tests, in order
to avoid making a Type II error (false negative). (Details are tabulated in appendix
G.). The sample size of 169 (the three university datasets combined) was found to be
large enough for Kruskal-Wallis tests (comparing three groups) and for Mann-
Whitney tests (similar to t-tests) with 80% power. However, the number of
participants in each university group was too small for correlation and standard
multiple regression. This may affect the accuracy of the results and external validity
is a concern (Norman, 2010).

Chapter 5: Case Studies and Results of Quantitative Phase 168
Evaluating Stakeholders’ Performance of ERP Systems in Saudi Arabia Higher Education Mona Althonayan
Figure 5.6: Participants’ job titles and name of ERP system, by University
5.6.1 KSU, KFU and KFUPM
5.6.1.1 Analysis of differences in outcome measures
In order to assess whether there were differences in perceived stakeholder
performance, ERP system quality and ERP service quality between KSU, KFU and
KFUPM, we first investigated the descriptive statistics for each variable (Table
5.27).

Chapter 5: Case Studies and Results of Quantitative Phase 169
Evaluating Stakeholders’ Performance of ERP Systems in Saudi Arabia Higher Education Mona Althonayan
Table 5.27: Descriptive statistics for each variable at KSU, KFUPM and KFU
It is clear that stakeholder performance variables were on average less positive for
KSU than for the other two universities. As table 5.28 shows, the mean scores for
KFU were all greater than 4 (ranging from 4.38 to 4.83). For KFUPM the mean
scores were also mainly greater than 4 (ranging from 3.62 to 4.46), whereas for KSU
they were mostly lower than 4 (ranging from 3.24 to 4.13). We can conclude that
stakeholder performance was most effective at KFU and least effective at KSU.
The analysis also revealed that on average, system quality variables were more
positive for KFU than for the other university samples, except for training and
compatibility, which were both, more negative for KFU than elsewhere.
Table 5.28 shows that ERP service quality variables were on average less positive for
KSU than in the other two cases. The mean scores for KFU were the most positive,
M SD M SD M SD
Time taken to Complete task 4.39 0.359 4.23 0.622 3.67 1.05
Improve stakeholders Productivity 4.83 0.376 4.47 0.604 3.82 0.99
Immediate recall Of information 4.43 0.662 4.04 0.693 4.13 1.03
Stakeholder confidence and
performance4.46 0.433 4.16 0.586 3.73 1.03
Ability to Identify Problem and Solution 4.38 0.555 3.62 0.835 3.24 0.934
Computer awareness 4.39 0.529 3.91 0.867 3.45 1.11
ERP systems quality variables
Lack of Confusion 3.57 0.903 3.38 1.23 2.93 1.13
Right data 3.41 1.02 3.47 0.94 3.03 1.09
Accessibility 4.57 0.499 4.11 0.658 4.02 1.02
Assistance 4.13 0.584 3.85 0.87 3.58 0.98
Flexibility 3.89 0.75 3.28 0.838 2.72 1.11
Authorisation 2.91 0.957 2.75 1.08 2.68 1.18
Ease of Use 3.98 0.495 3.85 1.01 3.78 0.846
Training 2.56 0.984 2.69 1.07 2.77 1.14
Accuracy 4.28 0.627 3.93 0.879 3.58 1.01
Compatibility 3.02 0.707 3.07 0.935 2.7 0.85
Currency 4.3 0.662 3.67 0.904 3.45 0.982
Content 4.46 0.387 4.02 0.585 3.6 0.867
Format 4.22 0.572 3.82 0.819 3.52 0.833
Timeliness 4.56 0.502 4.05 0.78 4.02 0.892
ERP systems service quality variables
Tangible 3.74 0.782 3.69 0.767 3.3 1.08
Reliability 4.43 0.57 4.15 0.558 3.33 1.07
Responsiveness 4 0.583 3.53 1.03 3.35 1.35
Assurance 3.72 0.856 3.76 0.881 3.58 1.11
KSUStakeholder performance variables
KFU KFU of P&M

Chapter 5: Case Studies and Results of Quantitative Phase 170
Evaluating Stakeholders’ Performance of ERP Systems in Saudi Arabia Higher Education Mona Althonayan
ranging from 3.72 to 4.43, while those for KFUPM were also close to 4 (from 3.52 to
4.13), indicating consistency between KFU and KFUPM, whereas those for KSU
ranged from 3.30 to 3.58. We can conclude that ERP service quality was most
effective at KFU and least effective at KSU.
5.6.1.2 Nonparametric analysis of outcome
To address the third and fourth research questions and to assess whether there were
significant differences in overall perceived stakeholder performance, ERP system
quality and ERP service quality, the Kruskal-Wallis test (the nonparametric
alternative to ANOVA) was used to compare the output measures in the three
universities. The mean rank values, chi-squared and significance level for each
variable are listed in Table 5.28.
From the data it can be concluded that there was a statistically significant difference
between the three universities’ median test scores for all the six stakeholder
performance variables as perceived by the participants, at p = 0.000. Because the
overall test was significant, pairwise comparisons among the three groups were
conducted.
Similarly, at the p = 0.05 level of significance, there exists enough evidence to
conclude that there was a difference in the median test scores (and hence in the mean
test scores) among the three university groups with respect to the ERP system quality
variables, except in flexibility, ease of use and training. Therefore, pairwise
comparisons among the three groups were conducted.
Finally, the Kruskal-Wallis test revealed a significant difference in median scores
among the three university groups and the service quality variables at p = 0.05,
except for tangibility and assurance.
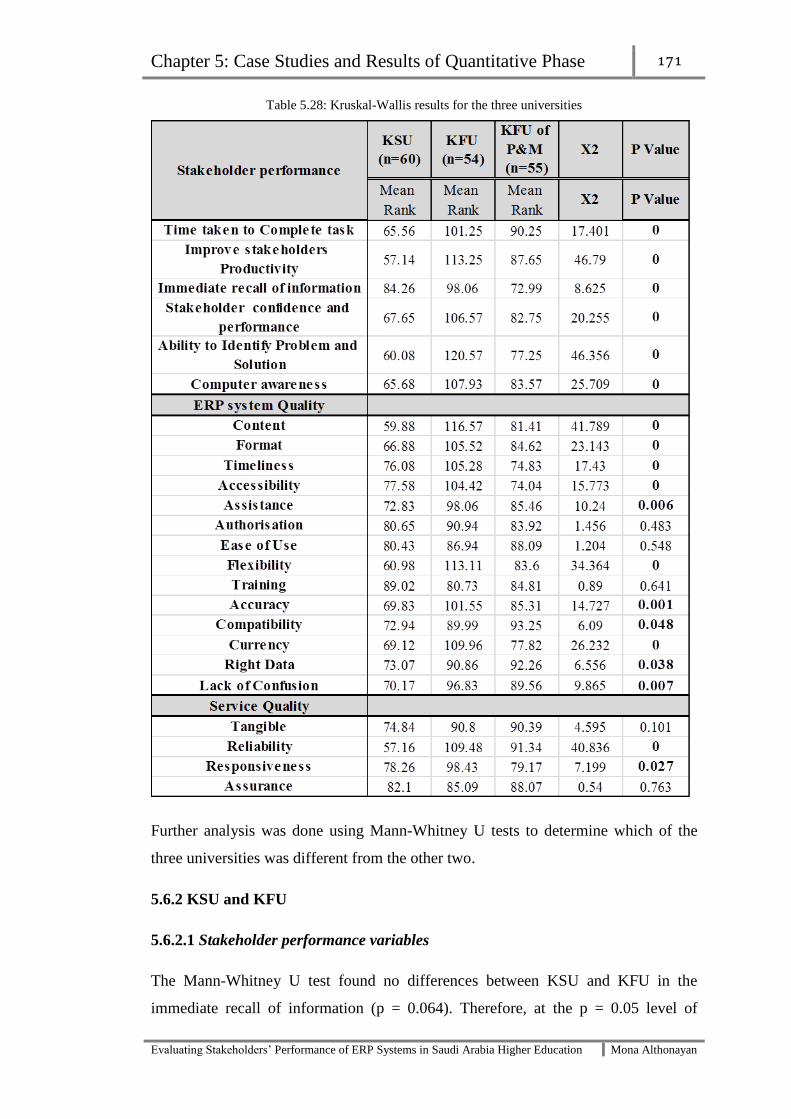
Chapter 5: Case Studies and Results of Quantitative Phase 171
Evaluating Stakeholders’ Performance of ERP Systems in Saudi Arabia Higher Education Mona Althonayan
Table 5.28: Kruskal-Wallis results for the three universities
Further analysis was done using Mann-Whitney U tests to determine which of the
three universities was different from the other two.
5.6.2 KSU and KFU
5.6.2.1 Stakeholder performance variables
The Mann-Whitney U test found no differences between KSU and KFU in the
immediate recall of information (p = 0.064). Therefore, at the p = 0.05 level of

Chapter 5: Case Studies and Results of Quantitative Phase 172
Evaluating Stakeholders’ Performance of ERP Systems in Saudi Arabia Higher Education Mona Althonayan
significance, there is enough evidence to conclude that there was a difference in the
median scores in the two universities with respect to all stakeholder performance
variables except for immediate recall of information. In addition, the fact that the
mean rank for KFU was higher than KSU in relation to all six stakeholder
performance variables indicates that KFU stakeholders perceived better performance
than those in KSU (Table 5.29).
5.6.2.2 ERP system quality variables
The Mann-Whitney U test (Table 5.29) also indicated no differences between KSU
and KFU in authorization, ease of use or training (p>0.05). In other words, at the p =
0.05 level of significance, there is enough evidence to conclude that there was a
difference in median scores between the two universities with respect to all ERP
system quality variables except for authorization, ease of use and training. In
addition, the fact that the mean rank was higher for KFU than KSU in relation to all
fourteen ERP system quality variables indicates that KFU stakeholders perceived
better system quality than did those at KSU.
5.6.2.3 ERP service quality
The Mann-Whitney U test results listed in Table 5.29 also indicate a meaningful
difference in terms of system reliability and responsiveness between KSU and KFU.
In addition, the mean rank for KFU was higher than KSU in relation to all four ERP
service quality variables, which indicates that KFU stakeholders perceived better
service quality than did those at KSU.

Chapter 5: Case Studies and Results of Quantitative Phase 173
Evaluating Stakeholders’ Performance of ERP Systems in Saudi Arabia Higher Education Mona Althonayan
Table 5.29: Mann-Whitney results (KSU and KFU)
5.6.3 KSU and KFUPM
5.6.3.1 Stakeholder performance variables
The Mann-Whitney U test indicated no differences between KSU and KFUPM in the
immediate recall of information (p = 0.432). Therefore, at the p = 0.05 level of
significance, there is enough evidence to conclude that there was a difference in the
median scores for the two universities with respect to all stakeholder performance
variables except for immediate recall of information. The mean rank for KSU was
also lower than that for KFUPM in relation to all stakeholder performance variables,
KSU (n=54) KFU (n=54)Mann
Whit. UZ P Value
Mean Rank Mean Rank U Z P Value
Time taken to Complete task 41.78 67.22 771 -4.39 0
Improve stakeholders
Productivity36.92 72.08 508.5 -6.49 0
Immediate recall of information 49.36 59.64 1180.5 -1.85 0.064
Stakeholder confidence and
performance42 67 783 -4.31 0
Ability to Identify Problem and
Solution35 74 405 -6.53 0
Computer awareness 41.44 67.56 752.5 -4.72 0
ERP system Quality
Content 36.8 72.2 502 -6.05 0
Format 42.63 66.37 817 -4.43 0
Timeliness 45.5 63.5 972 -3.33 0.001
Accessibility 46.16 62.84 1007.5 -3.06 0.002
Assistance 45.06 63.94 948 -3.66 0
Authorisation 49.98 59.02 1214 -1.59 0.111
Ease of Use 51.98 57.02 1322 -1.05 0.294
Flexibility 36.36 72.64 478.5 -6.26 0
Training 57.22 51.78 1311 -0.936 0.349
Accuracy 43.23 65.77 849.5 -4.08 0
Compatibility 46.78 62.22 1041 -2.64 0.008
Currency 41.87 67.13 776 -4.61 0
Right Data 46.56 62.44 1029.5 -2.83 0.005
Lack of Confusion 43.41 65.59 859 -3.82 0
Service Quality
Tangible 48.96 60.04 1159 -1.94 0.052
Reliability 38.09 70.91 572 -5.78 0
Responsiveness 45.74 63.26 985 -3.24 0.001
Assurance 52.19 56.81 1333.5 -0.836 0.403
Stakeholder performance

Chapter 5: Case Studies and Results of Quantitative Phase 174
Evaluating Stakeholders’ Performance of ERP Systems in Saudi Arabia Higher Education Mona Althonayan
indicating that KFUPM stakeholders perceived better performance than did those at
KSU (Table 5.30).
Table 5.30: Mann-Whitney results (KSU and KFUPM)
5.6.3.2 ERP system quality variables
The Mann-Whitney U test (Table 5.30) also found no differences between KSU and
KFUPM in timeliness, accessibility, assistance, authorization, ease of use, training or
currency (p>0.05). In other words, at the p = 0.05 level of significance, there is
KSU
(n=54)
KFU of
P&M
(n=54)
Mann
Whit. UZ P Value
Mean Rank Mean Rank U Z P Value
Improve stakeholders
Productivity44.17 64.83 900 -3.79 0
Time taken to Complete task 45.4 63.6 966.5 -3.12 0.002
Stakeholder confidence and
performance48.12 60.88 1113.5 -2.23 0.026
Computer awareness 48.05 60.95 1109.5 -2.31 0.021
Immediate recall of
information56.64 52.36 1342.5 -0.786 0.432
Ability to Identify Problem
and Solution46.86 62.14 1045.5 -2.56 0.011
ERP system Quality
Content 45.96 63.04 997 -2.962 0.003
Format 49.09 59.91 1166 -2.039 0.041
Timeliness 54.62 54.38 1451.5 -0.045 0.964
Accessibility 54.76 54.24 1444 -0.096 0.923
Assistance 49.21 59.79 1172.5 -1.95 0.051
Authorisation 52.66 56.34 1358.5 -0.645 0.519
Ease of Use 52.47 56.53 1348.5 -0.761 0.447
Flexibility 44.08 64.92 895.5 -3.544 0
Training 55.69 53.31 1394 -0.416 0.677
Accuracy 48.58 60.42 1138.5 -2.185 0.029
Compatibility 47.35 61.65 1072 -2.457 0.014
Currency 52.05 56.95 1325.5 -0.9 0.368
Right Data 46.33 62.67 1017 -2.886 0.004
Lack of Confusion 47.42 61.58 1075.5 -2.424 0.015
Service Quality
Tangible 49.32 59.68 1178.5 -1.85 0.064
Reliability 42.14 66.86 790.5 -4.47 0
Responsiveness 51.41 57.59 1291 -1.09 0.275
Assurance 51.71 57.29 1307.5 -1.04 0.3
Stakeholder performance

Chapter 5: Case Studies and Results of Quantitative Phase 175
Evaluating Stakeholders’ Performance of ERP Systems in Saudi Arabia Higher Education Mona Althonayan
enough evidence to conclude that there is a difference in the median scores for the
two universities with respect to all ERP system quality variables except for
timeliness, accessibility, assistance, authorization, ease of use, training and currency.
The mean rank for KFUPM was also higher than that for KSU in relation to all
fourteen ERP system quality variables, showing that KFUPM stakeholders perceived
better system quality than did those at KSU.
5.6.3.3 ERP service quality
Finally, the Mann-Whitney U test results listed in Table 5.30 indicate a meaningful
difference in terms of system reliability between KSU and KFUPM. In addition, as
the mean rank for KFUPM was higher than for KSU in relation to all four ERP
service quality variables, it can be concluded that KFUPM stakeholders perceived
better service quality than those at KSU.
5.6.4 KFU and KFUPM
5.6.4. 1 Stakeholder performance variables
In the final comparison between pairs of universities, the Mann-Whitney U test
results listed in Table 5.29 indicate no differences between KFU and KFUPM in the
time taken to complete a task (p = 0.152). Therefore, at the p = 0.05 level of
significance, we can conclude that there was a difference in the median scores for the
two universities with respect to all stakeholder performance variables except for the
time taken to complete a task. The additional fact that the mean rank for KFU was
higher than for KFUPM in relation to all six stakeholder performance variables
indicates that KFU stakeholders perceived better performance than those at KFUPM.
5.6.4.2 ERP system quality variables
The Mann-Whitney U test also found no difference between KFU and KFUPM in
assistance, authorization, ease of use, training, compatibility, right data or lack of
confusion (p>0.05). In other words, at the p = 0.05 level of significance, there is
enough evidence to conclude that there was a difference in the median scores at the
two universities with respect to all ERP system quality variables except for those
seven. In addition, the mean rank for KFU was higher than for KFUPM in relation to

Chapter 5: Case Studies and Results of Quantitative Phase 176
Evaluating Stakeholders’ Performance of ERP Systems in Saudi Arabia Higher Education Mona Althonayan
most of the ERP system quality variables, indicating that KFU stakeholders
perceived better system quality than did those at KFUPM (Table 5.29).
5.6.4. 3 ERP service quality
Finally, the Mann-Whitney U test results listed in Table 5.31 also indicate a
meaningful difference in terms of system reliability and responsiveness between
KFU and KFUPM. The table also shows that the mean rank for KFU was higher than
that for KFUPM in relation to the ERP service quality variables, indicating that KFU
stakeholders perceived better service quality than those at KFUPM.
Table 5.31: Mann-Whitney Results (KFU and KFUPM)
KFU (n=54)KFU of P&M
(n=54)Mann Whit. U Z P Value
Mean Rank Mean Rank U Z P Value
Improve stakeholders Productivity 63.58 45.42 967.5 -3.68 0
Time taken to Complete task 58.58 50.42 1237.5 -1.43 0.152
Stakeholder confidence and
performance62.5 46.5 1026 -2.87 0.004
Computer awareness 62.7 46.3 1015 -3.07 0.002
Immediate recall of information 62.74 46.26 1013 -3.05 0.002
Ability to Identify Problem and
Solution69.76 39.24 634 -5.13 0
ERP system Quality
Content 67.31 41.69 766 -4.495 0
Format 61.31 47.69 1090 -2.67 0.008
Timeliness 64.33 44.67 927 -3.71 0
Accessibility 64.56 44.44 914.5 -3.81 0
Assistance 58.49 50.51 1242.5 -1.62 0.106
Authorisation 57.08 51.92 1318.5 -0.919 0.358
Ease of Use 54.37 54.63 1451 -0.053 0.958
Flexibility 65.11 43.89 885 -3.67 0
Training 53.81 55.19 1421 -0.239 0.811
Accuracy 60.17 48.83 1152 -2.13 0.033
Compatibility 53.46 55.54 1402 -0.351 0.725
Currency 65.53 43.47 862.5 -4.06 0
Right Data 54.19 54.81 1441.5 -0.115 0.908
Lack of Confusion 56.78 52.22 1335 -0.797 0.425
Service Quality
Tangible 54.69 54.31 1447.5 -0.07 0.944
Reliability 61.56 47.44 1076.5 -2.7 0.007
Responsiveness 61.28 47.72 1092 -2.59 0.01
Assurance 53.89 55.11 1425 -0.237 0.813
Stakeholder performance

Chapter 5: Case Studies and Results of Quantitative Phase 177
Evaluating Stakeholders’ Performance of ERP Systems in Saudi Arabia Higher Education Mona Althonayan
The results of the comparisons between the three universities show that the impact on
performance was greatest at KFU and lowest at KSU. One possible reasons for these
results is that KFU and KFUPM both implemented Oracle, an ERP system which is
well known all over the world, while KSU chose to buy an in-house ERP system
from a local company, which will certainly have had less experience and expertise
than Oracle. Other possible reasons for the difference are preparation during the pre-
implementation phase, customization and employees’ resistance to change; all these
reasons and more will be discussed in detail in the next chapter.
5.7 All universities
To more thoroughly test H1, standard multiple regressions was again used to assess
the relative importance of the system quality variables in explaining differences in
attitudes towards stakeholder performance, with the six stakeholder performance
variables posited as the dependent variables and the fourteen ERP system quality
variables as the independent variables.
The R2 values show that the fourteen system quality variables, as a group, explained
48.0% of the variation in improved stakeholder productivity, 55.9% of the variation
in time taken to complete a task, 50.0% in stakeholder confidence and performance,
51.6% in computer awareness, 38.4% in immediate recall of information and 64.0%
in ability to identify problems and solutions.
The F values show that there were highly significant relationships (p<.001) between
the fourteen ERP system quality variables and the six stakeholder performance
variables. The model for ability to identify problems and solutions had the largest F
value, F(14, 168) = 19.554, p<.001, indicating that it was the most significant model,
followed by time taken to complete tasks, F(14, 168) = 13.944, p<.001, computer
awareness F(14, 168) = 11.714, p<.001, stakeholder confidence and performance,
F(14, 168) = 11.010, p<0.001, improved stakeholder productivity, F(14, 168) =
10.146, p<.001 and finally, immediate recall of information, F(14, 168) = 6.857,
p<.001.
β statistics were again used to assess the unique contribution of each predictor and
the effect on the outcome of a one standard deviation increase.

Chapter 5: Case Studies and Results of Quantitative Phase 178
Evaluating Stakeholders’ Performance of ERP Systems in Saudi Arabia Higher Education Mona Althonayan
5.7.1 Reliability test
Reliability was once more measured in terms of internal consistency by clustering
the items into their particular dimensional groups and calculating Cronbach’s α.
Table 5.32 shows that the total questionnaire, which consisted of 24 questions, had a
coefficient score of 0.917, indicating impressive internal consistency. In addition, the
performance, system quality and service quality constructs had respective reliability
coefficient scores of 0.889, 0.841 and 0.776, which are strongly acceptable, clearly
exceeding the 0.5 limit suggested by Nunnally (1978) for exploratory research.
Table 5.32: Reliability test - all universities
Hypothesis 1: ERP system quality variables have a significant impact on KSA
stakeholders’ performance variables (H1.1 - H1.14)
5.7.2 Multiple regression analysis
5.7.2.1 System quality
Improved stakeholder productivity: Table 5.33 shows that only four of the fourteen
system quality variables had a positive significant impact on improved stakeholder
productivity at p<0.05: timeliness, with a standardised coefficient of β = 0.230, ease
of use (β = 0.202), flexibility (β = 0.275) and currency (β = 0.147). Thus, the
regression equation to predict improved stakeholder productivity is:
B0 + B1 Timeliness + B2 Ease of use + B3 Flexibility + B4 Currency,
where the values of B0, B1, B2, B3, and B4 are 0.733, 0.244, 0.207, 0.222 and 0.131
respectively.
Constructs Number of items Cronbach's Alpha Type
Total questions 24 0.917 High reliability
Performance 6 0.889 High reliability
System Quality 14 0.841 High reliability
Service Quality 4 0.776 High reliability

Chapter 5: Case Studies and Results of Quantitative Phase 179
Evaluating Stakeholders’ Performance of ERP Systems in Saudi Arabia Higher Education Mona Althonayan
Time taken to complete task: Table 5.33 also shows that only four of the fourteen
system quality variables had a significant impact on time taken to complete a task
(p<0.05). These were content, with a standardised coefficient of β = 0.323, timeliness
(β = 0.173), authorisation (β = -0.189) and flexibility (β = 0.182). Thus, the
regression equation to predict time to complete task is:
B1 Content + B2 Timeliness + B3 Authorisation + B4 Flexibility,
where the values of B1, B2, B3 and B4 are 0.352, 0.178, -0.142 and 0.142
respectively, as listed in Table 5.33.
Table 5.33: Regression models for improved stakeholder productivity and time taken to complete task
influenced by system quality at all universities
Stakeholder confidence and performance: Table 5.34 shows that among the
variables of system quality, again only four had a significant impact on stakeholder
confidence and performance at p<0.05: content, (β = 0.178), timeliness (β = 0.181),
authorisation (β = -0.299) and flexibility (β = 0.266). Thus, the regression equation
to predict stakeholder confidence and performance is:
B0 + B1 Content + B2 Timeliness + B3 Authorisation + B4 Flexibility,
where the values of B0, B1, B2, B3 and B4 are 0.969, 0.191, 0.183, -0.222 and 0.205
respectively.
Computer awareness: Table 5.34 also shows that five of the fourteen system quality
variables had a significant impact on computer awareness at p<0.05: content
Model STD CO Model STD CO
ISP B Std. Error Beta TCT B Std. Error Beta
(Constant) 0.733 0.363 2.016 0.046 (Constant) 0.367 0.324 1.133 0.259
Content 0.078 0.103 0.07 0.758 0.45 Content 0.352 0.092 0.323 3.825 0
Format 0.042 0.089 0.04 0.465 0.643 Format 0.048 0.08 0.048 0.604 0.547
Timeliness 0.244 0.097 0.23 2.529 0.012 Timeliness 0.178 0.086 0.173 2.067 0.04
Accessibility -.127- 0.1 -.121- -1.263- 0.209 Accessibility 0.009 0.089 0.009 0.103 0.918
Assistance 0.067 0.07 0.069 0.945 0.346 Assistance -.020- 0.063 -.021- -.319- 0.75
Authorisation -.036- 0.051 -.046- -.703- 0.483 Authorisation -.142- 0.045 -.189- -3.132- 0.002
Ease of Use 0.207 0.073 0.202 2.836 0.005 Ease of Use 0.107 0.065 0.108 1.65 0.101
Flexibility 0.222 0.06 0.275 3.718 0 Flexibility 0.142 0.053 0.182 2.678 0.008
Training -.044- 0.054 -.056- -.815- 0.417 Training -.007- 0.048 -.009- -.142- 0.887
Accuracy 0.118 0.071 0.128 1.666 0.098 Accuracy 0.006 0.063 0.007 0.103 0.918
Compatibility -.020- 0.074 -.020- -.265- 0.792 Compatibility 0.074 0.066 0.078 1.132 0.259
Currency 0.131 0.062 0.147 2.102 0.037 Currency 0.094 0.056 0.108 1.687 0.094
Right Data 0.05 0.064 0.062 0.781 0.436 Right Data 0.083 0.057 0.106 1.448 0.15
Lack of Confusion 0.007 0.062 0.009 0.109 0.914 Lack of Confusion 0.021 0.055 0.029 0.379 0.705
UNSTD CO-Unstandardized Coefficients,STD CO-Standarized Coefficients
ISP=Improve stakeholders’ Productivity, TCT= Time Taken to Complete Task
Sig.USTD CO t Sig. USTD CO t
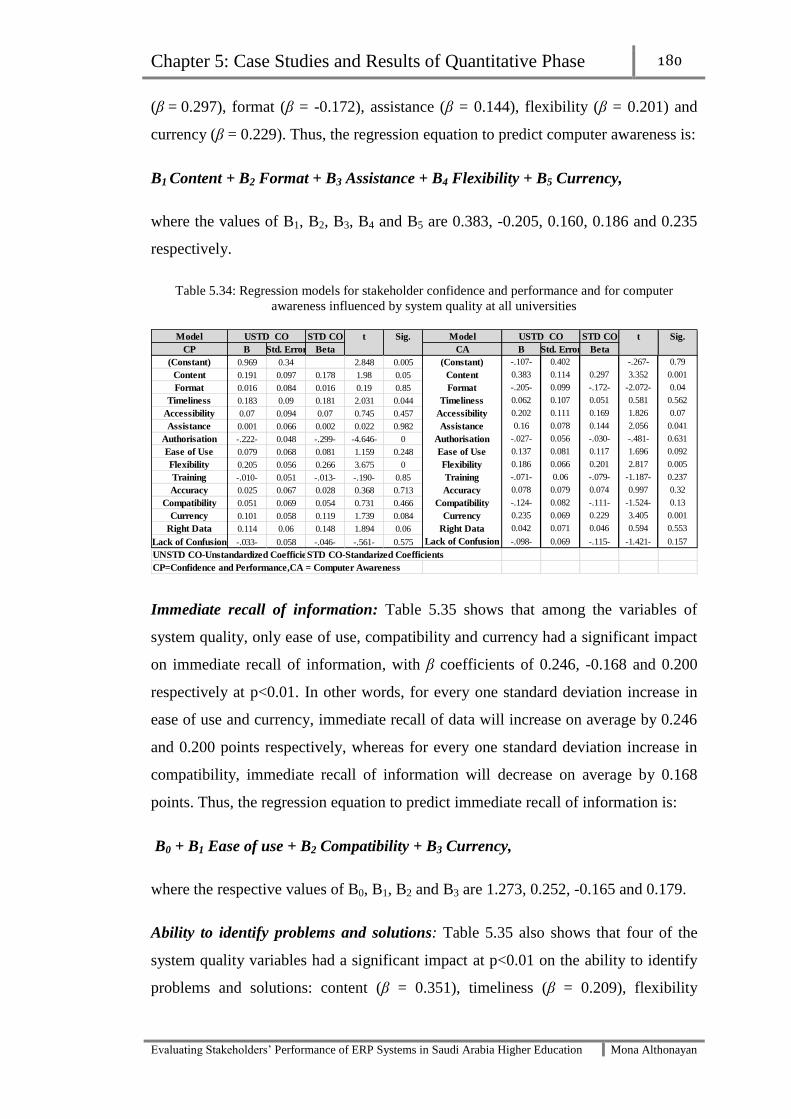
Chapter 5: Case Studies and Results of Quantitative Phase 180
Evaluating Stakeholders’ Performance of ERP Systems in Saudi Arabia Higher Education Mona Althonayan
(β = 0.297), format (β = -0.172), assistance (β = 0.144), flexibility (β = 0.201) and
currency (β = 0.229). Thus, the regression equation to predict computer awareness is:
B1 Content + B2 Format + B3 Assistance + B4 Flexibility + B5 Currency,
where the values of B1, B2, B3, B4 and B5 are 0.383, -0.205, 0.160, 0.186 and 0.235
respectively.
Table 5.34: Regression models for stakeholder confidence and performance and for computer
awareness influenced by system quality at all universities
Immediate recall of information: Table 5.35 shows that among the variables of
system quality, only ease of use, compatibility and currency had a significant impact
on immediate recall of information, with β coefficients of 0.246, -0.168 and 0.200
respectively at p<0.01. In other words, for every one standard deviation increase in
ease of use and currency, immediate recall of data will increase on average by 0.246
and 0.200 points respectively, whereas for every one standard deviation increase in
compatibility, immediate recall of information will decrease on average by 0.168
points. Thus, the regression equation to predict immediate recall of information is:
B0 + B1 Ease of use + B2 Compatibility + B3 Currency,
where the respective values of B0, B1, B2 and B3 are 1.273, 0.252, -0.165 and 0.179.
Ability to identify problems and solutions: Table 5.35 also shows that four of the
system quality variables had a significant impact at p<0.01 on the ability to identify
problems and solutions: content (β = 0.351), timeliness (β = 0.209), flexibility
Model STD CO Model STD CO
CP B Std. Error Beta CA B Std. Error Beta
(Constant) 0.969 0.34 2.848 0.005 (Constant) -.107- 0.402 -.267- 0.79
Content 0.191 0.097 0.178 1.98 0.05 Content 0.383 0.114 0.297 3.352 0.001
Format 0.016 0.084 0.016 0.19 0.85 Format -.205- 0.099 -.172- -2.072- 0.04
Timeliness 0.183 0.09 0.181 2.031 0.044 Timeliness 0.062 0.107 0.051 0.581 0.562
Accessibility 0.07 0.094 0.07 0.745 0.457 Accessibility 0.202 0.111 0.169 1.826 0.07
Assistance 0.001 0.066 0.002 0.022 0.982 Assistance 0.16 0.078 0.144 2.056 0.041
Authorisation -.222- 0.048 -.299- -4.646- 0 Authorisation -.027- 0.056 -.030- -.481- 0.631
Ease of Use 0.079 0.068 0.081 1.159 0.248 Ease of Use 0.137 0.081 0.117 1.696 0.092
Flexibility 0.205 0.056 0.266 3.675 0 Flexibility 0.186 0.066 0.201 2.817 0.005
Training -.010- 0.051 -.013- -.190- 0.85 Training -.071- 0.06 -.079- -1.187- 0.237
Accuracy 0.025 0.067 0.028 0.368 0.713 Accuracy 0.078 0.079 0.074 0.997 0.32
Compatibility 0.051 0.069 0.054 0.731 0.466 Compatibility -.124- 0.082 -.111- -1.524- 0.13
Currency 0.101 0.058 0.119 1.739 0.084 Currency 0.235 0.069 0.229 3.405 0.001
Right Data 0.114 0.06 0.148 1.894 0.06 Right Data 0.042 0.071 0.046 0.594 0.553
Lack of Confusion -.033- 0.058 -.046- -.561- 0.575 Lack of Confusion -.098- 0.069 -.115- -1.421- 0.157
UNSTD CO-Unstandardized Coefficients,STD CO-Standarized Coefficients
CP=Confidence and Performance,CA = Computer Awareness
Sig.USTD CO t Sig. USTD CO t
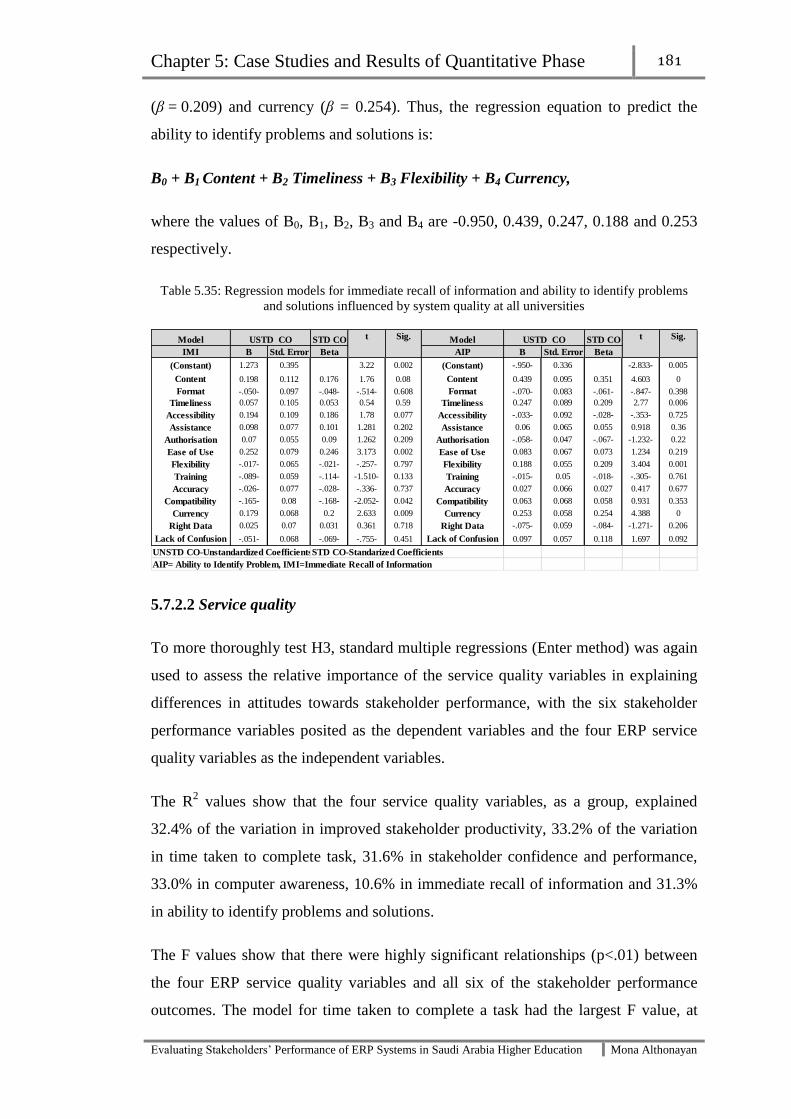
Chapter 5: Case Studies and Results of Quantitative Phase 181
Evaluating Stakeholders’ Performance of ERP Systems in Saudi Arabia Higher Education Mona Althonayan
(β = 0.209) and currency (β = 0.254). Thus, the regression equation to predict the
ability to identify problems and solutions is:
B0 + B1 Content + B2 Timeliness + B3 Flexibility + B4 Currency,
where the values of B0, B1, B2, B3 and B4 are -0.950, 0.439, 0.247, 0.188 and 0.253
respectively.
Table 5.35: Regression models for immediate recall of information and ability to identify problems
and solutions influenced by system quality at all universities
5.7.2.2 Service quality
To more thoroughly test H3, standard multiple regressions (Enter method) was again
used to assess the relative importance of the service quality variables in explaining
differences in attitudes towards stakeholder performance, with the six stakeholder
performance variables posited as the dependent variables and the four ERP service
quality variables as the independent variables.
The R2 values show that the four service quality variables, as a group, explained
32.4% of the variation in improved stakeholder productivity, 33.2% of the variation
in time taken to complete task, 31.6% in stakeholder confidence and performance,
33.0% in computer awareness, 10.6% in immediate recall of information and 31.3%
in ability to identify problems and solutions.
The F values show that there were highly significant relationships (p<.01) between
the four ERP service quality variables and all six of the stakeholder performance
outcomes. The model for time taken to complete a task had the largest F value, at
Model STD CO Model STD CO
IMI B Std. Error Beta AIP B Std. Error Beta
(Constant) 1.273 0.395 3.22 0.002 (Constant) -.950- 0.336 -2.833- 0.005
Content 0.198 0.112 0.176 1.76 0.08 Content 0.439 0.095 0.351 4.603 0
Format -.050- 0.097 -.048- -.514- 0.608 Format -.070- 0.083 -.061- -.847- 0.398
Timeliness 0.057 0.105 0.053 0.54 0.59 Timeliness 0.247 0.089 0.209 2.77 0.006
Accessibility 0.194 0.109 0.186 1.78 0.077 Accessibility -.033- 0.092 -.028- -.353- 0.725
Assistance 0.098 0.077 0.101 1.281 0.202 Assistance 0.06 0.065 0.055 0.918 0.36
Authorisation 0.07 0.055 0.09 1.262 0.209 Authorisation -.058- 0.047 -.067- -1.232- 0.22
Ease of Use 0.252 0.079 0.246 3.173 0.002 Ease of Use 0.083 0.067 0.073 1.234 0.219
Flexibility -.017- 0.065 -.021- -.257- 0.797 Flexibility 0.188 0.055 0.209 3.404 0.001
Training -.089- 0.059 -.114- -1.510- 0.133 Training -.015- 0.05 -.018- -.305- 0.761
Accuracy -.026- 0.077 -.028- -.336- 0.737 Accuracy 0.027 0.066 0.027 0.417 0.677
Compatibility -.165- 0.08 -.168- -2.052- 0.042 Compatibility 0.063 0.068 0.058 0.931 0.353
Currency 0.179 0.068 0.2 2.633 0.009 Currency 0.253 0.058 0.254 4.388 0
Right Data 0.025 0.07 0.031 0.361 0.718 Right Data -.075- 0.059 -.084- -1.271- 0.206
Lack of Confusion -.051- 0.068 -.069- -.755- 0.451 Lack of Confusion 0.097 0.057 0.118 1.697 0.092
UNSTD CO-Unstandardized Coefficients,STD CO-Standarized Coefficients
AIP= Ability to Identify Problem, IMI=Immediate Recall of Information
Sig.USTD CO t Sig. USTD CO t

Chapter 5: Case Studies and Results of Quantitative Phase 182
Evaluating Stakeholders’ Performance of ERP Systems in Saudi Arabia Higher Education Mona Althonayan
F(4, 168) = 20.398, p<.001, indicating that it was the most significant model,
followed by computer awareness F(4, 168) = 20.192, p<.001, then improved
stakeholder productivity, F(4, 168) = 19.644, p <.001, stakeholder confidence and
performance, F(4, 168) = 18.977, p<.001, ability to identify a problem and solution
F(4, 168) = 18.689, p<.001 and finally, immediate recall of information F(4, 168) =
4.86, p<.01.
Again, β statistics were calculated to assess the unique contribution of each predictor
on the outcome and the effect that a one standard deviation increase would have on
the outcome.
Hypothesis 2: ERP service quality variables have a significant impact on KSA
stakeholders’ performance variables (H2.1 – H2.4)
Improved stakeholder productivity: Table 5.36 shows that among the four variables
of service quality, only reliability had a positive significant impact on improving
stakeholder productivity, with a standardised Beta coefficient β = 0.458 at p<0.001,
so that for every one standard deviation increase in reliability, improved stakeholder
productivity will increase on average by 0.458 points. Thus, the regression equation
to predict improved stakeholder productivity is:
B0 + B1 Reliability = 2.238 + 0.420 Reliability,
where the values of B0 and B1 are the unstandardized B coefficients shown in the
regression analysis in Table 5.36.
Time taken to complete task: Table 5.36 also shows that all four variables of service
quality except tangibility (p = 0.391) had a significant impact on time taken to
complete a task. Thus, the regression equation to predict time taken to complete a
task is: B0 + B1 Reliability + B2 Responsiveness + B3 Assurance,
where the values of B0, B1, B2 and B3 are 2.164, 0.358, 0.233 and -0.15 respectively.

Chapter 5: Case Studies and Results of Quantitative Phase 183
Evaluating Stakeholders’ Performance of ERP Systems in Saudi Arabia Higher Education Mona Althonayan
Table 5.36: Regression models for improved stakeholder productivity and time taken to complete task
influenced by service quality at all universities
Stakeholder confidence and performance: Table 5.37 shows that all four variables
of service quality except tangibility (p = 0.082) also had a significant impact on
stakeholder confidence and performance. Thus, the regression equation to predict
stakeholder confidence and performance is:
B0 + B1 Reliability + B2 Responsiveness + B3 Assurance,
where the values of B0, B1, B2 and B3 are 2.294, 0.259, 0.275 and -0.174 respectively.
Computer awareness: Table 5.37 also shows that again, all four service quality
variables except tangibility (p = 0.116) had a significant impact on computer
awareness. Thus, the regression equation to predict computer awareness is:
B0 + B1 Reliability + B2 Responsiveness + B3 Assurance,
where the respective values of B0, B1, B2 and B3 are 1.62, 0.401, 0.258 and -0.191.
Table 5.37: Regression models for stakeholder confidence and performance and computer awareness
influenced by service quality at all the universities
Immediate recall of information: Table 5.38 shows that the situation was different
for immediate recall of information: among the service quality variables, only
reliability had a positive significant impact at p<0.05 (β = 0.193). For every one
standard deviation increase in reliability, immediate recall of information will
Model STD CO Model STD CO
ISP B Std. Error Beta TCT B Std. Error Beta
(Constant) 2.238 0.281 7.972 0 (Constant) 2.164 0.27 8.018 0
Tangible 0.139 0.073 0.152 1.913 0.058 Tangible 0.06 0.07 0.068 0.861 0.391
Reliability 0.42 0.077 0.458 5.491 0 Reliability 0.358 0.074 0.403 4.861 0
Responsiveness 0.058 0.069 0.076 0.848 0.398 Responsiveness 0.233 0.066 0.313 3.522 0.001
Assurance -.068- 0.074 -.078- -.920- 0.359 Assurance -.150- 0.071 -.179- -2.127- 0.035
UNSTD CO-Unstandardized Coefficients,STD CO-Standarized Coefficients
ISP=Improve stakeholders’ Productivity, TCT= Time Taken to Complete Task
t Sig.USTD CO t Sig. USTD CO
Model STD CO Model STD CO
CP B Std. Error Beta CA B Std. Error Beta
(Constant) 2.294 0.27 8.508 0 (Constant) 1.62 0.32 5.055 0
Tangible 0.122 0.07 0.14 1.747 0.082 Tangible 0.131 0.083 0.125 1.578 0.116
Reliability 0.259 0.074 0.295 3.52 0.001 Reliability 0.401 0.087 0.381 4.59 0
Responsiveness 0.275 0.066 0.373 4.153 0 Responsiveness 0.258 0.079 0.292 3.285 0.001
Assurance -.174- 0.071 -.209- -2.460- 0.015 Assurance -.191- 0.084 -.191- -2.273- 0.024
UNSTD CO-Unstandardized Coefficients,STD CO-Standarized Coefficients
CP=Confidence and Performance,CA = Computer Awareness
Sig.USTD CO t Sig. USTD CO t
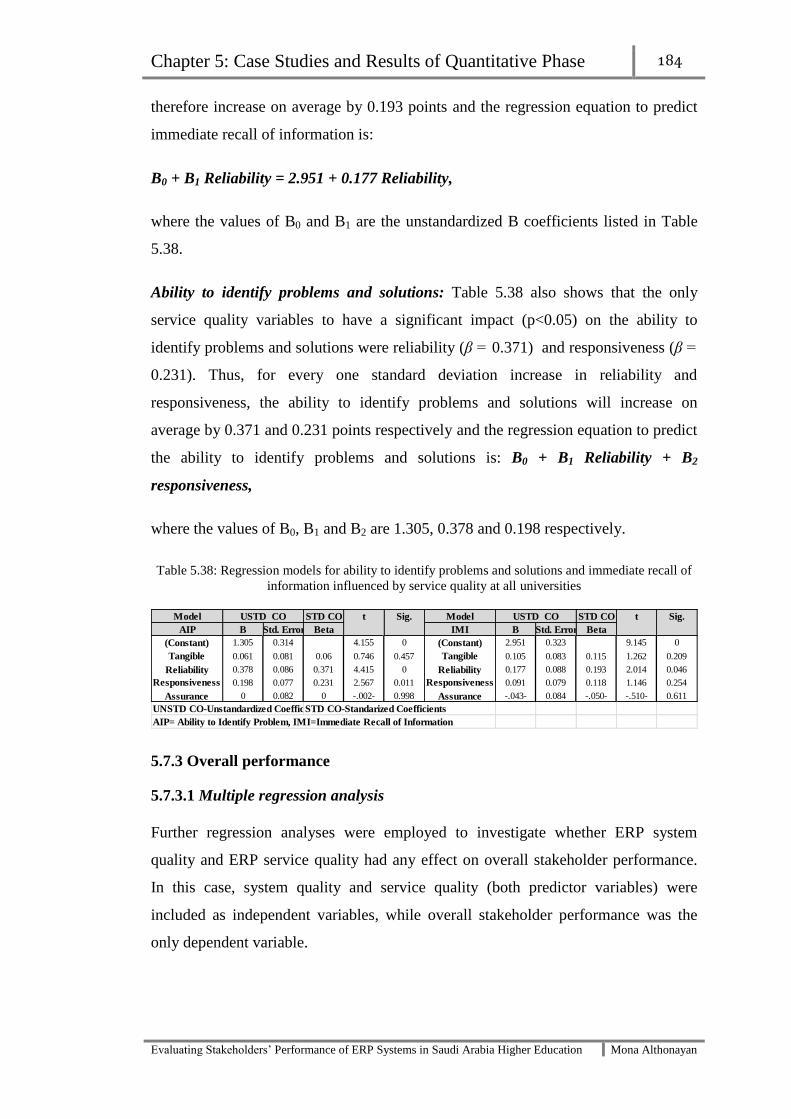
Chapter 5: Case Studies and Results of Quantitative Phase 184
Evaluating Stakeholders’ Performance of ERP Systems in Saudi Arabia Higher Education Mona Althonayan
therefore increase on average by 0.193 points and the regression equation to predict
immediate recall of information is:
B0 + B1 Reliability = 2.951 + 0.177 Reliability,
where the values of B0 and B1 are the unstandardized B coefficients listed in Table
5.38.
Ability to identify problems and solutions: Table 5.38 also shows that the only
service quality variables to have a significant impact (p<0.05) on the ability to
identify problems and solutions were reliability (β = 0.371) and responsiveness (β =
0.231). Thus, for every one standard deviation increase in reliability and
responsiveness, the ability to identify problems and solutions will increase on
average by 0.371 and 0.231 points respectively and the regression equation to predict
the ability to identify problems and solutions is: B0 + B1 Reliability + B2
responsiveness,
where the values of B0, B1 and B2 are 1.305, 0.378 and 0.198 respectively.
Table 5.38: Regression models for ability to identify problems and solutions and immediate recall of
information influenced by service quality at all universities
5.7.3 Overall performance
5.7.3.1 Multiple regression analysis
Further regression analyses were employed to investigate whether ERP system
quality and ERP service quality had any effect on overall stakeholder performance.
In this case, system quality and service quality (both predictor variables) were
included as independent variables, while overall stakeholder performance was the
only dependent variable.
Model STD CO Model STD CO
AIP B Std. Error Beta IMI B Std. Error Beta
(Constant) 1.305 0.314 4.155 0 (Constant) 2.951 0.323 9.145 0
Tangible 0.061 0.081 0.06 0.746 0.457 Tangible 0.105 0.083 0.115 1.262 0.209
Reliability 0.378 0.086 0.371 4.415 0 Reliability 0.177 0.088 0.193 2.014 0.046
Responsiveness 0.198 0.077 0.231 2.567 0.011 Responsiveness 0.091 0.079 0.118 1.146 0.254
Assurance 0 0.082 0 -.002- 0.998 Assurance -.043- 0.084 -.050- -.510- 0.611
UNSTD CO-Unstandardized Coefficients,STD CO-Standarized Coefficients
AIP= Ability to Identify Problem, IMI=Immediate Recall of Information
USTD CO t Sig.USTD CO t Sig.

Chapter 5: Case Studies and Results of Quantitative Phase 185
Evaluating Stakeholders’ Performance of ERP Systems in Saudi Arabia Higher Education Mona Althonayan
5.7.2.1.1 System quality
Table 5.39 shows that among the system quality variables, content had the highest β
value (0.294), indicating that it had the largest relative effect on overall stakeholder
performance. Of the other variables, format, accessibility, assistance, training,
accuracy, compatibility, right data and lack of confusion were not significant
predictors or determinants of overall stakeholder performance. Hence, the regression
equation for overall stakeholder performance is:
B1 Content + B2 Timeliness + B3 Authorisation + B4 Ease of use + B5 Flexibility +
B6 Currency,
Where the values of B1, B2, B3, B4, B5 and B6 are .274, 0.162, -0.069, 0.144, 0.154
and 0.165 respectively, as listed in Table 5.39
Table 5.39: Predicting overall stakeholder performance by ERP system quality
ERP system Quality
Content (β ) .294***
Format (β ) -.043-
Timeliness (β ) .184**
Accessibility (β ) 0.061
Assistance (β ) 0.076
Authorisation (β ) -.108-*
Ease of Use (β ) .170**
Flexibility (β ) .231***
Training (β ) -.061-
Accuracy (β ) 0.05
Compatibility (β ) -.025-
Currency (β ) .223***
Right Data (β ) 0.06
Lack of Confusion
(β )-.015-
R2 0.7
Adj. -R2 0.672
F -ratio 25.612
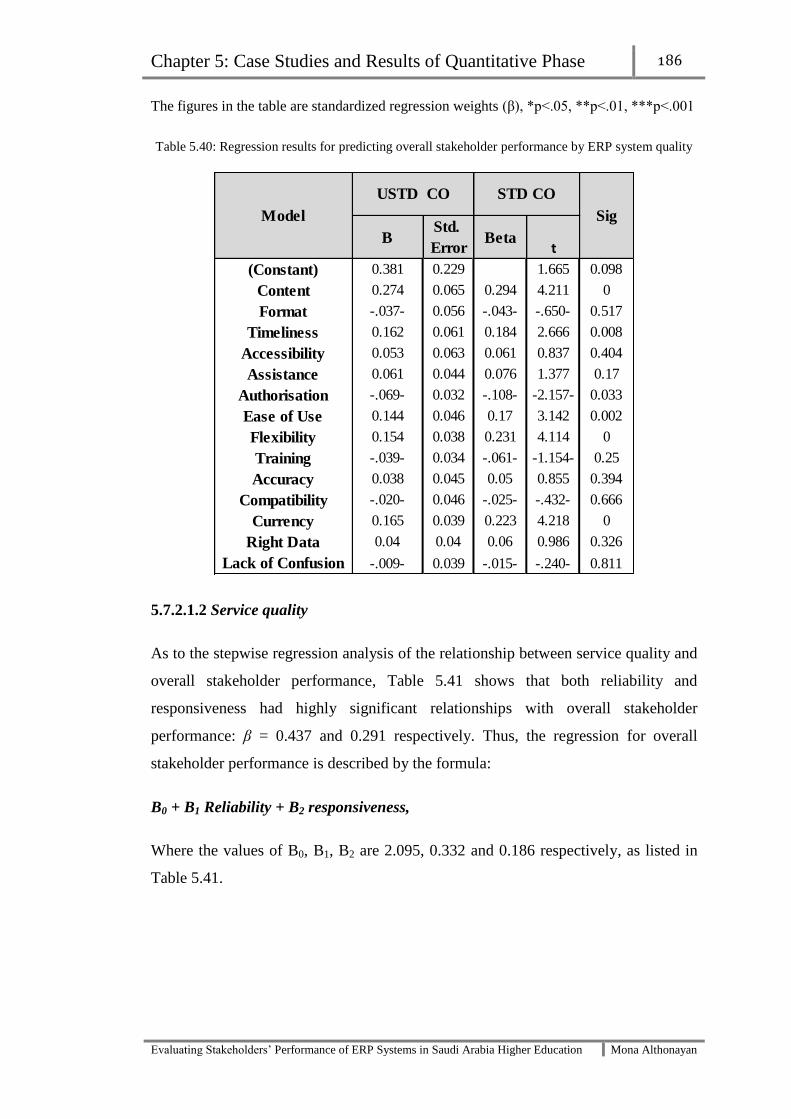
Chapter 5: Case Studies and Results of Quantitative Phase 186
Evaluating Stakeholders’ Performance of ERP Systems in Saudi Arabia Higher Education Mona Althonayan
The figures in the table are standardized regression weights (β), *p<.05, **p<.01, ***p<.001
Table 5.40: Regression results for predicting overall stakeholder performance by ERP system quality
5.7.2.1.2 Service quality
As to the stepwise regression analysis of the relationship between service quality and
overall stakeholder performance, Table 5.41 shows that both reliability and
responsiveness had highly significant relationships with overall stakeholder
performance: β = 0.437 and 0.291 respectively. Thus, the regression for overall
stakeholder performance is described by the formula:
B0 + B1 Reliability + B2 responsiveness,
Where the values of B0, B1, B2 are 2.095, 0.332 and 0.186 respectively, as listed in
Table 5.41.
BStd.
ErrorBeta
t
(Constant) 0.381 0.229 1.665 0.098
Content 0.274 0.065 0.294 4.211 0
Format -.037- 0.056 -.043- -.650- 0.517
Timeliness 0.162 0.061 0.184 2.666 0.008
Accessibility 0.053 0.063 0.061 0.837 0.404
Assistance 0.061 0.044 0.076 1.377 0.17
Authorisation -.069- 0.032 -.108- -2.157- 0.033
Ease of Use 0.144 0.046 0.17 3.142 0.002
Flexibility 0.154 0.038 0.231 4.114 0
Training -.039- 0.034 -.061- -1.154- 0.25
Accuracy 0.038 0.045 0.05 0.855 0.394
Compatibility -.020- 0.046 -.025- -.432- 0.666
Currency 0.165 0.039 0.223 4.218 0
Right Data 0.04 0.04 0.06 0.986 0.326
Lack of Confusion -.009- 0.039 -.015- -.240- 0.811
Sig
USTD CO STD CO
Model

Chapter 5: Case Studies and Results of Quantitative Phase 187
Evaluating Stakeholders’ Performance of ERP Systems in Saudi Arabia Higher Education Mona Althonayan
Table 5.41: Predicting overall stakeholder performance by ERP service quality
The figures in the table are standardized regression weights (β), *p<.05, **p<.01, ***p<.001
Table 5.42: Regression results for predicting overall stakeholder performance by ERP service quality
The purpose of this research was to investigate whether ERP system quality and ERP
service quality affected stakeholder performance. The analysis of the results shows
that the following system quality factors had a significant impact on overall
stakeholder performance: content, timeliness, and authorisation, ease of use,
flexibility and currency. This is not surprising, because it matches reports in the
literature of previous studies, although they had been used for different purposes.
As to service quality, the finding that responsiveness and reliability were the factors
showing the highest significant impact on overall stakeholder performance was
expected, whereas the insignificance of the assurance and tangibility factors was
unexpected, since these factors were engaged and correlated with the others.
Based on the above analysis, Figure 5.5 shows a conceptual model representing the
relationships among ERP system quality variables, ERP service quality variables and
overall stakeholder performance.
Service Quality
Tangible (β ) 0.136
Reliability (β ) .437***
Responsiveness
(β ).291**
Assurance (β ) -.145-
R2 0.421
Adj. -R2 0.407
F -ratio 29.86
BStd.
ErrorBeta
t
(Constant) 2.095 0.215 9.75 0
Tangible 0.103 0.056 0.136 1.852 0.066
Reliability 0.332 0.059 0.437 5.669 0
Responsiveness 0.186 0.053 0.291 3.518 0.001
Assurance -.104- 0.056 -.145- -1.853- 0.066
USTD CO STD CO
Model Sig.

Chapter 5: Case Studies and Results of Quantitative Phase 188
Evaluating Stakeholders’ Performance of ERP Systems in Saudi Arabia Higher Education Mona Althonayan
Figure 5.7: Conceptual model of results
Content
Timeliness
Authorization
Ease of use Overall Preformance
Flexibility
Currency
Reliability
Responsiveness
System and Service
Quality
Stakeholder
Performance

Chapter 5: Case Studies and Results of Quantitative Phase 189
Evaluating Stakeholders’ Performance of ERP Systems in Saudi Arabia Higher Education Mona Althonayan
The outcome of the above model (Figure 5.5) is based on the quantitative part of this
research; the researcher believes that there is still a need for additional qualitative
data to complement the proposed model (Figure 5.5). According to Skok and Legge
(2002), in complex ERP projects which involve multiple stakeholders and the
interrelationship between them, a single data collection technique would be unlikely
to provide a clear picture of the impact of the ERP system on stakeholders’
performance. Therefore, there is a need for an in-depth analysis, for which situation
an interpretive and qualitative approach is suitable, as it helps the researcher identify
the key issues of concern among the stakeholders who have actually been involved in
the ERP system in their daily work. This approach will be discussed in the following
chapter.
5.8 Summary
This chapter has reported, analysed and discussed the results of the quantitative
phase of this research in three steps: presenting the result of each case separately,
making comparisons between the cases, then aggregating all of the data to assess the
impact of the ERP systems on overall performance, shown in a conceptual model.
The next chapter will report and discusses the results of the qualitative phase
(interview) of this research in the three case studies separately and make the
comparison between the cases.
Chapter 6: Case studies’ Qualitative Analysis 188
Evaluating Stakeholders’ Performance of ERP Systems in Saudi Arabia Higher Education Mona Althonayan
PAGE
6.1 Overview……………………………………………………………………. 190
6.2 Method……………………………………………………………………... 190
6.2.1 Sample…………………………………………………………………… 190
6.2.2 Instrument design………………………………………………………. 191
6.2.3 Interview administration………………………………………………. 191
6.2.4 Data analysis……………………………………………………………. 191
6.3 Case Study 1: King Saud University………………………………………. 191
6.3.1 Contextual factors………………………………………………………. 192
6.3.2 Improving stakeholders’ productivity and performance…………….. 196
6.3.2.1 Systems Quality………………………………………………………. 196
6.3.2.2 Service quality………………………………………………………... 199
6.4 Case Study 2: King Fahd University of Petroleum & Minerals…………. 200
6.4.1 Contextual factors………………………………………………………. 201
CHAPTER SIX
CASE STUDIES’
QUALITATIVE
ANALYSIS

Chapter 6: Case studies’ Qualitative Analysis 189
Evaluating Stakeholders’ Performance of ERP Systems in Saudi Arabia Higher Education Mona Althonayan
PAGE
6.4.2 Improving stakeholders’ productivity and performance…………….. 203
6.4.2.1 System Quality……………………………………………………….. 204
6.4.2.2 Service Quality……………………………………………………….. 206
6.5 Case Study 3: King Faisal University……………………………………... 207
6.5.1 Contextual factors………………………………………………………. 207
6.5.3 Improving stakeholders’ productivity and performance…………….. 210
6.5.3.1 Systems Quality………………………………………………………. 210
6.5.3.2 Service quality……………………………………………….……….. 212
6.6 Universities Compared……………………………………………………...
213
6.6.5 Improving stakeholders’ productivity and performance…………….. 215
6.6.5.1 Systems Quality………………………………………………………. 215
6.6.5.2 Service quality………………………………………………………... 215
6.7 Summary……………………………………………………………………. 216

Chapter 6: Case studies’ Qualitative Analysis 190
Evaluating Stakeholders’ Performance of ERP Systems in Saudi Arabia Higher Education Mona Althonayan
6.1 Overview
This chapter continues the investigation begun in the previous chapter, aiming at a
deep and profound understanding of the phenomenon under investigation, as well as
testing the research hypotheses. Next, it examines the findings of the interviews,
document review and study of the archival records. The raw data are then narrowed
down by applying several techniques (as explained in detail in chapter 4). This
chapter thus presents the findings and offers a secondary analysis of the empirical
data to examine and validate the theoretical framework.
The interview findings are categorised according to the significant factors in the
model. They are also coded in accordance with the sub-units and themes that are
linked and found relevant to the key concepts. To offer a rigorous examination of the
findings, a cross-cases comparative analysis is also made and the strongest patterns,
key themes and concepts are identified.
Data analysis also suggests adding newly emerging constructs and factors; therefore,
an iterative and flexible analysis of the data is adopted to embrace any suggested
themes or patterns. The outcome of the initial preliminary analysis of the cases
suggests some modifications to the framework, which are presented and discussed
comprehensively in the next chapter.
6.2 Method
6.2.1 Sample
Interviews were conducted with 25 ERP system managers and employees (KSU n=9,
KFU n=8, KFUPM n=8) who used the systems in their daily work; the participants
all worked in the same departments (Management and administrative) and had
sufficient experience. Although this sample cannot be taken as representative of the
three universities overall, the participating managers were involved in the planning,
pre-implementation and implementation phases; therefore, their feedback was
essential to focus on any drawbacks and challenges faced by the universities. It was
also important to interview employees in order to support the results of the
questionnaire survey by eliciting further details from the participants.

Chapter 6: Case studies’ Qualitative Analysis 191
Evaluating Stakeholders’ Performance of ERP Systems in Saudi Arabia Higher Education Mona Althonayan
6.2.2 Instrument design
The interview protocol comprised a total of ten open-ended questions posed to
managers, seven of which were also asked of employees (see Appendix B). The aim
of the interviews with managers was to open a conversation in order to identify the
ideas behind the implementation and preparation for it, focusing on the barriers and
challenges before and after implementation, and on future plans.
The interviews with employees were slightly different; the questions were based on
the questionnaire results (chapter 5) and the aim was to elicit more detail from the
interviewees about their opinions of the ERP system in terms of problems
encountered and their suggestions for improved implementation.
6.2.3 Interview administration
The interviews were mainly conducted by phone during the months of August,
September and October 2012. Two interviews were conducted by Skype due to the
unavailability of managers at the time of the interview. All interviews were
transcribed by the researcher, who conducted the interviews in English and Arabic:
some English terms were used where necessary when the interview was in Arabic.
6.2.4 Data analysis
Interview answers were transcribed and examined analytically. As discussed in
chapter 4, the analysis involved coding all the answers given by participants and
classifying words under main headings. The frequency of the actual words and their
synonyms used by participants in response to questions helped to identify patterns
and relationships and to identify the most significant elements liable to be of value in
improving post-implementation evaluation.
6.3 Case Study 1: King Saud University
MADAR is a local office project, created within KSU (2007-2008) for the purpose of
managing the implementation of business systems (GRP/ ERP) at the university and
the provision of advisory services to destinations outside it, under special agreements
(MADAR systems’ definition, 2012). The interviews with project managers of the
MADAR system focused on the following specific points, which are considered

Chapter 6: Case studies’ Qualitative Analysis 192
Evaluating Stakeholders’ Performance of ERP Systems in Saudi Arabia Higher Education Mona Althonayan
essential from the managerial point of view and which had a direct effect on all
phases or levels of implementation. Table 6.1 shows in detail the number of
interviewees (Managers and employees) at KSU and the time spent during the
interview.
Table 6.1: Profiles of the interviewees at KSU
Case Interviewee Role System Interview
Time
KSU
Manager A Project Manager
MADAR
System
40-50 minutes
Manager B Project Manager 40-45 minutes
Manager C Project Manager 45 minutes
Manager D Project Manager 40 minutes
Manager E Project Manager 40 minutes
Employee A Employee affairs 30 minutes
Employee B Employee affairs 30 minutes
Employee C Financial department 35 minutes
Employee D Financial department 35 minutes
Source: Originated by the researcher
6.3.1 Contextual factors
Employee resistance
IS/ERP implementations often fail due to strong resistance from users. This problem
should be addressed, especially in the case of the public sector. Managers A and E
stated that although users were aware that the new system could help them with their
performance in different ways, older users who had spent most of their careers in the
same place preferred to work with the legacy system for the remainder of their
careers rather than spend time learning how to work in the new system, which they
considered complex compared to the old one. The majority of KSU project managers
(four) stated that resistance to change was the major problem that they faced during
the implementation phase:
It was really hard for us to convince the employees to use the new system,
those employees who’d spent their careers working with the legacy system,
especially when it came to the old users who didn’t have many years left
until their retirement (Managers A).
Most Saudi universities operate in the public sector, receiving funding and support
from the government, so the majority of personnel are government employees, which

Chapter 6: Case studies’ Qualitative Analysis 193
Evaluating Stakeholders’ Performance of ERP Systems in Saudi Arabia Higher Education Mona Althonayan
explains why KSU employees thought that their jobs were secure, according to
manager D:
Dealing with government employees leads us as managers to another
problem, which is job security. The employees thought that using the new
system was not compulsory and by law nobody can fire them, therefore we
have to take other action to solve this problem (Manager D).
Manager B asserted that in response, the university management decided to
encourage employees to attend training courses and to use the system efficiently,
because their decisions to resist or accept would significantly affect the new ERP
system:
To solve this problem as managers we agreed to link attending courses and
using the new system effectively with promotion for all the employees in the
same department. This decision was useful and helpful; by ending this
problem we can now turn our efforts to evaluating the advantages and
disadvantages of the system (Manager B).
Customization
Organizations are diverse and have different needs. In all ERP installations, some
degree of system customization is required. Although packaged applications are
designed to work in different organizations, or even in different industries, they often
do not provide all the functionality needed in a specific business. Albeit ERP as a
software application is designed to work in different organizations or industries, or at
different levels, some degree of system customization is required.
According to manager A, KSU configured its system to its needs by selecting
appropriate components and by setting parameters that allowed the university to
modify the system within the boundaries set by the developers of the application.
MADAR was designed in house by a local firm. KSU management decided to
choose a local company rather than a global one for many reasons, including cost
effectiveness, ease of contact and the ability to address any changes or configurations
based on the university’s needs:
Choosing a local company wasn’t a bad decision. Of course there is no
comparison between a local and a global one, but the local one we can ask
for any modification or changes we need on the system (Manager A).

Chapter 6: Case studies’ Qualitative Analysis 194
Evaluating Stakeholders’ Performance of ERP Systems in Saudi Arabia Higher Education Mona Althonayan
During the planning phase, KSU received many global and local implementation
proposals for the ERP project. Manager C, believed that local companies were found
to be a good choice because of their enhanced understanding of the university, in
addition to the financial efficiency offered by using a local firm and applying its
expertise in different departments:
Customisation wasn’t a serious issue in KSU, since the MADAR system is
provided by a local company, which makes it easier and flexible for the
university to customise and modify any function to suit its needs (Manager
C).
MADAR managers B and E said that customisation of the system to meet the
university’s needs was not a barrier for them. This was attributable to the company’s
flexibility and its direct connection with the university, eliminating the need for an
intermediary company.
Weakness of project leadership
Manager A believed that effective administration during and after implementation
was one of the serious problems that KSU managers faced, because there was an
assumption that the university administration was committed to supporting the
project, especially the MADAR package, which had already been selected and
implemented. As the ERP system was considered a new phenomenon and a major
change for any university, it was essential to focus on preparatory courses for
administrative and managerial personnel, rather than on the operational level of
implementation activities:
Successful implementation depends on many factors. Effective project
leadership is a critical issue for any implementation, by providing support
and acceptance of the project (Manager A).
Manager D added that the role of the management was to oversee pre-
implementation preparation and facilitation during the implementation; they needed
to be involved in every step of the project until full implementation of the ERP
system. In any such project, the management should continually monitor the progress
of the project and provide direction to the implementation teams:
Having an effective leadership is crucial, who are willing to allow for a
huge attitude change by accepting that a lot of learning has to be done at all
levels, including themselves, because their attitude will affect other

Chapter 6: Case studies’ Qualitative Analysis 195
Evaluating Stakeholders’ Performance of ERP Systems in Saudi Arabia Higher Education Mona Althonayan
employees as well, which will help the implementation go smoothly and
easily (Manager D).
MADAR project managers realized that the support of the university administration
was essential at all levels and this was identified as one of the most important and
crucial success factors in any ERP implementation, since management can deal with
many aspects of the project, including planning, organisation, information system
acquisition, employee selection and the management and monitoring of software
implementation. Therefore, motivating managers and administrators to cooperate
during all stages of the implementation was linked by KSU project managers to
successful and effective decisions.
Weakness of legacy system
Manager A explained that ERP is intended to replace existing systems, usually
known as legacy systems, each of which provides support for a specific functional
area. These legacy systems comprise hardware, software, business processes and
organisational structure. ERP implementation involves a complex transition from
legacy information systems and business processes to an integrated ERP
infrastructure and common business process throughout the organisation, dependent
on sophisticated IT infrastructure. Transferring from one system to another is costly,
because in a legacy system, information is spread across many different computers.
This is not the only difficulty faced in transition:
There is no doubt that changing from the current legacy system to the ERP
system is difficult, but when the current system has a bad data structure it
makes it even more difficult (Manager A).
Furthermore, manager E explained that the process of transition considered the
university to be a unique organisation with a special environment, such as having
different departments, administrations and cadres of employees, academics and
students with different needs, in addition to the various companies linked with the
university; these constitute a large number of stakeholders in a single organisation
with voluminous data, each function or department operating with its own
procedures and business requirements:
We suffered for long time from the bad data structures in the legacy system,
but when it came to this stage it was another story. It takes a long time to do
it (Manager E).

Chapter 6: Case studies’ Qualitative Analysis 196
Evaluating Stakeholders’ Performance of ERP Systems in Saudi Arabia Higher Education Mona Althonayan
MADAR system managers aware that KSU, one of the largest universities in the
KSA, had hitherto functioned with an ill-structured system, making it very difficult
to conduct data clean-up and transfer from the legacy system to the ERP system.
Despite this weakness of the legacy system, the transition had to be efficient, because
any mistake could cause many problems which would be difficult to rectify and
which had to be solved before the implementation could proceed.
6.3.2 Improving stakeholders’ productivity and performance
A fundamental economic purpose of the implementation of a new system is to
achieve the highest productivity in stakeholders’ work. The interviews examined this
question from the stakeholders’ point of view in order to clarify and supplement the
questionnaire data. It was found that the results of the first (quantitative) phase of
data collection concerning significant factors were similar to those of the second
(qualitative) phase, with limited changes from a managerial point of view.
6.3.2.1 Systems Quality
Training programme
The majority of KSU employees were aware that training plays a major role in ERP
implementation, which generally requires profound reengineering of any
organization. Indeed, practical training is an important factor that affects its success
or failure. Employee A believed that training offers a good opportunity for users to
adjust to the changes introduced by the ERP system and helps to build positive
attitudes towards the new system. It also provides experience for users, so that they
can appreciate the attributes and potential benefits of the new system. It is hard to say
whether the stakeholders were satisfied with the training programme provided by
KSU. Employees believed that they did not have adequate training to enable them to
understand the system in general and to operate it effectively.
Employees B, C and D explained that the majority of employees were unaware of the
concept of ERP and how the system would help them to relate their work to other
departments functionally; therefore it was important to build users’ initial conceptual
understanding of the new system, then to introduce other courses gradually. This

Chapter 6: Case studies’ Qualitative Analysis 197
Evaluating Stakeholders’ Performance of ERP Systems in Saudi Arabia Higher Education Mona Althonayan
may have helped employees to understand the system and make it more user-
friendly.
There is a difference between a full, strong training course and a short
session. I think what was provided for us was a session more than an
appropriate training course. As employees we need intensive courses to
build our confidence (Employee B).
Employee A suggested that long-term training was better than short courses,
especially for those with little or no knowledge of ERP systems:
A strong programme of training is really important, to give us as employees
knowledge, strength and confidence in terms of using the system (Employee
A).
Employees thus appeared to be aware of how important training was, because it
would help them to improve their work and increase their productivity. Therefore,
there was a demand for adequate training courses before, during and after
implementation. Early training would help the employees to accept the new system
and reduce any discontent or resistance which they might feel towards it.
Ease of use
Employees A, C and D believed that preparation, pre-implementation,
implementation and training were essential steps. Once the new system was
implemented, stakeholders could focus on its advantages. A fully implemented ERP
system can yield significant benefits. Although any ERP system is considered to be
complex, participants found MADAR easy to use, which was a significant positive
factor in its adoption by KSU employees, despite their need for more intensive
training. The majority of the interviewees agreed that they found ERP easier to use
than the legacy system:
The most important benefit of the MADAR system is that it is easy to use it
compared to the legacy system, in terms of the ability to do the work easily
and make faster information transactions (Employee B).
Ease of use is considered a major benefit of any ERP system. Employees asserted
that the ease of use of MADAR had a positive impact on both completing the task
effectively and increasing their productivity:

Chapter 6: Case studies’ Qualitative Analysis 198
Evaluating Stakeholders’ Performance of ERP Systems in Saudi Arabia Higher Education Mona Althonayan
Before I used the system I hesitated, I thought it would be difficult, but in fact
it was the opposite. If I had known it was that easy I wouldn’t have resisted
in the beginning (Employee C).
Furthermore, the presentation, format and content of the MADAR system were
reported to make it even easier to use, so that users could access any information that
they needed and improve the quality of their work; overall, employees believed that
MADAR implementation had made their jobs much easier.
Timeliness
Both managers and employees listed timeliness as one of the benefits of using the
ERP system. Employees A, B and D stated that timeliness was considered an
important factor in two different ways: accessing the information that the user
needed on time and helping users to do their work in a shorter time. Both of these
helped users to fulfil the needs and requirements of their job.
As a financial employee, working with the MADAR system is affecting my
work positively. For example it improves efficiency, reduces data errors and
avoids duplication of information. In both functional and application
domains it saves me many hours in my work (Employee A).
According to employees B, C and D, the MADAR system allowed administrative
and managerial personnel and faculty members to check their salaries and
promotions. It also made it possible to transfer easily, accurately and quickly to other
individual management functions within the system, such as procurement and
distribution. Additionally, several interviewees stated that MADAR, as a packaged
software system, had the advantages of reduced time, being easy to integrate and in
general offering high system quality.
Flexibility
Interviewees gave differing answers regarding the flexibility of the MADAR system.
Employees A, B and C, described as end-users, were more than pleased with its
flexibility and portrayed it as flexible to use, offering an acceptable level of
flexibility while making transactions faster. This degree of flexibility was provided at
the time of implementation:
The level of flexibility in the MADAR system is really obvious, which has
improved my ability to respond effectively, changing user interface,

Chapter 6: Case studies’ Qualitative Analysis 199
Evaluating Stakeholders’ Performance of ERP Systems in Saudi Arabia Higher Education Mona Althonayan
changing underlying data, and its effect is to change performance positively (Employee B).
In contrast, managers believed that flexibility could and should be improved by
upgrading the system to meet their future needs:
I agree that MADAR has a high degree of flexibility when using the system
daily, but as managers we look to have a higher degree of flexibility by
updating the system in the future (Manager A).
Thus, project managers A, B, D and E demanded that the level of flexibility be
increased in the future to match their planned expansion of the system, because ERP
system infrastructure should anticipate expansion in its degree of flexibility.
To conclude, employees A, B, C and D agreed that flexibility, timeliness and ease of
use were the most important factors and believed that they were having a significant
impact by increasing their productivity and accuracy while reducing the time they
spent on each job.
6.3.2.2 Service quality
Service quality was found to be a major area of concern for KSU project managers,
(Managers A, B, C, D and E) due to its strong impact in facilitating the successful
operation of the system and optimizing employee/user performance. Therefore, if the
MADAR system were successfully implemented, the links between different
departments of the university (Appendix) would not be adequate. Internal support
from the service quality department would also be required. Interviewees felt that it
was time to build a strong technical support/service to help the system flow smoothly
and reduce the barriers which inhibited the effective use of the system.
Employees A, B, C and D agreed that the service quality department at KSU, which
was linked with the MADAR system, was extremely important in facilitating their
use of the system and solving problems. Therefore, it was important to implement a
new system in parallel with the service:
It is important to start a new system with the latest hardware and software
bought and programmed for this purpose (Employee D).
Service quality, in other words, was seen to lie in the communications between users
and the technical department, in terms of how quickly and accurately it delivered

Chapter 6: Case studies’ Qualitative Analysis 200
Evaluating Stakeholders’ Performance of ERP Systems in Saudi Arabia Higher Education Mona Althonayan
answers to users’ enquiries. Interviewees perceived a strong link between speed of
response and the accuracy of their own work:
The service quality team are showing a high level of understanding and
experience dealing with the MADAR system’s difficulties, by quick
responses to system enquiries (Employee A).
According to employees C and D, the MADAR system had achieved a high degree
of reliability and trust among users in a short time, because the service quality team
was attempting to build strong relationships between the departments and users in
terms of achieving a high level of successful implementation:
As employees, over time we can feel the effort from the service quality team
to give the best they can to solve any problem we may face during the
implementation and after (Employee C).
It was widely perceived by the interviewees (managers and employees) that the
implementation of the MADAR system at KSU was intended to enforce or reinforce
changes in both financial and administrative aspects of the university’s operations.
The majority of the employees asserted that they would not resist the change if they
knew that changes were likely to have positive implications for themselves and the
university, including non-financial benefits, since it was clear that the MADAR
system had had a positive impact on their productivity at work and their performance
in general.
6.4 Case Study 2: King Fahd University of Petroleum & Minerals
The Oracle system was created within KFUPM in 2006 for the purpose of managing
the implementation of business systems (ERP) at the university and the provision of
advisory services to destinations outside it, under special agreements. The interviews
with project managers of the Oracle system focused on a number of specific points
which were considered essential from the managerial point of view and which had a
direct effect on all phases or levels of implementation.
Table 6.2 shows in detail the status of all interviewees at KFUPM and the time spent
on each interview.

Chapter 6: Case studies’ Qualitative Analysis 201
Evaluating Stakeholders’ Performance of ERP Systems in Saudi Arabia Higher Education Mona Althonayan
Table 6.2: Profiles of the interviewees at KFUPM
Case
Interviewee Role System Interview
Time
KFUPM
Manager A Project Manager
Oracle
system
40-45 minutes
Manager B Project Manager 40-45 minutes
Manager C Project Manager 35-40 minutes
Manager D Project Manager 35-40 minutes
Manager E Project Manager 35-40 minutes
Employee A Financial Department 30-35 minutes
Employee B Human Resource 30-35 minutes
Employee C Employees Affairs 30-35 minutes
Source: Originated by the researcher
6.4.1 Contextual factors
Participants in Case Study 2 were project managers of the Oracle system at KFUPM.
This section examines the interview responses regarding specific contextual factors
which were considered essential from the managerial point of view, and which were
seen as having a direct effect on all phases or levels of implementation.
Employee resistance
Manager A stated that KFUPM, like other organisations, suffered from employees’
resistance to the change brought about by the new system. Some employees showed
an unwillingness to cooperate or engage with it. There may be many reasons for such
resistance, but the chief one in the case of KFUPM was that employees refused to
work hard and did not want their authority to be taken from them:
Ignorance and resistance to change from the users because they are not
happy with the system. The authority they have may be taken away from
them. Furthermore, they are worried about having to work more and work
harder (Manager A).
For managers B and C, such resistance on the part of employees was a consequence
of a lack of preparation of the people who were likely to be affected by the change,
which induced pressure upon them to use the system. Implementation of the Oracle
system affected most important departments at KFUPM and impacted directly upon
users. Therefore, a plan of preparation to shape users’ understanding of the ERP
system’s importance and related concepts was required:

Chapter 6: Case studies’ Qualitative Analysis 202
Evaluating Stakeholders’ Performance of ERP Systems in Saudi Arabia Higher Education Mona Althonayan
The management attempted to encourage stakeholders to accept the system,
understanding the urgency of the business (Manager B).
Manager D believed that resistance was manifested in both the attitude and the
behaviour of some employees. They did not resist the change (i.e. the
implementation of a new system) in itself, but instead resisted their own perceived
loss of status, authority or comfort under the new system.
Customisation
Managers A and C asserted that ERP software applications are designed to fit any
organisation, but a degree of customization is required according to the
organization’s needs. Manager E emphasised that the situation in HE differs from
that in mainstream organisations in numerous respects. KFUPM project managers
were aware of their needs; thus, the preparation for customization started as soon as
they chose the Oracle system.
According to project manager A, ERP implementation at KFUPM was successful
and smooth, without any serious problems, for two reasons: because the university
had a dedicated open budget for the implementation, to allow for the solution of any
problems faced, and because KFUPM followed the American university system,
which made it easy to transfer data from the legacy system to the new one:
It wasn’t difficult for KFUPM because the university solved the problem
with the open budget it has. Also, the university did not change the system to
Arabic, which would have made it difficult, but has kept it as it is in English,
as it works in English, which is easier (Manager A).
Weakness of project leadership
Project managers A, B and D believed that the strong project management at
KFUPM was due to the successful experience of the project team, which comprised
personnel from different departments. The project team was chosen to be involved in
both the planning and implementation phases; therefore the key users were included
in the implementation.
It was a wonderful and successful experience giving the project team nine
months’ worth of training and working closely with the system during the
planning and implementation phases (Manager B).

Chapter 6: Case studies’ Qualitative Analysis 203
Evaluating Stakeholders’ Performance of ERP Systems in Saudi Arabia Higher Education Mona Althonayan
Since ERP system implementation is complex and highly integrated, it is essential
for a project team to plan, coordinate and control the complexity of the system.
Furthermore, without complete cooperation in planning, implementation and design
between all staff and departments, successful implementation will not be possible,
according to Manager E.
Weakness of the legacy system
Project managers A, B and D were also aware that the demands on the new system
required it to be well coordinated and integrated, to ensure the smooth flow of its
functions. According to manager B, the poor structure of the legacy system was not
the only problem faced by KFUPM; data being stored differently in different
departments was another serious hurdle. Although KFUPM already followed the
American university system, as noted above, transferring from the old separate
components to a new integrated system was difficult:
The project team was a big support during the transfer of data, since they
had been involved in the early stages of implementation (Manager D) .
Although the process took a long time to complete, Manager E explained that a well-
planned schedule for the transfer process, whereby data were transferred gradually,
department by department, ensured that each item of data was entered once and
accurately, which helped the whole process to be successful.
6.4.2 Improving stakeholders’ productivity and performance
A positive impact on stakeholders’ productivity and performance is perhaps the best
return on investment that any public sector organisation can achieve. Therefore,
interviewees were asked about their productivity and performance in order to address
this issue from a stakeholder perspective and to clarify and supplement the
quantitative data collected by means of the questionnaire in the first phase. The
results show that the significant factors identified in the second (qualitative) phase
were similar, with limited changes from a managerial point of view.

Chapter 6: Case studies’ Qualitative Analysis 204
Evaluating Stakeholders’ Performance of ERP Systems in Saudi Arabia Higher Education Mona Althonayan
6.4.2.1 System Quality
Training programme
From an examination of the KFUPM training schedule, it was clear that an effort to
organize a comprehensive programme of training in each department was already
being implemented in the system (Appendix). From the managers’ point of view, the
training schedule met users’ needs, especially as it provided courses for both end
users and key users. However, many users felt that the training courses they had
attended were not adequate to help them with the system and make it more user
friendly:
We have a good schedule for the stakeholders’ training which fits their
needs. For example, there is manual training for 2 or 3 days, or 1 to 2 weeks
for either the end users or the key users (Manager A).
Although the training courses provided for the employees were not adequate,
according to manager B, KFUPM attempted to prepare key users to train end users
by providing a nine-month full-time training programme during the implementation
phase. This step enabled key users to take a greater part in implementation:
At KFUPM we consider it important to involve key users in implementation.
They spent more than nine months full-time during the implementation
phase, which made it easy for them to understand the system in its early
stages (Manager B).
The decision by the strategic management of KFUPM to involve key users as early
as possible in systems implementation was seen by interviewees as giving the
university great advantages in terms of better understanding of the system, improved
work quality and efficiency, easier facilitation and support for end users, while
laying the foundations for more in-house training in future. From the users’ point of
view, however, the training programme was not adequate to their needs. According
to employees A, B and C, a continuous or long-term training course was essential to
increase their productivity and enhance their performance:
The training the university has provided is good but it is not enough. As
users we are looking for a continuous programme. It is better to be up-to-
date and more familiar with the system (Employee B).

Chapter 6: Case studies’ Qualitative Analysis 205
Evaluating Stakeholders’ Performance of ERP Systems in Saudi Arabia Higher Education Mona Althonayan
Ease of use
It was widely recognized by interviewees that since KFUPM had implemented the
Oracle system, stakeholders had found it easy to use, accessing and linking to the
information they wanted, whether via recent or historical data. Administrators and
managers were able to access the full functionality of the system, and transactions
were conducted on it between different departments in the university:
Easy access to the data history, or using corporate and divisional data, and
sharing data with other departments are some of the important advantages
of using the Oracle system (Employee A).
In addition, Employee C explained that all employees were able to access data at the
same time using the ERP system, whereas with the legacy system this task was much
harder. For example, with the flexible integration of departments offered by ERP,
employees from the finance department could obtain information about personnel
from the human resources department. This made access to this information when
required much easier than under the legacy system.
With the ERP system it’s much easier to access any incorrect information
and change it once, instead of going to each department separately and
changing it many times (Employee C).
Timeliness
According to employee A, KFUPM employees were aware that the principal purpose
of implementing the Oracle system was to improve stakeholders’ productivity, thus
helping the university to achieve a better competitive position among Saudi
universities. In this context, such improvement is another important benefit of ERP
systems, saving time and reducing redundancy:
Implementing the ERP system has enhanced our stakeholders’ performance
for sure. For example, in the budget process they used to take six months or
maybe more to finish the work, but with the new system it takes only two
weeks (Employee A).
Flexibility
Projects managers believed that insufficient flexibility can limit the success of an
ERP system by preventing certain circumstances and making exceptional handling
necessary. Therefore, in order to be effective, ERP systems need to be flexible.

Chapter 6: Case studies’ Qualitative Analysis 206
Evaluating Stakeholders’ Performance of ERP Systems in Saudi Arabia Higher Education Mona Althonayan
Employees A, B and C reported noticing a difference in degree of flexibility between
the legacy system and the newly implemented Oracle. In contrast, project managers
felt that the degree of flexibility depended on the type of ERP infrastructure (flexible
to change or pre-built functionality). Manager A concluded that in order to increase
flexibility, the university would need to update the system to version 12 in six
months’ time.
A wide range of employees asserted that flexibility was one of the important
elements of the ERP system, because they were able to change data, transfer it and
allow variation over time. Moreover, employees B and C believed that system
flexibility helped them to perform their tasks effectively and efficiently.
The ERP system has the ability to deal with both expected and unexpected
changes easily, which improves their job performance (Employee B).
6.4.2.2 Service quality
The majority of interviewees agreed that the absence of good service quality
decidedly affected their productivity and performance. Based on the questionnaire
results, none of the service quality factors (tangibility, reliability, responsiveness and
assurance) was found to be significant at KFUPM. This may be explained by the lack
of good service and technical support for system users in their work, which was seen
to have affected their productivity and performance:
The absence of decent service quality from the technical team is affecting
our productivity negatively. This poor service causes delay and cripples the
work (Employee A).
Advanced support from the service quality team would be required to facilitate the
work of users, to solve any problems that they might have and to avoid any delay or
postponement of stakeholders’ tasks.

Chapter 6: Case studies’ Qualitative Analysis 207
Evaluating Stakeholders’ Performance of ERP Systems in Saudi Arabia Higher Education Mona Althonayan
6.5 Case Study 3: King Faisal University
Oracle system, created within KFU (2008) for the purpose of managing the implementation
of business systems (ERP) at the university and the provision of advisory services to
destinations outside it, under special agreements. The interviews with project managers of
the Oracle system focused on the following specific points, which are considered essential
from the managerial point of view and which had a direct effect on all phases or levels of
implementation.
Table 6.3 shows in detail the number of interviewees (Managers and employees) at KFU and
the time spent during the interview.
Table 6.3: Profiles of the interviewees at KFU
Case Name Role System Interview
Time
KFU
Manager A Project manager
Oracle system
40-50 minutes
Manager B Project manager 40 minutes
Manager C Project manager 40-45 minutes
Manager D Project manager 40- 45 minutes
Manager E Project manager 30-35 minutes
Employee A Human Resource 30-40 minutes
Employee B Employee Affairs 30-40 minutes
Employee C Financial Department 30-40 minutes
Source: Originated by the researcher
6.5.1 Contextual factors
Project managers for the Oracle system at KFU focused in the interviews on the
following specific points, which were considered essential from the managerial point
of view and which had a direct effect on all phases and levels of implementation.
Employee resistance
In an IS environment, rapid change becomes an everyday part of organisational
dynamics and any resistance by employees can cripple an organisation. Therefore,
Managers A, C, and E, believed that management support played a crucial role in
encouraging, facilitating and gaining a better understanding of the concept of ERP
among the employees of KFU:

Chapter 6: Case studies’ Qualitative Analysis 208
Evaluating Stakeholders’ Performance of ERP Systems in Saudi Arabia Higher Education Mona Althonayan
The management support of the university plays an important role for the
decision makers among the employees, by explaining, training and
supporting before and after implementation (Manager A).
Managers A, B and D felt that resistance to change might cause the university many
problems, including delayed or slow start-up and obstructed or hindered
implementation, which would have severe financial costs. Therefore, strong and
effective leadership at the management level was essential to support decision
makers and to persuade users to use the system effectively.
It is noticeable that employees’ resistance to change affected the
system implementation at KFU and caused many problems, such as
delaying the implementation and financial problems (Manager C).
Customisation
While KFU chose to implement the same Oracle system as KFUPM, obtaining the
customization of the system that it desired was one of its greatest challenges. The
problem was not with Oracle itself, but with the vendor which supplied the system to
the university, according to manager A:
Customization was the main barrier with the vendor of the Oracle system.
They were not flexible regarding the customization, but wanted KFU to take
the system as it is from the shelf (Manager A).
Manager B asserted that as with any organization, KFU required ERP packaged
software that it was possible to configure or modify to meet the university’s
particular needs. There was a misunderstanding between the university and the
system vendor, causing a delay in implementation in some departments:
Unfortunately, the vendor did not respect its contract with the university, so
the university had to discuss all items in the agreement again. At the end the
misunderstandings were resolved and the process continued (Manager B).
Weakness of project leadership
Understanding by top management of the scope of changes to the system was very
important in the view of manager E. According to manager C, one way of managing
change effectively adopted by KFU was the establishment of an Oracle planning and
implementation team, including personnel from different departments of the
university. This team was responsible for providing all the necessary information and

Chapter 6: Case studies’ Qualitative Analysis 209
Evaluating Stakeholders’ Performance of ERP Systems in Saudi Arabia Higher Education Mona Althonayan
determining and explaining the structure that each department and end user might
need, as well as informing them about the system:
The project team has played an essential role during the planning and
implementation phases of the Oracle project by explaining the idea of ERP,
determining the departments’ needs and facilitating implementation
activities (Manager C).
This was a critical factor in the implementation of the ERP system at KFU; without
management support, the adoption of the Oracle system would have been
unsuccessful.
Weakness of the legacy system
Managers A, B, D and E all understood that an ERP system has a sophisticated IS
infrastructure; hence the transition from a legacy system to an integrated system is
complex for any organisation, which means that when changing the system, the
organisation should consider its own structure at the same time.
KFU had separate long-standing legacy systems which had been implemented and
developed to meet the university’s needs and decision making, but which offered no
integration or communication between departments. Moreover, all data had to be
entered separately by the different departments. Therefore, when the decision was
made to change to an integrated system, there was a problem with the transferring of
data to the ERP system, manager C stated. Although the data were extant and
available, changing them to a different format was difficult:
As soon as KFU started implementing its ERP system, facing the problem of
transferring data from the legacy system to the ERP system was one of the
serious barriers, because it takes a long time to collect information and
present it in a new format (Manager C).
Manager E added that the Oracle system generally comes with standard applications
centralizing the information of separate departments in an integrated system.
Consequently, the transition process needed to be accurate, because data needed to
be entered once, to fit the university’s structure and match its needs.
Because of the misunderstanding between the university and the vendor,
there was a delay in the transition process at KFU (Manager E).

Chapter 6: Case studies’ Qualitative Analysis 210
Evaluating Stakeholders’ Performance of ERP Systems in Saudi Arabia Higher Education Mona Althonayan
6.5.3 Improving stakeholders’ productivity and performance
The success of any organisation today is largely dependent on stakeholders’ ability
and willingness to exploit and adopt new technology in their daily operations.
Consequently, as for the other case studies, interviews were held with stakeholders to
elicit their views and to clarify and supplement the quantitative questionnaire data.
Once again, the results show that the same factors were found to be significant in this
second (qualitative) phase, with limited changes from a managerial point of view.
6.5.3.1 System Quality
Training programmes
The KFU employees appeared to be sensible and aware of the importance of training
to increase their understanding of the system and to build their confidence in it.
Based on the questionnaire results, training was found to have had a significant
impact on stakeholders’ performance. Despite this encouraging result, employees A,
B and C believed that more training was advisable:
It is important to organize and execute a continuous and effective training
programme to help users acquire adequate knowledge, especially if new
system functions are added (Employee A).
Employees B and C believed that as with any organisation, the university
experienced inconsistency between the Oracle and legacy systems and between
Oracle and the university’s structure, because change always has a positive or
negative impact on the nature of work. Therefore, continuous training was essential
to enable employees to learn about the new system in general and each specific job in
particular. Moreover, employees wanted a comprehensive training programme to
encompass their development of IS skills.
Training would be more useful if it covered both the system’s features and
related work processes. This would help employees to be comfortable and
reduce mistakes (Employee C).
The managers broadly agreed that it is worthwhile for any university undertaking
ERP implementation to invest time and resources in adequate training; otherwise
there is a strong possibility that the system will fail.

Chapter 6: Case studies’ Qualitative Analysis 211
Evaluating Stakeholders’ Performance of ERP Systems in Saudi Arabia Higher Education Mona Althonayan
Ease of use
It was widely perceived by interviewees that the reaction of Oracle system users after
attending initial training was that the system was easy to use and to understand.
However, employee B believed that employees were used to working on the legacy
system, which differed greatly from the new integrated one; when working with the
new system they would need to be familiar with both its functions and its
applications, necessitating that they acquire certain skills:
The most important benefit of the Oracle system is that it is an easy system
to learn. Easy to link with different departments, easy to check and correct
the work, easy to get a report. Overall, it changes the way we used to work
for the better (Employee B).
Employee C believed that implementing a new system at KFU was concerning for
users, because they needed to familiarize themselves with different functions and
applications; for example, the platform was new, data entry had changed and report
formats were different. However, the new system was considered easy to understand
from the users’ point of view and they found that it had a logical flow.
Timeliness
Another significant finding of this set of interviews was related to the effect of time
on employees’ performance; the majority of interviewees (four managers, three
employees) indicated that using the Oracle system reduced the time they would
spend doing daily work:
In a short period of time it is easy to check and transfer from different
departments. For example, checking financial issues and administrative
records at the same time was a noticeable benefit (Employee A).
Employees and managers indicated that the efficiency of the system in daily work
was clearly noticeable compared to the legacy system; some estimated that a month’s
work could now be completed in less than a week. Therefore, employees of KFU
believed that using the Oracle system saved time, which affected their performance
positively and increased their productivity.

Chapter 6: Case studies’ Qualitative Analysis 212
Evaluating Stakeholders’ Performance of ERP Systems in Saudi Arabia Higher Education Mona Althonayan
Flexibility
According to managers A, B and C, the need for an ERP system to have a degree of
flexibility is paramount, because it facilitates the rapid development and
implementation of applications that enhance stakeholders’ performance and
productivity by responding effectively and quickly, to take advantage of emerging
opportunities or to neutralize competitive threats. Thus, flexibility is absolutely
required for any ERP system to function properly. As previously mentioned, when
KFUPM implemented the Oracle system it had a level of flexibility built in with the
system infrastructure. Employee C made the point that flexibility was an essential
factor for KFU employees, having a significant impact on their performance:
Flexible… many advantages in our daily work, for example increased ability
to access the system, reduced overall time it usually takes to do the work,
and reduced complexity (Employee C).
Employee B believed that system flexibility or ability to change and adapt was the
most important of all factors, according to KFU employees. Flexibility from these
users’ perspective included a flexible and friendly interface, systems integration,
ability to connect with complete efficacy, and flexibility in transferring data to
different departments.
Although flexibility was not identified as a significant factor in the quantitative phase
of data collection at KFU, users of the Oracle system demanded a high level of
flexibility to improve their productivity and performance. In other words, employees
A, B and C asserted that if the system were any less flexible this would cause them
difficulties in doing their tasks; the lack of structure and time criticality would lead to
delays in doing their work.
6.5.3.2 Service quality
The service quality department at KFU was considered to play an essential role in
building stakeholders’ trust and belief. The majority of interviewees (five managers
and two employees) believed that service quality factors (reliability, responsiveness
and assurance) had a significant impact on their performance:
Chapter 6: Case studies’ Qualitative Analysis 213
Evaluating Stakeholders’ Performance of ERP Systems in Saudi Arabia Higher Education Mona Althonayan
I can rely on the Oracle system to do my work efficiently, since it is a well-
known package. It is also provided with the latest hardware and software,
which has helped me a lot in my work (Employee B).
Employee A believed that quick responsiveness from service team to answer
stakeholders’ questions, explain facilities and solve problems was a very important
issue for KFU employees:
As a new system user I am looking for quick responsiveness. It is important
to feel secure and safe in my work in case anything happened to the system
to find support and help as soon as I need it (Employee A).
6.6 Universities Compared
6.6.1 Employee resistance
KSU dealt with resistance to change with considerable experience. This solution was
proven to be a success with public sector employees. KFU and KFUPM were found
to suffer from the same problem, but they did not seriously attempt to solve it.
6.6.2 Customization
Customization was one of the barriers at KSU, especially during attempts to tailor
the system to the university’s needs. KSU’s choice to implement a local in-house
system was not a bad decision; the local company offered flexibility and direct
guidance to the university, enabling it to accept or order desired changes. Adopting
an in-house ERP system is less expensive than using the services of better known
global companies.
Although KFUPM project managers admitted that the Oracle user interfaces were not
very friendly and that the system was not ideal for students, the customisation of the
system was very advanced and was achieved without any serious problem.
According to the project manager, as soon as the university chose the software, the
vendors were contacted to initiate the preparation for implementation.
In contrast, customisation was the greatest difficulty that KFU faced with its Oracle
system. In fact, the difficulty was with the Oracle vendor company, which did not
fulfil the agreement it had with the university, causing a delay in implementation for
some departments.
Chapter 6: Case studies’ Qualitative Analysis 214
Evaluating Stakeholders’ Performance of ERP Systems in Saudi Arabia Higher Education Mona Althonayan
From this comparison between the universities it is clear that the system vendor plays
a crucial role in enabling customisation before implementation; the important factors
are clear requirements, contracts and strong commitment.
6.6.3 Weakness of project leadership
One of the reasons for ERP system failures is weak project management. The three
universities had different experiences regarding project leadership or project
management. KFUPM had considerable experience, which involved key users or
managers in the planning and implementation phases and which gave them enough
time to be involved and cooperate during sensitive phases of the implementation. The
KFU project team comprised personnel from different departments and was involved
in both planning and implementation phases, which helped the university to
determine its needs and requirements. Both universities appear to have successfully
involved managers in the implementation.
In contrast, KSU suffered from carelessness and apathy on the part of managers or
key users, because of the late involvement resultant from employee resistance. As
mentioned previously, KSU tried to solve this problem by linking positive
cooperation with promotion, which was clearly successful.
6.6.4 Weak data structure of the legacy system
All three universities had difficulties involving their legacy systems, comprising their
existing IT, organisational structures and work processes. In all cases, the difficulty
lay in transferring data from the dispersed legacy systems to the new integrated ERP
system; indeed, the inability to transfer and share data across non-integrated systems
was one of the reasons for the change. KSU had a negative experience with badly
structured data, which made it even more difficult to accommodate it to the ERP
system, while KFU and KFUPM seem to have faced fewer challenges from the
structure of their legacy systems.

Chapter 6: Case studies’ Qualitative Analysis 215
Evaluating Stakeholders’ Performance of ERP Systems in Saudi Arabia Higher Education Mona Althonayan
6.6.5 Improving stakeholders’ productivity and performance
6.6.5.1 Systems Quality
Training
Unsurprisingly, all interviewees at all three universities agreed that well programmed
training courses were essential to them; in fact, this was considered the most
important factor. Training empowered participants with more experience and
confidence in the system, which they perceived as more user-friendly. Moreover,
they asserted that they desired dedicated and thorough training, rather that short
sessions of a few days.
Flexibility
KSU implemented an in-house ERP system; therefore, interviewees from this
university demanded enhanced and updated flexibility, because what they had now
was what came during the implementation, which promised flexibility of use.
In contrast, KFU and KFUPM had adopted Oracle, an ERP system provided by a
well-known global company which provided the whole package of software with a
regular upgrade plan as part of its contract with each university.
Timeliness, ease of use
Interviewees at all of the universities had the same opinion about the following
factors: timeliness, ease of use, increased work productivity and a positive impact on
their performance compared to the legacy system.
6.6.5.2 Service quality
There is no doubt that service quality affects stakeholders’ performance in both
positive and negative ways. Interviewees at all three universities agreed that the
quality of service provided by the technical support team would play a major role in
their performance and productivity at work.
KSU and KFU participants indicated that their service quality teams provided a high
standard of service in terms of quick responsiveness and the provision of up-to-date
hardware and software. Overall, interviewees believed that MADAR and Oracle
Chapter 6: Case studies’ Qualitative Analysis 216
Evaluating Stakeholders’ Performance of ERP Systems in Saudi Arabia Higher Education Mona Althonayan
service support offered assurance and reliability. In contrast, KFUPM interviewees
did not feel that they had received the service support they should have had.
The provision of adequate service support is extremely important; the absence of
expert service certainly affects stakeholders’ performance negatively. For example,
late response may reduce productivity and cause delays in work.
6.7 Summary
This chapter has presented the findings of the second, qualitative, phase of the data
collection, i.e. interviews held with managers and system users at three KSA
universities: KSU, KFU and KFUPM. The findings were presented according to the
results of the quantitative phase, the final framework for the first phase and the
interview themes. For each case, the results were divided into two categories:
managers and users. A comparative analysis of the cases offers an explanation of the
main patterns, themes and case-specific elements, enabling an understanding of the
phenomenon from different angles.
The following chapter discusses the findings of both phases and links them with
previous studies in order to draw final conclusions.

Chapter 7: Discussion 217
Evaluating Stakeholders’ Performance of ERP Systems in Saudi Arabia Higher Education Mona Althonayan
PAGE
7.1 Overview…………………………………………………………………… 219
7.2 Policies of the Saudi Higher Education Board…………………………. 220
7.2.1 Key definitions and policies……………………………………………. 220
7.2.2 Budget …………………………………………………………………. 221
7.3 Implementing ERP Systems in Saudi HE………………………………. 221
7.3.1 ERP implementation in Saudi HE……………………………………. 222
7.3.2 SAP University Alliance………………………………………………. 223
7.3.3 Current situation of ERP evaluation in Saudi HE…………………… 224
7.4 Key Best Practice………………………………………………………….. 224
7.4.1 Understanding resistance to change………………………………….. 224
7.4.1.1 Employees’ characteristics…………………………………………. 225
7.4.1.2 Additional responsibility…………………………………………… 226
7.4.1.3 Loss of authority……………………………………………………. 226
7.4.1.4 Lack of preparation…………………………………………………. 226
7.4.2 Effective management support………………………………………. 227
CHAPTER SEVEN
DISCUSSION

Chapter 7: Discussion 218
Evaluating Stakeholders’ Performance of ERP Systems in Saudi Arabia Higher Education Mona Althonayan
PAGE
7.4.3 Appropriate customisation……………………………………………... 230
7.4.4 Intensive training schedule…………………………………………….. 232
7.4.5 Better system quality……………………………………………………. 236
7.4.5.1 Flexibility……………………………………………………………… 237
7.4.5.2 Ease of use…………………………………………………………… 238
7.4.5.3 Timeliness……………………………………………………………... 239
7.4.5.4 Content………………………………………………………………... 240
7.4.5.5 Authorisation…………………………………………………………. 241
7.4.5.6 Currency………………………………………………………………… 241
7.4.5.7 Section summary……………………………………………………….. 242
7.4.6 Better service quality……………………………………………………... 242
7.5 Summary……………………………………………………………………. 245
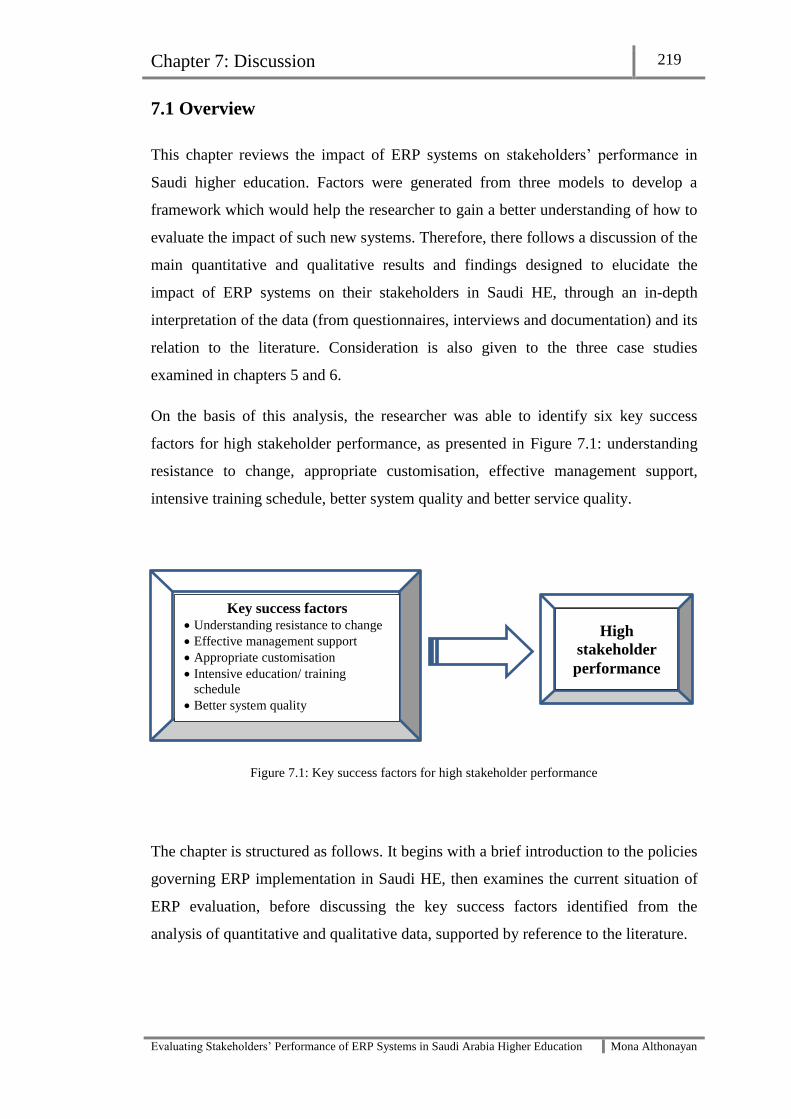
Chapter 7: Discussion 219
Evaluating Stakeholders’ Performance of ERP Systems in Saudi Arabia Higher Education Mona Althonayan
7.1 Overview
This chapter reviews the impact of ERP systems on stakeholders’ performance in
Saudi higher education. Factors were generated from three models to develop a
framework which would help the researcher to gain a better understanding of how to
evaluate the impact of such new systems. Therefore, there follows a discussion of the
main quantitative and qualitative results and findings designed to elucidate the
impact of ERP systems on their stakeholders in Saudi HE, through an in-depth
interpretation of the data (from questionnaires, interviews and documentation) and its
relation to the literature. Consideration is also given to the three case studies
examined in chapters 5 and 6.
On the basis of this analysis, the researcher was able to identify six key success
factors for high stakeholder performance, as presented in Figure 7.1: understanding
resistance to change, appropriate customisation, effective management support,
intensive training schedule, better system quality and better service quality.
Figure 7.1: Key success factors for high stakeholder performance
The chapter is structured as follows. It begins with a brief introduction to the policies
governing ERP implementation in Saudi HE, then examines the current situation of
ERP evaluation, before discussing the key success factors identified from the
analysis of quantitative and qualitative data, supported by reference to the literature.
Key success factors Understanding resistance to change
Effective management support
Appropriate customisation
Intensive education/ training
schedule
Better system quality
Better service quality
High
stakeholder
performance

Chapter 7: Discussion 220
Evaluating Stakeholders’ Performance of ERP Systems in Saudi Arabia Higher Education Mona Althonayan
7.2 Policies of the Saudi Higher Education Board
Saudi universities are subject to regulations issued by the Higher Education Board
(2007), which govern aspects of academic practice including teaching, learning,
student activities and management. The Higher Education Board is the supreme
authority that is responsible for HE (above the level of secondary education),
supervising and coordinating all HE institutions except those under military control.
The aspects of the Board’s responsibilities most relevant to the present research may
be summarised as follows:
- Directing HE policy.
- Monitoring the development of university education in all sectors.
- Coordinating between universities, especially in the field of science and the
award of degrees
- Issuing joint university regulations
- Regulating universities’ financial affairs.
7.2.1 Key definitions and policies
Universities in the KSA are scientific and cultural institutions working under the
guidance of Islamic law. Their duties include the implementation of educational
policy, the provision of university education, the award of degrees, the advancement
of scientific research, the conducting, reporting and publishing of research in their
specialist areas and the provision of community services. Each university is
financially independent from other HE institutions, in terms of ownership and
disposal.
Under Saudi regulations, holders of the most senior positions are appointed and
dismissed by royal decree. Accordingly, the rectors of all Saudi universities are
appointed by royal decree on the recommendation of the minister of HE. Each rector
is responsible for his university’s financial, academic, administrative and student
affairs.

Chapter 7: Discussion 221
Evaluating Stakeholders’ Performance of ERP Systems in Saudi Arabia Higher Education Mona Althonayan
7.2.2 Budget
Each university has its own independent budget determining revenues and
expenditure, issued and approved by royal decree, whose implementation is subject
to monitoring by the General Auditing Bureau. The fiscal year of each University is
the state’s fiscal year.
University revenues consist of:
Credits allocated by the government
Donations, bequests, grants and endowments
The proceeds of possessions and their resulting disposition
Any revenue resulting from the conduct of research projects, scientific studies
or services to others.
Each university prepares its own draft budget in coordination with its constituent
colleges, institutes, centres, branches and departments, based on estimates of
expenditure and associated justifications (Ministry of Saudi Arabian Higher
education, 2012).
7.3 Implementing ERP Systems in Saudi HE
The government of the Kingdom of Saudi Arabia is responsible for the education
sector in general and higher education in particular. The number of public
universities has increased from 8 to 23, now covering all parts of the country. Given
the growth of the HE sector, it is not surprising that the annual budget of the Ministry
of Higher Education was at its largest ever for the year 2011-2012, at 150 billion SR
(56 billion USD). With this money, universities are encouraged to achieve excellence
in education, services and training to prepare the new generation to meet the market
demand for qualified labour.
This large budget is divided between the 23 public universities according to their
needs. The 2011-2012 budget figures for the three universities featuring in the
present case studies are as follows: KSU, the largest and oldest university in the
country, was awarded almost 8 billion SR, while KFUPM received a little over one
billion SR and KFU had about 1.7 billion SR (Ministry of Saudi Arabian Higher
education, 2012).

Chapter 7: Discussion 222
Evaluating Stakeholders’ Performance of ERP Systems in Saudi Arabia Higher Education Mona Althonayan
Obviously, within the limits of their budgets, all universities seek to implement the
best technology possible, to match rapid technical developments, improve their
productivity and help decision makers and users by providing accurate and timely
data as needed.
7.3.1 ERP implementation in Saudi HE
Since 2006, Saudi Arabian universities have been encouraged to implement ERP
systems. Beside the three case studies considered here, several universities have done
so recently, while others are at the final stage of the evaluation phase, choosing
between several companies who provide such systems, especially as the budget is not
considered an obstacle. For instance, in April 2011, King Abdulaziz University
signed a contract with the SAP Company to supply its software, starting with the
financial module, followed by the personnel module and a logistics system, covering
contracts, procurement, planning, budgeting, monitoring, warehousing and inventory
control (KAU,2012).
Al Jouf University, one of the newest in Saudi Arabia, having been established in
2005, has deployed Cisco WebEx enterprise collaboration solutions for secure e-
learning and a number of other Cisco WebEx products, including its Meeting Centre,
Event Centre, Training Centre and Support Centre (Al Jouf University, 2012).
Shaqra University was established by royal decree even more recently, in 2009. In
February 2011 it announced that it had signed a contract to install SAP software. It is
noteworthy that Shaqra University then became the sixth Saudi academic institution
to join the SAP University Alliance programme (section 7.3.2), following KSU,
Jubail Industrial College, Yanbu Industrial College, KFUPM, Dammam Technical
College and King Khaled University. Students of Shaqra University thus joined
nearly 150,000 others in 1000 academic institutions around the world who, via this
programme, gain practical experience in the field of large integrated SAP solutions
(Shaqra University, 2012).
The King Abdullah University of Science and Technology (KAUST), also
established in 2009, specialises in academic research in scientific and technological
fields. To support this research effort, KAUST uses SAP IT systems and an on-line
project development tool (KAUST, 2012).
Chapter 7: Discussion 223
Evaluating Stakeholders’ Performance of ERP Systems in Saudi Arabia Higher Education Mona Althonayan
The Prince Sultan University Girls’ College has implemented the Oracle system,
while some other universities have chosen local ERP systems; for example, Umm
Al-Qura University decided to implement an in-house ERP system supplied by the
Towteen Company. As for the remaining Saudi universities, they either still work
with individual systems, or the researcher was unable to obtain information about the
systems they have implemented.
7.3.2 SAP University Alliance
As noted above, several universities and colleges in the KSA have joined the global
SAP University Alliance programme, boosting job prospects for students seeking
employment in the increasingly knowledge-based Saudi economy. The University
Alliance programme licenses member universities and fully equips their teaching
staff to provide students with in-depth, hands-on experience of SAP software and
solutions. The University Alliance community site, an online environment utilizing
the latest social media tools and technologies, provides academic resources to
teachers and students worldwide, facilitating professional opportunities. The
programme also aims to build relationships with participating universities to recruit
interns and graduates, enhancing the learning environment and project opportunities
for students, while furthering the research and publication efforts of academic staff.
It promotes the key academic and professional outcomes of higher-education degree
programmes worldwide, combining business process knowledge with enterprise
software expertise to develop one of the most valuable skills portfolios in the market.
Finally, it offers students free workshops and organises conferences for thousands of
teachers, supplying them with course materials and other instructional resources.
Every year, hundreds of thousands of students at participating campuses experience
first-hand how the fully integrated SAP enterprise information software systems
operate (SAP , 2012).
Given the large number of Saudi universities which have implemented ERP systems
to improve their productivity, or joined the SAP university alliance, it is obvious that
awareness of the importance of ERP systems in general is increasing in the Saudi HE
sector.

Chapter 7: Discussion 224
Evaluating Stakeholders’ Performance of ERP Systems in Saudi Arabia Higher Education Mona Althonayan
7.3.3 Current situation of ERP evaluation in Saudi HE
The majority of Saudi universities which have implemented ERP systems have done
so quite recently; therefore, they have not yet reached the evaluation phase. While a
few others have been running such systems for sufficiently long to be able to
evaluate them, there is no evidence that they have conducted such an evaluation,
either of the systems that they are using or of the performance of their employees. At
the end of 2012, there was no evidence of any formal evaluation method having been
used. The researcher found that no comprehensive attempt had been made to evaluate
stakeholders’ experience in any of the case studies (KSU, KFU and KFUPM),
although at KSU a questionnaire survey on the MADAR system was conducted by
Soliman Al-hadef, but no result has been published yet. The only other evaluation
discovered during the case studies was an online survey on the KFUof P&M website,
measuring overall satisfaction with all ICT systems including ERP (for a copy of the
survey, see the Appendix F). Having failed to find any other evidence to the contrary,
the researcher concludes that up to the end of 2012, there had been no extensive ERP
evaluation studies at Saudi universities and in particular no performance evaluation
(KFU of P&M feedback, 2012).
In the absence of any such in-house evaluation, the discussion which follows is based
on the quantitative and qualitative data presented in chapters 5 and 6.
7.4 Key Best Practice
7.4.1 Understanding resistance to change
ERP systems are known to suffer high failure rates for many reasons, one of the most
important being employees’ resistance to change (Hong and Kim, 2002). Zafar et al.
(2006) offer two different definitions of employee resistance to change, as
“behaviour which is intended to protect an individual from the effects of real or
imagined change” and as “employee behaviour that seeks to challenge, disrupt or
invert prevailing assumptions, discourses and power relations”. Chawla and
Kelloway (2004) identify two types of reasons for resistance to change: attitudinal
and behavioural. For example, users’ attitude may refer to the degree to which users
hold positive views about the need for organisational change, as well as the degree to
which they expect such changes to have positive implications for themselves and the

Chapter 7: Discussion 225
Evaluating Stakeholders’ Performance of ERP Systems in Saudi Arabia Higher Education Mona Althonayan
organisation (Kwahk and Ahn, 2010). In contrast, Aladwani (2001) offers two
fundamental reasons for users’ resistance to change: perceived risk, which is a
managerial issue, and users’ habits. Thus, the attitudes of users can determine
whether they decide to support or resist such a change.
However, while the human aspect has been given fair attention throughout the IS
literature, resistance to change has not received the same level of attention in regard
to ERP systems. It is essential to investigate the causes of resistance to change,
whether these lie in the organisations concerned, their employees, the new systems
themselves or indeed in all of these at the same time. The present research is notable
in focusing on the importance of social environmental factors in determining ERP
stakeholders’ performance in the post-implementation phase. It has examined the
impact of ERP systems on stakeholders’ performance and productivity, on the
understanding that when a new system is introduced, the organisation and its
members will welcome or resist the associated change, which will generate either a
positive or negative impact on users’ performance.
The findings of the current research reveal four main categories of reasons for
employees to resist such change in their organisations: employees’ characteristics,
additional responsibility, loss of authority and lack of preparation. Each of these is
discussed below.
7.4.1.1 Employees’ characteristics
All three case studies were of public sector universities, where dealing with
employee resistance can be said to be more difficult than in the private sector,
because of the difference in security of employment. Since private employees do not
enjoy the enhanced job security of their public-sector counterparts, they will tend to
be relatively strongly motivated to accept change, such as the use of a new system.
The majority of employees in the case study universities, being employed in the
public sector, considered their jobs to be secure. Indeed, all public employees in
Saudi Arabia come under the umbrella of the Ministry of the Civil Service and as
such are protected by a specific and strong regulation which stipulates that no
government employees may be dismissed or have their salary withheld. This meant
that the universities faced a real challenge when adopting new technology, especially

Chapter 7: Discussion 226
Evaluating Stakeholders’ Performance of ERP Systems in Saudi Arabia Higher Education Mona Althonayan
among older employees, who were less strongly motivated to use new systems than
other younger employees (Saudi Arabia of Minister of civil service, 2012).
7.4.1.2 Additional responsibility
Despite not being happy with the existing systems and considering them inadequate
for their needs, users were still reluctant to change because of the degree of comfort
they felt with the old systems and because they worried about having to assume extra
responsibility or to work harder under the new system (Huq et al., 2006). In addition,
employees may resist a new system because they do not want to abandon the
familiarity gained by working with the legacy system for a long time, or because they
are worried about the extra payments they may receive (Dent and Goldberg, 1999).
7.4.1.3 Loss of authority
The researcher also found loss of authority to be an important element of resistance
to change, which accords with the finding of Huq et al. (2006) that loss of status or
authority among employees can constitute a barrier to change. This is especially true
in Saudi culture, where giving people more authority in the workplace can make
them develop a superior attitude towards their co-workers. Therefore, the potential
loss of this power is an important factor in employees’ resistance to change.
An extraordinary example was set by KSU managers, who adopted the successful
solution of linking employees’ effective use of the ERP system with their promotion.
They also tracked the operations carried out by each employee to discover which of
them were using the system effectively. This policy helped to encourage employees
to attend training sessions and to operate the new system effectively.
7.4.1.4 Lack of preparation
According to Kwahka and Lee (2008), it is essential to ensure that users are prepared
for any change in their organisations. Gargeya and Brady (2005) agree that if users
are not ready or willing to change, change will not succeed or simply will not occur.
Hence, any organisation planning to change from one system to another should be
prepared for a long process, going beyond a technical transfer, so that the technical
and social planning phases should run in parallel. For instance, managers must be
charged with the responsibility of encouraging, controlling and training employees to

Chapter 7: Discussion 227
Evaluating Stakeholders’ Performance of ERP Systems in Saudi Arabia Higher Education Mona Althonayan
be prepared for the new system (Aladwani, 2001). In order to facilitate successful
ERP implementation, organisations should have a capable and effective change
management team responsible for introducing the changes and resolving any
problems, including employee resistance, which requires a clear plan of user
preparation before and during implementation (Aladwani, 2001). This opinion is
supported by a study of a successful ERP implementation, in which Kim et al. (2005)
found a lack of organizational change management expertise to be a critical barrier to
implementation.
The above discussion of four main reasons for resistance to change offers a clear
picture of the environment in which ERP implementation could take place, especially
in Saudi Universities. It is obvious that universities it would be better of focusing
narrowly on the technical aspects of the preparation phase while ignoring the human
aspects. The situation is made even more difficult by the fact that the majority of
employees are unfamiliar with the ERP concept; consequently, universities could run
a clear and well organized programme of preparation for their users, in parallel with
the technical preparation phase. In the research case studies, there is evidence that the
choice of the ERP system came for Senior management decisions without through
review of alternative choices. In Saudi’s universities there is a high need for
stakeholders’ preparation and involvement before the implementation of the ERP
systems, the aim of this involvement is to understand and enhance stakeholders’
values, avoid resistance and increase implementation success.
7.4.2 Effective management support
A successful ERP implementation is possible and achievable only when the
organization gives due consideration too many important points, one of which is the
support offered by top management. Almudimigh et al. (2001) define this support as
the “willingness of top management to provide the necessary resources and authority
or power for project success”.
Somers and Nelson (2004) also consider top management to be a crucial element in
determining the success or failure of ERP implementation, while the technological
capability of the project management team is one of the most widely cited critical

Chapter 7: Discussion 228
Evaluating Stakeholders’ Performance of ERP Systems in Saudi Arabia Higher Education Mona Althonayan
success factors, according to Finney and Corbett (2007). A successful
implementation is achievable only when high level managers have a strong
commitment to the project. Finney and Corbett (2007) identify three vital aspects of
management support: committed leadership at the top management level, the need
for management to anticipate any glitches that might be encountered and finally the
involvement of technically oriented senior managers in the strategic planning phase.
For other authors (Soja, 2006; Yusuf, 2004), the success of any ERP project depends
on two parties, the first of which is the project team, whose members are specialist
internal managers and staff who have vital knowledge of cross-functional business
relationships and experience of the old internal system. This team is responsible for
introducing ERP into the organization, in collaboration with the second party,
comprising experts from the external outsourcing company, representing the system
suppliers on site. These two parties should have a clear plan of cooperation between
them to help the project go smoothly and successfully. Kim et al. (2005) argue that
this is necessary to keep abreast of progress and make adjustments to the system and
to processes within the organization as necessary to shape the implementation.
Somers and Nelson (2004) suggest that senior project management representatives
and ERP end-user steering committee members should be involved in ERP selection,
the monitoring of implementation and the management of outside consultants.
It was widely perceived by the managers interviewed for all three case studies that
these essential elements of the implementation phase were missing. The executive
managers demanded more support from middle managers and project teams, while
middle managers required more knowledge and training, since the majority of them
were not familiar with the details of the new ERP systems. In practice, the skills and
knowledge of the project team are important in providing expertise in areas where
team members lack knowledge (Somers and Nelson, 2004). Based on the interview
data, it is obvious that Saudi universities have tended to neglect a very important part
of the transformation phase. According to Kim et al. (2005), any IT transformation
requires a comprehensive approach towards the large-scale process and system
changes associated with ERP implementation. In other words, without appropriate
change or top management support, the enterprise may not be able to adapt to the
new system and to realise the desired performance gains.

Chapter 7: Discussion 229
Evaluating Stakeholders’ Performance of ERP Systems in Saudi Arabia Higher Education Mona Althonayan
It was noticeable that managers at the Saudi universities studied had paid little
attention to these significant factors during pre-implementation and implementation,
which explained the high degree of employee resistance to the new systems in all
three case studies. The problem was a large gap in the preparation phase, concerning
the role that top management should play during implementation. Almudimigh et al.
(2001) argue that an active top management is important to provide adequate
resources, fast decisions and support for the acceptance of the project throughout the
organisation. Furthermore, they contend that the top management must be involved
in every step of ERP implementation. Finney and Corbett (2007) state that project
management refers to on-going management of the implementation plan. Therefore,
it involves not only the planning stage, but also the allocation of responsibilities to
various players. Top managers’ involvement in the various phases of implementation
is important in developing and promoting a vision for the enterprise’s IT
infrastructure and the role of the ERP system (Kim et al., 2005).
To enable successful ERP implementation, Beheshti and Beheshti (2010) state that
top management involvement is critical; many managers may be involved but not
completely realize the scope of the project, yet such managers should play important
roles as leaders and facilitators of change. Hence, inadequate top management
commitment is considered a major reason for the failure of implementation (Ligus,
2009).
Secondary results from the interviews with project managers indicate that this is the
most problematic area for ERP implementation in Saudi public universities. The case
studies found that the purchase of an ERP system would bring a Saudi university into
a complex implementation relationship with ERP itself and a system integration
partner. A possible explanation for the lack of management support is that there was
a gap between decision makers and managers, who should be involved in all steps,
from comparing potential suppliers and choosing between them to the preparation
and implementation phases. By encouraging such involvement, universities would
help to explain and facilitate their new systems and to avoid any possible resistance
from their employees, the end users.

Chapter 7: Discussion 230
Evaluating Stakeholders’ Performance of ERP Systems in Saudi Arabia Higher Education Mona Althonayan
7.4.3 Appropriate customisation
While the decision to implement an ERP system is an important one for any
organisation, it is most important to ensure that the implementation is successful. The
system should match the organisation’s needs and fit its task. A degree of fit is
required between the ERP system and the organisational processes it supports. Such
a fit can be achieved through reciprocal adaptation of the ERP system and of the
organisation’s processes, otherwise referred to as customisation (Holsapple et al.,
2005). Rothenberger and Srite (2009) define customisations as “building custom
features by using standard programming language, changing the ERP code and or
including third party packages that require some degree of programming to
implement”.
While the concept of customisation as applied to ERP systems is not clearly defined
(Giff, 2009), practitioners and researchers have attempted to explain the difference
between customisation and standardisation (Rothenberger and Srite, 2009;
Holsapple, et al., 2005). Customisation requires ERP software to be configured or
modified to meet organisations’ needs, by setting parameters that allow it to modify
the system within the boundaries set by the developers. In addition, customisation
can mould an ERP package to fit existing business processing, while business
process modification involves changing the business process to match the ERP
package. Customization can be used to enhance the value of off-the-shelf software,
letting the purchasing enterprise add value for its core competences. By contrast,
standardisation requires the adopting organisation to adapt its work to fit the
functionality of the ERP software. In other words, organisations can implement third-
party packages that are designed to work with the ERP software and supplement its
functionality.
According to Rothenberger and Srite (2009), some degree of system customisation is
required in all ERP installations. Although packaged applications are designed to
work in different organizations, or even in different industries, they often do not
provide all of the functionality needed in specific business. Each organisation must
choose between customisation and standardisation, according to the nature of its
activities and needs. In the case of universities, each of which is a unique
organisation with its own characteristics (see chapter 2), customisation would be the

Chapter 7: Discussion 231
Evaluating Stakeholders’ Performance of ERP Systems in Saudi Arabia Higher Education Mona Althonayan
more efficient option to undertake. Indeed, each of the universities studied for this
research was different in terms of the customisation it required, while their various
relationships with the ERP vendors were determined by the vendor companies
themselves, which were responsible for the package and service provided to each
university.
In the case of KFUPM, its experience of customisation was noticeably
straightforward, since the university already followed the American system,
facilitating the transformation from its legacy system to the Oracle ERP system. The
customisation process was based on the university’s needs and the implementation
agreement for the required customisation went very well, with the university
planning to upgrade the systems after six months. KSU, for its part, had chosen to
adopt a local system (MADAR) and the customisation process itself was configured
and modified to meet the university’s needs. KSU was planning to implement the
system in all departments, based on their needs and requirements. The choice of a
local company to supply the ERP software meant that it was cheaper than global
competitors. Consequently, any configuration or modification requested by the
university would be done by the vendor company. In contrast, the third case study
found evidence of a misunderstanding between KFU and the vendor of its Oracle
system regarding customisation: the vendor wanted to deliver the package as is,
while the university demanded a high degree of customisation to meet its needs. This
caused a gap between the functionality offered by the software package and that
required by the adopting university. These varying experiences show that ERP
vendors play an essential role during adoption and adaptation.
Beatty and Williams (2006) state that during the initial implementation of an ERP
system, many organisations choose to customize the standard software modules to
meet implementation dates and to match their unique business requirements.
Although most organisations that implement ERP undertake some customisation of
the vendor’s basic product offering, many make the mistake of over-customising
their application modules in an attempt to appease all members of their ERP upgrade
project teams.
Since this research focuses on the human aspect of implementation, i.e. the ERP
stakeholders, it is useful here to return to the recommendations reported in section

Chapter 7: Discussion 232
Evaluating Stakeholders’ Performance of ERP Systems in Saudi Arabia Higher Education Mona Althonayan
7.4.2 concerning the involvement of managers in all stages of the implementation, as
well as the importance of planning and preparation. This idea is supported by Giff
(2009), who states that the main challenge to ERP customisation is understanding the
system itself, since the managers will need to consult experts on specific modules if
customisation becomes complex. Park et al. (2007) report that users often ask for
customisation when their tasks and business needs are different from those envisaged
by the design of the standardized package; indeed, this explains why so many ERP
installations fail, as consultants’ technical knowhow and users’ business knowledge
sometimes collide during implementation. Therefore, organisations in general and
universities in particular find that ERP customisation and the upgrading of systems to
match individual universities’ needs represent the most severe technological
headaches (Beatty and Williams, 2006).
A comparison between responses of managers interviewed in the case studies reveals
differences among the strategies and policies of three universities, which makes no
sense and which exacerbates the above difficulties. All three are public universities,
supported by the government, with the same scope. Stronger relations and a more
effective collaboration between all Saudi universities would help them to exchange
expertise and to apply similar ERP systems to meet their common requirements.
To conclude, vendors should meanwhile play a significant role in supporting
universities’ continual investment in their new systems, by upgrading, adding
functionality, achieving a better fit between each university and its adopted system,
and being aware of the university’s strategic values. Therefore, vendor support
should include extended technical assistance, emergency maintenance and updating.
All of these factors and the reasons for them, discussed above, can be seen to be
linked to training, which is examined in the following section, where it will be
argued that with packaged software, special user training is an important factor
during the post-implementation phase.
7.4.4 Intensive education/ training schedule
Choosing the right system is important, but most important is choosing a system
capable of integrating the existing work applications and data archives to make
migration easy for users, to reduce the costs associated with transferring data and to
avoid interruption due to training (Lassila and Buchner, 1999). Thus, training plays a

Chapter 7: Discussion 233
Evaluating Stakeholders’ Performance of ERP Systems in Saudi Arabia Higher Education Mona Althonayan
major role in ERP implementation and use, which generally requires major
reengineering of the organisation (Bradley and Lee, 2007). Similarly, Umble et al.
(2003) assert that because user understanding is so important, education and training
are among the most widely recognised critical success factors. ERP implementation
requires a critical mass of knowledge to help users solve problems. It is important for
employees to understand how the system works; otherwise they may discover their
own suboptimal ways of using those parts of system that they are able to operate.
In general, the literature reveals the importance of ERP system training. For example,
Chien and Hu (2009) state that education and training constitute the essential process
of providing managers and employees with an understanding of the logic and overall
concept of the ERP system, which involves teaching many groups of users how to
operate the system efficiently in their daily work activities. According to Zhang
(2005), intensive training can give users a better understanding of how their work is
related to that of other functional areas within the same organisation. Hence, any user
who produces results should be held responsible for making the system perform to
expectations.
Significantly, most of our knowledge about IT learning focuses on the efficacy of
training or support during implementation (i.e. before the application becomes
operational). In this phase, training is typically considered “preparation for use” and
previous studies have shown that implementation training has a significant impact on
ERP success (Chien and Hu, 2009). It is therefore regrettable that ERP training is
often compressed because implementation projects are running out of time and
money. Indeed, organisations tend to cut training costs when adopting expensive
systems, resulting in negative user attitudes and low integration equilibrium. In the
case of Saudi universities, which enjoy the support of the government and
correspondingly generous budgets, discussed earlier in this chapter, time and money
are not major concerns. Notwithstanding this comfortable financial position,
however, this research shows that training is still a critical issue in Saudi universities.
A clear picture of the full benefits of ERP adoption cannot be recognized until end
users are using their new systems properly. Since these are complicated software
packages, sufficient training programmes will be required to enhance employees’
confidence and intention to use them effectively (Hsu et al., 2008). To make end user

Chapter 7: Discussion 234
Evaluating Stakeholders’ Performance of ERP Systems in Saudi Arabia Higher Education Mona Althonayan
training successful, it should start at an early stage, preferably before the
implementation phase begins (Umble et al., 2003).
Surprisingly, the preliminary results of the quantitative phase of the present research
found training not to be one of the final significant factors. This may be because the
questions on training were worded negatively. In contrast, the majority of
interviewees emphasised the importance of training and referred to the need for
continuous training on the new system to help them to do their work effectively.
Over the past decades, the human element has been found to play an important role
in user satisfaction with IS, including ERP (e.g. Wu and Wang, 2007; Calisira and
Calisir, 2004; Aladwani, 2003; Kelly et al., 2001; Mahmood, 2000; Doll et al; 2004;
Norman et al., 2002; Somers et al., 2003), while a good number of studies have
examined the importance of training as part of this human focus. The significance of
the current research is that it focuses on the human element from a somewhat
different angle, which is the impact of ERP system training users’ performance.
There is no doubt that the human element is a “profitable card” for any organisation
to play in order to avoid implementation failure and it is believed that appropriate
training programmes can strengthen employees’ confidence in using a new system
(Hsu et al., 2008).
Chien and Hu (2009) agree that training provides a great opportunity for end-users to
learn about work flow. For example, almost any organisation may face the challenge
of conflict or inconsistency between the new ERP system, its current work processes
and its structure. Therefore, Chien and Hu (2009) argue that the training environment
differs continually as ERP implementation changes the work environment. This
pattern represents a challenge to ERP training, because employees may feel
frustrated and resist using the system if they do not have experience of what is
happing in the transaction. Consequently, research has identified inadequate training
as a major factor contributing to the failure of ERP systems.
Interviewees with employees in all three case studies indicated a widespread belief
that they had not received appropriate training in terms of how to use the ERP system
and that they would prefer continuous training, since a continuous and effective
training plan must be organised and executed so as to help users to obtain sufficient
knowledge of the new system and its added functions.

Chapter 7: Discussion 235
Evaluating Stakeholders’ Performance of ERP Systems in Saudi Arabia Higher Education Mona Althonayan
Chien and Hu (2009) argue that formal training and regular review sessions are both
important to ensure that managers and employees stay up to date with the new
system and process changes. Examining the training schedules of the three
universities gave the researcher a clear picture of the training provided. It was
apparent that the universities had planned short sessions of training for their
employees, which would not be sufficient for to them to understand the operation of
the new ERP systems. Indeed, the universities offered training sessions of 2-3 days
for end users and a maximum of one or two weeks for key users, which is not
considered adequate, especially as the majority of trainees were unfamiliar with the
ERP concept.
Unfortunately, managers often heavily underestimate the degree of education and
training necessary to implement an ERP system as well as the associated costs. Top
management must be totally committed to spending enough money on end user
training and incorporate it as part of the ERP budget (Umble et al., 2003). Chien and
Hu (2009) asserted that such an integrated, complicated and costly undertaking as the
adoption of an ERP system requires a well-organized intensive training schedule for
employees in various relevant skills. In addition, ERP training cannot be viewed as
an event that occurs once and for all, since one of the most common reasons for
failure is inadequate on-going training.
Case study data indicate that KSU employees felt the need for more intensive and
continuous training, but the university did appear to have achieved progress in its
training policy. Large numbers of users were trained in order to implement the
system in various departments, largely through a “train the trainer” approach (see
Appendix: D). There was now among the university’s staff a greater awareness of the
ERP system and how it affected their work. At KFUPM, many key users were first
trained separately in each department so that they could then train other end users.
Key users were also involved in the implementation and their experience enabled
them to be more effective during other subsequent system implementation projects.
More benefits are likely to surface as users adapt to the system and learn more about
its functionality (see Appendix: F). In contrast, KFU was found to be providing the
same short sessions of training for all its employees. These training sessions were

Chapter 7: Discussion 236
Evaluating Stakeholders’ Performance of ERP Systems in Saudi Arabia Higher Education Mona Althonayan
conducted by the company which provided the system and implemented it at the
university (see Appendix: E).
To conclude, the human element should to be handled on two levels: first, employees
must be trained in the use of the new system in order to incorporate it into their daily
operations. The second level is educational exposure (Gargeya and Brady, 2005).
There is a heavy responsibility on managers, who should know and understand the
implications of the system and must come to a consensus on the changes that will
take place in each university. If managers agree that change is necessary and
possible, they can be charged with distributing this information to their support
managers, whereas if they are not in agreement or fail to collaborate, then there will
be no enthusiasm to buy and implement the system; indeed, there may even be active
resistance. There is a serious need for planned, intensive and continuous training to
help employees build their understanding of the system and to keep them up to date
with any upgrade of the ERP system, which will play a significant role in their
performance as well. According to Marshall et al. (2000), education and training are
major tools to improve human performance and encourage better decision making.
Finally, while improving ERP stakeholders’ performance remains a primary goal for
modern Saudi universities to increase competitiveness, analysis of the quantitative
data has revealed that not all constructs of the final research framework proved to be
significant in achieving such improvement. Despite the fact that training was not a
significant factor based on the initial results, nearly all the interviewees believed that
well planned intensive training would have a significant impact on their
performance.
7.4.5 Better system quality
A number of IS/ERP researchers have addressed the impact of adopting new systems
from various perspectives, including user satisfaction, organisational performance
and technical performance, while the literature has rarely focused on the impact of
ERP implementation on stakeholders’ performance. Therefore, whatever aspect is
chosen for study IS/ERP system evaluation should consider two dimensions: impact,
representing the net benefits, and quality, representing the best surrogate measure of
probable future impact (Gable et al., 2008). Subsequently, it is essential to adopt the
appropriate method of evaluating the quality of the system. Ifinedo and Nahar (2007)

Chapter 7: Discussion 237
Evaluating Stakeholders’ Performance of ERP Systems in Saudi Arabia Higher Education Mona Althonayan
refer to the performance characteristics of the ERP system, stating that system
quality is concerned with issues relating to the ease of using and learning the system.
Employing stakeholders’ performance in the evaluation of ERP system effectiveness
is certainly well established in the literature. However, several elements prompt
concern. A major dimension used in the IS/ERP literature is system quality, which
consists of several factors describing the quality of the system. This research was
designed to investigate the impact of system quality and service quality on
stakeholder performance. Based on the integration of the D&M, TTF and EUCS
models, the researcher chose the most widely used factors under the dimension of
system quality (see chapter 3).
A finding of the primary research was that six of the 14 system quality factors were
significant: content, timeliness, and authorisation, ease of use, flexibility and
currency. As to the secondary research findings, while the majority of participants
agreed that these factors all had a significant impact on their performance, when
asked in the interview to rank them by order of importance their responses identified
three of them as having the most important impact on stakeholders’ performance:
flexibility, ease of use and timeliness (see Appendix:B2). The following subsections
discuss the six significant factors in turn, beginning with the three most important
ones.
7.4.5.1 Flexibility
The flexibility of an ERP system in dealing with change in its environment is
important, so any change in the degree of flexibility is certain to affect users’
performance in time. Hence, the flexibility of certain system processes can be used as
a surrogate to measure the level of stakeholders’ performance. However, the
literature has largely concentrated on the three aspects of flexibility mentioned
earlier: user satisfaction, organisational performance and technical performance.
Gebauer and Lee (2008) describe flexibility as the “capacity of an information
system to adapt and to support and enable organisational change”, noting that it “has
been linked to operational efficiency and to organisational nimbleness”. More
simply, Gong and Janssen (2010) define flexibility as the “ability to respond
effectively to changing circumstances”.

Chapter 7: Discussion 238
Evaluating Stakeholders’ Performance of ERP Systems in Saudi Arabia Higher Education Mona Althonayan
Gebauer and Schober (2006) distinguish between two types of flexibility, in relation
to use and to change. Flexibility-to-use refers to the range of process activities that
are built into an enterprise system and supported without requiring a major change to
the system, from a user perspective. Flexibility-to-use manifests itself primarily in
system scope, including functionality, underlying databases, user interfaces and
processing capacity. In contrast, flexibility-to-change is conceptually related to IT
infrastructure and is measured by the effort that is required to change a given
enterprise system after its initial implementation.
The case study data reveal that both types of flexibility were important to the
universities’ stakeholders, but the ways in which participants viewed flexibility
varied slightly: end users were pleased about the degree of flexibility they had in
their daily work compared to the legacy systems, whereas managers (key users) were
concerned with both types of flexibility and looked forward to upgrading the systems
in the hope of achieving a higher degree of flexibility.
A number of researchers (e.g. Gebauer and Lee, 2008; Gebauer and Schober, 2006;
Gong and Janssen, 2010) believe that to be effective and efficient, an enterprise
system needs to be flexible, covering a certain range of functions and feature while
allowing for variation over time. Insufficient flexibility will limit the usage and
success of an ERP system by preventing its use in certain circumstances and by
making exceptional handling necessary. In addition, insufficient flexibility can
reduce the overall lifetime of a system.
To conclude, the stakeholders at Saudi universities found that the ERP systems
implemented at their workplaces were flexible and felt that they had a significant
impact on their performance. Moreover, the flexibility of these systems contributed
to the more efficient performance of given work tasks and processes.
7.4.5.2 Ease of use
According to Ifinedo and Nahar (2007), system quality refers to the performance
characteristics of an ERP system and is concerned with the ease with which it can be
used and its use learned. Indeed, the models most widely used to assess IS/ERP
systems have been used to examine the effects of the ease of use factor on user
satisfaction critical success factors, and users’ culture (D&M and EUCS) (e.g.

Chapter 7: Discussion 239
Evaluating Stakeholders’ Performance of ERP Systems in Saudi Arabia Higher Education Mona Althonayan
Smitha and Mentzerb, 2010; Petter and McLean, 2009; Wu and Wang, 2006;
Agourram and Ingham, 2007; Rai et al., 2002; McGill and Hobbs, 2003; Zhang et al.,
2005; Nelason and Somers, 2001; Somers et al., 2003; Torkzadeh and Doll, 1991)
and on system acceptance (TAM) (e.g. Bueno and Salmeron, 2008; Gyampah, 2007;
Venkatesh, 2003; Dishaw and Strong, 1999).
The present research considered ease of use to be an important element of system
quality, evaluating its impact on stakeholders’ performance. Both primary and
secondary findings show it to be one of the most significant factors affecting users’
productivity and performance. There is no doubt that ERP systems are complex, yet
large numbers of participants found them easy to use. Before ERP implementation,
employees of all three universities had long suffered from conflict between
departments, difficulties in performing their tasks and lack of integration, which
caused difficulties in communicating with other platforms. The results of the case
studies show that the ease of use of the ERP systems adopted by the universities
meant that stakeholders were able to work effectively and efficiently; in other words,
it improved their working environment and helped them to process their transactions
efficiently, thus improving their productivity.
7.4.5.3 Timeliness
The principal purposes of any organisation in implementing an ERP system are to
improve stakeholders’ productivity and to increase their work efficiency. By
achieving these two elements, the organisation will improve its competitive position
in the work environment. In order to do so, timeliness is considered an important
factor in two different ways: accessing the information that the users need on time
and helping users to do their work in a shorter time.
As discussed in the literature review, among the important benefits of ERP systems
are saving time, reducing redundancy and developing improvement. Similarly to
flexibility and ease of use, the effect of timeliness has been examined on user
satisfaction (D&M and EUCS), organisational performance and technical
performance (e.g. Zhang et al., 2005; Nelason and Somers, 2001; Somers et al.,
2003; Torkzadeh and Doll, 1991). The present researcher found it essential to include
timeliness in the framework, because it was able to provide a clear indication of
stakeholder performance and productivity.

Chapter 7: Discussion 240
Evaluating Stakeholders’ Performance of ERP Systems in Saudi Arabia Higher Education Mona Althonayan
The results relating to timeliness show that employees at Saudi universities are aware
of the importance of ERP systems and their role in helping them to perform their
work effectively, accurately and on time. Moreover, stakeholders compared the time
they spent completing tasks before and after ERP implementation. In this context,
employees found that they were able to save time which they could then use to
complete other tasks. Considering timeliness as a factor to evaluate the impact of
ERP systems on stakeholders’ performance in such unique organisations is an
essential issue, as discussed in chapters 2 and 3.
7.4.5.4 Content
A major challenge in IS design is to provide sufficient information without
overloading system users. Therefore, it is important that an ERP system should
contain exactly the information that its users need to complete their tasks efficiently
and effectively. Content includes the provision of precise information and the
production of final reports. Interestingly, different aspects of content have been
widely discussed in the literature; i.e. user satisfaction and the evaluation of ERP
system performance. It is also a feature of one of the important IS models, namely
EUCS. The current research has considered the content factor by integrating EUCS
with D&M and TTF in terms of focusing on stakeholder performance and
productivity. Based on the primary and secondary results, a wide range of
participants found their ERP systems to be providing employees with just sufficient
information to do their work.
7.4.5.5 Authorisation
Another essential consideration in ERP evaluation is authorisation. In the ERP
environment, this concept may take on a meaning different from that in other
workplace environments, referring to users’ ability to access data or to the
availability of useful data.
Based on the interview results, loss of authority was one of the causes of employee
resistance to ERP implementation. Some managers who believed in manual or semi-
manual working were afraid of losing their authority with automation. Nonetheless,
normal employees (end users) found in the new system an authority which they had

Chapter 7: Discussion 241
Evaluating Stakeholders’ Performance of ERP Systems in Saudi Arabia Higher Education Mona Althonayan
not enjoyed in the past, because the adoption of an ERP system meant that work was
no longer centralised.
Previous studies have considered various aspects of authorisation; for example,
researchers have used the TTF model to study its effect on user satisfaction [REF].
However, the present researcher found it more appropriate to consider authorisation
as a factor to measure the impact of the ERP system, in terms of the automation of all
functions and transactions at the three universities.
It was widely perceived by the majority of participants that authorisation was
satisfactory within the ERP systems. In other words, it was easy for them to access
the data required to do their jobs, which had not been available before ERP
implementation. Authorisation was found to be a significant factor, because easy
access would reduce the time and effort needed to complete the work, compared with
having to request permission to gain access to the necessary information. By saving
time and effort in this way, ERP would certainly have a positive impact on
stakeholder performance, while having the authority to access data would enhance
employees’ productivity.
7.4.5.6 Currency
The final significant factor in system quality is currency or recency (Bailey and
Pearson, 1983), which refers to up-to-date information being provided by the ERP
system; it is important that the system should provide the latest information relevant
to the work process in question. The literature reports a large number of studies of
currency in IS/ERP, ranging widely across aspects including user satisfaction and the
evaluation of ERP system performance. It has also been used in two of the important
IS model, namely TTF and D&M (e.g. Strong and Volkoff, 2010; Smitha and
Mentzerb, 2010; Zigurs and Bukland1998; Goodhue and Thompson, 1995)
Considering ERP stakeholders’ performance in universities is a new development in
that its focus is the impact of the system on stakeholders in this particular
environment. The results of this research reveal that employees believed that their
ERP systems were providing data suitable for their purposes. Moreover, the degree
of currency in ERP system environment met their needs and had a significant impact.

Chapter 7: Discussion 242
Evaluating Stakeholders’ Performance of ERP Systems in Saudi Arabia Higher Education Mona Althonayan
7.4.5.7 Section summary
University stakeholders were found to believe that the above six factors could help
them to fulfil the needs and requirements of their work and that they certainly
improved their performance. The findings of this research are consistent with those
reported in the literature in terms of the importance of considering system quality in
ERP evaluation, while it has also produced significant new insight that will be of
benefit to practitioners and academics by its focus on stakeholder performance. It is
easy to see and feel the benefits of ERP adoption by determining and evaluating such
factors, related to process productivity and to the impact on stakeholder performance.
It is notable, however, that eight of the fourteen system quality factors originally
considered were not found to be significant. Three facts may contribute to explaining
their absence from the analysis: first, the universities studied were all pioneers, being
among the first Saudi universities to implement ERP systems; secondly, the majority
of stakeholders had relatively little knowledge of the concepts underlying ERP
systems; finally, they lacked technical experience.
7.4.6 Better service quality
The final important dimension to be considered when evaluating an IS/ERP system is
service quality, because it is a key dimension in determining the success or failure of
such a system (Deshmukh and Vrat, 2004). Therefore, researchers have recognized
the importance of service quality and the effects it may have on IS users. Indeed,
some have called for more research to measure service quality (Chang and King,
2005). Petter et al. (2008) define service quality as “the quality of the support that
system users receive from the IS department and IT support personnel”.
Deshmukh and Vrat (2004) conducted a review of 19 different service quality
models, all of which focused on user satisfaction with service quality, the value of
service quality, or the perceived value of IS. Many other researchers have
emphasised the importance of service quality and its possible effects on various
outcome measures. For instance, Ray et al. (2005) argue that a flexible IS
infrastructure has a major role in facilitating rapid development and implementation
of IS applications that enhance customer service processes by allowing the

Chapter 7: Discussion 243
Evaluating Stakeholders’ Performance of ERP Systems in Saudi Arabia Higher Education Mona Althonayan
organisation to respond quickly to take advantage of merging opportunities or to
neutralize competitive threats.
However, despite the importance of service quality and its effect on system users,
there is limited reference to it in the research literature and it has been included in
few frameworks. Indeed, none of the original models which the researcher has
integrated into the current study considers service quality as one of its dimensions.
The model of DeLone and McLean (1992), for example, which is the most widely
cited in IS studies, does not take account of service quality. Several researchers have
subsequently attempted to test and modify the D&M model and others have called
for its further development and validation. The contribution of Pitt et al. (1995) was
to modify the model to include service quality as a measure of IS success, arguing
that it needed to be expanded to reflect the service role of IS department. In addition,
Myers et al. (1997) highlight the importance of service quality at the organisational
level, to provide customers with high quality.
While the few studies of IS service quality reported in the literature focus on a
number of different aspects, including user satisfaction and measuring system
performance, the present study makes a novel contribution by attempting to evaluate
the impact of service quality on stakeholder performance in the ERP environment. It
does so by treating service quality as a dimension which consists of four factors:
reliability, assurance, tangibility and responsiveness. Two of these, responsiveness
and reliability, were found to be significant. The primary results are consistent with
the secondary results in terms of the importance of service quality and its effect on
performance.
The majority of interviewees emphasised two aspects of their perceptions of service
quality. First, stakeholders felt that it was important for the system they were using to
be dependable and trustworthy, so that they could complete their tasks and improve
their productivity. The second point was their willingness to provide a timely service,
thus indicating that timeliness provides a significant connection between system
quality and service quality.
The findings of this research are consistent with the literature in terms of the
importance of service quality, while the novel contribution made by including
service quality in the model is to demonstrate that it has a significant impact on

Chapter 7: Discussion 244
Evaluating Stakeholders’ Performance of ERP Systems in Saudi Arabia Higher Education Mona Althonayan
stakeholder performance, in addition to the essential role played by effective and
efficient service quality in increasing productivity.
The analysis presented in chapters 5 and 6, as well as in the above discussion, allows
conclusions to be drawn as to the factors which have a significant impact on the
performance of ERP stakeholders. Both the system quality and service quality
dimensions have been identified in many studies reported in the literature, which
focus on different aspects, perspectives and ERP implementation phases, although
the role of management has only been identified in studies of the implementation
phase. The results of the present research show that factors from the pre-
implementation phase, the implementation phase (see Figure 7.2, Management
Quality dimension) and the post-implementation phase (see Figure 7.2, System
Quality and Service Quality dimensions) had a direct impact on stakeholders’
performance. In ERP implementation, each phase has a direct impact on the
following phase; in other words, all phases are linked and interconnected. Therefore,
organisations in general and higher education institutions in particular should focus
on all the early stages and the implementation phases if they wish to achieve high
stakeholder performance.
Figure 7.2: ERP system Impact on Stakeholders’ Performance Model
Stakeholders’
performance
System Quality
• Content • Timeliness • Authorization • Ease of use • Flexibility • Currency
Management Quality
• Resistance to change. • Appropriate customization. • Support management. • Continuous education and training.
Service Quality • Reliability • Responsiveness

Chapter 7: Discussion 245
Evaluating Stakeholders’ Performance of ERP Systems in Saudi Arabia Higher Education Mona Althonayan
7.5 Summary
The successful integration of three well known IS models (D&M, TTF and EUCS)
and the selection of the most suitable factors to evaluate the impact of ERP systems
on stakeholders performance in three Saudi universities has shown that adopting any
one of the models separately would not have been sufficient for the purpose of this
research.
In addition, the use of mixed methods of data collection and analysis helped the
researcher to understand and present clearly the findings of the first phase of this
research. There was an obvious consistency between the quantitative and qualitative
data. However, each case has been analysed separately and the results have proven
the significance of the quantitative findings in respect of most of the hypotheses
tested.
The final chapter will compare the findings of the present research with those
reported in the relevant IS literature. It will also identify the limitations of the
research and highlight its main contributions, ending with suggestions for future
studies.

Chapter 7: Discussion 246
Evaluating Stakeholders’ Performance of ERP Systems in Saudi Arabia Higher Education Mona Althonayan

Chapter 8: Conclusions 246
Evaluating Stakeholders’ Performance of ERP Systems in Saudi Arabia Higher Education Mona Althonayan
PAGE
8.1 Overview…………………………………………………………………… 247
8.2 Research Overview and Summary……………………………………….. 247
8.2.1 Research aim and position…………………………………………… 247
8.2.2 Literature review and theoretical framework……………………… 248
8.2.3 Research philosophy and methods……………………………………. 249
8.2.4 Empirical work…………………………………………………………. 249
8.2.4.1 Quantitative phase…………………………………………………… 249
8.2.4.2 Qualitative phase…………………………………………………….. 249
8.3 Findings…………………………………………………………………….. 250
8.4 Contributions………………………………………………………………. 251
8.4.1 Contribution to methodology…………………………………………. 251
8.4.2 Contribution to theory………………………………………………… 253
8.4.3 Contributions to policy and practice…………………………………. 256
8.5 Limitations of the research………………………………………………... 258
8.6 Recommendations for practice…………………………………………… 259
8.7 Future Research…………………………………………………………… 260
CHAPTER EIGHT
CONCLUSIONS

Chapter 8: Conclusions 247
Evaluating Stakeholders’ Performance of ERP Systems in Saudi Arabia Higher Education Mona Althonayan
8.1 Overview
This chapter draws conclusions from the study findings, offering an understanding of
the impact of ERP systems on stakeholders in Saudi universities in the context of
past and future research. It begins by summarizing the research and its findings,
outlining the main theme and rationale of each chapter of this thesis. Thereafter, the
research contributions are discussed under three headings: contributions to
methodology, to theory and to practice. The limitations of the research approach are
then considered, followed by suggestions for significant future research avenues that
might provide further developments in this important area of research.
8.2 Research Overview and Summary
The aim of this research was to develop the best possible framework to evaluate the
impact of ERP systems on stakeholders’ performance, in the specific context of
Saudi Arabian higher education. To summarise the structure and conduct of the
research, this section reviews the seven previous chapters of the thesis in turn under
four main headings: setting the research aim and position; evaluating the current
literature and designing the theoretical framework of the research; selecting the
research philosophy and data gathering techniques to be adopted; and finally,
conducting the empirical studies. Decisions about each of these steps in the research
were taken on the basis of gaps identified in the literature, as well as the objectives
and scope of the present study.
8.2.1 Research aim and position
Chapter 1 of this thesis introduced the field of interest and highlighted the aspects
most closely related to the specific research area. It explained the importance of ERP
systems in general and in higher education in particular. While a broad body of
literature was identified as dealing with the implementation of such systems,
indicating their importance, it was noted that few such studies had considered their
adoption in the higher education sector (Rabaa’i, 2009). Since the government of
Saudi Arabia has allocated a large part of its budget to investment in HE, most Saudi
universities are tending to adopt the latest technology to improve their educational
processes and productivity. Therefore, there is a serious need to investigate the
impact of such new systems on stakeholders at these universities. Chapter 1 thus

Chapter 8: Conclusions 248
Evaluating Stakeholders’ Performance of ERP Systems in Saudi Arabia Higher Education Mona Althonayan
stated the aims of the research as being to highlight the impact of ERP systems on
the performance of an academic institution and to provide researchers, practitioners
and decision-makers with a framework to enhance their evaluation of the
performance of ERP system stakeholders in higher education.
In order to position this research in relation to the existing literature, chapter 2
provided a critical overview of the current literature in the five research areas on
which this research touches: ERP systems, evaluation, stakeholders, performance and
HE. This was found to link the performance of such systems with stakeholders’
satisfaction as a central element of ERP literature. Saudi universities were identified
as interesting cases relevant to this research, for a reason explained in chapter 3: that
the impact of ERP systems on stakeholders’ performance at Saudi universities had
not been investigated by previous studies.
8.2.2 Literature review and theoretical framework
Chapter 3 further evaluated the literature reviewed in chapter 2, selecting three of
the existing models discussed there, namely D&M, TTF and EUCS. It identified each
of these models separately, and then reviewed the previous studies which had applied
them in the context of ERP adoption. Based on the evaluation of these models and a
consideration of factors counting for and against their use in the current research, the
researcher decided to combine them, selecting the most suitable factors from each to
evaluate the performance of ERP stakeholders. The choice of factors was supported
by reference to the reports in the literature of their use to investigate different aspects
of IS/ERP studies.
An initial theoretical framework was then developed, comprising three sets of factors
corresponding to the dimensions of performance impact, system quality and service
quality. From this were developed the research hypotheses and the dependent and
independent variables. A shortcoming was also identified in considering
stakeholders’ performance evaluation, more specifically in the HE context; gaps in
the field were highlighted in chapter 3, which helped to identify methodological and
technical limitations in the research area under investigation.

Chapter 8: Conclusions 249
Evaluating Stakeholders’ Performance of ERP Systems in Saudi Arabia Higher Education Mona Althonayan
8.2.3 Research philosophy and methods
Chapter 4 forms the methodological basis of this research, identifying the
ontological, epistemological and theoretical foundations of the positivist paradigm. It
justified the choice of this particular research philosophy as inspired by Yin’s (2009;
2012) case study approach to understanding social phenomena. Chapter 4 also
explained the sources used in this research, emphasising the reasons for using
triangulation and mixed qualitative and quantitative data gathering techniques. It
identified the sampling frame as three cases of ERP implementation in HE and the
unit of analysis as the performance of the systems’ stakeholders, explaining that this
sampling frame was chosen because of the increasing implementation of ERP
systems in Saudi universities.
8.2.4 Empirical work
Moving from the conceptual to the empirical, the hypotheses were tested in three
case studies of Saudi universities (KSU, KFU and KFUPM), adopting the mixed-
method approach, where a quantitative phase was followed by a qualitative one.
8.2.4.1 Quantitative phase
Chapter 5 reports the use of a questionnaire to gather quantitative data. The phase
was divided into three steps: first analysing each case separately, then conducting a
statistical comparison of the three sets of results and finally considering the data from
all three together to assess the impact on performance in general.
8.2.4.2 Qualitative phase
The qualitative phase of data collection, where managers and employees were
interviewed individually, was reported in chapter 6 of this thesis, followed by an in-
depth analysis, following the same three steps as in chapter 5.
Chapter 7 provided an in-depth discussion of the results of the two phases, taking
account of how the mixed-method data collection and analysis related to the
theoretical framework. The chapter ended with a proposed model for the evaluation
of ERP stakeholders’ performance.
Chapter 8: Conclusions 250
Evaluating Stakeholders’ Performance of ERP Systems in Saudi Arabia Higher Education Mona Althonayan
8.3 Findings
The integrated research theoretical framework suggested by this research was found
to be appropriate for evaluating the impact of ERP systems on stakeholders’
performance in the context of Saudi universities. The stakeholders in question were
identified as administrative employees and managers at KSU, KFU and KFUPM,
using ERP systems in their daily work.
The mixed-method approach to data collection and analysis was found to be
valuable, because it gave the researcher the opportunity to conduct the case studies in
greater depth and to achieve a fuller understanding than would have been possible
with any single method. The questionnaire proved to be a suitable technique to elicit
initial general data about the quality of ERP systems in Saudi universities and the
service provided during the post-implementation phase.
It was found that factors of system quality (flexibility, timeliness, ease of use,
content, authorisation, currency) and service quality (responsiveness and reliability)
had significant positive effects on stakeholders’ performance and productivity.
Consistent with published studies, these results prove that both system and service
quality are important dimensions to be considered for the evaluation of ERP systems
from the stakeholders’ perspective.
Interestingly, the qualitative phase of the research can be seen to have added
credibility to the findings. The interviews and documentary analysis were useful to
supplement the questionnaire findings with more in-depth data. The factors identified
during this qualitative phase (understanding resistance to change, effective
management support, appropriate customisation, intensive education and training
schedule) also had significant and positive effects on stakeholders’ performance,
from the management point of view. The interviews focused on managers rather than
users, to deepen the understanding of these factors. The qualitative findings play a
vital role in making the final model more comprehensive by adding the management
dimension to those of system and service quality.
The research findings show the great importance of integrating all three dimensions
throughout implementation, since all implementation phases are affected by each
other, from planning to post-implementation.

Chapter 8: Conclusions 251
Evaluating Stakeholders’ Performance of ERP Systems in Saudi Arabia Higher Education Mona Althonayan
8.4 Contributions
The contributions made by this research are various, in the theoretical, practical and
methodological spheres. This thesis adds value to research and practice communities
concerned with ERP systems, higher education, evaluation and public organisations.
Before the remainder of this section details the most important contributions of the
study to theory, practice and methodology, Table 8.1 shows how it meets the
objectives established in chapter 1 (section 1.3). The accomplishment of these
objectives was made possible by the integration of three IS models and developing a
framework for the evaluation of ERP stakeholders’ performance.
Table 8.1: Accomplishment of research objectives
Research Objectives Accomplishment 1: To review existing evaluation
frameworks for ERP systems in order to
assess the methods used to measure ERP
systems.
Achieved in chapter 2 through a thorough
review of ERP evaluation methods.
2: To identify the most successful method
applicable to evaluate the performance of
ERP stakeholders.
Achieved in chapter 3 with the identification of
three IS models: D&M, TTF and EUCS.
3: To develop a suitable theoretical
framework to evaluate the performance of
ERP systems in HE in Saudi Arabia, from
the perspective of their stakeholders.
Achieved in chapter 3 by developing a
theoretical framework based on the integration
of the three IS models.
4: To collect and analyse case study data
in order to test the theoretical framework.
Achieved by taking the mixed-method approach
as reported in chapters 5 and 6, using a
questionnaire and interviews, supported with
documentary and archival material, to evaluate
the impact of ERP systems in three case studies
in Saudi HE (KSU, KFU and KFUPM).
5: To identify the main factors having a
significant impact on the performance of
ERP stakeholders in higher education.
Achieved in chapter 7 by finalising the
framework based on the qualitative and
quantitative data. The researcher also identified
the specific needs and requirements for ERP
implementation in Saudi HE.
Source: Originated by the researcher
Chapter 8: Conclusions 252
Evaluating Stakeholders’ Performance of ERP Systems in Saudi Arabia Higher Education Mona Althonayan
8.4.1 Contribution to methodology
8.4.1.1 An integrated IS framework to assess ERP systems in public higher
education
The main methodological contribution of this research has been the use of the case
study strategy to explore the use of ERP systems in multiple organisations in the
public HE sector. As explained in chapters 2 and 3, the majority of ERP studies have
been set in manufacturing or service industries and in the private sector. Conducting
case studies of the impact on stakeholders’ performance of ERP systems in the public
sector is challenging, as is the adoption of a mixed-method approach in such cases,
due to the regulations restricting public sector organisations and the difficulty in
accessing the data.
A further major contribution is to have conducted this research in a developing
Middle Eastern country, namely Saudi Arabia, considering the general shortage of
ERP studies set in public sector organisations and of all ERP studies set in this
region, applying to both public and private sectors.
The following subsections evaluate the methodological approach taken here by
considering in turn three factors recommended by Yin (2012: 171-176) for the
evaluation of case studies, to prove the quality of the research approach.
8.4.1.2 Defining the case
The initial design of a case study evaluation must be based on a comprehensive
understanding of the activity being evaluated, which may be considered the intended
operation and outcomes of a ‘case’, giving explicit attention to contextual conditions.
Here, each of the three case studies was reported separately in chapters 5 and 6, with
an analysis of the data being followed by the findings. In each case there was a
description of the university and of the ERP system it had adopted, a note of the date
of implementation and a list of the departments which had implemented the system
in question.

Chapter 8: Conclusions 253
Evaluating Stakeholders’ Performance of ERP Systems in Saudi Arabia Higher Education Mona Althonayan
8.4.1.3 Data collection procedures
Case study evaluations tend to rely on a variety of sources, including some
combination of fieldwork, participant observation, and questionnaire-based surveys
of such groups as service personnel or neighbourhood residents, and social
indicators. The mixed methods used in the present research were found to be
valuable in exploring all aspects of the situations encountered in the case studies. The
data were collected from the following sources: a questionnaire, interviews,
documentation and archives.
8.4.1.4 Data analysis procedures
Data collection and analysis in case studies are likely to occur in an intermixed
fashion. The successful case study researcher is likely to be a diligent investigator
who understands the objective of the inquiry and can identify relevant evidence, even
though specific sources may differ. He or she should thoroughly document the
methodological steps taken to assure an unbiased data collection procedure, despite
this variation. The present thesis details all stages of data collection and analysis in
chapter 4.
8.4.2 Contribution to theory
The contribution of the current research to theory is manifold. The key contributions
can be summarized as: (1) the integration of three widely used IS models to evaluate
ERP systems from the stakeholders’ perspective; (2) the development of a theoretical
framework for evaluating stakeholder performance in the context of ERP systems;
(3) interrelating the two phases of ERP implementation when evaluating the impact
of systems. These contributions are dealt with in turn in the following subsections.
8.4.2.1 Integration of three widely used IS models
The main theoretical contribution of this thesis is to fulfil the need, identified in
chapter 1, section 1.5, to develop a systematic method to evaluate stakeholders’
performance. The first step was to investigate previous studies, which revealed the
lack of a suitable existing model to evaluate the impact of ERP systems on
stakeholders’ performance. As the best of these models (D&M, TTF and EUCS)
were found to be inadequate when used separately, the researcher chose to integrate

Chapter 8: Conclusions 254
Evaluating Stakeholders’ Performance of ERP Systems in Saudi Arabia Higher Education Mona Althonayan
them for the purpose of the present study. While the IS/ERP literature shows that
researchers have sometimes combined one of these models with another, such as
TTF with TAM, this research has shown that the integration of all three models
improved significantly the ability to evaluate the performance of ERP stakeholders.
8.4.2.2 Development of a framework for evaluating ERP stakeholder performance
When integrating the three models, the researcher used the results of earlier studies
to choose the most suitable factors for evaluating stakeholders’ performance. This
required the building of a theoretical framework to test the hypotheses that there are
relationships between the quality of an ERP system, its service quality and
stakeholders’ performance.
8.4.2.3 Interrelating two phases of ERP implementation
This research contributes to the understanding of the drivers of ERP systems. It has
succeeded in developing a model that enriches current research by offering
specification and justification of a set of interrelationships between two important
phases of ERP implementation (implementation itself and post-implementation),
which have tended in the past to be the subject of separate research. By examining
the association between these different phases, this research emphasises the role of
management, in addition to ERP system quality and service quality.
There are three main aspects of the contribution related to the interrelation between
the two phases of implementation, concerning linkage or integration, involvement
and sustainability.
8.4.2.3.1 Linkage or integration
The model developed here covers three important dimensions (administration,
technical and service/technical support) which must be considered together, not
separately, if successful implementation is to be assured, and which will have a
positive impact on employees’ performance.
This research has proven that administrative work processes should be integrated.
The integration between decision makers, executive managers, key users and end
users, throughout the implementation phase, will have a positive impact on the

Chapter 8: Conclusions 255
Evaluating Stakeholders’ Performance of ERP Systems in Saudi Arabia Higher Education Mona Althonayan
success of the ERP system in the post-implementation phase. The current research
model, by considering the pre-implementation phase to be a critical success factor,
having a significant impact on stakeholder performance, has achieved the goal of
integration. Hence, the developed model supports the rejection of solitary managerial
decisions. Starting from this point, it supports a high level of involvement throughout
implementation, as explained in the next subsection.
8.4.2.3.2 Involvement
Several studies reported in the literature emphasise the importance of involving key
users in the implementation phase. The model developed here proves that the degree
of user involvement during implementation plays an essential role in enhancing
employees’ understanding, acceptance and efficiency in respect of the new system.
The researcher believes that the ERP stakeholders’ performance model show users’
involvement to be as important as system and service quality.
Furthermore, the value of the involvement of top managers, key users and users in
implementation is enhanced by creating good understanding, support, experience and
awareness using the new system, thus reducing the likelihood of employee
resistance.
8.4.2.3.3 Sustainability
It is crucial for the developed model to be sustainable and to operate continuously,
since the evaluation process is supposed to be based on the organisations’ current
policy. The findings of the present research relevant to sustainability concern two
distinct areas: continuous education and training, and ongoing technical support.
Both quantitative and qualitative results show that education and training are crucial
factors. In the studies reported in the literature, training has been considered under
different dimensions, such as service quality, system quality and CSFs. While
educational and training can be seen as separate elements, both should be continuous.
Thus, the developed model considers education and training to cover both the
implementation and post-implementation phases in a sustained way.
Education: Throughout the pre-implementation and implementation phases,
educational courses for users are necessary and should be compulsory, since the

Chapter 8: Conclusions 256
Evaluating Stakeholders’ Performance of ERP Systems in Saudi Arabia Higher Education Mona Althonayan
majority of users are not even aware of the concepts behind ERP systems. Such
educational courses should be considered the first step in users’ involvement, helping
them to understand these concepts, to make the systems more user-friendly, to reduce
user resistance and prepare them for the next step.
Training: ERP systems are often described as complex, difficult and rapidly
developing; therefore, continuous training is essential. In addition, it is normal for
any organisation which has implemented such a system to consider upgrading it,
making ongoing training very important to improve users’ skills, to keep them up to
date with the system and to enhance their ability and productivity. In short,
continuous education and training will provide users with the knowledge they need.
Technical support: The relationships between the dimensions or constructs of
management, system and service are highly important to show the interdependencies
between ERP implementation and post-implementation performance. The dimension
of service quality in the developed model is considered essential for the
implementation of any system, because without continuous technical support, system
success is not possible; the technical support team should provide the organisation
with a high degree of continuous service. Therefore, the members of the technical
support team themselves should have focused training courses in the early stages of
implementation, in addition to their other two roles: helping users to solve any
problems or difficulties they may face in their work and providing training courses
for these users. Thus, by including the need to ‘train the trainer’, the developed
model will provide users with continuous service and training at the same time.
8.4.3 Contributions to policy and practice
This research makes a unique contribution to practice through the rich knowledge
and experience it supplies to HE rectors, decision-makers, executives, ERP
practitioners, key users and end users. In addition, the current research has practical
implications for the way in which ERP might enhance stakeholders’ performance and
thereby increase their productivity, as the developed model is comprehensive,
covering all organisational levels: management, technical and service. It offers
insight to organisations, clearly identifying steps which will ensure a high degree of
success in ERP planning and implementation and yield significant stakeholder

Chapter 8: Conclusions 257
Evaluating Stakeholders’ Performance of ERP Systems in Saudi Arabia Higher Education Mona Althonayan
performance in the post-implementation phase. Therefore, for Saudi universities
which plan to implement an ERP system or have already chosen a supplier and
signed a contract (see chapter 7section73.1), the developed model adds value to the
implementation phase and provides significant assistance in building and managing a
well planned and strategic ERP implementation.
In addition, it helps vendors of ERP systems to cooperate with client organisations in
terms of providing a clear offer of customisation matching their needs and
continuous education and training for employees.
Universities, as discussed in chapter 2, are considered ‘unique’ organisations
(Pollock and Cornford, 2004; Lockwood, 1985). Nonetheless, as well as differences,
there are some similarities between universities and business organisations, which
include complexity of purpose, limited measurability of output, autonomy from and
dependency on wider society, diffuse structure of authority and internal
fragmentation. Organisations in general may have one or more of these
characteristics or components; it is the particular combination of the components
within universities that make them unique.
In addition, universities in Saudi Arabia, as public organisations, may be seen as
unique because universities in the public sector have different characteristics from
those in the private sector (as discussed in chapter 7, sections 7.2.1 and 7.2.2). For
instance, the rectors of all Saudi universities are appointed by royal decree on the
recommendation of the minister of HE. Each rector is responsible for his university’s
financial, academic, administrative and student affairs. However, the government,
because it is the main source of income, must approve any long-term project and it
constrains all strategic direction and major decisions .
To conclude, there is a need to identify carefully and clearly the needs of universities
vis-à-vis ERP systems so that the vendors can provide the right components that will
match their needs and satisfy the users by increasing their performance and
productivity. Finally, the model developed here is intended to inspire ERP system
developers to identify and meet the exact needs and intentions of client organisations
according to their different roles, taking into consideration government policy and
organisational context.

Chapter 8: Conclusions 258
Evaluating Stakeholders’ Performance of ERP Systems in Saudi Arabia Higher Education Mona Althonayan
The following table 8.2: shows the contribution of this research to the literature of
ERP systems evaluation from the stakeholders’ perspective. This table is based on
the summary of research limitations as they have been presented at the end of chapter
(section 2.10).
Table 8.2: Theoretical contributions of this research
Research area Existing research Contribution of this
research ERP systems evaluation Technology performance,
financial, and satisfaction
driven
Evaluating the stakeholders
performance
ERP systems
implementation
Focused on
implementation phase and
critical success factors
Evaluate the impact of ERP
systems on stakeholders’
performance in the post
implementation phase.
Organisation / Sector The existing research focus
on the private and service
sector
This research focus on the public
sector in one of the developing
countries (Saudi Arabia)
ERP systems in higher
education
The existing literature
focus on the ERP system
in higher education from
the technical and the
implementation phase.
This research focus on the impact
of ERP systems on stakeholders’
performance and productivity.
ERP systems in higher
education in Saudi
Arabia
No literature available /
found
To the day of conducting this
research, research which
considers evaluating the ERP
system from stakeholders’
perspective has not been focus
on.
Integrated three models The existing literature
adopted the D&M, TTF,
and EUCS models
separately or integrated
two models for different
purpose.
This research integrated the
D&M, TTF, and EUCS models
for the purpose of evaluating
stakeholders’ performance in
higher education context.
Source: Originated by the researcher
8.5 Limitations of the research
There are number of limitations in the current research that should be recognised.
These can be summarised as follows:
It focuses on the ERP post-implementation phase.
Saudi universities which have implemented ERP systems need a sufficient period
of time for them to be evaluated.

Chapter 8: Conclusions 259
Evaluating Stakeholders’ Performance of ERP Systems in Saudi Arabia Higher Education Mona Althonayan
All Saudi universities are in the public sector; therefore, the transferability of the
findings and their implications will be limited by contextual idiosyncrasies
related to developing counties, the Arab region and the Saudi public sector.
No attempt was made to ensure gender balance; therefore, the research sample
was more male than female, due to the policy of Saudi universities to have
separate campuses for males and females. The empirical work was mainly
conducted on male campuses.
8.6 Recommendations for practice
Based on the findings of this research, the following recommendations are made to
help practitioners and managers avoid negative reactions to ERP implementation.
The Ministry of Higher Education should standardise ERP systems in all Saudi
universities. It should customise one selected ERP system to match the government’s
higher education policy, thus saving money and time, ensuring better communication
among Saudi universities and between them and the Ministry. If there were such an
ERP system, customised to make it suitable for all Saudi universities, there would be
no need to make serious changes unless these were fully justified. This would allow
Saudi universities to have better communication amongst themselves and exchange
experience to support the educational process in Saudi Arabia. Such a sharing of
experience among universities would allow them to emphasise the positive aspects of
ERP adoption and to reduce the likelihood of negative issues arising.
On the broader scale of the introduction of electronic government, the Ministry of
Civil Service should consider the IT systems used by public bodies when making any
changes to its central system. This would help to address the more general problem
of poor linkage among organisations in the public sector.

Chapter 8: Conclusions 260
Evaluating Stakeholders’ Performance of ERP Systems in Saudi Arabia Higher Education Mona Althonayan
8.7 Future Research
An important issue related to the contribution of this research is how the results may
prove useful in other research contexts. In addition to the significant contributions
outlined above, the current research also provides some important directions for
future research in order to continue developing this vital research domain.
It is important for future researchers to be able use the conclusions of this piece
of research, but in different contexts, with different samples and methods of data
collection and analysis.
It would be useful for similar future research during the maturity phase to include
all stakeholders in the universities.
Future research should test the applicability of the model of ERP impact on
stakeholders’ performance in other public sector organisations.
References 261
Evaluating Stakeholders’ Performance of ERP Systems in Saudi Arabia Higher Education
Mona Althonayan
Abreu, A. and Conrath, D. (1993) ‘The role of stakeholders’ expectations in
predicting information systems implementation outcome’, Proceeding SIGCPR
'93 Proceedings of the 1993 conference on Computer personnel research, pp. 408-
415.
Abugabah, A., Sanzongni, L. and Poropat, A. (2009a) ‘The Impact of Information
systems on user performance: A critical review and theoretical model’,
International Conference on Information Systems (ICIS), WASET, pp. 809-819.
Abugabah, A., Sanzongni, L. and Poropat, A. (2009b) ‘Enterprise Resource
Planning Systems (ERP) and User Performance: A literature Review’, 20th
Australian Conference on information system, 2-4- Dec 2009, Melbourne, pp. 820-
829.
Abugabah, A., Sanzongni, L. and Poropat, A. (2010) ‘Information Systems
Models: A Synthesized Validated Model for Measuring Information Systems
Impacts on End User Performance’, Information Society (I-Society) 28-30 June
2010, pp. 230 - 237.
Adelakun, O. and Jennex, M. (2002) ‘Stakeholder Process Approach to
Information System Evaluation’, Eighth Americas Conference on Information
Systems, pp. 1186-1195.
Ahmed, Z., Zabib, I. and Arokiasamy, S. (2006) ‘Resistance to change and
implementation success: the moderating role of change management initiatives’,
Asian Academy of Management Journal, 11 (2), pp.1-17.
Agourram, H. and Ingham, J. (2007) ‘The impact of national culture on the
meaning of information system success at the user level’, Journal of Enterprise
Information Management, 20 (6), pp. 641-656.
Aladwani, A. M. (2001) ‘Change management strategies for successful ERP
implementation’, Business Process Management Journal, 7 (3), pp.266 -275.
Aladwani, A. (2002) ‘An Empirical Examination of the Role of Social Integration
in System Development Projects’, Information Science Journal, 12 (4), pp. 339-
353.
Aladwani, A. (2003) ‘Key Internet characteristics and e-commerce issues in Arab
countries’, Information Technology & People, 16 (1), pp. 9-20.
Al- Hossan, A. and Al- Mudimigh, A. (2011) ‘Practical Guidelines for Successful
ERP Testing’, Journal of Theoretical and Applied Information Technology, 25, pp.
1-15.

References 262
Evaluating Stakeholders’ Performance of ERP Systems in Saudi Arabia Higher Education
Mona Althonayan
Allen, D., Kern,T. and Havenhand, M. (2002) ‘ERP critical success factors: an
exploration of contextual factors in public sector institutions’, 35th Hawaii
International conference on systems sciences, pp. 1-10.
Al-Mashari, M., Al-Mudimigh, A. and Zairi, M. (2003) ‘Enterprise resource
planning: A taxonomy of critical factors’, European Journal of Operational
Research, 146, pp. 352-364.
Al-Mashari, M. (2002) ‘Enterprise resource planning (ERP) systems: a research
agenda’, Industrial Management & Data Systems, 102 (3), pp.165 - 170.
Al-Mashari, M. (2001) ‘ERP software implementation: an integrative framework’,
European Journal of Information Systems, 10 (4), pp.216-226.
Al-Mashari, M., Zairi, M. and Okazawa, K. (2006) ‘Enterprise resource planning
(ERP) implementation: a useful road map’, International Journal of Management
and Enterprise Development, 3 (1/2) pp.169-180.
Al-Mudimigh, A., Zairi, M. and Al-Mashari, M. (2001) ‘ERP software
implementation: an integrative framework’, European Journal of Information
Systems, 10, pp. 216-226.
Al-Mudimigh, A. and Ullah, Z. (2011) ‘Integration and communication to prevent
dirty data: The role of MADAR projects’, Journal of Information, (ISI Indexed).
Al-Mudimigh, A., Ullah, Z., Saleem, F. and Al-Aboud, F. (2009) ‘Data mining for
customer queries in ERP model – a case study’, Fifth International Joint
Conference on INC, IMS and IDC, pp.2000-2005.
Al-Mudimigh, A., Saleem, F. and Ullah, Z. (2009) ‘Developing and integrated
data mining environment in ERP-CRM model –a case study of MADAR’,
International journal of education and information technologies, 3 (2), pp.135-
144.
Al-shamlan, H. and Al-Mudimigh, A. (2011) ‘The change management strategies
and processes for successful ERP implementation: A case study of MADAR’
International Journal of Computer Science, 8, pp. 20-30.
Al-turki, U., Duffuaa, S. and Demiral, T. (2008) ‘Stakeholders integration in
higher education: supply chain approach’, European journal engineering
education, 33 (2), pp. 211-129.
Alyassen, H., Eldabi, T., Paul, R.J. and Haddadeh, R. (2008) ‘Post implementation
evaluation of IT systems: A close review of practice’, in Irani, Z., and Love, P.
Evaluating Information Systems: Public and Private sector. London: Elsevier Ltd,
pp.134-152.

References 263
Evaluating Stakeholders’ Performance of ERP Systems in Saudi Arabia Higher Education
Mona Althonayan
Amaratunga, M. and Baldry, D. (2002) ‘Moving from performance measurement
to performance management’, Facilities, 20 (5/6), pp.217 – 223.
Amoli, J. E. and Farhoomand, A. (1996) ‘A structural model of end user
computing satisfaction and user performance’ Information &Management, 30, pp.
65-73.
Argyropoulou, M., Ioannou, G., Soderquist, K. E. and J. Motwani, (2008)
‘Managing ERP system evaluation and selection in SMEs using the six-
imperatives methodology’, International Journal of Procurement Management, 1
(4), pp. 430-452.
Avison, D. and Elliot, S. (2006) ‘Scoping the discipline of information systems’,
in king, J., Lyytinen, K. Information System the state of the field. London: John
Wiley & Sons Ltd.
Avison, D. and Pries, J. (2005) Research in information systems: A handbook for
research supervisor and their students. Elsevier Butterworth-Heinemann.
Au, N. Ngai E. and Cheng, T.C. ‘(2002) ‘A Critical review of end-user
information system satisfaction research and a new framework’, Omega, 30 (6),
pp. 451-478.
Au, N. Ngai E. and Cheng, T.C. (2008) ‘Extending the understanding of end user
information systems satisfaction formation: An equitable needs fulfilment model
approach’, MIS Quarterly. 32 (1), pp. 43-66.
Bailey, J. and Pearson, S. (1983) ‘Development of a tool for measuring and
analysing computer user satisfaction’, Managements science, 29 (5), pp. 530-545.
Bakry, A. and Bakry, S. (2005) ‘Enterprise resource planning: a review and a stop
view’, International journal of network management, 15, pp. 363-370.
Ballantine, J., Bonner, M., Levy, M., Martin, A., Munro, I. and Powell, P.L.
(1996) ‘The 3-D model of information systems success: the search for the
Dependent variable continues’, Information Resource Management Journal, 9 (4),
pp.5-14.
Ballejos, L. and Montagna, J.M. (2008) ‘Method for stakeholder identification in
inter organisational environments’, Requirements Engineering, 13, pp. 281-297.
Beatty, R. and Willams, C. (2006) ‘ERP II: Best practices for successfully
implementation an ERP upgrade’, Communications of the ACM - Self managed
systems CACM, 49 (3), pp.105-109.
Beaudry, A. and Pinsonneault, A. (2005) ‘Understanding user Responses to
information technology: A coping Model of user adoption’, MIS Quarterly, 29 (3),
pp. 493-524.

References 264
Evaluating Stakeholders’ Performance of ERP Systems in Saudi Arabia Higher Education
Mona Althonayan
Beheshti, H. (2006) ‘What mangers should know about ERP/ERPII’, Management
Research News, 29 (4), pp. 184-193.
Beheshti, H.M. and Beheshti, C.M. (2010) ‘Improving productivity and firm
performance with enterprise resource planning’, Enterprise Information Systems,
4, (4), pp. 445-472
Benbasat, I., Goldstein, D. and Mead, M. (1987) ‘The case research strategy in
studies of information systems’, 11 (3), MIS Quarterly, pp.369-386.
Benbasat, I. and Weber, R. (1996) ‘Research commentary: rethinking “diversity”
in information systems research’, Information System Research, 7 (4), pp.389-399.
Beretta, S. (2002) ‘Unleashing the integration potential of ERP systems. The role
of process- based performance measurement systems’. Business Process
Management Journal, 8 (3), pp. 254-277.
Bernstein, S. and Bernstein, R. (1999) Elements of Statistics II: Inferential
Statistics. Schaum's Outline Series, New York: McGraw-Hill.
Bernrider, E., (2008) ‘IT governance for enterprise resource planning supported by
the Delone- McLean model of information systems success’, Information &
Management, 45, pp. 257-269.
Bititci, U. and Turner, T. (2000) ‘Dynamic of performance measurement systems’,
Information Journal of Operations& Production Management, 20 (6), pp. 692-
704.
Bititci, U. S., Carrie, A. S. and McDevitt, L. (1998) ‘Integrated performance
measurement systems: a development guide’, International Journal of Operations
and Production Management, 17, pp.522–534.
Bititci, U.S. (1997) Integrated performance measurement systems: a reference
model. In Proceeding of the IFIPWG 5.7 Conference on Organising, the Extended
Enterprise, Ascona, Switzerland, pp. 15–16.
Bititci, U.S. and Carrie, A.S. (1998), ‘Integrated performance measurement
systems: structures and relationships’, EPSRC Research Grant Final Report,
Engineering and Physical Sciences Research Council, Swindon, UK.
Bologa, A., Muntean, M., Sabau, G. and Scorta, I. (2009) ‘Higher education ERPs:
Implementation factors and their interdependencies’, WSEAS Transaction on
Computers, 8 (4), pp.651- 660.

References 265
Evaluating Stakeholders’ Performance of ERP Systems in Saudi Arabia Higher Education
Mona Althonayan
Boonstra, A. (2006) ‘Interpreting an ERP- Implementation project from a
stakeholder perspective’, International journal of project management, 24, pp.38-
52.
Boonstra, A. (2009) ‘Identifying and managing stakeholders in enterprise
information system project’, International Journal of Enterprise Information
systems, 5 (4), pp.1-16.
Boudreau, M. and Robey, D. (1996) ‘Coping with contradictions in business
process re-engineering’, Information Technology & People, 9 (4), pp.40- 57.
Blyth, A. (1999) ‘Using stakeholders, domain knowledge, and responsibility to
specify information systems’ requirement’, Journal of Organisational Computing
and Electronic , 9 (4), pp. 287-296.
Bradley, J. and Lee, C. (2007) ‘ERP training and user satisfaction: A case study’,
Journal of Enterprise Information Systems, 3 (4), pp. 33-50.
Braun, V. and Clarke, V. (2006) ‘Using thematic analysis in psychology’,
Qualitative Research in Psychology, 3, pp.77-101.
Bryman, A. (2011) Business research methods. 3rd
edn. Oxford: Oxford University
Press.
Bryman, A. and Bell, E. (2007) Business research methods. 2nd
edn. Oxford:
Oxford University Press.
Chae, B. and Poole, M. (2005) ‘Enterprise system development in higher
Education’, Journal of Cases on Information Technology, 7 (2), pp. 82-101.
Calisir, F. and Calisir, F. (2004) ‘The relation of interface usability characteristics,
perceived usefulness, and perceived ease of to end user satisfaction with enterprise
resource planning (ERP) systems’, Computer in Human Behaviour, 20, pp.505-
515.
Cameron, B. (2008) ‘Enterprise systems education: new direction &challenges for
the future’, SIGMIS CPR '08 Proceedings of the 2008 ACM SIGMIS CPR
conference on Computer personnel doctoral consortium and research, pp.119-
126.
Chand, D., Hachey, G., Hunton, J., Owhoso, V. and Vasudevan, S. (2005) ‘A
balanced scorecard based framework for assessing the strategic impact of ERP
system’, Computer industry, 56, pp. 558-572.
Chang, H. H. (2008) ‘Intelligent agent’s technology characteristics applied to
online auction’ task: A combined model of TTF and TAM’, Technovation, 28, pp.
564-577.

References 266
Evaluating Stakeholders’ Performance of ERP Systems in Saudi Arabia Higher Education
Mona Althonayan
Chang, J. and King, W. (2005) ‘Measuring the performance of information
systems: A functional scorecard’, Journal of Management I information System,
22 (1), pp. 85-115.
Chang, M., Cheung, W., Cheng, C. and Yeung, J. (2008) ‘Understanding ERP
system adoption from the user’s perspective’, international journal production
economies, 113, pp.928- 942.
Chawla, A. and Kelloway, E.K. (2004) ‘Predicating openness and commitment to
change’, The Leadership & Organizational Development Journal, 25 (6), pp.485-
498.
Checkland, P. (1981) Systems Thinking, Systems Practice, Chichester: John Wiley.
Chen, W. and Hirschheim, R. (2004) ‘A paradigmatic and methodological
examination of information systems research from 1991 to 2001’, Information
systems journal, 14, pp.197-235.
Chen, S-G. and Lin, Y-K., (2008) ‘An Evaluation method for enterprise resource
planning systems’, Journal of the Operations Research Society of Japan, 51 (4),
pp. 299-309.
Chien, S. and Hu, C. (2009) ‘The moderating effect of employee computer self-
efficacy ERP competence constructs and ERP Effectiveness’, Journal of
Electronic commerce in organisation, 7 (3), pp. 59-85.
Chien, S. and Tsaur, S. (2007) ‘Investigating the success of ERP systems: Case
studies in three Taiwanese high-tech industries’, Computers in Industry, 58,
pp.783-793.
Chin, W., Jonson, N. and Schwarz, A. (2008) ‘A fast form approach to measuring
technology acceptance and other constructs’, MIS Quarterly, 32 (4), pp. 687- 703.
Conrath, D.W. and Mignen, O. P. (1990) ‘What is being done to measure user
satisfaction with EDP/MIS’, Information & Management, 19 (1), pp. 7-19.
Church, A. H. and Bracken, D.W. (1997) ‘Advancing the State of the Art of 360-
Degree Feedback’, Journal of Applied Psychology, 27 (11), pp. 983-1020.
Creswell, J., Clark, V., Gutmann, M. and Hanson, W. (2003) Advanced Mixed
Method Design. London: SAGE Publication Ltd.
Creswell, J. (2009) Research Design: Qualitative, Quantitative, and Mixed
Methods Approach. 3rd
edn. London: SAGE Publication Ltd.

References 267
Evaluating Stakeholders’ Performance of ERP Systems in Saudi Arabia Higher Education
Mona Althonayan
Cyert, R.M. and March, J.G. (1963) A behavioural theory of the firm. Englewood
Cliffs, NJ: Prentice-Hall. A behavioural theory of the firm. Englewood Cliffs, NJ:
Prentice-Hall.
Darmawan, I.G.N. (2001) ‘Adoption and implementation of information
technology in Bali’s government : A comparison between single level path
analyses using PLSPATH 3.01 and Amos4 and Multilevel Path Analyses using
MPLUS2.01’, International education journal, 2 (4), pp.100-125.
Delone, W.H. and Mclean, E.R. (1992) ‘Information systems success: The quest
for the dependent variable’, Information systems research, 3 (1), pp.60-95.
Delone, W. H. and Mclean, E.R. (2003) ‘The Delone and Mclean model of
information systems success: A ten- year update’, Journal of management
information systems, 19 (4), pp.9-30.
Dent, E. B. and Goldberg, S.G. (1999) ‘Challenging resistance to change’, Journal
of Applied Behavioural Science, 35, pp.24-41.
Denzin, N. and Lincoln, Y. (1998) Collecting and Interpreting Qualitative
Materials. London: SAG Publications Ltd.
Denzin, N. and Lincoln, Y. (2005) The SAGE handbook of qualitative research.
3rd
edn. London: SAG Publications Ltd.
Devers, K. J. (1999) ‘How will we know "good" qualitative research when we see
it? Beginning the dialogue in health services research’, Health Service Research,
34(5-2) pp. 1153–1188.
Dishaw, M.T., Strong D. M. and Bandy, D.B. (2002) ‘Extending the task
technology fit model with Self-Efficacy Constructs’, Eighth Americas Conference
on Information Systems, pp. 1021-1027.
Dishaw, M.T. and Strong, D. M. (1999) ‘Extending the technology acceptance
model with task – technology fit constructs’, Information &Management, 36, pp.9-
21.
Dishaw, M., Strong, D. and Bandy, D. (2004) ‘The impact of task technology fit in
technology acceptance and utilization model’, The tenth American conference on
information systems, pp.3306-3311.
Dixon, J.R., Nanni, A.J. and Vollmann, T.E. (1990) The New Performance
Challenge: Measuring Operations for World Class Competition. Homewood, Ill,
Dow Jones-Irwin.

References 268
Evaluating Stakeholders’ Performance of ERP Systems in Saudi Arabia Higher Education
Mona Althonayan
Doll, W., Deng, X. and Raghunathan, T.S. (2004) ‘The meaning and Measuring of
User Satisfaction: A multi group Invariance Analysis of the end user Computing
Satisfaction Instrument’, Journal of Management Information Systems, 21 (1), pp.
227-262.
Doll, W. and Torkzadeh, G. (1988) ‘The measurement of end user computing
satisfaction’, MIS Quarterly. 12 (2), pp. 250-273.
Doll, W. and Torkzadeh, J. (1991) ‘The measurement of end-user computing
satisfaction: theoretical and methodological issues’, MIS Quarterly, 15 (1), pp. 5-
10.
Dytham, C. (2003) Choosing and Using Statistics - A Biologist's Guide. 2nd
edn.
Blackwell Publishing.
Eerde, W. and Thierry, H. (1996) ‘Vroom’s expectancy model and work-related
criteria: A meta-analysis’, Journal of Applied Psychology, 81, pp. 575-586.
Eden, C. and Heijden, K.V. D. (1993) ‘The relationship between stakeholder
Analysis and Scenario Planning’, (Paper presented in the strategy seminar, at the
London School of Economics), Strathclyde Business School.
Elmes, M., Strong, D. and Volkoff, O. (2005) ‘Panoptic empowerment and
reflective conformity in enterprise systems- enabled organisations, Information
and organisations, 15, pp.1-37.
Esteves, J. and Pastor, J. (2001) ‘Enterprise resource planning systems research:
an annotated bibliography’, Communication of the Association Information
Systems, 7 (8), pp.1-52.
Farbey, F., Land, L. and Targett, D. (1992) ‘Evaluating investments in IT’,
Journal of Information Technology, 7, pp.109–122.
Farbey, B., Land, F. and Targett, D. (1993) How to Assess Your IT Investment.
Oxford: Butterworth-Heinemann Ltd.
Farbey, B., Land, F. and Targett, D. (1999) ‘Moving IS evaluation forward:
learning themes and research issues’, Journal of Strategic Information System, 8,
pp.189-207.
Fink, A. and Kosecoff, J. (1985) How to Conduct Surveys: A Step-by-Step Guide.
Beverly Hills, CA: SAGE Publications Ltd.
Finney, S. and Corbett, M. (2007) ‘ERP implementation a compilation and
analysis of critical success factors’, Business Process Management Journal, 13
(3), pp. 329-347.

References 269
Evaluating Stakeholders’ Performance of ERP Systems in Saudi Arabia Higher Education
Mona Althonayan
Freeman, W.R. (1984) Strategic management: a stakeholders approach. Poston:
Pitman Marshfield.
Freeman, R. E. (2001) ‘Stakeholder theory of the modern corporation’, in
Hoffman, W.M., Frederick, R.E., and Schwartz, M.S. (eds.) Business Ethics:
Readings and Cases in Corporate Morality Fourth Edition, McGraw Hill, Boston.
Flick. (2009) An Introduction to qualitative research. 4th
edn. London. SAGE
Publication Ltd.
Fowler, A. and Gilfillan, M. (2003) ‘A framework for stakeholders Integration in
higher education information system projects’, Technology Analysis & Strategic
Management, 15 (4), pp. 467-489.
Fraser, C. and Fraser, A. (2003) ‘Investigating the effectiveness of mangers
through an analysis of stakeholder perceptions’, Journal of Management
Development, 22 (9), pp.762-783.
Gable, G., Sedera, D. and Chan, T. (2003) ‘Enterprise systems success: a
measurement model’, twenty forth international conference of information
systems, pp.576-591.
Gable, G. (1994) ‘Integrated case study and survey research methods: An example
in information systems’, European journal of information systems, 3 (2), 112-126.
Gable, G., Scott, J.E. and Davenport, T.D. (1998) Cooperative ERP Life-cycle
Knowledge Management. 9th Australasian Conference on Information Systems,
29 September - 2 October, Sydney.
Gable, G., Sedera, D. and Chan, T. (2008) ‘Re-conceptualizing information system
success: The IS -impact measurement model’, Journal of the Association for
Information Systems. 9 (7), pp. 376-408.
Galliers, R. (1992) Information Systems Research. Issues, Methods, and Practical
Guidelines. Oxford: Blackwell science Publication.
Gargeya, V. B. and Brady, C. (2005) ‘Success and failure factors of adopting SAP
in ERP system implementation’, Business Process Management Journal, 11 (5)
pp. 501-516.
Gattiker, T. and Goodhue, D. (2005) ‘What happens after ERP implementation:
understanding the impact of inter-dependence and differentiation on plant level
outcome’, MIS Quarterly, 29 (3), pp.559-585.
Gebauer, J. and Schober, F. (2006) ‘Information system flexibility and the Cost
Efficiency of Business Process’, Journal of the Association for information
System, 7 (3), pp. 122-147.

References 270
Evaluating Stakeholders’ Performance of ERP Systems in Saudi Arabia Higher Education
Mona Althonayan
Gebauer, J. and Lee, F. (2008) ‘Enterprise system flexibility and implementation
Strategies: aligning theory with evidence from a case study’, Information System
Management, 25, pp. 71-82.
Gerring, J. (2004) ‘What is the Case study and what is it good for?’, American
political science review, 98 (2), pp341-354.
Genoulaz, V. B., Millet, P-A. and Grabot, B. (2005) ‘A survey on the recent
research literature on ERP system’, Computer in Industry, 56, pp. 510-522.
Giff, S. (2009) ‘ERP customization as software engineering: Knowledge Sharing
and cooperation’, IEEE software, 26 (6), pp. 41- 47.
Globerson, S. (1985) ‘Issues in developing a performance criteria system for an
organisation’, International Journal of Production Research, 23 (4) pp.639-646.
Gong, Y. and Janssen, M. (2010) ‘Measuring process flexibility and agility’,
ICEGOV '10 Proceedings of the 4th International Conference on Theory and
Practice of Electronic Governance, October, Beijing, China, pp. 173-182.
Googhue, D. (1998) ‘Development and measurement validity of a Task
technology fit Instrument for user evaluations of Information systems’, Decision
Sciences, 29 (1) pp.105- 138.
Googhue, D., Klein B. and March, T. (2000) ‘User evaluation of IS surrogates for
objective performance’, Information and Management, 38, pp.87-101.
Googhue, D. (1995) ‘Understanding user evaluation of information systems’,
Management science, 41(12) pp. 1827- 1995.
Googhue, D., Thompson, R. (1995) ‘Task – technology Fit and individual
Performance’, MIS Quarterly, 19 (2), pp.213-236.
Goodpaster, K. (1993) ‘Business ethics and stakeholder analysis’, in Winkler, E.
and Coombs, J. (Eds.) Applied Ethics: A Reader, Oxford: Blackwell. pp. 229-48.
Gros, C., Mueller, H. and Lovis, C. (2005) ‘Evaluating user interaction with
clinical information systems: A model based on human computer interaction
models’, Journal of Biomedical informatics, 38, pp.244-255.
Guba, E. and Lincoln,Y. (1994) ‘Competing paradigms in qualitative research’,
research. In Denzin, N. K. and Lincoln, Y. S. (Eds.), Handbook of qualitative
research, (pp. 105-117) Thousand Oaks. CA: SAGE Publication Ltd.
Haab, M. and Surry, D. (2009) Implementation of ERP system in higher education.
Verlag: VDM Publishing House Ltd.

References 271
Evaluating Stakeholders’ Performance of ERP Systems in Saudi Arabia Higher Education
Mona Althonayan
Hagood, W. and Friedman. L. (2002) ‘Using the balanced scorecard to measure
the performance of your HR information Systems’, Public Personnel
Management, 31 (4), pp. 543-557.
Hayes, R. and Utecht, K. (2009) ‘Enterprise resource planning implementation in
an institution of higher education learning: A case study of Drummond
University’, Journal of cases on Information Technology, 11 (2), pp. 42-55.
Helo, P. (2008) ‘Expectation and reality in ERP implementation: consultant and
solution provider perspective’, Industrial Management & Date systems, 108 (8),
pp.1045-1059.
Helo, P., Anussornnitisarn, P. and Phusavat, K. (2008) ‘Expectation and reality in
ERP implementation: consultant and solution provider perspective’, Industrial
Management & Data Systems, 108 (8), pp. 1045-1059.
Heo, J. and Han, I. (2003) ‘Performance measure of information systems (IS) in
evolving computing environments: an empirical investigation’, Information &
Management, 40, pp. 243- 256.
Hirschheim, R.A. (1991) ‘Information systems epistemology: An historical
Perspective’, in Galliers, R. Information Systems Research. .Oxford: Blackwell
Scientific Publications.
Hirschheim, R., and Klein, H. (1994) ‘Realizing emancipatory principles in
information systems development: the case for ETHICS’, MIS Quarterly, 18, (1),
pp.83-109.
Hirschheim, R. and Smithson, S. (1999) ‘Evaluation of information systems: a
critical assessment’. In: Willcocks, Leslie P. and Lester, Stephanie, (eds.) Beyond
the IT productivity paradox, Wiley series in information systems. John Wiley &
Sons Ltd., West Sussex, UK, pp. 381-410. ISBN 9780471986928.
Holsapple, C., Wang, Y.-M. and Wu, J.-H. (2005) ‘Empirically testing user
characteristics and fitness factors in enterprise resource planning success’,
international journal of human computer interaction, 19 (3), pp. 323-342.
Hong, K-K. and Kim, Y-G. (2002) ‘The critical success factors for ERP
implementation: an organizational fit perspective, Information & Management, 40
(1), pp.24- 40.
Howcroft, D., Newell, S. and Wagner, E. (2004) ‘Understanding the contextual
influences on enterprise system design, implementation, use and evaluation’,
Journal of Strategic Information Systems, 13 (4), pp. 271-7.
References 272
Evaluating Stakeholders’ Performance of ERP Systems in Saudi Arabia Higher Education
Mona Althonayan
Hsu, L., Lai, R. and Weng, Y. (2008) ‘Understanding the critical effect user
satisfaction and impact of ERP through innovation of diffusion theory’,
International journal technology management, 43 (1-3), pp. 30- 47.
Huq, Z., Huq, F. and Cutright, K. (2006) ‘BPR through ERP: Avoiding change
management pitfalls’, Journal of Change Management, 6 (1), pp.67-85.
Ifinedo, P., and., Nahar, N. (2006) ‘Do top and mid- level managers view
Enterprise Resource Planning (ERP) systems success measures differently’,
International Journal Management and Enterprise Development, 3 (6), pp. 618-
635.
Ifinedo, P. and Nahar, N. (2007) ‘ERP systems success: an empirical analysis of
how two organisational stakeholder groups prioritize and evaluate relevant
measures’, Enterprise information systems, 1 (1), pp. 25-48.
Introna, L. (1997) Management, Information and Power: A Narrative of the
Involved Manager. London: Macmillan.
Irani, Z., Sharif, A., Love, P. and Kahraman, C. (2002) ‘Applying concepts of
fuzzy cognintive mapping to model: The IT/IS investment evaluation process’,
International Journal of Production Economics, 75 (1/2) pp.199-211.
Irani, Z., Sharif1, A., and Love, P. (2005) ‘Linking knowledge transformation to
Information Systems evaluation’, European Journal of Information Systems, 14,
pp.213–228.
Irani, Z. and Love, P. (2008) Evaluating Information System: Public and Private
Sector. Oxford: Butterworth-Heinemann.
Irani, Z. (1998) Investment Justification of Information Systems: A focus on the
evaluation of MRP11, a thesis submitted for the degree of doctor of philosophy.
Islam, R. and Rasad, S. (2005) ‘Employee performance evaluation by AHP: a case
study’, Asia Pacific Management Review, 11 (3), 163-176.
Ives, B. Olson, M., and Baroudi, J. (1983) ‘The measuring of user information
satisfaction’, Communications of the ACM, 26 (10), pp. 785-793
Johnson. R.B., Onwuegbuzie, A.J. and Turner, L. (2007) ‘Toward a definition of
mixed methods research’, Journal of Mixed Methods Research, 1 (2), pp. 112-133.
Jones, S. (2008) ‘Social dimension of IT/IS evaluation: views from the public
sector’, In Irani, Z. and Love, P. (2008) evaluating information systems, public
and private sector. Oxford: Butterworth-Heinemann is imprite of Elsevier, pp.
236-256.

References 273
Evaluating Stakeholders’ Performance of ERP Systems in Saudi Arabia Higher Education
Mona Althonayan
Jones, T. M. (1995) ‘Instrumental stakeholder Theory A synthesis of Ethics and
Economics’, Academy of Management Review, 20 (2), pp. 404-437.
Jorgenson, D.W., Ho, M. S. and Stiroh, K. J. (2004) ‘Growth of U.S. Industries
and Investments in Information Technology and Higher Education’, Forthcoming
in Corrado, C., Haltiwanger, J. and Sichel, D. Measuring Capital in a New
Economy, Chicago, University of Chicago Press.
Kaplan, B. and Duchon, D. (1988) ‘Combining qualitative and quantitative
Methods in Information Systems Research: A case study’, MIS Quarterly, 12 (4),
pp. 571-586.
Kaplan, B. and Maxwell, J. (2005) ‘Qualitative research methods for evaluating
computer information systems’, in evaluating the organisation impact of the
healthcare information system, part 1, pp. 30-55.
Kaplan, B. and Cincinnati, U. (1988) ‘Combining qualitative and quantitative
methods in information systems research: a case study’, MIS Quarterly, 12 (4),
pp.571-586.
Kaplan, B. and Maxwell, J.A., (1994) ‘Qualitative research methods for evaluating
computer information systems’, in Anderson, J.G., Aydin, C.E. and Jay S.J.
Evaluating Health Care Information Systems: Methods and Applications, (eds),
CA: SAGE Publication Ltd, pp.45-68.
Kaplan, R. and Norton, D.P. (1996), The balanced scorecard: translating Strategy
into Action. Boston: Harvard Business School Press.
KAUST, 2012, available at:
http://www.kaust.edu.sa/research/management.html
Kelle, U. (2006) ‘Combining qualitative and quantitative methods in research
practice: purposes and advantages’, Qualitative Research in Psychology, 3, pp.
293-311.
KFU of P&M feedback, 2012, available at:
http://feedback.kfupm.edu.sa/FS/nsurvey.aspx?surveyid=999ea5482ce42a293bd42
43c744f5ce
Khalifa, G., Irani, Z., Balddwin, L. and Jones, S. (2001) ‘Evaluating information
technology with you in mind’, Journal of Information Systems Evaluation, 4 (1),
pp.1-26.
King Abdulaziz University, 2012, available at:
http://www.kau.edu.sa/content.aspx?site_id=0&lng=AR&cid=104133
References 274
Evaluating Stakeholders’ Performance of ERP Systems in Saudi Arabia Higher Education
Mona Althonayan
King, P., Kvavik, R. B. and Voloudakis, J. (2002) Enterprise resource planning
systems in higher education (ERB0222) Boulder, CO: EDUCAUSE Center for
Applied Research (ECAR).
Kim, Y., Lee, Z. and Gosain, S. (2005) ‘Impediments to successful ERP
implementation process’, Business Process Management Journal, 11 (2), pp.158-
170.
Kittner, M. and Slyke, C. (2000) ‘Reorganizing information technology service in
an academic environment’, Annals of cases on information technology
applications and management in organizations, IDEA group publishing, 2, pp.124.
Kitto, S. and Higgins,V. (2010) ‘Working around ERP in Technological
Universities’, Science, Technology & Human Values,35 (1), pp. 29-54.
Klein, K. K. and Myers, M. D. (1999) ‘A Set of Principles for Conducting and
evaluating Interpretive Field Studies in Information Systems’, MIS Quarterly, 23
(1), pp. 67-94.
Klaus, H., Rosemann, M. and Gable, G. (2000) what is ERP? Information Systems
Frontiers, 2 (2), pp. 141‐162.
Kominis, G. and Emmanuel, C. (2007) ‘The expectancy-valence theory
developing an extended Model of managerial motivation’, Management
Accounting Research, 18, pp. 49-75.
Kompiera, M.A., Cooper, C.L. and Geurts, S.A. (2000) ‘A multiple case study
approach to work stress prevention in Europe’, European Journal of Work and
Organizational Psychology, 9 (3), pp. 371-400.
Kositanurit, B., Ngwenyama,O. and Bryson, K-M. (2006) ‘An exploration of
factors that impact individual performance in an ERP environment: an analysis
using multiple analytical techniques’, European journal of Information Systems,
15, pp. 556-568.
Kwahk, K-Y. and Ahn, H. (2010) ‘Moderating effects of localization difference on
ERP use: A socio-technical systems perspective’, Computers in Human
Behaviour, 26, pp.186-198.
Kwahk, K-Y. and Lee, J-N. (2008) ‘The role of readiness for change in ERP
implementation:Theoretical bases and empirical validation’, Information &
Management, 45 (7), pp.474- 481.
Kvavik, R., Katz, R., Beecher, K., Caruso, J., king, P., Voloudakis, J. and
Williams, L. (2004) ‘The Promise and Performance of Enterprise Systems for

References 275
Evaluating Stakeholders’ Performance of ERP Systems in Saudi Arabia Higher Education
Mona Althonayan
Higher Education’, research study from the EDUCUSE Canter for Applied
Research, 4, pp.5-85.
Kvavik, R.B., Katz, R.N., Beecher, K., Caruso, J., King, P., Voloudakis, J. and
Williams, L.A. (2002) ‘The promise performance of enterprise systems for higher
education’, Educause Centre for Applied Research, 4, pp. 10.
Land, F.F. (1992) ‘The information systems domain’, in R. Galliers. Information
Systems Research: Issues, Methods, and Practical Guidelines. Oxford: Blackwell
Scientific Publications.
Land, F.F. (2001) IS evaluation: Recent trends, Keynote speech, NUKAIS
Information systems evaluation seminar, priestly Hall, Leeds Metropolitan
university, 27th
February, 2001.
Laframbosie, K. and Reyes, F. (2005) ‘Gaining competitive advantage from
integrating enterprise resource planning and total quality management’, The
Journal of Supply Chain Management, 41 (3), pp. 49-64.
Lansbury, R., (1988) ‘Process management: A process Approach’, Human
Resource Austria, pp. 46-54.
Lassila, K.S. and Buchner, J.C. (1999) ‘Adoption and utilization of commercial
Software Packages: Exploring Utilization Equilibria, Transitions, Triggers, and
Tracks’, journal of management information systems, 12 (2), pp. 63-90.
Leech, N. L. and Onwuegbuzie, A.J. (2009) ‘A typology of mixed methods
research designs’, Quality & Quantity, 43 (2), pp. 265-275.
Lim, E., Pan, S. and Tan, C. (2005) ‘Measuring user acceptance towards enterprise
resource planning (ERP) systems-understanding the dissonance between user
expectations and managerial policies’, European of journal of information system,
14, pp. 135-149.
Lockwood, G. (1985) ‘Universities as organizations’. In G. Lockwood, and J.
Davies (eds) Universities: The Management Challenge. Windsor: NFER-Nelson
Publishing.
Lin, W.T., Chen, S.C., Lin, M.Y. and Wu, H.H. (2006) ‘A study on performance
of introducing ERP to semiconductor related industries in Taiwan’, International
Journal Advantages Manufacturing Technology, 29, pp. 89–98.

References 276
Evaluating Stakeholders’ Performance of ERP Systems in Saudi Arabia Higher Education
Mona Althonayan
Longinidis, P. and Gotzamani, K. (2009) ‘ERP user satisfaction issues: insights
from a Greek industrial giant’, Industrial Management & Data Systems, 109, (5)
pp.628 – 645.
Low, C. and Ngai, E. (2007) ‘ERP system adoption: An exploratory study of the
organisational factors and impacts of ERP successes’, Information& Management,
44, pp.418-432.
Lupu, A. R., Bologa, Sabau, Gh. and Muntean, M. (2008) ‘The Romanian
Universities in the process of data and information system integration’,
Proceedings of the 7th WSEAS International Conference on Artificial Intelligence,
Knowledge Engineering and Databases (AIKED ‘08) Cambridge, pp.527-532.
Lyytinen K. and Hirscheim, R. A. (1987) ‘Information systems failures: survey
and classification of empirical literature,’ Oxford Surveys in Information Tech, 4,
pp. 257-309.
Mackenzie, K.D. and House, R. (1979) ‘Paradigm development in the Social
Sciences’, in Mowday, R. T. and Steers, R. M. (eds.) Research in Organizations:
Issues and Controversies. CA: Goodyear Publishing, Santa Monica. pp. 22-38.
MADAR system definition, KSU, 2012 available at:
http://erp.ksu.edu.sa/default.aspx
Mahmood, M., Burn, J., Gemoets, L. and Jacquez, C. (2000) ‘Variables affecting
information technology end user satisfaction: a meta- analysis of the empirical
literature’, International Journal Human Computer Studies, 52, pp.751-771.
Marshall, T., Byrd, T., Gardiner, L. and Rainer, R. (2002) ‘Technology acceptance
and performance: An investigation into requisite knowledge’, Information
Resource management, 13 (3), pp. 33-45.
Markus, M.L. and Tanis, C. (2000) ‘The enterprise systems experience-erom
adoption to success’, in Zmud. R.W. Framing the Domains of IT Management:
Projecting the Future Through the Past. Cincinnati, OH: Pinnaflex, pp. 173-207.
Maskell, B. (1989) ‘Performance measures for world class manufacturing’,
Management Accounting, 5, pp. 32-39.
Mason, R. O. (1978) ‘Measuring information output: A communication system
approach’, Information & Management, 1 (5), pp. 219-234.
Mathiassen, L. (2002) ‘Collaborative practice research’, Information Technology
&People, 15 (4), pp. 321-345.

References 277
Evaluating Stakeholders’ Performance of ERP Systems in Saudi Arabia Higher Education
Mona Althonayan
Matin, G. (1979) ‘What is the value of investments in information systems’, MIS
Quarterly, 3 (3), pp. 5-35.
MathWorks Inc. (2012) Introduction to analysis of variance: nonparametric
methods.retrieved:22.05.2012from:
http://www.mathworks.co.uk/help/toolbox/stats/bqttcvf.html#bq72grf-1
McGaughey, R. and Gunasekaran, A. (2007) ‘Enterprise resource planning (ERP):
past, present, and future’, International journal of enterprise information systems,
3 (3), pp.23-35.
McGill, T. and Hobbs, V. (2003) ‘User-developed application and Information
systems Success: A Test of Delone and Mclean’s Model’, Information Resource
Management Journal, 16 (1), pp. 24-45.
Mehlinger, L. (2006) Indicators of successful enterprise technology
implementation in higher education. Morgan University.
Mingers, J. (2001) ‘Combining IS research methods: towards a pluralist
Methodology’, Information Systems Research, 12 (3), pp. 240-259.
Ministry of Saudi Arabian Higher education, 2012, available at:
http://www.mohe.gov.sa/ar/Pages/Budget.aspx .
Miles, M. and Huberman, A. (1994) Qualitative data Analysis: an expanded
Sourcebook. 2nd
edn. London: SAGE Publications Ltd.
Moon, Y. (2007) ‘Enterprise resource planning (ERP): a review of the literature’,
Mechanical and Aerospace Engineering, 4 (3), pp. 235-264.
Moshe, Z. (2003) ‘User satisfaction in ERP system: some empirical evidence’,
Journal of Academic of Business and Economics, 2 (1), pp.1-11.
Motwani, J., Subramanian, R. and Gopalakrishna, P. (2005) ‘Critical factors for
successful ERP implementation: Exploratory Finding from four case studies’,
Computers in Industry, 56, pp. 529-544.
Mumford, E. and Weir, M. (1979) Computer systems in work design-the ETHICS
method: Effective technical and human implementation of computer systems: a
work design exercise book for individuals and groups. London: Associated
Business Press.

References 278
Evaluating Stakeholders’ Performance of ERP Systems in Saudi Arabia Higher Education
Mona Althonayan
Myers, B., Kappelman, .L.A. and Prybutok, V.R. (1997) ‘A comprehensive model
for assessing the quality and productivity of the information systems function:
Toward a theory for information systems assessment’, Information recourses
management journal. 10 (1), pp. 6-25.
Myers, B., Hollan, J. and Cruz, I. (1996) ‘Strategic directions in human-computer
interaction’, Journal ACM Computing Surveys (CSUR), 28 (4), pp. 794 – 809.
Myers, M. and Avison, D. (2002) Qualitative research in information systems.
SAGE Publications Ltd.
Myers, M. (1997) ‘Qualitative research in information systems’, MIS Quarterly,
(21:2), pp. 241–242. MISQ Discovery, archival version.
Nacher, N. (2008) ‘The Mann Whitney U: A test for assessing whether two
independent samples come from the same distribution’, Tutorials in Quantitative
Methods for Psychology, 4 (1), pp. 13-20.
Nah, F., Lau, J. and Kuang, J. (2001) ‘Critical factors for successful
implementation of enterprise systems’, Business Process Re-engineering &
Management Journal, 7 (3), pp.285 - 296.
Neely, A., Gregory, M. and Platts, K. (1995) ‘Performance measurement system
design: A literature review and research agenda’, International Journal of
Operations & Production Management, 15 (4), pp.80 - 116.
Norman, G. (2010) ‘Likert scales, levels of measurement and the ‘‘laws’’ of
statistics’, Advantage in Health Science Education, DOI: DOI 10.1007/s10459-
010-9222-y. Retrieved on 30.05.2012 from:
http://xa.yimg.com/kq/groups/18751725/1039265037/name/Likert%2Bscales,%2
Blevels%2Bof%2Bmeasurement%2Band%2Bthe%2B%25E2%2580%2598%25E
2%2580%2598laws%25E2%2580%2599%25E2%2580%2599.pdf
Norris, D. M. (2003) ‘Value on investment in higher education’, Boulder, COLO.
Educause centre for applied research, research Bulletin, 18.
Nunnally, J. C. (1978) Psychometric theory. New York: McGraw-Hill.
Oates, B. J. (2006) Researching information systems and computing. London:
SAGE Ltd.
References 279
Evaluating Stakeholders’ Performance of ERP Systems in Saudi Arabia Higher Education
Mona Althonayan
Okunoye, A. and Folick, M. (2006) ‘ERP Implementation in higher education: An
Account of Pre- Implementation and implementation Phases’, Journal of cases on
information technology, 8 (2), pp.110- 132.
Orlikowski, W. and Baroudi, J. (1991) ‘Studying information technology in
organizations: research approaches and assumptions’, Information Systems
Research, 2 (1), pp. 1-28.
Pallent, J. (2010) SPSS Survival Manual. 4th
edn. Oxford: McGraw-Hill
Education.
Pallant, J. (2005) SPSS Survival Guide: A step by step guide to data analysis using
SPSS for Windows, Australia: Allen & Unwin.
Park, J., Suh, H. and Yang, H. (2007) ‘Perceived absorptive capacity of individual
users in performance of Enterprise Resource Planning (ERP) usage: the case for
Korean firms’, information and management, 44, pp. 300-312.
Paré, G. (2004)’ Investigating information systems with positivist case studies
research’, Communication of the Association for the Information Systems, 13,
pp.233-264.
Parr, A., and Shanks,G. (2000) ‘A model of ERP project implementation’, journal
of information technology , 15, pp.289-303.
Pegah, k., Pegah, M. and Dillow, T. (2003) ‘Higher education ERP: framework to
Reduce the Pain’, Proceedings of the 31st annual ACM SIGUCCS fall conference,
pp. 86-89.
Peter, L. and Irani, Z. (2004) ‘An exploratory study of information technology
evaluation and benefits management practices of SMEs in the construction
industry’, Information & Management, 42, pp. 227-242.
Petter, S. (2008) ‘Measuring information systems success: models, dimensions,
measures, and interrelationships’, European journal of information systems, 17,
pp.236-263.
Petter, S., Delone W. and McLean, E. (2008) ‘Measuring information systems
success: model, dimension, measures and interrelationships’, European Journal of
Information Systems, 17, pp. 236-263.
References 280
Evaluating Stakeholders’ Performance of ERP Systems in Saudi Arabia Higher Education
Mona Althonayan
Pitt, L., Watson, R. and Kavan, C. (1995) ‘Service quality: a measure of
information systems effectiveness’, MIS Quarterly, 19 (2), pp. 173-187.
Pollock, N. and Cornford, J. (2001) ‘Customising industry standard Computer
systems for universities: ERP systems and the university as a ‘UNIQUE’
Organisation’, Standardization and Innovation in Information Technology, 2001
2nd IEEE Conference, pp.320 – 331.
Pollock, N. and Cornford, J. (2004) ‘ERP System and the university as a ‘unique’
organisation’, Information Technology & People, 17 (1), pp. 31-52.
Pouloudi, A. and Serafeimidis, V. (1999) ‘Stakeholders in information systems
evaluation: experience from a case study’, Proceedings of the 6th European IT
Evaluation Conference, November 4-5th, London, UK, 90 - 98.
Pouloudi, A. and Whitley, E.A. (1997) ‘Stakeholder identification in inter-
organizational systems: gaining insights for drug use management systems’,
European Journal of Information Systems, 6 (1), pp. 1-14.
Pouloudi, A. (1999) ‘Aspects of the stakeholder concept and their implication for
information systems development’, Proceedings of the 32nd Hawaii International
conference on systems science, pp. 1-16.
Preston, L. E. and Sapienza, H. J. (1990) ‘Stakeholder management and corporate
performance’, Journal of Behavioural Economics, 19, pp.361-375.
Rabaa`i, A., Bandara, W. and Gable, G. (2009a) ‘ERP system in the higher
education sector: A descriptive case study’, 20 Australian conference on
information systems, Melbourne. pp. 456-470.
Rabaa`i, A. (2009b) ‘Identifying critical success factors of ERP systems at the
higher education sector’, In ISIICT 2009 : Third International Symposium on
Innovation in Information & Communication Technology, 15 - 17 December,
2009, Philadelphia.
Rabaa'i, A. and Gable, G. (2009c) ‘Extending the IS-Impact model into the higher
education sector’, In ICICS2009: 7th International Conference on Information and
Communications Systems, 7-10 Dec., Macau.
Rai, A., Lng, S. and Welker, R. (2002) ‘Assessing the validity of IS Success
Models: An Empirical Test and Theoretical Analysis’, Information systems
research, 13 (1), pp. 50- 69.

References 281
Evaluating Stakeholders’ Performance of ERP Systems in Saudi Arabia Higher Education
Mona Althonayan
Ray, G., Muhanna, W. and Barney, J. (2005) ‘Information technology and the
performance of the customer service: a resource- based analysis’, MIS Quarterly,
29 (4), pp.625-652.
Robert, B. (2004) ‘The promise and performance of enterprise systems for higher
education’, Research Study from the EDUCUSE Center for Applied
Research.pp.1-7.
Robey, D. (1996) ‘Research commentary: diversity in information systems
research: threat, promise, and responsibility’, Information Systems Research, 7 (4),
pp. 400-408.
Rothenberger, M. and Srite, M. (2009) ‘An investigation of customisation in ERP
system implementation’, IEEE Transaction on Engineering Management, 56,
pp.663-676.
Rosemann, M. and Wiese, J. (1999) ‘Measuring the performance of ERP software:
A balanced scorecard approach’, 10th Australasian Conference on Information
Systems, pp. 773- 784.
Rushinek, A. and Rushinek, S.F. (1986) ‘The influence of troubleshooting,
education, and documentation on computer user satisfaction’, Journals &
Magazines, 16 (1), pp.165-168.
Sabau, G., Munten, M. Bologa, A. and Bologa, R. (2009) ‘An evaluation
framework for higher education ERP Systems’, WSEAS Transaction on Computer,
8 (11), pp. 1790-1799.
Sabherwal, R., Jeyaraj, A. and Chowa, C. (2006) ‘Information systems:
individual and organizational determinants’, Management science, 52 (12),
pp.1849-1882.
Sakris, J. and Sundarraj, R. P. (2000) ‘Factors for strategic evaluation of enterprise
information technology’, International Journal of Physical Distribution
&Logistics Management, 30 (3/4), pp. 196-220.
Sane, V. (2005) ‘Enterprise resource planning overview,’ Ezine articles. Retrieved
Jan 2, 2011, available at:
http://ezinearticles.com/?Enterprise-Resource-Planning-Overview&id=37656.

References 282
Evaluating Stakeholders’ Performance of ERP Systems in Saudi Arabia Higher Education
Mona Althonayan
SAP news, 2012, available at:
http://sap-news.tmcnet.com/news/2011/05/17/5514769.htm
SAP news, 2012, available at:
http://www.sap.com/mena/services/universityalliances/index.epx
Sarantakos, S. (2005) Social Research. 3rd
edn. Plgrave :Macmillan.
Saudi Arabia of Minister of civil service, 2012, available at:
http://www.mcs.gov.sa/_layouts/mocs/intro/intro.htmI
Saudi Arabian Higher Education Board, 2007, 2012, available at:
http://www.imamu.edu.sa/mangment_of_univirsity/University_Council/Pages/the
_system_of_higher%20education.aspx
Saunders, C. and Jones, J. (1992) ‘Measuring performance of the information
systems function’, Journal of Management Information System, 8 (4), pp. 63-82.
Seddon, P. (1997) ‘A specification and extension of the Delone and Mclean of IS
success’, Information systems research, 8 (3), pp.240-253.
Seddon, B., Graeser, V. and Willcocks, L. (2002) ‘Measuring organizational
effectiveness: IS an overview and update of senior management perspectives’,
Data base for advances in information systems, 33 (2), pp. 11-28.
Sedera, D., Gable, G. and Chan, T. (2003) ‘Measuring enterprise system success:
A preliminary model’, Ninth Americas Conference on Information Systems
(AMCIS), pp.476-485.
Seddon, P. (1999) ‘Dimension of information systems success”, Communication
of the Association for Information Systems, 2 (20), pp. 2-60.
Seddon, P. and Kiew, M. (1994) ‘A partial test and development of Delone and
Mclean’s model of IS success’, Australian Journal of Information Systems, 4 (1),
pp. 90-109.
Sedera, D. Gable, G. (2004) ‘A factor and structural equation analysis of the
enterprise system success measurement model’, Twenty- fifth international
conference on information systems, pp.449-464.
Seng, D. and Leonid, C. (2003) ‘Business Process-Oriented Information Support
for a Higher Education Enterprise’, 7th
Pacific Asia Conference on Information
Systems, 10-13 July 2003, Adelaide, South Australia, pp.1055-1047.

References 283
Evaluating Stakeholders’ Performance of ERP Systems in Saudi Arabia Higher Education
Mona Althonayan
Serafeimidis, V. and Smithson, S. (2000) ‘Information systems evaluation in
practice: a case study of organizational change’, Journal of Information
Technology, 15 (2), pp. 93–106.
Serafeimidis, V. and Smithson, S. (2003) ‘Information systems evaluation as an
organisational institution-experience from a case study’, Information systems
journal, 13, pp. 251-274.
Seth, N. and Deshmukh,S.G. (2005) ‘Service quality modedls: a review’,
international Journal of Quality & Reliability Management, 22 (9), pp.913-949.
Shang, S. and Seddon, P. (2000) ‘A comprehensive framework for classifying
benefits of ERP Systems’, American Conference on Information systems,
(AMCIS), pp. 1005-1014.
Shannon. E. and Weaver, W. (1949) The mathematical theory of communication.
Urbana, IL: University of Illinois Press.
Shaqra University, 2012, available at: http://su.edu.sa/English/Pages/default.aspx
Shehab, E.M., Sharp, M.W., Suprmaniam, L. and Spedding, T.A. (2004)
‘Enterprise resource planning. An integrative review’, Business Process
Management, 10 (4), pp. 359-386.
Skok, K. and Legge, M. (2002) ‘Evaluating enterprise resource planning
(ERP) systems using an Interpretive Approach’, Knowledge and Process
Management, 9 (2), pp. 72–82
Smitha, C.D. and John T. Mentzer, J.T. (2010) ‘Forecasting task-technology fit:
The influence of individuals, systems and procedures on forecast performance’,
International Journal of Forecasting, 26, pp.144–161
Soja, P. (2006) ‘Success factors in ERP systems Implementations: lessons from
practice’, Journal of Enterprise Information Management, 19 (6), pp. 646-661.
Somers, T., Nelson, K. and Karimi, J. (2003) ‘Confirmatory factors analysis of the
end user computing satisfaction instrument: replication within an ERP domain’,
Decision Sciences, 34 (3), pp. 595-621.
References 284
Evaluating Stakeholders’ Performance of ERP Systems in Saudi Arabia Higher Education
Mona Althonayan
Somers, T., Nelson, K. and Ragowsky, A. (2000) ‘Enterprise resource planning
(ERP) for the next Millennium: development of an integrative framework and
implications for research’, American Conferences on Information Systems
(AMCIS), pp. 998-1004.
Somers, T. and Nelson, K. (2004) ‘A taxonomy of players and activities across the
ERP project life cycle’, Information &Management, 41, pp. 257- 278.
Son Yu, C. (2005) ‘Causes influencing the effectiveness of the post-
implementation ERP system’, Industrial Management & Data Systems, 105 (1),
pp.115 - 132.
Spathis, C. and Ananiadis, J. (2005) ‘Assessing the benefits of using an enterprise
system in accounting information and management’, The Journal of Enterprise
Information Management, 18 (2), pp.195-210.
Spathis, C. and Ananiadis, J. (2005) ‘Assessing the benefits of using an enterprise
system in accounting information and management’, Journal of Enterprise
Information Management, 18 (2), pp.195 - 210.
Stensrud, E. and Myrtveit, I. (2003) ‘Identifying high performance ERP projects’,
Journals & Magazines, 29 (5), pp. 398 - 416.
Stoak, S. and William, J. (1992) ‘Measuring performance of the information
systems function’, Journal of management information systems, 8 (4), pp. 63- 82.
Stockdale, R. and Standing, C. (2006) ‘An interpretive approach to evaluating
information systems: A content, context, process framework’, European Journal
of Operation Research, 173, pp.1090-1102.
Stockdale, R., Standing, C., Love, P. and Irani, Z. (2008) ‘Revisiting the content
and process of IS evaluation’, in Irani, Z. and Love, P. Evaluating Information
Systems: Public and Private sector. London: Elsevier Ltd, pp. 35-48.
Strong, D. and Volkoff, O. (2010) ‘Understanding organisation- enterprise system
Fit: A Path to Technology Artifact’, MIS Quarterly, 34 (4), 731- 755, pp.731-756.
Swartz, D. and Orgill, K. (2000) ‘Higher education ERP: lessons learned’,
EDUCAUSE 2000 in Nashville, pp. 1-12.

References 285
Evaluating Stakeholders’ Performance of ERP Systems in Saudi Arabia Higher Education
Mona Althonayan
Tabachnick, B. G. and Fidell, L. S. (2001) Using multivariate statistics. 4th
edn.
Needham Heights, MA: Allyn & Bacon.
Tashakkori, A. and Teddlie, C. (2003) ‘The past and future of mixed methods
research: From data triangulation to mixed model designs’. In Tashakkori, A. and
Teddlie, C. Handbook of mixed methods in social and behavioural research.
Thousand Oaks, CA: SAGE Publication Ltd. pp. 671-702.
Teddlie, C. and Yu, F. (2007) ‘Mixed methods sampling a typology with
examples’, Journal of Mixed Methods Research, 1 (1), pp. 77-100.
Teddlie, C. and Tashakkori, A. (2006) ‘A general typology of research designs
featuring mixed’, Research in the School, (1), pp. 12-28.
Teijlingen, E. and Hundley, V. (2001) ‘The importance of pilot studies’,
department of sociology, social research update, University of Surrey, 35, pp.1-5.
Thomas, G. (2011) How to do your case study: a guide for students and
researchers. SAGE Publications Ltd.
Torkzadeh, G., Koufterosb, X. and Doll, W. (2005) ‘Confirmatory factor analysis
and factorial invariance of the impact of information technology instrument’,
OMEGA. 33, pp. 107-118.
Torkzadeh, G. and Doll, W.J. (1999) ‘The development of a tool for measuring the
perceived Impact of information technology on work’, OMEGA, 27, pp.327-339.
Tsai, W., Fan, Y., Chou, J. and Yang, C. (2007) ‘The relationship between
implementation variables and performance improvement of ERP systems’,
International journal Managements, 38 (4), pp. 350- 373.
Umble, E., Haft, R. and Umble, M. (2003) ‘Enterprise resource planning:
implementation procedures and critical factors’, European Journal of Operational
Research, 146, pp. 241-257.
Vessey, I., Ramesh, V. and Glass, R. (2002) ‘Research in information systems: An
Empirical study of Diversity in Discipline and its Journal’, Journal of
Management information systems, 19 (2), pp. 129-174.

References 286
Evaluating Stakeholders’ Performance of ERP Systems in Saudi Arabia Higher Education
Mona Althonayan
Wagner, E. and Newell, S. (2004) ‘Best’ for whom? The tension between ‘best
practice’ ERP packages and diverse epistemic cultures in a university context’,
The Journal of Strategic Information Systems, 13 (4), pp. 305-328.
Wagner, E. and Newell, S. (2006) ‘Repairing ERP producing social order to create
a working information system’, Journal of Applied Behavioural Science, 42 (1),
pp. 40-57.
Wang, X. and Huang, J. (2006) ‘The relationships between key stakeholders’
project performance and project success: perception of Chines construction
supervising engineers’, International Journal of Project Management, 24, pp.253-
260.
Walsham, G. (1993) Interpreting Information Systems in Organizations.
Chichester: Wiley.
Walsham, G. (1995) ‘The emergence of interpretivism in IS Research’,
Information Systems Research, 6 (4), pp.376-394.
Waston, E. and Schneider, H. (1999) ‘Using ERP systems in education’,
Communication of the Association for Information Systems, 1 (9), pp. 1-47.
Wei C.- C. (2008) ‘Evaluating the performance of the ERP systems based on the
knowledge of ERP implementation objectives’, The International Journal of
Advanced Manufacturing, 39, pp. 168-181.
Wieder, B., Booth, P., Matolcsy, Z. and Ossimitz, M.L. (2006) ‘The impact of
ERP systems on firm and business process performance’, journal of Enterprise
Information Managements’, 19 (1), pp.13-29.
Wilkes, R. B. and Dickson, G. W., (1987) ‘Assessment of the information systems
organization: An empirical investigation of assessor perspectives’, Proceedings
of8th ICIS Pittsburgh: Pennsylvania, pp.428-441.
Woodroof, J. and Kasper, G. (1998) ‘A conceptual development of process and
outcome user satisfaction’, Information Resources management journal, 11 (2),
pp. 37-43.
Wood, J., Vidgen, R., Wood-Harper, A. and Rose, J. (1995) Business process
redesign: radical change or reactionary tinkering? In Burke, G. and Peppard, J.
(eds), Examining Business Process Re-Engineering: Current Perspectives and
Research Directions. London: Kogan, pp. 245-261.
References 287
Evaluating Stakeholders’ Performance of ERP Systems in Saudi Arabia Higher Education
Mona Althonayan
Wu, J. and Wang, Y. (2006) ‘Measuring ERP Success: The ultimate users’ view’,
International Journal of Operation and Production Management, 26 (8), pp.882-
903.
Wu, J. and Wang, Y. (2007) ‘Measuring ERP Success: The key –users ‘viewpoint
of the ERP to produce a viable IS in the organisation’, Computer in Human
Behaviour, 23, pp.1582-1596.
Yin, R. (2009) Case study research: design and methods, 5th
edn. London: SAGE
Publications Ltd.
Yin, R. (2012) Application case study research.6th
edn. London: SAGE
Publications Ltd.
Yusuf, Y., Gunasekaran A. and Abthorpe, M. (2004) ‘Enterprise information
systems project implementation A case study of ERP in Rolls-Royce’,
International journal Production Economies, 87, pp. 251-266.
Zhang, Z., Lee, M., Hung, P., Zhang, L. and Huang, X. (2005) ‘A framework of
ERP systems implementation success in China: An empirical study’, International
journal production economies, 98, pp. 56-80.
Zhu, Y., Li, Y., Wang W. and Chen, J. (2010) ‘What leads to Post-Implementation
success of ERP? An empirical study of the chinese retail industry’, International
Journal of Information Management, 30, pp. 265-276.
Zigurs, I., & Buckland, B. K. (1998). A theory of task/technology fit and group
support systems effectiveness. MIS Quarterly, 22(3), 313–334.
Zornada, L. and Velkavrh, T.B. (2005) ‘Implementing ERP systems in higher
education institutions’, proceeding from the 27th International Conference on
Information Technology ICTI, Cavtat, Croatia. pp. 1-7

Appendices 288
Evaluating Stakeholders’ Performance of ERP Systems in Saudi Arabia Higher Education
Mona Althonayan
APPENDIX: A
ETHICAL APPROVAL

Appendices 289
Evaluating Stakeholders’ Performance of ERP Systems in Saudi Arabia Higher Education
Mona Althonayan

Appendices 290
Evaluating Stakeholders’ Performance of ERP Systems in Saudi Arabia Higher Education
Mona Althonayan

Appendices 291
Evaluating Stakeholders’ Performance of ERP Systems in Saudi Arabia Higher Education
Mona Althonayan
APPENDIX: B
B1: QUESTIONNAIRE
B2: INTERVIEW FORM

Appendices 292
Evaluating Stakeholders’ Performance of ERP Systems in Saudi Arabia Higher Education
Mona Althonayan
Evaluating the Performance on ERP systems in Saudi Arabia
Higher Education: A stakeholders’ perspective
I have read the information sheet. I agree to participate in the study and give my consent
freely. I understand that the study will be carried out as describe in the information
statement, a copy of which I have retained. I realise that whether or not I decided to
participate is my decision. I have all questions answered to my satisfaction.
Participant name
...................... Signatures
…………….
Date
......................
This study is intends to investigate the impact of ERP systems on the performance of the stakeholders,
in the environment of higher education.
This questionnaire is divided to four sections:
The first section is general information.
The second section is stakeholders’ impact; interviewees are requiring choosing one
answer and giving opinion if required.
The third section is the ERP systems quality; interviewees are requiring choosing one
answer
The fourth section is the technical support; interviewees are requiring choosing one
answer. (Please do not give more than one answer).
The questionnaire is to be filled by the administrative, staff and faculty, who are work on the systems
daily.
Please provide as detail information as possible.
The information provided will be held strictly and confidential.
If you interested in the results of this research, we will be happy to send you a result copy of this
research.
If you have any concerns or complaints regarding the ethical elements of this project please contact
[email protected] or Dr Laurence Brooks, Tel. No. 01895 266010
Your cooperation is highly appreciated.
Please if you have any questions do not hesitate to contact the researcher at
[email protected] or KSA-mobile,0554620396-UK 0044-7729119102
Appendices 293
Evaluating Stakeholders’ Performance of ERP Systems in Saudi Arabia Higher Education
Mona Althonayan
SECTION 2 Stakeholders’ impact:
1-The ERP system have positive impact on the productivity of your job.
2- The ERP system is an important aid to me in the performance of my job.
3- The ERP systems enhance your performance.
4-The ERP system enhances my effectiveness in my job.
5- The Oracle system allows me to accomplish more work than would otherwise
be possible.
6- The ERP system enhances my awareness about the system.
7- The ERP system facilities quick information retrieval.
8- It is easy to detect possible errors in the ERP system.
9- The ERP system helps me to identify problems.
SECTION 1 General Information
I. Name of the university
II. Which ERP system are your
university using?
III. What is your Job title?

Appendices 294
Evaluating Stakeholders’ Performance of ERP Systems in Saudi Arabia Higher Education
Mona Althonayan
10- It is easy with the Oracle system to find solutions to problems.
Please explain in two points how the ERP systems enhance your job performance.
1..................................................................................................................................
2..................................................................................................................................
SECTION 3 system quality:
11- The ERP system provides me with information that I need.
12-The ERP system provides reports that seem to be just about exactly what I
need.
13-The output is presented in a usual format.
14-I can get the information I need in time.
15-I can get data quickly and easily when I need to.
16-I can get the help that I need in accessing and understanding the data.
17- The data would be useful to me is unavailable because I don’t have the right
authorization.
18- It is easy to learn how to use the ERP system that gives me access to data.
Appendices 295
Evaluating Stakeholders’ Performance of ERP Systems in Saudi Arabia Higher Education
Mona Althonayan
19- The ERP system is too inflexible to be able to respond to my need for
changing data.
20- I am not getting as quick a turnaround as I need on requests for new reports or
data.
21- There is not enough training on how to find, understand, access or use
corporate divisional data.
22-The data that I use is accurate enough for my purposes.
23 -When it’s necessary to compare or aggregate data from two or more different
sources there are may be unexpected or difficult inconsistencies.
24- It is difficult or impossible to compare or aggregate data from two different
sources because the data defined differently.
25- I can get data that is current (up to date) enough to meet my needs.
26- It is more difficult to do my job effectively because some of the data I need is
not available.
27- The data is stored in so many different places and in so many forms; it is hard
to know how to use it effectively.
Which of the above system characteristics you consider significantly enhance your
performance (please state 3 in order of importance)

Appendices 296
Evaluating Stakeholders’ Performance of ERP Systems in Saudi Arabia Higher Education
Mona Althonayan
1..................................................................................................................................
2..................................................................................................................................
3..................................................................................................................................
SECTION 4 Technical support:
28- The ERP system has up –to date hardware and software.
29- The ERP system is dependable.
30- The ERP system user support team give prompt service to users.
31- The ERP system user support team have the knowledge to do their job well.
Do you expect any other technical support from the ERP system support team?
(Two point please)
1..................................................................................................................................
2..................................................................................................................................
This is the end of the questionnaire, thank you very much your cooperation is
highly appreciated
Mona Althonayan

Appendices 297
Evaluating Stakeholders’ Performance of ERP Systems in Saudi Arabia Higher Education
Mona Althonayan
Evaluating the Performance on ERP systems in Saudi Arabia Higher Education: A
stakeholders’ perspective
This study is intends to investigate the impact of ERP systems on
the performance of the stakeholders, in the environment of higher
education.
This interview is divided to 7 questions.
You are free to answer or refuse to answer any questions.
The interview is to be answered by the administrative, staff and
faculty, who are work on the systems daily.
Please provide as detail information as possible.
The information provided will be held strictly and confidential.
If you interested in the results of this research, we will be happy to
send you a result copy of this research.
If you have any concerns or complaints regarding the ethical
elements of this project please contact [email protected] or
Dr Laurence Brooks, Tel. No. 01895 266010
Your cooperation is highly appreciated.
Please if you have any questions do not hesitate to contact the
researcher at [email protected] or KSA-
mobile,0554620396-UK 0044-7729119102
I have read the information sheet. I agree to participate in the study and give my consent
freely. I understand that the study will be carried out as describe in the information
statement, a copy of which I have retained. I realise that whether or not I decided to
participate is my decision. I have all questions answered to my satisfaction.
...................... ...................... ......................
Participant Signatures Date

Appendices 298
Evaluating Stakeholders’ Performance of ERP Systems in Saudi Arabia Higher Education
Mona Althonayan
•Can you can explain in detail what are the main barriers or challenges facing
KSU during the implementation, or pre implementation.
………………………………………………………………………………………
………………………………………………………………………………………
………………………………………………………………………………………
………………………………………………………………………………………
•Did KSU face any problems, barriers during the implementation regarding the
customization?
………………………………………………………………………………………
………………………………………………………………………………………
………………………………………………………………………………………
•What is the plan for the future?
………………………………………………………………………………………
………………………………………………………………………………………
………………………………………………………………………………………
1-Based on your answer in the questionnaire please explain how the ERP system
has (or has not) positive impact on the productivity of your job.
………………………………………………………………………………………
………………………………………………………………………………………
………………………………………………………………………………………
2-In which way The ERP system is an important aid to you in the performance of
your job.
………………………………………………………………………………………
………………………………………………………………………………………
………………………………………………………………………………………
3-Which of the ERP system characteristics you consider significantly enhance
your performance (please state 3 in order of importance)
………………………………………………………………………………………
………………………………………………………………………………………
………………………………………………………………………………………
4-Please explain how the quality of the ERP systems enhances your job
performance
………………………………………………………………………………………
………………………………………………………………….…………………
………………………………………………………….…………………………

Appendices 299
Evaluating Stakeholders’ Performance of ERP Systems in Saudi Arabia Higher Education
Mona Althonayan
5-Do you think that you need continuous training on how to find, understands,
access or use corporate divisional data.
………………………………………………………………………………………
………………………………………………………………………………………
………………………………………………………………………………………
6- Do you expect any other technical support from the ERP system support team?
………………………………………………………………………………………
………………………………………………………………………………………
………………………………………………………………………………………
7-As ERP system user what do you think the major barriers in implementing the
ERP systems?
………………………………………………………………………………………
………………………………………………………………………………………
………………………………………………………………………………………
8-As a project manager I appreciate if you can add further comments for future
ERP system implementation in Saudi Arabian Universities.
………………………………………………………………………………………
………………………………………………………………………………………
………………………………………………………………………………………
………………………………………………………………………………………

Appendices 300
Evaluating Stakeholders’ Performance of ERP Systems in Saudi Arabia Higher Education
Mona Althonayan
APPENDIX: C
LITERTURE EVALUATION

Appendices 301
Evaluating Stakeholders’ Performance of ERP Systems in Saudi Arabia Higher Education
Mona Althonayan
Factors Title of the study Authors Year
Type of the
study Sample
ER
Ps
env
iro
nm
ent
Focus of the study
Ev
alu
ate
th
e
S o
r P
1
Improve stakeholders’
productivity, ease of use,
reliability, authorization,
An exploration of factors that
impact individual performance:
an analysis multiple analytical
techniques
Boontaree Kositanurit,
Ojelanki Ngwenyama and
Kweku-Muata Osei-Bryson
2006 On line survey (255) ERP users
and (95) non ERP
users
Yes TTF – User satisfaction
2
Compatibility, Training,
assistance, accuracy,
timeliness, ease of use,
accessibility.
Enterprise Resource Planning
Systems (ERP) and user
performance: A literature
Review.
Ahed Abugabah, Louise
Sanzogni. 2009 Comprehensive
literature
Review
(proposed
model)
--------- Yes TAM, TTF and D&M
3
Compatibility, Training,
assistance, accuracy, ease
of use, error recovery,
currency, format,
experience, flexibility,
timeliness, accessibility
The impact of information
Systems on user Performance:
A critical review and
theoretical model
Ahed Abugabah, Louise
Sanzogni, and Arthur
Poropat
2009 Comprehensive
literature
Review
(proposed
model)
--------- No TAM, TTF and D&M
4 Service quality, training,
accuracy, reliable,
timeliness, time taken to
complete task, immediate
recall, easy to use, improve
productivity.
ERP user satisfaction issues
insights from a Greek
industrial giant
Pantelis Longinidis and
Katerina Gotzamani 2009 Questionnaire
and interview
68 users and
personal interview
Yes Measure ERP users’ satisfaction
using 19 items, examined the
existence of deviation in satisfaction
levels among ERP users with five
different characteristics, department
of employment, gender, age,
education, and IT experience.

Appendices 302
Evaluating Stakeholders’ Performance of ERP Systems in Saudi Arabia Higher Education
Mona Althonayan
5
Information quality,
systems quality, service
quality
Investigating the success of
ERP systems case studies in
three Taiwanese high tech
industries
Shin-Wen Chien and Shu-
Ming Tsaur
2007 Survey Multiple case
study
Yes Propose a success model for ERP
systems and empirically investigate
the multi-dimensional relationships
among the success measures
S
6
Content, accuracy, format,
timeliness, ease of use
ERP systems adoption An
expiratory study of the
organisational factors and
impacts of ERP success
Chuck C. H. Low and
Erick W. T. Ngai
2007 Interview and
Survey
Multiple case
study
Yes Examine the relationship of success
factors ERP and BPI
S
7
System quality, training,
accuracy
A framework of ERP systems
implementation success in
China: empirical study
Zhe Zhang, Matthew
K.O.Lee, Pei Huang, Liang
Zhang, Xiaoyuan Huang
2005 Interview Multiple case
study
Yes Improve critical factors that affect
ERP implementation success.
S
8
Time, flexibility,
reliability, service
Evaluating the performance of
an ERP system based on the
knowledge of ERP
implementation objectives
Chun- Chin Wei 2008 Survey Case study Yes Evaluating the performance of an
ERP
S
9 Task relevance,
compatibility.
Empirically Testing User
Characteristics and Fitness
Factors in Enterprise
Resource Planning.
Clyde W. Holsapple,
Yu-Min Wang and Jen-
Her Wu.
2005 Questionnaire 617 candidate Yes User characteristics and faintness
factors.
10 Ease of use, user
performance, and
support.
A structural model of end
user computing satisfaction
and user performance
Jamshid Etezadi- Amoli
and Ali Farhoomand
1996 Questionnaire 341EUC end
user
No EUCS and user performance

Appendices 303
Evaluating Stakeholders’ Performance of ERP Systems in Saudi Arabia Higher Education
Mona Althonayan
11 Technical IT skills,
flexible IT
Information Technology
and the Performance of the
Customer Service Process:
A resource based analysis
Gautam Ray, Waleed
Muhanna and Jay B.
Barney.
2005 Survey 100 employee in
the health
insurance
No The performance of the customer
service.
12 Time, quality,
flexibility, service.
A neutral network
evaluation model for ERP
performance from SCM
perspective to enhance
competitive advantage
Chiu Chang, Hein- Ginn
Hwang, Hsueh Liaw,
Ming-Chien Hung, Sing-
Liang Chen and David C
Yen
2008 Questionnaire 60 Yes SCM
13 Training, ease of use. ERP Training and user
satisfaction
Joseph Bradley and C.
Christopher Lee
2004 Questionnaire 113 employees Yes ERP in midsized university
14 User productivity, task
performance, task
accomplishment, system
quality.
Understanding the critical
factors effect user
satisfaction and impact of
ERP through innovation of
diffusion theory
Li-Ling Hsu, Robert
S.Q.Lai and Yu-Te
Weng
2008 Questionnaire 504 Yes Incorporate the innovation theory
with IS success model to evaluate
the success factors for ERP
implementation.
15 Accuracy, reliability,
timeliness, format,
accessibility, response
time, flexibility,
responsiveness, service
support, accurate
A critical review of end
user information system
satisfaction research and
research framework
Norman Au, Eric
W.T.Ngai and
T.C.Edwin Cheng
2002 Comprehensiv
e literature
Review
(proposed
model)
------------ No EUISS

Appendices 304
Evaluating Stakeholders’ Performance of ERP Systems in Saudi Arabia Higher Education
Mona Althonayan
16 Accurate, flexible, easy
to use, reliable, allows
data integration, recall
for individual work,
improves individual
productivity, beneficial
for individual’s tasks,
saves individual tasks,
ERP systems success: an
empirical analysis of how
organizational stakeholder
groups prioritize and
evaluate relevant measure
P. Ifindo and N. Nahar 2007 Survey in
Finland and
Estonia
66 respondents
in 44 diverse,
privet, industrial
organizations
Yes ERP systems success
17 Accurate, flexible, easy
to use, reliable, allows
data integration, recall
for individual work,
improves individual
productivity, beneficial
for individual’s tasks,
saves individual tasks,
Do top and midlevel
managers view ERP success
measures differently?
Princely Ifindo and
Nazmun Nahar
2006 Survey in tow
small
Northern
Europe
countries
350 firms in
Finland and 120
in Estonia
Yes ERP systems success
18 Training, accuracy,
timeliness, reliability,
response time, ease of
use, flexibility, output
requirement
Measuring ERP success: the
ultimate user’s view
Jen-Her Wu and Yu-Min
Wang
2006 Survey and
interview
264 ERP
ultimate users
Yes ERP systems success
19 Technology
functionalities, task
requirement, individual
abilities.
Stakeholders process
approach to information
systems evaluation
Olayele Adelakun and
Murray E. Jennex
2002 Interview,
archives and
survey.
Stakeholders of
two companies,
McBee and
Powerco
No Stakeholders evaluation

Appendices 305
Evaluating Stakeholders’ Performance of ERP Systems in Saudi Arabia Higher Education
Mona Althonayan
20 Flexibility, accuracy,
timeliness, reliability,
confidence in systems,
currency, error recovery,
response/ turnaround
time, training, job
effects, format,
Development of a tool for
measuring and analyzing
computer user satisfaction
James E. Bailey and
Sammy W. Pearson
1983 Questionnaire
and Interview.
32 middle
managers
No CUS
21 Service quality Measuring Organizational
IS effectiveness: an
overview and update of
senior management
perspectives
Peter B. Saddon, Valerie
Graeser and Leslie P.
Willcocks
2002 Survey. 80 senior IT
mangers
No IT mangers evaluations
22 Quality of work/
complete task
Employee performance
evaluation by AHP: A case
study
Rafikul Islam and Shuib
bin Mohd Rasad 2005 Absolute
measurement
procedure of
AHP
294 employee of
inter system
maintenance
service
No Evaluate the performance of the
operational level employee
23 Training, ease of use ERP training and user
satisfaction: a case study
Joseph Bradley and C.
Christopher Lee
2007 Survey. 143 employee Yes ERP systems training and user
satisfaction
21 Compatibility, ease of
use, flexibility,
The relation of interface
usability characteristics,
perceived usefulness, and
perceived ease of use to
end-user satisfaction with
ERP system
Fethi Calisir and Ferah
Calisir
2004 Survey. 51 end user in 24
companies
Yes Examines various usability
factors affecting end user
satisfaction

Appendices 306
Evaluating Stakeholders’ Performance of ERP Systems in Saudi Arabia Higher Education
Mona Althonayan
24 Improve productivity,
improve performance
Managing user acceptance
towards ERP understanding
the dissonance between user
expectations and managerial
policies
Eric T.K. Lim , Shan
Ling Pan and Chee Wee
Tan
2005 Action
research
Case study 20
consultants
Yes Dissonance between user
expectancy performance and
managerial policies
25 Accuracy, reliability,
timeliness, accessibility,
response, flexibility,
work performance,
service quality, training,
responsiveness
Extending the
understanding of end user
information systems
satisfaction formation: an
equitable needs fulfilment
model approach
N. Au, E. W. T. Ngai
and T.C.E. Cheng
2008 Survey. 922 employee
from the airline
and hotel sector
No EUS
26 Authority, time, system
quality
The relationships between
key stakeholders’ project
performance and project
success: perception of
Chinese construction
supervising engineers
Xiaojin Wang, Jing
Huang
2006 Survey 245 No Stakeholders evaluate project
success
25 Training, accuracy,
timeliness, reliability,
flexibility, ease of use,
response time
Measuring ERP success:
The key –users’ viewpoint
of the ERP to produce a
viable IS in the organization
Jen-Her- Wu and Yu
Min Wang
2007 Survey Top 1000
enterprise in
Taiwan
yes Key user satisfaction as means of
determining system success
26 Ease of use, user skills Variables affecting
information technology end
user satisfaction: a meta-
analysis of the empirical
literature
Mo Adam Mahmood,
Janice M. Burn,
Leopoldo A. Gemoets
and Carmen Jacquez
2000 Comprehensiv
e literature
Review
----------- No EUS

Appendices 307
Evaluating Stakeholders’ Performance of ERP Systems in Saudi Arabia Higher Education
Mona Althonayan
27 Content, format, ease of
use, accuracy,
timeliness, computer
experience
User satisfaction in ERP
system: some empirical
evidence
Moshe Zviran 2003 Survey 172 user of ERP
system
Yes EUS
28 Content, format, ease of
use, accuracy,
timeliness,
The meaning and
measurement of user
satisfaction: A multigroup
invariance analysis of the
end user computing
satisfaction instrument
William J. Doll,
Xiaodong Deng, T.S.
Raghunathan,
Gholamreza Torkzadeh
and Weidong Xia
2004 Gholamreza
Torkzadeh
1386 user from
over 60 firms
No EUS
29 Content, format, ease of
use, accuracy,
timeliness,
A discrepancy model of end
user computing
involvement
William J. Doll and
Gholamreza Torkzadeh
1989 Survey data
and field
experiment
618 from 44
firms
No End user computing involvement
30 Task productivity/ time,
increase productivity,
accomplish more work.
Customer service.
Confirmatory factors
analysis and factorial
invariance of the impact of
information technology
instrument
William J. Doll,,
Xenophon Koufteros
and Gholamreza
Torkzadeh
2005 Survey 332 No Measuring information
technology impact
31 Task productivity/ time,
increase productivity,
accomplish more work.
Customer service.
The development of tool for
measuring the perceived
impact of information
technology on work
Gholamreza Torkzadeh
and William J. Doll,
1999 Interview ,
questionnaire
409 end user
from18
organization and
8 manufacturing
firms
No Measuring information
technology impact
Appendices 308
Evaluating Stakeholders’ Performance of ERP Systems in Saudi Arabia Higher Education
Mona Althonayan
32 Content, format, ease of
use, accuracy,
timeliness.
Confirmatory factor
analysis of the end user
computing satisfaction
instrument: replication
within an ERP domain
Toni M. Somers, Klara
Nelson and Jahangir
Karimi
2003 Nationwide
mail survey
407 Yes Measuring end user satisfaction
with ERP software application
33 Systems quality/
currency, content,
accuracy, format,
timeliness, ease of use,
reliability, authorization.
An exploration of factors
that impact individual
performance in an ERP
environment: analysis using
multiple analytical
techniques
Boontaree Kositanurit,
Ojelanki Ngwenyama
and Kweku- Muata
Osei- Bryson
2006 Survey 349 respondents
of these,
255resondents
are ERP users
Yes Evaluate individual performance
in an ERP environment
34 TAM and TTF Extending the technology
acceptance model with Task
Technology Fit
Mark T. Dishaw and
Diane M. Strong
1999 questionnaire 50 firms No Evaluate the integration between
TAM and TTF is useful to
understand the software
utilization
35 TTF Task technology fit and
effectiveness of group
support systems: evidence
in the context of task
requiring domain specific
knowledge
Uday Murthy and Dived
Kerr
2000 Experiment 76 No Effectiveness of group support
systems technology by explore
TTF hypothesis
36 TTF User evaluation of IS as
surrogates for objective
performance
Dale Goodhue, Barbra
Klein and Salvatore
March
2000 Experiment 155 No User evaluation

Appendices 309
Evaluating Stakeholders’ Performance of ERP Systems in Saudi Arabia Higher Education
Mona Althonayan
37 TTF Development and
measurement validity of a
task technology fit
instrument for user
evaluation of information
systems
Dale Goodhue 1989 Questionnaire
and interview
360
questionnaire
and 100
interview
No User evaluation
38 Awareness, recall,
individual productivity,
format, ease of use
accuracy, flexibility
A factor and structural
equation analysis of the
enterprise systems success
measurement model
Darshana Sedera and
Guy Gble
2004 Survey Identification
survey 137
Exploratory
phase :310
Confirmatory
phase :153
oracle users
Yes Measuring ERP systems success
39 Information quality/
accuracy, Ease of use,
Assessing the validity of IS
success models: an
empirical test and
theoretical analysis
Arun Rai, Sandra Lang
and Robert Welker
2002 Questionnaire 274 No Assessing the validity of IS
success models
40 Awareness, recall,
individual productivity,
format, ease of use
accuracy, flexibility,
currency, access,
timeliness, content
Measuring enterprise
systems success: a
preliminary model
Darshana Sedera, Guy
Gable and Taizan Chan
2003 Survey 317 Yes Measuring the ERP systems
success
41 Awareness, recall,
individual productivity,
format, ease of use
accuracy, flexibility,
currency, access,
timeliness, content
Re- conceptualizing
information systems
success: the IS impact
measurement model
Guy Gable, Darshana
Sedera and Taizan Chan
2008 Survey 153 No Information systems success
Appendices 310
Evaluating Stakeholders’ Performance of ERP Systems in Saudi Arabia Higher Education
Mona Althonayan
42 System quality/
reliability ease of use,
response time. Training,
user experience
Information systems
success: individual and
organizational determinants
Rajiv Sabherwal, Anand
Jeyaraj and Charles
Chowa
2006 Meta- analysis 612 finding
from 121 study,
from 1980 to
2004
No Information systems success
43 System quality, system
importance
A partial test and
development of Delone and
McLean’s model of IS
success
Peter Seddon and Min-
Yen Kiew
1994 Questionnaire 94 No Information systems success
44 Awareness, recall,
individual productivity,
format, ease of use
accuracy, flexibility,
currency, access,
timeliness, content
Enterprise systems success:
a measurement model
Guy Gable, Darshana
Sedera and Taizan Chan
2003 Survey 27 public sector Yes Measuring the ERP systems
success
45 Awareness, recall,
individual productivity,
format, ease of use
accuracy, flexibility,
currency, access,
timeliness, content
Measuring enterprise
systems success: the
importance of multiple
stakeholder perspective
Guy Gable, Darshana
Sedera and Taizan Chan
2004 Survey 310 Yes Measuring the ERP systems
success
46 Timeliness, accuracy,
content
Individual impact,
reliability,
User developed application
and information systems
success: A test of Delone
and McLean’s model
Tanya McGill and
Valerie Hobbs
2003 Experiment 79 No Information systems
success(UDA)

Appendices 311
Evaluating Stakeholders’ Performance of ERP Systems in Saudi Arabia Higher Education
Mona Althonayan
47 Service quality/
tangibles, reliability,
responsiveness,
assurance, empathy
Service quality: A measure
of information systems
effectiveness
Leyland Pitt, Richard
Watson and C. Bruce
Kavan
1995 Questionnaire 237 No Information systems
48 tangibles, reliability,
responsiveness,
assurance, empathy
Perceived service quality
and user satisfaction with
the information services
function
William Kettinger and
Choong Lee
1994 Questionnaire 400 computer
users
No Service quality in information
systems
49 Flexibility, reliability,
productivity, timeliness,
service level.
IT governance for
enterprise planning
supported by the Delone-
McLean model of
information systems success
Edward Bernroider 2008 Questionnaire 209 Yes Measuring the ERP systems
success
50 Improving job
performance, enhancing
productivity of job,
enhancing speed of
performance tasks,
easier to perform tasks
Perceived absorptive
capacity of individual users
in performance of enterprise
resource planning (ERP)
usage: the case for Korean
firms
Jong –Hun Park, Hyun-
Jn Suh and Hee-Dee-
Dong Yang
2007 Questionnaire 245 Yes Measuring the users performance
of ERP systems
51 Training, employee self
-efficacy, IT awareness
The moderating effect of
employee computer self-
efficacy on the relationship
between ERP competence
constructs and ERP
effectiveness
Shin-Wen Chien and
Changya Hu
2009 Survey and
questionnaire
657 Yes The role of employee self –
efficacy fulfils in ERP
effectiveness

Appendices 312
Evaluating Stakeholders’ Performance of ERP Systems in Saudi Arabia Higher Education
Mona Althonayan
52 Task interdependence,
training, ease of use,
ease of access
Subcultures and use of
communication information
technology in higher
education institution
Canchu Lin and Louisa
Ha
2009 Survey 1022 No The role of information
technology communication in
higher education
53 Training, awareness,
compatibility, accuracy
Critical success factors of
enterprise resource planning
systems implementation
success in China
Liang Zhang, Matthew
Lee, Zhe Zhang and
Probire Banerjee
2002 Survey 138 Yes Measuring the ERP systems
success
54 Accuracy, timeliness,
user’s job performance,
completeness of
information, systems
availability.
Performance measure of
information systems(IS) in
evolving computing
environments: an empirical
investigation
Jaeho Heo, Ingoo Han 2003 Survey 137 No Evaluate the impact of
information systems on business
performance
55 Training and education,
suitability of hardware
and software, data
accuracy and integrity,
timeliness.
A framework of ERP
systems implementation
success in China: An
empirical study
Zhe Zhang, Matthew K.
O. Lee, Pei Huang,
Liang Zhang, Xiaoyuan
Huang
2005 Interview 4- Case studies Yes ERP systems implementation
success
56 Content, format,
timeliness, accuracy,
ease of use
Measuring user satisfaction
and perceived usefulness in
the ERP context
Moshe Zviran, Nava
Pliskin, Ron Levin
2005 Questionnaire 200 ERP
systems users
Yes Measuring user satisfaction in
ERP context
57 D&M (individual
impact)
The relationship between
implementation variables
and performance
improvement of ERP
systems
Wen- Hsien Tsai, Yi-
Wen Fan, Jun-Der Leu
and Li – Wen Chou,
Ching-Chien Yang
2007 Questionnaire 5000 largest
corporation in
Taiwan
Yes Measuring ERP performance S

Appendices 313
Evaluating Stakeholders’ Performance of ERP Systems in Saudi Arabia Higher Education
Mona Althonayan
58 Task efficiency, overall
benefits,
The implementation factors
that influence the ERP
(enterprise resource
planning) benefits
Shih-Wei, Yu-Chieh
Chang
2008 Survey 166 Yes The implementation factors that
influence the ERP (post
implementation phase)
p
59 Time, quality,
flexibility, service
A neural network
evaluation model for ERP
performance from SCM
perspective to enhance
enterprise competitive and
advantage
Chiu Chang, Hsin-Ginn
Hwang, Hsueh- Chih
Liaw, Ming- Chien
Hung, Sing- Liang
Chen, David C. Yen
2008 Questionnaire
and Interview
60 questionnaire Yes Evaluation ERP performance
from SCM perspective
p
60 System quality,
information quality
The consequence of
information technology
acceptance on subsequent
individual performance
M. Igbaria, M. Tan 1997 Survey Case study No Examine the relationships
between IT acceptance and
individual performance
P
61 Ease of use, content,
accuracy, format
timeliness.
The meaning and
measurement of user
satisfaction: a multi group
invariance analysis of the
end user computing
satisfaction
William J. Doll.,
Xiadoing Deng.,
T.S.Raghunathan.,
Gholamreza Torkzadeh.,
Wwidoing Xia.
2004 Survey 1,166 Responses No Test the equivalent of the factor
loading and the structural weights
of the first order factors across
subgroups
S

Appendices 314
Evaluating Stakeholders’ Performance of ERP Systems in Saudi Arabia Higher Education
Mona Althonayan
APPENDIX: D
KSU
Appendices 315
Evaluating Stakeholders’ Performance of ERP Systems in Saudi Arabia Higher Education
Mona Althonayan
Aspirations of MADAR Project
• Shifting to a reference in the implementation of the enterprise resource planning
(ERP) systems in government entities and private in the Kingdom of Saudi Arabia.
• recruit the necessary expertise to ensure the successful implementation of the
resource planning systems.
• Change Management at the facility to ensure the implementation of the new
systems properly and unhindered
Achievements throughout the project at King Saud University
1. Activation of the financial systems and the new management of all key agencies
and departments.
2. Documentation of work procedures in the financial and administrative systems.
3. Creating a new generation of staff carries experiences of the older generation
through the transfer of knowledge and experience that has been documented
financial and administrative systems.
4. Reduce dependence on individuals to manage the work and activate of
teamwork and Specialist.
5. Auditing and purification and reviewing old data and the new transfer
regulations.
6. Provide integrated information infrastructure and interconnected within the
university.
7. Process re-engineering some work to reduce reliance on paperwork and raise
the efficiency of the implementation of these measures.
8. Train a large number of users and provide easy access training materials to raise
the efficiency of users (Appendix).
9. Transition to a consultant in the field of reference providing consultancy in the
implementation of the financial and administrative systems.
10. Benefit from the experience throughout the MADAR project at King Saud
University in the group of some research master's and doctoral students in local
universities, European and American.
11. Published a collection of scientific research, which holds experience
throughout the project as a case study.
Appendices 316
Evaluating Stakeholders’ Performance of ERP Systems in Saudi Arabia Higher Education
Mona Althonayan
12. Benefit from the experience over the project in some studies and statistics that
carried out some of the colleges, through questionnaires were distributed to the
users of the system and project management.
Beneficiary departments
• Financial Management
• The purchase department administration and pursue, and follow up
• General Administration of planning, budget and follow-up
• Management control warehouses
• Administrative Communications Centre.
• Deanship of faculty members and staff.

Appendices 317
Evaluating Stakeholders’ Performance of ERP Systems in Saudi Arabia Higher Education
Mona Althonayan
A comprehensive Report about MADAR systems until
March 2012
1-System of employees’ affair, Training, Scholarship and Salaries
Date starting system: 2008-2009
Number of users: 927
Departments activated by
the system:
Deanship of faculty members and staff, training and
scholarship and Salaries
The rest of the university
departments:
Implement processes leave, start the work, resolve
absence, evaluation of job performance and some
other operations.
Current status of the system
Number of
modifications
reported
Number of
amendments
executed
Number of
amendments to the
company (in
progress)
Number of
amendments to the
authority (to answer
inquiries)
410 333 20 57
81%
5%
14%
Employee Affairs
Number of amendments executed
Number of amendments to
the company ( in progress)
Number of amendments to the
authority (to answer inquiries)

Appendices 318
Evaluating Stakeholders’ Performance of ERP Systems in Saudi Arabia Higher Education
Mona Althonayan
2-Warehouse system
Date starting system: 2007- 2008
Number of users: 341
Departments activated by
the system:
Purchasing and warehouse management
The rest of the university
departments:
Implement requisitions automatically from their
positions.
Current status of the system
Number of
modifications
reported
Number of
amendments
executed
Number of
amendments to the
company (in
progress)
Number of
amendments to the
authority (to answer
inquiries)
97 94 0 3
97%
0% 3% Warehouse System
Number of
amendments executed
Number of
amendments to the
authority ( to answer
inquiries) nnGFGF

Appendices 319
Evaluating Stakeholders’ Performance of ERP Systems in Saudi Arabia Higher Education
Mona Althonayan
3-Financial system
Date starting system: 2008-2009
Number of users: 94
Departments activated by
the system:
Central financial management
The rest of the university
departments:
-----------------------------------------------------------
Current status of the system
Number of
modifications
reported
Number of
amendments
executed
Number of
amendments to the
company (in
progress)
Number of
amendments to the
authority (to answer
inquiries)
181 170 4 7
4- Procurement system
Date starting system: 2008- 2009
Number of users: 252
Departments activated by
the system:
Purchasing and warehouse management
The rest of the university
departments:
The university administration incorporate requests
from their insurance and electronic
94%
2% 4% Financial System
N umber of amendments
executed
Number of amendments to the
company
Number of amendments to the
authority ( to answer inquiries)

Appendices 320
Evaluating Stakeholders’ Performance of ERP Systems in Saudi Arabia Higher Education
Mona Althonayan
Current status of the system
Number of
modifications
reported
Number of
amendments
executed
Number of
amendments to the
company (in
progress)
Number of
amendments to the
authority (to answer
inquiries)
49 44 0 5
5- Warehouse control system and the Covenant
Date starting system: 2007-2008
Number of users: 74
Departments activated by
the system:
Warehouse management control
The rest of the university
departments:
Some departments are allowed to carry out the
transfer of the Covenant
Current status of the system
Number of
modifications
reported
Number of
amendments
executed
Number of
amendments to the
company (in
progress)
Number of
amendments to the
authority (to answer
inquiries)
37 36 0 1
90%
0% 10%
Procurement System
Number of amendments executed
Number amendments to the
company (in progress)
Number amendments to the
authority (to answer inquiries)

Appendices 321
Evaluating Stakeholders’ Performance of ERP Systems in Saudi Arabia Higher Education
Mona Althonayan
6- Budget system
Date starting system: Did not begin the actual application
Number of users: 15 pilot on the environment
Departments activated by
the system:
General Department of Planning and Budget and
follow-up
The rest of the university
departments:
----------------------------------------------------
Current status of the system
Number of
modifications
reported
Number of
amendments
executed
Number of
amendments to the
company (in
progress)
Number of
amendments to the
authority (to answer
inquiries)
49 34 15 0
97%
0% 3%
69%
31%
0%
Warehouse
management control
Budget System
Number of amendments executed
Number of amendments to the
company (in progress)
Number of amendments to authority (to answer inquiries)
Number of amendments executed
Number of amendments to the
company (in progress)
Number of amendments to the
authority (to answer inquiries)

Appendices 322
Evaluating Stakeholders’ Performance of ERP Systems in Saudi Arabia Higher Education
Mona Althonayan
7- Management Communication System
Date starting system: Did not begin the actual application
Number of users: 2648
Departments activated by
the system:
All units of the University
The rest of the university
departments:
---------------------------------------------
Current status of the system
Number of
modifications
reported
Number of
amendments
executed
Number of
amendments to the
company (in
progress)
Number of
amendments to the
authority (to answer
inquiries)
141 141 0 0
100%
0% 0% Management Communication System
Number of amendments executed
Number of amendments to the company
(in progress)
Number of amendments to the authority
(to answer inquiries)
1.

Appendices 323
Evaluating Stakeholders’ Performance of ERP Systems in Saudi Arabia Higher Education
Mona Althonayan
Departments and the number of employees who have been trained to draft rules Systems financial and administrative
No Name of the System Trainers Male Female Male
DEB
Female
DEB
Total of DEB
&ADM
Training by
Company
Staff
Training by
MADAR Staff
1 Financial System 72 70 2 1 0 1 48 24
2
Management Communication
System 1,895 1,375 520 343 124 467 288 1,607
3 Warehouse system 73 63 10 38 2 40 20 53
4 Inventory control system 22 22 0 1 0 1 22 0
5 Testament System 16 16 0 1 0 1 16 0
6 Procurement System 102 79 23 43 9 52 20 82
7 Competitions System 35 26 9 7 4 11 20 15
8 Employee System 513 390 123 136 32 168 100 413
9 Salary System 165 127 38 3 3 6 40 125
10 System Training and Scholarship 28 22 6 1 1 2 28 0
11 Budget system 15 15 0 2 0 2 15 0
12 Total 2,936 2,205 731 575 175 750 617 2,319

Appendices 324
Evaluating Stakeholders’ Performance of ERP Systems in Saudi Arabia Higher Education
Mona Althonayan
APPENDIX: E
KFU

Appendices 325
Evaluating Stakeholders’ Performance of ERP Systems in Saudi Arabia Higher Education
Mona Althonayan
KFU Oracle ERP Application Project Deployment
The scope of this deployment framework is to deploy the Oracle ERP application
in King Faisal University (Single Entity) with the below listed ERP application
components:
PHASE1
Financial Management
1 Oracle General Ledger
2 Oracle Accounts Payables
4 Oracle Assets
5 Oracle Cash Management
Supply Chain Management
6 Oracle Inventory
7 Oracle Purchasing
8 Oracle I Procurement
Human Resources Management
9 Oracle Core HRMS
10 Oracle Payroll
Customizations
11
Refer to the Appendix A for the Customizations which are in
scope for this deployment framework
Production Support
12 Two Months Support
PHASE2
Financial Management
1 Budgeting
Supply Chain Management
2 Oracle Sourcing
3 Oracle I Supplier
4 Oracle Procurement Contract
Human Resources Management
5 Oracle Self Service <SSHR>
Production Support
6 One Month Support
Customizations
7 None

Appendices 326
Evaluating Stakeholders’ Performance of ERP Systems in Saudi Arabia Higher Education
Mona Althonayan
Phase2 - High Level Implementation Scope
Planning & Budgeting
1. Manage budget planning & reporting centrally for KFU. 2. Integrate with the budgets & Actuals in General Ledger for data
extract/write back. 3. Online access for Budget definition and balance inquiries. 4. Apply business rules to calculate next year budget based on current year
actuals or previous year budget. 5. Budget at different department levels 6. Control budgeting cycle using budget targets and budget approval
workflow 7. Develop budgets using increase and aggregate functions 8. Budget validation and approval mechanism to enforce budget constraints 9. Budget Reporting and Analysis – This must fall within the total number of
customized reports of the scope. 10. Grant users different responsibilities based on their functional role within
the budget definition process
I Procurement
1. Setup & Enable I Procurement for online requisitions process as per the
standard feature with built-in integration with Oracle Purchasing 2. Setup & Enable online approval for purchase requisitions in I Procurement 3. Upload Item Catalogues (if provided by KFU for their item master & Item
Categories)
Procurement Contract
1. Setup Contract Terms & Condition Clause Types and fixed content (KFU to provide the clause types as per the needed format)
2. Enable contract for Oracle purchasing as per the standard feature 3. Configure the purchasing contract layouts in the system for automatic
generation of purchasing contracts (KFU to provide their layouts) – This must fall within the total number of customized reports of the scope.
Sourcing & I Supplier Portal
1. Setup Sourcing Process for quotation & Bids negotiation as per the standard feature
2. Supplier Access and security functions for enabling external suppliers to access the KFU application for suppliers as per the standard feature to automate the supplier communication with regards to purchase orders, shipments and invoicing.

Appendices 327
Evaluating Stakeholders’ Performance of ERP Systems in Saudi Arabia Higher Education
Mona Althonayan
Self Service HR
Setup and enable Self Service HR for the below standard functions within Self
Service HR Application
1-Employee Self Service for below listed standard processes
-Personnel Information (Employee Self-Service)
-Pay slips (Employee Self Service)
-My Information – Assignment Info (Employee Self Service)
-Events and Bookings (Employee Self Service)
-Education and Qualification (Employee Self Service)
-Other Professional Awards (Employee Self Service)
-Resume (Employee Self Service)
-Leave of Absence (Employee Self-Service)
-Documents of Record (Employee Self-Service)
-Manage Payroll Payments (Employee Self-Service).
2-Manager Self Service for below listed standard processes
-Change Manager (Manager Self-Service)
-Change of Regular Salary (Manager Self Service)
-Termination (Manager Self Service).
-Personnel Information (Manager Self-Service)
-My Employee Professional Information (Manager Self Service)
-Events and Bookings (Manager Self Service)
-Education and Qualification (Manager Self Service)
-Other Professional Awards (Manager Self Service)
-Resume (Manager Self Service)
-Leave of Absence (Manager Self-Service)
-Transfer and Promotion (Manager Self-Service)
-Change cost center (Manager Self-Service)
-Documents of Record (Manager Self-Service)

Appendices 328
Evaluating Stakeholders’ Performance of ERP Systems in Saudi Arabia Higher Education
Mona Althonayan
APPENDIX: F
KFU of P&M

Appendices 329
Evaluating Stakeholders’ Performance of ERP Systems in Saudi Arabia Higher Education
Mona Althonayan
Functional Scope of Work at
Academics Modules
1. Admission & registration
2. Student affairs 2.1 Student Housing 2.2 Student Services 2.3 Coop & Summer
Training 2.5 Counselling & Advising 2.6 Student Fund 2.7 Alumni Services
3. Applied Research
4. Scientific Research
5. Graduate Studies
IT Modules
1. Document management system
2. University portal
3. Business intelligence
Administrative Modules
1. General ledger
2. Accounts payables
3. Accounts receivables
4. Cash management
5. Fixed assets
6. Costing & budgeting
7. Inventory management
8. Warehouse management
9. Purchasing
10. Project accounting
11. Maintenance management
12. Faculty Affairs
13. Staff Affairs
14. Payroll
Appendices 330
Evaluating Stakeholders’ Performance of ERP Systems in Saudi Arabia Higher Education
Mona Althonayan
15. F&P Services
16. Support services
Office and Housing Services
Medical Services
Food Services
Safety and Security Services
Transportation Services
Book Stores
Change Management: Training Programs
Business Process Training (3 programs)
Oracle Applications Training (4 programs)
Oracle Technology Training (6 programs)
Accounting Concepts Training (Planned)
Business Intelligence Strategy
Establish a Business Intelligence Competency Centre
-Select specialized tools and systems for the following:
-Data Extraction, Profiling, Cleansing, Quality, Transformation and Loading,
Warehousing and Marting
-Ad-hoc reporting and analysis
-Enterprise Performance Reporting
-Data and Text Mining
-Statistical and Advanced Analyses
Develop a strong ownership for the BI program through awareness, training
and incentives
-Implement the Systems in phases:
Phase I: Research, HR, and Finance, Selected Services
Phase II: Student and Faculty, Others.

Appendices 331
Evaluating Stakeholders’ Performance of ERP Systems in Saudi Arabia Higher Education
Mona Althonayan
ITC Customer Satisfaction Survey
Thank you for your interest in helping ITC evaluate our services and determine
your current and future IT needs. This survey should take you around 5 minutes.
We appreciate your cooperation.
1. How satisfied are you with the following services provided by ITC?
Very
Satisfied
Satisfied
Dissatisfied
Very
Dissatisfied
No basis
to rate
Email Services
Internet Services
KFUPM Website
ITC Website
ITC Customer Support
IT Equipment Supply
PC Labs
Banner
Blackboard
ERP
Business Intelligence(BI)
Residential Management
System (RMS)
MedCare
Library Information
System (Symphony)

Appendices 332
Evaluating Stakeholders’ Performance of ERP Systems in Saudi Arabia Higher Education
Mona Althonayan
2. Which aspect of these services are you ‘Most-Satisfied’ with?
Performance Availability Usability
Email Services
Internet Services
KFUPM Website
ITC Website
ITC Customer Support
IT Equipment Supply
PC Labs
Banner
Blackboard
ERP
Business Intelligence (BI)
Residential Management System (RMS)
Med Care
Library Information System (Symphony)
3. Which aspect of these services are you ‘Least-Satisfied’ with?
Performance Availability Usability
Email Services
Internet Services
KFUPM Website
ITC Website
ITC Customer Support
IT Equipment Supply
PC Labs
Banner
Blackboard
ERP
Business Intelligence (BI)
Residential Management System (RMS)
Med Care
Library Information System (Symphony)

Appendices 333
Evaluating Stakeholders’ Performance of ERP Systems in Saudi Arabia Higher Education
Mona Althonayan
4. For the Service Aspect you are ‘Least-Satisfied’ with, please give details?
---------------------------------------------------------------------------------------------------
---------------------------------------------------------------------------------------------------
---------------------------------------------------------------------------------------------------
5. How can we improve the services which you are ‘Least-Satisfied’ with?
---------------------------------------------------------------------------------------------------
---------------------------------------------------------------------------------------------------
---------------------------------------------------------------------------------------------------
6. Please Check:
o Student
o Faculty
o Staff
o Visitor
Thank you for your time

Appendices 334
Evaluating Stakeholders’ Performance of ERP Systems in Saudi Arabia Higher Education
Mona Althonayan
APPENDIX: G
STATISTICS

Appendices 335
Evaluating Stakeholders’ Performance of ERP Systems in Saudi Arabia Higher Education
Mona Althonayan
CROSSTABULATIONS
Crosstab Analysis: Job Title by University (N=169)
Name of University
Total KFU
KFU of
P&M KSU
JOB
TITLE Administrative Count 27 28 30 85
% within name of 50.00% 50.90% 50.00% 50.30%
university
Management Count 27 27 30 84
% within name of 50.00% 49.10% 50.00% 49.70%
university
Total Count 54 55 60 169
% within name of 100% 100% 100% 100%
university
Pearson Chi-Square = .012 p = .994; N=169. 0 cells have expected count less than
5.
Crosstab Analysis: Name of ERP System by University
(N=169)
Crosstab Analysis: Name of ERP System by University
(N=169)
Name of University
Total KFU
KFU of
P&M KSU
NAME OF ERP
SYSTEM
Madar system Count 0 0 60 60
% within name of
university 0.00% 0.00% 100% 35.50%
Oracle System Count 54 55 0 109
% within name of
university 100% 100% 0.00% 64.50%
Total
Count 54 55 60 169
% within name of
university 100% 100% 100% 100%
Pearson Chi-Square = 169.000, p = .001; N=169. 0 cells have expected count less than 5

Appendices 336
Evaluating Stakeholders’ Performance of ERP Systems in Saudi Arabia Higher Education
Mona Althonayan
POST HOC POWER ANALYSIS
Post hoc power analysis using GPower 3.1 software to determine the appropriate
sample size for conducting the statistical tests, test based on type of
test, effect size, and power.
Statistical test Effect size Power Recommended Achieved Sufficient
sample size Sample size Sample size
Correlation
Medium
0.95 138 54-60
1 per
university
group
No (2-tailed) 0.8 84
Multiple Regression
Medium
0.95 194
54-601 per
university
group
No Systems Quality 0.8 135
14 Predictors
Multiple Regression
Medium
0.95 129
54-601 per
university
group
No Service Quality 0.8 85
4 Predictors
Kruskal Wallis
Medium 0.95 252
(3 Groups)
0.8 159 169 (3 groups) Yes
Mann Whitney
Medium 0.95 210
(2-tailed)
0.8 128 169 (3 groups) Yes
Note: 1 KFU sample (n=54), KFU of P&M sample (n=55), KSU sample (n=60)