Skeletal Biology and Mortuary Practice at the Kubinski Site (11WI1186), a Middle Woodland Ossuary
Upload
khangminh22Category
view
2download
0
A BIOARCHAEOLOGICAL STUDY OF MORTUARY PRACTICE AND CHANGE AMONG THE PIEDMONT SIOUAN INDIANS
by
Susan Hornes Hogue
A Dissertation submitted to the faculty of The University of North Carolina at Chapel Hill in partial fulfillment of the requirements for the degree of Doctor of Philosophy in the Department ::Jf Anthropology.
Chapel Hill
1998
Approved by:
~?'--;,._--. Reader
/ /
/{(:.:. -·~ L. Reader
' I , _..,... '-'-' '
Reader
/ )
,! "---., ·- ·,./ ,1--1., . ,,_ l
i .,_ "-- r -,_. ..,,... t
\

SUSAN HOMES HOGUE. A Bioarchaeological Study and Change Among the Piedmont Siouan Indians. of George R. Holcomb.)
ABSTRACT
of Mortuary Practice (Under the direction
This study represents a bioarchaeological approach to the
investigation of culture change among the non-Catawba Indian groups
who inhabited the Piedmont of the Carolinas and Virginia during the
late prehistoric to contact period. Five levels of inquiry comprise
this investigation: biological diversity and distance studies,
demographic analyses, assessment of trace element assays, analyses
of pathologies, and examination of social organization.
Ethnohistorical data are incorporated into the investigation
where appropriate. Results of the biological diversity and distance
study and the examination of social organization support a division
of the Indian populations that inhabited the region into two broad
categories that emulate the traditional northern and southern Siouan
categories formulated by previous researchers. As a direct result
of this research it is suggested that certain of the northern groups
may possibly have Iroquoian affiliations rather than Siouan
connections.
The investigation of the demographic data and the pathologies
present indicates a decrease in the overall health of the contact
period burial samples. Changes in diet are indicated with protein
from animal and nut resources being more important dietary elements
in the contact period burial samples. Finally, questions concerning
diet, health, demography, social relations and social organization
are formulated for future research.

TABLE OF CONTENTS
List of Tables •••••••••••••••••••••••••••••••••••••••••••••••••••• iv
List of Figures ................................................. v iii
List of Plates .................................................... ix
Acknowledgements .••.. ...•....•......•......•........••....•.••..... x
Chapter
I. Introduction •••••••••••••••••••••••••••••••••••••••••••••••• l
II. The Archaeological Sites and Study Populations ••••••••••••• 19
III. Population Diversity and Distance •••••••••••••••••••••••••• 36
IV, Demographic Analyses •..••.•..••••••••.•.•••••••.....••..... 70
V. Diet, Health, and Trace Element Analysis •••••••••••••••••• 101
VI. Pathologies •••••••••••••••••••••••••••••••• ••• •••••••••••• 154
VII. Mortuary Variability ...................................... 192
VIII. Conclusions ............................................... 313
Appendix A: Burial Age, Sex, and Artifact Associations ••••••••••• 328
Appendix B: Factor Scores by the Principal Components •••••••••.•• 342
Appendix C: Statistics Used to Select the Optimum Cluster Solutions ••••••••••••••••••••••••••• 351
Bibliography ••••••••••••••••••••••••••••••••••••••••••••••.••.•.. 362
iii

LIST OF TABLES
Table Page
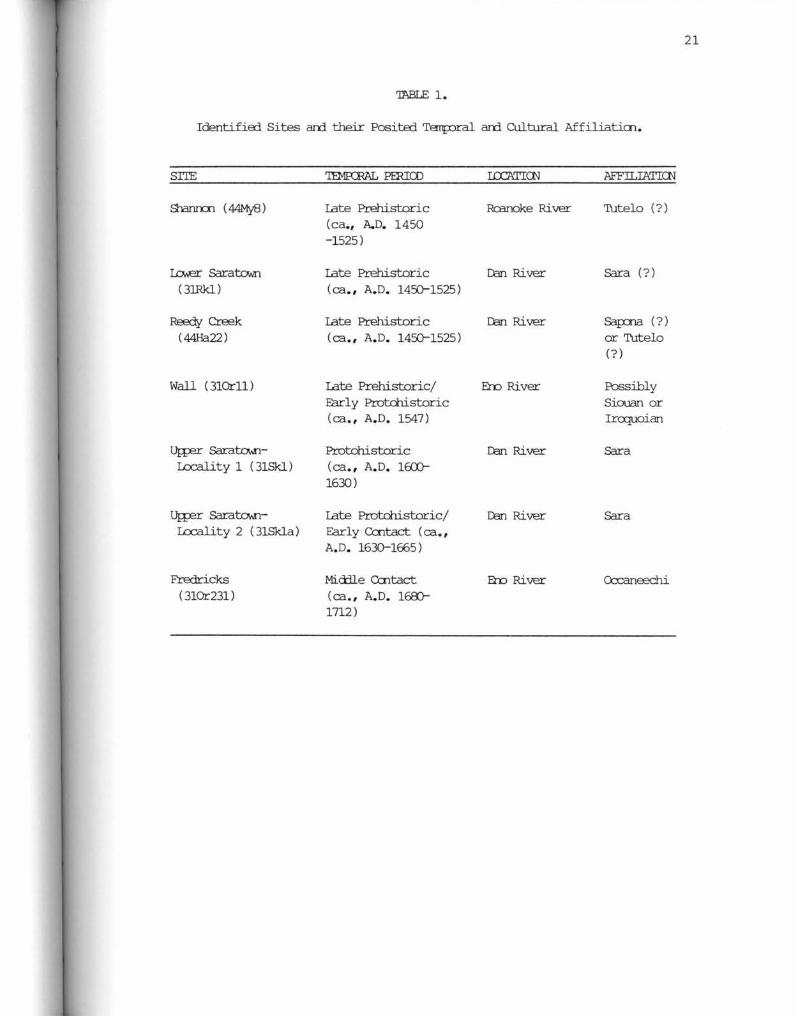
1. Identified Sites and Their Posited Temporal and Cultural Affiliations ••••••••••••••••••••••••• 21
2. Diversity for Each of the Nine Morphological Traits Within Each Sample Determined Using Lieberson's (1969) Formula ••••••••••••••••••••••••••• 43
3 . Within Sample Measure of Divergence Determined Using Lieberson's Dichotomous Values Formula .•....•.•...•.......•......••••.•.....•...... 50
4. Computation of the Mean Measure of Divergence between Samples for the Nine Morphplogical Traits •••••••••• 54
S. Cranial Indices for the Males and Females from the Samples ...... -..........•.......................... 58
6. Postcranial Indices for the Males and Females from the Samples . ..........••......•....•......•...••...... 59
7. Average Stature Estimates on Femur and Tibia Lengths for Males and Females in the Study Samples ••••••••• 65
8. Contingency Tables (2x2) for Chi-Square Test Comparing Males and Females from the Shannon Site and Upper Saratown-Locality 2 ••••••••••••• •• •• 87
9 . Contingency Tables (2x2 and 2x3) for Chi-Square Test Comparing Males from the Shannon Site and Upper Saratown-Locality 2 ••••••• •••••••••• 89
10. Contingency Tables (2x2 and 2x3) for Chi-Square Test Comparing Females from the Shannon Site and Upper Saratown-Locality 2 ••••••••••••••••• 90
11. Life Tabes with Ten-Year Age Categories for the Entire Samples from the Shannon Site, Wall Site, Upper Saratown-Locality 2, and Fredricks Site ••••••••••••••••••••••••••• •••••••••••••••••• 92
iv

12. Life Tables with Five-Year Age Categories for the Entire Samples from the Shannon Site, Wall Site, Upper Saratown-Locality 2, and Fredricks Site .....................................•....... 93
13. Male Life Tables with Five-Year Age Categories for the Samples from the Shannon Site and Upper Saratown-Locali ty 2 •••••••••••••••••••••••••••••••••• 94
14. Female Life Tables with Five-Year Age Categories for the Samples from the Shannon Site and Upper Saratown-Locali ty 2 .........••.•..................... 95
15. Comparison of Life Expectancy at Birth of the Four Study Samples with Selected Archaeological Samples ••••••••• 97
16. Changing Measure of Niche Width for Faunal Resources Through Time using Lieberson's Diversity Formula in Pounds of Meat Contributed by Each Species ••••••••••••••••••••••••••• • ••• 107
17. Mean Trace Element Assays for the Adults in the Five Study Samples •••••••••••••••••••••••••••••••••••• 119
18. Mean Trace Element Assays for the Subadults in the Five Study Samples .................... .... ............ 120
19. Mean Trace Element and Lead Assays for the Shannon Site by Age Groups •••••••••••••••••••••••••••••••• 131
20. Mean Trace Element and Lead Assays for the Wall Site by Age Groups ••••••••••••••••••••••••••••••••••• 132
21. Mean Trace Element and Lead Assays for the Upper Saratown-Locality 1 by Age Groups ••••••••••••••••••• 133
22. Mean Trace Element and Lead Assays for the Upper Saratown-Locality 2 by Age Groups ••••••••••••••••••• 134
23. Mean Trace Element and Lead Assays for the Fredricks Site by Age Groups •••••••••••••••••••••••••••••• 135
24. Mean Trace Element and Lead Assays for the Shannon Site and Upper Saratown-Locality 2 by Sex ••••••••••••••••• 140
25. Mean Trace Element and Lead Assays for the Shannon Site Males by Age Groups •••••••••••••••••••••••••• 144
26. Mean Trace Element and Lead Assays for the Shannon Site Females by Age Groups ••••••••••••••• •• ••••••• 145
v

27. Comparison of Means F Test Results for Three Trace Elements by Sex and Age Group at the Shannon Site and Upper Saratown-Locality 2 ••••••.••••••••• 146
28. Mean Trace Element and Lead Assays for the Upper Saratown-Locality 2 Males by Age Groups ••••••••••••• 148
29 . Mean Trace Element and Lead Assays for the Upper Saratown-Locality 2 Females by Age Groups ••••••••••• 149
30. Summary of the Disease Categories by Percentage of Afflicted Individuals and by Percentge of Total Pathologies in the Four Study Samples ••••••••••••••• 159
31. Association of Burial Posture with Age, Sex and Adult/Subadult Categories at the Shannon Site ••••••••• 227
32. Association of Burial Pit Type with Age, Sex and Adult/Subadult Categories at the Shannon Site ••••••••. 228
33. Association of Grave Orientation with Age, Sex and Adult/Subadult Categories at the Shannon Site ••••• 230
34. Constrained Artifact Associations in the Shannon Site Sample . ...•................•................. 231
35. Summary of the Factor Analysis for the Shannon Site Sample ••••••••••••••••••••••••••••••••••••••. 2 3 4
36 . Summary of the 16 Groupings Defined by the Agglomerative Cluster Analysis for the Shannon Site Sample •••••••••••••••••••••••••• ••• •••••••••• 240
37. Average Adult Trace Element Assays by Cluster for the Agglomerative Cluster Analysis of the Shannon Site Sample •••••••••••••••••••••••••••••••• 245
38. Summary Description of the 11 Groupings Defined by the Monothetic Cluster Analysis for the Shannon Site Sample •••••••••••••••••••••••••••• • •••••••••• 247
39. Association of Burial Posture with Age , Sex and Adult/Subadult Categories at the Wall Site ••••• ••• •••• 256
40. Association of Burial Pit Type with Age, Sex and Adult/Subadult Categories at the Wall Site •••••••••••• 257
41. Association of Grave Orientation with Age, Sex and Adult/Subadult Categories at the Wall Site •••••••• 258
42. Association of Burial Posture with Age , Sex and Adult/Subadult Categories at Upper Saratown-Locali ty 2 ••••••••••••••••••••••••••••••••• •• •• •• 261
vi

43. Association of Burial Pit Type with Age , Sex and Adult/Subadult Categories at Upper Saratown-Locali ty 2 •• • •• • •. • ••.•••.•••••••••••.••••••.••.• 262
44 . Association of Grave Orienta t ion with Age , Sex and Adult/Subadult Categories at Upper Saratown-Locali ty 2 ••• • •••••••••••••••••••••• •• •• • ••• • •• •• 265
45. Constrained Artifact Associations in the Upper Saratown-Locality 2 Sample •••••••••••••••••• • •••• • •• 268
46. Summary of the Factor Analysis for the Upper Saratown-Locality 2 Sample •••••••••••••••••••••• •• •• 270
47. Summary of the 11 Groupings Defined by the Agglomerative Cl uster Analysis for the Upper Saratown-Locality 2 Sample ••••••••••••••• • •••.• • .••• 276
48 . Average Trace Element Assays by Agglomerative Cluster Analysis for the Upper Saratown-Locality 2 Sample • • •••••••••••••••• • •••• • • • • • • • •• 284
49. Summary Description of the Five Groupings Defined by the Monothetic Cluster Analysis for the Upper Saratown-Locality 2 Sample ••• ••• • • •••• ••••• • 286
50 . Association of Burial Posture with Age , Sex and Adult/Subadult Categories at the Fredricks Site ••• • ••••••• • ••• •• ••• • •••••••••••• • •••••••••• 296
51. Association of Burial Pit Type with Age , Sex and Adult/Subadult Categories at the Fredricks Site •• ••• . • • • •••• • •••• • •• • •• • •••••.• • ••••• • ••••• 297
52 . Association of Grave Orientation with Age , Sex and Adu lt/Subadult Categories at the Fredricks Site •••••••••••••.•• • •••.•• • •••••••••••••••••••• 299
53 . Constrained Artifact Associations in the Fredricks Site Sample •.• • ••••••••••••••.•••••••••• •• • . •••• 300
vii
LIST OF FIGURES
Figure Page
1. Location of the Archaeological Sites Used in this Study •••••••••••.•••••••••••••••••••••••••••• 20
2. Map of the Excavated Burials and Posthole Patterns at the Shannon Site ••••••••••••••••••••• 23
3. Map of Excavated Burials, Features, and Posthole Patterns at the Wall Site •••••••••••••••••••••••• 26
4. Map of the Excavated Burials, Features, and Postholes at the Upper Saratown-Locality 1 Site ••••••••••• 28
S. Map of the Excavated Burials and Posthole Patterns at Upper Saratown-Locality 2 ••••••••••••••••••••• 30
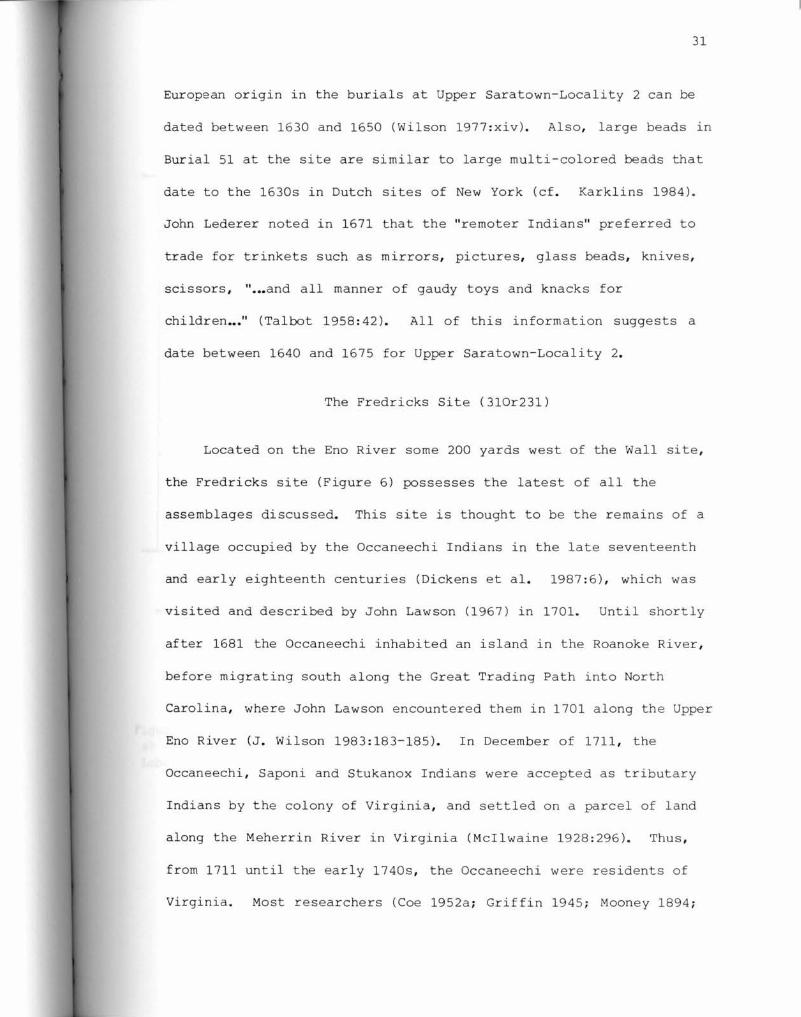
6. Map of the Excavated Burials, Features, and Posthole Patterns at the Fredricks Site ••••••••••••••••••• 32
7. Mortality Curves by 10 Year Age Groups for Four of the Study Samples ••••••••••••••••••••••••••••••••• 77
8. Mortality Curves by Sex for the Shannon and Upper Saratown-Locality 2 Samples ••••••••••••••••••••• 86
9. Monothetic Divisive Clusters Produced for the Artifacts Associated with the Shannon Site Burials ••••.•• 250
10. Monothetic Divisive Clusters Produced for the Artifacts Associated with the Upper Saratown-Locality 2 Burials •••••••••••••••••••••••••••••• 288
v iii

LIST OF PLATES
Plate Page
I. Healed Left Humerus Compared with Normal Right Humerus of Burial 1 from 310rll, the Wall Si te .•••••..•••• 162
II. Two Examples of Schmorl's Node or Herniated Disc from 310r231, the Fredricks Site ••••••••••.••••••.••••.••• 162
ix

ACKNOWLEDGEMENTS
I wish at this time to pause and thank a number of individuals
and institutions that contributed to the completion of this
dissertation. First, my heart-felt appreciation has to go to my
Ph.D. committee--George Holcomb, Julia Crane, William Pollitzer,
Richard Yarnell, and Vin Steponitis--for the help and direction they
provided me throughout this grueling, invigorating process. A very
special thanks is extended to George Holcomb who assumed the role of
advisor after the death of Roy Dickens.
I wish to thank the Research Laboratories of Anthropology, The
University of North Carolina at Chapel Hill for allowing me to make
use of the skeletal series from the Fredricks site, the Wall site ,
and the two Upper Saratown sites curated by that institution, for
providing me with the maps for the Fredricks and Wall sites, for
permitting me to use data concerning the archaeology of the
Fredricks site, Wall site, and the two Upper Saratown sites, and for
allowing me to photograph the bone e lements illustrated in Plates I
and II of this study.
The Shannon site skeletal series was made available for
analysis by Ed Garner of the National Museum of Natural History in
Washington, D.C •• The animal bone and field records from the
Shannon site were provided courtesy of Keith Egloff and the Virginia
Research Center for Archaeology in Yorktown, Virginia.
x

The trace element assays used in this investigation were
conducted by Benton Jones of the Department of Horticulture at the
University of Georgia in Athens.
Funding for the travel, trace element assays, computer
analyses, and numerous other expenses was provided in part by grants
from Sigma Xi and the Robert Bellemy Foundation of Miami, Florida.
Trace element assay of the Upper Saratown-Locality 2 burials was
made possible by a National Science Foundation grant directed by H.
Trawick Ward and R.P. Steven Davis of the Research Laboratories of
Anthropology.
The Clustan statistical package was used in this study through
t arhngement with the Department of Computational Science, University
of St. Andrews, St. Andrews, Scotland and the Tra ' ngle Universities
Computation Center.
A number of individuals have provided me with considerable
support and intellectual stimulation during my career in graduate
school, including Michael Trinkley, Estella Stansbury, Annie Holm,
~
,Chris Gremillion, Julie Hammett, Dan Simpkins, and Linda Carnes.
Two invaluable friends, Laura Castellanos and Sherry Paylor,
provided unlimited support and understanding during my dissertation
writing. Thanks guys.
To my parents Cy and Maryann, and my siblings, Ann and Cy, I
can only say thank you for your love, support, and understanding
during my years in graduate school.
And finally, to a very special individual, Jack Wilson, who
served as teacher, friend, companion , typist and map producer, thank
xi

you for invaluable help and persistence in my finishing this work.
I will always love you and regard you as a very special friend.
xii

CHAPTER I
INTRODUCTION
This study represents a bioarchaeological approach to the
investigation of culture change among the non-Catawba Indian groups
who inhabited the Piedmont of the Carolinas and Virginia during the
late prehistoric to contact period. Specifically, the effects of
European contact on these Indian groups will be investigated by
examining the change in biological characteristics and relationships
and in mortuary practices that occurred during this era.
Traditionally, these Piedmont Indians have been identifiej with the
Siouan linguistic and ethnic families (Griffin 1945 ; Mooney 1894;
Swanton 1946 ; J. Wilson 1983) , and have generally been thought to
have had a tribal type of sociocultural integration (Dickens et al .
1987; Navey 1982; Ward 1987 ; H. Wilson 1983a, 1983b; J. Wi l son
1983) .
Early European explorers upon arriving in the North Carolina
and Virginia Piedmont found the region inhabited by a number of
small Indian groups that researchers have come to associate with a
common culture and language. A linguistic category called "Siouan"
is identified with these Indians of the Piedmont and a number of
other Eastern Indian groups, who presumably spoke a language similar
to that of the Dakota Sioux of the Midwest (Lewis 1951 ; Mooney 1894 ;
Neumann 1 952 ; Swanton 1946) .
2
The category of Eastern Siouan into which the Piedmont Indians
ar2 placed is based primarily on linguistic evidence, which has
proven to be a tenuous form of evidence in the past (cf. J. Wilson
1983:588-591), geography (they all inhabited the Piedmont of
Virginia and the Carolinas), and history (most of the groups
amalgamated into two larger groups--the Catawba and the Fort
Christanna tributaries--generally identified as being Siouan) (Lewis
1951:1-2).
Lewis (1951:1-12) provides an excellent summary of the
linguistic evidence for the various Siouan identities and
affiliations, noting that word lists exist for only three of these
supposedly Siouan goups--the Catawba, the Tutela, and the Woccon.
The linguistic research among the Catawba Indians (Barton 1798,
Gallatin 1836, Lieber 1856, Mooney 1894, Morgan 1870), the Tutela
(Hale 1883, Mooney 1894), and the Woccon (Adelung and Vater 1816;
Gallatin 1836; Lawson 1967; Mooney 1894) has produced a number of
vocabularies for the Catawba, three small Tutela word lists obtained
during fieldwork among the last survivors of the Tutela resident
with the Iroquois-speaking Cayuga of New York (Frachtenberg 1913;
Hale 1883; Sapir 1913), and a list of 192 Woccon words provided by
John Lawson (1967) in his 1701 journal. The final conclusion that
can be reached concerning this research (Lewis 1951:7) is that there
are two basic divisions within the Siouan languages in general, but
particularly among the dialects spoken by the Indian groups of the
Carolina and Virginia Piedmont (Speck 1935:221; Swanton 1923:34).
This division is based in part on the general similarity of Catawba
to certain Muskogean languages (Michelson 1914:83-84, in Lewis

3
1951:6). Swanton (1932a:12; 1932b:66, in Lewis 1951:B) labels these
two groupings the "northern" division of Siouan Indians , composed of
those Virginia Indian groups historically related to the Tutela, and
a "southern" division of Siouan Indians, composed of those North
Carolina Indian groups historically associated with the Catawba
Indians. This division mirrors the perceived differences in the
Catawba and Tutela dialects , which are described by Siebert
(1945:103-104) as two "lexically dissimilar" languages. Lewis
(1951:10-11) provides the basic position that has guided the
research of the Siouan Indians of the Carolina and Virginia Piedmont
for the last four decades in the following four propositions:
1. Most of the tribes of the Carolinas and southern Virginia spoke dialects of the Siouan linguistic stock. 2. The Siouan-speaking tribes in Virginia and part of northern North Carolina spoke dialects related to one another and forming a "Tutela" or "northern" di vision of the eastern Siouanspeaking tribes, the language of this division being closely related to the languages of certain western Siouan-speaking tribes. 3. The remainder of the Siouan speaking tribes in the two Carolinas, including the Sara tribe , spoke dialects related to one another and forming a "Catawba" or "southern" division of the eastern Siouan-speaking tribes , the language of this division being rather different from that of the "northern" division and the western Siouan languages, and possibly related in some aspects to languages of the Muskhogean linguistic stock. 4. The linguistic differences between the two eastern divisions indicate other cultural differences, as yet unknown.
Lewis (1951:11) goes on to note that two major h ypotheses
constructed from these four generalizations can be investigated
through the use of archaeology and ethnohistory. These two
hypotheses state that

1. A territorially cot erminous group of tribes in Virginia and the Carolinas, speaking dialects of the Siouan linguistic stock, possessed a language and culture which differed significantly from that of other indigenous groups which bordered it. 2. Within this group there were linguistic differences of such cultural significance that the culture common to tribes of the "northern" unit differed from the culture common to tribes of the "southern" group".
Any research that is conducted on any of the Indian groups
4
traditionally assigned to either the northern or southern divisions
has to consider the implications of these two hypotheses for the
basic assumptions of that research.
From this early research into the Siouan-speaking Indians of
the Carolinas and Virginia, the Indian groups of the Carolina and
Virginia Piedmont have traditionally been divided as follows. In
the "northern" division are the Indians who resided at Fort
Christanna in Virginia as tributaries--the Sapona, Tutelo,
Occaneechi, and Stukanox, with the last-named group comprising the
remains of the Manakens and the other Indians of the "Monacan
Confederacey" of Virginia (Swanton 1946:201; Griffin 1945:321; J.
Wilson 1983 : 4). The "southern" division of the Siouans are thos e
groups that are thought to have incorporated with the Catawba
Indians by the 1740s, including the Eno, Sara (Cheraw) , Keyauwee ,
Shakori (Shoccores), Pedee (Pedea) Congaree , Wateree, and Santee
(Swanton 1946: 110 ; Griffin 1945: 321 ; J. Wilson 1983':4-5).
This general interpretation of the cultural geography of the
Carolina and Virginia Piedmont has not gone unchallenged. Carl
Miller (1957) re-examined the primary and secondary sources for
three of the northern division Indian groups--the Occaneechi ,

5
Saponi, and Tutelo. He concluded that their language was similar to
the Algonkian spoken by the Indians of the Northeast and Middle
Atlantic Coast (Miller 1957:115-211). The problem of the differing
linguistic identifications , ethnic affinity, and the cultural
composition and affiliati~ns of the Piedmont Indian groups is
addressed in Chapters III, VII, and VIII of this study.
In addition to the linguistic designation, another Eastern
Siouan category has been devised based on the physical
characteristics of certain Eastern Indians. Georg K. Neumann
(1952:31) attempted to "provide a framework for the reconstruction
of the racial history of the American Indian." Toward this end,
eight human physical varieties were defined by Neumann (1952) for
the Indians, with much of his work being built on Hrdlicka's (1916)
study of a Monsee Indian cemetery in Delaware. Neumann (1952:33)
recognized that considerable revisions to his work would be required
as additional information became available, because, as he noted,
the
means of a few conventional measurements and indices do not tend to be diagnostic. In order to characterize each variety, it therefore becomes necessary to combine them with brief morphological descriptions.
In North Carolina, archaeological and ethnohistorical studies
(Coe 1952a, 1952b; Coe and Lewis 1952; Coe et al . 1982; Dickens
1976; Keel 1976; Lewis 1951 ; Navey 1982; Phelps 198 3 ; J. Wilson
1983) have identified four distinct cultural groups: the Algonquians
and Tuscarora along the Northeast Coast and Coastal Plain; the
Siouans of the Piedmont and the Southern Coast and Coastal Plain ;
the Muskhogeans in the Pi e dmont ; and the Cherokee in the Mountains .

6
Using Neumann ' s physical typology , correlations can be suggested for
the Lenapid variety and the Algonkians, the Iswanid variety and the
Siouans , and the Cherokee and Muskhogeans with the Walcolid variety.
These general correlations have been verified by a number of
morphological studies including Neumann (n. d. ) , Pollitzer (1971),
and Coe et al. (1982). What has yet t8 be demonstrated is an
identical correlation between physical type, linguistic class, and
culture type.
Recently Ubelaker (1978:88) has noted that
many of the errors [misuse of biological data] stem from adherence to the discredited "typological" definition of a population. According to this view , a certain set of traits identify a "type" and all individuals possessing these traits belong to the same class. Among biologists, this thinking has been replaced by "population thinking", which r e cognized that all levels of biological difference •• incorporate a range of variation. ;
Robbins (1977) has expressed similar disagreement with the tendancey
to emphasize only description or morphology of skeletal series. She
(Robbins 1977:1) states that the typological approach fails to
investigate the "adaptive significance of the phenotypic variat ion"
within study samples or populations.
A variety of me tric and nonmetric techniques have been
developed to determine intra- and inter-population relationships.
Both multivariate and univariate techniques are being used to
determine the parameters of population dynamics . There is an
increased tendency to discuss biological distance, based on the
degree of morpho logical similarity of the populations under study
(Ubelaker 1978 : 87-88) . Although the typological approach and
redirection toward population dynamics offer somewhat different

7
results, both ultimately contribute to a thorough understanding of
the physical remains of past peoples (cf. Robbins 1977:11).
From this discussion it is evident that the data supporting
these categorizations have b een sparse and that more data are
necessary before the general characterization of the Indians of the
Virginia and Carolina Piedmont as speaking a common Siouan language,
possessing a particular physical morphology, and sharing a common
culture can be accepted, if that is a valid goal of research.
Obviously, archaeology will not indicate what language a particular
people spoke, and it is important to recognize that there is no
necessary relationship between the language spoken , physical type ,
and cultural assemblage of Indian groups. It is possible, however,
that a breeding population the members of which speak a common
language will produce a patterned cultural assemblage (R. S.
Dickens, personal communication, 1983). It is the task of the
archaeologist to delineate these patterns , and to isolate , describe,
and analyze culture change and continuity through time in order to
better understand the underlying forces of human behavior. To
accomplish these tasks in this case, the systematic collection and
study of information concerning the aboriginal inhabitants of the
North Carolina and Virginia Piedmont is necessary. A major part of
such an investigation involves the analysis of demographic and
mortuary data derived from archaeological contexts.
Although archaeologists have been studying the Piedmont Siouan
Indians for over 50 years (Benthall 1969; Coe 1937, 1952a, 1964,
n.d .; Coe and Lewis 1952; Dickens et al. 1986 , 1987a; Gardner 1980;
Griffin 1945; Kee l 1972; Lewis 1951 ; Ward 1983; J. Wilson 1977 ,

1981, 1982 , 1983), it is only within the last two decades that
investigations involving biocultural data have been conducted
8
(Graham 1973; Mecklenburg 1969 ; Navey 1982 ; H. Wilson 1985 , 1987) .
Graham (1973) includes two Siouan burials in her examination of the
dentition of 26 individuals from the Town Creek Indian Mound. This
temple mound and associated cere~onial area is located on the Little
River in central North Carolina. The mound complex itself dates to
the late prehistoric/early protohistoric period (A.O. 1450-1600) and
possesses an intrusive, late-seventeenth century contact-period
component that is presumably Siouan (J. Wilson 1983:xii-xiii) .
Graham ' s study focuses on the effects of subsistence and cultural
traits on dentition. Her research is very limited in reference to
the Siouan population that inhabited the site , given that only two
of the individuals in the study are Siouan. Demographic data,
mortuary behavior , and other biocultural information is not included
in her endeavor.
Mecklenburg' s (1969) work utilizes data on 106 burials from the
Shannon site, a possible Siouan occupation on t h e Upper Roanoke
River in Montgomery County , Virginia. Her research makes use of
information from the skeletal remains concerning age, sex , cranial
indices , and pathologies to investigate questions concerning the
representativeness, the ethnic identity , and the general health of
the population sample. Unfortunately, data concerning mortuary
behavior is not included in the study.
The most extensive biocultural study of the Piedmont Siouan
Indians is Navey ' s (1982) exam ination of the skeletal remains and
associated grave goods from 87 burials at Upper Saratown (31Skla) ,

9
a late-protohistoric/early-contact-period Siouan village located on
the Dan River in north central North Carolina (see Chapter II).
Results of the analyses of the demographic characteristics and
mortuary patterns of the sample are used by Navey to test Binford's
(1971:18) proposition that there is a correlation between the
complexity of the structure of a culture and the complexity of the
group' s mortuary behavior. Based on the age , sex, and grave
associations of each burial , Navey (1982:192) concludes that the
similar treatment accorded adults and subadults in Upper Saratown's
mortuary complex does not correspond to the predictions of Binford' s
simple versus complex socio-cultural systems.
A recent study by Sorohan (1985) compares the dental
pathologies exhibited by a late prehistoric/protohistoric period
skeletal series with those of a contact period skeletal series in
order to investigate the possible effects of European contact,
especially changes in subsistence, on the Siouan Indian groups. The
results of Sorohan's (1985:54) preliminary study indicate an overall
increase in dental pathologies in the contact period sample.
In general , the investigations discussed above that utilize
skeletal remains to study Siouan Indian populations are
particularistic in nature and/or consider only a few of the
biocultural data sets available for study. Mecklenburg ' s analysis
addresses questions pertaining to ethnicity, demography , and
pathologies , whereas Graham a nd Sorohan are concerned with the
effects of the environment and behavior on the dentition as
evidenced by dental pathologies . While Navey ' s work is the most
intensive biocultural study of any Siouan population, demographic

10
and mortuary data are only utilized to test a hypothesized
relationship between complexity of mortuary practices and complexity
of social organization. It is apparent, however, that enough
information exists to warrent a biocultural study of the Siouan
Indian groups of the Carolina and Virginia Piedmont that integrates
demography, subsistence practices, disease states, ethnicity, and
mortuary data.
Research Methods and Objectives
Within archaeology in general, and in this investigation of
continuity and change in the biocultural aspect of Siouan culture,
three theoretical levels of inquiry can be identified. On what can
be described as the "high" plane of general theory, generalizations
about culture can be achieved at the expense of explaining much of
the actual variation that exists. At this high level, consideration
of diversity becomes lost in the search for generalizations (Smith
and Winterhalder 1981:4, 7). In order to give meaning to the lowest
level of inquiry, the particularistic approach to the study of
discrete cultural units, a middle level of theory has been proposed
(cf. Binford 1977:7-9; 1983:31-39).
Considering first the "high" plane of theoretical explanation,
the concepts of open and closed communities, first proposed by
Durkheim in his investigation of religion (Evans-Pritchard 1965:54-
55), provide a framework for the study of continuity and change in
the biocultural aspect of Siouan culture. A closed community is
characterized by a "religion" (culture traits ?) that is transmitted
from one generation to another. This religion exists before an

11
individual enters a society at birth and will continue after that
_person exits the society through death (or , presumably, some other
means) . Thus , religion is acquired by being born into a particular
society, and is obligatory, as an individual has no option but to
accept that to which everybody gives common assent. In an open
society on the other hand , religious beliefs may not be transmitte d
at birth; religion is diversified ; and religious beliefs are less
obligatory, as individuals have a choice (Evans-Pritchard 1965:54-
55) .
By including other cultural traits (behavior patterns) with
religion in this consideration of Siouan culture change and
continuity, it is suggested that prior to European contact , the
Siouan Indian groups of the Piedmont exhibited characteristics of a
closed community. After contact , an open society, or diversity,
becomes necessary for either adaptive purposes (cf. Sahlins and
Service 1973:46-47) , or because people from different societies we re
interacting more and eventually joining together (cf. Evans
Pritchard 1965:55) . Archaeologically, the contact period situation
would be reflected in increased diversity in the morphology of the
population , diet, and mortuary patterns at sites over that noted at
pre-contact period sites. Greater diversity in the ty_pes of
pathologies exhibited by contact period populations might also occur
as individuals from different environments with different stresses
would be clustered together in a composite population.
At the low or particularistic level of investigation and
theory , diversity is accounted for in aggregate, but is not
explained in a theoretical fashion (Smith and Winterhalder 1981:4).

12
For example , the level of sociocultural integration (cf. Steward
1 955) of many prehistoric and contact period aboriginal societies in
the Southeast has been defined as either "tribes" or "chiefdoms",
but no explanation of how such a level of sociocultural integration
came about is offered. Service (1962:113-115) states that the
reason for a tribe to exist is basically conflict , which can be
interpre ted more broadly as competition, over scarce resources .
Tribes can be defined, as opposed to explained, as boundable systems
of relationships whose devices for connecting members are
sodalities, cross-cutting associations devoted to kinship
affiliations, age grades , secret societies , and ritual
configuration. The major institutions of social control are
manifested in roles and egalitarian statuses that have no
governmental function (Service 1962:111). Tribes are adaptive as
they provide the alliance and solidarity needed to cope with a
certain level of competition (Service 1962:12).
Chiefdoms are profoundly non-egalitarian , with the "chief"
having the ability to plan, organize , and deploy public labor
(Service 1962 : 150) . Chiefdoms transcend the tribe in two respects.
Chiefdoms represent a denser and usually larger and more populous
society made possible by greater productivity. And chiefdoms are
more complex and more organized. Redistribution of goods by a
central agent or agency is another characteristic associated with a
chiefdom (Service 1962:143).
The use of any typology, including that which contains tribes
and chiefdoms, to define particular aboriginal groups, societies ,
cultural systems, etc., is not especially useful , except possibly at

the synchronic level of inquiry. It is more useful to be able to
consider the groups , societies , cultural systems , etc., within an
evolutionary framework , i . e . change through time , and to address
questions of why and how the different types such as tribes and
chiefdoms change and develop.
13
In this study , it is hypothesized that the late prehistoric
Siouan societies possessed egalitarian social systems , or , for lack
of a better description , tribal types of social organization. With
increased conflict/competition brought about by European contact, a
tribal type of sociocultural integration would have been necessary
for the aboriginal societies. This follows from Service ' s
(1962 : 113-115) observations that tribal units are adaptive in the
face of conflict. It is also hypothesized that with the advent of
European contact , a more complex tribal organization would be
necessary to accommodate integration of previously autonomous tribal
units that occurred, i.e. , more stringent rules may have been
necessary for the different people to live together. Such an
increase in complexity might be reflected in differential diets for
certain segments of a population , and a more complex mortuary
pattern.
The third level of inquiry involves middle-level theory.
Models at the middle level of investigation are formulated with
attention given to both the diversity present and the formulation of
generalizations (S mith and Winterhalder 1981:7) . Generally, middle
range theory concerns the formation processes of the archaeological
record. The primary question that can be asked is what processes
responsible for change and diversification are reflected in

15
the southeast exhibited immediately prior to the appearance of
European explorers (Leacock 1971:9-10; J. Wilson 1983:35, 572-573).
The protohistoric period is represented by early, sporadic contacts,
either directly with European explorers , missionaries and traders,
or indirectly via goods traded through other Indians who acted as
intermediaries (Leacock 1971:11; J. Wilson 1983:36, 575) .
Interaction between the Europeans and the Indian groups during the
protohistoric perid was fleeting and non-lasting. The contact
period in the Carolina Piedmont is the time when direct and ongoing
interaction between the Indians of the region and the Europeans (the
English in this case) was established. The early part of this
period from circa 1665 until 1675-1680, which roughly covers the
time from planning and establishment of the English settlement at
Charlestown in 1670 and the defeat of the Occaneechi by Nathaniel
Bacon in 1676 to their subsequent removal into North Carolina from
the Roanoke River drainage (J. Wilson 1983:575; 1987), can be
separated from the later contact period. The middle contact period
covers the years of interaction between the Indians and the Euro
Americans before the migration of the Piedmont Indians southward
into South Carolina or to Fort Christanna in Virginia , a process
completed by 1712 (J. Wilson 1983:576; 1987).
The two general questions that are the focus of this study are
how the Siouan biocultural systems changed from the late prehistoric
to the contact period, when Europeans appeared in North Carolina and
Virginia; and what are the effects of contact upon the overall
health of the Siouan populations.

16
Research Techniques
Mortuary and population data from five areas of inquiry-
consideration of biological continuity, studies of demographics,
assessment of trace element levels in skeletal remains , analysis of
pathologies , and examination of patterning in the mortuary practices
--are used here to study the changing patterns of behavior of these
Indian groups .
Information about the possible biological connections between
late prehistoric and/or contact populations , and the extent of
population disruption and movement following contact, is provided by
the study of the skeletal material using both metric (cranial and
post-cranial indices) and non-metric (discrete skeletal traits)
techniques of analysis. Non-metric data are utilized in formulae
for measuring sample diversity (cf . Lieberson 1969) and divergence
(cf . Bu ikstra 1976) in order to eval uate the amount of variation
within a population sample and the biological distance between
population samples. The metric data consist of measurements and
calculated indices for cranial and postcrania l remains , and stature
estimates , which are used to investigate the similarities and
differences within and between the study samples .
Demographic analyses provide information pertinent to the study
of the overall health and fitness of the samples. Changes in the
mortality rates of certain age and sex groups would be expected
among the study samples given the disruptions of the environment
(considered in this study to consist of natural and cultural
components) of the Piedmont Indian groups during contact with the
Europeans. Lif e e xpectancies would also be expected to change

17
during the contact period with the introduction of additional
stresses related to European diseases and the skin/fur trade, and an
increase in existing stresses , such as warfare, in the environment.
Assuming that the environment of the Piedmont region remained
relatively constant with respect to food resources from the late
prehistoric to contact periods , changes in the diet of individuals
within populations can be investigated through trace element
analysis of human bone samples. By monitoring the concentrations of
such trace elements as zinc , copper , magnesium and strontium, it is
possible to estimate the relative contributions of floral and faunal
resources to the diet of both individuals and groups of individuals
(Szpunar et al. 1978).
Although some diseases , such as influenza and measles, leave no
marks on skeletal remains, and only· preliminary results have been
obtained in the study of the effects of smallpox on bone material
recovered from an archaeological context (cf. Jackes 1983),
consideration of bone pathologies can provide additional insights
into the presence of disease-induced stress. Categories of bone
pathologies and the occurrence of the respective types of
pathologies in the study samples are compared between samples to
assess whether more stress is evident in the contact period than in
pre-contact times. For example , changes in the frequencies of
certain types of pathologies , such as cut and puncture wounds, might
be expected in a contact-period population sample within an
environment in which warfare is a prominent feature.
The fifth line of inquiry involves consideration of mortuary
practices, a domain that includes data from the other four lines of

18
inquiry. Attributes concerning such characteristics as age and sex,
diet, and mortuary b2havior are integrated to investigate possible
differences across space and changes through time in status and
social organization that mark the study samples. Although these
Siouan groups are generally considered to have been tribal
societies, there occurred changes in the sociocultural composition
that can be studied through an examination of the mortuary practices
of the study populations (cf. O'Shea 1984).

CHAPTER II
THE ARCHAEOLOGICAL SITES AND STUDY POPULATIONS
The data utilized in this work are drawn from archaeological
sites of the Piedmont region of North Carolina and Virginia. The
boundaries of the study area are formed by the Roanoke River in
Virginia to the north , the Eno River in North Carolina to the south,
the Fall Line to the east , and the Blue Ridge Mountains to the west
(Figure 1) .
Five archaeological sites are available for use in this study
(Table 1). These are the Shannon site (44My8) , late prehistori c ;
Wall site (310rll), late prehistoric/protohistoric; Upper Saratown
Locality 1 (31Skl) , protohistoric; Upper Saratown-Locality 2
(31Skla) , late protohistoric/early contact; and the Fredricks site
(310r231) , middle contact. These sites are included in this study
because each represents a different temporal span of the Indian
occupation of the Piedmont. Also , two of the sites, Shannon and
Upper Saratown, have skeletal series that number approximately 100
individuals. Unfortunately , the Wall and Fredricks site s o n t he Eno
River and Upper Saratown-Locality 1 on the Dan River in North
Carolina have considerably smaller samples , but they are
incorporated into this study as they are the only skele tal mate rial
from the appropriate temporal periods available for the

Notlh C.s,ol1nJ ' I
I
, ,c•t•• •• •, , "'•
~
20ml
Figure 1 . Location of the archaeological sites considered in this study .
N
N 0
21
'lN3LE 1.
Identified Sites arrl their Posited TffilfOral arrl Cultural Affiliatim.
SITE 'I'EMEaW, PERIOO LCCATICN AFFILIATICN
Ehmn:n (44My8) Late Prehistoric Rcanoke River Tutelo (?)
(ca., A.D. 1450 -1525)
r..o...er Sarat:.o..vn Late Prehistoric Can River Sara (?)
(31Rkl) (ca., A.D. 14:0-1525)
Reedy Creek Late Prehistoric Can River Sap:na (?)
(44Ha22) (ca., A.D. 14:0-1525) or Tutelo (?)
Wall ( 310:rll) I.ate Prehistoric/ Ero River Possibly Early Protohistoric Siouan or (ca., A.D. 1547) Ircquoian
l.Jg;er Sarat:.ov.n- Protohistoric Can River Sara I..cx::ality 1 (31Skl) (ca., A.D. lEar
1630)
l.Jg;er Sarat:.ov.n- I.ate Protohistoric/ Can River Sara I..cx::ality 2 (31Skla) F.ar 1 y ca.tact ( ca. ,
A.D. 1630-1665)
Fredricks Mid:lle Q:ntact Eh:> River Cb::::aneechi (310r231) (ca., A.D. 168}-
1712)

region. The following section discusses each site and its
r espective archaeological assemblage in detail .
The Shannon Site (44My8)
22
The Shannon site (Figure 2) is situated on the North Fork of
the Roanoke River in Montgomery County, Virginia . It is
approximately 5 miles east of Blacksburg, Virginia, and 20 miles
north of the main channel of the Roanoke River . The site lies
within the Ellett Valley , a subsection of the Roanoke Valley, at an
elevation of 1500 feet above sea level. The topography of the
Ellett Valley consists of gently sloping terrain with low ridges
extending from the mountains to the edge of the river flood-plain .
The Roanoke River has extensively eroded the flood-plain , creating
numerous knolls and ridges, and exposing the underlying sediments in
a number of locations. Flood-deposited silts containing quartzite,
jasper, and chert pebbles, utilized by the aboriginal inhabitants of
the valley, are found in most low lying areas. The valley was once
covered by oak-hickory climax forest, interspersed with clearings in
various stages of succession (Benthall 1969:1).
Prior to the appearance of white settlers in 1750, the area is
thought to have been the home of the Siouan-speaking Tutela Indians
(Benthall 1969:ix). Swanton (1946 :178) places the "Totero" (Tutela)
village visited in 1671 by Thomas Batts and Robert Fallam on the
Roanoke River near Salem , Virginia , some 20 miles east of the Shannon
site. Later , the Tutela are thought to have moved to an island in
the Roanoke River near its confluence with the Dan River (Swanton
1946 : 200) . In 1701 , John Lawson (1967:53) located the Tutela near

: O li a7 p
2 b 0
;q 24 23 0 .'",,
·.: .. ..
.. 21,'.·
'-?!.))~:
·• .... ::
.·•· ....... · ;, ... J···-\ ;_;;~al j ,::!; ........ .
:g.84 , ..
. ~·· .,.
SHANNON SITE
44My 8
o BURIAL PIT
23
211 BURIAL NUMBER ·· .. POSTHOL ES
25 h:cl
Figure 2 . Map of the excavated burials and posthole patterns at the Shannon Site . (Adapted from Benthall 1969 using data furnished by the Virginia Research Center for Archaeology).

24
the headwaters of the Yadkin River. In 1711, the Tutelo were
accepted as tributary Indians by the colony of Virginia, and were
settled with the Saponi and Occaneechi Indians first on the Meherrin
River (Mcilwaine 1928:307-310), and later in 1714 at Fort Christanna
(Brock 1882:88). About 1740, the Tutelo and the other Indian groups
joined with the Saponi moved northward and were incorporated with the
Iroqu~is Indians, being settled for a time on the Susquehanna River
at an Indian vi llage known as "Shamokin" (Mooney 1894: 50; Swanton
1946: 1 78) •
Although the ethnic affiliation of the prehistoric Shannon site
inhabitants with the historically known Tutelo Indians is based
primarily on circumstantial evidence (cf. Benthall 1969:147-148;
Mecklenburg 1969), portions of the material culture do reflect
Siouan influences. Ceramics at the Shannon site include both
Clarksville and Dan River series sherds (Benthall 1969:147), which
are traditionally associated with Siouan Indian occupations of the
late prehistoric period (Coe and Lewis 1952; Lewis 1951: 214-264; J.
Wilson 1983:314-315). Radford Series ceramics are the predominant
pottery at the site, and show numerous similarities to the
Clarksville Series in rim profiles, surface decorations, handles,
surface treatment and vesse l shape (Benthall 1969:147). The only
difference in the two is that Radford ceramics are tempered with
crushed limestone and Clarkesville ceramics are tempered with fine
to medium sand (Benthall 1969:116, 123, 147).
The skeletal sample from the Shannon site consists of 129
burials curated at the National Museum of Natural History in
Washington, D.C •• Unfortunately, provenience information for 29 of

25
these burials is missing. Therefor e , only the 100 burials with
provenience information are included in this study. Of these 100
burials, four with nothing more than burial numbers and location had
to be excluded from the analysis. Burial data utilized are derived
from Benthall (1969), from field records housed at the Division of
Historic Landmarks, Virginia Department of Conservation and Historic
Resources, Richmond, Virginia, and from original analyses conducted
by the author.
The Wall Site (310rll)
The Wall site is located in a bend of the Eno River near
Hillsborough, North Carolina. Excavations were conducted at this
site in the summer of 1937, late fall and winter of 1940, and the
summers of 1983 and 1984 by the Research Laboratories of
Anthropology, The University of North Carolina at Chapel Hill
(Figure 3). The earlier excavations were part of a WPA program
administered through The University of North Carolina under the
direction of Robert Wauchope and Joffre L. Coe. An area of 14,225
square feet was excavated by this early work, and five burials were
exposed (J. Wilson 1983: 342 ).
The work conducted during the 1980s was part of the revised
Siouan Project coordinated by Roy S. Dickens, Jr .• Three additional
burials were uncovered at the Wall site by the 1983 excavations.
Combined, the excavations have revealed the greater part of a
palisaded village with at least 73 features and 12 structures
(Petherick 1987:30-49). c14 assays date the Wall site occupation to
A.O. 1545 +BO years , which lies within the late prehistoric/early

D D
(343R466)
.. , .. ··"""
300 -
280 -
(U7R630)
220 -
- l203R446)
1eo -I I I
J J ~ 0:
1 N
0
I
I
WALL SITE
A-L Structures
I-'ll: Palisades
F Feature
B Burial
20 40
feet
I
i
eo
I
J
Figure 3. Map of the excavated burials, features, and posthole patterns at the Wall site. (Map provided courtesy of the Research Laboratories of Anthropology, UNC-Chapel Hill).
26

27
protohistoric period (Dickens et al. 1987:6), Again, no definite
ethnic relationship can be documented for the Wall site at this
t ime, although Coe (1 952a:310-311) originally identified the site
with the historic Occaneechi of 1700. Recent analyses of the
ceramics from the site suggest a possible non-Siouan affiliation for
the site however (Davis 1987:214; J , Wilson 1983:369). The Wall
site ceramics are similar to those found at the later Fredricks site
located within 100 yards of the Wall site (Davis 1987:213-214), with
the later materials being identified with a 1701 village of the
Occaneechi Indians (see below), an Indian group that had
traditionally been identified as Siouan (cf. Mooney 1894; Swanton
1946; Coe 1952a).
Upper Saratown-Locality 1 (31Skl)
The earlier of the two Upper Saratown sites, Locality 1 (31Skl)
is situated on the Dan River near Walnut Cove in Stokes County,
North Carolina. Excavations at this site were conducted by the
Research Laboratories of Anthropology under the direction of Jack
Wilson during the summer of 1981. These excavations were conducted
to provide preliminary information pertinent to a study of the
cultural continuity and change of the Indians who had lived within
this section of the Dan River (J, Wilson 1983:378). A total of 40
features and 6 burials were uncovered by this initial work at the
site (Figure 4). The only European items recovered from the
undisturbed areas of the excavations were 2 blue glass trade beads ,
a piece of brass scrap, and one peach pit. These artifacts reflect
a low level of interaction with the Europeans and suggest a

~
5 tt.
50R240
• •
•
31 Sk 1
D BURIAL
[Z) FEAT URE
BJ POTHO LE
[Z) RIVER
•" PO ST HO LE
86 BURIA L NUMB ER
Figure 4. Map of the excavated burials , features , and postholes at the Upper Saratown-Locality 1 site. (Adapted from J . Wilson 1983 using data furnished by the Research Laboratories of Anthropology , UNC-Chapel Hill) .
28

protohistoric period occupation for the site (J. Wilson 1983:385;
1987), which would date between 1600 and 1640.
29
Mooney (1894), Swanton (1946), and Lewis (1951) identify the
Sara Indians as inhabitants of this area of the Dan River during
historic times. Certainly the material culture of these sites
along the Dan River has long been associated by archaeologists with
the Siouan Sara Indians (Griffin 1945; Lewis 1951; Coe 1952a; Coe
1952b; J. Wilson 1983). Apparently , the Dan River was home to the
Sara Indians until sometime in the first decade of the eighteenth
century, for by 1712 they had moved south to the Pee Dee River in
South Carolina (J. Wilson 1983:192-194).
Upper Saratown-Locality 2 (31Skla)
Located some 500 yards south of 31Skl on the Dan River is the
site of 31Skla, Upper Saratown-Locality 2. Excavations were
initiated at this site in 1972 in an attempt to salvage information
that was being actively destroyed by relic hunters. To date some
16,400 square feet of the site have been excavated (Figure 5) , with
225 features, 111 burials, portions of at least 4 palisade lines,
and all or part of 13 house structures being documented (J. Wilson
1983: 414) . As noted above, these remains are associated with the
Siouan Sara Indians. Given the types of European trade artifacts
present (glass beads , worked brass, brass bells, and a few iron
items such as scissors , a hoe, an axe, and a spike/chisel) and the
European artifacts absent (guns, metal containers, clothing
articles) (J. Wilson 1983:416-424), this site can be dated to the
late protohistoric/early contact period. Two metal spoons of
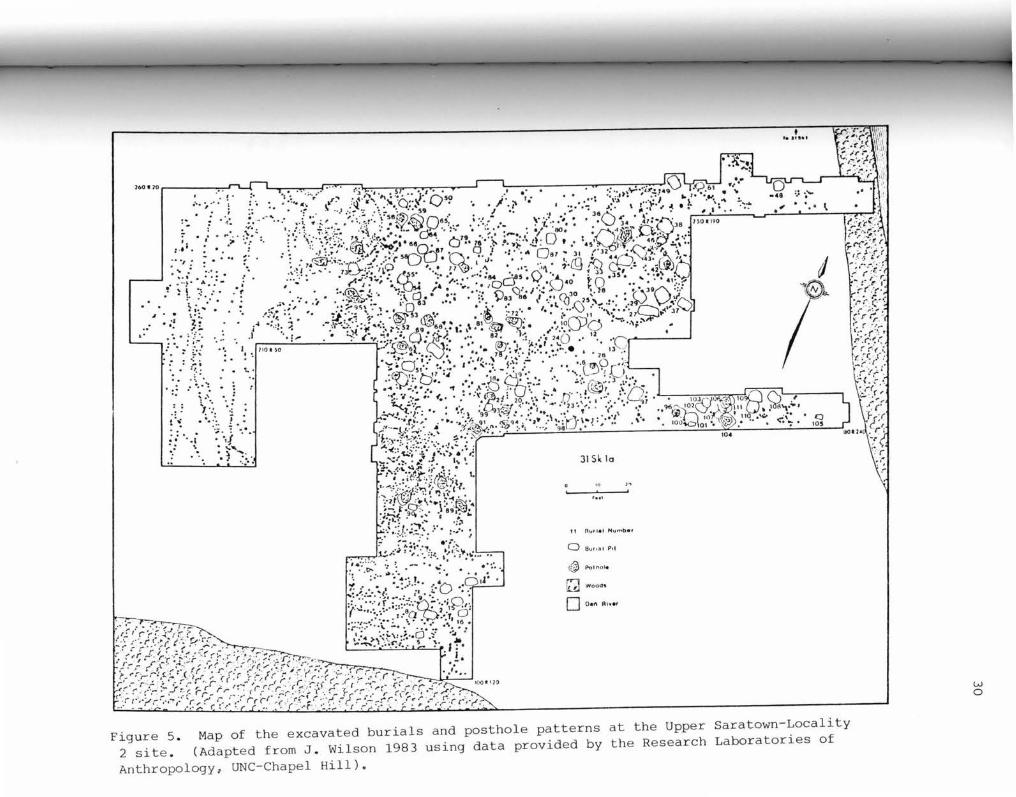
Figure 5 . Map of the excavated burials and posthole patterns at the Upper Saratown-Locality 2 site . (Adapted from J . Wilson 1983 using data provided by the Research Laboratories of
Anthropology, UNC-Chapel Hill).
w 0
31
European origin in the burials at Upper Saratown-Locality 2 can be
dated between 1630 and 1650 (Wilson 1977 :xiv) . Also, large beads in
Burial 51 at the site are similar to large multi-colored beads that
date to the 1630s in Dutch sites of New York (cf . Karklins 1984).
John Lederer noted in 1671 that the "remoter Indians" preferred to
t rade for trinkets such as mirrors , pictures , glass beads , knives,
s cissors , " ••• and all manner of gaudy toys and knacks for
children ••• " (Talbot 1958 : 42) . All of this information suggests a
date between 1640 and 1675 for Upper Saratown-Locality 2.
The Fredricks Site (310r231)
Located on the Eno River some 200 yards west of the Wall site ,
t he Fredricks site (Figure 6) possesses the latest of all the
a ssemblages discussed. This site is thought to be the remains of a
village occupied by the Occaneechi Indians in the late seventeenth
and early eighteenth centuries (Dickens et al . 1987:6) , which was
visited and described by John Lawson (1967) in 1701. Until shortly
after 1681 the Occaneechi inhabited a n island in the Roanoke River ,
before migrating south along the Great Trading Path into North
Carolina , where John Lawson encountered them in 1701 along the Upper
Eno River (J . Wi l son 1983 : 183-185) . In December of 1711 , the
Occaneechi , Saponi and Stukanox Indians were accepted as tributary
Indians by the colony of Virginia , and settled on a parcel of land
along the Meherrin River in Virginia (Mcilwaine 1928:296). Thus,
from 1711 until the early 1740s , the Occaneechi were residents of
Virginia . Most r esearchers (Coe 1952a ; Griffin 1945; Mooney 1894;

32
0-"· -,-----------------f1' ~ ,.~,!uA.. . •.
11.•.,• o ·• "• ,,. .N •, • •6'•" •. ~ . , .• . • . • ·- " • ·~,- f'I • ,.':, ·.:...
U ··;~: 001
: )~:·,;._.·· ~~~:-~?'.:: o· ' .. ·: ·. : .. · . ·.~· ·.;,•. •, <J •-/'J :;.~~' :"'·~;··~ .. ,-~••:-·••.,:,.,,,.. ,· "' (f.••,M ~~· .. I .. •• •" ll-• • ' , • ', ~ ,, .. Ho • t • • :'."'- ,I 'IJj~,n
.; tf"!tol... . •. 0 • 0 •l}, o1,.. .. • . •• •• •.• hi ••
-"r--'T"-.-•. ;. :.?/{{{:, \:?~t:;~; .. i··.' :·;~<·,, ··:.'---------, : ..... /··-'.'. ::'~-~ .. :.:: . . ,_,;~~\~. ·:·<:\~ .. ..: ·:·~;.'. .· .. : . . ;R· . 11i;··.-::.
o : ·/ · :.· ·er .. 11 .• ',..t·~\~.;'A°· ~-: .1, ~, ....... ,.,·: ·~. :. . . · . ~ ··.·::-. · . · sr· ;. ·. \!:3. · -~. · · ... • · · . ~ · .. ·. · D •· • • • ' ~ 1 (, ,., ,_If S~'""·t ' . . ' • , ' . , •f ',_. ,•~.:,.,: , , .~ ... · ~' • •
.'.( ~ ~ 1. · ··,. · · , , • • • , , ·,. '"!'.'''~ • ,;r IO ~ .. ~; .· : • • ~ .'·;:1;_~.v- . . :;·.";... ,;,·i::, .. ... ·, .... " ••. ~. ' 0 I , : ,~t\. A ~·:"
•• !, •'' i( · '• •.•,, '• '~ '";.?. .. • · (v,, ,1 , .'<: • •; [) , ', , •.'' \ .,:•ii,!! ,i!),•• • . . . ·. • / •• .. ~- . -~- • .• ~ ·. • . . .,. ,· : • •' , ·,.,.. if:f.!~ ,i; , , ' • '•"""' , · '. ·· ' •"• • ... •• ·,,•,. I • . • ... cj .• ~ , ·,,',
., .. t• n. ·,o · · · • . u .·.- o ·. .:·{: ;·· . ·. ·, ,, .- :··· ·, · · ~"~ a
.. ···:.::·,·:·····:·:·-. . ':· ·' 0. ·- . ~, '· Aft' ./' .. ... 0 0 · • . .•• • . . : · . ~ ; . . . : • •. • • '· .•• - .. . . ~-·· .· _... . .... ~ ... ,,' ... .. .•, .. Q'•ll ·: :. .. • ... . '·~ . . ,,, .• 2\· ,,_ o-..... . , .
.. ,, ;1, • · ~ . "' q_ ·,, ;. . ::1-.· .. ·' .. .• ·.~ : '<.'.) . :i~ . ..~. •' ',/,. ;N:.:l_;J;• • J;j.lv • •, .. •!: , ~·;•~ ; ' i "i: • j,,··.~. • '\
f (a ft' .. ·.·. ;." ;~:/~(t't:f f:.\' .. ! • ·. " ,. .• 0 . ,i • ,, • ., .: • • ; .,
• •• ,,; · .. ,:,!"', •• • o' , .: • ' :· .- ( ·• . ! l ' .... · , ' , ' - • • • I • ,, ,
t' . .. •, .. . . ·.•. . .... ·~ ··. -~·:'" :·. . :::· , . . ! · •.. .:.··· ·'J··:.' · . .&,. ... . : ··,·. .. . r.,. , ... .. . 0 .. . ~ • ·. t-a· .• ·.o ·. , ·.-.!:· ..
· '.• I .... • .,·· ,;'• ~ • ·•· IT,t I , •
·, .. ~ . •. :, : :·/ ··f!t· ,; ·.-: '· . -
,; : .. :.:.~ ! • ··~ , , .. '
· . 'i::) .· .• · ...... o. "· ··.,·: .
.. · ·\.,· .. ... .. . ...\
FREDRICKS SITE
. -~ I -.
\ .·_ . ,, :
~· . . ~-:. c::i .........
.. ·., ... :~ ·.·.: .. . ·.
PLAN Of' 1083-l!e EXC-'Y-'TlONS . :a··'. .. •"\ .. ., ·..:·· ·<.'. ...... ·~ ' .. .. J~.·.~~ ~: : ~ :o. t/ · . . .... . ··
··.··- .... :· . ·_ .. · .... _:::: ... i.\ :··:·:··· ....
...
. . ... ·-···::=:J N
I .. f~~\~:.·
. ;!.'' 6.,, .... .. .... . . ~ -~ 0 ~·- ..
0 .... ,·
... -··
..,. - ···-· 0
•"°"''°" .......
Figure 6. Map of at the Fredricks Laboratories of
the excavated burials, features, site. (Map provided courtesy of
Anthropology , UNC-Chapel Hill).
and posthole patterns the Research

33
Swanton 1946; J. Wilson 1983) have traditionally identified the
Occaneechi Indians as Siouan.
Archaeological investigations were initiated at the Fredricks
site in 1983 as part of an intensive research project undertaken by
the Research Laboratories of Anthropology, The University of North
Carolina at Chapel Hill, to study culture change among the Siouan
tribes of the North Carolina Piedmont during the protohistoric and
historic periods (ca. A. D. 1525-1740 ). 310r231 represents one of
the latest occupied, and certainly the best preserved, aboriginal
villages yet discovered in the Piedmont of North Carolina (Dickens
et al. 1986:1). Over a period of three summer field seasons the
site has almost been excavated in its entirety. A single palisade
around the village, 11 structures, and 61 features have been
documented for the site. An area outside the northwest portion of
t he palisade is thought to be a cemetery (Petherick 1987:74-75; Ward
1987:90) and contains 13 burials. Another two burials have been
excavated within the village itself , giving a total burial
sample of 15 from the Fredricks site.
Ancillary Sites
In addition to these five sites, two others--44Ha22 and 31Rkl-
possess non-skeletal archaeological datasets (ceramics and faunal
remains) that will be referred to later in this study. Both sites
date to the late prehistoric period, and both are located on the Dan
river (Figure 1) .
The Reedy Creek site (44Ha22) is located on the north bank of
the Dan River at South Boston, Virginia. Excavations were conducted

34
in the late summer and fall of 1975 at this site under the auspices
of the Virginia State Library (Coleman 1983). Excavations consisted
of 18 five-foot-square test pits and three five-by-ten foot squares.
Another section of the site had the topsoil stripped from it to
expose features and burials. A total of nine burials and 48
features were excavated during the project. Portions of a palisade
line and part of a single structure were documented. The ceramics
recovered from the excavation were primarily of the Clarkesville
type (cf. J . Wilson 1983:278-296). In addition to the ceramics ,
quantities of other material remains , including animal bone, charred
plant remains, and chipped stone artifacts were recovered from the
excavation of this small village site .
"Lower Sauro Town" is the name that has traditionally been
assigned to the other ancillary site considered here, 31Rkl (Griffin
1945; Coe and Lewis 1952; Coe 1952a). This site , however , appears
to definitely date to the late prehistoric period (J. Wilson
1983:239), and not the historic period as has previously been
thought. 31Rkl is located on the south bank of the Dan River near
the town of Eden , North Carolina , in Rockingham County (Figure 1) ,
approximately 25 miles downstream from the two Upper Saratown
locales. A total of 550 square feet of this site were excavated in
the spring of 1938 (Lewis 1951:206). Only eight features were
uncovered and approximately 60 postholes documented by this work.
No burials were encounte r ed in the small-scale excavations conducted
at this site. The bulk of the ceramics recovered from 31Rkl belong
to the Dan River Series (Coe and Lewis 1952 : 1 ; Gardner 1980:54-80;
Lewis 1951:214-253; J . Wilson 1983 : 240-265) . This site appears to
be a late prehistoric, possibly early protohistoric, village
occupation of the Indians known in historic times as the Sara (J.
Wilson 1983:239-240).
Summary
35
A total of 230 burials are available for study from five sites
that have traditionally been identified with the Siouan Indians of
the Carolina and Virginia Piedmont. These sites span the temporal
periods from the late prehistoric (ca. A.D. 1325-1525) to the
historic middle contact (ca. 1676-1710). The five populations have
traditionally been thought to be similar in that they all spoke a
Siouan dialect, and they possessed all or part of a similar material
culture. Unfortunately, only two sites, Shannon and Upper Saratown
Locality 2, have burial samples that can be considered to be
representative of the original resident population with all ages and
both sexes being present (cf. Ubelaker 1978). The other three
skeletal series are included primarily for comparison with particular
patterns and trends that are identified in the consideration of the
Shannon site and Upper Saratown-Locality 2 data.

CHAPTER III
POPULATION DIVERSITY AND DISTANCE
The subject of biological relationships between prehistoric and
historic Siouan groups has not previously been studied in any formal
manner. Researchers have usually based their investigations on
analyses of historical, linguistic and/or material culture data (cf.
Griffin 1945; Lewis 1951; Mooney 1894; Swanton 1946). These efforts
have all used cultural connections/continuity to infer biological
connections/continuity.
Biological distance is the expression of the genetic
dissimilarities between two or more populations. The basic
assumption of biological distance studies is that among a collection
of individuals, those displaying the most similarities are most
closely related (Buikstra 1976: 49-54 ; Ubelaker 1978:87). This basic
assumption provides the rationale for investigating here the changes
in population similarities (ie., the gene pools) of se l ected
aboriginal populations from the late prehistoric, protohistoric, and
contact periods.
It should be possible to examine the biological relationships
that exist between the prehistoric Wall and the contact period
Fredrick site burial samples. The main question that can be
asked for these two ass e mblage s is whether the Fredricks site
occupants are descendants of the earlier Wall site occupants. Given

37
that the two sites are located in the same bend of the Eno River,
and that studies of their respective assemblages suggest a common
ceramic tradition (Davis 1987:214), one would naturally expect there
to be little biological difference between the two skeletal series.
In a similar manner, comparison of the Upper Saratown and the
Shannon site burial samples can be made with reference to biological
diversity and biological distance. Although the geographical
distance between the two sites renders studies of biological
continuity questionable, measures of biological diversity within
each sample can be utilized to investigate questions concerning
the relationship of the various Siouan groups to each other and
other groups, and possible population movements by the Piedmont
Indian groups after contact. Evidence abounds in the ethnohistoric
record that during the historic period numerous previously separate
Indian groups in the Middle Atlantic area joined together for the
common good. At the time of Bacon's Rebellion in Virginia in 1676,
reports show that several Indian groups resided with the Occaneechi
at their stronghold on the Roanoke River (Billings 1975:267-269;
Sainesbury 1893:414). Among these groups were the Manakins,
Annalectins, and Susquehannock. The Susquehannock are Iroquoian
speakers from the upper Chesapeake drainage (Swanton 1946:31;
1952;:56) , and the Manakins are thought to have been a Piedmont
Siouan group of Virginia (Swanton 1946:148-149). The Annalectins
cannot be identified as any other known group.
A similar pattern of amalgamation apparently characterized the
Occaneechi after their move to the Eno River, especially given the
disruption caused them by Bacon's forces (J. Wilson 1983:104-105,

112-114). Certainly, the Occaneechi were living with the Saponi,
Tutela, and Manahoac at Fort Christanna on the Meherrin River in
38
Virginia by 1714 (Swanton 1946:201 ; J. Wilson 1983:140-141). Also,
the Sara Indians moved from the upper Dan River to the upper Pee Dee
River in South Carolina sometime after 1709, but no mention is made
of any other Indian group joining the Sara before this move (cf. J.
Wilson 1983:128). The Sara themselves moved westward from the Pee
Dee River and incorporated with the Catawba Indians in 1737 (J.
Wilson 1983:167-168).
Given the apparent increase in the movement and amalgamation of
Indian populations following European contact suggested by this
brief consideration of the ethnohistoric records concerning the
India ns of the Piedmont, one would expect less biological diversity
in prehistoric burial samples when compared to the late
protohistoric/contact period Indian burial samples. Likew ise, the
amount of similarity between the prehistoric and late
protohistoric/contact period Indian samples would depend to a
great extent on the percentage of the later sample comprised by
the descendents of the prehistoric population.
Another question that can be addressed by this biological
diversity and distance study is the division by some researchers
(Griffin 1945; Lewis 1951:10-11; Swanton 1936:379) of the Virginia
and Piedmont Siouan Indians into northern and southern divisions.
The northern division consists primarily of the Occaneechi, Sapona,
Tutela, and Manahoac or Manakins (Griffin 1945:321), who are all
found at Fort Christanna in Virginia in 1714. The major groups
that composed the southern division include the Catawba, Sara,
39
Keyauwee , and Saxapahaw (Griffin 1945 : 321) , with the latter three
Indian groups ultimately being incorporated with the Catawba after
1737 (J. Wilson 1984:191-196) . Swanton (1936) noted that these two
Siouan divisions could be defended on linguistic grounds , while
Griffin (1945 : 328-330) proposed that the two groups could be
identified on the basis of material remains , primarily ceramics.
It is possible that these two broad divisions might also be
defined by the biological compositi on of the respective groups.
Thus, the biological distance between groups in the northern and
southern division would be greater than that within the groups of
each of the two divisions. It is expected that the Sara and the
Keyauwee will exhibit less biological distance when compared with
each other than if the Sara are compared with the Tutela Indians of
the northern division. This assumption is based on the premise that
the former two groups (the Sara and Keyauwee) possess similar
material cultures and languages , and may have interacted more
closely with one another than with other related northern groups
with a slightly different language and material culture. Certainly,
this question is worthy of investigation.
The accuracy with which biological relationships can be
explored is dependent on how representative the skeletal samples
are, and on the selection of morphological traits that are purely
genetic (i. e. , are not affected by environment or the age/sex of an
i ndividual) (Ubelaker 1978:87) . Also, the practice of exogamy, or
marriage o u tside the biologi cal population, would affect biological
diversity by creating more diversity in the gene pool. The first
requirement presents a probl e m, as the samples from the Wall,

40
Fredrick and Upper Saratown-Locality 1 sites are not fully
representative of a normal population (i. e. , a population with both
sexes represented by all age groups) . Ubelaker (1978:87) suggests
that a sample comprising 100 individuals is sufficient for
biological studies if there are no biases present in the selection
of the sample. The maximum number of crania available for study
are, for the prehistoric period, 41 from the Shannon site; for the
late prehistoric/early protohistoric period, four from the Wall
site; for the protohistoric period, one from Upper Saratown-Locality
1; for the late protohistoric/early contact period, 25 from Upper
Saratown-Locality 2; and for the contact period, eight from the
Fredricks site.
It is evident that in each case the sample is smaller than the
minimum suggested by Ubelaker. Therefore, the results of the
biological diversity and distance studies conducted using these
samples and reported in the following pages have to be considered
preliminary. This investigation does , however, suggest questions
and directions for future research.
Three techniques are used in this study to determine the degree
of similarity and difference within and between the five study
skeletal series . The first involves a non-metric trait study
identical to that employed by Buikstra (1976) in her investigation
of prehistoric Illinois River population samples . This technique
enables one to examine the genetic distance between individuals
within a population and between two or more populations. The second
technique also follows Buikstra ' s (1976) work , and combines the
results of the non-metric trait study with Lieberson ' s (1969)

41
formula for measuring population diversity. This second technique
permits the biological diversity ~ithin a single population to be
computed and is especially useful for small samples. The third and
last technique employed here consists of the comparison of selected
cranial and post-cranial indices and stature estimates in order to
examine the similarities and differences of these variables within
and between population samples.
Non-Metric Traits and Within Population Diversity
The analysis of the non- metric data involves coding the
presence/absence of a select number of traits exhibited by the
cranium (Buikstra 1976:53, 84). A total of nine non-metric traits
were scored for each sample: 1) asterionic bone; 2) parietal notch
bone; 3) supraorbital foramen ; 4) multiple mental foramina; 5)
mylohyoid arch; 6) divided hypoglossal canal; 7) multiple zygomatic
facial foramina; 8) ossicle at lambda ; and 9) superior sagittal
sulcus flexes right. These variables are used in this study because
they can be observed for the greatest portion of the study serie s,
and each has been shown to be unaffected by age, sex, trait
intercorrelation, or cultural/environmental deformation (Buikstra
1976:49-51).
Lieberson ' s (1969) diversity formula is utilized to explore the
degree of similarity exhibited within the study samples.
Lieberson's measure of diversity is a variation of Simpson's formula
(Lieberson 1969) that describes the position of a population along a
continuum from homogeneous to hete rogeneous with respect to whatever
trait is under study. The formula for calculating the within-sample

42
diversity is expressed as
where Aw is the diversity , and Xn is the percentage occurrence of a
particular trait in a sample. This index expresses the probability
that two randomly paired traits of the sample will be different.
This means that if A = 0.375, which is a low diversity index, there w
is only a 37 . 5% chance that two observations in the population will
be different. A diversity index of 0 .875 is con sidered very high ,
and indicates that there is an 87. 5% probability that two
observations will be different.
It should be noted here that diversity is dependent up to a
certain point on sample size (Conkey 1980:617). In general , one
would expect diversity to increase as the sample size increases
(Conkey 1980:618) . In this study where the study samples are small
and are not biologically representative, the ca l culated diversity
f igures will be affected by this sample size relationship. This is
especially true for the samples from the Wall and Fredricks sites .
Therefore, the results of this investigation of biological diversity
have to remain preliminary in nature .
Biological Diversity within the Study Burial Samples
Within-sample diversity indices calculated for each sample
using the nine discrete biological traits previously defined and
Lieberson ' s f ormula are given in Table 2. These indices reflect the
heterogeneity of each trait as it occurs within the samples. The
individual figures are summed for each sample , and means and
standard deviations calculated to provide another measure of overall

TABlE 2.
Diversity for Fam of the Nine MJqh:,lcgical Traits Within Fam Sample DetenninErl Us~ Lieberscn ' s (1969) Formula.
UPPER SARfilOWN-~ WAIL I..CCALI'IY 2 FREIRIO<S
VARIANI' SI'IB SI'IB SI'IB
1- Asterirnic Bene 0 . 456 0 . 375 0 . 435 n= 41 4 19
2- Parietal l'btcl1. 0 . 343 O.:DO O.(XX) n= 39 4 16
3- Supraorbita!. Forairen 0 . 180 0 . 375 0 . 485 n= 34 4 22
4- Multiple t-Ental Foramina 0 . 255 O. (XX) n= 36 22
5- Myld1yoid Arch 0 . 575 0 . 455 0 . 211 n= 22 3 24
6- Divide:1 Hyp:glossal Canal 0 . 076 0 . (XX) 0 . 264 n= 26 3 13
7- Multiple Z~tic Facial Forarrena 0 . 493 0 . 455 0 . (XX)
n= 39 3 14 8- Ossicle At Ianb:ia 0 . 354 0.375 0.211
n= 34 4 24 9- Right Sup:rior Sagittal
Sul.cus Flexes 0.487 0.(XX) 0 . 364 n= 35 4 21
M:lan 0.358 0.317 0 . 219 Stamard Ceviaticn 0 . 1634 0.20CB 0 . 1885
Ceramic Surfa.C"e Treat:rrent Di versi t~ 0 . 3682b 0 . 5526 0. 7714
Ceramic Decoraticn Diversitya 0 . 6381 0 . 8287
IDIE: - :in:licates that this trait rould rot l:e measure:1 in a sample. n is the nunber of occurrences of a trait in a sarrple.
STIE
0 . 412 7
0.471 8
0 . 490 7
0 . 596 8
0.571 7
0 . (XX) 6
0 . 480 5
0 . 241 7
0.400 0 . 1975
0 . 660
a 'Ih: oomp.rurl diversity figures for ceramic surfaCE trootrnent arrl ceramic decnrations for Orll arrl Skla are from J . Wilson 1983, arrl for Or231 are from D3.vis 1985.
b 'Ihis surface trootrnent diversity figure is for the Radford ceramic S2ries, tlE daninant ceramic series recovered from tlE footures at tlE Shanrxn Site (cf. Benthall 1969:115). 'Ihe surface trootrnent diversity figure by surface trootrnent regardless of series for ceramics rerovered fran tlE footures (cf. Benthall 1969:115) is o.5632.
Liel:er~ ' s (1969) Fomula is : ~ = 1 - [(X1 )2 + cx2 )2 + •••• + (~) 2].
43

44
trait diversity. The lowest within-group measure of diversity is
exhibited by the the Upper Saratown-Locality 2 burial sample (.219),
followed by the Wall site (. 317), then the Shannon site (.358), and,
finally, the Fredricks site (.408). That the late
protohistoric/early contact period site of Upper Saratown- Locality
2 possesses the lowest within-group diversity is somewhat
unexpected, although the mixing of the various Indian groups
documented in the ethnohistoric record during historic times appears
to post-date 1675.
The interpretation of the patterns of diversity produced using
Lieberson's formula can be investigated further by incorporating the
results of analyses conducted by J. Wilson (1983:501-503) and Wilson
and Dickens (1984) of the relationship between changing diversity in
ceramic surface finish and decoration, and culture change in general
for the late Indian groups of the Carolina Piedmont. An explicit
conclusion of their work is that change associated with the era of
European contact manifests itself in the material remains of
aboriginal culture, with culture being a plastic medium and material
culture being readily more susceptible to non-structural change.
For the Upper Saratown-Locality 2 ceramic assemblage, the surface
finish diversity figure (derived using Lieberson's formula) is
0.7714 and the decoration diversity figure is 0.8287. These figure s
indicate that the cultural aspects of the Siouan Sara society were
in a state of change, especially when compared with the ceramic
diversity figures for the late prehistoric, presumably ancestral ,
ceramic collection from 31Rkl (surface finish diversity= 0.3563 and
decoration diversity= 0.7286).

45
Taken together, the diversity figures for the Upper Saratown
ceramic attributes and the morphological traits appear to indica te
that the Sara were experiencing changes in the structure of society
that did not include the incorporation of other distinct Indian
groups. This is consistent with the late protohistoric/early
contact date favored here for the remains from Upper Saratown
Locality 2, a time when the Sara are still a viable entity largely
unaffected as yet by the many stresses that accompanied contact with
the Euro-Americans during the later portions of the seventeenth
century.
The morphological trait diversity derived using Lieberson's
formula for the Shannon site of Virginia, 0.358, is higher than that
exhibited by the Sara at Upper Saratown-Locality 2 noted above. The
diversity of surface finish for the Radford Series ceramics in the
features of the Shannon site is 0.368, with Radford Series ceramics
accounting for 79.2% of the pottery found in the features. For all
three ceramic series recovered from the Shannon site features, the
surface finish diversity is 0.563 by surface finish category (net
impressed, cord-marked, plain, and fabric impressed). The c e ramic
diversity figure for the predominant Radford ceramic series (0.368)
is consistent with what would be expected of a pre-contact
population that is structurally stable (cf, J, Wilson 1983:501-
503), The higher diversity figure determined for the e ntire
collection of feature ceramics from the Shannon site (0.56 3 ) might
indicate ongoing interaction among a number of groups at the site.
This would not be unexpected, as the Shannon site lies near the
Kanawha-New River route from western North Carolina and east

46
Tennessee into the upper Ohio River Valley (Benthall 1969:146).
Likewise, the Shannon site could serve as a junction connecting the
Atlantic Coast of Virginia and North Carolina to this route to the
upper Ohio River Valley. Certainly, the quantities of marine shell
ornaments recovered from the Shannon site (cf. Benthall 1969:104-
113) attest to its connections with the coast. Also, the
similarity in the style of certain shell gorgets from the Shannon
site and the Wall site that has been noted by some researchers
(Hammett 1987; Sizemore 1984) might be the result of trade and
interaction between the inner Piedmont and the outer Piedmont and
Coastal Plain. Thus, the higher ceramic surface finish diversity
figures noted for the feature pottery assemblage, and that found in
the morphological trait diversity figure of 0.358 (at least when
compared with the Upper Saratown-Locality 2 morphological trait
diversity figure of 0.219) may reflect the increased interaction
that could be expected among a population on such a trade route
along which both goods and presumab l y people were moving. The
relatively high ceramic surface finish diversity figures could also
be the result of multiple occupation over time at the site , a
question that cannot be addressed here . However, it should be noted
that the morphological trait diversity figure of 0 . 358 at the
Shannon site is clearly indicative of a population with a stabl e
cultural structure .
Turning to the earlier of the two easternmost sites in this
study, the morphological trait diversity of the late
prehistoric/early protohistoric Wall site is 0.317, which reflects
more homogenity among the morphological traits in this burial sample
47
when compar ed to the Shannon site fig ure. Examination of the
Hillsboro Series ceramics recovered from excavation of features at
t he Wall site during the first four years ' work at the site provides
a s urface finish diversity figure of 0.5526 and a decoration figure
of 0 .6381 . Both of these Wall site figures are lower than those for
t he early/middle contact period ceramics from Upper Saratown
Locality 2 (0 .7714 and 0.8287 respectively). This is not
unexpected, as the increased stresses and inter action that occurred
during contact are not present as yet in the late prehistoric/early
protohistoric period of the Carolina Piedmont.
Comparison of the Wall site surface finish figure (0. 5526)
with the figure for the entire ceramic collection from the Shannon
s ite (0.563) , however, does suggest that the Wall site was not
isolated. Indeed, the Wall site shares with the Shannon site the
fact that both are on major routes from the coast to the interior .
Routes from the Virginia Coast across the Roanoke River drainage and
from the North Carolina Coast to the Carolina interior join in the
vicinity of the Wal l site (cf. Simpkin s 1985 : 46-48 , 53, 63-64 , 85) .
Also, some researchers (cf . Davis 1987:214 ; J . Wilson 1983:187 , 204-
205 , 369) suggest that the late prehistoric inhabitants of the
section of the Neuse River containing the Wall site are related to
the Iroquoian-speaking groups (i .e ., the Meherrin , Neuse and
Nottoway) of the Coastal Plain. Therefore , the relatively high
surface finish diversity figure for the Wall site ceramics may be
tied to the site ' s location at a trade route junction, and to the
site ' s possibly being the western-most outpost of a non-Siouan
Coastal Plain population. Both would account for an increase in the

48
flow of ideas and for a greater diversity in the material culture of
the Wall site. Still, the morphological trait diversity for the
Wall site suggests that the resident population itself was stable.
For the middle contact period site located within sight of the
Wall site at the Fredricks site, the morphological trait diversity
is 0.408. The ceramic surface finish diversity for the Fredricks
site is 0.660 (Davis 1984). These high figures suggest that both
the resident population and the material culture possessed by the
site ' s inhabitants were in flux, tied for the most part to the
increased population movement and the miscegenation occurring in the
area during the post-1676 contact period. Based on the figures, it
is tempting to suggest that by this time (ca. 1700) the aboriginal
material culture of the Occaneechi and associated Indian groups
resident at the Fredricks site had experienced enormous change (H.
Wilson 1984). Changes may have started to accelerate in other
aspects of the culture, including social structure and the
genetic/physical composition. Certainly, the morphological trait
diversity is elevated over what is noted for each of the other three
sites in this study.
A second formula devised by Lieberson to investigate the
diversity exhibited by a sample of dichotomous variables was also
utilized to determine the diversity of the genetic morphological
traits possessed by each of the four study samples. This second
equation is
where Aw is the population diversity , Xis the percentage of the
population exhibiting a particular trait, and N is the number of

49
dichotomous traits identified for the study. Table 3 presents the
r esults of the application of this formula to the four study
samples. Again , the scale for comparing the resulting diversity
figures runs from Oto 1, with O representing little diversity and 1
very high diversity.
As with the morphological trait diversity, the lowest
diversity, 0.1960 , is exhibited by the Upper Saratown-Locality 2
sample. The Wall site burial sample continues to possess the second
lowest diversity index, 0.2592. The conclusions drawn earlier that
both of these samples represent stable genetic groups are not
contradicted .
However, the Fredricks site and the Shannon site have their
relative positions reversed when the dichotomous diversity figures
are compared, with the Fredricks site diversity being 0.3200 and the
Shannon site 0.3468. Both figures are higher than the two more
stable populations of Upper Saratown-Locality 2 and the Wall site.
The Fredricks site figure does not run counter to the expectation
for a higher morphological trait diversity given the increased
interaction between groups and the admixture of groups during the
middle contact period. The high figure for the Shannon site
suggests that there was a greater degree of variability within the
population than previously suspected.
Non-Metric Data and Population Distance
The section just OJmpleted has examined the within-population
diversity for a select number of morphological traits and was
primarily concerned with the question of the stability of the

TIIBIE 3.
Within Si:nple M:lasure of Divergence CetenninErl Using Lieberscn ' s Didotarcus Values Fonrula.
Shann:n Site
co.2211 + D.1716 + om + 0.1275 + 0.245 + 0.0384 + 0.2464 + o.1 n1 + 0.2436) = (1.5€03)
'!\.,; = (l.5E03) 2 /9 = 0. 3468
Wall Site
(0.1875 + 0. 25 + 0. 1875 + 0 + 0 + 0 . 2244 + 0. 1875 + 0) = (1 .0369)
'!\.,; = (1. 0369) 2 /5 = 0. 2592
!JH:er Saratow1-I..a::ality 2
(0. 2176 + 0 + . 2419 + 0 + 0 + 0.1344 + 0 + 0. 1056 + 0.1824) = (0. 8819)
'!\.,; = (0. 8819) 2 /5 = 0.198'.)
Fredricks Site
(0. 2059 + 0. 2356 + 0 + 0. 2331 + 0. 2451 + 0 + 0 . 24 + 0 . 1204) = (1 . 2801)
'!\.,; = (1.2001) 2 /6 = 0. 32CX)
'Ire within sample diversity fonrula is
50

51
genetic pool that comprised the resident population. This section
of the study moves to a more general level of analytical scale and
cons iders the genetic distance between two samples. The broad
que stions to be examined here include the historical relationships
of the study skeletal series , and the validity of the northern and
s outhern divisions of Siouan Indians.
The technique used to conduct the biological distance studies
r e quired in this section has been used by Berry and Berry (1967) and
Buikstra (1976) to study a number of human skeletal populations.
The same nine morphological traits - -asterionic bone, parietal notch
bone, supraorbial foramen , multiple mental foramina , mylohyoid arch ,
divided hypoglossal canal , multiple zygomatic facial foramina,
ossic l e at lambda , and s uperior sagittal flexes right-- whose
presence/ absence was coded for the study conducted in the previous
s ection of this chapter are used here. Recall that these nine
traits could be observed in a good portion of each study sampl e ,
and each trait has been shown to be unaffected by age, sex, trait
intercorrel ation , and c ul t u ral/environmental deformation (Buikstra
1976 : 49-51) . The statistic used to investigate the biological
distance between each of the study samples is the mean measure
of divergence developed by C.A. B Smith , and utilized in the study of
both rat (Berry 1963 ; Petras 1967) and human skeletal populations
(Berry and Berry 1967 ; Buikstra 1976) . The mean measure of
d ivergence is a q uantitative expression of the separation of two
s amples , called here sample 1 and sample 2. The formula for the
mean measure of divergence (De) is
De = L [ (8 1 - e2 )2 - (l/n1 + l / n 2 ) J / N,
52
where e = sin_1 (l-2p) in radians with p being equal to the
percentage of the population with a particular trait; n is the
number of traits present in each population ; and N is the total
number of identified traits used in the study. In the actual
comparison of two populations, the measure of divergence (De) is the
mean of the squared differences between the angular value of each
character (81 - 8 2 ) 2 , minus the variance (V) which is due to random
sampling fluctuations (V = l/n1 + l/n2 ) (Petras 1967:582).
The variance V can also be calculated as
V = 4 [(l/n1 + l/n 2 ) ((8 1 - 0 2 ) 2 - (l/n 1 + l/n 2 ))] /N.
Berry (1963:209-210), and Berry and Berry (1967:373) note that the
square of the mean measure of divergence De (where De= e1 - 8 2 )
divided by the variance V, which can be written as (8 1 - 8 2 ) 2 /V, is
distributed approximately "as chi-square with one degree of freedom ,
and is significant at the 0.05 probability level if it is greater
than 3V and at the 0.01 level if it is greater than 6V." Petras
(1967:582) explains that this means that if De > 3V, then the
divergence (difference) between the two populations is significant
at the 0 . 05 probability level, and if De> 6V, the divergence is
significant at the 0.01 probability level. For this study,
primarily because of the size of the various samples , the divergence
between two populations is considered to be significant if De> 3V,
that is a 0 . 05 probability level is used. This can also be
interpreted so that if De< 3V, then the divergence between two
populations may not be different , that is there may not be any
significant difference in the genetic composition of the two
53
populations. The variance V utilized here is calculated using the
formula described at the beginning of this paragraph.
The results of applying the mean measure of divergence formula
to the percentage occurrence of the nine cranial morphological
traits are given in Table 4. The divergence (De)' variance (V), and
3V are all listed. In all tests comparing each population with
every other population the mean measure of divergence is greater
than 3V, which means that each population shows significant
divergence (difference) from the others at the 0.05 probability
level.
Explicit in the studies conducted by Berry and Berry (1967) and
Buikstra (1976) is the fact that the mean measure of divergence
calculated among more than two populations can be interpreted by
ranking each De from smallest to largest. This means that the
smaller the De, the more similar the two populations used to
calculate the De. Unfortunately, it is extremely difficult to
evaluate the true meaning of the closeness or distance implied by
comparison of the mean measure calculations for each sample.
Ranking the computed mean measure of divergence for the study
skeletal series in this manner suggests that the Shannon site and
Fredricks site samples are the most similar. The next most
similar sites are Upper Saratown-Locality 2 and the Fredricks
site, followed closely by the Shannon site and Upper Saratown
Locality 2. The Wall site is least similar to the other three
sites. Before proceeding further with this analysis, it should be
noted that the small size of the Wall site sample may be r espons ible
for it being more dissimilar to the other three sites.

TABIE 4.
Carprtaticn of the~ M3asure of Di vergex:e 1:eti,,een Scmples for the Nine tvbr}::.rolcgical Traits.
SI'IE
Shanocn Site
Wall Site
Ug:er Sarato.vn-I..o::ality 2
Fra:h:icks Site
Shannen Site
Wall Site
l . 1756a (0. 2195 )b [0. 6585 lc
U.I_:Fer Sarato.vn--I.Jxality 2
0. 90:D (0.0351) [0. 1053]
1.7576 (0. 3195) [0. 9585]
Fredricks Site
0. 5330 (0. 0492) [0. 1476]
1. 5865 (O.CB49) [0. 2847]
0. 8010 (O . CB49) [0.2847]
a A figure not enclosed within any symtol is a rrean rreasure of diversity De.
b A figure enclosed within ( is the variance v.
c A figure enclosed within [ is equal to 3V.
54

55
Of special interest is the simi l arity (re l a t ive to the other
populations) between the prehistoric Shannon site and the middle
contact period Fredricks site, which are separated by approximately
150 years in time. Because of the te mporal difference between the
t wo sites , the relative closeness exhibited by the mean measure of
divergence for the two sites is unexpected. One explanation for
this rel ative closeness could have been interaction between the
Shan non site inhabitants (and their ancestors and descendants) and
t he ancestors of the main population resident at the Fredricks site
during the prehistoric period. This interaction would have been
between populations resident within the Roanoke River drainage , and
has been referred to earlier in this chapter. J. Wilson (1983:491-
492, 573) has suggested that during the late preh istoric period
i nteraction between groups would tend to be more common within the
confines of discrete river drainages, a pattern similar to that
proposed here .
An alternative explanation for the relative biological
closeness may be the proposed northern and southern divisions of the
Carolina and Virginia Siouans discussed earlier . Both the Tutelo,
who are presumed to have inhabited the Shannon site in prehistoric
times , and the Occaneechi , who were resident at the Fredricks site
in 1700, are thought to have been members of the northern division
of Siouans (Griffin 1945 : 321 ; Lewis 1951:10-11 ; Swanton 1936:379).
When the Occaneechi inhabited the Fredricks site in 1700, the Tute lo
were probably still resident in the mountains of western Virginia
(J. Wilson 1983:190-197). Thus , the relative closeness of the
Shannon site and Fredricks site populations does not appear to have
56
been the result of Tutela descendents being present at the Fredricks
site among the Occaneechi , as the two groups did not amalgamate
until 1712, when the Tutela moved from the foot of the mountains to
Fort Christanna in Virginia (J. Wilson 1983:192). The Occaneechi
had moved to Fort Christanna from North Carolina (apparently) the
previous year (J. Wilson 1983:192). Therefore, one explanation that
must be considered for the closeness of the Shannon site and
Fredricks site populations is that the two groups belong to a
northern division of Siouan Indians that could be differentiated
from the southern division in terms of linguistics and material
culture by earlier researchers. The question that naturally arises
is whether the differences between these two divisions are
indicative of two distinct ethnic groups or of two related
populations with a similar language and slightly different cultures
as hypothesized by Lewis (1951). This will be considered further in
Chapters VII and VIII.
Another question that can be considered here is that of the
relationship of the Wall site to the Siouan populations of the
Piedmont. Previously, we have seen that some researchers (Davis
1987:214; J. Wilson 1983:369) have indicated that the material
remains at the Wall site may be indicative of a non-Siouan
population. In this study of biological distance, we have seen
that , although all of the study skeletal series show significant
differences at the 0.05 probability level , the Siouan Upper
Saratown-Locality 2 sample is closer to the Fredricks site and
Shannon site samples than to the Wall site sample , and the
differences between the Wall site and the other three are all 1.6 or

57
greater. It does not appear that the Wall site sample is the
ancestor of one of the southern Siouan division groups, given the
relatively great mean measure of divergence present between it and
the Sara occupation at Upper Saratown-Locality 2. Likewise, there
does not appear to be a strong biological connection between the
Wall site sample and the middle contact period Occaneechi sample
resident at the Fredricks site, certainly not one that equals the
supposed similarities in the material culture (i. e ., ceramics) of
the two (Davis 1987:214) . Therefore, a conclusion that can be drawn
is that the Wall site sample stands distinct from the Shannon site ,
the Fredricks site and Upper Saratown-Locality 2 samples based on
genetic differences. However, this conclusion must be tempered by
the fact that the sample from the Wall site is extremely small and
may be biasing the results of this comparison. The question of a
possible non-Siouan ethnic affiliation for the Wall site population
has to remain an untested hypothesis at this time.
Metric Analyses and Between-Population Differ ences
Another dataset that can be used to compare the four study
samples is the results of the metrical analysis of the skeletal
series. Standard cranial and postcranial metr ical indices
calculated for the four skeletal series are presented in Tables 5
and 6 . Standard deviations are also presented to give the range of
variation of each index within each sample. As the samples
available to produce each index are so small, no statistical tests
of significance can be conducted when the samples are compared. The

58
'ITIBIE 5.
Cranial Irrlires for the Males arrl Farales fran the Sbrly Sarrpleso
STI'E CI CM C1H CBH MBH FPI FGI
~
~ 77 . 37 152. 73 79 . 47 103 .06 89 . 69 EB.87 109.46 Site (3 . 76) (2. EB) (3 . 86) (4.36) (3 . 55) (2 . 37) (7.38)
[31J [24J [24J [24J [24J [28J [28J
Wall 88.05 152. 67 83. 78 95. 26 89 . CB 64. 976 Site (5 . 748) (4 .839) (3.416) (2 . 738) (1 . 218) (0.834)
[3J [3J [3J [ 3J [3J [3J [OJ
Ug:er 00.138 151.50 73 . 357 96. 025 82 . 777 E6 . 441 110. E61 Sarato,..,n- (9.70 ) (0. 71) (2. 53) (15 . 634) (4.281) (4.461) (7.442) I..o::ality [4J [2J [2J [2J [2J [4J [3J 2
Fredricks 78 .97 156. E6 72 . 47 ~ . 22 81.01 EB.145 Site (4 . 88) (2. 355) (0. 848) (4. 38) (1.258) (1. 153)
[2J [2J [2 J [2J [2 J [2J [OJ
FrM\LES
Eh:moon 79 . 19 146. 35 79 . 74 100. 95 89 .06 ffi.48 104.24 Site (4. 21) (4.EB) (3 . 26) (5 . 61) (3.89) (3.89) (6.91)
[19J [14J [14J [14J 14J [16J [14J
Wall Site
[OJ [OJ [O J [O J [O J [O J [OJ
Ug:er 78 . 122 149. 33 78 . 857 102. 22 89.032 67.896 93 . 361 Sarato,.,,n- (1.072) (2.665) (3.944) I..o::ality [3J [lJ [lJ [lJ [lJ [3J [3J 2
Fredricks 74 . 46 152 . 67 69.15 92.86 79.27 Site
[lJ [lJ [lJ [lJ [lJ [OJ [OJ
CI : Cranial Irrlex CM: Cranial M:rlule CIR: Cranial length-Height Irrlex CBH: Cranial Breadth-Height Irrlex MBH: 1'Ean Basicn-H=ight Irrlex FPI: Fronto-Parietal Irrlex FGI : Frooto-Gcnial Irrlex
Nt.rrbers enclosed within ( ) are standard deviaticns. Nurbers enclcsed within [ J are the nurbers of in:lividuals (n) rre3SUre:l.

59
'mBLE 6.
Pastcranial Irrlices for Males am. Fara..les fran the Sarrples.
SITE RI RHI CI PI Pi I FRI PLI
W>JE3
91anoon 18 . 65 TI.69 14.46 76.00 ll4 . 82 ll . 99 63.92 Site (l.<:05) (1.987) (1.041) (6. 364) (11.144) (0.918) (8.501)
[22] [15] [20] [25] [26] [24] [26]
Wall 18.45 81 . 54 lll.293 ll . 06 64. 53 Site (1. 56) (12 . 84) (4 . 742) (0.511) (6. 651)
[3] [OJ [OJ [2] [ 3] [ 3] [3]
twr 18. 84 74 . 10 16 . 52 83 . 05 ll7 .24 12 . 44 61 . 20 Sarato..Jn- (G.191) (0.00) (0.00) (7.07 (8.402) (0.176) (6.838) I..cx::ality 2 [2] [1] [1] [8] [8] [3] [7]
Fre:3.ricks 20. 71 86. 85 117.322 12.46 65 . ~ Site (0.179) (2.90) (6.340) (0.923) (G.SJ7)
[2] [OJ [OJ [4] [4] [4] [3]
.FEWILES
Eh3nn::>n 18. 19 75.82 15.07 74 . 25 108.44 12.05 65.61 Site (1.139) (2.103) (1.195) (6.027) (9.986) (0.615) (5.891)
(16] [9] 12] [18) [19] [14] (16)
Wall Site
[OJ [OJ [OJ [OJ [OJ [OJ [OJ
twr 16. 89 13.36 78 . 66 ll2.00 12.05 65.48 Sarato..Jn- (0.S74) (0.00) (5.840) (8.899) (1.120) (3.609) I..cx::ality 2 [3] [OJ [1] [10] [ill [8] [7]
Fre:3.ricks 16. <:E 92.85 121. 74 10.74 Site (0.00) (0. 00) (0 . 00) (0.00)
[1] [OJ [0] [1] [1) [1] [OJ
RI: Hurrerus Rch.IBticity Irrlex RHI: Radio-Hureral Irrlex CI: Ulna caliber Irrlex PI: Farur Platyrreric Irrlex PiI: Ferrur Pilastic Irrlex FRI: Fan.rr Rd:usticity Irrlex PLI: Tibia Platymanic Irrlex
Nunbers enclosed within ( ) are standard deviatims . Nurbers e nclosed within [ ) are the rn.rrbers of irrlividuals (n) rre3SU1'.'Erl.

60
observations offered here are , therefore, thematic and non-
statistical in nature.
The cranial indices calculated for the males at each site
(Table 5) indicate that the Wall site sample is least similar to the
other three samples. The two most similar samples appear to be
Upper Saratown-Locality 2 and the Fredricks site. The Shannon site
seems to be slightly more similar to the Fredricks site sample than
to the Upper Saratown-Locality 2 sample.
When the postcranial indices (Table 6) of the males are
compared , a similar pattern emerges. The two samples that are the
least similar in some postcranial indices are from the Wall and
Fr edricks sites. And the Upper Saratown-Locality 2 and Fredricks
s ite samples appear to be the most similar.
Slightly different patterns emerge when the cranial and
postcranial indices of the females in each sample are compared
(Tables 5 and 6) . It should be noted prior to proceeding further
that no females are present in the Wall site sample, and the
Fredricks site sample has only one female. Therefore, the following
discussion is limited by the very biased nature of the study
s amples. Still , the females from the Shannon site and Upper
Saratown-Locality 2 are most similar when the cranial and
postcranial indices are examined. For only one post-cranial index,
RI (Humerus Robusticity Index) (Table 6), is the measure for the
Fredricks site female within the standard deviation noted for the
female indices from the Shannon site and Upper Saratown-Locality 2.
The indices of the Fredricks site female are least similar to those
of the Shannon site females , and they are very different from those

61
for the Upper Saratown-Locality 2 females . The dissimilarities in
t he female indices and the similarities in the male indices are
possibly consistent with matrilocal residence for the study samples.
Although sample size is a critical factor that affects this
comparison of morphometrical indices , some comments can be offered
about the differing patterns for males and females at the sites.
First , however , the apparent separation of the Wall site male sample
fro m the other three sites based on differences in the cranial and
postcranial indices mirrors the separation noted in the study of
biological distance .
For the other three sites , some observations derived primarily
from research using ethnohistoric accounts can be offered to account
for the appar ent differences in the relationships of males and
f emales at the Shannon site, Upper Saratown-Locality 2, and the
Fredricks site apparently doc umented in the patterns of cranial and
postcranial indices. Most researchers agree that the Siouan and
Iroquoian groups of the Carolinas and Virginia possessed matrilineal
de s cent (Hudson 1 9 76: 185 ; Swan ton 1946 : 654-655 ). This
characterization is based in large part on John Lawson' s (1967:57)
observations concerning Keyauwee Jack ,
who i s King of that People. He is a Congar ee-Indian, and ran away when he was a boy. He got this Government by Marriage with the Queen ; the Female Issue carrying the Heritage , for fear of Imposters ; •••
This passage suggests that descent among the Keyauwee , a presum ed
southern Siouan group, is matrilineal , residing in the female line.
The implication of matrilocal residence is also present , although in
a mbiguous terms , with the Congaree-Indian resident at Keyauwee.

62
Another character istic of the Siouan peoples , and indeed most
o f the Indian groups , of the Carolinas and Virginia is the fact that
males ' work consisted mainly of hunt i ng , fishing , agriculture ,
construction , and cond ucting warfar e and trade (Lewis 1951: 139,
173) , although some suggest that females were primarily responsible
for agriculture (Hudson 1976:259). The women are thought to have
co llected wild foods , prepared food for storage and immediate use ,
gathered firewood, and manufactured pottery, clothing, mats and
baskets (Lewis 1951 : 139) . In his travels among the Siouan Indians
o f the Carolina Piedmont , John Lawson (1967 : 46 , 48 , 63) noted only
Indian men conducting trade at villages other than their own. Both
women (Lawson 1967:41-42 , 47) and men (Lawson 1967:41-42 , 46)
conducted trade at their own villages .
From the information contained in these ethnohistoric accounts,
a number of generalizations can be formulated. It is evident that
males have a high degree of mobility in Indian society, being
involved in trading and hunting. Also , matrilocal residence rules
would possibly encou rage the movement of males between villages of
the various Piedmont Indian groups . The likelihood of males dying
and being buried outside the location of their reproductive pool is
gr eater than for females . Thus , the dissimilarity of the males from
the Wall site to those of the other three sites is unexpected if the
former are indeed Siouan. We have already seen that the Wall site
popu l ation may be non - Siouan, with the likelihood that its
population would interact in trade, hunting, and marriage with other
similar non-Siouan groups. Also, the separation in time from the
two contact period sites and in space from the prehistoric Shannon
63
site would account, in part, for the distinctiveness of the Wall
site (as indicated by the cranial and postcranial indices). In only
a few instances do the mean cranial and postcranial indices of the
Wall site males o::>mpare closely with the Fredricks site males , which
is contrary to the close similarity noted in the material culture
for the two sites (cf. Davis 1987:214). In addition to the
temporal separation affecting these two sites, the admixture of
Indian groups from outside the region in the Fredricks site
population may be responsible for these morphometrical differences.
Considering the three sites with similar male cranial and
postcranial indices, the temporal difference between the Shannon
s ite, on the one hand, and Upper Saratown-Locality 2 and the
Fredricks site on the other may be one reason for the latter two
being more similar with each other. The Fredricks site and Upper
Saratown-Locality 2 are separated by on l y decades, and not the one
or more centuries that separate them from the Shannon site.
However, the similarity between the Shannon site and the Fredicks
site samples in cranial indices and some of the postcranial
measurements may reflect the fact that the two populations reside nt
at this site are part of the northern , and thus related, Siouan
group. Alternately, this similarity may reflect a pattern of
interaction by groups resident within the same river drainage in the
past.
For the fema l es , the separation of the one Fredricks site
individual of that sex may r eflect the disintegration of Siouan and
Indian society in general that occurred in the post-1675 contact
period. We have seen that the Occaneechi Indians who probably live d

64
at the Fredricks site had incorporated amongst them a number of non
Siouan groups , most notably the Iroquoian Susquehannock. The
Fredricks site female may be a member of this or some other Indian
group from outside the Piedmont region. The biological evidence
discussed previously may indicate that the Shannon site and Upper
Saratown-Locality 2 populations were stable. The ethnohistoric
record documents the disruption that had occurred among the
Occaneechi Indians resident at the Fredricks site during the early
and middle contact periods. The difference in cranial and
postcranial indices between the Shannon site/Upper Saratown-Locality
2 and the Fredricks site females is apparently the result of this
disruption, whether it took the form of admixture of disparate
groups, of the break-up of the existing social structure, or both.
This discussion is hampered of course by the fact that there is only
one female in the middle-contact-period Fredricks site sample.
However, future research that incorporates more data should be able
to investigate this question more thoroughly.
Stature
Stature estimates calculated using tibias and femurs for the
study samples using a regression formula developed by Genoves (1967)
for Mesoamerican populations are presented in Table 7 . Examining
the male stature est imates for the four sites , it appears that the
Shannon site (168 . 66 cm) and the Upper Saratown-Locality 2
(169. 16cm) samples are similar. Likewise , the Fredricks site
(172.81 cm) and the Wall site (173 . 41 cm) also are quite close. For
females, stature estimates a r e available only for the Shannon site,

'mBLE 7.
Average Stature Estirrates BaSErl rn Farur am. Tibia Lengths for Miles am. Farales in the stu:1y S:rnples.
MALES Site Ferur Tibia
Sann:::n Site 168. E6 168. 61 (4. 636) (3 . 417)
Will Site 173 . 406 (2. 395)
~ Sarata,.,n- 169 .16 170. 00 Locality 2 (3 . 911) (1. 736)
Fredricks 172. 81 Site (3.4:20)
Stardard Deviatioos are enclosed in ( ) •
Farur
156.31 (4. 50)
158. 47 (4. 473)
171.47 (0.00)
Tibia
156.23 (5. 926)
160. 60 (2 . 910)
65

66
Upper Saratown-Locality 2, and the Fredricks site. As for the males
from the Shannon site and Upper Saratown-Locality 2, the female
numbers are quite close. The mean height for the Shannon site
burial sample is 156.31 cm and for the Upper Saratown-Locality 2
sample it is 158.47 cm.
Among the three major physical types of Indians resident in
North Carolina and Virginia, Siouan populations are generally
described as being gracile and short in stature, whereas Iroquoian
and Algonkian populations are considered to more robust and taller
(Neumann 1952:34-36). This generalization is corroborated by the
evidence of this study if the population at the Wall site is not
Siouan as many have suspected, and if there are a number of
Iroquoian Indians such as the Susquehannock incorporated with the
Occaneechi Indians at the Fredricks site. That is, the presumed
Siouan skeletal series from the Shannon site and Upper Saratown
Locality 2 are shorter than the Iroquoian burial sample from the
Wall site and the Siouan/Iroquoian mixed sample at the Fredricks
site. Likewise, the different environments occupied by the two sets
of sites might be reflected in the division that can be made among
the four pQpulation samples based on stature. This acknowledges
that stature can be affected by differing environments and the
resulting different diets, which includes the vitamins and minerals
that occur naturally in the environment that a population has. In
this study, both the Shannon site and Upp2r Saratown-Locality 2 are
located in a mountainous area of the inner Piedmont and their
res ident populations share a similar stature. Likewise, a case can
be made that the Fredricks and Wall sites were occupied by

populations long resident within the outer portion of the Piedmont
along the fall line immediately west of the inner Coastal Plain.
For now , these observations are just that, and should be
investigated in their own right in the future.
Swnmary
67
The examinatiJn of population diversity within and distance
between the samples has considered information concerning biological
distance, metric and non-metric morphological traits , and stature.
The fact that the Wall site and Fredricks site samples are decidedly
small has to be borne in mind at all times when any of the comments
and propositions offered in this chapter are considered. Certainly,
no clear pattern of relationships and differences emerges from this
study. The three non-Sara samples stand apart from the the Upper
Saratown-Locality 2 sample in some but not all of the datasets
cons idered in this chapter. Also, the Wall site sample differs from
the other three study samples in all but one instance. Only the
male stature estimates for the Wall site are similar to those of the
Fredricks site sample.
Although the computed values are statistically different, the
Shannon site and Fredricks site samples share a closer biological
distance than do any of the other sample combinations. Also the
cranial indices of males of the ShannJn site sample are more similar
to the Fredricks site sample than that at Upper Saratown-Locality 2.
Conversely, the female postcranial measurements for the Shannon site
and the Fredricks site samples are most different.

68
Considering the Shannon site and Upper Saratown-Locality 2
samples, the two are noticably different according to the biological
distance study. However, the female postcranial and stature
measurements, and male stature measurements for the two are similar.
Comparing the Upper Saratown-Locality 2 and Fredricks site samples ,
similarities are present in male cranial indices and male
postcranial measurements. However, the postcranial measurements for
females in these two samples are very different.
Finally, the Wall and Fredricks site samples stand distinct
according to the biological distance study , and constitute the most
distinct of all sample combinations considered in this study. Also,
the male cranial indices for these two burial samples are quite
d ifferent, and the male postcranial measurements for the two samples
are the least similar in a few instances . Only the male stature
measurements for the two are similar.
Considering the first question asked at the beginning of this
chapte r, the proposition that the Wall and Fredricks site
inhabitants are the same or similar populations cannot be supported
at this time, given the results of the population diversity studies.
The question of the validity of northern and southern divisions
among the Siouan Indians is given credence when the differences and
similarities between the Shannon site burial sample (the pres umed
ancestors of the norther division Tutelo Indians) and the Upper
Saratown-Locality 2 sample (the Sara Indians of the southern
division) noted in this examination of population diversity are
considered. Finally, the effects of the increase in movement a nd
interaction among the Indi a n populations of the Virginia and

69
northeastern North Carolina Piedmont during the contact _period may
be reflected in the absence of any clear patterns in the population
diversity studies . Contributing to this problem are the interaction
patterns of the Indian groups along the Roanoke River proper during
the late prehistoric period.
Two observations that need further research are the relatively
close similarity documented for the Shannon site and the Fredricks
site samples by the mean measure of divergence, and the differences
noted between the Wall site and Fredricks site samples by the mean
measure of divergence and in the metrical indices considered here .
Certainly , the differences and relationships noted here and
elsewhere in this chapter require further consideration in future
research that incorporates additional data from a number of sites of
the region that span all the temporal periods covered by this study,
including the sites that possess the study samples included in this
investigation .

CHAPTER IV
DEMOGRAPHIC ANALYSES
The first question that must be considered in the study of the
demography of any h uman soc i ety is the biological representativeness
of the sampl e . Demographic details abou t archaeological societies
are based on the assu mption that the numbers, ages, and sexes of the
skeletal sampl e accurately reflect the original population, and that
all biases present can be recognized and considered during analysis.
Sources of error that can res ult in i naccurate interpretations
include differential disposal of particular segments of a
population , such as infants ; inadequate sampling of the overall
mortuary complex; and differential preservation of the ske l etons
(Ubelaker 1978 : 91-92) . In addition to these errors , there are
problems uni que to each analyt ical de mographic technique utilized in
the study of the biological aspects of burial data . Such problems
will be covered when the appr opriate technique is considered.
The first step in the demographic reconstruction of a
population is to obtain the age at death and the sex of each
individual . Usually, only adult remains are sexed, as individuals
less than the age of 1 5 at the time of death cannot be accurately
sexed (Ubelaker 1978 : 42) . In this study , each skeleton in each
s amp l e was aged and sexed using the same set of techniques.

Unfortunately, some burials could not be aged and sexed using all
the techniques available due to differential bone preservation.
Age of Subadults
71
The subadults were aged based on dental eruption and
development (Ubelaker 1978:112-113), longbone length (Ubelaker
1978:48-49), and epiphyseal closure (Bass 1971). Where only
fragments of the longbone or cranium were present for a subadult
burial, the remains were compared with other subadults of known age
from the same skeletal series and an age assigned on the basis of
this comparison.
Subadults are those individuals who are aged less than 15 years
at the time of death. Subadults comprise 33% (n=37) of the burial
population at the Shannon site; 63% (n=5) at the Wall si-te; 83%
(n=5) at Upper Saratown-Locality 1; 44% (n=41) at Upper Saratown
Locality 2; and 53.3% (n=8) at the Fredricks site.
Age and Sex of Adults
The criteria used to age the adult individuals from the sites
were dental eruption of the third molar (Ubelaker 1978); dental
attrition (Molnar 1971); endocranial suture closure (Krogman 1978);
epiphyseal closure (Bass 1971); and erosion of the symphyseal face
of the os pubis (McKern and Stewart 1957). With the exception of
the symphyseal face of the~ pubis, the skeletal elements required
under these criteria to age a skeleton were present for all adult
burials in each sample. The aged adult individuals were placed in
five year categories.

72
The sex of the adult individuals was determined primarily from
morphologica l data acquired from the cranium, mandible (Bass 1971;
Krogman 1978), and pelvis (Bass 1971). Sex determinations based on
metric data from each individual were also made, but only to
corroborate (or refute) the result obtained from the morphological
analyses. Metrical sexing techniques used included femur mid-shaft
circumference (Black 1978), femur head diameter (Bass 1971), and
humerus head diameter (Bass 1971). Appendix A contains the age and
sex determined for each member of the study samples.
Examination of the age of all individuals in the sample and the
sex of the adult members shows clearly that a biologically
representative sample is not present at the Wall site, Upper
Saratown-Locality 1, or the Fredricks site. This is not unexpected,
given the small number of individuals that comprise the skeletal
series from each of these three sites. At the Wall site,
individuals that are very young or very old predominate in the
burial sample. Only one individual is between the ages of 10 and 20
years, and none are between 25 and 45 years. Also, all the adults
from the Wall site are males. Similar biases can also be seen in
the burial sample from the Fredricks site, where a number of
individuals aged 0-5 years are present, but few old adults are
present. The group aged 20 to 45 years contains few individuals,
and only two individuals are present in the 10-20 year age category.
Also, a bias for males is evident at the Fredricks site, with five
male adults being identified and only one female. At Upper
Saratown-Locality 1 only a single adult (a female) is present, the
other five burials are subadults.

73
Demographic Profiles
Because of the numerous stresses associated with early life,
many researchers (cf. Buikstra 1976:22-23) consider most aboriginal
populations to have had frequent deaths of infants. High infant
mortality would be indicated by a large percentage of the burial
sample being between O and 5 years of age at death. Because of the
high death risk associated with childbearing, adult females aged 18
to 30 years at death should also be elevated over that of other age
segments in the sample. This assumes that the sample is
biologically representative, which is not the case for the Wall
site, Upper Saratown-Locality 1, or the Fredricks site. Another
age-sex group that should possess an elevated mortality rate for the
prehistoric period, and a still higher rate after contact, are males
aged 18 to 40 years. This is due to the stress associated with
hunting and warfare, w~ich increased in the late protohistoric /
period from the heightened competition associated with the skin
trade and the increased animosity that ,narked the interaction
between the Indians of the Northeast and those of the Virginia and
Car0 lina Piedmont (cf. Lawson 1967:49-50).
The segment of the prehistoric skeletal series classified as
old (aged 40 years and above) , sho~ld be comprised mostly of males,
as they are most likely to survive the stress years of 18 to 40.
For late protohistoric/contact period samples, both males and
females would endure increased stress derived from exposure to
European diseases, incre ased warfare and competitio~, and disruption
of the extant social system. Few of either sex would be likely to
survive the stress years. Females, however, would probably have a

74
better chance than males to survive to old age in the late
protohistoric/contact peri~d if there was a decrease in childbearing
and its related stress from that of the prehistori8 period.
Convers:=ly , the presence of European diseases would probably
result in an increase in the nu~ber of deaths in all age groups
among Indian populati.()ns of the protohistoric and contact periods.
Such would be marked in particular by an increase in the ~u~ber of
dea t hs in the S-to-15 year age group. In a popu lation that is not
undergoing any extraordinary stresses , the S-to-15 year age group
usual l y sees a dec l ine in mortality (Droessler 1981) . Also , life
expectancy at birth and for each age category should be lower for
protohistoric/contact period samples when compared with prehistoric
s amples , given the increase in the types and intensity of stresses
to which the former are subjected.
In summary , five general demographic trends should be evident
when prehistoric , protohistoric and contact period burial sampl 9 s
are compared. These are :
1 . Similar mor tality profiles should be present for infants and females in all three.
2 . Higher mortality for males aged 18 to 40 years at death should be found in late protohistoric/co~tact pe r iod samples.
3. More old individuals (those aged 40+ in years) should be evident in th2 prehistoric/early protohistori8 period sa~ples.
4 . High ~r morta l ity among i nd ~viduals aged 10 to 20 years shou Jd be seen in late protohistoric/contact period sa mples.
5. Higher life e~pectancies f~r all age groups should b e exhibited by prehistoric and early protohistoric period samples.

75
Basic Assumptions and Limitations of Demographic Analyses
To investigate these five propositions, burial data from all
five sites are used to construct comparative demographic profiles.
The de~ographic reconstruction of a population is based on thre e
assumptions (Ubelaker 1974:59). First and foremost , it is assumed
that the skeletal sample is complete , or fully representative of the
living population. Of the five study sampl~s, only the Fredricks
site has almost been completely excavated. The other four sites
have bee~ partially excavated, which means th~t only a portion of
the total burial population is present. Even for the Fredricks site
it is possible that mare burials , as yet uncovered, lie outside the
confines of the palisade line which is the limit of the excavation
conducted at the site. The presence of one or m~re additional
cemetery areas at the Fredricks site is a distinct possibility,
given that 1 3 of the 15 burials in th,~ sample are from a supposed
c emetery (see Figure 6) located outside the northeast section of
palisade.
The second assumption of demographic reconstruction is that the
age at death can be accurately determined. In this study a nu~ber
of techniques i~h .~t utilized morphological or metrical data were used
to age individuals in each sa~ple (see below). Also , because th e
author aged all five samples, any biases introduc.:•:!d in determi ning
the age at death should affect each sampl 2 equally.
The final assumption of demographic reconstruction is that the
size of the living population and its death rate remain constant
during the occupation represented by the site ' s component undAr
study. This assumption is problematic in regard to

proto:1istoric/contact perio:i samples where nurtality probably
fluctuated fr:::,m year to year given the varying levels of stress
indu8ed by European disease , warfare , hunting and trade. Also ,
both Indians a,d Eur:::>peans t:::>ok slaves for both groups (Lawson
1967:48 , 64, 79-80 , 208-212) . This custom would also probably
r esult in population fluctuations from year to year.
76
Given these three assumptions and the limitations imposed on
the demographic reconstructions of the study samples , the results
presented here can only be viewed as preliminary and as providing a
basis for future investigations.
The first step in reconstructing the demographic
characteristics was to c:::>nstruct mortality curves and life tables
for the four samples with more than one adult individual. This
eliminated Upper Saratown-Locality 1 from consideration here as it
has only one adult i~dividual . Mortality curves were also
constructed for sexed individuals in order to investigate potential
differences and similarities in the mortality of the two sexes for
t he prehistoric , protohistoric and historic contact periods.
Mortality Curves
Mortality curves allow one to examine the percentages of a
population that died in particular age groups . Five-year age groups
are used to co~pute the life tables for three of the four sites in
t he study. The Wall site sample is so small that o~ly ten-year age
groups could be constructed in the site ' s life table. Figure 7
shows the mortality curves r econs tr:icted for all four sa mples.

p r. ·~ R c E !'! T l\ G E
0 F
D To:
A T H s
7
6 \ \ \
5C
"' \
.
"'' 4 \"-.
"' \ .
"' J \ \
2C
1 G
C·
0 1 0
AGE 07
Shan non 3ite \fo ll Si tc Uppe r Sn r atown Fred ric ks Site - · -
77
"' "'
'-..... I I '-..... .
......
' I
" 20 JO LJ)+
I' ,D IVIDUALS
Figure 7 . Mortality curves by 10-year age groups for four of the study samples .

78
Several similarities are immediately evident when the two
profiles of the prehistoric/early protohistoric period sites are
examined. There is a high frequency of death in the first 10 years
of life, which is followed by a decline through childhood into
adolescence as represented by the 10-20 year age category. At the
Shannon site a grajual increase in number of deaths is present in
the 20-30 year age group, with the increase continuing in the older
age groups at the site. At the Wall site, because no individuals
aged 20 to 40 years at death are present, little more can be said
about the mortality among this segment of the late prehistoric/early
protohistoric period sample. In both sample, the 40 and above age
group shows a sharp increase in mortality over the younger groups.
This pattern of high infant mortality, followed by lower childhood
mortality, and a subsequent continui ng rise in adult ,nortality at
the Wall and Shannon sites is similar to United Nations mortality
model curves computea from 158 censuses in 50 developing (non
industrialized) countries and published in 1955 (Buikstra 1976:22-
23). A similar pattern was found by Buikstra in a Middle Woodland
skeletal series from the Gibson and Klunk sites in Illinois. Such a
patte rn is considered to represent a normal mortality curve.
The late protohistoric/contact period Upper Saratown-Locality 2
and Fredricks site skeletal series also exhibit a pattern of high
infant mortality and low childh8od-adolescent ~ortality. However,
mortality at Upper Saratown-Locality 2 increases in the 20-30 age
group, while it remains constant at the Fredricks site. In the
Upper Saratown-Locality 2 sample, mortality then decreases in the
subsequent 30-40 age group before increasing slightly in th2 over 40
79
category. In contrast, the Fredricks site sample has a high
mortality rate in the 30-40 age group followed by a decrease in the
Jver 40 group. The general pattern of a high mortality rate between
the ages of 20 and 40 years , with fewer people surviving in th2 over
40 age group, at the two later sites deviates from the United
Nations model and that noted for the two samples of the late
prehistoric/early protohistoric era.
From the earlier discussio~s concerning the problems of sample
bias and sample size, it is evident that comparisons of mortality
between the late prehistoric/early protohistoric and late
protohistoric/contact periods in this study can involve only the
relatively larJt:"! samples from the Shannon site and Upper Saratown
Locality 2. The reconstructed mortality curves for these two
samples are graphically detailed in Figure 7. In general , the two
mortality curves are similar for the two sa~ples until age 25-30
years. At Upp2r Saratown-Locality 2, this age segment comprises
19. 3% of the sa~ple , a large increase from the 2.2% of the sa~ple
that is within the 20-25 year age group. The Shannon site sample ,
on the other ha.1d, exhibits 3. mor2 modest rise, increasing fr-:::>m 7. 1%
in the 20-25 year group to 8.0% for th~ 25-30 year gro~p. The
mortality curves for both sa~ples decrease for the 30-35 year age
~roup, that is followed by an increase for both in the 35-40 year
group. The ShannJ n site ~ortality curve then decreases to 6 . 2% for
the 40-45 year age group, before increasing d - amatically to 25.1%
for the over-45-year age group. In contrast, the mortality curve
for Upp2r Saratown-Locality 2 exhibits only a slight increase in the
two oldest age groups.

80
The differences that can be observed by examining the mortality
curves for the two study samples are taken to support two of the
propositions sta~ed earlier. First, there is a high rate of infant
mortality in all of the samples. This pattern is not unexpected,
conforming as it does to the infant mortality pc3.ttern that is
typical of ~ost ~odern-day Third World populations, who are
considered by many researchers to provide the best comparative data
for the study of past human populations (Droessler 1981:48). What
is noticable about the infant mortality figures is the lower
percentage of young infant deaths in the prehistoric period Shannon
site sample in comparison with the late protohistoric/early contact
period Upper Saratown-Locality 2 sample. The mean age of
individuals in the 0-5 year age group in the Shannon site sample is
1.2 years. For the other early sample in this study, the Wall site ,
the mean age for the 0-5 year gro~p is 1.26 years. In marked
contrast, the mean age at late protohistoric/early contact period
Upper Saratown-Locality 2 for this age group is 2. 92 years.
Likewise, the Fredricks site 0-5 year segment of the sampl e is aged
2.25 years . These figures indicate that neonates , that is , those
individuals aged Oto 12 months at death, might be underrepresented
at both of the later sites . Among the po3sible explanations for
this fact are that the neonates are buried in a location differe nt
from that of the other segments of the sample; they have been
disposed of in a manner that did not involve formal burial ; they
survived longer in the late protohistoric/contact period
populations; or some co~bination of two or more of these
explanations .

81
The first two alternatives listed here cannot be addressed at
this tim2 because other data dealing with differential burial/burial
customs are not avai l able . The third proposition, however , can be
examined using the twin concepts of "r-" and "K-" selection
developed by population biologists to study group formation in
animals (cf. Horn 1978: Pianka 1978). Basically, the r- and K
designations represent two poles on a continuum of strategies that
populations utilize to insure their survival. In population
biology, an r-strategy is denoted by large litters , small offspring,
little parental care, low parental survival , a nd high survival of
juveniles (Horn 1978 : 416) . K-strategies represent the opposite end
of the continuum, and are characterized by small litters , large
young, much parental care, high p~rental survival, and low survival
of the young (Horn 1978:418) . Obviously, not all of the various
characteristics listed for either r- or K-selection among animal
g roups need apply directly to human groups. Pianka (1978:120-125)
considers r- and K-selection in terms of competition. Populations
that are subjected to great fluctuations in the environ~ent can be
termed opportunistic populations (Pianka 1978:120) . In contrast,
populations that are usually in equilibrium with their resources,
that inhabit a stable environment , can be called equilibrium
populations (Pianka 1978:121). In a co~petitive vacuum, II . the
best reproductive strategy is often to put maximal amounts of matter
and energy into reproduction and to produce as many total progeny as
possible as soon as possible." (Pianka 1978:121). Such a strate gy
approximates the r-selection strategy described by Horn. The K
s election strategy, on the other hand, is best in an e nvironment

82
where the "competition is keen , and the best strategy may often be
to put more energy into competition and maintenance and to produce
offsprinq with more substantial competitive abilities." (Pianka
1978:122) . Because this strategy is "energetically more expensive,
it means that fewer [offspring] can be produced." (Pianka 1978:122).
Because the skeletal series involved here comprise only two
potentially biologically representative samples , all the
implications of the r- and K-selection reproductive stragegy model
for the investigation of the demographic changes between
prehistor ic/early protohistoric and l ate protohistoric/contact
period popu lations have yet to be fully explored. However, the
following proposition about the observed differences in the average
age of the subadul ts in the study samples is offered to sti~ulate
thought and serve as a basis for further research. In previous
sections of this study, the late prehistoric/early protohistoric
period, especially the prehistoric perioj, has been characterized
as a time of reduced stress and competition when compared to the
late protohistor ic/contact period. Th u s , late prehistoric/early
protohistoric populations should tend to exhibit r-type reproductive
strategies , given that stress and competition are low or stable.
Such strategies would be marked in a population by numerous
Jffspring found in the 0-2 year age group, and weaning would take
place at a n earlier age, say betw2en O and 24 months, than in K
strategy popu l ations. In contrast , the "best" reproductive strategy
for the high stress and competition times of the late
protohistoric/contact period would be a K-selection strategy. In
these later populations , more energy would have to be put toward

83
competition and maintenance of the social unit in the face of high
l evels of stress and co~pe tition. Energy e xpended on reproduction
would be less , so that fewer offspring could be produced. To insure
t he survival of these fewer offspring, ~ore energy (relative tor-
selection populations) would be expended on each offspring, but the
total energy expended on all the offspring would be less than in the
earlier r-selection populations because there would be fewer
offspring in the later, K-se l ection based populations. The K-
s election strategy of high stress/competition late
protohistor ic/contact populations should manifest itself in the
prolonged nursing of the individual offspring (delaye d weaning ) to
insure its survival into childhood and adolescence. This scenario
f or the late protohistoric/contact period is reflected in an
observation made by John Lawson (1967:196) to the effect that
neither does the youngest Wife ever fail of proving so g~od a Nurse , as to bring her Child up free from Rickets and Disasters that proceed from the Teeth, with many other Distempers which attack our Infants in England, and Parts of Europe. They let their Children suck till they are well grown, un l ess they pr ove big with child sooner .
The second proposition supported by the mortality curv es
derived for the Shannon site and Upper Saratown-Locality 2 sa~ples
is that older individuals comprise a larger percenta ge of late
prehistoric/early protohistori8 period sampl e s than of late
protohistoric/contact period samples. At the Shannon site, 31.25 %
of the burial sample survived to the 40+ age group. In contra st ,
the late protohistoric/early contact period Upper Sara town- Locality
2 site had only 16.14% of t h e sampl e s u rviving past age 40.
Mirroring this diffe rence , 25. 0% of the late prehistoric/early

protohistoric period Wall site sample survived to the over-age-40
group, as opposed to only 6. 67% of the middle contact period
Fredricks site sample.
84
Related to the higher percentage of individuals aged over 40
years at the late prehistoric/early protohistoric sites is the fact
that slightly more individuals between the ages of 20 and 40 years
died at the late protohistoric/contact period sites. Within this
age range , 35. 48% of the Upper Saratown-Locality 2 sample died, and
33. 33% of the Fredricks site. A smaller percentage of the sample,
32.1%, is aged between 20 and 40 years at death in the late
prehistoric period Shannon site sample.
A third proposition, that more individuals would be found in
the 10-to-20 year age category for the late protohistoric/contact
period samples , is only marginally supported by examining the
reconstructed mortality curves. The late protohistoric/contact
pe r iod Upper Saratown-Locality 2 and Fredricks site samples have
mortality levels of 10. 75% and 13. 33%, respectively, for this age
segment. The percentage of the Shannon site 's b urial sample aged 10
to 20 years at death is 8 . 04% , while the percentage for the Wall
site is 12. 5%. The figure for th2 Wall site is misleading because
of the extremely small size of the sampl e from the site. However,
the figures do not seem to reflect an abrupt change, certainly not a
dramatic increase , in adolescent mortality from the
prehistoric/early protohistoric to th2 late protohistoric/contact
periods .

85
Mortality Curves .!2,y Sex
Mortality curves by sex for the Shannon site and Upper
Saratown-Locality 2 are depicted in Figure 8 . No mortality curves
by sex coJld be computed for the Wall and Fredricks sites because of
the small sample sizes and the fact that no females are present in
the Wall site sample. For the late prehistoric period Shannon site ,
26% of the males and 22% of the females died between the ages of 20
and 30 years. In the 30-to-40 year age group at the Shannon site ,
males decline to 20% while females rose to 33%. Individuals over 40
comprise 54% of the Shannon site male sample. And 45% of the burial
sample at the Shannon site is female. The figur e s for both sexes
aged 40+ are quite larger than the preceding 30-40 age group.
To explore whether the number of males and females at the
Shannon site in the two age categories 20-to-40 years and 40+
years were significantly different statistically, a Chi-s1uare test
was performed. The results of the analysis of the 2x2 contingency
table, detailed in Tabl e 8, show that x2 = 0 . 6903 , df = 1 , and p <
0. 50. This indicates that the differences noted for the two age
groups by sex are not statistically significant.
At Upper Saratown-Locality 2, a slightly different pattern of
age and sex distribution is present. A total of 37% of the males
are aged 20 to 30 years , as opposed to only 27 . 5% of the females.
In the 30-to-40 year age category, 29% of the males are found and
27.5% of the females. And in the 40+ age group, 34% of the males
are found , and 45% of the females. A 2x2 contingency table (Table
8) with two age categories, one of 20 to 40 years and the other of
40+ years, was constructed to test whether the difference in age

p E R c E ~·J T A G E
0 F
D E A T H s
60
5
40
30
20
1 0
0
20 30
AGE OF I~DIVIDUALS
Sha nnon Site Males Shan non Site Females Upper Saratown !!ales -Upper Saratown Females ~ · ~
86
.,,,,,,; · /
40+
Figure 8 . Mortality curves by sex for the Shannon site and Upper Saratown-Locality 2 site study samples.

'!ABLE 8.
CcntinJency Tables (2x2) for Chi-Sq..iare Test Conp3.rinJ M:l.les am. Feral.es fran the Sh3nn:n Site am. lJr:p2r Sarato.vn-I.ccality 2.
N..MEER ~ 20-40 YE1\RS N.MPER ~ 40+ YE7IRS 'IOW.,
Count Exp2ctErl Percentage Count Exp:.ct:Erl Percentage
SEruxn Site
Miles 16 (17 .75) 46% 19 (17.25) 54% 35
Feral.es 20 (18.25) 55% 16 (17 .75) 45% 36
'Ibtal 36 36 71
x2 = 0.6<:()3, with df = 1, p < O.::D.
Ug::er Sarato.vn-I.ccality 2
Miles 16 (14 .85 ) 67% 8 (9.15) 33% 24
Farales 10 (11.15) 55% 8 (7.85) 45% 18
'Ibtal 26 16 42
x2 = 0.5206, with df = 1, p < O.::D.
87

group distribution by sex was significant using the Chi-square
statistic. The results are x2 = 0.5206, df = 1, and p < a.so.
Again, the Chi-square statistic indicates that there is no
significant difference between male and female mortality at late
protohistoric/early contact period Upper Saratown-Locality 2.
88
The Chi-square test was also used to co~pare changes in male
and female mortality through time. Using the same 20-to-30 and 40+
age categories, 2x2 and 2x3 contingency tables were constructed for
the male data from the Shannon site and Upper Saratown-Locality 2.
Table 9 shows the contingency tables and the result of the test,
which is that x2 = 2.5128, df = 1, and p < 0.20. Although this
result is not statistically significant, it does indicate that study
of a possible shift in the mortality pattern of males from the late
prehistoric/early protohistoric period to the late
protohistoric/early contact period using more data might prove
useful. Examination of the raw figures (the percentages and counts
listed in Table 9 and Figure 8) indicates that male mortality
increased during the late protohistoric/early contact period with a
higher percentage of individuals dying between the ages of 20 and 40
years than had in the prehistoric period.
The 2x2 and 2x3 contingency tables constructed for the
comparison of the females from the Shannon site and Upper Saratown
Locality 2 are shown in Table 10. The figure computed for the 2x2
test is x2 = 0.0, df = 1, and p < 0.99, and for the 2x3 test is x2
0.2695, df = 2 , and p < 0.90. Both results indicate that no
statistically significant changes in female mortality occurred from

TABIE9.
Qntingency Tables (2x2 and 2x3) for Ori.-&:µrre Tests Cmp3ring Miles fran tre Shanrx:n Site arrl Ug;:er Saratavn-Lcx::ality 2.
STIE Qil-9'.}lARE TABlE
89
N..MBER AGED 20-40 YEARS Count Exp3cted Percentage
N..MBER AGED 40+ YE1IRS 'lOIAL
Sh:mnon Site
lJW2r Sarato,.n-I.ccality 2
'lbtal
16 (18.'*3) 45%
16 (13 . 02) 66%
32
Count Exp3cted Percentage
19 (16 .02) 54% 35
8 (10 . '*3) 34% 24
27 59
x2 = 2. 5128, with df = 1, p > 0. 20.
N..MBER AGED 20-30 Count Exp3cted %
Sannon Site
lJW2r SaratavnI.ccality 2
'lbtal
9 (10.67) 26%
9 (7.33) 37%
18
N..MBER AGED 3'.)-40
Count Exp3cted %
7 (8.X>) 20%
7 (5.40) 29%
14
N.M3ER AGED 40+ 'lOIAL
Count Exp3cted %
19 (16 .02) 54% 35
8 (10 . '*3) 34% 24
27 59
x2 = 2.505, with df = 2, p > 0 . 30.

TABIE 10.
Crnt.inga1cy Tables (2x2 am. 2x3) for Clri.-&µrre Tests Catlp3.ring Ferales fran tre Shann:n Site arrl Uf!:er Saratavn-Locality 2.
SITE
Shannon Site
lJJ.:!Er Sarata.vn-Lcx::ality 2
'Ibtal
N..M8ER .AGED 20-40 YEARS Count Exf:ectErl Peramtage
20 (20) 55%
10 (10) 55%
30
N.M3ER .AGED 40+ YEARS Count Exf:ectErl PerCEntage
16 (16) 45%
8 (8) 45%
24
x2 = o, df = 1, m differenCE.
N..M8ER .AGED 20-30 N..M8ER .AGED JJ-40 N..M8ER .AGED 40+
Count Exf:ectErl % Count Exf:ectErl % Count ExpectErl %
Shannon 8 (8.66) 22% 12 (11.33) 33% 16 (16) 45%
UJ:!Er 5 (4.34) 28% 5 (5.67) 28% 8 (8) 44% Sarato,,n-
Locality 2
'lbtal 13 17 24
x2 = 0.2695, with df = 2, P < o.~.
90
36
18
54
WW,
36
18
54

the late prehistoric period site to the late protohistoric/early
contact period.
91
Based on the results of these Chi-square studies, the
proposition that female mortality would remain relatively constant
in late prehistoric, protohistoric and contact period samples is
supported. Also, the proposition that higher mortality among males
aged 20-to-40 years in the later samples is supported. Although
little can be done at present to further test these propositions,
examination of the small skeletal samples from the Wall and
Fredricks sites corroborates the above proposition concerning males
aged 20-to-40 years . For the late prehistoric/early protohistoric
period Wall site male sample (n=3), one male is aged between 17 and
20 years, and two are aged 40+ years. This is similar to the ratio
noted above for the Shann~n site sample. In contrast, four of the
five males found at the Fredricks site are aged 20-to-40 years at
death, and only one is aged 40+, a pattern similar to that found
among Upper Saratown-Locality 2 males.
Life Tables
Using the information on age at death for the study samples,
life tables were constructed for the four sites (Tables 11-14).
Such life tables are useful in the investigation of the proposition
that the life expectancy of an individual would tend to be greater
in late prehistoric/early protohistoric burial samples than in late
protohistoric/contact period samples. Life tables were determined
using the same formulae used by Ubelaker (1974:62) in his analysis
of the Maryland Nanjemoy ossuaries. To co~pare the four sites, and
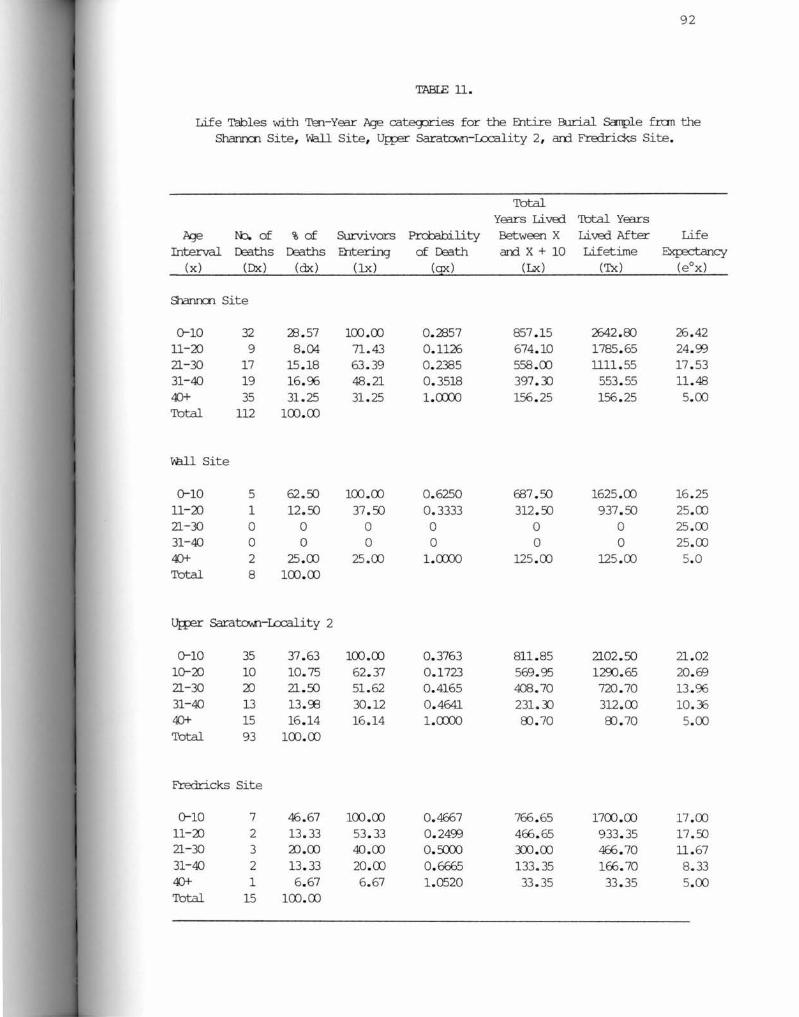
92
T.ABIE 11.
Life Tables with Tal-Yrer lv::Je categ::iries for the Ehtire Burial Sample f:ran the Shann::n Site, Wall Site, u~ Sarato.vn-Locality 2, am Fredricks Site.
Total Yrers Liverl 'Ibtal Yrers
1'q2. It). of % of Survivors Prd:Ebility Between X Liverl After Life Interval Ceaths Ceaths Ehtering of Ceath am x + 10 Lifetime E>q:a::;tancy
(x) (Dx) (dx) ( lx) (qx) (Lx) ('Ix) (e0 x)
Sanrx:11 Site
0-10 32 ?B . 57 100.00 O. ?i357 857 .15 2642 .80 26 . 42 11-20 9 8. 04 71 . 43 0.1126 674. 10 1785. 65 24. 93 21-30 17 15. 18 63 . 39 0. 2385 558 .00 1111. 55 17 . 53 31-40 19 16.96 48 . 21 0. 3518 397. 31 553. 55 11. 48 .«)+ 35 31 . 25 31.25 1.0000 156. 25 156. 25 5.00 Total 112 100. 00
Will Site
0-10 5 62 . 50 100.00 0. 6250 687 . 50 1625.00 16 . 25 11-20 1 12.50 37 . 50 0. 3333 312. 50 937. 50 25. 00 21-30 0 0 0 0 0 0 25 .00 31-40 0 0 0 0 0 0 25. 00 40+ 2 25 .00 25.00 1.0000 125. 00 125.00 5. 0 Total 8 100. 00
Ug;;er Sarato...n-I.ccality 2
0-10 35 37 .63 100.00 0.3763 811 .85 2102.50 21 .02 10-20 10 10.75 62 . 37 0.1723 569. 95 1290.65 20. 69 21-30 20 21 . 50 51 . 62 0. 4165 408 . 70 720 . 70 13 . 96 31-40 13 13.<:l3 30. 12 0. 4641 231.31 312.00 10.36 40+ 15 16.14 16.14 1.0000 00 . 70 8) . 70 5. 00 Total 93 100. 00
Fredricks Site
0-10 7 46.67 100.00 0. 4667 766. 65 1700.00 17 .00 11-20 2 13 . 33 53. 33 0. 2493 466 . 65 933 . 35 17.50 21-30 3 2) .00 40 .00 0.5000 3'.Xl .00 466.70 11 . 67 31-40 2 13.33 20. 00 0. 6665 133. 35 166.70 8. 33 40+ 1 6. 67 6. 67 1.0520 33.35 33 . 35 5.00 Total 15 100. 00

93
TABIE 12.
Life Tables with Five-Ye:rr Age Categ)res for the Entire Burial Semple fran tre Sharuxn Site, U:i:per Sarato,..n-Lccality 2, arrl tre Fredricks Site.
Total Ye:rrs Liva:! Total Ye:rrs
Age N:>. of % of Survivors Prd::>ability Between X Liva:! After Life Interval Ceaths Ceaths Entering of Ceath arrlX+5 Lifetime E:>qE::tancy
(x) (Dx) (dx) (lx) (gx) (Lx) (Tx) (e0 x)
SErln::n Site
0-5 25 22 . 30 100.00 0.2230 444 . 25 2740.00 27.40 6-10 7 6. 2) 77 . 70 0. 0798 373.00 2295. 75 29 . 55
U-15 5 4. 50 71.50 0.0629 346. 25 1922. 75 26 .89 15-2) 4 3. EO 67.00 0 .0537 326.00 1576. 50 23 . 53 21-25 8 7.10 63.40 0. 1199 299.25 1250. 50 19.72 26-30 9 8.00 56. 30 0.1421 261.50 951.25 16. CXJ 31-35 6 5.40 48 . 30 0. 1118 228.00 ffi9 . 75 14. 00 36-40 13 11.EO 42.CXJ 0. 2704 185. 50 461.75 10. 76 41-45 7 6. 2) 31.30 0.1981 141.00 276.25 8. 82 46-50 13 11. EO 25.10 0. 4621 96. 50 135.25 5.39 51-55 14 12.50 13.50 0.9259 36.25 38. 75 2.87 55+ 1 1.00 1.0 l.CX)O'.) 2.50 2.50 2.50 Total ll2 100.00
U:i:per Sarato,..n-Lccality 2
0-5 24 25.00 100.00 0.2580 435 . 50 2109.50 21 .09 6-10 11 11 . 00 74 . 2) 0.15CXJ 341. 50 1674.00 22.56 ll-15 6 6.50 62 . 40 0.1042 295 . 75 1332. 50 21 . 35 15-2) 4 4. 30 55. CXJ 0.0769 268.75 1036.75 18. 55 21-25 2 2. 2) 51 . f:D 0.0426 252.50 768.00 14.88 26-30 18 19.30 49. 40 0.3o/J7 198. 75 515. 50 10.43 31-35 6 6.50 30. 10 0. 2159 134.25 316. 75 10. 52 36-40 7 7. 50 23.EO 0.3178 99.25 182.50 7. 73 41-45 7 7. 50 16.10 0.4658 61 . 75 83.25 5.17 46-50 8 8. EO 8.EO l.CX)O'.) 21.50 21.50 2.50 Total 93 100.00
Fredricks Site
0-5 6 40 .00 100.00 0.4000 400.00 1516.67 15.16 6-10 1 6. 67 f:IJ. 00 0. 1112 283.32 1116.67 18.61
ll-15 1 6. 67 53 . 33 0.1251 249.97 833.35 15.62 15-2) 1 6. 67 46. €6 0. 1429 216. 62 583.38 12. 50 21-25 2 13 . 31 39 .99 0. 3328 166.67 366.76 9. 17 26-30 1 6. 67 26. 68 0. 2500 116. 72 200.09 7.49 36-40 2 13.31 2).01 0. €651 €6 .70 83 . 37 4.16 41-45 1 6. 67 6. 67 l.CX)O'.) 16.67 16. 67 2. 50 Total 15 100.00
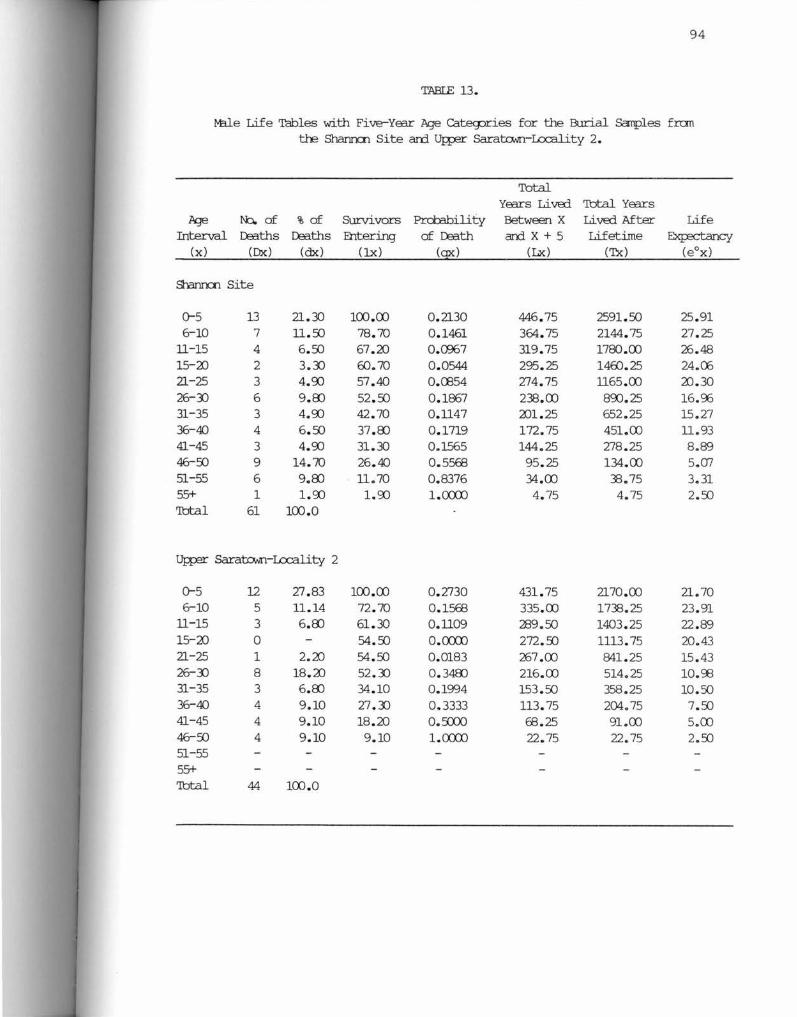
94
'!'.ABIE 13.
M3.le Life Tables with Five-Year Age Ca:tegxies for the Burial Samples fran tre Shann::n Site arrl UJ;p=r Sarato,,,n-I..ccal.ity 2.
Total Years Li VErl 'lbtal Years
Age N:.. of % of Survivors Prd:abilify Between X Li VErl After Life Interval Ce3.ths Ce3.ths Ehtering of Ce3.th andX+5 Lifetime ExfEci:ancy
(x) (Ox) (dx) (lx) (gx) (Lx) (Tx) (e0 x)
Sranrx:n Site
0-5 13 21.30 100.00 0.2130 446.75 2591.50 25.91 6-10 7 11.50 78.70 0.1461 364.75 2144.75 27.25
11-15 4 6.50 67.20 0.(Jx,7 319.75 1780.00 26 . 48 15-20 2 3.Xl 60.70 0.0544 295.25 1460.25 24.(X) 21-25 3 4.90 57.40 0.0054 274.75 1165.00 20.30 26-Xl 6 9.00 52.50 0.1867 238.00 890.25 16.96 31-35 3 4.90 42.70 0.1147 201.25 652.25 15.27 36-40 4 6.50 37.00 0.1719 172.75 451.00 11.93 41-45 3 4.90 31.30 0.1565 144.25 278 . 25 8.89 46-50 9 14.70 26.40 0.5568 95 .25 134.00 5.ITT 51-55 6 9.00 · 11. 70 0.8376 34.00 38.75 3.31 55+ 1 1.90 1.90 1.0000 4.75 4.75 2.50 Total 61 100.0
Ui;:p=r Sarato,,,n-I..ccal.ity 2
0-5 12 27.83 100.00 0.2730 431.75 2170.00 21.70 6-10 5 11.14 72.70 0.1568 335.00 1738.25 23.91
11-15 3 6.00 61.30 0.1109 289.50 1403.25 22 .89 15-20 0 54.50 0.0000 272.50 1113.75 20.43 21-25 1 2.20 54.50 0.0183 267.00 841.25 15.43 26-X) 8 18.20 52.Xl 0.3400 216.00 514.25 10.':E 31-35 3 6.00 34 .10 0.1994 153.50 358.25 10. 50 36-40 4 9.10 27.Xl 0.3333 113.75 204.75 7.50 41-45 4 9.10 18.20 0.5000 68.25 91.00 5.00 46-50 4 9.10 9.10 1.0000 22 . 75 22. 75 2.50 51-55 55+ Total 44 100.0

95
TABIE 14.
Farale Life Tables with Five Yrer ~ Catecpries for the Burial Scuiples fran tre Shanrx::n Site and U.i;p=r Sarato..Jn-I.ccality 2.
Total Yrers Lived 'Ibtal Yrers
h:Je N:i. of % of Survivors Prd::ability Between X Lived After- Life Interval I:e:tths I:e:tths Entering of I:e:tth and.X+5 Lifetime Elq::ectancy
(x) (Dx) (dx) (lx) (gx) (Lx) (Tx) (e0 x)
SEnrol Site
Cr5 13 21.00 100.00 0.2100 447.50 2550.75 25 .50 6-10 7 11.)J 79.00 0.143.J 366.75 2103.27 26. 62
11-15 4 6.40 67 . 70 O.CB45 322 .50 1736.52 25 .65 15-~ 2 3.~ 61.3.J 0.0522 289.50 1414.02 23.07 21-25 5 8.10 58.10 0. 1394 270.25 1115.52 19.20 26-)J 3 4.00 50.00 0.09EO 238.00 845.27 16.90 31-35 3 4.00 45.20 0.1062 214.00 607.27 13.43 36-40 9 14.50 40.40 0.3589 165. 75 393. 27 9. 78 41-45 4 6.40 24.90 0.2471 113.50 227.52 8.78 46-50 4 6.40 19.50 o. 3282 81.50 114.02 5. 84 51-55 8 13.90 13.10 1.0000 32.50 32.50 2.48 55+ 'Ibtal 62 100.00
U.i;p=r Sarato..Jn-I.ccality 2
Cr5 12 28.60 100.00 0.2860 428 .50 ~10.99 ~.10 6-10 5 11.90 71.40 0.1666 327 .25 1582.49 22.16
11-15 3 7.15 59.50 0.1201 279 .62 1255.24 21.10 15-~ 4 9.50 52.35 0.1815 238.00 975.62 18. 64 21-25 42.85 0.0000 214.25 737.62 17.21 26-3.J 5 11.90 42.85 0.27TI 184.50 523. 37 12.21 31-35 3 7.15 38.95 0.2310 136.87 338 . 87 10.95 36-40 2 4.00 23.00 0.2017 107.00 202.00 8. 49 41-45 4 9.50 19.00 0.0526 71.25 95 .00 5. 00 46-50 4 9.50 9.50 1.0000 23. 75 23 .75 2.50 51-55 55+ 'Ibtal 42 100.00

96
primarily due to the small sample size of at least two of the study
samples, 10 year age categories were computed. In addition , 5 year
age categories could be constructed to compare the Shannon site and
Upper Saratown-Locality 2 b urial samples. Using 10 year categories,
l ife expectancy at birth for the late prehistoric period Shannon
site sample is 26.42 years (Table 11). If an individual reaches
past the age of 10 years, the life expect ancy is an additional 24 . 99
years (age at death is 34. 99 ). After age 20 this figure decreases
to 17.53 years. The Wall site buria l sample possesses a life
expectancy at birth of on ly 1 6.25 years (Table 11). This figure,
which is extremely low when compared with the Shannon site and other
prehistoric period skeletal series f r o m the southeast (Table 15), is
certainly an artifact of the s mall sample fro m the Wall site.
Comparison of the life expectancy at ages 10 and 20 shows that the
Wall site figures are cons istently higher than those of the Shannon
site.
Both of the later samples possess lif e expectancies at birth
that are l ess than that noted for the Shannon site. Life expectancy
at birth for Upper Saratown-Locality 2 (Table 11 ) using 10-year age
categories is 21.02 years , at 1 0 years it is 30. 69 , and at 20 years
it is 33 . 96. For the Fredricks site (Table 11), the life expectancy
is 17 . 56 at birth , 28 . 75 years at age 10, and 33 . 33 years at age 20 .
Using 5 year age intervals , the lif e expectancy at birth in the
Sh annon site (Table 12) is 27.4 years. At Upper Saratown-Locality
2, the life expectancy at birth based on 5 year age groups is 21 . 09
years (Table 12) .

'I7\BI.E 15.
Ccrrµrriscn of Li£e E:iq;:ectancy at Buth of the Foor Sbrly Sarples with Selected Archaeolcgical furial Sarrples.
LIFE EXPECrnNC.Y FOFUI.ATICN DA'IE IN YEARS
Larsen, Scuth D3kota A.O. 17:1)-1785 13.2
Fredricks Site, North A. O. 1600-1712 15.16 Carolina
Will Site, North Carolina A.O. 1547 16.3
Irrlian Kn:>ll , Kenb.lcky 300) B.C. 18.6
M::Fayj.61 M::urrl, ( 31..&67) I A. O. lCXX)--1500 19.9 North Carolina
N3.n jeroy, Osst.ary I , A.O. 1500-16CX) 20 . 9 M:u:ylarrl
lJI::!;er Sarat.o,.,n-Locality 2, A.O. 1630-1665 21 .0 North Carolina
N3.njeroy, Osst.ary II , A.O. 1500-16CX) 22 . 9 M:u:ylarrl
S1ann::,n Site, Virginia A.O. 1450- 26 . 4
Texas Irrlians A.O. 850-1700 30. 5
t>b:lified fran O,,,sley arrl Bass (1979: l:D) arrl H. Wilsen ( 1982: 154 ) •
97

98
Comparing the life expectancies for males and females at the
Shannon site and Upper Saratown-Locality 2 (Tables 13 and 14) , it is
evident that both sexes are quite similar to one another within
their own burial samples. This changes when the life expectancies
for both sexes between the sites are examined. Both sexes have a
higher life expectancy in the late prehistoric period sample than in
the late protohistoric/early contact period. For males , the life
expectancy at birth in the prehistoric Shannon site sample is 25 . 91
years , and for females it is 25 . 50 years . At Upper Saratown
Locality 2, males have a life expectancy at birth of 21 . 70 years and
females of 20 .10 years .
As comparison of the data by skeletal series and by sex shows ,
life expect ancies are generally higher for the late prehistoric
period sample than for the late protohistoric/early contact period
sample. The original poposition that there woulj be a general trend
toward a longer life expectancy in the late prehistoric/early
protohistoric samples when compared to the late
protohistoric/contact period samples is supported. This observation
is made with the information from the Wall and Fredricks sites being
excluded because the population samples from these two sites are too
small for reliable conclusions to be drawn from them.
Crude Mortality Rates
The crude mortalilty rate of a population represents the number
of individuals per 1000 that die in a year . Assuming that the death
rate is constant, the crude mortality rate of a population can be
computed by dividing the life expectancy at birth into 1000

99
(Ubelaker 1978:96). For the Shannon site, a life expectancy at
birth of 26.42 years yields a crude mortality rate of 37.85. A
crude mortality rate of 61.73 is computed from the Wall site data.
Of these two, the Shannon site estimate best represents the crude
mortality rate for a pre-contact period population, given the
problems with sample size and sample bias that plague the Wall site
sample .
For the late protohistoric/contact period sites, Upper
Saratown-Locality 2 has a crude mortality rate of 47.573 , and the
Fredricks site of 56 .625 . Therefore, as stated in our original list
of propositions, there is an increase in the number of deaths per
year per 1000 individuals from the prehistoric period (as
represented by the Shannon site skeletal series) to the late
protohistoric/contact period (as represented by Upper Saratown
Locality 2 and the Fredricks site) .
Summary of the Demographic Studies
The information on age-specific ~ortality and life expectancy
presented here has proved valuable in evaluating the overall health
and fitness of the four Piedmont Indian burial samples. Several
propositions were introduced and examined using techniques of
demographic analysis. The relatively l arge skeletal sa~ples from
the late prehistoric period Shannon site and the late
protohistoric/early contact period Upper Saratown-Locality 2 were
used to develop "models" against which the small (and probably
biased) samples from the late prehistoric/early protohistoric period
Wall site and the middle contact period Fredricks site could be

100
compared. Of the five propositions originally set forth i n this
section, four are supported by data from the Shannon site and Upper
Saratown-Locality 2, with similar patterns being documented for the
Wall and Fredricks sites. Support is provided for the propositions
that there will be similar mortality profiles for infants and
females at the late prehistoric , protohistoric and contact period
sites; higher mortality for young males at the late
protohistoric/contact period sites ; more older individuals in the
late prehistoric/early protohistoric period sites; and higher life
expectencies for the late prehistoric/early protohistoric period
burial samples. The fifth proposition, that higher mortality among
individuals 10 to 20 years would exist in the late
protohistoric/contact period samples , is not supported. Hopefully,
larger and more representative samples from the Wall and Fredricks
sites, and other prehistoric , protohistoric and contact period
sites , will be forthcoming. This will permit a more thorough study
of these propositions and suggest other patterns for investigation.

CHAPTER V
DIET, HEALTH, AND TRACE ELEMENT ANALYSIS
A major advance in the study of prehistoric human diet has been
the ability to analyze the chemical content of bone samples,
especially those analyses that examine the occurrence of certain
trace elements. In this study, trace element analysis is used to
consider questions pertinent to the diet and general health of the
prehistoric, protohistoric, and contact period populations.
Techniques that measure the relative concentrations of trace
elements in human bone have come to be heavily relied upon by
archaeaologists interested in reconstructing diet, studying disease
states, and examining the general health of archaeological
populations (Bahou 1975; Blakely and Beck 1981; Lambert et al.
1979).
Bahou (1975) attempted to study the relationship between
disease states and trace e lement levels for the skeletal series from
the Dickson Mounds in Illinois. Bahou (1975:15) hypothesized that
zinc would be correlated with infectious disease states. Because of
zinc ' s ability to enhance wound closure, with an assumed
accompanying lower susceptibility to infection, there should be a
relationship between zinc levels and the presence and severity of
infectious disease states in the skeletal sample. However, no
definite correlation between infectious severity and zinc

102
concentrations was uncovered by Bahou, although zinc was present in
the bone samples. Still , Bahou (1975 :15) concluded that the
poss ibility of discerning disease states using trace element
analysis was high , given the important intersection of culture and
biology. Although Bahou' s study did not produce the intended
results , it did show that trace element studies offered a way in
which disease states in archaeological popu lations could be studied.
In their study, Blakely and Beck (1981 : 429) stress that more
than one trace element should be used to assess dietary stress in a
population. Copper , z i nc , magnesium, a n d strontium are the
recommended trace elements because of their sensitivity to dietary
intake. Blakely and Beck used trace e l ement analysis to test the
hypothesis that skeletons representing the subordinate and
superordinate classes at Etowah, a Mississippian ceremonial center
and mound complex in Georgia , would contain different concentrations
of trace elements. The four elements used in the analysis were
zinc, copper , strontium, and magnesium. Zinc and copper are usually
found in high levels in meat resources , while strontium and
magnesium are usually found in high concentrations in plant
resources . Blakely and Beck compared the l evels of these four
elements for two Etowah skeletal samples , one from a village in the
area and the other from a mound in the ceremonial complex. Results
suggested that no statistically significant differences were present
for the trace element l eve l s from the two samples. This was take n
to indicate that status was achieved rather than ascribed in Etowah
society (Blakely and Beck 1981:420) .
Lambert , Szpunar , and Buikstra (1979) used trace e l e ment

103
analysis to compare the diets of a Middle Woodland skeletal series
from the Gibson site and a Late Woodland skeletal sample from the
Lederer site in Illinois. It was found that strontium, zinc,
magnesium, calcium, sodium, and copper in bone were . unaffected by
soil contamination, and therefore could be used in the study of
human bone samples (Lambert e t al. 1979:127). Differences between
the two skeletal series were noted in the levels of strontium,
manganese , and magnesium. These differences were interpreted to
reflect the change from a hunting-gathering form of subsistence
dependent on locally gathered wild plants employed at the earlier
Gibson site, to a subsistence dependant on maize agriculture
(Lambert et al. 1979:127-128).
Another use of trace element analysis has been for determining
the relative contributions of meat and plant food resources to the
diets of various segments of a population, and how such patterns
relate to status (Brown 1974; Hatch a nd Geidel 1983; Schoeninger
1979). In one of the earliest considerations of this use of trace
element analysis, Brown (1974) convincingly argued that individuals
in a population with preferential access to meat resources could be
identified by lower strontium levels in the bone samples. This
hypothesis was tested using skeletal series from the site of Huitzo
in the Valley of Oaxaca, Mexico. Eleven bone samples were assayed
for strontium, and differing levels of this trace element were
noted. Brown concluded that strontium levels could be used as a
dietary indicator of status differences between and within
populations. Also , she suggested that the assay of strontium levels
in the bone samples could be used to monitor changes in diet through

104
time at a site. Such changes in diet could reflect alterations in
subsistence behavior, or changes in access by population segments to
food resources (Brown 1974:48).
In addition to trace elements , the levels of other elements,
such as lead, in the bone samples can be analyzed. For the contact
period, an inquiry into the lead content of bone may prove
rewarding. Research has shown that elevated levels of lead in human
tissue usually arise from association with some form of lead
manufacturing or utilization (Aufderheide et al. 1981). Given the
introduction of lead into aboriginal society in the for m of pewter
artifacts, lead metal artifacts (especially lead shot), lead-based
paint, and lead-glazed pottery, bone lead content from earlier to
later contact period sites could be compared. The presence of
increased lead levels in contact period aboriginal populations could
indicate the use of lead artifacts such as pots, shot , and pipes in
traditional European fashion. Also, elevated lead levels in the
environment could have contributed to decreased birth rates and
increased poor health for contact period populations.
Food Resources and Trace Element Analysis
For trace element analysis to be informative, it is essential
that the food resources available to a population be reconstructed
from the archaeological record. Information is available concerning
the faunal food resources utilized at each site included in this
study. A list of the major animal species represented in the
archaeological remains from the Shannon site is provided by Benthall
( 1969: 143-144 ). For the Upper Saratown sites J. Wilson (1983:513-

105
545) provides an analysis of the faunal remains. Holm (1987) gives
the results of the analysis of faunal collections from the Fredricks
and Wall sites. In all cases deer (Odocoileus virginianus), turkey
(Meleagris gallapavo), passenger pigeon (Ectopistes migratorius),
and turtle (Terrapene carolina) were the prominent meat resources.
Small mammals, such as the raccoon (Procyon lotor) and opossum
(Didelphis virginiana), other birds , such as the bobwhite quail
(Colinus virginianus), and fish were also utilized by the study
populations.
The relative diversity of the faunal resources used by each
study population (except for the Shannon site) as indicated by the
pounds of meat percentage contributed by each animal species was
examined using Lieberson's (1969) Diversity Index formula (which was
discussed earlier in Chapter III). Information for another
prehistoric site of the Roanoke River drainage in the inner Virginia
Piedmont, the Reedy Creek site (44Ha22), was used instead of the
Shannon site information, which did not have any lists from which
the pounds of meat contributed by each species to the site total
could be calculated. It is recognized here that the use of the data
from 44Ha22 skews any conclusions that might be reached in the
following analysis. However, it is used here because it is the best
example of the faunal resource usage at a late prehistoric site in
the inner Piedmont of Virginia, and it is felt that it can serve as
an approximation of the general structure of faunal utilization at
the Shannon site. Also, both the Shannon site a nd the Reedy Creek
site possess similar ceramics of the Clarkesville series.
Information for 44Ha22 and the Upper Saratown sites are from J.

106
Wilson (1983:522-540), and data for the Fredricks and Wall sites are
from Holm (1987:254) . Table 16 shows the results of applying
Lieberson's diversity formula to the meat weight totals from the
five sites.
Comparison of the diversity computed for meat yield for each
species indicates that there is an increase in the diversity of
species utilized through time. The lowest index, 0.2422, is from
the late prehistoric period Reedy Creek site. The highest index of
0.6253 is also from the latest site included in this study , the
middle contact period Fredricks site.
J . Wilson (1983:542-544) suggests that the apparent increasing
diversity noted in the use of faunal resources after the late
prehistoric period reflects the increasing use of habitats,
primarily the deciduous forest habitat, other than those favored by
deer. This slight shift may have been tied to a need to expand the
hunting range for skin- and fur-bearing animals used in trade with
the Europeans .
For whatever reason, the apparent increase in the diversity of
animal resources utilized beginning in the protohistoric period is
important in interpreting the results of the trace element analyses
of a skeletal sample. This is especially true when those elements
related to protein intake, such as zinc , are considered. If more
protein foods are available to the entire population, one might
expect an increase in the percentage of zinc identified in late
protohistoric/contact period skeletal series over that of late
prehistoric/early protohistoric period skeletal series. Conversely,
there may be little change, or a decrease , in zinc if the increased

'mBLE 16.
~irg fveasure of Niche Width far Faunal Rescurces through Tine Usirg Liererscn's Diversity Pamula arrl Pc::un:ls of M:xlt Crntri.h.Ited by ooch SJ:::.ecies.
STIE PERI CD NIQIB WIDIH
Reedy Creek ( 44Ha22) Late Prehistoric .2422
Will. Site ( 310rll) Late Prehistoric/ .3135 Farly Protchistoric
Ug::er Sarato..iri-Lo:ality 1 Protc:hi.storic .4518 (31Skl)
Ug;:er Sarato,,n-I.ccality 2 Late Protc:hi.storic/ .5231 (31Skla) Farly Caltact
Fredricks Site (310r231) Mid:lle Crntact .6253
Liererscn's Diversity Fo:rrrula is
where Aw is tre diversity within tre sample p:>p.tlatim, ~ is the _reroentage ocx::urrence of the p::::,unjs of meat yield far a p:rrticular SP=(:ies. S is the summed total of tre squarerl _rercentage meat yield for all faunal SfeCies in the sbrly. Subtracting S from 1 gives the prd:ability that two ran::lanly p3irErl traits (in this case _rercentage meat yields) within the sample p::p.tlation will te different.
'Ire Reedy Creek sample o:nsists of 18 SfeCies/taxa categ::iries and a minimum nurber of in:::lividuals count of 85 (J. Wilsen 1983).
'Ire Wall site sample o:nsists of 25 species/taxa categ::iries with a minimum number of in:lividuals count of 264 (Holm 1987).
'Ire Ug:er Saratown-I..a::ality 1 sample has 19 species/taxa categ::iries and a minirnum nurber of in:::lividuals rount of 156 (Holm 1987).
'Ire Ug:er Saratown-I.ccality 2 sample has 14 species/taxa cate<pries and a minirnum nurber of in:::lividuals count of 67 (J. Wilsen 1983).
'Ire Fredricks site sample has 27 species/taxa categ::iries and a minimum~ of in:::lividuals rount of 133 (Holm 1987).
107

108
diversity of faunal resources available reflects an attempt to cover
an overall decline in the total amount of protein derived from
animals .
For the other major food resource that comprised the Indian ' s
subsistence, plant foods , information is available for the Shannon
site in the form of an unquantified general list (Benthall
1969 : 143) , the Wall and Fredricks sites (Gremillion 1987 : 259) , and
Upper Saratown-Locality 2 (31Skla) (J. Wilson 1983:545-561). Major
plant food resources identified for all four sites include corn (Zea
~ays) , beans (Phaseolus vulgaris) , hickory nuts (Carya sp.), acorn
(Quercus sp. ) , and, to a lesser extent, walnut (Juglens nigra).
Gremillion ' s (1987) study of the plant remains from the late
prehistoric/early protohistoric Wall site and the middle contact
Fredricks site suggests relatively little change in plant food
ut ilization between the two sites. The peach is the only European
derived plant food recovered from the Fredricks site. Also , the
relative and actual amounts of acorn and hickory nut differ between
the two sites. At the Wall site , acorns , and the other nuts in
general , are all present in greater quantities. In contrast , there
is l es s acorn present in the archaeological remains from the later
Fredricks site, where hickory nut predominates. Differences in the
contribution of maize to the overall s ubsistence is also suspected,
with slightly larger amounts of this cereal being present at the
Fredricks site (Gremillion 1987:271) .
Gremi llion (1987 : 271) compares the results of her analysis of
the Fredricks site archaeobotanical sample with the data compiled by
J. Wilson (1977, 1983) in his analysis of botanical sampl es from

109
Upper Saratown-Locality 2 (31Skla). Gremillion notes that the plant
food assemblages are similiar in several respects. The percentage
of hickory nut shell at Upper Saratown-Locality 2 (51.6%) and the
Fredricks site (52.4%) are similar. However, when ratios of acorn
to-hickory nut shell are computed, Upper Saratown-Locality 2 has a
0.94 ratio and the Fredricks site has only a 0.17 ratio according
analysis of materials recovered using 1/16 inch mesh screen.
Flotation samples from the Fredricks site have an acorn-to-hickory
ratio of 1.67. No comparable flotation sample analyses are
available from Upper Saratown-Locality 2. It is possible that such
analyses would also indicate that acorn was more important at Upper
Saratown-Locality 2. For now, the question of acorn being more
important at Upper Saratown-Locality 2 than at the later Fredricks
site has to be set aside until more studies involving flotation
samples from the former site are conducted. Other nut resources,
including walnut and hazelnut, are apparently present in greater
quantities at Upper Saratown-Locality 2, based on the analysis of
1/16 inch mesh screenings.
In addition to the differences noted in the nuts , Gremillion
(1987:271) also suspects that there is a greater percentage of corn
in the total plant food sample from Upper Saratown-Locality 2 when
compared with the Fredricks site. She admits that this higher
percentage is possibly due to the greater variety of archaeological
features that produced the floral sample analyzed from Upper
Saratown-Locality 2.
Computing diversity indices for the the two sites , Upper
Saratown-Locality 2 was found to measure 0.8876 and the Fredricks
llO
site 0.8812 (Gremillion 1987:271). These figures indicate a broad
based or diverse use of plant foods by both populations for
subsistence.
Trace Element Analysis and Related Problems
A number of propositions concerning possible changes in diet
can be tested by identifying the relative and absolute amounts of
zinc, copper, magnesium, strontium, and vanadium present in the
skeletal series. Of the trace elements commonly utilized in the
analysis of diet, zinc is one of the most important for
archaeological studies. Zinc is necessary for proper mineralization
of the bone as well as endocrine functions, wound healing, disease
resistance, and growth. Adequate amounts of zinc for human diets
can be obtained from both animal and plant food sources. In healthy
human bone, zinc is present in approximately 181 ppm (parts per
million) (Gilbert 1977:92).
Copper is one of the most crucial minerals for the survival of
both plants and animals. Healthy human bone has an average of 19.63
ppm for copper. Copper deficiencies that occur in humans are
usually associated with hypoproteinia. Severe chronic health
disorders and anemia also cause levels of copper to increase.
Copper deficiences in general can contribute to increased stress
within a population (Gilbert 1977:92-93).
Strontium is available in a number of different foods, for
example plant foods and molluscs. Usually, human diets are not
deficient in strontium. Healthy bone contains about 114 ppm of
strontium. However , levels of strontium increase with age , and

111
variable levels of strontium in bone samples can be created by the
amount of plant foods consumed (Gilbert 1977: 33) .
Magnesium levels in healthy human bone averages 1,100 ppm.
Over the first ten years of life, as age increases, concentrations
of magnesium decrease. After this initial decrease the amount of
magnesium remains consistent in the bone. Deficiencies in magnesium
are caused by protein-caloric malnutrition and by prolonged alcohol
use. Magnesium is found primarily in plant foods, especially grains
(Gilbert 1977:93). Changes in the importance of maize among the
study samples could be indicated by changes in magnesium levels.
In contrast to the promise held by the use of trace element
analysis in the reconstruction of diet, the analytical technique
itself is fraught with difficulties. Although trace elements can
usually be associated with either plants or animals, only a few can
be directly correlated with a particular plant or animal food
resource. Nuts are a good example of this problem, because, like
meat resources, nuts are a good source of zinc. Another problem
encountered in the use of trace element analysis is the antagonistic
relationship of zinc and copper. When levels of zinc decrease,
levels of copper will increase (Gilbert 1977:89-90). Also, the
interpretation of the levels of zinc present in bone samples is
uncertain because zinc levels also decrease in the presence of
increasing amounts of phytate (an acid salt), a component of grains
(Gilbert 1977; Sever 1974). Finally, hyperexidroxis (excessive
sweating) and parasite infection can also decrease the levels of
zinc in the body (Sever 1974).

Recently, a number of studies (Lambert et al. 1985;
Schoeninger and Peebles 1981; Sillen 1981, 1985; Sillen and
Kavanaugh 1982) have noted a variety of potential general problems
with using trace element levels from human bones to reconstruct
diet. First , strontium levels in human bone can be influenced by
112
the consumption of shellfish (Schoeninger and Peebles 1981). Marine
food resources generally are enriched with strontium, and
populations that have access to marine food resources will usually
have higher strontium levels than populations that do not have
access. Thus, strontium levels among segments of a population that
relied to a degree on marine food resources would be similar to the
levels exhibited by people with a vegetarian diet (Schoeninger and
Peebles 1981). In addition to this problem, strontium levels also
differ from geographic region to region (Schoeninger 1979). Given
this problem, comparisons of strontium levels should be restricted
to sample populations within a sing le river drainage within a region
and to being within a single skeletal series. To check the
variabililty of strontium in a study, bone samples from known
herbivores and carnivores should also be assayed (Price and
Kavanaugh 1982).
Another problem with trace element analysis is the question of
whether the levels present in the skeletal sampl es have changed
after burial, a process known as diagenesis. Trace-elements can be
leached from bone and can be absorbed by bone from the surrounding
soil and groundwater (Ambrose 1987:91). When bone is exposed to
aqueous solutions containing moderately high concentrations of trace
elements , absorption by the bone of strontium, zinc, l ead , and

113
magnesium can occur within 24 houts (Lambert et al. 1985). One way
to test for diagenesis is to assay the soil matrix surrounding the
bone. Higher levels of a trace element in the bone when compared to
the soil may indicate contamination of the bone sample for that
trace element (Lambert et al. 1983).
A final problem with trace element assays concerns the
treatment of the human bone prior to the analysis. Bones are
ultrasonically cleaned and washed in distilled water prior to
ashing. Substances that are absorbed and crystalized into the bone
from groundwater are not always removed by this process. If these
minerals are not removed then the trace element levels will be
distorted (Ambrose 1987 :92 ).
When possible a number of precautions should be exercised to
control for these problems that can afflict trace element analyses.
First, strontium levels should be cnmpared for samples within the
same river drainage within a region and within samples. Bone
samples from known herbivores and carnivores should be assayed for
strontium levels to check for diagenesis, and the possibility that
molluscs were a part of the diet of a population sample. Soil
samples from around the bone should also be assayed as an additional
check for diagenesis. And caution should be practiced in the
interpretation of trace e l ement analyses given the potential for
contaminates not being removed from bone samples during the cle aning
stage of preparing the bone for analysis. Sillen (1986:312-317) has
recently conducted experiments on the chemical removal of posthumous
strontium contaminations from herbivore, omnivore and carnivore bone
samples that prove promising.

114
For this study, all of these precautions could not be followed.
First, there were no subsoil samples from any of the sites that could
be analyzed as a check of possible diagenesis. And although bone
samples from a known herbivore (white-tailed deer) were assayed for
trace elements , there were no known carnivore bone samples available
for study. Therefore, a known omnivore, raccoon, was used instead
of a carnivore as a check on diagenesis and mollusc consumption,
although molluscs are a common constituent of a raccoon's diet. As
noted throughout this study, extreme care has been exercised in the
interpretation and comparison of results between and within samples.
A number of propositions about possible changes in diet for the
study samples can be examined by identifying the relative and
absolute levels of zinc, copper, magnesium, strontium, and vanadium
present in the skeletal series. These propositions are based
primarily on the potential sources of the various trace elements.
As noted zinc and copper are found predominantly in meats, seafood,
and nuts. Grains and nuts all provide good sources for vanadium,
strontium, and magnesium (Gilbert 1977). As noted earlier, molluscs
also provide very high quantities of strontium (Schoeninger and
Peebles 1981).
The central proposition about diet to be considered here is
that if there is little difference in the relative amounts of the
food resources that are sources of the trace elements then the
levels of trace elements within each study sample should be similar.
For example , if more meat resources are available at late
protohistoric/contact period sites as a consequence of increased
hunting tied to the European fur and skin trade, then it is expected
l

115
that quantities of zinc and copper will be higher in these later
samples when compared to the late prehistoric/early protohistoric
period skeletal samples. This increase might possibly be associated
with a decrease in the levels of the other three elements--
strontium, vanadium and magnesium.
Before continuing, the problem noted previously with the
comparison of strontium levels between sites presents a special
case that is not encountered for the other four trace elements
considered in this study. To review, the problem is that
different environments can contain differing amounts of strontium
(Schoeninger 1979). Therefore, comparing information about
strontium for sites from different locales would produce distorted
results. In this study, intersite comparison of strontium levels
can only be conducted between the Wall and Fredricks sites located
on the Eno River, and the two Upper Saratown localities found on the
Dan River. These two groups of sites are the only ones that share a
similar environmental setting, being located within 300 meters of
one another within the same river drainage.
Trace Element Assay Technique
A bone sample weighing 1.5 grams was taken from each burial
assayed. Rib fragments were used from the prehistoric period
Shannon site because of restrictions placed by the institution
housing the collection from this site, the Museum of Natural History
of the Smithsonian Institution in Washington, D.C., on the use and
number of burials that could be analyzed. Fortunately, ribs were
well preserved in the Shannon site burials and samples could be

116
obtained for each of the adults present. A total of 51 Shannon site
individuals of known age and sex were assayed. Of this total, 24
are female and 27 are male. Also, each adult age category is
represented for both sexes.
For the skeletal series from the other four sites used in this
study, cortical bone from the femurs was used for the assay samples.
Trace element analysis could be conducted for four individuals from
the Wall site, 12 individuals from the Fredricks site, five
individuals from Upper Saratown-Locality 1, and 50 individuals from
Upper Saratown-Locality 2. Only the two samples from the Shannon
site and Upper Saratown-Locality 2 are considered large enough for
valid conclusions to be drawn from the comparison of trace element
levels. The smaller samples, however, do provide additional
information on general trends in diet change over time.
The use of ribs from one site and the cortical tissue of femurs
from the other four sites should not distort the comparison of the
results of the trace element analyses within and between the study
samples. Lambert et al. (1979) compared the results of assay
determinations based on rib and femur samples from the same
individuals. Their findings showed no recognizable difference
between the two bone sources in the levels of trace elements found.
This was also found to be true for the five trace elements
considered in this study--zinc, stontium, magnesium, copper, and
vanadium--and also for the heavy metal lead.
All bone samples were assayed for the levels of five trace
e lements and lead at the Horticulture Laboratory of the University
of Georgia at Athens using "inductively coupled argon plasma

emission spectrometry" or ICP. Studies have shown that the ICP
technique is preferable to the commonly used atomic absorption
analysis because ICP reduces the potential for ion interference
(Price and Kavanagh 1982), and a number of trace elements can be
assayed at the same time (Gilbert 1977:95).
117
For the ICP analysis each bone sample is prepared as follows.
After cleaning the bone sample is weighed and placed in a beaker.
Each sample is muffled at 500° for eight hours. The resulting
residue is dissolved in aqua regia and dried on a hotplate. The
sample is then taken up in 50 ml of acid. Of this final solution,
20 ml is assayed on a plasma e mission spectrometer (Jones, personal
communication , 1986).
In addition to the human bone, bone samples from a known
herbivore, white-tailed deer, and an omnivore, raccoon, obtained
from the recovered archaeological assemblage was assayed for the
Wall site, the Fredricks site , and Upper Saratown-Locality 2. Also,
deer bone samples from the Shannon site and Upper Saratown-Locality
1 were also assayed. The results of the deer and raccoon assays
were used to provide a scale for comparing the human bone assays.
The deer sample results provide a check on the reliability of the
human strontium assays. Because deer are herbivores, levels of
strontium in the deer samples should be higher than the human
(omnivore) samples. If the human bone samples contain levels of
strontium that are higher than the deer, then one or more of the
following factors may be at work. Molluscs , which Schoeninger and
Peebles (1981) have shown to be high in strontium content, may have
been a very important food resource. Large quantities of mollusc

118
shell in the archaeological assemblage would support this
interpretation. Also, if only some of the human bone samples at a
site are higher than the deer samples, it may be that these
individuals are from other geographic areas where strontium levels
are naturally higher in the environment. This situation would not
be unexpected at contact perioj sites because of the increased
movement between villages and r e gions that apparently occurred after
European contact (cf. Merrell 1987:25; Simpkins 1985:29-48, 95-108).
Results of the Trace Element Analysis
Comparison of the results of the trace element analysis for the
five skeletal series are made across four broad categories: 1) the
adult samples as a whole; 2) age categories; 3) sex categories
(males and females); and 4) age and sex categories. The
differences and similarities between the study samples noted in
thes e four areas of inquiry are used to provide insights into diet
changes through time.
The Adult and Subadult Populations: Diet Elements
Table 17 lists the adult means, standard devia tion and variance
for the six elements --strontium, magnesium, zinc , copper , vanadium,
and lead--analyzed for each sample. Table 18 provides the same
information for the subadults in four of the study samples with no
assays being available for the Shannon site s ubadults. All five
adult skeletal series contain strontium in l evels well above the 114
ppm average usually considered healthy in human bone. The strontium
means for each sample are lower than the deer assays from each
r espective site.

119
'lABIE 17 .
M2an TraCE Elarent Assays for the Adults in the Five Stu:ly Sanples.
ELEMENI' n= ME1I.N SmNDARD DEVIATICN DEER
9-lAN'rn SITE Strcntiun 51 3ED. 98J 59. 784 444. ffi) * M:l.gnesiun 51 1200.039 2fD.810 796.000 * Zin:: 51 204. SCB 70. 4ITT 81.CXX) * (q:p=r 51 8. 333 15 . 684 * Varadiun 51 28 . 627 49 . 381 * Ired 6 IB.500 114. 627 *
WALL SI'IE
Strontium 3 8:i:J . E66 113 .160 1268.000 844.000 M3.gnesiun 3 877. CXX) 129. 039 695.20) 1126.CXX) Zinc 3 174. 333 32.624 154. 9'.X) 231 .000 Ccg;;er 0 Vanadium 2 3. 000 2.828 9.9'.X) 3.000 Ired 0
l.PPER SARA'ION-r..c:x:ALTIY 1 ( 31Skl) Strcntiun 1 410. CXX) o.o 1472. CXX) * M:l.gnesi urn 1 817 .000 o.o 938.000 * Zin:: 1. 341.CXX) o.o 167.CXX) * (q:p=r 0 * Varadiun 1 10. CXX) o.o 25.CXX) * Ired 1 22 .000 o.o 33 . 000 *
UPPER SARA'.IOtN-LCX::ALI'IY 2 ( 31Skla) Strontium 42 788.428 160.031 1061.000 927.rm M:lgnesiun 42 1093. 404 255.535 122.CXX) 153. CXX) Zinc 42 376.000 214 . 651 181 .000 334.000 Ccg;;er 1 l . CXX) 0.0 Vanadium 42 33.857 12 . 241 42 . 000 54 . 000 Lead 42 77 . 167 26.234 71 . CXX) 71.CXX)
FREIRIO<S SITE Strcntiun 7 820. 143 ED.859 1190. CXX) 1138. CXX) M:l.gnesium 7 513 . 428 118. 564 1013.20) 871.000 Zin:: 7 287.428 113.468 159.500 185.CXX) (q:p=r 0 Varadiun 3 13. CXX) 3. 464 Ired 2 ED .000 65 .053
'IRl'CE ELEMENI' LEVELS IN l'rnMAL OCNE: Strcntium, 114.0 g:,m; M3.gnesium, 1100.0 .i;:pn; Zinc, 181. 0 .i;:pn; arrl O:Ji:F.er, 19. 63 .i:pn.
Figures for M2an, standard D:Niation, Ce:!r arrl Racxxx:n are in p:irts r:er millicn <wn).
n is the nunber of irrlividuals with a detected level of a trace elarent. A"-" rrrens that the level of that trace elerent was too lo.v to rreasure. A "*" irrlicates that the b:ne sample for that cate<pry at a site was oot
assaye::l .

'mBIE 18.
Mean Trace Elarent Assays for Sul::adults in Fa.rr of tre Sbrly 8arrples.
n= ME1\N SrANDARD DEVIATICN DEER
WAIL SI'IE
Strootiun 1 824. 00J o.o 1268.00J 844. 00J M3.gnesium 1 518 . (XX) o.o 695.200 1126.(XX) Zin:: 1 179.00J o.o 154. SO'.) 231.(XX)
~ 0 Vanadiun 0 9.SO'.) 3.CXD 183.d 0
UPPER ~ILCALI'IY 1 (31Skl)
strootiun 5 822. 400 283 .132 1472.(XX) * Magnesiun 5 856. 4CD 142.200 988. CXD * Zinc 5 288.400 114.532 167.(XX) * Cq:p:!r 0 * Vanadium 5 28 . 200 14 .923 25 . (XX) * Le3d 5 83.00J 28.792 38.00J *
UPPER Si\RA'KWIJ-ILCALI'IY 2 (31Skla)
Strootiun 8 829. 250 288 . 832 1061.00J 927.00J M3.gnesium 8 1223 . :ffi f:04 .949 122 . (XX) 153.(XX) Zin:: 8 427.375 217 . 219 181.00J 334.00J ~ 1 63 . (XX) o.o Vanadiun 8 39. 250 15.989 42.00J 54.00J 183.d 8 75 . 250 44.252 71 .COO 71.COO
FREIRICKS SI'IE
strootium 4 ffi5 . :ro 287.963 1190.COO 1138.COO Magnesiun 4 653. 00J 150.685 1013.200 871.00J Zinc 4 1659. :ffi 1830.596 159.:ffi 185.COO Cq:p:!r 4 50. SCXJ 56.C03 Vanadium 3 6. 333 4.509 Le3d 2 38. 00J 48.CB3
Figures for tlE Mean, Starrlard I:€viatim, Deer arrl Raccxxn are in prrts r:er million (i:::pm).
n is the nuncer of irrlividuals with a detected level of a trace elarent. A"-" rrea.ns that the level of that trace elarent was too le:,,., to !1'6:ISUI'e.
A "*'' irrlicates that the lx:ne sampl e for that catecpry at a site was not assayed.
N:> sul::adult lx:ne sarrples fran the Sh3.nncn site CDuld be tak.m for analysis.
120
121
At the two sites with burial samples large enough to provide
valid insights into questions concerning diet and status , the
Shannon site and Upper Saratown-Locality 2, a number of individuals
with strontium levels higher than the deer assays are present. Of
the five individuals (Burials 3, 23, 55, 56, and 82) from the
prehistoric Shannon site with elevated strontium levels, all but one
(Burial 55) are male. These elevated strontium levels may be due to
these five individuals having had a diet rich in molluscs, the
remains of which are quite common in the features at the Shannon
site (Benthall 1969:144).
Moving forward in time, the late protohistoric/early contact
period site at Upper Saratown-Locality 2 has two males (Burials 62
and 74) with levels of strontium higher than the deer assay for the
site. Also, both burials possess cranial deformation, a rare ·
cultural trait (n=S) within this sample. Taken together, these two
attributes strongly suggest that these two males are from regions
other than the Dan River area. Although the problem with molluscs
noted above remains, the presence of cranial deformation for Burials
62 and 74 generally supports this proposition. The cranial
deformation and elevated levels of strontium may indicate these
males are from another region, that they are distinct individuals,
or that diagenesis has ske wed the results. There are no f e males with
elevated strontium levels (in combination with other physiological
traits) indicative of extra-Dan River origins.
Examining the mean magnesium levels within the five samples,
only the prehistoric Shannon site skeletal series mean (1200.039
ppm) is greater than the 1,100 ppm ave rage considered healthy. Of

122
the other four samples, only the late protohistoric/early contact
period Upper Saratown-Locality 2 mean (1099 . 404 ppm) is close to the
healthy average for normal bone. The lowest magnesium comes from
the middle contact period Fredricks site (513 . 428 ppm), the latest
of the five samples.
The extremely low magnesium means at the Fredricks site could
be attributed to one or more of a number of factors. If corn, a
cerea l crop rich in magnesium , was less important as a food resource
at the Fredricks site, than at the slightly earlier Upper Saratown
Locality 2 site , the low means is not unexpected. Contributing to
this possible decline in the importance of corn in the diet could be
the expenditure of more time and energy by both men and women on the
skin and fur trade, with men spending more time hunting and engaging
in trade, and women spending more time processing skins and furs
obtained for trade with the Europeans. One example of the extra
energy the Indians of the interior were required to expend was in
serving as pack-animals for the traders. Abraham Woods (Alvord and
Bidgood 1912:210-266 ; Sainesbury 1889:604-607) noted in his account
of the murder of James Arthur by an Occaneechi Indian in 1674 that
an argument over an Indian porter letting his burden slip into the
water as the trading party crossed the "Sarrah" River precipitated
Arthur ' s demise. Also , it was not until 1716 that the Commissione rs
of South Carolina trade consented to buy horses as replacements for
Indian porters, this following repeated complaints by the Indians at
this ill-use (McDowell 1955:272).
Another major factor derived from European contact that may
have contributed to lower magnesium l eve ls at the Fredricks site is

the possible availability of alcohol to the site's inhabitants.
John Lawson (1967:18 , 184, 211 , 240) noted that the Indians would
sell all of their goods to traders in exchange for rum. Once
acquired, an Indian would not stop drinking until completely
intoxicated. As noted earlier, excessive alcohol consumption can
cause magnesium levels to drop (Gilbert 1977).
123
In all of the samples except for the Wall site, where the mean
for adults is 174.333 ppm, zinc levels exceed the mean for healthy
bone of 181 ppm. The highest zinc levels are present at Upper
Saratown-Locality 2 (376 ppm ), then Upper Saratown-Locality 1 (341
ppm), and finally, the Fredricks site (287 ppm). These higher
levels of zinc in the three later sites may reflect an increase in
animal protein in the diet that perhaps occurred with the increased
emphasis on hunting skin- and fur-bearing animals for trade directly
or indirectly with the Europeans. It should be noted that the small
sample sizes for the Wall, Upper Saratown-Locality 1 and the
Fredricks sites obviously affect the interpretation of the zinc and
other trace element levels. Still, the high zinc assay for the
Upper Saratown-Locality 2 sample indicates that the trend for the
later skeletal samples to have higher zinc levels than earlier
samples may be valid.
Considering the trace e l e ment copper , only two samples have
levels high enough to be detected and both have levels below the
19.63 ppm average found in healthy bone. This may be the result of
the antagonistic effect of the relatively high zinc levels noted for
the skeletal series . The Shannon site had the highest average
concentration of copper at 8.333 ppm.
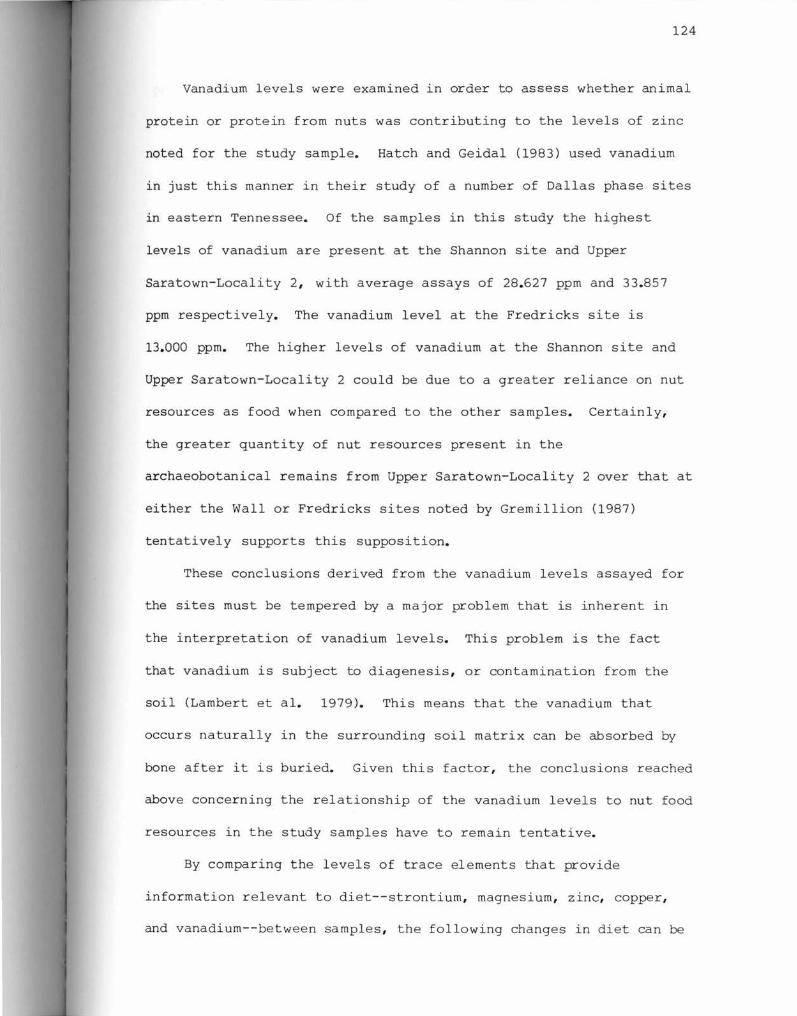
124
Vanadium levels were examined in order to assess whether animal
protein or protein from nuts was contributing to the levels of zinc
noted for the study sample. Hatch and Geidal (1983) used vanadium
in just this manner in their study of a number of Dallas phase sites
in eastern Tennessee. Of the samples in this study the highest
levels of vanadium are present at the Shannon site and Upper
Saratown-Locality 2, with average assays of 28 .627 ppm and 33.857
ppm respectively. The vanadium level at the Fredricks site is
13.000 ppm. The higher levels of vanadium at the Shannon site and
Upper Saratown-Locality 2 could be due to a greater reliance on nut
resources as food when compared to the other samples. Certainly,
the greater quantity of nut resources present in the
archaeobotanical remains from Upper Saratown-Locality 2 over that at
either the Wall or Fredricks sites noted by Gremillion (1987)
tentatively supports this supposition.
These conclusions derived from the vanadium l evels assayed for
the sites must be tempered by a major problem that is inherent in
the interpretation of vanadium levels. This problem is the fact
that vanadium is subject to diagenesis , or contamination from the
soil (Lambert et al. 1979). This means that the vanadium that
occurs naturally in the surrounding soil matrix can be absorbed by
bone after it is buried. Given this factor, the conclusions reached
above concerning the relationship of the vanadium l evels to nut food
resources in the study samples have to remain tentative.
By comparing the levels of trace e lements that provide
information r e l evant to diet--strontium, magnesium, zinc, copper,
and vanadium--between samples , the following changes in diet can be

125
proposed. The propositions that immediately follow are based on the
data from the two largest samples, the late prehistoric period
Shannon site (n=51 individuals) and the late protohistoric/early
contact period Upper Saratown-Locality 2 site (n=42 individuals) .
In both cases a mixed diet of plant and animal food is present, as
strontium levels are lower than those for the deer control samples
at each respective site. Maize apparently continued to be an
important cereal at both sites, although it may have declined
somewhat in importance at the later Upper Saratown-Locality 2 site
given the decline in magnesium levels from a 1208.039 ppm average at
Shannon to 1099.404 ppm at Upper Saratown-Locality 2. Also, there
appears to have been an increase in the meat protein in the diet of
the Upper Saratown-Locality 2 sample, where the zinc level average
of 376 ppm is almost double the 204.509 ppm average present in the
earlier Shannon site sample. The lower copper l evels present at
Upper Saratown-Locality 2 reflect the higher level of zinc present
at this site. The small increase in the level of vanadium at Upper
Saratown-Locality 2 over that present at the Shannon site (33.857
ppm to 28.627 ppm) could indicate that nut resources were somewhat
more important in the subsistence base of the former population.
However, this small increase is not enough to account for the large
difference in zinc l evels between the two sites , indicating that
animal protein was more readily available to the Upper Saratown
Locality 2 population as a whole. Meanwhile, the problem of
vanadium diagnesis prohibits any s ubstantial conclusions to be drawn
from the assays of this trace element.
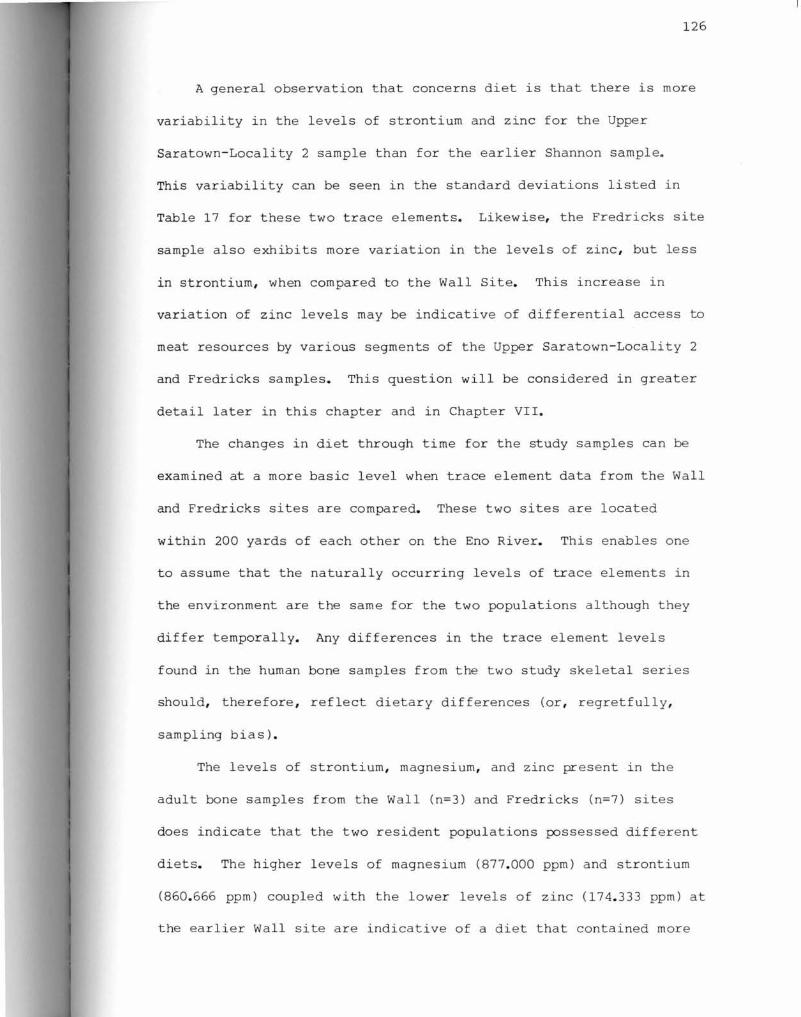
126
A general observation that concerns diet is that there is more
variability in the levels of strontium and zinc for the Upper
Saratown-Locality 2 sample than for the earlier Shannon sample.
This variability can be seen in the standard deviations listed in
Table 17 for these two trace elements. Likewise, the Fredricks site
sample also exhibits more variation in the levels of zinc , but less
in strontium, when compared to the Wall Site. This increase in
variation of zinc levels may be indicative of differential access to
meat resources by various segments of the Upper Saratown-Locality 2
a nd Fredricks samples. This question will be considered i n greater
detail later in this chapter and in Chapter VII .
The changes in diet through time for the study samples can be
examined at a more basic level when trace element data from the Wall
and Fredricks sites are compared. These two sites are located
within 200 yards of each other on the Eno River. This enables one
t o assume that the naturally occurring levels of trace elements in
the environment are the same for the two populations although they
differ temporally. Any differences in the trace element levels
found in the human bone samples from the two study skeletal series
should, therefore , reflect dietary differences (or , regretfully ,
sampling bias) .
The levels of strontium, magnesium , and zinc present in the
adult bone samples from the Wall (n=3) and Fredricks (n=7) sites
does indicate that the two resident populations possessed different
diets. The higher levels of magnesium (877 . 000 ppm) and strontium
(860 . 666 ppm) coupled with the lower l evels of zinc ( 174. 333 ppm) at
the earlier Wall site are indicative of a diet that contained more

127
and grains. The higher zinc level (287.428 ppm) and lower magnesium
(513.428 ppm) and strontium (820.143 ppm) levels present at the
later Fredricks site reflects a diet composed of more animal
protein. The increased vanadium levels at the Fredricks (13.00 ppm)
as compared with the Wall (3.00 ppm) tentatively support an
increase in the amount of protein-rich nut resources, especially
hickory nuts, utilized by the later Fredricks populations as
hypothesized by Gremillion (1987:271).
Adul t Skeletal Samples and Lead
The interpretation of the levels of lead present in bone can be
a rewarding endeavor although there are a number of problems
associa ted with the occurrence of this metal. In the soil , lead is
firmly bound to organic molecules, and is freely mobil e when soil ph
is low, that is, in conditions that would not favor good bone
preservation. Waldron (1981 : 395) argues that lead assays on
archaeological burial samples can be assumed to reflect the exposure
of that individual to lead during its life. However, the presence
of certain conditions, such as lead-lined or lead coffins , as well
as burial artifacts which contain lead, do provide environments
whereby lead is absorbed in the bone after deposition in the
archaeological context (Waldron 1981:396). Before bone lead
concentrations can be used in a study confidently, a thorough survey
of lead levels present in the soil and the surrounding environment
must be made. Where overall l ead levels are high, it is deemed
unwise to give much credence to the results of bone lead assays.
Modern levels of lead in bone would rarely be expected to exceed 60

128
ppm in people with no occupational exposure to lead (Waldron
1981 : 395-397) .
Research (Carnes 1987 ; H. Wilson 1984) has shown that during
contact Europeans introduced a number of lead-bearing artifacts such
as lead shot , vermi l lion (a lead-based red body paint) , and pewter
utensils into the aboriginal cultures of the Carolinas, Virginia and
the rest of eastern North America. It is expected that the presence
a nd use of these artifacts would be reflected by the occurrence of
higher lead levels in the late protohistoric/contact period sites.
Als o , t here should be a h igher level of lead in later contact period
sites than in protohistoric and early contact period sites , as the
number of lead-bearing artifacts present increases and as they come
to be used in a manner more similar to European ways of use. For
example , pewter utensils such as bowls or spoons may be used as
decorative items by earlier populations , as at Upper Saratown
Locality 2 (cf. J . Wilson 1983 : 209-220) , and as bowls or spoons at
later contact period sites such as the Fredricks site as
acculturation proceeds. The latter use of lead bearing artifacts
would result in a greater likelihood of lead being absorbed by
i ndividuals in a population.
At the late prehistoric period Shannon site Burials 85, 89 , 91 ,
92 , and 97 had measurable levels of bone lead, with a range from 103
pp m to 378 ppm. The mean for these five burials is 309. 5 ppm. The
unusually high levels of lead for these five burials are probably
the result of contamination while the bones wer e buried, or after
the bones were excavated. In the late prehistoric/early
pr otohistoric period sample from the Wall site no measurab l e traces
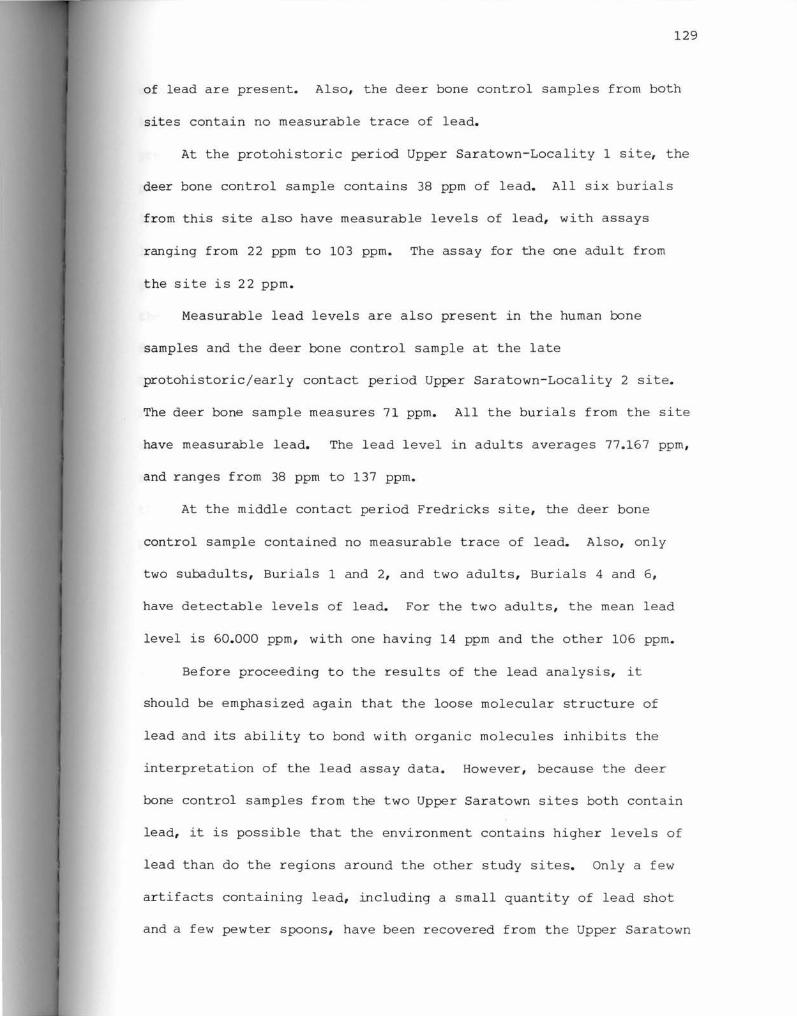
129
of lead are present. Also, the deer bone control samples from both
sites contain no measurable trace of lead.
At the protohistoric period Upper Saratown-Locality 1 site, the
deer bone control sample contains 38 ppm of lead. All six burials
from this site also have measurable levels of lead, with assays
ranging from 22 ppm to 103 ppm. The assay for the one adult from
the site is 22 ppm.
Measurable lead levels are also present in the human bone
samples and the deer bone control sample at the late
protohistoric/early contact period Upper Saratown-Locality 2 site.
The deer bone sample measures 71 ppm. All the burials from the site
have measurable lead. The lead level in adults averages 77.167 ppm,
and ranges from 38 ppm to 137 ppm.
At the middle contact period Fredricks site, the deer bone
control sample contained no measurable trace of lead. Also, only
two subadults, Burials 1 and 2, and two adults, Burials 4 and 6,
have detectable levels of lead. For the two adults , the mean lead
level is 60.000 ppm, with one having 14 ppm and the other 106 ppm.
Before proceeding to the results of the lead analysis, it
should be emphasized again that the loose molecular structure of
lead and its ability to bond with organic molecules inhibits the
interpretation of the lead assay data. However, because the deer
bone control samples from the two Upper Saratown sites both contain
lead, it is possible that the environment contains higher levels of
lead than do the regions around the other study sites. Only a few
artifacts containing lead, including a small quantity of lead shot
and a few pewter spoons, have been recovered from the Upper Saratown

130
sites (Jack Wilson 1987, Personal Communication). In general,
however, there is definitely an increase in the amount of lead
present in the contact period samples when compared to the earlier
prehistoric/protohistoric samples. Also, the general increase in
lead levels among the contact period samples is supported by the
lead assays from the two Upper Saratown sites. However, this
general trend of increase through time is apparently contradicted by
the results from the middle contact period Fredricks sample, where a
decrease from the lead levels noted at the early contact Upper
Saratown-Locality 2 site occurs. Obviously, consideration of the
results of the lead assays is complicated by sample size problems
and the nature of lead itself. Until these problems can be
rectified, only the general argument that lead levels increased in
the contact period over those present in the
prehistoric/protohistoric period can be supported.
Analysis of Trace Elements by Age Categories
In addition to general questions about change in diet among the
study samples through time, a number of questions can be
investigated that rely on intersite differences in the occurrence of
trace elements. One such question is whether certain age groups
within a population have differential access to selected food
resources, and how this pattern changes over time, if at all.
Tables 19 through 23 present the trace element data for each group
by site.
Unfortunately, no distinct pattern of decrease or increase in
any trace element with age group can be discerned for any of the

131
'I7\B1E 19.
t-Ean Trace Elerent arrl l.e:3.d As.says for the Sh:mn::n Site by Age Group.
Kil:: GRCXJP n= SffiCNI'IlM MACNESTIM ZIN: CXJPPER VANADTIJM LE1\D
16-X) 2 369. SOJ 1170.SOJ 133.SOJ 4. 50J 23 . 000 (9.192) (93 . 702) (72.831) (6. 364) (32 . 527) ( - )
21-25 4 367 . SOJ 1193.SOJ 182. SOJ 3.000 14. 250 (39 . 433) (Xl5 . 687) (24 . 228) (6.000) (28.500) ( -
26-)J 6 344. 667 1335.000 200.000 4. 333 (59 .002) (EC6 . 839) (46.EOO) ( - ) (9.223) ( - )
31-35 5 359. 200 leff>.400 139. 000 (47 . 183) (123.395) (51.546) ( - ) ( - ) ( -
36-40 8 3a:l.50J 1155.875 2fD. 7'3J 22. SOJ 74.875 83. 875 (43. 710) (113 . cn:3) (84 . 930) (23 .839) (70 . 337) (160 . 736)
41-45 3 357.667 1139. 000 243.667 (32 . 064) (81.000) (5 . 773) ( - ) ( - ) ( - )
46+ 22 362. 636 1214.727 203. 864 8.045 26.227 36.727 (78.070) (223.350) (-;D.621) (13 . 723) (43 .194) (104 . 823)
kJe Group categ::iries are in yrers.
Figures for the trace elerents arrl lead are in prrts per millim (g:m).
No informatim is inclUJErl for group; urrler the age of 16 because human b:ne samples CXJU.ld rot be taken fran the Sh:mn::n site suh3.dult hrrials .
After ead1 kJe Group category, the first line a:ntains tre Mean for that trace element or lea~ arrl the standard D2viaticn for that trace element or lead is enclooed in _parenthese::; imme:liatel y urrlemeath tre Mean.
n is the nunber of irrlividuals with a detected level of a trace elerent. A"-" rre3I1S that the level of that trace elerent was tco lo,; to rreasure.

'Il\BLE 20.
Mean Tra02 Elarent arrl Le3.d As53.ys for the wall Site bf lqe Groop.
)l£;E CHXJP n= S'IlUITilM WG',IESil.M ZThC a)PPER VANADilM I..DID
3-5 1 824 . CXX) 518.CXX) 179. CXX) (0. 0) (O . O) (0. 0) ( - ( - ) ( -
21-25 1 932 . CXX) 952 . CXX) 167 . CXX) l . CXX) o.o (0 .0) (0. 0) ( - ) (0.0) ( -
46+ 2 8'.X) . CXX) 839 . 5)() 178 . CXX) 5.CXX) (59. 397) (157 . 685) (45.254) ( - ) ( - ) ( -
Age Group categories are in years.
Figures for the trace elarents arrl lead are in i;:arts per rnillim <wn) .
After earn Jlqe Group category, the first line cxntains tre Mean for that tra02
elema1t or lead, aoo. the st:.aruard Deviatirn for that trace element or lead is enclcred in parentheses irnrneli.atel y urrlemeath tre Mean.
'Ire Vanadiun assay for the 46+ yrer age group is tased m one irrlividJal.
n is the nurber of individuals with a detected level of a trace elerrent. A"-" rreans that the level of that trace elarent was tco low tD rreasure.
l
132
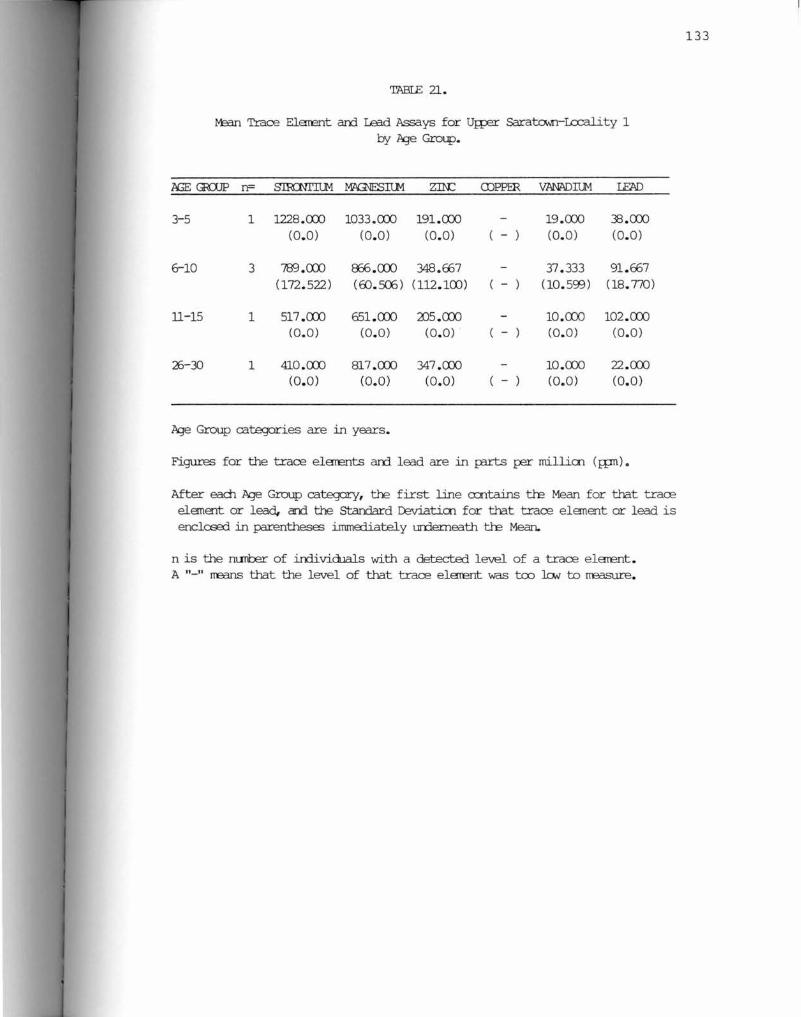
TIIBIE 21.
t-Ean Trace Elerent arrl Ie:l.d As:ays for U_g:12r Saratown-I.o:::ality 1 by Age Group.
lGE GRaJP n= S'IRCNI'Il.M WGIESIU1 zm::: CDPPER VANmI.lli I.EAD
3-5 1 1228.CXX) 1033.CXX) 191.CXX) 19.CXX) 33.CXX) (0.0) (O . O) (0.0) ( - ) (0.0) (0.0)
6-10 3 'lffi.CXX) 8:i6 .CXX) 348.€£7 37.333 91.ffi7 (172.522) (ED.SOS) (112.l(X)) ( - ) (10. 593) (18. 770)
ll-15 1 517 .CXX) 651.CXX) 2)5.CXX) 10.CXX) 102.CXX) (O.O) (0. 0) (0.0) ( - (0.0) (O.O)
26-30 1 410 .CXX) 817 . CXX) 347 .CXX) 10.CXX) 22.CXX) (0.0) (0.0) (O.O) ( - ) (0.0) (0.0)
h;e Group categories are in years.
Figures for the trace elerents arrl lead are in prrts i;:er millim <wn).
After eadl Age Group category, the first line crntains tlE Mean for that traCE eleme1t or lead, am. the standard D:Niatim for that trace element or lead is enclooed in parentheses irnmediatel y urrlerneath tlE Mean.
n is the nunter of irrlividuals with a detected level of a trace elerent. A"-" rreans that the level of that trace elerent was too lo,., to rreasure.
133

134
'rnBLE 22.
Mean Trare Elerent an::l Le3d Assays for Ur:p:r Sarato,.,n-Locality 2 cy k:Je Group.
ll;E rn::xJP n= srn::NI'TIM MAGJESTI.M ZIN: O'.:PPER VANADIUM LEAD
3-5 2 812.SOJ 985.SOJ 392.SOJ 57.(XJJ 36. SOJ (282 .136) (11.016) (127 .%) ( - ) (14 . 142) (6.364)
6-10 5 896.fill 1404.BCX) 48).BCX) 63.(XJJ 37. BCX) 96.4CD (311.915) (722.228) (254 .091) (0. 0) (6.140) (43.673)
11-15 1 526.(XJJ 793.(XJJ 230.(XJJ 11.(XJJ 47.(XJJ (O.O) (0 .0 ) (0.0) ( - ) (0. 0) (0.0)
16-:JJ 5 813.20J 10:JJ. BCX) 254.BCX) 31.4CD 74.(XJJ (125.3ill) (100.107) (52.232) ( - ) (18.284) (23.054)
26-30 11 784.(XJJ 1001. <:XB 331.545 31. 818 81.273 (161.629) (139 . 918) (84.100) ( - ) (8 .010) (10. 030)
31-35 5 884.4CD 1053.4CD 313.BCX) 39. 4CD 73.BCX) (144 .232) (218.810) (75.337) ( - ) (19.S62) (40.127)
36-40 7 684. 571 1081.428 272.(XJJ 30.857 69.857 (229.636) (76.848) (53.529) .( - ) (10 . 431) (28.252)
41-45 4 765.SOJ 1222.7':JJ 537.(XJJ 34.7':JJ 64.2':JJ (142 . 4~) (244.855) (292 . 466) ( - ) (12. 764) (9.251)
46+ 9 829. 444 1257. 667 SE0. 889 l.(XJJ 37. 222 84. 444 (118 .418) (433 .161) (331 .464) (0. 0) (11.144) (31.950)
kJe Group categ:Jries are in yrers .
Figures for the trace elerents an::l lead are in p:rrts i:;er millirn (wnl.
After each k:Je Group category, the first line a::ntains tre Mean for that trare element or lead, arrl the Standard D2viatirn for that trace element or lead is enclca::rl. in parentheses immErliately urrlerneath tre Mean.
'lli:: Cq:per assays for the 6-10 an::l 46+ yrer age group:; are J::a.sed m me irrlividual each.
n is the nunber of individuals with a detected level of a trace elerent. A"-" rreans that the level of that trace elerrent was tco lo.,., to rreasure.

135
'mBIE 23 .
~ TraCE Elerent arrl Lead Asrays for the FrErlricks Site by 1'ge Group.
AGE GEUJP n= S1RCN1'I(J,1 ~IlM zm:: ffiPPER VM:WJILM IEAD
3-5 3 792 . ffi7 596. 333 2142.333 ffi . ffi7 6. :0) 72.a:YJ (304. 231) (121 . 624) (l<XJ3 . 677) (56. 003) (6. 363) (0.0)
6-10 1 1004.a:YJ 823 . a:YJ 'XE . a:YJ 2. a:YJ 6. a:YJ 4. a:YJ (0. 0) (0. 0) (0.0) (0.0) (0.0) (0.0)
11-15 0 o.o 0. 0 o.o o.o o.o o.o (0.0) (0.0) (0.0) (0.0) (0.0) (0.0)
16-20 1 848 .a:YJ 400 .a:YJ 229 .a:YJ (0. 0) (0.0) (0.0) ( - ) ( - ) ( - )
21-25 2 7oo • .:D) 465 • .:D) 328 . a:YJ 15.a:YJ 14 . a:YJ (19. 092) (41 . 719) (209 . 304) ( - ) (0.0) (0.0)
26-30 1 839 . a:YJ 498.a:YJ 216 . a:YJ 15. a:YJ 106. a:YJ (0. 0) (0. 0) (O. O) ( - ) (0.0) (0.0)
:D-35 0 o.o o.o o.o 0. 0 o.o 0.0 (0. 0) (0.0) (0.0) (0.0) (0.0) (0.0)
~-40 2 765 . a:YJ :.01 . a:YJ 356.a:YJ ( 38.184) (48. 003) (62.225) ( - ) ( - ) ( -
46+ 1 <Xll . 00 763.a:YJ 196.a:YJ 9.a:YJ (0.0) (0 .0) (0.0) ( - ) (0.0) ( - )
1'ge Group categories are in years.
Figures for the trace elarents arrl lead are in p:rrts per millicn (wn) .
After eadl 1'ge Group category, the first line cx::ntains tre Mean for that traCE element or lead, and the standard Ceviaticn for that trace element or lead is enclcee:i in parenthese:; inunoo.iatel y urrlerneath tre Mean.
'IlE Vanadium assay for the 3-5 year age group is b3sed on two individ.ials and for the 6-10 year age grot.p m ore in:li vid.ial.
'IlE I.red assays for the 3-5 year age group arrl the 6-10 age group are b3sed en me in:lividual.
n is the nunter of in::lividuals with a detected level of a trace elarent. A "-" rreans that the level of that trace elerent was tco lcw to rreasure.

136
study samples. However, there are some sp2cial circumstances
that can be discussed.
At the late prehistoric period Shannon site , the age categories
begin at 16 years at death (Table 19) , because bone samples for
trace element analysis could not be taken for the subadults .
Strontium levels appear very similar across each age category with
little variation for each category. Magnesium levels also are
relatively uniform, except for the age 26-30 category. For this age
group, magnesium levels are somewhat higher than for the others.
The standard deviation of 606.839 ppm for this age category
indicates that there is considerable variation within the group.
This age group also has the lowest strontium levels for individuals
from the Shannon site, and zinc levels show a general increase over
that of the previous age group. The following age group, 31-35
years, show a decrease in zinc before the 36-40 age group has an
increase in the zinc assay. Although no significant patterns of
possible diet change by age group are indicated for the Shannon
site, the differing levels of strontium, magnesium, and zinc for the
26-30 year age group may indicate that these individuals had a
slightly different diet from that of the other age segments in the
sample.
The trace element levels at the late protohistoric/early
contact period Upper Saratown-Locality 2 site, shown in Table 22 ,
indicate a greater variability in the levels of strontium and zinc
when compared with the Shannon site. At Upper Saratown-Locality 2,
strontium levels are lowest for age 11-15 years (526 ppm) and age
36-40 (684. 571 ppm) . Zinc levels are highest for ages 3-10 ye ars

137
(392.500 ppm for ages 3-5 years and 480.800 ppm for ages 6-10 years)
and ages 41+ (537.000 ppm for age 41-45 and 560.889 ppm for age
46+). Magnesium (1404.800 ppm) and strontium (896.006 ppm) levels
are also highest for the 6-10 year age group. Comparison of the
strontium, magnesium, and zinc levels of the 3-5 and 6-10 year age
groups of Upper Saratown-Locality 2 with that for similar age groups
from Upper Saratown-Locality 1 (Table 21) and the Fredricks site
(Table 23), indicates that the diet of subadults appear to change
around age 6 years. Higher levels of strontium and magnesium are
found in this age group at the Fredricks site than in the 3-5 or 11-
15 age groups, while zinc is less than in either of these two age
groups. The Upper Saratown-Locality 1 levels of strontium and
magnesium decrease in the 6-10 year age group from the 3-5 year age
group, but are higher than those of the 11-15 year age group. In
contrast, zinc is higher in the 6-10 year age group than in either
the 3-5 or 11-15 year age group. The 6-10 year age group at Upper
Saratown-Locality 2 differs from that at both of these two sites
with the levels of strontium, magnesium, and zinc being higher in
that age category than in either the 3-5 or 11-15 year age group.
Although the pattern differs in details, it does appear that there
is a change in diet among subadults for these three samples. It is
suspected that these results indicate that weaning occurred between
3 and 5 years in the protohistoric period Upper Saratown-Locality 1
population, and between the age of 6 and 10 years in the late
protohistoric/early contact period Upper Saratown-Locality 2 and the
middle contact Fredricks site. The diet of the sample segments to

the age of weaning at these three sites was probably nursing
supplemented by plant and meat food resources.
138
Among the adults at Upper Saratown-Locality 2, the highest
l evels of zinc occur in the age groups 41-45 (537.000 ppm) and 46+
(560.889 ppm) . Both of these age groups also exhibit more variation
i n zinc levels than do the other age groups (standard deviations of
292 . 466 ppm and 331.464 ppm respectively) , and both have higher
magnesium levels as well. Strontium levels for these two age groups
were close to the mean of 788 . 428 ppm for the adult sample as a
whole a t Upper Saratown-Loca l ity 2. The h igh zinc leve l s present in
these two age groups may reflect a diet high in meat protein for
s o me of the older individuals, which may in turn indicate
differential status categories in the sample. A more detailed
consideration of diet and status can be · found i~ Chapter VII.
Due to the small sizes of the samples from the Wall site (Table
20) , Upper Saratown-Locality 1 (Table 21) , and the Fredricks site
(Table 23) , little can be said about the relationship of trace
element assays and age groups.
In summary, no general patterns of diet change by age category
through time can be noted for the study population. However,
several observations about diet could be discerned. There is more
variability in the levels of the trace elements strontium and zinc
in the contact period sites than in the prehistoric/protohistoric
period sites. This may reflect differential access to plant foods
and animal protein by different segments of the samples. Certainly,
the individuals age 41 years and older at Upper Saratown-Locality 2
may have had preferential access to animal protein given the very

139
high zinc levels of certain of these individuals relative to the
other age segments of the adult sample. A further consideration of
the relationship of possible differential diets to status will be
addressed in Chapter VII.
In addition to these observations, there appears to have been a
shift in the age at which subadults were weaned. Individuals may
have been weaned between the ages of 3 and S years in the
protohistoric period, and between the ages of 6 and 10 years in the
late protohistoric/early contact and middle contact periods. More
trace element data concerning larger samples for the prehistoric and
contact periods are needed to more completely examine this
generalization, as well as others concerning the relationship of
diet and age.
Sex and the Trace Element Analysis
The next logical step in investigating the levels of the
various trace elements assayed for the skeletal series is to compare
the results by sex. For this study only the samples from the late
prehistoric period Shannon site and the late protohistoric/early
contact period Upper Saratown-Locality 2 site are used (Table 24),
because the other population samples do not have representative
numbers of the two sexes. The results of both intra-site and inter
site comparisons are presented in the following discussion.
At the Shannon site only slight differences can be seen in the
trace element levels between males and female s. Males have slightly
higher l evels of strontium, magnesium, and zinc , while females have
slightly higher levels of copper and vanadium. Variation in the

~
Miles
FEmales
~
Miles
FEmales
'ffiBLE 24.
Mean Tra02 Elerrent arrl Lead Asrays for tm Shannen Site and Ui;:p=r Sararo,.,n-I..o::ality 2 cy Sex.
SHNN:N SI'IE
n= SIR:NI'IlM Ml>(MSTI.M ZIN: O)PPER VANAJ:)IlM
27 373.629 1221.629 203.296 7.407 24.407 (68.645) (336.578) (74.063) (15.143) (44.684)
24 346. 750 1175.750 XJJ.250 9.375 33.375 (45.209) (136.565) (67.SED) (16.534) (54. 768)
UPPER ~u:x::::ALI'IY 2
n= sm::NI'IlM ~IlM ZIN: illPPER VANAJ:)IlM
23 787.739 1082.(XX) 346.956 l.CXX) 34.913 (172.363) (181.595) (169.348) (O.O) (13.048)
18 795.166 1127.(XX) 422. 777 32.833 ( 150. 384) (336.222) (262.240) ( - ) (11.678)
I.EAD
25.481 (00.041)
48. 708 (131.777)
LEAD
73.130 (25.ro3)
00.944 (26.914)
Figures for the tra02 elerrents and lead are in parts r:er millirn (fP!l).
After each Sex, the first line o:ntains the Mean for that trace element or lred, am. ~ Starrlard D2viation for that trac-e element or lead is enclose:l in prrentheses irnmediatel y urrlernreth the Mean.
Tre mean assay far Cor:per in ~ Male Sex Category at Ur:per Saratown-I..o::ality 2 is l:ased rn one individual.
n is the nunber of individuals with a detected level of a trace elerrent. A"-" rreans that the level of that trace elerrent was too lo,., to rreasure.
140

level of each trace element is similar for both sexes, with the
exception of magnesium. Males have more variation in magnesium
141
levels, with a standard deviation of 336.578 ppm, than do females,
who have a standard deviation of 136.566 ppm. This may indicate
that males had greater variation in the quantity of cereal foods
that comprised their diet than did females.
At Upper Saratown-Locality 2, females have higher average
levels of strontium, magnesium, and zinc than do males. Both sexes
have similar variation in the strontium levels (the male standard
deviation is 172.363 ppm, and the female standard deviation is
150.384 ppm). However, females show greater variability in the mean
levels of magnesium (336.222 ppm) and zinc (262.240 ppm) than do
males (181.595 ppm and 169.348 ppm, respectively). For vanadium,
the levels are similar for both sexes (males=34.913 ppm and
females=32.833 ppm), with males having only slightly higher mean.
Also, the standard deviations are similar for the sexes (13.048 ppm
for males and 11.678 ppm for females), with the female figure being
slightly smaller. These results appear to indicate that overall
females possessed slightly different diets from the males at Upper
Saratown, and perhaps even had a better overall diet than did males.
However, the standard deviations for the magnesium, zinc and
vanadium assays apparently indicate that different segments of the
femal e population enjoyed differential access to cereal and protein
rich (nuts and animal protein) food resources.
Comparing the trace element assays for the two sites the
following statements can be made concerning dietary changes that
occurred after European contact. During the prehistoric period, as

142
represented by the Shannon site population, males and females
probably had similar access to plant foods and animal protein. More
variability in access to cereal foods within the male segment of the
population is indicated, however. After contact, as represented by
the data from Upper Saratown-Locality 2, males and females continue
to have a similar access to plant food resources, particularly
cereal foods, but animal protein becomes more accessible to females
as a whole. During the late protohistoric/contact period,
variability within each sex in their access to food resources is
quite high, but this is markedly so for magnesium and zinc
(representing cereal and animal protein resources) among females.
This increased variability could reflect status differences, and
will be given more attention in Chapter VII.
Trace Element Levels by Age and Sex Categories
This final consideration of trace element levels by
identifiable age and sex categories utilizes only the two samples
that have semblances of being representative for the adult sexes-
the late prehistoric period Shannon site and the late
protohistoric /early contact period Upper Saratown-Locality 2. The
purpose of this analysis is to examine whether diet changed with age
in either sex, and whether different age categories exhibit
significantly different trace element levels that perhaps suggest
different diets by sex. In order to test the significance of trace
element levels by age and sex, comparison of mean F tests were run
on strontium , magnesium and zinc assays using the SAS General Linear
Model (GLM) Procedure (SAS Institute 1985:434-506). This SAS

143
procedure is used in unbalanced situations where there are unequal
numbers of observations for the different combinations of variables
being analyzed. For example, GLM wou ld be used in a 2x2 factorial
model where three of the four cells have two observations each, but
the fourth cell has only one observation (SAS Institute 1985:437).
In this study, there are some age groups with no trace element
readings, and there are a differ ent number of r eadings for most age
g r oups. This situation precludes the use of ANOVA for the analysis
of variance , and the GLM procedure is used instead (SAS Institute
1 985 : 113-126, 437-438) .
Table 25 summarizes the strontium, magnesium , zinc , copper
vanadium and lead levels by age for Shannon site males , and Table 26
does likewise for the Shannon site females . Among males, strontium
levels appear to increase with age , with the lowest levels occurring
among the 21-25 year age group (333 .000 ppm) and the highest in the
46+ year age group (383. 461 ppm) . The level of strontium among
females fluctuates with the lowest levels being in the 26-30 year
age category (329. 500 ppm) and the highest in the 21-25 year age
category (379 . 000 ppm) . These results appear to indicate that there
is a slight increase in plant foods in the diet of males as they
grow older. As fe males grow older , the suggestion is that plant
foods decrease somewhat in the diet after the age of 25 years. The
F test results , given in Table 27 , indicate however, that there is
no significant difference in the strontium levels along the lines of
age and sex at the Shannon site.
Examining the magnesium levels for the Shannon site population ,
the assays between the two sexes by age are relatively similar.

144
'Iru3IE 25.
M::an Trace Elarent arrl Lead Assays for the Shanrrn Site M3.les by loge Group.
!>GE GEO.JP n= sm::NI'Il.M WGIJESTIJ.1 ZIN: ffiPPER VlWNJilM LEAD
21-25 1 333 . CXX) 1017. CXX) 147 . CXX) (0.0) (0.0) (0.0) ( - ) ( - ) ( -
26-30 4 352 . 250 1491. 750 194 . 750 0. 750 (74 . 5SB) (717 . 240) (:D. 2CE) ( - ) (1 . 5CD) - )
31-35 3 :£7 .CXX) 1064. f:£>7 113 .CXX) (53 . 777) (157 . 983) (38. 509) ( - ) ( - ) ( -
:£-40 4 377 . 250 1172 . 75 244 . 000 23 . :00 72 . :00 64 . :00 (56.079) (lCB. 015) (77 . 335) (24 . ':0'i) (65 . 312) (129. CXX))
41-45 2 375 . :00 1139. 000 242 .000 (12 . 021) (114. 551) (7 . 071) ( - ) - ) ( - )
46+ 13 383 . 461 1218. 231 223 .000 8.154 28.154 33.077 (84. 420) (269 . 630) (77 . 557) (14. 462) (44. 594) (92. 788)
loge Group categories are in years.
Figures for the trace elarents arrl lead are in prrts per millim <wn> .
After each loge Group category, the first line rontains tre Mean for that trace element or lead, am. the Standard ~tim for that trace element or lead is enclCS=d in parentheses immediately urrlerneath tre Mean.
n is the nunber of indi vi.duals with a detected level of a trace elarent . A"-" rreans that the level of that trace elarent was tco lo,; to rreasure.

145
TABIE 26 .
Mean Trace Elerent arrl Le3d AsS:lys for tlE Shann:::n Site Farales by llqe Group.
N:iE GO.JP n= SlRCNI'TIM W(;NESTI.M ZJN:: CDPPER VANADTIM LEAD
16-20 2 ':69 . :0J 1170 . :0J 133.:0J 4.:0J 23.CXXl (9. lc.:x:J) (93 . 702) (72 . 832) (6. 364) (32. 527) ( - )
21-25 3 379 . CXXl 1252.333 194. 333 4.CXXl 19. CXXl ( 39 . 230) (206. 621) (6. 351) (6. 928) (32 . ~) ( - )
26-30 2 329.:0J 1021.:0J 210 . :0J 11.:0J (23 . 334) (55. 861) (54. 447) ( - ) (16. 263) ( - )
31-35 2 347 . :OJ 1119. CXXl 178 . CXXl (51.619) (ffi.267) (:D. 912) ( - ) ( - ) ( - )
':6-40 4 343 . 750 1139. CXXl 277 . :OJ 21 . :0J 77 . 250 103 . 250 (23 . 768) (132.783 ) (100. 626) (26. 514) (85. 223) (206. :0J)
41-45 1 322 . CXXl 1139. CXXl 247 . CXXl (0 . 0) (O . O) (O . O) ( - ) ( - ) ( - )
46+ 9 332.555 1209.667 176 . 222 7.889 23.444 42.CXXl (59. 873) (147 . 816) (51.132) (13. 439) (43. Sffi) (126. 000)
llqe Group categories are in years.
Figures for the trace elarents arrl lead are in p:irts per millim (gm) .
After eadl llqe Group category, tlE first line cx:ntains tlE Mean for th3.t trace eleme-it or lead, arrl the standard D=viatim for th3.t trace element or lead is enclCSErl in parentheses imme:hatel y urrlerneath tlE Mean.
n is the nunber of individuals with a detected level of a trace elererrt . A "-" rre3I1S that the level of th3.t trace elerrent was tco lo.v to rre3Sl.lre.
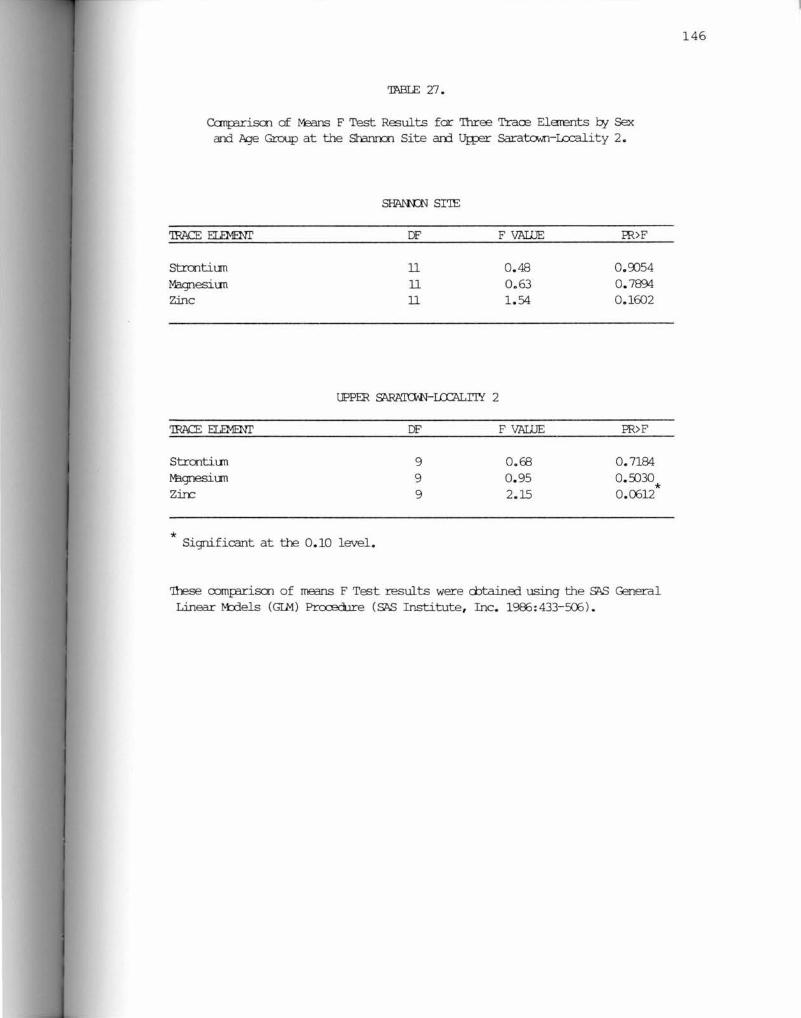
'ffiBLE 27.
Ccrnprrism of M=ans F Test Results for Three Tra02 ElE!TEnts by Sex and hje Group at the Sra.nn::n Site arrl Ug:er Sarato.vn-Lccality 2.
Strcntiun M3.gnesiun Zinc
~ SI'IE
OF
ll ll ll
F VAI1JE
0. 48 0.63 1.54
UPPER ~-I..CG\LTIY 2
'IRACE ELEMENI' OF F VALUE
Strmtiun 9 O.EB M3.gnesiun 9 0.95 Zin::: 9 2.15
* Significant at the 0 . 10 level.
FR>F
o.c;os4 0 . 7894 0.1602
PR>F
0.7184 0.:030 0.0612 *
'These oomp:rriscn of ffi63IlS F Test results were cbtaina:1 using the SAS Ceneral Linear M:.dels (GIM) PrcxEdrre (SAS Institute, Inc. 19ffi:433-506).
146

147
There does appear to be more variability in the levels of magnesi um
for males when compared with females . However, the F test results
again show that there is no significant difference between any age -
sex category for males and females in the magnesium levels.
For zinc, the levels for males are overall lower than for
females except in the 46+ year age group. The lowest zinc level for
males is in the 31-35 year age category (113.000 ppm) and the
highest is in the 36-40 year group (244. 000 ppm) . Females exhibit
the lowest zinc levels in the 16-20 (133 . 500 ppm) age group and the
highest in the 36-40 year age group (277.500 ppm). Again, the F
tests indicate that there are no significant differences in the
levels of zinc between the two sexes in any age category.
Considering the information from Upper Saratown-Locality 2,
more variability is shown in the levels of the three major trace
elements by age and sex (Tables 28 and 29). For strontium, the
levels are different between males and females . Males have the
lowest strontium levels in the 16-20 year age category (687 .000 ppm)
and the 26-30 year age category (772.000 ppm) , with no individuals
being present for the 21-25 year age group. The highest male
strontium levels are seen in the 31-35 year age group (906.667 ppm).
For females , the lowest strontium levels are from age 36-40 years
(579.500 ppm), and the highest at 16-20 years (844.750 ppm) and 26-
30 years (805 .000 ppm) , again with no female individuals aged 21-25
years. There also appears to be more fl uctuation in the strontium
l evels by age category among males than among females. However, the
F test calculations indicate that there are no significant
differences in the strontium levels by age and sex.

'ffiBIE 28 .
Mean Trare Elerent arrl Lead Assays for the Urr:,er Sarato..Jn-Lcx::ality 2 Miles by kJe Group.
[:(;£ ffiCXJP n= SIRCNI'IlM MAGIESilM ZIN: CDPPER VANADil.M LEAD
16-a:) 1 6ITT .cm 1262. (XX) 203.(XX) 56. (XX) (O . O) (0.0) (0.0) ( - ) (0.0) ( - )
26- JJ 7 772 . (XX) 900. 857 320. 36) 29.857 82. 714 (178 .001) (140 . 393) (95 . 3ED) ( - ) (9. 547) (22 . 001)
31-35 3 906. 667 1089. (XX) 292. 667 43. (XX) 70. (XX) (107 . 342) (299 . 511) (68 . ED3) ( - ) (27.221) (38 . CXX))
36-40 5 726. fm 1082. 200 273 . (XX) 32. 200 69. 000 (254 . 814) (92 . 221 ) (62. 789 ) ( - ) (9. 444) (32 .935)
41-45 3 748.(XX) 1103. (XX) 400. 667 29. 667 66. 333 (169 .177) (62 . 378) (129 . 554) ( - ) (9. 452) (10 . 116)
46+ 4 857.SCD 1192.7':!J 522. 2':!J l. (XX) 39. 7':!J 71 . 2':!J (<X) . 497) (277. 771) ( 328. 743 ) (0.0) (7.041) (31.009)
kJe Group categ:xies are in yrers .
Figures for the trare elarents arrl lead are in p:rrts r.er millirn (g:m) .
After each kJe Group category, tre first line a:ntains tlE Mean for that trare element or lead, arrl the starrlard D2viatirn for that trare element or l ead is enclosed in parentheses irrune:liatel y urrlerneath tlE Mean.
'Ihe !vEan Assay for ~ in the 46+ year age group is b3.sed en me irrli vidual.
n is the nunter of irrlividuals with a detected l evel of a trare elarent . A"-" rreans that the level of that trare elarent was too lo,; to rreasure.
l
148

'ffiBIB 29 .
Mean Traae Elerent arrl Le3d Assays for the Ui;:p:r Saratcwn-Lcx::ality 2 Fsra.les l::ry l>qe Group.
l>£;E ma.JP n= S1RCNI'IU1 M.Z>GJESilli znc CDPPER VANADIUM I..Eill
16-:JJ 4 844.7':JJ 9ffi. 5CO 267 . 7':JJ 25. 2':JJ 77 . SCO
(119 . 656) ( 137 . ffiO) (':JJ . 195) ( - ) (13 . 913) (25 . 040)
26-~ 4 005. CXX) 1038. 7'3J 351 . CXX) 35. 2':JJ 78.7':JJ
(149 . 052) (151 . 634) (68.122) ( - ) (2. 530) (16.830)
31-35 2 851 . CXX) lCXX). CXX) 345 . SCO 34.CXX) 79.SCO (237 . 588) (':JJ . 912) (c:B . 702) ( - ) (4. 243) (58 . 690)
36-40 2 579. SCO 1079. SCO 269. SCO 27 . SCO 70. CXX)
(lED . 513) (37.477) (37 . 477 ) ( - ) (16 . 263) (21 . 213)
41-45 1 818 . CXX) 1582.CXX) 946 . CXX) '3J. CXX) '3J. CXX)
(0. 0) (0.0) (0. 0) ( - ) (0.0) (0. 0)
46+ 5 007 . CXX) 13CB.6CX) 591.BOJ 35. 20J 95.CXX)
(143.131) (556 . ECO) ( 368. 776) ( - ) (14.131) ( 31.072)
Jlqe Gra.lp categ::iries are in yrers.
Figures for the trare elerents arrl lead are in p:rrts per millim (g::m) .
After each l>qe Group category, tre first line cx:ntains tlE Mean for that traae element or lead, arrl the standard Ceviatim for that trare element or lead is enclosed in parentheses irnme:liatel y urtlerneath tlE Mean.
n is the nunber of irrlividuals with a detected l evel of a trare elerent. A"-" rre:ms that the level of that trare elerent was ta:> lo,; to rreasure.
149

150
The magnesium assays show even more variab ility than does
stronti um. Fema l es aged 16-20 years at death have the lowest
magnesium levels (960. 500 ppm) , while females aged 41-45 years have
the highest (1582. 000 ppm) and females aged 46+ years have the
second highest level (1309. 60 ppm) . This suggests that for femal e s
magnesium levels increase with age, indicating that cereal food
r e s ou rces i n crease in a female ' s diet with age. Converse l y , males
ha ve the highest magnesium levels in the 16-20 year age category
(1262 . 000 ppm) and the lowest in the 26-30 year age group (980. 857
ppm ). The male magnesium l evels then increase s l ightly and remain
re latively stable in the age categories older than 30 year s . The F
t e s t results again show that the differences in magnesium levels by
age category for the two sexes are not significant.
In contrast to the other two trace elements , zinc levels for
ma les and females show a similar pattern. Males have the lowest
zinc level in the 16-20 year age grou p (203 .000) , with fluctuating
levels from age 26 to 40 years, and then increasing levels after age
41. The highest male zinc level is seen in the 46+ year age
ca t egory. Females exhibit a similar pattern, with the lowest zinc
l evel occurring at age 16-20 years . Again, the zinc assays
fluctuate between the ages of 26 and 40, and the highest leve ls are
in the 41-45 year and 46+ age categories . As a whole , variability
within each age group for both sexes is similar. The F test shows
that the re is a significant difference between the two sexes by age
group in the zinc levels. This difference is probably due in part
t o the big difference between the sexes in the zinc l evels for the
41-45 year age group, where the male mean (n=3) is 400. 667 ppm and

151
the female mean (n=l) is 946.000 ppm. Still, excluding this age
group from the analysis, the female mean zinc level is higher than
the male for the age groups between the ages of 16 and 35 , and for
the 41+ age group. The female mean zinc level is only slightly
lower than the male for the 36-40 age group. The implication is
that females at Upper Saratown-Locality 2 in general have better
access to animal protein than do males , especially for females of
childbearing age (16-35 years) and old females aged greater than 40
years. Once again, however, these statements are tempered by the
fact that the sample size is small for the Upper Saratown-Locality 2
adult males and females, and sample bias may be influencing the
interpretations.
Still, a number of general proposals can be set forth
concerning the changes in diet between males and females from the
prehistoric to the late protohistoric/contact period. In the late
protohistoric/contact period, both males and females tend to have
higher levels of zinc as documented by the Upper Saratown-Locality 2
sample when compared with the late prehistoric period Shannon site.
However, females from both sites at most age groups appear to have
higher levels of zinc than do males. Magnesium levels appear to
remain relatively similar for the sexes by age category over time.
Strontium levels are more constant for males and females by age
category at the Shannon site than at Upper Saratown-Locality 2, with
the latter exhibiting greater variability. However, the only
significant change appears to b e that males and females at Upper
Saratown-Locality 2 have higher overall levels of zinc than do the
Shannon site males and females. This overall increase probably

reflects the increased availability of animal protein during the
late protohistoric/contact period due in part to the posited
increased hunting tied to the skin and fur trade with Europeans.
Conclusions
152
Levels of trace element were compared within and between the
five skeletal series for the adult and subadult segments of each
sample, age categories, sex, and age and sex categories. In
general, there is an increase in levels of zinc found in the
populations of the late protohistoric/contact period over those of
the late prehistoric/early protohistoric periods. This increase is
considered to be in part due to the increased availability of animal
protein during the contact period as a result of increased emphasis
on hunting animals for the European fur and skin trade.
The late protohistoric/contact period samples also appear to
possess more variability in the levels of trace element present than
do the earlier samples. This may be associated with changes in the
access of certain segments of the sample to certain food resources,
which may in turn reflect changes in status among the samples over
time. This question will be given greater consideration in Chapter
VII. For now, comparison of the sexes does appear to indicate that
females may have had greater accessibility to animal protein during
the late protohistoric/contact period than earlier. This is
strongly suggested by the zinc analysis for the Upper Saratown
Locality 2 sample. This and the other general patterns discussed in
this chapter do serve as a guide for future research, because it is
admitted that more extensive research with better population samples

153
i s needed to properly interpret the results of the trace element
analyses of the aboriginal populations of the Carolina and Virginia
Piedmont .

CHAPTER VI
PATHOLOGIES
In Chapter IV the demographic analyses conducted on the
prehistoric, protohistoric and contact period burial samples
appeared to indicate that European contact created a more stressful
environment for the aboriginal populations. This is illustrated
demographically by higher male mortality and lower life expectancies
at the contact period sites. By examining the skeletal remains for
pathological conditions, information can be gathered about the
susceptibility of a population to stress and disease. Data
concerning changes in diet can also be collected. By comparing the
data on pathologies from several sites the question of stress
related and disease-related changes in behavior can be addressed.
Most diseases, including those of Old World origin, do not
affect the skeletal structure of the body, and specific diseases can
not always be associated with a specific pathology (Buikstra and
Cook 1980:439-444). Therefore, as is usually the case when studying
archaeological remains, there are only a few diseases of the many
that existed that can be examined directly using skeletal samples.
This study will begin with a general survey that relies heavily on
ethnographic information concerning the endemic and European-derived
diseases that possibly afflicted the native populations in the
Piedmont during the protohistoric and contact periods.

155
Epidemic Diseases in the Southeast, 1520-1710
Diseases introduced from Europe caused numerous epidemics of
lethal pathogens in the New World between A.D. 1520 and 1710 (Dobyns
1983:8). The most destructive of these Old World pathogens for
native Americans was smallpox. With European contact smallpox
spread rapidly throughout the southeast affecting aboriginal
populations that possessed no immunity to the disease (Dobyns
1983:11). The earliest recorded smallpox epidemic lasted from 1520
until 1524 and was more deadly than any of the later outbreaks.
Between 1665 and 1667, a second major epidemic struck the southeast
from Florida to Virginia. Another smallpox epidemic, dating to
1696, decimated the interior Southeastern and Gulf Coast chiefdoms
before it ended in 1699 (Dobyns 1983:15).
John Lawson (1967) makes note of the smallpox epidemic of 1696-
1699 in his record of his travels through the Carolinas in the
winter of 1701. Lawson (1967:231-232) recalls that "The Small-Pox
has been fatal to them; they do not often escape, when they are
seiz'd with that Distemper, which is a contary Fever to what they
ever knew." Lawson (1967:232) went on to speculate that smallpox
was new to the Native Americans as "it destroy'd whole Towns,
without leaving one Indian alive."
Another known European disease that may have been fatal to
Indian groups of the Carolinas and Virgina is influenza. Dobyns
(1983:18-19) suggests that the effects of influenza on Native
American populations are probably underestimated because outbreaks
of this disease are not reported in any of the historic r ecords,
given that influenza symptoms are not easily recognized. After

156
smallpox, influenza may have been the second most lethal disease
respectively among aboriginal populations. Lawson (1967:17) does
not identify influenza as being present among the Indians with whom
he had contact, but he does describe several medicines made of
roots , herbs , and/or snake skins that the Indians used to treat
generic "fevers" . A high fever is one symptom commonly associated
with both influenza and smallpox.
Another disease that has a high fever as a symptom is measles.
However, there is no historical evidence to support the presence of
measles in the Carolinas and Virginia between 1520 and 1710.
Syphilis is a disease that can definitely be identified as
affecting Indian populations of the sou theast. The major question
that surrounds this disease is whether syphilis originated in the
Old World or the New World, with a number of theories based on
biological , environmental , and paleopathological evidence having
been proposed to explain its origin and presence in the New World
(cf. Steinbock 1976 : 87-97) . Whateve r its origin, syphilis is
considered to have been one of the major diseases responsible for
population decline among Native Americans after 1520 (Dobyns
1983:35) . Lawson (1967:25, 231) in his journey through the
Carolinas notes a number of individuals who were afflicted with the
"Pox" (syphilis) and had lost their noses . He also records in his
journal that yaw s , as well as syphilis (both of which are classed
together as treponemal infections) , is present among the aboriginal
populations and that the two diseases exhibit similar symptoms.
Yaw es ••• is •• • atte nded with nocturnal Pains in the Limbs , and commonly makes such a Progress , as to vent part of the Matter by Botches , and several Ulcers in the Body and other Parts ; oftentimes
Death ensuing. I have known mercurial Unguents and Remedies work a Cure, following the same Methods as in the Pox . (Lawson 1967 : 231) .
Using only skeletal remains it is difficult to differentiate
157
yaws from syphilis postively because the osteological indicators of
the two diseases are similar. These indicators include cranial
lesions, nasal destruction, and lesions on, and swelling of , the
lower limbs (Steinbock 1976:102-105).
In summary, four diseases--smallpox, measles , influenza , and
treponemal infections (yaws and syphilis)--may have affected the
Indian groups of the Carolina and Virginia Piedmont during the
pr otohistoric and contact periods. The effects of these diseases on
the skeletal remains varies from almost none (influenza) to extreme
(yaws and syphilis) , which can create problems when attempting to
determine if one of these diseases is present in a skeletal series.
Because influenza and measles do not affect bone , the two diseases
cannot be identified positively using only skeletal remains .
Treponemal infections, however, have been observed in a number of
archaeological skeletal populations by the presence of lesions on
cranial and postcranial remains (cf. Bullen 1972 ; Steinbock
1976:86-106).
Smallpox (variola osteomyelitis) does deform the bone , usually
of the upper extremities, especially in the area of the elbow , but
any joint in the skeleton can be affected (Ortner and Putshar
1981:227-228). At the Grimsby site in Ontario, Canada, deformities
of the elbow joint in a number of burials were identified as having
been caused by variola osteomyelitis (Jackes 1983). This Neutral

Indian cemetery dates to about 1650, and provides the first
archaeological evidence of smallpox in the New World.
158
In this study , none of the four samples considered here
possesses lesions caused by treponemal infections, and no
protohistoric or contact period population shows evidence of having
been affected by smallpox. Given this negative evidence, the
presence of these three diseases (yaws , syphilis, and smallpox) as
additional biological stresses during European contact can be
inferred only from ethnohistorical descriptions of their occurrance,
and not from any evidence derived from the skeletal remains
available for analysis in this study.
Study of the Pathologies within the Sample Populations
The ultimate goal of this study of the skeletal pathologies
observed is the comparison by burial sample of the frequency of the
differing types of pathologies that are present. Six major
categories of skeletal pathologies are used in this analysis: 1)
traumatic or violent pathologies ; 2) degenerative pathologies; 3)
tumors; 4) general stress-related pathologies; 5) pathologies
associated with dietary stress; and 6) general infectious
pathologie s. Table 30 summarizes the various pathologies present by
percentage of occurrence in the sample and by percentage of the
total pathologies present.
Traumatic/Violent Pathologies
Pathologies that are generally considered to be evidence of
trauma or violence can be placed into four broad categories--bone
fractures, bone damage due to possible blows to the head, cuts, and

Swmrry of the Disease Categories by Percentage of Afflicte::l Inlivi.d.ials and by Peroentage of Total Pathologies in the Fem- Sb..rly Samples.
~ Sarato,.,n-
Sha.rn::n Site Wall Site l.J::x:ality 2 Frooricks Site DISEASE %µ)p . %p.lth. %µ)p. %p3.th. %µ)p. %p.lth. %J??p. %@th
Trarnatic 12. 3 3.6 12. 5 3.8 3.3 1.4 15.4 5.7
Cegenerative 48 . 4 14. 1 25 .0 11. 4 22.2 9.7 15 . 4 3.8
'furors 20. 6 9. 3 o.o 0.0 7. 7 3.9 15.4 3.8
Schrorl I S Na:Je 5. 1 1.5 25.0 7. 6 3. 3 1. 4 3). 8 7. 5
Enarrel 56. 7 16. 5 75.0 23.0 62. 2 27.0 85.0 20. 7 Hyp:,plasia
Cribra 12 . 3 3.6 25.0 7. 6 5. 5 2.4 40 .0 7.5 Orbitalia
Sp:ngy o.o o.o 12.5 3.8 1.1 0.48 7. 7 1.9 Hyperostosis
Period::ntal 62 . 9 18 . 3 37 . 5 11.5 33.9 16.9 46 . 0 11 . 3 Diseare
Caries 73 . 2 21 . 2 62 . 5 19.2 71 .1 31 .0 85.0 'XJ.7
Osteitis 41 . 2 12.0 37.5 11.5 13.3 5.8 69.0 17.0
rF'J7 100 n=B 100 n---<.::o 100 n=13 100
n is the nurber of analyz.Erl .in:lividuals for each saill)le.
159

160
piercing wounds. The basic hypothesis concerning such pathologies
is that there would be an increase in traumatic/violent injuries
from the late prehistoric into the contact period, given the
increased warfare documented for the contact period (cf. Lawson
1967: 49-50 , 233) and the probable increased occurrence of accidents
tied to the growing importance of hunting animals to procure skins
and furs for trade with the Eu ro-Americans.
At the prehistoric Shannon site , traumatic/violent pathologies
af fected 12.3% (n=l2) of the sample and accounted for 3. 6% of the
tota l pathologies present. Of these traumatic/violent pathologies ,
53. 7% were fractures of limb bones (15. 3% lower limbs and 38.4%
upper limbs) , 23 . 1% were identified as resulting from blows to the
head, a nd 23.1 % were puncture wounds. Of the males, 22. 8% exhibit
traumatic/violent injuries , while only 13. 8% of the females have
such injur ies .
For females at the Shannon site , 60% of the total traumatic
violent pathologies are breaks , 20% consist of possible head blows,
and 20% of piercing wounds. Among males , 50% of the total
traumatic/violent pathologies are breaks, 25% are possible head
blows, and 25% represent piercing or c u t wounds. The male piercing
wound category contains one individual with a small chipped stone
pr ojectile point imbedded in the 6th rib.
The limb bones most commonly broken are the radius , then the
humerus, then fibula , and last the ulna. At the Shannon site , the
overall fracture rate for the major long bones is 1.19% (3 out of
252 possible bone occurrences) for females and 1 . 63% (4 of 245 bone
occurrences) for males .

161
At the late prehistoric/protohistoric Wall site, only one
traumatic/violent pathology is present in the sample, a healed
fracture of the left humerus of a male 45 years old (Plate I). This
one example accounts for 3.8% of all the pathologies at the Wall
site, where 12.5% of the sample possesses evidence of one pathology
or another.
In the Upper Saratown-Locality 2 sample, which dates to the
late protohistoric/early contact period, only three adults have
traumatic/violent pathologies. This represents 3.3% of the segment
of the burial sample that shows evidence of any pathology, and 1. 4%
of the total number of pathologies present. None of these injuries
is from fractures or breaks. A chipped stone projectile point is
embedded in the left femur midshaft of an adult male . An adult
female (Burial 17) shows evidence of a blow to the head--dents on
the right parietal. Another male (Burial 73) also has evidence of a
blow to the head in the form of dents on the frontal bone. The
percentage of Upper Saratown-Locality 2 males affected by
traumatic/violent injuries is 8.3, while 5.5% of the females are
affected.
At the middle contact period Fredricks site, 15.4% (n=2) of the
sample shows evidence of traumatic/violent pathologies. This
cataegory accounts for 5.7% of the total number of pathologies
present in the skeletal series. Both of the identified
traumatic/violent pathologies are puncture wounds. A female aged 35
to 40 years has a possible pierce wound of the left fibula that may
represent a gunshot wound (a lead shot was found in situ on this
individual's fibula). Although the fibula is extremely fragmented,

162
O l J 4
(M
Plate I . Healed left humerus (top) compared with norma l right humerus (bottom) of Burial 1 from 310r231 , the Wall site.
0 2 3 4 s
CM
Plate II . Two examples of Schmorl ' s node or h e rniated disc from 310r231 , the Fredricks site.

163
there is no evidence of bone reconstruction or osteitis, which
indicates that the woman died shortly after incurring the injury.
The other individual in the Fredricks site sample that
evidences a traumatic/violent pathology may also have been a victim
of warfare. This male, aged 25 to 30 years at death, has cut marks
that extend from the right parietal to the right temporal. The
depth of the cuts through the periosteal layer of the cranium
suggests that a very sharp weapon used with great force inflicted
the injury. Although it is possible that these marks are evidence
of scalping, the irregular nature of the cuts is not consistent with
the usual pattern of scalping whereby the frontal region is cut and
the scalp pulled toward the back of the head where it then is cut
away, sometimes with part of the skull (cf. Lawson 1967:207). An
alternative explanation of these wounds is that the individual was
struck repeatedly about the head with a sharp weapon such as a
sword. Also, this burial is unique at the Fredricks site in that it
had been interred as a disarticulated bundle. The individual died
as a result of the identified cuts on the head (and possibly other
unidentified wounds) , probably at a locale some distance away from
the village. The body was not returned to the Fredricks site for
burial until some time after death had occurred, certainly after
decomposition was well advanced (which would account for this burial
being a bundle-type interment). It does appear that this male had
been a victim of warfare or some other violent act. A similar
pattern of treatment of war victims, i.e., the retrieval and
subsequent interment of human remains sometime after a war-like

encounter, is documented among the Choctaw and Creek Indians by
Adair (Williams 1930).
Thus all numerous nations of Indians perform the like friendly office to every deceased person of their respective tribe, in so much that those who lose their people at war , if they have not corrupted their primitive customs, are so observant of this kindred duty as to appropriate some time to collect the bones of their relations, which they call bone gathering_.(Williams 1930:181-182).
It can be suggested that this burial had been exposed to the
164
elements for at least several weeks before the remains were returned
and buried at the Fredricks site. No defleshing marks, which would
indicate intentional disarticulation and secondary burial, are
present on this individual's bone. Also, there is no documentary
evidence to suggest that intentional disarticulation and secondary
buria l was ever practiced by the late prehistoric or historic period
Indian groups of the Piedmont.
This study of the occurrence of the traumatic/violent
pathologies in the burial samples does not completely support the
original hypothesis that there would be a general increase in the
incidence of such injuries over time. Comparing the two samples
that are the most representative, those from the Shannon site and
from Upper Saratown-Locality 2 , there is a dramatic decrease , not
the expected increase. Also, at the Shannon site , 46 . 2% of all the
traumatic/violent injuries are other than broken bones. In
contrast, the Upper Saratown-Locality 2 sample has all of the
traumatic/violent pathologies (n=3) other than broken bones. A
similar pattern of decrease in the occurrence in broken bones in the
contact period is also exhibited when the Wall and Fredricks site

165
samples are compared to each other. No explanation for this trend
can be given now, although it is suspected that changes in the
behavior patterns associated with hunting and warfare may account in
part for these patterns.
Degenerative Pathologies
Degenerative pathologies are those that are associated with age
anj physical activity, i.e., those that are tied to the gradual
deterioration of the body. Arthritis and osteoporosis are
degenerative pathologies noted in the study samples. The guiding
hypothesis of this analysis is that because more individuals survive
to old age in the late prehistoric/early protohistoric samples at
the Shannon site and the Wall site than in the late
protohistoric/contact period samples represented by Upper Saratown
Locality 2 and the Fredricks site (see Chapter III), there should be
more degenerative pathologies present in the earlier burial samples
when compared to those of the contact period.
Arthritis is present in all four of the skeletal series, with
osteoporosis occurring only in the Shannon and Wall site samples.
At the Shannon site, 14.2% of the total pathologies present,
affecting 48.4% (n=47) of the sample, are degenerative. For the
Wall site, 25% (n=3) of the burial sample is afflicted by
degenerative pathologies , which comprise 11.4% of the total
pathologies. For the late protohistoric/contact period sites,
degenerative pathologies affect 22.2% (n=20) of the Upper Saratown
Locality 2 sample, accounting for 9.7 % of the total number of
pathologies, and 15.4% (n=2) of the Fredricks site sample (3.8% of
the total pathologies identified).

166
Comparing the larger and more representative samples from the
late prehistoric Shannon site and the late protohistoric/early
contact period Upper Saratown-Locality 2 shows a decrease of over
50% from the former to the latter in the number of individuals
affected by degenerative pathologies . Also, there is a 30% decrease
in the percentage of total pathologies present in the late
protohistoric/early contact period from what is present in the late
prehistoric period. Similar patterns can be defined when the small
burial samples from the Wall site and the Fredricks site are
compared. Thus , as expected, there is a decrease in the occurrence
of degenerative pathologies in the contact period from the level
noted for the prehistoric period.
Tumors
Tumors and tumor-like pathologies are only rarely associated
with just human bone. Instead, tumors are the result of unchecked
growth of the osteogenic mesenchyme, which includes the bone,
cartilage, fibrous tissue , and blood vessels . Tumors can be
classified as being benign or malignant. If growth is localized and
consists of mature tissue, the tumor is considered to be benign. If
growth spreads to other parts of the body and affects immature
tissue, it is class ified as malignant (Ortner and Putshcar
1981:365) . The tumors identified in the study populations consist
of ear extosis , button osteomas , and cartilagenous exostosis , all of
which appear to be benign in nature. As with the other categories
of pathologies considered in this section, it is hypothesized that
the incidence of tumors in th e study samples should show an increase
through time from the late prehistoric period to the later contact

period, given the generally more stressful and less healthy time
that the contact period is generally considered to have been.
167
At the Shannon site , 20 . 6% (n=20) of the burial sample has some
form of a tumor-like lesion, with 31 total occurrences (9. 3% of all
pathologies) being identified. Of these 31 occurrences , 19 are
examples of ear extosis, two of button osteomas, and one is an
instance of osteochondroma (cartilagenous exostosis) of the right
ilium. In the other pre-contact skeletal series from the Wall site ,
no tumor-like lesions are present.
For Upper Saratown-Locality 2 , only 7.7% (n=7) of the burial
sample evidences tumor-like lesions, which account for 3.9% of the
total pathologies. Ear extosis accounts for four of these tumors,
multiple cartilageneous exostosis of long bones for three,
cartilageneous exostosis of the basion area for one, and button
osteoma for one.
The incidence of tumors at the Fredricks site doubles to 15.4%
(n=2) of the sample over that noted for Upper Saratown-Locality 2.
However, tumor-like lesions still account for only 3.8% of the total
pathologies identified in the skeletal series. These tumor-like
lesions are tentatively identified as osteomas located on the
mandibles of two individuals.
Comparing the percentage of occurrence of tumors in the study
samples from the late prehistoric Shannon site and the late
protohistoric/early contact period Upper Saratown-Locality 2 , the
increase expected according to the hypothesis guiding this analysis
is not corroborated. Again , the Upper Saratown-Locality 2 sampl e
exhibits a more healthy pattern than does its late prehistoric

168
counterpart. Examining the percentages for the unrepresentative
late prehistoric/early protohistoric Wall site and the middle
contact period Fredricks site, the expected increase in the
incidence of tumors is found. However, the percentage occurrence of
tumors at the Fredricks site is still lower than that for the late
prehistoric Shannon site, although it is higher than the figure for
the earlier Upper Saratown-Locality 2 skeletal series.
Mechanical and General Stress
The two pathologies that are indicative of general or
mechanical stress are Schmorl's nodes (intervertebral disc hernia)
and dental hypoplasia. Schmorl's nodes are caused by pressure from
tension on the spine. Trauma induced by mechanical stress can cause
the centrum of the vertebra to collapse, resulting in the formation
of Schmorl's nodes (Plate II). This can occur in individuals of any
age. Also, Schmorl's nodes can appear as a result of degenerative
changes associated with the aging process (Schmorl 1971:158-166).
Given the factors that cause Schmorl's nodes, it is postulated
that this pathology will affect a greater percentage of the burial
population between the ages of 20 and 40 at the late
protohistoric/contact period sites. This prediction is based
primarily on an increase of mechanical stress during this period
related to obtaining, dressing, and transporting furs and skins for
trade with Euro-Americans, and an increased p:i.rticipation in warfare
and hunting. Conversely, because young adults in the
prehistoric/early protohistoric period samples would presumably have
experienced less mechanical and general stress, this segment of the
burial sample at the Shannon and Wall sites should exhibit a low

169
incidence of Schmorl's nodes. In these early burial samples, this
pathology would be expected to occur primarily among older adults as
a result of degenerative processes. Because of the predicted
presence of both mechanical and degenerative stress, those
individuals that survive to old age at the late
protohistoric/contact period sites should also evidence a high
incidence of Schmorl's nodes.
At the prehistoric Shannon site, five individuals possess
Schmorl's nodes. Three of these individuals are males aged 50+
years, and the other two are females, cne aged 40 to 45 years and
the other 50+ years. The mean age for these five Shannon site
individuals with Schmorl's nodes is 48 years. At the Shannon site
5.1% of the skeletal series is affected by Schmorl's nodes, where
the pathology accounts for 1.5% of the total pathologies noted at
the site.
In the late prehistoric/early protohistoric Wall site burial
sample, two old males aged 50+ have Schmorl's nodes. These two
individuals comprise 25% of the sample. Schmorl's nodes represent
7.6% of the total pathologies present at the site. At both the Wall
site and the earlier Shannon site, arthritic lipping of the lumbar
and thoracic vertebrae is present, indicating that the herniated
discs are probably degenerative in nature and not the direct result
of mechanical stress. Certainly, the absence of young adults with
Schmorl's nodes, especially at the Shannon site, suggests the
absence of extraordinary mechanical stress levels in these two
societies.

170
For the late protohistoric/early contact period Upper Saratown
Locality 2 burial sample, only three individuals have Schmorl's
nodes . The mean age of these three is 35.8 years . Two of these
individuals are females , one aged 30 to 35 years and the other 45 to
50 years . The third individual is a male 25 to 30 years old. All
three individuals also possess arthritic lipping. These three
individuals comprise only 3. 3% of the Upper Saratown-Locality 2
sample, and only 1. 4% of the total pathologies present are of this
type. It seems unlikely that degenerative stress related to aging
would have been the cause of the Schmorl ' s nodes in the male, who
was aged using the os pubis. Instead it appears that mechanical
stress contributed to his pathological condition. The oldest female
fits the pattern of Schmorl's nodes being the result of degenerative
stress. The status of the female aged 30 to 35 years is more
equivocal , with both mechanical and degenerative stress possibly
contributing to the development of the pathology. Unfortunately,
the analysis of Schmorl ' s nodes in the Upper Saratown-Locality 2
sample is affected detrimentally by the poor preservation state of
the vertebra in the site ' s burials.
At the middle contact period Fredricks site four adults , with a
mean age of 36. 2 years , have Schmorl's nodes. This pathology is
present in 30. 8% of the Fredricks site burial sample, and totals
7.5% of the pathologies identified at the site. Three of the four
adults with Schmorl ' s nodes are males, one aged 50, one aged 25 to
35, and one aged 25 to 30 years. One female aged 35 to 40 years
completes the sample. Here it appears that both degenerative stress
and mechanical stress are afflicting the adults in the burial sample

171
as a whole, resulting in the occurrence of Schmorl's nodes in both
the younger and older adults.
In summary, and as originally postulated, the occurrence of
Schmorl's nodes in the late prehistoric/early protohistoric period
burial samples is generally associated with older individuals,
probably as the result of degenerative stress. Younger adult
individuals at the late protohistoric/contact period sites exhibit
Schmorl's nodes more frequently than do their prehistoric/early
protohistoric counterparts. In fact there are no individuals with
Schmorl's nodes that are aged less than 40 years at either the
Shannon site or the Wall site. Considering the second aspect of the
original hypothesis concerning Schmorl's nodes, there is a general
increase in the percentage of the sample affected by Schmorl's nodes
when the earliest skeletal series from the Shannon site is compared
to the latest skeletal series from the Fredricks site. The late
prehistoric/early protohisoric period Wall site also adheres to the
general pattern. However, the late protohistoric/early contact
period Upper Saratown-Locality 2 burial sample does not, as far as
the percentage and number of individuals afflicted with Schmorl's
nodes is concerned. For the Upper Saratown-Locality 2 sample, the
problem noted earlier with the poor preservation of the vertebral
remains from the burials may be affecting this analysis. Although
the samples tend to reflect a trend for more younger individuals to
possess Schmorl's nodes in the late protohistoric/contact period
samples and for more older individuals (by count and percentage of
the sample) to be affected in the prehistoric/early protohistoric
samples, additional burial samples from other sites of all periods
172
will need to be examined before this question can be addressed in
full.
The other indicator of general stress in a population that will
be considered in this study is enamel hypoplasia. This pathology is
an indicator of physiological stress derived from the effects of
disease or diet. Enamel hypoplasia is defined as a deficiency in
enamel thickness resulting from the slowing of enamel formation due
to stress (Huss-Ashmore et al. 1982:441). Transverse lines or
rings form as distortions on the enamel when the stress terminates
and normal development resumes. These rings are not altered or
affected by later events in life (except extreme dental wear) . The
rings thus serve as a record of stress that occurs during a person ' s
years of developm ent (Huss-Ashmore et al. 1982:441). Episodes of
non-specifi c develop~ental stress can be initiated by a number of
diverse stimuli, including weaning, malnutrition, infection, and
psychological stress. Therefore, the precise cause of a specific
transverse line on the teeth cannot be determined. Instead, only
the age of an individual at the tiille of each ring formation can be
calculated by comparison of the ring location on the tooth crown
with standardized charts of dental develJpment (GJodman, Armelagos
and Rose 1980).
For each skeletal series, all undamaged permanent incisors and
canines were examined u~der a lOx magnification microscope. Each
tooth was scored for three levels of dental hypoplasia severity, and
the age when stress occurred was recorded. Positive cases of enamel
hypoplasia were noted only in those instances where l esions were

observed on two or more teeth in the dentition from an individual
bur ial .
173
The general hypothesis that guides this study of enamel
hypoplasia is that there should be a general increase in its
~ccurrence from the late prehistoric to the contact period, given
the general increase in the amount and severity of the stress to
which the late protohistoric/contact period p::>pulations were
subjected. A corollary of this is that the age at which the
earliest onset of enamel hypoplasia appears in an individual should
increase in the late protohistoric/contact period population over
that noted for an individual from a late prehistoric/early
protohistoric population. This corollary derives from the
discussion of r- and K- selection initiated in Chapter IV of this
study. To summarize this argument, there should be more parental
investment in caring for individual offspring during the high-stress
contact perioj over that given offspring from the l~wer stress
earlier periods. This would translate to mean that delayed weaning
would occur a~ong the late protohistoric/contact period burial
samples , resulting in a delay in the formation of the earliest
enamel hypoplasia tooth rings over that identified for the
prehistoric/early protohistoric samples. Weaning would certainly be
a period of stress common to infants and young children of both
periods, and probably the earliest ordinary stress affecting this
segment of any population of any period.
Examination of the teeth from the four burial samples shows
that ove r 55% of each is affected by enaillel hypoplasia. At the
Shannon site , 56. 7% (n=55) of the sample exhibits episodes of

174
general stress, with dental hypoplasia r e presenting 16. 5% of the
total pathologies present. For the Wall site, 75% (n=6) of the
sample is afflicted by the pathology and 23% of the total nu~ber of
pathologies are dental hypoplasia. The two late
protohistoric/contact period sites, Upper Saratown-Locality 2 and
the Fredricks site, show occurrence rates of 62 . 2% (n=56) and 85%
(n=ll) respectively for each sample. Also, in both cases enamel
hypoplasia comprises a large proportion of the total number of
pathologies present, 27 .0% for Upper Saratown-Locality 2 and 20. 7%
for the Fredricks site.
Comparing the two sites that have the best samples , the Shannon
site and Upper Saratown-Locality 2 , both the percentage of the
population affected and the percentage incidence of dental
hypoplasia increase through time from the late prehistoric to the
late protohistoric/contact period. When the two sites with poorer
sa~ples are co~pared to each other, the saille pattern is found.
Therefore, the first portion of the original hypothesis concerning
the increase in general stress, and thus dental hypoplasia, through
time is tentatively supported.
The corollary of this hypothesis that there will be an increase
through time in the age at which dental hypoplasia first appears is
also supported. Only the burial samples from the Shannon site and
Upper Saratown-Locality 2 were us e d in this analysis , the other two
samples being woefully inadequate. The mean age calculated for the
the occurrence of hypoplasia l esions at the Shannon site is 3.9
years , and at Upp2r Saratown-Locality 2 it is 4. 4 years . This
slight increase in the mean age of hypoplasia rings at Upper
175
Saratown-Locality 2 is taken to indicate that weaning may have been
delayed in this late protohistoric/early contact period site beyond
the age at which weaning occurred at late prehistoric period sites.
In addition to documenting the incidence of this pathology in
the the Shannon site and Upper Saratown-Locality 2 samples , the
severity of each case of enamel hypoplasia canals:) be determined.
Of the 44 individuals at the Shannon s 'ite with enamel hypoplasia ,
70. 5% (n=31) displ ay lesions that can be classified ~s mild, 15. 9%
(n=7 ) mild to moderate lesions, and 13. 6% (n=6) moderate lesions.
N.:) examples of severe lesions are present in the Shannon site
sample. In the late protohistoric/contact period Upper Saratown
Locality 2 burial sample , where 56 individuals evidence enamel
hypoplasia , 50% (n=28) have mild lesions, 15. 8% (n=9) have mild to
moderate lesions, and 34. 2% (n=19) have moderate lesions. As with
the Shannon site , no instances of severe lesions are present in the
Upper Saratown-Locality 2 sample. Comparing the percentages for the
t wo sites shows that there is a general increase in the late
protohistoric/contact period Upper Saratown-Locality 2 sample in the
lesions that can be classified as moderate in some manner , 50% to
29.5% for the late prehistoric Shannon site sample. This increase
in the percentage of the buria l sample exhibiting the more severe
moderate dental hypoplasia lesions probably reflects the more
stressful e nvironment that characterized the contact period.
Factors contributing to this increase may include weaning as a child
from a protein-rich diet to :)ne less able to meet the physiological
n2eds of t h e individual , and greater exposure to e nvironment al
pathogens , particularly European introduced diseases like influenza
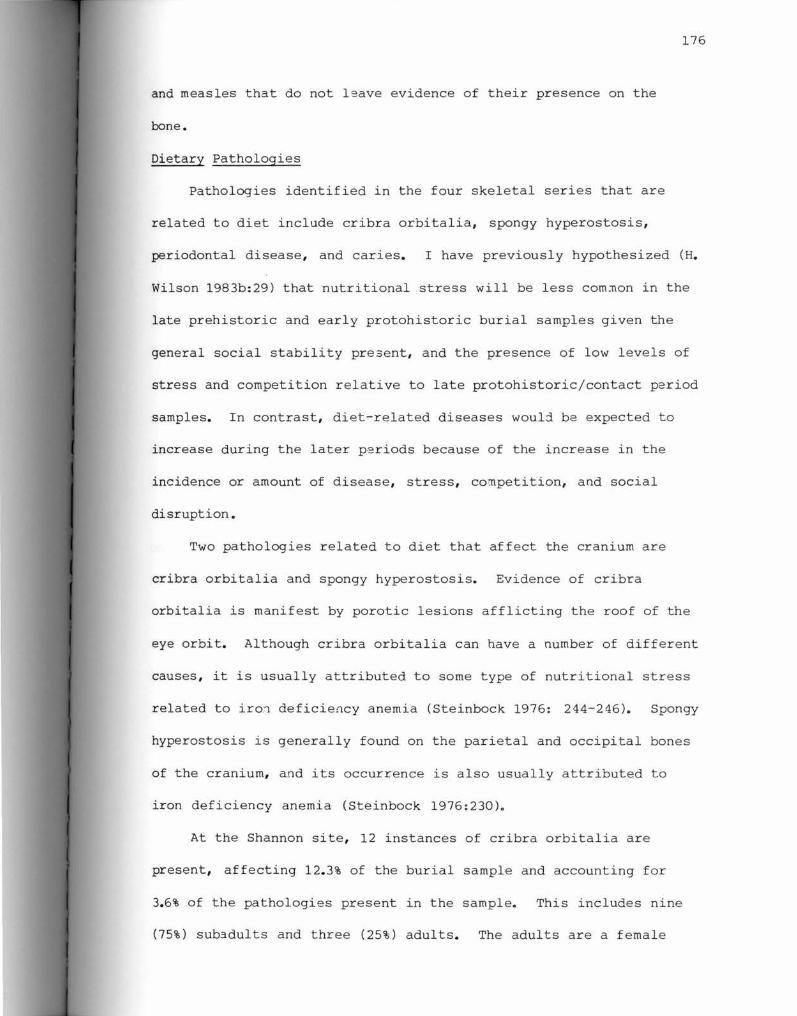
and measles that do not l:ave evidence of their presence on the
bone.
Dietary Pathologies
176
Pathologies identified in the four skeletal series that are
related to diet include cribra orbitalia, spongy hyperostosis,
periodontal disease, and caries. I have previously hypothesized (H.
Wilson 1983b:29) that nutritional stress will be less com~on in the
late prehistoric and early protohistoric burial samples given the
general social stability present, and the presence of low levels of
stress and competition relative to late protohistoric/contact period
samples. In contrast, diet-related diseases woulj be expected to
increase during the later periods because of the increase in the
incidence or amount of disease, stress, coillpetition, and social
disruption.
Two pathologies related to diet that affect the cranium are
cribra orbitalia and spongy hyperostosis. Evidence of cribra
orbitalia is manifest by porotic lesions afflicting the roof of the
eye orbit. Although cribra orbitalia can have a number of different
causes, it is usually attributed to some type of nutritional stress
related to iro~ deficiency anemia (Steinbock 1976: 244-246). Spongy
hyperostosis is generally found on the parietal and occipital bones
of the cranium, and its occurrence is also usually attributed to
iron deficiency anemia (Steinbock 1976:230).
At the Shannon site, 12 instances of cribra orbitalia are
present, affecting 12.3% of the burial sample and accounting for
3. 6% of the pathologies present in the sample. This includes nine
(75%) sub3dults and three (25%) adults. The adults are a female

177
aged 30 to 35 years, a male aged 20 to 25 years and a second male
aged 30 to 35 years . No evidence of spongy hyperostosis is present
in this skeletal series.
For the Wall site , cribra orbitalia afflicts only two
individuals in the burial sample , a subadult and a male aged 16 to
20 years . Also, one subadult is affected by spongy hyperostosis.
Cribra orbitalia and spongy hyperostosis are present on 25% and
12.5% of the Wall site sample respectively, and account for only
7. 6% and 3. 8% of the total pathologies at the site respectively.
In the burial sample at Upper Saratown-Locality 2, only five
individuals, r epresenting 5. 5% of the sample , evidence cribra
orbitalia. This pathology comprises only 2. 4% of the total number
of pathologies present at the site. Four of the individuals are
subadults, and one is an adult female aged 30 to 35 years . Also,
one subadul t , 1 .1% of the sample , is afflicted with spongy
hyperostosis, which totals 0.48% of the total pathologies.
The contact period Fredricks site skeletal series h~s 40% (n=4)
of its m2mbers affected by cribra orbitalia, which accounts for 7.5%
of the total pathologies present at the site. Of these four
individuals, three are subadults and one is an unsexed adult aged 20
to 25 years . One male aged 35 to 40 years, or 7.7% of the sample ,
has spongy hyperostosis . This single occurrence represents 1.9% of
the total pathologies identified for the sample.
Comparing the percentage occurrence of the anemia-related
pathologies of cribra orbitalia and spongy hyperostosis at the late
pr ehistoric Shannon site with that at the late protohistoric/early
contact period Upper Saratown-Locality 2 , it appears that more

178
individuals at the late prehistoric site are affected than at the
later site. This runs contrary to the trend expected from the
hypothesis stated ~t the beginning of this section. It may be that
there is an increase in the animal protein available at the later
Upper Saratown-Loca lity 2 site over that present at the Shannon
site , a trend tentatively confirmed by the results of the trace
element analyses conducted in Chapter V. This increase would have
bee n the result of the increased hunting being done by the Upper
Saratown-Locality 2 population to procure furs and skins for trade
with the EurJpeans. This increased hunting activity would
presumably have resulted in m,Jre meat being present as a protein
resource. Also, the delayed weaning that may have characterized the
burial sample at Upper Saratown-Locality 2 might have contributed to
the low incidence of -0nemia-related pathologies at this late
protohistoric/early contact period site .
Comparing the information from the middle contact period
Fr edricks site with that from the Shannon site , the Wall site , and
Upper Saratown-Locality 2, there is an increase in the percentage of
the burial sample affected by anemia-related pathologies , and
anemia-re l ated pathologies comprise a greater percentage of the
total number of pathologies present. Although the samples at the
Wal l site and the Fredricks site are too small to support any but
the most general of conclusions, the expected general pattern of
increas2 over time given in the original hypothesis is supported.
The anomaly that is Upper Saratown- Locality 2 appears to reflect a
population that dates to the late protohistoric/early contact period
during a lull in the occurrence of epidemics of European introduced

179
di s eases , and is a time before the dramatic increase in warfare that
characterized t~e Piedmont in the late seventeenth and early
eighteenth centuries. Certainly the presumed 1700 Occaneechi
oc cupation at the Fredricks site is a time of extensive warfare (J.
Wilson 1983), and of a known outbreak of smallpox from 1696 to 1699
(Dobyns 1983:15 ; Lawson 1967 : 231-232) . Also , by 1700 the Piedmont
I ndian grou ps had a greatly diminished role in t h e European fur and
skin trade , which may have resulted in a decreased access by the
population resident at the Fredricks site to animal protein. All of
t hese factors woulj have contributed to more str ess at the Fredricks
s i te , and possibly to an increased incidence in anemia-related
pat hologies in the population.
The other two pathologies that can be related to diet are
caries and periodontal disease , which affect the teeth and jaw of an
i ndividual. The dentition of an Indian was subject to a number of
stresses above those usually associated with eating. Teeth were
commonly used as tools in the working of rawhide , the manu facture of
thongs , and sewing (cf. Grah~m 1973) . For the era under
consideration in this study , the late contact period (and to a
lesser extent the protohistoric period) is characterized by the
i ntroduction of a whole array of European goods and foods that
helped change th2 existing Native American lifestyles. Two of these
new European foods , the peach (Gremi l lion 1987 : 269 ; Lawson 1967 : 115-
116) and rum (Lawson 1967 : 232-233) , would have contributed to a
dr amatic increase in the amount of sugar in the diet of late
protohistoric/contact period populations over that present in late
pr ehistoric or early protohistoric period populat ions. It is
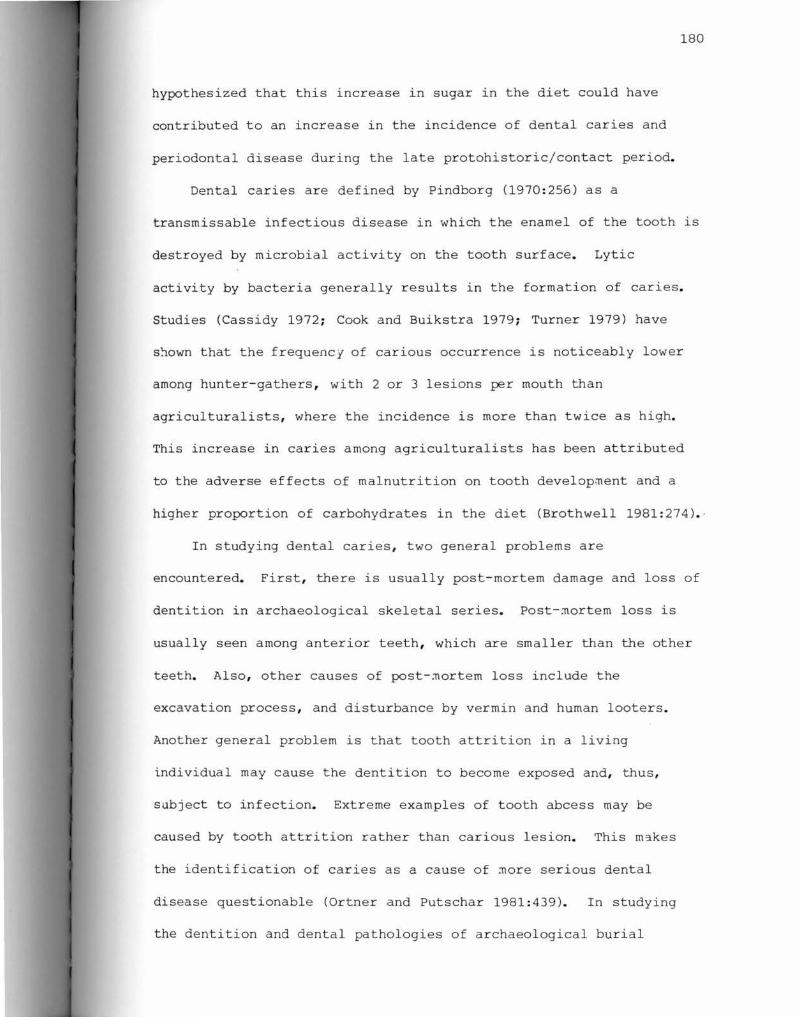
hypothesized that this increase in sugar in the diet could have
contributed to an increase in the incidence of dental caries and
periodontal disease during the late protohistoric/contact period.
180
Dental caries are defined by Pindborg (1970 : 256) as a
transmissable infectious disease in which the enamel of the tooth is
destroye d by microbial activity on the tooth surface. Lytic
activity by bacteria generally results in the formation of caries.
Studies (Cassidy 1972; Cook and Buikstra 1979 ; Turner 1979) have
s~own that the frequency of carious occurrence is noticeably lower
among hunter-gathers , with 2 or 3 lesions per mouth than
agriculturalists, where the incidence is more than twice as high.
This increase in caries among agriculturalists has been a t tributed
to the adverse effects of malnutrition on tooth develop~ent and a
higher proportion of carbohydrates in the diet (Brothwell 1981:274) . ·
In studying dental caries, two general problems are
encountered. First , there is usually post-mortem damage and loss of
dentition in archaeological skeletal s eries. Post-~ortem loss is
usually seen among anterior teeth , which are smaller than the other
teeth. Also , other causes of post-~ortem loss include the
excavation process , and disturbance by vermin and human looters .
Another general problem is that tooth attrition in a living
individual may cause the dentition to become exposed and, thus,
subject to infection. Extreme examples of tooth abcess may be
caused by tooth attrition rather than carious lesion. This m~kes
the identification of caries as a cause of ~ore serious dental
disease questionable (Ortner and Putschar 1981 : 439) . In studying
the dentition and dental pathologies of archaeological burial

181
samples, the potential difficulties posed by these two problems have
to be considered and allowances made for the effects of these
difficulties.
The most obvious manifestation of the problem of post-mortem
tooth loss is found at Upper Saratown-Locality 2, where relic
hunters have disturbed a number of the burials included in the
sample. Although all burials were examined for the presence and
absence of dental caries, only the dentition of undisturbed burials
were assayed as to the degree each was afflicted by caries to
control for the problem of postmortem tooth loss. At each site, the
nu~ber of teeth were inventoried for each burial, the number of
caries for each individual was noted, and the number of teeth with
caries was recorded.
· At the Shannon site, 73.2% (n=71) of the burial sample has
carious lesions, which co~prises 21.2% of the total pathologies at
the site. The Wall site sample has caries in 62.5% (n=5) of its
members, which accounts for 19.2% of the site's total pathologies.
In the Upper Saratown-Locality 2 burial sample, 71.1% (n=64) of the
sample has caries, which totals 31% of the total pathologies
present. In the Fredricks site sample, 85% (n=ll) have caries, and
this disease accounts for 20.7% of the site's total pathologies.
Comparing the prehistoric Shannon site and the late
protohistoric/early contact period burial sample from Upper
Saratown-Locality 2, there appears to be little difference in the
percentage of the sample afflicted by dental caries. However, there
is an increase of 10 percentage points from the Shannon site to
Upper Saratown-Locality 2 in the portion of the total pathologies
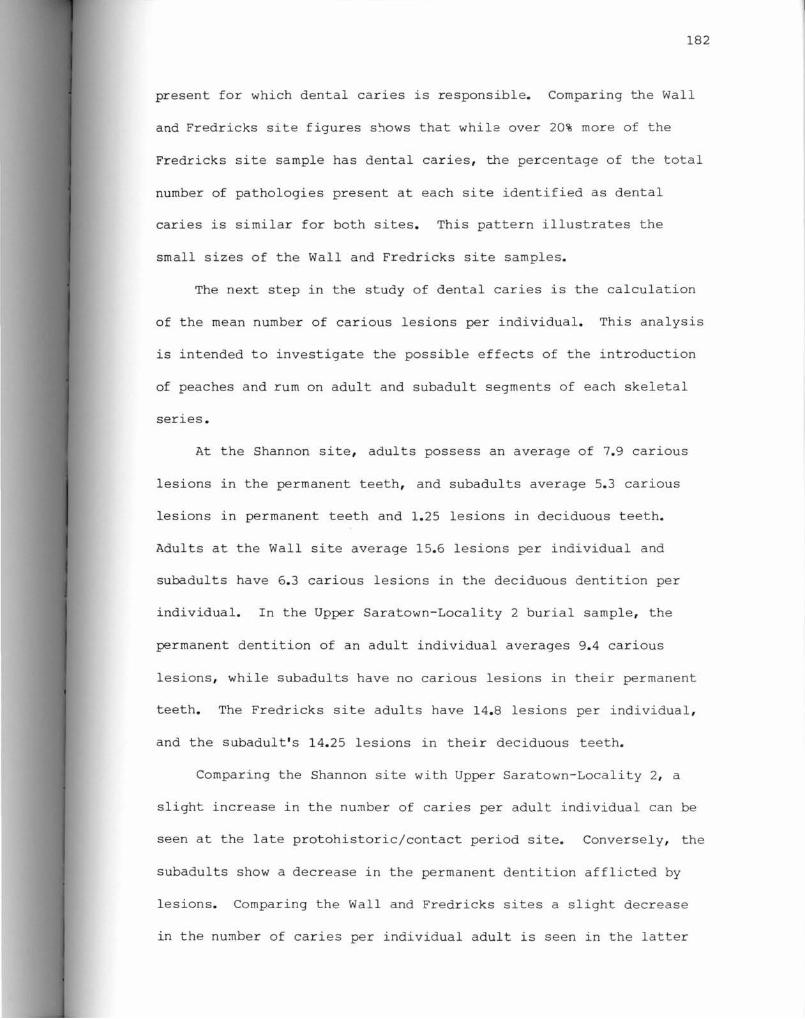
182
present for which dental caries is responsible. Comparing the Wall
and Fredricks site figures s~ows that while over 20% more of the
Fredricks site sample has dental caries , the percentage of the total
number of pathologies present at each site identified as dental
caries is similar for both sites. This pattern illustrates the
small sizes of the Wall and Fredricks site samples.
The next step in the study of dental caries is the calculation
of the mean number of carious l esions per individual. This analysis
i s intended to investigate the possible effects of the introduction
of peaches and rum on adult and subadult segments of each skeletal
series .
At the Shannon site, adults possess an average of 7. 9 carious
lesions in the permanent teeth, and s ubadults average 5.3 carious
lesions in permanent teeth and 1.25 lesions in deciduous teeth.
Adults at the Wall site average 15. 6 lesions per individual and
subadults have 6 . 3 carious lesions in the deciduous dentition per
individual. In the Upper Saratown-Locality 2 burial sample , the
permanent dentition of an adult individual averages 9.4 carious
lesions, while subadults have no carious lesions in their permanent
teeth. The Fredricks site adults have 14.8 lesions per individual ,
and the subadult's 14.25 lesions in their deciduous teeth.
Comparing the Shannon site with Upper Saratown-Locality 2, a
slight increase in the nu~ber of caries per adult individual can be
seen at the late protohistoric/contact period site. Conversely, the
subadults show a decrease in the permanent dentition afflicted by
lesions. Comparing the Wall and Fredricks sites a slight decrease
in the number of caries per individual adult is seen in the latter

183
contact period sample. For the subadult deciduous dentition at
these two sites, there are almost as many lesions per individual at
the later Fredricks site as at the Wall site.
The relatively small increase of 1.5 carious lesion per adult
individual from the Shannon site to the Upper Saratown-Locality 2
sample suggests that European introduced foods may have had some,
but almost an inconsequential , effect on the incidence of dental
caries. This may reflect sa~ple bias jue to the nu~ber of burials
from Uppe r Saratown-Locality 2 that had to be excluded from the
study because of relic hunter disturbance. However , the results of
the Shannon Site and Upper Saratown-Locality 2 comparison may be
indicative of the earlier date in the contact period of the Upper
Saratown-Locality 2 sample, before intense and continued interaction
with the European, primarily British, traders which resulted in the
widespread availability of rum. Also, the delay in weaning at the
late protohistoric/early contact period Upper Saratown-Locality 2
may contribute to the decreased incidence of caries in the
subadults. Sample bias is certainly skewing the results when the
Wall and Fredricks sites are considered, which limits further
discussion of the comparison of the two samples.
The othe r pathology that can be linked to diet is periodontal
diseases, which involves an inflammatory response to one or more
conditions. Generally , the alveolar bone is resorbed when
periodontal disease develops , and severe degrees of this pathology
can cause tooth loosening and eventual loss of dentition. Various
factors that contribute to alveolar resorption include poor hygiene,
calculus, dental attrition , and lowered tissue stability due to a

184
poor diet (Brothwell 1981:154). Each individual burial at each site
was examined for the presence of periodontal disease. The severity
of the disease in each case was rated with "1" indicating only a
slight case of the disease, "2" a medium onset , and "3" a severe or
considerabl e case.
Periodontal disease is present in all four burial samples. In
the Shannon site sample , 62 . 9% (n=61) of the individuals exhibit
some instance of periodontal disease , which comprises 18.3% of the
total number of instances of all diseases at the site. The average
severi ty for adults is 1.8 , or slight to medium. A total of three
individuals , 37.5% of the sample, at the Wall site have periodontal
disease, with an average severity of 2.3, medium to considerable.
Periodontal disease comprises 11.5% of the total number of instances
of all pathologies in the sample. At Upper Saratown-Locality 2,
38.9% (n=35) of the sample have periodontal disease, with an average
rating of 1.7, or slight to medium. Periodontal disease accounts
for 16.9% of the total number of instances of all pathologies at
this site. Finally, 46% (n=6 ) of the Fredricks site sample have
some instance of periodontal disease , and an average of 2. 3 , medium
to considerable. Periodontal diseases comprise 20 . 7% of the total
number of instances of all diseases at the Fredricks site.
Comparison of the prehistoric period Shannon site sample with
the l ate protohistoric/early contact Upper Saratown-Locality 2
sample shows that although more individuals were afflicted with
periodontal disease at the Shannon site, the percentage of the total
pathologies that periodontal disease co mpri se is similar. Also, the
average severity rating of periodontal disease is similar for both

185
sites. However, because there are m8re older individuals at the
Shannon site than at Upper Saratown-Locality 2, there are more
younger individuals at the later site that are afflicted with this
disease. A similar trend of periodontal disease affecting younger
individuals at the later contact period sites can also be discerned
when less representative samples from the Wall and Fredricks sites
are compared. Again, the average severities of the periodontal
disease present in the Wall and Fredricks site burial samples
resemble each other, medium to considerable in this case.
All four types of dietary pathologies considered in this
study--cribra orbitalia, spongy hyperostosis, dental caries, and
periodontal disease--are found in each of the samples. When
comparing the larger and more representative samples from the late
prehistoric Shannon site and the late protohistoric/early contact
period Upper Saratown-Locality 2, there is a decrease in the number
of individuals affected by anemia-related diseases (cribra orbitalia
and spongy hyperostosis), periodontal disease, and caries at the
later site. It is possible that the unexpected decrease in anemia
related diseases is due to an increase in the zinc available to the
Upper Saratown-Locality 2 burial sample as a result of more animal
protein being present in the diet. This would be due to increased
amounts of meat being available as a direct result of increased
hunting designed to acquire furs and skins for trade with the
Europeans. The decrease in the incidence of periodontal disease and
dental caries from the late prehistoric to the historic period
sample is also not expected. It may be that the increased animal
protein present in the diet of the late protohistoric/early contact

period Upper Saratown-Locality 2 burial sample may contribute to
this unexpected decrease.
186
When the two unrepresentative samples from the late
prehistoric/early protohistoric period Wall site and the middle
contact period Fredricks site are compared, there are slight to
moderate increases in the incidence of anemia-related pathologies,
dental caries , and periodontal disease. Unfortunately, this support
for the original hypotheses expecting general increases in these
pathologies through time that were set forth originally is not
valid, given the small size of the burial samples available for
study from the Wall and Fredricks site.
Considering the overall results of this analysis of diet
related pathologies, two general observations can be made. The
decreases noted in the- incidence of anemia-related diseases between
the two good burial samples from the Shannon site and Upper
Saratown-Locality 2 might be indicative of one of the following
situations. The sample at Upper Saratown-Locality 2 dates to a time
in the contact period before A. O. 1676, when interaction with the
British traders became more intense and prolonged. This era would
have been one where there was less stress from the competition in
the form of warfare and hunting pressures that characterized the
later contact period after 1676. Also, this earlier late
protohistoric/early contact period would have a lessened likelihood
that European diseases would afflict the Piedmont Indians , given the
lessened interaction with Europeans and other Indians that would
have occurred. Conversely, the unexplained divergences from the
original hypotheses could indicate that the Indian groups being

187
compared, already defined as being representative of larger Northern
and Southern Siouan groups, may be less closely related than
previously thought. This line of reasoning is based on the
supposition that populations with differing sociocultural structures
would react to anj be affected by contact in differing manners.
This suspicion will be given a fuller consideration in the analyses
considered in Chapter VII of this study.
Osteitis
Osteitis is an inflammation of the bone caused by trauma,
infection or disease (Steinbock 1976:60). Because these three
conditions--trauma, infection, and disease--would be expected to
generally increase from the prehistoric period to the contact period
due to the presence of European diseases and increased stress and
competition, there should be an increase in the incidence of
osteitic lesions during this time also.
In the prehistoric Shannon site burial sample, 41.2% (n=40) of
the individuals show evidence of osteitis. This decreases to 37.5%
(n=3) in the Wall site sample. The late protohistoric/early contact
period burial sample at Upper Saratown-Locality 2 has the lowest
incidence of osteitis of the four samples 13.3% (n=12). Conversely,
the later contact p eriod burial sample from the Fredricks site has
the highest rate of osteitis, with 69% (n=9) of the individuals
being afflicted.
When the two biologically representative burial samples from
the Shannon site and Upper Saratown-Locality 2 are co~pared, the
dramatic decrease in the incidence of osteitis is directly counter
to the expected increase as set forth in the hypothesis at the

188
beginning of this section. Considering the data from the Wall and
Fredricks sites, the expected increase in the occurrence of osteitis
is documented but the sample bias present for these two populations
precludes the use of this information in this analysis.
Reasons for the divergence from the expected fall under the
following three general categories. The poorer preservation of the
skeletal material at Upper Saratown-Locality 2 might be masking the
true (and higher) incidence of osteitis in the sample. Also, the
samples from the Shannon site and Upper Saratown-Locality 2 being
compared might represent different groups with different
sociocultural organizations. Or the environment inhabited by the
Upper Saratown-Locality 2 Indians may have been more healthy overall
than that of the late prehistoric Shannon site inhabitants (and of
the Wall site and Fredricks site inhabitants). For now no one
actual explanation can be offered to explain the decrease in the
incidence of osteitis from the Shannon site burial sample to the
Upper Saratown-Locality 2 sample.
Summary of the Analysis of the Pathologies
The skeletal series from the four sites were examined for the
incidence of a number of pathologies to determine whether there was
a decrease through time from the late prehistoric to the contact
period in the overall health of the people. The middl e contact
period Fredricks site appears to be the least healthy of the four
samples. The time between A.O. 1680 and 1710, when the Fredricks
site was apparently occupied by the Occaneechi Indians, was a period
of intense stress among the Indians of the Southeastern United

189
States. This heightened stress load derived from the numerous
epidemics of European-introduced diseases documented in the historic
record (cf. Dobyns 1983), and the increased warfare and conflict
between Indian groups and between Indian groups and Europeans (cf.
Lawson 1967; Swanton 1946; J. Wilson 1983). Unfortunately, the
small size of the Fredricks site burial sample prevents any
observation based on the site ' s data from being more than a general
observation that can confirm general patterns derived from the
investigation of more representative populations.
The Wall site skeletal series is also not adequate as a
biologically representative sample. The site dates to A.O. 1545
(Dickens et al . 1987:6), based on a radiocarbon assay, which is the
end of the late prehistoric period and the beginn ing of the early
protohistoric period. The burial sample at· the Wall site is
generally more healthy than that of the Fredricks site , but not as
healthy as the late prehistoric Shannon site or the Upper Saratown
Locality 2 samples. Thus , the information derived from the Wall
site can be used only to corroborate general trends derived from the
study of representative burial samples.
Comparison of the late prehistoric Shannon site and the late
protohistoric/early contact period Upper Saratown-Locality 2 samples
shows that there is a decrease from early to late in the percentage
of all pathologies except for e namel hypoplasia and dental caries.
At the Shannon site , 43 . 1% of the total pathologies are diet
related, and 50. 34% of all pathologies at Upper Saratown-Locality 2
are diet-rel ated. This increase is represented primarily by dental
caries , with there being an increase in caries per adult individual

190
in the Upper Saratown-Locality 2 skeletal series. This may indicate
that the introduction of such European foods as the peach and
watermelon, the remains of which have been found in the
archaeological collection from Upper Saratown-Locality 2 (J. Wilson
1977), and to a lesser extent rum, may have had a detrimental effect
on the late protohistoric/early contact period adult population.
Conversely, because of the increased percentage of occurrences
of diet-related pathologies, for which dental caries is primarily
responsible, there is a decrease in the percentage incidence of the
other pathologies from the late prehistoric period Shannon site
sample to the late protohistoric/early contact period Upper
Saratown-Locality 2 sample. Overall then, the late
protohistoric/early contact period sample at Upper Saratown-Locality
2 is in many ways more healthy than the earlier sample. This is not
the expected outcome, given the hypotheses proposed for the study of
the pathologies in this section, nor given the generally accepted
view of the contact period being a time of intense stress (cf.
Dobyns 1983).
Perhaps the results obtained in this study of pathologies is
biased by the relatively poor preservation of the skeletal material
from Upper Saratown-Localtiy 2, which prevents a more detailed
examination of the bone remains. Other factors have also been
alluded to earlier in this chapter, including the questions of
whether there are differences in the sociocultural organization of
the study populations not previously recognized, and whether the
Upper Saratown-Locality 2 site dates to the earlier portion of the
contact period before the onset of intense and prolonged interaction

191
between the Indians of the Piedmont and the British populations of
the coastal regions. These questions will be addressed in more
depth in the analysis of grave associations in Chapter VII that
immediatel y follows.
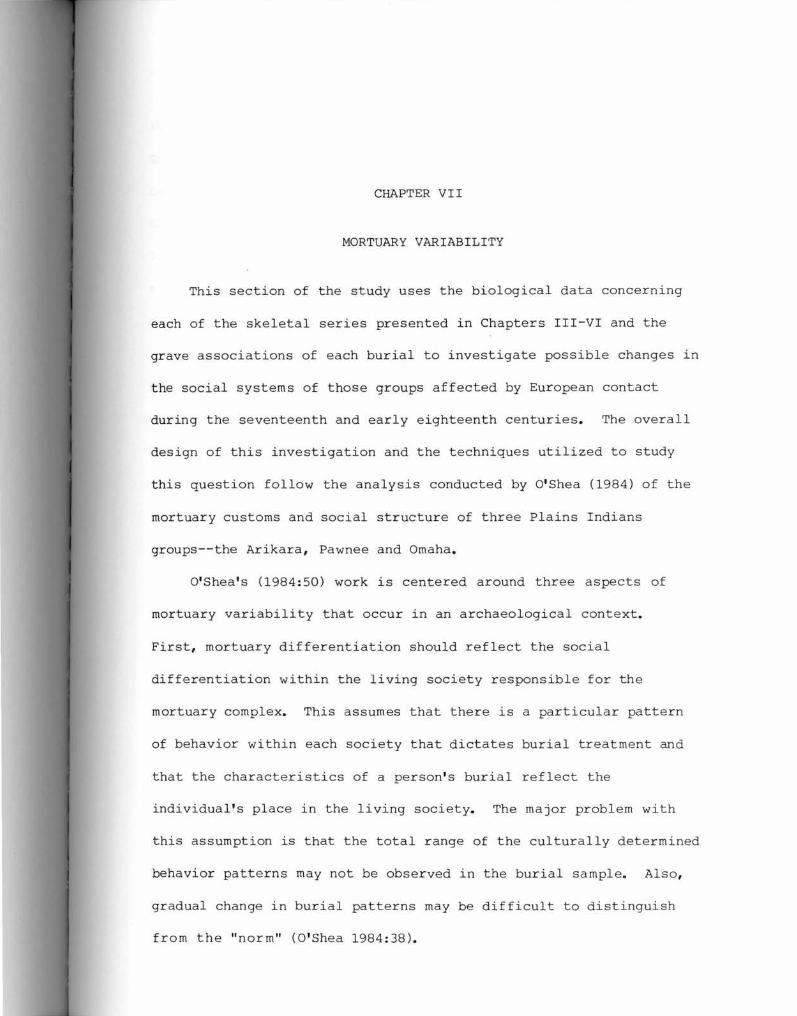
CHAPTER VII
MORTUARY VARIABILITY
This section of the study uses the biological data concerning
each of the skeletal series presented in Chapters III-VI and the
grave associations of each burial to investigate possible changes in
the social systems of those groups affected by European contact
during the seventeenth and early eighteenth centuries. The overall
design of this investigation and the techniques utilized to study
this question follow the analysis conducted by O'Shea (1984) of the
mortuary customs and social structure of three Plains Indians
groups--the Arikara, Pawnee and Omaha.
O'Shea's (1984:50) work is centered around three aspects of
mortuary variability that occur in an archaeological context.
First, mortuary differentiation should reflect the social
differentiation within the living society responsible for the
mortuary complex. This assumes that there is a particular pattern
of behavior within each society that dictates burial treatme nt and
that the characteristics of a person's burial reflect the
individual's place in the living society. The major problem with
this assumption is that the total range of the culturally determine d
behavior patterns may not be observed in the burial sample. Also,
gradual change in burial patterns may be difficult to distinguish
from the "norm" (O'Shea 1984:38).

193
The second aspect of the study of mortuary variability involves
identifying changes in the funerary treatment that coincided with
European contact. Here emphasis will be placed on the differences
between the mortuary complexes identified at the Shannon site (of
the late prehistoric period) and Upper Saratown-Locality 2, the
latter being assumed to have been in contact with Europeans (Dickens
et al. 1987:5). These two sites also possess the only biological
representative sample available for comparison in this study.
The third level of this inquiry is to determine the possible
ethnic affiliations of the samples. Both archaeological and
ethnohistorical data will be used to refine the currently defined
historic geography of the Virginia and North Carolina Piedmont.
Method and Theory
Numerous studies of funerary patterns have been attempted over
the years in an effort to delineate the patterns of social
organization that characterized extinct societies resident at
archaeological sites. The most common type of such studies are
those that look at social differentiation among individuals at
single sites. Classic examples of this kind of study include work
by Brown (1971), Gruber (1971) , Peebles and Kus (1977), Rothschild
(1979), Saxe (1971), and Tainter (1973 ). These studies incorporate
a varied array of investigative techniques and stress the importance
of funerary data to the study of archaeological sites (O'Shea
1984:2).
Other studies focus more on the social system represented by a
collection of sites rather than single sites. These studies include

194
Brown (1974), Hatch (1976), Larson (1971), Peebles (1971), and
Tainter (1977). Social organization and social complexity are the
focus of these studies, which use a variety of archaeological
contexts to investigate their propositions (O'Shea 1984:2).
Despite the rather large number of studies that have been done
in the past, a comprehensive archaeological theory of mortuary
variability and a comprehensive methodology designed to study
mortuary variability has yet to be defined. O'Shea (1984:21-22)
criticizes the current body of general archaeological theory on
these grounds, and notes that mortuary studies have uncovered a
number of behavioral correlates which integrate social organization
with mortuary treatment. These studies provide numerous hypotheses
that attempt to predict correlation between behavior, social
organization, and mortuary treatment. According to O'Shea
(1984:22), these studies fail to address the process of
archaeological context formation and the constraints which are
necessary for the transformation of the mortuary complex to an
archaeological context to occur.
O'Shea (1984) follows the lead of Binford and Bertram (1977:77)
in advocating the need to link past cultural behavior to
archaeological remains. Three basic relationships which enable this
correlation between past cultural behavior and present
archaeological observation are defined by O'Shea (1984:23): 1) the
amount of patterning and/or structure in a society' s mortuary
behavior; 2) the formation processes of mortuary practices that are
observable by archaeologists; and 3) the limitations and problems
presen t in the detection and recognition of variability within the

195
archaeological record. Each of these relationships is important in
understanding the funerary remains in an archaeological context.
Archaeological Burial Patterns and Social Organization
As noted earlier , a number of investigators have attempted to
understand social organization and social structure through the
analysis of mortuary data . Both single-site and multi-site
investigations have been done. The results of a select sample of
each type of study will be examined before proceeding with the
analytical strategy used in this work.
James Hatch (1975) analyzed the artifact and grave associations
of mound burials at late prehistoric Dallas phase sites in
Tennessee. Hatch (1975:134) suggested that status was ascribed in
Dallas society because "high status artifacts" were found with both
sexes of all ages . He then compared the stature of the individuals
interred in the mounds with those found in village cemeteries to
test his hypothesis that "among adults the average stature should be
greater for high status individuals as compared to low status
individuals." (Hatch 1975:136). Low-status individuals were defined
as those not buried in a mound. The rationale behind Hatch ' s
argument was that individuals with ascribed status were taller
because they were not subjected to nutritional stresses during
childhood. An alternative expl anation was that such individuals, if
taller, may have been genetically taller individuals who were chosen
as leaders (Hatch 1975:136) . Hatch found a significant difference
in stature between males interred in mounds and those in village
cemeteries . The differences between the females from both areas

were not significant. Further investigation by Hatch (1975:136)
showed that stature measurements within the sex groups from the
mound were homogeneous, while that for the village were
heterogeneous.
196
Hatch and Geidel (1983) continued Hatch's initial research by
using trace element analysis to test whether certain individuals had
differential access to different foods, which resulted in the
differential height measurements noted in Dallas society. Among
subadults, significant differences between mound and village burials
were found for three mineral elements--strontium, manganese, and
vanadium. These elements would have been concentrated in the plant
foods consumed by the Dallas population. The mound burials had
lower levels of all three elements. This suggested that the
villagers possessed a .diet centered on maize. In contrast, the
individuals represented by the mound burials probably had a more
diffuse diet, or at least access to a wider variety, and possibly
greater amounts, of plant and animal foods.
A comparison of the adult male skeletal remains from the two
Dallas cemetery areas also reflected differential diets, as did the
subadult remains. Unlike these two groups, however, the adult
females showed no clear evidence of differential diets. It was
proposed that women in Dallas society shared a similar diet
regardless of their social position, and that their status was both
achieved (probably through marriage) and ascribed (Hatch and Geidel
1983 :59).
This 1983 study was taken by the authors (Hatch and Geidel
1983:59) to substantiate the results of Hatch's 1975 analysis of
197
stature where significant differences were noted between the males,
but not among the females, from the two Dallas cemetery areas. The
combination of these two analytical techniques--stature estimation
and trace element analysis--provided a definite step forward in the
study of status and, by inference, social organization.
Hatch's work followed Lewis Larson's (1971) study of the
skeletal remains from another "Mississ ippian" cere monial center ,
Mound Cat the Etowah site near Cartersville, Georgia. Social
stratification within the resident population at this site was
suggested by the burials in the mound being accompanied by goods
made of exotic and rare materials that were not found in the
associated village burials (Larson 1971:62-65). From the analysis
of the excavated data, Larson (1971:67) stated that a descent group
(which implies inherited status) was represented iri the mound
burials, and that within this group there was also internal ranking.
In 1981, Blakely and Beck used trace element analysis of
skeletal remains from Mound C and the Etowah village to investigate
the pattern of social stratification suggested by Larson. The
authors stated that if status was inherited, one might expect
members of a higher-status group to receive preferential treatment,
which would have included a higher nutritional standard. It was
noted that archaeological and ethnographic evidence from chiefdoms
in North America, Africa , and the Philippines all indicate d that
high-ranking individuals often consumed greater quantities of meat
within a more diffuse diet than those of subordinate ranks. For
their study, Blakely and Beck (1981:420) set out to test whether
skeletons representing the subordinate (village) class at Etowah
198
contained different concentrations of selected trace elements, which
in turn indicated a diet different from the higher-status mound
population.
Levels of zinc, copper, strontium, and magnesium in the
skeletal remains from the village area and Mound C were compared.
The results indicated that there were no significant differences
between the two samples. Blakely and Beck (1981:420) concluded that
although Etowah did constitute a socially stratified society, status
was probably achieved rather than ascribed. The implication was
that social organization at Etowah incorporated components of lx:>th
chiefdom and egalitarian societies, perhaps making the social
structure more adaptive (Blakely and Beck 1981:420). Although this
did not support Larson's initial hypothesis that a chiefdom level of
social organization existed at Etowah, it did define more
specifically the level (or levels) of social organization that
characterized the population as a whole. Unfortunately, the
conclusions that Blakely and Beck reached may be erroneous because
the comparison population sample from the village area at Etowah may
have included burials from a time period later than the Mound C
population (Roys. Dickens, Jr., personal communication, 1983).
A similar dual pattern of organization, where a combination of
ascribed and achieved status prevailed, has also been proposed for
the population at the King site in northwest Georgia (Funkhouser
1978:69). The King site is a protohistoric period Indian village
located on the Coosa River in Floyd County, just west of Etowah.
Although no mound is present at this site, the settlement plan
consists of a central plaza surrounded by an outer habitation area,
199
a defensive ditch, and a palisade that extends around the perimeter
of the site (Funkhouser 1978:20) .
The burial location was divided into two major areas, "public"
and "private". Public burials were characterized by the presence
solely of older adult males and children, and the total absence of
adult males under 30 years of age and of adult females. Burials in
the private sector were representative of the total population
(Funkhouser 1978:69). Funkhouser (1978:69) suggested that the
public burials represented a special class of individuals, perhaps
village leaders and their children. Furthermore, he suggested that
the over-30 age of these public adult males i;:erhaps indicated
achieved status, while the presence of children may have been due to
ascribed status (Funkhouser 1978:69).
·The works by Funkhouser (1978) and Blakely and Beck (1981) are
important contributions to the study of mortuary data because they
provide possible documentation for several levels of social
organization existing simultaneously in a society. All too often
archaeologists have identified social organization with one level of
an evolutionary typology such as tribe or chiefdom, depending on the
presence or absence of particular archaeological traits such as
mound s to make the identification. The underlying assumption that
supports this tendency is that attributes defining societal types
are so strongly associated with each other and so highly redundant
that the presence of one attribute , such as a temple mound, implies
the presence of all the other traits characteristic of particular
social types (Tainter 1978: 115 ). A "checklist" approach to the
evaluation of social organization in Neolithic Wessex, England, by

200
Renfrew (1973) indicated that characteristics associated with a
chiefdom as defined by Service (1962) and Sahlins (1968) had to be
inferred or otherwise documented. The archaeological evidence
itself simply did not exist for the majority of the characteristics.
Renfrew (1973:557) concluded that the chiefdom type of social
organization "will have to make way for, or be refined to yield
subtler and less inclusive concepts."
Tainter (1978:117) suggests that if the objective of the
archaeologist is to study social variation and change, then there
should be a concentrated effort to develop truly quantitative scales
for measuring social characteriestics. Tainter (1975a, 1975b, 1977)
applied such quantitative methods to the problem of Middle Woodland
to Late Woodland cultural change in west-central Illinois. Using an
information theory model, Tainter (1977 :85) found that the change in
the levels of social organization present during the Middle Woodland
to late Woodland periods in Illinois largely reflected
transformations in the nature of the resident social systems.
Another quantitative method known as formal analysis is used by
James A. Brown (1971) in his study of burials from Spiro, a
specialized Mississippian period site in eastern Oklahoma. Brown
(1971:95) set up a key diagram where three dimensions could be
examined for the domain of mortuary data . These three dimensions
included the characteristics associated with burial behavior (the
handling of the deceased), grave behavior (burial context) , and the
population profile (age and sex). Using this key Brown (1971:97-98)
identified 13 burial types within the Spiro mortuary complex. It
was possible to rank the burial types from those least used (high

rank) to those most used (low rank) (Brown 1971:99-100). Brown
(1971:102) concludes that the pyramid arrangement of burial types
and its inferred association with rank and order of status by
membership size, and the disproportinate access to valuable goods,
fulfills some of the requirements of an adaptive level of
organization that can be labelled "chiefdom".
201
Brown's model is important, as it presents a deductive
framework that exploits the potential mortuary data sets found in
each particular archaeological situation, and it is a systematic
approach that includes factors of the physical , social, and cultural
environment. There are, however, problems with using formal
analysis that Brown (1971:93-94) underscores in his article. A
major problem is that the initial key used to examine the mortuary
data will be very complicated, and one has to be selective in the
language used for description and analysis. Another problem, not
discussed by Brown, but relevant to all archaeological studies, is
the question of sample size. If the skeletal collection is too
small, then the key may not be efficiently used. It would be too
restricted and could not be used with other burial collections.
Having a representative sample is very important in establishing the
initial model.
The seven studies reviewed here focus on the inference of
social organization and status using mortuary data. Two works, by
Funkhouser (1978) and Blakely and Beck (1981), document the results
of studies conducted to test hypotheses concerning evolutionary
typologies of social organization. These latter two studies
indicate that a number of social patterns attributed to tribes and
202
chiefdoms may have co-existed temporally and spatially in certain
cultural systems. However, it is equally possible that the two
sites reflect different levels of chiefdoms with differing amounts
of complexity.
The two works by Tainter (1977) and Brown (1971) mark the
initial attempts to replace the limited qualitative methods or
checklist approach traditionally used to study status and mortuary
data archaeologically. Both of these works advocate the use of
quantitative methods to investigate social structure. Tainter's
information theory and Brown's formal analysis both provide
methodologies that could prove useful to the analysis of mortuary
behavior if used within a deductive framework.
This previous research has shown that _patterns associated with
the disposal of the dead in a living society can be documented.
O'Shea (1984:21) abstracts the following regularities (patterns)
that are basic to these and other mortuary studies.
1. Mortuary differentiation is patterned and its elements are integrated with other aspects of the sociocultural system.
2. The mortuary differentiation accorded an individual, although not necessarily isomorphic, is consistent with his social position in the living society.
3. The complexity of the system of mortuary differentiation will increase with the complexity of the society at large.
These regularities are fundamental to the study of funerary
practices of the past.
The second and third propositions listed by O'Shea are
questioned by Hodder (1982) who takes issue with the assumption that
an individual's social position in lif e is reflected by his/her
mortuary treatment. Instead, it is suggested that burial patterns

203
are meaningful transformations of social differentiation that do not
necessarily directly reflect social hierarchy. Hodder (1982:150)
states that most archaeological work on social hierarchies has been
concerned with social systems and not social structures. The social
system is considered to be patterns of "relationships and roles, the
communication and use of power, relations of dependence and
authority, the movement of resources and trade." (Hodder 1982:150).
Social systems have traditionally been described by archaeologists
in terms of complexity and adaptation and homeostasis. Subsystems
such as trade, hierarchy, and subsistence interact functionally to
form the social system. In contrast, the social structure is
comprised of the rules and concepts which give the social system
meaning. These rules and concepts, including ideologies and
symbol ic principles, are organized and continually changing in
relation to each other, hence the social structure is reorganized as
part of the changing relationships between groups and different
powers (Hodder 1980:150). In order to understand social systems ,
archaeologists must understand the socia l structures behind them
(Hodder 1982 :150).
Hodder (1982:152) states that burial ritual may be used as part
of an ideology that reflects aspects of a living society, although
the ideology of a society may e ntail "distorting, obscuring, hiding ,
or inventing particular forms of social relationships." Therefore ,
mortuary patterning must be understood as being specific to each
burial and ritual context. In order to understand the burial and
ritua l context within a society, models and generalizations
concerning burial ritual must be examined, and ethnographic studies

204
of burial ritual and belief must be studied (Hodder 1982:152). This
means that the symbolic and ideological basis behind mortuary
practices must be identified. Hodder (1982:152) also suggests that
because the archaeological social structure or ideology is unknown
the assumption cannot be made that a lack of P3-ttern in mortuary
practices reflects an egalitarian society because the context of the
mortuary ritual may be obscured.
Hodder's arguments and the problems that he sees with
identifying social differentiation or status using archaeological
burial data alone will have to be borne in mind as the following
study is presented. It is thought that the use of formal analysis
in this investigation of culture change will enable patterns to be
discerned which will at least distinguish similarities and
differences in mortuary treatment among the four study samples.
Archaeological Formation Processes
Schiffer (1976:27) defines formation processes as those
cultural materials which cease to function in the living culture and
become part of the archaeological record. It is important to
recognize these processes in order to organize the funerary r e mains
present in the archaeological record. Two major formation processes
can be identified (cf. Schiffer 1976), primary depostional processes
and post-depositional processes. Primary depositional processes
include objects that were interred from which cultural behavior can
theoretically be identified. Post-depositional processes are those
changes that objects have undergone after their interment (O'Shea
1984:24) .

205
Primary depositional processes are of three types--intentional,
coincidental, and accidental. Intentional depositions in a mortuary
complex are those cultural acts that are associated with formal
burial. These include the type of burial pit , placement of the body
in the pit, and objects purposely interred with the individual.
Coincidental mortuary depositions are those objects that are not a
primary focus of burial behavior, but are more or l ess a byproduct.
A.n example of coincidental deposition would be the burial of an
individual wearing his/her everyday clothing. The clothing may
decompose, but buttons or beads may be preserved in the
archaeological record. These buttons and beads were not interred
for symbolic reasons, but as a part of the everyday clothing worn by
the person. Accidental deposition includes midden debris deposited
in the grave pit when it is being backfilled, or a musket ball or
projectile point embedded in the individual . No symbo lic meaning or
patterning can be associated with accidental inclusions. However ,
information on the cause of death and about the general lifestyles
of the living society can be forwarded (O'Shea 1984:24).
One obvious problem with the identification of primary
depositions is determining when coincidental deposition is just that
and not intentional. One aspect of aboriginal clothing identified
archaeologically for the societies resident in the Piedmont of the
Carolinas and Virginia are shell and bone beads sewn on clothing (J.
Wilson 1983:378-385; Hammett 1987:16 7-183). Such artifacts , and
European glass beads are found in contact-period burials , apparently
having been originally sewn onto garments (Navey 1982; H. Wilson
1984). Although the presence of these items may be coincidental

206
according to O'Shea's definition, they may have had symbolic meaning
within the living society. This meaning could be determined if one
sex or a particular age group within the burial population possessed
certain combinations and patterns of beads. In this study,
therefore , clothing remnants--shell, bone and glass beads--will be
retained as an analytical unit in order to investigate such possible
age/sex associations.
Post-depositional processes, which generally serve to distort
relationships, also affect the archaeological record. An effort has
to be made to identify the range of such processes that are
exhibited by the archaeological samples that comprise each study
population. Post-depositional processes can be the result of
natural or cultural activities. Natural processes include
decomposition of organic material such as flesh, clothing, matting,
wood, and skins (O'Shea 1984:25). Thus, if matting is found
preserved in one burial, we cannot assume that it was not present in
other burials because differential preservation can occur between
burial areas at a site. Copper salts, found in artifacts such as
brass bells, also preserve organic material by retarding
decomposition due to microbial activity. The remains of such
fortuitously preserved items can be observed in the archaeological
record. In general, then, organic materials should not be included
in studies unless their preservation is not correlated with the
presence of artifacts composed of copper or some other preserving
agent. Otherwise, the differential occurrence of organic material
in a burial population might not reflect differences in its

207
occurrence in the living society, but the vagaries of preservation
and decomposition.
Cultural disturbances include activities of the living society
or a later society (O' Shea 1984 : 26). The activities of relic
hunters in recent times is a prime exampl e of a cultural disturbance
t hat is very destructive and that cau ses the removal of particular
gr ave associations from the archaeological record. An important
consideration in mortuary ana l yses, therefore, is whether a burial
has been disturbed by relic hunters (O' Shea 1984:26). This is just
one of the natural and cultural factors that can affect
ar chaeological contexts. The proper understanding and control of
the depositional processes that form the archaeological context and
the post - deposi t ional processes tha t c hange that context are
essential in any study of mortuary variability.
Problems in the Detection and Recognition of Mortuary Activities
In addition to considering the masking of mortuary activities
by depositional and post-depositional processes , the
representativeness of the burial sample and funerary treatments
also has to be assessed (O' Shea 1984 : 27) . The Shannon site burials
ar e all from test squares originally excavated to delineate the
palisade that originally surrounded the site. Very little of the
excavation at the site has been done within the village proper that
was enclosed by that palisade (see Figure 2) . The population
profile at the late prehistoric period Shannon site indicates that
a l l ages and both sexes are present (see Chapter III). Therefore ,
in spite of the spatial bias introduced by the excavation strategy

208
at the site, the sample is biologically representative. A
biologically representative sample is considered here to mean that
all age groups and both sexes are present in almost equal
proportions. However, not all social categories may be represented
by these burials.
The late protohistoric/early contact period Upper Saratown
Locality 2 skeletal series is also a biologically representative
sample with all age groups and both sexes being present. Burials
are located within the palisade at this site, and extensive
excavations have been conducted in both the palisade and the main
habitation areas of the site (see Figure 5). Again, not all sociel
categories may be represented in the sample.
Both sites have been subjected to the destructive activities of
relic hunters, Upper Saratown-Locality 2 more than the Shannon site.
In the analyses that follow, this factor has been recognized and
appropriate steps have been taken where necessary to insure that
this factor does not introduce any bias into this study. Also,
neither site has been completely excavated, so it is not possible at
this time to determine if the complete range of mortuary treatment
present in each society is represented archaeologically. This
problem is also applicable to the Wall site sample. Only a portion
of the inner palisade area has been excavated at this late
prehistoric/early protohistoric period site. Conversely, the
contact-period Fredricks site has been excavated almost completely,
with the majority of burials being located just outside the
palisade. It is possible that additional burials may be found
outside the village proper by futur e excavations at the Fredricks

209
site. Neither the Wall site nor the Fredricks site has a
biologically representative burial sample. Therefore, the Wall and
Fredricks site samples are primarily used in this study for
comparison with the findings derived from the analysis of the
representative burial samples from the Shannon site and Upper
Saratown-Locality 2.
Given the sample limitations and biases , and the depositional
and post-depositional processes that characterize the four skeletal
series, it must be emphasized that the findings of this study can
only be viewed as being preliminary at best. Future research on the
mortuary behavior of the Indian groups of the Piedmont may benefit
from this preliminary study. It is assumed here that this future
research will support some aspects of this study, and probably alter
others.
Research Framework
Archaeologists have traditionally ascribed two levels of
sociocultural integration to the prehistoric and contact period
aboriginal societies in the Southeast--tribes and chiefdoms (cf.
Swanton 1946; Hudson 1976). However , seldom are explanations
offered of how such l evels came into being. Service (1962:113-115)
notes that the reason for a tribe's existence is conflict,
interpreted in this study more broadly as competition, basically for
scarce resources . Tribes are defined as boundable systems of
relationships whose devices for connecting members are sodalities
(cross- cutting associations devoted to kinship affiliations) , age
grades , secret societies, and ritual congregations (Service
210
1962:111). The major institutions of social control are carried out
by roles and egalitarian statuses that have no governmental function
(Service 1962:111). Tribes are adaptive because they provide the
alliance and solidarity needed to cope with a certain level of
competition (Service 1962:12).
In contrast, chiefdoms are decidedly nonegalitarian, with a
"chief" having the ability to plan, organize, and deploy public
labor (Service 1962:150). Chiefdoms transcend tribes in two
respects (Service 1962:143). They represent a denser and usually
larger and more populous society made possible by greater
productivity. And they are more complex and more organized. Also,
redistribution by a central agent or agency is considered to be a
characteristic trait of chiefdoms (Service 1962:143). This form of
redistribution differs from that found in a tribe, where reciprocity
is most common.
For the late prehistoric Indian societies of the central and
northern Carolina Piedmont , traditionally associated with the Siouan
Hill Tribes (cf. Le wis 1951) , it is suggested that an egalitarian
system that perhaps can be equated with a tribal level of
organization is the primary form of sociocultural integration.
Status in such egalitarian societies would have been achieved by an
individual, and clan membership would be a primary cohesive social
institution. Essentially, there would be a relatively low level of
competition, and little need for a more complex social system.
With the arrival of European explorers, traders, and settlers ,
the cultural environment began to change drastically, with the
change being associated with the protohistoric and contact periods.

211
European-introduc ed diseases were very disruptive forces during
t hese periods (cf. Dobyns 1 983). Co~petition related to hunting
for the European skin and fur trade would have increased (cf.
Waselkov 1977 ; Gramly 1977) . Competition in the form of warfare
also escalated, as the prevalence of fortified villages (Gibson
1974:133) and the conflict between the northern Iroquois and the
Piedmont I ndians of the Carolinas and Virginia (cf. Lawson 1967 ; J.
Wilson 1 983) r eadi l y attests .
To meet these stresses and to insure the survival of the group
in this changing environment , a form of social organization more
complex than the egalitarian society that characterized the
pre h istori8 period may have been necessary. Also , with the
combining of depopulated vi l lages into aggregates during the
protohistoric and contact periods , a more complex level of
sociocultural integration may have been advantageous. With a more
complex social organization, the mortuary remains from contact
period sites in the Piedmont should show an increased incidence of
soci o technic artifacts and perhaps ref l ect inherited status.
The mountains of the Southern Applachians were home to
populations that possessed a level of organization that approached
that of a chiefdom (cf. Dickens 1976) . Service (1962:150-151)
states that aspects of higher-levels of social organization, such as
a chiefdom , are likely to occur among cultural systems such as
t ribes that are interacting with higher-level societies. This may
have been the case along the Wateree/Catawba River drainages of the
southern Carolina Piedmont where the local Siouan Indians , later
known as the Catawba , apparently came into contact with a true

212
chiefdom, represented by the Pee Dee Focus, which was expanding
northward from the Coastal Plain during the late prehistoric period
(H. Wilson 1983:38; J. Wilson 1983:572-573). It is not suggested
that the Siouan Indians of the Piedmont suddenly took on a chiefdom
level of social organization in the protohistoric period. It is
possible, however, that artifacts traditionally associated with
status in cultural systems of these two ecotones , the Coast and the
Mountains, may have been co-opted as indicators of status among the
Piedmont groups.
Also, it is suggested that some changes in the natural
environment of a cultural system would be indicated by change in the
technomic artifacts present, while a change in the social system
(and cultural environment) would be mirrored by changes in
sociotechnic items (Binford 1971:251). Technomic artifacts are
those artifacts which have their primary functional context in
coping directly with the physical environment, and include such
items as projectile points, hammerstones, bone awls, bone needles,
ceramic bowls, brass kettles, guns, lead shot, knives, scissors,
iron hoes, brass buttons, and metal spoons (Binford 1971:251; H.
Wilson 1983a:34-36). Sociotechnic artifacts are those artifacts
that have their primary functional context in the socio-cultural
system of a society, such as beads, gorgets, bells, and perhaps
brass rings (Binford 1971:251-252; H. Wilson 1983a:35-36). Thus it
could be argued that a change from few or no sociotechnic items in
the mortuary complex to an increased number of such items would
indicate a change from a lower level of sociocultural integration to
one more possibly complex. As we move from the protohistoric period

213
into the contact period, we would expect some of the traditional
aboriginal technomic and sociotechnic artifacts to be replaced by
European inspired counterparts, as well as new items. This would be
the result of increased interaction with the Europeans through the
skin and fur trade for such artifacts. It is also predicted that
fewer European technomic artifacts with new uses (cf. Brain 1979)
will have been adopted by the Indians of this period, as there is
little change in their r elationships with the natural environment.
The European technomic artifacts used by the contact period Indians
will continue to be utilized in a traditional manner, and may very
well not have completely replaced the aboriginal models. Thus, the
clustering of burial types from an early contact period Indian site
should exhibit a higher number of European sociotechnic artifacts
than European technomic and aboriginal sociotechnic artifacts. In a
later contact period site, more European than aboriginal technomic
items may be present.
Using statistical models, the presence of both achieved status
(characteristic of a relatively egalitarian society) and ascribed or
inherited status (characteristic of a stratified, and by
implication, a more complex society) in the archaeological record
can be investigated. For egalitarian societies, because status is
achieved, status symbols among such societies would not be
inherited. All ages and both sexes wil l be found in the burial
sample from archaeological sites with such a pattern. This implies
that cemeteries segregated by age and sex will be uncommon. If
different locations of burials (such as p ubli c versus private) do
occur, both sexes and all age groups will be represented in all
locations.
214
Saxe (1971) suggests that in egalitarian societies achieved
status will be indicated by age and sex differentials. Males will
probably have more or higher status than females of the same age
group. Older females will have more or higher status than younger
females . Also, for each sex, there will be differential status in
adult age groups. Older adults will generally have more or higher
status than younger adults. Lineages and similar clan groupings may
be indicated by clustering of individuals, either associated with a
common structure or public area, or with similar sociotechnic
artifacts, such as gorgets, being found with these burials.
In a stratified society, such as a chiefdom, where status is
inherited or ascribed (Service 1962), special treatment of
individuals by age and/or sex would be expected. For example, high
status subadults would be afforded the same treatment as high status
adults. Placement of individuals in public or private sectors
should reflect discrete patterning. For example , one age group or
one sex may be represented in one or the other sector in the
archaeological record. It is possible that evidence of exclusive
use of special mortuary paraphernalia by a segregated group within
the stratified society would be found, as at Etowah (cf. Blakely and
Beck 1981; Larson 1971), in Dallas sites (cf. Hatch 1976; Hatch and
Geidel 1983), and Moundville (Peebles 1971; Peebles and Kus 1977).
Sociotechnic artifacts, generally associated with achieved adult
status in an egalitarian society, would be found with subadults and

215
even infants in a stratified society, indicating the inheritance of
the status symbolized by the artifacts.
Saxe (1971) suggests that another aspect of social organization
which can be investigated is post-marital residence. The methods
involved in such a study makes use of demographic data. The
argument is that if more cultural and/or morphological variation is
found in burials of one sex, then it is possible that these
individua ls came into the area from other village groups who
represented different breeding populations. This might be indicated
by unusual burial pit types or body orientations within the pits. A
morphologica l trait that might indicate immigration among the study
populations is cranial deformation, a culturally determined trait
characteristic of the Waxhaw Indians of the southern Piedmont of
North Carolina (cf. Graham 1973; Lawson 196~) , and the Cherokee of
the Mountains (cf. Dickens 1976).
Social Organization and Kinship in the Historical Record
The only extensive analysis of the social organization of any
of the non-Catawba Indian groups of the North Carolina and Virginia
Piedmont has been done by Ernst Lewis (1951). Lewis was interested
primarily in the Sara Indians who lived along the Dan River in North
Carolina and Virginia during the contact period. However, given the
paucity of information about the Piedmont Indian groups in general ,
Lewis's discussion abstracts information about specific Indian
groups, which seldom include the Sara, from the historical record
and interprets the Siouan lifestyle at a more general level of
analysis. Thus, Lewis's work provides an overview of the

216
ethnohistor ical information related to social organization available
on the Indian groups of the Piedmont that have generally been
thought to have been Siouan (cf. J . Wilson 1983). One problem with
the study, besides its age , is the fact that some of the information
that Lewis uses, primarily from the writings of John Lawson, may be
applicab le only to the Indian groups of the coast and coastal plain,
such as the Tuscarora and Algonquians , or the socially more complex
Catawba Indians of the southern Piedmont.
Basically, Lewis (1951:153) notes some separations along age
lines , especially a mong males, within the groups that Lawson
describes during his travels through the Carolinas in the winter and
spr ing of 1701. There were different titles for "Old Man" and
"Young Man", and young men would take a new name when they became
warriors. Old men were the most p:>werful individuals in society,
presumably due to their organized knowledge of r eligion. Lawson
(1967:43) writes that "Whenever an Aged Man is speaking, none ever
interrupts him" and "Old Age being held in as great veneration
amongst these Heath ens".
Lewis (1951:154) also suggests that there was a definite order
or rank within the Siouan tribes. In his accounts of the Waxhaw
Indians , Lawson (1967 : 43) notes that "When an English-Man comes
amongst them , perhap.s everyone is acquainted with him, yet first,
the King bids him Welcome , after him the War-Captain , so on
gradually from High to Low."
From these accounts, it appears that status in large degree was
achieved in Siouan society, at least for males . Also, there is
evidence that status differences existed on a tribal level . We

217
would expect these patterns of social organization to be reflected
in the mortuary profiles at sites that can be identified as Siouan
in the Piedmont. Generally , older individuals should have more
grave associations and reflect a status diffe rent than younger
individuals, as Saxe (1971) proposes. It is suggested that these
patterns will be found at the prehistoric period Shannon site and at
the late protohistoric/early contact period Upper Saratown-Locality
2. However, because of the increased dependence on European trade
and the increased competition/warfare of the contact period, younger
males should reflect a special status due to their skills in hunting
and warfare. It is proposed then that a difference in young male
status will be evidenced in the late protohistoric and contact
period burial populations. More grave associations, especially of
sociotechnic artifacts , will be found among late protohistoric and
contact-period younger males when compared with earlier populations.
In considering residence and descent, Lawson provides numerous
accounts that indicate matrilineal descent, or possibly biateral
descent was (Richard Yarnell , personal communication, 1988) , common
among the Siouan Indians of the Piedmont. In discussing a Keyauwee
Indian King , Lawson (1967:57) writes that "He got this Government by
Marriage with the Queen; the Female Issue carrying the Heritage, for
fear of Imposters ". Succession of a status position was also
matrilineal as "The Succession falls not to the King's Son , but to
hi s Sister ' s Son, which is a sure way to prevent Impostors in the
Succession" (Lawson 196 7 : 205).
Generally speaking , descent among the Southeastern Indians was
matril ineal , with individuals tracing their relationships to each

218
other through the female line (Hudson 1976:185; Swanton 1946:804-
805), although there were differences in this and other
generalizations. It has been suggested that the matrilineal descent
and matrilocal residence which characterized the Siouan Indians of
the prehistoric, protohistoric, and early contact periods changed to
patrilineal descent and patrilocal/neolocal residence during the
middle and later contact periods (Hudson 1976:187-188; Lewis
1951:162-167). If this occurred, then it is expected that there
will be a gradual change in male status through time with more males
exhibiting more elaborate mortuary treatment the later in the
contact period to which a population dates, relative to earlier
populations. Changes in female status would be reflected in a
decrease in elaborate mortuary treatment through time.
Another aspect of the social organization of the Siouan Indians
of the Carolinas and Virginia that can be considered is the sexual
division of labor. Males are thought to have been responsible for
hunting, fishing, agriculture, construction, and conducting warfare
and trade (Lewis 1951:139, 173). Females supposedly collected wild
foods, prepared and preserved foods, gathered wood, and manufactured
pottery, clothing, mats and baskets (Lewis 1951:139), and prepared
skins (Hudson 1976:266). Hudson (1976:259) states that women were
not only responsible for gathering foods but also for cultivation.
Because of this sexual division of labor it follows that those
technomic artifacts, the items used to cope directly with the
natural environment (Binford 1971), used in the tasks outlined above
will be found with burials of the sex responsible for those tasks.
219
Hypotheses and Research Expectations
From the consideration of the ethnohistorical data and within
the research guidelines that have just been discussed, a number of
hypotheses can be constructed that will guide this analysis of
mortuary behavior and social organization. These several hypotheses
will be tested using a variety of statistical techniques, including
principal component analysis and cluster analysis. First , the
hypotheses and the expectations they engender will be delineated.
Hypothesis 1: At the prehistoric Shannon site, a tribal level of social organization existed in which status was achieved.
Expectations: Older individuals will have more elaborate burial treatment.
Hypothesis 2: With European contact, a more different level of social organization developed among the Indian groups of the Piedmont to handle the increased competition present and the agglomeration of different villages.
Expectations: a) There will be more younger individuals with a special status as evidenced by burial treatment at contact period sites relative to earlier sites.
b) A certain proportion of the subadult segment of the contact period populations will show evidence of a special status that differs from the rest of the subadults in both cont.act and prehistoric period populations.
Hypothesis 3: With the increased competition due to the European fur and skin trade and warfare in the late protohistoric and contact periods, young males, who will have a high value for these activities, will have a diferent status than in earlier populations.
Expectations: There will be more young males, aged 16 to 30 years , with a special status at Upper Saratown-Locality 2 and the Fredricks site.
Hypothesis 4: There will be evidence of a change from matrifocal to patrifocal orientation in society during the contact period.
Expectations: a) In the prehistoric period populations, certain females should possess a variety of sociotechnic items that set them apart from the rest of the society and that serve as indicators of status associated with a

220
matrifocal orientation. Through time, these sociotechnic items or their counterparts should become associated with males as the shift to a patrifocal orientation occurs in the contact period.
b) Males should evidence an unique status when compared to females in patrifocal societies , and females will evidence ascribed status in matrifocal societies, where ma les will continue to evidence achieved status .
c) In matrifocal societies there should be more biological variation in males than in females within a a:>mmunity. In patrifocal societies there should be more biological variation in females than in males within a community .
Hypothesis 2: Given the sexual division of labor that characterized the Piedmont Indian groups, there should be a dichotomy in the various technomic artifacts found associated with each sex.
Expectations: a) Because males are the hunters, traders, builders , and warriors , artifacts such as guns, lead shots, nails, projectile points, axes , hammerstones , etc. should be associated with male burials.
b) Because females are associated with food gathering, food preparation, horticulture, pottery making and clothing making, artifacts such as grinding stones , containers , pots, beadmaking and sewing kits, etc., should be associated with female burials.
c) Artifacts associated with farming , such as hoes , would be found with whichever sex is responsible for this task, presumably males for clearing land and females for cultivating and tending the soil.
Methods of Analysis
The analysis of mortuary treatment among the Indian groups of
the North Carolina and Virginia Piedmont is modeled after O' Shea ' s
(1984) study of three Plains Indian groups: the Arikara, Pawnee,
and Omaha. Three aspects of mortuary variability as evidenced by
the four study samples will be addressed ; social

221
differentiation, change through time, and possible ethnic
distinction. The hypotheses just listed will provide the framework
for the investigation of these three subjects. The isolation of any
patterns within the data sets will be accomplished using statistical
techniques. According to O' Shea (1984:65), the statistical analysis
of mortuary data involves two primary operations: the discovery of
r e l ationships within the burial data, and the estimation of the
significance of these relationships. The statistical procedures
employed to accomplish these operations are measure of association,
principal component analysis , and cluster analysis (cf . O' Shea
1984:65).
The initial step in this analysis is to determine the
constraints that affect the distribution of artifacts according to
age and sex groups in a population in order to understand the basic
organization of the population's mortuary variation. An artifact
and population segment association is considered constrained if the
distribution of the artifact is perfectly consistent or occurred
most frequently with one age group or one sex. For this study, the
constant association of artifacts with two or more individuals in an
age or sex category will be used to identify a constrained
distribution.
The identification of association constraints is important for
evaluating the organization that characterized the material culture
of a past culture. A second technique , principal component factor
analysis, is used to evaluate the covariation of sets of artifacts
observed in each mortuary complex. The choice of the minimum leve l
of occurrence for artifact types before they can be included in the

222
principal component factor analysis is arbitrary (O'Shea 1984:66).
In this study all the artifacts are included in the analysis.
For this study, the artifact types were analyzed using
principal component analysis as implemented in the Procedure FACTOR
of the Statistical Analysis System (SAS) (SAS Institute 1985:39-40,
336-376). Components with an eigenvalue greater than 1.0 were
extracted and rotated with varimax criteria in order to simplify the
columns of the factor matrix. Each variable will load strongly in
either a negative or positive direction on a given factor or will
load close to zero. This positive or negative loading allows the
interpretation of these factors for the presence or absence of
certain variables, i.e., artifacts in this case (O'Shea 1984:66).
This analytical framework closely follows O'Shea's (1984:66) outline
of his study of the thr:ee Plains Indian groups.
One of three generalized patterns of variable loading can be
observed in the rotated factors that aid in explaining the factors
(O'Shea 1984:66-67). The first is known as a grouped pattern which
occurs when a group of variables load strongly (usually greater than
~0.5) either positively or negatively against low loadings (closer
to 0.0) of the remaining variables. The second pattern is bipolar,
with both strong positive and negative loading characterizing the
factor. This pattern reflects inverse or mutually exclusive
relationships. The third pattern is termed specific, and occurs
when only one variable loads either strongly positively or
negatively. The specific factor pattern usually occurs in weakly
structured data sets where types have low correlations (O'Shea
1984 : 66-67).

223
The primary purpose of principal a::>mponent analysis is to
uncover the interaction of sets of artifacts. In order to identify
similarity and structure between sets of graves in a population, two
different cluster procedures are used, agglomerative clustering and
monothetic division (O'Shea 1984:68).
Agglomerative clustering techniques combine burials that are
most similar with one another into clusters. Ward's minimum
variance cluster analysis, as implemented by SAS (SAS Institute
1985:45-69 , 255-315), is used in this study to progressively fuse
those two clusters that result in the minimum increase in the error
sum of squares (O'Shea 1984:68). The data that are clustered by
Ward's method are the factor scores produced by the principal
component analysis for each burial in a sample. This limits the
variables included in the data set to those which were used in the
principal component analysis (O'Shea 1984:68). To determine which
number of clusters produced by Ward's method is the best solution,
three statistical criteria are provided by SAS (SAS Institute
1985:66-67)--the cubic clustering criterion (CCC) (Sarle 1983), the
pseudo F statistic (Calinski and Harabasz 1974), and a pseudo t 2
statistic, which is a transformed version of the Je(2) / Je(l)
statistic of Duda and Hart (1973). To use these statistics to
decide on the best clustering solution one has to " ••• look for a
consensus among the three statistics, that is, local peaks of the
CCC and pseudo F statistics combined with a small value of the
pseudo t 2 statistic and a larger pseudo t 2 for the next cluster
fusion." (SAS Institute 1985:67).

The second cluster technique employed here is monothetic
division , which divides the burials into clusters based on the
presence or absence of a given artifact. The monothetic division
t echnique used here is information analysis as implemented by
Clustan Version 1-C (Wishart 1978). This technique employs an
information measure to determine the differences between clusters
224
(O'Shea 1984 :68 ). O'Shea (1984:68) notes that there are objections
to the use of monothetic divisive cluster techniques on formal
grounds, referring to Jardine and Sibson (1971:115), but he goes on
to state that Peebles (1972) and Tainter (1975a, 1975b) have
successfully used the technique in the archaeological analysis of
mortuary variability. The use of monothetic division is to identify
major subdivisions within each population by focusing on the
artifacts responsible for the divisions and on the characteristics
of the created clusters (O' Shea 1984:68). To select the best
cluster solution among the set of all possible solutions produced by
the monothetic division analysis, Clustan's Procedure RULES, which
tests statistically for a significant number of clusters (Wishart
1982:14-18), is used. Appendix C details how the Procedure Rules is
implemented.
The data used to create the monothetic clusters include all
attributes (artifact types) from each individual burial (cf. O'Shea
1984:68) . All graves from the study samples are included in the
analysis even if no artifacts are present in a burial.
Both clustering techniques are utilized because they both have
certain advantages, and it is reasoned that if a similar or
complimentary structure results from the use of different

225
techniques , than the results can be interpreted with more confidence
than otherwise. The agglomerative clustering analysis with its use
of a data set developed from principal component analysis uses
va riables which occur most frequently, and weighing the variables
differently in terms of importance. The monothetic division cluster
technique allows all the attribute data (artifact types) to be used
i n constructing clusters , although it implicity assumes that
var iables are of equal importance and weight , which may not always
be the case. Comparison of the results obtained from these two
clustering techniques will result in the identification of
s i milarities or differences between the two analyses which will
serve to support or refute each other (O' Shea 1984:68-69).
It is not possible to determine which cluster procedure is
"best" or the actual significance of the results of cluster
a nalysis. Techniques of cluster analysis are useful only in
providing information on the organization of the burial data sets.
The interpretation of that organization must remain thematic and
attempt on l y to discover why certain divisions in a data set occur
(O ' Shea 1984:69) .
The following sections describe the burial remains recovered
f r om the archaeological components at the four study sites, and
interpret the patterns of artifact association as they relate to
social differentiation. For each site, the burial treatment and
grave associations are analyzed. Detailed information on artifact
oc currence and burial characteristics are presented in Appendix A.
One data set that has shown itself useful in the investigation of
social organization , stature differences in population segments (cf.

226
Hatch 1975; Hatch and Geidel 1983), could not be used in this study
because there were too few individuals for whom stature could be
estimated for any of the samples to permit reliable comparisons to
be made.
Mortuary Differentiation and Social Distinction at the Shannon Site
A total of 96 burials (31 males, 29 females, 2 unidentified
adults and 34 subadults) from the Shannon site could be analyzed.
The overall preservation of the skeletal series is quite good, and
89 of the 96 burials could be assigned to specific age groups, and
sex could be determined for 60 of the 62 adults. Individual burials
at the Shannon site are most often found in a flexed position
(78.49 % of the inhumations), with the extended position comprising
10.75% of the burials, extended with legs flexed 9.6% and secondary
inhumation 1.08% (Table 31). The only differential treatment
observed appears to be that subadults make up 80% of those burials
in extended and extended with legs flexed positions.
No specific sex appears to be buried in one position or
another. Twenty-nine males and 27 females are buried in a flexed
position, and one of each sex is in an extended position. The sole
secondary burial at the site is a male aged 41 to 45 years at death.
Two different undisturbed pit types are present at the Shannon
site (Table 32 ). Simple pits account for 88 of the burials (29
males, 27 females, one unidentified adult, and 31 subadults). Only
one shaft and side chamber burial pit , for a male aged 26 to 30
years at death, is present. No sex differences in the occurrence of

'IMIE 31 .
Associatim of furial Part::ure with ~e, Sex an:1 Adult/Sul::adult categories
CATEG:RY
~ in Years:
0-2 3-5 6-10
11-15 16-20 21-25 26-30 31-35 ~-40 41-45 45+
Suredult .klult
'IDrnL
Sex:
Mile Ferrale In:leter:ninate
'IDrnL
Sub:ldult/Adult:
Sub3dult Adult
6 2 3 5 3 4 6 5 9 3
24
3
73
29
27 17
73
16 57
73
at the Sh3nn:n Site.
EXIIlDED
5 2
1
1 1
10
1 1 8
10
8 2
10
UNUSUAL
1
1
1
1
1
1
ElfilNE) W/ rn:::;.s FIEXED
8
1
9
9
9
9
9
19 4 3 6 4 4 6 5 9 4
25
1 3
93
31 28 34
93
33 ED
93
227

TABLE 32.
Asscciation of &lrial Pit Typ2 with !>qe, Sex arrl Adult/Sumdult categories
CA'IID:RY
~ in Years:
0-2 3-5 6-10
11-15 16-21 1 21-25 26-30 31-35 36-40 41-45 45+
Sutadult ldult
'lUl'AL
Sex:
Mile Femle Inl.:terminate
'lUl'AL
3ul:edul t/Adul t:
Sutadult Adult
at the Shmrx:n Site.
SIMPIE PIT
18 3 3 6 4 4 5 4 9 4
25 1 2
88
29 27 32
88
31 57
88
ffiAFT AND
SIDE ClW1BER
1
1
1
1
1
1
DISIURBED
1
1
1
3
1 1 1
3
1 2
3
19 3 3 6 4 4 6 5 9 4
25 1 3
92
31 28 33
92
32 EO
92
228

pit types, other than this one male, are present at the Shannon
site.
229
The orientation of the head in over 85% of the burials at the
site is generally easterly--northeast, 25.26% of the population;
east, 35.79%; and southeast, 24.21% (Table 33). Of the remaining
burials, 10 (10.53%) individuals have their heads oriented to the
south, two (2.11%) to the southwest, one (1.05 %) to the west, and
one (1.05%) to the northwest. No significant differences by sex are
present in the orientation of the head in the Shannon site burials.
However, the two individuals with heads to the west and northwest
are both subadults. The two burials with heads to the southwest are
both adults.
From this consideration of the formal treatment accorded the
burials at the Shannon site, little difference can be discerned
between the different age and sex categories in the population. The
only possible distinction is that subadults are more likely to have
been buried in an extended position than adults.
Artifact Occurrence
A total of 48 aboriginal artifact types can be defined for the
prehistoric period burials at the Shannon site. These summary
tables are listed in Appendix A. Of these 48 artifact types, eight
(1 6. 6%) show a constrained distribution by age group and/or sex
category when the two or more observation criteria discussed
earlier are employed. Three artifact types are constrained by age,
two by sex, and three by both age and sex (Table 34). The artifact
type that is found only with subadults aged 11 to 15 years at death
(n= 2) are deer phalange projectile points, while columella shell

'Il\BIE 33.
Associaticn of Grave Orientaticn with h:Je, Sex ani Adult/Sub3.dult Categ:::iries at the Sh3nnc:n Site.
C1>.'IHXRY
!'!;re in Years:
0-2 3-5 6-10
11-15 16-20 21-25 26-30 31-35 36-40 41-45 45+
Sul::adult lrlult
'ICID\L
3ex:
Mile Pere.le
Imeterrninate
Sub:ldult/Adult:
Suredult Adult
NE
4 2
1
1 2 1 3 3 7
24
11 6 7
24
7 17
24
E
4 1 2 1 3
2 3 4
10 1 3
34
10 14 10
34
9 25
34
SE
9 1
3 1 2 1
6
23
6 4
13
23
13 10
23
s
1
1 1
1 1 2 1
2
10
3 4 3
10
3 7
10
SW
1 1
2
1 1
2
2
2
w NW
1 1
1 1
1 1
1 1
1 1
1 1
20 4 3 6 4 4 6 6 9 4
25 1 3
95
31 29
35
95
34 61
95
230

™3IE 34.
Ccnst:raine:3. Artifact Associatirns in the Shannrn Site sarrple.
Fara.le
Colurella Cylirrlrical Beads Shell Beade:1 Ganrents
Sul::adult
Deer Phalange Projectile Point Colurella Shell Pemants
Male
Unaltered M..issel Shell Turkey Tibiotarsal Awl Bear canine Beads
klult
Unaltere:3. M..issel Shell Turtle Carap:i.02 Cup Turkey Tiliiotarsal Awl Grou.rrl stcne Celt
231

232
pendants are present with three subadults aged Oto 2 years at
death. Thus, both technomic (the deer phalange projectile points)
and sociotechnic (columella shell pendants) are associated with
subadults.
For adult individuals, four artifact types are constrained-
unaltered mussel shell, turtle carapace cups , turkey tibiotarsal
awls, and ground stone celts. The turtle carapace cups and turkey
tibiotarsal awls are both technomic artifacts. The ground stone
celts are possibly sociotechnic artifacts , although they could be
technomic as well , and the function of the unaltered mussel shell is
unknown .
For females , two ornamental artifact types are constrained,
columella shell cylindrical beads and shell-beaded garments, which
are also shared with subadults. The problem alluded to earlier in
attempting to impart meaning to the artifact types is a factor in
this identification. The columella cylindrical shell beads are
found with two subadults (o ne aged 0-2 years and one aged 11-15
years) and four adul t females (one 16-20 years o l d , one 36-40 years
old, one 41-45 years old and one 46+ years old) . A total of eight
individuals possess shell bead garments , six subadults (four aged 0-
2 years, one aged 3-5 years , and one aged 6-10 years) and two adult
females (one 26 to 30 years of age and one 46+ years of age). These
two artifact types do not appear to be distributed in a manner
consistent with status achieved by age. Rather , the two sociotechnic
artifact types together might be indicative of individual ascribed
status that distinguishes status among females that may reflect
lineage associations within a matrilineal society. For now ,

233
however, a more definite statement can not be made about the
columella shell cylindrical beads and shell-beaded garments than
that the shell beads are sociotechnic ornamental items of some kind.
The three artifact types constrained to males are also
constrained by age. In all cases , the males (n=4) with these
artifacts are more than 45 years old. The three artifacts include
unaltered mussel shell (function unknown) , turkey tibiotarsal awls
(technomic artifact), and bear canine beads (sociotechnic ornamental
with ideotechnic overtones). The bear canine beads (and other
isolated bear remains at the Shannon site) may be part of a bear
ceremonialism in the society, a ceremonialism that many researchers
(Guilday et al. 1962; Hallowell 1926; Parmalee 1959 ; Parmalee et
al. 1972; Runquist 1979; Skinner 1919) have speculated existed
among the Indian societies of the eastern United States.
Principal Component Analysis
The data used in the principal component analysis of the
Shannon site ' s mortuary complex include all the undisturbed graves
at the site. This sample is composed of 96 burials and includes 41
distinct artifact types as variables. The principal component
analysis identified 16 factors , which are summarized in Table 35 and
listed in Appendix B, with e igenvalues greater than 1 and a total
variance of 34. 31 for the original dataset. Three of these 16
factors account for about 50% (17 of 34. 31) of this total variance.
All three of these factors exhibit grouped patterns with strong
positive loadings for several artifact types.
Factors 1 and 2 show a strong male orientation. In fact , in
all but three of the cases, the artifacts isolated in these two

'I1IB1E 35 .
Surrrrery of the Factor Analysis Pattern for the Shann01 Site Sanple.
FACit:R #
1 7. 7 (22.4%)
2 6.8 (19. 8%)
3 2. 5 (7.3%)
4 group:rl 1.7 (5.0%)
5 group:rl 1. 7 (5.0%)
6 group:rl 1.6 (4.7%)
7 group:rl 1.5 (4.4%)
8 group:rl 1.5 (4.4%)
9 group:rl 1.4 (4.1%)
una1 tered rrussel shell M+- < turkey tibiotarsal awl M+- < beaver incisor chisel M+- * < ·:i:ler l~e chisel M+- * < deer l:x:ne flaker M+- * < chii:p:rl st.me projectile p::>int chii:p:rl st.me drill M+- * < grc:urrl st.me celt + < stcrie abrader M+- * < raw /harrunered native rog::er M+ * <
unaltered rrussel shell M+- < turtle cara:p3.ce cup + turkey tibiotarsal awl M+- < e:i.gle talon beads M+- * < deer lcrq::x:ne beads M+- * < elk t:a::,th beads M+- * < chii:p:rl st.me scra:i:er M+- * < st.me I)=lrl3nt M+- * < rcx:k crystals MSl'I.
olive shell beads - * rrountain lion claw beads deer p,al~ projectile p::>int -:hii:p:rl st.me projectile p::>int
rrarginella shell beads rolurella shell I)=lrl3nts -turkey ooraooid beads FSA
oolurrella cylimrical beads FS\ turkey l~e tube beads st.me/rock -*
w::>lf canine beads - * rock crystals MSA.
bear canine beads MSA.
bear rran:lible M+-* <
oolurella srell disc beads chii:p:rl st.me blade M+-*
turtle cara:p3.ce cup+ turkey digit beads M+-*<
234

FACICR #
10
11
12
13
14
15
16
Crnstraints: + crlult rnly - sl..lb3dult only
I..ON)IN3
PATI'ERN
group:rl
bip::,lar
specific
sµcific
specific
sµcific
'™3IB 35. (a:ntinued)
VARIANCE EXPLAINED
1.3 (3.8%)
1.2 (3.5%)
1.0 (2.9%)
1.0 (2.9%)
1.0 (2.9%)
1.0 (2.9%)
1.0 (2.9%)
turkey tibiotarsal awl Mt-< clay pi.J?= Mt-*
oolurella tute reads tone hairpin Pt*
harrrrerstme (p::,sitive loodin:J) Mt-*<
deer l:x:ne teads (negative leading) -*
rolled native c:x::,_i;:p=r bead -*
clay p::>t -*
chifP:rl st:ne knife Mt-*<
deer l:x:ne fishh:ok Mt-*
M rrale rnly F ferale ooly
MS.?\ rrales & subadul ts < rrales 45+ years FSA feral.es & sub3dults * (n=l)
235

236
factors are associated only with males older than 45 years of age.
Factor 1 includes only technomic artifacts, some of which (awls,
chisels, flakers, projectile points, and drills) are indicative of
tool assemblages used in hunting and tool manufacture. Factor 2
includes both sociotechnic ornamental artifacts which are found only
with males over 45 years of age (elk tooth beads and stone pendant),
and technomic artifacts associated with working leather (awls and
stone end scraper). Only three artifacts in Factor 2 cannot be
associated with one of these two categories. One of these
unassigned artifacts, unaltered mussel shell, is unique to males
over the age of 45 , but two others , turtle carapace cup and rock
crystals, are shared by the oldest males with other segments of the
population, including a small number of younger males, females and
subadults.
Factor 3 combines sociotechnic ornamental items associated with
a select number of adults (male and female) and subadults (mount ain
lion claw beads) and only a subadult (olive shell beads) , and
technomic hunting artifacts unique to subadults (deer phalange
projectile point) and technomic hunting artifacts found with both
adults and subadults (chipped stone projectile points). The third
factor represents a more general grouping that includes a number of
males and subadults, but only one female.
Factor 4 has a grouped pattern and consists of ornamental
artifacts, of which only one is constrained by age. Columella shell
pendants are found only with subadults . The other two artifact types
are marginella shell beads and turkey coracoid beads. The
marginella shell beads are found in male (n=2) and female (n=6)

adult burials as well as subadult burials (n=S). Turkey coracoid
beads are found only in female (n=l) and subadult (n=l) burials.
237
Factor 5, which also has a grouped pattern, is composed of two
ornamental sociotechnic artifacts (columella cylindrical beads and
turkey longbone beads) and a possible technomic artifact (a
stone/rock). The columella cylindrical beads are found only with
females (n=4) and subadults (n=2). The turkey longbone beads are
found with males (n=l), females (n=2) and subadults (n=2). The
possible technomic artifact, a stone/rock, is present in one subadult
burial.
Factor 6 has a grouped pattern composed of wolf canine beads (a
sociotechnic ornamental artifact) and rock crystals (a possible
sociotechnic artifact). The wolf canine beads are found with one
subadult. The rock crystals are found with one adult male aged 46+
years and one subadult.
Factors 7 and 9 are grouped and have at least one artifact
that is associated with a male over 45 years old. Factor 7 consists
of a sociotechnic ornamental artifact, bear canine beads, found with
males aged 46+ years (n=2) and with subadults (n=2), and a
sociotechnic artfact, a bear mandible, found with a male aged 46+
years (n=l). Factor 9 has a technomic artifact, a turkey carapace
cup, constrained to adults (n=3, two males and one female), and a
sociotechnic ornamental artifact, turkey digit beads, found with one
male aged 46+ years.
The artifacts in grouped Factor 8 are sociotechnic columella
small disc shell beads and a technomic chipped stone blade. The

former are found with females (n=3), males (n=l) and subadults
(n=l), and the latter is found with an adult male.
238
Factor 10 possesses grouped artifacts, turkey tibiotarsal awl
and clay pipe, that are associated with males more than 45 years
old. The turkey tibiotarsal awl has a constrained distribution with
such males (n=4), while the sole occurrence of a clay pipe is with a
male 46+ years.
Factor 11 has a grouped pattern. The artifacts in this factor,
columella shell tube beads and a bone hairpin, are both
sociotechnic. Columella shell tube beads are found with males
(n=3), females (n=5), and subadults (n=6). The bone hairpin is
associated with one female aged 16 to 20 years at death.
Factor 12 has the only bipolar loading pattern for the Shannon
site sample. This factor consists of a negative loading for deer
bone beads, which are a sociotechnic ornamental artifact found with
one subadult, and a positive loading for a hammerstone, a technomic
artifact associated with a single adult male aged greater than 45
years at death.
Factors 13, 14, 15 and 16 are all characterized by specific
loading patterns. The sociotechnic ornamental artifact, a rolled
native copper bead, in Factor 13 is found with a single subadult
burial, as is the technomic artifact, a clay pot, in Factor 14.
Males are associated with the technomic artifacts that comprise
Factors 15 and 16. The chipped stone knif e of Factor 15 is
associated with a male aged greater than 45 years. And Factor 16
consists of a deer bone fishhook found with a male 41 to 45 years
oM.

239
Overall, the results of the factor analysis appear to emphasize
the male role within the Shannon site population. Males are
di stinctly separated from females by the distribution of technomic
artifacts used in hunting , tool and bead manufacturing , and possible
leather working. The fact that the artifacts found in Factors 1 and
2 all occur with males over 45 years of age supports the observation
that status may have been achieved among males in the Shannon site
society. No females stand distinct from any segment of the
population when the results of the factor analysis of the artifact
as sociations are considered. However, Factor 5 indicates that
columella shell cylindrical beads, which are found only with adult
females (n=4) and subadults (n=2) might set apart certain females
and subadults from the rest of the population. This pattern has
previously been discussed in the earlier section on the Artifact
Occurrence at the Shannon site. Also , the inclusion of turkey
longbone tubular beads , which are found with one male , two female
and two subadult burials, in this factor obscures the meaning of
t his factor grouping.
Agg lomerative Clustering
Applying Ward ' s minimum variance cluster analysis to the factor
scores produced by the principal component analysis for each burial
at the Shannon site, a 16 cluster solution was determined to be the
best ordering of the data according to the results of the pseudo T2
statistic (see Appendix C) . These clusters are summarized by Table
36. The overall clustering pattern suggests a strong orientation
toward achieved male status with some associated subadult
clustering. Clusters 15 and 16 both represent males over the age of

'mBI.E 36.
Surnrary Descriptirn of the 16 Gra.l~ Defined by the Ag:Jlarerative Cluster Arelysis for the Sh3nnc:n Site Sample.
Cluster 1: Nurber of Irrlividuals NuTber of Males
2 0
Nurber of Females 1 NuTber of lldul ts 1 'Utber of Sul::edults 1
Cluster M2rrbers: 49, 98.
Cluster 2: Nurber of Irrlividuals 76 NuTber of Males 22 'Utber of Females 28 Nurrber of lldults 51 Nurber of Sul::edults 25
Cl uster Members: 1, 2, 3, 5, 7, 8, 9, 10, 11, 12, 13, 14, 15, 16, 17, 19, 20, 21, 22, 23, 24, 26, 27, 28, 29, 30, 31, 33, 35, 36, 38, 39, 40, 44, 46, 47, 48, 50, 51, 53, 54 , 55, 57, 59, 60, 62, 63, 64, 65, 66, 67, 68, 69, 70, 71, 72, 73, 74, 76, 78, 79, 80, 81, 83, 84, 85, as, 87 , 88, 89, 90, 91, 93 , 94, 95, 97 .
Cluster 3: Nurrber of Irrlividuals 5 Nurber of Males 3 NuTber of Females O Nurber of lldults 3 Nurrber of Sul::adults 2
:luster M3tbers : 25, 37, 56, 58, 99 .
Cluster 4: NuTber of Irrli viduals 1 Nurber of M3.les O NuTber of Ferales O Nurber of lldults O NuTber of Sul::edul ts 1
Cluster M2rrbers: 6.
Cluster 5: Nurber of Irrlividuals Nurrber of Males
1 0
Nurber of Ferales 1 NuTber of lldul ts 1 Nurber of Sul::edults O
Cluster M:!rbers: 75.
Cluster 6: Nurber of Irrlividuals 1 NuTber of Males O Nurber of Ferales O Nurrber of lldults O Nurber of Sul::adults 1
Cluster M2rrbers: 77 .
240

241
ThBLE 36. (o:ntinuoo)
Cluster 7: Nunber of Irrlividuals 1 Nurrber of M3.les 1 :bTlber of Farales 0 Nurrber of Milts 1 Nurber of Sul:Bdults 0
Cluster t,arbers: 61.
Cluster 8: Nunber of Irrlividuals 1 Nu.mer of M3.les 0 Nutter of Farales 0 Nu.mer of Milts :)
Nurber of Sul:Bdults 1 Cluster M2!tbers: 43.
Cluster 9: Nunber of Irrlividuals 1 Nunber of M3.les 1 Nurber of Farales 0 Nu.mer of Milts 1 Nurber of Sul:Bdults 0
Cluster M2!tbers: 92.
Cluster 10: Nurber of Irrlividuals 1 Nu.mer of M3.les 0 Nunber of Farales 0 Nunber of Mil ts J Nurber of Sul:Bdults 1
Cluster M2rrtlers: 34.
Cluster 11: Nurber of Irrlividuals 1 Nu.mer of M3.les 0 Nurber of Farales 0 Nunber of A::lults J Nunber of Sul:Bdults 1
Cluster M2Irbers: 41.
Cluster 12: Nunber of Irrlividuals 1 Nu.mer of M3.les 1 Nurber of Farales 0 Nu.mer of A::lul ts 1 Nurber of Sul:Bdults 0
Cluster M2Irbers: 18
Cluster 13: Nurber of Irrlividuals 1 Nu.mer of M3.les 0 Nurber of Farales 0 Nurrber of A::lults J Nunber of Sul:Bdults 1
Cluster t-Bmers: 52.

242
'I7IBLE 36. ( o::ntinue::l)
Cluster 14: Nurber of Irrlividuals 1 Nu:rber of Males 1 Nurber of Farales 0 Nurrber of Mil.ts 1 Nurber of Sul:adults 0
Cluster I-arbers: 82.
Cluster 15: NuTber of Irrlividuals 1 Nu.mer of Males 1 Nurber of Farales 0 Nurrber of Mil.ts 1 Nurbe.r of Sul:adults 0
Cluster t-Bmers: 4.
Cluster 16: Nurber of Irrlividuals 1 Nu.mer of Males 1 Nurber of Farales 0 Nu.mer of Mil.ts 1 Nurber of Sul:adults 0
Cluster ~mers: 45.
243
45 that have numerous sociotechnic and technomic artifact
associations. A third male aged more than 45 with both technomic
and sociotechnic artifacts comprises Cluster 12. Clusters 9 and 14
are also males over 45 years of age , but they have only technomic
artifacts. Cluster 7 is a male aged 41 to 45 years that likewise
has only technomic artifacts. Cluster 3 is composed of three males
(one aged 31-35 years and two aged 45+ years) and two subadults aged
Oto 2 years. This cluster has primarily sociotechnic ornamental
artifacts with a heavy loading toward artifacts manufactured from
bear (Ursus americanus) remains.
Females dominate two clusters, numbers 1 and 5. Cluster 1 has
one adult female and one subadult aged 11 to 15 years of age, and
both possessed only a single technomic item, a hammerstone. Cluster
5 is a young female aged 16 to 20 who possesses only a bone hairpin.
Subadults aged 11 to 15 years of age comprise Clusters 8 and
10. The burial in Cluster 8 has only a technomic artifact
associated with it , a clay pot. Cluster 10 has both technomic and
sociotechnic ornamental artifact associations. Clusters 11 and 13
are both individuals aged 6 to 10 years at death that have
sociotechnic ornamental grave associations. Subadults aged Oto 2
years are found in Clusters 4 and 6 , and both these clusters possess
only sociotechnic ornamental objects.
Cluster 2 represents the mass of the population, and is
composed of both sexes and all age groups. The artifact
associations of this group range from no artifacts present in the
burial to a small number of technomic and sociotechnic items being
found .
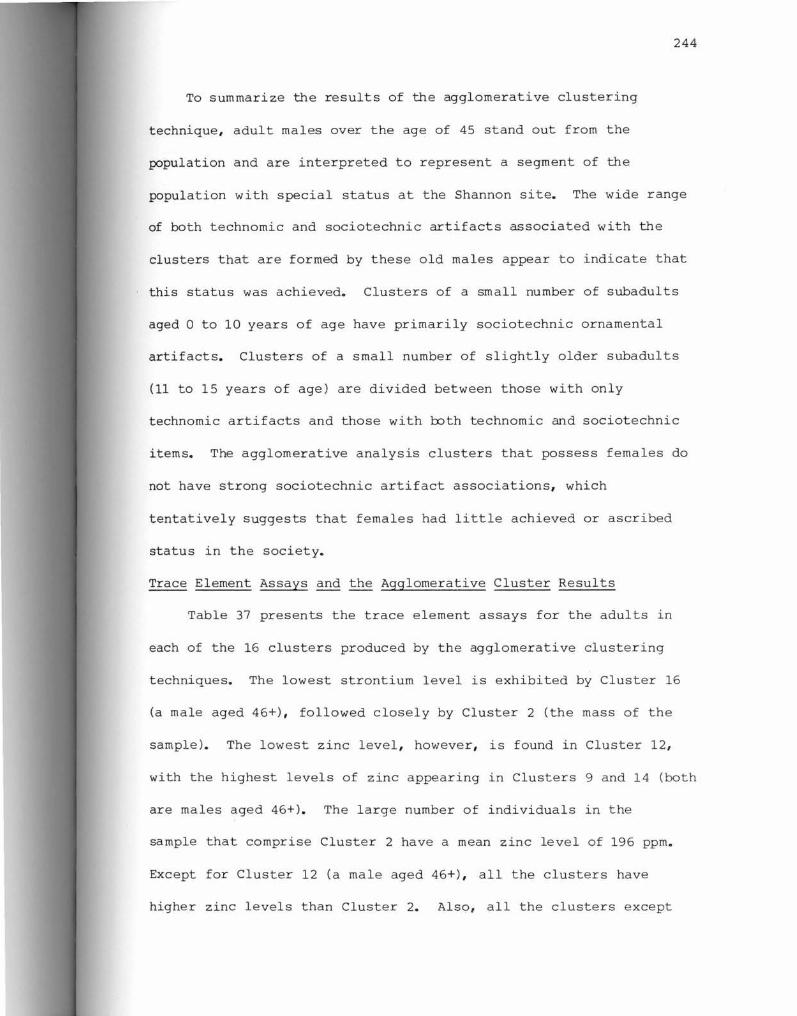
244
To summarize the results of the agglomerative clustering
technique, adult males over the age of 45 stand out from the
population and are interpreted to represent a segment of the
population with special status at the Shannon site. The wide range
of both technomic and sociotechnic artifacts associated with the
clusters that are formed by these old males appear to indicate that
this status was achieved. Clusters of a small number of subadults
aged Oto 10 years of age have primarily sociotechnic ornamental
artifacts. Clusters of a small number of slightly older subadults
(11 to 15 years of age) are divided between those with only
technomic artifacts and those with both technomic and sociotechnic
items. The agglomerative analysis clusters that possess females do
not have strong sociotechnic artifact associations, which
tentatively suggests that females had little achieved or ascribed
status in the society.
Trace Element Assays and the Agglomerative Cluster Results
Table 37 presents the trace element assays for the adults in
each of the 16 clusters produced by the agglomerative clustering
techniques. The lowest strontium level is exhibited by Cluster 16
(a male aged 46+), followed closely by Cluster 2 (the mass of the
sample). The lowest zinc level, however, is found in Cluster 12,
with the highest levels of zinc appearing in Clusters 9 and 14 (both
are males aged 46+). The large number of individuals in the
sample that comprise Cluster 2 have a mean zinc level of 196 ppm.
Except for Cluster 12 (a male aged 46+), all the clusters have
higher zinc levels than Cluster 2. Also, all the clusters except

245 'I7\B1E 37.
Average lrlult Trace Elerent Assays by Cluster far the l-\gJlarerative Cluster Analysis of the Sh:mnm Site Sarrple.
~VE
CUBI'ER # n S'lR:NI'IlM W>Gill3IlM ZIN: CDPPER
1 1
2 43 350 1184 196 8
3 2 468 1sas 241
4 0
5 1
6 0
7 1 384 12:;:n 247 0
8 0
9 1 374 1218 326 47
10 0
11 0
12 1 407 1383 104 0
13 0
14 1 486 1159 345 12
15 1 421 1139 244 6
16 1 345 976 211 0
Sarrple ~ 51 360 1200 :;:D4 8.3

246
for 2 and 12 (an adult male aged 46+) are above the sample mean
f or zinc.
From the survey of the mean strontium trace element levels by
c l uster, it does not appear that older males had preferential access
to meat , with lower levels of strontium being equated with more meat
in a diet. The zinc levels , however , a r e higher in a number of the
c lusters with males aged 46+ years tha n the mean for the sample
as a whole and the mass of the burial sample in Cluster 2. This
indicates that some at present unidentified protein source is being
tapped by a select number of the males aged 46+ , indicating that
these individuals may have had a diet that differed from the rest of
the Shannon site burial sample.
Monothetic Division Cl uster Analysis
A total of 96 burials and 42 artifact types were included in
t he monothetic division cluster analysis of the Shannon site
skeletal series. A total of 11 clusters was selected as being the
best division of the sample given the artifacts present based on the
r e s ults of Clustan' s Procedu re Rules (see Appendix C) . Tab l e 38 and
Figure 9 provide a summary of these 11 clusters.
Cluster I , the first cluster formed , is composed of those
ind ividuals with no artifacts. The remaining individuals with
artifacts were subdivided into those individuals with turkey
tibiotarsal awls and those without this artifact type. The
i ndividuals with tibiotarsal awls were f u rther subdivided into those
with columella beads (Cluster II) and those with no columella beads.
This latter group of individuals was divided again into individuals
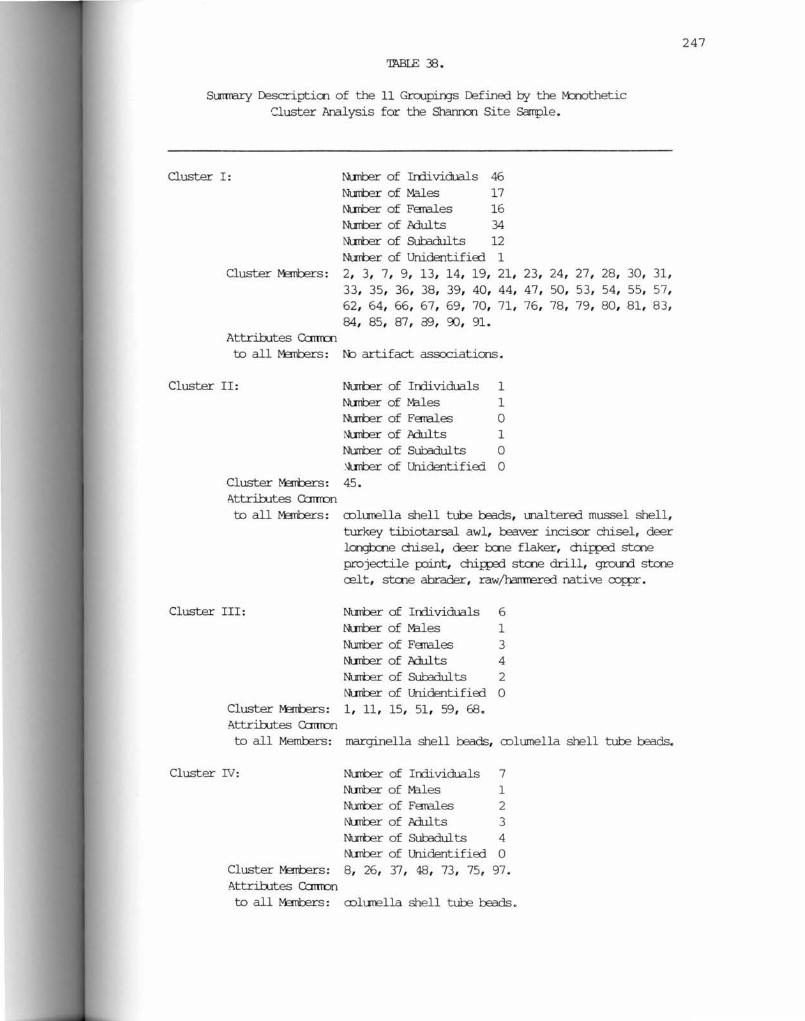
'mBIB 38 .
Sumrary Cescriptim of the 11 Groo~s Cefined by the M:nothetic Guster Analysi s for the Shannon Site Sarrple.
Cluster I:
Cluster r-anters:
Attril:utes Ccnrrcn to all t>anters:
Cluster II:
Nunber of Irrlividuals 46 Nurrter of Males 17 Nurber of Feral.es 16 Nurber of Adults 34 Nunber of Sul:edults 12 Nurber of Unidentified 1 2, 3, 7, 9, 13, 14, 19, 21, 33, 35, 36, 38, 39, 40, 44, 62, 64, 66, 67 , 69, 70, 71, 84, 85, 87, 39, 90, 91.
tb artifact associations.
Nurrter of Irrlividuals 1 NuTiber of M:l.les 1 Nurber of Feral.es O Nunber of l>dults 1 Nurrter of Subadults O ~ of Unidentified O
Cluster M2rrbers: 45. Attrib.ltes Camon
23 , 24 , 27 , 28, 47, 50, 53, 54, 76 , 78, 79, 80,
30, 31, 55, 57, 81, 83,
to all M::!rrers : rolurella shell tube beads, rnaltered mussel shell,
Cluster III :
turkey tibiotarsal awl, beaver incisor chisel, deer lmgl:x:ne chisel, deer J:x:ne flaker, chirµrl st.me projectil e f()int, chii;psrl stme drill, grurrrl stone CElt, st.me abrader, raw/h3mrered native cq;:pr .
Nunber of Irrlividual s 6 NuTiber of M:l.les 1 Nurrter of Feral.es 3 Nunber of l>dults 4 Nurrter of Subadults 2 Nurber of Unidentified O
Cluster M2rrbers: 1, 11 , 15, 51 , 59, 68. Attril:utes Camon to all Meml::Ers: marginella shell beads, rolumella shell tube beads.
Cluster DJ: Nurrter of Irrlividuals 7
NuTiber of M:l.les 1 Nurrter of Feral.es 2 Nunber of l>dults 3 Nurrcer of Subadults 4 Nunber of Unidentified O
Cluster M2rrbers: 8, 26, 37 , 48, 73, 75, 97. Attril:utes Camon to all t>anters: rolurella shell tube l::e3ds.
247

ThBLE 38. (o:ntinuErl)
Cluster V: Nurter of Irrlividuals 1 Nunber of M3J.es 1 Nurter of Feral.es O Nunber of ldults 1 Nutter of Suradults O Nunber of Unidentified O
Cluster M:rrbers: 4 Attrih.rt:es Camon to all M3T1b=rs: una1 tered mussel shell, turtle carap:tce 01p,
turkey lmgl::x:ne reads, turkey tibiotarsal awl, regle talon beads, drer longl::one awl, elk tooth reads, d1ifPed st:aE end scrai;:er, strn2 ferdant, rock crystal •
Cluster VI: Nurter of Irrlividuals 4 Nunber of M3J.es 1 Nu.teer of Feral.es 1 Nunber of ldults 2 Nurrter of Suradults 2 Nunber of Unidentified O
Cluster M:rrbers: 34, fJJ, 65, 72. Attrih.rt:es Camon to all M:!nbers: rramtain lien claw beads .
Cluster VII: Nurrter of Irrlividuals 3 Nunber of M3J.es 0 Nutter of Feral.es 1 Nunber of ldults 1 Nu.teer of Suradul ts 2 Nunber of Unidentified 0
Cluster M::rrbers: 6, 63, 95. At:trih.ites Camon to all M:!nbers: rolurella cylindrical reads.
Cluster VIII: Nurocer of Irrlividuals 2 Nunber of M3J.es 2 Nutter of Feral.es O Nunber of ldults 2 Nu'tlter of Sul:adul ts O Nunber of Unidentified O
Cluster M:rrbers: 18, 82. Attrirutes Camon to all M:!nbers: turkey tibiotarsal awl .
248

249 TABLE 38. (a:ntinued)
Cluster IX: Nu:rt:er of Irilividuals 3 Nunber of M3.les 2 Nurrber of Ferales 0 -~ of A:lults 2 Nu-rt:a" of Sub3dul ts 1 Nt.Trrer of Unidentified 0
Cluster M::rrt:ers: 25, 56, 99. Attrirutes Camon to all M::rnl:ers: rear canine b::ads.
Cluster X: Nurber of Irilividuals 10 Nunber of Miles 1 Nurrber of Ferales 3 Nunber of A:lults 4 Nurrt:er of Sub3dults 6 Nunber of Unidentified 0
Cluster ~s: 10, 12, 16, 17, 20, 52, 74, 86, 93, 94. Attrirutes Camon to all M::rnl:ers: rrarginella shell b::ads.
Cluster XI: Nurrber of Irilividuals 13 Nurber of Miles 4 Nuiter of Ferales 4 ~ of Sub3dults 5 Nuiter of Unidentified 0
:luster M3nl:ers: 5, 15, 22, 29, 41 , 43, 46, 49, 58, 61, 88, 92, SB. Attrirutes Carnul to all M::rnl:ers: N:ne (left over irrlividuals with artifacts).

I
CLUSTIJI I "• .\rt1faet1 n•4b
96 BURI>.LS I
I Wl th Turi<•T Tl blotaraal Avl n•4
I
CLUSTIJI II Wlth Colu• ella Tube Beads
Vit.hout. Coluae lla T\lbe Beada n•J
I
With Art1C'acts n•~O
I
I
\1i1 th '1arg1nella Shell E\e s ds n:a1b
I
I
Wl thout Turi<•r T1blotaraal Awl n•4b .
CLU~Tf.R I I I CLUSTER I Wt th Colucella iH thout Coluaella Tube B~ads Tut-e Beads n.,.6 n• 10
. Without. Harginella She 11 Beads n•JO
250
CLUSTER V With Unal tored Husael. Shell n•l
CLUSTER VIII Without Dnaltered Huoool Shell Wi thout Col uoella
Tube ~ f'll dS
CLOSTER IV With Coluaella Tube Beads
n•2
I
n•2)
I W'l thout Hount.aJ n Lion Claw beads n•19
n•?
CLOSTER VI \11th Mountain Li on Cl aw Beads n:4
'111'1 t hout Colu•e lla !:hell Read e
I CLU~TER VII Wt th Colu11ella Sholl Beads n•J
n•lb
I CLU5T::R XI CLUSTER II iii t.hout Bear Ill th Bear Canine ee ads Can in• S.ad1 n•l) n•J
Figure 9. Monothethic division clusters produced for the artifacts associated with the Shannon site burials.
with unaltered mussel shell (Cluster V), and those without
unaltered mussel shell (Cluster VIII).
251
The segment of the sample that did not have turkey tibiotarsal
awls eventually were divided into seven more clusters, with the
initial separation occurring for those with and those without
marginella shell beads. The individuals with marginella shell beads
divided into a group with columella tube beads (Cluster III), and a
group without this artifact (Cluster X) . The group without
marginella beads was also divided on the basis of columella tube
beads into a group with this artifact (Cluster IV) and those
without. This without segment was split into a group with mountain
lion claw beads (Cluster VI) and without mountain lion claw beads.
The presence of columella cylindrical beads split off Cluster VII
from the group without mountain lion claw beads. The final division
in the sample was of this group without mountain lion claw beads
into a group with bear canine beads (Cluster IX) and a group without
bear canine beads (Cluster XI) .
Examining these 11 clusters and the artifacts that are
responsibl e for the clustering, there is a definite division in the
Shannon site sample according to age and sex characteristics.
Clusters II, V, and VII all contain turkey tibiotarsal awls and are
all males aged 46+. Cluster IX is composed of two males over th e
age of 45 , and a subadult aged Oto 2 years. These three
individuals in Cluster IX all have bear canine beads. Males over
the age of 45 are associated with turkey tibiotarsal awls and bear
canine beads. The awl is assumed to be a technomic artifact used to
sew garments, to attach beads to garments, and perhaps to work the

beads themselves. Bear canine beads are considered to be
sociotechnic artifacts.
252
Females of all ages and subadults appear in clusters that are
formed on the basis of the presence of sociotechnic ornamental
artifacts manufactured of shell (Clusters III, IV, VII and X). It
is interesting to note that 11 of the 13 subadults in Clusters III,
IV, VII and X are 2 years of age or less . Cluster VI is unusual in
that it includes one male and one female , both aged 36 to 40, and
two subadults, one aged 0-2 years and the other 11-15 years. The
four individuals in this cluster al l possess mountain lion claw
beads.
The only cluster that possesses no males, only females (n=l)
and subadults (n=2), is Cluster VII. This cluster is separated by
the presence of columella shell cylindrical beads, an artifact type
which has previously been shown to have a constrained relationship
with females and subadults. Only one of the four females with this
artifact are included in Cluster VII , the other three being
separated from the rest of the sample previously by the presence of
columella shell tube beads (n=2) and marginella shell beads (n=l)
into clusters that possess males and subadults.
The results of the monothetic division cluster analysis
indicate that males dominate those clusters that evidence a p:i.ttern
of artifact association different from the vast majority of the
sample. This domination may indicate a special status for
certain males r elative to other segments of the sample. Clusters
II, V, VIII , and IX vividly illustrate this pattern. Technomic
art ifacts in the form of tibiotarsal awls characterize Clusters II ,

253
v, and VII, and Cluster IX has a sociotechnic item, bear canine
beads, that sets it apart from the other clusters. Females of all
ages and subadults Oto 2 years of age are associated with
sociotechnic shell ornamental artifacts, as Clusters III, IV, VII
and X show. However , males also possess sociotechnic shell
ornamental artifacts, indicating that while females and young
subadults are associated with shell artifacts, shell artifacts are
not necessarily solely associated with females and young subadults.
The tentative identification of columella cylindrical shell beads
and shell-beaded garments as possible indicators of a special status
for certain females earlier in this section is not corroborated by
the monothetic division cluster analysis.
Shannon Site Social Organization
The combined results of the agglomerative and monothetic
division cluster analyses of the Shannon site skeletal series
indicates that there are distinct patterns of mortuary status
present in the society. The propositions that status is achieved in
the society, and that an ega litarian form of social organization
similar to what might be called a tribe is present , are supported by
males aged more than 45 years being associated with distinct
artifacts of both technomic and sociotechnic function (see Tables 34
and 3 5) .
Cluster IX of the monothetic division analysis consists of two
males aged 46+ and one subadult aged Oto 2 years that possessed
bear canine beads. Swanton (1946:661) notes that Bear clans are
commonly found among the Indian groups of the Southeast. It was
discussed previously in this work that a number of researchers

254
(Guilday et al. 1962; Hallowell 1926; Parmalee 1959; Parmalee at al .
1972; Skinner 1919) have identified the presence of bear
ceremonialism among the Southeastern Indian s . Runquist (1979:141-
146) goes so far as to suggest that bear ceremonalism was common
among the prehistoric period Indians, but gradually disappeared with
European contact. The presence of subadults within Cluster IX may
be indicative of clan relationships in which membership is gained at
birth. Likewise, Cluster VI with its mountain lion claw beads might
represent another clan, that of the panther, within the society (cf.
Swanton 1946:661).
The distinct status evidenced by older males and the lack of
any corresponding distinct special status for females leads to the
conclusion that the social structure that characterized the Shannon
site society is dominated by males. Males in general are associated
with technomic artifacts used for hunting , working leather and
horticulture, and a number of sociotechnic artifacts as well.
Females are associated primarily with a few sociotechnic ornamental
artifacts. This generalization related to the sexual division of
labor further emphasizes the i mportance of males over females in the
Shannon site society. Columella cylindrical shell beads and shell
beaded garments may indicate status among females at the Shannon
site. There is no evidence of achieved status for females, that is
there are no group of older females possessing unique artifacts, and
there is little evidence for ascribed status that might be tied to
importance within a lineage in a matrifocal society.

Mortuary Differentiation and Social Distinction at the Wall Site
255
Only eight burials comprise the skeletal sample ana lyzed from
the late prehistoric/early protohistoric Wall site. Given the small
size of the sample, no statistical analyses could be performed.
Instead, the data produced by the analysis of the Wall site sample
can be used only for comparison with trends and patterns delineated
by the study of the two more representative samples.
Preservation of the Wall site burial series is good for adults
(n=3), but is poor for subadults (n=4). A total of nineteen
artifact types are associated with this sample (see Appendix A).
The three adults are males, meaning that no female adults are
present in the sample. All eight burials are primary interments,
and, with one exception, a burial with an indeterminate position,
all have a flexed position (Table 39). Simple pits and shaft-and-
side-chamber pits are the two burial pit types present at this site
(Table 40). A total of two individuals, one subadult and one of the
adult males, have simple pits, and the other six individuals (four
subadults and two adult males) have the shaft and side chamber
variety. In general, the orientation of the head within the burials
(Table 41) is to the northeast (n=3). There is also one individual
each with their heads to the east , southeast, and southwest. The
other two burials have an indeterminate head ori e ntation.
Artifact Occurrence
At this time, very few valid comments can be offered concerning
the artifact associations that characterize the Wall site mortuary
complex. Bearing in mind that the population sample from the Wall

ThBI.E 39.
Asscx::iatioo of Burial Posture with h]e arrl Adult/Subadult Categories 3.t the vall Site.
CM"EURY
~ in Years:
0-2 3-5
21-25 46+
'IOrnI,
Sub3.dul t/Adult:
&lb3.dult Adult
'IOI'AL
2 1 1 2
6
3 3
6
2
2
2
2
4 1 1 2
8
5 3
8
256

'Il\BIE 40.
Assoc:iaticn of Burial Pit 'l'yP= with .Age arrl Adult/ Sul:E.dult Categories at the Wall Site.
CT\'IHl:RY
0-2 3-5
21-25 46+
Sul::adult/Adult:
Sul::adult Adult
SIMPLE PIT
1
1
2
1 1
2
SiAFI' AND SIDE GlAMBER
3 1 1 1
6
4 2
6
4 1 1 2
8
5 3
8
257

'I1\BIE 41.
Asscx::iatim of Grave Orientatim with ~e arrl Adult/Sul:adult
CMBJ::RY
~ in Years:
0-2 3-5
21-25 46+
'lOmL
Sul:edult/l\dult:
&ll::adult Adult
Cate<pries at the Wall Site.
NE
1
1 1
3
1 2
3
E
1
1
1
1
SE SW
1 1
1 1
1 1
1 1
INDEI'ERMINATE
2
2
2
2
4 1 1 2
8
5 3
8
258

259
site is not representative, the following observations can be made.
Using the constrained criterion of association with two or more
burials of the same population segment, columella shell gorgets and
rolled copper beads occur only with subadults. The shell gorgets
present are similar to those found in southwestern Virginia,
including the Shannon site, but differ from those found in the
interior southwest of the Roanoke River (Hammett 1987:169; Sizemore
1984:6-11).
Although not a constrained relationship, among the adult males
clay pipes (n=l) and serrated mussel shell (n=l) are found only
with individuals aged 46+ (n=2) , who have no shell beads of any
type associated with them. The pattern for the small subadult
sample is similar to that for the Shannon site subadults . The
occurrence of mussel shell and clay pipes with older adult males at
the Wall site also parallels what is found at the Shannon site.
What is different is that no sociotechnic ornamental artifacts occur
with the males older than 45 years at the Wall site, whereas such
artifacts are common in this age group at the Shannon site. Both
sociotechnic ornamental and technomic a rtifacts are present in the
one Wall site male burial that is aged 21 to 25 years at death , and
in the subadult burials.
Wall Site Social Organization
There a re no older males at the Wall site that have the
artifact associations indicative of the special achieved status that
is characteristic of the few older males at the Shannon site.
Instead, the older males at the Wall site are more like the older
males at the Shannon site that have technomic associations. In the

260
Wall site sample, the young male 21 to 25 years old exhibits the
most unique status according to the technomic and sociotechnic
artifact associations present. What these few characterizations
indicate is that the sample is inadequate to provide a basis for
conducting the same kind of indepth study that could be done for the
Shannon site, and more work is needed at this site and related sites
to explore fully the status relationships that characterized the
Wall site society.
Mortuary Differentiation and Social Distinction at Upper Saratown-Locality 2
A total of 111 analyzed burials comprise the late
protohistoric/early contact period sample at Upper Saratown-
Locali ty 2. All age groups are represented in the sample, and 46 of
the 60 adults could be accurately sexed (25 males and 21 females).
The normative burial treatment accorded the majority of the
individuals in the sample (n=93) is a flexed primary position
(Table 42). One male exhibits an unusual position (lying on the
back with the legs crossed in a squatting position) , and two males
have an extended position with their legs flexed (both are in a
double interment with each other) . One adult individual of
indeterminate sex is in an extended position. Posture could not be
determined for 14 of the burials. In summary, the only variation
from the normative flexed body position is found in adult burials ,
primarily of males , as all the subadults exhibit a flexed posture.
Pits present at Upper Saratown-Locality 2 (Table 43) can be
divided into five categories--simple pit, shaft and side chamber,
shaft and central chamber, reused storage pit, and disturbed

261
'mBIE 42.
Association of Burial Pooture with k:Je, Sex arrl .Adult/Sutadult Categories at U];r:er &lrato..vn-Lo::ality 2.
EXl'ENDED W/ ~y Elm:NDED UNUSUAL LEGS FLEXED IND~'IB '!000.,
~ in Years:
0-2 6 1 7
3-5 17 1 18 6-10 13 1 14
11-15 2 1 3 16-20 4 1 5 21-25 1 1 26-30 15 1 1 17 31-35 6 6 l:i-40 4 3 7
41-45 4 1 1 6 45+ 8 1 9
Unid. Sutadult 1 1 2 Unid. M.ilt 8 1 9
'IOrAL 93 1 1 2 14 111
Sex:
Mile 18 1 2 4 25 Farale 20 1 21 Irrleterminate 55 1 9 65
'IOrAL 93 1 1 2 14 111
Sul:adul t/.Adul t
Suredult 39 5 44 Adult 50 1 1 2 6 ffi
'IOrAL 89 1 1 2 11 104

262
'mBLE 43.
Asscciatim of Burial Pit 'fyp= with kJe, Sex am. Adult/Suba.dult Categ::ries :i.t {4p=r Sarato.vn-I..a::ality 2.
ffiAFT AND c,.'IHIRY SIMPLE PIT SIDE CliAMBER CENIRAL CliAMBER DISIURBED SirnAGE PIT
l>qe in Years:
(}-2 5 2 7 3-5 6 3 8 1 18 6-10 7 2 5 14
11-15 1 1 1 3 16- 20 2 1 1 4 21-25 1 1 :26-30 3 14 17 31-35 1 5 6 36-40 3 4 7 41-45 2 4 6 45+ 2 2 5 9
Unid. Suba.dult 1 1 2 Unid. Adult 1 3 3 7 Irrletenninat 1 3 3 7
'IOmL 30 12 E() 7 1 110
Sex:
M:lle 4 1 19 24 Farele 4 6 10 1 21 Irrletenninate 22 5 31 7 65
'IOmL 30 12 E() 7 1 110
&ll::6dult/Adult
Subadult 20 5 16 3 44 Adult 9 7 41 1 1 59
'IOmL 29 12 57 4 1 103

263
(potted). Of the four undisturbed pit types, 49% (n=20) of the
subadults are buried in simple pits, 39% (n=16) in shaft and central
chamber pits , and 12% (n=S) in shaft and side chamber pits. No
subadults appear to have been buried in reused storage pits. Adults
as a whole are most often found in shaft and central chamber pits
(71%) , followed by simple pit (15%), shaft and side chamber (12%),
and finally, a reused storage pit (2%) . There does not appear to be
any association between pit type and a specific age group at Upper
Saratown-Locality 2.
Comparing subadults to adults, there does appear to be some
differenc e between the two in the type of pit in which they are
buried, with more subadults being found in simple pits and more
adults in shaft and central chamber pits. A factor that may affect
this pattern is that plowing has removed approximately the top foot
of most of the burial pits at the site. Because s~badult pits are
shallower (and smaller) than adult burial pits, more of the former
may have had the l edges indicative of a shaft and centra l pit plowed
away, which would bias the resulting subadult pit type sample in
favor of simple pi ts. For now there is no way to control for this
potential bias.
Considering sex and pit type associatio~, 79% (n=19) of the
males are buried in shaft and central cha~ber pits , 17% (n=4) of the
~ales in simple pits, and 4% (n=l) in shaft and side chamber pits.
Females vary with only 47% (n=lO) in shaft and central chaDber pits ,
19% (n=4) in simple pits , 29% (n=6) in shaft and side chamber pits ,
and 1% in a reused trash pit. Although shaft and central cha~ber
pits are the preferred pit type f or males and females, a great many

264
:nore males than females by count and per.::entage are associated with
t his type. The shaft and side chamber pit type accounts for the rest
of the major difference by sex, with a greater percentage and number
of females than males being interred in this pit type.
Orientation of the burials is generally to the east, with both
subadults and adults represented in all the east categories (Table
44). However, twice as many adults (n=l4) as subadults are oriented
t o the southeast. Both one subadult and one adult are oriented to
the south, and two adults have their h~ads oriented to the west. No
specific age group and neither sex appears to be associated with a
particular head orientation at Upper Sara~own-Locality 2.
Considering all these aspects of funerary treatment, the only
distinctions within the sample are in the type of pits in which
individuals are buried, and, to a lesser extent, the posture in
which the burials are interred. Females are always found in a
flexed position (one female burial has an indeterminate posture).
The great majority of the males are also buried in a flexed position
(n=18 with four indeterminate postures). However, only males of the
identified adults have a posture other than flexed--one example of
an unusual cross-legged position and two examples of extended
burials with flexed legs (a variation of the normative tightly
flexed posture). This indicates that, for some reason, a small
number of males were accorded burial treatment that differed from
the rest of the sample.
Considering pit typ2s, adults are found most often in shaft and
central cha~be= pits, subadults in simple pits. By sex, males have
1.nore shaft and central chamber pi ts than do females, and females

265
'l1IBI.E 44 •
Associatirn of Grave Orientation with Age, Sex arrl Adult/Sutadult Catecpries at Ug:Er Sarato,.n-I..ccality 2.
CA'IHXRY NE E SE s w INDEI'ERMINATE
Age in Years:
0-2 1 5 1 7 3-5 2 14 1 1 18 6-10 1 8 3 1 1 14
11-15 1 1 1 3 16-20 3 1 1 5 21-25 1 1 26-30 1 10 5 1 17 31-35 1 2 3 6 JS-40 2 2 3 7 41-45 1 4 1 6 45+ 1 4 3 1 9
Unid. Sutadult 1 1 2 Uri.d. Adult 1 5 2 1 9 Irrletenninat 1 3 3 7
'IDW, 13 61 20 2 2 13 111
Sex:
Mtle 4 12 4 1 1 3 25 Fara.le 2 12 4 1 2 21 Irrleterminate 7 37 12 1 8 65
'IOrAL 13 61 20 2 2 13 111
Sul:Edult/Adult
Sul::adult 5 28 6 1 4 44 Adult 7 30 14 1 2 6 ff)
'IOrAL 12 58 20 2 2 10 104

266
have more shaft and side cha~ber pits than do males. The
distinction between adults and subadults may reflect differences in
energy expe~ded in digging the burial pits, and it may reflect the
affects of post - depositional disturbance in the form of plowing on
the data set. The contribution of each to the observed adult
subadult pattern cannot be determined at this time.
The male-female difference in pit type , however, deserves more
comment. The low incidence of shaft and side chamber pits among
male burials suggests that certain femal~s were accorded
jifferential burial treatment in the society at Upper Saratown
Locality 2. Also, the one male with a shaft a~d side cha~ber burial
?it (Burial 108) differs from the rest of the sampl e in b ur i al
posture, it possesses the unus ual position noted earlier. This
unusual position is a squatting position with the head to the west.
The only artifacts associated with this individual are a clay pipe
and a single-strand necklace of small glass beads. The shaft and
side chamber pit identified with Burial 1J8 also differs from that
associated with the females and subadults , for whom a shal l ow cavity
into one side of the pit ~omprises the side chamber. The side
chamber for Burial 108 consists of a continuation of the central
shaft straight down with a step along one wall creating the side
chamber. There appears to be some unknown reason(s) other than
differential status for the funerary treat~ent accorded th2 male in
Burial 108. This and other patterns in the for mal funerary
treatment accorded certain segments of th2 population will be
considered again in the following examination of the artifact
associations at the site.
267
Artifact Occurrence
A total of 55 artifact typ2s, 21 aboriginal types and 34 types
of European origin, are present in the Upper Saratown-Locality 2
assemblage. Only seven of these artifacts are constrained on the
basis of age or 3ex (Table 45), when the constant association with
two or m::ire individuals of the same age or sex group criterion is
invoked.
Subadults have constrained associations with glass bead
leggings and unidentifiej brass objects, both of which exhibit
strong European connections. The glass beads are of European
origin, while the leggings ar2 of Indian manufacture. Adult
constrained artifacts are columella hairpins, clay pipes,
unidentified iron ·::ibjects, chipped ston::~ p::-ojectile points, brass
rings and red ochre. These artifacts can be identified as
aboriginal sociotechnic ornamental, aboriginal technomic, and
European sociotechnic ornamental and possibly technomic. In
addition to the unidentified iron objects, identified iron
artifacts, including single occurrences of a pair of scissors, a
hoe, an axe, a knife, and a spike/chisel, are found only with
adults. Only one artifact is constrained for females, brass rings,
a sociotechnic ornamental artifact of European origin. Males have
constrained associations with chipped stone projectile points, an
aboriginal technomic artifact.
In summary, subadults and females exhibit constrained
associations with Eun:>pean sociotechnic ornamental artifacts. Only
aboriginal technomic artifacts are constrained to males. And adults

'.mBLE 45.
Coostraina:1 Artifact Asscx:iations in the u~ Sarato.vn-I.ccality Sarrple.
Ferale
Brass rings
Suredult
Glass bead legµngs Misc. brass fragrrents
Male
01.i.i:µrl stcne projectile p::>int*
ldult
Colurella hairpin Clay pi~ Unid. irm cbject Csi;p Brass rings Red ocnre
* Ou.i;µrl stcne projectile p::>ints were asscx:iated with 2 males and 1 unidentified adult.
268

have constrained relationships with both aboriginal and European
soc iotechnic ornamental , and aboriginal technomic artifacts.
269
Examining the distribution of iron and brass artifacts within
t he adult sa mple by sex (see Appendix A) , an unconstrained
relationship for these items with females ca~ be documented. There
are a total of 12 artifacts made of iron or brass (brass gorgets,
l arge brass tubes , geometric brass pendants , brass wire, small brass
bells , rolled brass beads, iron scissors , iron knife , iron hoe , iron
axe , iron spike/chisel , and unidentified iron object) that are found
wi th either m:1.les or f emales. Of these , only four--brass wire,
s mall brass bells , rolled brass beads , and unidentified iron
object--are found with male burials. Only the brass wire is found
so l ely with a male (n=l), and only one male possesses small brass
bells (two females do) . Also , six fema l es have rolled brass beads
as opposed to tw·:::> males. All five of the identified iron technomic
artifact types are fou nd only with females, and three of the six
brass sociotechnic artifacts are found only with females. This
general relationship underscores the differential funerary treatment
accorded certain females at Upper Saratown-Locality 2 relative to
other segments of the population, including m:1.les.
Principal Component Analysis
A total of 16 factors with eigenva l ues greater than 1 were
extracted from the principal component analysis of the Upper
Saratown-Locality 2 sample. The first six factors represent
more than 561 (17 . 55 of 31.3261 49) of the total variance exhibited
by th~ rotated factor pattern (Table 46 and Appendix B). Among
these first six factors a number of distinct patterns of positive

FACTCR #
1
2
3
4
5
6
7
8
9
10
11
12
'mB1E 46.
St.mrary of the Factor Analysis Pattern for the Ug;:er Saratown-Lxality 2 Sarrple.
3.8 (12.1%)
gra.ipaj 3.7 (11.8%)
gra.ipaj 3 . 5 (11. 7%)
gro..i_p:rl 2.3 (7.3%)
gro..i_p:rl 2.2 (6.9%)
2.1 (6. 7%)
gro..i_p:rl 1. 7 (5.4%)
gra.ipaj 1.6 (5.1%)
1.6 (5.1%)
gro..i_p:rl 1.5 (4.8%)
gro..ip:rl 1.4 (4.5%)
gro..ip:rl 1.3 (4.1%)
mlurella shell hairpins + drig::ed stcne projectile roint M+ chir:pa:l strne drill + stcne/rock + * clay rot rnidentified irrn cbject +
irrn knife F+ * irrn h::>e F+ * irrn spike/chisel F+ * brass rings F+
mlurella shell disc beads F+ * irrn scissors F+ * rretal spx:n FSi\
turtle carap:i.ce cup - * clay rot large brass cx:nes - *
gro..irrl strne discs clay di_g:Er - *
- *
gro..irrl st.me celt + * hamrerstcne + *
chir:pa:l strne flakes M+*< red ochre +
geaTEtric brass p:!ooants FSA. large brass bells -*
deer lx:ne beads -* large brass beads FSA
fired clay lunp -* brass gorget FSA srrall brass bells
srrall glass beads lead shot
clay pip:! + brass wjre M+*
270

13
14
15
16
Crnstraints: + adult rnly - sul::adul t only
271
TABIB 46. (a:ntinued)
I..OADIN3 VARIAN::E PA'I'Iflm EXPI..AINEil DIJlGDSTIC FCSITIVE I..OADIN3S
specific 1.2 (3.8%) ir01 axe F+*
sr;ecific 1.2 (3 . 8%) rollerl brass beads
si;:ec:ific 1.0 (3.2%) miscellanea.is brass fragrrents -
sr;ecific 1.0 (3 . 2%) brass an:i.rral effigy -*
M rrale rnly MSA rrales & sul::E.dults * (n=l) F fera.le only FSA fera.les & sul:adults < rrales 45+ yffi.rS

272
technomic loading coupled with few ornamental loadings can be
identified, with these patterns perhaps defining groups of tool
kits. Factor 1 possesses gro~ped positive loadings for colum2lla
hairpins, chipped stone projectile points, chipped stone drills,
stone/rocks, clay pots, and unidentified iron objects. The
tech~omic artifacts represent general huntin g, and tool and ornament
manufacturing kits. One of these artifacts , chipped stone
projectil e points, is constrained to males. With the exception of
the clay pot category, which in two instances is found with
SJbadults and in two instances with unidentified adults, all these
artifacts are associated with adults.
Factors 2 and 3 represent grouped patterns that load positively
for sociotechnic and tech~omic items of European origin associated
with females. The artifacts in Factor 2 consist of the iron knife,
iron hoe, iron spike/chisel and brass rings. This factor exhibits a
domestic/agricultural orientation , and also possesses sociotechnic
artifacts in the form of the brass rings. Factor 3 loads positively
for columella small disc beads, iron scissors, and metal spoons.
The first two artifacts are found only with females, and metal
spoons are found only with females and subadults. These reflect a
domestic asse~blage that also includes an aboriginal sociotechnic
~rtifact type.
Factors 4 and 5 represent grouped patterns that are strongly
oriented toward the subadults in the sample. Factor 4 loads
positively for turtle carapace cups, clay pots, and large brass
cones. This collection of artifacts consists of European
sociotechnic ornamental types and aboriginal technornic items that

273
are associated in general with food consu~ption. Factor 5 loads
positively for ground stone discs and clay dippers . Both of these
art ifacts are aboriginal in origin, and represent sociotechnic and
technomic artifacts respectively. The clay dipper is associated
with food consu~ption, as are the aboriginal technomic artifacts in
Factor 4 .
Factor 6 represents a grouped positive loading on adult
aboriginal artifacts--hammerstones and ground stone celts. The
for mer is a technomic artifact associated ·,,ith tool making , and the
l atter is a sociotechnic item.
Factors 7 and 12 are both grouped patterns that exhibit a male
orientation. Factor 7 consists of chipped stone flakes, a technomic
ar tifact , found with one male aged 45+, and red ochre, a
sociotechnic artifact , constrained to adults (six males and one
female). Factor 12 also has two artifacts , clay pipes and brass
wire. Clay pipes , a sociotechnic artifact , are constrained to
adults, being found with six males, one female and two unsexed
adults. The brass wire , whic~ may be a bracelet, a sociotechnic
ar tifact , is associated with a male aged 26 to 30 years at d eath.
Factors 8 and 9 are also grouped, and include ornamental
sociotechnic items. The Factor 8 artifacts are geometric brass
pendants that are found with females (n=2) and subadults (n=S) , and
large brass b el ls that are found with only one subadult. Factor 9
loads positively on larg e brass t"Jbes , which are associated with
females (n=2) and subadults (n=B) , and deer bone beads , which are
found with one s..1badult .

274
Factor 10 has another grouped pattern with positive loadings.
The artifacts in this factor consist of a fired lu~p of clay, a
technomic item found with a s ubadult; brass gorgets, a sociotechnic
item found with females (n=2) and subadults (n=7) ; and small brass
bells, a sociotechnic ornamental item found with males (n=l) ,
females (n=2) and subadults (n=8).
Factor 11 is the last factor that has a grouped pattern. Small
glass beads, a sociotechnic ornamental artifact found with males
(n=l 4) , females (n=ll) , unsexed adults (n=l4), and subadults (n=30) ,
and lead shot, a technomic possibly sociotechnic artifact found with
one male aged 31 to 35 years at death, one female aged 16 to 20
years at death, and four subadults .
Factors 13, 14, 15 and 16 a ll have specific positive loading
patterns. Factor 13 consists of an iron axe , a technomic possibly
sociotechnic artifact, found with an adult female aged 26 to 30
years at death. The item in Factor 15 is miscellan2ous brass
fragments, a technomic, probably sociotechni c , artifact found with
subadults (n=2). Likewise , Factor 16 consists of a sociotechnic
artifact, a brass animal effigy associated with a single subadult
burial.
Factor 14 loads positively for rolled brass beads, a
sociotechnic ornamental item. This artifact is found predominately
with females (n=6), and to a lesser extent with subadults (n=3) and
males (n=2).
To summarize the results of the principal component factor
analysis , there appears to be discernible patterns in the
distribution of artifacts in the mortuary complex at Upper Saratown-

275
Locality 2. Grave associations tend to emphasize age and sex, with
females and subadults apparently being highlighted by the technomic
ar tifact associations and the variation in the occurrence of
orn3mental sociotechnic artifacts .
Agglomerative Cluster Analysis
All 111 burials in the Upper Saratown-Locality 2 sample could
be included in the agg l omer ative cluster analysis of the factor
scores produced for each burial in the sample. A total of 11
c lusters were produced by this cluster ing technique (Table 47 and
Appendix C) . Cluster 1 consists of 85 individu a l s , the greater
portion of the sample , wh~ possess no artifact associations , or who
pos sess sociotechnic ornamental artifacts of European (primarily
glass beads) and aboriginal origins and a fewer tech nomic items of
both European and aboriginal manufacture. This cluster is composed
o f 18 males , 16 females , 6 unsexed adults , and 34 subadults of all
ag e grou ps .
The remaining ten clusters segr egate the sample into male ,
f emale and subadul t groupings. Clusters 2 and 7 appear to represent
ma le grouping s (given the artifact associations) , although only
individuals in Cluster 2 coul1 be accurately sexed.
The Cluster 2 sample con sists of 13 individuals , seven males
(two aged between 18 and 25 years and four over 40 years of age) ,
one female aged 16 to 20 years , one unsexed adult , and four
s ubadults (one aged Oto 1 year , two aged 3 to 5 years , and one aged
11-15) . Inclusion in this group is primarily dependent on the
pr esence of red ochre (aboriginal sociotechnic) or lead shot
(European technomic) . The two males with associated chipped stone

TI-\BIE 47.
Surrrary Descriptim of the 11 Grrupings Cefined by the Agglarerative Cluster Aralsysis for the U:i;:p=r Sarato...n-Lccality 2 Sample.
Cluster 1 : Nunber of Irrlividuals 85 Nurrter of Males 18 Nunber of Fe:rales 16 Nurrter of Mults 45 NuTber of Sutadults 34 Nurber of Unidentified 6
Cluster M:rrbers: 2, 3, 4, 5 , 6 , 7, 9, 10, 11, 12, 13, 14, 16, 18, 19, 20, 21, 22, 23, 24, 25, 26, 27, 29, 30, 32, 34, 35, 38, 39, 40, 41, 46, 47 , 49, 50, 51, 52, 54, 56, 58, 59, 60, 61, 62 , 63, 64, 65, 66, 67, 70, 72, 73 , 74, 75, 76, 77, 78, 79, 81, 82, 83, 85, 86, 87, 88, <X), 92, 93, 94, 97, 98, g:J, 100, 101, 102, 105, 106, 107, 108, 10'9, 111.
Cluster 2: Nurber of Irrlividuals 13 Nurber of Mtles 7 Nurber of Fatales 1 Nunber of Mults 9 NuTber of Sutadults 4 Nurber of Unidentified 0
33, 53, 69, 84,
Cluster M::rrbers: 28, 42, 45a, 45b, 48, 55, 68, 71, 89, 95, 96, 104, 110.
Cluster 3: NuTber of Irrlividuals 3 Nunber of Mtles 0 NuTber of Fatales 1 Nurber of Mults 2 NuTber of Sub3.dults 1 Nunber of Unidentified 0
Cluster l'-arbers: 8, 31, 36.
Cluster 4: Nurt:er of Irrlividuals 3 Nurber of Males 0 Nurber of Fe:rales 1 Nurber of .Adults 2 Nunber of Sutadults 1 Nurber of Unidentified 0
Cluster M::rrbers: 43 , 57, 91.
Cluster 5: Nunber of Irrlividuals 1 Nurber of Males 0 Nunber of Fe:rales 0 NuTber of Mul ts 0 Nurber of Sutadults 1 Nurber of Unidentified 0
Cluster M:ID::Jers: 103.
276
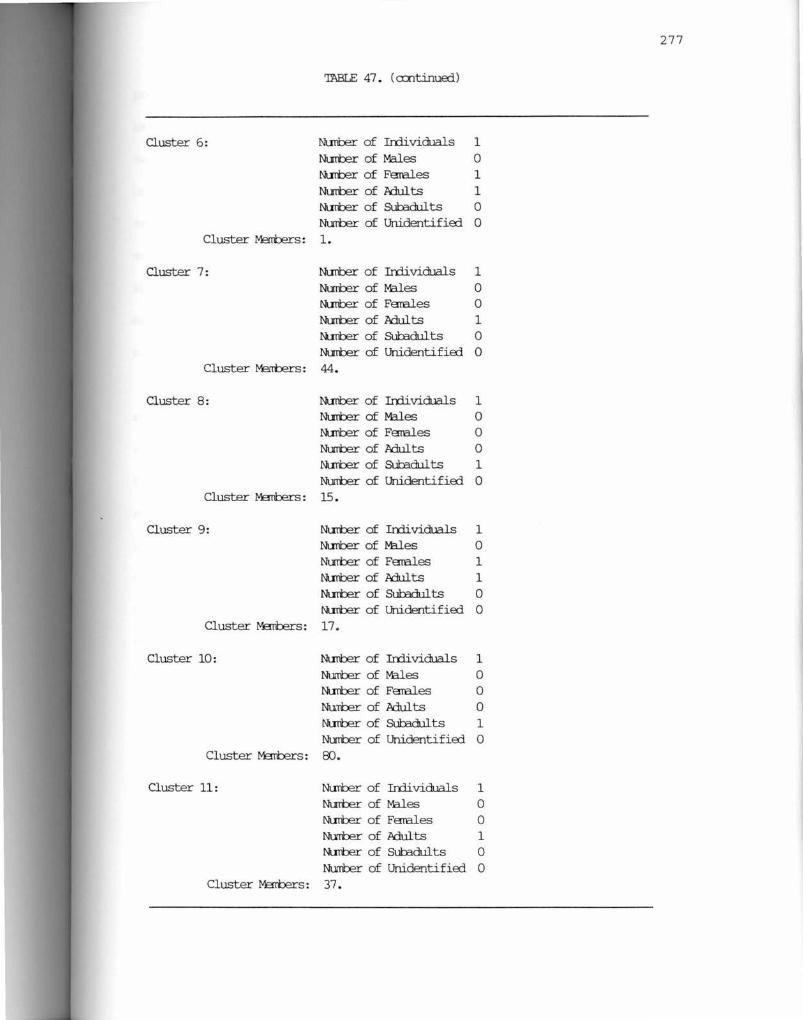
277
ThBLE 47. ( cx::ntinua:1)
Cluster 6: Nunber of Irrlividuals 1 Nurber of Males 0 Nurber of FE!!ales 1 Nurber of l\dul ts 1 Nurber of Sul::adults 0 Nurrt:er of Unidentifia:1 0
Cluster Metbers: 1.
Cluster 7: Nutter of Irrlividuals 1 Nurber of Males 0 Nutter of Fatales 0 Nurber of l\dul ts 1 N..rrber of Sul::adults 0 Nurber of Unidentifia:1 0
Cluster M:!JTbers: 44.
Cluster 8: Nunber of Irrlividuals 1 Nurber of Males 0 Nunber of FE!!ales 0 Nurrt:er of .Adults 0 Nurber of Sul::adults 1 Nurrt:er of Unidentifia:1 0
Cluster M3nbers: 15 .
Cluster 9: Nurber of Irrlividuals 1 Nurber of Males 0 Nurber of FE!!ales 1 Nutt:er of .Adults 1 Nurber of Sub3dults 0 Nurber of Unidentifia:1 0
Cluster Metbers: 17.
Cluster 10: Nutter of Irrlividuals 1 Nurrt:er of Males 0 Nurber of FE!!ales 0 NuTter of l\dul ts 0 Nurber of Sul::adults 1 Nurber of Unidentifia:1 0
Cluster Metbers: 00.
Cluster 11: Nutter of Irrlividuals 1 Nurber of Males 0 Nurber of FE!!ales 0 Nurrt:er of l\dul ts 1 Nurber of Sul::adults 0 Nurrt:er of Unidentifia:1 0
Cluster Metbers: 37.

projectile points are also in this cluster, and other artifact
associations include chipped stone flakes (n=l), clay pipes (n=2
males), brass gorgets (n=2 subadults with lead shot), brass bells
(n=l subadult), and rolled brass beads (n=2, 1 unsexed adult with
red ochre, and 1 female with red ochre and lead shot). The
artifacts other than red ochre and lead shot comprise both
aboriginal technomic items associatej with hunting and tool
manufacturing and sociotechnic artifacts made of European derived
materials (brass beads, brass bells and brass gorgets).
278
Cluster 7 (n=l) consists of one adult that could not be
accurately sexed or aged. The artifact in this cluster found only
with males is a chipped stone projectile point (n=2), the artifact
found predominantly with males is a clay pipe (n=6), and an artifact
split between identified males (n=l) and females (n=l) is an
unidenti fied iron object. The columella hairpin present with this
individual is found only in one other burial at the site, that of a
female, and the rolled brass beads in the Cluster 7 burial are found
predominately with females, although two other male burials at Upper
Saratown-Locality 2 also have this artifact type. In general, the
artifacts present in the Cluster 7 burial include an aboriginal
technomic item associated with hunting and tool manufacture, an
aboriginal sociotechnic ornamental item, and an European
technomic/sociotechnic item (the unidentified iron object) .
A total of five of the remaining five clusters--3, 4 , 6, 9, and
11--all appear to be correlated with females, females and subadults,
or suggest a correlation with females. The primary artifacts that
set off the individuals in these clusters include sociotechnic ite ms

279
manufactured of brass obtained from Europeans (rolled beads,
tubes/cones, gorgets , geometric shaped pendants), sociotechnic items
obtained from the Europeans (brass bells), technomic artifacts of
iron obtained from Europeans (scissors and axe) , a miscellaneous
metal technomic item of European origin (a spoon) , aboriginal
sociotechnic artifacts (deer bone beads , columella shell cylindrical
and disc beads, and a col umella shell gorget) . The technomic items
of European origin are present in four of the five clusters. Only
Cluster 11, which is composed of an unsexed adult with artifact
associations (rolled brass beads) that suggest a female orientation,
does not have any technomic artifact of European origin.
Cluster 6 is composed of one adult female aged 18 to 22 years
at death , that also shows evidence of cranial deformation. This
individual had been interred in a shaft and side chamber pit. This
burial possesses both aboriginal (shell beads) and European-derived
(brass gorget, brass pendants, and brass bells) sociotechnic
artifacts. Also , two of the technomic artifacts of European origin
that reflect a domestic orientation , scissors and a spoon , are
present. And this burial has an unidentified iron object associated
with it.
Cluster 9 is unique in that only objects of European origin are
present. This cluster consists of one adult female , an old female
more than 45 years of age , who also has cranial deformation , and is
buried in a shaft and side chamber pit. Technomic artifacts in this
cluster include an iron knife , an iron hoe , and an iron
spike/chisel , all of which are tools with possible associations with

280
horticulture. Sociotechnic items include a brass gorget, geometric
brass pendants , and brass rings.
The individual females associated with Clusters 6 and 9,
despite their differences in age, stand out from the rest of the
sample in the sociotechnic and technomic artifacts they possess,
their funerary treatment , and their physical appearance.
Clusters 3 and 4 both contain a mix of females and subadults.
Cluster 3 has a female aged 26 to 30 years of age, an unidentified
adult, and a subadult aged 6 to 10 years . This cluster possesses
one of the two aboriginal sociotechnic ornamental artifacts, deer
bone beads , that occur only once in the mortuary complex at Upper
Saratown-Locality 2. Sociotechnic artifacts in this cluster that
are manufactured of European-derived materials include large brass
tubes and rolled brass beads. One European technomic artifact
present is an iron axe.
Cluster 4 possesses a female 30 to 35 years of age , and two
subadults , one 1 to 2 years in age and the other 6 to 10 years of
age. Cluster 4 (composed of one adult female , one unidentified
adult and one subadult) has the other one of the two aboriginal
sociotechnic artifacts that occur at the site only once, an incised
(with a rattlesnake design) columella shell gorget. Sociotechnic
artifacts made of brass obtained in trade with the Europeans include
brass tubes and rolled brass beads (like Cluster 3), and brass
gorgets, brass pendants, and brass bells.
The final three groups denoted in the sa~ple by Clusters 5,
8 and 10 are all composed of individual subadults. The burial in
Cluster 5 is aged 5 to 10 years , and has associations only with

281
European sociotechnic items--glass beads and a brass ani mal effigy.
Cluster 8 has a subadult also aged 5-10 years at death. The only
European sociotechnic artifacts present in this cluster are large
brass cones. Two aboriginal t echnomic artifacts, a turtle carapace
cup a~d a clay pot, are also present . The burial that comprises
Cluster 10 is a subadult aged 3 to 5 years at death. European
sociotechnic artifacts with this individual include brass
tubes /cones and large glass beads. An aboriginal sociotechnic
artifact , ground stone discs, and an aboriginal technomic item, a
clay dipper, are also associatej with this subadult.
In summary the results of the agglomerative cluster analysis
show that there are distinct male and female artifact associations
that may indicate differential status in the Upper Saratown-Locality
2 society. Males with a special status are separated from the other
segments of the society by aboriginal and European technomic
artifacts associatej with hunting and warfare (chipped stone
projectile points and lead shot), and an aboriginal sociotechnic
item, red ochre. These distinguished males evidence fewer
sociotechnic artifacts in general, but especially ornamental types,
than do the other segments of the sa~ple.
Females with a special status appear to possess a wide range of
aboriginal and European-derived sociotechnic artifacts, including a
variety of ornamental types , and a number of technomic items,
primarily of European origin , that can be associated with
horticulture and domestic activities. Artifact types of European
origin or manufactured of materials obtained from Europeans
predominate among the females.

282
This pattern of fema l es possessing both sociotechnic and
technomic artifacts a l so exists in the earlier re l ated site of Upper
Saratown- Locality 1 . Bur ial 3 at this protohistoric period Sara
v i llage is an adu lt female 20 to 30 yea r s of age (J. Wi lson
1983 : 383) . Sociotechnic artifacts that accompany this individual
i nclude an incised (with a r attlesnake design) shell gorget, two
shell ha irpins , co lumella she l l cylindrical beads , and marg inella
shell beads that had originally been sewn on a cloak or sleeved
garment . Technomic artifacts with this b urial are one unworked
mussel s h el l, one turkey t ibiotarsal a wl , t wo deer longbone
ne edles/awls , two quartz flakes . What appear to be the remains of
bags of animal bone beads--turkey phalanx beads and rabbit
innominate beads--along with a number of turkey longbone bead
"b l anks" and small stones, can be identified with the technomic
art ifacts listed as a bead-making kit . Burial 3 had also been
placed in a shaft and side chamber burial.
The relation of the two Upper Saratown locales is quite
explicit when the material assemblages of the two sites are
compared, and a direct lineal relationship between the two has been
suggested (J. Wilson 1983 : 377-454) . The Burial 3 artifact
associations clearly show a profound difference from that documented
for the male-dominated Shannon site sa~ple, where no females of any
age possessed turkey tibiotarsal awls , deer longbone awls, or
unaltered mussel shell. Only Shannon site males possessed these
a r tifacts . Unfortunately , the sample from Upper Saratown-Locality 1
is the smallest considered in this study (n=6) , consisting of only
the one adult female and five subadults . Obviously, no patterns

283
that can be used in comparison with the other samples can be
extracted from this late protohistoric period site. However, the
information furnished by Burial 3 does conform to the pattern of
female association with both sociotechnic and technomic artifacts in
the slightly later sample at Upper Saratown-Locality 2, and
provides some time depth to this pattern.
S~badults found in clusters other than the main sample
grouping of Cluster 1 at Upper Saratown-Locality 2 tend to possess
primarily sociotechnic artifacts of European origin, with a small
number of aboriginal technomic and aboriginal sociotechnic items
als ~ being present.
Trace Ele~ent Assays and the Upper Saratown-Locality 2 Agglomerative Cluster Analysis
Table 48 provides a summary of the average trace element assays
that are associated with each of the 11 clusters defined by the
agglomerative cluster analysis of the Upper Saratown-Locality 2
sample. Only two clusters, 1 and 3, have lower strontium than the
sample mean of 788 ppm. The two clusters with the highest strontium
levels are 4 and 6, with Cluster 4 having one female, one unsexed
adult and one subadult. Cluster 6 comprises the young female aged
18 to 22 years at death that exhibits the outstanding funerary
treatment. These strontium figures indicate that there is some
variation among the female-associated clusters in regard to plant
food consumption.
The highest zinc levels are present in Clusters 4 and 9, which
are both composed of older females. The individual in Cluster 9 is
the older counterpart of the Cluster 4 female that also exhibits a
distinctive funerary treatment in the society. For Clusters 4 and

284
TABIB 48.
Average Trac-e Elarent Assays by h:Blarerative Cluster for the UJ?fEr Sarata..Jn-I..cx::ality 2 .Adults.
Jl£Il.CMRATIVE
CLUS1'ER # n SIRCNI'IlM MNN:STIM ZIN: CJPPER LEAD
1 39 785 1129 397 32 79
2 7 823 1089 337 68
3 1 586 1194 275 TI
4 1 1019 964 416 38
5 0
6 1 935 1033 247 102
7 0
8 0
9 1 Em 1092 428 79
10 0
11 0
Sanple M:!an 42 1099 376 1.0 TI

285
9, the two groups with the highest zinc levels, however, the
strontium levels are also high. This indicates that the protein
being used as a food resource by these two older females comes from
a source other than animals, most likely nuts. This resembles the
pattern noted among the older males at the Shannon site.
In summary, it appears that females identified as having a
special status at Upper Saratown-Locality 2 exhibit the same
variability in their diet and access to protein as do the rest of
the sample, as indicated by the trace element assays.
Monothetic Division Cluster Analysis
All 111 burials and 42 artifact types could be used in the
monothetic division cluster analysis of the Upper Saratown-Locality
2 sample. A total of five clusters were delineated (Table 49
and Figure 10). The results of Clustan ' s Procedure Rules used to
chose the optimum cluster solution are given in Appendix C.
The initial division within the society is between those
individuals with small glass trade beads (n=71) and those that have
none (n=40). Those with small glass beads are divided into a group
with brass gorgets (Cluster I , n=9) and one without brass gorgets
(n=62). The burials without brass gorgets are subdivided into those
with large glass beads (Cluster V, n=39) and those without large
glass beads (Cluster III, n=23).
The 40 burials that do not possess glass trade beads are
subdivided into two groups, one with no artifacts (Cluster II,
n=16), and a group wi th some artifact occurrence (Cluster IV, n=24).
The artifacts that are found with the burials in Cluster IV are
listed in Appendix A.

'Il\BI.E 49.
Surrrary Descriptim of the Five Groupings Dc!fined by the M::loothetic Cluster An3.lsysis for the Ui:::µrr Saratown Lcx:::ality 2 Fq;:ulaticn.
Cluster I: Nunber of Irrlividuals 9 NuTter of M3J.es 0 Nurber of Fera.les 2 NuTtEr of Adults 2 Nunber of Sul::adults 7
Nurrber of Unidentified 0 Cluster~= 1, 5, 8, 17, 43, 54, 55, 57, 71. Attriootes Camm to all~= smll glass reads, brass gorgets.
Cluster II: Nurrber of Irrlividuals 16 Nurber of M:l.les 3 NuTtEr of Fera.les 4 Nunber of Adults 9 NuTtEr of Sul::adults 6 Nurber of Unidentified 1
Cluster M3nbers: 4, 7, 11, 12, 14, 18, 25, 32, 67, 79, 86, 88, 90, 101, 105, ill.
Attriootes Camm to all ~: tb artifacts.
Cluster III: NuTtEr of Irrlividuals 23 Nurber of M:l.les 2 Nur'rer of Fera.les 7 Nurber of Jldults 13 Nurt:er of Sul::adults 9 Nunber of Unidentified 1 13, 34, 35, 36, 38, 39, 40, 46, Cluster Marbers: 47, 48, 50, 51, 56, 64, 65, 66, 69, 72, 74, 76, 95, 107, 109.
Attriootes Camm to all M3nbers: smll glass reads, large glass reads
Cluster N: NuTtEr of Irrlividuals 24 Nunber of M:l.les 8 Nurt:er of Perales 5 Nunber of Jldults 17 Nurrber of Suradul ts 7 Nurber of Unidentified O
Cluster ~Tters: 9, 15, 16, 20, 22, 24, 26, 27, 29, 30, 33, 37, 44, 45a, 45b, 49, 77, 78, 87, 91, 96, 102, 104, no.
Attriootes Camm to all ~: Absence of smll glass reads.
286

Cluster V:
TABIE 49 . (cxntinue::i)
Nurber of Irrlividuals 39 Nurber of M:1..1.es 12 Nun::er of Feral.es 3 Nurber of Adults 19 Nurber of Sul::adults 15 Nurber of Unidentifiej 5
Cluster M:rrbers: 2, 3, 6, 10, 19, 21 , 23, 28, 31, 41, 42, 52, 53, 58, 59, 61 , 62, 63 , 68, 70, 73, 75, 80, 81, 82, 83,
Attributes Carrn::n
84, 85, 89, 92, 93, 94, 97, 98, 99, lOJ, 103, 106, 108.
to all M:mters: srall glass l:e:tds.
287

Without Small Glass Beads n=40
CLUSTER II With No Artifacts n=16
I I CLUSTER IV With an Artifact n=24
111 Burials
With Small Glass Beads n=71
Without Brass CLUSTER I Gorgets With Brass n=G2 Gorge ts
n=9
i CLUSTER V Without Large Glass Beads n=J9
CLUSTER III With Large Glass Beads n=2 J
Figure 10. Monothetic division clusters produced for the artifacts associated with the Upper Saratown-Locality 2 burials.
288
289
The separation within the sample as defined by the use of
monothetic division cluster analysis appears to be due to the
presence/absence of small glass trade beads (a European sociotechnic
ornamental artifact) and brass gorgets (a sociotechnic item made of
material obtained by trade with Europeans).
Clusters I, III, and Vall possess small glass trade beads. In
Cluster I, all the individuals also possess brass gorgets. These
individuals include two females (one 16-20 years old, and one aged
46+), and seven subadults (two aged Oto 2 years at death, three
aged 3 to 5 years, and two aged 6 to 10 years). Although no
hierarchy can be observed according to age, a female-associated
grave assemblage indicative of a special status that contains
sociotechnic artifacts is defined by Cluster I. If Burial 91, a
female aged 31-35 years who possesses a columella shell gorget
incised with a rattlesnake design and a rolled brass bead necklace,
is taken from Cluster IV and added to Cluster I to create a generic
gorget group, then three females aged 16-20 years, 31-35 years and
46+ years are present. With this configuration, only the ten-year
age segment from 21 to 30 within the sample is without at least
one representative that possesses a gorget.
Cluster III comprises 23 individuals that possess both large
and small glass beads. This group includes seven females of all age
groups, two males (one aged 26 to 30 years and the other aged 36 to
40 years), and nine subadults (one Oto 2 years of age, five 3 to 5
years of age, two 6 to 10 years of age, and one 11 to 15 years of
age). Also, there are four unsexed adults, two of which are 26 to
30 years of age. Again, there appears to be a strong
290
fem ale/subadult orientation in this cluster which is denoted by the
pres e n ce of European sociotechnic ornamental artifacts.
Cluster V contains 39 individuals that all possess small glass
beads. In this grou p are 12 males (five aged 26-30 years , one aged
31-35 years , three aged 36-40 years , one aged 41-45 years , and two
aged 46+) , three females (one aged 31 to 35 years , one aged 36 to 40
year s , and one aged 46+) , four unsexed adults (one of which is aged
26 to 30 years at death) , and 15 subadults (one 0-2 years of age ,
e ight 3-5 years of age , three 6-10 years of age , one 11-15 years of
age , and one subadult that could not be accurately aged) . Another
f ive individuals in the cluster could not be identified as to age or
s ex. Thus , while no age-specific associations can be identified in
Cluster V, there are more males than females in the group.
Of the two remaining divisions of individuals with no small
glass trade beads, Cluster II is composed of individuals with no
ar tifact associations and Cluster IV comprises the 24 burials that
possess some type of artifact but no small trade beads. Cluster II
has 16 burials , including four females (one aged 26-30 , one aged 36-
40 , one aged 41-45 , and one aged 46+) , three males (one 31 to 35
years old , one 36 to 40 years old , and one 41 to 45 years old) , two
unidentified adults, six subadults (one aged 0-2 years and 5 aged 6-
10 years) , and one unidentifiable individual . Adults of different
ages and both sexes are present , but no subadults aged 3 to 5 years
a t death .
The 24 burials in Cluster IV consist of five females (two aged
16-20 years old, one aged 26-30 years old, one aged 31-35 years old,
and one aged 46+ years old) , eight males (one aged 16 to 20, two
291
aged 26 to 30, one aged 31 to 35, two aged 41 to 45 , and two aged
46+), and four unidentified adults (one aged 21-25 , one aged 26-30 ,
and two of indeterminable age) . Also, seven subadult groups (two
aged Oto 2 years, two aged 3 to 5 years , two aged 6 to 10 years,
and one aged 11 to 15 years) are present in this cluster.
In summary, the monothetic division analysis continues to
emphasize those patterns first delineated in the principal component
analysis and the agglomerative cluster analysis. Females and
subadults appear to be associated with European sociotechnic
artifacts , as illustrated by Clusters I and III . Males do appear in
one of the clusters which evidence European sociotechnic artifacts
(Cluster III), but there appear to be fewer European sociotechnic
artifacts associated with males in general.
Upper Saratown-Locality ~ Social Organization
In contrast to the Shannon site sample, some females at Upper
Saratown-Locality 2 exhibit artifact associations that are
interpreted here to indicate a special status when compared to the
rest of the sample. The analyses that have been reported in this
section suggest that certain females of all ages and subadults aged
3 to 5 years at death have a status that differs from the rest of
the society. Also, a number of females and subadults are separated
from the rest of the sample by the presence of gorgets made of both
shell and brass. The one shell gorget associated with a burial at
Upper Saratown-Locality 2, a female aged 30 to 35 years old, has an
incised rattlesnake motif. This artifact could be a clan marker,
possibly indicating that clan membership is decided within the
female line. This would be consistent with the generally accepted

292
identification of this Siouan population being a matrilineal based
society. Swanton (1946:661) notes that snake clans are present
among both Siouan and Algonquian groups of the Southeast. An
alternative explanation is that this shell gorget , and the brass
gorgets, are lineage status indicators that mark special status
females and subadults in a matrilineal society. This implies that
those subadults with gorgets are female.
Related to this question of shell and brass gorgets as status
indicators is the distribution of shell gorgets among the late
prehistoric sites of the mountains of western North Carolina and
eastern Tennessee (cf. H. Wilson 1983; J. Wilson 1987). In these
populations shell gorgets are almost invariably associated with a
select number of females and subadults (Kneberg 1959:39; Lewis and
Kneberg 1946:147; Smith and Smith 1987) . It is possible that this
artifact, which apparently indicated a differential status of the
female and subadult burials in which they occur , diffused from the
mountains into the Piedmont of North Carolina during the
protohistoric period following Spanish contact in the sixteenth
century. In the protohistoric period Siouan populations , to which
the Sara Indians belong, these indicators of female status were
possibly incorporated as an indicator of a special status that
certain females and subadults already possessed. During the latter
portions of the protohistoric period and into the contact period,
this badge of female status came to be manufactured of brass. This
proposition cannot be investigated further in this study , but it can
be addressed by future research involving the various Indian groups

of the central , western , and southwestern North Carolina Piedmont
a nd the Mountains of North Carolina and Tennessee.
293
Another possible grave association that could be a status
marker , which also may have diffused from the Mountains during the
early part of the protohistoric period, is the shaft and side
chamber burial pit. This burial pit type has been identified at the
late prehistoric period late Pisgah phase sites , which date to A. D.
1250-1450 (Dickens 1976:206 ), in the mountains of western North
Carolina. As noted in this chapter this burial pit type is found at
all of the sites in this study. The time depth of the shaft and
side chamber burial pit in the Carolina and Virginia Piedmont needs
to be more fully explored before its distribution can be tied to
interaction between Indian societies of the protohistoric period.
As expected, given the hypotheses that guide the research
conducted for this section, more younger individuals and subadults
have sociotechnic artifacts that differentiate them from the rest of
the late protohistoric/contact period sample at Upper Saratown
Locality 2. This differs from the pattern exhibited by the earlier
late prehistoric Shannon site. However , young males at Upper
Saratown-Locality 2 do not appear to have artifact associations that
would indicate they possessed a status similar to females . Males
appear to continue to be associated with technomic hunting/warfare
artifact types , while females appear to be associated with technomic
artifacts useful in horticulture. This pattern is distinct from
that noted at the Shannon site. Also , iron and brass artifacts are
general l y associated with segments of the Upper Saratown-Locality 2
sample that do not include males. Both females and subadults

294
possess the great majority of the identified and unidentified brass
and iron artifacts. Only two males possess rolled brass beads (six
females do), only one male burial contains an unidentified iron
object (as does one female burial), only one male burial possesses
small brass bells (two females do), and only one male interment has
a brass object, wire, that no female burial has.
The patterns exhibited for the Upper Saratown-Locality 2 appear
to be indicative of a society in which females evidence both
achieved and ascribed status, and males possess achieved status.
This is consistent with what probably characterizes a matrifocal
society. The patterns also are consistent with the importance
of women rulers in southern Siouan groups as indicated by the
identification of queens, but no kings, among the Indian groups of
the lower Catawba and Yadkin River drainages encountered by .the
Spanish explorer Juan Pardo in his two journeys into the Carolina
Piedmont between 1566 and 1567 (Folmesbee and Lewis 1965:114, 119) .
It is not until later in the historic period after 1670 that
individuals identified as kings come to be mentioned in relation to
queens among the Piedmont groups, as John Lawson (1967:57) found in
1701 while he resided for a short time with the Keyauwee Indians.
Spanish (Folmesbee and Lewis 1965:114, 119) and English explorers
(Lawson 1967:30, 35, 44, 45, 49 51 , 229, 241) both note the presence
of important male figures other than kings, including war leaders,
shamens and important men. These patterns differ markedl y from
those found in the earlier Shannon site and Wall site samples, and
they differ from what is found in the later contact period Fredricks
site.

Mortuary Differentiation and Social Distinction at the Fredricks Site
The analysis of the burial sample from the middle contact
period Fredricks site is limited to a consideration of the formal
treatment accorded the burials and of the pattern of the artifact
distribution within the sample. There are too few individuals
in the sample to permit statistical analyses to be done, and the
interpretations involving data from the site are limited to
comparison with trends denoted in the analysis of more
representative samples.
295
A total of 15 burials are found in the mortuary complex at the
contact period Fredricks site. Preservation states of the burials
range from poor to good. Of the seven adults in the sample, six
could be aged and sexed with some degree of accuracy, one female and
five males . This distribution of adults by sex underscores the
biased nature of the sampl e . The other eight members of the sample
are subadul ts .
All of the adult burials at the Fredricks site are, with the
exception of one adult male aged 26 to 30 years of age that is a
secondary burial, primary burials buried in a flexed posture (Table
50). All of the subadult burials are also primary flexed
interments , except for two poorly preserved subadults aged 0-2 years
whose burial posture is indeterminate.
Pit types are primarily simple pits (n=l4) , with only one
subadult 0-2 years of age being buried in a shaft and side chamber
pit (Table 51 ). Head orientation is generally to the southeast

296
'ffiBIE S).
Associatim of Burial Pa3ture with k:Je, Sex arrl Jldult/Sub3.dult Categories at the Fredricks Site.
CATEUF.Y UNUSUAL INDEI'ERMINA'IE
~ in Years:
0-2 1 2 3 3-5 3 3 6-10 1 1
11-15 1 1 16-20 1 1 21-25 2 2 26-30 1 1 36-40 2 2
45+ 1 1
'IDrAL 12 1 2 15
Sex:
Mile 4 1 5 Famle 1 1 Irrleterminate 7 2 9
IDlAL 12 1 2 15
SUbadult/Jldult
SUl::adult 6 2 8 Jldult 6 1 7
'IDrAL 12 1 2 15

297
'mBI.E 51.
Associatirn of Burial PittYP= with lv:Je, Sex arrl Adult/ Sute.dult Categories at the Fredricks Site.
ffiAFT AND
CA'IID'.:RY SIMPLE PTI' SIDE Q-lAMBER 'IOIN,
~ in Years: 0-2 2 1 3 3-5 3 3 6-10 1 1
11-15 1 1 16-20 1 1 21-25 2 2 26-30 1 1 36-40 2 2 45+ 1 1
'IOThL 14 1 15
Sex:
Mile 5 5 Fatale 1 1 Irrletenninate s. 1 9
'IOThL 14 1 15
&ll:adult/Adult
Subadult 7 1 8 Mult 7 7
'IOThL 14 1 15

(n=9), with three individuals oriented to the southwest and three
with indeterminate head or i entation (Table 52) .
This brief consideration of the formal treatment accorded
individuals in the mortuary complex at the Fredricks site shows
that there is little to differentiate the burials in the sample.
Artifact Occurrence
298
A total of 54 artifact types are present in the Fredricks site
mortuary assemblage , a surprisingly large number considering the
small size of the burial sample. Artifacts of native manufacture
comprise 28% (n=l5) of this total , and items of European origin the
other 72% (n=39). This represents a slight increase in the number
of European artifact types when the Fredricks site is compared to
Upper Saratown-Locality 2. A very large increase is indicated when
the small number of Fredricks site burials (n=l5) that produced this
total is compared to the large number of burials in the Upper
Saratown-Locality 2 sample (n=lll) .
Of the 54 Fredricks site artifact types , 18 are constrained
according to age or sex (Table 53) , although the biased nature of
the sample cannot be ignored. Artifacts that occur only
with subadults are primarily sociotechnic ornamental shell items of
aboriginal manufacture. A few European items are also constrained
with subadults , including metal spoons (a technomic artifact), and
small glass beads and brass bells (two sociotechnic artifacts) .
A sociotechnic ornamental shell item that does not have a
constrained relationship with subadults is shell gorgets, although
the only occurrence of this artifact type is with Burial 1 , a
subadult aged 3 to 5 years at death . The two shell gorgets with

299
'mBIE 52.
Asscx::iatim of Grave Orientation with Ji.Je, Sex arrl Adult/Sub3.dult Categ:,ries at the Fredricks Site.
CA'I'EIJ:RY SE SW I.NDEI'ERMINA'IE
~ in Years:
0-2 1 2 3 3-5 3 3 6-10 1 1
11-15 1 1 16-20 1 1 21-25 1 1 2 26-30 1 1 36-40 2 2 45+ 1 1
'lOI'AL 9 3 3 15
Sex:
Mile 2 2 1 5 Farale 1 1 Irrletenninate 6 1 2 9
'lOI'AL 9 3 3 15
SUl:adult/Adult
Sure.dult 5 1 2 8 Adult 4 2 1 7
'lOI'AL 9 3 3 15
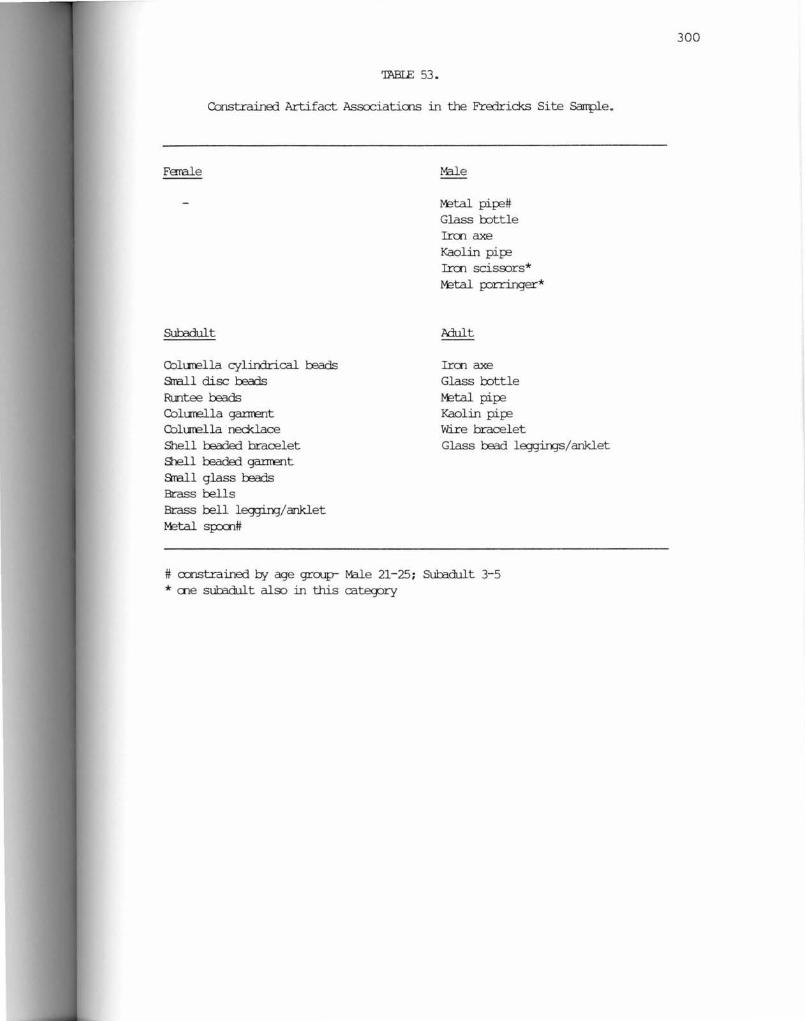
'mBI.E 53.
Const:rainoo Artifact Associatims in the Frerlricks Site Sarrple.
Fera.le
Sul:edult
Colurella cylindrical l:eads atall disc reads Rlmtee reads Colurella garrrent Colurella necklace Shell l::Eaded bracelet &\ell beaded garrrent atall glass l:eads Brass bells Brass bell leg:felg/anklet M:tal sp::x:n#
M3.le
M:tal pip2# Glass tottle Irm axe Kaolin pip: Irm scisoors* M:tal p:>rringer*
.klult
Irm axe Glass tottle M:tal pii:;e Kaolin pip: Wire bracelet Glass read leggings/anklet
# ronstrained by age groop- M3.le 21-25; Sul:adult 3-5 * me sul::edult aloo in this cate<pry
300

301
this burial are of note, however, because they are decorated with
lines and designs formed by punctations (Hammett 1987:170). Shell
gorgets decorated in a similar manner have been found at the Irene
site on the coast of Georgia, the Patawomeke site on the Potomac
River in the Chesapeake Bay region, and at an ossuary in Richmond
County, Virginia, on the north side of the Rappahannock River in
northeastern Virginia that dates to approximately 1650 (Sizemore
1984:8-9). These latter two sites underscore again the interaction
with the Middle Atlantic region evidenced by the Occaneechi and the
Fredricks site material remains.
Adults have only European artifacts constrained with them. The
technom ic items include iron axes and glass bottles. The metal
pipes and kaolin pipes present are considered to be
technomic/sociotechnic items. Two adult European sociotechnic
ornamental artifacts include wire bracelets and glass beaded
leggings/anklets.
Males are associated with a number of technomic artifacts of
European origin. These include glass bottles, iron scissors, iron
axe, and metal porringer. The iron scissors and metal porringer
artifact types are shared with subadults, where one occurrence of
each is noted. Also, males possess technomic/sociotechnic Euroean
artifacts, metal pipes and kaolin pipes. Two of the constrained
European artifacts, metal smoking pipe and iron scissors, are found
only with young males aged 21-25 years o ld.
Although these artifact associations do not indicate a
hunting/warfare orientation as expected, they do suggest a
relationship with trade. This is especially true of the metal
302
pipes. These kinds of pipes were preferred by Euro-American
travelers in the eighteenth century because they would not break
(Noel Hume 1982:308) . The presence of the iron axe suggests
associations with a multitude of activities, including construction,
warfare/hunting, and horticulture. Artifacts definitely tied to
horticulture--iron hoes--are found in male and subadult burials , and
the one female burial. This one female does not have any artifacts
unique to her burial , possessing only the iron hoe , an iron knife
and lead shot. All of these items are also found with both males
and subadults . No sociotechnic artifacts , ornamental or others, are
associated with the one identified female burial. Conversely , males
have sociotechnic artifacts , including ornamental types, that are of
aboriginal manufacture. The fact that males at the Fredricks site
possess identified iron technomic artifacts, and sociotechnic brass
gorgets, stands in stark contrast to the pattern at Upper Saratown
Locality 2 , where such artifacts are found only with females .
Examination of the artifacts that do not have constrained
associations at the Fredricks site indicates that males 21 to 25
years of age and subadults 3 to 5 years of age possess most of these
items. The suggestion is that these young males and subadults aged
3 to 5 years of age occupy a niche in the Fredricks site sample
that could indicate a special status compared to other segments of
the sample , given that there are older males and other subadult
age groups present in the sample. A similar interpretation of
the Fredricks site burials is given by Ward (1987 :109), who suggests
that the traditional big men in society at this time were young
males .

303
Social Organization at the Fredricks Site
Although it is obvious that the Fredricks site burial
sample is extremely biased, the following general comments can be
offered. The mortuary complex shows a strong male orientation that
is similar in many ways to what is found at the late prehistoric
Shannon site. The major difference appears to be that young males
at the Fredricks site , not older males as at the Shannon site ,
exhibit the artifact associations indicative of a special status in
the society. The overall pattern of artifact occurrence within the
Fredricks site sample, especial l y among the males, implies the
presence of a male-dominated society. This pattern is consistent
with a patrifocal form of social organization. A larger population
sample from the site, especially one with more females, would permit
more than this tenuous characterization.
As originally hypothesized, the younger males at this contact
period site , as indicated by the elaborate funerary treatment ,
appear to exhibit a special status within the sample that differs
from that at the two earlier sites (the Shannon site and Upper
Saratown-Locality 2) with more representative sa mples. This
probably reflects the value of males to the society in hunting ,
trade, and warfare, activities which have a high premium among late r
contact period groups . At the Fredricks site, male s possess
artifacts associated with hunting / warfare (firearms and axes), a nd
t r ading (metal smoking pipes) . Horticulture-related artifacts (iron
hoes) are found among all segments of the population--males , females
and subadults - -indicating that this activity may have been a share d
responsibility. The lack of sociotechnic ornamental artifacts with

304
the female burial at the Fredricks site suggests that the status of
this sex may have decreased greatly by this date in the middle
contact period. Certainly a better sample is needed before this can
be validated.
Summary and Conclusions Concerning this Study of Mortuary Variability
This study of the mortuary practices of the Indian societies
represented by the five Piedmont sites was conducted in order to
test five hypotheses concerning the structure and change within the
social organization of these groups from the prehistoric period to
the contact period.
The initial hypothesis postulated stated that populations of
the prehistoric period should evidence a tribal level of
sociocultural organization , with status being primarily achieved.
This hypothesis is supported by the data from the Shannon site,
where older males have a unique burial treatment indicative of a
special status different from other segments of the burial sample.
Also , males are associated with both technomic and sociotechnic
artifacts, some of which may indicate clan membership. In summary,
the burial behavior at the Shannon site emphasizes males over
females , and there is only scarce evidence to suggest a differential
status among the female segment of the sample.
The second hypothesis considered in this study states that with
European contact a more complex form of social organization would be
necessitated by the increased competition and the consolidation of
villages that marked the period. Status in a society with a more
complex social organization would not only be achieved, but evidence

305
of ascribed status might be found. In such a society, younger
individuals should exhibit a special status through their
possession of elaborate funerary treatment that their prehistoric
period counterparts lack. This proposition is supported by the
burial data from the two contact period sites of Upper Saratown
Locality 2 and the Fredricks site. Young adults of both sexes at
Upper Saratown-Locality 2 have graves equally as elaborate as , or
more so than , the older individuals in the society, which contrasts
with the pattern at the prehistoric period sites. Among females at
Upper Saratown-Locality 2 , differences in female status may be
indicated by gorgets . At the Fredricks site, the young adults have
the most elaborate burials in the sample which concurs with the
expected findings according to the original hypothesis .
Another expectation of this second hypothesis is that subadults
at contact-period sites would evidence more elaborate burials than
at the earlier prehistoric sites. This pattern does appear to be
substantiated when the Upper Saratown-Locality 2 and Fredricks s i te
samples are compared with that at the Shannon site. Of note is
the age of the subadults with the more elaborate funerary treatments
at the prehistoric and contact period sites. Subadults aged Oto 2
years at death appear to have the more elaborate graves at the
Shannon site. In contrast , subadults aged 3 to 5 years at Upper
Saratown-Locality 2 and the Fredricks site exhibit the more
elaborate grave associations. This may be tied to the increased
"worth ," or parental investment to insure their survival, that the
subadults aged 3 to 5 years in the late protohistoric and contact
periods embody. This pattern was originally predicted in the

306
earlier consideration in Chapter IV of r- and K- selection, weaning
and age of subadults at death. Also, the distribution of gorgets
among subadults at Upper Saratown-Locality 2 might be indicative of
ascribed status.
The third hypothesis is that younger males will evidence a
special status during the contact period due to the value placed on
their contribution to society as hunters, traders and warriors.
This proposition is generally supported by the contact period
samples. At the late protohistoric/early contact period Upper
Saratown-Locality 2 , young males appear to have a status similar to
that of older males. In general, few males at Upper Saratown
Locality 2 evidence a special status relative to the rest of the
burial sample when their entire funerary treatment and artifact
associations are examined. Males in general show an association
with technomic artifacts, but few sociotechnic items separate them
from the other population segments. That certain males, primarily
the younger ones, appear to differ from other males in funerary
treatment at Upper Saratown-Locality 2 is consistent with the
concept of achieved status in a society. This shift is expected
given the original third hypothesis for this section.
At the middle contact period Fredricks site, young males
between the age of 20 and 30 years have the most elaborate burial
treatment, which indicates that they have a unique status within
this society. From this it does not appear that young males become
the most important individuals in contact-period society until later
in the period (after the early 1680s, the earliest date that might
be associated with the Fredricks site).

307
The fourth hypothesis states that there will be evidence of a
change fro m a matrifocal to a patrifocal society during the contact
period. This proposition is tentatively supported in part by this
study. At the prehistoric Shan non site , old males are accorded the
most elaborate funerary treatment , and possess most of the
sociotechnic artifacts that separate segments of the sample. Any
segment of the sample that is set off from the rest of the
society has males associated with it , and sometimes has subadults
(and no females) associated with the males. Females exhibit few
sociotechnic items , and none that separate that sex from males or
ot her segments of the sample, except in isolated case s . This
pattern suggests that a male-dominated or patrifocal society
characterized the prehistoric Shannon site.
In stark contrast , at Upper Saratown-Locality 2 f ema les of all
ages and selected subadults exhibit the most elaborate a nd unique
burial treatments . This includes the association with females of a
variety of sociotechnic artifacts of aboriginal manufacture and
items made of materials obtained from Europeans. The pattern
exhibited by the females in general , and of a small number of males
that exhibit better funerary treatment than other male s , in
association with the artifact associations for subadults is
consistent with a female-dominated matrifocal society.
At the middle contact period Fredricks site, young males
exhibit the most elaborate and unique burials. The sample is small ,
but the presence of sociotechnic artifacts with males in general at
this site , both young and old, and the absence of such artifacts in
the single female burial , suggests a pattern of funerary treatment
308
that might characterize a male dominated patrifocal society. The
overall pattern for males exhibited by the late
prehistoric/protohistoric period Wall site sample is similar to that
for the Fredricks site, although no older males have sociotechnic
objects at the former site. There are no females in the Wall site
sample, which prohibits further comparison with the trends indicated
for the other samples.
The tentative patterns that have been identified in this study
of the hypothesized change from a matrifocal society characterizing
the prehistoric period to a patrifocal society in the contact period
raises a number of questions concerning the social organization of
the groups included in this study. It can be asked immediately if
all of these groups are really Siouan. The prehistoric period
Shannon site , the middle contact period Fredricks site, and, very
tentatively, the late prehistoric/early protohistoric period Wall
site all give evidence of male-dominated societies. The relatively
close biological similarities between the Shannon site and Fredricks
site samples discussed in Chapter III , combined with the results of
this analysis of mortuary practices , definitely separates the groups
resident at these two sites from the Sara occupation at Upper
Saratown. It is possible that the two samples--and the Wall site
sample--may be Iroquoian-speaking groups similar to the Meherrin ,
Nottoway and Tuscarora of the Inner Coastal Plain. The split into
northern and southern groups that has traditionally been identified
with the "Siouan" groups of the Carolina and Virginia Piedmont based
primarily on linguistics (Griffin 1945 ; Lewis 1951; Swanton 1936),
and the subsequent migration of the northern groups to New York

309
where they became part of the League of the Iroquois (J. Wilson
1983 : 144-173) is consistent with this suggestion that the Occaneechi
are not Siouan. The limited Siouan linguistic similarities noted
a mong the Tutela language spoken by a few individuals in New York
may be the result of Siouan words incorporated into Occaneechi
dur ing the late seventeenth century when Occaneechi was widely used
among Indians to conduct trade (Merrell 1987 : 20 , 27). Also , the
strong association between the Susquehannock Indians, an Iroquoian
group of the Middle Atlantic region , and the Occannecchi (cf . Ward
1987 : 89-90) would be explained. The ceramics associated with the
supposed Occaneechi occupation of the Fredricks site show a close
r e l ationsh ip to the ceramics found at the l ate prehistoric/early
protohistoric Wall site, and they are very different from ceramics
that can be associated with the Sara Indian occupations along the
Dan River of North Carolina (Davis 1987:213-214) .
The ceramics found at the Shannon site , although primarily
l imestone-tempered, show strong similarities with other
pr edominantly net-impressed ceramic wares that have traditionally
been associated with both northern and sou thern Siouan groups (cf .
J. Wilson 1983 : 238-505) . Clarkesville ceramics , which are very
si milar to the pottery found at t he Shannon site (Benthall
1969 : 147) , have always been something of an enigma in the
archaeology of the Roanoke drainage , and have usually been equated
with the Dan river ceramics of the North Carolina Piedmont (J.
Wilson 1983 : 278-279) . It may be that Clarkesville ceramics are
associated with the northern Siouan Saponi and Tutel a Indian groups
of the Roanoke drainage during the late prehistoric period (cf . Coe

310
1952b; J . Wilson, personal communication, 1988). The separation
noted between Clarkesville and Dan River ceramics would mirror the
split between the southern and northern Siouan groups. Certainly,
the entire question of ethnic identity and material culture
associations needs to be investigated further.
The population resident at Upper Saratown-Locality 2, as the
name implies , can be associated with the Sara Indians of the larger
southern Siouan group who eventually moved south and incorporated
with the Catawba in the late 1730s (J. Wilson 1983:168), and may
represent the only true Siouan Indians in this study. The
hypothesis concerning the change from a matrifocal society to a
patrifocal society that contributed to these conclusions is only
partially supported at this time. Before the larger question of
differing ethnic affiliations suggested here, and the associated
question of change from a matrifocal society to a patrifocal
society, can be addressed in greater detail to more archaeological
and biological data have to be obtained on the prehistoric and
contact period populations that may be connected with both the
northern and southern groupings that researchers have delineated.
Any future research that is conducted will certainly have to give
strong consideration to the ethnic affiliations proposed for the
Indian groups of the Piedmont in this study.
The fifth and final hypothesis investigated in this study
states that the sexual division of labor characteristic of each
society should be reflected in the funerary treatment accorded
members of that society. In general, males appear to be
consistently associated through time with artifacts used in hunting

311
and warfare. In this study , artifacts indicative of horticulture
appear to be associated primarily with males in the prehistor ic
pe r iod (cf . the Shannon site) , with fe males during the early part
of the late protohistoric/early contact period (cf. Upper Saratown
Locality 2), and with both males and females during the middle
contact period (cf. the Fredricks site) . This changing pattern is
not totally unexpected, if, prior to contact, males were
traditionally responsible for a large portion of the horticulture
practiced. During the late protohistoric and contact periods , there
would have been an increased need for males to act as hunters to
acquire furs and skins to trade to the Europeans , and to engage in
warfare. The decreased time spent by males on horticulture would
have corresponded with an increased female involvement in
horticulture during the early contact-period societies, as noted in
this study. The involvement of all segments of the population in
horticulture during the later contact period, as represented by the
Fredricks site , would have been the result of the decreased size of
the overall population present to provide subsistence for the
population as a whole. This decrease may have necessitated that
males assist more in the procurement of food resources from the
horticultural base of the society.
This investigation of social organization and change among the
Piedmont Indians has provided answers for some questions . However ,
as is usual in studies of archaeological data , a number of questions
that require attention in future research conducted on the Piedmont
Indians have also been raised. The most intriguing question
concerns probable Iroquoian ethnic identification (meaning similar

312
to the Meherrin, Nottoway, and Tuscarora Indians) of a number of
groups that have traditionally been assumed to have been Siouan,
i . e . , those groups associated by past researchers with the northern
Division of Siouan groups. Although some of the expected trends in
the change of social organization from the prehistoric pe riod into
the contact period were substantiated, the basic question on the
effects of European contact on the social organization of the Indian
groups of the Virginia and Carolina Piedmont cannot be addressed
properly until more research is conducted on representative
populations that can be identified with the prehistoric and contact
period societies that inhabited the region.

CHAPTER VIII
CONCLUSIONS
This study has investigated the effects of European contact on
the aboriginal populations of the Carolina and Virginia Piedmont
through five levels of inquiry--biological distance , demographic
profiles , trace element assays , pathologies , and mortuary practices.
The four central questions addressed in the analysis and
interpretation of these five datasets are 1) the ethnic associations
of the five populations; 2) the overall change in health from the
prehistoric period into the middle contact period; 3) the change in
diet associated with European contact ; and 4) the changes that
occurred in social organization.
The five skeletal series used in this study form a temporal
sequence that spans the era from the late prehistoric period, circa
A.D. 1300 , to the middle contact period, circa A.O. 1712. The two
sites with the most biologically repre sentative burial samples, the
late prehistoric period Shannon site (n=96) and the late
protohistoric/early contact period Upper Saratown-Loca lity 2 site
(n=lll) , form the core of this study. Information from three other
sites--the late prehistoric/early protohistoric period Wall site ,
the protohistoric period Upper Saratown-Locality 1 site, and the
middle contact period Fredricks site-- , with burial samples too
small to be used in and of the ms elves to build patterns, is

314
considered in conjunction with the trends and patterns abstracted
from the comparison of the data sets from the Shannon site and Upper
Saratown-Locality 2.
The results of the biological distance studies (Chapter III)
and the analysis of funerary treatment (Chapter VII) provide
important insights into the ethnic identity and social organization
of the Indian groups of the Carolina and Virginia Piedmont.
Previous researchers have generally considered the majority of these
aboriginal inhabitants to comprise part of the larger group of
Siouan Indians that share a similar material culture. Within these
parameters , there should also have been a close physical similarity
evidenced by the skeletal remains associated with these individual
Siouan groups--including the burial samples used in this study. The
statistical techniques used to determine the mean measure of
divergence between four of the five study samples indicate that the
late prehistoric period Shannon site and the middle contact period
Fredricks site samples are the closest biologically, standing
distinct from the Upper Saratown-Locality 2 burial sample. The
prehistoric period Wall site burial sample is the least similar to
the other three samples , which certainly reflects the small size of
the sample from this site.
It is suggested that the similarities between the Shannon and
Fredricks site study samples are due to the northern orientation,
i . e . , close ties with the Indian groups of the Chesapeake Bay and
the Middle Atlantic region , of the two societies these sites
represent--presumably the prehistoric counterparts of the Tutela
Indians at the Shannon site, and the Occaneechi Indians of A.D. 1700

315
at the Fredricks site. This northern orientation is consistent with
the interpretations of previou s researchers (Griffin 1945:321; Lewis
1951:10-11; Swanton 1936:379) , but the meaning of this orientation
might differ radically from that favored by these same researchers.
The analysis of the mortuary practices of the study samples
(Chapter VII) provides evidence that reflects on the meaning of this
northern orientation. It has generally been assumed that the Siouan
groups of the Carolinas and Virginia possessed a matrilineal society
(Hudson 1976:185; Lewis 1951:153-167 ; Swanton 1946:654-655) , and
certainly one in which certain females identified as queens
possessed some status different from other segments of the society.
The funerary treatment accorded individuals at both the Shannon site
and the Fredricks site favors males in the society without any clear
evidence of preferential treatment for any ·group of females which
would be consistent with a differential (and high) status for
certain females in the society. At the Shannon site, certain older
males and subadul ts aged Oto 2 years of age possess the most
elaborate funerary treatment , with the burials of these older males
being suggestive of achieved status. In the Fredricks site burial
sample, younger males and subadults aged 3 to 5 years evidence the
most elaborate funerary treatment, relative to other males (and one
female) and subadults in the society. The treatment accorded the
younger adult males is consistent with achieved status which
reflects the increasing importance that young males as a group have
as hunters in the skin and fur trade, as traders, and as warriors
du ring t h e later portions of the contact period. This male
orientation in the funerary treatment accorded individuals at the

316
Fredricks site is consistent with a patrifocal or male dominated
society. This is expected in the case of the Fredricks site, given
the change from a matrilineal society to a patrilineal society
postulated by researchers (Hudson 1976:187-188; Lewis 1951:162-167)
for most Indian groups of the southeastern United States over the
course of the contact period. The pattern of male dominance
evidenced by the prehistoric period Shannon site burials is not
consistent with what was expected.
In contrast to the male orientation exhibited by the Fredricks
site and Shannon site burial samples, the mortuary patterns
identified at Upper Saratown-Locality 2, and corroborated to some
degree by the small burial sample from the slightly earlier site of
Upper Saratown-Locality 1 , reflect an orientation toward a group of
females that include all age groups, subadults aged 3 to 5 years
old, and a small number of subadults age Oto 10 years old. The
unique female burials and the close association of technomic
artifacts of European manufacture and sociotechnic items in general
with females, combine with evidence of achieved status by males
(again as hunters and warriors) to provide a pattern of funerary
treatment that is considered here to reflect a female dominated
society that is consistent with a matrifocal society.
The results of the trace element assays (Chapter V) also
provide information useful to the study of status among the study
samples. At the Shannon and Wall sites , all age groups and the
great majority of both sexes appear to have similar diets (see
Tables 17-20) evidenc ing no noticeable differences in access to
animal and plant food resources . However , males older than 36 years

317
of age and the female segment of the population aged between 36 and
40 years have higher zinc levels than do the rest of the burial
sample (Tables 25-26). The female segment of the population aged
41+ years shows a large drop in the zinc assay from the level for
the 36-40 age group.
At Upper Saratown-Locality 2 , individuals older than 40 have
higher levels of zinc (Table 22) , with females in general having
higher zinc assays than males (Table 24) . Also , older males more
than 46 years of age have higher zinc levels than do younger males
(Table 27) , while females more than 41 years old have higher zinc
levels than younger females in general and all males (Table 28).
The results of an F Test statistical comparison of males and females
at Upper Saratown-Locality 2 (Table 29) shows that there is a
significant difference in the two at the 0.10 confidence level .
These differences in the trace element assays for certain
segments of the two representative study samples are considered to
support the patterns of social organization documented in the
analysis of funerary treatment. At the Shannon site, older males
appear to have differential access to protein-rich food sources.
Because strontium levels are similar for the population segments,
these protein-rich food sources did not replace vegetabl e foods , and
appear to be food other than meat, such as protein rich nuts. Such
a pattern would be expected in an egalitarian society with elements
of a tribal level of social organization where achieved status is
associated with older males.
At Upper Saratown-Locality 2, females evidence a higher protein
diet according to the trace e lement analysis . The similarity of

318
strontium levels among all population segments suggests that this
protein source is not directly attributable to animal food sources.
Also, older females (40+) and older males (45+) have higher zinc
levels than the rest of the population. This pattern of older
females and males in the society having preferential access to a
protein-rich food source is consistent with achieved status that
would have characterized the female-dominated society at this late
protohistoric/early contact period site.
The trace element assays for the Fredricks site skeletal series
reflect the presence of a high level of protein from animal foods in
the diet of all individuals. Interpretation of the variation within
the trace element levels that does occur is hampered by the fact
that the mixed Fredrcks site burial sample appears to be composed of
a large number of individuals from villages located in different
environments. The differences in the strontium levels especially
are affected by this factor. Therefore, the general pattern
exhibited by the unrepresentative sample from the contact period
Fredricks site cannot be considered further at this time.
Another aspect of this study has been to investigate the
hypothesized catastrophic effects of European epidemic diseases (cf.
Dobyns 1983) on the aboriginal populations of the Carolina and
Virginia Piedmont during the protohistoric and contact periods.
Along with a general population decline, the stress of epidemic
disease (and warfare) resulted in the formation of single villages
from the combination of the population remnants from a number of
other often unrelated villages. Such a pattern of population
decline and recombination would result in increased biological

319
diversity characterizing groups resident at contact period sites.
The results of the diversity studies conducted in this study
(Chapter III) indicate that the late protohistoric/early contact
period Upper Saratown-Locality 2 burial sample has the lowest
biological within-population diversity of the four sites. The late
prehistoric/early protohistoric period Wall site skeletal series (a
very biased sample) exhibits the next lowest diversity level
followed by the late prehistoric Shannon site burial sample. The
highest within-population biological diversity is found at the
middle contact period Fredricks site.
Comparing this biological diversity with diversity for surface
finish and decoration in ceramics (Chapter III), the Upper Saratown
Locality 2 assemblage indicates that the Indians resident at this
site were experiencing changes in the fabric of their society that
did not include incorporation of other related and unrelated
distinct groups. This suggests that the Sara at Upper Saratown
during the late protohistoric/early contact period were a viable
society that was as yet not adversely affected by the stresses
associated with European contact , especially that associated with
smallpox epidemics. Given that there is a 141 year gap from the
time of the first major smallpox epidemic in 1520-1524 until the
second in 1665-1667 (Dobyns 1983:15) , the stability and lack of
admixture evidenced by the Sara Indians living at Upper Saratown
Locality 2 is consistent with the pre-contact, pre-1665 era of low
level indirect interaction with Europeans, which is even earlier
than the dates suggested elsewhere in this study for Upper Saratown
Locality 2. Th e high biological diversity found at the middle
320
contact period Fredricks site, associated with the Occaneechi
Indians of 1700, provides ample evidence of the adverse effects of
stress contributing to population decline and admixture during the
post 1665 contact period. The contrast in the patterns of
biological distance between the Fredricks site and Upper Saratown
Locality 2 supports the identification of the latter with the lower
stressed (relative to the middle contact period) pre-1665
protohistoric/early contact period that characterized Indian
European interaction in the Carolina and Virginia Piedmont.
This general finding can be expanded when the changes within
and between the study samples in health and diet with European
contact (Chapters IV, V and VII) are considered. In general, there
is a decrease in the overall health within the populations as the
decreased life expectancy (Chapter IV) at Upper Saratown-Locality 2
and the Fredricks site illustrate. More detailed analysis of the
individual pathologies (Chapter VI) present indicates that the
middle contact period Fredricks site burial sample is the least
healthy. This finding is consistent with the high-stress middle
contact-period that dates between 1675 and 1710 for the Indian
groups of the Piedmont.
Comparison of the late prehistoric period Shannon site burial
sample with the late protohistoric/early contact period Upper
Saratown-Locality 2 skeletal series shows a decline through time in
the percentage of all pathologies except for enamel hypoplasia and
dental caries. Only 43. 1% of the pathologies at the Shannon site
are diet related in contrast to 50. 3% at the contact period site .
This increase is primarily due to the increased incidence of dental

321
caries, which can be tied to the introduction of the peach and
watermelon (cf. Wilson 1977) , and rum into the diet. The increased
amount of sugar that these food resources would have contributed to
the diet could have accounted for the increase in dental caries. A
change in diet between the two sites which is suggested by the
effects of peach, watermelon and rum on dental caries , is supported
by the pattern of lower levels of magnesium documented by the trace
element analysis (Chapter V) at Upper Saratown-Locality 2 compared
to the Shannon site. This difference suggests a lessened reliance
on maize in the late protohistoric/early contact period diet at
Upper Saratown-Locality 2.
In general , the Upper Saratown-Locality 2 burial sample appears
to have experienced rather good health, especially when compared
with the late prehistoric period Shannon site and the middle contact
period Fredricks site. This reflects the fact that the Upper
Saratown population lived before the time of the intense stresses
associated with the middle contact period, and after the occurrence
of the stress related to epidemics of smallpox that characterized
the early protohistoric period. The decline in the life expectancy
at Upper Saratown-Locality 2 is an aberration given the analysis of
pathologies conducted in this work (Chapter VI) , and it may reflect
the presence of influenza or measl es , two European diseases not
identified in the historic record nor identifiable in an analysis of
skeletal material.
The trace element analysis (Chapter V) also contributed
information on the health of the study samples. The definite
increase in zinc levels at Upper Saratown-Locality 2 and at the

322
Fredricks site suggests that there is an increase in the amount of
animal protein in the diet of the later samples, which is not
unexpected given the increase in hunting of fur and skin bearing
animals induced by trade with Europeans in furs and skins. The
increased hunting would presumably have resulted in more meat being
available in the diets of these two populations. This increase in
protein available to the Upper Saratown-Locality 2 inhabitants is
consistent with the overall healthy burial sample present at the
site, which is not unexpected given the relatively low stress load
(compared to the middle contact period) this late
protohistoric/early contact period group experienced. In contrast,
increased protein from animal sources in the middle contact period
Fredricks site sample was not enough to compensate for the dual
stresses of European disease and extensive warfare. The overall
poor health of this middle contact period skeletal series vividly
reflects this fact.
In closing, this study has been able to address a number of
questions about the effects of European contact on the aboriginal
cultures of the Carolina and Virginia Piedmont. However, a number
of new q u estions about these groups have also been raised. Of
special interest , and one that requires further research, is the
question of the ethnic affiliation of these supposedly Piedmont
Siouan groups. It is suggested here that the groups of Indians
previously identified with the northern Siouans, including the
Tutelo and Occaneechi, have definite affinities with the Iroquoian
societies of the Inner Coastal Plain and the Middle Atlantic region.
The social organization and biological similarities that

323
characterize the presumed Tutelo occupation at the Shannon site and
the Occaneechi village at the Fredricks site differentiate these two
populations from the Sara Indians resident at Upper Saratown
Locality 2.
The interaction of the Tutelo and Occaneechi with the Iroquoian
Indian groups to the north, and the Sara with the Siouan groups to
the south , is documented in no uncertain terms in the ethnohistoric
record of these groups during the later contact period. Ward
(1987:89-90) recounts the close connections between the Occaneechi
and the Susquehanna Indians, an Iroquoian-speaking group who lived
on the Susquehanna River in New York, Pennsylvania and Maryland
until approximately 1675 (Swanton 1952:56). Between 1675 and 1676
the main body of the Susquehanna Indians were defeated and absorbed
by the Iroquois Indians of New York (Swanton 1952:57). Small groups
of Susquehanna Indians sought refuge with the Occaneechi (Swanton
1946:164) and apparently with the Meherrin Indians (Swanton
1952:62) . The Occaneechi , Susquehanna and a number of other Indian
groups, including the Mannakin of the Virginia Piedmont , resident on
an island in the Roanoke River were shortly thereafter attacked and
defeated by Nathaniel Bacon in 1676 (Billings 1975:267-269). By the
early 1680s the Occaneechi and pre sumably the Indians incorporated
with them moved into the Piedmont of North Carolina (J. Wilson
1983:113-114 , 183-184) . Later , the Occaneechi moved to Fort
Christanna and between 1711 and 1712 incorporated with the Saponi,
Stukanox, and Tutelo Indians as tributaries to the colony of
Virginia (J. Wilson 1983 : 131) . In approximate ly 1740, the Saponi
a nd other Fort Christanna Indians moved north into Pennsylvania
324
initially, and then New York, where they became part of the Iroquois
Confederacy, which was comprised of core Indian groups that spoke
Iroquoian dialects (J. Wilson 1983:169). In contrast to these
movements , the Sara Indians and other Indian groups of the southern
Siouan division moved south and southeast from the North Carolina
Piedmont , and eventually incorporated with the Catawba Indians in
the late 1730s (J. Wilson 1983:191-197).
In addition to the Susquehanna Indians, three Iroquoian
speaking groups of the Inner Coastal Plain of North Carolina and
Virginia--the Tuscarora, Meherrin, and Nottoway (Boyce 1978:282-283;
Swanton 1946:10-11)--also live in close proximity to the Occaneechi
Indians. Unfortunately, beyond the classification of the language
associated with these three groups, little is known of the material
culture or social organization of the Tuscarora, Meherrin, and
Nottoway. Leadership was at a community level , with status being
determined by access to goods and services (Boyce 1978:283). Men
typically were the leaders and were called "Kings'' amongst these
Iroquoian-speaking groups of Virginia and North Carolina (Boyce
1978:283). Of special interest is the fact that Tuscarora women in
North Carolina were traditionally given less elaborate mortuary
treatment than men (Boyce 1978:285-286). Also, the Tuscarora of New
York buried their dead in special areas according to clan
affiliation (Landy 1978:523). A similar pattern of spatially
segregated burials by social unit is suggested by Ward (1987 : 109) to
have existed among the Occaneechi based on the archaeology of a
cemetery area at the Fredricks site.

325
From this study , a number of characteristics are delineated
that distinguish three of the study samples--Shannon site , the Wall
site, and the Fredricks site--from the Sara popul ations of the Dan
River . These include the male orientation evidenced by the funerary
treatment at all three non-Sara sites ; the low biological distance
associated with the Shannon site and Fredricks site populations; the
close affiliation of the Wall and Fredricks site ceramics ; the
similarity of gorget types between the Wall site and Shannon site
material cultures ; and the interaction documented in the
ethnohistoric record of the three non-Sara populations with the
Indian groups northeast of the study area. The following
propositions can be advanced to account for these characteristics .
First , the Indian groups that have traditionally been
identified with the northern Siouan division, including the Tutela
and Occaneechi , are in reality non-Siouan , most probably Iroquoian-
speaking , groups. Secondly, it can be proposed that the northern
Siou an division does exist , comprised of the Sapona and Tutela
Indians, with the Occaneechi Indians being non-Siouan. Other Indian
groups traditionally placed in the northern division such as the
Manakin would have to be placed in an unknown group pending further
archaeological research. A third proposition is that the northern
Siouan division is composed of the groups traditionally identified
with it and that the hypotheses defined by Lewis (1951:11) are
valid : that
1. A territorially coterminous group of tribes in Virginia and the Carolinas , speaking dialects of the Siou an lingu istic stock, possessed a language and culture which differed significantly fro m t ha t of other indigenou s groups which bordered on it .

2. Within this group there were linguistic differences of such cultural significance that the culture common to tribes of the "northern" unit differed from the culture common to tribes of the "southern" group.
326
Unfortunately, none of these three proposals accounts for all of the
common characteristics denoted above and the differences that this
study has identified for the three non-Sara sites.
The first proposal covers all of the characteristics except for
the difference in the ceramics found at the Shannon site and those
found at the Wall and Fredricks sites (Chapter VII) , and the
distinction of the Wall site burial sample from the other two
burial samples when biological distance is considered. The second
proposal does not account for the low biological distance between
the Shannon site (Tutela) sample and the Fredricks site
sample , nor is the close interaction documented by the
ethnohistoric record satisfactorily explained. The third proposal
suffers from the same shortcomings identified for the first
proposal . At this time , not one of these three propositions can be
chosen as the correct model of the culture history of these Indian
groups , although the second proposal appears to be the best
approximation currently available.
In order to investigate the implications of these propositions
concerning ethnic and cultural composition , further archaeological ,
biological, and historical research that incorporates a number of
sites dating to the temporal continuum d e fined by the late
prehistoric , protohistoric and contact periods in both the areas
associated with both the "northern Siouan" groups and the "southern
Siouan" groups in the Carolinas and Virginia must be conducted.

327
Until investigations that incorporate both biological and
a r chaeological data are conducted, the reconstruction ,
interpretation, and explanation of the past l ifestyles and cultures
of the Indian groups resident in the Piedmont will not be possible.
APPENDIX A.
BURIAL AGE , SEX AND ARTIFACT ASSOCIATIONS

CDJE
V1 \/2
V3 V4 V5 V6 V7
V8 V9 iJlO
Vll iJ12 Vl3 iJ14 VlS iJ16 Vl.7
iJ18 Vl9 \/20 V2l \/22 V23 \/24
V25
V26 V27 iJ28 V29 V30 V31 V32 V33 V34 V35 V36 V37 V38 V39 V40 V41 V42 V43 V44 V45 V46
'mBLE 1A.
O::des Used to Identify the Artifacts Asscx::iated with F.adl :&lrial in the Sb.rly S:rrples.
ARI'IFACT
olive shell beads rrarginella shell beads oolmella segrrent beads rolurella cylindrical l:::eads rolurella ture beads rolurella sra.11 disc l:::eads runtee beads W3!tµl[ll beads roluTella shell .P=rrlmt rolurella shell gorget oolurella shell hairpin rrarginella shell necklace rrarginella shell braCElet colurella shell b2ada:1 gaurent rrarginella shell legqin;J rolurella shell necklace rolurella shell bra02let colurella shell anklet rolurella shell legqin;J unaltered rrussel shell serrated rrussel shell b.u:tle c:arap:i.ce cup turkey digit beads turkey coracoid l:::eads turkey longl:x:ne tub.tlar beads turkey tibiotarsal awl eagle talm l:::eads anirral lxne hairpin ramit scaµtl.a beads l:::eaver incisor dlisel \\Olf canine beads rrountain lim claw l:::eads l:::ear canine l:::eads !:::ear rrarrlible (p:i.rt of a rrask ?) deer l:x:ne beads deer loogl:x:ne awl deer loogl:x:ne needle deer lmglxne drisel deer lxne flaker deer J::x:ne fishhook deer µial~e projectile p::>int elk troth l:::eads drifP:rl stme projectile p::>int dlifP=d stme drill drifP:rl stc:ne knife (with antler han::lle) dlifP=d stme blade
329

CIDE
V47 V48 V49 V':IJ VSl V52 V53 V54 vss V56 1/57 V58 V59 vro V61 V62 V63 V64 \/65 V66 V67
Vffi
V69 V70 V71
V72 V73 V74 V75 V76 V77 V78 V79 voo V81 V82 V83 V84 V85 '\J86 V87
V88 V89 V?/J V91 V92
~ 1A. (cx::ntinued)
drii:p:rl st:rn.e errl scrap:rr chig;:ed stme flakes gm.n-rl stale discs ( gaming discs) gram st:rn.e celt gm.n-rl st:rn.e ceads st:rn.e p::rrlant st:rn.e abrader harnrerst:rn.e rock crystals (anyt:hest & quartz) stme/rock (unaltered.) red cx:hre mica p::rrlant clay r:ot clay pip:: clay dif:P=r fired. clay ltrrp rolled. native~ bead raw/harnrered native CDH£r split cane l:.:asket srall glass ceads (white, blue , & black) large glass ceads (multi-colored. &
milti-shap::d) brass garget (bar arrl circular shap::s) large brass tubes (rairpip::s) large brass anes (tinklers) geanetric brass p::rrlant (small disc-, u-,
crescent- arrl tri~le-shap::d) brass an:i.rral effigy brass wire srall brass bells large brass bells rrolled brass beads miscellan€0.l.S brass fragrent(s) irm scisoors irm knife irm hce irm axe irm spike/chisel irm nail unidentified irm cbject rretal rucklle (brass) rretal ruttm (brass, lead, & :r;ewter) wire bracelet (brass) glass J:ottle (wine/run) glass fragrent rretal kettle (brass)
rretal r:orringer metal sp:x:n (brass, latten & silver
plated. brass )
330

CIDE
V93 V94 \195 V9/6 \197 V98
V99 Vl.00 Vl.01 Vl.02 Vl.03
Vl.04 Vl.05 Vl.OC> vl07 Vl.00 VJ.CB Vl.10
Vl.11 Vl12 Vl.13 Vl.14 Vl.15 Vl16 Vl.17 Vl.18 Vl.19 Vl.20
Vl.21 Vl.22 Vl.23 Vl.25 Vl.26 Vl.27 Vl.28 Vl.29
'rnBI.E lA. ( a::ntiruEtl)
rretal pip:! (f£'Wt:er)
kaolin pip:! anber terrier jew' s harp gun gun J)3rts (~lock~) gunflint lead shot glass beadErl ganrent glass bead necklace glass bead bracelet glass bead anklet glass bead le<Ring brass rell necklace brass rell bracelet brass rell anklet brass rell le<Ring gannent with glass beads arrl brass
ornarrents brass bead necklace brass bead bracelet brass bead anklet brass bead le<Ring shell beadErl gament shell bead necklace shell bead bracelet shell bead anklet shell bead leggi.n; b:ne bead gament Jxne bead necklace b::ne bead le<Ring Jxne bead anklet brass rings lead J::ale seal vennillim/red lead snuff tin case knife
331

1 2 3 4
5 6 7
8 9 10 11 12 13 14 15 16 17 18 19 20 21 22 23 24 25 26 27 28 29 ~
31 32 33 34
35 36 37 38 39 40 41 42 43 44
Burial NuTber, l>.Je, Sex, am. Grave Asscx:::iaticns far Irrlividuals Interred at the Shmncn Site.
SEX
SJBA!XJLT SJE3ADULT
MALE Fil1AlE FEMAIE
MALE FEMAIE
SJE3ADULT MALE
SJBADULT MALE
Fil1AlE SJE3ADULT
MALE MALE
Fil1AlE FEMAIE Fil1AlE
MALE MALE MALE
SJE3ADULT SJE3ADULT SJE3ADULT
FEMAIE MALE
FEMAIE
SJE3ADULT FEMAIE Fil1AlE
SUBAIXJLT MALE MALE
AIXJLT
46+
0-2 26-~
46+
11-15 0-2
26-~ 41-45
46+
41-45 16-20 0-2
26-~ 3-5
21-25 31-35 0-2 46+
26-~ 16-20
46+
21-25 46+
31-35 46+
0-2 6-10 0-2
21-25 36-40 31-35
11-15 46+
46+
0-2 46+
41-45 36-40
11- 15 31-35
V2 , V4, VS, Vl6, Vl15, Vl16. N:liIE
N:liIE
V20, V22, V25, V26, V27, V36, V42, V47, VS2, V54, Vl21. V9. V4, Vl6, V25 , V56 , Vll6, Vl20, Vl21. N:liIE
V4, VS, V6, Vl6, Vll6. N:liIE
V2, Vl2,Vl16. V2, VS, V6, Vl2, Vl6, Vl16. V2 , Vl15. N:liIE
N:liIE
V2 , vs, Vl2, Vl6, Vl16. V2, Vl2, Vll6. V2 , Vl2, Vl16. V22, V26, V23. N:liIE
V2, V4, V12 , Vl6 . N:liIE
V22 . N:NE
N:liIE
V33, Vl21. VS, V25 , Vll6, Vl21 . N:NE
N:liIE
V25, Vl21. N:liIE
N:NE
N:liIE
Vl , V32, V41 , V43 , Vl16, Vl21. N:liIE
N:liIE
VS, Vl6, V33, V63, Vl16, Vl21 . N:NE
N:NE
N:liIE
V35, Vl21.
VS9. N:liIE
332

333
TABlE '2A. ( cx:ntinuErl)
BURIAL SEX N;E GRAVE ASSXIATICNS
45 Mi\LE 46+ VS, Vl6, V20, V2.6, V30, V38, V39, V43, V44, V:IJ, VS3, V64, Vll6.
46 FEMAIE 46+ V:IJ. 47 FEMALE 46+ N:l'IB
48 EDBAIXJLT 0-2 VS, V9, Vl6, Vl16. 49 FEMALE AIXILT V54 . 50 MAIE 46+ N:l'IB
51 SJBADULT 0-2 V2., VS, V12 , Vl6, Vll6. 52 ruPAIXJLT 6-10 V2. , V31, V55, Vll5, Vll6, Vl21. 53 Mi\LE 46+ N:l'IB
54 ruPAIXJLT 0-2 N.:l',lE
55 FEMALE 31-35 N:l'IB 56 MAIE 46+ V33, V34, Vl21. 57 Mi\LE 46+ N:l'IB
58 MAIE 31-35 V6, Vl6, V46, Vll6. 59 SJBADULT 0-2 V2. , VS, V9, Vl6, Vll5, Vll6. ED FEMAIE 36-40 V32,V:IJ, Vl22, Vl23. 61 Mi\LE 41-45 V40. 62 FEMAIE 36-40 N.:l',lE
63 FEMALE 36-40 V4, Vl6, Vll6. 64 SlJB?\OOLT 3-5 N.:l',lE
65 Mi\LE 36-40 V32 , Vl21. · 66 MAIE AIXILT N.:l',lE
67 FEMALE 46+ N:l'IB
68 FEMAIE 26-30 V2. , VS, V6, V2.4 , Vll5, Vll6, Vl21. 69 ffMALE 46+ N.:l',lE
70 FEMAIE 21-25 N.:l',lE
71 FEMALE 46+ N.:l',lE
72 EDBAIXJLT 0-2 V32, Vl21. 73 SJBADULT 0-2 VS, V16 , Vl16 . 74 SlJB?\OOLT 3-5 V2. , Vll5. 75 ffMALE 16-20 VS, V28, Vll6. 76 FEMAIE 16-20 N.:l',lE
77 EDBAIXJLT 0-2 V43 . 78 &JBAI:XJLT 0-2 N:NE 79 SJBADULT 0-2 N:l'IB
00 &JBAI:XJLT 0-2 N.:l',lE
81 FEMALE 26-30 N:l'IB 82 MAIE 46+ V2.6, VED. 83 SJBADULT ? N.:l',lE
84 MAIE 46+ N.:l',lE
85 Mi\LE 46+ N.:l',lE
86 EDBAIXJLT 0-2 V2. , V9, V2.4, Vll5, Vl21. 87 Mi\LE 46+ N.:l',lE
88 MAIE 36-40 V25, Vl21 . 89 FEMALE 46+ N:l'IB 90 ruPAIXJLT 11-15 N.:l',lE
91 FEMALE 36-40 N:l'IB 92 MAIE 46+ V45.

334
'mBLE LA. ( o::ntinuerl)
BJRIAL SEX ~ ffiAVE ASSXIATICNS
93 FEMAI.E AIXJLT V2, Vl2, Vll6. 94 SJPADULT 0-2 V2 , Vl2, Vll6 . 95 SUPAOOLT 11-15 V4, Vl6, V41 , Vll6. 96 NJ ~~TI'ED
97 MALE 36-40 vs, Vl6, Vll6. se SJPADULT ll-15 V54 . 99 SUPAOOLT 0-2 V6, V33, Vll5 , Vl21 . 100 NJ ~CN-<:MITI'ED

B.lRIAL
1 2 3 4 5 1-83
2- 83 3-83
'mBLE 3A.
Burial Nurber, ~e, Sex, arrl Grave Asscci.aticns for Irrlividuals Interred at the wall Site .
SEX llGE GRAVE ASS'.XIATICNS
MALE 46+ V59, Vf:IJ. EUBADULT 0-2 V6, VlO, Vl5, Vl7 , V59, V63.
MAIE 46+ V21. MALE 21-25 V3, V6, Vl6 , Vl7 , Vl8, V59.
SllB\IXJLT 0-2 N:l'IB EUBADULT 3-5 V2, V3, V6, VlO, Vl4, Vl5, Vl6,
V20, V59, V63. SJm:XJLT 0-2 V3, Vl6, V56. SJBADULT 0-2 V59 .
335
Vl9,

B.JRIAL
1 2 3
4 5 6
'ffiBLE 4A.
Burial Nurber, Jlge, Sex, arrl Grave Asso:::iatioos for Irrlividuals Interred at Uf:!:er Sarato.vn-I.o::ality 1.
SEX 1'J3E rnAVE ASSX:IATICNS
~ 6-10 r-rNE SJBADULT 6-10 VS, VlO, Vl6 , Vll6 .
FEMAIE 26-30 V6, VlO, Vl5, V23, V25, V26, V29,
V37 , V48 , VllS. SJBADULT U-15 V4, V6, Vl6, Vl 7, V56, Vl16, Vl17. SJBADULT 6-10 V4, Vl7 , Vll7 . EUIWXJLT 3-5 V2, V6, VlS, V21, V24, V25, V26,
V29, V59, V68 (?) , VllS, V116, V120, Vl21.
336

1
2
3 4 5 6 7 8 9 10 11 12 13 14 15 16 17 18 19 20 21 22 23 24 25 26 27 28
29
30 31 32 33 34 35 36 37 38 39
40 41 42 43
"mBLE SA.
Burial Nurber, h]e, Sex, arrl Grave Asscciatirns for In::lividuals Interred at tJr:p2r Sarato.vn-I..cx:ality 2.
SEX
MAI.E
WII.£
MAI.E
mPADULT
MAI.E
AIXJLT ~
mPADULT
AOOLT SJBi\DULT
AOOLT
AIXJLT FEMALE ~T
FEMALE FEMALE FEMALE FEMALE
MAI.E
~T FEMALE
SJBi\DULT
MAI.E
WII.£
~
AIXJLT AOOLT
WII.£
SJBAIXJLT INCEI'ERMINA'IB IND~
~T INDETI:RMINA'IE ~T
FEMALE AIXJLT AIXJLT AIXJLT ~
AIXJLT MAI.E
~T
16-20
26-30 26-30 31-35
3-5 36-40
?
6-10 6-10
? 6-10
? 26-30 36-40 3-5
16-20 46+
46+ 46+
26-30 11-15 16-20 0-2
26-30 41-45 0-2
26-30 26-30 31-35 6-10
? ?
11-15 ?
3-5 26-30 21-25 26-30
?
3-5 ?
26-30 6-10
V4, V6, V66, V68, V71, V74, V78, V84 , V92 , VllO, Vl16, V4, V16, V66, Vl02, V116. Vf/J I V66 I V73 I VlQl , V103 • llOlE V59, Vf:f5, V68, V69, V103, V104, VlOS.
Vf:f5, VlOl, V102. llOlE
V35, Vf:f5, V68, V69. V67 , V102 . Vf:f5, V102, V103 . llOlE
llOlE
V66, V67 I VlQl , V102 , V103. llOlE
V22, V59 , V70 . Vll. V66, V68 , V79, VOO , V82 , VlOl, V124. llOlE
V66, V69, V102 . V4, V16, Vl16. V66 . V67, V69. V66, VlOl, V102 , V103 . V67, V102. llOlE
V2, V12, V116. V69 . V57, Vf:f5, V76, Vl02, Vlll . Vffi . V77. V66, V69. llOlE
V69 . Vf:f5, V67. V66 I V67 I VlOl , V102 o
Vf:f5, V67, V76, V81, V102, Vlll . V50 I V54 I V76 I Vlll. V66, V67, VlOl, V102. Vf:f5 , V67 , V76, VlOl , V102 . Vf:f5, V67, VlOl, V102. V66 I VlQl , V1Q4 o
V57, Vf:f5, VlOl. 'vr:£J, V68, V69, V71, V75, V76, VlOl, Vlll .
337

44
45a 45b 46 47 48 49 50 51 52 53 54 55
56 57 58 59 fjJ
61 62 63 64
65 a; 67 E£ 69 70 71 72 73
74 75 76 77 78 79 00 81 82 83 84 85
86 87
TABI.E SA. (a:ntinue:i)
ADULT
MAI.E MALE
$.l13AIX1LT
SJBl\DULT
$.l13AIX1LT
ADULT
MAI.E FEW\LE
EmlAOOLT SJBl\DULT
$.l13AIX1LT
ru&\DULT
?
41-45 16-20
3-5 6-10
11-15 ?
26-30 46+ 6-10 3-5 3-5 3-5
26-30 0-2
31-35 ?
ID INFCFMATICN---CMITI'ED ru&\DULT 3-5
MAI.E 26-30
MAI.E MALE
$.l13AIX1LT
FEW\LE
EmlAOOLT FEW\LE
SUEAIXJLT MALE
FEMAIE SJPADULT $.l13AIX1LT
SJPADULT $.l13AIX1LT
FEW\LE
3-5 0-2
26-30 41-45 36-40 31-35 6-10
26-30 0-2
?
46+
36-40 45+ 3-5
26-30 3-5
41-45 3-5
36-40 36-40 3-5
? 3- 5 6-10 46+
GRAVE ASS:x:IATICN3
Vll, V43, V44, V56, V59, Vf:fJ, V76, V84, Vlll. V43, V57 . V43 , V57 , Vf:fJ. Vffi, V67, VlOl, Vl02. VfJ:J , V67 I VlOl , Vl04 . Vffi, V67, VlOO, VlOl , Vl02. V59, Vf:fJ , V69 . Vffi, V67, VlOl, Vl02 . VfJ:J , V67 I V74, VlOl, Vl02, Vl06. V4, Vffi, V76, VlOl . V4, Vl6, Vffi, V74, VlOl, VlOB, V116 . Vffi, V68, V74, V92, VlOl, Vl04, VlOO.
Vfi:J, V67, V68, V74, VlOO, VlOl, Vl02, Vl04, Vl06. Vfi:J, V67, V76, VlOl, Vl02. V62, Vfi:J , V68 , V74, VlOl , VlOB. Vffi, 101, Vl02, Vl03. Vffi, V77.
VfJ:J I V77 I VlQ2 • Vfi:J, VlOl. Vfi:J , Vl02. Vffi, V67, V71, V74, VlOl, Vl03, Vl04 , vno. Vffi, V67, VlOl, Vl02, Vl03. Vfj5 I V67 I VlOl . N:tE V4, Vfi:J , VlOO, VlOl . V4, Vfi:J, V67, V74, Vl02, VllO. Vfi:J. Vffi, V67, V68, VlOO, VlOl. Vffi, V67 . V4, Vl6, Vf:fJ, Vffi, V76, VlOl, Vlll, V116 . Vffi, V67 . V4, Vfi:J , VlOl. Vffi, V67, VlOl . V67, V76, VlOl , Vl02 , Vl03, Vl12 . V67, V71. tnJE V61 , V67 , V69, Vl02. Vfi:J, V74 , VlOB. Vffi, V76. Vfi:J, Vl02 , V103 , V105 . Vffi, V71, Vl02, Vl03. Vfi:J, V76, VlOl , Vl06 . N:tE Vf:fJ.
338

339
'I7IBLE SA. ( a::ntirued)
BURIAL SEX la: GRAVE ASSX:IATICNS
ffi SUBAIXlLT 6-10 N'.NE
89 EUB.?\DlJLT 3-5 Vf:15, VlOO. <3) SUBAIXlLT 6-10 N'.NE
91 FEMAIE 31-35 VlO, V76, Vlll. 92 JNreI'ERMINATE ? Vf:15 , V71. 93 INDEIERMINAlE ? Vf:15. 94 JNreI'ERMINATE ? Vf:15, V76. 95 FEMAIE 16-20 V57, Vf:15, V67, V76, VlOO, Vl03 . % MALE 46+ V57. 97 EUB.?\DlJLT ? Vf:15 . 93 SUBAIXlLT 6-10 Vf:15 . 99 SUBAOOLT 3-5 V4, Vl6, Vf:15, Vl02, Vl16. 100 MALE 36-40 Vf:15 , V84, VlOl. 101 SUBAOOLT 0-2 N'.NE 102 SUBAIXlLT 0-2 V67, V74 , Vl02, VlCB . 103 SUBAOOLT 6-10 Vf:15, V72, VlOl, Vl05. 104 MALE 46+ V48, V57, V60. 105 FEMAIE 26-30 N'.NE 106 AOOLT ? Vf:15, V76 . 107 SUBAIXJLT 3-5 Wf:15, V67, V74, VlOl, Vl02, Vl04,
VlOO. -100 MALE 41-45 VED, Vf:15, Vl02. lCB FEMALE 31-35 Vf:15, V67, V71, VlOl, Vl02, Vl03. 110 MAI.E 41-45 V57. ill SJPADULT 6-10 N'.NE
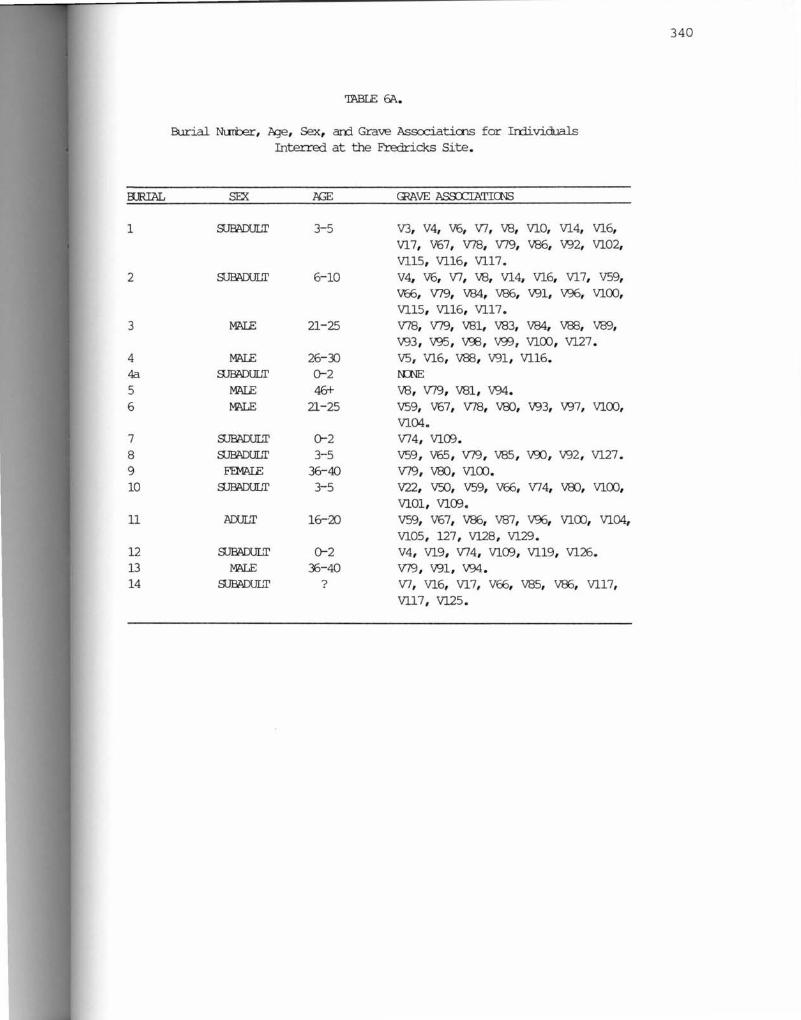
fl.lRIAL
1
2
3
4 4a 5 6
7 8 9 10
11
12 13 14
'mBIE 6A.
Burial Nurber, l'qe, Sex, arrl Grave Associatirns for Irrlividuals Interred at the Fredricks Site.
SEX M;E GRAVE ASSXJATICNS
SJBAlXlLT 3-5 V3, V4, V6, V7, V8, VlO, Vl4, Vl6, V17, V67, V78, V79, V86, V92, Vl02, V115, V116, V117 .
SUBNXJLT 6-10 V4, V6, V7, V8, Vl4, Vl6, Vl 7, V59, V66, V79, V84, V86, V91, V96, VlCXJ, V115, V116, V117 .
MAIE 21-25 V78, V79, V81, V83, V84, VSB, V89,
V93 , V95 , \193 , V:fJ, VlOO, Vl27 . MAIE 26-30 vs, Vl6, VSB, V91, Vll 6.
SJB?>DULT 0-2 N:NE
MAIE 46+ V8, V79, V81, V94. MME 21- 25 V59, V67 I V78, V8), V93, V97, VlCXJ,
Vl04. SJBAlXlLT 0-2 V74, VlCB. SUBAfXJLT 3-5 V59, V65, V79, V85 , vgJ , V92 , Vl27 .
FEMAIE 36-40 V79, V8), VlCXJ. SUBAfXJLT 3-5 V22, VSO, V59, V66, V74, V8), VlCXJ,
VlOl , VlCB. AIXJLT 16-20 V59, V67, V86, V87, V96, VlOO, V104,
VlOS, 127, Vl28 , Vl29. SJBAlXlLT 0-2 V4, Vl9, V74, VlCB, Vll 9 , Vl26.
MME 36-40 V79, V91 , V94 . SUBAfXJLT ? Vl, Vl6, Vl7, V66, V85, V86, Vll 7,
Vll7 I Vl25 .
340
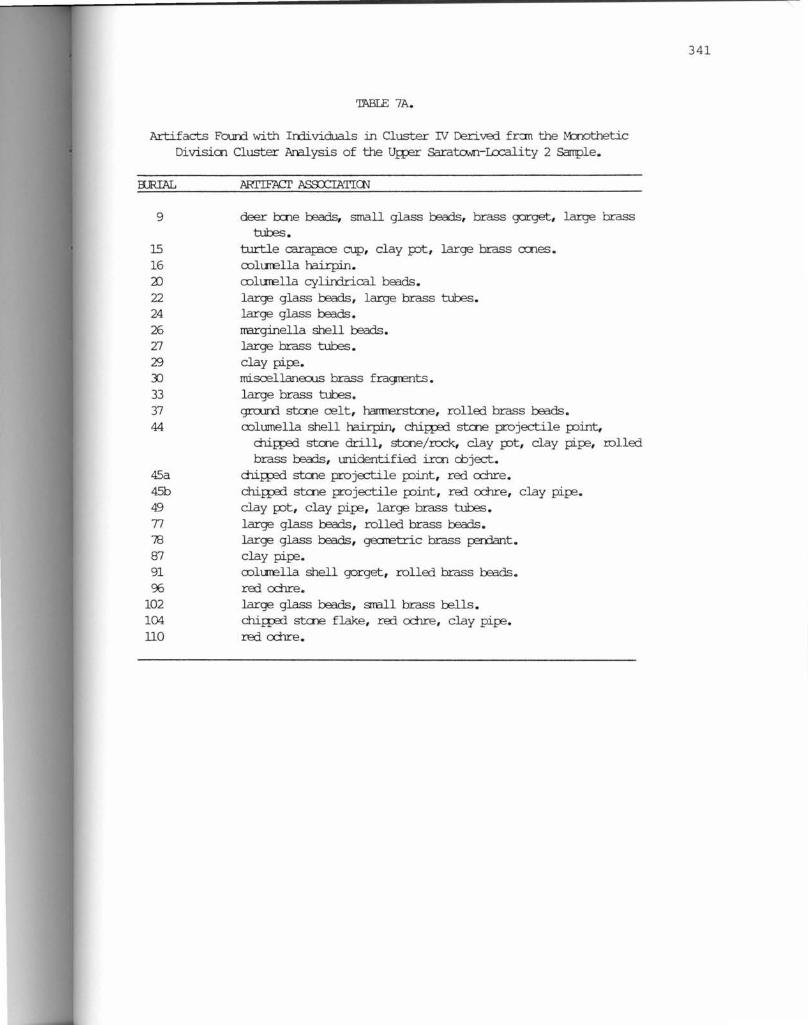
'mBLE 7A.
Artifacts Foun:i with Irrlividuals m Cluster IV D2rived fran the M:nothetic Divisim Cluster Ara.lysis of the Ur:p::r Sarato..Jn-L:cality 2 Sample.
9
15 16 X)
22 24 26 27 29 3)
33 37 44
45a 45b 49
77 78 87
91 96
102 104 llO
deer lxne beads, small glass beads, brass garget, large brass t:ul::Es.
b.rrtle carap:1.ce cup, clay .IDt, large brass cmes. oolurella hairpin. oolurella cylirdrical beads. large glass beads, large brass t:ul::Es. large glass beads. rrarginella shell beads. large brass tutes. clay pi.P3. rniscellana:us brass fragrrents. large brass t:ul::Es. gra..ird stale celt, h3mrerstme, rolled brass beads. oolumella shell hairpin, chig::aj stale projectile _IX)lllt,
drii:p:rl stale drill, stale/rock, clay JX)t, clay pi.P3, rolled brass beads, unidentified irm ooject.
drii:p:rl stale projectile _IX)lllt, red o:::hre. chig::aj stale projectile _IX)lllt, red o:::hre, clay pi.P3. clay .IDt, clay pi:i:;e, large brass t:ul::Es.
large glass beads, rolled brass beads. large glass beads, ge:::rretric brass :p=mant. clay pi:i:;e. colurella shell gorget, rolled brass beads. red o:::hre. large glass beads, STB.11 brass bells. chig::aj stcne flake, red ochre, clay pi:i:;e.
red cx::hre.
341

APPENDIX B
FACTORS PR<JDUCED BY THE PRINCIPAL COMPONENTS ANALYSIS WITH VARIMAX ROTATION FOR THE SHANNON SITE AND UPPER SARATOWN-LOCALITY 2 .

343
'IlIBI.E lB.
'Ihe 16 Factors Prcx:nx:ed by the Princip3l Comp:nents Analysis with Varirrax Rotalioo for the Sh3nnon Site.
ARTIFACT F.A.CKR 1 F.A.CKR 2 F.A.CKR 3 F.A.CKR 4
Olive Shell Beads 0.00254 -0.00315 0.93528 0.00345 M3.rginella Shell Beads -0.05203 -O.Cxi332 -0.06479 0.62244 Colurella Cylimrical Beads -0.03656 -0.05888 0.07543 0 .03096 Colurella 'Tube Beads 0.24074 -0. 03174 -O.Cxi663 0.39017 Colurella .9:rall Disc Beads -0.02669 -0.01984 -0.02671 0 . 21113 Colurella Shell Peooants -0.02341 -0.00414 -0.02677 0.69509 UnalterErl fussel Shell 0.70215 0.70716 -0.01069 -0.00294 Turtle Carap:i.CE Cup -0.01920 0.56482 -0.02393 -0.03974 Turkey Digit Beads -0.00955 -0. 0453) -0.0216) -0.03093 Turkey Coraooid Beads -0.01832 0.00068 -0.00700 0.75669 Turkey I..atj::x::ne Tul:ular Beads -0.02118 0. 47446 -O.Cxi279 -0.07176 Turkey Tibiotarsal Awl 0.56222 0. 57100 -0.02281 -0.02281 Eagl e Talm Beads -0.00886 0.99649 -0.00317 -0.00582 Bene Hairpin -0.04331 -0.00005 -0.01776 -0.17623 Beaver Incioor Chisel 0 . 99662 -0. 00169 -0.01186 0. 00168 W:>lf Canine Beads -0.00898 -0.00896 -0.01786 -0.02472 M:Jtmtain Lim Claw Beads 0.00247 -0.01131 0.66254 -0.06247 l3e3r Canine Beads -0. 02338 -0.01623 -0.03134 -0.04507 Bear M:lrdible -0.01040 -0. 00805 -0.01322 -0.03259 D::er" Bene Beads -0.00852 -0.00372 -0. 05430 -0 .10042 Deer I..atj::x::ne Awl -0.00886 0. 99649 -0.00317 -0.00582 D::er" Lcngl:x:ne Chisel 0.99662 -0.00169 -0.01186 0.00168 Deer Bene Flaker 0.99662 -0.00169 -0.01186 0.00168 D::er" Bene Fishhook -0.00703 -0.00699 -0.02845 -0.05438 D::er" Phalarq2 Projectile Point -0. 01944 -0. 02013 0.83773 -0. 01731 Elk Tooth Beads -0.00886 0.99649 -0.00317 -0.00582 Chir:p:rl Strne Projectile Point 0.71026 -0.00344 0 . 65642 0.00365 Chir:p:rl Stale Drill 0. 99662 -0.00169 -0.01186 0.00168 Chir:p:rl Stme Knife -0. 00703 -0.00769 -0.02713 -0.05246 Chir:p:rl Stale Blade -0.00866 -0.00348 -0.01755 -0. 14283 Chir:p:rl Stme fu:l Scra_E:er -0. 00886 0 . 99649 -0.00317 -0.00582 Grcurrl Stale Celt 0. 62557 -0. 01392 0.05966 -0 .05631 Stme Pen::lant -0. 00886 0. 99649 -0.00317 -0.00582 Stale Abrader 0.99662 -0. 00169 -0.01186 0.00168 Hamrerstale -0. 01405 -0. 01024 -0.04415 -0.07957 Rock Crystals -0.01269 0.70199 -0 .01495 -0.02171 Stme/Rock -0.00455 -0.01591 -0.04501 -0.06615 Clay Pot -0.00702 -0. 00771 -0.02703 -0.05227 Clay Pi.i:e -0.02426 -0.01627 -0. 02346 -0.03495 Rolled Na.live Cq:p2r Bead -0.00702 -0.00774 -0 .02691 -0.05205 Raw/Hamrered Na.live Cof.P=r 0.99662 -0. 00169 -0. 01186 0.00168

344
'ffiBLE IB. ( a::ntinuErl)
ARI'IFACT FAcrrn 5 FAcrrn 6 FACirn 7 FAcrrn 8
Oli-ve Shell Beads -0.01002 0.00229 0.00725 -0.00559 Mrrginella Shell Beads 0.05265 0.4(XX)5 -0. 07475 0.06289 Colurella Cylirrlrical Beads 0. 74974 0.04372 -0.03152 0. 10309 Colurrella 'Tul:::E Beads 0.11218 -0.01814 0. 04759 0. 14956 Colurella Srall Disc Beads 0. 06026 -0. 00696 0. 11348 0. 85484 Colurella Shell Peooants -0.07164 -0.11242 -0.03077 -0. 10013 Unaltera:1 M..issel Shell 0. 00948 0. 00868 -O. cxx:E2 -0.00029 Turtle Carap:3.oe Cup -0.02360 -0 .01520 -0. 02315 -0.01880 Turkey Digit Beads -0.02048 -0.01088 -0.01923 -0.01637 Turkey Coraroid Beads -0.03819 -0.0'3J77 -0.00857 0. 15871 Turkey I.a1gl:x:ne Turular Beads 0.56799 -0. 07037 -0.02706 -0.08197 Turkey Tibiotarsal Awl -0. 00805 -0.00364 -0. 01358 -0.01117 F.agle Talcn Beads 0.00929 0. 01076 -0.00329 -0. rox:B Ecne Hairpin -0.00274 -0. 02808 -0.05589 -O.CBJ68 Beaver Incisor Qri.sel 0.00404 0. 00145 0. 00213 -0.00032 vblf Canine Beads -0.03000 0. 96485 -0.01157 -0.03010 t-buntain Lien Claw Beads -0.11002 -0. 04397 -0. 04746 -0.03672 Bear Canine Beads -0.03783 -0.02604 0. 86521 0. 09979 Bear Marrlible -0.02015 -0. 00033 0. 84287 -0.07653 Deer Bene Beads -0.10464 -0. 00231 -O.CB823 -0.04282 Deer I.a1gl:x:ne Awl 0.00929 0.01076 -0.00329 -0. rox:B Deer I..cngtx::ne Ori.sel 0.00404 0.00145 0.00213 -0.00032 Deer Bene Flaker 0.00404 0. 00145 0. 00213 -0.00032 Deer Ecne Fishhcok -0. 04998 -0.03163 -0. 04449 -0. 01<:X:>7 Deer Phalange Projectile Point 0.15035 0.01354 -0.00153 0.00545 Elk 'Itoth Beads 0.00929 0. 01076 -0. 00329 -O. CX)CX)9 Ori.r:p:rl Stme Projectile Point -0.00994 0.002€:ii 0.00667 -0.00420 Ori..i:p::d stcne Drill 0.00404 0. 00145 0.00213 -0.00032 Ori.r:p:rl Stme Knife -0.04799 -0. 03000 -0. 04271 -0.01839 Ori..i:p::d Stale Blade -0.05512 -0.01933 -0.07860 0. 00581 Ori.r:p:rl Stme Ehl. Scraµ:r 0.00929 0. 01076 -0. 00329 -0. rox:B Gra.rrrl Stale Celt -0.07230 -0.03428 -0.04386 -0.02666 Stme Peooant 0.00929 0. 01076 -0. 00329 -0. rox:B stcne Abrader 0. 00404 0.00145 0.00213 -0.00032 Hamrerstme -0. 07155 -0. 04725 -0. 06297 -0.03131 Rock Crystals -0.01472 0. 69352 -0. 01056 -0.02147 Stme/Rock 0.82783 -0 . 03455 -0.01323 -0 .06684 Clay Pot -0.04780 -0. 02984 -0.04253 -0.01831 Clay Pii;:e -0. 02713 -0. 01844 -0. 02211 -0.01874 RollErl Nati-ve Cqµ:r Bead -0. 04758 -0.02965 -0.04232 -0.01822 Raw/HamrerErl Nati -ve Co.J;P=r 0. 00404 0. 00145 0. 00213 -0.00032

345
'mBLE IB. (o:ntinued)
ARTIFACT FACTCR 9 FACTCR 10 FACTCR 11 FACTCR 12
Olive Shell Beads 0.00594 0.00872 O. OOSffi --0 .00335 M:lrginella Ehell Beads --0.02768 --0.01664 0.13268 --0.02716 Col urel la Cylirrlri cal Beads 0.00690 0.01693 0. 117EIJ --0.01482 Colurella Tote Beads --0.03421 --0 .02722 0. 66208 --0.04062 Colurella &ra1l Disc Beads --0. 00811 --0.00630 0. 12561 --0. 02134 Colurella Ehell Pen::lants --0. 02700 --0.02269 --0.01827 --0.01476 Unaltered Mussel Shell 0.02372 0. 02136 0. 02219 0. 02219 Turtle Cara_p3.rn Qip 0. 72919 --0.01121 --0.02866 --0.01917 'Turkey Digit Beads 0. 94692 --0. 01182 --0.02591 --0.02849 'Turkey Coracoid Beads --0.00160 --0.00070 --0 .06968 --0.01EIJ2 'Turkey I..cngb::ne Tul:::ular Beads --0. 03852 --0. 04537 --0.03975 --0 .01814 'Turkey Tibiotarsal Awl 0.00784 0.59363 --0.00057 --0.01524 Fagle Talcn Beads 0.02993 0.01054 --0.00200 0.00116 Bcne Hairpin --0.02133 --0.01588 0. 82863 --0.03064 Beaver Incioor Qrisel 0.00338 0. 01951 0.03321 0.00221 W:)lf Canine Beads --0.01723 --0. 01484 --0.04759 --0.02097 M:Juntain Lien Claw Beads --0.05125 --0. 06176 --0. 08736 --0. 025<cB Bear Canine Beads --0.01975 --0. 01577 0.03640 --0.02178 Bear M3rrlible --0.00944 --0. 00683 --O. OED91 --0. 01716 Deer Bene Beads --0.11054 --0.10229 --0. 14741 --0. 51780 Deer I..cngb::ne Awl 0 . 02993 0. 01054 --0. 00200 0.00116 Deer Lcnglxne Orisel 0.00338 0. 01951 0. 03321 0.00221 Deer Bene Flaker 0.00338 0. 01951 0.03321 0. 00221 Deer Bene Fishhcx::lk --0.04222 --0.03483 --0. 05533 --0.10409 Deer Phal~ Projectil e Point 0.01764 0.02945 0. 02978 0.00247 Elk Tooth Beads 0.02999 0.01054 --0.00200 0.00116 Qrii;:p:rl Stal2 Projectile Point 0. 00662 0.02007 0. 02779 --0.00081 Chii;:p:rl strne Drill 0. 00338 0.01951 0.03321 0. 00221 Orii;:p:rl Stme Knife --0. 04021 --0. 033CB --0. 05321 --0. 10425 Qrii;:p:rl strne Blade --0.01807 --0.01424 --0. 10544 --0.00186 Orii;:p:rl stme F.rrl Scra:i;:er 0. 02993 0. 01054 --0. 00200 0.00116 Groorrl strne Celt --0.04252 --0.05840 --0 .06494 --0.01911 Stal2 Pen::lant 0 . 02999 0. 01054 --0.00200 0.00116 strne Abrader 0.00338 0. 01951 0.03321 0. 00221 Harrrrerstme --0. 06119 --0. 05256 --0.08474 0.83593 Rock Crystals 0. 00907 --0.00306 --0.03525 --0.01408 Stcne/Rcx::k --0. 01952 --0. 02196 --0. 11766 --0. 02206 Clay Pot --0. 0400) --0.03289 --0.05295 --0. 10591 Clay PifE --0. 01994 0. 98727 --0 .03219 --0.02948 Rolled Native CcgEr Bead --0.03974 --0.03265 --0.05263 --0. 10704 Raw/Hamrered Native Cq:p2r 0. 00338 0. 01951 0. 03321 0.00221

346
'mBLE lB. (a:ntinue:i)
ARTIFACT FACirn 13 FACICR 14 FACirn 15 FACICR 16
Olive Shell Beads --0. 01252 --0. 01243 --0.01234 --0. 01115 Mrrginella S'lell Beads --0. 02648 --0.02626 --0. 02ffi4 --0.02416 Colurella Cylirrlrical Beads --0. 02781 --0.02761 --0. 02741 --0.02549 Colurella Tube Beads --0.03661 --0. 03632 --0.03ffi2 --0.03386 Colurella Srell Disc Beads --0. 02161 --0. 02144 --0. 02126 --0.0198:i Colurella Shell Perdants --0. 00579 --0.00572 --0. 00564 --0. 00500 Unal terErl Mussel Shell 0. 00240 --0. 00235 --0. 00236 --0.00272 Turtle carap:KE Cup --0. 01524 --0.01512 --0.01500 --0.01432 Turkey Digit Beads --0.02292 --0. 02273 --0. 02253 --0 .02099 Turkey Coraroid Beads --0.01400 --0.01387 --0.01374 --0.01259 Turkey I.cngl:x:ne Turular Beads --0.CXX)l9 --O. CXX)l4 --O. CXXJ09 --O. CXXJ03 Turkey Tibiotarsal Awl --0. 01491 --0.01481 --0.01471 --0.01426 Eagle Talrn Beads O.CXXJ28 0.CXX)26 0 . CXX)24 --O. CXX)36 B::ne Hairpin --0. 02026 --0. 02010 --0.01993 --0.01908 Beaver Incisor Chisel --0.00358 --0. 00357 --0. 00356 --0. 00346 w:>lf Canine Beads --0. 01500 --0.01486 --0.01472 --0.01355 M:Jlmtain Lim Claw Beads 0.01800 0 . 01182 0. 01184 0. 01188 Bear Canine Beads --0.01766 --0. 01751 --0. 01735 --0 .01ffi6 Bear Marrlible --0.01374 --0. 01362 --0. 01349 --0. 01239 Deer B::ne Beads --0.3ffil8 --0.3ffi56 --0. 3ffi28 --0 . 36354 Deer I.cngl:x:ne Awl 0 .CXX)28 0. CXX)26 0 . CXX)24 --0. CXX)36 Deer I.cngb:ne Chisel --0.00358 --0. 00357 --0.00356 --0.00346 Deer B'.:ne Flaker --0. 00358 --0. 00357 --0. 00356 --0.00346 Deer B::ne Fishhcok --0.09944 --O. CB368 --0 .09813 o.~97 Deer Phalange Projectil e Point --0. 01891 -0. 01800 -0.01869 --0. 01723 Elk Troth Beads 0. 00028 O. CXXJ26 O. CXXJ24 --0 .CXX)36 Chii:p:rl Stme Projectile Point --0. 01145 --0.01138 --0. 01131 --0.01038 Chig::ed strne Drill --0.00358 --0. 00357 --0.00356 --0.00346 Chii:p:rl Stme Knife --0. 09762 --0. 09736 08JJJ7 --0. 09732 Chig::ed strne Blade 0. 00511 --0.00509 0. 00507 0.00478 Chii:p:rl Stme Ertl Sc:ra_r:a- 0. CXX)28 0.CXX)26 O. CXXJ24 --O . CXX)36 Gro..nrl strne Celt 0. 01498 0. 01495 0. 01492 0.01437 Stme Perdant 0. CXX)28 0. CXX)26 0.CXX)24 --O. CXX)36 Stale Abrader --0.00358 --0.00357 --0. 00356 --0 .00346 Harmerstme --0. 14938 --0. 15076 --0. 15241 --0.15425 Ra::k Crystals --0. 01046 --0.01038 --0.01029 --O. <XB89 Stme/Rcx::k --0. 00743 --0. 00732 --0. 00720 --0. 00622 Clay Pot --0.09741 O. gJJJ7 --0. 09699 --0. 09676 Clay PiP= --0. 02225 --0. 02207 --0.02189 --0. 02061 Rolle:i Native Cq:p2r Bead 0.90823 --0.09679 --0.09657 --0.09582 Raw/Hairnerro Native Cq:p2r --0. 00358 --0. 00357 --0.00356 --0. 00346

347
'ITIB1E 2B.
'The 16 Factors Produced l:Jy the Princip:il Ccrrµnents Analysis with Varirrax Rotatim for~ Sarato,..n-I..ocality 2.
ARTIFACT Factor l Factor 2 Factor 3 Factor 4
Mrrginella Shell Beads -0.01373 -0.00960 -0.01CB9 -0.04737 Colurella Cylirrlrical Beads -0.03173 -0. 04Cm 0. 41936 -0.03275 Colurrella Stall Disc Beads -0.00139 -0.00411 0.95578 -0.00170 Colurella Shell Gargets -0. 04051 -0. 01031 -0. 01093 -0 .00741 Colurella Shell Hairpins 0.78987 -0.009J4 -0.02285 -0.00842 Turtle Carap:ice Cup -0. 03961 -O.C0303 -0. 00383 0.97914 D::er Bene Beads -0.03401 -0.02234 0.00534 -0.04574 Chii;p:d stme Projectile Point 0 . 66703 -0.01004 -0. 01601 -0.01235 Ori.fP:rl Stale Drill 0 .96392 -0. 00379 0.00166 0.02027 Chii;p:d Stme Flakes -0.05484 -0. 00529 0.00800 -0. 00454 Gra.rrrl Strne Discs -0. 01113 -0. 00474 -0.00226 -0.01036 Grourrl Stme Celt -0. 01368 -0. 00739 -O.OCX326 -0.00701 H3rrrrerstme -0.01368 -0. 00739 -O.OCX326 -0.00701 Strne/Rcx::k 0 . 96392 -0. 00379 0.001£6 0.02027 Red O::hre 0.01559 -0.02475 -0.03158 -0.03230 Clay Pot 0 . 52134 -0. 00998 -0. 02317 0.629£6 Clay PiIE 0. 34872 -0.02726 -0.02073 0.01789 Clay Di_I:P=r -0. 01113 -0. 00474 -0.00226 -0.01036 Fired Clay lrnI> -0.00314 -0.01935 -0.07352 -O.CX:B66 Em311 Glass Beads -0.15943 0.05328 0.10702 -0.142SJ Large Glass Beads -O. CX3£67 -0.00262 -0.13795 -0.06825 Brass Garget -0. 00988 0. 33894 0.33186 0.02805 Large Brass Tul:es -0.00793 -0.03507 -0.03454 0.04527 Large Brass 0:::nes -0. 03961 -O.C0303 -0.00383 0.97914 Ga::rretric Brass Peroants -0. 03613 -0. 03129 0. 36434 -0.02968 Brass Anirral Effigy -0 .00753 -0 .01176 -0.02212 -0.01125 Brass Wire -0. 05782 -0 .00763 -0.02174 -0.01817 Em3.ll Brass Bells -0.03778 -0 .05005 0.36200 -0.03022 Large Brass Bells -0. 00899 0.00106 -0. 03441 -0.00140 Rolled Brass Beads 0.24056 -0.03895 -0. 05350 -0.03585 Mi.scell ana::us Brass Fragrrents -0.01931 -0.02531 -0.03253 -0.05008 Irm Scissors -0.00139 -0.00411 0.95578 -0.00170 Irm Knife -0. 00603 O.SB588 -0.00603 -0.00383 Irm Hee -0. 00603 0.98500 -0.00603 -0.00383 Irm Axe -0.02021 -0.00465 0.00666 0.00432 Irm Spike/Chisel -0.00603 0.98500 -0.00603 -0.00383 Unidentified Irm Object 0.60409 -0.00916 0.61058 -0 .00286 Metal Sp:x:n -0. 02138 -0. 00073 0.81051 -0 .002£6 I.red Sh:Jt -0.01174 -0.02278 -0.04576 -0.00320 Brass Rings -0. 01323 0. 00594 -0.01447 -0.01025

348
'I1ffiIE 2B. ( a:ntinuErl)
ARTIFACT Factor 5 Factor 6 Factor 7 Factor 8
M:rrginella Shell Beads -0. ():,484 -0. 02737 -0.072"33 -0.04874 c.olurella Cylirrlrical Beads -0.03633 -0. 03147 -0 .13667 -0. 17603 Colurella &n:tll Disc Beads O. CX:Wl -0. 00057 0. 00903 0.07302 c.olurella Shell G::irgets 0 .01383 -0.06205 -0.07449 -0.01773 Col urella Shell Hairpins -0.00942 -0. 00594 -0. 07721 -0. 02600 'furtle CaraP3-ce Cup -0.01019 -0.00550 -0.01071 -0.02076 Deer B:ne Beads -0.08579 -0. 012CB -0.03493 -0. 12078 Ori.I¢ stme Projectile Faint -0.00642 -0.00951 0. "33241 -0.02132 Ori.i:µrl Stale Drill -0. 00268 0. 00060 -0.04295 -0. 00527 Ori.I¢ stme Flakes -0.00464 -0. 01040 0.67661 0.00322 Grourrl Stale Discs 0.98670 -0. 00459 -0.01238 -0. 01767 Gra.url stme Celt -0.00486 0. 99439 -0.01732 -0.01337 Harmerstooe -0. 00486 0. 994"33 -0.01732 -0. 01337 stme/Rcck -0.00268 0.00060 -0.04295 -0.00527 RErl Ochre -0.02465 -0. 01934 0. 85234 -0.04116 Clay fut 0.00194 -0.00969 -0.02568 0.02552 Clay Pipe -0. 01578 -0.02170 0. 39611 -0.04195 Clay Di~ 0.98670 -0.00459 -0.01238 -0.01767 FirErl Clay Lurp -0.00929 0. 00033 -0. 00lB -0.06267 Srall Glass Beads -0.17259 -0.12883 -0.27126 0.10392 Large Glass Beads 0. 22355 -0. 06617 -0.13116 0.36914 Brass G::irget -0.04078 -0.00284 -0.00865 0.29954 Large Brass Tubes 0.31742 -0.02008 -0. 03648 0. 27076 Large Brass O:nes -0.01019 -0.00550 -0.01071 -0.02076 Ge:rretric Brass Pernants -0.03287 -0. 03066 -o.ocm7 0.69635 Brass An:iiral Effigy -0.00435 -0.01188 -0.01734 -0.00781 Brass Wire -0. 00546 -0.00:a-3 -0. 07318 0.00402 Srall Brass Bells -0.00505 -0.02591 -0. 07337 0.02842 Large Brass Bells -0.02100 -0.00773 0. 00982 0. 84901 RollErl Brass Beads -0.04576 -0. 27168 0. 12086 0.20354 MiscellanEO.lS Brass Fragrents -0. 05151 -0. 03824 -0. 0BOE() -0.05335 Irrn Scissors O.CX:Wl -0.00057 0.00903 0.07302 Irrn Knife -0. 00267 -0. 00311 -0. 00873 -0.00173 Irrn !be -0.00267 -0.00311 -0.00873 -0.00173 Ira,. AA.e -0. 01578 -0.017<:B -0.00634 -0.07172 Irrn Spike/Ori.sel -0.00267 -0.00311 -0.00873 -0.00173 UnidentifiErl Irrn Object -0. 00830 -0.00825 -0.05217 0.01628 r-Etal Sµx:m -0.00924 0.00046 0.01308 0.03376 Lead Sh:Jt -0.00977 -0.00486 0.06992 -0.04835 Brass Rings -0.00589 -0.00749 -0.01266 -0.02571

349
'l7'\BIE 2B. ( cx:ntinued)
ARI'IFl\CT Factor 9 Factor 10 Factor 11 Factor 12
Mrrginella Shell l3eads -D.02160 -0.02876 -0. 19364 -0.08821 Colurella Cylirrlrical Beads -0.04336 -0.17124 0. 33129 0. 16129 Colurella Srall Disc Beads -0.00823 0.01455 -0.02710 -0. 02018 Colurella Shell Gargets -0. 0SCBB 0. 04592 -0. 11110 -0.03057 Colurella Shell Hairpins -0.03144 -0. 00792 -0.05579 -0.00683 Turtle Carapace Cup -0.04882 -0. 01750 -0. 01707 -0.03019 D3er Bene l3eads 0.82520 -0.02097 0. 02210 -0. 05661 Chi.i;µrl Strne Projectile Point -0.02942 -0 .02096 -0. 00624 -0. 03150 Ori.fP=d Stale Drill -0. 00973 -0.00383 0.00438 0.04645 Chi.i;µrl Staie Flakes -O. CXl882 0 . 01404 -0. 08415 0.16375 Gru.rrrl Stale Discs 0.04961 -0 .01085 -0.01643 -0.00657 Grourrl Stene Celt -0. 012ED -0. 00727 -0.02631 -0.00699 H3rnrerstme -0.01260 -0.00727 -0.02631 -0.00699 Stme/Rcx:::k -0. 00973 -0. 00383 0. 00438 0. 04645 Red a::hre -0.04857 -0.05636 O. CB783 -0.11178 Clay Pot 0 . 21146 0.02221 -0.03630 0.11375 Clay Pi.P= 0.03089 -0.04414 -O.CB457 0. 65790 Clay Di:i;:rer 0.04961 -0.01085 -0. 01643 -0.00657 Fired Clay 1unp 0.00022 0.83986 -0.07163 0.02117 S!rall Glass Beads 0.06422 0. 11683 0.50105 0. 11370 Large Glass Beads -0. 20485 0. 03850 0. 37387 -0.14202 Brass Garget 0.38773 0. 53961 0. 23564 -0.03618 Large Brass Tubes 0.70033 -0.02935 -0.00746 0.02552 Large Brass Cales -0.04882 -0. 01750 -0. 01707 -0. 03019 Gearetric Brass Perrlants -0.10674 -0.01649 -0.07128 -0.02761 Brass Anirral Effigy -0. 02568 0. 00193 -0. 07490 -0 .05737 Brass Wire -0.05169 0.01017 -0.01617 0. 84042 EiTall Brass Bells -0.13323 0.66244 0. 14657 -0.03769 Large Brass Bells 0.15727 0. 01067 0. 01549 0.01870 Rolled Brass Beads -0.03241 -0.11106 0. 15764 -0. 02595 Miscellana::us Brass Fragrrents -0.06201 -0.02657 -0. 28694 -0. 14775 Irrn Scissors -0.00828 0.01455 -0. 02710 -0. 02018 Irm Knife -0.00112 0.00836 0. 01413 0.00207 Irrn Hoe -0.00112 0.00836 0. 01413 0. 00207 Irm Axe 0.02299 -0.01241 -0.09236 0. 00027 Irm Spike/Chisel -0. 00112 0. 00836 0.01413 0. 00207 Unidentified Irm Object -0.01ED5 -0.02150 -0.02469 0. 00730 M=tal Sp::x:n 0.02546 0. 20846 -0.00690 -0. 02893 Lead Soot -0.02016 0. 04287 0. 78884 -0.10441 Brass Rings -0. 02613 -0. 01970 -0. 06197 -0. 02473

350
'I1IBI.E 2B. ( a:ntinuerl)
ARTIFACT Factor 13 Factor 14 Factor 15 Factor 16
I>arginella Shell Beads -O. OC825 -0.04075 -0. 65736 -0. 15772 Colurella Cylirrlrical Beads -0.13476 0. 21693 0. 03240 0.06102 Col urella &rall Disc Beads 0 . 00522 -0. 01143 -0. 00578 -0.007':JJ Colurella Shell G::>rgets -0.05036 0.81058 -0.06271 -0. 05831 Colurella Shell Hairpins -0. 033'3J -0.02242 -0 .03078 -0. 0138) Turtle CaraP3CE Cup 0.00365 -0. 00538 0. 00760 -O. Ct:XJB7 Deer Bene Beads 0. 04977 -0. 05282 0.00554 0.00326 Orir:p:d strne Proje:::tile Point 0. 00528 0. 11472 0.01943 0.00577 Orir:p:d Stme Drill 0. 01514 0. 00447 0. 00537 0.00136 Orir:p:d strne Flakes -0.00833 -0. 13643 -0.01292 -0.01003 Grourrl Stme Discs -0. 00146 -0. 00217 0.01'3J3 -0. 00032 Gruurl strne Celt -0.00638 0. 00829 -0.00215 -0.00641 Harmerstrne -0.00638 0. 00829 -0. 00215 -0. 00641 strne/Rcck 0.01514 0.00447 0.00537 0.00136 Rerl Cx:hre 0. 00693 0. 09658 0.03093 0.00256 Clay Pot -0.04406 -0.02088 -0.01118 -0. 02102 Clay Pii;:e -0.06114 -0.01379 -0.01318 -0. 02846 Clay Di~ -0. 00146 -0.00217 0.01'3J3 -0.00032 Firerl Clay LUTp -0.01495 0. 00251 0. 04722 0.04035 Srell Glass Beads 0.24492 -O.CB469 0.27912 0. 19499 Large Glass Beads 0.37483 -0. 23578 -0. 10911 -0. 11047 Brass G::>rget -0.04652 0.00169 0.00846 -0.04480 Large Br ass Tubes -0. 06100 -0 . 01509 -0.03119 -0 .03364 Large Brass Cales 0.00365 -0. 00538 0.00760 -O. Ct:XJB7 Gearetric Brass Pen::lants -0 . 01800 -0.10135 -0 .01797 O.OOlffi Brass Anirral Effigy -0. 04014 -0.05119 0.00639 0.93004 Brass Wire 0.01600 -0.02561 o.cxm2 -0.03417 Srell Brass Bells 0.01234 -0.12631 -0.05048 -0.04110 Large Brass Bells -0. 03200 0. 14035 0.04626 0.00855 Rollerl Brass Beads 0.40058 0. 58827 0.03263 0.02107 Misrellaneous Brass Fragrents -0 . 11397 -0. 10968 0.70612 -0 . 24534 Irm Scissors 0.00522 -0 .01143 -0.00578 -0.00750 I.rm Knife 0.00587 -0.00565 0. 01043 0.00334 Irm !be 0.00587 -0.00565 0.01043 0. 00334 Irai. Axe 0 . 89286 0. 02702 -0. 00035 -0. 02824 Irm Spike/Orisel 0.00587 -0. 00565 0.01043 0.00334 Unidentifierl I.rm Object 0. 01456 -0.02407 0.01218 0. 01146 M::tal Spx,n 0.00501 -0.02737 -0.01248 -0.01835 18:rl Sh::)t -0.11393 -0. 04282 -0.03256 -0. 11861 Brass Rings -0.02933 -0.00831 -0.02821 -0. 01430

APPENDI X C
STATISTICS USED TO SELECT THE OPTIMUM CLUSTER SOLUTIONS .
SECTION 1.
STATISTICS USED TO DETERMINE OPTIMUM NUMBER OF CLUSTERS USING WARD'S MINIMUM VARIANCE CLUSTER ANALYSIS.
352
To determine the optimal number of clusters it is best to" ••
look for a consensus among the three statistics , that is , local
peaks of the CCC and pseudo F statistics combined with a small value
of the pseudo t 2 statistic and a larger pseudo t 2 for the next
fusion cluster." (SAS Institute 1985:67). The CCC statistic is the
cubic clustering criterion of Sarle (1983). In the following two
lists of statistics for each of the samples, there are no local
peaks for the CCC and pseudo F statistics. Therefore, the optimum
number of clusters in taken to be the fusion cluster where the
pseudo t 2 statistic declines and is then followed by a larger pseudo
t 2 for the next fusion cluster.

353
CRITERIA USED TO DETERMINE BEST NUMBER OF CLUSTERS FOR WARD'S MINIMUM VARIANCE CLUSTER ANALYSIS OF THE SHANNON SITE DATA.
Number of Clusters CCC PSEUDO F PSEUDO T**2
19 97.8752 46 .69 9.65 18 89.1114 38 .58 27 . 59 17 76.1002 29.61 31.26 16 63.0295 23 . 43 6.52 15 52.8523 19.48 26.50 14 44.3846 16.66 20.77 13 37.1074 14.52 14.14 12 30.8491 12.87 12.79 11 24.9789 11.44 12.19 10 20.0530 10 .33 10.81
9 15.8824 9.45 9.74 8 12.3375 8.75 8.88 7 9.3373 8 .19 8.17 6 6 .8 283 7.75 7.57 5 4.5881 7.36 7.28 4 2.5665 7.00 7.06 3 0.6438 6.60 6.95 2 0.0869 6.23 6.60 1 0.0000 6.23
NOTE: A "." indicates that a statistic could not computed for that fusion cluster.

354
CRITERIA USED TO DETERMINE BEST NUMBER OF CLUSTERS FOR WARD'S MINIMUM VARIANCE CLUSTER ANALYSIS OF THE
UPPER SARATOWN-LOCALITY 2 DATA.
Number of Clusters CCC PSEUDO F PSEUDO T**2
22 99.3963 44.54 15.09 21 96.0650 41.11 17.66 20 91.3866 37.16 10.59 19 87.2756 34.03 16.37 18 83.1073 31.23 15.02 17 74.7826 26.78 21.29 16 64.4559 22.81 15 55.8969 19.96 12.57 14 47 . 9511 17.59 23.75 13 40.9868 15.72 19 . 47 12 35.1642 14.31 69.17 11 29.8564 13.12 1.24 10 25.2475 12.17 14.93
9 20.7432 11.26 12.80 8 16.5483 10.44 10.34 7 12.8294 9.75 9.70 6 9.3688 9.11 9.09 5 6.3569 8.56 8.79 4 3.6149 8.03 8.46 3 1. 3128 7.57 7.97 2 0.5689 7.19 7.52 1 0 . 00000 7.19
NOTE: A " ." indicates that the statistic was not computed for that fusion stage.

SECTION 2.
STATISTICS USED TO DETERMINE BEST NUMBER OF CLUSTERS FOR WISHART'S CLUSTAN MONOTHETIC DIVISION USING THE RULES PROCEDURE
The following discussion of the us e of the Procedure Rules in
355
Clustan to determine the optimum number of clusters for monothethic
division is based directly on Wishart ' s (1982:14-17) detailed
discussion of the technique. This technique tests for a significant
number of clusters for monothetic divison cluster analysis.
Two statistical stopping rules are provided: the "upper tail" rule, and the "moving average quality control" rule.
The rules procedure can be called after any hierarchical cluster analysis has been completed, including monothethic division. It reads the dendrogram data stored during the most recent cluster analysis in the current CLUSTAN job and prints relevant statistical indicators depending on the stopping rule selected.
Most hierarchical classification methods produce a sequence of criterion values corresponding to the level of the custering criterion at each of N-1 fusions. The sequence referred to here is of the form ~ = [ z 1 , z 2 ••• zN_ 1 J, where zj is the value of the criterion of the jth fusion stage.
RULE 1: Upper Tail Rule This rule selects the partition corresponding
to the first stage j in the cluster sequence j=2 •• N-2 satisfying
where z and s2
are the mean and unbiased standard deviation of the distribution of N-1 values, and k is the standard deviate.
This simple rule defines a "significant" classification as one for which the following

criterion value Z·+l is significant , ie zj+l lies in the upperJtail of the distribution of criterion values~- The rule thus predicts N-j clusters as best for the first zj+l which satisfies the rule. If no z .+l satisfies the rule , one cluster is judged to be the best: ie , it can be concluded that there are no significant classifications in the hierarchical clustering sequence .
In practice it is best to make the rule independent of k by computing the realised deviate kj at each stage , where kj is given by:
The distribution of k , values is sorted into descending order so t1at the 'best' partitions can be more easily identified.
An example of the output produced by RULES for a hierarchical classification of 12 case s is given below. This output indicates that the 2 cluster partition is the most likely candidate for conside ration as a ' natural' break in the hierarchy; in this case the value of the criterion for the final fusion zn-l is found to exceed the mean criterion value by more than two and a half times the standard deviation sz.
STOPPI NG RULE ONE EXAMPLE : Mean Std . Dev .
Realised Deviates
2.53 0 . 62 0 . 62 0.03 0 . 00
-0 . 23 -0.37 -0 . 67 -0 . 73 -0 . 81
3 .698 1.593
Predicte d Clusters
2 3 4 5 6 7 8 9
10 11
At-statistic wi th v=(n-2) degree s of fr eedom can be computed by multiplying the realised deviate kj by the square root of (n-1), the numbe r of crite rion value s . In t h is case t he test statistic would be 3 . 32 x 2.53 = 8.39 which is significant at the 1% l eve l for 10 d egre es of fr eed o m.
356

It should be noted that there are problems with this test. Firstly, the (n-1) criterion values cannot be considered to be normally distributed. They are usually bounded (eg all must exceed zero for Ward' s method) . More important however is the fact that the mean z and standard deviation sz are both computed using all zn-l values , including the value Z ·+l being tested for significant departure from the common mean. If the value being tested were to be excluded from the estimation of mean and standard deviation, however, the test statistic would be even greater under normal circumstances .
RULE 2 : Moving Average Quality Control Rule This rule selects the partition corresponding
to the first stage j in the partial cluster sequence j=r, r+l, •• , N-2 satisfying:
> z . + L. + b, + ks , J J J J
where r is the number of items in the moving average; z . is the moving mean in stage j ; 1. is the cor~ection for trend lag in stage j; 6j is the moving least squares slope in stage j; ands . is the moving unbiased estimate of the populition standard deviation in stage j. If no value for Z ·+i satisfies this rule one cluster is ass11med to be the best .
Rule 2 treats~ as a quality control series with l inear trend where the upper control limit is given by the right-hand side of the above inequality. Note that z . + L , represents the expected value of zj andJzj +JLj + bj is the expected value of Z ·+i ·
For a theoreticalJseries characterised by a ramp with constant slope b ., it can be proved that the expected moving sfandard deviation is constant and the trend lag is given by
Statistically this rule is superior to Rule 1 because candidates for significance do not influence the sample statistics. However , the user must decide the value for 4 , the number of criterion values to be included in the moving average. This is done by specifying a range and step for r as a proportion of the number of criterion values (n-1) . The range is specifi e d by minimum and maximum proportions PMIN and PMAX , and a step of PSTEP .
357

For example, in the case of a hierarchical classification on 12 cases, involving 11 criterion values , if PMIN=0. 3 PMAX=0.8 and PSTEP=0.3 rule 2 will be evaluated for 2, 6 and 10 criterion values contributing to the moving average. A typical output for the second test is as follows:
STOPPING RULE TWO EXAMPLE:
Moving Average Proportion =0.500 (6 items) Mean Forecast Error =0.129 Absolute Mean Forecast Error =0 . 249 Number of Forecasts =4
Realised Predicted Deviates Clusters
3 . 94 2 1.12 4 0 .40 6
-0.14 3 -0.28 5
As with Rule 1, the realised Deviates are ordered by numerical value to enable candidates for significant partitions to be chosen. The above example shows that criterion value for the 2 cluster partition is nearly 4 standard deviates than the mean of the prededing 6 criterion values in the cluster sequence.
358
For this study the results of the Stopping Rule Two tests were
utilized to determine the optimum number of clusters, primarily
because of the problems noted above for the Stopping Rule One test.
The default values for r (PMIN=0. 4 , PMAX=0.8 , and PSTEP=0.2)
provided by CLUSTAN were used to specify the number of criterion
values to be included in the moving average. A two cluster solution
would have been accepted as the optimum division of the sample only
if no other cluster solution was indicated by any of the Stopping
Rule Two test results. When a two cluster solution was produced in
conjunction with n+2 cluster solution(s) , the two cluster solution
was rejected because it would only have divided the sample into
those individuals with artifacts and those individuals without

artifacts. For each monothethic cluster analysis a solution other
than a two cluster solution was indicated at least once by the
Stopping Rule Two test results.
359

CRITERIA USED TO DETERMINE BEST NUMBER OF CLUSTERS FOR WISHART' S MONOTHETHIC DIVISION CLUSTER ANALYSIS USING STOPPING RULE TWO
FOR THE SHANNON SITE DATA
Moving Group Proportion Mean Forecast Error
0 . 400 (8 items) 6 . 075
Absolute Mean Forecast Error Number of Forecasts
6.075 = 10
Realised Predicted Deviates Clusters
7.84 11 4.46 2 3 . 80 4 2.12 3 1.49 10 0.78 9 0.76 6 0.15 12 0.14 7 0.07 8
Moving Group Proportion = 0.600 (12 items) Mean Forecast Error =10.849 Absolute Mean Forecast Error =10.849 Number of Forecasts = 6
Realised Deviates
5.14 3.52 2.46 1.24 o. 71 0.58 0 . 47
Moving Group Proportion Mean Forecast Error
Predicted Clusters
2 4 3 6 7 8 5
= 0.800 (16 items) =29.219
Absolute Mean Forecast Error =29.219 Number of Forecasts = 2
Realised Deviates
5 . 88 3 . 84 3.00
Predicted Clusters
2 4 3
360

361
CRITERIA USED TO DETERMINE BEST NUMBER OF CLUSTERS FOR WISHART' S MONOTHETHIC DIVISION CLUSTER ANALYSIS USING STOPPING RULE TWO
FOR THE UPPER SARATOWN-LOCALITY 2 DATA
Moving Group Proportion Mean Forecast Error
0.400 (6 items) 5.096
Absolute Mean Forecast Error Number of Forecasts
5.096 = 8
Realised Predicted Deviates Clusters
4.24 5 3.45 2 1.95 6 1.01 9 0.72 7 0.46 4 0.35 10 0.33 3 0.21 8
Moving Group Proportion = 0.600 (10 items) Mean Forecast Error =14.762 Absolute Mean Forecast Error =14.762 Number of Forecasts = 4
Realised Predicted Deviates Clusters
4.57 5 4.14 2 2.04 6 1. 27 4 1.08 3
Moving Group Proportion = 0.800 (13 items) Mean Forecast Error =20.188 Absolute Mean Forecast Error =20.188 Number of Forecasts = 1
Realised Deviates
4.67 1.52
Predicted Clusters
2 3

BIBLIOGRAPHY
Adelung, J.C., and J . s. Vater 1816 Mithridates Oder Allge~eine Sprachenkunde. Dritter Theil ,
Dritte Abteilung, Berlin .
Ambrose , s. H. 1987 Chemical and Isotopic Techniques of Diet Reconstruction in
Eastern North America. In Emergent Horticultural Econo~ies of the Eastern Woodlands , edited by w. F. Keegan , pp 87-107 . Center for Archaeological Investigations, Occasional Paper No. 7, Southern Illinois University , Evansville.
Aufderheide, A. C. , F . D. Neuman, L. E . Wittmers, Jr., and G. Rapp 1981 Lead in Bone II: Skeletal Lead Content as an Indicator of
Lifetime Lead Ingestions and the Social Correlates in an Archaeological Population. American Journal of Physical Anthropology, 55:285-291.
Bahou, w. F. 1975 The Relationships of Particular Trace Elements in the
Dickson Mounds Population . Paleopathology Newsletter, 11:15-17 .
Barton , B. s. 1797 New Views of the Origins of the Tribes and Nations of
America . Bieren, Philadelphia.
Bass, w. M. 1971 Human Osteology: ~ Laboratory and Field ~anual of the Hu~an
Skeleton. Missouri Archaeological Society, Columbia.
Benthall , J . 1969 Archaeological Investigation of the Shannon Site , ~ontgo~ery
County, Virginia. Virginia State Library, Richmond.
Berry , R. J . 1963 Epigenetic Polymorphism in Wild Populations of Mus musculus .
Genetic Research, 4:193-220 .
Berry , A. C. , and R. J. Berry 1967 Epigenetic Variation in the Human Cranium. Journal of
Anatomy, 101:361-379 .
Billings , W. K. (editor) 1975 The Old Do~inion in the Seventeenth Century: ~ Documentary
History of Virginia , 1606-1689. University of North Carolina Press , Chapel Hill .

Binford , L . R. 1971 Mortuary Pr actice : Their Study and their Potential. In
Approacehes to the Social Dimensions of Mor tuary Practices, edited by J . A. Brown, pp 1-6. Memoirs of the Society for American Archaeology, No. 25 .
363
1977 General Introduction. In For Theory Building in Archaeol ogy , edited by L. R. Binford, pp 1-10. Academic Press, New York .
1983 Working at Archaeology . Academic Press , New York .
Binford , L . R., and J . B. Bertram 1977 Bone Frequencies and Attritional Processes. In For Theory
Bu i l ding in Arc haeology, edited by L. R. Binford, pp 77-156. Academic Press , New York .
Blakely , R. L ., and L . Beck 1981 Trace El e ments , Nut ritiona l Str ess, and Social
Stratification at Et owah, Georgia. In Research Potential of Anthropolog ical ~us e u~ Collections , edited by A. Cantwell , J . B. Griffin , and N. A. Rothchild, pp 417-431. Annals of the New York Academy of Science , Volume 376 .
Black , T . K. , III 1978 A New Method of Assessing the Sex
Remains : Femur Shaft Circumferenc e. Physical Anthropolog y , 48 : 227-231 .
Boyce, D.
of Fragmentary Skeletal American Journal of
1978 Iroquois Tribes of the Virginia-North Carolina Coastal Plain. In Handbook of North American Indians , Volu~~ 15: Northeast , edited by Bruce Trigger , pp 282-289. Smithsonian Institution Press , Wash i ngton .
Brain , J . P . 1979 Tunica Treasure. Papers of the Peabody Museum of
Ar chaeol ogy a nd Ethno l ogy, No. 71 . Harvard University, Cambr idge .
Brock , R. A. (editor) 1882 The Official Letterbook of Alexander ~~ood, Lieutenant
Governor of the Colony of Virginia , 1710, No~ First Printed fro~ t he Manuscript in the Col l ections of the Virginia Historical Society, Volume I . Virginia Historical Society, Richmond.
Brothwell , D. R. 1981 Di gging~ Bones . Cornell University Press , Ithica.
Brown , A. B. 1974 Bone Strontium as a Dietary Indicator in Human Skeletal
Populations . Contributions to Geology , 13(2):47-48.
Brown , J . A. 197lb The Dimensions of Status in the Burials at Spiro. In
Approacehes to the Social Dimensions of Mortuary Practices, edited by J . A. Brown, pp 1-6. Memoirs of the Society for American Archaeology, No. 25.
Buikstra , J . E. 1976 Hopewell in the Lo~~ Illinois Valley. Northwestern
University Anthropological Program, Scientific Papers , No. 2. Evanston , Indiana.
Buikstra , J . E., and D. c. Cook 1980 Paleopathology : An American Account. Annual Review of
Ant hropology , 9:433-470 .
Bullen , A. K.
364
1972 Paleoepidemiology and Distribution of Prehistoric Trepomeniasis in Florida . Florida Anthropologist , 25:133-174 .
Calinski , T., and J . Harabasz 1974 A Dendrite Method for Cluster Analysis. Communications in
Statistics , 3:1-27 .
Carnes , L. F. 1987 Euroa merican Artifacts from the Fredricks, Wall, and Mitchum
Sites. In The Siouan Project: Seasons! and II , edited by R. s. Dickens , Jr . , H. T. Ward , and R. P. s. Davis , Jr ., pp 141-146. Research Laboratories of Anthropology, University of North Carolina, Monograph Series No. 1. Chapel Hill.
Cassidy , c. M. 1972 Comparison of Nutrition and Health in Pre-Agricultural and
Agricultural Amerindian Skeletal Populations. Ph. D. Dissertation , Department of Anthropology, University of Wisconsin. University Microfilms, Ann Arbor.
Coe , J . L. 1937 Keyauwee--A Preliminary Statement. Bulletin of the
Ar chaeolog ical Society of North Carolina , 4(1):8-16 .
1952a Cultural Sequence of the Carolina Piedmont. In Archaeoloqy of the Easter n United States , edited by J. B. Griffin, pp 301-331. University of Chicago Press , Chicago.
1952b Certain Eastern Siouan Pottery Types. In Prehistoric Pottery of the Eastern United States , edited by James B. Griffin . University of Michigan , Ann Arbor.
1964 For~ative Cultures of the Carolina Pied~ont. Transactions of the American Philosophical Society, 54(4). Philadelphia.
n. d . The Poole Site : Randolph County. Manuscript on fil e the Research Laboratories of Anthropology , University of North Carolina , Chapel Hill . unpaged .

365
Coe , J . L ., and E. Lewis 1952 The Dan River Series Statement. In Prehistoric Pottery of
the Eastern United States , edited by J . B. Griffin. University of Michigan , Ann Arbor .
Coe , J . L., H. T. Ward, M. Graham , L. Navey , s. H. Hogue , and J. Wilson , Jr.
1982 Archaeolog ical and Pa l eoosteol ogical Investigations at the Cold Morning Site, Ne~ Hanover County , North Carolina. Report prepared for Interagency Archaeological Services , Contract# C55082 (79 ). Copies available from Interagency Archaeological Services , Atlanta , Georgia .
Coleman , G. N. 1983 The Reedy Creek Site , 44Ha22 , South Boston, Virginia.
Quarterly Bulletin, Archaeological Society of Virginia , 37(4) : 150-209 .
Conkey , M. L . 1980 The Identification of Prehistoric Hunter-Gatherer
Aggr egation Sites . Current Anthropology , 21 : 609-630.
Cook , D. c. , and J . E. Buikstra 1979 Health and Differential Survival in Prehistoric Populations:
Pre-Natal Dental Defects. (abstract) . American Journal of Physical Anthropology , 50:429-430 .
Davis , R. P . s. , Jr . 1984 Aboriginal Ceramics from the Eno and Haw River Valleys and
their Bearing upon the Identification of John Lawson ' s Occaneechi Town. Paper presented at the 17th Annual Meeting of the Society for Historical Archaeology, Williamsburg , Virginia .
1987 Pottery from the Fredricks, Wall and Mitchum Sites. In The Siouan Project: Seasons! and II . edited by R. s. Dickens , Jr. , H. T. Ward , and R. P. s . Davis , Jr., pp 185-216. Research Laboratories of Anthropology, University of North Carolina, Monograph Series No . 1 . Chapel Hill .
Dickens , R. s., Jr . 1976 Cherokee Prehistory : The Pisgah Phase in the Appalachian
Summit Region. University of Tennessee Press , Knoxville.
Dickens , R. S ., Jr ., H. T . Ward , and R. P. s. Davis, Jr. 1985 The Historic Occaneechi: An Archaeological Investigation of
Culture Change. Final Report of 1984 Investigations. Research Laboratories of Anthropology, University of North Carolina, Chapel Hill.
1986 Cultural Dynamics in the Late Prehistoric and Historic Periods on the Carolina Piedmont: Symposium Introduction. Paper Presented at the 5lst Annual Meeting of the Society for American Archaeology . New Orleans, Louisiana.

366
Dickens , R. s ., Jr., H. T. Ward , and R. P . S. Davis , Jr . (continued) 1987 Introduction. In The Siouan Pr oject : Seasons! and!!·
edited by R. S . Dickens , Jr. , H. T. Ward , and R. P . S. Davis , Jr., pp 1-18. Research Laboratories of Anthropology, Univer sity of North Car olina, Monograph Ser ies No. 1. Chapel Hill.
Dobyns , H. F . 1983 Their Nu~ber s Beco~~ Thinned : Native Amer ican Population
Dynamics in Eastern North ~~erica. University of Tennessee Press , Knoxville.
Droessler , J. 1981 Cr aniometry and Bioloqical Distance : Biocultural Continuity
and Chang e at t he Late Woodland- -M i ss i ss ippian Interface. Center for American Archaeology , Evanston , Indiana.
Duda , R. o., and P . E . Hart 1973 Pattern Classification and Scene Ana l ysis. John Wiley and
Sons , New York.
Evans -Pritchard , E. E. 1965 Theories of Primitive Religion. Oxford University Press ,
Oxford.
Everitt , B. 1974 Cluster Analysis . Heineman Educational Books, Ltd ., London .
Folmesbee , s ., a nd M. K. Lewis 1965 Journals of the Juan Pardo Expedition , 1566-1567. East
Tennessee Historical Society ' s Publications , 37:106-121 .
Frachtenberg, L . J . 1913 Contributions to a Tutela Vocabulary. American
Anthropologist, 15 : 477-479 .
Funkhouser, G. 19 78 Paleodemography of the King Site. Unpublished Master ' s
Thesis , Department of Ant hropol ogy , University of Georgia , Athens.
Gallatin , A. 1836 ~ Synopsis of the Indian Tribes ~ithin the United States
East of the Rocky Mountains , and in the British and Russian Possessions in North ~~erica. Transactions and Collections of the American Antiquarian Society , Volume II . Boston.
Gardner , P. 1980 An Anal ysis of Dan River Cer a mics from Virginia and North
Carolina. Unpublished Master ' s Thesis , Departme nt of Anthropology , University of North Carolina , Chapel Hill.

367
Genoves, S. C. 1967 Proportionality of Long Bones and their Relation to Stature
among Mesa-Americans. American Journal of Physical Anthropology , 26:67-78 .
Gibson, J. L. 1974 Aboriginal Warfare in the Protohistoric Southeast: An
Alternative Perspective . American Antiquity , 39 : 130-133.
Gilbert, R. I. 1977 Applications of Trace Element Research to Problems in
Archaeology. In Prehistoric Adaptations in Prehistoric ~~erica, edited by R. L. Blakely, pp 85-100. University of Georgia Press, Athens.
Goodman , A.H. , G. J . Armelagos, and J . C. Rose 1980 Enamel Hypoplasias as Indicators of Stress in Three
Prehistoric Populations from Illinois. Hu~an Biology, 52:515-528 .
Graham, M. D. 1973 Dental Morphology , Attrition and Pathology in Selected
Skulls from Town Creek Indian Mound, Mount Gilead, North Carolina. Unpublished Master's Thesis , Department of Anthropology , University of North Carolina, Chapel Hill.
Gramly, R. N. 1977 Deerskins and Hunting Territories:
Resource of the Northeastern Woodlands. 42:601-605.
Grayson , D. K.
Competition for a Scarce American Antiquity ,
1981 The Effects of Sample Size on Some Derived Measures in Vertebrate Faunal Analysis. Journal of Archaeological Science, 8(1):77-88 .
Gremi ll ion , K. J . 1987 Plant Remains from the Fredricks, Wall and Mitchum Sites.
In The Siouan Proiect: ~~~.§.~~~ .! ~~3 !!· edited by R. S. Dickens , Jr. , H. T. Ward , and R. P. S. Davis , Jr ., pp 259-278 . Research Laboratories of Anthropology , University of North Carolina, Monograph Series No. 1. Chapel Hill.
Griffin , J. B. 1945 An Interpre tation of Siouan Archaeology in the Piedmont of
North Carolina and Virginia . American Antiquity , 10 : 321-330 .
Gruber , J . W. 1971 Death in a Late Prehistoric Village in Pennsylvania.
American Antiquity , 36:64-76.

368
Guilday, J.E., P. w. Parmalee, and D. P. Tanner 1962 Aboriginal Butchering Techniques at the Eschelman Site
(36Lal2), Lancaster , Pennsylvania. Pennsylvania Archaeologist , 32(2):59-83.
Hale, H. 1883 The Tutelo Tribe and Language. Proceedings of the American
Philosophical Society, 21(114):1-45.
Hallowell, A. I. 1926 Bear Ceremonialisn in the Northern Hemisphere. American
Anthropologist , 28, 1-175.
Hammett, J.E. 1987 Shell Artifacts from the Carolina Piedmnot. In The Siouan
fE~ect: ~~~~2!:!~ .! ~nd .!.!· edited by R. s. Dickens , Jr., H. T. Ward, and R. P. s. Davis, Jr. , pp 167-184. Research Laboratories of Anthropology, University of North Carolina , Monograph Series No. 1. Chapel Hill.
Hatch, J . w. 1975 Social Dimensions of Dallas Burials. Southeastern
Archaeological Conference Bulletin, 18:132-138.
1976 Status in Death: Principles of Ranking in Dallas Culture Mortuary Re~ains. Ph.D. Dissertation, Department of Anthropology, Pennsylvania State Unive~sity. University Microfilms, Ann Arbor.
Hatch, J. W., and R. A. Geidel 1983 Tracing Status and Diet in Prehistoric Tennessee.
Archaeology, 36:56-60.
Hodder, I. 1982 The Identification and Interpretation of Ranking in
Prehistory: A Contextual Perspective. In Ranking, Resource and Exchange, edited by c. Renfrew and S. Shennan, pp 150-154. Cambridge University Press, Cambridge .
Holm, M. A. 1987 Faunal Remains from the Wall and Fredricks Sites. In The
Siouan Project: Seasons.!_ and II. edited by R. S. Dickens, Jr. , H. T. Ward, and R. P. s. Davis, Jr., pp 237-258. Research Laboratories of Anthropology, University of North Carolina, Monograph Serie s No. 1. Chape l Hill.
Horn, H. S . 1978 Optimal Tactics Reproduction and
Behavioral Ecology: An Evolutionary Krebs , and N. B. Davies , pp 411-429. Publications, Oxford .
Life History. In Approach , edited by J. R. Blackwell Scientific

Hrdlicka , A. 1916 Physical Anthropology of the ~enape or Delawares and the
Eastern Indians in General. Bureau of American Ethnology, Bulletin 32 . Washington .
Hudson , c. M. 1976 The Southeastern Indians. University of Tennessee Press,
Knoxville .
Huss - Ashmore , R., A. H. Goodman , and G. J . Armelagos
369
1982 Nutritional Infer ence from Paleopathology. In Advances in Archaeological Method and Theory , 5:395-474.
Jackes , M. K. 1983 Osteological Evidence for Smallpox: A Possible Case from
Seventeenth Century Ontario. American Journal of Physical Anthropology , 60:75-81 .
Jardine , N. , and R. Sibson 1971 Mathematical Taxonomy . John Wileny and Sons , London.
Karklins , K. 1984 Glass Beads from a Late 16th-Early 17th Century Glasshouse
in Amsterdam. Paper presented at the 44th Annual Meeting of the Society for Historical Archaeology , Williamsburg, Virginia.
Keel , B. C. 1972 Summary Field Report of the 1972 Archaeological
Investigations at Site Sk la, Stokes County , North Carolina. Manuscript on file at the Research Laboratories of Anthropology, University of North Carolina, Chapel Hill.
1976 Cherokee Archaeology. University of Tennessee Press, Knoxville .
Kneberg , M. 1959 Engraved Shell Gorgets and Their Associations. Tennessee
Archaeologist , 15(1):1-39.
Krogman , w. M. 1978 The Hu~~ Skeleton in Forensic Medicine. Charles c. Thomas,
Springfield, Illinois.
Lambert , J . B., s . V. Simpson , J. E. Buikstra, and D. Hanson 1983 Electron Microprobe Analysis of Elemental Distribution in
Excavated Human Femurs . American Journal of Physical Anthropology , 62:409-423 .
Lambert , J . B., S . V. Simpson, c . B. Szpunar, 1985 Bone Diagenesis and Dietary Analysis.
Evolution , 14:477-482.
and J.E. Buikstra Journal of Human

370
Lambert , J.B. C. B. Szpunar, and J. E. Buikstra 1979 Chemical Analysis of Excavated Human Bones from Middle and
Late Woodland Sites. Archaeometry , 21:115-129.
Landy, D. 1978 Tuscarora Among the Iroquois . In Handbook of Northeastern
Indians, Volu~~ 15: Northeast, edited by B. G. Trigger, pp 518-524 . Smithsonian Institution Press, Washington.
Larson, L. H., Jr. 1971 Archaeological Implications of Social Stratification at the
Etowah Site, Georgia. In Approaches to the Social Dimensions of Mortuary Practices, edited by J. A. Brown, pp 58-67 . Me moirs of the Society for American Archaeology, Volume 25.
Lawson , J. 1967 ~ Ne~ Voyage to Carolina. Originally published in 1707.
edited by Hugh T. Lefler. University of North Carolina Press, Chapel Hill.
Leacock , E. B. 1971 Introduction. In North American Indians in Historical
PeE~~E!:.iv~, edited by E. B. Leacock and N. o. Lurie, pp 3 - 28 . Random House , New York.
Lewis, E. 1951 The Sara Indians, 1540-1768: An Ethnoarchaeological Study.
Unpublished Master's Thesis, Department of Sociology and Anthropology, University of North Carolina, Chapel Hill.
Lewis, T., and M. Kneberg 1946 Hi~assee Island: An Archaeological
Tennessee Indian Peoples, 1976 Edition. Tennessee Press, Knoxville.
Lieber, O. M.
Account of Four ---University of
1958 Vocabulary of the Catawba Language. Collections of the South Carolina Historical Society, 2:327-342.
Lieberson , S . 1969 Measuring Population Diversity. American Sociological
Review, 34(6): 850-862 .
McDowell, W. L. (editor) 1955 Journal of the Co~missioners of the Indian Trade, 1710- 1715.
South Carolina Archives Department, Columbia.
Mcilwaine , H. R. (editor) 1928 Executive Journals of the Council of Colonial Virginia ,
Volu~~ III , ~~ l!_ 1705-0ctober ~ 1721. Virginia State Library, Richmond.

371
McKern , T . w., and T. D. Stewart 1957 Skeletal Ag e in Young American ~ales. Headquarters
Quartermaster Research and Development , Technical Report EP-45, Na tick, Massachusetts .
Mecklenburg , C. W. 1969 Human Skeletal Remains from the Shannon Site , Montgomery
County , Virqinia. Unpublished Master ' s Thesis, Department of Anthropology , University of Washington , Seattle.
Merrell , J. H. 1984 Comments on "In Search of Occaneechi: Archaeology and
History of the Aboriginal North Carolina Piedmont". Paper presented at the 44th Annual Meeting of the Society for Historical Arcaeology , Williamsburg , Virginia .
1987 This Western World : The Evolution of the Piedmont , 1525-1725. In Th e Siouan Project: Seasons! and II . edited by R. s. Dickens , Jr. , H. T . Ward , and R. P . s. Davis , Jr ., pp 19-28 . Research Laboratories of Anthropology, University of North Carolina, Monograph Series No. 1. Chapel Hill .
Michelson, T . 1914 Field Work among the Catawba, Fox , Sutaio , and Sauk Indians.
Smithsonian Miscellaneous Collections, 63 (8):83-84.
Miller , C. F . 1957 Re-evaluation of the Eastern Siouan Problem with Particular
Emphasis on the Virginia Branches--the Occaneechi ; the Saponi ; and the Tutelo. Bureau of American Ethnology, Bulletin 164 , Washington .
Molnar , S . 1971 Human Tooth Wear , Tooth Function and Cultural Variability.
American Journal of Physical Anth ropology , 17:179- 186 .
Mooney , J . 1894 The Siouan Tribes of
Ethnology , Bulletin 22 .
Morgan , L . H. 1870 Indian Migrations .
Navey , L .
the East. Bureau of American -- ---Washington .
The North American Review , 110:37-82.
1982 An Introduction to t h e Mortuary Practices of the Historic Sara. Unpublished Master ' s Thesis , Department of Anthropology , University of North Carolina, Chapel Hill .
Neumann , G. K. 1952 Archaeology and Race in the American Indian. In Archaeology
of Eastern United States , edited by J . B. Griffin , pp 13-34. University of Chicago Press , Chicago .

372
Neumann, G. K. (continued) n.d. The Skeletal Remains from Keyauwee . In The Poole Site:
Randolph County, edited by J . L. Coe. Manuscript on file at the Research Laboratories of Anthropology, University of North Carolina, Chapel Hill .
Noel Hume , I • 1982 ~ Guide to Artifacts of Colonial ~~erica. Alfred A. Knopf,
New York .
Ortner , D. J ., and W. G. T . Putschar 1981 Identifications of Pathological Conditions in Hu~an Skeletal
Remains. Smithsonian Institution Press , Washington .
O'Shea , J.M. 1984 Mortuary Variability, An Archaeological Investigation.
Academic Press, Orlando, Florida .
Owsley, D. w. , and w. M. Bass 1979 A Demographic Analysis of Skeletons from the Larson Site
(39WW2), Walworth county, South Dakota: Vital Statistics. American Journal of Physical Anthropology, 51:145-154.
Parmalee, P . w. 1959 Use of Mammalian Skulls and Mandibles by Prehistoric Indians
of Illinois. Transactions of the Illinois State Academy of Sciencs, 52:85-95.
Parmalee, P. w., A. A. Paloumpis, and N. Wilson 1972 ~~inals Utilized .e.y Woodland Peoples Occupying~ Creek
Site, Illinois. Transactions of the Illinois State Academy of Sciences, Volume 23.
Peebles, C. 1971 Moundville and Surrounding Sites: Some Structural
Considerations of Mortuary Practice II. In Approaches to the Social Dimensions of Mortuary Practices, edited by J. A. Brown , pp 68-91. Memoirs of the Society for American Archaeology, Volume 25.
1972 Monothetic Divisive Analysis of the Moundville Burials: An Initial Report . Newsletter of Computer Archaeology, 8:1-13 .
Peebles , c., ands. Kus 1977 Some Archaeological Correlates of Ranked Societies.
American Antiquity , 42:421-448 .
Petherick, G. L. 1987 Architecture and Features at the Fredricks, Wall, and
Mitchum Sites. In The Siouan Project: Seasons! and II. edited by R. S . Dickens , Jr., H. T. Ward, and R. P. s. Davis, Jr., pp 29-80. Research Laboratories of Anthropology, University of North Carolina, Monograph Series No. 1. Chapel Hill.

373
Petras , M. L . 1967 Studies of Natu ral Popu lation s of Mus :
Canadian Journal of Genetics and Cytology , Skeletal Variations .
4 : 575- 588 .
Pianka , E. 1978 Evolutionary Ecolog y . Harper and Row , New Yor k .
Pielou , E. c . 1966 Species-Diversity
Ecological Succession. 383 .
Pindborg , J . J .
and Pattern-Diversity in the Stu dy of Journal of Theoretica l Biol ogy, 10 : 370-
1970 Pathology of the Dental Hard Tissues. w. B. Saunders Company , Phil a d elphia .
Phelps , D. S . 1983 Archaeology of the North Carolina Coast and Coastal Plain:
Problems and Hypotheses. In The Pr ehistory of North Carolina : An Archaeological _§y~ posiu~ , edited by M. A. Mathis and J . J . Crow , pp 1-51. North Car olina Division of Archives and History, Department of Cultural Resources , Raleigh .
Pollitzer , w. S . 1971 Physical Anthropo l og y of the Old South. In Red, ~hite , and
Black: Sym po s ium on Indians in the Old South , edited by C. M. Hudson, pp 31-43 . University of Georgia Press , Athens .
Price , D. T ., and M. Kavanagh 1982 Bone Composition and the Reconstruction of Diet : Examples
from the Midwestern United States. Micontinental Journal of Archaeology , 7 : 61-79 .
Renfrew, C. 1973 Monuments , Mobilization and Social Organization in Neolithic
Wessex. In The Expl a na t ion of Cu l t ure Chang e : ~odels in Prehistory, edited by c. Renfrew , pp 529-538 . Gerald Duckworth and Co ., Ltd ., London .
Robbins , L. M. 1977 The Story of Life Revealed by the Dead. In Biological
Adaptation i n Prehistoric America , edited by R. L. Blakely, pp 10-20 . University of Georgia Press , Athens .
Rothchild , N. A. 1979 Mortuary Behavior and Social Organization at Indian Knoll
and Dickson Mounds . American Antiquity , 44 : 658-675 .
Runquist , J . 1979 Analysis of the Flora and Faunal Remains from Protohistoric
~ ~ - -~~ ~- ---~~ ~~ North Carolina Cherokee Sites. Unpublished Ph. D. Dissertation, Department of Zoology , North Carolina State University , Raleigh.

Sahlins , M. D. 1968 Tribesmen. Prentice-Hall , Inc., Englewood Cliffs, New
Jersey .
Sahlins, M. D. , and E. R. Service 1973 Evolution and Culture. University of Michigan Press , Ann
Arbor .
Sainesbury , w. N. (editor)
374
1889 Calendar of State Papers , Colonial Series, America and the West Indies , 1660-1674. Printed for Her Magesty ' s Stationary Office by Eyre and Spottiswoods , London .
1893 Calendar of State Papers , Colonial Series, America and the West Indies, 1675-1676, also Addenda 1574-1674, Preserved in the Public Record Office. Printed for Her Magesty' s Stationary Office by Eyre and Spottiswoods, London.
Sapir, E. 1913 A Tutelo Vocabulary. American Anthropologist, 15 : 295-297 .
Sarle, W. s . 1983 The Cubic Clustering Criterion. SAS Technical Report A-108 ,
SAS Institute, Inc. , Cary, North Carolina.
SAS Institute 1985 SAS User ' s Guide : Statistics, Version 5 Edition. SAS
Institute, Inc. , Cary, North Carolina .
Saxe, A. A. 1971 Social Dimensions of Mortuary Practics in Mesolithic
Popu lation from Wade Halfa, Sudan. In Approaches to the Social Dimens ions of Mortuary Practices, edited by J . A. Brown, pp 36-56 . memoirs of the Society for American Archaeology, Volu~e 25 .
Schiffer , M. B. 1976 Behavioral Archaeology. Academic Press , New York .
Schmorl, G. 1971 The Hu~an Spine in Health and Disease , 2nd American Edition.
Greene and Straton , New York .
Schoeninger , M. J. 1979 Diet and Status at Chalcatzingo: Some Emperica l and
Technical Aspects of Strontium Analysis. American Journal of Physical Anthropology , 51:295-310 .
Schoeninger , M. J., and c . s . Peebles 1981 Effec~ of Mollusc Eating on Human Bone Strontium Levels.
Journal of Archaeological Science, 8:391-397 .
Service , E. R. 1962 Primitive Social Organization . Random House, New York .

375
Sever , L . E. 1974 Zinc and Human D·2velopmen: A Review. Hu!!!~ Ecology, 3:43-
57 .
Shannon, C. E., and W. Weaver 1949 The Mathematical Theory of Communication. University of
Illinois Press , Urbana .
Sheldon , A. L. 196'-l EquiL-1.bility Indices: Dependence on the Specie.3 Count.
Ecology, 50:466-467 .
Siebert, F . T ., Jr . 1945 Linguistic Classificatio~ of Catawba. International Journal
of American Linguistics , ll: l •)0-104, 211-218.
Sillen, A. 1981 Strontium and Diet at Hayonim Cave. American Journal of
Physical Anthropology, 56:131-137 .
1986 9iogenic and Diagenetic Sr/Ca in Plio-Pleistocene Fossils of the Omo Shungura Formation. Paleobiology , 12:311-323.
Sillen, A. , and~ . Kavanaugh 1982 Strontium and Paleodietary Resear ch : A Review. Yearbook of
Physical Anthropology , 25:67-90 .
Simpkins, D. L . 1985 First Phase Investigations of Late Aboriginal Settlement in
the Eno, Haw , and Dan River Drainages , North Carolina. Report prepared for the North Carolina Division of Archi ves and History under a Survey and Planni~g Grant from the United States Depa ,-tment of the Interior. Copies are available from the Research Laboratories of Anthropology, University of North Carolina, Chapel Hill and the Office of State Archaeology, N~rth Carolina Division of Archives and History, Raleigh.
Sizemore , B. A. 1984 "Gorges" and "Wampum": Shell Artifac ts from the Wall and
Fredricks Sites. Paper presented at the 44th Annual Meeting of the Society for Historical Archaeology , Williamsburg , Virginia.
Skinner , A. 1919 Explorations of Aboriginal Sites at Throgs Neck and Clason
Point , Ne~ York City. Contributions of th2 Museu :n of the American Indian , Volum,,• 5 , Part 4 . New York.
Smith , E . A., and B. Winterhalde r 1981 New Perspectives on Hunter-Gatherer Socioecology. In
Hunter-Gatherer Foraging Strategies, edited by B. Winterhalder and E. A. Smith, pp 1-12. University of Chicago Press , Chicago.

376
Smith , M., and J . B. Smith 1987 Weeping Eye Masl-: Gorgets in North America. Paper presented
at the 44th An,ual Meeting of t he Southestern Archaeological , conference , Charleston , South Carolina.
Sneath , P ., and R. Sokal 19 73 Numerical Taxonomy . w. H. Freeman, San Francisco.
Sorohan , B. P . 1985 An Analy s is of the Dental Patholog y of Human Skeletal
Remains fro~ the ~all and Fredricks Sites , Hillsborough, North Carolina . Unp~blished Honor ' s Thesis, Department of Anthropology , University of North Carolina, Chapel Hill.
Sp,2ck , F . G. 1935 Siouan Tribes of the Carolinas as Known from Catawba,
Tutelo, and Docu~entary Sources. American Anthropologist , 37 : 201 - 225 .
Steinboc k , R. T. 1976 Paleopathol ogical Diagnosis and Interpretation. Charles G.
Thomas , Springfield , I l linois •
.Stewar d , J. 1955 Theory of Culture Change. University of Illinois Press ,
Urbana .
Swanton , J . 1932a The Sou t heastern Indians of History. Conference on Southern
Pre- History, National Resear~h Council , Mimeographed. pp 5-20. Washington .
1932b The Re l atio~ of the Southeast to General Culture ProblE~ms of American Pre-History. Conference on Southern Pre-History, National Research Council, Mimeographed . pp 60-74. Washington.
1936 Early Hist ory of t he Eastern Siouan Tribes. In Essays in Anthr o pology Pr esented to A. L. Kroeber , edited by R.H. Lowrie , pp 371-381 . University of California Press , Berkeley .
1946 The Indian s of the Southeastern United States , 1979 Edition. Bureau of American Ethology , Bul l etin 137. Washington.
1952 The Indian Tribes of North ~~ erica. Bureau of American Ethnology, Bulletin 145. Washington.
Szpunar , C. B., J . B. Lambert , and J . E. Buikstra 1979 Analysis of Excavated Bone by Atomic Absorption. American
J ournal of Physical Anthropology, 48: 199-202 .
Tainter , J . 1973 The Social Corre lates of Mortuary Patterning at Ka l oko,
North Koua , Hawaii. Archaeology and Physical Anthropology of Jc~~gi~, 8 :1-11.

Tainter, J. (conti,ued) 1975a Social Inference and Mortuary Practices:
Numerical Classification. World Archaeology , An Experiment in 7:1-15.
377
1975b The Archaeological Study of Social Change : Woodland Syste~~ in West-Central Illinois. Ph. D. Dissertati~n, Department of Anthropoloqy, N<:)rthwestern University. University Microfilms , Ann Arbor.
1977 Modeling Change in Prehistoric Social Systems. In For Theory Building in Archaeology, edited by L. R. Binford, pp 327-351. Academic Press, New York.
1973 Mortuary Practices and the Study of Prehistoric Social Systems. Advances in Archaeological ~ethod and Theory, 1:105-141.
Talbot , w. 1912 The Discoverie3 of John Ledere r . In The First Explorations
of the Trans-Allegheny Region QY the Virginians, 1650-1674, edited by c. V. Alvord and L. Bidgood , pp 131-1 71. The Arthur H. Clark Company, Clevela~d .
Turner , C. G. , II 1979 Dental Anthropological Implications of Agriculture among the
Jomon People of Central Japan. American Journal of Physical Anthropology , 51:619-635 .
Ubelaker , D. L. 1974 Reconstruction of Demographic Profiles fro~ Ossuary Skeletal
Samples: ~ Case Study fro~ the Tidewater Poto~ac. Smithsonian Institution Press , Washington.
1978 Human Skeletal Remains . Aldine Publishing, Chicago.
Waldro:1 , H. A. 1981 Postmortem Absorption of Lead by the Skeleton. American
Journal of Physical Anthropology, 55:395-398.
Ward , H. T. 1983 A Review of Archaeology in the North Carolina Piedmont: A
Study of Change. In The Prehistory of North Carolina: ~n Archaeological§..¥~~~' edited by M.A. Mathis and J. J. Crow, pp 53-81. North Carolina Division of Archives and Hisi.ory, Department of Cultural Resources, Raleigh.
1987 Mortuary Patterns at the Fredricks , Wall and Mitchum Sites. In The Siouan Project : Seasons I and II. edited by R. S. Dickens , Jr ., H. T. Ward , and R. P. s . Davis, Jr., pp 81-110. Research Laboratories of Anthropology, University of North Carolina , ~onograph Series No. 1. Chapel Hill.

378
Waselkov , G. A. 1977 Prehistoric Dan River Hunting Strateg ies.
Master ' s Thesis , Depart~ent of Anthropology, Carolina , Chapel Hill.
Unpublished University of North
Williams , s . C. (editor) 1930 Adair 's History of the Amer ican Indians. Reprint of the
1775 London Edition. The Watauga Press , Johnson City, Tennessee .
Wilson , H. H. 1982 An Analysis of Skeletal Material fro~ ~~£67 , Bruns~ick
County, North Carolina. Unpublished Master ' s Thesis , Department of Anthropology, University of North Carolina , Chapel Hill.
1983a An Alternative Approach to the Study of "Siou:1n" Mortuary Data and Change. Manuscript on file at th,e Research Labor atories of Anthropology, University of North Carolina, Chapel Hil l.
1983b The Use of Paleo-Nutrition in the Analysis of North Carolina Pedmont Aboriginal Populations. Manuscript on file at the Research Laboratories of Anthropology, University of North Carolina, Chapel Hill.
1984 European Trade Goods from the Fredricks Site (310R231). Paper presented at the 17th Annual Meeting of the Society for Histori,:::al Archaeology , Williamsburg , Virginia.
1985 Human Skeletal Remains from the Wall and Fredricks Sites. In The Historic Occaneechi: An Archaeological Investigation of Culture Chang e . Final Report of 1984 Investigations , edited by R. S. Dickens , Jr ., H. T . Ward , and R. P. S. Davis , Jr. , pp 260-339. Resear ch Laboratories of Anthropology, Univeristy of North Carolina , Chapel Hill.
1987 Human Skeletal Remains from the Wall and Fredricks Sites. In The Siouan Pr~ect : Seasons I and II. edited by R. S. Dickens , Jr., H. T. Ward , and R. P. s . Davis , Jr ., pp 111-140. Research Laboratories of Anthropology, University of North Carolina , Monograph Series No. 1. Chapel Hill.
Wils:m, J . H. 1977 Feature Fill , Plant Utilization, and Disposal ~~ong the
Historic Sara Indians. Unpublished Master ' s Thesis , De partment of Anthropology, University of North Carolina, Chapel Hill .
1981 The Beginning of the End : Continuing Research into the Protohistoric-Historic Period of t he Carolina Piedmont--A Labor of Love. Paper Presented at the 38th Annual Meeting of the Southeastern Archaeological Conference , New Orleans.

Wilson , J. H. (continued) 1982 The Sara South of the Border : Cheraw or Bust. Paper
presented at the 8th Annual Conference on South Carolina Archaeolo~y, Columbia.
379
1983 ~ Study of the Late Prehistoric, Protohistoric, and Historic Indians of the Carolina and Virginia Pied~ont: Structure, Process , and Ecoloqy. Ph. D. Dissertation, Department of Anthropology, University of North Carolina , Chapel Hill. University Microfil ms, Ann Arbor.
1987 Archaeology and Ethnohistory of the North Carolina Piedmont. Paper presented at the 44th Annual Meeting of the Southeastern Archaeological Conference . Charleston , South Carolina.
Wilson , J . H. , J r., and R. S . Dickens , Jr . 1984 Cultural Interaction and Ceramic Diversity in the North
Carolina Piedmont. Paper presented at the 49th Annual Meeting of the Society for American Archaeology , Portland , Oregon .
Wishart , D. 1978 Clustan: User ~anual , 3rd Edition. Program Library Unit ,
Edinburgh University.
1982 Clustan: User ~anual Suppl e ment, 3rd Edition. Program Library Unit, Edinburgh University .
Win t erhalder , B. , and E. A. Smith (editors ) 1981 Hunter-Gatherer Foraging Strategies. University of Chicago
Press , Chicago.
Woods , Abraham 1912 The Trip and Trials of James Needha m and Gabriel Arthur. In
The First Explorations of the Trans-Allegheny Region £Y the Virg inians , edited by c. w. Alvord and L. Bidgood, pp 210-266. ArthuL H. Clark, Cleveland.
Copyright © 2022 FDOKUMEN