
A behavioral study of healthy and cancer genes by modeling electrical network
12
A behavioral study of healthy and cancer genes by modeling electrical network Tanusree Roy ⁎, Soma Barman Institute of Radio Physics and Electronics, University of Calcutta, 92, APC Road, Kolkata 700009, India abstract article info Article history: Received 13 April 2014 Received in revised form 18 June 2014 Accepted 6 August 2014 Available online 10 August 2014 Keywords: Genomics Genetic instability Cancer Network simulation System model LabVIEW In recent years, gene network modeling is gaining popularity in genomics to monitor the activity profile of genes. More specifically, the objective of the network modeling concept is to study the genetic behavior associated with disease. Previous researchers have designed network model at nucleotide level which produces more complexity for designing circuits mostly in case of gene expression studies. Whereas the authors have designed the present network model, based on amino acid level which is simpler as well as more appropriate for prediction of the ge- netic abnormality. In the present concept, SISO continuous and discrete system models of genes are realized using Foster network. The model is designed based on hydropathy index value of amino acids to study the bio- logical system behavior. The time and phase response in continuous (s) domain and pole-zero distribution in dis- crete (z) domain are used as measurement metric in the present study. The simulated responses of the system show genetic instability for cancer genes which truly reflects the medical reports. The proposed modeling con- cept can be used, to accurately identify or separate out the diseased genes from healthy genes. © 2014 Elsevier B.V. All rights reserved. 1. Introduction Genomics entails the study related to large sets of genes with the goal of understanding the collective gene function rather than the indi- vidual gene. The genes are responsible for the creation of amino acids (Anastassiou, 2001; Vaidyanathan, 2004). The twenty amino acids of genes are combined in various ways to create different types of proteins, present in all living organisms; deficiency of which can cause problems ranging from indigestion to depression, stunted growth and physical disorders. Some of the amino acids play significant role in growth of can- cer genes. Inhibition of these amino acids may be beneficial for curing cancer patients (https://www.apjohncancerinstitute.org/caat-protocol). Cancer is a genetic disease (Vogelstein and Kinzler, 2004) and it re- sults from the accumulation of mutations in the genes (Lengauer et al., 1998). Cancer genes produce inordinate amount of lactic acid (Warburg, 1956) and arginine can modulate the growth of breast cancer (Singh et al., 2000). Several researchers have used the statistics of amino acids to study the gene behavior and predict the cancer and healthy genes (Barman et al., 2011a,b; Das and Mitra, 2011; Roy et al., 2013). But still determination of cancer genes accurately is tedious, inefficient and also a significant challenge for oncologists and computational biologists. Since network modeling is gaining importance in genomic research to learn about the structure and function of DNA, different studies have mostly focused on developing and manipulating algorithms based on molecular computing, molecular algebra, simulation and modeling (Alfinito et al., 2008; Hodzic and Newcomb, 2007; Marshall, 2009, 2010a,b; Sampath, 2006). The genetic networks are very much complex as large amount of uncertainty associated with this model, most of the models proposed are probabilistic. For example, the DNA/RNA strings are modeled using passive electrical components at nucleotide level (Marshall, 2010a) and the ultimate circuitry is incredibly complex when the modeling concept is applied on Homo sapiens genes i.e. com- posed of long nucleotide sequence. The amino acid property based methods have proven more sensitive and responsive than nucleotide based methods (McClellan, 2012); therefore the present network model is much more appropriate as modeling is done on amino acid level. Considering circuit complexity and computational load, the con- cept is novel in the present era of technology. In our study, ‘genetic instability (Lengauer et al., 1998) and majority of hydrophilic amino acid composition (Stranzl et al., 2012) in cancer associated genes’ are the key features to distinguish cancer genes from healthy genes. The main objectives of this paper include: • Designing electrical circuit model for individual amino acid based on their hydropathy index value (Kyte and Doolittle, 1982) of the side chain from the elementary level using passive electrical components R, L and C. Gene 550 (2014) 81–92 Abbreviations: DNA, deoxyribonucleic acid; RNA, ribonucleic acid; NCBI, National Center For Biotechnology Information; CGAP, Cancer Genome Anatomy Project; R, resis- tor; C, capacitor; L, inductor; SISO, single input single output; ATF3, activating transcription factor 3; R L , load resistance; LabVIEW, Laboratory Virtual Instrument Engineering Workbench; CD, continuous domain; ROC, region of convergence. ⁎ Corresponding author. E-mail address: [email protected] (T. Roy). http://dx.doi.org/10.1016/j.gene.2014.08.020 0378-1119/© 2014 Elsevier B.V. All rights reserved. Contents lists available at ScienceDirect Gene journal homepage: www.elsevier.com/locate/gene
Transcript of A behavioral study of healthy and cancer genes by modeling electrical network
Gene 550 (2014) 81–92
Contents lists available at ScienceDirect
Gene
j ourna l homepage: www.e lsev ie r .com/ locate /gene
A behavioral study of healthy and cancer genes by modelingelectrical network
Tanusree Roy ⁎, Soma BarmanInstitute of Radio Physics and Electronics, University of Calcutta, 92, APC Road, Kolkata 700009, India
Abbreviations: DNA, deoxyribonucleic acid; RNA, riCenter For Biotechnology Information; CGAP, Cancer Gentor; C, capacitor; L, inductor; SISO, single input single outpufactor 3; RL, load resistance; LabVIEW, Laboratory ViWorkbench; CD, continuous domain; ROC, region of conv⁎ Corresponding author.
E-mail address: [email protected] (T. Roy).
http://dx.doi.org/10.1016/j.gene.2014.08.0200378-1119/© 2014 Elsevier B.V. All rights reserved.
a b s t r a c t
a r t i c l e i n f oArticle history:Received 13 April 2014Received in revised form 18 June 2014Accepted 6 August 2014Available online 10 August 2014
Keywords:GenomicsGenetic instabilityCancerNetwork simulationSystemmodelLabVIEW
In recent years, gene networkmodeling is gaining popularity in genomics tomonitor the activity profile of genes.More specifically, the objective of the networkmodeling concept is to study the genetic behavior associatedwithdisease. Previous researchers have designed networkmodel at nucleotide level which producesmore complexityfor designing circuits mostly in case of gene expression studies. Whereas the authors have designed the presentnetworkmodel, based on amino acid level which is simpler as well as more appropriate for prediction of the ge-netic abnormality. In the present concept, SISO continuous and discrete system models of genes are realizedusing Foster network. The model is designed based on hydropathy index value of amino acids to study the bio-logical systembehavior. The time and phase response in continuous (s) domain and pole-zero distribution in dis-crete (z) domain are used as measurement metric in the present study. The simulated responses of the systemshow genetic instability for cancer genes which truly reflects the medical reports. The proposed modeling con-cept can be used, to accurately identify or separate out the diseased genes from healthy genes.
© 2014 Elsevier B.V. All rights reserved.
1. Introduction
Genomics entails the study related to large sets of genes with thegoal of understanding the collective gene function rather than the indi-vidual gene. The genes are responsible for the creation of amino acids(Anastassiou, 2001; Vaidyanathan, 2004). The twenty amino acids ofgenes are combined in variousways to create different types of proteins,present in all living organisms; deficiency of which can cause problemsranging from indigestion to depression, stunted growth and physicaldisorders. Some of the amino acids play significant role in growth of can-cer genes. Inhibition of these amino acids may be beneficial for curingcancer patients (https://www.apjohncancerinstitute.org/caat-protocol).
Cancer is a genetic disease (Vogelstein and Kinzler, 2004) and it re-sults from the accumulation of mutations in the genes (Lengauer et al.,1998). Cancer genes produce inordinate amount of lactic acid(Warburg, 1956) and arginine canmodulate the growth of breast cancer(Singh et al., 2000). Several researchers have used the statistics of aminoacids to study the gene behavior and predict the cancer and healthygenes (Barman et al., 2011a,b; Das and Mitra, 2011; Roy et al., 2013).But still determination of cancer genes accurately is tedious, inefficient
bonucleic acid; NCBI, Nationalome Anatomy Project; R, resis-t; ATF3, activating transcriptionrtual Instrument Engineeringergence.
and also a significant challenge for oncologists and computationalbiologists.
Since network modeling is gaining importance in genomic researchto learn about the structure and function of DNA, different studies havemostly focused on developing and manipulating algorithms based onmolecular computing, molecular algebra, simulation and modeling(Alfinito et al., 2008; Hodzic and Newcomb, 2007; Marshall, 2009,2010a,b; Sampath, 2006). The genetic networks are verymuch complexas large amount of uncertainty associated with this model, most of themodels proposed are probabilistic. For example, the DNA/RNA stringsare modeled using passive electrical components at nucleotide level(Marshall, 2010a) and the ultimate circuitry is incredibly complexwhen the modeling concept is applied on Homo sapiens genes i.e. com-posed of long nucleotide sequence. The amino acid property basedmethods have proven more sensitive and responsive than nucleotidebased methods (McClellan, 2012); therefore the present networkmodel is much more appropriate as modeling is done on amino acidlevel. Considering circuit complexity and computational load, the con-cept is novel in the present era of technology.
In our study, ‘genetic instability (Lengauer et al., 1998) andmajorityof hydrophilic amino acid composition (Stranzl et al., 2012) in cancerassociated genes’ are the key features to distinguish cancer genes fromhealthy genes. The main objectives of this paper include:
• Designing electrical circuit model for individual amino acid based ontheir hydropathy index value (Kyte and Doolittle, 1982) of the sidechain from the elementary level using passive electrical componentsR, L and C.
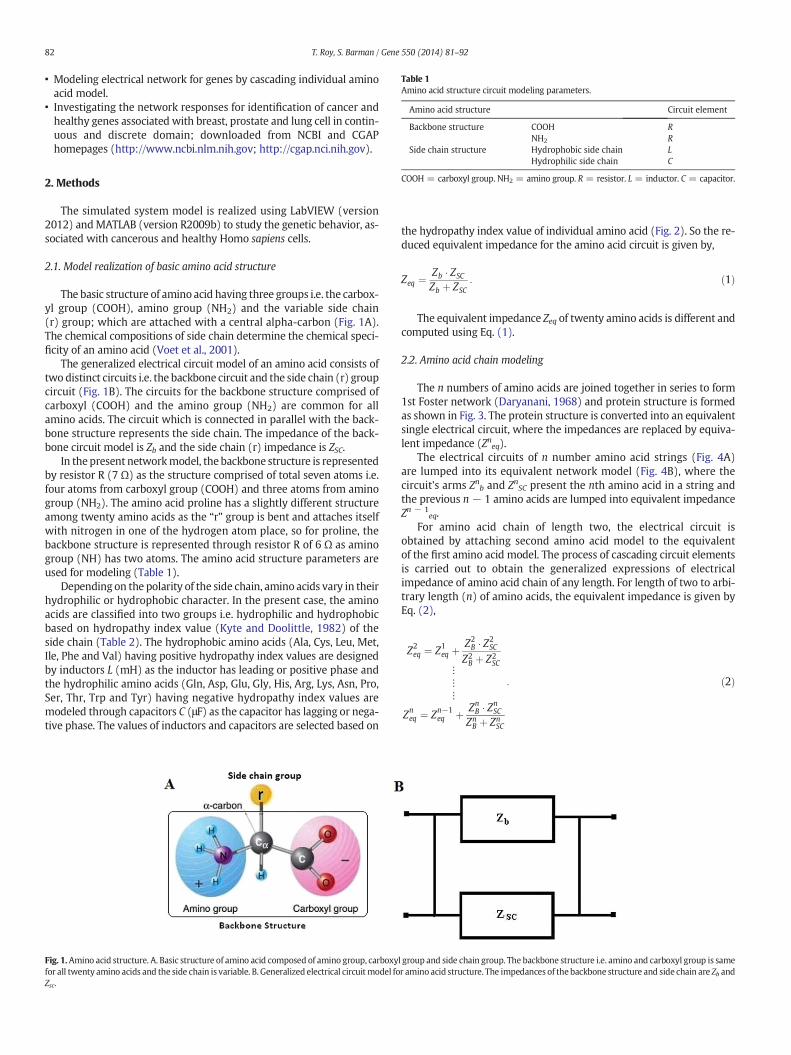
Table 1Amino acid structure circuit modeling parameters.
Amino acid structure Circuit element
Backbone structure COOH RNH2 R
Side chain structure Hydrophobic side chain LHydrophilic side chain C
COOH = carboxyl group. NH2 = amino group. R = resistor. L = inductor. C = capacitor.
82 T. Roy, S. Barman / Gene 550 (2014) 81–92
• Modeling electrical network for genes by cascading individual aminoacid model.
• Investigating the network responses for identification of cancer andhealthy genes associated with breast, prostate and lung cell in contin-uous and discrete domain; downloaded from NCBI and CGAPhomepages (http://www.ncbi.nlm.nih.gov; http://cgap.nci.nih.gov).
2. Methods
The simulated system model is realized using LabVIEW (version2012) andMATLAB (version R2009b) to study the genetic behavior, as-sociated with cancerous and healthy Homo sapiens cells.
2.1. Model realization of basic amino acid structure
The basic structure of amino acid having three groups i.e. the carbox-yl group (COOH), amino group (NH2) and the variable side chain(r) group; which are attached with a central alpha-carbon (Fig. 1A).The chemical compositions of side chain determine the chemical speci-ficity of an amino acid (Voet et al., 2001).
The generalized electrical circuit model of an amino acid consists oftwo distinct circuits i.e. the backbone circuit and the side chain (r) groupcircuit (Fig. 1B). The circuits for the backbone structure comprised ofcarboxyl (COOH) and the amino group (NH2) are common for allamino acids. The circuit which is connected in parallel with the back-bone structure represents the side chain. The impedance of the back-bone circuit model is Zb and the side chain (r) impedance is ZSC.
In thepresent networkmodel, the backbone structure is representedby resistor R (7 Ω) as the structure comprised of total seven atoms i.e.four atoms from carboxyl group (COOH) and three atoms from aminogroup (NH2). The amino acid proline has a slightly different structureamong twenty amino acids as the “r” group is bent and attaches itselfwith nitrogen in one of the hydrogen atom place, so for proline, thebackbone structure is represented through resistor R of 6 Ω as aminogroup (NH) has two atoms. The amino acid structure parameters areused for modeling (Table 1).
Depending on the polarity of the side chain, amino acids vary in theirhydrophilic or hydrophobic character. In the present case, the aminoacids are classified into two groups i.e. hydrophilic and hydrophobicbased on hydropathy index value (Kyte and Doolittle, 1982) of theside chain (Table 2). The hydrophobic amino acids (Ala, Cys, Leu, Met,Ile, Phe and Val) having positive hydropathy index values are designedby inductors L (mH) as the inductor has leading or positive phase andthe hydrophilic amino acids (Gln, Asp, Glu, Gly, His, Arg, Lys, Asn, Pro,Ser, Thr, Trp and Tyr) having negative hydropathy index values aremodeled through capacitors C (μF) as the capacitor has lagging or nega-tive phase. The values of inductors and capacitors are selected based on
Fig. 1.Amino acid structure. A. Basic structure of amino acid composed of amino group, carboxyfor all twenty amino acids and the side chain is variable. B. Generalized electrical circuitmodel foZsc.
the hydropathy index value of individual amino acid (Fig. 2). So the re-duced equivalent impedance for the amino acid circuit is given by,
Zeq ¼Zb � ZSC
Zb þ ZSC: ð1Þ
The equivalent impedance Zeq of twenty amino acids is different andcomputed using Eq. (1).
2.2. Amino acid chain modeling
The n numbers of amino acids are joined together in series to form1st Foster network (Daryanani, 1968) and protein structure is formedas shown in Fig. 3. The protein structure is converted into an equivalentsingle electrical circuit, where the impedances are replaced by equiva-lent impedance (Zneq).
The electrical circuits of n number amino acid strings (Fig. 4A)are lumped into its equivalent network model (Fig. 4B), where thecircuit's arms Znb and ZnSC present the nth amino acid in a string andthe previous n − 1 amino acids are lumped into equivalent impedanceZn − 1
eq.For amino acid chain of length two, the electrical circuit is
obtained by attaching second amino acid model to the equivalentof the first amino acid model. The process of cascading circuit elementsis carried out to obtain the generalized expressions of electricalimpedance of amino acid chain of any length. For length of two to arbi-trary length (n) of amino acids, the equivalent impedance is given byEq. (2),
Z2eq ¼ Z1
eq þZ2B � Z2
SC
Z2B þ Z2
SC⋮⋮⋮
Zneq ¼ Zn−1
eq þ ZnB � Zn
SC
ZnB þ Zn
SC
: ð2Þ
l group and side chain group. The backbone structure i.e. amino and carboxyl group is samer amino acid structure. The impedances of the backbone structure and side chain are Zb and
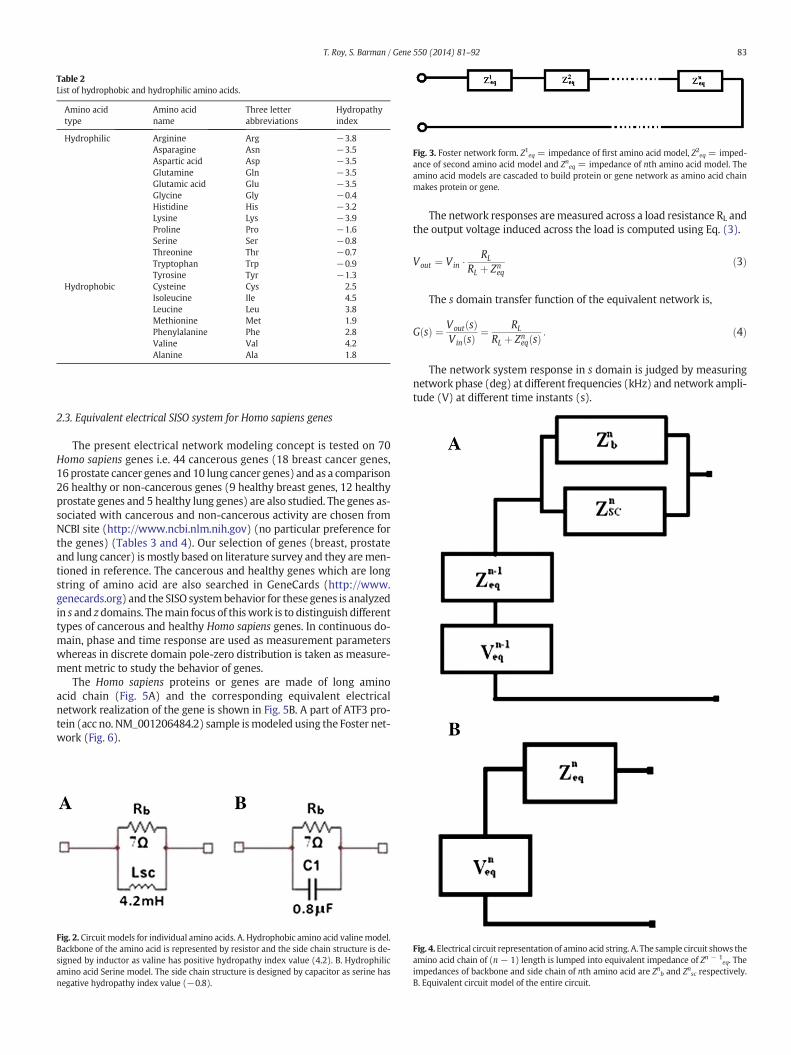
Table 2List of hydrophobic and hydrophilic amino acids.
Amino acidtype
Amino acidname
Three letterabbreviations
Hydropathyindex
Hydrophilic Arginine Arg −3.8Asparagine Asn −3.5Aspartic acid Asp −3.5Glutamine Gln −3.5Glutamic acid Glu −3.5Glycine Gly −0.4Histidine His −3.2Lysine Lys −3.9Proline Pro −1.6Serine Ser −0.8Threonine Thr −0.7Tryptophan Trp −0.9Tyrosine Tyr −1.3
Hydrophobic Cysteine Cys 2.5Isoleucine Ile 4.5Leucine Leu 3.8Methionine Met 1.9Phenylalanine Phe 2.8Valine Val 4.2Alanine Ala 1.8
Fig. 3. Foster network form. Z1eq = impedance of first amino acid model, Z2eq = imped-ance of second amino acid model and Zneq = impedance of nth amino acid model. Theamino acid models are cascaded to build protein or gene network as amino acid chainmakes protein or gene.
83T. Roy, S. Barman / Gene 550 (2014) 81–92
2.3. Equivalent electrical SISO system for Homo sapiens genes
The present electrical network modeling concept is tested on 70Homo sapiens genes i.e. 44 cancerous genes (18 breast cancer genes,16 prostate cancer genes and 10 lung cancer genes) and as a comparison26 healthy or non-cancerous genes (9 healthy breast genes, 12 healthyprostate genes and 5 healthy lung genes) are also studied. The genes as-sociated with cancerous and non-cancerous activity are chosen fromNCBI site (http://www.ncbi.nlm.nih.gov) (no particular preference forthe genes) (Tables 3 and 4). Our selection of genes (breast, prostateand lung cancer) is mostly based on literature survey and they aremen-tioned in reference. The cancerous and healthy genes which are longstring of amino acid are also searched in GeneCards (http://www.genecards.org) and the SISO systembehavior for these genes is analyzedin s and z domains. Themain focus of thiswork is to distinguish differenttypes of cancerous and healthy Homo sapiens genes. In continuous do-main, phase and time response are used as measurement parameterswhereas in discrete domain pole-zero distribution is taken as measure-ment metric to study the behavior of genes.
The Homo sapiens proteins or genes are made of long aminoacid chain (Fig. 5A) and the corresponding equivalent electricalnetwork realization of the gene is shown in Fig. 5B. A part of ATF3 pro-tein (acc no. NM_001206484.2) sample ismodeled using the Foster net-work (Fig. 6).
Fig. 2. Circuit models for individual amino acids. A. Hydrophobic amino acid valinemodel.Backbone of the amino acid is represented by resistor and the side chain structure is de-signed by inductor as valine has positive hydropathy index value (4.2). B. Hydrophilicamino acid Serine model. The side chain structure is designed by capacitor as serine hasnegative hydropathy index value (−0.8).
The network responses aremeasured across a load resistance RL andthe output voltage induced across the load is computed using Eq. (3).
Vout ¼ Vin �RL
RL þ Zneq
ð3Þ
The s domain transfer function of the equivalent network is,
G sð Þ ¼ Vout sð ÞVin sð Þ ¼ RL
RL þ Zneq sð Þ : ð4Þ
The network system response in s domain is judged by measuringnetwork phase (deg) at different frequencies (kHz) and network ampli-tude (V) at different time instants (s).
Fig. 4.Electrical circuit representation of amino acid string. A. The sample circuit shows theamino acid chain of (n − 1) length is lumped into equivalent impedance of Zn − 1
eq. Theimpedances of backbone and side chain of nth amino acid are Znb and Znsc respectively.B. Equivalent circuit model of the entire circuit.
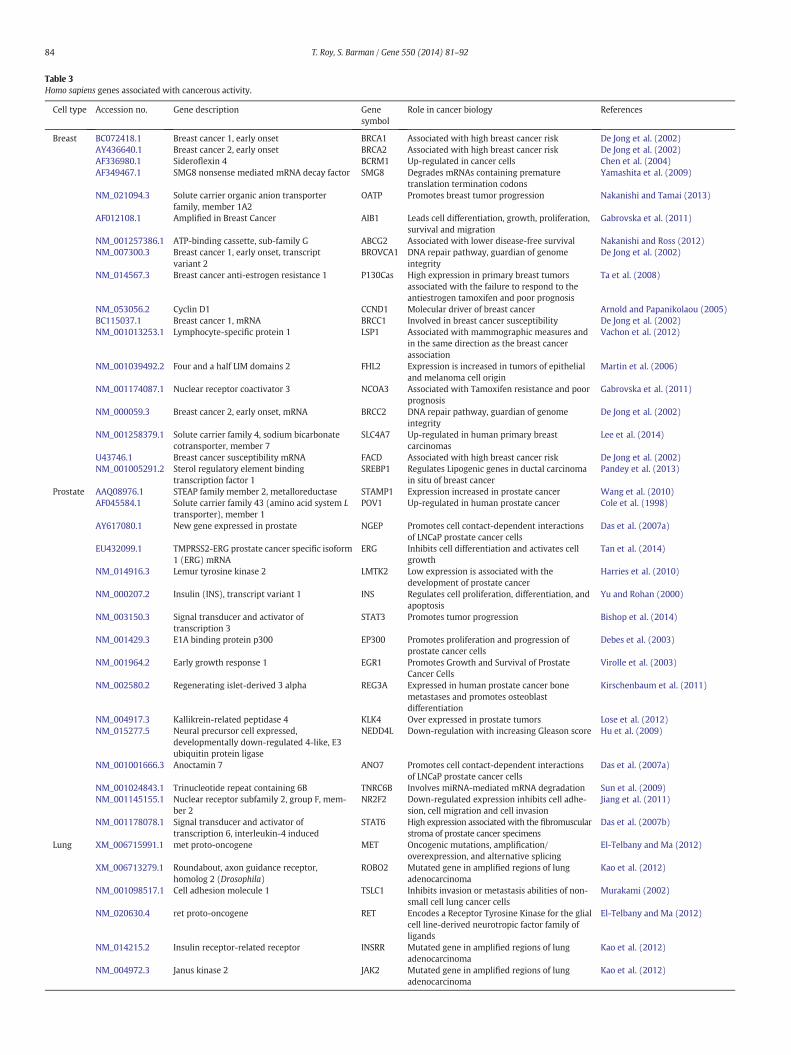
Table 3Homo sapiens genes associated with cancerous activity.
Cell type Accession no. Gene description Genesymbol
Role in cancer biology References
Breast BC072418.1 Breast cancer 1, early onset BRCA1 Associated with high breast cancer risk De Jong et al. (2002)AY436640.1 Breast cancer 2, early onset BRCA2 Associated with high breast cancer risk De Jong et al. (2002)AF336980.1 Sideroflexin 4 BCRM1 Up-regulated in cancer cells Chen et al. (2004)AF349467.1 SMG8 nonsense mediated mRNA decay factor SMG8 Degrades mRNAs containing premature
translation termination codonsYamashita et al. (2009)
NM_021094.3 Solute carrier organic anion transporterfamily, member 1A2
OATP Promotes breast tumor progression Nakanishi and Tamai (2013)
AF012108.1 Amplified in Breast Cancer AIB1 Leads cell differentiation, growth, proliferation,survival and migration
Gabrovska et al. (2011)
NM_001257386.1 ATP-binding cassette, sub-family G ABCG2 Associated with lower disease-free survival Nakanishi and Ross (2012)NM_007300.3 Breast cancer 1, early onset, transcript
variant 2BROVCA1 DNA repair pathway, guardian of genome
integrityDe Jong et al. (2002)
NM_014567.3 Breast cancer anti-estrogen resistance 1 P130Cas High expression in primary breast tumorsassociated with the failure to respond to theantiestrogen tamoxifen and poor prognosis
Ta et al. (2008)
NM_053056.2 Cyclin D1 CCND1 Molecular driver of breast cancer Arnold and Papanikolaou (2005)BC115037.1 Breast cancer 1, mRNA BRCC1 Involved in breast cancer susceptibility De Jong et al. (2002)NM_001013253.1 Lymphocyte-specific protein 1 LSP1 Associated with mammographic measures and
in the same direction as the breast cancerassociation
Vachon et al. (2012)
NM_001039492.2 Four and a half LIM domains 2 FHL2 Expression is increased in tumors of epithelialand melanoma cell origin
Martin et al. (2006)
NM_001174087.1 Nuclear receptor coactivator 3 NCOA3 Associated with Tamoxifen resistance and poorprognosis
Gabrovska et al. (2011)
NM_000059.3 Breast cancer 2, early onset, mRNA BRCC2 DNA repair pathway, guardian of genomeintegrity
De Jong et al. (2002)
NM_001258379.1 Solute carrier family 4, sodium bicarbonatecotransporter, member 7
SLC4A7 Up-regulated in human primary breastcarcinomas
Lee et al. (2014)
U43746.1 Breast cancer susceptibility mRNA FACD Associated with high breast cancer risk De Jong et al. (2002)NM_001005291.2 Sterol regulatory element binding
transcription factor 1SREBP1 Regulates Lipogenic genes in ductal carcinoma
in situ of breast cancerPandey et al. (2013)
Prostate AAQ08976.1 STEAP family member 2, metalloreductase STAMP1 Expression increased in prostate cancer Wang et al. (2010)AF045584.1 Solute carrier family 43 (amino acid system L
transporter), member 1POV1 Up-regulated in human prostate cancer Cole et al. (1998)
AY617080.1 New gene expressed in prostate NGEP Promotes cell contact-dependent interactionsof LNCaP prostate cancer cells
Das et al. (2007a)
EU432099.1 TMPRSS2-ERG prostate cancer specific isoform1 (ERG) mRNA
ERG Inhibits cell differentiation and activates cellgrowth
Tan et al. (2014)
NM_014916.3 Lemur tyrosine kinase 2 LMTK2 Low expression is associated with thedevelopment of prostate cancer
Harries et al. (2010)
NM_000207.2 Insulin (INS), transcript variant 1 INS Regulates cell proliferation, differentiation, andapoptosis
Yu and Rohan (2000)
NM_003150.3 Signal transducer and activator oftranscription 3
STAT3 Promotes tumor progression Bishop et al. (2014)
NM_001429.3 E1A binding protein p300 EP300 Promotes proliferation and progression ofprostate cancer cells
Debes et al. (2003)
NM_001964.2 Early growth response 1 EGR1 Promotes Growth and Survival of ProstateCancer Cells
Virolle et al. (2003)
NM_002580.2 Regenerating islet-derived 3 alpha REG3A Expressed in human prostate cancer bonemetastases and promotes osteoblastdifferentiation
Kirschenbaum et al. (2011)
NM_004917.3 Kallikrein-related peptidase 4 KLK4 Over expressed in prostate tumors Lose et al. (2012)NM_015277.5 Neural precursor cell expressed,
developmentally down-regulated 4-like, E3ubiquitin protein ligase
NEDD4L Down-regulation with increasing Gleason score Hu et al. (2009)
NM_001001666.3 Anoctamin 7 ANO7 Promotes cell contact-dependent interactionsof LNCaP prostate cancer cells
Das et al. (2007a)
NM_001024843.1 Trinucleotide repeat containing 6B TNRC6B Involves miRNA-mediated mRNA degradation Sun et al. (2009)NM_001145155.1 Nuclear receptor subfamily 2, group F, mem-
ber 2NR2F2 Down-regulated expression inhibits cell adhe-
sion, cell migration and cell invasionJiang et al. (2011)
NM_001178078.1 Signal transducer and activator oftranscription 6, interleukin-4 induced
STAT6 High expression associated with the fibromuscularstroma of prostate cancer specimens
Das et al. (2007b)
Lung XM_006715991.1 met proto-oncogene MET Oncogenic mutations, amplification/overexpression, and alternative splicing
El-Telbany and Ma (2012)
XM_006713279.1 Roundabout, axon guidance receptor,homolog 2 (Drosophila)
ROBO2 Mutated gene in amplified regions of lungadenocarcinoma
Kao et al. (2012)
NM_001098517.1 Cell adhesion molecule 1 TSLC1 Inhibits invasion or metastasis abilities of non-small cell lung cancer cells
Murakami (2002)
NM_020630.4 ret proto-oncogene RET Encodes a Receptor Tyrosine Kinase for the glialcell line-derived neurotropic factor family ofligands
El-Telbany and Ma (2012)
NM_014215.2 Insulin receptor-related receptor INSRR Mutated gene in amplified regions of lungadenocarcinoma
Kao et al. (2012)
NM_004972.3 Janus kinase 2 JAK2 Mutated gene in amplified regions of lungadenocarcinoma
Kao et al. (2012)
84 T. Roy, S. Barman / Gene 550 (2014) 81–92
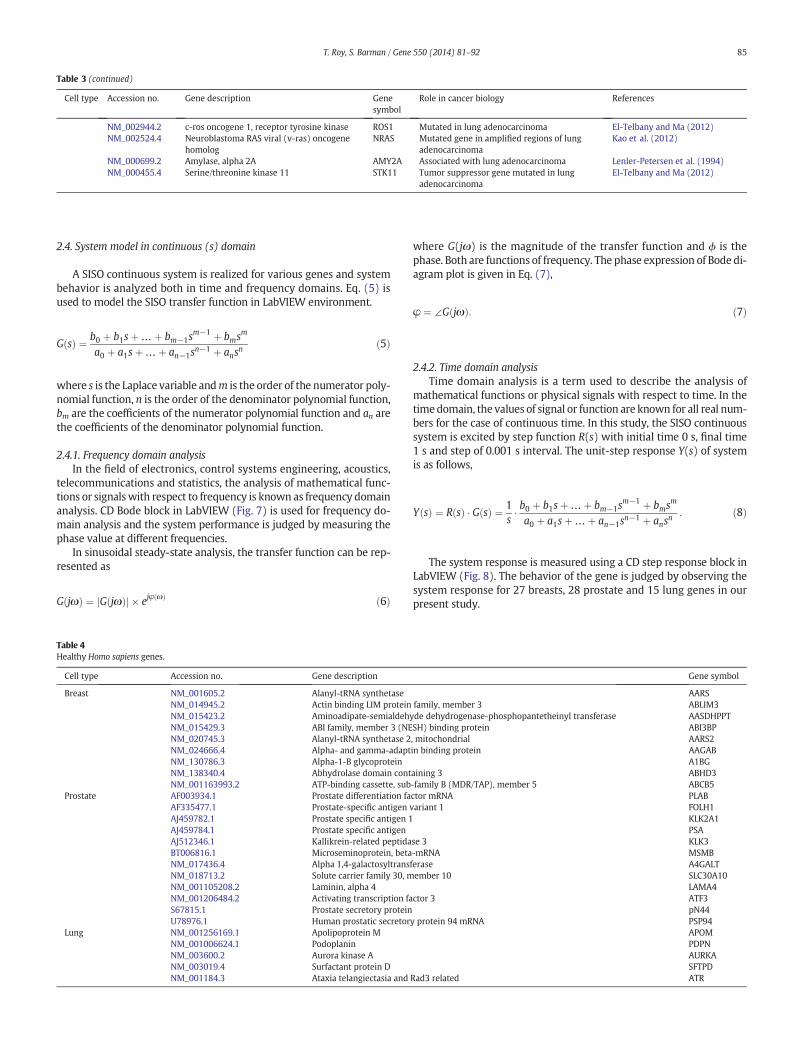
Table 3 (continued)
Cell type Accession no. Gene description Genesymbol
Role in cancer biology References
NM_002944.2 c-ros oncogene 1, receptor tyrosine kinase ROS1 Mutated in lung adenocarcinoma El-Telbany and Ma (2012)NM_002524.4 Neuroblastoma RAS viral (v-ras) oncogene
homologNRAS Mutated gene in amplified regions of lung
adenocarcinomaKao et al. (2012)
NM_000699.2 Amylase, alpha 2A AMY2A Associated with lung adenocarcinoma Lenler-Petersen et al. (1994)NM_000455.4 Serine/threonine kinase 11 STK11 Tumor suppressor gene mutated in lung
adenocarcinomaEl-Telbany and Ma (2012)
85T. Roy, S. Barman / Gene 550 (2014) 81–92
2.4. System model in continuous (s) domain
A SISO continuous system is realized for various genes and systembehavior is analyzed both in time and frequency domains. Eq. (5) isused to model the SISO transfer function in LabVIEW environment.
G sð Þ ¼ b0 þ b1sþ…þ bm−1sm−1 þ bms
m
a0 þ a1sþ…þ an−1sn−1 þ ans
n ð5Þ
where s is the Laplace variable andm is the order of the numerator poly-nomial function, n is the order of the denominator polynomial function,bm are the coefficients of the numerator polynomial function and an arethe coefficients of the denominator polynomial function.
2.4.1. Frequency domain analysisIn the field of electronics, control systems engineering, acoustics,
telecommunications and statistics, the analysis of mathematical func-tions or signalswith respect to frequency is known as frequency domainanalysis. CD Bode block in LabVIEW (Fig. 7) is used for frequency do-main analysis and the system performance is judged by measuring thephase value at different frequencies.
In sinusoidal steady-state analysis, the transfer function can be rep-resented as
G jωð Þ ¼ G jωð Þj j � ejφ ωð Þ ð6Þ
Table 4Healthy Homo sapiens genes.
Cell type Accession no. Gene description
Breast NM_001605.2 Alanyl-tRNA synthetaseNM_014945.2 Actin binding LIM proteinNM_015423.2 Aminoadipate-semialdehyNM_015429.3 ABI family, member 3 (NENM_020745.3 Alanyl-tRNA synthetase 2NM_024666.4 Alpha- and gamma-adaptNM_130786.3 Alpha-1-B glycoproteinNM_138340.4 Abhydrolase domain contNM_001163993.2 ATP-binding cassette, sub
Prostate AF003934.1 Prostate differentiation faAF335477.1 Prostate-specific antigen vAJ459782.1 Prostate specific antigen 1AJ459784.1 Prostate specific antigenAJ512346.1 Kallikrein-related peptidaBT006816.1 Microseminoprotein, betaNM_017436.4 Alpha 1,4-galactosyltransNM_018713.2 Solute carrier family 30, mNM_001105208.2 Laminin, alpha 4NM_001206484.2 Activating transcription faS67815.1 Prostate secretory proteinU78976.1 Human prostatic secretor
Lung NM_001256169.1 Apolipoprotein MNM_001006624.1 PodoplaninNM_003600.2 Aurora kinase ANM_003019.4 Surfactant protein DNM_001184.3 Ataxia telangiectasia and
where G(jω) is the magnitude of the transfer function and ϕ is thephase. Both are functions of frequency. The phase expression of Bode di-agram plot is given in Eq. (7),
φ ¼ ∠G jωð Þ: ð7Þ
2.4.2. Time domain analysisTime domain analysis is a term used to describe the analysis of
mathematical functions or physical signals with respect to time. In thetimedomain, the values of signal or function are known for all real num-bers for the case of continuous time. In this study, the SISO continuoussystem is excited by step function R(s) with initial time 0 s, final time1 s and step of 0.001 s interval. The unit-step response Y(s) of systemis as follows,
Y sð Þ ¼ R sð Þ � G sð Þ ¼ 1s� b0 þ b1sþ…þ bm−1s
m−1 þ bmsm
a0 þ a1sþ…þ an−1sn−1 þ ans
n : ð8Þ
The system response is measured using a CD step response block inLabVIEW (Fig. 8). The behavior of the gene is judged by observing thesystem response for 27 breasts, 28 prostate and 15 lung genes in ourpresent study.
Gene symbol
AARSfamily, member 3 ABLIM3de dehydrogenase-phosphopantetheinyl transferase AASDHPPTSH) binding protein ABI3BP, mitochondrial AARS2in binding protein AAGAB
A1BGaining 3 ABHD3-family B (MDR/TAP), member 5 ABCB5ctor mRNA PLABariant 1 FOLH1
KLK2A1PSA
se 3 KLK3-mRNA MSMBferase A4GALTember 10 SLC30A10
LAMA4ctor 3 ATF3
pN44y protein 94 mRNA PSP94
APOMPDPNAURKASFTPD
Rad3 related ATR

Fig. 5. Homo sapiens polypeptide chain. A. polypeptide chain is made of amino acids. B. The corresponding electrical network for the polypeptide chain. The individual amino acidmodelsare joined together to make the protein or polypeptide chain network.
86 T. Roy, S. Barman / Gene 550 (2014) 81–92
2.5. System model in discrete (z) domain
Instability is the engine for identifying cancer genes, but no two can-cer genes are exactly genetically alike. Since the cancer genomes arerandomly varied, to predict more clearly another feature pole zero
Fig. 6.Amino acid sequence. A. ATF3 protein (acc no. NM_001206484.2)made of amino acid strsystem behavior for protein or gene is obtained through load resistance RL.
distribution on the z-plane is also considered in the present case. Thecontinuous SISO system is discretized using Eq. (9) and themapping be-tween z-plane and s-plane is shown in Fig. 9.
z ¼ esT ð9Þ
ing downloaded fromNCBI site. B. Corresponding network realization of ATF3 protein. The
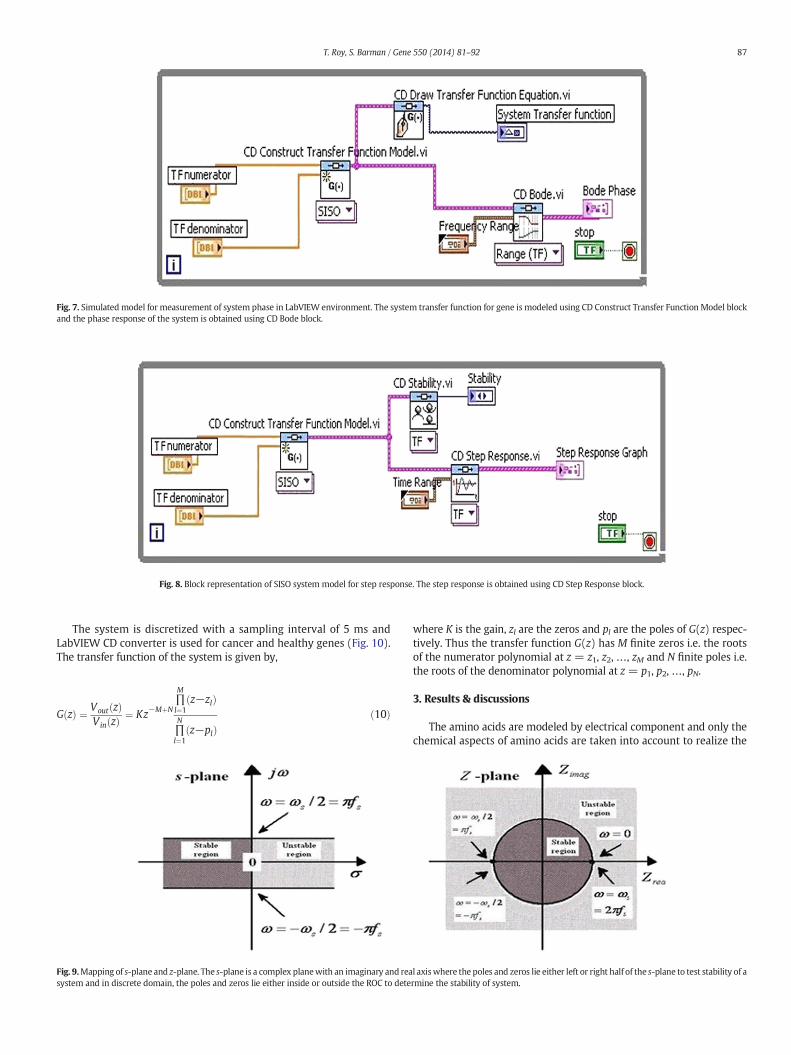
Fig. 7. Simulated model for measurement of system phase in LabVIEW environment. The system transfer function for gene is modeled using CD Construct Transfer Function Model blockand the phase response of the system is obtained using CD Bode block.
Fig. 8. Block representation of SISO system model for step response. The step response is obtained using CD Step Response block.
87T. Roy, S. Barman / Gene 550 (2014) 81–92
The system is discretized with a sampling interval of 5 ms andLabVIEW CD converter is used for cancer and healthy genes (Fig. 10).The transfer function of the system is given by,
G zð Þ ¼ Vout zð ÞVin zð Þ ¼ Kz−MþN
∏M
l¼1z−zlð Þ
∏N
l¼1z−plð Þ
ð10Þ
Fig. 9.Mapping of s-plane and z-plane. The s-plane is a complex planewith an imaginary and reasystem and in discrete domain, the poles and zeros lie either inside or outside the ROC to dete
where K is the gain, zl are the zeros and pl are the poles of G(z) respec-tively. Thus the transfer function G(z) has M finite zeros i.e. the rootsof the numerator polynomial at z = z1, z2, …, zM and N finite poles i.e.the roots of the denominator polynomial at z = p1, p2, …, pN.
3. Results & discussions
The amino acids are modeled by electrical component and only thechemical aspects of amino acids are taken into account to realize the
l axiswhere the poles and zeros lie either left or right half of the s-plane to test stability of armine the stability of system.
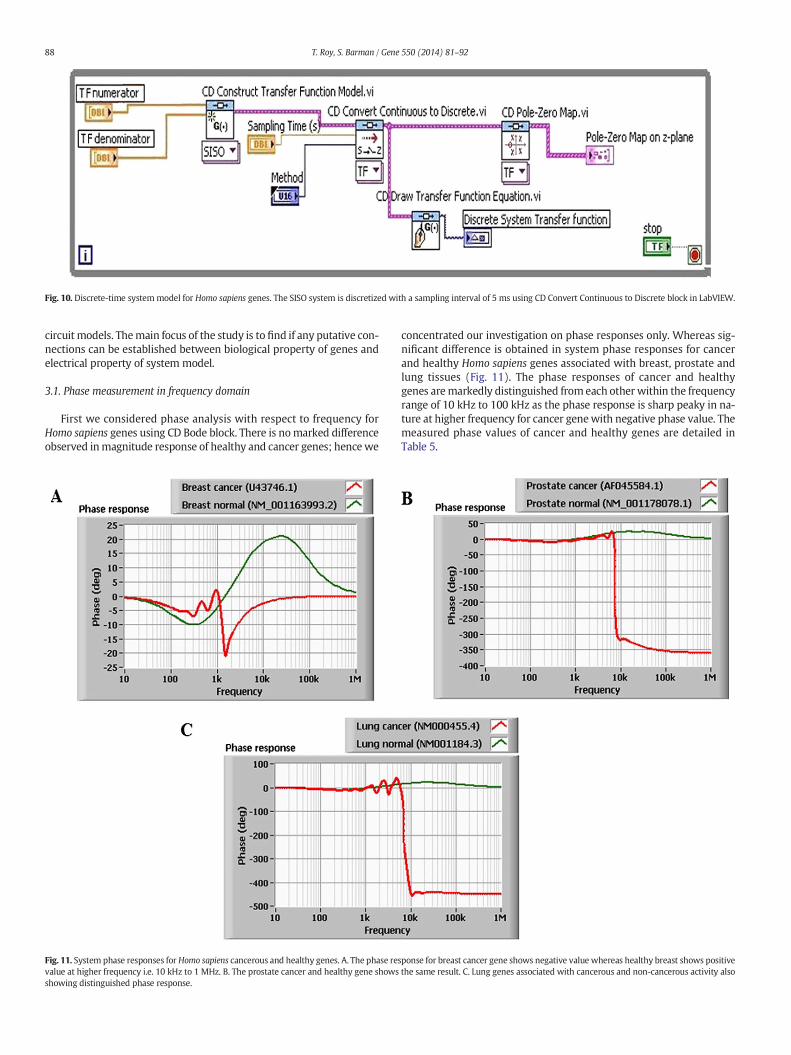
Fig. 10. Discrete-time systemmodel for Homo sapiens genes. The SISO system is discretized with a sampling interval of 5 ms using CD Convert Continuous to Discrete block in LabVIEW.
88 T. Roy, S. Barman / Gene 550 (2014) 81–92
circuit models. Themain focus of the study is to find if any putative con-nections can be established between biological property of genes andelectrical property of system model.
3.1. Phase measurement in frequency domain
First we considered phase analysis with respect to frequency forHomo sapiens genes using CD Bode block. There is nomarked differenceobserved inmagnitude response of healthy and cancer genes; hencewe
Fig. 11. System phase responses for Homo sapiens cancerous and healthy genes. A. The phase resvalue at higher frequency i.e. 10 kHz to 1 MHz. B. The prostate cancer and healthy gene showsshowing distinguished phase response.
concentrated our investigation on phase responses only. Whereas sig-nificant difference is obtained in system phase responses for cancerand healthy Homo sapiens genes associated with breast, prostate andlung tissues (Fig. 11). The phase responses of cancer and healthygenes aremarkedly distinguished from each other within the frequencyrange of 10 kHz to 100 kHz as the phase response is sharp peaky in na-ture at higher frequency for cancer genewith negative phase value. Themeasured phase values of cancer and healthy genes are detailed inTable 5.
ponse for breast cancer gene shows negative value whereas healthy breast shows positivethe same result. C. Lung genes associated with cancerous and non-cancerous activity also
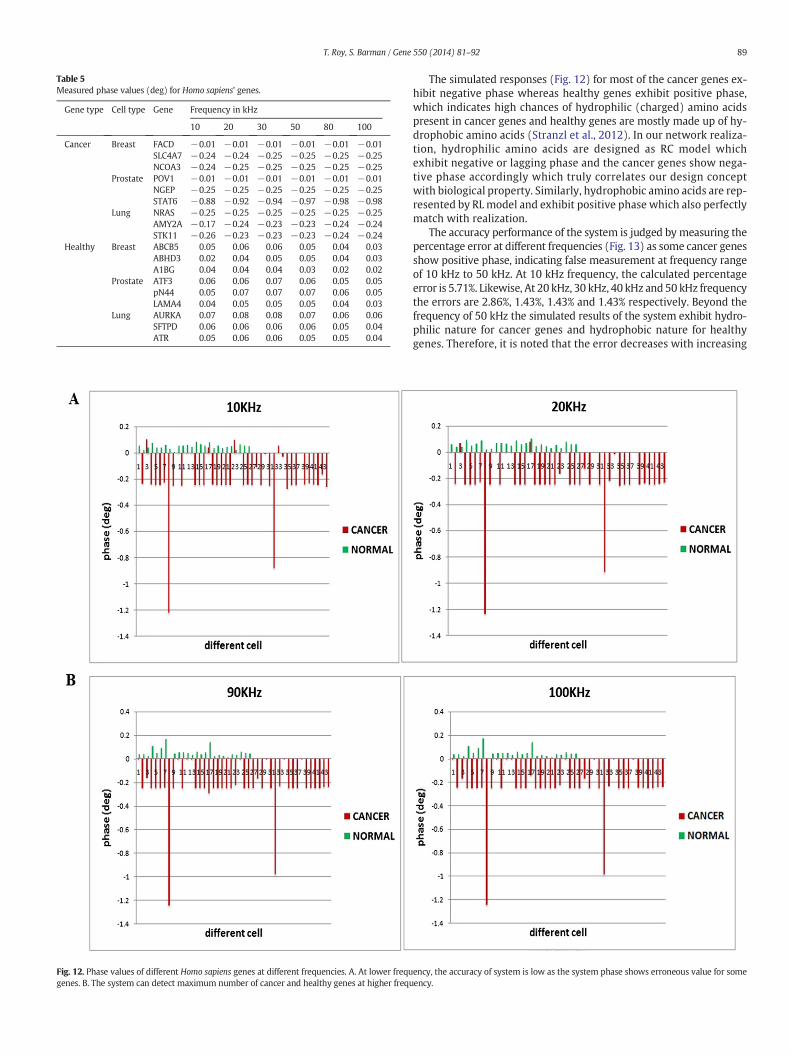
Table 5Measured phase values (deg) for Homo sapiens' genes.
Gene type Cell type Gene Frequency in kHz
10 20 30 50 80 100
Cancer Breast FACD −0.01 −0.01 −0.01 −0.01 −0.01 −0.01SLC4A7 −0.24 −0.24 −0.25 −0.25 −0.25 −0.25NCOA3 −0.24 −0.25 −0.25 −0.25 −0.25 −0.25
Prostate POV1 −0.01 −0.01 −0.01 −0.01 −0.01 −0.01NGEP −0.25 −0.25 −0.25 −0.25 −0.25 −0.25STAT6 −0.88 −0.92 −0.94 −0.97 −0.98 −0.98
Lung NRAS −0.25 −0.25 −0.25 −0.25 −0.25 −0.25AMY2A −0.17 −0.24 −0.23 −0.23 −0.24 −0.24STK11 −0.26 −0.23 −0.23 −0.23 −0.24 −0.24
Healthy Breast ABCB5 0.05 0.06 0.06 0.05 0.04 0.03ABHD3 0.02 0.04 0.05 0.05 0.04 0.03A1BG 0.04 0.04 0.04 0.03 0.02 0.02
Prostate ATF3 0.06 0.06 0.07 0.06 0.05 0.05pN44 0.05 0.07 0.07 0.07 0.06 0.05LAMA4 0.04 0.05 0.05 0.05 0.04 0.03
Lung AURKA 0.07 0.08 0.08 0.07 0.06 0.06SFTPD 0.06 0.06 0.06 0.06 0.05 0.04ATR 0.05 0.06 0.06 0.05 0.05 0.04
Fig. 12. Phase values of different Homo sapiens genes at different frequencies. A. At lower frequgenes. B. The system can detect maximum number of cancer and healthy genes at higher frequ
89T. Roy, S. Barman / Gene 550 (2014) 81–92
The simulated responses (Fig. 12) for most of the cancer genes ex-hibit negative phase whereas healthy genes exhibit positive phase,which indicates high chances of hydrophilic (charged) amino acidspresent in cancer genes and healthy genes are mostly made up of hy-drophobic amino acids (Stranzl et al., 2012). In our network realiza-tion, hydrophilic amino acids are designed as RC model whichexhibit negative or lagging phase and the cancer genes show nega-tive phase accordingly which truly correlates our design conceptwith biological property. Similarly, hydrophobic amino acids are rep-resented by RLmodel and exhibit positive phase which also perfectlymatch with realization.
The accuracy performance of the system is judged by measuring thepercentage error at different frequencies (Fig. 13) as some cancer genesshow positive phase, indicating false measurement at frequency rangeof 10 kHz to 50 kHz. At 10 kHz frequency, the calculated percentageerror is 5.71%. Likewise, At 20 kHz, 30 kHz, 40 kHz and 50 kHz frequencythe errors are 2.86%, 1.43%, 1.43% and 1.43% respectively. Beyond thefrequency of 50 kHz the simulated results of the system exhibit hydro-philic nature for cancer genes and hydrophobic nature for healthygenes. Therefore, it is noted that the error decreases with increasing
ency, the accuracy of system is low as the system phase shows erroneous value for someency.
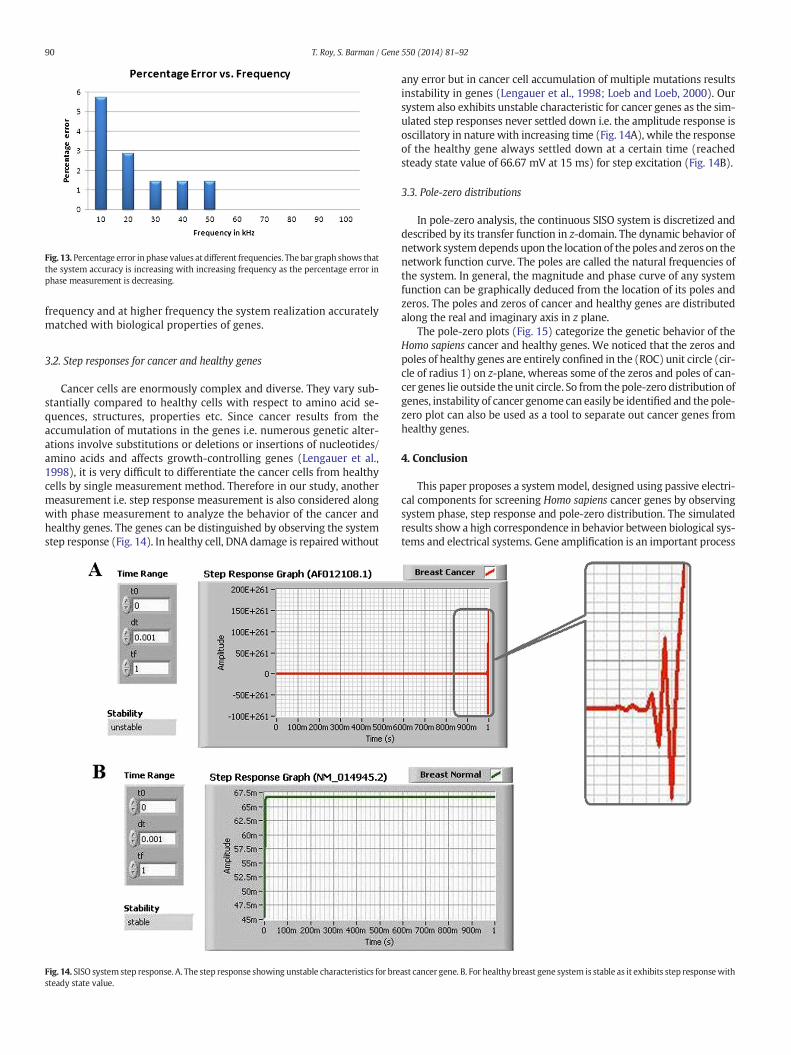
Fig. 13. Percentage error in phase values at different frequencies. The bar graph shows thatthe system accuracy is increasing with increasing frequency as the percentage error inphase measurement is decreasing.
90 T. Roy, S. Barman / Gene 550 (2014) 81–92
frequency and at higher frequency the system realization accuratelymatched with biological properties of genes.
3.2. Step responses for cancer and healthy genes
Cancer cells are enormously complex and diverse. They vary sub-stantially compared to healthy cells with respect to amino acid se-quences, structures, properties etc. Since cancer results from theaccumulation of mutations in the genes i.e. numerous genetic alter-ations involve substitutions or deletions or insertions of nucleotides/amino acids and affects growth-controlling genes (Lengauer et al.,1998), it is very difficult to differentiate the cancer cells from healthycells by single measurement method. Therefore in our study, anothermeasurement i.e. step response measurement is also considered alongwith phase measurement to analyze the behavior of the cancer andhealthy genes. The genes can be distinguished by observing the systemstep response (Fig. 14). In healthy cell, DNA damage is repaired without
Fig. 14. SISO system step response. A. The step response showing unstable characteristics for bresteady state value.
any error but in cancer cell accumulation of multiple mutations resultsinstability in genes (Lengauer et al., 1998; Loeb and Loeb, 2000). Oursystem also exhibits unstable characteristic for cancer genes as the sim-ulated step responses never settled down i.e. the amplitude response isoscillatory in nature with increasing time (Fig. 14A), while the responseof the healthy gene always settled down at a certain time (reachedsteady state value of 66.67 mV at 15 ms) for step excitation (Fig. 14B).
3.3. Pole-zero distributions
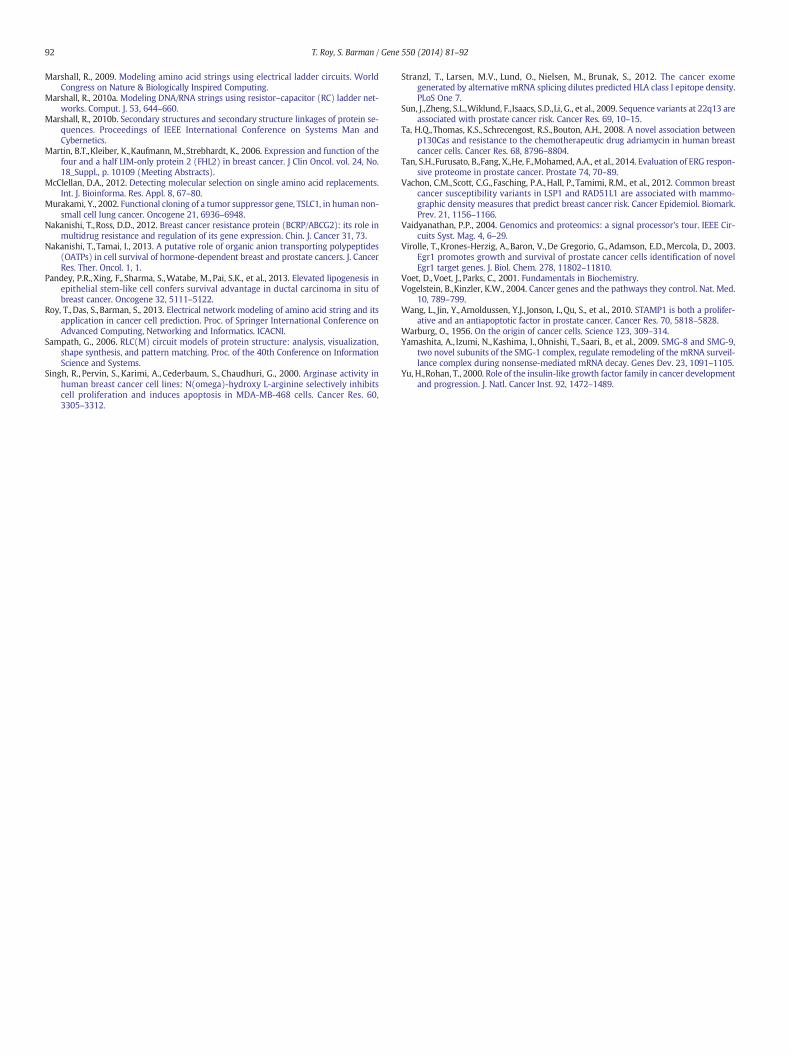
In pole-zero analysis, the continuous SISO system is discretized anddescribed by its transfer function in z-domain. The dynamic behavior ofnetwork systemdepends upon the location of thepoles and zeros on thenetwork function curve. The poles are called the natural frequencies ofthe system. In general, the magnitude and phase curve of any systemfunction can be graphically deduced from the location of its poles andzeros. The poles and zeros of cancer and healthy genes are distributedalong the real and imaginary axis in z plane.
The pole-zero plots (Fig. 15) categorize the genetic behavior of theHomo sapiens cancer and healthy genes. We noticed that the zeros andpoles of healthy genes are entirely confined in the (ROC) unit circle (cir-cle of radius 1) on z-plane, whereas some of the zeros and poles of can-cer genes lie outside the unit circle. So from the pole-zero distribution ofgenes, instability of cancer genome can easily be identified and the pole-zero plot can also be used as a tool to separate out cancer genes fromhealthy genes.
4. Conclusion
This paper proposes a systemmodel, designed using passive electri-cal components for screening Homo sapiens cancer genes by observingsystem phase, step response and pole-zero distribution. The simulatedresults show a high correspondence in behavior between biological sys-tems and electrical systems. Gene amplification is an important process
ast cancer gene. B. For healthy breast gene system is stable as it exhibits step responsewith
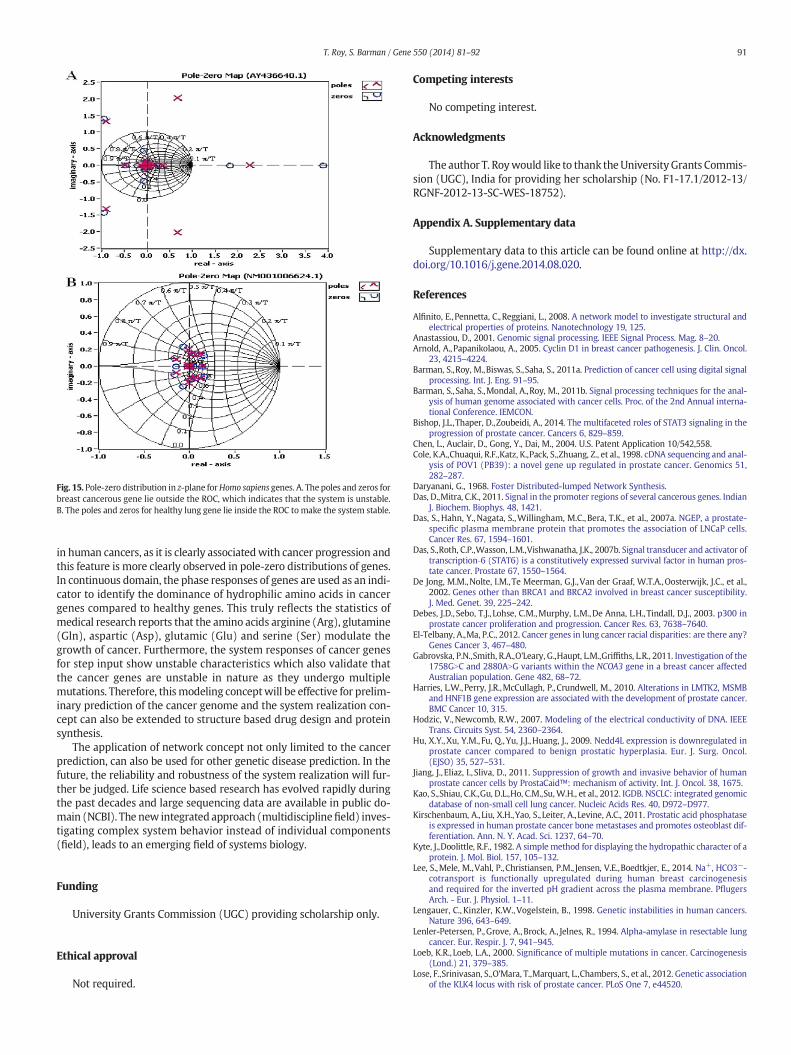
Fig. 15. Pole-zero distribution in z-plane forHomo sapiens genes. A. The poles and zeros forbreast cancerous gene lie outside the ROC, which indicates that the system is unstable.B. The poles and zeros for healthy lung gene lie inside the ROC to make the system stable.
91T. Roy, S. Barman / Gene 550 (2014) 81–92
in human cancers, as it is clearly associatedwith cancer progression andthis feature is more clearly observed in pole-zero distributions of genes.In continuous domain, the phase responses of genes are used as an indi-cator to identify the dominance of hydrophilic amino acids in cancergenes compared to healthy genes. This truly reflects the statistics ofmedical research reports that the amino acids arginine (Arg), glutamine(Gln), aspartic (Asp), glutamic (Glu) and serine (Ser) modulate thegrowth of cancer. Furthermore, the system responses of cancer genesfor step input show unstable characteristics which also validate thatthe cancer genes are unstable in nature as they undergo multiplemutations. Therefore, thismodeling conceptwill be effective for prelim-inary prediction of the cancer genome and the system realization con-cept can also be extended to structure based drug design and proteinsynthesis.
The application of network concept not only limited to the cancerprediction, can also be used for other genetic disease prediction. In thefuture, the reliability and robustness of the system realization will fur-ther be judged. Life science based research has evolved rapidly duringthe past decades and large sequencing data are available in public do-main (NCBI). The new integrated approach (multidisciplinefield) inves-tigating complex system behavior instead of individual components(field), leads to an emerging field of systems biology.
Funding
University Grants Commission (UGC) providing scholarship only.
Ethical approval
Not required.
Competing interests
No competing interest.
Acknowledgments
The author T. Roywould like to thank theUniversityGrants Commis-sion (UGC), India for providing her scholarship (No. F1-17.1/2012-13/RGNF-2012-13-SC-WES-18752).
Appendix A. Supplementary data
Supplementary data to this article can be found online at http://dx.doi.org/10.1016/j.gene.2014.08.020.
References
Alfinito, E.,Pennetta, C.,Reggiani, L., 2008. A network model to investigate structural andelectrical properties of proteins. Nanotechnology 19, 125.
Anastassiou, D., 2001. Genomic signal processing. IEEE Signal Process. Mag. 8–20.Arnold, A.,Papanikolaou, A., 2005. Cyclin D1 in breast cancer pathogenesis. J. Clin. Oncol.
23, 4215–4224.Barman, S.,Roy, M.,Biswas, S.,Saha, S., 2011a. Prediction of cancer cell using digital signal
processing. Int. J. Eng. 91–95.Barman, S.,Saha, S.,Mondal, A.,Roy, M., 2011b. Signal processing techniques for the anal-
ysis of human genome associated with cancer cells. Proc. of the 2nd Annual interna-tional Conference. IEMCON.
Bishop, J.L.,Thaper, D.,Zoubeidi, A., 2014. The multifaceted roles of STAT3 signaling in theprogression of prostate cancer. Cancers 6, 829–859.
Chen, L., Auclair, D., Gong, Y., Dai, M., 2004. U.S. Patent Application 10/542,558.Cole, K.A.,Chuaqui, R.F.,Katz, K.,Pack, S.,Zhuang, Z., et al., 1998. cDNA sequencing and anal-
ysis of POV1 (PB39): a novel gene up regulated in prostate cancer. Genomics 51,282–287.
Daryanani, G., 1968. Foster Distributed-lumped Network Synthesis.Das, D.,Mitra, C.K., 2011. Signal in the promoter regions of several cancerous genes. Indian
J. Biochem. Biophys. 48, 1421.Das, S.,Hahn, Y.,Nagata, S.,Willingham, M.C., Bera, T.K., et al., 2007a. NGEP, a prostate-
specific plasma membrane protein that promotes the association of LNCaP cells.Cancer Res. 67, 1594–1601.
Das, S.,Roth, C.P.,Wasson, L.M.,Vishwanatha, J.K., 2007b. Signal transducer and activator oftranscription‐6 (STAT6) is a constitutively expressed survival factor in human pros-tate cancer. Prostate 67, 1550–1564.
De Jong, M.M.,Nolte, I.M.,Te Meerman, G.J.,Van der Graaf, W.T.A.,Oosterwijk, J.C., et al.,2002. Genes other than BRCA1 and BRCA2 involved in breast cancer susceptibility.J. Med. Genet. 39, 225–242.
Debes, J.D., Sebo, T.J., Lohse, C.M.,Murphy, L.M.,De Anna, L.H., Tindall, D.J., 2003. p300 inprostate cancer proliferation and progression. Cancer Res. 63, 7638–7640.
El-Telbany, A.,Ma, P.C., 2012. Cancer genes in lung cancer racial disparities: are there any?Genes Cancer 3, 467–480.
Gabrovska, P.N.,Smith, R.A.,O'Leary, G.,Haupt, L.M.,Griffiths, L.R., 2011. Investigation of the1758GNC and 2880ANG variants within the NCOA3 gene in a breast cancer affectedAustralian population. Gene 482, 68–72.
Harries, L.W.,Perry, J.R.,McCullagh, P.,Crundwell, M., 2010. Alterations in LMTK2, MSMBand HNF1B gene expression are associated with the development of prostate cancer.BMC Cancer 10, 315.
Hodzic, V.,Newcomb, R.W., 2007. Modeling of the electrical conductivity of DNA. IEEETrans. Circuits Syst. 54, 2360–2364.
Hu, X.Y.,Xu, Y.M., Fu, Q.,Yu, J.J.,Huang, J., 2009. Nedd4L expression is downregulated inprostate cancer compared to benign prostatic hyperplasia. Eur. J. Surg. Oncol.(EJSO) 35, 527–531.
Jiang, J., Eliaz, I., Sliva, D., 2011. Suppression of growth and invasive behavior of humanprostate cancer cells by ProstaCaid™: mechanism of activity. Int. J. Oncol. 38, 1675.
Kao, S.,Shiau, C.K.,Gu, D.L.,Ho, C.M.,Su,W.H., et al., 2012. IGDB. NSCLC: integrated genomicdatabase of non-small cell lung cancer. Nucleic Acids Res. 40, D972–D977.
Kirschenbaum, A.,Liu, X.H.,Yao, S.,Leiter, A.,Levine, A.C., 2011. Prostatic acid phosphataseis expressed in human prostate cancer bone metastases and promotes osteoblast dif-ferentiation. Ann. N. Y. Acad. Sci. 1237, 64–70.
Kyte, J.,Doolittle, R.F., 1982. A simple method for displaying the hydropathic character of aprotein. J. Mol. Biol. 157, 105–132.
Lee, S.,Mele, M.,Vahl, P.,Christiansen, P.M., Jensen, V.E.,Boedtkjer, E., 2014. Na+, HCO3−-cotransport is functionally upregulated during human breast carcinogenesisand required for the inverted pH gradient across the plasma membrane. PflugersArch. - Eur. J. Physiol. 1–11.
Lengauer, C., Kinzler, K.W.,Vogelstein, B., 1998. Genetic instabilities in human cancers.Nature 396, 643–649.
Lenler-Petersen, P.,Grove, A.,Brock, A., Jelnes, R., 1994. Alpha-amylase in resectable lungcancer. Eur. Respir. J. 7, 941–945.
Loeb, K.R., Loeb, L.A., 2000. Significance of multiple mutations in cancer. Carcinogenesis(Lond.) 21, 379–385.
Lose, F.,Srinivasan, S.,O'Mara, T.,Marquart, L.,Chambers, S., et al., 2012. Genetic associationof the KLK4 locus with risk of prostate cancer. PLoS One 7, e44520.
92 T. Roy, S. Barman / Gene 550 (2014) 81–92
Marshall, R., 2009. Modeling amino acid strings using electrical ladder circuits. WorldCongress on Nature & Biologically Inspired Computing.
Marshall, R., 2010a. Modeling DNA/RNA strings using resistor–capacitor (RC) ladder net-works. Comput. J. 53, 644–660.
Marshall, R., 2010b. Secondary structures and secondary structure linkages of protein se-quences. Proceedings of IEEE International Conference on Systems Man andCybernetics.
Martin, B.T.,Kleiber, K.,Kaufmann, M.,Strebhardt, K., 2006. Expression and function of thefour and a half LIM-only protein 2 (FHL2) in breast cancer. J Clin Oncol. vol. 24, No.18_Suppl., p. 10109 (Meeting Abstracts).
McClellan, D.A., 2012. Detecting molecular selection on single amino acid replacements.Int. J. Bioinforma. Res. Appl. 8, 67–80.
Murakami, Y., 2002. Functional cloning of a tumor suppressor gene, TSLC1, in human non-small cell lung cancer. Oncogene 21, 6936–6948.
Nakanishi, T.,Ross, D.D., 2012. Breast cancer resistance protein (BCRP/ABCG2): its role inmultidrug resistance and regulation of its gene expression. Chin. J. Cancer 31, 73.
Nakanishi, T.,Tamai, I., 2013. A putative role of organic anion transporting polypeptides(OATPs) in cell survival of hormone-dependent breast and prostate cancers. J. CancerRes. Ther. Oncol. 1, 1.
Pandey, P.R.,Xing, F., Sharma, S.,Watabe, M., Pai, S.K., et al., 2013. Elevated lipogenesis inepithelial stem-like cell confers survival advantage in ductal carcinoma in situ ofbreast cancer. Oncogene 32, 5111–5122.
Roy, T.,Das, S.,Barman, S., 2013. Electrical network modeling of amino acid string and itsapplication in cancer cell prediction. Proc. of Springer International Conference onAdvanced Computing, Networking and Informatics. ICACNI.
Sampath, G., 2006. RLC(M) circuit models of protein structure: analysis, visualization,shape synthesis, and pattern matching. Proc. of the 40th Conference on InformationScience and Systems.
Singh, R., Pervin, S., Karimi, A., Cederbaum, S., Chaudhuri, G., 2000. Arginase activity inhuman breast cancer cell lines: N(omega)-hydroxy L-arginine selectively inhibitscell proliferation and induces apoptosis in MDA-MB-468 cells. Cancer Res. 60,3305–3312.
Stranzl, T., Larsen, M.V., Lund, O., Nielsen, M., Brunak, S., 2012. The cancer exomegenerated by alternative mRNA splicing dilutes predicted HLA class I epitope density.PLoS One 7.
Sun, J.,Zheng, S.L.,Wiklund, F.,Isaacs, S.D.,Li, G., et al., 2009. Sequence variants at 22q13 areassociated with prostate cancer risk. Cancer Res. 69, 10–15.
Ta, H.Q.,Thomas, K.S., Schrecengost, R.S.,Bouton, A.H., 2008. A novel association betweenp130Cas and resistance to the chemotherapeutic drug adriamycin in human breastcancer cells. Cancer Res. 68, 8796–8804.
Tan, S.H.,Furusato, B.,Fang, X.,He, F.,Mohamed, A.A., et al., 2014. Evaluation of ERG respon-sive proteome in prostate cancer. Prostate 74, 70–89.
Vachon, C.M.,Scott, C.G., Fasching, P.A.,Hall, P.,Tamimi, R.M., et al., 2012. Common breastcancer susceptibility variants in LSP1 and RAD51L1 are associated with mammo-graphic density measures that predict breast cancer risk. Cancer Epidemiol. Biomark.Prev. 21, 1156–1166.
Vaidyanathan, P.P., 2004. Genomics and proteomics: a signal processor's tour. IEEE Cir-cuits Syst. Mag. 4, 6–29.
Virolle, T.,Krones-Herzig, A., Baron, V.,De Gregorio, G., Adamson, E.D.,Mercola, D., 2003.Egr1 promotes growth and survival of prostate cancer cells identification of novelEgr1 target genes. J. Biol. Chem. 278, 11802–11810.
Voet, D.,Voet, J., Parks, C., 2001. Fundamentals in Biochemistry.Vogelstein, B.,Kinzler, K.W., 2004. Cancer genes and the pathways they control. Nat. Med.
10, 789–799.Wang, L., Jin, Y.,Arnoldussen, Y.J., Jonson, I.,Qu, S., et al., 2010. STAMP1 is both a prolifer-
ative and an antiapoptotic factor in prostate cancer. Cancer Res. 70, 5818–5828.Warburg, O., 1956. On the origin of cancer cells. Science 123, 309–314.Yamashita, A., Izumi, N.,Kashima, I.,Ohnishi, T.,Saari, B., et al., 2009. SMG-8 and SMG-9,
two novel subunits of the SMG-1 complex, regulate remodeling of the mRNA surveil-lance complex during nonsense-mediated mRNA decay. Genes Dev. 23, 1091–1105.
Yu, H.,Rohan, T., 2000. Role of the insulin-like growth factor family in cancer developmentand progression. J. Natl. Cancer Inst. 92, 1472–1489.