Healthy Youth Survey 2021
61
Healthy Youth Survey 2021 Report of Participating Schools Pierce County Grade 10 March 1, 2022 Looking Glass Analytics 101 Capital Way N, Suite 203 Olympia, WA 98501 More information about the Healthy Youth Survey is available at www.AskHYS.net
-
Upload
khangminh22 -
Category
Documents
-
view
2 -
download
0
Transcript of Healthy Youth Survey 2021

Healthy Youth Survey 2021
Report of Participating Schools
Pierce County
Grade 10
March 1, 2022
Looking Glass Analytics101 Capital Way N, Suite 203
Olympia, WA 98501
More information about the Healthy Youth Survey is available at www.AskHYS.net

Pierce County Grade 10
ƒƒƒƒƒƒƒƒƒƒƒƒƒƒƒƒƒƒƒƒƒƒƒƒƒƒƒƒƒƒƒƒƒƒƒƒƒƒƒƒƒƒƒƒƒƒƒƒƒƒƒƒƒƒƒƒƒƒ
Report Contents
Introduction and Overview ....................................................................................... 2
Understanding Your Report ...................................................................................... 5
Highlights of the Local Results.................................................................................... 7
Selected Results by Sex ......................................................................................... 8
Individual Question Results....................................................................................... 9Demographics and General Information (Questions 1-20)............................................................ 9Alcohol, Tobacco, and Other Drug (ATOD) Use .................................................................... 13
Lifetime Use (Questions 21-31)................................................................................ 1330-Day Use (Questions 32-44) ................................................................................ 14Other Tobacco-Related Questions (Questions 45-55) ............................................................. 16Other Electronic Cigarette- and Vaping Related Questions (Questions 56-59) ......................................... 18Other Alcohol-Related Questions (Questions 60-69) .............................................................. 19Other Marijuana-Related Questions (Questions 70-75)............................................................. 21Other Alcohol- and Drug-related Questions (Questions 76-82) ...................................................... 22
Other Health Concerns ........................................................................................ 23Nutrition and Fitness (Questions 83-103)........................................................................ 23Health Conditions and Health Care (Questions 104-114)........................................................... 27Sexual Behavior (Questions 115-119)........................................................................... 28Behaviors Related to Unintentional Injuries (Questions 120-129) .................................................... 29Behaviors Related to Intentional Injuries (Questions 130-133)....................................................... 31Physical, Emotional and Sexual Abuse (Questions 134-140)........................................................ 31Mental Health (Questions 141-151)............................................................................. 32
COVID-19 ................................................................................................... 34Gambling.................................................................................................... 35School Climate (Questions 152-164) ............................................................................. 36Children's Hope Scale (Questions 167-171) ....................................................................... 38Adverse Childhood Experiences Scale (WAH-ACEs) ................................................................ 39Risk and Protective Factors .................................................................................... 41
Risk and Protective Factor: Reporting Schedule.................................................................. 41Risk and Protective Factor: Domain Scale Results and Graphs ..................................................... 42Risk and Protective Factor: All Scale Graph ..................................................................... 46
Risk and Protective Factor: Individual Question Results ............................................................. 47Community Domain (Questions 172-189)........................................................................ 47Family Domain (Questions 190-207)............................................................................ 49School Domain (Questions 208-225) ........................................................................... 52Peer and Individual Domain (Questions 226-244) ................................................................. 55
Questions by Topic ............................................................................................. 59
Core Questions ................................................................................................ 60
For a detailed list of all of the survey questions by topic - please use the Questions by Topic section in the back of this report.

Healthy Youth Survey 2021 Survey Results For help interpreting your results, please see information starting on page 2 Page 2
ƒƒƒƒƒƒƒƒƒƒƒƒƒƒƒƒƒƒƒƒƒƒƒƒƒƒƒƒƒƒƒƒƒƒƒƒƒƒƒƒƒƒƒƒƒƒƒƒƒƒƒƒƒƒƒƒƒƒ
Pierce County
Grade 10
Introduction and OverviewThis report presents results from the fall 2021 Healthy Youth Survey in Washington State. This survey was sponsored by the Health Care Authority, the Department of Health, the Office of Superintendent of Public Instruction, and the Liquor and Cannabis Board in cooperation with schools throughout the state of Washington.
Survey questions covering the same topics are grouped together when possible but be sure to consult the Questions by Topic index for related questions when searching for information on a specific topic. The numbering in this report is not the same as the question order on the survey itself.
The dot points and graphs included at the beginning of this report highlight selected findings. Additional information may be found in the Interpretive Guide posted to the Healthy Youth Survey web site under Training and Tools:http://www.askhys.net/Reports/Additional.
Survey Participation in this Report Number of students surveyed: 2,707Number of valid responses: 2,639Number of enrolled students*: 4,916Your survey participation rate**: 54%
* The estimate of enrolled students is based on figures from the 2021-22 school year, provided by OSPI.** The survey participation rate is the number of valid responses divided by the number of enrolled students.
Caution about Participation and BiasPlease use the following guidance when reviewing your results:
• 70% or greater participation–Results are probably representative of students in this grade.• 40–69% participation–Results may be representative of students in this grade.• Less than 40% participation–Results are likely not representative of students in this grade but do reflect students
who completed the survey.
There may be limitations to your results even if you have a high participation rate. For instance, a particular group of students (say, the school orchestra) may have been away from school the day of the survey, and that could bias the results. It is important to acknowledge the potential limitations when using the results in this report. For reports summarizing results at the county or School District level, you should also consider whether the schools that participated represent all students in that area.

Healthy Youth Survey 2021 Survey Results For help interpreting your results, please see information starting on page 2 Page 3
ƒƒƒƒƒƒƒƒƒƒƒƒƒƒƒƒƒƒƒƒƒƒƒƒƒƒƒƒƒƒƒƒƒƒƒƒƒƒƒƒƒƒƒƒƒƒƒƒƒƒƒƒƒƒƒƒƒƒ
Pierce County Grade 10
ƒƒƒƒƒƒƒƒƒƒƒƒƒƒƒƒƒƒƒƒƒƒƒƒƒƒƒƒƒƒƒƒƒƒƒƒƒƒƒƒƒƒƒƒƒƒƒƒƒƒƒƒƒƒƒƒƒƒ
Comparing ResultsThis report includes a new feature that shows if the local results are different from the statewide results. If local results are significantly different from the state (the confidence intervals do not overlap), there will be an “*” between the two results to note the difference.
In the example below, lifetime marijuana use is significantly lower for local students (9%) compared to students statewide (16%).
Special Considerations for HYS 2021 and the COVID-19 PandemicThe COVID-19 pandemic led to several important changes in the usual HYS process and structure that may have an impact on the results. Due to the unexpected shift to primarily remote learning, the HYS was not administered in fall 2020 as it was originally intended. Instead, the HYS Planning Committee determined it would be best to delay the survey to fall 2021. This ensured a process could be created for students who needed to take the survey remotely and it allowed the Planning Committee to add a small number of COVID-19-related questions to support future preparedness and response in schools and communities. In addition, the decision was made to expand e-survey/online survey administration across the state. All of this led to a number of factors that may or may not have had an impact on the results:
1) Delaying the survey by a year means a change in the cohort of students being surveyed. HYS has historically been offered in Fall of even years to students in grades 6, 8, 10 and 12, So, roughly the same cohort of students were ultimately being surveyed every two years as they advanced.
2) The Planning Committee chose to halt plans for a more extensive evaluation of the e-survey mode compared to paper that was scheduled for HYS 2020. Instead, the shift to an e-survey mode without the in-depth comparison makes it more difficult to determine whether the survey mode (paper vs e-survey) has an effect on how students answer questions. Only a very small number of schools elected to do the survey on paper in 2021.
3) Schools were allowed to administer the e-survey remotely in Fall 2021 to accommodate students who may be doing hybrid or fully distanced learning. The vast majority of students took the survey in-person at school,though a small number did take the survey remotely. The potential impact of having students complete the survey remotely is still being assessed.
4) Finally, the pandemic itself has led to massive changes in the lives of Washington youth. Increases and decreases in HYS 2021 data may be more a reflection of the pandemic and its affect on our lives than a change that would have happened if the pandemic had not occurred. This means that trend data from before the pandemic and during/after the pandemic should be interpreted with tremendous caution.For example, a large decrease in one particular risk behavior on school property may be explained by a new school education campaign or program or it may be explained by the fact that students are doing more remote learning.

Healthy Youth Survey 2021 Survey Results For help interpreting your results, please see information starting on page 2 Page 4
ƒƒƒƒƒƒƒƒƒƒƒƒƒƒƒƒƒƒƒƒƒƒƒƒƒƒƒƒƒƒƒƒƒƒƒƒƒƒƒƒƒƒƒƒƒƒƒƒƒƒƒƒƒƒƒƒƒƒ
Pierce County Grade 10
ƒƒƒƒƒƒƒƒƒƒƒƒƒƒƒƒƒƒƒƒƒƒƒƒƒƒƒƒƒƒƒƒƒƒƒƒƒƒƒƒƒƒƒƒƒƒƒƒƒƒƒƒƒƒƒƒƒƒ
Small Numbers: Caution about Number of Students ParticipatingResults based on small numbers of students answering a question are unstable---that is, they could easily change with the absence from school of only a couple of students. This is especially the case when only a few students choose a particular answer option. Also, in this situation, the reported 95% confidence interval might be too narrow.Thus, use caution if fewer than 30 students answered a question and fewer than 5 students selected a given response option.
For example, if 20 students answered a question and of those 20 only 3 students answered “Yes”, the estimate is unreliable.
See the Understanding Your Report section later in this report for a discussion of “confidence intervals” to help guide your interpretation of the results.
Key to the NotesThree versions of the survey were used in the administration of the 2021 HYS. Forms A and B were given to secondary students grades 8, 10, and 12 (and in grades 9 and 11 in some small school districts). Eight questions on sexual orientation, gender identity, sexual behavior, and sexual abuse were asked at the discretion of the school; schools that did not administer the sexual orientation and gender identity questions were required to seek an exemption from the HYS Planning Committee. Form C was given to elementary students in grade 6 (and in grade 7 in some small school districts).
A list of the topics asked and their location in the report are provided in the Questions by Topic section at the end of this report. "Core" questions are asked on both Forms A and B. A list of Core Questions is also found at the end of this report.
The following notes are used throughout this report to document the differences between the questions on different versions and indicate the removable questions on potentially sensitive topics that schools could choose not to administer:
A = wording on Form A; B = wording on Form B; C = wording on Form C† = removable questions
Legal requirements: Federal and Washington state regulations prohibit discrimination against LEP individuals who are Deaf, DeafBlind, Hard of Hearing, or visually impaired. Read HCA Policy 01-27 "Language Access Services" and Policy 01-30 "Equal Access to Services for Individuals with Disabilities" for more information. If you have a question about an accommodation, please contact the Healthy Youth Survey study Principal Investigator, at [email protected] or call toll free (877-HYS-7111).

Healthy Youth Survey 2021 Survey Results For help interpreting your results, please see information starting on page 2 Page 5
ƒƒƒƒƒƒƒƒƒƒƒƒƒƒƒƒƒƒƒƒƒƒƒƒƒƒƒƒƒƒƒƒƒƒƒƒƒƒƒƒƒƒƒƒƒƒƒƒƒƒƒƒƒƒƒƒƒƒ
Pierce County Grade 10
ƒƒƒƒƒƒƒƒƒƒƒƒƒƒƒƒƒƒƒƒƒƒƒƒƒƒƒƒƒƒƒƒƒƒƒƒƒƒƒƒƒƒƒƒƒƒƒƒƒƒƒƒƒƒƒƒƒƒ
Understanding Your Results
N's
In this report “n” is shorthand for “number”---the number of students who took this survey or who answered a survey question. N’s are important! We also report the point estimates (%), and the 95% confidence intervals (CI).
Here is an example of how results are displayed in the report tables and charts.
How many students took this survey?
Look on page 2, under Survey Participation. The “number of students surveyed” is the number of surveys that we received. We have careful procedures for “cleaning” to remove surveys with many inconsistent or false answers – the “clean” surveys are the “number of valid surveys”. Only valid surveys are presented in this report.
How many students answered each survey question?
The n’s for each question vary. Why? There are several reasons:
• There are two versions of the grades 8, 10, and 12 survey – Form A and B. Core questions are on all versions, so the n’s for those questions are about the same as the number of valid surveys. For non-Core questions the n’s will be about half, or less.
• Some schools chose to administer the questions about sexual orientation, gender identity, sexual behavior, and sexual abuse. Schools that chose to not ask those additional questions will have no responses for those questions. [District and county reports may include some schools that DID ask those questions and some that DID NOT.]
• Not all students finish the survey, so questions near the end have smaller n’s. [NOTE: the order of the questions in the report is not the same as on the survey itself.] Also, some students may decide to skip certain questions.
Here are examples from a district with 400 valid surveys --- notice how the n’s change with each question type.

Healthy Youth Survey 2021 Survey Results For help interpreting your results, please see information starting on page 2 Page 6
ƒƒƒƒƒƒƒƒƒƒƒƒƒƒƒƒƒƒƒƒƒƒƒƒƒƒƒƒƒƒƒƒƒƒƒƒƒƒƒƒƒƒƒƒƒƒƒƒƒƒƒƒƒƒƒƒƒƒ
Pierce County Grade 10
ƒƒƒƒƒƒƒƒƒƒƒƒƒƒƒƒƒƒƒƒƒƒƒƒƒƒƒƒƒƒƒƒƒƒƒƒƒƒƒƒƒƒƒƒƒƒƒƒƒƒƒƒƒƒƒƒƒƒ
How many students are we talking about?
N’s are only provided for the total number of students who answered a question, not the individual answer options. Some people find it useful to translate their point estimates (%) into the number of students.
For example, in a district if 10% of students reported that “Yes” they used inhalants in their lifetime and 200 students answered the questions, then 20 students in the district used inhalants (20 X 0.10).
Confidence IntervalsIt is unlikely that the point estimate (%) reported for each question is exactly the same as the “true” value for all your students. This report includes 95% confidence intervals (CI) to describe this uncertainty. If there is no bias in the data, then there is a 95% chance that the CI will include the true value. So for example, if the point estimate and CI are 51.5% (±1.5%),then there is a 95% chance that the true percentage is between 50.0% and 53.0%.
The size of your CIs depend in part on the n for each question – as more students answer a question, your point estimate is likely to be closer to the “true” value. If the group of students you’re looking at is small, then your CIs will be large. The confidence interval does not take into account the participation rate – in other words, a low participation rate can create bias which will not be reflected in the CI.
How can you “use” confidence intervals?
CIs help you to decide if the differences between your students and the state are statistically significant.
For an example, let’s say your students report 25% ±5%. That means that the CI is between 20% and 30% Here is the math:25% -5% = 20%, and 25% +5% = 30%
Using CIs, you can decide if the difference between your students and the state results are statistically significant:
1. A significant difference:
• Your students report 25% ±5%, so the point estimate is 25% and the CI is 20% to 30% • Students statewide report 36% ±3%, so the point estimate is 36% and the CI is 33% to 39% • The CIs don’t overlap, so the difference is significant
2. Not a significant difference:
• Your students report 25% ±5%, so the point estimate is 25% and the CI is 20% to 30% • Statewide students report 28% ±3%, so the point estimate is 28% and the CI is 25% to 31% • The CI for your students overlaps the point estimate for students statewide, so the difference is not significant
3. Not sure if there is a difference:
• Your students report 25% ±5%, so the point estimate is 25% and the CI is 20% to 30% • Statewide students report 32% ±3%, so the point estimate is 32% and the CI is 29% to 35% • The CIs overlap, but don’t include the other point estimates, so you don’t know for sure if they are really different
without using the significance testing tool described in the next paragraph
More information about interpreting CIs is available on the HYS Training web page at www.AskHYS.net/Training. The Training web page includes past HYS training materials and a “Tool for Determining HYS Statistical Significance”. Use the “tool” to find out if your results are significantly different.

Healthy Youth Survey 2021 Survey Results For help interpreting your results, please see information starting on page 2 Page 7
ƒƒƒƒƒƒƒƒƒƒƒƒƒƒƒƒƒƒƒƒƒƒƒƒƒƒƒƒƒƒƒƒƒƒƒƒƒƒƒƒƒƒƒƒƒƒƒƒƒƒƒƒƒƒƒƒƒƒ
Pierce County Grade 10
ƒƒƒƒƒƒƒƒƒƒƒƒƒƒƒƒƒƒƒƒƒƒƒƒƒƒƒƒƒƒƒƒƒƒƒƒƒƒƒƒƒƒƒƒƒƒƒƒƒƒƒƒƒƒƒƒƒƒ
Highlights of the Local Results
Your students and students statewide reported the following behaviors and attitudes:
Substance Use Your Students
% ( ± CI) Statewide
% ( ± CI)
Smoked cigarettes in past 30 days 1.5% (±0.9) 1.9% (±0.4)
Drank alcohol in past 30 days 7.3% (±1.6) 8.4% (±1.6)
Used marijuana or hashish in past 30 days 7.4% (±1.9) 7.2% (±1.2)
Binge drinking in past 2 weeks 5.0% (±0.8) 5.5% (±1.1)
Your Students Statewide
% o
f Stu
dent
s
0%
20%
40%
60%
80%
100%
Smoked cigarettesin past 30 days
Drank alcoholin past 30 days
Used marijuana orhashish in past 30 days
Binge drinkingin past 2 weeks
1% 2% 7% 8% 7% 7% 5% 6%
Bullying and School Climate Your Students
% ( ± CI) Statewide
% ( ± CI)
Carried a weapon at school in the past 30 days 1.5% (±0.6) 2.2% (±0.4)
Bullied in the past 30 days 13.3% (±1.4) 13.3% (±1.4)
Enjoyed being at school over the past year 24.3% (±3.3) 27.0% (±1.6)
Felt safe at school 81.8% (±4.7) 83.0% (±2.1)
Your Students Statewide
% o
f Stu
dent
s
0%
20%
40%
60%
80%
100%
Carried a weaponat school
in the past 30 days
Bullied in thepast 30 days
Enjoyed beingat school
over the past year
Felt safe at school
13% 13%
1% 2%
24% 27%
82% 83%
For more information on specific HYS topics, see the Fact Sheets at www.AskHYS.net, under HYS Results – Fact Sheets

Healthy Youth Survey 2021 Survey Results For help interpreting your results, please see information starting on page 2 Page 8
ƒƒƒƒƒƒƒƒƒƒƒƒƒƒƒƒƒƒƒƒƒƒƒƒƒƒƒƒƒƒƒƒƒƒƒƒƒƒƒƒƒƒƒƒƒƒƒƒƒƒƒƒƒƒƒƒƒƒ
Pierce County Grade 10
ƒƒƒƒƒƒƒƒƒƒƒƒƒƒƒƒƒƒƒƒƒƒƒƒƒƒƒƒƒƒƒƒƒƒƒƒƒƒƒƒƒƒƒƒƒƒƒƒƒƒƒƒƒƒƒƒƒƒ
Selected Results by SexSelected survey questions are presented by sex to highlight any differences between females and males.
The p-values reported after each question, calculated from a chi-square test, can be used to examine whether differences between females and males are statistically significant.
A p-value of less than 0.05 means there is a significant difference between females and males (that is, if there really is no difference between females and males, the probability of observing a difference at least this large is less than 5%).
To ensure student anonymity, we do not report results by sex for any question unless a minimum of students answer each response option. These results are “suppressed”.
For your student results by sex, a minimum of 10 students need to answer each response option:
For example, to report smoking cigarettes in the past 30 days for your students by sex – surveys are needed for at least 10 females who smoke, 10 females who don’t smoke, 10 males who smoke, and 10 males who don’t smoke.
For state results by sex, a minimum of 5 students need to answer each response option.
Results that are suppressed are marked with asterisks “*”. Many small counties, districts and schools may not have enough students to report results by sex for all or some questions.
Your Students Statewide
Female % Male % p-value Female % Male % p-value
Smoked cigarettes in past 30 days(n=2,325) (n=8,305)
2.0% 0.9% 0.0257 2.3% 1.6% 0.0136
Drank alcohol in past 30 days(n=2,321) (n=8,306)
8.9% 5.5% 0.0015 9.7% 7.0% <.0001
Used marijuana or hashish in past 30 days(n=2,323) (n=8,312)
8.8% 5.9% 0.0063 7.9% 6.4% 0.0078
Binge drinking in past 2 weeks(n=2,333) (n=8,389)
5.9% 3.9% 0.0234 6.0% 4.9% 0.0340
Carried a weapon at school in the past 30 days(n=2,337) (n=8,368)
1.6% 1.4% 0.7414 2.0% 2.3% 0.2329
Bullied in the past 30 days(n=2,341) (n=8,401)
15.6% 10.9% 0.0008 16.3% 10.1% <.0001
Enjoyed being at school over the past year(n=2,353) (n=8,403)
23.0% 25.7% 0.1335 24.3% 30.1% <.0001
Felt safe at school(n=2,329) (n=8,346)
78.4% 85.4% <.0001 80.3% 86.0% <.0001

Healthy Youth Survey 2021 Survey Results For help interpreting your results, please see information starting on page 2 Page 9
ƒƒƒƒƒƒƒƒƒƒƒƒƒƒƒƒƒƒƒƒƒƒƒƒƒƒƒƒƒƒƒƒƒƒƒƒƒƒƒƒƒƒƒƒƒƒƒƒƒƒƒƒƒƒƒƒƒƒ
Pierce County Grade 10
ƒƒƒƒƒƒƒƒƒƒƒƒƒƒƒƒƒƒƒƒƒƒƒƒƒƒƒƒƒƒƒƒƒƒƒƒƒƒƒƒƒƒƒƒƒƒƒƒƒƒƒƒƒƒƒƒƒƒ
Frequency Results
Demographics and General Information
1. Where are you taking this survey?
Your Students
% ( ± CI) (n=2,666)
Statewide
% ( ± CI) (n=9,377)
a. On school property 96.3% (±5.5) 99.1% (±0.4)
b. Not on school property 3.7% (±5.5) 0.9% (±0.4)
2. How old are you? (n=2,653) (n=9,336)
a. 12 or younger 0.0% (±0.0) 0.0% (±0.0)
b. 13 0.1% (±0.1) 0.0% (±0.0)
c. 14 0.9% (±0.6) 0.8% (±0.2)
d. 15 77.0% (±2.2) 77.2% (±1.2)
e. 16 21.3% (±2.1) 21.4% (±1.2)
f. 17 0.6% (±0.4) 0.5% (±0.2)
g. 18 0.1% (±0.1) 0.0% (±0.0)
h. 19 or older 0.1% (±0.1) 0.0% (±0.0) [Question 3 appears only on the elementary version of the survey.]
4. What sex/gender were you at birth, even if you are not that gender today? (n=2,621) (n=9,091)
a. Female 51.2% (±2.9) 50.6% (±1.0)
b. Male 48.8% (±2.9) 49.4% (±1.0)
5. How do you currently identify yourself? Choose all that apply. (n=2,589) (n=8,658)
a. Male 46.6% (±3.1) 47.2% (±1.1)
b. Female 42.4% (±1.9) 42.2% (±1.1)
c. Transgender 0.6% (±0.3) 0.6% (±0.2)
d. Questioning/not sure of my gender identity 1.7% (±0.7) 1.9% (±0.4)
e. Something else fits better 2.3% (±0.8) 2.0% (±0.4)
f. I do not know what this question is asking 0.3% (±0.2) 0.4% (±0.2)
More than one response selected 6.1% (±1.8) 5.6% (±0.7)
Some students may select multiple answers to this question so that their response is consistent with how they identify. For example, a student who identifies as a transgender woman may select both female and transgender.This type response is represented in the ‘selected multiple responses’ category.
6. Which of the following best describes you? (n=2,551) (n=8,548)
a. Heterosexual (straight) 68.5% (±5.4) 70.0% (±2.2)
b. Gay or lesbian 4.1% (±1.5) 3.7% (±0.5)
c. Bisexual 13.9% (±2.3) 12.9% (±1.2)
d. Questioning/not sure 4.7% (±1.3) 5.6% (±0.7)
e. Something else fits better 6.0% (±1.6) 5.1% (±0.7)
f. I don't know what this question is asking 2.8% (±0.9) 2.7% (±0.6)

Healthy Youth Survey 2021 Survey Results For help interpreting your results, please see information starting on page 2 Page 10
ƒƒƒƒƒƒƒƒƒƒƒƒƒƒƒƒƒƒƒƒƒƒƒƒƒƒƒƒƒƒƒƒƒƒƒƒƒƒƒƒƒƒƒƒƒƒƒƒƒƒƒƒƒƒƒƒƒƒ
Pierce County Grade 10
ƒƒƒƒƒƒƒƒƒƒƒƒƒƒƒƒƒƒƒƒƒƒƒƒƒƒƒƒƒƒƒƒƒƒƒƒƒƒƒƒƒƒƒƒƒƒƒƒƒƒƒƒƒƒƒƒƒƒ
The next two tables display data on race and ethnicity of participating students. There are different ways to look at these data. Table 7 shows mutually exclusive categories. This means that every student is counted only one time. If a student indicated more than one race or ethnicity, they are included in the bottom row (more than one race/ethnicity marked). Table 7 has been reported in prior HYS reports. Table 8 is new this year and shows the data in non-mutually exclusive categories. This means that each student is counted for every race or ethnicity they indicated. Each category displays the number of youth who indicated they are of that particular race or ethnicity, either alone or in combination with another. Because these are not mutually exclusive categories the total will be more than 100%. The HYS continues to evolve, as do our reporting practices, to focus more on highlighting student identity and limiting erasure of students with multiple identities.
7. How do you describe yourself? Choose all that apply. These are mutually exclusive categories. Those who selected more than one are captured in the bottom row of the table.
Your Students
% ( ± CI) (n=2,616)
Statewide
% ( ± CI) (n=9,083)
a. American Indian or Alaskan Native 1.3% (±0.5) 1.3% (±0.4)
b. Asian or Asian American 7.2% (±3.3) 9.8% (±4.7)
c. Black or African-American 7.9% (±3.4) 3.6% (±1.2)
d. Hispanic or Latino/Latina 14.6% (±5.8) 17.1% (±7.4)
e. Native Hawaiian or other Pacific Islander 2.2% (±1.3) 1.0% (±0.4)
f. White or Caucasian 41.4% ±12.0) 48.4% (±6.8)
g. Other 3.1% (±0.9) 2.8% (±0.4)
More than one race/ethnicity marked 22.1% (±3.3) * 15.9% (±1.8)
8. How do you describe yourself? These are not mutually exclusive categories. Each row shows the number of students who indicate that race/ethnicity alone or in combination with other race/ethnicities.
(n=2,616)
(n=9,082)
American Indian or Alaskan Native AOIC* 6.0% (±1.4) 4.5% (±0.9)
Asian or Asian American AOIC* 14.0% (±4.2) 14.6% (±5.0)
Black or African-American AOIC* 16.3% (±5.1) * 7.3% (±2.0)
Hispanic or Latino/Latina AOIC* 23.2% (±5.7) 23.5% (±7.9)
Native Hawaiian or other Pacific Islander AOIC* 6.0% (±2.5) 3.3% (±1.0)
White or Caucasian AOIC* 57.1% ±12.1) 60.6% (±7.3)
Other AOIC* 6.3% (±1.3) 5.8% (±0.7)
*AOIC = Alone or in combination with other race/ethnicities.
9. If you are of Asian or Pacific Islander background, which groups best describe you? Choose all that apply.
(n=1,943)
(n=6,847)
a. Not Asian or Pacific Islander 74.6% (±5.8) 76.7% (±5.8)
b. Asian Indian 0.4% (±0.3) 3.5% (±3.3)
c. Cambodian/Khmer 1.6% (±1.2) 0.4% (±0.3)
d. Chinese 1.0% (±0.5) 2.6% (±1.4)
e. Filipino 4.1% (±1.1) 3.5% (±1.2)
f. Japanese 2.1% (±0.7) 1.4% (±0.3)
g. Korean 2.5% (±1.5) 1.8% (±0.8)
h. Vietnamese 2.1% (±2.0) 2.0% (±1.5)
i. Other Asian 1.6% (±0.6) 2.0% (±0.5)
j. Native Hawaiian or other Pacific Islander 5.4% (±2.6) 2.7% (±0.9)
Mutliracial Asian, more than one response indicated 2.4% (±1.2) 2.3% (±0.8)
Mutliracial Asian and Pacific Islander, more than one response indicated 2.4% (±0.7) * 1.0% (±0.4)

Healthy Youth Survey 2021 Survey Results For help interpreting your results, please see information starting on page 2 Page 11
ƒƒƒƒƒƒƒƒƒƒƒƒƒƒƒƒƒƒƒƒƒƒƒƒƒƒƒƒƒƒƒƒƒƒƒƒƒƒƒƒƒƒƒƒƒƒƒƒƒƒƒƒƒƒƒƒƒƒ
Pierce County Grade 10
ƒƒƒƒƒƒƒƒƒƒƒƒƒƒƒƒƒƒƒƒƒƒƒƒƒƒƒƒƒƒƒƒƒƒƒƒƒƒƒƒƒƒƒƒƒƒƒƒƒƒƒƒƒƒƒƒƒƒ
10. What language is usually spoken at home?
Your Students
% ( ± CI) (n=2,622)
Statewide
% ( ± CI) (n=9,093)
a. English 82.2% (±6.5) 79.7% (±5.3)
b. Spanish 11.7% (±5.3) 12.4% (±5.4)
c. Russian 0.8% (±0.5) 0.9% (±0.3)
d. Ukrainian 0.2% (±0.2) 0.2% (±0.1)
e. Vietnamese 1.1% (±1.2) 0.8% (±0.8)
f. Chinese 0.1% (±0.1) 0.9% (±0.6)
g. Korean 0.6% (±0.8) 0.5% (±0.4)
h. Japanese 0.2% (±0.2) 0.2% (±0.1)
i. Other 3.2% (±1.2) 4.5% (±1.8) [Question 11 appears only on the elementary version of the survey.]
12. How far did your mother get in school? (n=2,343) (n=8,455)
a. Did not finish high school 10.5% (±3.4) 9.5% (±3.1)
b. Graduated from high school or GED 20.4% (±3.9) 16.8% (±3.1)
c. Had some college or technical training after high school 17.8% (±1.5) 15.2% (±1.5)
d. Graduated from a 4-year college 20.2% (±5.9) 24.9% (±4.8)
e. Earned an advanced graduate degree 10.2% (±4.4) 14.8% (±3.9)
f. Don't know 19.3% (±4.3) 16.7% (±2.4)
g. Does not apply 1.5% (±0.5) 2.0% (±0.5)
13. Who did you live with most of the time in the last 30 days? (n=2,377) (n=8,506)
a. Parent(s), step-parent(s), or legal guardian 95.8% (±1.2) 95.8% (±0.8)
b. Relatives like a grandparent, an aunt, an older brother - but NOT your parents 2.7% (±0.9) 2.3% (±0.5)
c. Foster care parent(s) 0.4% (±0.3) 0.4% (±0.1)
d. Adults who are not your parents, relatives, or foster parents 0.3% (±0.1) 0.3% (±0.1)
e. Friends of yours with no adults present 0.0% (±0.0) 0.2% (±0.1)
f. On your own 0.3% (±0.2) 0.3% (±0.1)
g. Other 0.5% (±0.3) 0.8% (±0.2)
14. Where did you live most of the time in the last 30 days? (n=2,374) (n=8,509)
a. In a own house or apartment that my family rents or owns 95.2% (±1.1) 95.3% (±0.8)
b. In a house or apartment that a relative rents or owns 3.0% (±0.7) 2.7% (±0.4)
c. In a house or apartment with someone who is not a relative 0.5% (±0.3) 0.5% (±0.1)
d. In a shelter 0.1% (±0.1) 0.1% (±0.1)
e. In a car or RV, park, or campground 0.1% (±0.2) 0.3% (±0.2)
f. In a motel/hotel 0.0% (±0.1) 0.1% (±0.1)
g. On the street 0.1% (±0.1) 0.1% (±0.1)
h. Moved from place to place 0.3% (±0.2) 0.2% (±0.1)
i. Other 0.7% (±0.3) 0.8% (±0.3)

Healthy Youth Survey 2021 Survey Results For help interpreting your results, please see information starting on page 2 Page 12
ƒƒƒƒƒƒƒƒƒƒƒƒƒƒƒƒƒƒƒƒƒƒƒƒƒƒƒƒƒƒƒƒƒƒƒƒƒƒƒƒƒƒƒƒƒƒƒƒƒƒƒƒƒƒƒƒƒƒ
Pierce County Grade 10
ƒƒƒƒƒƒƒƒƒƒƒƒƒƒƒƒƒƒƒƒƒƒƒƒƒƒƒƒƒƒƒƒƒƒƒƒƒƒƒƒƒƒƒƒƒƒƒƒƒƒƒƒƒƒƒƒƒƒ
15. Are your current living arrangements the result of losing your home because your family cannot afford housing?
Your Students
% ( ± CI) (n=2,369)
Statewide
% ( ± CI) (n=8,470)
a. No 90.2% (±2.8) 91.3% (±1.3)
b. Yes 2.9% (±0.6) 2.5% (±0.4)
c. Not sure 6.9% (±2.4) 6.2% (±1.1)
16. Do you receive free or reduced price lunches at school? (n=1,234) (n=4,350)
a. No 36.1% (±9.7) 41.7% (±6.1)
b. Yes 46.0% (±6.4) 42.4% (±5.0)
c. Not sure 17.8% (±4.0) 15.9% (±1.6)
17. Has your parent(s) or guardian(s) served in the military (Army, Navy, Air Force, Marines, Coast Guard, National Guard, or Reserves)?
(n=1,225)
(n=4,361)
a. No 68.0% (±3.3) 74.0% (±5.5)
b. Yes 26.9% (±2.9) 21.7% (±5.6)
c. Not sure 5.1% (±1.7) 4.3% (±0.9)
18. Have you or your family moved in the past 3 years to another school district or city for temporary or seasonal work in agriculture, dairy, or fishing?
(n=2,617)
(n=9,101)
a. No 84.9% (±3.5) 88.0% (±1.6)
b. Yes 9.7% (±2.1) 7.6% (±1.1)
c. I do not know. 5.4% (±2.1) 4.4% (±0.8)
19. During the past 30 days, on how many days have you been absent from school for any reason? Include any day that you missed at least half of the school day.
(n=2,347)
(n=8,470)
a. 0 days 38.4% (±8.0) 36.8% (±2.6)
b. 1 or 2 days 35.4% (±4.4) 35.8% (±1.4)
c. 3 or more days 26.2% (±4.7) 27.4% (±2.6)
20. During your last school year, how many times did you change schools for reasons other than moving up a grade?
(n=1,130)
(n=4,271)
a. I did not change schools 85.8% (±3.0) 88.4% (±1.5)
b. Once 11.6% (±2.5) 9.5% (±1.4)
c. Twice 1.4% (±0.6) 1.4% (±0.4)
d. Three or more times 1.2% (±0.5) 0.7% (±0.3)
21. How many hours per week are you currently working for pay, NOT counting chores around your home, yard work, or babysitting?
(n=1,231)
(n=4,424)
a. None, not currently working 87.1% (±2.1) 85.1% (±1.4)
b. 10 hours a week or less 7.8% (±1.8) 10.4% (±1.2)
c. 11-20 hours a week 3.7% (±0.8) 3.1% (±0.5)
d. 21-30 hours a week 0.8% (±0.6) 0.8% (±0.3)
e. 31-40 hours a week 0.2% (±0.3) 0.3% (±0.2)
f. More than 40 hours a week 0.4% (±0.4) 0.4% (±0.2)

Healthy Youth Survey 2021 Survey Results For help interpreting your results, please see information starting on page 2 Page 13
ƒƒƒƒƒƒƒƒƒƒƒƒƒƒƒƒƒƒƒƒƒƒƒƒƒƒƒƒƒƒƒƒƒƒƒƒƒƒƒƒƒƒƒƒƒƒƒƒƒƒƒƒƒƒƒƒƒƒ
Pierce County Grade 10
ƒƒƒƒƒƒƒƒƒƒƒƒƒƒƒƒƒƒƒƒƒƒƒƒƒƒƒƒƒƒƒƒƒƒƒƒƒƒƒƒƒƒƒƒƒƒƒƒƒƒƒƒƒƒƒƒƒƒ
22. How honest were you in filling out this survey?
Your Students
% ( ± CI) (n=2,168)
Statewide
% ( ± CI) (n=7,871)
a. I was very honest. 76.0% (±3.8) 76.1% (±1.1)
b. I was honest most of the time. 20.5% (±2.9) 20.7% (±0.9)
c. I was honest some of the time 3.6% (±1.2) 3.2% (±0.4)
d. I was honest once in a while. surveys pulled
e. I was not honest at all. surveys pulled
Alcohol, Tobacco and Other Drug UseAlcohol, tobacco, and other drug (ATOD) use has been a major concern in this country for many years. The consequences of ATOD use are well known. In the short term, ATOD use interferes with positive physical,emotional, and social development. In the long term, ATOD use is associated with delinquency and criminal activity, unintended injuries, and a variety of health complications including shorter life expectancy. Tobacco use is the world’s leading cause of preventable death, disease, and disability. This section provides information about lifetime ATOD use (which in part reflects experimental use), use in the past 30 days (i.e., current use), and other tobacco-, alcohol-, and drug-related issues.
Lifetime Use
Have you ever, even once in your life:
23. Smoked a cigarette, even just a puff? (Computed from question 236)
(n=1,115)
(n=4,239)
a. No 86.3% (±2.1) 87.0% (±2.1)
b. Yes 13.7% (±2.1) 13.0% (±2.1)
24. Used an electronic cigarette, also called e-cigs, JUUL, or vape pens? (Computed from question 53)
(n=1,215)
(n=4,344)
a. No 78.6% (±3.3) 81.5% (±2.5)
b. Yes 21.4% (±3.3) 18.5% (±2.5)
25. Drank more than a sip or two of beer, wine, or hard liquor? (Computed from question 25 or 237)
(n=2,331)
(n=8,412)
a. No 67.8% (±2.1) 68.4% (±2.8)
b. Yes 32.2% (±2.1) 31.6% (±2.8)
26. Used marijuana? (Computed from question 26 or 235) (n=2,340) (n=8,442)
a. No 82.7% (±3.0) 84.1% (±2.1)
b. Yes 17.3% (±3.0) 15.9% (±2.1)
27. Used heroin? Choose all that apply. (n=1,117) (n=4,250)
a. No, I’ve never used it 99.6% (±0.5) 99.6% (±0.2)
b. Yes, within the past year 0.3% (±0.4) 0.3% (±0.2)
c. Yes, over a year ago 0.3% (±0.3) 0.2% (±0.2)
28. Used methamphetamines (speed, meth, crystal meth, ice, crank)? Do not include other types of amphetamines. Choose all that apply.
(n=1,119)
(n=4,246)
a. No, I’ve never used it 99.3% (±0.5) 99.2% (±0.3)
b. Yes, within the past year 0.4% (±0.3) 0.5% (±0.2)
c. Yes, over a year ago 0.4% (±0.5) 0.4% (±0.2)

Healthy Youth Survey 2021 Survey Results For help interpreting your results, please see information starting on page 2 Page 14
ƒƒƒƒƒƒƒƒƒƒƒƒƒƒƒƒƒƒƒƒƒƒƒƒƒƒƒƒƒƒƒƒƒƒƒƒƒƒƒƒƒƒƒƒƒƒƒƒƒƒƒƒƒƒƒƒƒƒ
Pierce County Grade 10
ƒƒƒƒƒƒƒƒƒƒƒƒƒƒƒƒƒƒƒƒƒƒƒƒƒƒƒƒƒƒƒƒƒƒƒƒƒƒƒƒƒƒƒƒƒƒƒƒƒƒƒƒƒƒƒƒƒƒ [Question 29 appears only on the elementary version of the survey.]
30-Day Use (Use in the Past 30 Days)
During the past 30 days, on how many days did you:
30. Smoke cigarettes?
Your Students
% ( ± CI) (n=2,342)
Statewide
% ( ± CI) (n=8,402)
a. None 98.5% (±0.9) 98.1% (±0.4)
b. 1-2 days 0.8% (±0.6) 1.0% (±0.3)
c. 3-5 days 0.4% (±0.3) 0.3% (±0.1)
d. 6-9 days 0.0% (±0.0) 0.2% (±0.1)
e. 10-29 days 0.2% (±0.2) 0.2% (±0.1)
f. All 30 days 0.0% (±0.1) 0.2% (±0.1)
Any use in past 30 days 1.5% (±0.9) 1.9% (±0.4)
31. Use chewing tobacco, snuff, or dip? (n=1,208) (n=4,266)
a. None 99.5% (±0.5) 99.4% (±0.2)
b. 1-2 days 0.2% (±0.3) 0.2% (±0.1)
c. 3-5 days 0.2% (±0.2) 0.1% (±0.1)
d. 6-9 days 0.0% (±0.0) 0.1% (±0.1)
e. 10-29 days 0.0% (±0.0) 0.0% (±0.1)
f. All 30 days 0.1% (±0.2) 0.1% (±0.1)
Any use in past 30 days 0.5% (±0.5) 0.6% (±0.2)
32. Smoke cigars, cigarillos, or little cigars? (n=1,219) (n=4,332)
a. None 99.3% (±0.5) 98.9% (±0.4)
b. 1-2 days 0.4% (±0.3) 0.6% (±0.3)
c. 3-9 days 0.1% (±0.2) 0.3% (±0.2)
d. 10-29 days 0.2% (±0.3) 0.1% (±0.1)
e. All 30 days 0.0% (±0.0) 0.1% (±0.1)
Any use in past 30 days 0.7% (±0.5) 1.1% (±0.4)
33. Use an electronic cigarette, also called e-cigs, JUUL, or vape pens? (n=2,333) (n=8,407)
a. None 91.9% (±2.0) 92.4% (±1.3)
b. 1-2 days 3.2% (±1.0) 3.0% (±0.5)
c. 3-5 days 1.2% (±0.4) 1.1% (±0.3)
d. 6-9 days 1.2% (±0.5) 0.9% (±0.2)
e. 10-19 days 0.6% (±0.3) 1.0% (±0.3)
f. 20-29 days 0.6% (±0.2) 0.6% (±0.2)
g. All 30 days 1.5% (±0.7) 1.1% (±0.3)
Any use in past 30 days 8.1% (±2.0) 7.6% (±1.3)

Healthy Youth Survey 2021 Survey Results For help interpreting your results, please see information starting on page 2 Page 15
ƒƒƒƒƒƒƒƒƒƒƒƒƒƒƒƒƒƒƒƒƒƒƒƒƒƒƒƒƒƒƒƒƒƒƒƒƒƒƒƒƒƒƒƒƒƒƒƒƒƒƒƒƒƒƒƒƒƒ
Pierce County Grade 10
ƒƒƒƒƒƒƒƒƒƒƒƒƒƒƒƒƒƒƒƒƒƒƒƒƒƒƒƒƒƒƒƒƒƒƒƒƒƒƒƒƒƒƒƒƒƒƒƒƒƒƒƒƒƒƒƒƒƒ
34. Smoke tobacco or flavored tobacco in a hookah, even just a puff?
Your Students
% ( ± CI) (n=1,216)
Statewide
% ( ± CI) (n=4,320)
a. None 97.0% (±1.4) 97.7% (±0.5)
b. 1-2 days 1.9% (±1.0) 1.3% (±0.4)
c. 3-9 days 0.3% (±0.3) 0.5% (±0.2)
d. 10-29 days 0.4% (±0.4) 0.3% (±0.1)
e. All 30 days 0.3% (±0.3) 0.2% (±0.2)
Any use in past 30 days 3.0% (±1.4) 2.3% (±0.5)
35. During the past 30 days,did you use a heated tobacco product? (Heated tobacco products are different from e-cigarettes, which heat a liquid to produce vapor. Some brands of heated tobacco products include iQOS, glo and Eclipse.)
(n=1,221)
(n=4,322)
a. Yes 4.9% (±1.4) 4.5% (±0.7)
b. No 77.3% (±4.3) 78.7% (±1.5)
c. I don't know what this is. 17.8% (±3.3) 16.8% (±1.4)
36. During the past 30 days, which of the following tobacco or marijuana products that you used were flavored to taste like menthol (mint), candy,fruit, or any other flavors? Choose all that apply.
(n=1,153)
(n=4,123)
a. I did not use any flavored tobacco or marijuana products in the past 30 days. 88.6% (±2.9) 90.2% (±1.5)
b. Cigars, little cigars, hookah, or other smoked tobacco 0.5% (±0.3) 0.4% (±0.2)
c. Chewing tobacco, dissolvables, snus or other smokeless tobacco 0.3% (±0.2) 0.3% (±0.2)
d. Joints, bongs, pipes, blunt, or other smoked marijuana products 4.2% (±1.5) 3.8% (±0.9)
e. I do not know. 6.7% (±1.4) 5.7% (±1.1)
During the past 30 days, on how many days did you:
37. Drink a glass, can or bottle of alcohol?
(n=2,338)
(n=8,407)
a. None 92.7% (±1.6) 91.6% (±1.6)
b. 1-2 days 5.3% (±1.3) 5.9% (±1.0)
c. 3-5 days 1.4% (±0.4) 1.5% (±0.5)
d. 6-9 days 0.3% (±0.3) 0.5% (±0.2)
e. 10 or more days 0.3% (±0.2) 0.5% (±0.2)
Any use in past 30 days 7.3% (±1.6) 8.4% (±1.6)
38. Use marijuana or hashish? (n=2,340) (n=8,414)
a. None 92.6% (±1.9) 92.8% (±1.2)
b. 1-2 days 2.9% (±0.8) 2.7% (±0.6)
c. 3-5 days 1.1% (±0.5) 1.3% (±0.3)
d. 6-9 days 0.8% (±0.5) 0.8% (±0.2)
e. 10-19 days 1.1% (±0.4) 0.9% (±0.3)
f. 20-29 days 0.6% (±0.3) 0.8% (±0.2)
g. All 30 days 0.9% (±0.4) 0.7% (±0.2)
Any use in past 30 days 7.4% (±1.9) 7.2% (±1.2)

Healthy Youth Survey 2021 Survey Results For help interpreting your results, please see information starting on page 2 Page 16
ƒƒƒƒƒƒƒƒƒƒƒƒƒƒƒƒƒƒƒƒƒƒƒƒƒƒƒƒƒƒƒƒƒƒƒƒƒƒƒƒƒƒƒƒƒƒƒƒƒƒƒƒƒƒƒƒƒƒ
Pierce County Grade 10
ƒƒƒƒƒƒƒƒƒƒƒƒƒƒƒƒƒƒƒƒƒƒƒƒƒƒƒƒƒƒƒƒƒƒƒƒƒƒƒƒƒƒƒƒƒƒƒƒƒƒƒƒƒƒƒƒƒƒ
39. Not counting alcohol, tobacco, or marijuana, use another illegal drug?
Your Students
% ( ± CI) (n=1,118)
Statewide
% ( ± CI) (n=4,224)
a. None 98.2% (±0.8) 98.9% (±0.4)
b. 1-2 days 1.0% (±0.7) 0.6% (±0.2)
c. 3-5 days 0.3% (±0.4) 0.2% (±0.1)
d. 6-9 days 0.4% (±0.3) 0.1% (±0.1)
e. 10 or more days 0.2% (±0.3) 0.2% (±0.1)
Any use in past 30 days 1.8% (±0.8) 1.1% (±0.4)
40. Use any illegal drug, including marijuana? (Computed from questions 38 and 39)
(n=1,114)
(n=4,208)
None 92.0% (±2.2) 92.2% (±1.4)
1 or more days 8.0% (±2.2) 7.8% (±1.4)
41. Use a pain killer TO GET HIGH, like Vicodin, OxyContin (sometimes called Oxy or OC) or Percocet (sometimes called Percs)?
(n=2,337)
(n=8,413)
a. None 98.8% (±0.3) 99.0% (±0.2)
b. 1-2 days 0.8% (±0.3) 0.6% (±0.2)
c. 3-5 days 0.1% (±0.1) 0.2% (±0.1)
d. 6-9 days 0.2% (±0.2) 0.1% (±0.1)
e. 10 or more days 0.1% (±0.1) 0.1% (±0.1)
Any use in past 30 days 1.2% (±0.3) 1.0% (±0.2)
42. Use prescription drugs not prescribed to you? (n=1,117) (n=4,231)
a. None 97.8% (±1.0) 98.5% (±0.3)
b. 1-2 days 1.4% (±0.8) 1.1% (±0.3)
c. 3-5 days 0.4% (±0.3) 0.3% (±0.2)
d. 6-9 days 0.4% (±0.4) 0.1% (±0.1)
e. 10 or more days 0.1% (±0.2) 0.0% (±0.0)
Any use in past 30 days 2.2% (±1.0) 1.5% (±0.3)
43. During the past 30 days, which of the following have you used for non-medical reasons? Choose all that apply.
(n=1,311)
(n=4,832)
a. I did not take any of these for non-medical reasons. 95.9% (±1.6) 96.0% (±0.8)
b. I used a stimulant, like Adderall or Ritalin. 0.3% (±0.3) 0.6% (±0.2)
c. I used a painkiller, like Vicodin, OxyContin, or Percocet. 1.1% (±0.6) 0.7% (±0.3)
d. I used a tranquilizer, like Valium or Xanax. 0.3% (±0.3) 0.2% (±0.2)
e. I used another kind of prescription drug. 0.9% (±0.6) 0.9% (±0.3)
f. I used an over-the-counter drug, like cough syrup or cold medicine. 2.8% (±1.1) 2.8% (±0.7)
g. I took something, but I don’t know what it was. 0.5% (±0.7) 0.7% (±0.2)
Other Tobacco-Related Questions
44. Are the cigarettes that you usually smoke menthol cigarettes? (n=1,214) (n=4,316)
a. I do not smoke cigarettes. 87.1% (±3.2) 87.9% (±1.4)
b. Yes 0.7% (±0.6) 0.8% (±0.3)
c. No 12.1% (±3.3) 11.3% (±1.3)

Healthy Youth Survey 2021 Survey Results For help interpreting your results, please see information starting on page 2 Page 17
ƒƒƒƒƒƒƒƒƒƒƒƒƒƒƒƒƒƒƒƒƒƒƒƒƒƒƒƒƒƒƒƒƒƒƒƒƒƒƒƒƒƒƒƒƒƒƒƒƒƒƒƒƒƒƒƒƒƒ
Pierce County Grade 10
ƒƒƒƒƒƒƒƒƒƒƒƒƒƒƒƒƒƒƒƒƒƒƒƒƒƒƒƒƒƒƒƒƒƒƒƒƒƒƒƒƒƒƒƒƒƒƒƒƒƒƒƒƒƒƒƒƒƒ
45. During the past 7 days, on how many days were you in the same room with someone who was smoking cigarettes?
Your Students
% ( ± CI) (n=1,235)
Statewide
% ( ± CI) (n=4,378)
a. 0 days 78.3% (±3.9) 82.2% (±2.4)
b. 1-2 days 13.4% (±2.6) 10.6% (±1.3)
c. 3-4 days 3.5% (±1.1) 2.8% (±0.6)
d. 5-6 days 1.5% (±0.5) 1.3% (±0.4)
e. 7 days 3.4% (±0.9) 3.0% (±0.7)
46. During the past 30 days, how did you usually get your own tobacco? Choose only one answer.
(n=1,213)
(n=4,288)
a. I did not use tobacco during the past 30 days 93.8% (±1.7) 94.9% (±0.9)
b. I bought it in a store such as a convenience store, supermarket, discount store or gas station
0.4% (±0.3)
0.5% (±0.2)
c. I bought it from a vending machine 0.1% (±0.2) 0.1% (±0.1)
d. I gave someone else money to buy them for me 0.8% (±0.5) 0.8% (±0.3)
e. I borrowed (or bummed) them from someone else 1.7% (±0.7) 1.5% (±0.4)
f. A person 18 years old or older gave them to me 0.7% (±0.6) 0.3% (±0.2)
g. I took them from a store or a family member 0.7% (±0.5) 0.2% (±0.1)
h. I got them some other way 1.7% (±0.8) 1.7% (±0.5)
47. How wrong do your friends feel it would be for you to: Use tobacco? (n=1,120) (n=4,237)
a. Very wrong 60.6% (±3.8) 60.8% (±2.6)
b. Wrong 24.9% (±3.2) 25.2% (±1.5)
c. A little bit wrong 10.1% (±2.4) 9.3% (±1.1)
d. Not at all wrong 4.4% (±1.4) 4.7% (±1.1)
48. If one of your best friends offered you a cigarette, would you smoke it? (n=1,239) (n=4,372)
a. Definitely no 80.1% (±2.8) 79.0% (±1.8)
b. Probably no 13.7% (±2.5) 15.0% (±1.4)
c. Probably yes 4.8% (±1.2) 4.6% (±0.8)
d. Definitely yes 1.4% (±0.8) 1.4% (±0.4)
49. Do you think that you will smoke a cigarette anytime in the next year? (n=1,233) (n=4,364)
a. Definitely no 80.1% (±2.9) 78.6% (±2.0)
b. Probably no 15.2% (±3.0) 16.6% (±1.2)
c. Probably yes 3.6% (±0.8) 3.7% (±1.0)
d. Definitely yes 1.0% (±0.5) 1.1% (±0.3)
50. Have made a firm commitment to not smoke cigarettes; i.e., not susceptible to smoking. (Computed from questions 48 and 49)
(n=1,233)
(n=4,360)
a. Yes, not susceptible 75.7% (±3.0) 74.7% (±2.0)
b. No, susceptible 24.3% (±3.0) 25.3% (±2.0)
51. During the past 12 months, did you ever try to quit using all products that contain nicotine, including cigarettes, e-cigarettes (e-cigs, vape pens,JUUL), cigars, smokeless tobacco, shisha and hookah tobacco?
(n=1,228)
(n=4,342)
a. I did not use any products that contain nicotine during the past 12 months. 84.0% (±3.4) 84.6% (±2.0)
b. Yes 7.3% (±1.7) 6.3% (±1.1)
c. No 8.6% (±2.2) 9.1% (±1.3)

Healthy Youth Survey 2021 Survey Results For help interpreting your results, please see information starting on page 2 Page 18
ƒƒƒƒƒƒƒƒƒƒƒƒƒƒƒƒƒƒƒƒƒƒƒƒƒƒƒƒƒƒƒƒƒƒƒƒƒƒƒƒƒƒƒƒƒƒƒƒƒƒƒƒƒƒƒƒƒƒ
Pierce County Grade 10
ƒƒƒƒƒƒƒƒƒƒƒƒƒƒƒƒƒƒƒƒƒƒƒƒƒƒƒƒƒƒƒƒƒƒƒƒƒƒƒƒƒƒƒƒƒƒƒƒƒƒƒƒƒƒƒƒƒƒ
52. How soon after you wake up do you want to use products with nicotine (cigarettes, JUUL, vapes, etc.)?
Your Students
% ( ± CI) (n=1,229)
Statewide
% ( ± CI) (n=4,354)
a. Within 5 minutes 1.6% (±0.8) 1.4% (±0.5)
b. From 6 to 30 minutes 0.7% (±0.5) 0.7% (±0.2)
c. From more than 30 minutes to 1 hour 0.8% (±0.4) 0.8% (±0.3)
d. After more than 1 hour but less than 24 hours. 1.6% (±0.6) 1.2% (±0.5)
e. I rarely use tobacco products or e-cigarettes. 6.4% (±1.6) 5.8% (±1.0)
f. I do not use tobacco products or e-cigarettes. 88.9% (±2.3) 90.1% (±1.6)
Other Electronic Cigarette- and Vaping-Related Questions
53. How old were you the first time you used an electronic cigarette, also called e-cigs, JUUL, or vape pens?
(n=1,215)
(n=4,344)
a. Never have 78.6% (±3.3) 81.5% (±2.5)
b. 10 or younger 0.4% (±0.3) 0.7% (±0.3)
c. 11 1.4% (±0.7) 1.2% (±0.3)
d. 12 3.5% (±1.0) 3.0% (±0.6)
e. 13 5.3% (±1.8) 5.0% (±0.9)
f. 14 6.7% (±1.6) 5.0% (±0.7)
g. 15 3.8% (±0.9) 3.2% (±0.6)
h. 16 0.2% (±0.3) 0.3% (±0.2)
i. 17 or older 0.1% (±0.2) 0.1% (±0.1)
54. During the past 30 days, which of the following e-cig or vaping products did you use? Choose all that apply.
(n=2,263)
(n=8,212)
a. I did not use any e-cig or vaping products in the past 30 days. 89.4% (±2.1) 90.3% (±1.4)
b. Liquid with nicotine in it 6.1% (±1.7) 5.1% (±1.0)
c. Liquid with THC (marijuana) in it 4.0% (±1.1) 3.7% (±0.7)
d. Liquid with nicotine and THC (marijuana) in it 1.5% (±0.4) 1.0% (±0.3)
e. Liquid with neither nicotine nor THC 0.4% (±0.3) 0.3% (±0.1)
f. Don’t know 3.1% (±1.0) 3.0% (±0.5)
55. During the past 30 days, which of the following e-cig or vaping products that you used were flavored? Choose all that apply.
(n=1,191)
(n=4,232)
a. I did not use any flavored e-cig or vaping products in the past 30 days 88.7% (±3.1) 89.3% (±1.7)
b. Flavored liquid with nicotine 6.3% (±2.4) 5.4% (±1.2)
c. Flavored liquid with THC (marijuana) 2.2% (±1.1) 2.4% (±0.6)
d. Flavored liquid with nicotine and THC (marijuana) 1.3% (±0.6) 0.7% (±0.3)
e. Flavored liquid with neither nicotine nor THC 0.2% (±0.2) 0.3% (±0.2)
f. Don’t know 3.9% (±0.9) 3.9% (±0.8)

Healthy Youth Survey 2021 Survey Results For help interpreting your results, please see information starting on page 2 Page 19
ƒƒƒƒƒƒƒƒƒƒƒƒƒƒƒƒƒƒƒƒƒƒƒƒƒƒƒƒƒƒƒƒƒƒƒƒƒƒƒƒƒƒƒƒƒƒƒƒƒƒƒƒƒƒƒƒƒƒ
Pierce County Grade 10
ƒƒƒƒƒƒƒƒƒƒƒƒƒƒƒƒƒƒƒƒƒƒƒƒƒƒƒƒƒƒƒƒƒƒƒƒƒƒƒƒƒƒƒƒƒƒƒƒƒƒƒƒƒƒƒƒƒƒ
56. During the past 30 days, how did you usually get your own get your own e-cig or vaping products? Choose only one answer.
Your Students
% ( ± CI) (n=1,208)
Statewide
% ( ± CI) (n=4,261)
a. I did not use electronic vapor products during the past 30 days. 90.4% (±2.6) 91.7% (±1.5)
b. I bought them in a store such as a convenience store, supermarket, discount store, or gas station.
0.4% (±0.4)
0.3% (±0.2)
c. I bought them in a vape shop. 0.1% (±0.2) 0.3% (±0.2)
d. I got them on the Internet. 0.2% (±0.2) 0.1% (±0.1)
e. I gave someone else money to buy them for me. 2.0% (±1.0) 1.6% (±0.4)
f. I borrowed (or bummed) them from someone else. 3.0% (±1.2) 2.9% (±0.7)
g. A person 18 years old or older gave them to me. 1.4% (±0.7) 0.6% (±0.2)
h. I took them from a store or family member. 0.4% (±0.4) 0.3% (±0.2)
i. I got them some other way. 2.2% (±0.8) 2.2% (±0.6)
57. How much do you think people risk harming themselves if they use electronic cigarettes, also called e-cigs, JUUL, or vape pens regularly (almost daily)?
(n=1,217)
(n=4,354)
a. No risk 6.7% (±1.4) 5.1% (±0.9)
b. Slight risk 8.7% (±2.1) 7.9% (±0.9)
c. Moderate risk 28.9% (±1.8) 27.0% (±1.3)
d. Great risk 44.7% (±5.5) 49.6% (±3.1)
e. Not sure 11.0% (±2.7) 10.3% (±1.7)
Other Alcohol-Related Questions
58. Think back over the last 2 weeks. How many times have you had five or more drinks in a row? (A drink is a glass of wine, a bottle of beer, a shot glass of liquor, or a mixed drink.)
(n=2,349)
(n=8,485)
a. None 95.0% (±0.8) 94.5% (±1.1)
b. Once 2.6% (±0.5) 2.8% (±0.6)
c. Twice 1.2% (±0.5) 1.3% (±0.3)
d. 3-5 times 0.6% (±0.3) 0.8% (±0.3)
e. 6-9 times 0.3% (±0.2) 0.3% (±0.1)
f. 10 or more times 0.3% (±0.1) 0.4% (±0.1)
59. Drinking Categories Variable (Computed from questions 37 and 58) (n=2,257) (n=8,192)
None, no drinking past 30 days and no binging past 2 weeks 90.8% (±1.5) 89.6% (±1.8)
Experimental, 1-2 days drinking past 30 days and no binging past 2 weeks 3.5% (±1.0) 3.8% (±0.7)
Heavy, 3-5 days drinking past 30 days and/or 1 binge past 2 weeks 3.0% (±0.5) 3.4% (±0.7)
Problem, 6+ days drinking past 30 days and/or 2+ binge past 2 weeks 2.7% (±0.8) 3.2% (±0.7)

Healthy Youth Survey 2021 Survey Results For help interpreting your results, please see information starting on page 2 Page 20
ƒƒƒƒƒƒƒƒƒƒƒƒƒƒƒƒƒƒƒƒƒƒƒƒƒƒƒƒƒƒƒƒƒƒƒƒƒƒƒƒƒƒƒƒƒƒƒƒƒƒƒƒƒƒƒƒƒƒ
Pierce County Grade 10
ƒƒƒƒƒƒƒƒƒƒƒƒƒƒƒƒƒƒƒƒƒƒƒƒƒƒƒƒƒƒƒƒƒƒƒƒƒƒƒƒƒƒƒƒƒƒƒƒƒƒƒƒƒƒƒƒƒƒ
60. During the past 30 days, if you used alcohol, what type of alcohol did you usually drink?
Your Students
% ( ± CI) (n=1,088)
Statewide
% ( ± CI) (n=4,166)
a. I did not drink alcohol during the past 30 days. 88.9% (±2.3) 88.2% (±1.8)
b. I do not have a usual type. 4.2% (±1.7) 4.2% (±0.6)
c. Beer 0.8% (±0.5) 1.2% (±0.3)
d. Flavored malt beverages, such as Smirnoff Ice, Bacardi Silver, or Hard Lemonade
1.3% (±0.7)
1.6% (±0.6)
e. Wine coolers, such as Bartles & Jaymes or Seagrams 0.2% (±0.2) 0.1% (±0.1)
f. Wine 0.8% (±0.5) 0.6% (±0.2)
g. Liquor, such as vodka, rum, scotch, bourbon or whiskey 3.0% (±0.9) 3.6% (±0.8)
h. Some other type 0.7% (±0.5) 0.7% (±0.3)
61. During the past 30 days, if you used alcohol, how did you get it? Choose all that apply.
(n=1,061)
(n=4,102)
a. I did not get alcohol in the past 30 days. 91.8% (±1.8) 90.9% (±1.6)
b. I bought it from a store. 0.4% (±0.5) 0.7% (±0.3)
c. I stole it from a store. 0.5% (±0.5) 0.5% (±0.4)
d. I got it from friends. 2.2% (±0.8) 3.2% (±1.2)
e. I got it at a party. 1.6% (±0.8) 2.3% (±0.8)
f. I got it from an older brother or sister. 1.3% (±0.5) 1.0% (±0.3)
g. I gave money to someone to get it for me. 0.7% (±0.4) 0.9% (±0.3)
h. I took it from home without my parents' permission. 1.5% (±1.0) 2.0% (±0.6)
i. I got it at home with my parents' permission. 2.6% (±0.7) 2.4% (±0.5)
j. I got it some other way. 1.5% (±0.6) 1.6% (±0.4)
62. NOT including talks on drinking and driving, in the past year have your parent(s) or guardian(s) talked to you about why you should not drink alcohol?
(n=1,131)
(n=4,275)
a. Yes, a number of times 41.1% (±3.7) 41.7% (±2.1)
b. Yes, once 18.6% (±1.7) 19.3% (±1.7)
c. No 26.9% (±2.6) 26.1% (±1.5)
d. I don't remember. 13.4% (±2.3) 12.9% (±1.3)
63. How wrong do your parent(s) feel it would be for you to: Have one or two drinks of an alcoholic beverage nearly every day?
(n=1,120)
(n=4,241)
a. Very wrong 83.6% (±2.3) 84.1% (±1.5)
b. Wrong 12.9% (±2.0) 12.9% (±1.2)
c. A little bit wrong 2.5% (±0.5) 2.2% (±0.4)
d. Not wrong at all 1.0% (±0.6) 0.8% (±0.3)
64. How wrong do your friends feel it would be for you to: Have one or two drinks of an alcoholic beverage nearly every day?
(n=1,124)
(n=4,244)
a. Very wrong 57.1% (±4.4) 57.0% (±3.0)
b. Wrong 25.7% (±3.7) 26.8% (±1.7)
c. A little bit wrong 11.9% (±1.7) 11.1% (±1.3)
d. Not at all wrong 5.2% (±1.5) 5.0% (±0.8)

Healthy Youth Survey 2021 Survey Results For help interpreting your results, please see information starting on page 2 Page 21
ƒƒƒƒƒƒƒƒƒƒƒƒƒƒƒƒƒƒƒƒƒƒƒƒƒƒƒƒƒƒƒƒƒƒƒƒƒƒƒƒƒƒƒƒƒƒƒƒƒƒƒƒƒƒƒƒƒƒ
Pierce County Grade 10
ƒƒƒƒƒƒƒƒƒƒƒƒƒƒƒƒƒƒƒƒƒƒƒƒƒƒƒƒƒƒƒƒƒƒƒƒƒƒƒƒƒƒƒƒƒƒƒƒƒƒƒƒƒƒƒƒƒƒ
65. How much do you think people risk harming themselves if they: Have 5 or more drinks of an alcoholic beverage once or twice a week?
Your Students
% ( ± CI) (n=1,113)
Statewide
% ( ± CI) (n=4,228)
a. No risk 2.9% (±0.8) 3.2% (±0.7)
b. Slight risk 7.1% (±1.3) 7.8% (±1.1)
c. Moderate risk 28.4% (±2.7) 27.7% (±1.8)
d. Great risk 54.8% (±2.8) 55.6% (±2.6)
e. Not sure 6.8% (±1.9) 5.7% (±0.8)
66. How do you feel about someone your age having one or two drinks of an alcoholic beverage nearly every day?
(n=1,121)
(n=4,234)
a. Neither approve nor disapprove 17.7% (±3.7) 17.4% (±2.0)
b. Somewhat disapprove 18.6% (±2.5) 19.3% (±1.8)
c. Strongly disapprove 55.0% (±4.9) 53.8% (±3.3)
d. Don't know or can't say 8.7% (±2.4) 9.4% (±1.4)
Other Marijuana-Related Questions
67. Does anyone who lives with you now use marijuana? (n=1,106) (n=4,210)
a. No 78.5% (±4.4) 82.1% (±2.3)
b. Yes 21.5% (±4.4) 17.9% (±2.3)
68. During the past 30 days, if you used marijuana, how did you use it? Choose all that apply.
(n=1,064)
(n=4,101)
a. I did not use marijuana during the past 30 days. 92.4% (±1.9) 92.5% (±1.4)
b. Smoked it (in a joint, bong, pipe, blunt). 5.3% (±1.6) 5.2% (±1.0)
c. Ate it (in brownies, cakes, cookies, candy). 2.7% (±1.3) 2.3% (±0.6)
d. Drank it (tea, cola, alcohol). 0.6% (±0.5) 0.4% (±0.2)
e. Vaporized it (e-cig, JUUL, or vape pen). 3.6% (±0.8) 3.5% (±0.7)
f. Dabbed it. 1.8% (±0.8) 2.7% (±0.6)
g. Used it some other way. 0.4% (±0.4) 0.5% (±0.2)
69. If you use marijuana or hashish how long do you usually stay high? (n=1,094) (n=4,200)
a. I don't use marijuana. 88.6% (±2.5) 88.8% (±1.7)
b. I usually don't get high. 1.8% (±0.6) 2.4% (±0.4)
c. 1 to 2 hours 4.1% (±1.6) 4.2% (±0.8)
d. 3 to 4 hours 3.9% (±1.4) 3.6% (±0.8)
e. 5 to 6 hours 0.8% (±0.5) 0.7% (±0.3)
f. 7 to 8 hours 0.1% (±0.2) 0.1% (±0.1)
g. 9 or more hours 0.6% (±0.6) 0.2% (±0.1)

Healthy Youth Survey 2021 Survey Results For help interpreting your results, please see information starting on page 2 Page 22
ƒƒƒƒƒƒƒƒƒƒƒƒƒƒƒƒƒƒƒƒƒƒƒƒƒƒƒƒƒƒƒƒƒƒƒƒƒƒƒƒƒƒƒƒƒƒƒƒƒƒƒƒƒƒƒƒƒƒ
Pierce County Grade 10
ƒƒƒƒƒƒƒƒƒƒƒƒƒƒƒƒƒƒƒƒƒƒƒƒƒƒƒƒƒƒƒƒƒƒƒƒƒƒƒƒƒƒƒƒƒƒƒƒƒƒƒƒƒƒƒƒƒƒ
70. During the past 30 days, if you used marijuana, how did you get it? Choose all that apply.
Your Students
% ( ± CI) (n=1,063)
Statewide
% ( ± CI) (n=4,095)
a. I did not get marijuana in the past 30 days. 92.9% (±2.0) 92.6% (±1.3)
b. I bought it from a store. 0.3% (±0.4) 0.5% (±0.2)
c. I stole it from a store. 0.1% (±0.2) 0.1% (±0.1)
d. I got it from friends. 3.7% (±1.4) 4.2% (±1.0)
e. I got it at a party. 0.5% (±0.5) 0.7% (±0.3)
f. I got it from an older brother or sister. 0.8% (±0.5) 0.7% (±0.3)
g. I gave money to someone to get it for me. 1.5% (±1.0) 1.4% (±0.4)
h. I took it from home without my parents' permission. 0.5% (±0.3) 0.7% (±0.2)
i. I got it at home with my parents' permission. 0.7% (±0.6) 0.7% (±0.3)
j. I got it some other way. 1.6% (±0.7) 1.8% (±0.5)
71. In the past year, have your parent(s) or guardian(s) talked to you about why you should not use marijuana?
(n=1,130)
(n=4,265)
a. Yes, a number of times 39.5% (±3.2) 39.3% (±2.0)
b. Yes, once 19.4% (±1.8) 19.0% (±1.5)
c. No 31.4% (±3.6) 30.4% (±1.8)
d. I don't remember. 9.7% (±1.9) 11.3% (±1.1)
72. How wrong do your friends feel it would be for you to: Use marijuana? (n=1,119) (n=4,230)
a. Very wrong 48.2% (±3.8) 50.8% (±3.6)
b. Wrong 21.2% (±3.0) 21.1% (±1.7)
c. A little bit wrong 15.9% (±2.6) 15.1% (±1.7)
d. Not at all wrong 14.7% (±3.5) 13.0% (±1.7)
Other Alcohol- and Drug-Related Questions
73. How many times in the past year (12 months) have you been drunk or high while participating in school?
(n=1,120)
(n=4,244)
a. Never 93.2% (±2.3) 93.8% (±1.2)
b. 1 - 2 times 3.8% (±1.4) 2.7% (±0.6)
c. 3 - 5 times 0.8% (±0.5) 1.1% (±0.4)
d. 6 - 9 times 0.6% (±0.6) 0.7% (±0.2)
e. 10 or more times 1.6% (±0.7) 1.8% (±0.5)
74. During the past 30 days, which of the following did you use on school property? Choose all that apply.
(n=2,294)
(n=8,310)
a. I have not been on school property in the past 30 days. 91.5% (±1.8) 91.8% (±1.1)
b. I didn't use any of these on school property. 0.4% (±0.3) 0.4% (±0.2)
c. Tobacco (cigarettes, cigars, or chew/dip) 3.5% (±1.2) 3.4% (±0.7)
d. Electronic cigarette, also called e-cigs, JUUL, or vape pens 1.7% (±0.8) 2.2% (±0.6)
e. Marijuana 0.7% (±0.3) 0.8% (±0.3)
f. Alcohol (at least one drink) 5.5% (±1.4) 5.0% (±0.9)
Healthy Youth Survey 2021 Survey Results For help interpreting your results, please see information starting on page 2 Page 23
ƒƒƒƒƒƒƒƒƒƒƒƒƒƒƒƒƒƒƒƒƒƒƒƒƒƒƒƒƒƒƒƒƒƒƒƒƒƒƒƒƒƒƒƒƒƒƒƒƒƒƒƒƒƒƒƒƒƒ
Pierce County Grade 10
ƒƒƒƒƒƒƒƒƒƒƒƒƒƒƒƒƒƒƒƒƒƒƒƒƒƒƒƒƒƒƒƒƒƒƒƒƒƒƒƒƒƒƒƒƒƒƒƒƒƒƒƒƒƒƒƒƒƒ
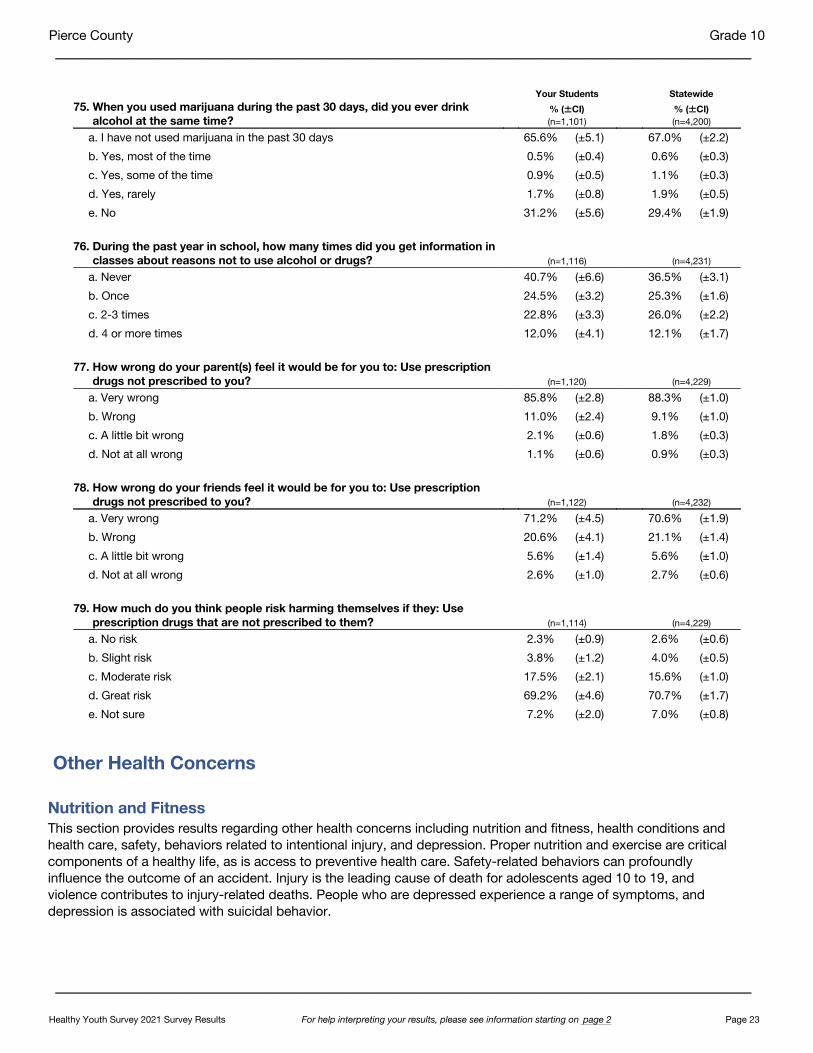
75. When you used marijuana during the past 30 days, did you ever drink alcohol at the same time?
Your Students
% ( ± CI) (n=1,101)
Statewide
% ( ± CI) (n=4,200)
a. I have not used marijuana in the past 30 days 65.6% (±5.1) 67.0% (±2.2)
b. Yes, most of the time 0.5% (±0.4) 0.6% (±0.3)
c. Yes, some of the time 0.9% (±0.5) 1.1% (±0.3)
d. Yes, rarely 1.7% (±0.8) 1.9% (±0.5)
e. No 31.2% (±5.6) 29.4% (±1.9)
76. During the past year in school, how many times did you get information in classes about reasons not to use alcohol or drugs?
(n=1,116)
(n=4,231)
a. Never 40.7% (±6.6) 36.5% (±3.1)
b. Once 24.5% (±3.2) 25.3% (±1.6)
c. 2-3 times 22.8% (±3.3) 26.0% (±2.2)
d. 4 or more times 12.0% (±4.1) 12.1% (±1.7)
77. How wrong do your parent(s) feel it would be for you to: Use prescription drugs not prescribed to you?
(n=1,120)
(n=4,229)
a. Very wrong 85.8% (±2.8) 88.3% (±1.0)
b. Wrong 11.0% (±2.4) 9.1% (±1.0)
c. A little bit wrong 2.1% (±0.6) 1.8% (±0.3)
d. Not at all wrong 1.1% (±0.6) 0.9% (±0.3)
78. How wrong do your friends feel it would be for you to: Use prescription drugs not prescribed to you?
(n=1,122)
(n=4,232)
a. Very wrong 71.2% (±4.5) 70.6% (±1.9)
b. Wrong 20.6% (±4.1) 21.1% (±1.4)
c. A little bit wrong 5.6% (±1.4) 5.6% (±1.0)
d. Not at all wrong 2.6% (±1.0) 2.7% (±0.6)
79. How much do you think people risk harming themselves if they: Use prescription drugs that are not prescribed to them?
(n=1,114)
(n=4,229)
a. No risk 2.3% (±0.9) 2.6% (±0.6)
b. Slight risk 3.8% (±1.2) 4.0% (±0.5)
c. Moderate risk 17.5% (±2.1) 15.6% (±1.0)
d. Great risk 69.2% (±4.6) 70.7% (±1.7)
e. Not sure 7.2% (±2.0) 7.0% (±0.8)
Other Health Concerns
Nutrition and FitnessThis section provides results regarding other health concerns including nutrition and fitness, health conditions and health care, safety, behaviors related to intentional injury, and depression. Proper nutrition and exercise are critical components of a healthy life, as is access to preventive health care. Safety-related behaviors can profoundly influence the outcome of an accident. Injury is the leading cause of death for adolescents aged 10 to 19, and violence contributes to injury-related deaths. People who are depressed experience a range of symptoms, and depression is associated with suicidal behavior.

Healthy Youth Survey 2021 Survey Results For help interpreting your results, please see information starting on page 2 Page 24
ƒƒƒƒƒƒƒƒƒƒƒƒƒƒƒƒƒƒƒƒƒƒƒƒƒƒƒƒƒƒƒƒƒƒƒƒƒƒƒƒƒƒƒƒƒƒƒƒƒƒƒƒƒƒƒƒƒƒ
Pierce County Grade 10
ƒƒƒƒƒƒƒƒƒƒƒƒƒƒƒƒƒƒƒƒƒƒƒƒƒƒƒƒƒƒƒƒƒƒƒƒƒƒƒƒƒƒƒƒƒƒƒƒƒƒƒƒƒƒƒƒƒƒ
Obese: “Obese” includes students who are in the top 5% for body mass index by age and gender based on growth charts developed by the Centers for Disease Control and Prevention (2000). “Overweight” includes students who are in the top 15% but not the top 5%.
80. Obese or overweight? (Computed from numeric responses to "How tall are you without your shoes on?" and "How much do you weigh without your shoes on?")
Your Students
% ( ± CI) (n=1,105)
Statewide
% ( ± CI) (n=3,774)
Obese 20.3% (±5.0) 15.8% (±2.9)
Overweight 15.5% (±2.8) 14.5% (±1.7)
Normal weight 60.6% (±5.2) 65.6% (±3.5)
Underweight 3.6% (±1.3) 4.1% (±0.7)
81. How often do you eat dinner with your family? (n=1,251) (n=4,377)
a. Never 5.4% (±1.6) 5.0% (±0.8)
b. Rarely 14.5% (±2.6) 13.3% (±1.4)
c. Sometimes 21.1% (±2.2) 21.0% (±1.6)
d. Most of the time 34.0% (±3.8) 35.2% (±2.1)
e. Always 25.0% (±2.2) 25.4% (±1.6)
82. How often in the past 12 months did you or your family have to cut meal size or skip meals because there wasn't enough money for food?
(n=2,365)
(n=8,493)
a. Almost every month 1.1% (±0.6) 1.3% (±0.3)
b. Some months but not every month 3.3% (±1.5) 2.7% (±0.6)
c. Only 1-2 months 1.8% (±0.7) 1.9% (±0.4)
d. Did not have to skip or cut the size of meals. 93.8% (±2.0) 94.1% (±1.0)
83. Did you eat breakfast today? (n=1,250) (n=4,380)
a. Yes 44.6% (±5.4) 52.9% (±4.1)
b. No 55.4% (±5.4) 47.1% (±4.1)
84. Number of servings of fruits and vegetables eaten per day (Computed from FV1 - FV6)
(n=1,127)
(n=4,033)
a. Less than 1 14.5% (±3.3) 12.6% (±2.1)
b. 1 to less than 3 40.4% (±3.0) 41.1% (±2.0)
c. 3 to less than 5 21.7% (±3.2) 23.0% (±2.3)
d. 5 or more 23.4% (±2.8) 23.3% (±1.8)
85. During the past 7 days, how many times did you drink sugar-sweetened drinks like soda, sports drinks, energy drinks, coffee drinks, tea drinks, or other flavored sugar-sweetened drinks? Do not include diet, sugar-free or drinks with artificial sweetener.
(n=1,240)
(n=4,345)
a. 0 times 13.1% (±2.6) 17.1% (±2.0)
b. 1 - 3 times 48.2% (±2.6) 47.6% (±1.7)
c. 4 - 6 times 16.4% (±1.6) 15.8% (±1.4)
d. 1 time per day 10.2% (±1.2) 9.9% (±1.0)
e. 2 times per day 7.1% (±1.3) 5.8% (±0.9)
f. 3 times per day 2.2% (±0.9) 1.7% (±0.4)
g. 4 or more times per day 2.8% (±1.1) 2.1% (±0.6)

Healthy Youth Survey 2021 Survey Results For help interpreting your results, please see information starting on page 2 Page 25
ƒƒƒƒƒƒƒƒƒƒƒƒƒƒƒƒƒƒƒƒƒƒƒƒƒƒƒƒƒƒƒƒƒƒƒƒƒƒƒƒƒƒƒƒƒƒƒƒƒƒƒƒƒƒƒƒƒƒ
Pierce County Grade 10
ƒƒƒƒƒƒƒƒƒƒƒƒƒƒƒƒƒƒƒƒƒƒƒƒƒƒƒƒƒƒƒƒƒƒƒƒƒƒƒƒƒƒƒƒƒƒƒƒƒƒƒƒƒƒƒƒƒƒ86. During the past 7 days, how many times did you drink sugar-sweetened
drinks like soda, sports drinks, energy drinks, coffee drinks, tea drinks, or other flavored sugar-sweetened drinks at school (including any after-school and weekend activities)? Do not include diet, sugar-free or drinks with artificial sweetener.
Your Students
% ( ± CI) (n=1,234)
Statewide
% ( ± CI) (n=4,340)
a. 0 times 53.9% (±3.9) 54.9% (±3.1)
b. 1 - 3 times 34.8% (±3.0) 34.9% (±2.5)
c. 4 - 6 times 7.7% (±1.1) 7.2% (±0.9)
d. 7 - 9 times 2.0% (±0.7) 1.6% (±0.4)
e. 10 times or more 0.7% (±0.4) 1.1% (±0.4)
f. I have not been on school property in the past 7 days. 0.8% (±0.5) 0.3% (±0.2)
87. During the past 7 days, where did you usually get the soda or other sugar-sweetened drinks that you drank at school? Choose only one answer.
(n=1,235)
(n=4,336)
a. I did not drink sodas, sports drinks, or other flavored drinks at school. 51.4% (±3.9) 54.5% (±2.6)
b. I brought them from home. 26.2% (±2.4) * 21.5% (±2.2)
c. I got them from friends. 3.8% (±1.2) 3.6% (±0.6)
d. I bought them at school. 11.8% (±4.4) 11.4% (±2.2)
e. Other 5.9% (±1.5) 8.3% (±1.8)
f. I have not been on school property in the past 7 days. 0.8% (±0.4) 0.7% (±0.3) [Questions 88-89 appear only on the elementary version of the survey.]
90. In the past 7 days, on how many days were you physically active for a total of at least 60 minutes per day? (Add up all the time you spent in any kind of physical activity that increases your heart rate or makes you breathe hard some of the time.)
(n=1,233)
(n=4,347)
a. 0 days 13.3% (±2.4) 12.8% (±1.9)
b. 1 day 7.8% (±1.7) 6.5% (±0.9)
c. 2 days 9.0% (±2.3) 8.2% (±0.7)
d. 3 days 13.5% (±2.2) 12.2% (±1.2)
e. 4 days 8.8% (±1.6) 10.6% (±1.0)
f. 5 days 19.5% (±3.3) 19.8% (±1.4)
g. 6 days 9.4% (±1.4) 11.0% (±1.3)
h. 7 days 18.7% (±2.0) 19.0% (±1.4)
91. On how many of the past 7 days did you do exercises to strengthen or tone your muscles, such as push-ups, sit-ups, or weight lifting?
(n=1,190)
(n=4,216)
a. 0 days 31.3% (±5.1) 30.0% (±2.1)
b. 1 day 9.4% (±2.3) 10.0% (±0.9)
c. 2 days 11.4% (±1.5) 11.5% (±1.2)
d. 3 days 12.5% (±1.7) 12.6% (±1.5)
e. 4 days 8.2% (±2.2) 7.8% (±1.0)
f. 5 days 11.5% (±2.7) 12.4% (±1.5)
g. 6 days 4.9% (±1.2) 5.6% (±0.9)
h. 7 days 10.8% (±1.7) 10.3% (±1.1)

Healthy Youth Survey 2021 Survey Results For help interpreting your results, please see information starting on page 2 Page 26
ƒƒƒƒƒƒƒƒƒƒƒƒƒƒƒƒƒƒƒƒƒƒƒƒƒƒƒƒƒƒƒƒƒƒƒƒƒƒƒƒƒƒƒƒƒƒƒƒƒƒƒƒƒƒƒƒƒƒ
Pierce County Grade 10
ƒƒƒƒƒƒƒƒƒƒƒƒƒƒƒƒƒƒƒƒƒƒƒƒƒƒƒƒƒƒƒƒƒƒƒƒƒƒƒƒƒƒƒƒƒƒƒƒƒƒƒƒƒƒƒƒƒƒ
92. On average, how many days a week do you walk to or from school?
Your Students
% ( ± CI) (n=1,233)
Statewide
% ( ± CI) (n=4,326)
a. In an average week, I don't normally travel to school. 9.2% (±2.3) 9.9% (±1.3)
b. Never 64.5% (±5.7) 60.0% (±4.0)
c. 1 - 2 days 9.7% (±3.0) 9.8% (±1.5)
d. 3 - 4 days 3.2% (±1.2) 4.9% (±1.3)
e. I walk every day. 13.4% (±4.1) 15.4% (±2.8)
93. On average, how many days a week do you ride a bicycle to or from school?
(n=1,217)
(n=4,253)
a. In an average week, I don't normally travel to school. 12.2% (±2.1) 12.6% (±1.2)
b. Never 84.8% (±2.2) 83.6% (±1.4)
c. 1 - 2 days 1.4% (±0.7) 1.5% (±0.5)
d. 3 - 4 days 0.5% (±0.6) 0.6% (±0.3)
e. I bike every day. 1.2% (±0.6) 1.7% (±0.5)
94. On an average school day, how many hours do you watch TV shows or movies or stream videos (such as YouTube, Netflix, Hulu) on any electronic device (Computer, TV set, tablets or smartphone)?
(n=1,240)
(n=4,351)
a. I do not watch TV or movies on an average school day. 6.7% (±1.5) 8.8% (±1.1)
b. Less than 1 hour per day 9.4% (±2.6) 10.6% (±1.1)
c. 1 hour per day 13.0% (±2.2) 15.8% (±1.9)
d. 2 hours per day 20.4% (±2.8) 22.8% (±1.5)
e. 3 hours per day 21.1% (±1.6) * 17.6% (±1.2)
f. 4 hours per day 11.0% (±1.8) 9.9% (±1.2)
g. 5 or more hours per day 18.5% (±3.6) 14.5% (±2.2)
95. On an average school day, how many hours do you play video or computer games, or use a computer for something that is not school work? (Count time spent on things such as Xbox, PlayStation, tablet or smartphone,social media).
(n=1,238)
(n=4,349)
a. I do not play video games or use a computer for something that is not school work.
16.4% (±2.4)
19.2% (±1.8)
b. Less than 1 hour per day 16.5% (±1.5) 16.8% (±1.6)
c. 1 hour per day 11.7% (±2.7) 12.0% (±1.6)
d. 2 hours per day 16.0% (±2.2) 16.1% (±1.3)
e. 3 hours per day 14.9% (±2.0) 13.1% (±0.9)
f. 4 hours per day 9.1% (±1.1) 9.0% (±1.1)
g. 5 or more hours per day 15.4% (±4.2) 13.8% (±2.0)
96. During the average week, on how many days do you participate in supervised after-school activities either at school or away from school? Include activities such as sports, art, music, dance, drama, or community service, religious, or club activities.
(n=2,366)
(n=8,470)
a. 0 days 47.6% (±6.7) 44.8% (±4.5)
b. 1-2 days 20.0% (±2.9) 21.7% (±1.9)
c. 3 or more days 32.3% (±6.3) 33.5% (±3.4)

Healthy Youth Survey 2021 Survey Results For help interpreting your results, please see information starting on page 2 Page 27
ƒƒƒƒƒƒƒƒƒƒƒƒƒƒƒƒƒƒƒƒƒƒƒƒƒƒƒƒƒƒƒƒƒƒƒƒƒƒƒƒƒƒƒƒƒƒƒƒƒƒƒƒƒƒƒƒƒƒ
Pierce County Grade 10
ƒƒƒƒƒƒƒƒƒƒƒƒƒƒƒƒƒƒƒƒƒƒƒƒƒƒƒƒƒƒƒƒƒƒƒƒƒƒƒƒƒƒƒƒƒƒƒƒƒƒƒƒƒƒƒƒƒƒ
97. Did you participate in team sports or athletics in the past 12 months?
Your Students
% ( ± CI) (n=1,132)
Statewide
% ( ± CI) (n=4,259)
a. Yes 47.7% (±8.4) 52.5% (±4.4)
b. No 52.3% (±8.4) 47.5% (±4.4)
Health Conditions and Health Care
98. When was the last time you saw a doctor or health care provider for a check-up or physical exam when you were not sick or injured?
(n=1,232)
(n=4,388)
a. During the past 12 months 61.7% (±4.5) 67.4% (±2.5)
b. Between 12 and 24 months ago 17.3% (±1.7) 15.5% (±1.1)
c. More than 24 months ago 7.2% (±1.2) 5.4% (±0.9)
d. Never 1.9% (±1.0) 2.0% (±0.5)
e. Not sure 11.9% (±2.8) 9.7% (±1.7)
99. Has a doctor or nurse ever told you that you have asthma? (n=1,246) (n=4,406)
a. Yes 19.7% (±2.4) 16.0% (±1.4)
b. No 74.8% (±2.8) 78.7% (±1.7)
c. Not sure 5.5% (±1.3) 5.3% (±0.9)
100. Do you still have asthma? (n=1,241) (n=4,404)
a. I have never had asthma. 55.4% (±3.7) 56.9% (±1.9)
b. Yes 9.6% (±1.6) 8.1% (±1.1)
c. No 25.1% (±2.7) 26.1% (±1.4)
d. Not sure 10.0% (±2.2) 8.9% (±1.2)
101. When was the last time you saw a dentist for a check-up, exam, teeth cleaning, or other dental work?
(n=1,214)
(n=4,322)
a. During the past 12 months 73.1% (±5.8) 76.1% (±2.8)
b. Between 12 and 24 months ago 11.4% (±1.9) 10.9% (±1.1)
c. More than 24 months ago 6.8% (±2.4) 5.2% (±1.0)
d. Never 0.8% (±0.5) 1.2% (±0.3)
e. Not sure 7.8% (±2.4) 6.5% (±1.3)
102. During the past 12 months, how many days did you miss some school because of toothache? (Do not include toothache due to braces or injury.)
(n=1,234)
(n=4,397)
a. None 92.7% (±1.4) 93.7% (±1.1)
b. 1-4 days 3.8% (±0.9) 3.2% (±0.6)
c. 5 days or more 1.1% (±0.5) 0.8% (±0.3)
d. Not sure 2.4% (±0.6) 2.3% (±0.6) [Question 103 appears only on the elementary version of the survey.]

Healthy Youth Survey 2021 Survey Results For help interpreting your results, please see information starting on page 2 Page 28
ƒƒƒƒƒƒƒƒƒƒƒƒƒƒƒƒƒƒƒƒƒƒƒƒƒƒƒƒƒƒƒƒƒƒƒƒƒƒƒƒƒƒƒƒƒƒƒƒƒƒƒƒƒƒƒƒƒƒ
Pierce County Grade 10
ƒƒƒƒƒƒƒƒƒƒƒƒƒƒƒƒƒƒƒƒƒƒƒƒƒƒƒƒƒƒƒƒƒƒƒƒƒƒƒƒƒƒƒƒƒƒƒƒƒƒƒƒƒƒƒƒƒƒ
104. On an average school night how many hours do you sleep?
Your Students
% ( ± CI) (n=1,242)
Statewide
% ( ± CI) (n=4,391)
a. 5 hours or less 21.7% (±4.2) 17.2% (±2.0)
b. About 6 hours 26.6% (±2.9) 25.7% (±1.6)
c. About 7 hours 29.1% (±2.6) 29.6% (±1.7)
d. About 8 hours 18.8% (±3.4) 23.0% (±2.2)
e. 9 hours or more 3.9% (±1.2) 4.6% (±0.6)
105. Do you have any physical disabilities or long-term health problems lasting or expected to last 6 months or more?
(n=1,231)
(n=4,378)
a. Yes 8.5% (±1.2) 9.3% (±0.9)
b. No 79.2% (±2.4) 80.2% (±1.7)
c. Not sure 12.3% (±1.6) 10.5% (±1.4)
106. Do you have any long-term emotional problems or learning disabilities lasting or expected to last 6 months or more?
(n=1,232)
(n=4,370)
a. Yes 17.4% (±2.3) 17.2% (±1.7)
b. No 66.5% (±4.0) 67.0% (±2.6)
c. Not sure 16.2% (±2.4) 15.8% (±1.7)
107. Would other people consider you to have a disability or long-term health problem including physical health, emotional, or learning problems?
(n=1,233)
(n=4,367)
a. Yes 13.9% (±3.0) 13.1% (±1.2)
b. No 66.7% (±3.4) 68.3% (±2.2)
c. Not sure 19.3% (±3.2) 18.6% (±1.7)
108. Are you limited in any activities because of a disability or long-term health problem including physical health, emotional, or learning problems expected to last 6 months or more?
(n=1,230)
(n=4,378)
a. Yes 8.9% (±2.0) 8.8% (±1.1)
b. No 80.2% (±3.0) 80.8% (±1.4)
c. Not sure 11.0% (±2.0) 10.3% (±1.4)
Sexual Behavior
109. Have you ever had sex? † (n=871) (n=2,619)
a. Yes 14.7% (±4.2) 13.9% (±2.5)
b. No 85.3% (±4.2) 86.1% (±2.5)
110. How old were you when you had sex for the first time? † (n=871) (n=2,619)
a. I have never had sex. 85.3% (±4.2) 86.1% (±2.5)
b. 11 years old or younger 0.7% (±0.7) 1.1% (±0.5)
c. 12 years old 0.5% (±0.4) 0.7% (±0.3)
d. 13 years old 2.5% (±1.3) 2.0% (±0.7)
e. 14 years old 4.5% (±1.7) 3.4% (±0.7)
f. 15 years old 5.5% (±2.7) 5.8% (±1.3)
g. 16 years old 0.7% (±0.4) 0.8% (±0.4)
h. 17 years old or older 0.3% (±0.4) 0.1% (±0.1)

Healthy Youth Survey 2021 Survey Results For help interpreting your results, please see information starting on page 2 Page 29
ƒƒƒƒƒƒƒƒƒƒƒƒƒƒƒƒƒƒƒƒƒƒƒƒƒƒƒƒƒƒƒƒƒƒƒƒƒƒƒƒƒƒƒƒƒƒƒƒƒƒƒƒƒƒƒƒƒƒ
Pierce County Grade 10
ƒƒƒƒƒƒƒƒƒƒƒƒƒƒƒƒƒƒƒƒƒƒƒƒƒƒƒƒƒƒƒƒƒƒƒƒƒƒƒƒƒƒƒƒƒƒƒƒƒƒƒƒƒƒƒƒƒƒ
111. With how many people have you ever had sex? †
Your Students
% ( ± CI) (n=869)
Statewide
% ( ± CI) (n=2,613)
a. I have never had sex. 85.6% (±4.3) 85.8% (±2.5)
b. 1 person 9.8% (±3.2) 7.7% (±1.5)
c. 2 people 2.4% (±1.0) 2.5% (±0.7)
d. 3 people 0.8% (±0.5) 1.6% (±0.5)
e. 4 people 0.3% (±0.5) 0.6% (±0.4)
f. 5 people 0.1% (±0.2) 0.3% (±0.2)
g. 6 or more people 0.9% (±0.5) 1.5% (±0.5)
112. During your life, with whom have you had sexual contact? Choose all that apply. †
(n=844)
(n=2,578)
a. I have never had sexual contact 74.2% (±5.8) 75.3% (±3.1)
b. Females 17.2% (±4.0) 14.9% (±2.1)
c. Males 11.3% (±3.2) 12.2% (±2.0)
d. Other 1.3% (±0.8) 1.0% (±0.4)
113. The last time you had sex, what method(s) did you or your partner use to prevent pregnancy and/or sexually transmitted diseases? Choose all that you used. †
(n=856)
(n=2,587)
a. I have never had sex 85.7% (±4.0) 85.9% (±2.5)
b. No method was used 4.3% (±1.3) 3.3% (±0.8)
c. Birth control pills 2.7% (±0.7) 3.9% (±1.0)
d. Condoms 8.3% (±2.8) 8.3% (±1.7)
e. An IUD or implant (such as Mirena or ParaGard; Implanon or Nexplanon) 0.5% (±0.4) 1.3% (±0.5)
f. A shot (such as Depo-Provera) 0.8% (±0.6) 0.4% (±0.3)
g. Patch or birth control ring (such as Xulane; NuvaRing) 0.1% (±0.2) 0.3% (±0.2)
h. Withdrawal or some other method 2.0% (±0.9) 1.4% (±0.4)
i. Not sure 0.4% (±0.4) 0.7% (±0.4)
Behaviors Related to Unintentional Injury [Question 114 appears only on the elementary version of the survey.]
115. How good a swimmer do you think you are? (n=1,259) (n=4,426)
a. Good 47.7% (±7.0) 50.3% (±3.5)
b. So-so 34.7% (±2.5) 34.1% (±1.6)
c. Not good 9.1% (±2.2) 8.1% (±1.2)
d. Can't swim 8.6% (±3.4) 7.5% (±1.6)
116. Have you ever taken formal swimming lessons? (n=1,256) (n=4,421)
a. Yes 56.1% ±13.9) 58.3% (±7.6)
b. No 39.8% ±13.5) 38.0% (±7.3)
c. Not sure 4.1% (±1.0) 3.8% (±0.6)
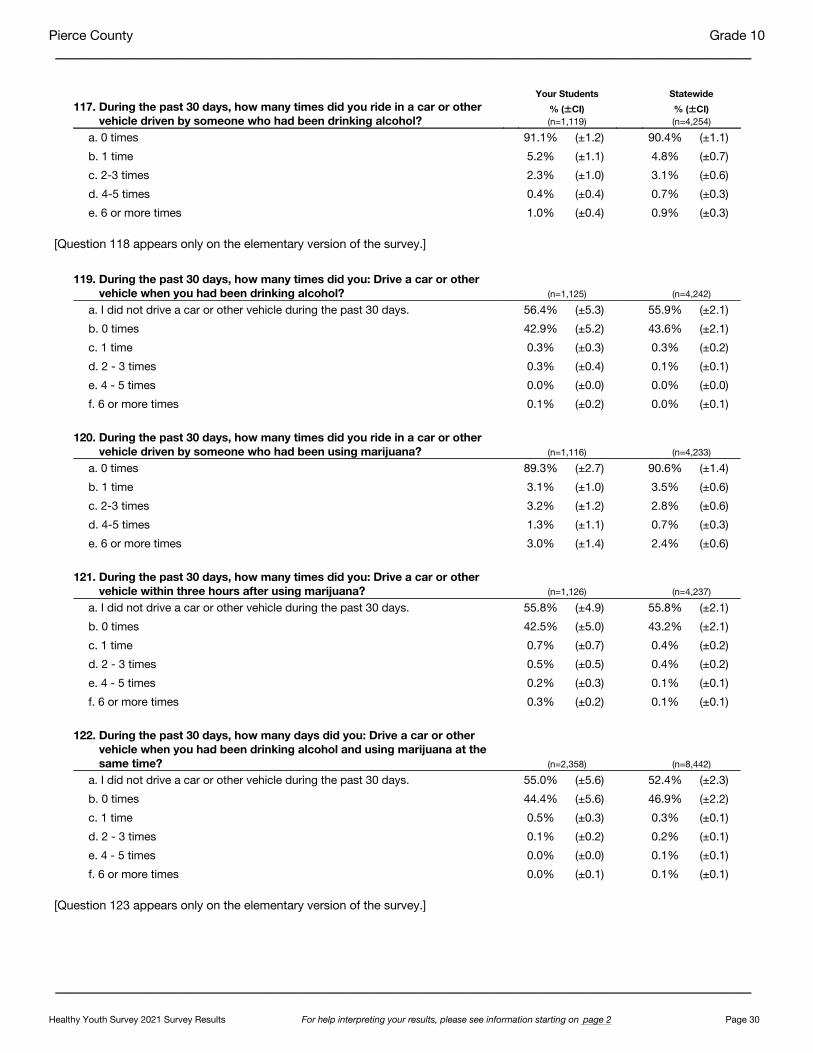
Healthy Youth Survey 2021 Survey Results For help interpreting your results, please see information starting on page 2 Page 30
ƒƒƒƒƒƒƒƒƒƒƒƒƒƒƒƒƒƒƒƒƒƒƒƒƒƒƒƒƒƒƒƒƒƒƒƒƒƒƒƒƒƒƒƒƒƒƒƒƒƒƒƒƒƒƒƒƒƒ
Pierce County Grade 10
ƒƒƒƒƒƒƒƒƒƒƒƒƒƒƒƒƒƒƒƒƒƒƒƒƒƒƒƒƒƒƒƒƒƒƒƒƒƒƒƒƒƒƒƒƒƒƒƒƒƒƒƒƒƒƒƒƒƒ
117. During the past 30 days, how many times did you ride in a car or other vehicle driven by someone who had been drinking alcohol?
Your Students
% ( ± CI) (n=1,119)
Statewide
% ( ± CI) (n=4,254)
a. 0 times 91.1% (±1.2) 90.4% (±1.1)
b. 1 time 5.2% (±1.1) 4.8% (±0.7)
c. 2-3 times 2.3% (±1.0) 3.1% (±0.6)
d. 4-5 times 0.4% (±0.4) 0.7% (±0.3)
e. 6 or more times 1.0% (±0.4) 0.9% (±0.3) [Question 118 appears only on the elementary version of the survey.]
119. During the past 30 days, how many times did you: Drive a car or other vehicle when you had been drinking alcohol?
(n=1,125)
(n=4,242)
a. I did not drive a car or other vehicle during the past 30 days. 56.4% (±5.3) 55.9% (±2.1)
b. 0 times 42.9% (±5.2) 43.6% (±2.1)
c. 1 time 0.3% (±0.3) 0.3% (±0.2)
d. 2 - 3 times 0.3% (±0.4) 0.1% (±0.1)
e. 4 - 5 times 0.0% (±0.0) 0.0% (±0.0)
f. 6 or more times 0.1% (±0.2) 0.0% (±0.1)
120. During the past 30 days, how many times did you ride in a car or other vehicle driven by someone who had been using marijuana?
(n=1,116)
(n=4,233)
a. 0 times 89.3% (±2.7) 90.6% (±1.4)
b. 1 time 3.1% (±1.0) 3.5% (±0.6)
c. 2-3 times 3.2% (±1.2) 2.8% (±0.6)
d. 4-5 times 1.3% (±1.1) 0.7% (±0.3)
e. 6 or more times 3.0% (±1.4) 2.4% (±0.6)
121. During the past 30 days, how many times did you: Drive a car or other vehicle within three hours after using marijuana?
(n=1,126)
(n=4,237)
a. I did not drive a car or other vehicle during the past 30 days. 55.8% (±4.9) 55.8% (±2.1)
b. 0 times 42.5% (±5.0) 43.2% (±2.1)
c. 1 time 0.7% (±0.7) 0.4% (±0.2)
d. 2 - 3 times 0.5% (±0.5) 0.4% (±0.2)
e. 4 - 5 times 0.2% (±0.3) 0.1% (±0.1)
f. 6 or more times 0.3% (±0.2) 0.1% (±0.1)
122. During the past 30 days, how many days did you: Drive a car or other vehicle when you had been drinking alcohol and using marijuana at the same time?
(n=2,358)
(n=8,442)
a. I did not drive a car or other vehicle during the past 30 days. 55.0% (±5.6) 52.4% (±2.3)
b. 0 times 44.4% (±5.6) 46.9% (±2.2)
c. 1 time 0.5% (±0.3) 0.3% (±0.1)
d. 2 - 3 times 0.1% (±0.2) 0.2% (±0.1)
e. 4 - 5 times 0.0% (±0.0) 0.1% (±0.1)
f. 6 or more times 0.0% (±0.1) 0.1% (±0.1) [Question 123 appears only on the elementary version of the survey.]
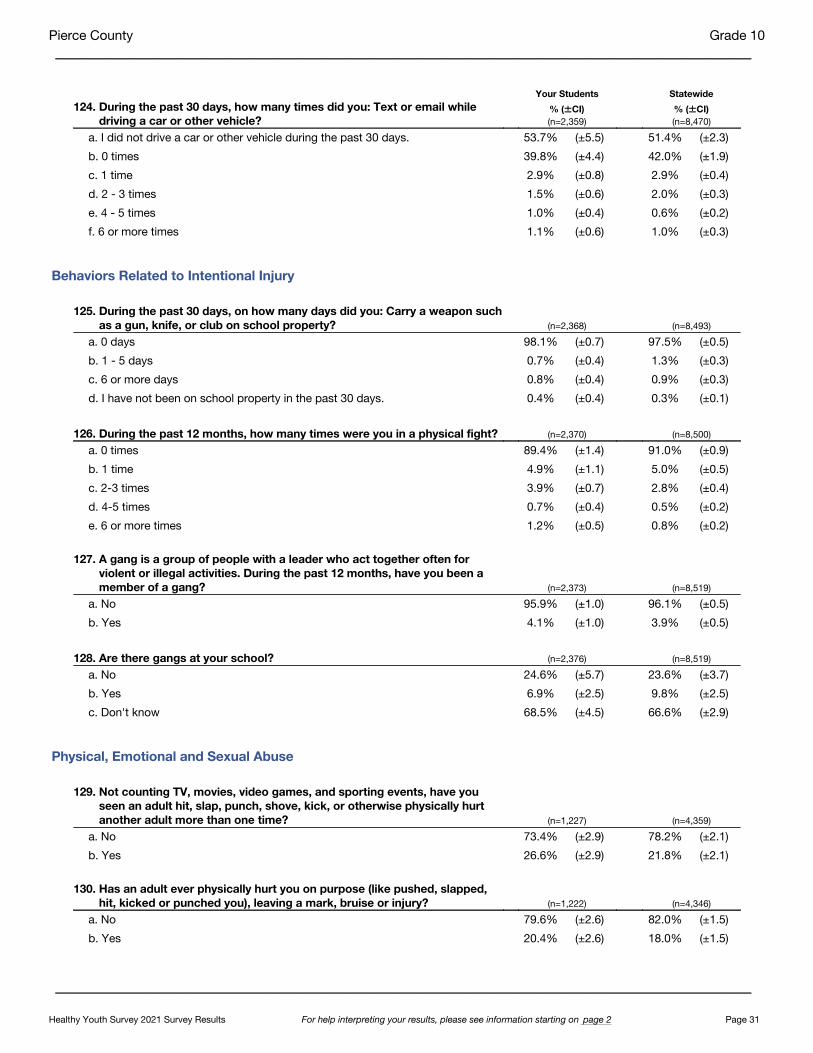
Healthy Youth Survey 2021 Survey Results For help interpreting your results, please see information starting on page 2 Page 31
ƒƒƒƒƒƒƒƒƒƒƒƒƒƒƒƒƒƒƒƒƒƒƒƒƒƒƒƒƒƒƒƒƒƒƒƒƒƒƒƒƒƒƒƒƒƒƒƒƒƒƒƒƒƒƒƒƒƒ
Pierce County Grade 10
ƒƒƒƒƒƒƒƒƒƒƒƒƒƒƒƒƒƒƒƒƒƒƒƒƒƒƒƒƒƒƒƒƒƒƒƒƒƒƒƒƒƒƒƒƒƒƒƒƒƒƒƒƒƒƒƒƒƒ
124. During the past 30 days, how many times did you: Text or email while driving a car or other vehicle?
Your Students
% ( ± CI) (n=2,359)
Statewide
% ( ± CI) (n=8,470)
a. I did not drive a car or other vehicle during the past 30 days. 53.7% (±5.5) 51.4% (±2.3)
b. 0 times 39.8% (±4.4) 42.0% (±1.9)
c. 1 time 2.9% (±0.8) 2.9% (±0.4)
d. 2 - 3 times 1.5% (±0.6) 2.0% (±0.3)
e. 4 - 5 times 1.0% (±0.4) 0.6% (±0.2)
f. 6 or more times 1.1% (±0.6) 1.0% (±0.3)
Behaviors Related to Intentional Injury
125. During the past 30 days, on how many days did you: Carry a weapon such as a gun, knife, or club on school property?
(n=2,368)
(n=8,493)
a. 0 days 98.1% (±0.7) 97.5% (±0.5)
b. 1 - 5 days 0.7% (±0.4) 1.3% (±0.3)
c. 6 or more days 0.8% (±0.4) 0.9% (±0.3)
d. I have not been on school property in the past 30 days. 0.4% (±0.4) 0.3% (±0.1)
126. During the past 12 months, how many times were you in a physical fight? (n=2,370) (n=8,500)
a. 0 times 89.4% (±1.4) 91.0% (±0.9)
b. 1 time 4.9% (±1.1) 5.0% (±0.5)
c. 2-3 times 3.9% (±0.7) 2.8% (±0.4)
d. 4-5 times 0.7% (±0.4) 0.5% (±0.2)
e. 6 or more times 1.2% (±0.5) 0.8% (±0.2)
127. A gang is a group of people with a leader who act together often for violent or illegal activities. During the past 12 months, have you been a member of a gang?
(n=2,373)
(n=8,519)
a. No 95.9% (±1.0) 96.1% (±0.5)
b. Yes 4.1% (±1.0) 3.9% (±0.5)
128. Are there gangs at your school? (n=2,376) (n=8,519)
a. No 24.6% (±5.7) 23.6% (±3.7)
b. Yes 6.9% (±2.5) 9.8% (±2.5)
c. Don't know 68.5% (±4.5) 66.6% (±2.9)
Physical, Emotional and Sexual Abuse
129. Not counting TV, movies, video games, and sporting events, have you seen an adult hit, slap, punch, shove, kick, or otherwise physically hurt another adult more than one time?
(n=1,227)
(n=4,359)
a. No 73.4% (±2.9) 78.2% (±2.1)
b. Yes 26.6% (±2.9) 21.8% (±2.1)
130. Has an adult ever physically hurt you on purpose (like pushed, slapped,hit, kicked or punched you), leaving a mark, bruise or injury?
(n=1,222)
(n=4,346)
a. No 79.6% (±2.6) 82.0% (±1.5)
b. Yes 20.4% (±2.6) 18.0% (±1.5)
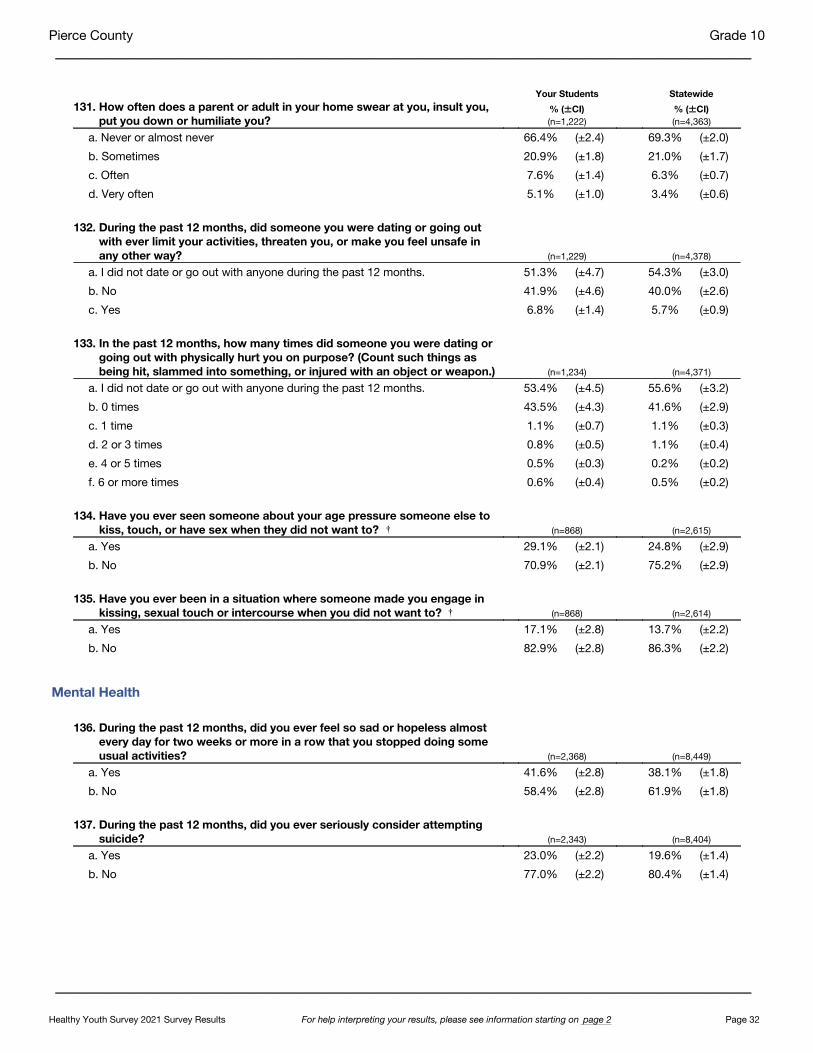
Healthy Youth Survey 2021 Survey Results For help interpreting your results, please see information starting on page 2 Page 32
ƒƒƒƒƒƒƒƒƒƒƒƒƒƒƒƒƒƒƒƒƒƒƒƒƒƒƒƒƒƒƒƒƒƒƒƒƒƒƒƒƒƒƒƒƒƒƒƒƒƒƒƒƒƒƒƒƒƒ
Pierce County Grade 10
ƒƒƒƒƒƒƒƒƒƒƒƒƒƒƒƒƒƒƒƒƒƒƒƒƒƒƒƒƒƒƒƒƒƒƒƒƒƒƒƒƒƒƒƒƒƒƒƒƒƒƒƒƒƒƒƒƒƒ
131. How often does a parent or adult in your home swear at you, insult you,put you down or humiliate you?
Your Students
% ( ± CI) (n=1,222)
Statewide
% ( ± CI) (n=4,363)
a. Never or almost never 66.4% (±2.4) 69.3% (±2.0)
b. Sometimes 20.9% (±1.8) 21.0% (±1.7)
c. Often 7.6% (±1.4) 6.3% (±0.7)
d. Very often 5.1% (±1.0) 3.4% (±0.6)
132. During the past 12 months, did someone you were dating or going out with ever limit your activities, threaten you, or make you feel unsafe in any other way?
(n=1,229)
(n=4,378)
a. I did not date or go out with anyone during the past 12 months. 51.3% (±4.7) 54.3% (±3.0)
b. No 41.9% (±4.6) 40.0% (±2.6)
c. Yes 6.8% (±1.4) 5.7% (±0.9)
133. In the past 12 months, how many times did someone you were dating or going out with physically hurt you on purpose? (Count such things as being hit, slammed into something, or injured with an object or weapon.)
(n=1,234)
(n=4,371)
a. I did not date or go out with anyone during the past 12 months. 53.4% (±4.5) 55.6% (±3.2)
b. 0 times 43.5% (±4.3) 41.6% (±2.9)
c. 1 time 1.1% (±0.7) 1.1% (±0.3)
d. 2 or 3 times 0.8% (±0.5) 1.1% (±0.4)
e. 4 or 5 times 0.5% (±0.3) 0.2% (±0.2)
f. 6 or more times 0.6% (±0.4) 0.5% (±0.2)
134. Have you ever seen someone about your age pressure someone else to kiss, touch, or have sex when they did not want to? †
(n=868)
(n=2,615)
a. Yes 29.1% (±2.1) 24.8% (±2.9)
b. No 70.9% (±2.1) 75.2% (±2.9)
135. Have you ever been in a situation where someone made you engage in kissing, sexual touch or intercourse when you did not want to? †
(n=868)
(n=2,614)
a. Yes 17.1% (±2.8) 13.7% (±2.2)
b. No 82.9% (±2.8) 86.3% (±2.2)
Mental Health
136. During the past 12 months, did you ever feel so sad or hopeless almost every day for two weeks or more in a row that you stopped doing some usual activities?
(n=2,368)
(n=8,449)
a. Yes 41.6% (±2.8) 38.1% (±1.8)
b. No 58.4% (±2.8) 61.9% (±1.8)
137. During the past 12 months, did you ever seriously consider attempting suicide?
(n=2,343)
(n=8,404)
a. Yes 23.0% (±2.2) 19.6% (±1.4)
b. No 77.0% (±2.2) 80.4% (±1.4)

Healthy Youth Survey 2021 Survey Results For help interpreting your results, please see information starting on page 2 Page 33
ƒƒƒƒƒƒƒƒƒƒƒƒƒƒƒƒƒƒƒƒƒƒƒƒƒƒƒƒƒƒƒƒƒƒƒƒƒƒƒƒƒƒƒƒƒƒƒƒƒƒƒƒƒƒƒƒƒƒ
Pierce County Grade 10
ƒƒƒƒƒƒƒƒƒƒƒƒƒƒƒƒƒƒƒƒƒƒƒƒƒƒƒƒƒƒƒƒƒƒƒƒƒƒƒƒƒƒƒƒƒƒƒƒƒƒƒƒƒƒƒƒƒƒ
138. During the past 12 months, did you make a plan about how you would attempt suicide?
Your Students
% ( ± CI) (n=1,221)
Statewide
% ( ± CI) (n=4,320)
a. Yes 18.3% (±1.8) 15.6% (±1.3)
b. No 81.7% (±1.8) 84.4% (±1.3)
139. During the past 12 months, how many times did you actually attempt suicide?
(n=1,229)
(n=4,337)
a. 0 times 89.6% (±1.5) 91.8% (±0.9)
b. 1 time 5.6% (±1.2) 4.5% (±0.7)
c. 2-3 times 3.3% (±0.8) 2.6% (±0.4)
d. 4-5 times 1.1% (±0.5) 0.5% (±0.3)
e. 6 or more times 0.3% (±0.3) 0.5% (±0.2) [Questions 140-141 appear only on the elementary version of the survey.]
142. How often over the last 2 weeks, were you bothered by: Feeling nervous,anxious or on edge?
(n=2,355)
(n=8,445)
a. Not at all 30.8% (±2.9) 31.2% (±1.9)
b. Several days 29.6% (±2.3) 29.8% (±1.5)
c. More than half the days 18.5% (±1.5) 17.2% (±1.0)
d. Nearly every day 21.1% (±1.7) 21.7% (±1.5)
143. How often over the last 2 weeks, were you bothered by: Not being able to stop or control worrying?
(n=2,335)
(n=8,380)
a. Not at all 41.4% (±2.9) 44.3% (±1.8)
b. Several days 27.2% (±3.1) 24.2% (±0.8)
c. More than half the days 15.0% (±1.4) 14.6% (±0.9)
d. Nearly every day 16.4% (±1.5) 16.9% (±1.1)
144. When you feel sad or hopeless, are there adults that you can turn to for help?
(n=1,234)
(n=4,351)
a. I never feel sad or hopeless. 15.7% (±2.2) 17.0% (±1.4)
b. Yes 52.4% (±4.7) 50.1% (±2.6)
c. No 15.5% (±3.1) 14.7% (±1.5)
d. Not sure 16.4% (±1.9) 18.1% (±1.3)
145. If you feel sad or hopeless almost every day for two weeks or more in a row, to whom would you most likely turn for help? Choose all that apply.
(n=1,311)
(n=4,832)
a. Sibling or cousin 24.7% (±3.5) 25.0% (±1.5)
b. Teacher, school counselor, or other adult in my school 8.1% (±1.5) 9.7% (±1.2)
c. Friend or peer 41.5% (±2.8) 45.2% (±2.6)
d. Parent/Guardian 31.7% (±4.1) 34.0% (±2.0)
e. Religious/faith leader 5.3% (±1.8) 4.1% (±0.7)
f. Coach 4.9% (±2.2) 5.9% (±1.3)
g. Other adult that's not my parent 8.5% (±1.7) 9.1% (±1.0)
h. I don't have anyone I would talk to. 14.2% (±2.1) 12.2% (±1.2)
i. I have not felt sad or hopeless for two weeks or more in a row. 22.6% (±3.5) 23.9% (±1.6)
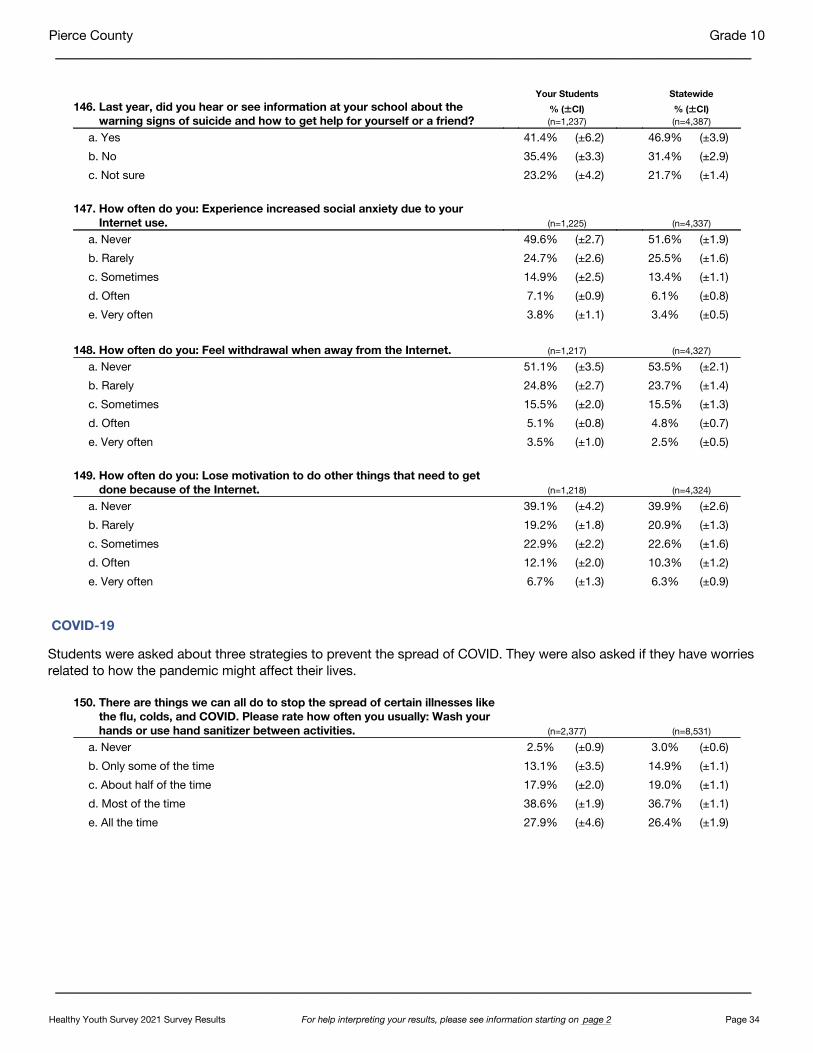
Healthy Youth Survey 2021 Survey Results For help interpreting your results, please see information starting on page 2 Page 34
ƒƒƒƒƒƒƒƒƒƒƒƒƒƒƒƒƒƒƒƒƒƒƒƒƒƒƒƒƒƒƒƒƒƒƒƒƒƒƒƒƒƒƒƒƒƒƒƒƒƒƒƒƒƒƒƒƒƒ
Pierce County Grade 10
ƒƒƒƒƒƒƒƒƒƒƒƒƒƒƒƒƒƒƒƒƒƒƒƒƒƒƒƒƒƒƒƒƒƒƒƒƒƒƒƒƒƒƒƒƒƒƒƒƒƒƒƒƒƒƒƒƒƒ
146. Last year, did you hear or see information at your school about the warning signs of suicide and how to get help for yourself or a friend?
Your Students
% ( ± CI) (n=1,237)
Statewide
% ( ± CI) (n=4,387)
a. Yes 41.4% (±6.2) 46.9% (±3.9)
b. No 35.4% (±3.3) 31.4% (±2.9)
c. Not sure 23.2% (±4.2) 21.7% (±1.4)
147. How often do you: Experience increased social anxiety due to your Internet use.
(n=1,225)
(n=4,337)
a. Never 49.6% (±2.7) 51.6% (±1.9)
b. Rarely 24.7% (±2.6) 25.5% (±1.6)
c. Sometimes 14.9% (±2.5) 13.4% (±1.1)
d. Often 7.1% (±0.9) 6.1% (±0.8)
e. Very often 3.8% (±1.1) 3.4% (±0.5)
148. How often do you: Feel withdrawal when away from the Internet. (n=1,217) (n=4,327)
a. Never 51.1% (±3.5) 53.5% (±2.1)
b. Rarely 24.8% (±2.7) 23.7% (±1.4)
c. Sometimes 15.5% (±2.0) 15.5% (±1.3)
d. Often 5.1% (±0.8) 4.8% (±0.7)
e. Very often 3.5% (±1.0) 2.5% (±0.5)
149. How often do you: Lose motivation to do other things that need to get done because of the Internet.
(n=1,218)
(n=4,324)
a. Never 39.1% (±4.2) 39.9% (±2.6)
b. Rarely 19.2% (±1.8) 20.9% (±1.3)
c. Sometimes 22.9% (±2.2) 22.6% (±1.6)
d. Often 12.1% (±2.0) 10.3% (±1.2)
e. Very often 6.7% (±1.3) 6.3% (±0.9)
COVID-19
Students were asked about three strategies to prevent the spread of COVID. They were also asked if they have worries related to how the pandemic might affect their lives.
150. There are things we can all do to stop the spread of certain illnesses like the flu, colds, and COVID. Please rate how often you usually: Wash your hands or use hand sanitizer between activities.
(n=2,377)
(n=8,531)
a. Never 2.5% (±0.9) 3.0% (±0.6)
b. Only some of the time 13.1% (±3.5) 14.9% (±1.1)
c. About half of the time 17.9% (±2.0) 19.0% (±1.1)
d. Most of the time 38.6% (±1.9) 36.7% (±1.1)
e. All the time 27.9% (±4.6) 26.4% (±1.9)
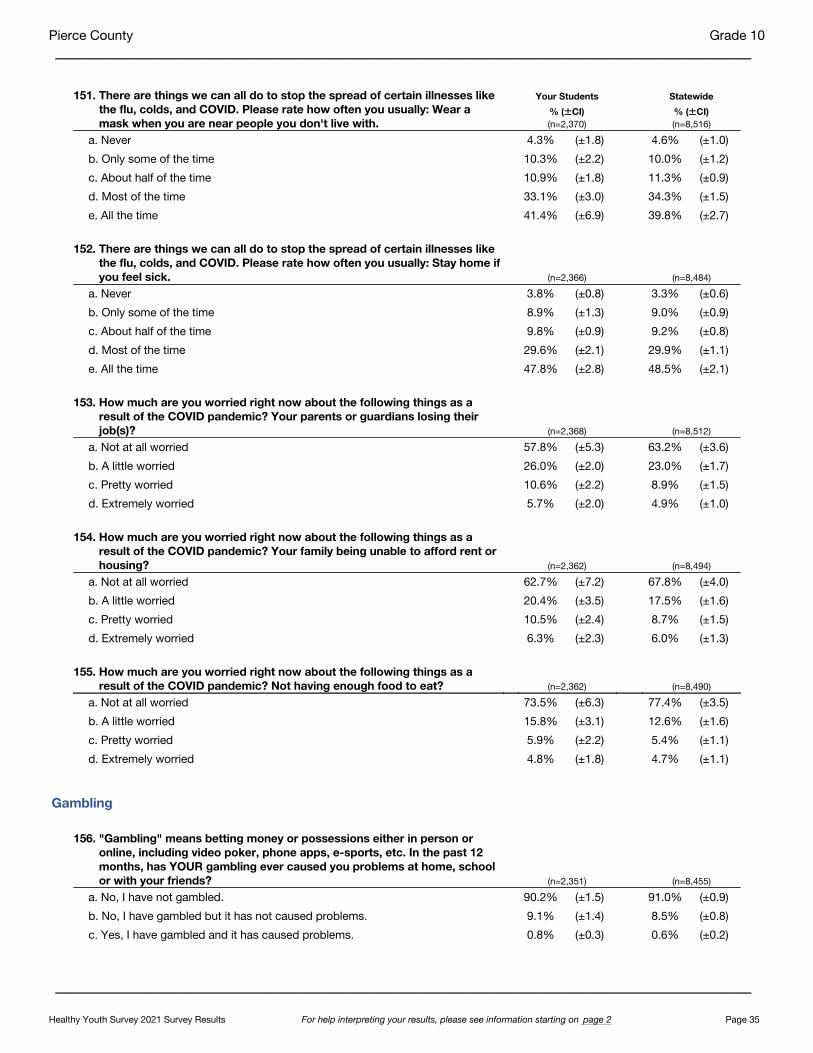
Healthy Youth Survey 2021 Survey Results For help interpreting your results, please see information starting on page 2 Page 35
ƒƒƒƒƒƒƒƒƒƒƒƒƒƒƒƒƒƒƒƒƒƒƒƒƒƒƒƒƒƒƒƒƒƒƒƒƒƒƒƒƒƒƒƒƒƒƒƒƒƒƒƒƒƒƒƒƒƒ
Pierce County Grade 10
ƒƒƒƒƒƒƒƒƒƒƒƒƒƒƒƒƒƒƒƒƒƒƒƒƒƒƒƒƒƒƒƒƒƒƒƒƒƒƒƒƒƒƒƒƒƒƒƒƒƒƒƒƒƒƒƒƒƒ151. There are things we can all do to stop the spread of certain illnesses like
the flu, colds, and COVID. Please rate how often you usually: Wear a mask when you are near people you don't live with.
Your Students
% ( ± CI) (n=2,370)
Statewide
% ( ± CI) (n=8,516)
a. Never 4.3% (±1.8) 4.6% (±1.0)
b. Only some of the time 10.3% (±2.2) 10.0% (±1.2)
c. About half of the time 10.9% (±1.8) 11.3% (±0.9)
d. Most of the time 33.1% (±3.0) 34.3% (±1.5)
e. All the time 41.4% (±6.9) 39.8% (±2.7)
152. There are things we can all do to stop the spread of certain illnesses like the flu, colds, and COVID. Please rate how often you usually: Stay home if you feel sick.
(n=2,366)
(n=8,484)
a. Never 3.8% (±0.8) 3.3% (±0.6)
b. Only some of the time 8.9% (±1.3) 9.0% (±0.9)
c. About half of the time 9.8% (±0.9) 9.2% (±0.8)
d. Most of the time 29.6% (±2.1) 29.9% (±1.1)
e. All the time 47.8% (±2.8) 48.5% (±2.1)
153. How much are you worried right now about the following things as a result of the COVID pandemic? Your parents or guardians losing their job(s)?
(n=2,368)
(n=8,512)
a. Not at all worried 57.8% (±5.3) 63.2% (±3.6)
b. A little worried 26.0% (±2.0) 23.0% (±1.7)
c. Pretty worried 10.6% (±2.2) 8.9% (±1.5)
d. Extremely worried 5.7% (±2.0) 4.9% (±1.0)
154. How much are you worried right now about the following things as a result of the COVID pandemic? Your family being unable to afford rent or housing?
(n=2,362)
(n=8,494)
a. Not at all worried 62.7% (±7.2) 67.8% (±4.0)
b. A little worried 20.4% (±3.5) 17.5% (±1.6)
c. Pretty worried 10.5% (±2.4) 8.7% (±1.5)
d. Extremely worried 6.3% (±2.3) 6.0% (±1.3)
155. How much are you worried right now about the following things as a result of the COVID pandemic? Not having enough food to eat?
(n=2,362)
(n=8,490)
a. Not at all worried 73.5% (±6.3) 77.4% (±3.5)
b. A little worried 15.8% (±3.1) 12.6% (±1.6)
c. Pretty worried 5.9% (±2.2) 5.4% (±1.1)
d. Extremely worried 4.8% (±1.8) 4.7% (±1.1)
Gambling
156. "Gambling" means betting money or possessions either in person or online, including video poker, phone apps, e-sports, etc. In the past 12 months, has YOUR gambling ever caused you problems at home, school or with your friends?
(n=2,351)
(n=8,455)
a. No, I have not gambled. 90.2% (±1.5) 91.0% (±0.9)
b. No, I have gambled but it has not caused problems. 9.1% (±1.4) 8.5% (±0.8)
c. Yes, I have gambled and it has caused problems. 0.8% (±0.3) 0.6% (±0.2)

Healthy Youth Survey 2021 Survey Results For help interpreting your results, please see information starting on page 2 Page 36
ƒƒƒƒƒƒƒƒƒƒƒƒƒƒƒƒƒƒƒƒƒƒƒƒƒƒƒƒƒƒƒƒƒƒƒƒƒƒƒƒƒƒƒƒƒƒƒƒƒƒƒƒƒƒƒƒƒƒ
Pierce County Grade 10
ƒƒƒƒƒƒƒƒƒƒƒƒƒƒƒƒƒƒƒƒƒƒƒƒƒƒƒƒƒƒƒƒƒƒƒƒƒƒƒƒƒƒƒƒƒƒƒƒƒƒƒƒƒƒƒƒƒƒ
School ClimateIn the past few years Washington State has given increased attention to supportive learning environments. Students need a safe, nurturing, healthy, and civil learning environment if they are to be successful in school. This section provides information about student perceptions of school climate.
157. "Bullying" is when one or more students threaten, spread rumors about,hit, shove, or otherwise hurt another student over and over again. It is not bullying when two students of about the same strength or power argue or fight or tease each other in a friendly way. In the last 30 days, how often have you been bullied?
Your Students
% ( ± CI) (n=2,358)
Statewide
% ( ± CI) (n=8,499)
a. I have not been bullied. 86.7% (±1.4) 86.7% (±1.4)
b. Once 5.8% (±0.8) 6.0% (±0.7)
c. 2 - 3 times 4.8% (±1.2) 4.4% (±0.7)
d. About once a week 1.1% (±0.3) 1.4% (±0.3)
e. Several times a week 1.7% (±0.6) 1.5% (±0.3)
158. In the past 30 days, how often were you bullied, harassed, or intimidated:Because of your race, ethnicity, or national origin or what someone thought it was?
(n=1,224)
(n=4,364)
a. 0 times 90.5% (±1.8) * 93.3% (±0.9)
b. 1 time 5.3% (±1.6) 3.4% (±0.6)
c. 2 - 3 times 2.5% (±0.9) 2.1% (±0.4)
d. About once a week 0.7% (±0.6) 0.5% (±0.2)
e. Several times a week or more 1.1% (±0.6) 0.7% (±0.3)
159. In the past 30 days, how often were you bullied, harassed, or intimidated:Because someone thought you were gay, lesbian, or bisexual (whether you are or are not)?
(n=1,219)
(n=4,353)
a. 0 times 90.4% (±2.0) 91.4% (±1.2)
b. 1 time 4.3% (±1.2) 4.2% (±0.6)
c. 2 - 3 times 3.2% (±1.3) 2.5% (±0.7)
d. About once a week 0.7% (±0.4) 0.9% (±0.3)
e. Several times a week or more 1.3% (±0.6) 1.0% (±0.3)
160. During the past 30 days, on how many days did you not go to school because you felt you would be unsafe on your way to and from school?
(n=1,241)
(n=4,381)
a. 0 days 89.2% (±5.5) 91.3% (±1.5)
b. 1 day 6.0% (±4.6) 4.0% (±0.8)
c. 2 or 3 days 3.2% (±1.5) 2.6% (±0.6)
d. 4 or 5 days 0.5% (±0.3) 0.7% (±0.2)
e. 6 or more days 0.9% (±0.7) 1.0% (±0.3)
f. I did not travel to school in the past 30 days. 0.2% (±0.2) 0.4% (±0.2)

Healthy Youth Survey 2021 Survey Results For help interpreting your results, please see information starting on page 2 Page 37
ƒƒƒƒƒƒƒƒƒƒƒƒƒƒƒƒƒƒƒƒƒƒƒƒƒƒƒƒƒƒƒƒƒƒƒƒƒƒƒƒƒƒƒƒƒƒƒƒƒƒƒƒƒƒƒƒƒƒ
Pierce County Grade 10
ƒƒƒƒƒƒƒƒƒƒƒƒƒƒƒƒƒƒƒƒƒƒƒƒƒƒƒƒƒƒƒƒƒƒƒƒƒƒƒƒƒƒƒƒƒƒƒƒƒƒƒƒƒƒƒƒƒƒ
161. During the past 30 days, on how many days did you not participate in school activities because you felt unsafe?
Your Students
% ( ± CI) (n=1,238)
Statewide
% ( ± CI) (n=4,368)
a. 0 days 90.9% (±3.6) 91.8% (±0.8)
b. 1 day 5.9% (±3.7) 4.3% (±0.6)
c. 2 or 3 days 2.1% (±1.1) 2.6% (±0.5)
d. 4 or 5 days 0.6% (±0.5) 0.6% (±0.2)
e. 6 or more days 0.6% (±0.4) 0.7% (±0.2)
162. In the past 30 days, how often have you been bullied by someone using social media, a phone, or video games?
(n=1,224)
(n=4,375)
a. I have not been bullied. 86.8% (±1.8) 88.3% (±1.4)
b. Once 6.8% (±1.6) 5.3% (±0.8)
c. 2 - 3 times 3.6% (±0.5) 3.8% (±0.5)
d. About once a week 1.6% (±0.6) 1.0% (±0.3)
e. Several times a week 1.1% (±0.3) 1.6% (±0.5)
163. During the past 30 days, have you received sexually suggestive or revealing messages, images, photos or videos via text, app, or social media?
(n=1,222)
(n=4,352)
a. Yes 20.4% (±4.1) 18.8% (±1.7)
b. No 79.6% (±4.1) 81.2% (±1.7)
164. When a student is being bullied, how often do teachers or other adults at school try to put a stop to it?
(n=1,196)
(n=4,238)
a. Almost always 18.8% (±4.0) 17.9% (±2.1)
b. Often 22.7% (±2.6) 22.3% (±1.9)
c. Sometimes 24.6% (±1.9) 25.1% (±1.6)
d. Once in a while 17.7% (±2.9) 17.9% (±1.8)
e. Almost never 16.1% (±2.5) 16.8% (±2.0)
165. If you see bullying or have been bullied during school do you know how to report it?
(n=1,218)
(n=4,352)
a. Yes 67.7% (±5.6) 64.7% (±2.8)
b. No 12.2% (±2.7) 14.8% (±1.6)
c. Not sure 20.1% (±3.2) 20.5% (±1.7)
166. Does your school provide a counselor, intervention specialist, or other school staff member for students to discuss problems with alcohol,tobacco, or other drugs?
(n=1,128)
(n=4,277)
a. No 6.6% (±1.9) 5.3% (±0.9)
b. Yes 51.2% (±8.6) 59.0% (±3.5)
c. Not sure 42.3% (±7.2) 35.6% (±3.3)
167. In the last year, did you have any contact with a school counselor? (n=1,237) (n=4,373)
a. Yes 40.2% (±5.7) 45.6% (±3.8)
b. No 58.6% (±5.2) 53.6% (±3.7)
c. I do not have a school counselor 1.2% (±0.9) 0.8% (±0.3)
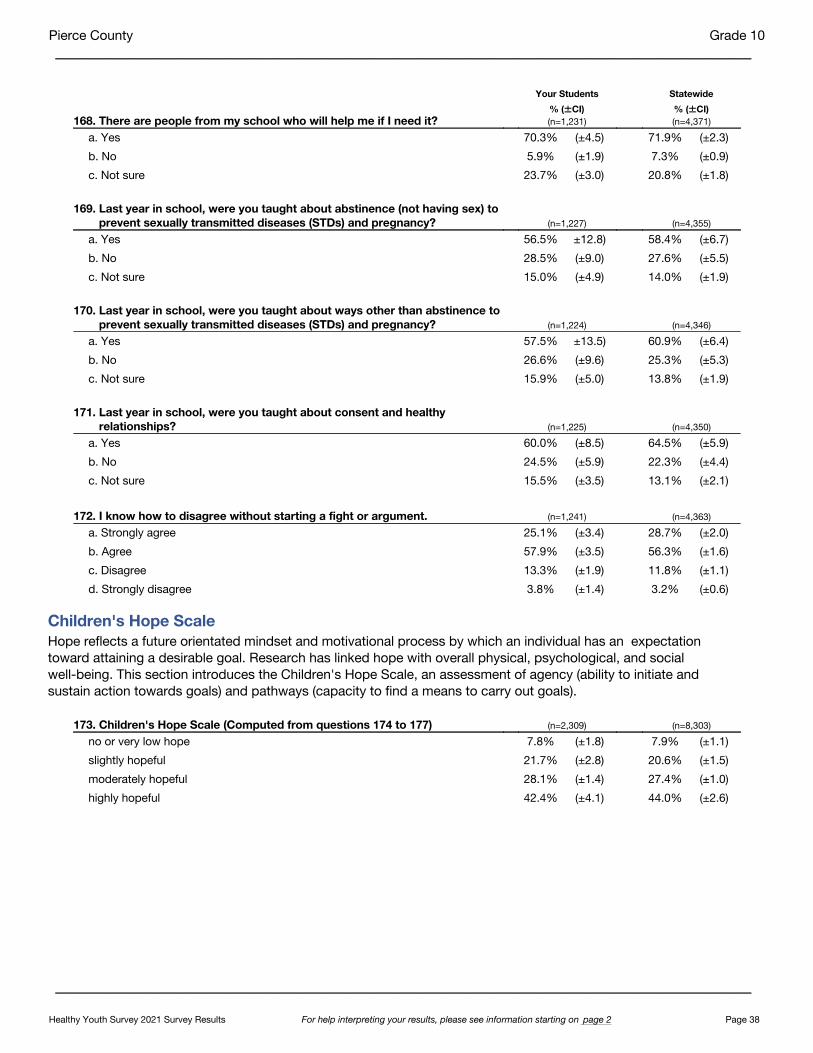
Healthy Youth Survey 2021 Survey Results For help interpreting your results, please see information starting on page 2 Page 38
ƒƒƒƒƒƒƒƒƒƒƒƒƒƒƒƒƒƒƒƒƒƒƒƒƒƒƒƒƒƒƒƒƒƒƒƒƒƒƒƒƒƒƒƒƒƒƒƒƒƒƒƒƒƒƒƒƒƒ
Pierce County Grade 10
ƒƒƒƒƒƒƒƒƒƒƒƒƒƒƒƒƒƒƒƒƒƒƒƒƒƒƒƒƒƒƒƒƒƒƒƒƒƒƒƒƒƒƒƒƒƒƒƒƒƒƒƒƒƒƒƒƒƒ
168. There are people from my school who will help me if I need it?
Your Students
% ( ± CI) (n=1,231)
Statewide
% ( ± CI) (n=4,371)
a. Yes 70.3% (±4.5) 71.9% (±2.3)
b. No 5.9% (±1.9) 7.3% (±0.9)
c. Not sure 23.7% (±3.0) 20.8% (±1.8)
169. Last year in school, were you taught about abstinence (not having sex) to prevent sexually transmitted diseases (STDs) and pregnancy?
(n=1,227)
(n=4,355)
a. Yes 56.5% ±12.8) 58.4% (±6.7)
b. No 28.5% (±9.0) 27.6% (±5.5)
c. Not sure 15.0% (±4.9) 14.0% (±1.9)
170. Last year in school, were you taught about ways other than abstinence to prevent sexually transmitted diseases (STDs) and pregnancy?
(n=1,224)
(n=4,346)
a. Yes 57.5% ±13.5) 60.9% (±6.4)
b. No 26.6% (±9.6) 25.3% (±5.3)
c. Not sure 15.9% (±5.0) 13.8% (±1.9)
171. Last year in school, were you taught about consent and healthy relationships?
(n=1,225)
(n=4,350)
a. Yes 60.0% (±8.5) 64.5% (±5.9)
b. No 24.5% (±5.9) 22.3% (±4.4)
c. Not sure 15.5% (±3.5) 13.1% (±2.1)
172. I know how to disagree without starting a fight or argument. (n=1,241) (n=4,363)
a. Strongly agree 25.1% (±3.4) 28.7% (±2.0)
b. Agree 57.9% (±3.5) 56.3% (±1.6)
c. Disagree 13.3% (±1.9) 11.8% (±1.1)
d. Strongly disagree 3.8% (±1.4) 3.2% (±0.6)
Children's Hope ScaleHope reflects a future orientated mindset and motivational process by which an individual has an expectation toward attaining a desirable goal. Research has linked hope with overall physical, psychological, and social well-being. This section introduces the Children's Hope Scale, an assessment of agency (ability to initiate and sustain action towards goals) and pathways (capacity to find a means to carry out goals).
173. Children's Hope Scale (Computed from questions 174 to 177) (n=2,309) (n=8,303)
no or very low hope 7.8% (±1.8) 7.9% (±1.1)
slightly hopeful 21.7% (±2.8) 20.6% (±1.5)
moderately hopeful 28.1% (±1.4) 27.4% (±1.0)
highly hopeful 42.4% (±4.1) 44.0% (±2.6)

Healthy Youth Survey 2021 Survey Results For help interpreting your results, please see information starting on page 2 Page 39
ƒƒƒƒƒƒƒƒƒƒƒƒƒƒƒƒƒƒƒƒƒƒƒƒƒƒƒƒƒƒƒƒƒƒƒƒƒƒƒƒƒƒƒƒƒƒƒƒƒƒƒƒƒƒƒƒƒƒ
Pierce County Grade 10
ƒƒƒƒƒƒƒƒƒƒƒƒƒƒƒƒƒƒƒƒƒƒƒƒƒƒƒƒƒƒƒƒƒƒƒƒƒƒƒƒƒƒƒƒƒƒƒƒƒƒƒƒƒƒƒƒƒƒ
174. I can think of many ways to get the things in life that are most important to me.
Your Students
% ( ± CI) (n=2,352)
Statewide
% ( ± CI) (n=8,418)
a. None of the time 4.1% (±0.9) 3.9% (±0.6)
b. A little of the time 9.8% (±1.5) 9.1% (±1.0)
c. Some of the time 26.1% (±2.6) 25.9% (±1.4)
d. A lot of the time 22.7% (±2.1) 21.1% (±1.0)
e. Most of the time 22.7% (±3.0) 24.9% (±1.6)
f. All of the time 14.6% (±1.7) 15.2% (±1.1)
175. I am doing just as well as other kids my age. (n=2,351) (n=8,437)
a. None of the time 6.0% (±1.2) 6.4% (±0.9)
b. A little of the time 13.2% (±1.9) 13.5% (±1.0)
c. Some of the time 22.2% (±2.3) 21.1% (±1.3)
d. A lot of the time 17.2% (±2.3) 16.8% (±1.0)
e. Most of the time 25.8% (±3.7) 25.0% (±1.8)
f. All of the time 15.6% (±1.9) 17.1% (±1.4)
176. When I have a problem, I can come up with lots of ways to solve it. (n=2,344) (n=8,389)
a. None of the time 4.4% (±1.0) 4.5% (±0.7)
b. A little of the time 14.1% (±1.6) 13.5% (±1.3)
c. Some of the time 25.2% (±2.8) 24.1% (±1.4)
d. A lot of the time 21.2% (±1.8) 20.4% (±0.9)
e. Most of the time 21.5% (±3.0) 23.6% (±1.9)
f. All of the time 13.6% (±2.2) 13.9% (±1.1)
177. I think the things I have done in the past will help me in the future. (n=2,346) (n=8,410)
a. None of the time 8.8% (±1.4) 8.3% (±1.2)
b. A little of the time 13.9% (±1.8) 12.9% (±1.1)
c. Some of the time 25.3% (±2.2) 23.5% (±1.1)
d. A lot of the time 16.3% (±2.1) 17.3% (±0.9)
e. Most of the time 20.1% (±3.0) 21.7% (±1.7)
f. All of the time 15.6% (±1.8) 16.2% (±0.9)
Washington Healthy Youth Survey – Adverse Childhood Experiences Scale (WAH-ACEs)
Eleven questions from the HYS were selected to be included in the WAH-ACEs score based on review of public health, social work, and psychology literature on adverse experiences among children, youth and young adults and the association with short and long-term effects on their health and wellbeing. These questions addressed the topics identified in the literature review, including intimate partner violence, physical or sexual abuse by an adult,safety in school, bullying, and financial hardship, among other topics. Some adverse experiences identified in the literature were not captured in HYS questions and could therefore not be included in WAH-ACEs (e.g., neglect).
For each question, a student could get a value of 0 or 1 and these were added up to create their final score.Sometimes students did not answer all questions on the survey; the WAH-ACEs score accounts for any missing answers to give schools and districts a more precise picture of what their students are experiencing. For more information about the WAH-ACEs, please see WAH-ACEs Interpretive Guide.

Healthy Youth Survey 2021 Survey Results For help interpreting your results, please see information starting on page 2 Page 40
ƒƒƒƒƒƒƒƒƒƒƒƒƒƒƒƒƒƒƒƒƒƒƒƒƒƒƒƒƒƒƒƒƒƒƒƒƒƒƒƒƒƒƒƒƒƒƒƒƒƒƒƒƒƒƒƒƒƒ
Pierce County Grade 10
ƒƒƒƒƒƒƒƒƒƒƒƒƒƒƒƒƒƒƒƒƒƒƒƒƒƒƒƒƒƒƒƒƒƒƒƒƒƒƒƒƒƒƒƒƒƒƒƒƒƒƒƒƒƒƒƒƒƒ
178. Adverse Childhood Experiences Scale (WAH-ACEs)
Your Students
% ( ± CI) (n=975)
Statewide
% ( ± CI) (n=2,861)
O ACEs 37.3% (±4.3) 42.9% (±4.2)
1 ACEs 23.9% (±1.9) 23.4% (±1.9)
2 ACEs 14.2% (±1.8) 13.3% (±1.4)
3 ACEs 10.1% (±2.7) 9.0% (±1.6)
4 or more ACEs 14.6% (±3.3) 11.4% (±2.1)

Healthy Youth Survey 2021 Survey Results For help interpreting your results, please see information starting on page 2 Page 41
ƒƒƒƒƒƒƒƒƒƒƒƒƒƒƒƒƒƒƒƒƒƒƒƒƒƒƒƒƒƒƒƒƒƒƒƒƒƒƒƒƒƒƒƒƒƒƒƒƒƒƒƒƒƒƒƒƒƒ
Pierce County Grade 10
ƒƒƒƒƒƒƒƒƒƒƒƒƒƒƒƒƒƒƒƒƒƒƒƒƒƒƒƒƒƒƒƒƒƒƒƒƒƒƒƒƒƒƒƒƒƒƒƒƒƒƒƒƒƒƒƒƒƒ
Risk and Protective FactorsDecades of research have shown that certain risk factors are associated with increased likelihood of health risk behaviors including ATOD use, violence, and delinquent behaviors. Similarly, research from Drs. Hawkins and Catalano and associates at the University of Washington, has shown that protective factors exert a positive influence against the negative influence of risk factors. The premise of the risk reduction and protective factor enhancement approach to prevention is that preventing a problem before it occurs requires addressing the factors that predict the problem. Ideally, this strategy entails discovering the causes of the problem behavior and influencing those causes. Many of the survey questions were used to assess students’ status on risk and protective factors in the community, school, and peer-individual domains. Composite scales were computed for use in local program planning.
Risk and Protective Factor Framework and Reporting ScheduleThis table provides a list of risk and protective factors included in the Healthy Youth Survey by year.
2008 2010 2012 2014 2016 2018 2021Community Risk Factors
Low Neighborhood Attachment X S X S X S
Perceived Availability of Drugs X X X X X X XPerceived Availability of Handguns X S X S X S X S X S
Laws And Norms Favorable to Drug Use X X X X X X X E
Community Protective FactorsOpportunities for Prosocial Involvement X S X S X S X S X S X S X S
Rewards for Prosocial Involvement X X E X E X E X E X E X E
Family Risk FactorsPoor Family Management X S, † X S, † X S, † X S X S X S X S
Parental Attitudes Favorable towards Drug Use X S, † X S X S X S X S X S X S
Family Protective FactorsOpportunities for Prosocial Involvement X † X † X † X X X XRewards for Prosocial Involvement X † X † X † X E X E X E X E
School Risk FactorsAcademic Failure X X X X X X XLow Commitment to School X X X X X X X
School Protective FactorsOpportunities for Prosocial Involvement X S X S X S X S X S X S X S
Rewards for Prosocial Involvement X X X X X X X
Peer-Individual Risk FactorsPerceived Risk of Drug Use X X X X X X XEarly Initiation of Drug Use X S X S X S X S X S X S X S
Early Initiation of Antisocial Behavior X S X S X S Favorable Attitudes Towards Drug Use X X X X X X XFavorable Attitudes Towards Antisocial Behavior X S X S Rewards for Antisocial Involvement X S Friends’ Use of Drugs X S X S X S X S X S X S X S
Interaction With Antisocial Peers X S X S X S Intentions to Use X S X S X S
Peer-Individual Protective FactorsInteraction With Prosocial Peers X X S X S X S X S Belief in the Moral Order X S X S X S X S X S Prosocial Involvement X E X E X E X E X E Social Skills X S X S X S X S X S X S
Note: X S = included only on the secondary version; X E = included only on the elementary version; X † = removable questions.

Healthy Youth Survey 2021 Survey Results For help interpreting your results, please see information starting on page 2 Page 42
ƒƒƒƒƒƒƒƒƒƒƒƒƒƒƒƒƒƒƒƒƒƒƒƒƒƒƒƒƒƒƒƒƒƒƒƒƒƒƒƒƒƒƒƒƒƒƒƒƒƒƒƒƒƒƒƒƒƒ
Pierce County Grade 10
ƒƒƒƒƒƒƒƒƒƒƒƒƒƒƒƒƒƒƒƒƒƒƒƒƒƒƒƒƒƒƒƒƒƒƒƒƒƒƒƒƒƒƒƒƒƒƒƒƒƒƒƒƒƒƒƒƒƒ
Risk and Protective Factor Scale Results and GraphsFor each risk factor scale, the percentage of students who are at risk (i.e., who agreed with statements that predict ATOD use or other problem behaviors) is reported; higher percentages indicate that more students are likely to engage in problem behaviors. For each protective factor scale, the percentage of students who are resilient (i.e., who agreed with statements that predict the ability to resist ATOD use or other problem behaviors) is reported; higher percentages indicate that fewer students are likely to engage in problem behaviors. These percentages are based on computational methods provided by the University of Washington’s Social Development Research Group.
Community Domain Risk Factors
Your Students % ( ± CI)
Statewide % ( ± CI)
Perceived Availability of Drugs (Questions 179-182) (n=1,107) (n=4,175)
13.1% (±2.6) 13.2% (±1.2)
Perceived Availability of Handguns (Question 183) (n=1,105) (n=4,159)
11.8% (±2.3) 12.1% (±1.5)
Laws And Norms Favorable to Drug Use (Questions 184-189)
NA E NA E
Low Neighborhood Attachment (Questions 190-192) (n=1,122) (n=4,247)
44.7% (±6.6) 40.3% (±3.5)Protective Factors
Opportunities for Prosocial Involvement (Questions 193-196) (n=1,076) (n=4,082)
53.3% ±11.5) 59.7% (±5.4)
Rewards for Prosocial Involvement (Questions 197-199)
NA E NA E
Your Students Statewide
% o
f Stu
dent
s
0%
20%
40%
60%
80%
100%
RISKPerceivedAvailabilityof Drugs
RISKPerceivedAvailability
of Handguns
RISKLaws and Norms
Favorable toDrug Use
RISKLow Neighborhood
Attachment
13% 13% 12% 12%
NAE
45% 40%
Community Risk Factors
Your Students Statewide
% o
f Stu
dent
s
0%
20%
40%
60%
80%
100%
PROTECTIVEOpportunities for
ProsocialInvolvement
PROTECTIVERewards for
ProsocialInvolvement
53% 60%
NAE
Community Protective Factors Note: NA S = included only on the secondary version; NA E = included only on the elementary version.

Healthy Youth Survey 2021 Survey Results For help interpreting your results, please see information starting on page 2 Page 43
ƒƒƒƒƒƒƒƒƒƒƒƒƒƒƒƒƒƒƒƒƒƒƒƒƒƒƒƒƒƒƒƒƒƒƒƒƒƒƒƒƒƒƒƒƒƒƒƒƒƒƒƒƒƒƒƒƒƒ
Pierce County Grade 10
ƒƒƒƒƒƒƒƒƒƒƒƒƒƒƒƒƒƒƒƒƒƒƒƒƒƒƒƒƒƒƒƒƒƒƒƒƒƒƒƒƒƒƒƒƒƒƒƒƒƒƒƒƒƒƒƒƒƒ
Family Domain Risk Factors
Your Students % ( ± CI)
Statewide % ( ± CI)
Poor Family Management (Questions 200-207) (n=1,107) (n=4,217)
26.1% (±3.6) 24.4% (±2.2)
Parental Attitudes Favorable Towards Drug Use (Questions 215-217) (n=1,122) (n=4,244)
45.0% (±3.3) 43.0% (±3.0)Protective Factors
Opportunities for Prosocial Involvement (Questions 208-210) (n=1,116) (n=4,240)
58.2% (±4.8) 61.0% (±2.4)
Rewards for Prosocial Involvement (Questions 211–214)
NA E NA E
Your Students Statewide
% o
f Stu
dent
s
0%
20%
40%
60%
80%
100%
RISKPoor Family
Management
RISKParental Attitudes
Favorable TowardsDrug Use
PROTECTIVEOpportunities for
ProsocialInvolvement
PROTECTIVERewards for
ProsocialInvolvement
26% 24%
45% 43%
58% 61%
NAE
Family Risk Factors Family Protective Factors

Healthy Youth Survey 2021 Survey Results For help interpreting your results, please see information starting on page 2 Page 44
ƒƒƒƒƒƒƒƒƒƒƒƒƒƒƒƒƒƒƒƒƒƒƒƒƒƒƒƒƒƒƒƒƒƒƒƒƒƒƒƒƒƒƒƒƒƒƒƒƒƒƒƒƒƒƒƒƒƒ
Pierce County Grade 10
ƒƒƒƒƒƒƒƒƒƒƒƒƒƒƒƒƒƒƒƒƒƒƒƒƒƒƒƒƒƒƒƒƒƒƒƒƒƒƒƒƒƒƒƒƒƒƒƒƒƒƒƒƒƒƒƒƒƒ
School Domain Risk Factors
Your Students % ( ± CI)
Statewide % ( ± CI)
Academic Failure (Questions 218–219) (n=1,106) (n=4,195)
50.9% (±7.0) 48.2% (±3.9)
Low Commitment to School (Questions 220–226) (n=1,128) (n=4,261)
59.9% (±4.9) 56.6% (±2.6)Protective Factors
Opportunities for Prosocial Involvement (Questions 227–231) (n=1,122) (n=4,241)
70.8% (±6.2) 69.7% (±2.4)
Rewards for Prosocial Involvement (Questions 232–235) (n=1,118) (n=4,230)
64.2% (±6.4) 62.6% (±2.3)
Your Students Statewide
% o
f Stu
dent
s
0%
20%
40%
60%
80%
100%
RISKAcademic
Failure
RISKLow Commitment
to School
PROTECTIVEOpportunities for
ProsocialInvolvement
PROTECTIVERewards for
ProsocialInvolvement
51% 48%
60% 57%
71% 70% 64%
63%
School Risk Factors School Protective Factors
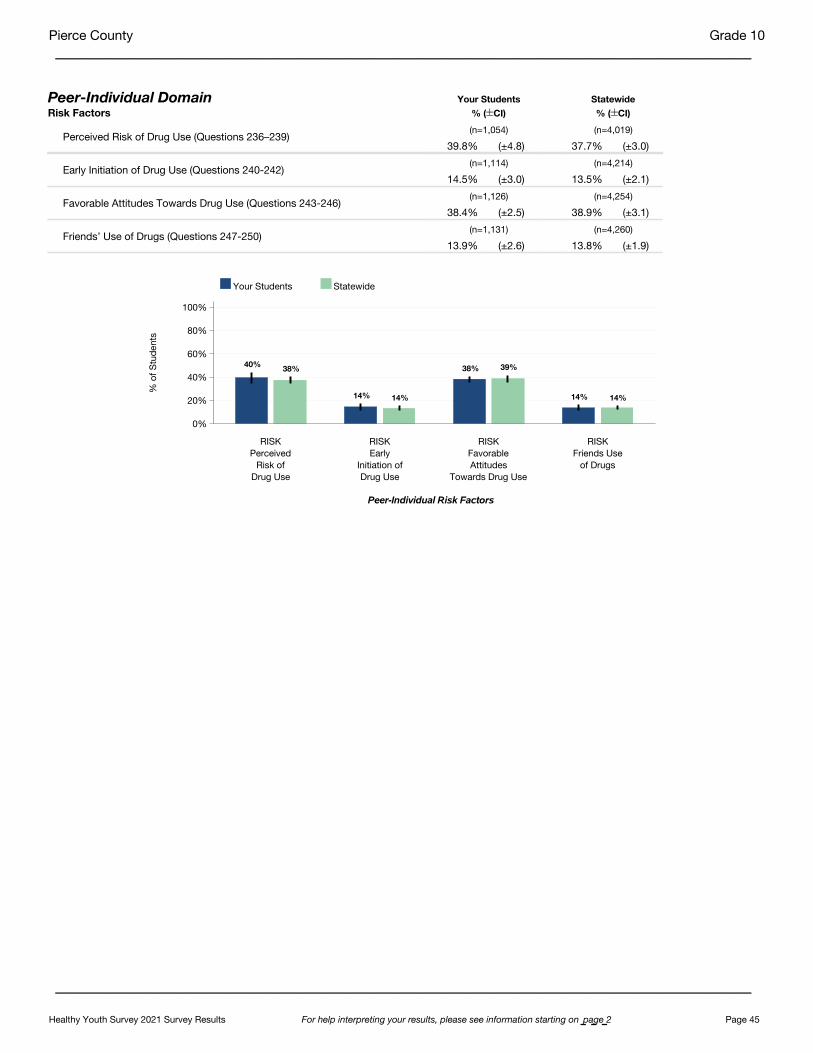
Healthy Youth Survey 2021 Survey Results For help interpreting your results, please see information starting on page 2 Page 45
ƒƒƒƒƒƒƒƒƒƒƒƒƒƒƒƒƒƒƒƒƒƒƒƒƒƒƒƒƒƒƒƒƒƒƒƒƒƒƒƒƒƒƒƒƒƒƒƒƒƒƒƒƒƒƒƒƒƒ
Pierce County Grade 10
ƒƒƒƒƒƒƒƒƒƒƒƒƒƒƒƒƒƒƒƒƒƒƒƒƒƒƒƒƒƒƒƒƒƒƒƒƒƒƒƒƒƒƒƒƒƒƒƒƒƒƒƒƒƒƒƒƒƒ
Peer-Individual Domain Risk Factors
Your Students % ( ± CI)
Statewide % ( ± CI)
Perceived Risk of Drug Use (Questions 236–239) (n=1,054) (n=4,019)
39.8% (±4.8) 37.7% (±3.0)
Early Initiation of Drug Use (Questions 240-242) (n=1,114) (n=4,214)
14.5% (±3.0) 13.5% (±2.1)
Favorable Attitudes Towards Drug Use (Questions 243-246) (n=1,126) (n=4,254)
38.4% (±2.5) 38.9% (±3.1)
Friends’ Use of Drugs (Questions 247-250) (n=1,131) (n=4,260)
13.9% (±2.6) 13.8% (±1.9)
Your Students Statewide
% o
f Stu
dent
s
0%
20%
40%
60%
80%
100%
RISKPerceived
Risk ofDrug Use
RISKEarly
Initiation ofDrug Use
RISKFavorableAttitudes
Towards Drug Use
RISKFriends Use
of Drugs
40% 38%
14% 14%
38% 39%
14% 14%
Peer-Individual Risk Factors

Healthy Youth Survey 2021 Survey Results For help interpreting your results, please see information starting on page 2 Page 46
ƒƒƒƒƒƒƒƒƒƒƒƒƒƒƒƒƒƒƒƒƒƒƒƒƒƒƒƒƒƒƒƒƒƒƒƒƒƒƒƒƒƒƒƒƒƒƒƒƒƒƒƒƒƒƒƒƒƒ
Pierce County Grade 10
ƒƒƒƒƒƒƒƒƒƒƒƒƒƒƒƒƒƒƒƒƒƒƒƒƒƒƒƒƒƒƒƒƒƒƒƒƒƒƒƒƒƒƒƒƒƒƒƒƒƒƒƒƒƒƒƒƒƒ
Risk and Protective Factor Graph of All Scale Results
0% 20% 40% 60% 80% 100%
Your Students Statewide
% of Student at Risk or Protected
Community Risk Factors
Perceived Availability of Drugs13.1%
13.2%
Perceived Availability of Handguns11.8%
12.1%
Laws and Norms Favorable to Drug Use NAE
Low Neighborhood Attachment44.7%
40.3%
Community Protective Factors
Opportunities for Prosocial Involvement53.3%
59.7%
Rewards for Prosocial Involvement NAE
Family Risk Factors
Poor Family Management26.1%
24.4%
Parental Attitudes Favorable Towards Drug Use45.0%
43.0%
Family Protective Factors
Opportunities for Prosocial Involvement58.2%
61.0%
Rewards for Prosocial Involvement NAE
School Risk Factors
Academic Failure50.9%
48.2%
Low Commitment to School59.9%
56.6%
School Protective Factors
Opportunities for Prosocial Involvement70.8%
69.7%
Rewards for Prosocial Involvement64.2%
62.6%
Peer-Individual Risk Factors
Perceived Risk of Drug Use39.8%
37.7%
Early Initiation of Drug Use14.5%
13.5%
Favorable Attitudes Towards Drug Use38.4%
38.9%
Friends Use of Drugs13.9%
13.8%
Note: NA S = included only on the secondary version; NA E = included only on the elementary version.

Healthy Youth Survey 2021 Survey Results For help interpreting your results, please see information starting on page 2 Page 47
ƒƒƒƒƒƒƒƒƒƒƒƒƒƒƒƒƒƒƒƒƒƒƒƒƒƒƒƒƒƒƒƒƒƒƒƒƒƒƒƒƒƒƒƒƒƒƒƒƒƒƒƒƒƒƒƒƒƒ
Pierce County Grade 10
ƒƒƒƒƒƒƒƒƒƒƒƒƒƒƒƒƒƒƒƒƒƒƒƒƒƒƒƒƒƒƒƒƒƒƒƒƒƒƒƒƒƒƒƒƒƒƒƒƒƒƒƒƒƒƒƒƒƒ
Risk and Protective Factors: Individual Question ResultsThe remainder of the report provides results for the individual survey questions used to compute the risk and protective factors.
Community Domain
Perceived Availability of Drugs (Questions 178-182)
179. If you wanted to get some beer, wine, or hard liquor, how easy would it be for you to get some?
Your Students
% ( ± CI) (n=1,109)
Statewide
% ( ± CI) (n=4,193)
a. Very hard 34.3% (±4.6) 32.4% (±2.9)
b. Sort of hard 29.3% (±3.4) 26.9% (±1.4)
c. Sort of easy 22.7% (±1.7) 25.7% (±1.8)
d. Very easy 13.7% (±1.9) 15.0% (±1.6)
180. If you wanted to get some cigarettes, how easy would it be for you to get some?
(n=1,104)
(n=4,179)
a. Very hard 49.1% (±4.2) 46.4% (±2.6)
b. Sort of hard 25.3% (±2.9) 27.3% (±1.8)
c. Sort of easy 15.7% (±1.9) 17.2% (±1.4)
d. Very easy 10.0% (±2.5) 9.2% (±1.1)
181. If you wanted to get some marijuana, how easy would it be for you to get some?
(n=1,095)
(n=4,134)
a. Very hard 45.3% (±4.4) 46.1% (±2.9)
b. Sort of hard 20.5% (±3.3) 22.3% (±1.4)
c. Sort of easy 18.5% (±2.2) 17.7% (±1.5)
d. Very easy 15.6% (±2.9) 14.0% (±1.5)
182. If you wanted to get a drug like cocaine, LSD, or amphetamines, how easy would it be for you to get some?
(n=1,104)
(n=4,169)
a. Very hard 78.0% (±3.1) 73.7% (±1.7)
b. Sort of hard 14.1% (±2.3) 17.6% (±1.3)
c. Sort of easy 5.2% (±1.5) 6.1% (±0.8)
d. Very easy 2.7% (±0.8) 2.6% (±0.6)
Perceived Availability of Hand Guns (Question 183)
183. If you wanted to get a handgun, how easy would it be for you to get one? (n=1,105) (n=4,159)
a. Very hard 71.0% (±2.4) 70.7% (±2.2)
b. Sort of hard 17.3% (±2.1) 17.2% (±1.2)
c. Sort of easy 6.7% (±2.0) 7.8% (±1.0)
d. Very easy 5.1% (±1.3) 4.4% (±0.8)

Healthy Youth Survey 2021 Survey Results For help interpreting your results, please see information starting on page 2 Page 48
ƒƒƒƒƒƒƒƒƒƒƒƒƒƒƒƒƒƒƒƒƒƒƒƒƒƒƒƒƒƒƒƒƒƒƒƒƒƒƒƒƒƒƒƒƒƒƒƒƒƒƒƒƒƒƒƒƒƒ
Pierce County Grade 10
ƒƒƒƒƒƒƒƒƒƒƒƒƒƒƒƒƒƒƒƒƒƒƒƒƒƒƒƒƒƒƒƒƒƒƒƒƒƒƒƒƒƒƒƒƒƒƒƒƒƒƒƒƒƒƒƒƒƒ
Laws and Norms Favorable to Drug Use (Questions 184-189) [Questions 184-186 appear only on the elementary version of the survey.]
187. If a kid drank some beer, wine, or hard liquor in your neighborhood or community, would they be caught by the police?
Your Students
% ( ± CI) (n=1,112)
Statewide
% ( ± CI) (n=4,222)
a. NO! 19.8% (±3.3) 18.4% (±1.5)
b. No 55.2% (±4.4) 51.8% (±2.0)
c. yes 19.5% (±3.0) 23.2% (±1.7)
d. YES! 5.5% (±1.3) 6.6% (±1.1)
188. If a kid carried a handgun in your neighborhood or community, would they be caught by the police?
(n=1,111)
(n=4,204)
a. NO! 11.9% (±3.5) 10.7% (±1.5)
b. No 32.3% (±2.9) 28.6% (±2.5)
c. yes 38.3% (±3.7) 40.8% (±2.0)
d. YES! 17.5% (±2.1) 19.9% (±2.3)
189. If a kid used marijuana in your neighborhood or community, would they be caught by the police?
(n=1,111)
(n=4,211)
a. NO! 20.6% (±3.6) 19.0% (±1.7)
b. No 51.8% (±3.6) 48.4% (±2.2)
c. yes 21.4% (±2.9) 25.1% (±2.0)
d. YES! 6.2% (±1.4) 7.5% (±1.4)
Low Neighborhood Attachment (Questions 190-192)
190. I'd like to get out of my neighborhood or community. (n=1,117) (n=4,242)
a. NO! 21.8% (±2.7) 25.6% (±2.4)
b. No 48.1% (±3.4) 45.9% (±1.9)
c. yes 20.2% (±3.4) 19.4% (±1.8)
d. YES! 9.8% (±2.3) 9.0% (±1.2)
191. If I had to move, I would miss the neighborhood or community I now live in.
(n=1,125)
(n=4,248)
a. NO! 8.9% (±2.4) 7.5% (±1.3)
b. No 24.7% (±3.8) 22.4% (±2.2)
c. yes 42.9% (±3.2) 42.7% (±1.7)
d. YES! 23.5% (±4.5) 27.4% (±2.5)
192. I like my neighborhood / community. (n=1,113) (n=4,233)
a. NO! 5.3% (±2.0) 4.5% (±1.0)
b. No 17.6% (±3.6) 14.0% (±2.0)
c. yes 56.1% (±3.5) 57.2% (±1.7)
d. YES! 21.0% (±4.6) 24.2% (±2.4)

Healthy Youth Survey 2021 Survey Results For help interpreting your results, please see information starting on page 2 Page 49
ƒƒƒƒƒƒƒƒƒƒƒƒƒƒƒƒƒƒƒƒƒƒƒƒƒƒƒƒƒƒƒƒƒƒƒƒƒƒƒƒƒƒƒƒƒƒƒƒƒƒƒƒƒƒƒƒƒƒ
Pierce County Grade 10
ƒƒƒƒƒƒƒƒƒƒƒƒƒƒƒƒƒƒƒƒƒƒƒƒƒƒƒƒƒƒƒƒƒƒƒƒƒƒƒƒƒƒƒƒƒƒƒƒƒƒƒƒƒƒƒƒƒƒ
Opportunities for Prosocial Involvement (Questions 193-196)
193. There are adults in my neighborhood or community I could talk to about something important.
Your Students
% ( ± CI) (n=1,130)
Statewide
% ( ± CI) (n=4,259)
a. NO! 16.0% (±4.5) 13.2% (±1.9)
b. No 21.6% (±3.8) 21.5% (±2.1)
c. yes 37.8% (±4.1) 40.3% (±2.1)
d. YES! 24.6% (±5.0) 25.0% (±2.4)
Which of the following activities for people your age are available in your neighborhood or community?
194. Sports teams and recreation
(n=1,113)
(n=4,205)
a. Yes 70.4% (±9.7) 76.6% (±4.0)
b. No 29.6% (±9.7) 23.4% (±4.0)
195. Scouts, Camp Fire, 4-H Clubs, or other service clubs (n=1,088) (n=4,125)
a. Yes 50.3% ±10.6) 56.5% (±5.5)
b. No 49.7% ±10.6) 43.5% (±5.5)
196. Boys and Girls Club, YMCA, or other activity clubs (n=1,110) (n=4,144)
a. Yes 62.3% (±9.9) 66.0% (±5.5)
b. No 37.7% (±9.9) 34.0% (±5.5)
Rewards for Prosocial Involvement (Questions 197-199) [Questions 197-199 appear only on the elementary version of the survey.]
Family Domain
Poor Family Management (Questions 200-207)
200. My parent(s) ask if I've gotten my homework done. (n=1,127) (n=4,282)
a. NO! 4.1% (±1.6) 3.8% (±0.6)
b. No 12.8% (±1.9) 13.2% (±1.4)
c. yes 46.2% (±2.6) 44.1% (±1.9)
d. YES! 36.9% (±4.8) 38.8% (±2.7)
201. Would your parent(s) know if you did not come home on time? (n=1,110) (n=4,219)
a. NO! 1.7% (±1.0) 2.0% (±0.5)
b. No 7.9% (±1.1) 9.3% (±0.9)
c. yes 46.7% (±2.9) 45.3% (±2.6)
d. YES! 43.7% (±3.6) 43.4% (±2.8)
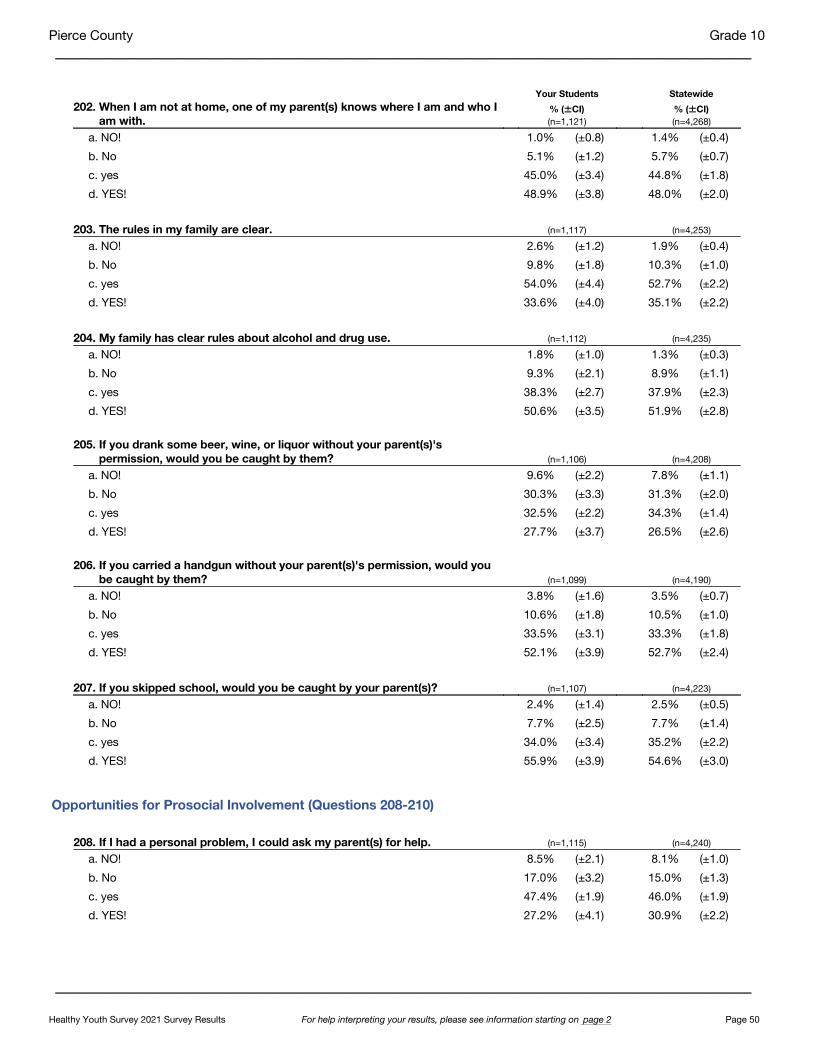
Healthy Youth Survey 2021 Survey Results For help interpreting your results, please see information starting on page 2 Page 50
ƒƒƒƒƒƒƒƒƒƒƒƒƒƒƒƒƒƒƒƒƒƒƒƒƒƒƒƒƒƒƒƒƒƒƒƒƒƒƒƒƒƒƒƒƒƒƒƒƒƒƒƒƒƒƒƒƒƒ
Pierce County Grade 10
ƒƒƒƒƒƒƒƒƒƒƒƒƒƒƒƒƒƒƒƒƒƒƒƒƒƒƒƒƒƒƒƒƒƒƒƒƒƒƒƒƒƒƒƒƒƒƒƒƒƒƒƒƒƒƒƒƒƒ
202. When I am not at home, one of my parent(s) knows where I am and who I am with.
Your Students
% ( ± CI) (n=1,121)
Statewide
% ( ± CI) (n=4,268)
a. NO! 1.0% (±0.8) 1.4% (±0.4)
b. No 5.1% (±1.2) 5.7% (±0.7)
c. yes 45.0% (±3.4) 44.8% (±1.8)
d. YES! 48.9% (±3.8) 48.0% (±2.0)
203. The rules in my family are clear. (n=1,117) (n=4,253)
a. NO! 2.6% (±1.2) 1.9% (±0.4)
b. No 9.8% (±1.8) 10.3% (±1.0)
c. yes 54.0% (±4.4) 52.7% (±2.2)
d. YES! 33.6% (±4.0) 35.1% (±2.2)
204. My family has clear rules about alcohol and drug use. (n=1,112) (n=4,235)
a. NO! 1.8% (±1.0) 1.3% (±0.3)
b. No 9.3% (±2.1) 8.9% (±1.1)
c. yes 38.3% (±2.7) 37.9% (±2.3)
d. YES! 50.6% (±3.5) 51.9% (±2.8)
205. If you drank some beer, wine, or liquor without your parent(s)'s permission, would you be caught by them?
(n=1,106)
(n=4,208)
a. NO! 9.6% (±2.2) 7.8% (±1.1)
b. No 30.3% (±3.3) 31.3% (±2.0)
c. yes 32.5% (±2.2) 34.3% (±1.4)
d. YES! 27.7% (±3.7) 26.5% (±2.6)
206. If you carried a handgun without your parent(s)'s permission, would you be caught by them?
(n=1,099)
(n=4,190)
a. NO! 3.8% (±1.6) 3.5% (±0.7)
b. No 10.6% (±1.8) 10.5% (±1.0)
c. yes 33.5% (±3.1) 33.3% (±1.8)
d. YES! 52.1% (±3.9) 52.7% (±2.4)
207. If you skipped school, would you be caught by your parent(s)? (n=1,107) (n=4,223)
a. NO! 2.4% (±1.4) 2.5% (±0.5)
b. No 7.7% (±2.5) 7.7% (±1.4)
c. yes 34.0% (±3.4) 35.2% (±2.2)
d. YES! 55.9% (±3.9) 54.6% (±3.0)
Opportunities for Prosocial Involvement (Questions 208-210)
208. If I had a personal problem, I could ask my parent(s) for help. (n=1,115) (n=4,240)
a. NO! 8.5% (±2.1) 8.1% (±1.0)
b. No 17.0% (±3.2) 15.0% (±1.3)
c. yes 47.4% (±1.9) 46.0% (±1.9)
d. YES! 27.2% (±4.1) 30.9% (±2.2)
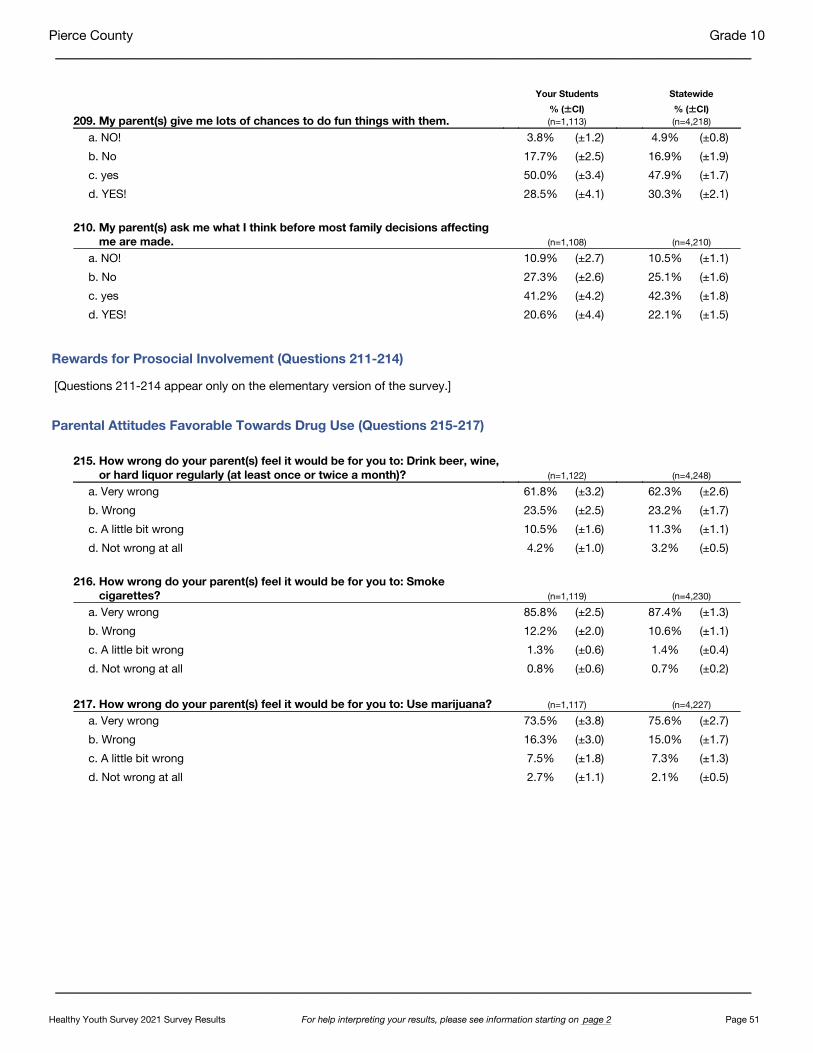
Healthy Youth Survey 2021 Survey Results For help interpreting your results, please see information starting on page 2 Page 51
ƒƒƒƒƒƒƒƒƒƒƒƒƒƒƒƒƒƒƒƒƒƒƒƒƒƒƒƒƒƒƒƒƒƒƒƒƒƒƒƒƒƒƒƒƒƒƒƒƒƒƒƒƒƒƒƒƒƒ
Pierce County Grade 10
ƒƒƒƒƒƒƒƒƒƒƒƒƒƒƒƒƒƒƒƒƒƒƒƒƒƒƒƒƒƒƒƒƒƒƒƒƒƒƒƒƒƒƒƒƒƒƒƒƒƒƒƒƒƒƒƒƒƒ
209. My parent(s) give me lots of chances to do fun things with them.
Your Students
% ( ± CI) (n=1,113)
Statewide
% ( ± CI) (n=4,218)
a. NO! 3.8% (±1.2) 4.9% (±0.8)
b. No 17.7% (±2.5) 16.9% (±1.9)
c. yes 50.0% (±3.4) 47.9% (±1.7)
d. YES! 28.5% (±4.1) 30.3% (±2.1)
210. My parent(s) ask me what I think before most family decisions affecting me are made.
(n=1,108)
(n=4,210)
a. NO! 10.9% (±2.7) 10.5% (±1.1)
b. No 27.3% (±2.6) 25.1% (±1.6)
c. yes 41.2% (±4.2) 42.3% (±1.8)
d. YES! 20.6% (±4.4) 22.1% (±1.5)
Rewards for Prosocial Involvement (Questions 211-214) [Questions 211-214 appear only on the elementary version of the survey.]
Parental Attitudes Favorable Towards Drug Use (Questions 215-217)
215. How wrong do your parent(s) feel it would be for you to: Drink beer, wine,or hard liquor regularly (at least once or twice a month)?
(n=1,122)
(n=4,248)
a. Very wrong 61.8% (±3.2) 62.3% (±2.6)
b. Wrong 23.5% (±2.5) 23.2% (±1.7)
c. A little bit wrong 10.5% (±1.6) 11.3% (±1.1)
d. Not wrong at all 4.2% (±1.0) 3.2% (±0.5)
216. How wrong do your parent(s) feel it would be for you to: Smoke cigarettes?
(n=1,119)
(n=4,230)
a. Very wrong 85.8% (±2.5) 87.4% (±1.3)
b. Wrong 12.2% (±2.0) 10.6% (±1.1)
c. A little bit wrong 1.3% (±0.6) 1.4% (±0.4)
d. Not wrong at all 0.8% (±0.6) 0.7% (±0.2)
217. How wrong do your parent(s) feel it would be for you to: Use marijuana? (n=1,117) (n=4,227)
a. Very wrong 73.5% (±3.8) 75.6% (±2.7)
b. Wrong 16.3% (±3.0) 15.0% (±1.7)
c. A little bit wrong 7.5% (±1.8) 7.3% (±1.3)
d. Not wrong at all 2.7% (±1.1) 2.1% (±0.5)

Healthy Youth Survey 2021 Survey Results For help interpreting your results, please see information starting on page 2 Page 52
ƒƒƒƒƒƒƒƒƒƒƒƒƒƒƒƒƒƒƒƒƒƒƒƒƒƒƒƒƒƒƒƒƒƒƒƒƒƒƒƒƒƒƒƒƒƒƒƒƒƒƒƒƒƒƒƒƒƒ
Pierce County Grade 10
ƒƒƒƒƒƒƒƒƒƒƒƒƒƒƒƒƒƒƒƒƒƒƒƒƒƒƒƒƒƒƒƒƒƒƒƒƒƒƒƒƒƒƒƒƒƒƒƒƒƒƒƒƒƒƒƒƒƒ
School Domain
Academic Failure Questions (Questions 218-219)
218. Putting them all together, what were your grades like last year?
Your Students
% ( ± CI) (n=2,356)
Statewide
% ( ± CI) (n=8,488)
a. Mostly As 41.5% (±8.6) 49.0% (±5.3)
b. Mostly Bs 28.6% (±3.8) 23.9% (±1.5)
c. Mostly Cs 18.8% (±3.4) 16.3% (±2.3)
d. Mostly Ds 4.8% (±1.5) 6.1% (±1.2)
e. Mostly Fs 6.3% (±2.3) 4.7% (±1.3)
219. Are your school grades better than the grades of most students in your class?
(n=1,109)
(n=4,211)
a. NO! 6.8% (±1.7) 8.9% (±1.1)
b. No 36.6% (±4.7) 33.2% (±2.1)
c. yes 42.7% (±3.2) 45.5% (±2.2)
d. YES! 14.0% (±3.1) 12.4% (±1.4)
Low Commitment to School (Questions 220-226)
220. How often do you feel the schoolwork you are assigned is meaningful and important?
(n=1,130)
(n=4,260)
a. Almost always 7.4% (±2.3) 7.6% (±1.2)
b. Often 15.0% (±2.4) 18.0% (±1.3)
c. Sometimes 41.3% (±4.1) 40.1% (±1.6)
d. Seldom 22.1% (±3.4) 21.2% (±1.1)
e. Never 14.1% (±3.0) 13.2% (±1.6)
221. How interesting are most of your courses to you? (n=1,128) (n=4,257)
a. Very interesting and stimulating 3.6% (±2.2) 4.8% (±0.9)
b. Quite interesting 19.7% (±4.0) 19.8% (±1.7)
c. Fairly interesting 40.9% (±3.4) 40.1% (±1.3)
d. Slightly dull 26.2% (±3.3) 25.3% (±1.6)
e. Very dull 9.7% (±2.6) 10.1% (±1.3)
222. How important do you think the things you are learning in school are going to be for you later in life?
(n=1,124)
(n=4,253)
a. Very important 7.7% (±1.6) 7.8% (±1.2)
b. Quite important 16.6% (±3.0) 19.0% (±1.5)
c. Fairly important 32.8% (±2.8) 33.4% (±1.4)
d. Slightly important 34.2% (±3.2) 30.8% (±1.8)
e. Not at all important 8.6% (±2.5) 9.0% (±1.0)

Healthy Youth Survey 2021 Survey Results For help interpreting your results, please see information starting on page 2 Page 53
ƒƒƒƒƒƒƒƒƒƒƒƒƒƒƒƒƒƒƒƒƒƒƒƒƒƒƒƒƒƒƒƒƒƒƒƒƒƒƒƒƒƒƒƒƒƒƒƒƒƒƒƒƒƒƒƒƒƒ
Pierce County Grade 10
ƒƒƒƒƒƒƒƒƒƒƒƒƒƒƒƒƒƒƒƒƒƒƒƒƒƒƒƒƒƒƒƒƒƒƒƒƒƒƒƒƒƒƒƒƒƒƒƒƒƒƒƒƒƒƒƒƒƒ
Think back over the past year in school. How often did you:
223. Enjoy school?
Your Students
% ( ± CI) (n=2,370)
Statewide
% ( ± CI) (n=8,514)
a. Never 11.4% (±2.3) 11.5% (±1.3)
b. Seldom 20.0% (±2.1) 19.2% (±1.1)
c. Sometimes 44.3% (±1.7) 42.3% (±1.1)
d. Often 19.2% (±2.5) 21.4% (±1.4)
e. Almost always 5.1% (±1.1) 5.6% (±0.7)
224. Dislike school? (n=1,120) (n=4,256)
a. Never 2.6% (±1.0) 3.6% (±0.7)
b. Seldom 12.4% (±2.5) 12.9% (±1.0)
c. Sometimes 33.7% (±3.7) 34.8% (±1.7)
d. Often 34.5% (±3.8) 34.1% (±2.0)
e. Almost always 16.9% (±3.4) 14.7% (±1.7)
225. Try to do your best work in school? (n=1,123) (n=4,249)
a. Never 2.3% (±1.4) 2.0% (±0.5)
b. Seldom 7.3% (±2.2) 6.8% (±0.9)
c. Sometimes 24.1% (±4.2) 23.5% (±1.6)
d. Often 34.3% (±3.2) 36.1% (±1.9)
e. Almost always 32.0% (±4.5) 31.6% (±1.9)
226. During the LAST 4 WEEKS, how many whole days of school have you missed because you skipped or "cut"?
(n=1,125)
(n=4,261)
a. 0 days 80.4% (±4.1) 82.8% (±2.3)
b. 1 day 7.4% (±2.2) 6.5% (±0.9)
c. 2 days 4.2% (±1.4) 3.2% (±0.7)
d. 3 days 3.2% (±1.0) 2.6% (±0.5)
e. 4-5 days 2.0% (±0.7) 2.3% (±0.6)
f. 6-10 days 1.5% (±0.8) 1.4% (±0.4)
g. 11 or more days 1.3% (±0.7) 1.2% (±0.4)
Opportunities for Prosocial Involvement (Questions 227-231)
227. In my school, students have lots of chances to help decide things like class activities and rules.
(n=1,122)
(n=4,254)
a. NO! 8.4% (±2.7) 8.4% (±1.0)
b. No 28.8% (±5.2) 30.5% (±2.2)
c. yes 53.2% (±5.8) 51.1% (±2.0)
d. YES! 9.6% (±3.1) 10.0% (±1.6)
228. There are lots of chances for students in my school to talk with a teacher one-on-one.
(n=1,115)
(n=4,245)
a. NO! 2.7% (±1.4) 3.8% (±0.7)
b. No 15.8% (±3.2) 16.0% (±1.7)
c. yes 59.4% (±4.3) 59.6% (±1.8)
d. YES! 22.2% (±5.3) 20.6% (±2.4)

Healthy Youth Survey 2021 Survey Results For help interpreting your results, please see information starting on page 2 Page 54
ƒƒƒƒƒƒƒƒƒƒƒƒƒƒƒƒƒƒƒƒƒƒƒƒƒƒƒƒƒƒƒƒƒƒƒƒƒƒƒƒƒƒƒƒƒƒƒƒƒƒƒƒƒƒƒƒƒƒ
Pierce County Grade 10
ƒƒƒƒƒƒƒƒƒƒƒƒƒƒƒƒƒƒƒƒƒƒƒƒƒƒƒƒƒƒƒƒƒƒƒƒƒƒƒƒƒƒƒƒƒƒƒƒƒƒƒƒƒƒƒƒƒƒ
229. Teachers ask me to work on special class projects.
Your Students
% ( ± CI) (n=1,103)
Statewide
% ( ± CI) (n=4,169)
a. NO! 10.2% (±2.7) 11.8% (±1.1)
b. No 51.0% (±5.2) 48.1% (±2.0)
c. yes 33.4% (±3.7) 34.6% (±1.7)
d. YES! 5.5% (±2.7) 5.5% (±0.9)
230. There are lots of chances for students in my school to get involved in sports, clubs, and other school activities outside of class.
(n=1,123)
(n=4,240)
a. NO! 1.6% (±1.1) 2.2% (±0.6)
b. No 5.2% (±2.5) 5.0% (±1.1)
c. yes 47.2% (±3.3) 45.7% (±2.1)
d. YES! 46.0% (±5.6) 47.2% (±2.9)
231. I have lots of chances to be part of class discussions or activities. (n=1,121) (n=4,227)
a. NO! 2.5% (±1.2) 2.6% (±0.6)
b. No 9.5% (±1.2) 9.1% (±1.3)
c. yes 65.0% (±2.4) 63.5% (±2.0)
d. YES! 23.0% (±3.6) 24.7% (±2.6)
Rewards for Prosocial Involvement (Questions 232-235)
232. My teacher(s) notices when I am doing a good job and lets me know about it.
(n=1,121)
(n=4,248)
a. NO! 6.2% (±1.7) 6.9% (±1.0)
b. No 28.1% (±5.5) 31.3% (±2.3)
c. yes 54.5% (±4.1) 51.2% (±1.6)
d. YES! 11.2% (±3.4) 10.6% (±1.5)
233. The school lets my parent(s) know when I have done something well. (n=1,113) (n=4,223)
a. NO! 17.4% (±5.1) 18.8% (±2.0)
b. No 48.9% (±4.5) 49.3% (±1.5)
c. yes 27.9% (±5.8) 26.2% (±2.1)
d. YES! 5.8% (±1.7) 5.7% (±1.0)
234. I feel safe during school. (n=2,349) (n=8,446)
a. NO! 3.9% (±1.4) 3.6% (±0.6)
b. no 14.3% (±3.5) 13.4% (±1.7)
c. yes 64.8% (±3.0) 64.1% (±1.5)
d. YES! 17.0% (±3.9) 18.8% (±2.8)
235. My teachers praise me when I work hard in school. (n=1,108) (n=4,205)
a. NO! 10.9% (±2.7) 11.0% (±1.3)
b. No 41.4% (±5.2) 41.3% (±2.4)
c. yes 40.3% (±6.2) 40.0% (±2.3)
d. YES! 7.4% (±2.0) 7.7% (±1.2)

Healthy Youth Survey 2021 Survey Results For help interpreting your results, please see information starting on page 2 Page 55
ƒƒƒƒƒƒƒƒƒƒƒƒƒƒƒƒƒƒƒƒƒƒƒƒƒƒƒƒƒƒƒƒƒƒƒƒƒƒƒƒƒƒƒƒƒƒƒƒƒƒƒƒƒƒƒƒƒƒ
Pierce County Grade 10
ƒƒƒƒƒƒƒƒƒƒƒƒƒƒƒƒƒƒƒƒƒƒƒƒƒƒƒƒƒƒƒƒƒƒƒƒƒƒƒƒƒƒƒƒƒƒƒƒƒƒƒƒƒƒƒƒƒƒ
Peer and Individual Domain
Perceived Risk of Drug Use (Questions 236-239)
How much do you think people risk harming themselves if they:
236. Smoke one or more packs of cigarettes per day?
Your Students
% ( ± CI) (n=1,115)
Statewide
% ( ± CI) (n=4,240)
a. No risk 3.0% (±1.1) 3.2% (±0.8)
b. Slight risk 4.8% (±1.5) 4.8% (±0.7)
c. Moderate risk 16.6% (±2.5) 14.6% (±1.3)
d. Great risk 70.2% (±4.1) 72.6% (±2.4)
e. Not sure 5.3% (±1.5) 4.9% (±0.8)
237. Try marijuana once or twice? (n=1,113) (n=4,227)
a. No risk 28.8% (±2.2) 27.8% (±2.4)
b. Slight risk 35.9% (±3.3) 34.4% (±1.8)
c. Moderate risk 17.4% (±2.5) 18.3% (±1.5)
d. Great risk 11.7% (±2.5) 13.8% (±1.9)
e. Not sure 6.1% (±1.7) 5.7% (±0.9)
238. Use marijuana regularly (at least once or twice a week)? (n=1,100) (n=4,188)
a. No risk 10.2% (±3.7) 9.8% (±1.5)
b. Slight risk 20.5% (±3.7) 18.7% (±1.7)
c. Moderate risk 34.4% (±3.1) 32.9% (±1.9)
d. Great risk 29.2% (±3.9) 33.1% (±3.1)
e. Not sure 5.7% (±1.6) 5.5% (±1.0)
239. Take one or two drinks of an alcoholic beverage nearly every day? (n=1,110) (n=4,226)
a. No risk 3.5% (±1.1) 4.4% (±0.9)
b. Slight risk 10.5% (±2.8) 12.2% (±1.5)
c. Moderate risk 31.2% (±2.2) 30.5% (±1.8)
d. Great risk 49.8% (±4.0) 47.8% (±3.1)
e. Not sure 5.0% (±1.7) 5.0% (±0.9)

Healthy Youth Survey 2021 Survey Results For help interpreting your results, please see information starting on page 2 Page 56
ƒƒƒƒƒƒƒƒƒƒƒƒƒƒƒƒƒƒƒƒƒƒƒƒƒƒƒƒƒƒƒƒƒƒƒƒƒƒƒƒƒƒƒƒƒƒƒƒƒƒƒƒƒƒƒƒƒƒ
Pierce County Grade 10
ƒƒƒƒƒƒƒƒƒƒƒƒƒƒƒƒƒƒƒƒƒƒƒƒƒƒƒƒƒƒƒƒƒƒƒƒƒƒƒƒƒƒƒƒƒƒƒƒƒƒƒƒƒƒƒƒƒƒ
Early Initiation of Drug Use (Questions 240-242)
How old were you the first time you:
240. Used marijuana?
Your Students
% ( ± CI) (n=2,340)
Statewide
% ( ± CI) (n=8,442)
a. Never have 82.7% (±3.0) 84.1% (±2.1)
b. 10 or younger 0.8% (±0.4) 0.7% (±0.2)
c. 11 1.0% (±0.6) 0.9% (±0.3)
d. 12 2.0% (±0.5) 1.9% (±0.4)
e. 13 4.4% (±1.3) 3.9% (±0.7)
f. 14 4.6% (±0.8) 4.4% (±0.6)
g. 15 4.1% (±0.9) 3.9% (±0.6)
h. 16 0.3% (±0.2) 0.2% (±0.2)
i. 17 or older 0.1% (±0.1) 0.0% (±0.0)
241. Smoked a cigarette, even just a puff? (n=1,115) (n=4,239)
a. Never have 86.3% (±2.1) 87.0% (±2.1)
b. 10 or younger 2.2% (±0.9) 2.0% (±0.6)
c. 11 1.0% (±0.6) 1.2% (±0.4)
d. 12 2.7% (±0.7) 2.1% (±0.6)
e. 13 3.1% (±1.0) 2.5% (±0.6)
f. 14 2.1% (±0.7) 2.7% (±0.6)
g. 15 2.3% (±0.7) 2.3% (±0.5)
h. 16 0.1% (±0.2) 0.2% (±0.1)
i. 17 or older 0.2% (±0.3) 0.1% (±0.1)
242. Had more than a sip or two of beer, wine, or hard liquor? (n=2,331) (n=8,412)
a. Never have 67.8% (±2.1) 68.4% (±2.8)
b. 10 or younger 6.3% (±1.4) 5.8% (±0.8)
c. 11 2.0% (±0.5) 2.3% (±0.4)
d. 12 4.0% (±0.6) 3.4% (±0.5)
e. 13 5.7% (±1.3) 5.5% (±0.8)
f. 14 6.9% (±1.2) 7.6% (±0.7)
g. 15 6.5% (±1.7) 6.3% (±0.8)
h. 16 0.5% (±0.2) 0.6% (±0.2)
i. 17 or older 0.1% (±0.1) 0.1% (±0.1)
Favorable Attitudes Toward Drug Use (Questions 243-246)
How wrong do YOU think it is for someone your age to:
243. Drink beer, wine, or hard liquor regularly?
(n=1,126)
(n=4,263)
a. Very wrong 36.7% (±3.8) 37.1% (±3.0)
b. Wrong 31.4% (±2.8) 31.0% (±1.5)
c. A little bit wrong 25.3% (±2.5) 24.0% (±2.0)
d. Not wrong at all 6.6% (±1.8) 8.0% (±1.3)
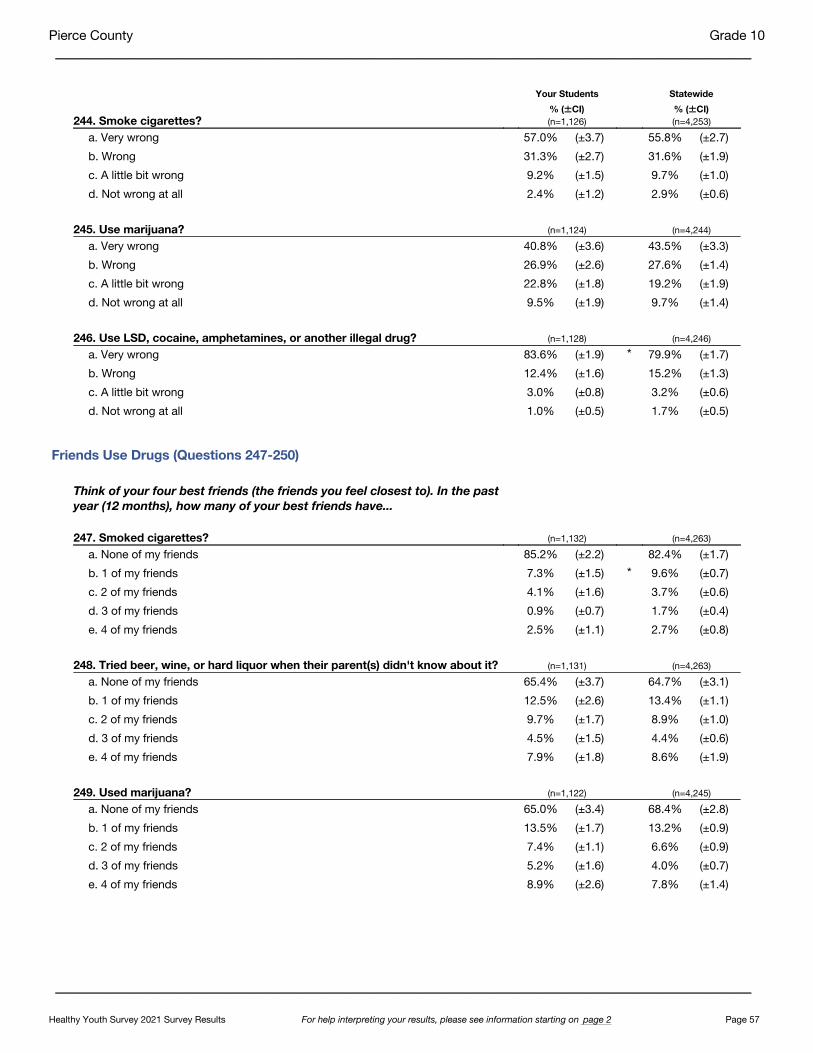
Healthy Youth Survey 2021 Survey Results For help interpreting your results, please see information starting on page 2 Page 57
ƒƒƒƒƒƒƒƒƒƒƒƒƒƒƒƒƒƒƒƒƒƒƒƒƒƒƒƒƒƒƒƒƒƒƒƒƒƒƒƒƒƒƒƒƒƒƒƒƒƒƒƒƒƒƒƒƒƒ
Pierce County Grade 10
ƒƒƒƒƒƒƒƒƒƒƒƒƒƒƒƒƒƒƒƒƒƒƒƒƒƒƒƒƒƒƒƒƒƒƒƒƒƒƒƒƒƒƒƒƒƒƒƒƒƒƒƒƒƒƒƒƒƒ
244. Smoke cigarettes?
Your Students
% ( ± CI) (n=1,126)
Statewide
% ( ± CI) (n=4,253)
a. Very wrong 57.0% (±3.7) 55.8% (±2.7)
b. Wrong 31.3% (±2.7) 31.6% (±1.9)
c. A little bit wrong 9.2% (±1.5) 9.7% (±1.0)
d. Not wrong at all 2.4% (±1.2) 2.9% (±0.6)
245. Use marijuana? (n=1,124) (n=4,244)
a. Very wrong 40.8% (±3.6) 43.5% (±3.3)
b. Wrong 26.9% (±2.6) 27.6% (±1.4)
c. A little bit wrong 22.8% (±1.8) 19.2% (±1.9)
d. Not wrong at all 9.5% (±1.9) 9.7% (±1.4)
246. Use LSD, cocaine, amphetamines, or another illegal drug? (n=1,128) (n=4,246)
a. Very wrong 83.6% (±1.9) * 79.9% (±1.7)
b. Wrong 12.4% (±1.6) 15.2% (±1.3)
c. A little bit wrong 3.0% (±0.8) 3.2% (±0.6)
d. Not wrong at all 1.0% (±0.5) 1.7% (±0.5)
Friends Use Drugs (Questions 247-250)
Think of your four best friends (the friends you feel closest to). In the past year (12 months), how many of your best friends have...
247. Smoked cigarettes?
(n=1,132)
(n=4,263)
a. None of my friends 85.2% (±2.2) 82.4% (±1.7)
b. 1 of my friends 7.3% (±1.5) * 9.6% (±0.7)
c. 2 of my friends 4.1% (±1.6) 3.7% (±0.6)
d. 3 of my friends 0.9% (±0.7) 1.7% (±0.4)
e. 4 of my friends 2.5% (±1.1) 2.7% (±0.8)
248. Tried beer, wine, or hard liquor when their parent(s) didn't know about it? (n=1,131) (n=4,263)
a. None of my friends 65.4% (±3.7) 64.7% (±3.1)
b. 1 of my friends 12.5% (±2.6) 13.4% (±1.1)
c. 2 of my friends 9.7% (±1.7) 8.9% (±1.0)
d. 3 of my friends 4.5% (±1.5) 4.4% (±0.6)
e. 4 of my friends 7.9% (±1.8) 8.6% (±1.9)
249. Used marijuana? (n=1,122) (n=4,245)
a. None of my friends 65.0% (±3.4) 68.4% (±2.8)
b. 1 of my friends 13.5% (±1.7) 13.2% (±0.9)
c. 2 of my friends 7.4% (±1.1) 6.6% (±0.9)
d. 3 of my friends 5.2% (±1.6) 4.0% (±0.7)
e. 4 of my friends 8.9% (±2.6) 7.8% (±1.4)
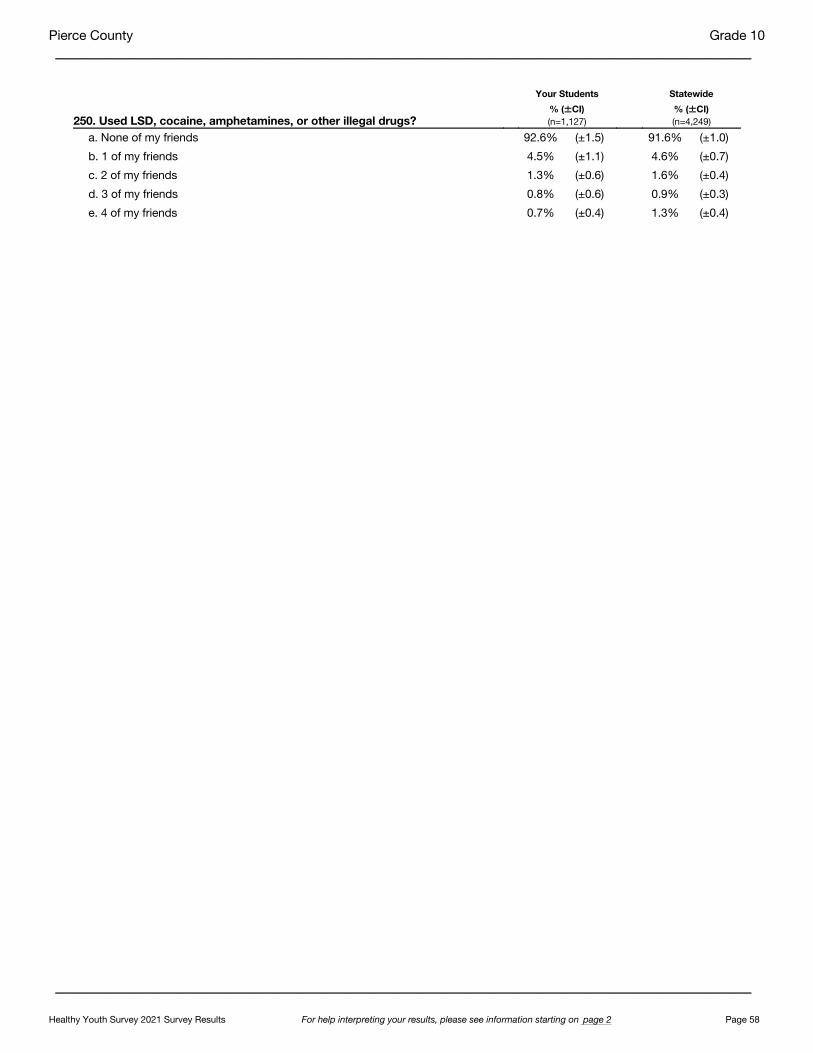
Healthy Youth Survey 2021 Survey Results For help interpreting your results, please see information starting on page 2 Page 58
ƒƒƒƒƒƒƒƒƒƒƒƒƒƒƒƒƒƒƒƒƒƒƒƒƒƒƒƒƒƒƒƒƒƒƒƒƒƒƒƒƒƒƒƒƒƒƒƒƒƒƒƒƒƒƒƒƒƒ
Pierce County Grade 10
ƒƒƒƒƒƒƒƒƒƒƒƒƒƒƒƒƒƒƒƒƒƒƒƒƒƒƒƒƒƒƒƒƒƒƒƒƒƒƒƒƒƒƒƒƒƒƒƒƒƒƒƒƒƒƒƒƒƒ
250. Used LSD, cocaine, amphetamines, or other illegal drugs?
Your Students
% ( ± CI) (n=1,127)
Statewide
% ( ± CI) (n=4,249)
a. None of my friends 92.6% (±1.5) 91.6% (±1.0)
b. 1 of my friends 4.5% (±1.1) 4.6% (±0.7)
c. 2 of my friends 1.3% (±0.6) 1.6% (±0.4)
d. 3 of my friends 0.8% (±0.6) 0.9% (±0.3)
e. 4 of my friends 0.7% (±0.4) 1.3% (±0.4)

Healthy Youth Survey 2021 Survey Results For help interpreting your results, please see information starting on page 2 Page 59
ƒƒƒƒƒƒƒƒƒƒƒƒƒƒƒƒƒƒƒƒƒƒƒƒƒƒƒƒƒƒƒƒƒƒƒƒƒƒƒƒƒƒƒƒƒƒƒƒƒƒƒƒƒƒƒƒƒƒ
Pierce County Grade 10
ƒƒƒƒƒƒƒƒƒƒƒƒƒƒƒƒƒƒƒƒƒƒƒƒƒƒƒƒƒƒƒƒƒƒƒƒƒƒƒƒƒƒƒƒƒƒƒƒƒƒƒƒƒƒƒƒƒƒ
Questions by TopicsQuestions about a single topic are not always grouped together in this report. For example, some questions about alcohol are presented in the Alcohol, Tobacco, and Other Drug (ATOD) Use section and others are presented in the Risk and Protective Factor section. The following list, groups the questions by topic so you can easily locate them in this report.
• Abuse 129-135• Activities and Clubs 96-97, 194-196• Adverse Childhood Experiences Scale (WAH-ACEs) 178• Alcohol
Access 61, 179 Age at first use 242 Current use 37, 58, 75 Drinking and driving 117, 119, 122 Family influence 62, 204-205, 215 Lifetime use 25 Perceived norms 63-64, 66, 179, 187, 243, 248 Perceived risks 65, 239 Prevention/intervention 76, 166 Use at school 73-74 Usual type 60
• Asthma 99-100• Bullying/Harassment 157-165• Children's Hope Scale 173-177• COVID-19 150-155• Demographics 1-2, 4-10, 12-22• Disability 105-108• Family 200-210, 215-217
Food insecurity 81-82 Living situations 13-15 Migrant or seasonal work 18 Military service 17 Mother's education 12
• Fighting 126• Fitness
Physical activity 90-93, 97 Sedentary behavior 94-95
• Gambling 156• Gangs 127-128• Health or Health Care
Doctor visit 98 Oral Health 101-102 Sleep 104
• HIV/STD/Pregnancy Prevention 113, 169-171• Honesty 22• Marijuana
Access 70, 181 Age at first use 240 Current use 38, 75 Family influence 67, 71, 217 Lifetime use 26 Perceived norms 72, 181, 189, 245, 249 Perceived risks 237-238 Use at school 73-74 Using and driving 120-122 Usual type 68
• Mental Health Anxiety and worry 142-143 Depression 136 Help with mental health 144-146 Suicide 137-139
• Neighborhood or Community 187-196
• Nutrition Breakfast 83 Food insecurity 81-82 Fruit/Vegetable servings 84 Soda and Sugar Drinks 85-87
• Other Drugs Access 182 Current use 39-43 Family influence 77, 204 Lifetime use 27-28 Perceived norms 77-78, 182, 246, 250 Perceived risks 79 Prevention/intervention 76, 166 Use at school 73-74
• Problematic Internet Use 147-149• Safety-related Behaviors
Swimming 115-116• School Climate
Absence 19, 102, 207, 226 Achievement 218-219 After-school activities 96-97, 194-196 Bullying/harassment 157-165 Changed school in past year 20 Counseling and support 166-168 Engagement 220-225, 227-235 Nutrition 16, 86-87 Physical activity 92-93 Prevention/intervention 76, 146, 166, 169-171 Safety during 160-161, 234 Substance use at 73-74 Weapons at 125
• Sexual Behaviors 109-113• Sexual Identity 5• Sexual Orientation 6• Social and Emotional Learning 172• Substance Use Prevention 76, 166• Texting and Driving 124• Tobacco and Electronic Cigarettes/Vaping
Access 46, 56, 180 Addiction/quitting 51-52 Age at first use 53, 241 Current use 30-36, 44 Family 216 Lifetime use 23-24 Perceived norms 47, 180, 244, 247 Perceived risks 57, 236 Prevention/intervention 166 Secondhand smoke 45 Suscepibility to smoking 48-50 Use at school 74 Usual type 54-55
• Weapons 125, 183, 188, 206• Weight 80• Work 21

Healthy Youth Survey 2021 Survey Results For help interpreting your results, please see information starting on page 2 Page 60
ƒƒƒƒƒƒƒƒƒƒƒƒƒƒƒƒƒƒƒƒƒƒƒƒƒƒƒƒƒƒƒƒƒƒƒƒƒƒƒƒƒƒƒƒƒƒƒƒƒƒƒƒƒƒƒƒƒƒ
Pierce County Grade 10
ƒƒƒƒƒƒƒƒƒƒƒƒƒƒƒƒƒƒƒƒƒƒƒƒƒƒƒƒƒƒƒƒƒƒƒƒƒƒƒƒƒƒƒƒƒƒƒƒƒƒƒƒƒƒƒƒƒƒ
Core Questions“Core” questions that appeared on both Forms A and B (the secondary versions of the survey) are listed below. All other questions appeared on either Form A or Form B, but not both. Core questions may or may not have appeared on Form C (the elementary version).
• Activities Participation in after school activities 96
• Alcohol Age when first drank alcohol 242 Binge drinking 58 Current alcohol drinking (past 30 days) 37 Levels of alcohol use 59 Lifetime alcohol use 25
• Bullying Been bullied (past 30 days) 157
• COVID-19 Prevention - stay home is sick 152 Prevention - wash hands 150 Prevention - wear mask 151 Worried about enough food 155 Worried about housing 154 Worried about parents jobs 153
• Demographics Age 2 Asian or Pacific Islander background 9 Education level of mother 12 Food insecurity 82 Gender identity 5 Language spoken in home 10 Loss of home due to family finances 15 Migrant status 18 Race/Ethnicity 7, 8 Sex/gender 4 Sexual orientation 6 Where you live 14 Who you live with 13
• Driving Under Influence Driving after using alcohol and marijuana 122
• Fighting Physical fighting (past 12 months) 126
• Gangs Gang involvement 127 Gangs at school 128
• Honesty Honesty in completing survey 22
• Hope Can get things important in life 174 Can solve problems 176 Doing as well as other kids 175 Past will help in future 177
• Marijuana Age when first used marijuana 235 Current marijuana use (past 30 days) 39 Lifetime marijuana use 26
• Mental Health Bothered by anxiety 142 Bothered by worrying 143 Depression (past 12 months) 136 Seriously considered attempting suicide 137
• Other Drugs Current painkiller use (past 30 days) 41
• School Climate Absent from school 19 Been bullied (past 30 days) 157 Enjoyed being in school (past 12 months) 223 Feel safe during school 234 Grades in school (past 12 months) 218 Participation in after school activities 96 Substance use on school property 74 Weapon carrying on school property (past 12 months) 125
• Texting and Driving Texting and driving (past 30 days) 124
• Tobacco Current cigarette smoking (past 30 days) 30 Current e-cigarette use (past 30 days) 33 E-cigarette use products 54
• Weapons Weapon carrying on school property (past 12 months) 125
For more information on which survey forms each question was on,see the Survey Crosswalk at www.AskHYS.net, under HYS Results - QxQ