Introduction to Bayesian Econometrics Introduction to Bayesian Econometrics
Upload
independentCategory
view
0download
0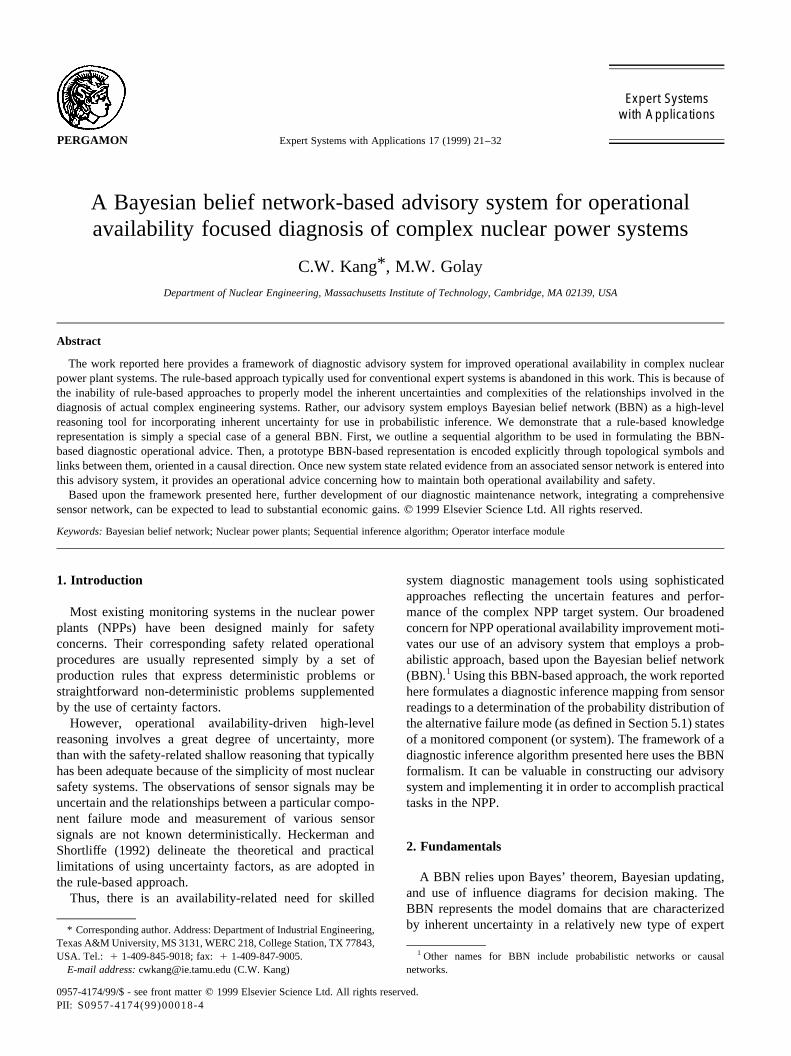
A Bayesian belief network-based advisory system for operationalavailability focused diagnosis of complex nuclear power systems
C.W. Kang* , M.W. Golay
Department of Nuclear Engineering, Massachusetts Institute of Technology, Cambridge, MA 02139, USA
Abstract
The work reported here provides a framework of diagnostic advisory system for improved operational availability in complex nuclearpower plant systems. The rule-based approach typically used for conventional expert systems is abandoned in this work. This is because ofthe inability of rule-based approaches to properly model the inherent uncertainties and complexities of the relationships involved in thediagnosis of actual complex engineering systems. Rather, our advisory system employs Bayesian belief network (BBN) as a high-levelreasoning tool for incorporating inherent uncertainty for use in probabilistic inference. We demonstrate that a rule-based knowledgerepresentation is simply a special case of a general BBN. First, we outline a sequential algorithm to be used in formulating the BBN-based diagnostic operational advice. Then, a prototype BBN-based representation is encoded explicitly through topological symbols andlinks between them, oriented in a causal direction. Once new system state related evidence from an associated sensor network is entered intothis advisory system, it provides an operational advice concerning how to maintain both operational availability and safety.
Based upon the framework presented here, further development of our diagnostic maintenance network, integrating a comprehensivesensor network, can be expected to lead to substantial economic gains.q 1999 Elsevier Science Ltd. All rights reserved.
Keywords:Bayesian belief network; Nuclear power plants; Sequential inference algorithm; Operator interface module
1. Introduction
Most existing monitoring systems in the nuclear powerplants (NPPs) have been designed mainly for safetyconcerns. Their corresponding safety related operationalprocedures are usually represented simply by a set ofproduction rules that express deterministic problems orstraightforward non-deterministic problems supplementedby the use of certainty factors.
However, operational availability-driven high-levelreasoning involves a great degree of uncertainty, morethan with the safety-related shallow reasoning that typicallyhas been adequate because of the simplicity of most nuclearsafety systems. The observations of sensor signals may beuncertain and the relationships between a particular compo-nent failure mode and measurement of various sensorsignals are not known deterministically. Heckerman andShortliffe (1992) delineate the theoretical and practicallimitations of using uncertainty factors, as are adopted inthe rule-based approach.
Thus, there is an availability-related need for skilled
system diagnostic management tools using sophisticatedapproaches reflecting the uncertain features and perfor-mance of the complex NPP target system. Our broadenedconcern for NPP operational availability improvement moti-vates our use of an advisory system that employs a prob-abilistic approach, based upon the Bayesian belief network(BBN).1 Using this BBN-based approach, the work reportedhere formulates a diagnostic inference mapping from sensorreadings to a determination of the probability distribution ofthe alternative failure mode (as defined in Section 5.1) statesof a monitored component (or system). The framework of adiagnostic inference algorithm presented here uses the BBNformalism. It can be valuable in constructing our advisorysystem and implementing it in order to accomplish practicaltasks in the NPP.
2. Fundamentals
A BBN relies upon Bayes’ theorem, Bayesian updating,and use of influence diagrams for decision making. TheBBN represents the model domains that are characterizedby inherent uncertainty in a relatively new type of expert
Expert Systems with Applications 17 (1999) 21–32PERGAMON
Expert Systemswith Applications
0957-4174/99/$ - see front matterq 1999 Elsevier Science Ltd. All rights reserved.PII: S0957-4174(99)00018-4
* Corresponding author. Address: Department of Industrial Engineering,Texas A&M University, MS 3131, WERC 218, College Station, TX 77843,USA. Tel.: 1 1-409-845-9018; fax:1 1-409-847-9005.
E-mail address:[email protected] (C.W. Kang)
1 Other names for BBN include probabilistic networks or causalnetworks.
system application. In this treatment one estimates the prob-ability of an event in terms of a subjective degree of belief inits occurrence, and one also provides a measure of uncer-tainty that takes into account all available relevant knowl-edge and information.
Jensen (1996) defines a BBN formally as a directed acyc-lic graph2 that models the relationships of a set of variables.The recent availability of powerful computers and betterinstrumented plants makes it possible to incorporate anabstract, symbolic knowledge representation and permitsthe numerical calculation needed to support BBN-basedreasoning. Within a BBN the nodes of the graph representrandom variables, and the links represent relationshipsbetween these probabilistically determined state variables(Jensen, 1996). These dependencies are quantified througha set of conditional probability values.
2.1. Bayes’ theorem
The cornerstone of Bayesian probability theory is theinversion formula due to Bayes’ theorem:
P�Hj =E� �P�E=Hj�P�Hj�Xn
i�1
P�E=Hi�P�Hi�: �1�
The Hi ’s are a set of mutually exclusive hypotheses, fori � 1,2,…,n. E is the observation. In the Bayesian interpre-tation, the probability of a certain hypothesisHi , being true,P�Hi� represents the degree of belief in the validity of thathypothesis.
2.2. Bayesian updating
One’s posterior degree of belief concerning a system’sstate is changed after one receives new evidence,E, at a
particular domain within the causal network (explained inSection 4) which may either reinforce or weaken that hypoth-esis. This degree of belief,P�Hi�, can be formally updatedusing Bayes’ theorem, Eq. (1). Thus, in a new domain aposterior probability distribution,f 0, is obtained in terms ofthe previously utilized probability distribution,f, and newlyobtained evidence,E, according to the relationship
f 0 � CP�E�f ; �2�where
f is the previously utilized probability distribution,f 0 is the posterior probability distribution,P�E� is the probability of observing the newly obtainedevidence,C is a constant.
2.3. Influence diagram
The BBN-based expert system successfully combinesinfluence diagrams that are useful for complex decisionmaking by graphically depicting the information availableat the time of making a decision. A BBN augmented withdecision and utility functions is usually termed a Bayesianinfluence diagram (Jensen, 1996).
3. Sequential inference algorithm for a BBN-baseddiagnositc maintenance advice
The flowchart depicted in Fig. 1 suggests several steps tobe taken in the developing a system diagnosis for the
C.W. Kang, M.W. Golay / Expert Systems with Applications 17 (1999) 21–3222
2 A directed acycle graph contains no directed cycle between the twonodes involved, i.e. in a directed acycle graph, it is impossible to return toone node from the other node along a reversibly directed path.
`
Input: Sensor reading
Estimation of probability distribution of failure mode states, givena set of sensor readings
Calculation of expected utility values in terms of costs and benefitsof possible state transitions arising from alternative actions
Determination of a recommended action based upon the action ofhighest net utility (i.e., weighed benefits and costs of an action)
Output: Prediction of probability distribution of failure mode statesafter a particular action having been taken
Fig. 1. Sequential inference algorithm for a BBN-based diagnostic main-tenance advice.
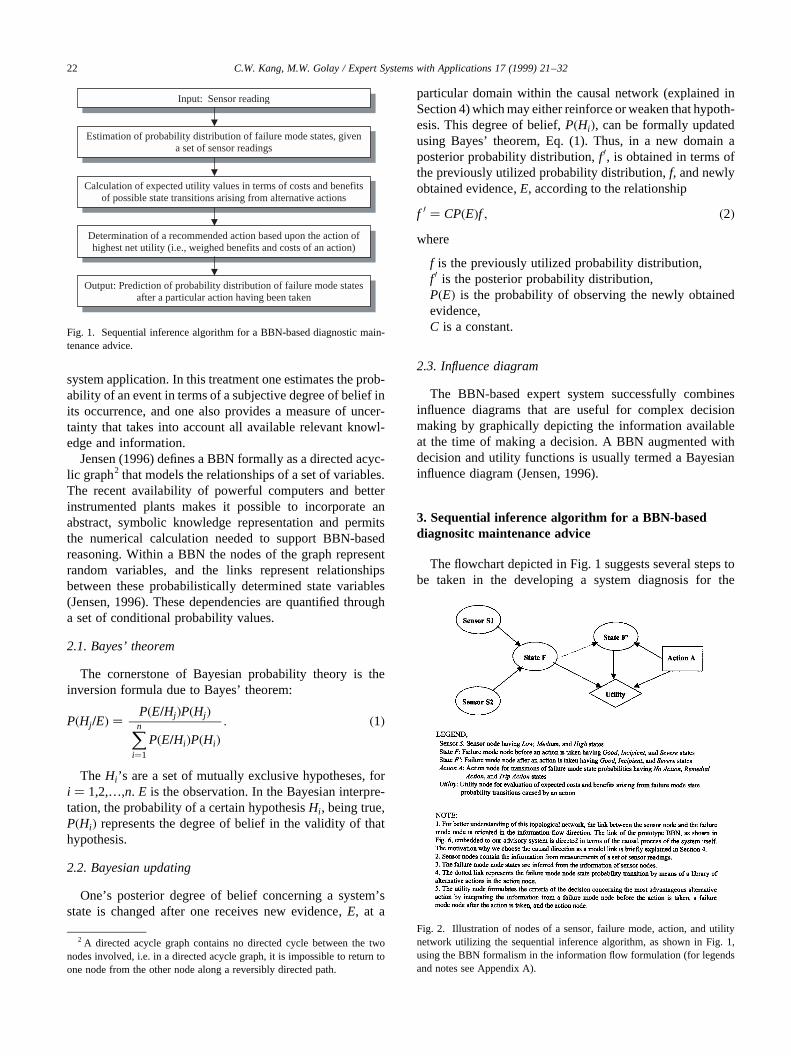
Fig. 2. Illustration of nodes of a sensor, failure mode, action, and utilitynetwork utilizing the sequential inference algorithm, as shown in Fig. 1,using the BBN formalism in the information flow formulation (for legendsand notes see Appendix A).
provision of operational advice. This algorithm starts fromthe use of input sensor readings and ends with an outputprediction of the future system status should a particularaction be taken. This is done through an inference of thecurrent status probability distribution of the specific systemstates and determination of the most advantageous action totake.
Fig. 2 illustrates how the inference algorithm shown inFig. 1 is encoded into an example topological model fromthe viewpoint of information flow using the BBN formal-ism.
4. Causal flow reasoning
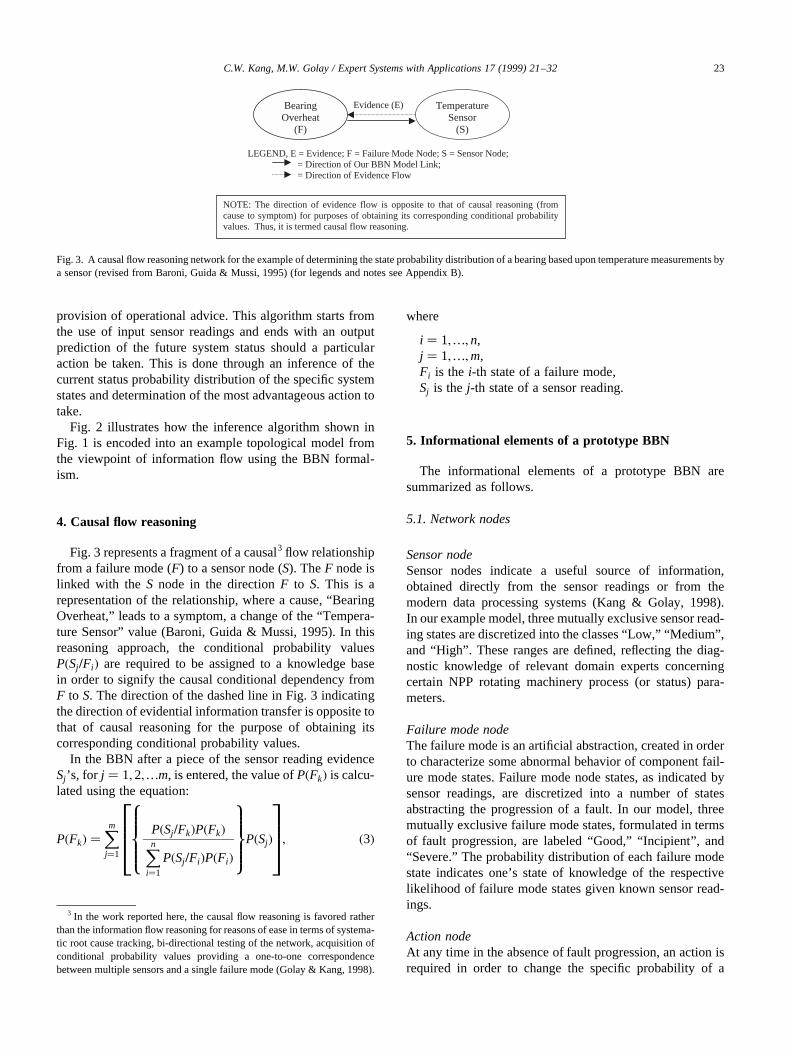
Fig. 3 represents a fragment of a causal3 flow relationshipfrom a failure mode (F) to a sensor node (S). TheF node islinked with the S node in the directionF to S. This is arepresentation of the relationship, where a cause, “BearingOverheat,” leads to a symptom, a change of the “Tempera-ture Sensor” value (Baroni, Guida & Mussi, 1995). In thisreasoning approach, the conditional probability valuesP�Sj =Fi� are required to be assigned to a knowledge basein order to signify the causal conditional dependency fromF to S. The direction of the dashed line in Fig. 3 indicatingthe direction of evidential information transfer is opposite tothat of causal reasoning for the purpose of obtaining itscorresponding conditional probability values.
In the BBN after a piece of the sensor reading evidenceSj ’s, for j � 1;2;…m, is entered, the value ofP�Fk� is calcu-lated using the equation:
P�Fk� �Xmj�1
P�Sj =Fk�P�Fk�Xni�1
P�Sj =Fi�P�Fi�
8>>><>>>:9>>>=>>>;P�Sj�
266664377775; �3�
where
i � 1;…;n,j � 1;…;m,Fi is the i-th state of a failure mode,Sj is the j-th state of a sensor reading.
5. Informational elements of a prototype BBN
The informational elements of a prototype BBN aresummarized as follows.
5.1. Network nodes
Sensor nodeSensor nodes indicate a useful source of information,obtained directly from the sensor readings or from themodern data processing systems (Kang & Golay, 1998).In our example model, three mutually exclusive sensor read-ing states are discretized into the classes “Low,” “Medium”,and “High”. These ranges are defined, reflecting the diag-nostic knowledge of relevant domain experts concerningcertain NPP rotating machinery process (or status) para-meters.
Failure mode nodeThe failure mode is an artificial abstraction, created in orderto characterize some abnormal behavior of component fail-ure mode states. Failure mode node states, as indicated bysensor readings, are discretized into a number of statesabstracting the progression of a fault. In our model, threemutually exclusive failure mode states, formulated in termsof fault progression, are labeled “Good,” “Incipient”, and“Severe.” The probability distribution of each failure modestate indicates one’s state of knowledge of the respectivelikelihood of failure mode states given known sensor read-ings.
Action nodeAt any time in the absence of fault progression, an action isrequired in order to change the specific probability of a
C.W. Kang, M.W. Golay / Expert Systems with Applications 17 (1999) 21–32 23
BearingOverheat
(F)
TemperatureSensor
(S)
Evidence (E)
NOTE: The direction of evidence flow is opposite to that of causal reasoning (fromcause to symptom) for purposes of obtaining its corresponding conditional probabilityvalues. Thus, it is termed causal flow reasoning.
LEGEND, E = Evidence; F = Failure Mode Node; S = Sensor Node; = Direction of Our BBN Model Link; = Direction of Evidence Flow
Fig. 3. A causal flow reasoning network for the example of determining the state probability distribution of a bearing based upon temperature measurements bya sensor (revised from Baroni, Guida & Mussi, 1995) (for legends and notes see Appendix B).
3 In the work reported here, the causal flow reasoning is favored ratherthan the information flow reasoning for reasons of ease in terms of systema-tic root cause tracking, bi-directional testing of the network, acquisition ofconditional probability values providing a one-to-one correspondencebetween multiple sensors and a single failure mode (Golay & Kang, 1998).
failure mode state. For this reason, the action node is intro-duced to represent the failure mode state probability trans-formation functions to be imposed by the plant operator.Utility nodeThe possible alternative actions should be evaluated on thebasis of the net value of their various consequences. Thecriterion of the decision of whether to take an action isformulated in a utility node. This node integrates the prob-ability information from each failure mode node state beforean action is taken that of each failure mode node state afterthe action is taken, and the action node depicting each of thealternative actions that will cause the state probability tran-sition of interest. The usefulness of each action is evaluatedon a numerical scale, called a utility value.
5.2. Conditional probability and utility values
Typically nuclear electric utility company experts are notfamiliar with Bayesian concepts. So, the scheme developedin this work includes a general treatment concerning how toelicit their expertise and then to translate it into a Bayesianformat.
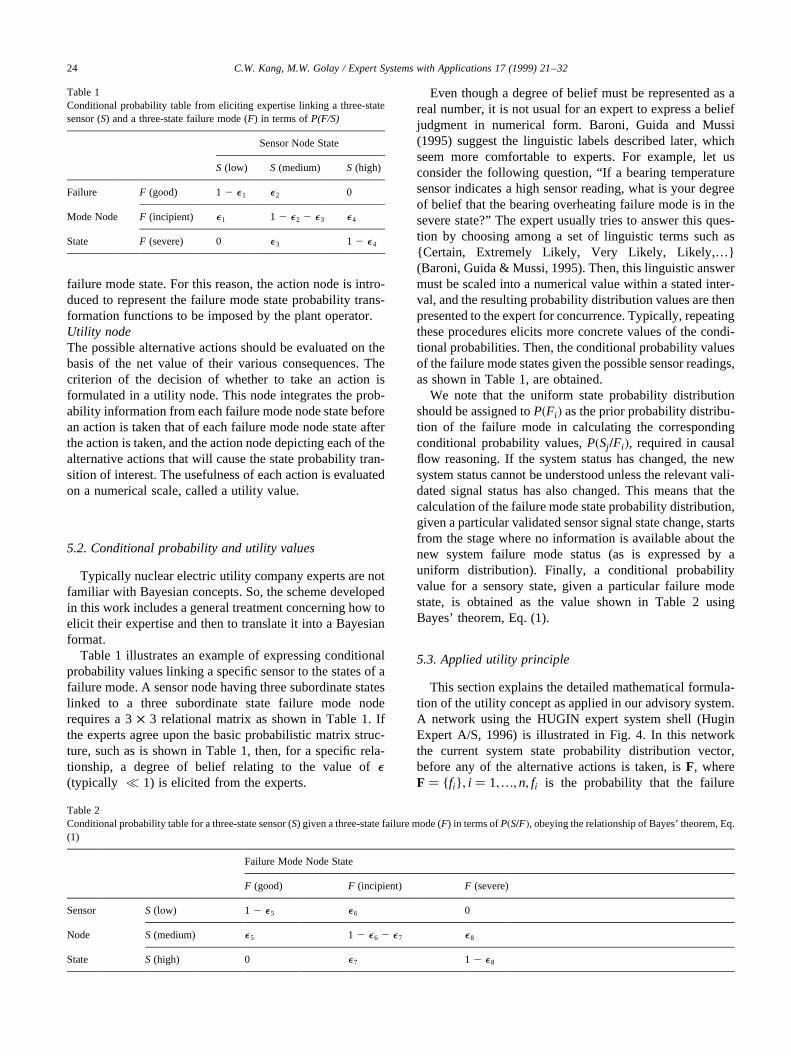
Table 1 illustrates an example of expressing conditionalprobability values linking a specific sensor to the states of afailure mode. A sensor node having three subordinate stateslinked to a three subordinate state failure mode noderequires a 3× 3 relational matrix as shown in Table 1. Ifthe experts agree upon the basic probabilistic matrix struc-ture, such as is shown in Table 1, then, for a specific rela-tionship, a degree of belief relating to the value ofe(typically p 1) is elicited from the experts.
Even though a degree of belief must be represented as areal number, it is not usual for an expert to express a beliefjudgment in numerical form. Baroni, Guida and Mussi(1995) suggest the linguistic labels described later, whichseem more comfortable to experts. For example, let usconsider the following question, “If a bearing temperaturesensor indicates a high sensor reading, what is your degreeof belief that the bearing overheating failure mode is in thesevere state?” The expert usually tries to answer this ques-tion by choosing among a set of linguistic terms such as{Certain, Extremely Likely, Very Likely, Likely,…}(Baroni, Guida & Mussi, 1995). Then, this linguistic answermust be scaled into a numerical value within a stated inter-val, and the resulting probability distribution values are thenpresented to the expert for concurrence. Typically, repeatingthese procedures elicits more concrete values of the condi-tional probabilities. Then, the conditional probability valuesof the failure mode states given the possible sensor readings,as shown in Table 1, are obtained.
We note that the uniform state probability distributionshould be assigned toP�Fi� as the prior probability distribu-tion of the failure mode in calculating the correspondingconditional probability values,P�Sj =Fi�, required in causalflow reasoning. If the system status has changed, the newsystem status cannot be understood unless the relevant vali-dated signal status has also changed. This means that thecalculation of the failure mode state probability distribution,given a particular validated sensor signal state change, startsfrom the stage where no information is available about thenew system failure mode status (as is expressed by auniform distribution). Finally, a conditional probabilityvalue for a sensory state, given a particular failure modestate, is obtained as the value shown in Table 2 usingBayes’ theorem, Eq. (1).
5.3. Applied utility principle
This section explains the detailed mathematical formula-tion of the utility concept as applied in our advisory system.A network using the HUGIN expert system shell (HuginExpert A/S, 1996) is illustrated in Fig. 4. In this networkthe current system state probability distribution vector,before any of the alternative actions is taken, isF, whereF � { fi} ; i � 1;…;n; fi is the probability that the failure
C.W. Kang, M.W. Golay / Expert Systems with Applications 17 (1999) 21–3224
Table 1Conditional probability table from eliciting expertise linking a three-statesensor (S) and a three-state failure mode (F) in terms ofP(F/S)
Sensor Node State
S (low) S (medium) S (high)
Failure F (good) 12 e1 e2 0
Mode Node F (incipient) e1 1 2 e2 2 e3 e4
State F (severe) 0 e3 1 2 e4
Table 2Conditional probability table for a three-state sensor (S) given a three-state failure mode (F) in terms ofP�S=F�, obeying the relationship of Bayes’ theorem, Eq.(1)
Failure Mode Node State
F (good) F (incipient) F (severe)
Sensor S (low) 1 2 e5 e6 0
Node S (medium) e5 1 2 e6 2 e7 e8
State S (high) 0 e7 1 2 e8
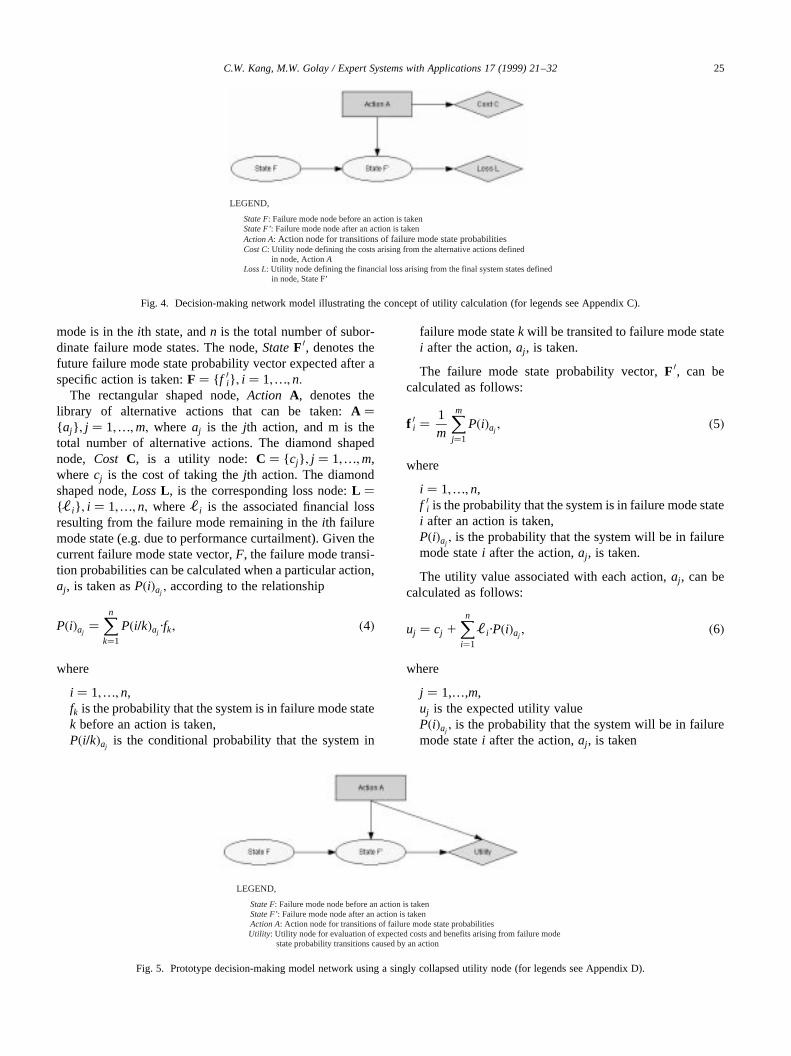
mode is in theith state, andn is the total number of subor-dinate failure mode states. The node,StateF 0, denotes thefuture failure mode state probability vector expected after aspecific action is taken:F � { f 0i} ; i � 1;…;n:
The rectangular shaped node,Action A, denotes thelibrary of alternative actions that can be taken:A �{ aj} ; j � 1;…;m; whereaj is the jth action, and m is thetotal number of alternative actions. The diamond shapednode, Cost C, is a utility node: C � { cj} ; j � 1;…;m,wherecj is the cost of taking thejth action. The diamondshaped node,LossL , is the corresponding loss node:L �{`i} ; i � 1;…;n; where`i is the associated financial lossresulting from the failure mode remaining in theith failuremode state (e.g. due to performance curtailment). Given thecurrent failure mode state vector,F, the failure mode transi-tion probabilities can be calculated when a particular action,aj , is taken asP�i�aj
; according to the relationship
P�i�aj�Xnk�1
P�i=k�aj·fk; �4�
where
i � 1;…;n,fk is the probability that the system is in failure mode statek before an action is taken,P�i=k�aj
is the conditional probability that the system in
failure mode statek will be transited to failure mode statei after the action,aj , is taken.
The failure mode state probability vector,F 0, can becalculated as follows:
f 0i � 1m
Xmj�1
P�i�aj; �5�
where
i � 1;…;n,f 0i is the probability that the system is in failure mode statei after an action is taken,P�i�aj
; is the probability that the system will be in failuremode statei after the action,aj , is taken.
The utility value associated with each action,aj , can becalculated as follows:
uj � cj 1Xni�1
`i ·P�i�aj; �6�
where
j � 1,…,m,uj is the expected utility valueP�i�aj
; is the probability that the system will be in failuremode statei after the action,aj , is taken
C.W. Kang, M.W. Golay / Expert Systems with Applications 17 (1999) 21–32 25
LEGEND,
State F: Failure mode node before an action is takenState F’: Failure mode node after an action is takenAction A: Action node for transitions of failure mode state probabilitiesCost C: Utility node defining the costs arising from the alternative actions defined in node, Action ALoss L: Utility node defining the financial loss arising from the final system states defined in node, State F’
Fig. 4. Decision-making network model illustrating the concept of utility calculation (for legends see Appendix C).
LEGEND,
State F: Failure mode node before an action is takenState F’: Failure mode node after an action is takenAction A: Action node for transitions of failure mode state probabilities
Utility: Utility node for evaluation of expected costs and benefits arising from failure mode state probability transitions caused by an action
Fig. 5. Prototype decision-making model network using a singly collapsed utility node (for legends see Appendix D).
cj is the cost of taking thejth action`i is the associated financial loss resulting from thesystem remaining in failure mode statei.
After the expected utility values associated with eachalternative action are obtained from Eq. (6), the most advan-tageous action is identified to be that with the highestexpected utility value. In case that the action,ak, leads tothe least financial loss, then, in action nodeA, the followingprobability distribution is assigned:
P�aj� �0; j ± k
1; j � k:
(�7�
Then, the BBN as shown in Fig. 4 provides the final
results, the expected financial loss and the future systemstate probability distribution, once the suggested action istaken.
6. Prototype BBN-based diagnostic maintenance model
According to Eq. (6) the two utility nodes of Fig. 4 can becollapsed into a single utility node, as shown in Fig. 5, in theHUGIN expert system shell formalism. And the inferencewithin the network of our advisory system can be extendedto predict the future state probability distribution of thesensor-state, given all prior evidence, with the most advan-tageous action having been taken. Fig. 6 represents the
C.W. Kang, M.W. Golay / Expert Systems with Applications 17 (1999) 21–3226
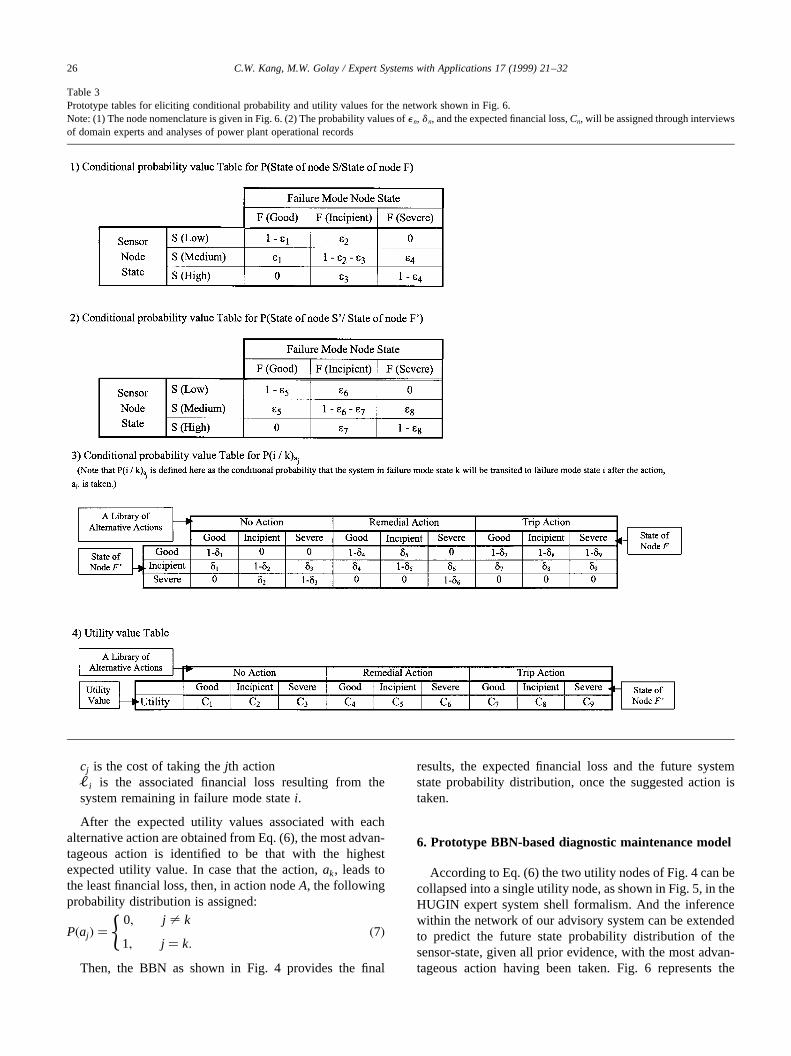
Table 3Prototype tables for eliciting conditional probability and utility values for the network shown in Fig. 6.Note: (1) The node nomenclature is given in Fig. 6. (2) The probability values ofen, dn, and the expected financial loss,Cn, will be assigned through interviewsof domain experts and analyses of power plant operational records
prototype BBN model including the predictive mode to beused in our advisory system. The sensor node, S0, gives thefuture probability distribution of the sensor reading statesafter the suggested action is taken. With this analysis, theoperator can check the predicted probability distribution ofthe sensor readings, obtained from the advisory system.Such estimates provide a basis for comparison of the ulti-mately observed component and sensor set performance tothe estimations of the advisory system.
The prototype input tables for the prototype conditionalprobability and utility values required as the essential
knowledge base of the network, as shown in Fig. 6, are listedin Table 3.
7. Demonstration of example model execution
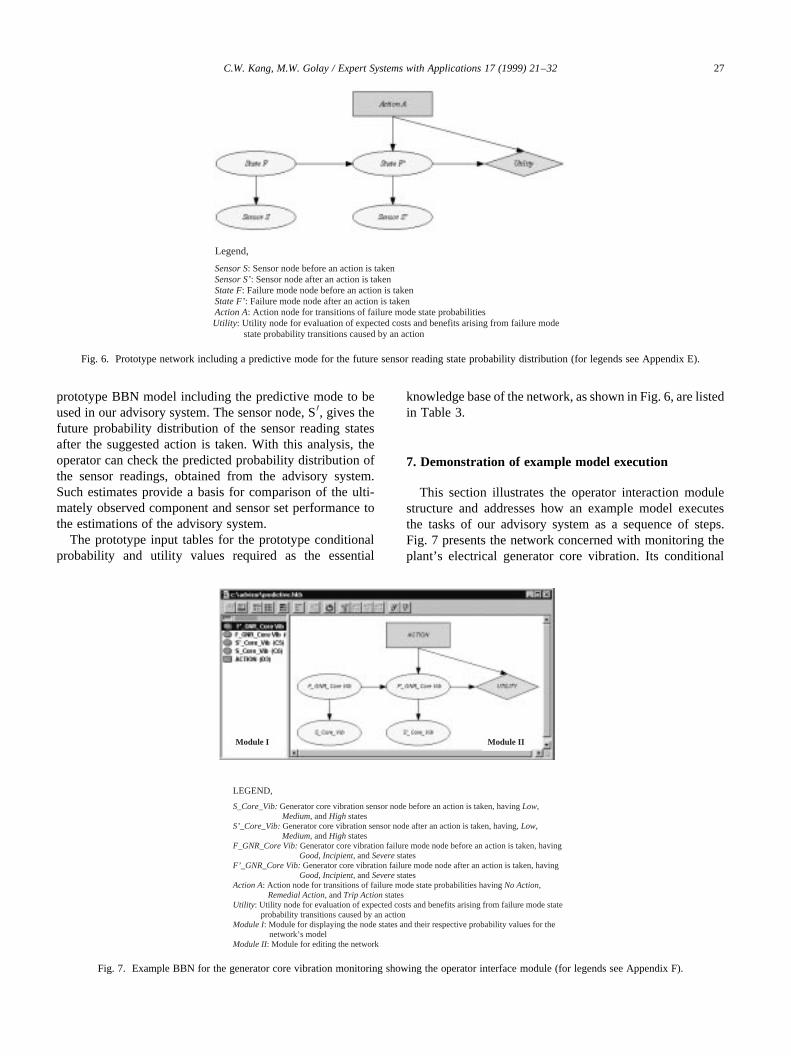
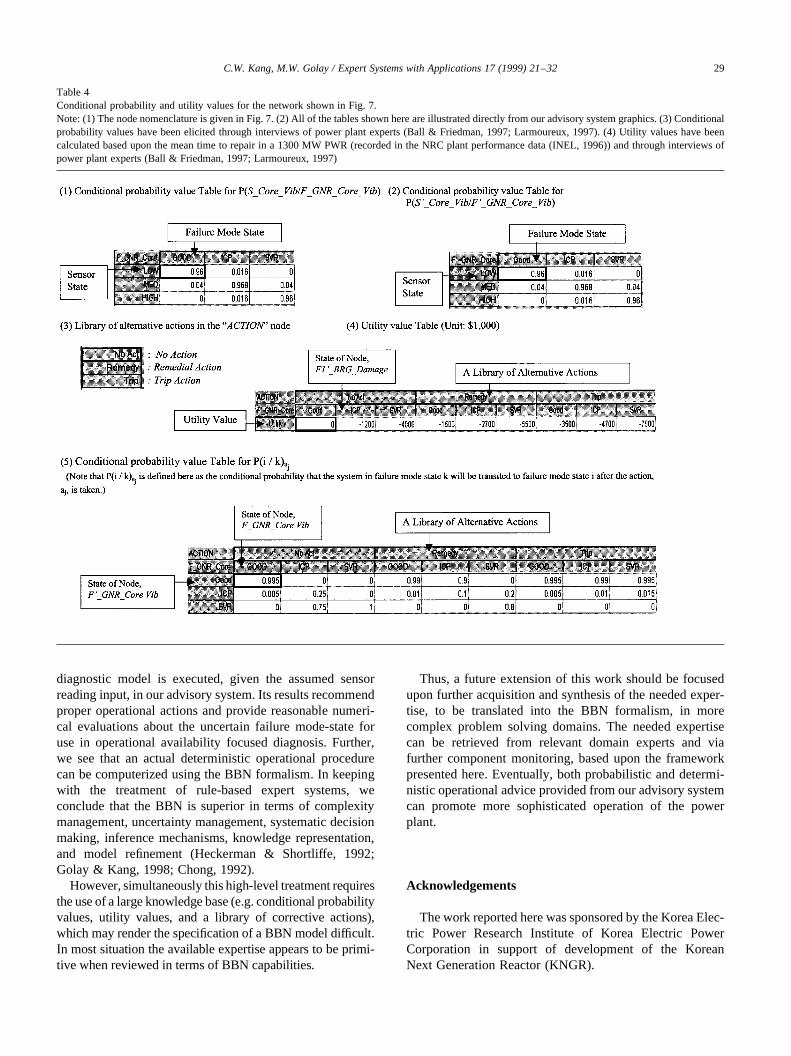
This section illustrates the operator interaction modulestructure and addresses how an example model executesthe tasks of our advisory system as a sequence of steps.Fig. 7 presents the network concerned with monitoring theplant’s electrical generator core vibration. Its conditional
C.W. Kang, M.W. Golay / Expert Systems with Applications 17 (1999) 21–32 27
Legend,
Sensor S: Sensor node before an action is takenSensor S’: Sensor node after an action is takenState F: Failure mode node before an action is takenState F’: Failure mode node after an action is takenAction A: Action node for transitions of failure mode state probabilitiesUtility : Utility node for evaluation of expected costs and benefits arising from failure mode state probability transitions caused by an action
Fig. 6. Prototype network including a predictive mode for the future sensor reading state probability distribution (for legends see Appendix E).
LEGEND,
S_Core_Vib: Generator core vibration sensor node before an action is taken, having Low, Medium, and High statesS’_Core_Vib: Generator core vibration sensor node after an action is taken, having, Low, Medium, and High statesF_GNR_Core Vib: Generator core vibration failure mode node before an action is taken, having
Good, Incipient, and Severe statesF’_GNR_Core Vib: Generator core vibration failure mode node after an action is taken, having
Good, Incipient, and Severe statesAction A: Action node for transitions of failure mode state probabilities having No Action,
Remedial Action, and Trip Action statesUtility : Utility node for evaluation of expected costs and benefits arising from failure mode state probability transitions caused by an actionModule I: Module for displaying the node states and their respective probability values for the network’s modelModule II: Module for editing the network
Module I Module II
Fig. 7. Example BBN for the generator core vibration monitoring showing the operator interface module (for legends see Appendix F).
probability and utility values required for execution of thisnetwork are given in Table 4.
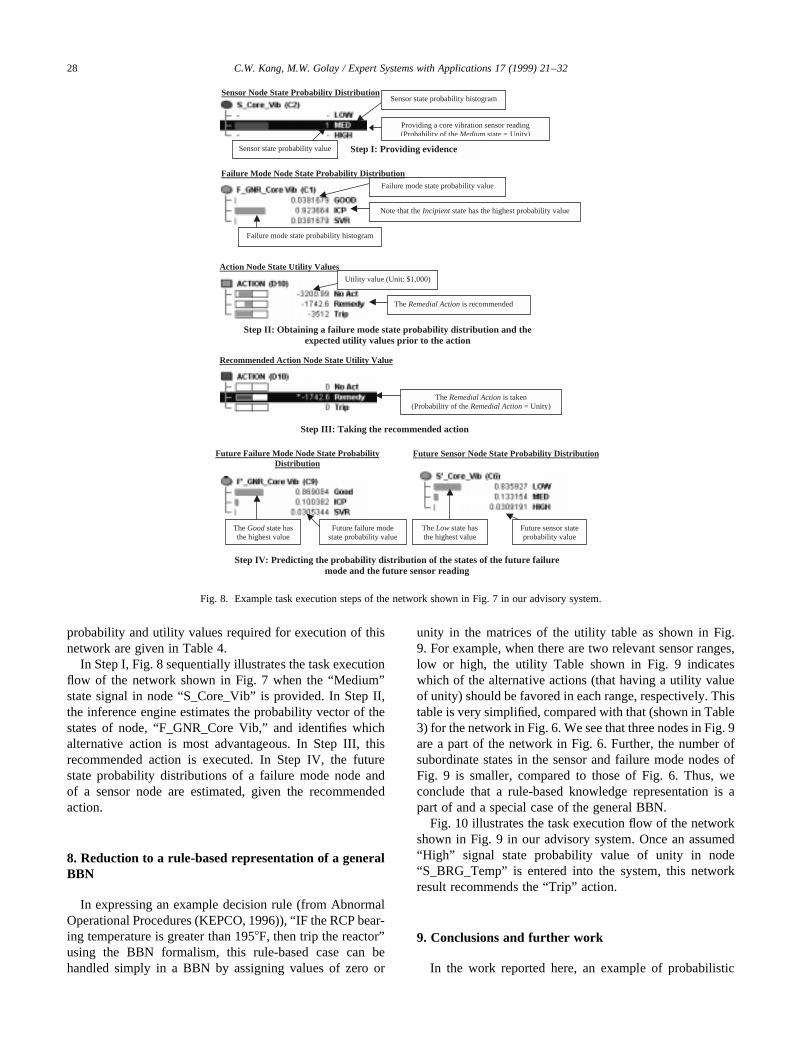
In Step I, Fig. 8 sequentially illustrates the task executionflow of the network shown in Fig. 7 when the “Medium”state signal in node “S_Core_Vib” is provided. In Step II,the inference engine estimates the probability vector of thestates of node, “F_GNR_Core Vib,” and identifies whichalternative action is most advantageous. In Step III, thisrecommended action is executed. In Step IV, the futurestate probability distributions of a failure mode node andof a sensor node are estimated, given the recommendedaction.
8. Reduction to a rule-based representation of a generalBBN
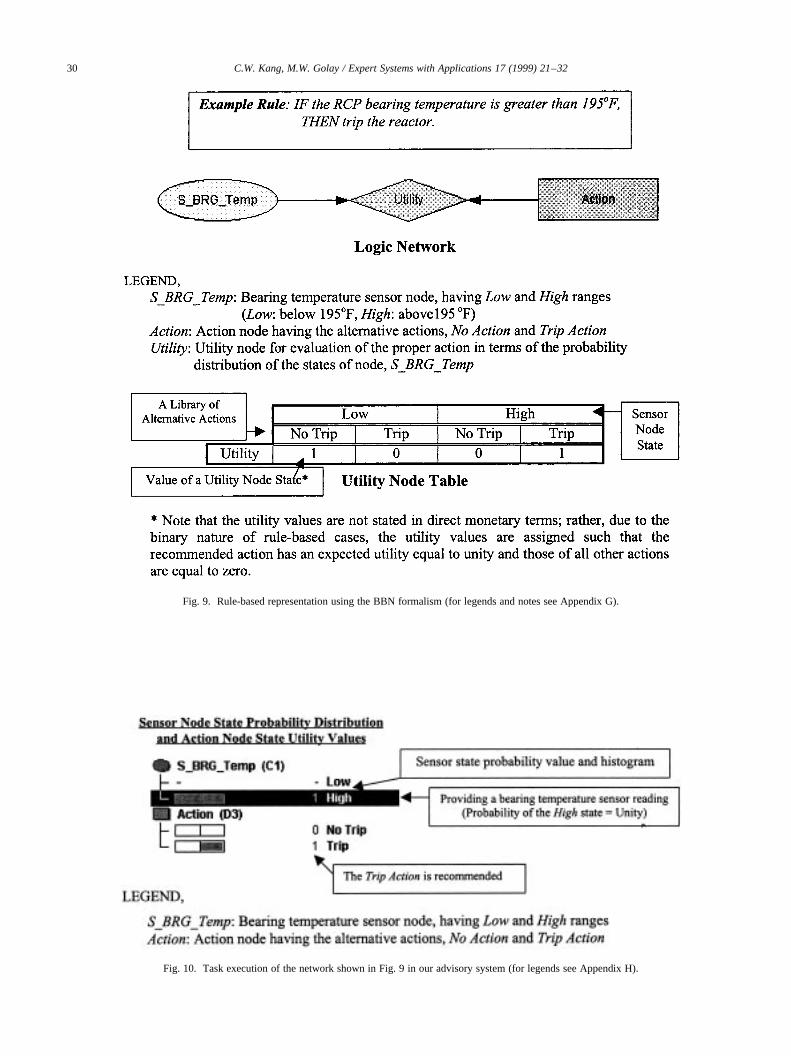
In expressing an example decision rule (from AbnormalOperational Procedures (KEPCO, 1996)), “IF the RCP bear-ing temperature is greater than 1958F, then trip the reactor”using the BBN formalism, this rule-based case can behandled simply in a BBN by assigning values of zero or
unity in the matrices of the utility table as shown in Fig.9. For example, when there are two relevant sensor ranges,low or high, the utility Table shown in Fig. 9 indicateswhich of the alternative actions (that having a utility valueof unity) should be favored in each range, respectively. Thistable is very simplified, compared with that (shown in Table3) for the network in Fig. 6. We see that three nodes in Fig. 9are a part of the network in Fig. 6. Further, the number ofsubordinate states in the sensor and failure mode nodes ofFig. 9 is smaller, compared to those of Fig. 6. Thus, weconclude that a rule-based knowledge representation is apart of and a special case of the general BBN.
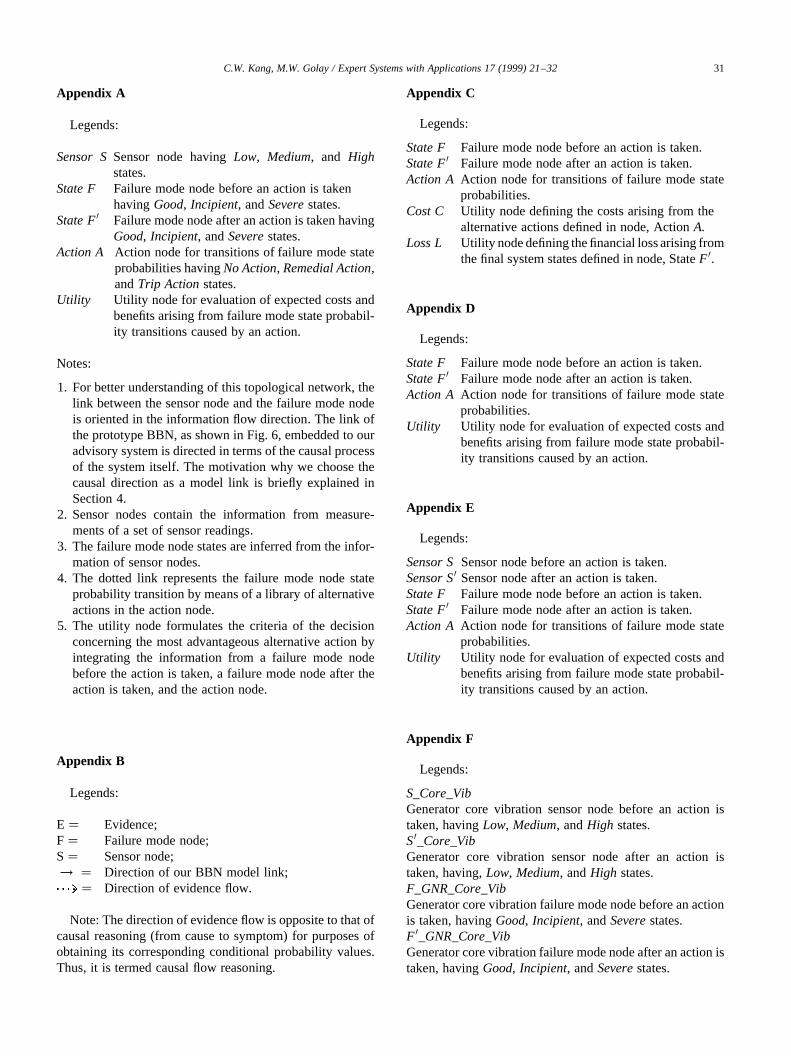
Fig. 10 illustrates the task execution flow of the networkshown in Fig. 9 in our advisory system. Once an assumed“High” signal state probability value of unity in node“S_BRG_Temp” is entered into the system, this networkresult recommends the “Trip” action.
9. Conclusions and further work
In the work reported here, an example of probabilistic
C.W. Kang, M.W. Golay / Expert Systems with Applications 17 (1999) 21–3228
Step II: Obtaining a failure mode state probability distribution and theexpected utility values prior to the action
The Remedial Action is recommended
The Remedial Action is taken(Probability of the Remedial Action = Unity)
Step IV: Predicting the probability distribution of the states of the future failuremode and the future sensor reading
The Good state hasthe highest value
The Low state hasthe highest value
Future sensor stateprobability value
Step I: Providing evidence
Providing a core vibration sensor reading(Probability of the Medium state = Unity)
Step III: Taking the recommended action
Sensor state probability value
Failure mode state probability value
Sensor Node State Probability DistributionSensor state probability histogram
Failure Mode Node State Probability Distribution
Note that the Incipient state has the highest probability value
Action Node State Utility ValuesUtility value (Unit: $1,000)
Failure mode state probability histogram
Recommended Action Node State Utility Value
Future Sensor Node State Probability Distribution
Future failure modestate probability value
Future Failure Mode Node State ProbabilityDistribution
Fig. 8. Example task execution steps of the network shown in Fig. 7 in our advisory system.
diagnostic model is executed, given the assumed sensorreading input, in our advisory system. Its results recommendproper operational actions and provide reasonable numeri-cal evaluations about the uncertain failure mode-state foruse in operational availability focused diagnosis. Further,we see that an actual deterministic operational procedurecan be computerized using the BBN formalism. In keepingwith the treatment of rule-based expert systems, weconclude that the BBN is superior in terms of complexitymanagement, uncertainty management, systematic decisionmaking, inference mechanisms, knowledge representation,and model refinement (Heckerman & Shortliffe, 1992;Golay & Kang, 1998; Chong, 1992).
However, simultaneously this high-level treatment requiresthe use of a large knowledge base (e.g. conditional probabilityvalues, utility values, and a library of corrective actions),which may render the specification of a BBN model difficult.In most situation the available expertise appears to be primi-tive when reviewed in terms of BBN capabilities.
Thus, a future extension of this work should be focusedupon further acquisition and synthesis of the needed exper-tise, to be translated into the BBN formalism, in morecomplex problem solving domains. The needed expertisecan be retrieved from relevant domain experts and viafurther component monitoring, based upon the frameworkpresented here. Eventually, both probabilistic and determi-nistic operational advice provided from our advisory systemcan promote more sophisticated operation of the powerplant.
Acknowledgements
The work reported here was sponsored by the Korea Elec-tric Power Research Institute of Korea Electric PowerCorporation in support of development of the KoreanNext Generation Reactor (KNGR).
C.W. Kang, M.W. Golay / Expert Systems with Applications 17 (1999) 21–32 29
Table 4Conditional probability and utility values for the network shown in Fig. 7.Note: (1) The node nomenclature is given in Fig. 7. (2) All of the tables shown here are illustrated directly from our advisory system graphics. (3) Conditionalprobability values have been elicited through interviews of power plant experts (Ball & Friedman, 1997; Larmoureux, 1997). (4) Utility values have beencalculated based upon the mean time to repair in a 1300 MW PWR (recorded in the NRC plant performance data (INEL, 1996)) and through interviews ofpower plant experts (Ball & Friedman, 1997; Larmoureux, 1997)
C.W. Kang, M.W. Golay / Expert Systems with Applications 17 (1999) 21–3230
Fig. 9. Rule-based representation using the BBN formalism (for legends and notes see Appendix G).
Fig. 10. Task execution of the network shown in Fig. 9 in our advisory system (for legends see Appendix H).
Appendix A
Legends:
Sensor SSensor node havingLow, Medium, and Highstates.
State F Failure mode node before an action is takenhavingGood, Incipient, andSeverestates.
State F0 Failure mode node after an action is taken havingGood, Incipient, andSeverestates.
Action A Action node for transitions of failure mode stateprobabilities havingNo Action, Remedial Action,andTrip Action states.
Utility Utility node for evaluation of expected costs andbenefits arising from failure mode state probabil-ity transitions caused by an action.
Notes:
1. For better understanding of this topological network, thelink between the sensor node and the failure mode nodeis oriented in the information flow direction. The link ofthe prototype BBN, as shown in Fig. 6, embedded to ouradvisory system is directed in terms of the causal processof the system itself. The motivation why we choose thecausal direction as a model link is briefly explained inSection 4.
2. Sensor nodes contain the information from measure-ments of a set of sensor readings.
3. The failure mode node states are inferred from the infor-mation of sensor nodes.
4. The dotted link represents the failure mode node stateprobability transition by means of a library of alternativeactions in the action node.
5. The utility node formulates the criteria of the decisionconcerning the most advantageous alternative action byintegrating the information from a failure mode nodebefore the action is taken, a failure mode node after theaction is taken, and the action node.
Appendix B
Legends:
E � Evidence;F � Failure mode node;S� Sensor node;! � Direction of our BBN model link;� Direction of evidence flow.
Note: The direction of evidence flow is opposite to that ofcausal reasoning (from cause to symptom) for purposes ofobtaining its corresponding conditional probability values.Thus, it is termed causal flow reasoning.
Appendix C
Legends:
State F Failure mode node before an action is taken.State F0 Failure mode node after an action is taken.Action A Action node for transitions of failure mode state
probabilities.Cost C Utility node defining the costs arising from the
alternative actions defined in node, ActionA.Loss L Utility node defining the financial loss arising from
the final system states defined in node, StateF 0.
Appendix D
Legends:
State F Failure mode node before an action is taken.State F0 Failure mode node after an action is taken.Action A Action node for transitions of failure mode state
probabilities.Utility Utility node for evaluation of expected costs and
benefits arising from failure mode state probabil-ity transitions caused by an action.
Appendix E
Legends:
Sensor SSensor node before an action is taken.Sensor S0 Sensor node after an action is taken.State F Failure mode node before an action is taken.State F0 Failure mode node after an action is taken.Action A Action node for transitions of failure mode state
probabilities.Utility Utility node for evaluation of expected costs and
benefits arising from failure mode state probabil-ity transitions caused by an action.
Appendix F
Legends:
S_Core_VibGenerator core vibration sensor node before an action istaken, havingLow, Medium, andHigh states.S0_Core_VibGenerator core vibration sensor node after an action istaken, having,Low, Medium, andHigh states.F_GNR_Core_VibGenerator core vibration failure mode node before an actionis taken, havingGood, Incipient, andSeverestates.F 0_GNR_Core_VibGenerator core vibration failure mode node after an action istaken, havingGood, Incipient, andSeverestates.
C.W. Kang, M.W. Golay / Expert Systems with Applications 17 (1999) 21–32 31
Action A Action node for transitions of failure mode stateprobabilities havingNo Action, Remedial Action,andTrip Action states.
Utility Utility node for evaluation of expected costs andbenefits arising from failure mode state probabil-ity transitions caused by an action.
Module I Module for displaying the node states and theirrespective probability values for the network’smodel.
Module II Module for editing the network.
Appendix G
Legends:
S_BRG_TempBearing temperature sensor node, havingLow and High ranges (Low: below 1958F,High: above 1958F).
Action Action node having the alternative actions,No ActionandTrip Action.
Utility Utility node for evaluation of the properaction in terms of the probability distributionof the states of node,S_BRG_Temp.
Note: The utility values are not stated in direct monetaryterms; rather, due to the binary nature of rule-based cases,the utility values are assigned such that the recommendedaction has an expected utility equal to unity and those of allother actions are equal to zero.
Appendix H
Legends:
S_BRG_TempBearing temperature sensor node, havingLow andHigh ranges.
Action Action node having the alternative actions,NoAction andTrip Action.
References
Ball, S., & Friedman, S. (1997). System expert meeting at Seabrook powerstation.
Baroni, P., Guida, G., & Mussi, S. (1995). Causal reasoning under uncer-tainty with Q/C-E networks: a case study on preventive diagnosis ofpower transformers.International Conference on the Applications ofArtificial Intelligence in Engineering.
Chong, H. G. (1992). Rule-based versus probabilistic approaches to thediagnosis of faults in water treatment processes.Artificial IntelligenceIn Engineering.
Golay, M. W., & Kang, C. W. (1998). On-line monitoring for improvednuclear power plant availability and operating advice-active equipmentmonitoring: rotating machinery.MIT Technical Report, No.MIT-ANP-TR-057, 1.
Heckerman, D. E., & Shortliffe, E. H. (1992). From certainty factor tonetworks belief.Artificial Intelligence in Medicine, 4.
HUGIN Expert A/S (1994). HUGIN runtime user’s guide.INEL (Idaho National Engineering Laboratory) (1996). NRC Plant perfor-
mance database.Jensen, F. (1996). Bayesian belief network technology and the HUGIN
system.Proceedings of International Conference on Intelligent DataManagement, London.
Jensen, F. V. (1996). An Introduction to Bayesian Networks. Berlin:Springer.
Kang, C. W., & Golay, M. W. (1998). An integrated method for compre-hensive sensor network development in complex nuclear powersystems.Journal of Reliability Engineering and System Safetyin press.
KEPCO (Korea Electric Power Corporation) (1996). Abnormal OperationalProcedures.
Larmoureux, J. R. (1997). System expert meeting at Pilgrim power station.
C.W. Kang, M.W. Golay / Expert Systems with Applications 17 (1999) 21–3232
Copyright © 2022 FDOKUMEN