
Fully Connected Bayesian Belief Networks: A Modeling Procedure with a Case Study of the Ganges River...
12
Fully Connected Bayesian Belief Networks: A Modeling Procedure with a Case Study of the Ganges River Basin Olli Varis,*y Muhammad Mizanur Rahaman,y and Tommi Kajandery yWater and Development Research Group, Aalto University, PO Box 15200, FI-00076 Espoo, Finland (Submitted 15 November 2010; Returned for Revision 16 March 2011; Accepted 11 May 2011) ABSTRACT The use of Bayesian Belief Networks (BBNs) in modeling of environmental and natural resources systems has gradually grown, and they have become one of the mainstream approaches in the field. They are typically used in modeling complex systems in which policy or management decisions must be made under high uncertainties. This article documents an approach to constructing large and highly complex BBNs using a matrix representation of the model structure. This approach allows smooth construction of highly complicated models with intricate likelihood structures. A case study of the Ganges river basin, the most populated river basin of the planet, is presented. Four different development scenarios were investigated with the purpose of reaching the Millennium Development Goals and Integrated Water Resources Management goals, both promoted by the United Nations Agencies. The model results warned against the promotion of economic development policies that do not place strong emphasis on social and environmental concerns. Integr Environ Assess Manag 2012;8:491–502. ß 2011 SETAC Keywords: Bayesian Belief Networks Development Environment Probabilistic models River basin management INTRODUCTION Many of the basic ideas of Bayesian decision theory are rooted in the frequentist probability theory that prevailed in the 1930s and 1940s. Von Neumann and Morgenstern (1944) visualized decision problems using a decision tree, and developed the axiomatization of many basic concepts of utility theory that have become cornerstones of Bayesian decision theory. These concepts became truly Bayesian somewhat later through advancements in mathematical and statistical theory by Wald (1950), Blackwell and Girshick (1954), Savage (1954), and Luce and Raiffa (1957). Many of these concepts have been summarized and popularized by Howard (1968), North (1968), and Raiffa (1968). Statistics is seen to be persistently split into 2 camps—frequentists and Bayesians — and this split still largely prevails and has a history of more than 250 years (Efron 2005; Little 2006). The evolution of Bayesian concepts in the 1940s and 1950s further reinforced the split of statistical decision theory (Shafer 1990). In the past several decades, most Bayesian decision theory applications have emerged in automated decision making in which large amounts of observation data are being used on- line to adjust model predictions and optimizing systems in the fields of navigation, chemical engineering, manufacturing processes, and pattern recognition (Shafer 1990). A specific cluster of decision theory applications is directed at the acquisition of knowledge and information from experts in strategic decision making on complex systems where obser- vational data are not as readily available as in the operational settings mentioned above, and where the reasoning leading to decisions has a strong social and human dimension and context. Such systems—also addressed in this article—have most typically been used to support consensus making and to facilitate learning processes in the identification of complex, social and economic systems (Shachter 1988; Shafer 1990; Varis and Fraboulet-Jussila 2002; Borsuk et al. this issue; Henriksen et al. this issue; Johnson et al. this issue; Uusitalo et al. this issue). The computer implementation of Bayesian knowledge- acquisition tools started in the late 1970s (e.g., Leal and Pearl 1977; Humphreys and McFadden 1980). Facilitated by the development of computational algorithms and architectures (such as Shachter 1986; Pearl 1986; Lauritzen and Spiegel- halter 1988), the application software has been evolving and represents concurrently a wide selection of tools for various purposes from statistical-mathematical package add-ins to stand-alone software, and from packages of source codes on languages such as Java and Cþþ to web-based toolsets (Korb and Nicholson 2004; Murphy 2007). The Bayesian Belief Network (BBN) methodology belongs to the branch of Bayesian decision theory approaches with a strong focus on knowledge acquisition. This methodology has gradually become one of the mainstream approaches in environmental modeling and assessment (McCann et al. 2006; Nyberg et al. 2006; Uusitalo 2007). The methodo- logy has been particularly popular in modeling complex Integrated Environmental Assessment and Management — Volume 8, Number 3—pp. 491–502 ß 2011 SETAC 491 EDITOR’S NOTE This paper represents 1 of 7 review and case study articles generated as a result of a workshop entitled ‘‘Scenario and decision analysis in environmental management using Bayesian Belief Networks’’ (1–2 October 2009, Oslo, Norway) hosted by the Norwegian Institute for Nature Research (NINA) and the Strategic Institute Project ‘‘Nature 2020R’’ and funded by the Research Council of Norway. The main aim of the workshop was to compare Bayesian network applications to different environmental and resource management problems from around the world, identifying common modeling strategies and questions for further research. * To whom correspondence may be addressed: olli.varis@aalto.fi Published online 17 May 2011 in Wiley Online Library (wileyonlinelibrary.com). DOI: 10.1002/ieam.222 Special Series
Transcript of Fully Connected Bayesian Belief Networks: A Modeling Procedure with a Case Study of the Ganges River...
Fully Connected Bayesian Belief Networks: A ModelingProcedure with a Case Study of the Ganges River BasinOlli Varis,*y Muhammad Mizanur Rahaman,y and Tommi KajanderyyWater and Development Research Group, Aalto University, PO Box 15200, FI-00076 Espoo, Finland
(Submitted 15 November 2010; Returned for Revision 16 March 2011; Accepted 11 May 2011)
ABSTRACTThe use of Bayesian Belief Networks (BBNs) inmodeling of environmental andnatural resources systems has gradually grown,
and they have become one of the mainstream approaches in the field. They are typically used in modeling complex systems in
which policy or management decisions must be made under high uncertainties. This article documents an approach to
constructing large and highly complex BBNs using amatrix representation of themodel structure. This approach allows smooth
construction of highly complicatedmodels with intricate likelihood structures. A case study of the Ganges river basin, themost
populated river basin of the planet, is presented. Four different development scenarios were investigated with the purpose of
reaching theMillenniumDevelopmentGoals and IntegratedWater ResourcesManagementgoals, bothpromotedby theUnited
Nations Agencies. Themodel results warned against the promotion of economic development policies that do not place strong
emphasis on social and environmental concerns. Integr Environ Assess Manag 2012;8:491–502. � 2011 SETAC
Keywords: Bayesian Belief Networks Development Environment Probabilistic models River basin management
INTRODUCTIONMany of the basic ideas of Bayesian decision theory are
rooted in the frequentist probability theory that prevailed inthe 1930s and 1940s. Von Neumann and Morgenstern (1944)visualized decision problems using a decision tree, anddeveloped the axiomatization of many basic concepts ofutility theory that have become cornerstones of Bayesiandecision theory. These concepts became truly Bayesiansomewhat later through advancements in mathematical andstatistical theory by Wald (1950), Blackwell and Girshick(1954), Savage (1954), and Luce and Raiffa (1957). Many ofthese concepts have been summarized and popularized byHoward (1968), North (1968), and Raiffa (1968). Statistics isseen to be persistently split into 2 camps—frequentists andBayesians—and this split still largely prevails and has a historyof more than 250 years (Efron 2005; Little 2006). Theevolution of Bayesian concepts in the 1940s and 1950s furtherreinforced the split of statistical decision theory (Shafer1990).
In the past several decades, most Bayesian decision theoryapplications have emerged in automated decision making inwhich large amounts of observation data are being used on-line to adjust model predictions and optimizing systems in thefields of navigation, chemical engineering, manufacturingprocesses, and pattern recognition (Shafer 1990). A specific
cluster of decision theory applications is directed at theacquisition of knowledge and information from experts instrategic decision making on complex systems where obser-vational data are not as readily available as in the operationalsettings mentioned above, and where the reasoning leading todecisions has a strong social and human dimension andcontext. Such systems—also addressed in this article—havemost typically been used to support consensus making and tofacilitate learning processes in the identification of complex,social and economic systems (Shachter 1988; Shafer 1990;Varis and Fraboulet-Jussila 2002; Borsuk et al. this issue;Henriksen et al. this issue; Johnson et al. this issue; Uusitaloet al. this issue).
The computer implementation of Bayesian knowledge-acquisition tools started in the late 1970s (e.g., Leal and Pearl1977; Humphreys and McFadden 1980). Facilitated by thedevelopment of computational algorithms and architectures(such as Shachter 1986; Pearl 1986; Lauritzen and Spiegel-halter 1988), the application software has been evolving andrepresents concurrently a wide selection of tools for variouspurposes from statistical-mathematical package add-ins tostand-alone software, and from packages of source codes onlanguages such as Java and Cþþ to web-based toolsets (Korband Nicholson 2004; Murphy 2007).
The Bayesian Belief Network (BBN) methodology belongsto the branch of Bayesian decision theory approaches with astrong focus on knowledge acquisition. This methodology hasgradually become one of the mainstream approaches inenvironmental modeling and assessment (McCann et al.2006; Nyberg et al. 2006; Uusitalo 2007). The methodo-logy has been particularly popular in modeling complex
Integrated Environmental Assessment and Management — Volume 8, Number 3—pp. 491–502� 2011 SETAC 491
EDITOR’S NOTEThis paper represents 1 of 7 review and case study articles generated as a result of a workshop entitled ‘‘Scenario and decision
analysis in environmental management using Bayesian Belief Networks’’ (1–2 October 2009, Oslo, Norway) hosted by theNorwegian Institute for Nature Research (NINA) and the Strategic Institute Project ‘‘Nature 2020R’’ and funded by theResearch Council of Norway. The main aim of the workshop was to compare Bayesian network applications to differentenvironmental and resource management problems from around the world, identifying common modeling strategies andquestions for further research.
* To whom correspondence may be addressed: [email protected]
Published online 17 May 2011 in Wiley Online Library
(wileyonlinelibrary.com).
DOI: 10.1002/ieam.222
Specia
lSerie
s

interrelationships between socioeconomic and biophysicalsystems in which the uncertainties are high, and the structureof the reasoning is of particular interest (Varis and Kuikka1999; McCann et al. 2006; Kragt et al. 2011).
This article documents 1 specific approach to constructingBBNs for the analysis of highly complex natural resourcesand environmental management problems. The theoreticalbasis for the Fully Connected Belief Networks (FC BeNe)approach lies in the algorithms of Pearl (1986, 1988), andspecifically in the extensions to that methodology by Varis(1998). The approach, as well as the software implementa-tion, has further been developed through a number of casestudies in river basin management (Varis and Fraboulet-Jussila 2002; Varis and Lahtela 2002; Varis and Keskinen2006), fisheries and game management (Varis and Kuikka1997b; Pellikka et al. 2005), and climate change impactassessment (Kuikka and Varis 1997; Varis and Kuikka 1997a).Instead of a graph interface, the model structure is beingconstructed by filling up a spreadsheet interfaced matrix ofinterlinkages.
Here the computational details are not documentedbecause they have been published earlier (Varis 1998).
Instead, we present an itemized description of the modelingprocedure in a specific case study, followed by a Discussionand Conclusion section on the application of BBNs inintegrated environmental assessment and management, andon the proposed approach in particular.
THE MODELING PROCEDURE: THE OUTLINE ANDOUTSET
Technically, the FC BeNe modeling approach differssubstantially from those conventional BBN models, whichare operated through a graphical interface consisting of nodesand arcs. A modeling exercise using the approach applied herestarts from a ‘‘tabula rasa’’ (blank slate) model, in which allmodel variables are technically connected with all othervariables, but these connections are noninformative, i.e., achange in 1 variable does not influence the other variables.Also the variables are, at the outset, empty of all information,in Bayesian terms they are represented by a uniform,noninformative probability distribution. Within the modelingprocedure, the tabula rasa is being filled with information on
Figure 1. The proposed modeling procedure.
492 Integr Environ Assess Manag 8, 2012—O Varis et al.
the variables and their interconnections, typically duringexpert panel sessions.
In addition to basic analyses, comprehensive sensitivityanalyses can be carried out, including studies of the rolesof the information sets obtained for the variables understudy, as well as the roles of the causalities between thevariables. The steps of the modeling procedure are shownin Figure 1.
The authors of this article acted as the basis of the expertpanel and worked out the model in numerous brainstorming
sessions that took place over a period of 2 years. In severalsessions, other topical experts also were invited to offer theirviews on certain specific topics. The total time allocation forthis study—excluding the background studies—was theequivalent of approximately 10 working months.
The Ganges Basin and goals for its development
The goal of the case study was to analyze the policy optionsfor the Ganges river basin in South Asia to meet 2 sets of
Table 1. Selected social, economic and environmental indicators for the Ganges basin riparian countriesa
Relevant to MDG Indicator
Country
Bangladesh India Nepal
Population (millions, 2007) 157.8 1164 28.3
Expected population (millions, 2015) 168.2 1260.4 32.7
Surface area (1000 km2) 144 3287 147
GDP per capita (PPP US $) (2007) 1241 2753 1049
Urban population (%) (2004) 24.7 28.5 15.3
1 Population below income poverty line (%) (1 US $/d) (2004) 36 34.7 24.1
2 Children reaching grade 5 (%) (2003) 65 79 67
3 Ratio of female to male enrollments in primary, secondaryand tertiary schools (%) (2004)
58 58 52
4–6 Life expectancy at birth (2004) 63.6 63.3 62.1
4–7 Access to improved water source (% of population) (2004) 74 86 90
4–7 Access to improved sanitation facilities (% of population) (2004) 39 33 35
7 CO2 emissions per capita (metric tons) (2003) 0.3 1.2 0.1
8 Aid % of GDPb (2004) 2.5 0.1 6.4
aData taken from UNDP (2006; 2009).bGDP¼gross domestic product; MDG¼Millennium Development Goals; PPP¼purchasing power parity.
Table 2. The United Nations Millennium Development Goals
Number Title
1 Eradicate extreme poverty and hunger: reduce by half the proportion of people living on less than 1 dollar per day.
2 Achieve universal primary education: ensure that all boys and girls complete a full course of primary schooling.
3 Promote gender equality and empower women: eliminate gender disparity in primary and secondary education,preferably by 2005, and at all levels by 2015.
4 Reduce child mortality: reduce by two-thirds the mortality among children under 5.
5 Improve maternal health: reduce by 75% the maternal mortality ratio.
6 Combat HIV/AIDS, malaria and other diseases: halt and begin to reverse the spread of HIV/AIDS, the incidence of malariaand other major diseases.
7 Ensure environmental sustainability: integrate the principles of sustainable development into country policies andprograms, reverse loss of forests, halve the proportion of people without access to improved drinking water,and improve the lives of slum dwellers.
8 Develop a global partnership for development. Develop further an open trading and financial system with a commitmentto good governance, address the special needs of the least developed and land-locked countries, deal comprehensivelywith the developing countries’ debt problems, ensure employment for youth and share the benefits of new technologies,and so forth.
Fully Connected Bayesian Belief Networks— Integr Environ Assess Manag 8, 2012 493
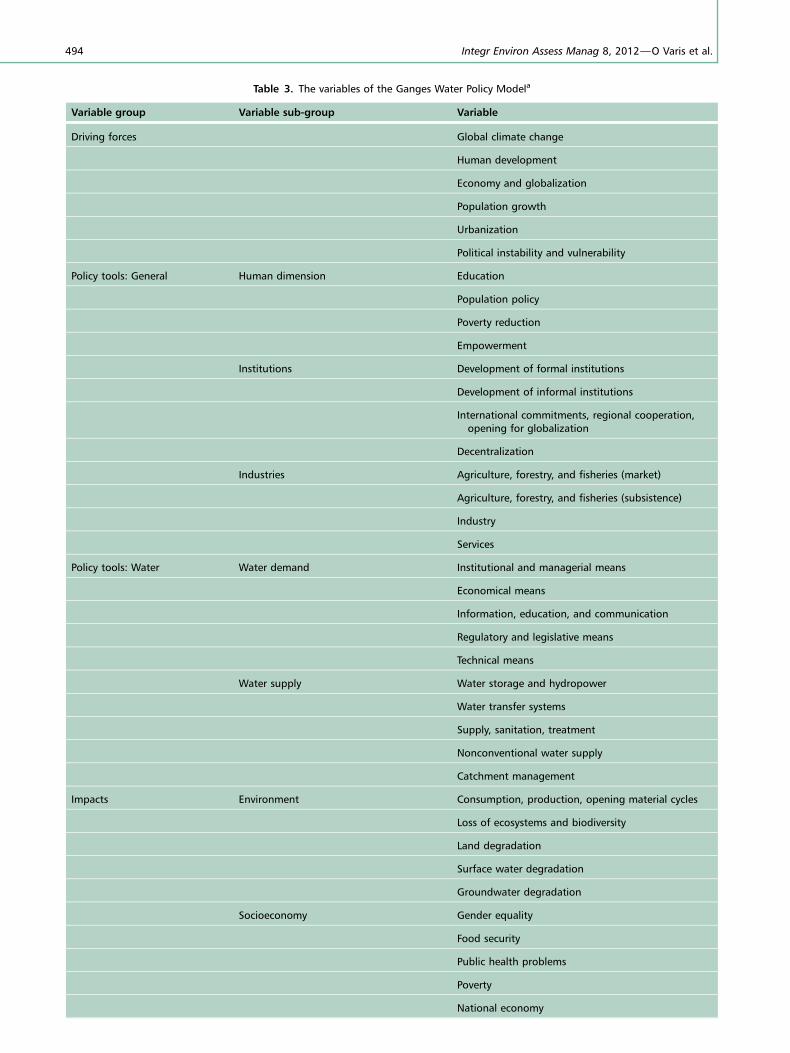
Table 3. The variables of the Ganges Water Policy Modela
Variable group Variable sub-group Variable
Driving forces Global climate change
Human development
Economy and globalization
Population growth
Urbanization
Political instability and vulnerability
Policy tools: General Human dimension Education
Population policy
Poverty reduction
Empowerment
Institutions Development of formal institutions
Development of informal institutions
International commitments, regional cooperation,opening for globalization
Decentralization
Industries Agriculture, forestry, and fisheries (market)
Agriculture, forestry, and fisheries (subsistence)
Industry
Services
Policy tools: Water Water demand Institutional and managerial means
Economical means
Information, education, and communication
Regulatory and legislative means
Technical means
Water supply Water storage and hydropower
Water transfer systems
Supply, sanitation, treatment
Nonconventional water supply
Catchment management
Impacts Environment Consumption, production, opening material cycles
Loss of ecosystems and biodiversity
Land degradation
Surface water degradation
Groundwater degradation
Socioeconomy Gender equality
Food security
Public health problems
Poverty
National economy
494 Integr Environ Assess Manag 8, 2012—O Varis et al.

internationally agreed development goals. The basin is by anymeasure one of the planet’s most challenging and problematicriver basins (Biswas et al. 2005; Varis et al. 2011). Thisworld’s most populated river basin is shared by India, Nepal,Bangladesh, and to a marginal extent by China. Themagnitude of the development challenges faced by thesecountries (Table 1) reveals that decisive and comprehensivesteps need to be taken toward achieving overall developmentin the region.
As water is intertwined with almost all conceivable parts oflife in the Ganges basin, and because water is a highly politicalissue in the region, it is highly justified to approach watermanagement targets in such a situation by using criteria thatare as widely accepted as possible. Therefore, the UnitedNations Millennium Development Goals (MDGs) and theUnited Nations promoted Integrated Water Resources Man-agement (IWRM) objectives were chosen to constitute thegoal-set of this analysis, as they are relevant within the watermanagement and development context of the Ganges basin.These goals are globally accepted, and international commun-ities have pledged to accomplish them worldwide. They areexplained in brief below.
In the year 2000, the United Nations adopted the 8 MDGs(Table 2) that should be met by the year 2015. Accordingly,the leaders from virtually all 191 UN member states vowed tocooperate to achieve these goals (UN 2000, 2011).
The United Nations has equally strongly promoted theimplementation of IWRM over several decades (Rahaman andVaris 2005). The GWP (2000) defined IWRM as ‘‘. . .aprocess that promotes the coordinated development andmanagement of water, land and related resources to maximizethe resultant economic and social welfare in an equitablemanner without compromising the sustainability of vitalecosystems.’’ It also emphasized that water should bemanaged in a basinwide context, under the prevalence ofgood governance and public participation (Rahaman andVaris 2005). The 3 key strategic objectives of IWRM are asfollows:
1) Economic development: waters should be used to provideeconomic well-being.
2) Social development: allocation of water across differentsocial and economic groups in an equitable manner toensure social development.
3) Environmental sustainability: protect the water resourcesbase and associated ecosystems.
Background studies
A comprehensive set of background analyses and reviews ofthe status and future development options of the Gangesbasin was carried out.
First, a comprehensive, regional analysis of the implemen-tation of IWRM was performed for the entire South andSoutheast Asia (Biswas et al. 2005). This included ananalysis of a series of country studies as well as river basinstudies. The critical drivers for water resources managementin the region have been summarized by Varis (2005).Rahaman (2009a, 2009b) analyzed the role of the GangesRiver in the regional development of South Asia, as well asthe international collaboration, conflicts, and treatiesrelated to the river. Rahaman and Varis (2009) extendedthe previous studies to include another giant river ofSouth Asia—the Brahmaputra—that actually joins theGanges before emptying into the Bay of Bengal and con-stitutes along with the Meghna basin the enormous Ganges-Brahmaputra-Meghna system, home to more than 650million people. For these background studies, data werecollected from both primary and secondary sources. Primarydata and information were collected from relevant organiza-tions and experts in the study area (Nepal, Bangladesh, India,and Bhutan).
These analyses revealed that water management is heavilyinterlinked with institutional development as well as withdifferent sectors, and the integration between the differentsectoral policies is key to achieving overall development in theregion. In addition, social, political, environmental, andeconomic challenges were scrutinized, and they appearedrelatively similar in all the riparian countries. Therefore, theGanges basin is hereafter regarded as 1 unit, according to thephilosophy of IWRM.
Table 3. (Continued )
Variable group Variable sub-group Variable
Goals Millennium development goals 1. Eradicate extreme poverty and hunger
2. Achieve universal primary education
3. Promote gender equity and women empowerment
4–6. Health issues
7. Ensure environmental sustainability
8. Develop a global partnership for development
IWRM objectives Economic growth
Social development
Environmental sustainability
aThe variables are listed in the causal sequence as used in the model.
Fully Connected Bayesian Belief Networks— Integr Environ Assess Manag 8, 2012 495
VARIABLES FOR THE MODELThe first part of the model construction was to identify a
plausible set of variables to describe the Ganges basin and itsregional development context. This was a long exercise, withplenty of trials and errors. The variable set should becomprehensive yet compact, whereas the variables shouldbe intuitively clear and analytically unambiguous.
Four variable clusters—driving forces, policy tools,impacts, and goals—were identified. Driving forces arefactors that are under a low level of control and that createthe settings for the water and sector policies. Policy tools areactive measures that can be used to affect the system.Together, these clusters have impacts—either positive ornegative—on the environment and socioeconomy. The goals,namely the IWRM goals and the MDGs, are at the end of thenetwork and mainly affected by the impacts.
In total, there are 47 variables (Table 3). They consist of 6driving forces, 22 policy tools, 10 impact variables, and 9development goals. MDGs 4 to 6 are considered 1 variable,because all of them deal with health issues.
Causal sequence of variablesBecause the used computational algorithm is based on a
directed graph approach, the variables must be organized toform a sequence (Pearl 1988). This usually requires someelaboration to assure that as little information as possible islost in the model for 2 reasons. First, the algorithm cannotevaluate loops; and second, propagating information backand forth (i.e., Node 4 ! Node 5 ! Node 3) cannot beperformed precisely (instead, the information from Node 3!Node 4 ! Node 5 or from Node 5 ! Node 4 ! Node 3 ispropagated precisely because the direction of the messagedoes not change).
Prior probabilities
The state variables and driving forces typically have acertain prior condition and tendency to change in a certaindirection. The present situation was used as a referencesituation: whether the issue will grow, decrease, stayunchanged, and to what extent. Consequently, the variablesof the model were defined as rates of change. A priorprobability distribution was assigned to the rate of change ofeach variable, which is sharp if we know this variable well,but flat if it is poorly known, or is subjected to variation that isbeyond the resolution of the model.
For policy tools, mathematically similar prior probabilitydistributions are being used for decision outcomes in thisapproach. In such a situation, a sharp probability distributionimplies that the corresponding decision variable is well undercontrol, whereas a flat distribution tells that it is poorlycontrollable.
In the Ganges model, the prior probability distributions arecalculated from the input marks shown in Table 5, knowingthe interpretation shown in Table 4.
MODEL STRUCTUREThe second part of the model construction is to define the
structure of the model. In this approach, a numerical value,ranging from �1 to þ1 is assigned to describe the strength ofthe link between each pair of 2 nodes. These link strengthparameters indicate how much a change in one variableinfluences another variable. As interpreted through a stat-
istical analogy, it implies the proportion of the variance ofeach variable explained by the variance of the conditioningvariable (analogous to Pearson’s R2, which is additive, unlike,for instance, R), yet with causal interpretation of direction ofinfluence. Accordingly, the sum of absolute values of all thelink strengths heading to a variable may not exceed 1. Theentire link matrix of the Ganges model contains 1081 (¼(47� 46)/2) elements. Therefore, it is not worthwhile topresent the matrix and describe all its elements in detail in ajournal article. However, as an illustration, a piece of the linkmatrix is shown in Figure 2. With this formulation of linksand prior probability distributions, normality is assumed, butthe computational approach is by no means restricted tonormality. Other formulations are also possible (Varis 1998).
Consistency iteration
The posterior probability of a variable should not be muchflatter than its prior probability; if it is, it might indicateinconsistency in the assessment. The states of the othervariables and their connections are not fully in accord with theassumption of the state of the variable concerned. A sharperposterior distribution indicates that the information contentof the entire model allows a decrease in the uncertainty of thevariable under consideration. In general, an inconsistent linkmatrix flats out the posterior distributions quite easily.
Although being entirely different, the link matrix and itsinconsistency analysis properties are sometimes mixed withsome multiple criteria decision-making approaches (e.g.,Saaty 1980), in which 2 variables are subjectively comparedwith a numerical scale, and the consistency of the assessmentof a set of multiple variables can be analyzed by usingeigenvalues of the resulting intercomparison matrix.
SCENARIO ANALYSIS
Scenarios
The Ganges model was used to analyze 3 characteristicdevelopment scenarios and for constructing a feasible com-promise between them, aimed at better meeting the develop-ment goals set for the exercise than any of the originalcharacteristic scenarios. These scenarios consisted of 3classical corners of sustainable development and of theircombination, i.e., they were the ones in which eithereconomic development, human development, environmentalconcerns, or their ‘‘integrated’’ mix would be prioritized(Table 5). All scenarios were again constructed by the expertpanel and were essentially based on the aforementionedbackground studies.
The integrated scenario is not an absolute mean of theother 3 scenarios but rather a compromise between them,seeking solutions in which none of the development goalsare ignored (Varis and Lahtela 2002; Varis and Keskinen2006). The amount and direction of change were chosen byiteration, whereas the accuracy reveals the level of control ofeach sector policy that such a change would actually takeplace. The results of the model are summarized in Tables 6and 7.
Sensitivity analysis
The model was constructed to include a possibility to carryout an interactive sensitivity analysis. In such an analysis, asmall perturbation is imposed on the prior probability
496 Integr Environ Assess Manag 8, 2012—O Varis et al.

distribution of each of the sector policies, and the responsecan be observed graphically. We introduced a 1% perturba-tion on the average of a probability distribution. Thisapproach is analogous to the Hessian matrix from optimiza-tion theory.
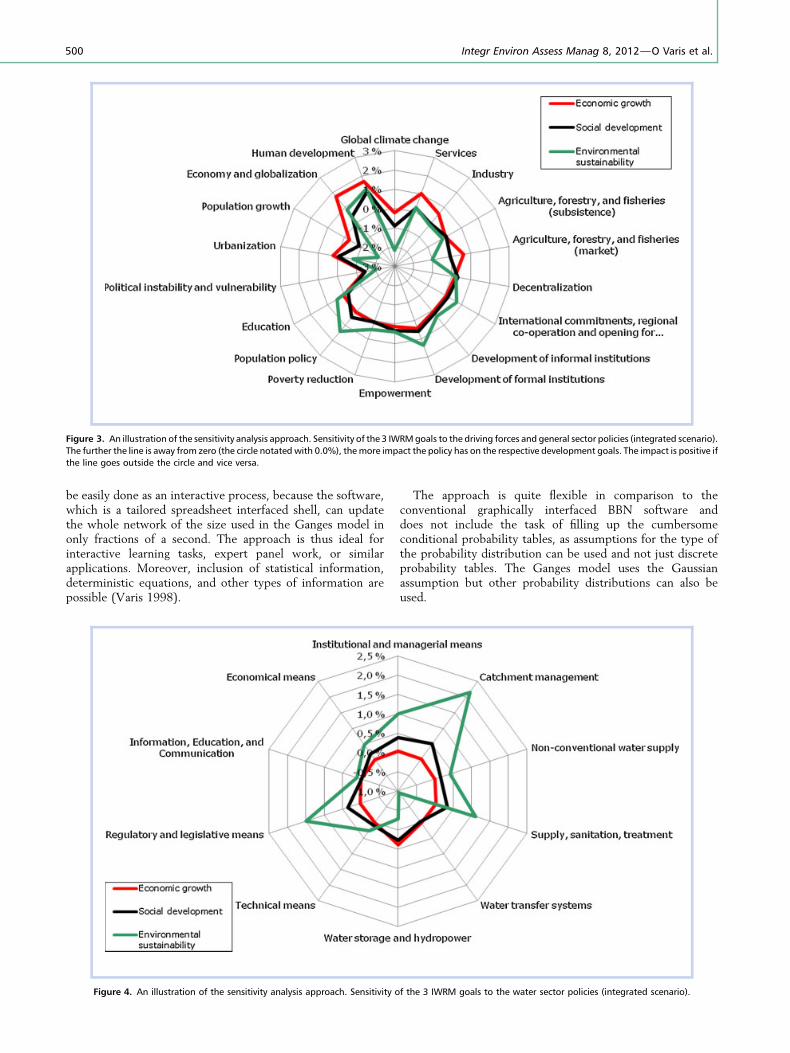
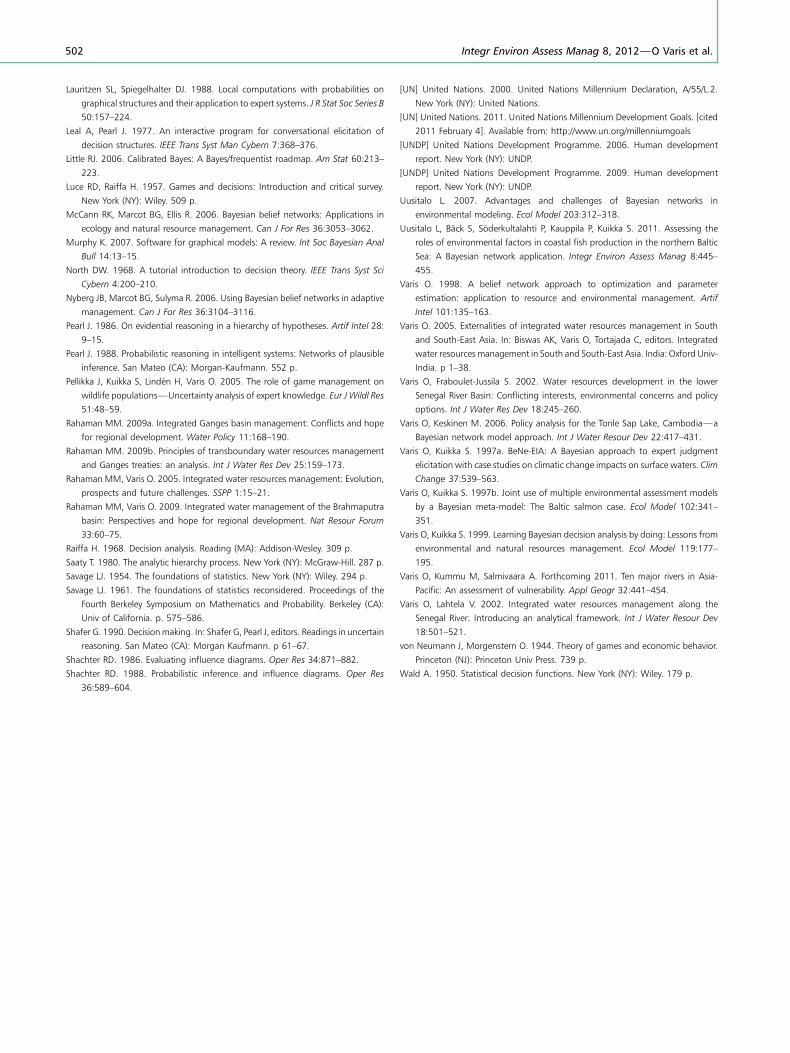
The sensitivity plots show the sensitivity of the MDGs andIWRM goals to changes in sector policies. They also showhow much the realization of these development goalsresponds to small changes in different sector policies. Theexamples shown in Figures 3 and 4 reveal the sensitivity of theIWRM goals to the driving forces and sector policies for theintegrated scenario. The sensitivity of each development goalto the sector policies can be observed graphically for all 4scenarios analyzed with this model.
The sensitivity plots change interactively when thescenario is modified. This provides important guidance onhow the scenario could be modified to make it betterwith respect to any of the 8 MDGs and 3 IWRM goals.Some comments are listed below on the basis of sensitivityanalyses (Figures 3 and 4) with respect to the policycombinations in terms of their efficacy in achieving the 3IWRM goals:
1) Economic growth: this objective would be best achievedby emphasizing policies such as industries, services,agriculture, forestry and market fisheries, water storageand hydropower development, and development of formalinstitutions. To avoid possible conflict with the environ-mental sustainability objective, careful considerationshould be given to some of these policies, e.g., waterstorage and hydropower, as well as industries.
2) Social development: investing in education, populationpolicy, poverty reduction, empowerment and watersupply, sanitation and treatment policies would bringpositive development. However, political stability and
human development are fundamental to implementingthese policies.
3) Environmental sustainability: the important policies inrelation to this objective would be education, populationpolicy, poverty reduction, catchment management, non-conventional water supply, water supply, sanitation andtreatment, development of formal institutions, interna-tional commitments, and regional cooperation.
DISCUSSION AND CONCLUSIONSThe development of the Ganges Water Policy Model aimed
at providing systematization of the various factors that areinfluential in water policy making toward meeting the MDGsand IWRM objectives in the Ganges basin. Reality is alwaysfar more complicated than computer models, however, andthe models can only foster policy dialogue with systematicstructuring and analysis of excessively complicated entitiessuch as the one presented here. In particular, the modelallows an approach that takes greater account of the broaderissues and constraints faced by water managers due to themultidimensional, multifaceted task of managing water.Equally important is the capability of handling very highuncertainties and communicating these to policy makers.Such a capability is missing from many contemporary scenariomodeling techniques.
Decision support and policy advantages of explicit modelingof uncertainty
Multidisciplinary and holistic approaches are needed toanalyze complex policy making tasks in environmentaland natural resources management in a transparent andmost equitable way. An approach to using the BBN method-ology in a systematic trade-off and scenario analysis in
Table 4. The 4 development scenarios and general sector policies investigated with the Ganges Water Policy Modela
Ganges Basin
Environment Economic growthHuman
development Integrated
Mean Accuracy Mean Accuracy Mean Accuracy Mean Accuracy
Education > ��� > ��� >> �� > ���
Population policy > ���� – ��� > �� >> ��
Poverty reduction >> ��� < ��� >>> ��� > ���
Empowerment >> ��� < ��� >> ��� >> ��
Development of formal institutions > ��� >> ��� – – >> ��
Development of informal institutions – – – – > �� > ��
International commitments, regionalcooperation and opening for globalization
>> ��� > ��� > �� > ���
Decentralization – – > ���� >>> �� >> ��
Agriculture, forestry, and fisheries (market) << �� >>> ��� > �� >> ���
Agriculture, forestry, and fisheries (subsistence) > ��� << ��� >>> ��� > ����
Industry << �� >>> ��� > ��� > ���
Services – �� >> ��� – – > ��
aSee Table 5.
Fully Connected Bayesian Belief Networks— Integr Environ Assess Manag 8, 2012 497

Table 5. Semiquantitative scale used for scenario analysis and future tendencies
Means All variables AccuracyPolicy variables:level of control
Driving forces and impacts:level of knowledge
No change No control Unknown
> Small increase � 20% under control 20% known
>> Modest increase �� 40% under control 40% known
>>> Large increase ��� 60% under control 60% known
< Small decrease ���� 80% under control 80% known
<< Modest decrease ����� Fully under control Fully known
<<< Large decrease – – –
Figure 2. The principle of the link matrix with an example draw out with selected comments attached to specific link strength values.
498 Integr Environ Assess Manag 8, 2012—O Varis et al.

such situations was examined. It was used as part of acomplex scrutiny that yielded a set of policy recommenda-tions.
The analysis showed clearly the advantages of explicitmodeling of uncertainty in a highly complicated case forthe management of environment and natural resources.Awareness and understanding of the interconnectednessand high level of uncertainty of the various factors relevantto water policy making in the gigantic river basin in questioncan be improved through a systematic BBN analysis such asthe present one. An approach such as this can be useful inguiding experts and policy makers to consider the complexityof the issues systematically and in a coherent fashion, and ityields policy-relevant results. The models are among thevarious means to reach the ends, which are a set of balanced
results of an integrated analysis, aiming at benefittingwater resources development in as sustainable a manner aspossible.
Merits of the proposed approach
When analyzing highly complex and multidisciplinarysystems such as the development of the Ganges river basin,the use of a Bayesian model fosters consistent thinking andargumentation and serves as a plausible platform for construct-ing a coherent view of a problem which is conceptually quitedifficult to comprehend due to its colossal dimension.
The applied FC BeNe approach is quite efficient in thisregard and allows a systematic and versatile model develop-ment procedure for the analysis of complex models. This can
Table 7. Results of the 4 development scenarios with respect to the 3 IWRMa goals
Goals/scenarioEnvironmental
scenarioEconomic growth
scenarioHuman development
scenarioIntegratedscenario
Economicgrowth
Lowest average and highestuncertainty. It reveals thatenvironmental sustainabilityand economic growth arenot going hand in hand.
Higher improvementin relation to otherscenarios. Butuncertainty is higher incomparison to humandevelopment andintegrated scenarios.
Showing slightly lowerimprovement inrelation to economicgrowth scenario. Butuncertainty is lowerthan economic growthscenario
Although improvementis slightly lower thaneconomic growthscenario, theuncertainty is lowest inrelation to the 3 basicscenarios.
Socialdevelopment
Environmental scenario showsan almost equal average tothe human developmentscenario.
Offering lowest averageand highest uncer-tainty.
Offering best improve-ment in comparison tothe 2 other basic sce-narios.
Highest average andlowest uncertainty incomparison with the3 basic scenarios.
Environmentalsustainability
All 4 scenarios give negative results and uncertainty is very high. Naturally, the environmental scenario implies lessenvironmental deterioration.
aIWRM¼ Integrated Water Resources Management.
Table 6. Results of the 4 development scenarios analyses with respect to the MDGsa
MDG Title Results
1 Eradicate extreme povertyand hunger
Integrated scenario offers best improvement with the least uncertainty. The economicdevelopment scenario is giving the worst results both in terms of effectiveness anduncertainties.
2 Universal primary education The difference between human development scenario and integrated scenario is minor.Integrated scenario offers less uncertainty.
3 Promote gender equalityand empower women
Differences between environmental, human development and integrated scenarios are minor.All these scenarios offer positive development in the achievement of MDG 3. Economicgrowth scenario offers the least development with highest uncertainty. The uncertainty inthe integrated scenario is the lowest and is therefore considered the most desirable option.
4–6 Health issues The environmental, human development, and integrated scenarios have an almost equaleffect. However, again, the economic scenario offers the lowest improvement and highestuncertainty. The integrated scenario offers the lowest uncertainty, which implies thatintegrated scenario is less risky and would be a better choice in relation to these goals.
7 Ensure environmentalsustainability
The 4 scenarios indicate nomajor differences. However, the environmental scenario offers onlya minor improvement. The lesson learned from this output is that ensuring environmentalsustainability is quite difficult, if not impossible. Overall socioeconomic development isneeded to even maintain the current status.
8 Develop global partnershipfor development
All the 4 scenarios offer positive development. The integrated scenario offers better resultsthan any of the 3 basic scenarios both in terms of effectiveness and certainties.
aMDG¼Millennium Development Goals.
Fully Connected Bayesian Belief Networks— Integr Environ Assess Manag 8, 2012 499
be easily done as an interactive process, because the software,which is a tailored spreadsheet interfaced shell, can updatethe whole network of the size used in the Ganges model inonly fractions of a second. The approach is thus ideal forinteractive learning tasks, expert panel work, or similarapplications. Moreover, inclusion of statistical information,deterministic equations, and other types of information arepossible (Varis 1998).
The approach is quite flexible in comparison to theconventional graphically interfaced BBN software anddoes not include the task of filling up the cumbersomeconditional probability tables, as assumptions for the type ofthe probability distribution can be used and not just discreteprobability tables. The Ganges model uses the Gaussianassumption but other probability distributions can also beused.
Figure 3. An illustration of the sensitivity analysis approach. Sensitivity of the 3 IWRMgoals to the driving forces and general sector policies (integrated scenario).
The further the line is away from zero (the circle notated with 0.0%), themore impact the policy has on the respective development goals. The impact is positive if
the line goes outside the circle and vice versa.
Figure 4. An illustration of the sensitivity analysis approach. Sensitivity of the 3 IWRM goals to the water sector policies (integrated scenario).
500 Integr Environ Assess Manag 8, 2012—O Varis et al.

Computationally, the FC BeNe approach is based onPearl’s algorithms (1986, 1988). Considerable extensionsaddressing environmental and natural resources managementsituations were provided by Varis (1998), and a furtherdevelopment of the multidimensional sensitivity analysisproperty was introduced by Varis and Keskinen (2006). Theapproach includes several innovations that set it apart fromthe mainstreamed graph interfaced approaches in severalways, as documented above.
Bayesian modeling strategies specific to the environmentalmanagement problem
A modeling strategy for addressing problems such as thepresent one would start with a profound investigation of theenvironmental management situation under study. In theGanges case, this was an extensive undertaking that wasreported in a number of scientific books and articles. Inparallel, a body of experts is needed for the modelingprocedure to be sound. The involvement of stake holdersand policy makers would be important at a later stage.
Certain impact on policy dialogue has been achieved in theGanges case, notably in Bangladesh, and the role of back-ground studies has been particularly important. In someearlier cases of similar nature (Varis and Fraboulet-Jussila2002; Varis and Lahtela 2002; Varis and Keskinen 2006) thepolicy impact has become essentially bigger. The approachand the strategy applied are not particularly specific to casessuch as the present one as the experience from fisheriesmanagement (Kuikka and Varis 1997), climate changeadaptation (Varis and Kuikka 1997a), and game management(Pellikka et al. 2005) reveal.
Challenges of the use of BBNs
Whereas the BBNs offer a wealth of possibilities andproperties uncommon for most other modeling approaches,there are also certain factors that hinder the spread andacceptance of these approaches in the environmental andnatural resources management fields. Above all, a majority ofthe experts tend not to be familiar with, or ready to learn thetheoretical, philosophical, and computational basics of theapproach. The Bayesian philosophy, the inference andpropagation of information, which is not bound to modelphysical quantities, energy fluxes etc., and the analyticalformulation of subjective and uncertain information allconstitute boundaries between Bayesian and nonBayesianmodelers.
This split between statistics and users of statistical modelsto frequentists and Bayesians (Savage 1961; Shafer 1990;Howson and Urbach 1991; Efron 2005; Little 2006) is clearlyvisible in our field. The boundaries are high and challengingwhen communicating the models and their outcomes to endusers, or when incorporating them into the knowledgeelicitation procedures. Many experts and end users ofenvironmental models readily accept highly complicated andin many parts highly subjective model formulations whenthey are hidden behind so-called, physically based models,consisting typically of a large set of partial differentialequations and having dozens of more or less ambiguous,nonidentifiable parameters. However, the same individualstend to reject approaches in which the uncertainty andsubjectivity are explicitly and transparently formulated asmodel components.
Interestingly, many Bayesian modelers consider physicallybased simulation models with the above mentioned featurescloser to Bayesian models than frequentist ones, andcategorize, in the philosophical sense, the classical physics-based modelers such as Laplace as forerunners of Bayesianmethodology (Efron 2005) as the prior information (physics-based equations, nonmeasurable parameter values, etc.) isbeing widely used. Efron (2005) maintains that today’s greatexpansion of data sets, modeling approaches and so forthpress the developers of methodology to cross the ancientboundary between the frequentists and Bayesians. We wouldlike to add that the societal and political importance and roleof various statistical-mathematical inference approachespushes in the same direction.
After all, no approach is superior to others in all respects,and a toolbox of a modeler in environmental and naturalresources management field should incorporate severalcomplementary approaches, including Bayesian tools. Beingtoo one-sided in methodological terms is a great danger(Hopple 1986) for any modeler who deals with diverse andcomplex matters such as faced in integrated environmentalassessment and management.
Acknowledgment—The authors thankfully acknowledge thefinancial support of the Academy of Finland Project 133748,and Maa-ja vesitekniikan tuki r.y. The authors would liketo thank David Barton, Marko Keskinen, Virpi Stucki, MattiKummu, Pertti Vakkilanen, Sakari Kuikka, Iswer RajOnta, and M. Maniruzzaman Miah for their constructivecomments.
REFERENCESBiswas AK, Varis O, Tortajada C, editors. 2005. Integrated water resources
management in South and South-East Asia. India: Oxford Univ Press. 353 p.
Blackwell D, GirshickMA. 1954. Theory of games and statistical decisions. New York
(NY): Wiley. 355 p.
Borsuk M, Schweizer S, Reichert P. 2012. A Bayesian network model for integrative
river rehabilitation planning and management. Integr Environ Assess Manag
8:462–472.
Efron B. 2005. Bayesians, frequentists, and scientists. J Am Stat Assoc 100:1–5.
[GWP] Global Water Partnership. 2000. IWRM at a glance: Technical Advisory
Committee. Stockholm, Sweden: Global Water Partnership Secretariat.
Henriksen HJ, Brugnach M, Zorrilla P, de la Hera A. 2012. Use of Bayesian belief
networks for dealing with ambiguity in integrated groundwater management.
Integr Environ Assess Manag 8:430–444.
Hopple GW. 1986. Decision aiding dangers: The law of the hammer and other
maxims. IEEE Trans Syst Man Cybern 16:948–964.
Howard RA. 1968. The foundations of decision analysis. IEEE Trans Syst Sci Cybern
4:211–219.
Howson C, Urbach P. 1991. Bayesian reasoning in science. Nature 350:371–
374.
Humphreys PC, McFadden W. 1980. Experiences with MAUD: Aiding decision
structuring versus bootstrapping the decision maker. Acta Psychol 45:51–69.
Johnson S, Low Choy S, Mengersen K. 2012. Integrating Bayesian networks and
geographic information systems: Good practice examples. Integr Environ
Assess Manag 8:473–479.
Korb KB, Nicholson AE. 2004. Bayesian artificial intelligence. London (UK):
Chapman and Hall/CRC. 364 p.
Kragt ME, Newham LTH, Bennett J, Jakeman AJ. 2011. An integrated approach to
linking economic valuation and catchment modeling. Environ Model Software
26:92–102.
Kuikka S, Varis O. 1997. Uncertainties of climatic change impacts in Finnish
watersheds: A Bayesian network analysis of expert knowledge. Boreal
Environ Res 2:109–128.
Fully Connected Bayesian Belief Networks— Integr Environ Assess Manag 8, 2012 501
Lauritzen SL, Spiegelhalter DJ. 1988. Local computations with probabilities on
graphical structures and their application to expert systems. J R Stat Soc Series B
50:157–224.
Leal A, Pearl J. 1977. An interactive program for conversational elicitation of
decision structures. IEEE Trans Syst Man Cybern 7:368–376.
Little RJ. 2006. Calibrated Bayes: A Bayes/frequentist roadmap. Am Stat 60:213–
223.
Luce RD, Raiffa H. 1957. Games and decisions: Introduction and critical survey.
New York (NY): Wiley. 509 p.
McCann RK, Marcot BG, Ellis R. 2006. Bayesian belief networks: Applications in
ecology and natural resource management. Can J For Res 36:3053–3062.
Murphy K. 2007. Software for graphical models: A review. Int Soc Bayesian Anal
Bull 14:13–15.
North DW. 1968. A tutorial introduction to decision theory. IEEE Trans Syst Sci
Cybern 4:200–210.
Nyberg JB, Marcot BG, Sulyma R. 2006. Using Bayesian belief networks in adaptive
management. Can J For Res 36:3104–3116.
Pearl J. 1986. On evidential reasoning in a hierarchy of hypotheses. Artif Intel 28:
9–15.
Pearl J. 1988. Probabilistic reasoning in intelligent systems: Networks of plausible
inference. San Mateo (CA): Morgan-Kaufmann. 552 p.
Pellikka J, Kuikka S, Linden H, Varis O. 2005. The role of game management on
wildlife populations—Uncertainty analysis of expert knowledge. Eur J Wildl Res
51:48–59.
Rahaman MM. 2009a. Integrated Ganges basin management: Conflicts and hope
for regional development. Water Policy 11:168–190.
Rahaman MM. 2009b. Principles of transboundary water resources management
and Ganges treaties: an analysis. Int J Water Res Dev 25:159–173.
Rahaman MM, Varis O. 2005. Integrated water resources management: Evolution,
prospects and future challenges. SSPP 1:15–21.
Rahaman MM, Varis O. 2009. Integrated water management of the Brahmaputra
basin: Perspectives and hope for regional development. Nat Resour Forum
33:60–75.
Raiffa H. 1968. Decision analysis. Reading (MA): Addison-Wesley. 309 p.
Saaty T. 1980. The analytic hierarchy process. New York (NY): McGraw-Hill. 287 p.
Savage LJ. 1954. The foundations of statistics. New York (NY): Wiley. 294 p.
Savage LJ. 1961. The foundations of statistics reconsidered. Proceedings of the
Fourth Berkeley Symposium on Mathematics and Probability. Berkeley (CA):
Univ of California. p. 575–586.
Shafer G. 1990. Decisionmaking. In: Shafer G, Pearl J, editors. Readings in uncertain
reasoning. San Mateo (CA): Morgan Kaufmann. p 61–67.
Shachter RD. 1986. Evaluating influence diagrams. Oper Res 34:871–882.
Shachter RD. 1988. Probabilistic inference and influence diagrams. Oper Res
36:589–604.
[UN] United Nations. 2000. United Nations Millennium Declaration, A/55/L.2.
New York (NY): United Nations.
[UN] United Nations. 2011. United Nations Millennium Development Goals. [cited
2011 February 4]. Available from: http://www.un.org/millenniumgoals
[UNDP] United Nations Development Programme. 2006. Human development
report. New York (NY): UNDP.
[UNDP] United Nations Development Programme. 2009. Human development
report. New York (NY): UNDP.
Uusitalo L. 2007. Advantages and challenges of Bayesian networks in
environmental modeling. Ecol Model 203:312–318.
Uusitalo L, Back S, Soderkultalahti P, Kauppila P, Kuikka S. 2011. Assessing the
roles of environmental factors in coastal fish production in the northern Baltic
Sea: A Bayesian network application. Integr Environ Assess Manag 8:445–
455.
Varis O. 1998. A belief network approach to optimization and parameter
estimation: application to resource and environmental management. Artif
Intel 101:135–163.
Varis O. 2005. Externalities of integrated water resources management in South
and South-East Asia. In: Biswas AK, Varis O, Tortajada C, editors. Integrated
water resources management in South and South-East Asia. India: Oxford Univ-
India. p 1–38.
Varis O, Fraboulet-Jussila S. 2002. Water resources development in the lower
Senegal River Basin: Conflicting interests, environmental concerns and policy
options. Int J Water Res Dev 18:245–260.
Varis O, Keskinen M. 2006. Policy analysis for the Tonle Sap Lake, Cambodia—a
Bayesian network model approach. Int J Water Resour Dev 22:417–431.
Varis O, Kuikka S. 1997a. BeNe-EIA: A Bayesian approach to expert judgment
elicitation with case studies on climatic change impacts on surface waters. Clim
Change 37:539–563.
Varis O, Kuikka S. 1997b. Joint use of multiple environmental assessment models
by a Bayesian meta-model: The Baltic salmon case. Ecol Model 102:341–
351.
Varis O, Kuikka S. 1999. Learning Bayesian decision analysis by doing: Lessons from
environmental and natural resources management. Ecol Model 119:177–
195.
Varis O, Kummu M, Salmivaara A. Forthcoming 2011. Ten major rivers in Asia-
Pacific: An assessment of vulnerability. Appl Geogr 32:441–454.
Varis O, Lahtela V. 2002. Integrated water resources management along the
Senegal River: Introducing an analytical framework. Int J Water Resour Dev
18:501–521.
von Neumann J, Morgenstern O. 1944. Theory of games and economic behavior.
Princeton (NJ): Princeton Univ Press. 739 p.
Wald A. 1950. Statistical decision functions. New York (NY): Wiley. 179 p.
502 Integr Environ Assess Manag 8, 2012—O Varis et al.