File Code: 1900; 2700 Date: April 6,2017 Kimberly D. Bose ...
Upload
khangminh22Category
view
0download
0
HAL Id: hal-01669206https://hal.archives-ouvertes.fr/hal-01669206
Submitted on 13 Apr 2018
HAL is a multi-disciplinary open accessarchive for the deposit and dissemination of sci-entific research documents, whether they are pub-lished or not. The documents may come fromteaching and research institutions in France orabroad, or from public or private research centers.
L’archive ouverte pluridisciplinaire HAL, estdestinée au dépôt et à la diffusion de documentsscientifiques de niveau recherche, publiés ou non,émanant des établissements d’enseignement et derecherche français ou étrangers, des laboratoirespublics ou privés.
A 2700-year record of ENSO and PDO variability fromthe Californian margin based on coccolithophore
assemblages and calcificationLuc Beaufort, Michaël Grelaud
To cite this version:Luc Beaufort, Michaël Grelaud. A 2700-year record of ENSO and PDO variability from the Californianmargin based on coccolithophore assemblages and calcification. Progress in Earth and PlanetaryScience, Springer/Japan Geoscience Union, 2017, 4 (1), �10.1186/s40645-017-0123-z�. �hal-01669206�
Progress in Earth and Planetary Science
Beaufort and Grelaud Progress in Earth and Planetary Science (2017) 4:5 DOI 10.1186/s40645-017-0123-z
RESEARCH ARTICLE Open Access
A 2700-year record of ENSO and PDOvariability from the Californian marginbased on coccolithophore assemblages andcalcification
Luc Beaufort1* and Michaël Grelaud2Abstract
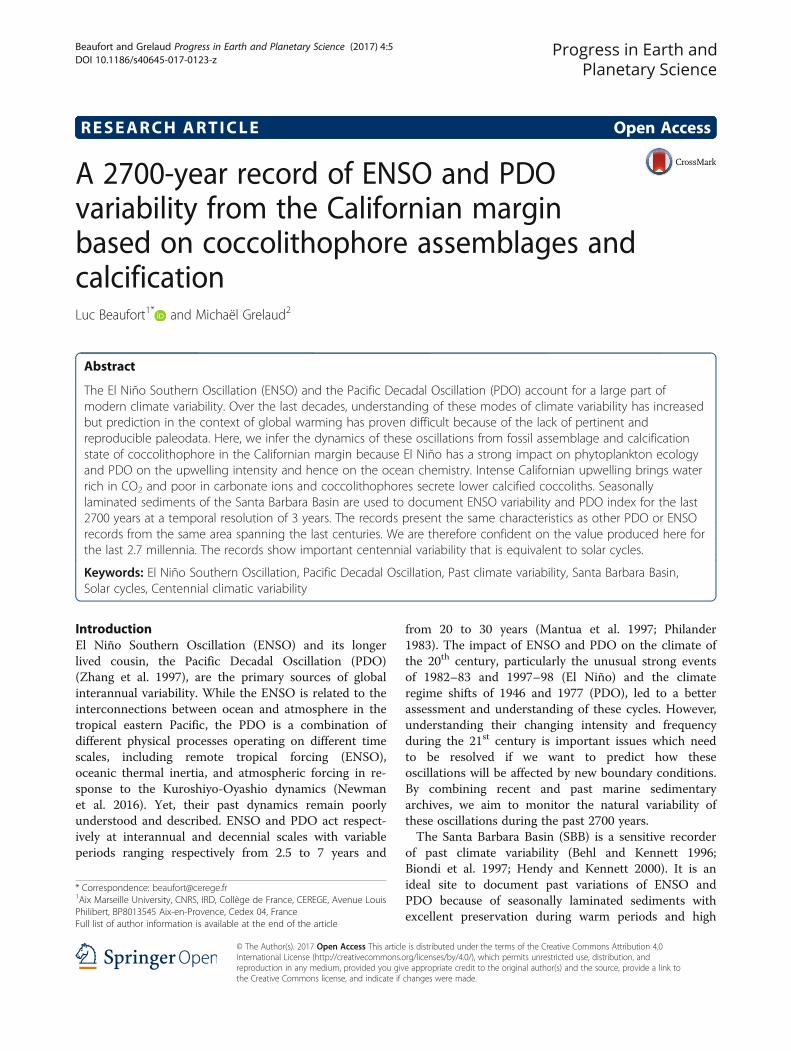
The El Niño Southern Oscillation (ENSO) and the Pacific Decadal Oscillation (PDO) account for a large part ofmodern climate variability. Over the last decades, understanding of these modes of climate variability has increasedbut prediction in the context of global warming has proven difficult because of the lack of pertinent andreproducible paleodata. Here, we infer the dynamics of these oscillations from fossil assemblage and calcificationstate of coccolithophore in the Californian margin because El Niño has a strong impact on phytoplankton ecologyand PDO on the upwelling intensity and hence on the ocean chemistry. Intense Californian upwelling brings waterrich in CO2 and poor in carbonate ions and coccolithophores secrete lower calcified coccoliths. Seasonallylaminated sediments of the Santa Barbara Basin are used to document ENSO variability and PDO index for the last2700 years at a temporal resolution of 3 years. The records present the same characteristics as other PDO or ENSOrecords from the same area spanning the last centuries. We are therefore confident on the value produced here forthe last 2.7 millennia. The records show important centennial variability that is equivalent to solar cycles.
Keywords: El Niño Southern Oscillation, Pacific Decadal Oscillation, Past climate variability, Santa Barbara Basin,Solar cycles, Centennial climatic variability
IntroductionEl Niño Southern Oscillation (ENSO) and its longerlived cousin, the Pacific Decadal Oscillation (PDO)(Zhang et al. 1997), are the primary sources of globalinterannual variability. While the ENSO is related to theinterconnections between ocean and atmosphere in thetropical eastern Pacific, the PDO is a combination ofdifferent physical processes operating on different timescales, including remote tropical forcing (ENSO),oceanic thermal inertia, and atmospheric forcing in re-sponse to the Kuroshiyo-Oyashio dynamics (Newmanet al. 2016). Yet, their past dynamics remain poorlyunderstood and described. ENSO and PDO act respect-ively at interannual and decennial scales with variableperiods ranging respectively from 2.5 to 7 years and
* Correspondence: [email protected] Marseille University, CNRS, IRD, Collège de France, CEREGE, Avenue LouisPhilibert, BP8013545 Aix-en-Provence, Cedex 04, FranceFull list of author information is available at the end of the article
© The Author(s). 2017 Open Access This articleInternational License (http://creativecommons.oreproduction in any medium, provided you givthe Creative Commons license, and indicate if
from 20 to 30 years (Mantua et al. 1997; Philander1983). The impact of ENSO and PDO on the climate ofthe 20th century, particularly the unusual strong eventsof 1982–83 and 1997–98 (El Niño) and the climateregime shifts of 1946 and 1977 (PDO), led to a betterassessment and understanding of these cycles. However,understanding their changing intensity and frequencyduring the 21st century is important issues which needto be resolved if we want to predict how theseoscillations will be affected by new boundary conditions.By combining recent and past marine sedimentaryarchives, we aim to monitor the natural variability ofthese oscillations during the past 2700 years.The Santa Barbara Basin (SBB) is a sensitive recorder
of past climate variability (Behl and Kennett 1996;Biondi et al. 1997; Hendy and Kennett 2000). It is anideal site to document past variations of ENSO andPDO because of seasonally laminated sediments withexcellent preservation during warm periods and high
is distributed under the terms of the Creative Commons Attribution 4.0rg/licenses/by/4.0/), which permits unrestricted use, distribution, ande appropriate credit to the original author(s) and the source, provide a link tochanges were made.
Beaufort and Grelaud Progress in Earth and Planetary Science (2017) 4:5 Page 2 of 13
sedimentation rates (Behl and Kennett 1996; Grelaudet al. 2009a). Located in the center of the CaliforniaCurrent System (CCS), the SBB is seasonally affected bytwo opposite currents: the southward California Current(CC) during late spring and summer; and the northwardDavidson Current (DC, also known as the CaliforniaCountercurrent or the California Undercurrent) duringlate fall and winter. The intensity of these two currentsis modulated by the North Pacific High (NPH) and theAleutian Low (AL). Upwelling activity in the area isrelated to the strength of the CC, as it brings deeperwaters rich in nutriment to the surface. The waters arecharacterized by low pH and carbonate ion concentra-tions (Alin et al. 2012). At interannual and decennialscale, ENSO and PDO impact directly the intensity ofthese atmospheric cells, leading to measurable variationsof CC and DC flows (Bograd and Lynn 2001; Chavezet al. 2003). During the cold phases of ENSO or PDO(La Niña or negative PDO), the AL is centered over thenorthwest Pacific and the NPH intensifies leading tostrengthening of the CC, associated upwelling, and aweakening of DC. The opposite occurs during warmphases of ENSO or PDO (El Niño or positive PDO), asthe AL strengthens and moves southward over the cen-tral Pacific, reducing the intensity of the NPH. ENSOand PDO are modulating the strength of the upwellingsystem in SBB.The impact of ENSO and PDO in the SBB is inferred
from the interplay of the currents within the CCS whosedynamics can be estimated by carefully analyzing fossilassemblages of microalgae growing in the upper photic
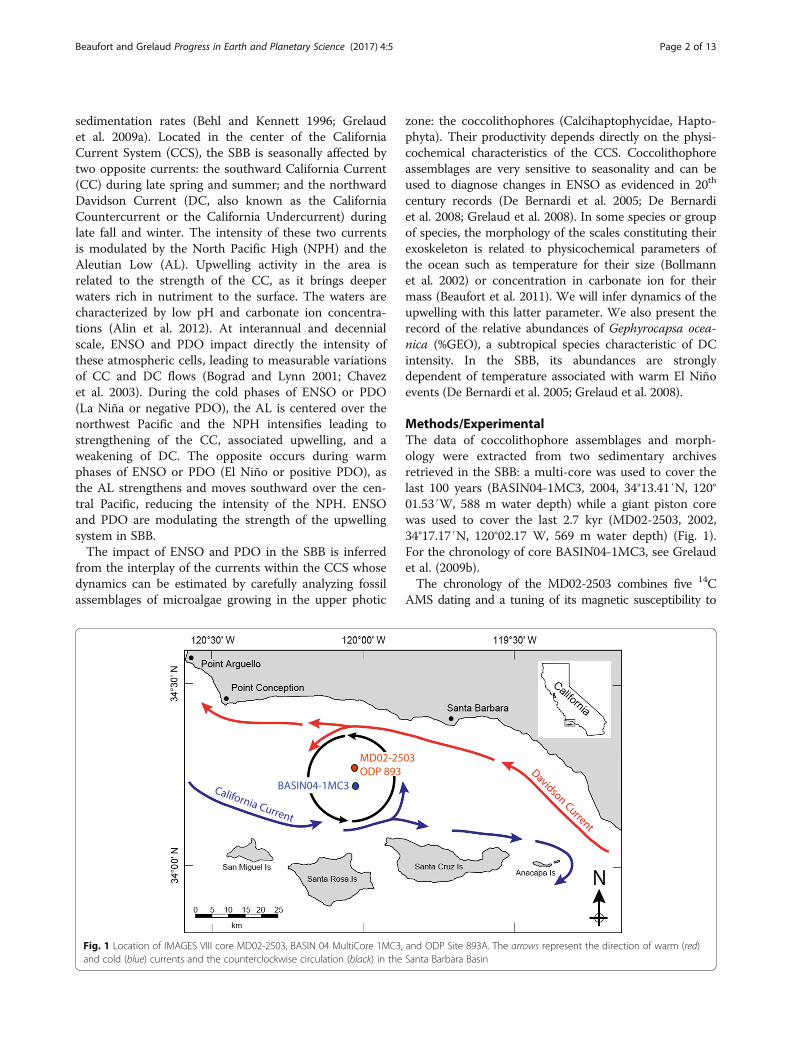
Fig. 1 Location of IMAGES VIII core MD02-2503, BASIN 04 MultiCore 1MC3,and cold (blue) currents and the counterclockwise circulation (black) in the
zone: the coccolithophores (Calcihaptophycidae, Hapto-phyta). Their productivity depends directly on the physi-cochemical characteristics of the CCS. Coccolithophoreassemblages are very sensitive to seasonality and can beused to diagnose changes in ENSO as evidenced in 20th
century records (De Bernardi et al. 2005; De Bernardiet al. 2008; Grelaud et al. 2008). In some species or groupof species, the morphology of the scales constituting theirexoskeleton is related to physicochemical parameters ofthe ocean such as temperature for their size (Bollmannet al. 2002) or concentration in carbonate ion for theirmass (Beaufort et al. 2011). We will infer dynamics of theupwelling with this latter parameter. We also present therecord of the relative abundances of Gephyrocapsa ocea-nica (%GEO), a subtropical species characteristic of DCintensity. In the SBB, its abundances are stronglydependent of temperature associated with warm El Niñoevents (De Bernardi et al. 2005; Grelaud et al. 2008).
Methods/ExperimentalThe data of coccolithophore assemblages and morph-ology were extracted from two sedimentary archivesretrieved in the SBB: a multi-core was used to cover thelast 100 years (BASIN04-1MC3, 2004, 34°13.41′N, 120°01.53′W, 588 m water depth) while a giant piston corewas used to cover the last 2.7 kyr (MD02-2503, 2002,34°17.17′N, 120°02.17 W, 569 m water depth) (Fig. 1).For the chronology of core BASIN04-1MC3, see Grelaudet al. (2009b).The chronology of the MD02-2503 combines five 14C
AMS dating and a tuning of its magnetic susceptibility to
and ODP Site 893A. The arrows represent the direction of warm (red)Santa Barbara Basin
Beaufort and Grelaud Progress in Earth and Planetary Science (2017) 4:5 Page 3 of 13
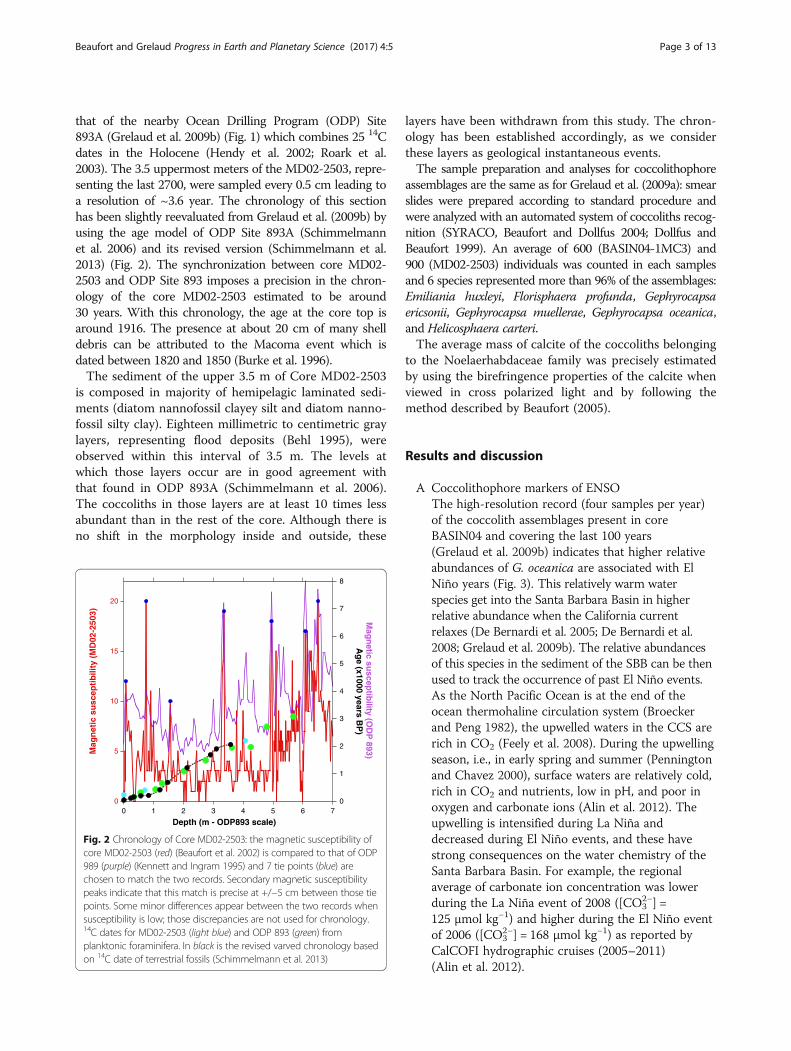
that of the nearby Ocean Drilling Program (ODP) Site893A (Grelaud et al. 2009b) (Fig. 1) which combines 25 14Cdates in the Holocene (Hendy et al. 2002; Roark et al.2003). The 3.5 uppermost meters of the MD02-2503, repre-senting the last 2700, were sampled every 0.5 cm leading toa resolution of ~3.6 year. The chronology of this sectionhas been slightly reevaluated from Grelaud et al. (2009b) byusing the age model of ODP Site 893A (Schimmelmannet al. 2006) and its revised version (Schimmelmann et al.2013) (Fig. 2). The synchronization between core MD02-2503 and ODP Site 893 imposes a precision in the chron-ology of the core MD02-2503 estimated to be around30 years. With this chronology, the age at the core top isaround 1916. The presence at about 20 cm of many shelldebris can be attributed to the Macoma event which isdated between 1820 and 1850 (Burke et al. 1996).The sediment of the upper 3.5 m of Core MD02-2503
is composed in majority of hemipelagic laminated sedi-ments (diatom nannofossil clayey silt and diatom nanno-fossil silty clay). Eighteen millimetric to centimetric graylayers, representing flood deposits (Behl 1995), wereobserved within this interval of 3.5 m. The levels atwhich those layers occur are in good agreement withthat found in ODP 893A (Schimmelmann et al. 2006).The coccoliths in those layers are at least 10 times lessabundant than in the rest of the core. Although there isno shift in the morphology inside and outside, these
0
5
10
15
20
0
1
2
3
4
5
6
7
8
0 1 2 3 4 5 6 7
Mag
net
ic s
usc
epti
bili
ty (
MD
02-2
503)
Mag
netic su
sceptib
ility (OD
P 893)
Ag
e (x1000 years BP
)
Depth (m - ODP893 scale)
Fig. 2 Chronology of Core MD02-2503: the magnetic susceptibility ofcore MD02-2503 (red) (Beaufort et al. 2002) is compared to that of ODP989 (purple) (Kennett and Ingram 1995) and 7 tie points (blue) arechosen to match the two records. Secondary magnetic susceptibilitypeaks indicate that this match is precise at +/−5 cm between those tiepoints. Some minor differences appear between the two records whensusceptibility is low; those discrepancies are not used for chronology.14C dates for MD02-2503 (light blue) and ODP 893 (green) fromplanktonic foraminifera. In black is the revised varved chronology basedon 14C date of terrestrial fossils (Schimmelmann et al. 2013)
layers have been withdrawn from this study. The chron-ology has been established accordingly, as we considerthese layers as geological instantaneous events.The sample preparation and analyses for coccolithophore
assemblages are the same as for Grelaud et al. (2009a): smearslides were prepared according to standard procedure andwere analyzed with an automated system of coccoliths recog-nition (SYRACO, Beaufort and Dollfus 2004; Dollfus andBeaufort 1999). An average of 600 (BASIN04-1MC3) and900 (MD02-2503) individuals was counted in each samplesand 6 species represented more than 96% of the assemblages:Emiliania huxleyi, Florisphaera profunda, Gephyrocapsaericsonii, Gephyrocapsa muellerae, Gephyrocapsa oceanica,and Helicosphaera carteri.The average mass of calcite of the coccoliths belonging
to the Noelaerhabdaceae family was precisely estimatedby using the birefringence properties of the calcite whenviewed in cross polarized light and by following themethod described by Beaufort (2005).
Results and discussion
A Coccolithophore markers of ENSO
The high-resolution record (four samples per year)of the coccolith assemblages present in coreBASIN04 and covering the last 100 years(Grelaud et al. 2009b) indicates that higher relativeabundances of G. oceanica are associated with ElNiño years (Fig. 3). This relatively warm waterspecies get into the Santa Barbara Basin in higherrelative abundance when the California currentrelaxes (De Bernardi et al. 2005; De Bernardi et al.2008; Grelaud et al. 2009b). The relative abundancesof this species in the sediment of the SBB can be thenused to track the occurrence of past El Niño events.As the North Pacific Ocean is at the end of theocean thermohaline circulation system (Broeckerand Peng 1982), the upwelled waters in the CCS arerich in CO2 (Feely et al. 2008). During the upwellingseason, i.e., in early spring and summer (Penningtonand Chavez 2000), surface waters are relatively cold,rich in CO2 and nutrients, low in pH, and poor inoxygen and carbonate ions (Alin et al. 2012). Theupwelling is intensified during La Niña anddecreased during El Niño events, and these havestrong consequences on the water chemistry of theSanta Barbara Basin. For example, the regionalaverage of carbonate ion concentration was lowerduring the La Niña event of 2008 ([CO32−] =125 μmol kg−1) and higher during the El Niño eventof 2006 ([CO3
2−] = 168 μmol kg−1) as reported byCalCOFI hydrographic cruises (2005–2011)(Alin et al. 2012).
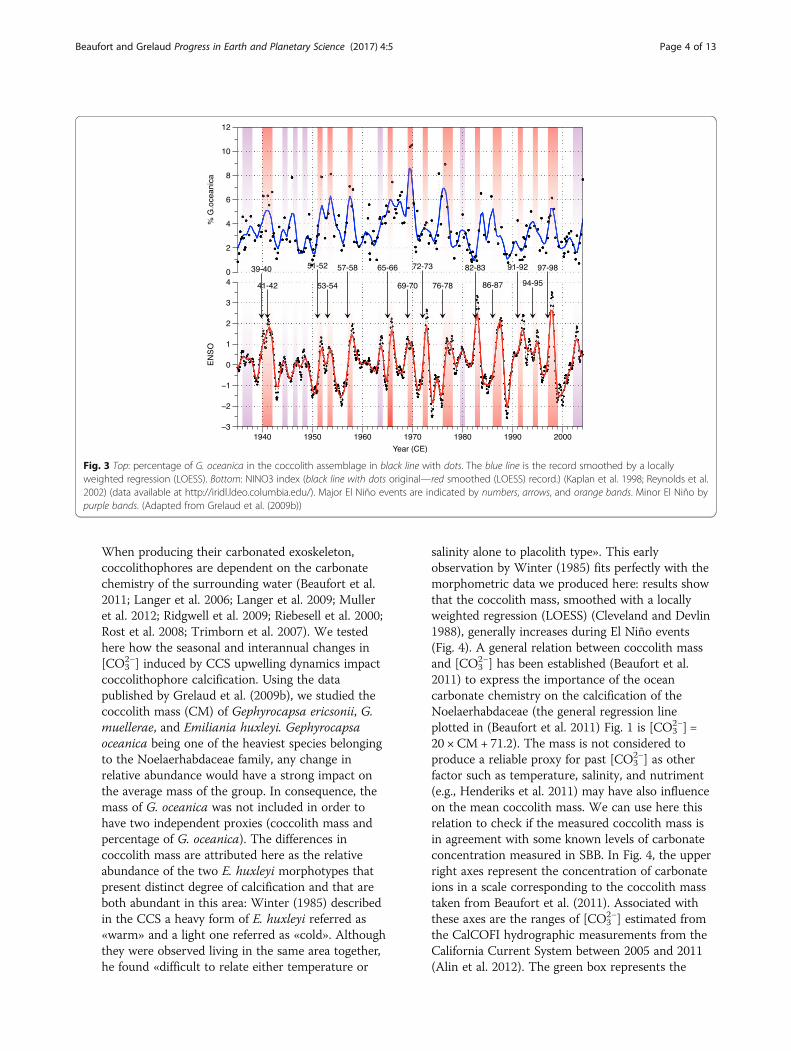
Fig. 3 Top: percentage of G. oceanica in the coccolith assemblage in black line with dots. The blue line is the record smoothed by a locallyweighted regression (LOESS). Bottom: NINO3 index (black line with dots original—red smoothed (LOESS) record.) (Kaplan et al. 1998; Reynolds et al.2002) (data available at http://iridl.ldeo.columbia.edu/). Major El Niño events are indicated by numbers, arrows, and orange bands. Minor El Niño bypurple bands. (Adapted from Grelaud et al. (2009b))
Beaufort and Grelaud Progress in Earth and Planetary Science (2017) 4:5 Page 4 of 13
When producing their carbonated exoskeleton,coccolithophores are dependent on the carbonatechemistry of the surrounding water (Beaufort et al.2011; Langer et al. 2006; Langer et al. 2009; Mulleret al. 2012; Ridgwell et al. 2009; Riebesell et al. 2000;Rost et al. 2008; Trimborn et al. 2007). We testedhere how the seasonal and interannual changes in[CO3
2−] induced by CCS upwelling dynamics impactcoccolithophore calcification. Using the datapublished by Grelaud et al. (2009b), we studied thecoccolith mass (CM) of Gephyrocapsa ericsonii, G.muellerae, and Emiliania huxleyi. Gephyrocapsaoceanica being one of the heaviest species belongingto the Noelaerhabdaceae family, any change inrelative abundance would have a strong impact onthe average mass of the group. In consequence, themass of G. oceanica was not included in order tohave two independent proxies (coccolith mass andpercentage of G. oceanica). The differences incoccolith mass are attributed here as the relativeabundance of the two E. huxleyi morphotypes thatpresent distinct degree of calcification and that areboth abundant in this area: Winter (1985) describedin the CCS a heavy form of E. huxleyi referred as«warm» and a light one referred as «cold». Althoughthey were observed living in the same area together,he found «difficult to relate either temperature or
salinity alone to placolith type». This earlyobservation by Winter (1985) fits perfectly with themorphometric data we produced here: results showthat the coccolith mass, smoothed with a locallyweighted regression (LOESS) (Cleveland and Devlin1988), generally increases during El Niño events(Fig. 4). A general relation between coccolith massand [CO3
2−] has been established (Beaufort et al.2011) to express the importance of the oceancarbonate chemistry on the calcification of theNoelaerhabdaceae (the general regression lineplotted in (Beaufort et al. 2011) Fig. 1 is [CO3
2−] =20 × CM+ 71.2). The mass is not considered toproduce a reliable proxy for past [CO3
2−] as otherfactor such as temperature, salinity, and nutriment(e.g., Henderiks et al. 2011) may have also influenceon the mean coccolith mass. We can use here thisrelation to check if the measured coccolith mass isin agreement with some known levels of carbonateconcentration measured in SBB. In Fig. 4, the upperright axes represent the concentration of carbonateions in a scale corresponding to the coccolith masstaken from Beaufort et al. (2011). Associated withthese axes are the ranges of [CO3
2−] estimated fromthe CalCOFI hydrographic measurements from theCalifornia Current System between 2005 and 2011(Alin et al. 2012). The green box represents the
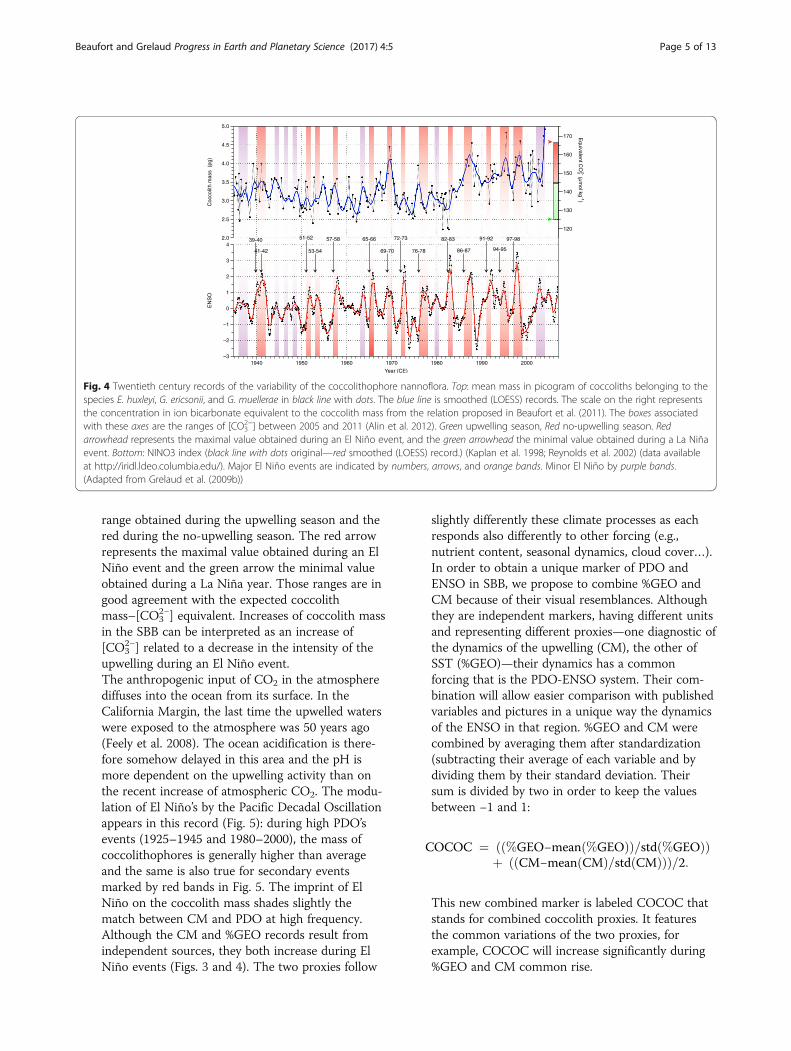
Fig. 4 Twentieth century records of the variability of the coccolithophore nannoflora. Top: mean mass in picogram of coccoliths belonging to thespecies E. huxleyi, G. ericsonii, and G. muellerae in black line with dots. The blue line is smoothed (LOESS) records. The scale on the right representsthe concentration in ion bicarbonate equivalent to the coccolith mass from the relation proposed in Beaufort et al. (2011). The boxes associatedwith these axes are the ranges of [CO3
2−] between 2005 and 2011 (Alin et al. 2012). Green upwelling season, Red no-upwelling season. Redarrowhead represents the maximal value obtained during an El Niño event, and the green arrowhead the minimal value obtained during a La Niñaevent. Bottom: NINO3 index (black line with dots original—red smoothed (LOESS) record.) (Kaplan et al. 1998; Reynolds et al. 2002) (data availableat http://iridl.ldeo.columbia.edu/). Major El Niño events are indicated by numbers, arrows, and orange bands. Minor El Niño by purple bands.(Adapted from Grelaud et al. (2009b))
Beaufort and Grelaud Progress in Earth and Planetary Science (2017) 4:5 Page 5 of 13
range obtained during the upwelling season and thered during the no-upwelling season. The red arrowrepresents the maximal value obtained during an ElNiño event and the green arrow the minimal valueobtained during a La Niña year. Those ranges are ingood agreement with the expected coccolithmass–[CO3
2−] equivalent. Increases of coccolith massin the SBB can be interpreted as an increase of[CO3
2−] related to a decrease in the intensity of theupwelling during an El Niño event.The anthropogenic input of CO2 in the atmospherediffuses into the ocean from its surface. In theCalifornia Margin, the last time the upwelled waterswere exposed to the atmosphere was 50 years ago(Feely et al. 2008). The ocean acidification is there-fore somehow delayed in this area and the pH ismore dependent on the upwelling activity than onthe recent increase of atmospheric CO2. The modu-lation of El Niño’s by the Pacific Decadal Oscillationappears in this record (Fig. 5): during high PDO’sevents (1925–1945 and 1980–2000), the mass ofcoccolithophores is generally higher than averageand the same is also true for secondary eventsmarked by red bands in Fig. 5. The imprint of ElNiño on the coccolith mass shades slightly thematch between CM and PDO at high frequency.Although the CM and %GEO records result fromindependent sources, they both increase during ElNiño events (Figs. 3 and 4). The two proxies follow
slightly differently these climate processes as eachresponds also differently to other forcing (e.g.,nutrient content, seasonal dynamics, cloud cover…).In order to obtain a unique marker of PDO andENSO in SBB, we propose to combine %GEO andCM because of their visual resemblances. Althoughthey are independent markers, having different unitsand representing different proxies—one diagnostic ofthe dynamics of the upwelling (CM), the other ofSST (%GEO)—their dynamics has a commonforcing that is the PDO-ENSO system. Their com-bination will allow easier comparison with publishedvariables and pictures in a unique way the dynamicsof the ENSO in that region. %GEO and CM werecombined by averaging them after standardization(subtracting their average of each variable and bydividing them by their standard deviation. Theirsum is divided by two in order to keep the valuesbetween −1 and 1:
COCOC ¼ %GEO−mean %GEOð Þð Þ=std %GEOð Þð Þþ CM−mean CMð Þ=std CMð Þð Þð Þ=2:
This new combined marker is labeled COCOC that
stands for combined coccolith proxies. It featuresthe common variations of the two proxies, forexample, COCOC will increase significantly during%GEO and CM common rise.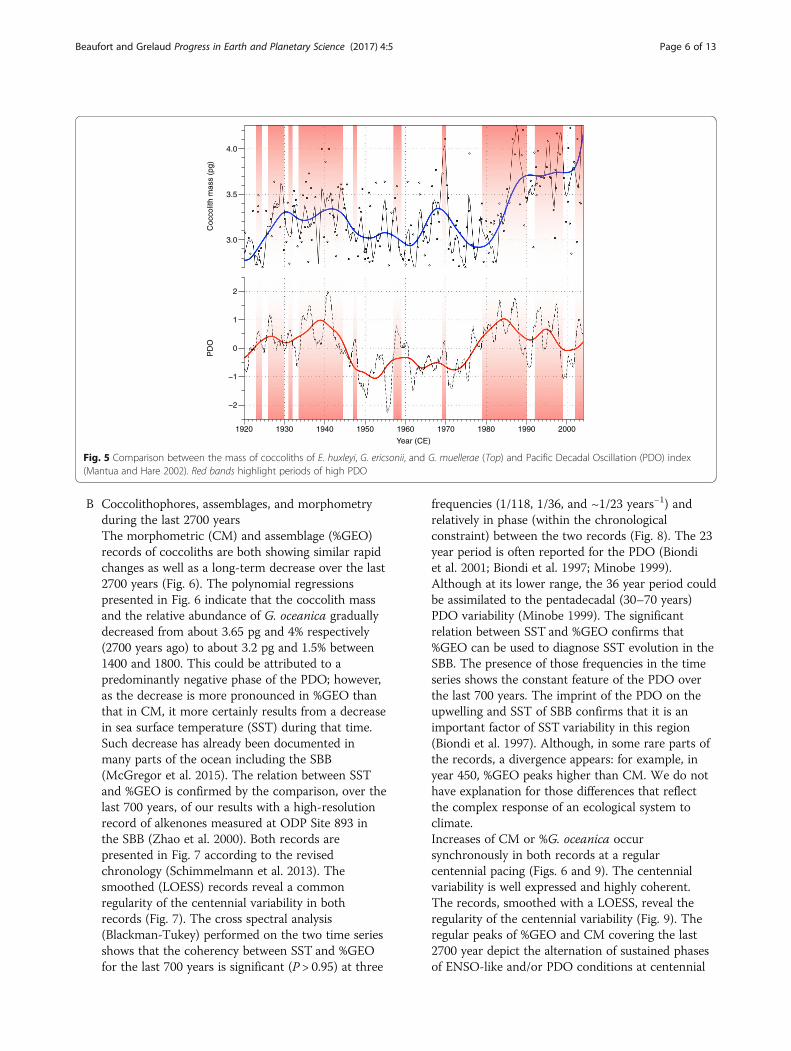
Fig. 5 Comparison between the mass of coccoliths of E. huxleyi, G. ericsonii, and G. muellerae (Top) and Pacific Decadal Oscillation (PDO) index(Mantua and Hare 2002). Red bands highlight periods of high PDO
Beaufort and Grelaud Progress in Earth and Planetary Science (2017) 4:5 Page 6 of 13
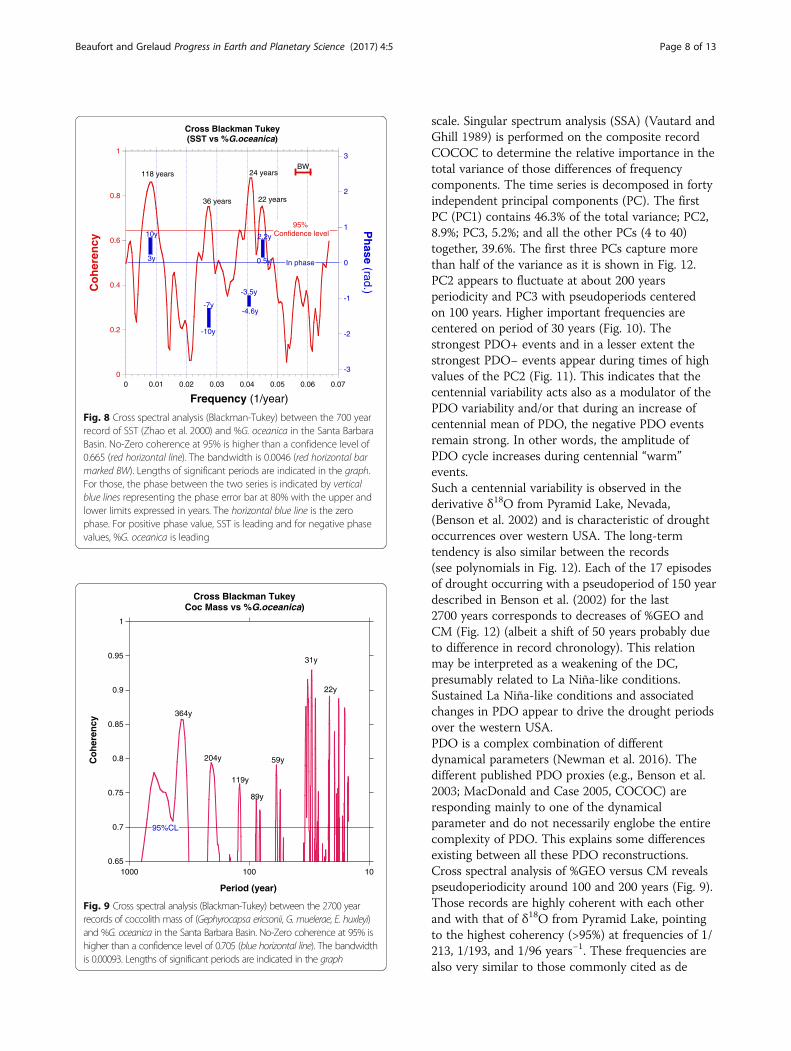
B Coccolithophores, assemblages, and morphometryduring the last 2700 yearsThe morphometric (CM) and assemblage (%GEO)records of coccoliths are both showing similar rapidchanges as well as a long-term decrease over the last2700 years (Fig. 6). The polynomial regressionspresented in Fig. 6 indicate that the coccolith massand the relative abundance of G. oceanica graduallydecreased from about 3.65 pg and 4% respectively(2700 years ago) to about 3.2 pg and 1.5% between1400 and 1800. This could be attributed to apredominantly negative phase of the PDO; however,as the decrease is more pronounced in %GEO thanthat in CM, it more certainly results from a decreasein sea surface temperature (SST) during that time.Such decrease has already been documented inmany parts of the ocean including the SBB(McGregor et al. 2015). The relation between SSTand %GEO is confirmed by the comparison, over thelast 700 years, of our results with a high-resolutionrecord of alkenones measured at ODP Site 893 inthe SBB (Zhao et al. 2000). Both records arepresented in Fig. 7 according to the revisedchronology (Schimmelmann et al. 2013). Thesmoothed (LOESS) records reveal a commonregularity of the centennial variability in bothrecords (Fig. 7). The cross spectral analysis(Blackman-Tukey) performed on the two time seriesshows that the coherency between SST and %GEOfor the last 700 years is significant (P > 0.95) at three
frequencies (1/118, 1/36, and ~1/23 years−1) andrelatively in phase (within the chronologicalconstraint) between the two records (Fig. 8). The 23year period is often reported for the PDO (Biondiet al. 2001; Biondi et al. 1997; Minobe 1999).Although at its lower range, the 36 year period couldbe assimilated to the pentadecadal (30–70 years)PDO variability (Minobe 1999). The significantrelation between SST and %GEO confirms that%GEO can be used to diagnose SST evolution in theSBB. The presence of those frequencies in the timeseries shows the constant feature of the PDO overthe last 700 years. The imprint of the PDO on theupwelling and SST of SBB confirms that it is animportant factor of SST variability in this region(Biondi et al. 1997). Although, in some rare parts ofthe records, a divergence appears: for example, inyear 450, %GEO peaks higher than CM. We do nothave explanation for those differences that reflectthe complex response of an ecological system toclimate.Increases of CM or %G. oceanica occursynchronously in both records at a regularcentennial pacing (Figs. 6 and 9). The centennialvariability is well expressed and highly coherent.The records, smoothed with a LOESS, reveal theregularity of the centennial variability (Fig. 9). Theregular peaks of %GEO and CM covering the last2700 year depict the alternation of sustained phasesof ENSO-like and/or PDO conditions at centennial

% G
.oce
anica
0
1
2
3
4
5
6
7
8
9
Coc
colit
h m
ass
(pg)
2.6
2.8
3.0
3.2
3.4
3.6
3.8
4.0
4.2
Year (CE)
500 0 500 1000 1500 2000
Fig. 6 Two thousand and seven hundred-year records of variability of the coccolithophore nannoflora. Top—red: coccolith mass of E. huxleyi, G.ericsonii, and G. muellerae. Bottom—blue: relative abundance of G. oceanica. Colored lines represent the LOESS function and the dotted lines representpolynomial of fourth order to depict the long-term tendencies. Vertical colored bars are synchronous events common to the two series
Fig. 7 Comparison of the abundance of G. oceanica and SST for the last 700 years. Top: Records of %G. oceanica. Bottom: SST (UK37 from Zhaoet al. (2000)). Both records are from the same position in the Santa Barbara Basin. Colored lines represent the LOESS smoothing function for thetwo series. Vertical bands are long-term increases of temperature detected by the two proxies
Beaufort and Grelaud Progress in Earth and Planetary Science (2017) 4:5 Page 7 of 13
0
0.2
0.4
0.6
0.8
1
-3
-2
-1
0
1
2
3
0 0.01 0.02 0.03 0.04 0.05 0.06 0.07
Cross Blackman Tukey(SST vs %G.oceanica)
Co
her
ency
Ph
ase (rad.)
Frequency (1/year)
118 years
36 years
24 years
95% Confidence level
BW
3y
10y
-10y
-7y-4.6y
-3.5y
22 years
0.5y
2.2y
In phase
Fig. 8 Cross spectral analysis (Blackman-Tukey) between the 700 yearrecord of SST (Zhao et al. 2000) and %G. oceanica in the Santa BarbaraBasin. No-Zero coherence at 95% is higher than a confidence level of0.665 (red horizontal line). The bandwidth is 0.0046 (red horizontal barmarked BW). Lengths of significant periods are indicated in the graph.For those, the phase between the two series is indicated by verticalblue lines representing the phase error bar at 80% with the upper andlower limits expressed in years. The horizontal blue line is the zerophase. For positive phase value, SST is leading and for negative phasevalues, %G. oceanica is leading
0.65
0.7
0.75
0.8
0.85
0.9
0.95
1
101001000
Cross Blackman TukeyCoc Mass vs %G.oceanica)
Co
her
ency
Period (year)
95%CL
364y
204y
31y
22y
59y
119y
89y
Fig. 9 Cross spectral analysis (Blackman-Tukey) between the 2700 yearrecords of coccolith mass of (Gephyrocapsa ericsonii, G. muelerae, E. huxleyi)and %G. oceanica in the Santa Barbara Basin. No-Zero coherence at 95% ishigher than a confidence level of 0.705 (blue horizontal line). The bandwidthis 0.00093. Lengths of significant periods are indicated in the graph
Beaufort and Grelaud Progress in Earth and Planetary Science (2017) 4:5 Page 8 of 13
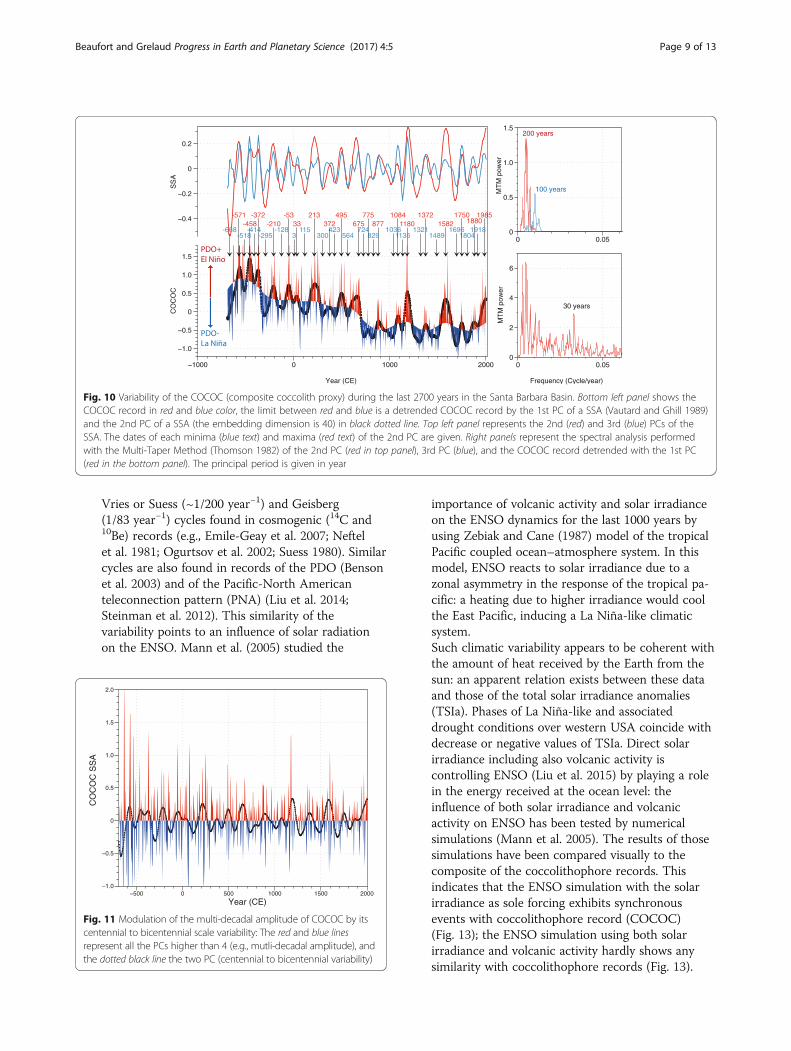
scale. Singular spectrum analysis (SSA) (Vautard andGhill 1989) is performed on the composite recordCOCOC to determine the relative importance in thetotal variance of those differences of frequencycomponents. The time series is decomposed in fortyindependent principal components (PC). The firstPC (PC1) contains 46.3% of the total variance; PC2,8.9%; PC3, 5.2%; and all the other PCs (4 to 40)together, 39.6%. The first three PCs capture morethan half of the variance as it is shown in Fig. 12.PC2 appears to fluctuate at about 200 yearsperiodicity and PC3 with pseudoperiods centeredon 100 years. Higher important frequencies arecentered on period of 30 years (Fig. 10). Thestrongest PDO+ events and in a lesser extent thestrongest PDO− events appear during times of highvalues of the PC2 (Fig. 11). This indicates that thecentennial variability acts also as a modulator of thePDO variability and/or that during an increase ofcentennial mean of PDO, the negative PDO eventsremain strong. In other words, the amplitude ofPDO cycle increases during centennial “warm”events.Such a centennial variability is observed in thederivative δ18O from Pyramid Lake, Nevada,(Benson et al. 2002) and is characteristic of droughtoccurrences over western USA. The long-termtendency is also similar between the records(see polynomials in Fig. 12). Each of the 17 episodesof drought occurring with a pseudoperiod of 150 yeardescribed in Benson et al. (2002) for the last2700 years corresponds to decreases of %GEO andCM (Fig. 12) (albeit a shift of 50 years probably dueto difference in record chronology). This relationmay be interpreted as a weakening of the DC,presumably related to La Niña-like conditions.Sustained La Niña-like conditions and associatedchanges in PDO appear to drive the drought periodsover the western USA.PDO is a complex combination of differentdynamical parameters (Newman et al. 2016). Thedifferent published PDO proxies (e.g., Benson et al.2003; MacDonald and Case 2005, COCOC) areresponding mainly to one of the dynamicalparameter and do not necessarily englobe the entirecomplexity of PDO. This explains some differencesexisting between all these PDO reconstructions.Cross spectral analysis of %GEO versus CM revealspseudoperiodicity around 100 and 200 years (Fig. 9).Those records are highly coherent with each otherand with that of δ18O from Pyramid Lake, pointingto the highest coherency (>95%) at frequencies of 1/213, 1/193, and 1/96 years−1. These frequencies arealso very similar to those commonly cited as de
1985
19181880
1804
1750
16961582
1489
1372
13211180
1135
1084
1036877
829
775
724675
564
495
423372
300
213
11533
3
-53
-128-210
-295
-372
-414-458
-518
-571
-668
CO
CO
C
1.0
0.5
0
0.5
1.0
1.5
SS
A
0.4
0.2
0
0.2
Year (CE)
1000 0 1000 20000
2
4
6
0 0.05
PDO+El Niño
PDO-La Niña
Frequency (Cycle/year)
0
0.5
1.0
1.5
0 0.05
200 years
100 years
30 years
MT
M p
ower
MT
M p
ower
Fig. 10 Variability of the COCOC (composite coccolith proxy) during the last 2700 years in the Santa Barbara Basin. Bottom left panel shows theCOCOC record in red and blue color, the limit between red and blue is a detrended COCOC record by the 1st PC of a SSA (Vautard and Ghill 1989)and the 2nd PC of a SSA (the embedding dimension is 40) in black dotted line. Top left panel represents the 2nd (red) and 3rd (blue) PCs of theSSA. The dates of each minima (blue text) and maxima (red text) of the 2nd PC are given. Right panels represent the spectral analysis performedwith the Multi-Taper Method (Thomson 1982) of the 2nd PC (red in top panel), 3rd PC (blue), and the COCOC record detrended with the 1st PC(red in the bottom panel). The principal period is given in year
CO
CO
C S
SA
Figcenreprthe
Beaufort and Grelaud Progress in Earth and Planetary Science (2017) 4:5 Page 9 of 13
Vries or Suess (~1/200 year−1) and Geisberg(1/83 year−1) cycles found in cosmogenic (14C and10Be) records (e.g., Emile-Geay et al. 2007; Neftelet al. 1981; Ogurtsov et al. 2002; Suess 1980). Similarcycles are also found in records of the PDO (Bensonet al. 2003) and of the Pacific-North Americanteleconnection pattern (PNA) (Liu et al. 2014;Steinman et al. 2012). This similarity of thevariability points to an influence of solar radiationon the ENSO. Mann et al. (2005) studied the
1.0
0.5
0
0.5
1.0
1.5
2.0
Year (CE)500 0 500 1000 1500 2000
. 11 Modulation of the multi-decadal amplitude of COCOC by itstennial to bicentennial scale variability: The red and blue linesesent all the PCs higher than 4 (e.g., mutli-decadal amplitude), anddotted black line the two PC (centennial to bicentennial variability)
importance of volcanic activity and solar irradianceon the ENSO dynamics for the last 1000 years byusing Zebiak and Cane (1987) model of the tropicalPacific coupled ocean–atmosphere system. In thismodel, ENSO reacts to solar irradiance due to azonal asymmetry in the response of the tropical pa-cific: a heating due to higher irradiance would coolthe East Pacific, inducing a La Niña-like climaticsystem.Such climatic variability appears to be coherent withthe amount of heat received by the Earth from thesun: an apparent relation exists between these dataand those of the total solar irradiance anomalies(TSIa). Phases of La Niña-like and associateddrought conditions over western USA coincide withdecrease or negative values of TSIa. Direct solarirradiance including also volcanic activity iscontrolling ENSO (Liu et al. 2015) by playing a rolein the energy received at the ocean level: theinfluence of both solar irradiance and volcanicactivity on ENSO has been tested by numericalsimulations (Mann et al. 2005). The results of thosesimulations have been compared visually to thecomposite of the coccolithophore records. Thisindicates that the ENSO simulation with the solarirradiance as sole forcing exhibits synchronousevents with coccolithophore record (COCOC)(Fig. 13); the ENSO simulation using both solarirradiance and volcanic activity hardly shows anysimilarity with coccolithophore records (Fig. 13).
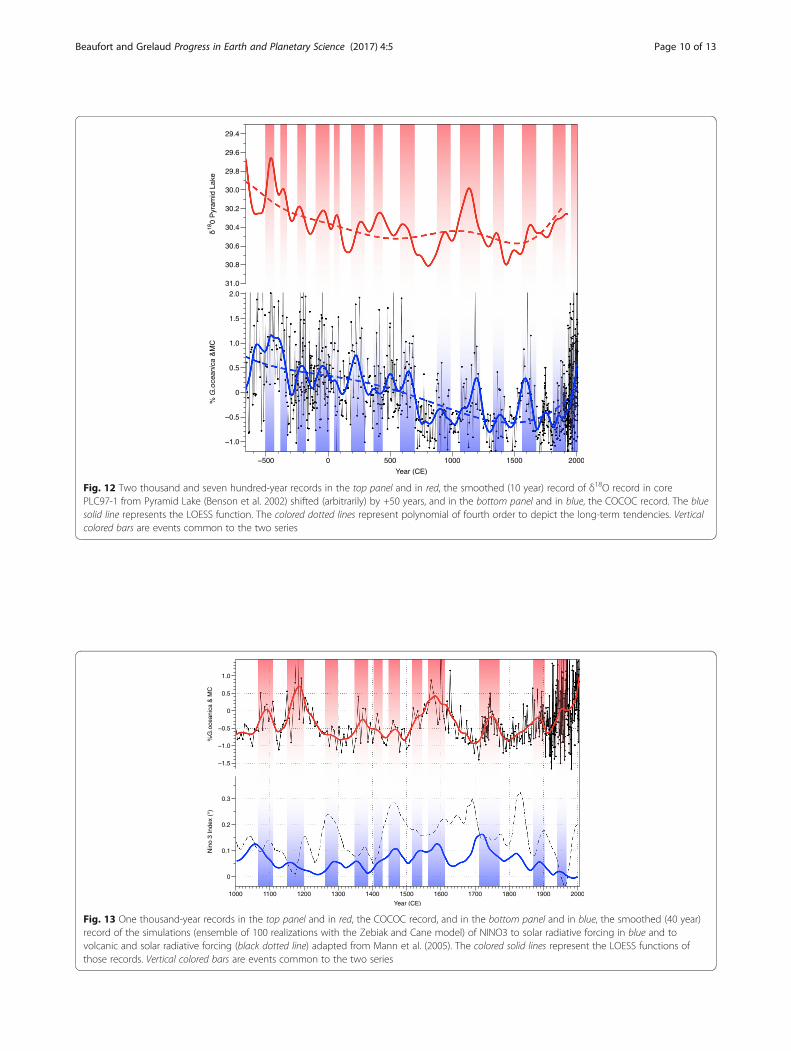
Fig. 12 Two thousand and seven hundred-year records in the top panel and in red, the smoothed (10 year) record of δ18O record in corePLC97-1 from Pyramid Lake (Benson et al. 2002) shifted (arbitrarily) by +50 years, and in the bottom panel and in blue, the COCOC record. The bluesolid line represents the LOESS function. The colored dotted lines represent polynomial of fourth order to depict the long-term tendencies. Verticalcolored bars are events common to the two series
Fig. 13 One thousand-year records in the top panel and in red, the COCOC record, and in the bottom panel and in blue, the smoothed (40 year)record of the simulations (ensemble of 100 realizations with the Zebiak and Cane model) of NINO3 to solar radiative forcing in blue and tovolcanic and solar radiative forcing (black dotted line) adapted from Mann et al. (2005). The colored solid lines represent the LOESS functions ofthose records. Vertical colored bars are events common to the two series
Beaufort and Grelaud Progress in Earth and Planetary Science (2017) 4:5 Page 10 of 13
Beaufort and Grelaud Progress in Earth and Planetary Science (2017) 4:5 Page 11 of 13
This could be indicative that solar activity isresponsible in a large part of the ENSO and PDOdynamics and that volcanic activity as limitedimpact on PDO/ENSO dynamics. This is evenfurther demonstrated by the lack of synchronismbetween the timing of the large PDO events foundin the COCOC record and the timing of the majorvolcanic eruptions occurred during the last2500 years described by Sigl et al. (2015). Thiswould explain why there is stable centennialvariability similar to that of the solar cycle(knowing that volcanic activity should not be cyclic).The persistence of quasi-bicentennial cycle duringthe entire Holocene in the North America has beenrecently described elsewhere (Liu et al. 2014) andconfirms the permanence of the centennial tobicentennial dynamics in the eastern Pacific andNorth America.
ConclusionsWe presented here two 2700 years' long records from theSanta Barbara Basin of ENSO/PDO proxies based on coc-colithophores: one resulting from the relative abundancein the assemblage of one warm species Gephyrocapsaoceanica and the other from the degree of calcification ofa group of three abundant species (Emiliania huxleyi, G.ericsonii, G. muellerae). The first proxy appears to berelated primarily to SST changes and to ENSO, and thesecond proxy is more related to the dynamics of theupwelling and on PDO. Although the two proxies areindependent, they show similar dynamics:
1. A general decrease (in abundance and mass) overthe last millennia until 300 years ago. Since then, thevalues increase. This recent increase is particularlypronounced for the mass values that show thehighest in the 2700 record in the last 30 years. Thisgeneral trend is in accordance with the generaldecrease of SST in the ocean and in particular in thecoast of California (McGregor et al. 2015). Theimpact of ocean acidification in the most recent partof the record may be limited because the relativelyold waters upwelled in this area delay the drop ofpH by 50 years (Feely et al. 2008).
2. In addition to this long-term variation, there is astrong variability at multi-decadal (periods of 23 and39 years), centennial, and bicentennial that aretypical of ENSO and PDO in that region. The multi-decadal amplitude is modulated by the centennial/bicentennial variability, implying that both phases(negative and positive) of the PDO are increasedduring high mean COCOC value events atcentennial to bicentennial scale.
The presence in those records of de Vries or Suess(~1/200 year−1) and Geisberg (1/83 year−1) cycles thatare associated to solar radiation is indicative of theradiative forcing as an important factor of climatic vari-ability in the eastern Pacific regions.
AbbreviationsAL: Aleutian Low; CC: California Current; CCS: California Current System;CM: Coccolith mass; COCOC: Composite coccoliths records; DC: DavidsonCurrent; ENSO: El Niño Southern Oscillation; NPH: North Pacific High;PDO: Pacific Decadal Oscillation; SBB: Santa Barbara Basin
AcknowledgementsWe thank the IMAGES program, IPEV, and the crew of the RV Marion-Dufresnefor retrieving the core MD02-2503. LB gratefully acknowledges the invitationand support by Pr Masanobu Yamamoto to participate to the INQUA 2015symposium held in Nagoya, Japan.
FundingWe thank the Agence Nationale de la Recherche for its financial support toLB under projects ANR‐12-BS06‐0007–CALHIS and JPI Blemont projectANR-15-JCLI-0003-05–PACMEDY. This work is a contribution to the EU FP7project MedSeA (grant agreement no. 265103).
Authors’ contributionsLB proposed the topic. MG carried out the experimental study. LB and MGinterpreted the data. LB wrote the first drafts of the manuscript and bothapproved the final manuscript.
Competing interestsThe authors declare that they have no competing interests.
Publisher’s NoteSpringer Nature remains neutral with regard to jurisdictional claims inpublished maps and institutional affiliations.
Author details1Aix Marseille University, CNRS, IRD, Collège de France, CEREGE, Avenue LouisPhilibert, BP8013545 Aix-en-Provence, Cedex 04, France. 2Institute ofEnvironmental Science and Technology, Autonomous University of Barcelona(UAB), Bellaterra 08193, Spain.
Received: 13 November 2016 Accepted: 9 March 2017
ReferencesAlin SR, Feely RA, Dickson AG, Martin Hernandez-Ayon J, Juranek LW, Ohman MD,
Goericke R (2012) Robust empirical relationships for estimating the carbonatesystem in the southern California Current System and application to CalCOFIhydrographic cruise data (2005–2011). J. Geophys. Res.-Oceans 117. doi:10.1029/2011JC007511
Beaufort L (2005) Weight estimates of coccoliths using the optical properties(birefringence) of calcite. Micropaleontol 51:289–298
Beaufort L, the members of the scientific party (2002) MD126 MONA (MargesOuest Nord Americaines) IMAGES VIII. Insitut Polaire Francais Paul EmileVictor (IPEV), Brest, p 453
Beaufort L, Dollfus D (2004) Automatic recognition of coccolith by dynamicalneural network. Mar Micropaleont 51/1-2:57–73
Beaufort L, Probert I, de Garidel-Thoron T, Bendif EM, Ruiz-Pino D, Metzl N, GoyetC, Buchet N, Coupel P, Grelaud M, Rost B, Rickaby REM, de Vargas C (2011)Sensitivity of coccolithophores to carbonate chemistry and oceanacidification. Nature 476:80–84
Behl RJ. (1995) Sedimentary Facies and Sedimentology of the Late QuaternarySanta Barbara Basin, Site 893. In: Kennett JP, J.G. B, Lyle M (eds). Proceedingsof the Ocean Drilling Program, Scientific Results, vol. 146. Ocean DrillingProgram, College Station, pp 295–308
Behl RJ, Kennett JP (1996) Brief interstadial events in the Santa Barbara Basin, NEPacific, during the past 60 kyr. Nature 379:243–246
Beaufort and Grelaud Progress in Earth and Planetary Science (2017) 4:5 Page 12 of 13
Benson L, Kashgarian M, Rye R, Lund S, Paillet F, Smoot J, Kester C, Mensing S,Meko D, Lindstrom S (2002) Holocene multidecadal and multicentennialdroughts affecting Northern California and Nevada. Quat Sci Rev 21:659–682
Benson L, Linsley B, Smoot J, Mensing S, Lund S, Stine S, Sarna-Wojcicki A (2003)Influence of the Pacific Decadal Oscillation on the climate of the SierraNevada, California and Nevada. Quat Res 59:151–159
Biondi F, Lange CB, Hughes MK, Berger WH (1997) Inter-decadal signals duringthe last millennium (AD 1117–1992) in the varve record of Santa Barbarabasin, California. Geophys Res Lett 24:193–196
Biondi F, Gershunov A, Cayan DR (2001) North Pacific decadal climate variabilitysince 1661. J Clim 14:5–10
Bograd SJ, Lynn RJ (2001) Physical-biological coupling in the California Currentduring the 1997–99 El Nino-La Nina cycle. Geophys Res Lett 28:275–278
Bollmann J, Henderiks J, Brabec B (2002) Global calibration of Gephyrocapsacoccolith abundance in Holocene sediments for paleotemperatureassessment. Paleoceanogr 17:10.1029
Broecker W, Peng TH (1982) Tracer in the sea. Columbia University, New-YorkBurke S, Dunbar R, Berger W (1996) Benthic and pelagic Foraminifera of the
Macoma layer, Santa Barbara Basin. Oceanogr Lit Rev 1:64–65Chavez FP, Ryan J, Lluch-Cota SE, Niquen M (2003) From anchovies to sardines
and back: multidecadal change in the Pacific Ocean. Science 299:217–221Cleveland WS, Devlin SJ (1988) Locally weighted regression: an approach to
regression analysis by local fitting. J Am Stat Assoc 83:596–610De Bernardi B, Ziveri P, Erba E, Thunell RC (2005) Coccolithophore export
production during the 1997–1998 El Nino event in Santa barbara basin(California). Mar Micropaleontol 55:107–125
De Bernardi B, Ziveri P, Erba E, Thunell RC (2008) Calcareous phytoplanktonresponse to the half century of interannual climatic variability in SantaBarbara Basin (California). Paleoceanography 23. doi:10.1029/2007pa001503
Dollfus D, Beaufort L. (1999) Fat neural network for recognition of position-normalised objects. Neural Networks 12:553–560
Emile-Geay J, Cane M, Seager R, Kaplan A, Almasi P (2007) El Niño as a mediatorof the solar influence on climate. Paleoceanography 22. 10.1029/2006PA001304
Feely RA, Sabine CL, Hernandez-Ayon JM, Ianson D, Hales B (2008) Evidence forupwelling of corrosive “acidified” water onto the continental shelf. Science.320:1490–1492
Grelaud M, Schimmelmann A, Beaufort L (2008) Coccolithophore response toclimate and surface hydrography in Santa Barbara Basin, California, AD1917–2004. Biogeosciences Discuss 5:4129–4159
Grelaud M, Schimmelmann A, Beaufort L (2009a) Coccolithophore response toclimate and surface hydrography in Santa Barbara Basin, California, AD1917–2004. Biogeosciences 6:2025–2039
Grelaud M, Beaufort L, Cuven S, Buchet N (2009b) Glacial to interglacial primary productionand El Nino—Southern Oscillation dynamics inferred from coccolithophores of theSanta Barbara Basin. Paleoceanography 24(PA1203):1201–1215
Henderiks J, Winter A, Elbrächter M, Feistel R, Van der Plas A, Nausch G, Barlow R(2011) Environmental controls on Emiliania huxleyi morphotypes in theBenguela coastal upwelling system (SE Atlantic). Mar Ecol Prog Ser 448:51–66
Hendy IL, Kennett JP (2000) Dansgaard-Oeschger cycles and the CaliforniaCurrent System: planktonic foraminiferal response to rapid climate change inSanta Barbara Basin, Ocean Drilling Program Hole 893A. Paleoceanography15:30–42
Hendy IL, Kennett JP, Roarkc EB, Ingramc BL (2002) Apparent synchroneity ofsubmillennial scale climate events between Greenland and Santa BarbaraBasin, California from 30–10 ka. Quat Sci Rev 21:1167–1184
Kaplan A, Cane MA, Kushnir Y, Clement AC, Blumenthal MB, Rajagopalan B (1998)Analyses of global sea surface temperature 1856–1991. J Geophys ResOceans 103:18567–18589
Kennett J, Ingram B (1995) Paleoclimatic evolution of Santa Barbara basin duringthe last 20 kyr: marine evidence from Hole 893A. Proc Ocean Drill ProgramSci Results 146(Part 2):309–325
Langer G, Geisen M, Baumann K-H, Kläs J, Riebesell U, Thoms S, Young JR (2006)Species-specific responses of calcifying algae to changing seawatercarbonate chemistry. Geochem Geophys Geosyst 7:Q09006
Langer G, Nehrke G, Probert I, Ly J, Ziveri P (2009) Strain-specific responses ofEmiliania huxleyi to changing seawater carbonate chemistry. BiogeosciDiscuss 6:4361–4383
Liu Z, Yoshimura K, Bowen GJ, Buenning NH, Risi C, Welker JM, Yuan F (2014)Paired oxygen isotope records reveal modern North American atmosphericdynamics during the Holocene. Nat Commun 5. doi:10.1038/ncomms4701
Liu F, Chai J, Huang G, Liu J, Chen ZY (2015) Modulation of decadal ENSO-likevariation by effective solar radiation. Dyn Atmos Oceans 72:52–61
MacDonald GM, Case RA (2005) Variations in the Pacific Decadal Oscillation overthe past millennium. Geophys Res Lett 32:4
Mann ME, Cane MA, Zebiak SE, Clement A (2005) Volcanic and solar forcing ofthe tropical Pacific over the past 1000 years. J Clim 18:447–456
Mantua NJ, Hare SR (2002) The Pacific decadal oscillation. J Oceanogr 58:35–44Mantua NJ, Hare SR, Zhang Y, Wallace JM, Francis RC (1997) A Pacific
interdecadal climate oscillation with impacts on salmon production. Bull AmMeteorol Soc 78:1069–1079
McGregor HV, Evans MN, Goosse H, Leduc G, Martrat B, Addison JA, Mortyn PG,Oppo DW, Seidenkrantz M-S, Sicre M-A, Phipps SJ, Selvaraj K, Thirumalai K,Filipsson HL, Ersek V (2015) Robust global ocean cooling trend for the pre-industrial Common Era. Nat Geosci 8:671–677
Minobe S (1999) Resonance in bidecadal and pentadecadal climate oscillationsover the North Pacific: role in climatic regime shifts. Geophys Res Lett 26:855–858
Muller MN, Beaufort L, Bernard O, Pedrotti ML, Talec A, Sciandra A (2012)Influence of CO2 and nitrogen limitation on the coccolith volume ofEmiliania huxleyi (Haptophyta). Biogeosciences 9:4155–4167
Neftel A, Oeschger H, Suess HE (1981) Secular non-random variations of cosmogeniccarbon-14 in the terrestrial atmosphere. Earth Planet Sci Lett 56:127–147
Newman M, Alexander MA, Ault TR, Cobb KM, Deser C, Di Lorenzo E, Mantua NJ,Miller AJ, Minobe S, Nakamura H (2016) The Pacific decadal oscillation,revisited. J Clim 29:4399–4427
Ogurtsov M, Nagovitsyn YA, Kocharov G, Jungner H (2002) Long-periodcycles of the Sun’s activity recorded in direct solar data and proxies.Sol Phys 211:371–394
Pennington JT, Chavez FP (2000) Seasonal fluctuations of temperature, salinity,nitrate, chlorophyll and primary production at station H3/M1 over 1989–1996in Monterey Bay, California. Deep-Sea Res II Top Stud Oceanogr 47:947–973
Philander SGH (1983) El Niño Southern Oscillation phenomena. Nature 302:295–301Reynolds RW, Rayner NA, Smith TM, Stokes DC, Wang W (2002) An improved in
situ and satellite SST analysis for climate. J Clim 15:1609–1625Ridgwell A, Schmidt DN, Turley C, Brownlee C, Maldonado MT, Tortell P, Young J
(2009) From laboratory manipulations to Earth system models: scalingcalcification impacts of ocean acidification. Biogeosciences 6:2611–2623
Riebesell U, Zondervan I, Rost B, Tortell PD, Zeebe R, Morel FM (2000) Reducedcalcification of marine plankton in response to increased atmospheric CO2.Nature 407:364–367
Roark EB, Ingram BL, Southon J, Kennett JP (2003) Holocene foraminiferalradiocarbon record of paleocirculation in the Santa Barbara Basin. Geology31:379–382
Rost B, Zondervan I, Wolf-Gladrow DA (2008) Sensitivity of phytoplankton tofuture changes in ocean carbonate chemistry: current knowledge,contradictions and research directions. Mar Ecol Prog Ser 373:227–237
Schimmelmann A, Lange CB, Roark EB, Ingram BL (2006) Resources forpaleoceanographic and paleoclimatic analysis: a 6,700-year stratigraphy andregional radiocarbon reservoir-age (ΔR) record based on varve counting and14C-AMS dating for the Santa Barbara Basin, offshore California, USA. JSediment Res 76:74–80
Schimmelmann A, Hendy IL, Dunn L, Pak DK, Lange CB (2013) Revised ∼2000-year chronostratigraphy of partially varved marine sediment in Santa BarbaraBasin, California. GFF 135:258–264
Sigl M, Winstrup M, McConnell JR, Welten KC, Plunkett G, Ludlow F, Buntgen U,Caffee M, Chellman N, Dahl-Jensen D, Fischer H, Kipfstuhl S, Kostick C, MaselliOJ, Mekhaldi F, Mulvaney R, Muscheler R, Pasteris DR, Pilcher JR, Salzer M,Schupbach S, Steffensen JP, Vinther BM, Woodruff TE (2015) Timing and climateforcing of volcanic eruptions for the past 2,500 years. Nature 523:543–549
Steinman BA, Abbott MB, Mann ME, Stansell ND, Finney BP (2012) 1500 yearquantitative reconstruction of winter precipitation in the Pacific Northwest.Proc Natl Acad Sci 109:11619–11623
Suess HE (1980) The radiocarbon record in tree rings of the last 8000 years.Radiocarbon 22:200–209
Thomson DJ (1982) Spectrum estimation and harmonic analysis. Proc IEEE 70:1055–1096
Trimborn S, Langer G, Rost B (2007) Effect of varying calcium concentrations andlight intensities on calcification and photosynthesis in Emiliania huxleyi.Limnol Oceanogr 52:2285–2293
Vautard R, Ghill M (1989) Singular spectrum analysis in nonlinear dynamics, withapplications to paleoclimatic time series. Physica D 35:395–424

Beaufort and Grelaud Progress in Earth and Planetary Science (2017) 4:5 Page 13 of 13
Winter A (1985) Distribution of living coccolithophores in the California currentsystem, Southern California borderland. Marine Microplaleontol 9:385–393
Zebiak SE, Cane MA (1987) A model El Niño-Southern Oscillation. Mon WeatherRev 115:2262–2278
Zhang Y, Wallace JM, Battisti DS (1997) ENSO-like interdecadal variability:1900–93. J Clim 10:1004–1020
Zhao M, Eglinton G, Read G, Schimmelmann A (2000) An alkenone (U37K′)quasi-annual sea surface temperature record (A.D. 1440 to 1940) usingvarved sediments from the Santa Barbara Basin. Org Geochem 31:903–917
Submit your manuscript to a journal and benefi t from:
7 Convenient online submission
7 Rigorous peer review
7 Immediate publication on acceptance
7 Open access: articles freely available online
7 High visibility within the fi eld
7 Retaining the copyright to your article
Submit your next manuscript at 7 springeropen.com
Copyright © 2022 FDOKUMEN