9371621.pdf - International Nuclear Information System (INIS)
143
B.A.R.C-937 GOVERNMENT OF INDJA ATOMIC ENERGY COMMISSION ANNUAL REPORT OF THE NEUTRON PHYSICS SECTION Period Ending December 1976 Edited by O, P. Joneja and M. Ramanadham BHABHA ATOMIC RESEARCH CENTRE BOMBAY, INDIA 1977
-
Upload
khangminh22 -
Category
Documents
-
view
2 -
download
0
Transcript of 9371621.pdf - International Nuclear Information System (INIS)
B.A.R.C-937
GOVERNMENT OF INDJA
ATOMIC ENERGY COMMISSION
ANNUAL REPORT OF THENEUTRON PHYSICS SECTION
Period Ending December 1976
Edited byO, P. Joneja and M. Ramanadham
BHABHA ATOMIC RESEARCH CENTRE
BOMBAY, INDIA1977
B.A.R.C.-937
GOVERNMENT OF INDIAATOMIC ENERGY COMMISSION
ANNUAL REPORT OF THENEUTRON PHYSCS SECTIONPeriod Ending December 1976
Edited by
O. P. Janoja *ad M. Ramutadhun
BHABHA ATOMIC RESEARCH CENTREBOMBAY. INDIA
1977
F O R E W O R D
Host of the research programmes of Neutron Physics
Section can be classified as basic research though there are
some applied R and D programmes. In X-ray and neutron cry-
stallography, interest has continued on structures of mole-
cules of biological interest. The period of this report saw
the TDC-312 computer-controlled neutron diffractometer go
into operation. This is the first indigenously built compu-
ter controlled (neutron or x-ray) diffractometer in the
country and it has operated very well for an year. , A more
sophisticated diffractometer for x-rays has nov been designed
and is under fabrication.
Phase transformations of various kinds have been inves-
tigated over the last couple of years. Detailed studies have
been made on the static high-pressure transformations in Ti
and Zr using the resistivity method. Several crystal struc-
tures have also been examined to search for potential ferro-
elastics. The vapourisation, melting and other phenomena in
rocks consequent to an underground nuclear explosion have
been studied. This has involved the development of complex
oomputer codes for the propogation of shock waves in rooks
using numerical simulation techniques; attempts are also being
made to find analytical solutions to segments of the problem.
Much of the recent interest of the Purnima Group has233been concentrated on U JJ systems. Following the earlier
23*5studies on a sub-critical U 'J uranyl nitrate solution sys-233tem, two critical configurations using U •" have been
planned - a solution experiment which should be completed
shortly and a source mini-reactor for neutron radiography
and other fixper linen+,s it RHU.
A part of the work of Neutron Physics Section can be
described as reactor computational physics - both develop-
ment of new computer codes and adaptation cf standard codes
on BSEM-6 computer. Some of the new codes developed have
been baaed on the Monte Carlo technique. The activities
concerned with neutron generators and neutron spectrum
measurements have continued. A miniature sealed neutron
generator is being developed in collaboration with other
Divisions in BARCl to help the OHGC in the use of nuclear
techniques for oil exploration. Extended abstracts of the
various research activities of the Section for the period
July 19Y5 - December 1976 are contained in this report.
(R. Chidambaram)
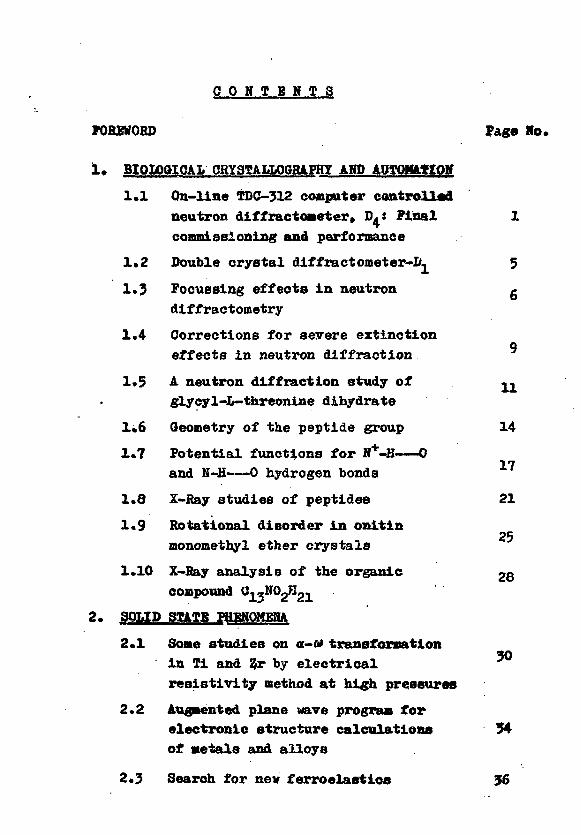
0 0 N T B N T 3
FOREWORD P a g e Ho.
1. BIOLOQIOAL CRYSTALLOGRAPHY AND AUTOMATION
1.1 On-line TDC-312 computer controlled
neutron diffractoseter, D^: Final 1
commissioning and performance
1*2 Double crystal diffract ometer-I/- 5
1.3 Focussing effects in neutron g
diffraetometry
1*4 Corrections for severe extinctionq
effects in neutron diffraction
1.5 A neutron diffraction study of **
glycyl-L-tfareonine dihydrate
1.6 Geometry of the peptide group 14
1.7 Potential functions for »+-H 017and N-H--—0 hydrogen bonds
1.8 X-fiay studies of peptides 21
1.9 Rotational disorder in onitin
monomethyl ether crystals
1.10 X-Ray analysis of the organic 2 8
compound °X3NO2H21
2. SOUP STATE PHKNOMEHA
2.1 Some studies on a-o> transfomatlon
in Ti and Z,r by electrical
resistivity method at high pressures
2.2 Augmented plane wave program for
electronic structure calculations 74
of aetals and alloys
2*3 Search for nev ferroelastics 36
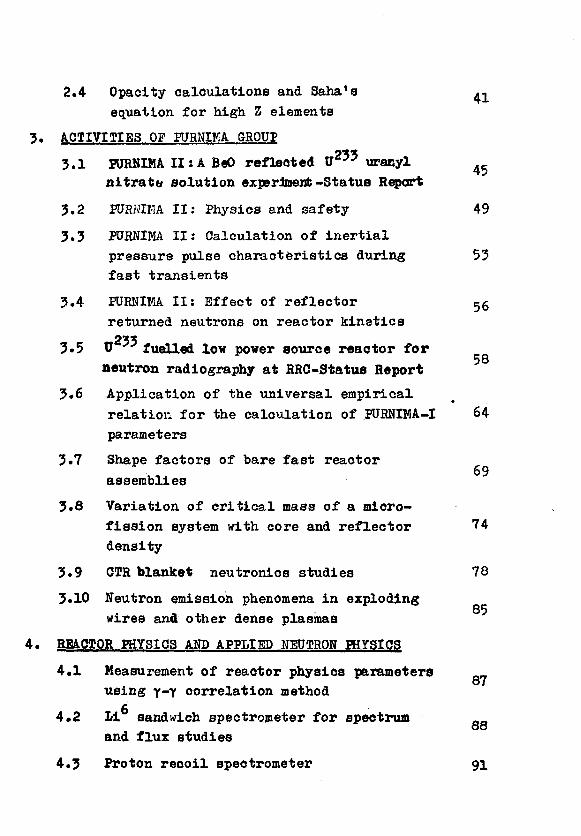
2.4 Opacity calculations and Saha's .^
equation for high Z elements
ACTIVITIES OF HJRNIMA GROUP
3.1 PURNIMA II: A BeO reflected U 2 5 5 uranyl ^
nitrate solution experiment-Status Report
3.2 PURHIHA II: Physics and safety 49
3.3 PURNIMA II: Calculation of inertial
pressure pulse characteristics during 53
fast transients
3.4 PURNIMA II: Effect of reflector 5 6
returned neutrons on reactor kinetics
3*5 tJ •'•' fuelled low power source reactor for
neutron radiography at RRC-Statua Report
3.6 Application of the universal empirical
relation for the calculation of PURNIMA-I 64
parameters
3.7 Shape factors of bare fast reactor
assemblies
3.8 Variation of critical mass of a micro-
fission system with core and reflector 74
density
3.9 CTR blanket neutronics studies 78
3.10 Neutron emission phenomena in exploding
wires and other dense plasmas
4. REACTOR PHYSIOS AND APPLIED NEUTRON PHYSICS
4.1 Measurement of reactor physics parameters87
using y-Y correlation method
4.2 Li sandwich spectrometer for spectrum88
and flux studies
4.3 Proton recoil spectrometer 91
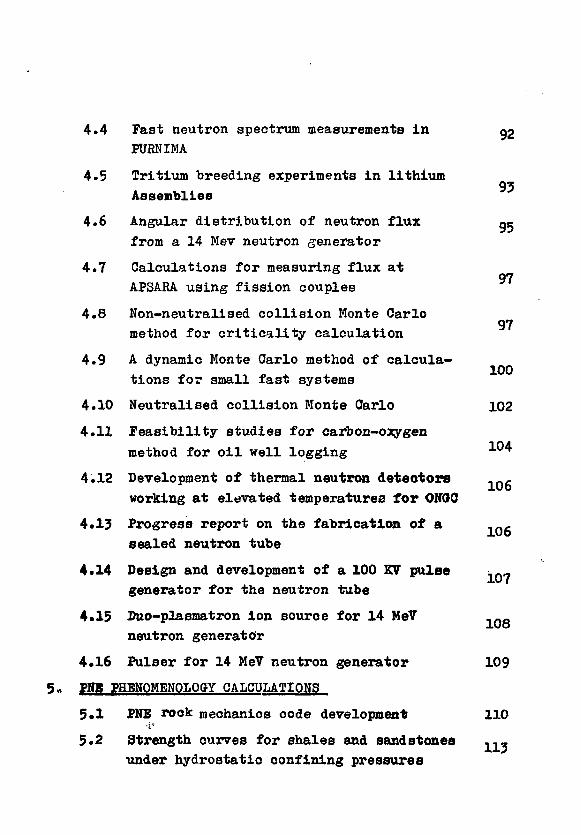
4.4 Past neutron spectrum measurements in M
PURNIMA
4.5 Tritium breeding experiments in lithium93Assemblies
4.6 Angular distribution of neutron flux ne
from a 14 Mev neutron generator
4.7 Calculations for measuring flux at97
APSARA using f iss ion couples4.8 Non-neutralised collision Monte Carlo
97method for critical!ty calculation
4.9 A dynamic Monte Carlo method of calcula-100
tions for small fast systems4.10 Neutralised collision Monte Carlo 102
4.11 Feasibility studies for carbon-oxygen
method for oil well logging 10^
4*12 Development of thermal neutron detectors ,n,lUo
working at elevated temperatures for ONGO
4.13 Progress report on the fabrication of a .n£J.UO
sealed neutron tube
4*14 Design and development of a 100 KV pulse 1 Q 7
generator for the neutron tube4*15 Duo-plasmatron ion source for 14 MeV ...
xuo
neutron generator
4*16 Pulser for 14 MeV neutron generator 109
5» PUB PHENOMENOLOGY CALCULATIONS
5.1 PNE rook mechanics code development 110
5.2 Strength curves for shales and sandstones ,,,
under hydrostatic confining pressures
5«3 Cavity radius oaloulations for contained 119underground nuclear explosions
gPBLlCATIOHS
l* Papers published/aubaltted/aocepted for 122publication
2. Papers presented or accepted for 126presentation at Symposia, Senlnars etc.
3* Theses submitted and degrees awarded 128
OTHER ACADEMIC ACTIVITIES OF THB MEMBERS OP 129
THE SECTIOH
1BCTDB13 OROAHISED BT THB SECTION 132
S1CXIO* STAFF 133
-1-
1. BIOLOGICAL CRYSTALLOGRAPHY AMD AUTOMATION
1.1 On-line TDC-512 Computer Controlled Neutron Diffracto-meter. P.; Final Commissioning and Performance(R. Chidambaram, A. Sequeira, S.N. Momin. H. Rajagopal,R.N. Khunte, M. Ramanadham and J.N. Soni)
The above system was commissioned in December 1975 and
has since been operating very satisfactorily at the CIRUS
reactor. A photograph of the newly fabricated four circle
neutron diffractometer alongwith the TDC-312 (4K) system is
shown in Fig. 1.1. This is the first indigenously fabricated
on-line computer controlled (neutron or x-ray) diffractometer
in the country.
The diffractometer consists of a 18" dia. full -circle
on which the 0-circle assembly iq carried along with its drive
and angle tracking system. The diffractometer has been aligned
such that the 0 and the 3C~axes intersect orthogonally within a
tolerance of 40 microns and an estimated tilt of 0.03 of a
degree, with their point of intersection remaining on the W -
and the 26-axes within the same tolerance. The four angles
are driven by worm drives (180:1 for 0 and 360:1 for others)
using d.c. motors and can be set in parallel at speeds upto
35 deg./nin. The angles are tracked using interrupts from the
digitizers attached to each worm shaft, which generate 100
pulses persdegree motion of the angle, along with a reference
pulse (degree marker). The positioning accuracy of the angXbs
is around 0.01 of a degree.
A compact 4K software package consisting of various inter-
face and interrupt routines, floating point arithmetic and
-2-
Fig. I.I (a). The 4-circle neutron difTractometer, DA
Fig. 1.1 (b), TDC-312 computer system for controlling thediffract ometer.
-3-
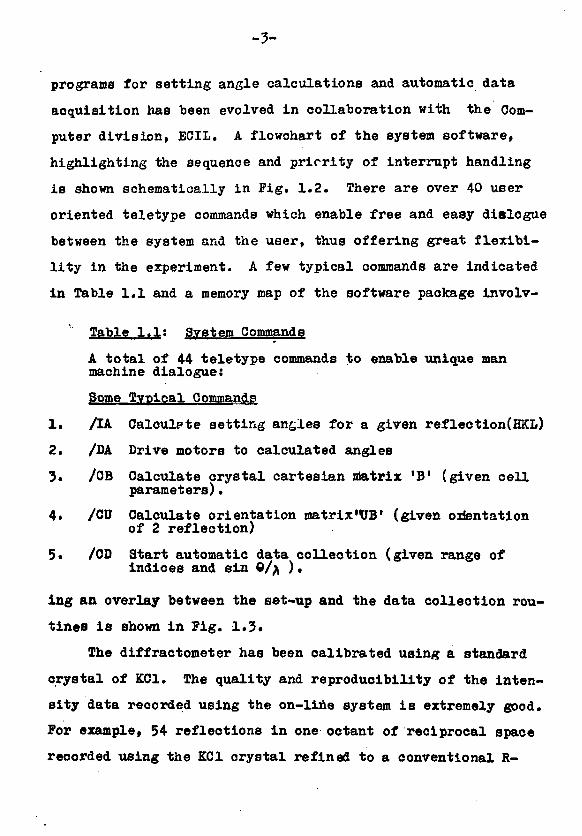
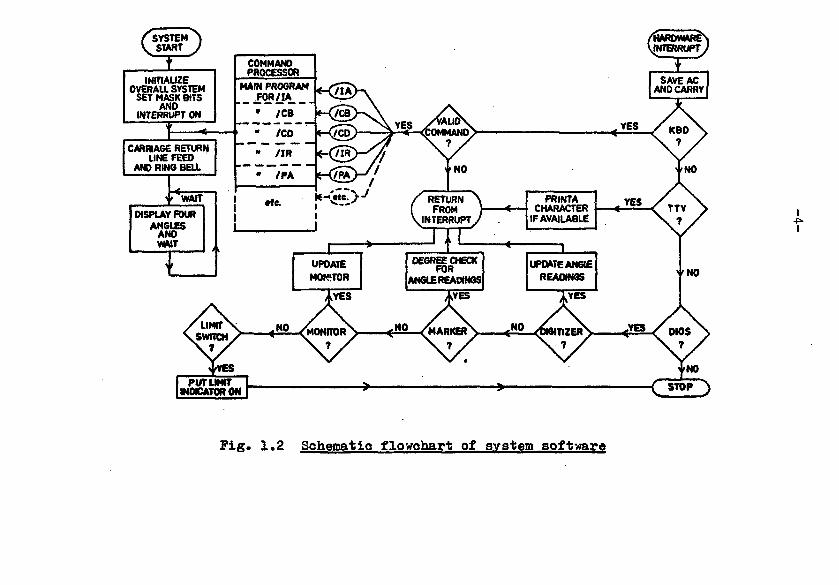
programs for setting angle calculations and automatic data
acquisition has been evolved in collaboration with the Com-
puter division, BOIL. A flowchart of the system software,
highlighting the sequence and priority of interrupt handling
is shown schematically in Pig. 1.2. There are over 40 user
oriented teletype commands which enable free and easy dialogue
between the system and the user, thus offering great flexibi-
lity in the experiment. A few typical commands are indicated
in Table 1.1 and a memory map of the software package involv-
Table 1.1s System Commands
A total of 44 teletype commands to enable unique manmachine dialogue:
Some Typical Commands
1. AA Calculpte setting angles for a given reflection(HKL)
2. /DA Drive motors to calculated angles
3. /CB Calculate crystal cartesian matrix 'B' (given cellparameters).
4. /CU Calculate orientation matrix'UB1 (given orientationof 2 reflection)
5. /CD Start automatic data collection (given range ofindices and sin Q/% ).
ing an overlay between the set-up and the data collection rou-
tines is shown in Fig. 1.3.
The diffractometer has been calibrated using a standard
crystal of KC1. The quality and reproducibility of the inten-
sity data recorded using the on-line system is extremely good.
For example, 54 reflections in one octant of reciprocal space
recorded using the KC1 crystal refined to a conventional R-
SYSTEMSTART
INITIALIZEOVERAU SYSTEM
SET MASK BITSAND
INTERRUPT ON
CARRIAGE RETURNLire FEED
AND RING BELL
' WAIT
DISPLAY FOURANGLES
ANOWAIT
PUT LIMITMOCATORON
rte.
.NO
RETURN[ FROM\INTERRUPT
UPDATEMOWTOR
YES
DEGREE CHECKFOR
lANGLEREAUNOSl
,NO
PRINTACHARACTER
IF AVAILABLE
'""TVBS
< W 0 <P9ITIZER\ < V
Fig. 1.2 Schematic flowchart of system software
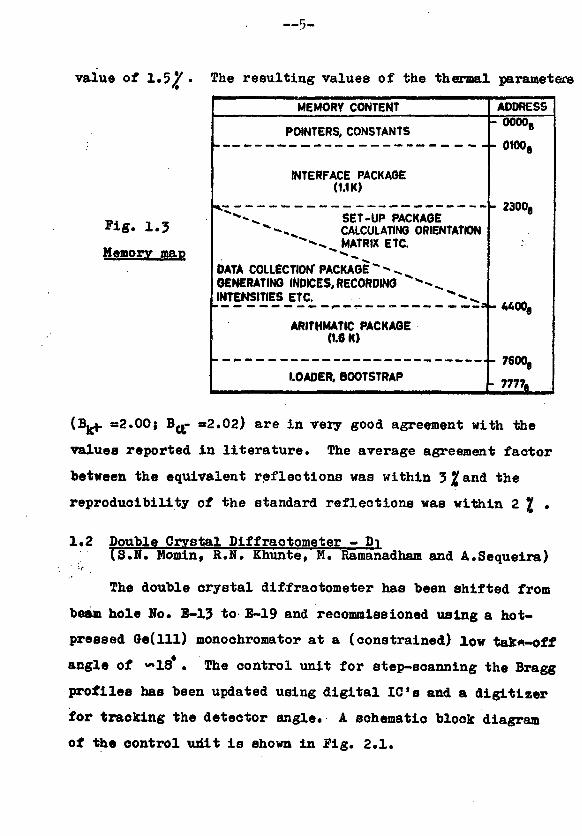
value of 1, The resu l t ing values of the thermal parameters
Fig . 1.3
Memory map
MEMORY CONTENT
POINTERS, CONSTANTS- 0000 B
- - 0HX>9
INTERFACE PACKAGE(1.1 K)
SET-UP PACKAGECALCULATING ORIENTATION
. MATRIX ETC.
DATA COLLECTION* PACKAGEGENERATING INDICES, RECORDING "INTENSITIES ETC.
ARITHMATIC PACKAGE(1.6 K)
LOADER. BOOTSTRAP
ADDRESS
2300e
«*00fl
-7600^
- 7777.
=2.00; B^- =2.02) are in very good agreement with the
values reported in literature. The average agreement factor
between the equivalent reflections was within 3^and the
reprodueibility of the standard reflections was within 2 \ .
1.2 Double CrysDouble Crystal(S.N. Momin, R
Diffractometer - PiMomin, R.N. Khunte, M. Ramanadham and A.Sequeira)
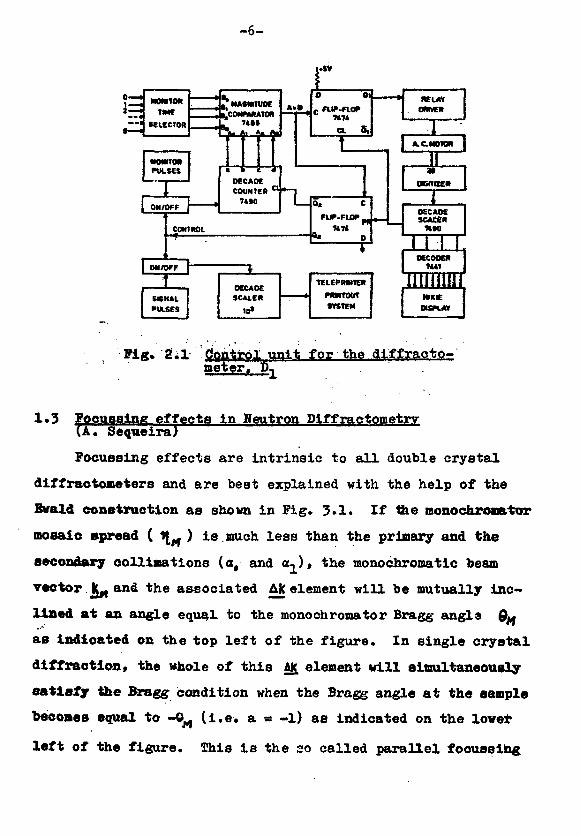
The double crystal diffractometer has been shifted from
beam hole No. E-13 to B-19 and recommissioned using a hot-
pressed Ge(lll) monochromator at a (constrained) low tak«-off
angle of ^ 1 8 * . The control unit for step-scanning the Bragg
profiles has been updated using digital 10's and a digitizer
for tracking the detector angle* A schematic block diagram
of the control uriit is shown in Fig. 2.1.
- 6 -
i.*v
TSKKALPULSES
OECAOESCALE*
TCLEPRM1EK
PMfTOUT•VSTEM
_l—1—I—LsOECODOI
TU1 |
uimiiiiMKE
MSPLAY
Pig. 2U1 flontrolControl umeter. pT
f n r diftracto-
1.3 'ocussing effects in Neutron Diffractometrv7 Sequeira)
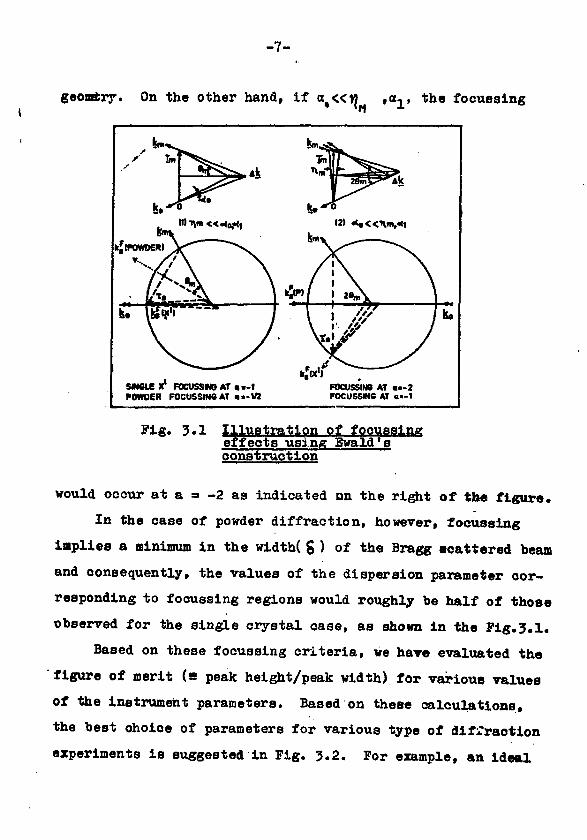
Pocuasing effects are intrinsic to all double crystal
diffractoneters and are best explained with the help of the
Bwald construction as shown in Fig. 3.1. If the aonochromtoi
mosaic spread ( 1^ ) is.much less than the primary and the
secondary colli»ations (a, and a 1) # the monochromatic beam
vector fc^ and the associated AK element will be mutually inc-
lined at an angle equal, to the monochromator Bragg angle Qy,
as Indicated on the top left of the figure. In single crystal
diffraction, the whole of this AK element will simultaneously
satisfy the Bragg condition when the Bragg angle at the sample
becomes equal to -0^ (i.e. a = -1) as indicated on the lower
left of the figure. This is the so called parallel focussing
-7-
geoaftzy On the other hand, if \«Y^ ,0^, the focussing
SMCLCX1 FOCUSSNOAT «—tPOWOER F0CUSSIN6AT «<-V2
r t^* • « •
F0CUSSIM8 AT « - 2F0CUSSM6 AT <••-!
Pig. 3*1 Illustration of focussingeffects using •sconstruction
would ocour at a =» -2 as indicated on the right of the figure.
In the case of powder diffraction, however, focussing
implies a minimum in the width(§) of the Bragg scattered beam
and consequently, the values of the dispersion parameter cor-
responding to focussing regions would roughly be half of those
observed for the single crystal case, as shown in the Fig.3.1.
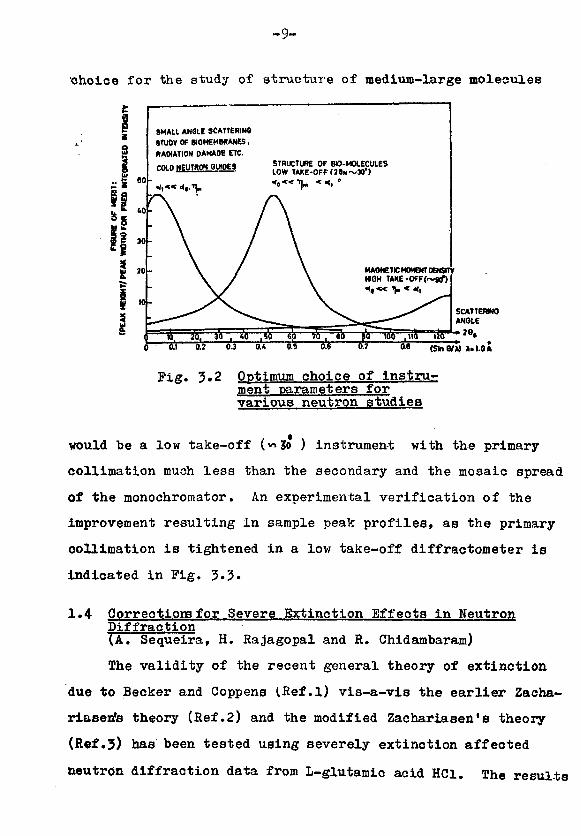
Based on these focussing criteria, we have evaluated the
figure of merit (B peak height/peak width) for various values
of the instrument parameters. Based on these calculations,
the best oholce of parameters for various type of diffraotion
experiments is suggested in Fig. 3.2. For example, an ideal
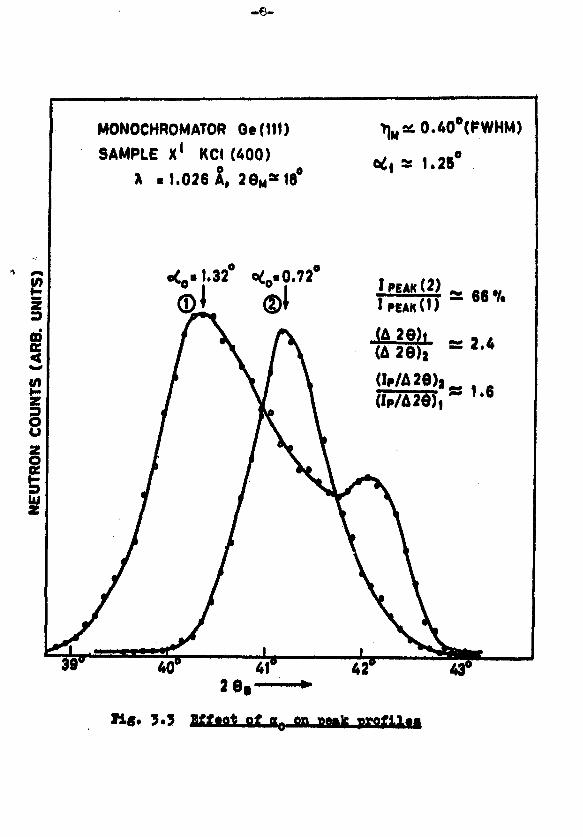
- 6 -
MONOCHROMATOR
SAMPLE X1 KCI (400)
a .1.026 A, 29 M *18
>.40°(FWHM)
a: 1.25°
1.32
3
CD
5
1 PEAK ( 2 )I PEAK ( D
(A 29).(A 29),
(WA29),
66 V.
2.4
1.6
UJ
3*3 Bff*ot of a, BiM.k t t r o f l l * *
choice for the study of structure of medium-large molecules
= 5
I
SMALL AN3LE SCATTERIN*
STUDY OF BIOMEMMANES,
RADIATION DAMAGE ETC.
COID NEUTJSPJilUIDES STRUCTURE OF BIO-MOLECULESLOW TAKE-OFF<J»N~3O*>
MAGNETIC MOMENT DBOmrHIOH TAKE-OFF(~90*)
».I.OA
Pig. 3.2 Optimum choice of Instrument parameters forvarious neutron studies
would be a low take-off (v>3© ) instrument with the primary
collimation much less than the secondary and the mosaic spread
of the monochromator. An experimental verification of the
improvement resulting In sample peak profiles, as the primary
collimation is tightened in a low take-off diffractometer ia
indicated in Fig. 3.35.
1.4 OorreotioiB for Severe Extinction Effects in NeutronDiffraction(A. Sequeira, H. Rajagopal and R. Chidambaram)
The validity of the recent general theory of extinction
due to Becker and Coppens (Ref.l) vis-a-vis the earlier Zacha-
riasen's theory (Ref.2) and the modified Zachariasen's theory
(Ref.3) has been tested using severely extinction affected
neutron diffraction data from L-glutamic acid HCl. The results
-10-
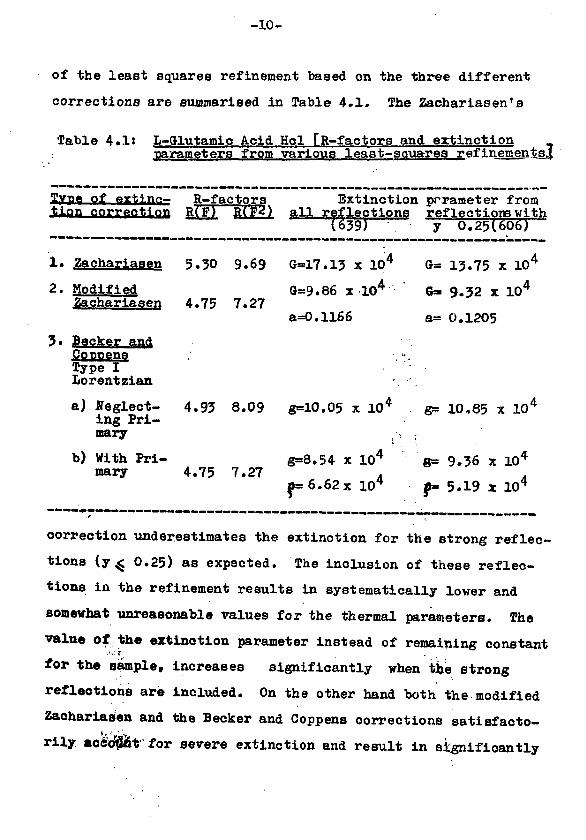
of the least squares refinement based on the three different
corrections are summarised in Table 4.1. The Zachariasen's
Table 4.1s L-Qlutamic Acid Hcl [R-factors and extinctionparameters from various least-squares refinements!
of extlnn- R-factors Extinction parameter fromtlon correction R(F) R(F^) all reflections reflections with
(619) • y 0.25(606)
1. Zachariaaen 5.30 9.69 G=17.13 x 10⁴ G= 13.75 x 10⁴
2. Modified G=9.86 x 10⁴ &- 9.32 x 10⁴
iSachariasen 4.75 7.27a=0.H66 a= 0.1205
3. Becker andOoppena . • <•.•Type ILorentzian ;
a) Neglect- 4.93 8.09 g=10.05 x 10⁴ g= 10,85 x 10⁴
ing Pri-mary .. .
b) With Pri- g=8.54 x 10⁴ g= 9.36 x 10⁴
mary 4.75 7.27 . A^=6.62x 10⁴ f= 5.19 x 10⁴
correction underestimates the extinction for the strong reflec-
tions (y 0.25) as expected. The inclusion of these reflec-
tions in the refinement results in systematically lower and
somewhat unreasonable values for the thermal parameters. The
value of the extinction parameter instead of remaining constant
for the sample, increases significantly when tie strong
reflections are included. On the other hand both the modified
Zachariasen and the Becker and Coppens corrections satisfacto-
rily *cittHL&t for severe extinction and result in significantly
-11-
euperior R-factors as indicated in the Table. Also, in these
models the value of the extinction parameter & remains inde-
pendent of the number of reflections used in the refinement.
In the Becker and Coppens theory, the best results were
obtained with Type I-Lorentzian correction and the correspon-
ding R-factors are indicated in 3a of the Table 4.1. These
R-factors are superior to those obtained with Zachariasen*s
model j£!but are nox- superior to those obtained in the modi-
fied Zachariasen's model ffZ* When the primary extinction was
included in the Becker and Coppens model, the R-factors imp-
roved and became comparable to those obtained in refinement
$-Z, but the resulting particle size of 9.28/tdoesn't appear
reasonable*. It is therefore concluded that the results of
Becker and Coppens theory show significant improvement over
the Zachariasen8s theory but are not superior to results of
modified Zachariasen theory of Sequeira, Rajagopal and Chidam-
baram (Refo2)o
/I/ Becker PoJc and Coppens P. (1974), Acta Cryst. A50. 129.
/2/ Zachariasen, W,H. (1967), Acta Cryst. 21, 558.
/3/ Sequeira A., Rajagopal H., and Chidambaram R. (1972)Acta Cryst. A28. S4. S193.
1<>5 A Neutron Diffraction Study of <rlvcyl-L»ThreonineDihydrate(A. Sequeira, H. Rajagopal and V.M. Padmanabhan)
In continuation of our work on precise structural studies
of small biological molecules, a neutron diffraction study of
glycyl-1-threonine dihydrate (C6N2O4H12.2H2O) has be^n carried
-12-
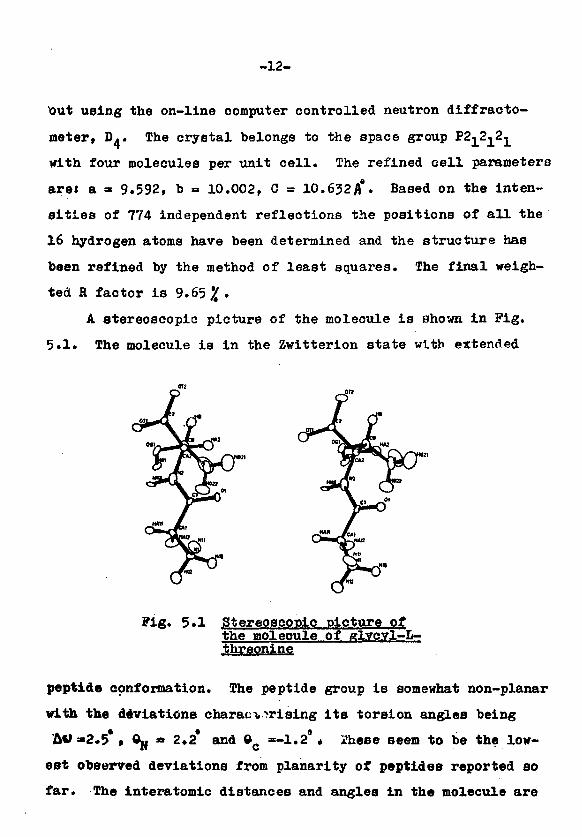
out using the on-line computer controlled neutron diffracto-
meter, D.. The crystal belongs to the space group K ^ ^ ^
with four molecules per unit cell. The refined cell parameters
are: a » 9.592, b = 10.002, C = 10.632/1*. Based on the inten-
sities of 774 independent reflections the positions of all the
16 hydrogen atoms have been determined and the structure has
been refined by the method of least squares. The final weigh-
ted R factor is 9.65 #.
A stereoscopic picture of the molecule is shown in Pig.
5.1. The molecule is in the Zwitterion state with extended
Pig. 5«1 Stereoscopic picture ofthe molecule of gl.vc.yl-L-threonine
peptide conformation. The peptide group is somewhat non-planar
with the deviations characterising its torBion angles being
M>=»2.5*, Ojj - 2.2* and ©c =-1.2** 2hese seem to be the low-
est observed deviations from planarity of peptides reported so
far. The interatomic distances and angles in the molecule are
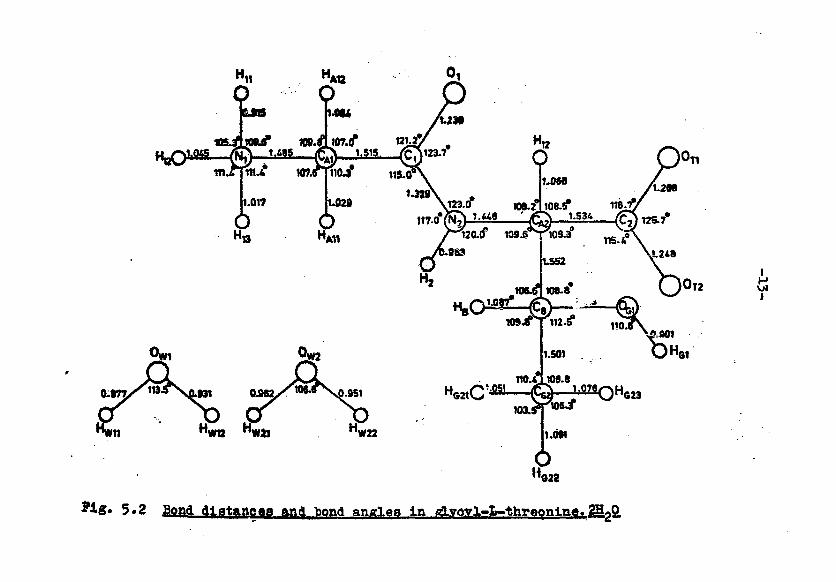
1.515 /FA123.7
A A 61
622
5 • 2 Bond d^ataneaa and bond anglea in aLyoyl-L-thre^nin^. 2HgQ
-14-
givsn in Pig. 5.2. All the hydrogens attached to the nitrogen
and oxygen atoms are involved in hydrogen bonding. It is inter-
esting to note that one of the terminal carboxyl oxygens, OT^,
which accepts three hydrogen bonds has a longer C-0 distance
compared with the other atom, 0T2, which accepts two hydrogen
bonds.
1.6 Geometry of the Peptide Group(M. Ramanadham)
The peptide linkage was assumed to be planar in the secon-
dary and tertiary model structures of the polypeptides proposed
by Pauling and co-workers. However, recently there has been
some rethinking regarding the exact planarity of the peptide
group. The results of the work reported by Winkler and Dunitz
[Ref.9], Ramachandran et al [Ref.4] and Ramachandran and Kolaa-
kar [Ref.5] indicate that, eventhough,the equilibrium configu-
ration of the peptide group is planar or close to it, small
but significant deviations from planarity can occur at a very
low cost of energy. In addition to the usual to—rotation about
the C-N bond, there can be distortions in the planar configu-
ration of the bonds at N and 0 atoms. However, the distortions
at the nitrogen atom were found to be significantly larger than
those at the carbon atom. Neutron diffraction studies of the
three dipe'ptides, namely, perdeutero-a-glycylglycine [Freeman
et al, 1970], glyeylglycine.HCl.HgO [Koetzle et al,1972] and
glycyl-L-threonine.2H20 [Sequeira et al, 1976] have confirmed
the above observations. The torsion-angle data listed in
-15-
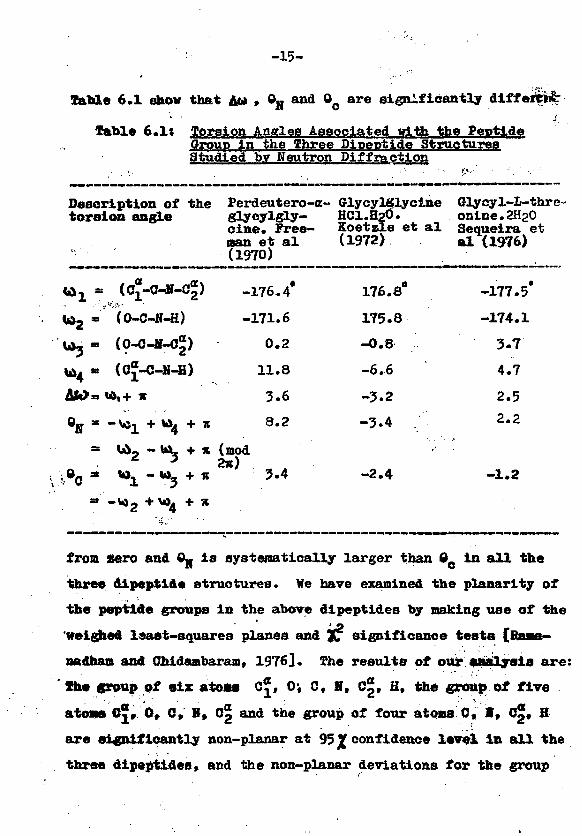
Table 6.1 show that At* , ©H and OQ are significantly diff»m£r»• . r
Table 6.1s Torsion Angles Associated with the PeptideOroup in the Three Dloeotide StructuresStudied by Neutron Diffraction
Description of the Perdeutero-a- GlycyKSlycine Glycyl-L-thre-torsion angle glycylgly- HCl.HgO. onine.2H20
cine. Free- Koetzle et al Sequeira etman et al (1972) al (1976)(1970) - _^ _
w l * t0?-0-11-0^ -176.4* 176.8° -177.5*
(0-C-N-H) -171.6 175.8 -174.1
(O-C-H-C*) 0.2 -0.8 3.7
(Cj-G-M-H) 11.8 -6.6 4.7
* 3.6 -5.2 2.5
+ W 4 + » 8.2 -3.4 2« 2
, - WL + * (mod
- u>5 + * 3.4 -2.4 -1.2
= -\
from Aero and Cy is systematically larger than 0Q in all the
three dipeptid* structures. We have examined the planar!ty of
the peptlcte groups in the above dlpeptides by making use of the
weighed least-squares planes and JT significance tests (Baaa-
oadham and Chidambaram, 1976]. The results of our analysis are:
' The group of six atoiw C*, 0-, C, H, Cg, Hf the group of five
atoas C*f 0» C, H» o| and the group of four atoms C, I, c"» H
are significantly non-planar at 95 % confidence le*rei in all the
three dlpeptldes» and the non-planar deviations for the group
-16-
bf four atoms C?» 0, 0, N are significant at the same confi-
dence level in perdeutero-a-glycylglycine and glycylglycine.
HC1.H2O and not significant in the case of glyeyl-L-Threonine
2H20.
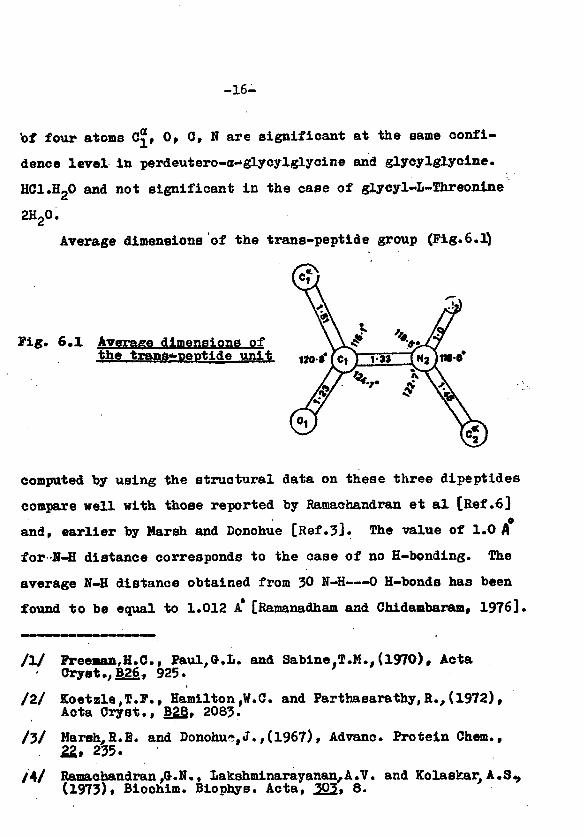
Average dimensions of the trans-peptide group (Fig.6.1)
Pig. 6.1 Average dimensions ofthe trana»T>eptide unit
computed by using the structural data on these three dipeptides
compare well with those reported by Ramachandran et al [Ref.6]
and, earlier by Harsh and Donohue [Ref.3]. The value of 1.0 A
for N-H distance corresponds to the case of no H-bonding. The
average N-H distance obtained from 30 N-H—-0 H-bonds has been
found to be equal to 1.012 A* [Ramanadham and Chidambaram, 1976].
/I/ Freeman,H.C., Paul.G.L. and Sabine.T.M.,(1970), ActaOryst.,Bg6, 925.
/2/ Koetzle,T.F., Hamilton ,W.C. and Parthasarathy, R.,(1972),Aota Cryst., B2S, 2083.
/3/ Marsh, R.B. and Donohu*.J.,(1967), Advanc. Protein Chem.,21, 235.
/4/ Ramaohandran,G.N., Lakshminarayanan,A.V. and Kolaskar. A.S.,(1973)» Bioohim. Biophys. Acta, 222» 8.
-17-
/5/ Ramachandran,G.N. and Kolaskar, A.S.,(1973), Biochim.Biophys. Acta, 222t 385.
/6/ Ramachandran.G.N., Kolaskar,A.S., Ramakrishnan,C. andSasisekharan,V.,(l974)f Biochim. Biophys. Acta, 252» 298.
/7/ Ramanadham,M. and Chidambaram,Rv(1976), to be published.
/8/ Sequ<jira,A., Rajagopal,H. and Padmanabhan,V.M. (1976), tobe published.
/9/ Winkler.F.K. and Dunitz,J.Dt.^(l97l), J. Mol. Biol., 52,169.
1.7 Potential Functions for H*-H 0 and N-H 0 Hydrogen Bonds(M. Ramanadham)
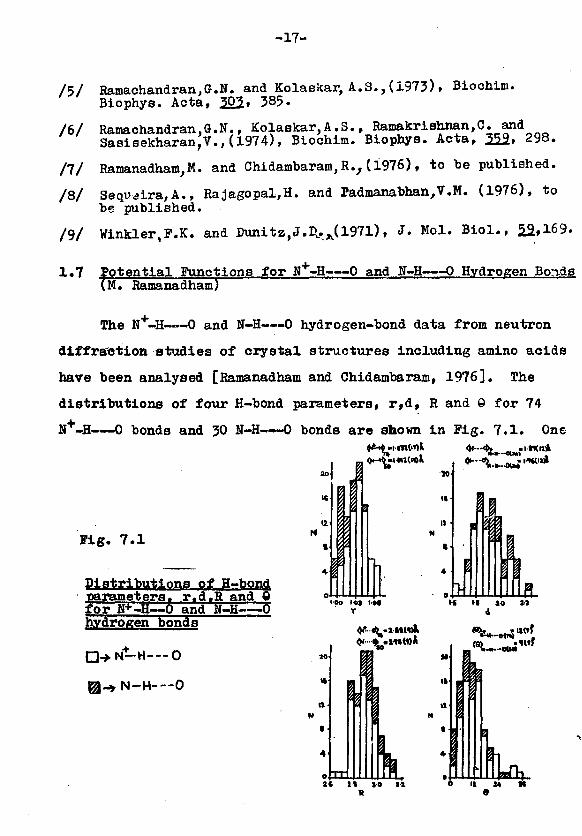
The N+-H—--0 and N-H—0 hydrogen-bond data from neutron
diffraction studies of crystal structures including amino acids
have been analysed [Ramanadham and Chidambaram, 1976]. The
distributions of four H-bond parameters, r,d, R and 9 for 74
N +-H—0 bonds and 30 N-H 0 bonds are shown in Fig. 7.1. One
Fig. 7 .1
Distributions of H-borparameters. r.d.R and
2O
IS •
12 J *
Ji I
Afor N+-H—0 and N-H 0hydrogen bonds
ISO tOJ IO«
TIt If to II
4
Q-».N-H— O^••(^.Mttt)*
at l* so
I'i
II 14 M
a
-18-
can see from this figure that there are systematic differences
between these two types of hydrogen bonds. The N -H distances
are longer than N-H distances and N + 0 and H 0 distances
of N+-H 0 bonds are shorter than the corresponding K....0 and
H 0 distances of N-H 0 bonds. The average values of the
four H-bond parameters are:„ a » •
N+-H 0 1.032(-7) 1.8y(l2) 2.88(9) 12(7)
N-H 0 1.012(13) 1.96(12) 2.94(9) 9(7)
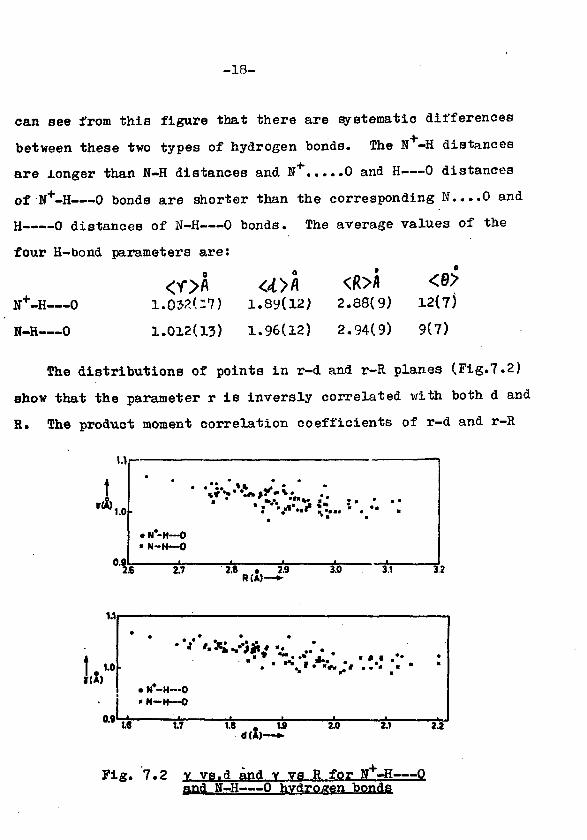
The distributions of points in r-d and r-R planes (Fig.7.2)
show that the parameter r is inversly correlated with both d and
R. The product moment correlation coefficients of r-d and r-R
2.8 • 2.9RCA)
1.1
0.9
V
• N*-H—0. N - H — 0
I*.*.* *.» •**
ts 1.7 1.8 . 1 9 2.0 2.1d{ A ) — f
2.2
Pig. 7.2 y vs'd a n d Y v a R f o r N -»H 0and N - H — 0 hvdroa^n bonds
-19-
for N +-H—0 and N-H 0 bonds are:
N+-H 0 -0.73 -0.63
N-H 0 -0.57 -0.47
These values are significantly different from zero, The least-
squares straight lines for the above four cases are:
For N+-H 0 bonds
r <* 1.224 - 0.102 d
r = 1.364 - 0.116 R
For K-H 0 bonds
r « 1.134 - 0.062 d
r = 1.208 - 0.067 H
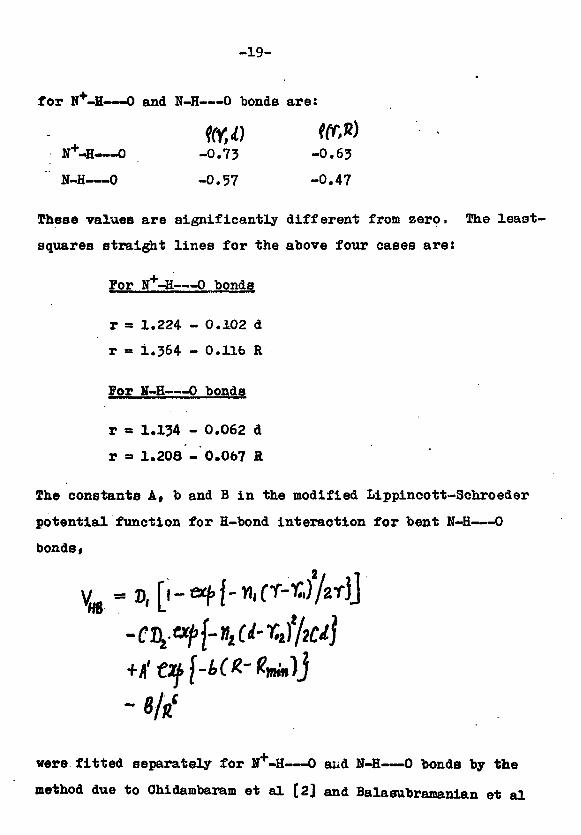
The constants A, b and B in the modified Lippineott-Schroeder
potential function for H-bond interaction for bent N-H 0
bonds,
2,
were fitted separately for N +-H—0 aud N - H — 0 bonds by the
method due to Chidambaram et al [2] and Balasubramanian et al
-20-
[lj. The constant r#, was chosen as 1.014 A for N+-H 0
bonds and 1.0 A for H-H—0 bonds. The values for other
constants, D^, n^, C, Dg, n 2 and r02 were taken from the
paper by Chidambaram et al. [2]. The constant A refined
here is related to the constant A used by Chidambaram et al.
[2] as A = A* exp ( D R ^ ^ ) . T h e constants were refined for
various sets of values of H_4n» Rnl} and V . chosen in the
ranges 2.78 to 3.0 JL, 3.2 to 3.6 A and -4.5 to -5.5 kcal/mole
respectively. The final values of the constants thus refined
were:
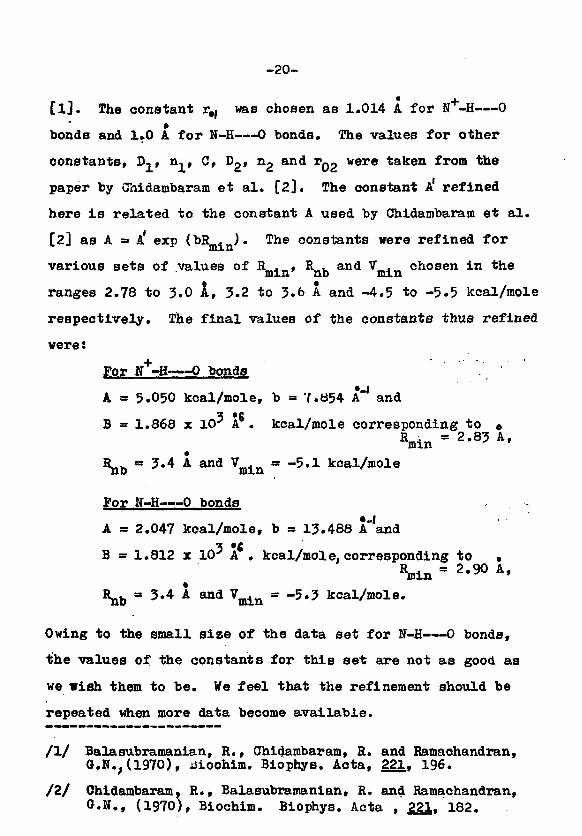
For N+-H 0 bonds -
A = 5.050 kcal/mole, b » Y.854 A"1 and
B = 1.868 x 10^ A . kcal/mole corresponding to «2' 8 5 A'
3.4 A and Vfflin = -5.1 kcal/mole
For N-H—0 bonds
A = 2.047 kcal/mole, b = 13.488 A"'and
B = 1.812 x 10⁻⁷ A . kcal/mole. corresponding toHj 2
3.4 A and Vfflin = -5 .3 kcal/mole.
Owing to the small size of the data set for N-H 0 bonds,
the values of the constants for this set are not as good as
we wish them to be. We feel that the refinement should be
repeated when more data become available.
/I/ Balasubramanian, R., Chidambaram, R. and Ramachandran,G.N.;(1970), iiiochim. Biophys, Acta, 221. 196.
/2/ Chidambaram, R., Balasubramanian, R. and Ramachandran,O.N., (1970), Biochim. Biophys. Acta , £21, 182.
-21-
/3/ Ramanadham, M. and Chidambaram, R.>(1976), To be published.
1.8 X-ray Studies of Peptides
IV.3. Yadava and V.H. Padmanabhan)
1» DL-Leucyl-glycyl-glyoine
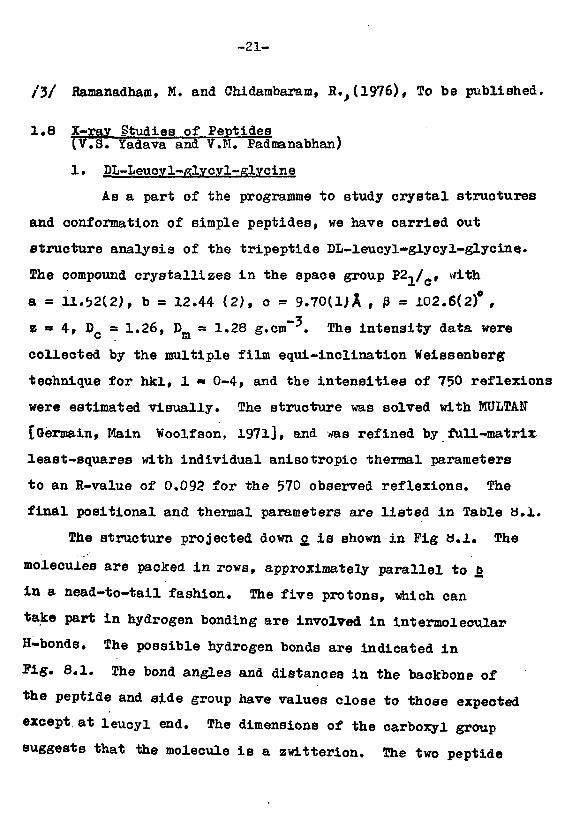
As a part of the programme to study crystal structures
and conformation of simple peptides, we have carried out
structure analysis of the tripeptide DL-leucyl~glyeyl-glycine..
The compound crystallizes in the space group P2,/ , with
a = ll.i>2(2), b = 12.44 (2), c - 9.7011}A , P = 102.6(2)° ,
z » 4, DQ = 1.26, D =s 1.28 g.cm~ . The intensity data were
collected by the multiple film equi-inclination Weissenberg
technique for hkl, 1 • 0-4, and the intensities of 750 reflexions
were estimated visually. The structure was solved with MULTAN
[Germain, Main Woolfson, 1971], and was refined by full-matrix
least-squares with individual anisotropic thermal parameters
to an R-value of 0.092 for the 570 observed reflexions. The
final positional and thermal parameters are listed in Table U.I.
The structure projected down £ is shown in Pig U.I. The
molecules are packed in rows, approximately parallel to b
in a nead-to-tail fashion. The five protons, which can
take part in hydrogen bonding are involved in intermolecular
H-bonds. The possible hydrogen bonds are indicated in
Pig. 8.1. The bond angles and distances in the backbone of
the peptide and side group have values close to those expected
except at leucyl end. The dimensions of the carboxyl group
suggests that the molecule is a zwitterion. The two peptide
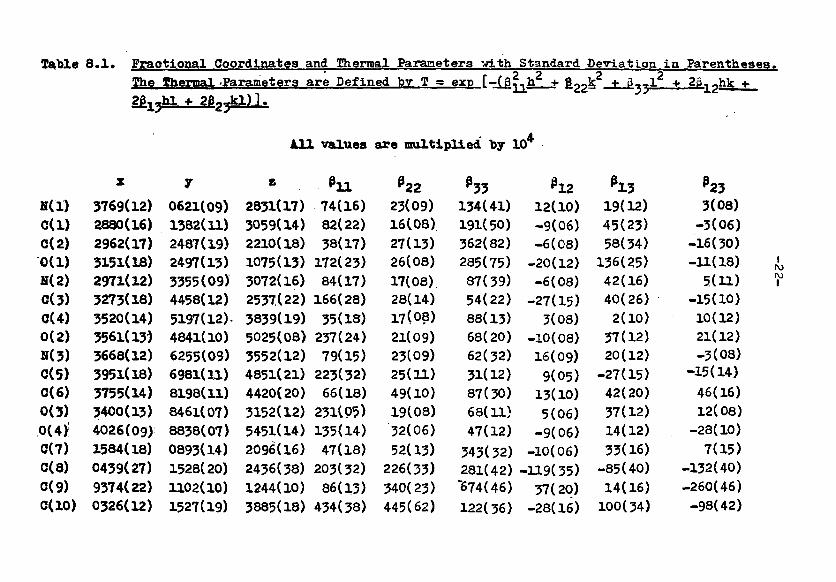
Table 8 .1 . Fractional Coordinates and Thermal Parameters with Standard Deviation in Parentheaea.The thermal-Parameters are Defined by T = exr> F—(3?..h + S^k + 3..-.1 •* 2p. ,.hk +•F—(3?..h +
All values are multiplied by 10*
22 33 hz P23N(i)0(1)0(2)0(1)H(2)0(3)0(4)0(2)N(3)0(5)0(6)0(3)0(4>0(7)0(8)0(9)0(10)
3769(12)2880(16)2962(17)3151(18)2971(12)3273(18)3520(14)3561(13)3668(12)3951(18)3755(14)3400(13)4026(09)1584(18)0439(27)9374(22)0326(12)
0621(09)1382(11)2487(19)2497(13)3355(09)4458(12)5197(12)-4841(10)6255(09)6981(10.)8198(11)8461(07)8838(07)0893(14)1528(20)1102(10)1527(19)
2831(17)3059(14)2210(18)1075(13)3072(16)2537(22)3839(19)5025(08)3552(12)4851(21)4420(20)3152(12)5451(14)2096(16)2436(38)1244(10)3885(18)
74(16)82(22)38(17)
172(23)84(17)
166(28)35(18)
237(24)79(15)
223(32)66(18)
231(95)135(14)47(18)
203(32)86(13)
434(38)
23(09)16(08)27(13)26(08)17(08).28(14)17(08)21(09)23(09)25(11)49(10)19(08)32(06)52(13)
226(33)340(23)445(62)
134(41)191(50)362(82)285(75)87(39)54(22)88(13)68(20)62(32)31(12)87(30)68(11)47(12)
343(32)281(42)"674(46)122(36)
12(10)-9(06)-6(08)
-20(12)-6(08)
-27(15)3(08)
-10(08)16(09)
9(05)13(10)5(06)
-9(06)-10(06)
-119(35)37(20)
-28(16)
19(12)45(23)58(34)
136(25)42(16)40(26)
2(10)37(12)20(12)
-27(15)42(20)37(12)14(12)33(16)
-85(40)14(16)
100(34)
3(08)-3(06)
-16(30)-11(18)
5(11)-15(10)10(12)21(12)-3(08)
-15(14)46(16)12(08)
-28(10)7(15)
-132(40)-260(46)-98(42)
Iro
- 23 -
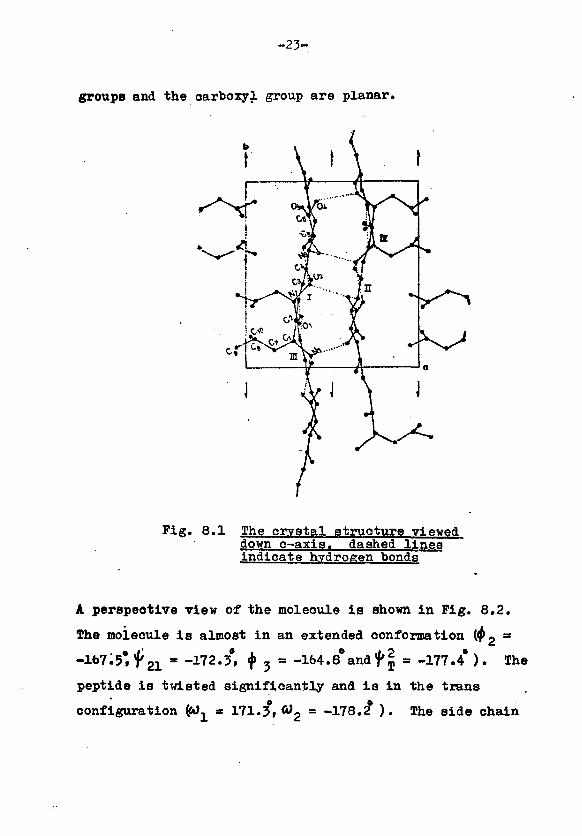
groups and the earboxyl group are planar.
Pig. 8.1 The crystal structure vieweddown c-^axisf dashed linesindicate hydrogen bonds
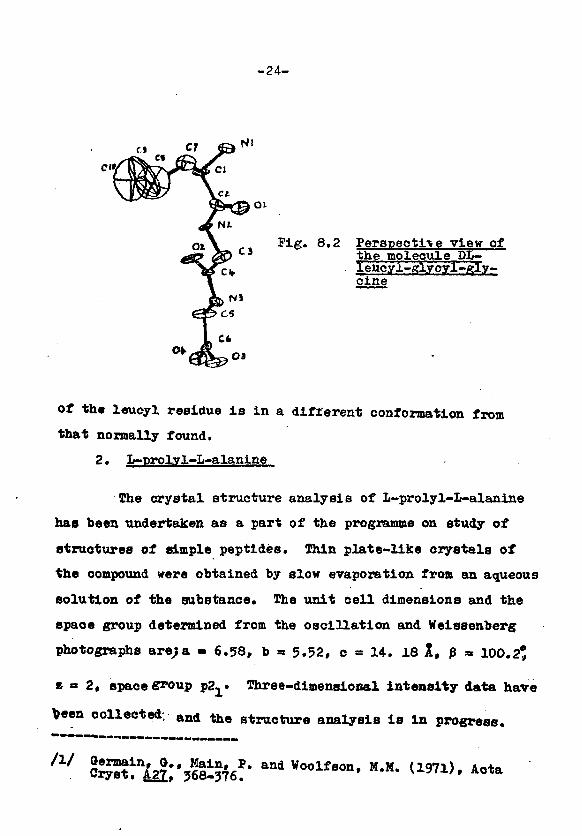
A perspective view of the molecule is shown in Fig. 8.2.
The moiecule i s almost in an extended conformation (^2 =
3° j 1 4 8 ° d ty\ 774*i21 - -172.3°, «j> 5 = -164.8°and ty\ = -177.4* ) . The
peptlde i s twisted significantly and i s in the trans
configuration (fO^ » 171.3»<y2
= ~ 1 ^ 8 ' 2 )• T n e s i d e
-24-
Fig. 8.2 Perspeotlte view ofthe molecule DL—
cine
of the leucyl residue is in a different conformation from
that normally found.
2. L-prolyl-L-alanine
The crystal structure analysis of L-prolyl-L-alanine
has been undertaken as a part of the programme on study of
structures of simple peptides. Thin plate-like crystals of
the oompound were obtained by slow evaporation from an aqueous
solution of the substance. The unit cell dimensions and the
spaoe group determined from the oscillation and Weissenberg
photographs are;a « 6.58, b = 5.52, c » 14. 18 X, p a 100.2*
» « 2, spaoe group p2^. Three-dimensional intensity data have
been collected, and ^ BtruCture analysis is in progress.
and W00lf80n' M*M-
-25-
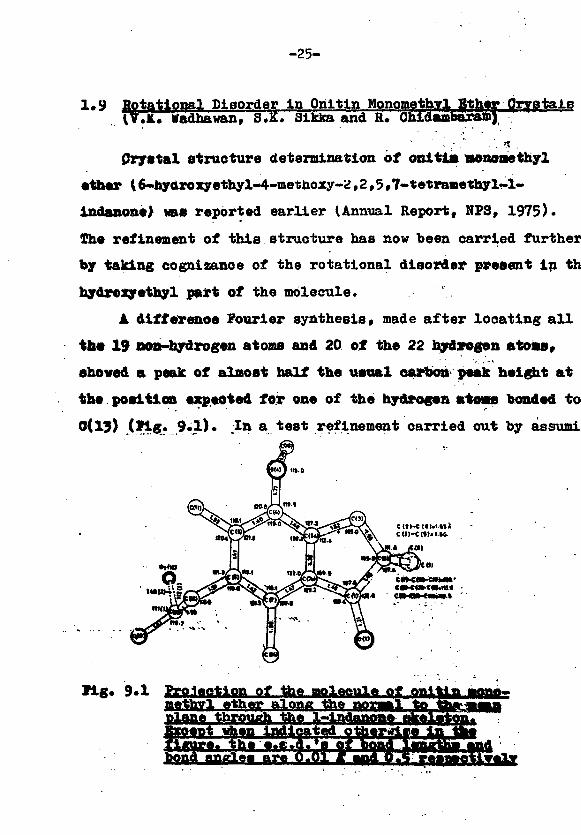
1«9 Botatio*p7 Biaprder In Onitln Monomethyl Ether q ylY.i. Wadhawan, 3.K. Sikka and R. Chidambaram),
Crystal structure determination of onltls vonoaethyl
ether I6-hydroxyethyl-4-methoxy-2,2,5,7-tetra»ethyl-l-
indanone> was reported earlier lAnnual Report, NFS, 1975).
The refinement of this structure has now been carried further
by taking cognizance of the rotational disorder present in th
hydrexyethyl part of the molecule.
X differenoe Fourier synthesis, made after locating all
th« 19 non>hydrogen atoms and 20 of the 22 hydarogen atoms,
shoved a peak of almost half the uaual cartoon peak height at
the position expeoted for one of the hydrogen atwts bonded to
0(19) (Flg_< 9*1)> In a test refinement carried out by assumi
* 9*1 Proiaction of the moleeula of onl
-26-
a oarbon atom of variable occupancy at this position,, the R
factor fell from 0.093 to 0.081 and the carbon atom refined
to a position 1.28 A away from C(i3), and with an occupancy
faotor 0.47. However, the presence of a methyl group at this
position, with an occupancy of about one-half, was ruled out
on the basis of NMR and mass spectroscoplc data and from
crystallographlc considerations. Rotational disorder about
the C(12)-C(13) single bond was therefore postulated.
In the proposed model, the OH group is randomly distributed
over the sites marked 0. (13) and 02(l3) in Fig. 9.1. The
model was first checked by carrying out an unconstrained
refinement, allowing independent variation of 0,(13) and 02(l3)
occupancy factors. A constrained refinement was then carried
out: 0,(13) and 0^(13) were assigned variable occupancy factors
x and (l-x). Also, two hydrogen atoms, with occupancy factors
(l-x) and x were kept fixed at points corresponding to C-H
bond lengths of 1 A each and lying on the lines joining 0(13)
to 01(l3) and 0^(13) respectively. The third hydrogen atom
bonded to 0(13) was assigned full occupancy and variable
positional parameters. As a result of this refinement, the R
factor for 1266 observed reflections fell from 0.093 to 0.075-
The occupancy factors for 0^13) and 02(l3) refined to 0.800(1?
and 0.200(12). The calculated bond lengths and angles are
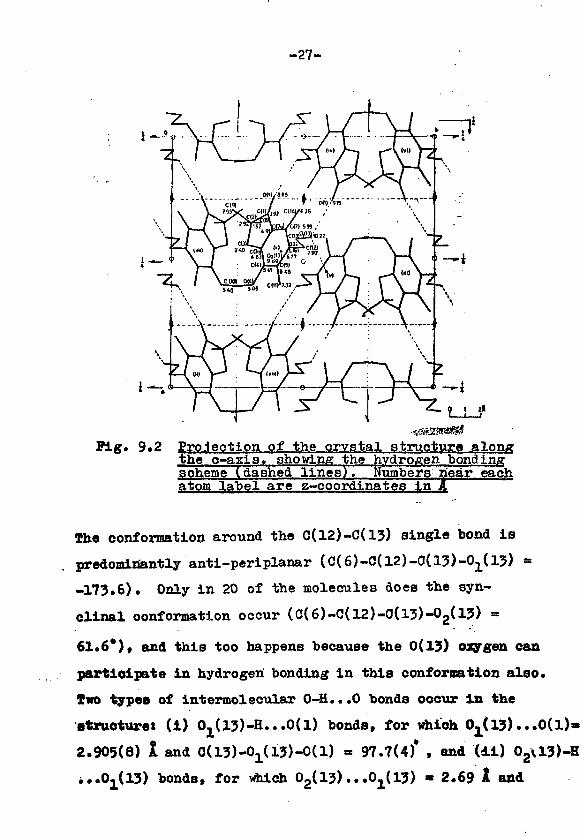
indicated in Pig. 9.1, and Fig. 9.2 gives a view of the
crystal structure along the c-axis [l].
-27-
Pig. 9.2 Projection of the crystal structure alongihe c-axia* showing the hydrogen bondingscheme (dashed lines). Numbers near eaoliatom label are z-coordinates in ^
The conformation around the 0(12)-C(13) single bond is
predominantly anti-periplanar (C(6)-C(12)-0(l3)-O1(l3) =
-173.6). Only in 20 of the molecules does the syn-
clinal conformation occur (C(6)-0(12)-0(l3)-O2(l3) =
61.6*)t and this too happens because the 0(13) oxygen can
participate in hydrogen bonding in this conformation also.
Two types of intermolecular 0-H...0 bonds occur in the
structuret (i) 0^13)-^...0(1) bonds, for which 0^13) ...0(l)»
2.905(8) 1 and 0(13)-0^13)-0(1) = 97.7(4)* , and (4i) O2\13)-H
bonds, for which 02(13) ...0^13) » 2.69 A and
-28-
C(15)-O2(13)-O1(13) = 120.7(7) . The possibility of formation
of the second type of hydrogen bond is the reason why the OH
group is statistically distributed over two sites. An energy
calculation, performed by including the contributions of non-
bonded interaction and the bent 0-H...0 bond interaction,
clearly shows a potential energy minimum at the 00(13) site.
If the oxygen atom urs at Op(l3) with a probability
x(=0.20), the probability of forming the 02(l3)-H. ..0^13)
bond will be between x and v(l-x), that is, between 0.20
and 0.16, depending on the elations between the occupancies
of 0p(l3) and 0^(13) in neighbouring molecules.
/I/ Wadhawan, V.K. (1976). Ph.D. Thesis, University ofBombay, Bombay.
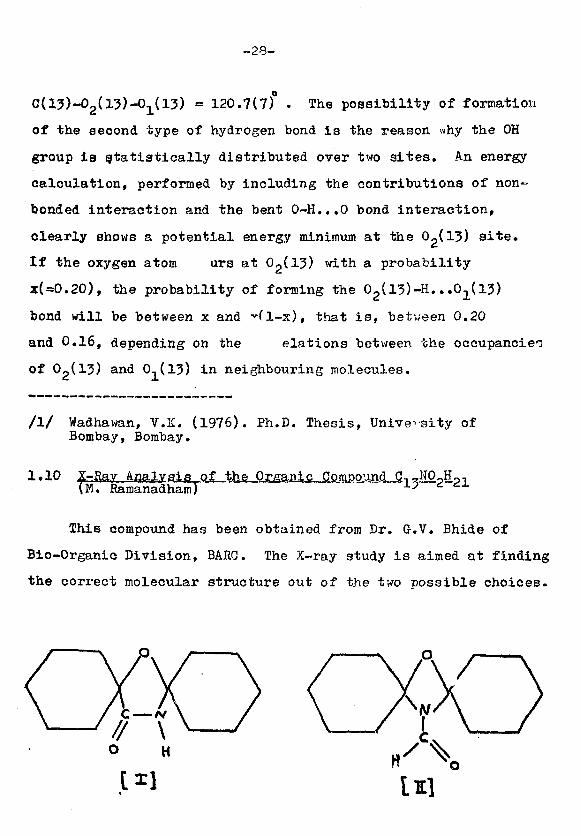
1 • 1° X-Rav Analysis of the Organic.. qompo-jnd C1JK3UBU.,(M. HamanadhamT i-5 d dX
This compound has been obtained from Dr. G.V. Bhide of
Bio-Organic Division, BARC. The X-ray study is aimed at finding
the correct molecular structure out of the two possible choices.
-29-
Orystals were grown by slow evaporation from a solution
of the compound in dioxan. They were like long needleB in
shape. The dimensions of the sample chosen were 0.1 x 0.2
x 1 mm. The crystals belong to the triclinic system (space
group PI or Pi). The unit-cell dimensions, determined with
the help of oscillation, zero-layer Weissenberg and precession
photographs, are: a = 11.40, b = 10.14, c = 6.02 1, o = 91* ,
P - 113 and y = 96* . The c-axis of the unit cell coinoides
with the needle axis of the crystals. X-Ray intensity data
were collected by the multiple-film Weissenberg method for 1
values of 0, 1, 2 and 3. Analysis of the data and further work
is in progress.
-30-
2- SOLID STATE PHKNOKENA
2.1 Some Studios on a-M Transformation in Ti and Zr fryElectrical Restivity Method at HjUsii Pressures(Y.K. Vohra, S.K. Sikka und*H. ChLOambaram)
The IV group hop metala Ti and Zr n.re known to undergo a
phase transition [Jamieson, 1963J to the to—phase (simple hexa-
gonal, typical of AlBg compounds). The pressure at which a-u)
transition takes place (l*a-w ) *lf*s been studied by various
authors. The valuesfor Ti ran^o from 20-80 kbars and for
Zr from 22 to 60 kbars. This scatter in Pa_w may be due to
difference in loading conditions, decree of the hydrostatic
nature of the applied stress, purity and defect structure of
the samples studied. Some of the above effects on P w were
studied.
For high pressure resistivity mrasurements in the range
0-100 kbars, the experimental setup of Dr. S.N. Vaidya
(Chemistry Division, BARO) was used. This is a two probe
Bridgman opposed anvil type of assembly. In all resistivity
runs, the pressure was varied in small steps with soaking for
a fixed time at each pressure. Bismuth phase transitions
(I-II), (II-IT.I) and (V-VC) wore used for pressure calibration.
After each resistivity run, il-ray powder pattern of the
quenched sample was taken to confirm the presence (or absence)
of the CO -phase. For Ti, we have done measurementa on 4 sam-
ple types listed in Table 1.1 Typical resistance vs pressure
curves for different samples are plotted in Fi-% 1.1.
-31-
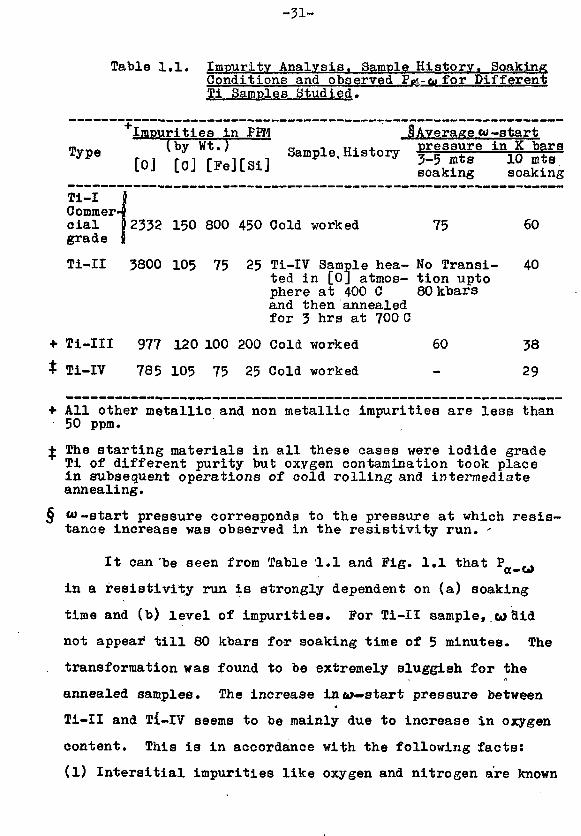
Table 1.1. Impurity Analysis. Sample History. SoakingConditions and observed Pg<-<nfor DifferentTi Samples Studied.
"''Impurities in PPM 5 Average en-startType CbTwtTJ Sample. History pressure in K bars
™ [o] [o] weal] * « • £ JSJJ^Ti-ICommer-cial 0 2332 150 800 450 Gold worked 75 60grade }
Ti-II 3800 105 75 25 Ti-IV Sample hea- No Transi- 40ted in [0] atmos- tion uptophere at 400 C 80 kbarsand then annealedfor 3 hrs at 700 0
+ Ti-III 977 120 100 200 Cold worked 60 38
t Ti-IV 785 105 75 25 Cold worked - 29
+ All other metallic and non metallic impurities are less than50 ppm.
£ The starting materials in all these cases were iodide gradeTi of different purity but oxygen contamination took placein subsequent operations of cold rolling and intermediateannealing.
§ a)-start pressure corresponds to the pressure at which resis-tance increase was observed in the resistivity run. '
It can "be seen from Table 1.1 and Fig. 1.1 that P a_ w
in a resistivity run is strongly dependent on (a) soaking
time and (b) level of impurities. For Ti-II sample,,o>Sid
not appear till 80 kbars for soaking time of 5 minutes. The
transformation was found to be extremely sluggish for the
annealed samples. The increase in o>—start pressure between
Ti-II and Ti-IV seems to be mainly due to increase in oxygen
content. This is in accordance with the following facts:
(l) Intersitial impurities like oxygen and nitrogen are known
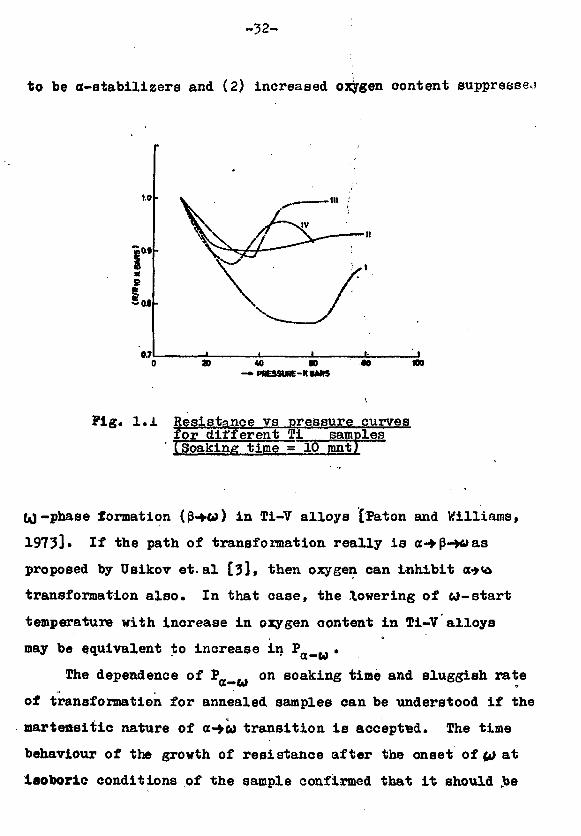
-32 -
to be oc-stablllzers and (2) Increased oxygen content suppresses
to
at
L0.7
III :
40 m• PSESSWE-KMIW
Pig. 1.1 Resistance vs pressure curvesfor different Tl samplestSoaking time = 10
to-phase formation (P-+6>) In Ti-V alloys [Paton and Williams,
1973]* If the path of transformation really Is a-»p-*>as
proposed by Usikov et.al [33, then oxygen can Inhibit a->«o
transformation also. In that case, the lowering of CJ-start
temperature with increase in oxygen content in Ti-V alloys
may be equivalent to increase in Pa_M •
The dependence of £„..., on soaking time and sluggish rate
of transformation for annealed samples can be understood if the
martensitic nature of <x-»eo transition is accepted. The time
behaviour of the growth of resistance after the onset of it) at
isoboric conditions of the sample confirmed that it should .be
-33-
of isothermal martensitic variety. The grain boundaries and
defects in the sample may provide their locked in energy to
assist the nuclei formation and therefore the transformation
rate (which depends only on the nucleation rate for isother-
mal martensites) ' will be more for cold worked samples (lower)
grain sizes and higher dislocation density).
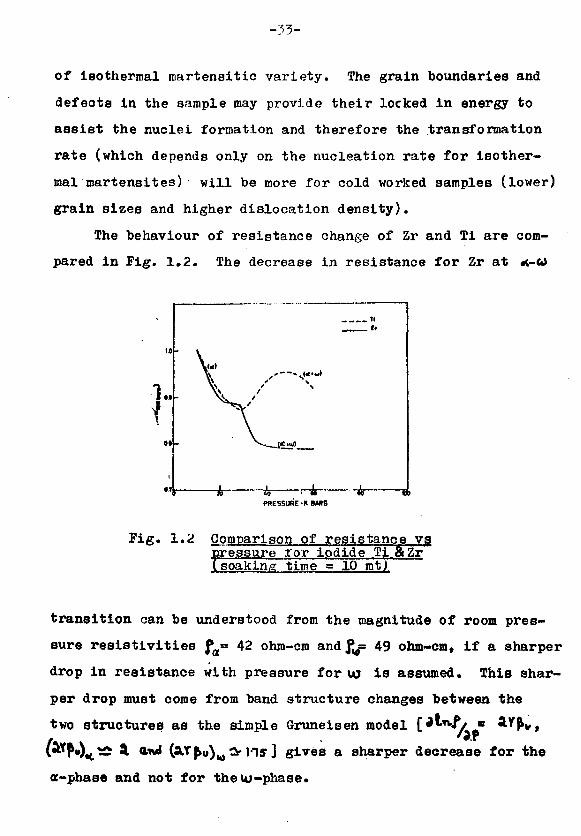
The behaviour of resistance change of Zr and Ti are com-
pared in Fig. 1.2. The decrease in resistance for Zr at «c-o>
1..f
01
1
07
• v
-
X
tt
«0 ' U W KPRESSURE-KIMS
Fig. 1.2 Comparison of resistance vsassure tor iodide Ti &Zr
\soaking time = 10 mt)Si
transition can be understood from the magnitude of room pres-
sure resistivities fa= 42 ohm-cm andf^ 49 ohm-cm, if a sharper
drop in resistance with pressure for \a is assumed. This shar-
per drop must come from band structure changes between the
two structures as the simple Gruneisen model [Jwv/y s AY^y,
v^NXc.^ * awJ (*•*£«»)« * I "JS 3 gives a sharper decrease for the
a-phase and not for the iu-phase.
-54-
J\/ Jamtoson J.O., Science 142 (1965) 72.
/2/ Paton N.B., and Williams J.O., Scripta Metallur^ica 2(1973) 647.
hi Usikov M.P. and Zil'bershtein V.A., Phys. atat. Sol.19a (1973) 53.
2«2 Awanented Pj.ano Wave Program for Bleotronlo StructureCalculations of Motalg, and Alloys(Y.K. Vohroj
Many BOlid state phase transformations in metals and
alloys are electronically driven. In theae cases tho ohanges
in the electronic structure at and near the orltical point
are important in understanding the dynamics and kinetics of
transformations. Of particular interest are the polymorphous
transformations observed in transition metals and their alloys
with temperature and pressure. APW method has been found
suitable for band structure calculations involving transition
metals.
A non-relativistio APW program has been developed for
band structure calculation applicable to the case of different
types of atoms in the unit cell. Starting from SCF atomic
wave functions for free atoms, approximate crystal coulomb
potentials and charge densities around various inequivalent
lattice sites are constructed. This is done by expanding the
neutral coulomb potentials and charge densities of neighbour-
ing atoms about the origin using Lowdin's alpha function expan-
sion and retaining only the spherically symmetrio terms in the
expansions. Full Slater's exchange potential (oc=l) proportion-
al to oube root of the superimposed atomic charge densities
is also included [L.P. Mattheiss, 1964]. The potentials
-35-
obtained for various sites are suitably averaged Lti between
the APW spheres. The "Huffin-Tin" potential is constructed
by subtracting the nvera;je potential from the total poten-
tial. With this form of Mul'i'in Tin potential the lo^rithimic
derivatives of the radial wave functions at the APW sphere
boundaries are obtained by numerical integration of radial
part of the Schrbdinger equation. The basis set of recipro-
cal lattice vectors is chosen depending on the k-point in the
Brillouin Zone. Finally APW matrix elements are constructed
and determinant examined for energy eigen values.
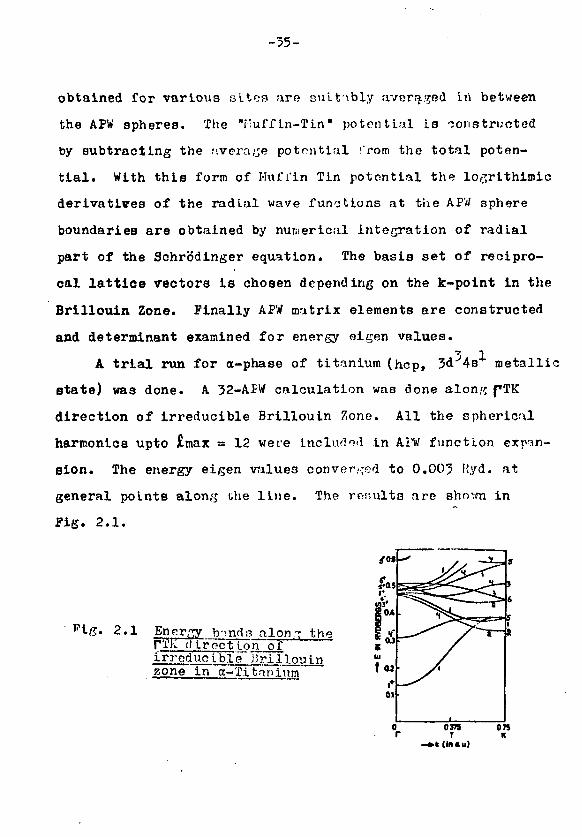
A trial run for o-phase of titanium (hep, 3d')4s* metallic
state) was done. A 32-APW calculation was done along pTK
direction of irreducible Brillouin Zone. All the spherical
harmonics upto Jtmax = 12 were incliuiod in APW function expan-
sion. The energy eigen values converged to 0.003 Kyd. at
general points along the line. The ronulta are shown in
Fig. 2.1.
got
Fig. 2.1 Energy b-?nd« alon-r ther*TK tiTfectton ofirrcdixcible J3rilloujnzone in g - - ' f . i t i
-.56-
Calculation along thLa dLrection agrees with the pub-
lished results (L.F. Matthelss, 1964 and 0. Jepeen et al,1975
Whatever differences are there they are due to relativistic
effects and lack of nelf consistency ns the results (parti-
cularly d bands) are sensitive to the choice of starting
atomic potentials.
/I/ Mattheisa L.F. (1964), Phys. Hev. JL25, A1599, 124, A97O.
/2/ Jepaen 0., *ndereon O.K. and Mackintosh A.R. (1975)»Phys. Rav. 12B, 3084.
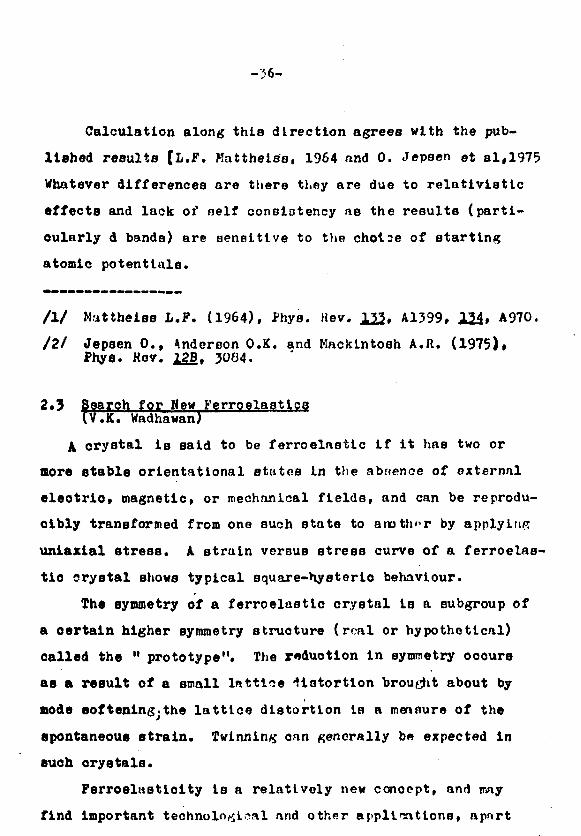
2.5 Search for Hew Ferroelastlcs(v.K. Wadhawan)
A crystal 1 B said to be ferroelastlc if it has two or
more stable orientatlonal states in the abnence of external
eleotrio, magnetic, or mechanical fields, and can be reprodu-
oibly transformed from one such state to another by applying
uniaxlal stress. A strain versus stress curve of a ferroelns-
tlo srystal shows typical square-Hysteric behaviour.
The symmetry of a ferroelastlc crystal is a subgroup of
a certain higher symmetry structure (real or hypothetical)
called the " prototype". The reduction in symmetry occurs
as a result of a small lattice distortion brought about by
node softening^the lattice distortion Is a menmire of the
spontaneous strain. Twinning can generally be expected in
such crystals.
FerroelnstLolty is a relatively new concept, and may
find Important technological and other applications, apnrt
-37-
from leading to a better understanding of an important claat
of phase transitions. Results of our efforts at identifying
new ferroelastio materials are summarized Below,
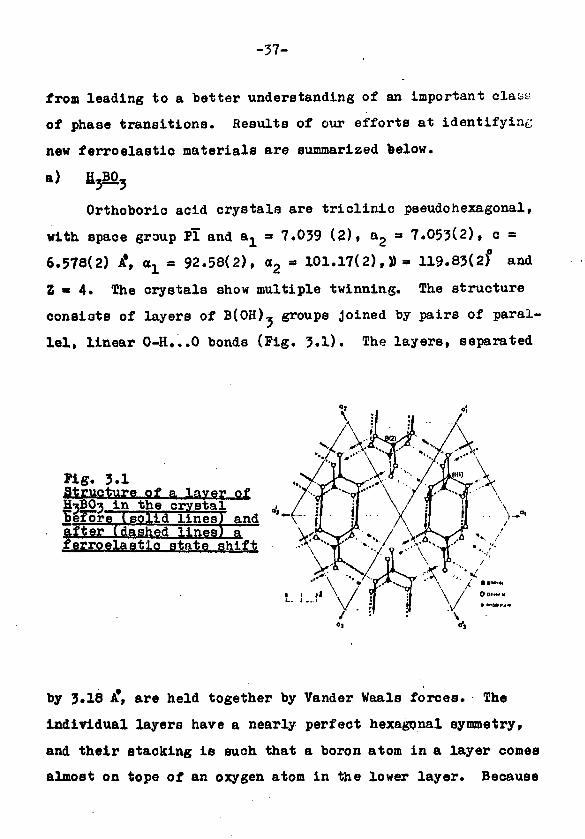
a) % B 0 5
Orthoborio acid crystals are triclinic pseudohexagonal,
with space group PI and a1 = 7.039 (2), a2 = 7.053(2), c =
6.578(2) A*, o^ • 92.58(2), oc2 - 101.17(2),»» 119.83(2)° and
Z • 4. The crystals show multiple twinning. The structure
consists of layers of B(OH), groups joined by pairs of paral-
lel, linear 0-H...0 bonds (Fig. 3.1). The layers, separated
Pig. 3.1Structure of a-lax_er_of
t in the crystalbefore Tsolid lines^after (dashed lines
and
ferroelastio state shifif
'>-••
by 3*18 A*, are held together by Vander Waals forces. The
individual layers have a nearly perfect hexagonal symmetry,
and their stacking is such that a boron atom in a layer comes
almost on tope of an oxygen atom in the lower layer. Because
-38-
ot the hexagonal symmetry of the layers, this can be done in
12 equivalent ways. In actual ordered crystals, two of thesc<
ways are utilized alternately in successive layers.
Analysis of the atomic coordinates obtained from a neu-
tron diffraction on D,BO- shows that for any atom at a point
Xjt y^, z,t in the crystal, another atom of the same kind can
be found at x,» yp» z? s u c n t^a*
X2» y 2 ' Z2 * *xl ~ yl' xl* zl) + - ^
where A t which plays the role of an order parameter, has the
following values:
0.74^A<0.77 A for B atoms, 0.72 4 A 4 0.79 A for 0
atoms, and 0.72 A < 0.82 A for D atoms.
(Alternative pseudosymmetry relations are: (l) x2, y2,
Z2 " (xl~yl» xl» * " zl) + 4 } ^ii^ X2* y 2 ' Z2 * ^ yl' yl " xl'
Bj ) + g » and (iii) x2, y2, z2 = (ylt yx - Xj , -i - Zx) + A ).
Pig. 3.1 shows the effeot of applying Eq.(l) to a single
layer (at z = 1/4). The arrows indicate the displacement A•
For an adjustment layer (at z =-l/4 or 3/4), the displacement
is by the same amount (•• 0.75 A) but in the opposite direction.
Thus, shear stress, applied approximately along the [21o]
direction, is expected to reorient the-unit cell so that the
new a£, al» ai axes are along the old a,, a, and a2 directions
respectively (Pig. 3.1). This results in a change of the
twinning pattern, and was verified by direct observation with
a polarizing microscope. Inhomogeneous stress was applied on
a thin a^a^-plate of the crystal by pressing it with a needle.
Perroelastio domain walls could be created, moved or even made
-39-
• -• disappear by a light touch of the pin.
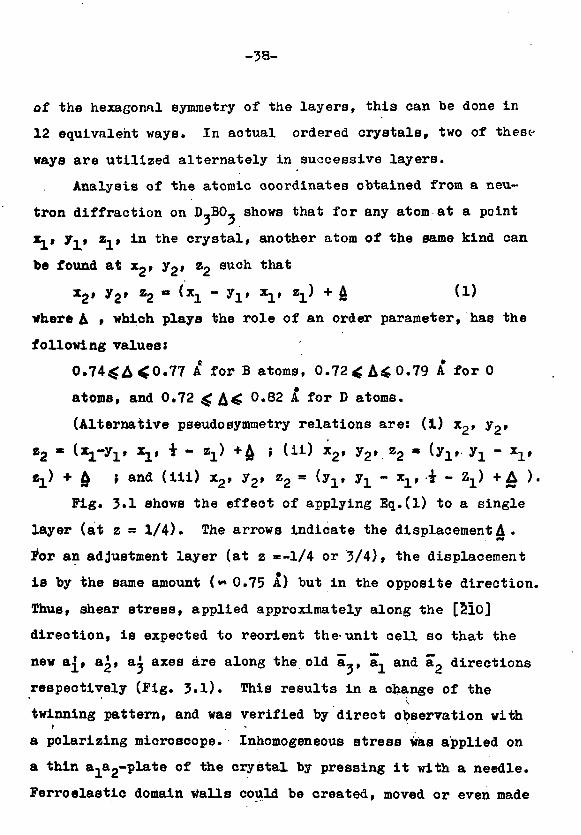
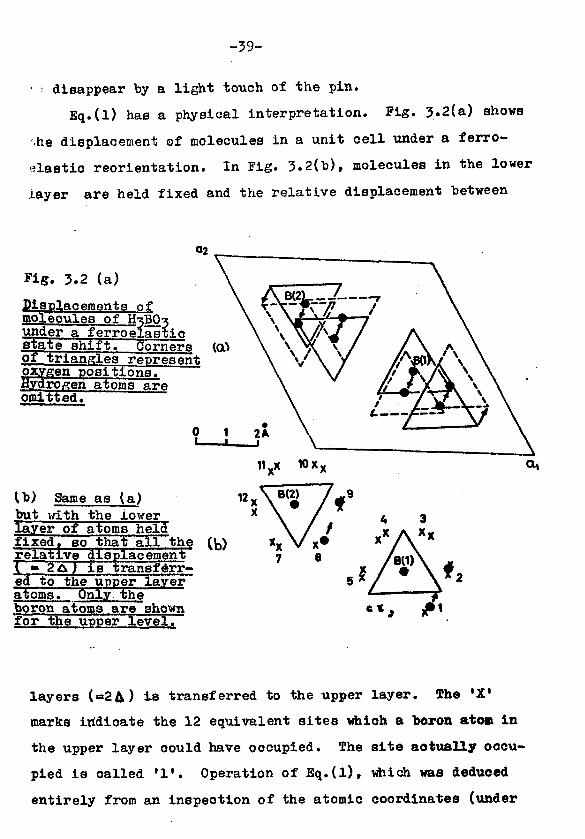
Eq.(l) has a physical interpretation. Fig. 3.2(a) shows
-.he displacement of molecules in a unit cell under a ferro-
slastio reorientation. In Fig. 3.2(b), molecules in the lower
layer are held fixed and the relative displacement between
Fig. 3.2 (a)
Displacements ofmolecules of H^B^under a ferroelasticstate shift. Cornersof triangles representoxygen positions.Hydrogen atoms areomitted*
Same as (a)but with the lowerlayer of atoms heldfixed, so that all~therelative displacement( • 2AT"la transferr-ed to the upper layeratoms. Only theboron atoms are shownfor the upper level.
layers (=>2&) is transferred to the upper layer. The 'X'
marks iridicate the 12 equivalent sites which a boron atom in
the upper layer could have occupied. The site actually occu-
pied is called '1*. Operation of Eq.(l), which was deduced
entirely from an inspection of the atomic coordinates (under
-40-
the requirement of minimum atomic displacements), takes the
boron atoms from one of the equivalent sites (marked '1') to
another (marked '2'). An alternative pseudosymmetry operation
corresponds to going from site 1 to site 6.
b) Ba01£.2H20
This crystal is monoclinic pseudoorthorhombic with space
Agroup V^/n and a = 6.738, b = 10.86, c = 7.136 A and 0 =?
90* 57 *. Pair s of atoms of the same kind in this structure
can be related by the following equation:
X2» V2 f Z2~ ( xl' * + yl' "*1* + &
where 0.26^^^1.02 1. This corresponds to a space group
Ponb for the prototype. Shear stress applied either along
[100] or along [001] should therefore result in an interchange
of a- and o-axes. The resultant change of the twinning pat-
tern and the appearance and disappearance of domains was con-
firmed by observations on thin ac-plates of the crystal under
a polarizing microscope.
Like H.B0-, this crystal also has a layer structure.
However t, there is also a significant interlayer interact:) -n
between Ba and 01 ions, the distance between these ions
being 3.32A*. Moreover, during a ferroelastic state-shift,
the atoms involved In Ba... 01 and H...C1 interactions between
layers get ohanged. For these reasons, the coercive stress
for this orystal is considerably higher than that for H,BO_.
-41-
2.4 Opacity Calculations and Saha's Equation for Htffr ZElements(B.K. Oodwal and S.K. Sikka)
In high Z elements, for temperature in the kev range,
the dominant mechanism of energy transport is by radiation
through (i) bound-bound (ii) bound-free (iii) free-free and
(iv) scattering processes. In computation of the cross-sec-
tions (opacities) for these processes a complete knowledge1 of
the (i) free electron density (i.i) populations of the various
ionic species and (iii) populations of the various energy
states for a given ion for a given temperature and density of
the plasma is required. For elements of astrophysical inter-
eBt (e.g. upto Fe), Saha's ionization equation is used [Rouse,
1971]. We have extended these calculations for high Z elements
as these have been suggested as tamper materials .in laser
induced fusion schemes. Calculations have been done for two
elements (<v/ (Z = 74,f#=19.2 gm/cc) and U (Z = 92, ^=18.9 gm/cc).
The form of the Saha's equation used is that of House [lj
OSCP modified formula
Nfi = free electrons/cc., C = N./N = concentration of .ion i,
Ni 3 No p e r c*c# o f i o n i a m 1 IJ' t o t a l nura er of free p-irticles/
c.c. » Ne + N1 and HQ = % N^, G - Ne/W. l± ionization poten-
tial of ion i, Ui= electronic partition function of ion i, D=
screening radius, (»)= Pressure ionization terms. The ioni-
zation potentials were evaluated using the Bohr's formula
-42-
I 9 I
(I. 3 RZi / n£, where Z^ - screened charge and |f, principal
quantum number). The screened charges were determined from
the screening constants given by Burns [1964]. It has been
estimated by Kastner that I.Aso evaluated are quite accurate
(error for W 3? ) for high Z elements except for a few loni-
zation potentials. These do not affect the calculations as
the pressure ionization term takes care of these. The ground
state degeneracies were computed using the Hund's rule.
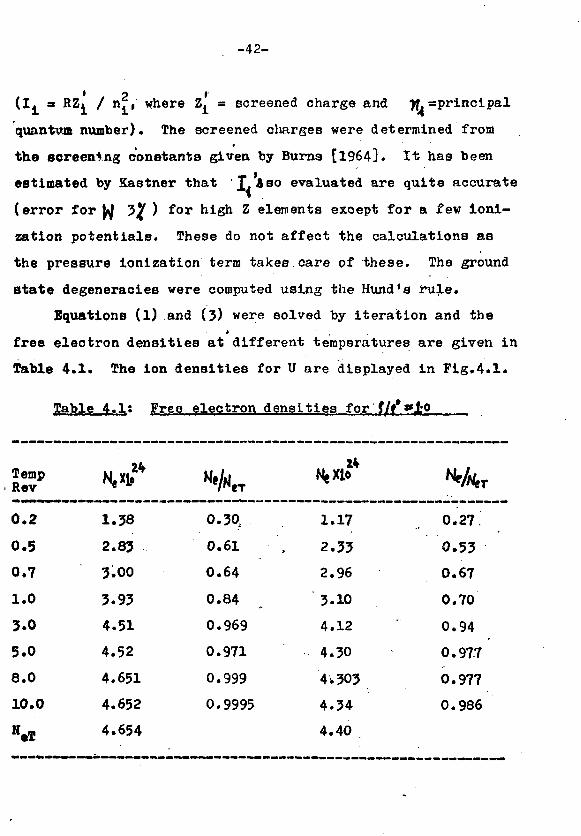
Equations (1) and (3) were solved by iteration and the
free electron densities at different temperatures are given in
Table 4.1. The ion densities for U are displayed in Fig.4.1.
Table 4.1; Free electron densities for f/f*«*l-o
TempRev
0 . 2
0.5
0 .7
1.0
3.0
5.0
8.0
10.0
1.38
2.833.00
3.93
4.51
4.52
4.651
4.652
4.654
0.30,
0.61
0.64
0.84
0.969
0.971
0.999
0.9995
1.17
2.33
2.96
3-10
4.12
4.30
4.303
4.34
4.40
* / « ,
0.27.
0.53
0.67
0.70
0.94
0.977
0.977
0.986
-43-
Theae show that for U, even at 10 kev, the k-ehell is substan-
tially intact and for W it is almost ionised. The ratio Ifc/lT
where I. is the ionization potential at the peak & at a given T
varies from 5 to 2.7 compared to the value 2.8 expected from
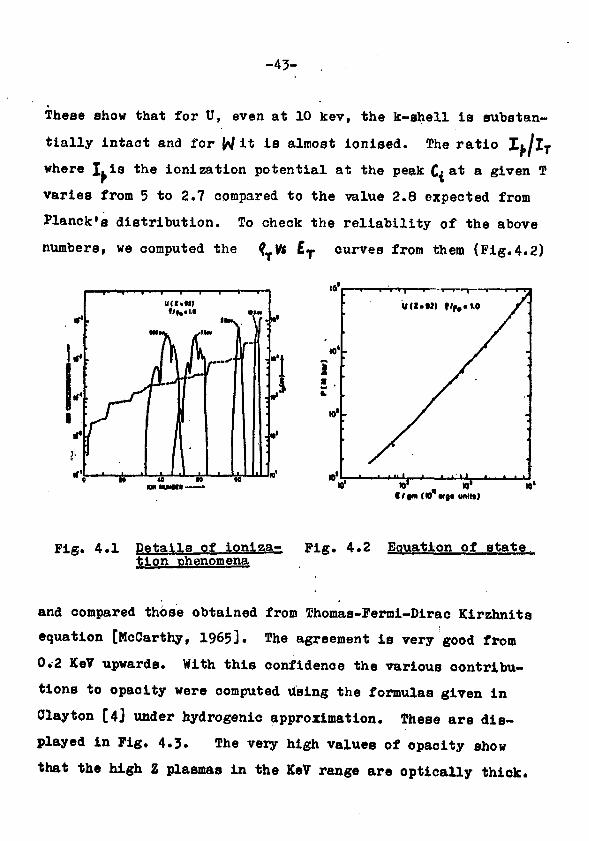
Planck's distribution. To check the reliability of the above
numbers, we computed the £ T curves from them (Fig.4.2)
Pig. 4.1 Details of lonlza- Pig. 4.2 Equation of statetlon phenomena
and compared those obtained from Thomas-Fermi-Dirac Kirzhnits
equation [McCarthy, 19653. The agreement is very good from
0.2 KeV upwards. With this confidence the various contribu-
tions to opacity were computed Using the formulas given in
Clayton [4] under hydrogenlc approximation. These are dis-
played In Pig. 4.3. The very high values of opacity show
that the high Z plasmas in the KeV range are optically thick.
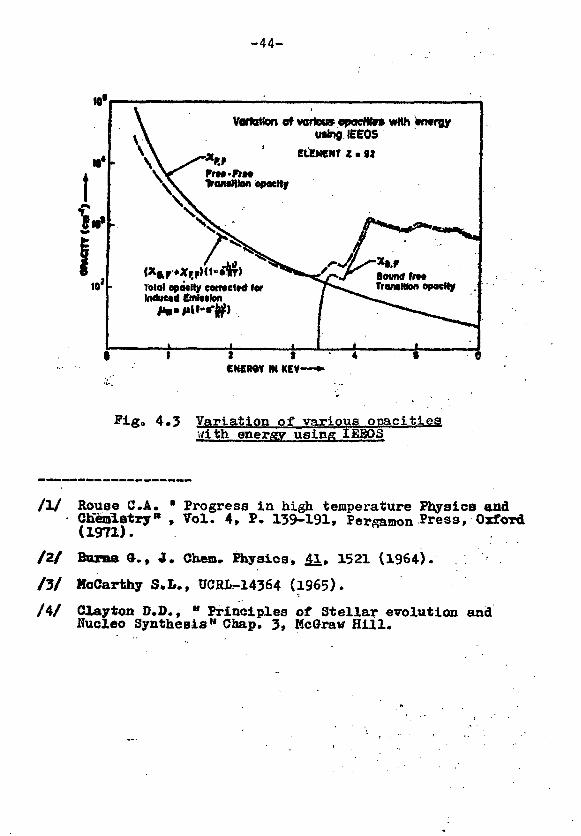
- 4 4 -
10'
Variation of variousing IEEOS
E&MEMT Z . 92
bntrgy
Bountf frt*TraMWon opacityToiat opacity eemclttf (or
I t f l e C
t 3CHCRdV IN KCV
4*3 Variation of various opacitieswith energy using IES03
/I/ Rouse C.A. " Progress in high temperature Physics andChemistry1* , Vol. 4, P. 139-191, Pereamon Press, Oxford(1971).
/2/ Boras «., 4, Chem. Physics, 1, 1521 (1964). .
/3/ McCarthy S,L.r UCR1-14364 (1965).
/4/ Clayton D.D., - Principles of Stellar evolution andNucleo Synthesis" Chap. 3, HcGrav Hill.
-45-
3. ACTIVITIES OF KJRNIMA QROPP
3.1 PPRHIMA lit A BeO Reflected 0 ^ Uranvl jfltrateSolution Experiment-Status ReportIK. Chandramoleehwar, H. Srinivaean, V.R. Nargundkar,C.S. Pasupathy and P.K. Job)'*'
Purnima reaotor is currently undergoing modifications
<;o make it a more flexible general purpose facility. The
oore and reflector assemblies are being fabricated in the
form of easily replaceable modules. The control system Is
being modified suitably to meet the requirements of * thermal
homogeneous solution reaotor. The first critical experiment
to be carried out with the new setup Is a BeO reflected*
V ** uranyl nitrate solution system.
The fiasile fuel solution is contained in a cylindrical
oore vessel and is surrounded by a 30 om thick BeO reflector
forming an approximate 80 om side parallelopiped assembly.
Gravity drop of a large BeO block from immediately outside
the oore and out of the reactor assembly constitutes the
prinoipal safety shutdown mechanism in this reaotor. k pair
of •black1 boral neutron absorber plates operating between
the core and reflector serve as back-up safety devioes. For
normal shutdown the fissile fuel solution is drained out of
the core vessel into a storage tank kept in a glove box at
* lower level. One of the design goals of this reaotor was
+ In collaboration with Reaotor Control Division and FuelReprooessing Division
-46-
to minimise the critical mass to the extent possible subjeot
to limitations posed by praotioal, operational and safety
considerations. The expected critical mass for the system
iS*»400 gm of U 2 " . The main characteristics of the reactor
are summarised in Table 1.1.
Table 1.1: Main Characteristics of PURNIMA II Reactor
Fuel
Concentration
Critical Mass
Core Volume
Core Vessel
Refleotor
Safety
Control
Shutdown
Fuel Transfer
Fuel Handling andChemical Operations
s u 2 5 5 TJranyl Nitrate Solution
t 80 - 130 g/0.
j 400 + 50 gm of TJ255
: 4 - 5 litres
: 14 cm(nominal) dia 45 cmheight zircaloy cylinder
: ^30 cm thick BeO stacked inmodular reflector boxes
: a) Gravity drop of BeO refleo-tor block out of assembly
b) Gravity drop of Boral SafetyPlates into assembly
i Two S3 absorber blades
: Drainout of fuel solution fromcore vessel
: Peristaltic pump
: Inside glove boxes connectedto the core vessel
It has been demonstrated that in homogeneous solution
reactors radiolytio gas bubbles oreated by the fission frag-
ments interacting direotly with the water, contribute signi-
fioantly to void production during a power transient. In
fact this shutdown mechanism is so reliable that a number of
-47-
pulsed solution reactors hare be«n and are being operated
successfully based on this principle for various research pur-
poses. The only safety question that has to be considered in
the design of such reactors is the dynamic leading that would
be felt by th« core Teasel walla oa *ceo*at of the "inertial
pressure pulse" produced in case of a fast power transient
(Section 3.3). She core vessel has to be designed to with-
stand this pressure pulse.
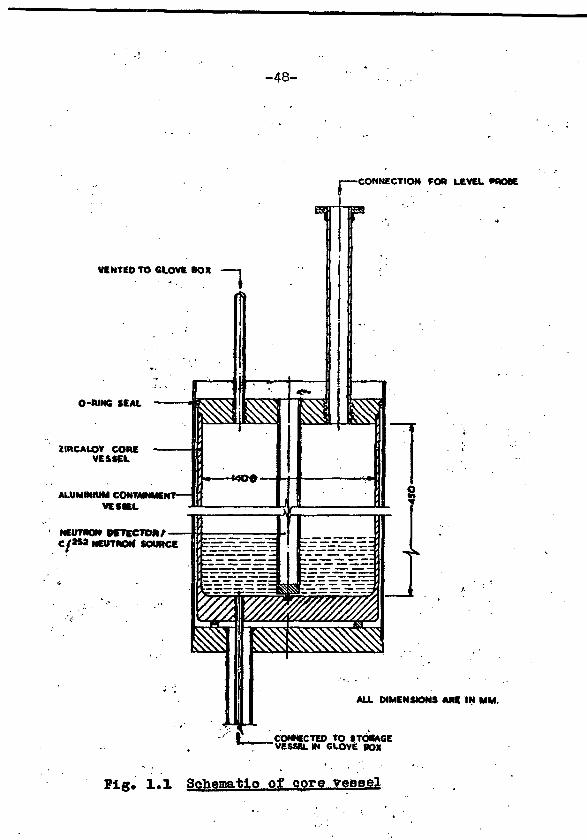
Fig. 1.1 gives a schematic sectional view of the core
vessel assembly. The cylindrical cor* vessel Material has
been chosen to be zircaloy in view of its good chemical com-
patibility with uranyl nitrate solution. Reactivity worth
calculations (section 3.2) show that the penalty in terms of
fissile inventory is minimum for zircaloy. The-44 oa dia-
meter seamless core vessel is surrounded by an outer aluminium
jacket serving as secondary containment to preclude spread of
contamination in the event of development of core vessel
cracks, weld failure etc. A central tube also of sircaloy
1.7 cm in diameter 45 cm high and closed at the bottom has
been provided to accommodate a small neutron soitree needle or
an inoore neutron detector. A bottom penetration in the core
vessel has been provided so that the entire fissile solution
can be drained out under gravity with negligible feold-ttp into
the storage tank located in the glove box. A tube attached
to the top of the core vessel is in communication with the
glove box atmosphere and helps equal!** y m a r M . Th« solu-
tion height is controlled using a weir box. A level monitoring
-48-
VENTED TO CLOVE BOX
O-MN6 SEAL
ZIRCALOY COREVESSEL
ALUMINIUM CONTMNMCNT—VESKL
NEUTNQM PSTCC1
CONNECTtOM FOR LEVEL TOOBE
C^»» NEUTRON' SOURCE j t = ^ " H i ~ §
ALL DIMENSIONS ARE IN MM.
CONNECTED TO «TOSA6EVESSEL IN GLOVE BOX
Pig. 1*1 Sohematlo of core veeeel
-49-
devioe provides remote indication of the oore solution height
in the oontrol rooa. • ' .*•
Special instrumentation is incorporated In view of the233
solution nature, inherent alpha activity of U ar.d gamma
activity of U ' daughter products. A core vessel leak detec-
tion system senses leakages due to pinholes* weld cracks etc.
On-line alpha and gamma monitoring continuously checks for air
borne aotivity, if any.
The present status is that the various BeO reflector
modules are fabricated and are ready. The material for zirca-
loy core vessel was received from HFC, Hyderabad and machining
of the vessel has been completed. The glove box is expected to
be available by mid 1977. An Auxiliary glove box for chemical
analysis is also planned and the modus operand! for checking
solution concentration prior to start up on routine basis is
being worked out. Field tests would commence soon after the
commissioning of the glove boxes. Preparation of a detailed
safety analysis report is underlay.
>.2 HJRNIMA II; Physios and SafMv(P.K. Job and M. SrinivasanJ . ,:
A number of support calculations were carried out to esti-
mate parameters like K^, M , cri-W.cal mass la cylindrical geo-
metry, optimum oore vessel diameter, optimum fissile solution
concentration and the magnitudes of various operational coeffi-
cients such as level coefficient of reactivity, mass coefficient
of reactivity and dilution/evaporation coefficient of reactivity.
-50-
K^ was calculated as a function of TS JJ oonoentratton
using DTF IV codo in spherical geometry with reflective boun-
dary condition. 18 group Bells cross-section set was used.
Critical mass for bare and BeO reflected spheres were calcula-
ted for various concentrations. The minimum spherical oriti-VVK
oal mass for BeO reflected system was** 200 gm of B ^ In the
concentration range of 60 to 100 g/1 of U 2 " . M was evaluated
aa a function of B 2 " concentration from K^ and bare criticalO 2 9
radii values i, using the relation M *= (K-l)/Bg » where Bg is
calculated as [*/(% + .71 A t)]2.
Table 2.1 summarises the K^ and M values as a function of
solution concentration.Table 2.1s Summary of Purnima II Core Physics
Concentrationie/D
50
70
90
110
Parameters
K-co
1.76
1.88
1.95
2.00
(cm2)27.0
26.69
26.46
26.35
Soherical Critical Mass(gm )
210
203
210
220
The radial thermal flux variation for 80 g/1 solution is
shown in Fig. 2.1. The results of both DTF IV, 1-D, 18-group
calculations and IWOTRAH 2-D, 2-group calculations forv actual
PURliIHA II geometry are given. The flux at the core-reflector
boundary is 80%of that at the centre of the core. For about
10 cm beyond the core boundary, the flux remains relatively
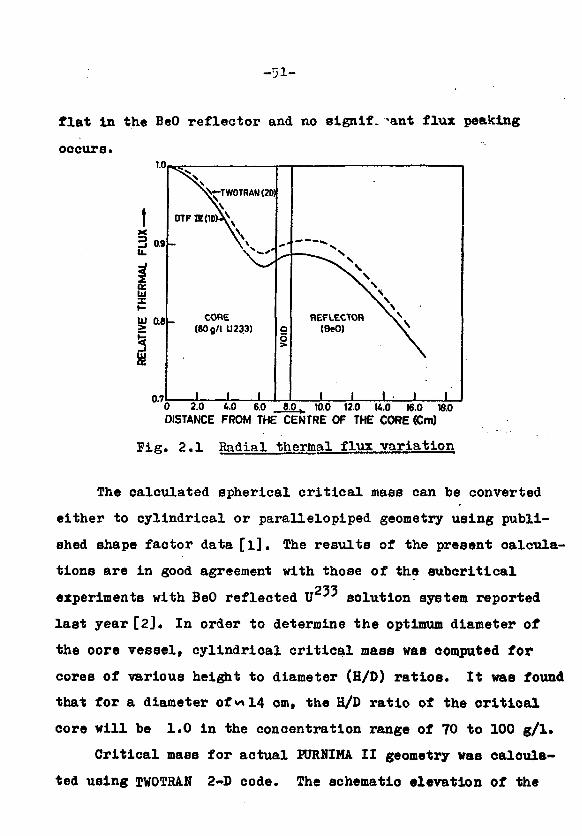
-51-
flat in the BeO reflector and no signify 'ant flux peaking
occurs.
0.7 I I I I I I0 2.0 4.0 6.0 8.0^ 10.0 12.0 W.0 16.0 18.0DISTANCE FROM THE CENTRE OF THE CORE (Cm)
Pig. 2.1 Radial thermal flux variation
The calculated spherical critical mass can be converted
either to cylindrical or parallelopiped geometry using publi-
shed shape factor data [l]. The results of the present calcula-
tions are in good agreement with those of the subcritical
experiments with BeO reflected U 'J solution system reported
last year [2]. In order to determine the optimum diameter of
the oore vessel, cylindrical critioal mass was computed for
cores of various height to diameter (H/D) ratios. It was found
that for a diameter ofv%i4 cm, the H/D ratio of the critical
core will be 1.0 in the concentration range of 70 to 100 g/1.
Critical mass for actual RJRNIMA II geometry was calcula-
ted using TWOTRAN 2-D code. The schematio elevation of the
-52-
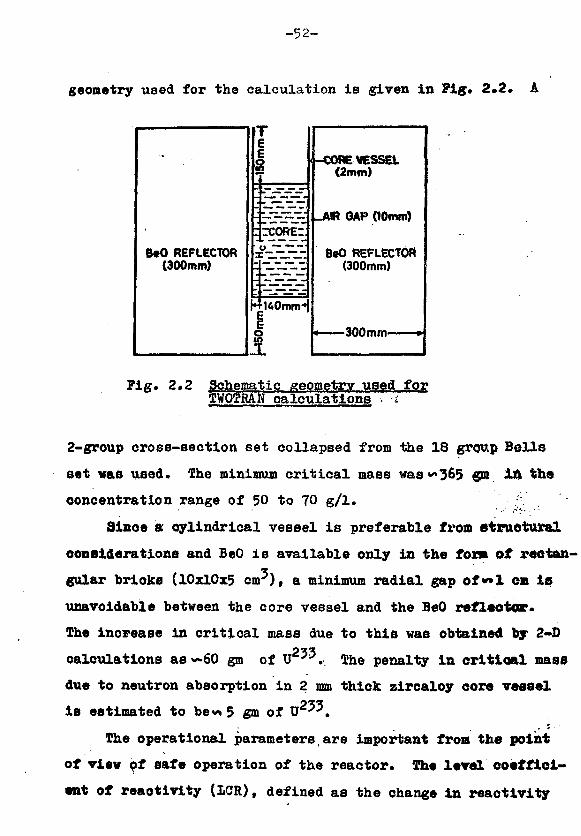
geometry used for the calculation is given in Fig. 2.2. A
B*0 REFLECTOR(300mm)
TEE
^pCOREZ
J-CORE VESSEL(2mm)
-AIR OAF (10mm)
B«O REFLECTOR(300mm)
300mm
Pig. 2.2 Schematic geometry used forTWOTRA.N calculations -i
2-group cross-section set collapsed from the 18 group Bells
set was used. The minimum critical mass was "365 got <L& the
concentration range of 50 to 70 g/1. . .;•:
Since a cylindrical vessel is preferable froa etruotural
considerations and BeO is available only in the fox* of rectan-
gular bricks (10x10x5 cur), a minimum radial gap of**! cm is
unavoidable between the core vessel and the BeO reflector.
The increase in critical mass due to this was obtained by 2-D
calculations as ~60 gm of U " . The penalty in critical mass
due to neutron absorption in 2 mm thick zircaloy core vessel
is estimated to bev, 5 gm of U 2 ^ .
The operational parameters,are important from the point
of view of safe operation of the reactor. The level coeffici-
ent of reaetivity (LCR), defined as the change in reactivity
-53-
of the system per mm change in solution height at critical was
calculated as 1.4 mk/ram at SO g/l concentration.
The increase in reactivity of the system per gran increa-
se in the fissile material inventory at constant core volume,
(defined as mass coefficient of reactivity) at critical, has
been determined as 27 f /g of U at 80 g/l of concentration.
This coefficient is always positive at any operating concentra-
tion.
The evaporation or dilution coefficient at critical is
the change in system reactivity per unit fractional unit change
in solution concentration at critical (corresponding to unit
fractional change in solution height). The magnitude and sign
of this coefficient is critically dependent on operating con-
centration. At optimum concentration (minimum critical mass
region) this coefficient is zero. Evaporation coefficient at
80 g/l is estimated as -20 f /mm. A detailed calculation of
this coefficient at different concentrations is under way.
/I/ Paxton H.C. et al, 'Critical Dimensions of SystemsContaining IJ235, Pu239 and U233" TID 7028.
/2/ Job P.K. et al, "Subcritical Multiplication Measurementswith BeO reflected U233 Uranyl JTitrate solution syate»" ,Paper E-7, Symposium on Reactor Physics (1976).
3*3 PURHIMA lit Calculations of Inertial Pressure PulseCharacteristics during Fast TransientsIS. Das)
In connection with the safety of PURNIMA II, a detailed
study [S. Das, 1976] was undertaken to assess the magnitude of'v
the inertial pressure pulse that would be generated in the
-54-
homogeneous solution core in the unlikely event of a short-
period (millisecond) power transient. Solution reactors ar»
known to be inherently Bafe because of the presence of a large
negative power coefficient. However, it should be ensured
that the pressure pulse does not cause damage to the core
[Barbry et al, 1976j Pierre Lecorche et al., 1973]. The ori-
gin of the pressure field is due to the formation and subsequent
growth of hydrogen bubbles when the fission energy deposition
in the system reaches a threshold value, Ec. Production of H 2
ia due to radiolysis of water caused by high energy fission
fragments. Release of pressure is due to He actual physical
expansion of the solution with a decay constant (RC) determined
by the time taken for the shock wave to travel the core height.
The pressure is called inertial because of the threshold nature
of the phenomenon. The pressure pulse is followed by an increa-
se in solution volume which gives rise to a negative shutdown
coefficient of reactivity.
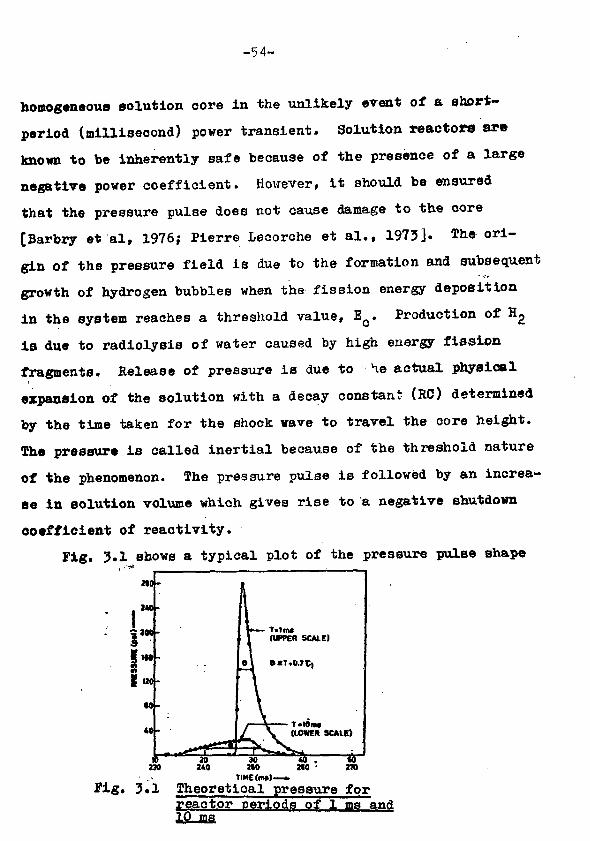
Fig. 3.1 shows a typical plot of the pressure pulse shape
2«0-
240 •
200 -
120 -
4 0 -
T.tnw(UPPER SCALE)
! I230
T.tOrM(LOWER SCALE)
M0 •"To"
270210' ... TIME(m»l—•
Fig. 3.1 Theoretical pressure forreactor periods of 1 ms and1,0 ma
-55-
tor * • 1 as ana T a 10 ma, where T represents stable reactor*
period. The oalculational model used was similar to that of
Dunenfeld and Stitt [3].. The pulse width 0 defined as
full width at half maximum is given by
0 » T + 0.7 RC
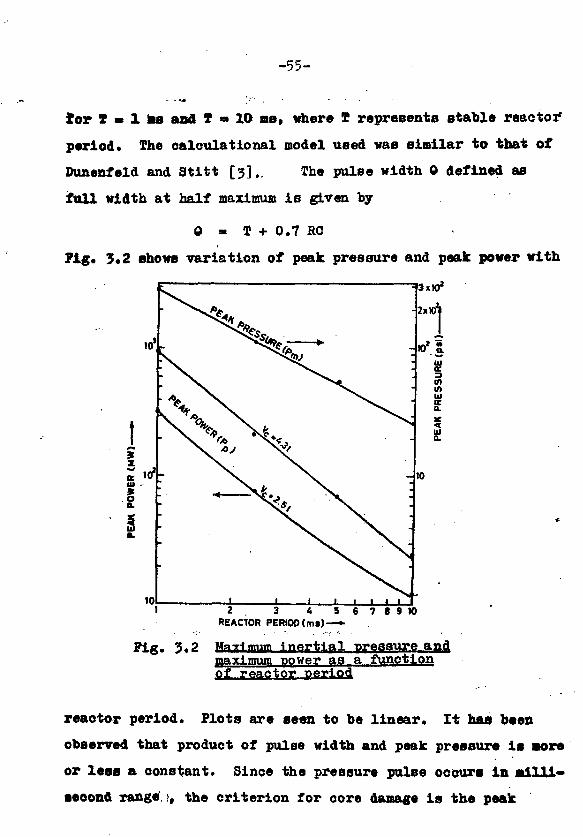
Fig. 3.2 shows variation of peak pressure and peak power with
3x10*
» o $ -
102 3 6 5 6 7 B 9 10
REACTOR PERIOD (m»)—*•
Pig. 3.2 Ma-Hmnjn 1 nartlal pressure andmaximum power as a functionof reactor period
reactor period. Plots are seen to be linear. It has been
observed that product of pulse width and peak pressure is aore
or less a constant. Since the pressure pulse occurs in Billi-
second range' i, the criterion for core damage is the peak
-56-
preseuxe, the one having a smaller peak value being safer.
The magnitude of the dynamic pressure wave during a fast ex-
cursion limits the maximum permissible reactivity step.
/I/ Barbry, P., Mangin, D. and Vanel, M. Conf. Fast BurstReactors, Tokyo, Japan, March, 1976.
/2/ Das, S., Proc. Symp. Reactor Phys., BARC,-Bombay, 1976,B-ll. ^n.
/3/ Dunenfeld, M.S. and Stitt, R.K. (1963), NAN-3R-7087.
/4/ Pierre Lecorche and Seale, R.L. (1975), Y-CDC-12.
3.4 PURKIKA II; Effect of Reflector-Returned Neutrons onReactor Kinetics(S, Das and M. Srinivasan)
PURNIMA II is a homogeneous solution thermal reactor with
a water moderated core surrounded by BeO as reflector. Because
of the large absorption mean free path of thermal neutrons in
BeO ( \m 1500 cm), a large fraction of the neutrons leaking
into the reflector returns back to the core after moderation.
This introduces a delay time which could be long compared to
the core neutron life time and may thus change the dynamics of
the reactor completely. Hence;the need to investigate the role
of reflector delayed neutrons on the dynamics of PURNIMA II.
The most accurate way of accounting for this effect is to do a
detailed space-time kinetic analysis. One of the- simpler
approaches is to treat reflectod neutrons as an additional de-
layed group of neutrons [Wasserman, 1962] with a decay constant
equal to ?Land an abundance equal to |3~. Alternately one could
do a bare kinetics calculation with an appropriate overall
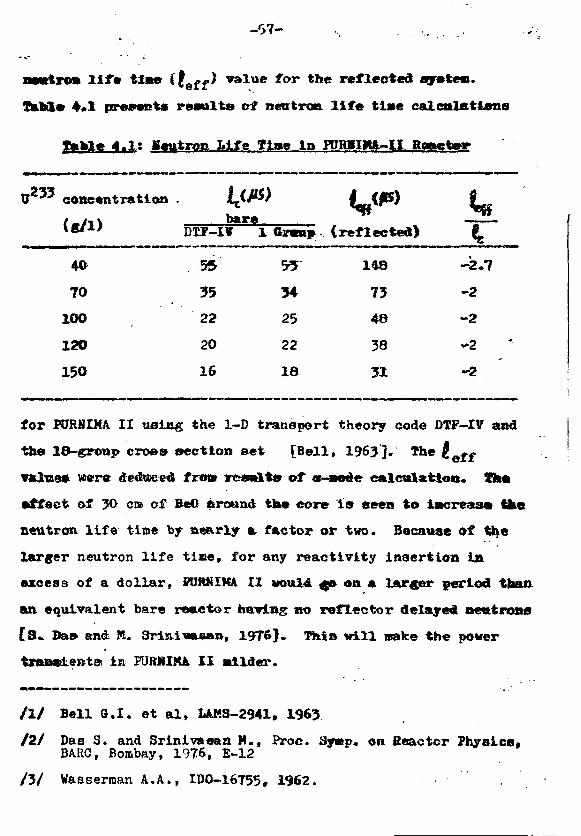
nsrlrrni l i f» tlm» ifeff) value for the reflected system.
Ifcbl* 4»1 prsssnta results of netrtroo. l i f e ti»e calculations
4.1: Msutron Life Tlae In PURIIHA-II Roactor
r233 concentration - l^Mtm**\ bare
(ref lee ted)
concentration - l^M JttS) 1bare H
4fr 55 55 198 -2.7
70 35 34 75 -2
100 22 25 48 -2
120 20 22 58 -2
150 16 18 31 -2
for PURNIMA II using the 1-D transport theory code DTF-IV and
the 18-group cross section eet [Bell, 1963]. The £ e fj
•ftlue* were deebu-eed f ro» r&s»lts of «-aoe> ealenlatioQ. Thm
mttact of 30 cm of BcO around the core is aeen to iacreas* tke
neutron life time by nearly a factor or two. Because of the
larger neutron life tine, for any reactivity insertion in
excess of a dollar, 9URKIK& II would » « a t larger period than
an equivalent bare reactor having tto reflector delayed neutrons
f 3i Das- and K. grindvasan, 1976}. This will make the power
in FURNIK& II allder.
/I/ Bell O.I. et al, L4MS-2941, 1963
/2/ Dae S. and Srinivaaan M., Proc. Sjmp. on Reactor Physics.BARC, Bombay, 1976, E-12
/3/ Wasserman A.A.., IDO-16755, 1962.
-50-
3.5 V Fuelled Low Power Source Reactor for NeutronRadiography at RRC-Status Reoorg(C.S. Pasupathy and M. Srinivasan)
Work on the design of the mini source reactor to be ins-
talled at the Radiometallurgy Laboratories of RRC, Kalpakkasa
was continued with emphasis on core physics calculations«
This reactor consisting of U " -Al alloy fuel plates in water,
differs from the physics point of view from a homogeneous solu-
tion core due to the presence of aluminium and the heteroge-
neous fuel-moderator arrangement. Calculations were performed
to determine the critical mass of the referenoe core (Table
5*1) of this, reactor using one dimensional transport code DTP-
IV and Bells [G.I. Bell et al., 1963] 18 group cross section
eet.
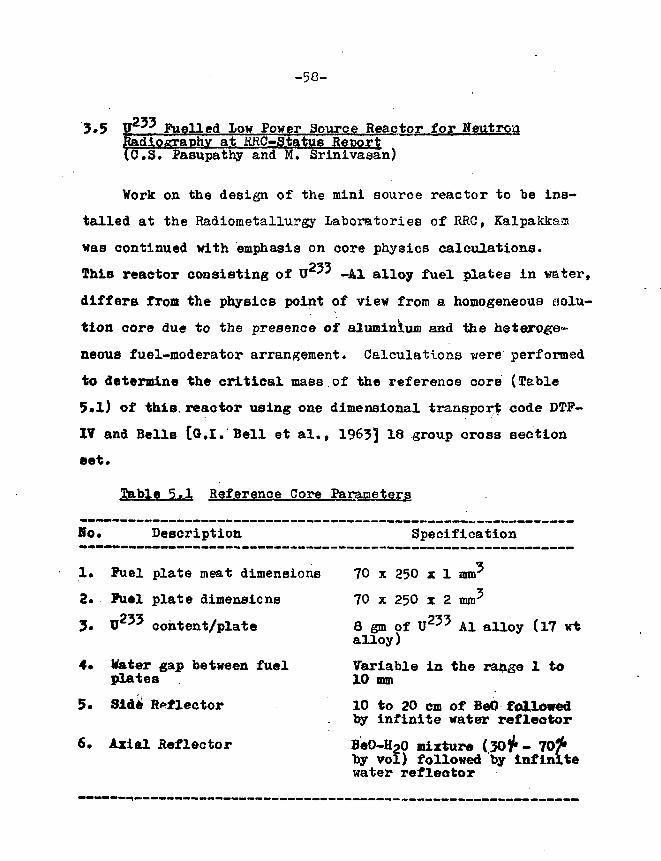
Table 5.1 Reference Core Parameters
No. Description Specification
1* Fuel plate meat dimensions 70 x 250 x 1 mnr
2. Fuel plate dimensions 70 x 250 i 2 mm'
3. U 2 3 5 content/plate 8 gm of U 2 5 5 Al alloy (17 wtalloy)
4* Water gap between fuel Variable in the range 1 toplates . 10 mm
5. Side Reflector 10 to 20 cm of BeO followedby infinite water reflector
6. Axial Reflector BeO-H2O mixture (50^- 70^by vol) followed by infinitewater reflector
-59-
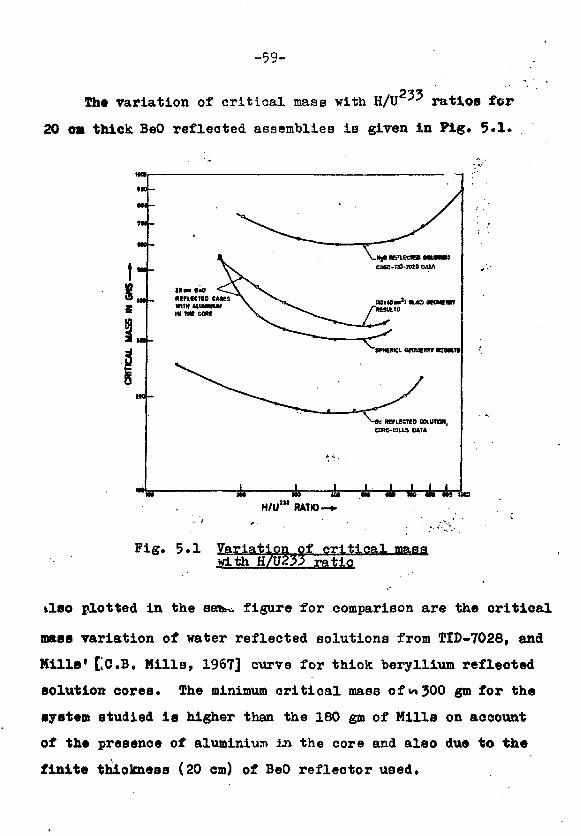
Th* variation of critical mass with H/U2-5' ratios for
20 OB thick BeO reflected assemblies is given in Fig. 5.1.
•* 1 JL 1 Hi,H/U1" RATIO.
Fig. 5.1 yariationof critical masswith H/U253 ratio
IIBO plotted in the sa*^ figure for comparison are the critical
mass variation of water reflected solutions from TID-7028, and
Mills' [;c.B. Mills, 1967] curve for thick beryllium reflected
solution cores. The minimum critical mass of «* 300 gm for the
system studied is higher than the 180 gm of Mills on account
of the presenoe of aluminium in the core and also due to the
finite thickness (20 cm) of BeO refleotor used.
-60-
The effect of heterogeneity on K o was studied using an
actual cell representation and comparing it with homogenised
K calculations performed on the same cell. The difference
In Ka by these methods wna found to be 41.5 indicating that
homogeneous calculations would be sufficient for most of
the design work. This oonclusion is also corroborated by the
monte carlo calculations of Hunt and Sehuske [53.
Table 5.2 summarises the results obtained for critical
mass and migration area using different aluminium volume
fractions (V*1). From the constancy of the ratio of reflected
core radius R to bare core radius Ro, and the product )
X Ro, it is concluded that aluminium acts essentially as void.2 2 2
The change in migration area M from 21 cm to 112 cm foraluminium volume fraction change in the range 0 to 70 % is also
consistent with above conclusion.
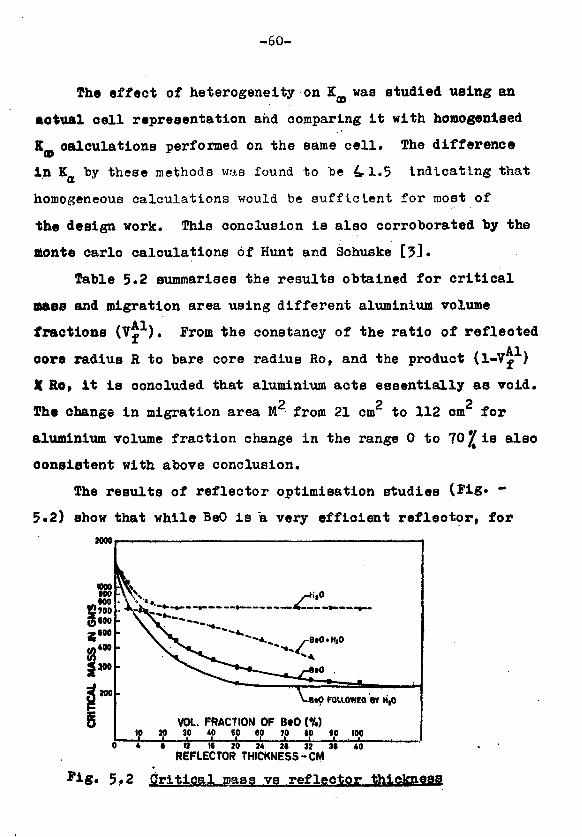
The results of reflector optimisation studies (Fig* *"
5.2) show that while BeO is a very efficient refleotor, for
JOOOf
0 FOU.OWEO BY H,0
VOL. FRACTION OF B»0 (%)X 30 «0 50 60 70 10 80 100I I I K 10 » 21 32 31
REFLECTOR THICKNESS-CM40
Fig. 5»2 Critical mass vs reflector
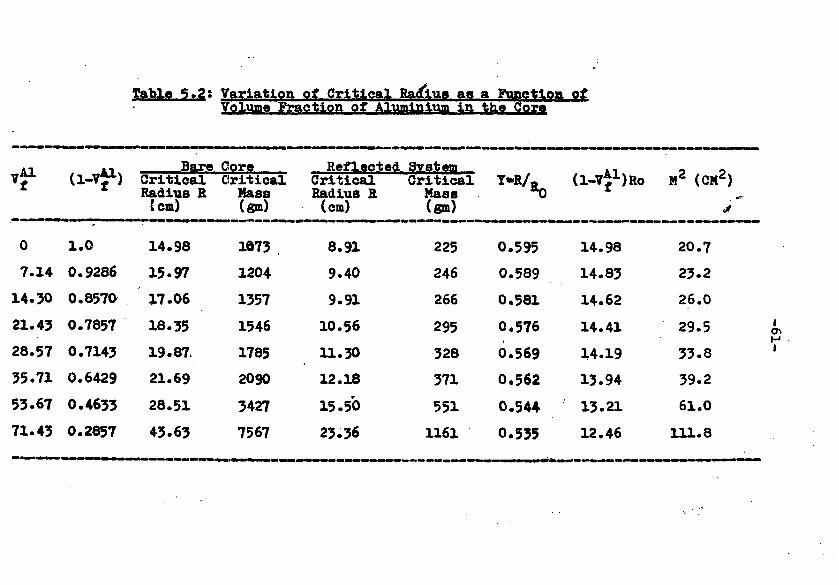
Table 5.2s Variation of Critical RadiusVolume Fraction of Al^
&«y « ^irction ofla th.a Core
0
7.14
14.30
21.43
28.57
35.71
53.67
71.43
U-vJ1)
1.0
0.9286
0.857a
0.7857
0.7143
0.6429
0.4633
0.2857
BareCriticalRadius R(cm)
14.98
15.97
17.06
18.35
19.87.
21.69
28.51
43.63
CoreCriticalMass(gm)
1673 .
1204
1357
1546
1785
2090
3427
7567
ReflectedCriticalRadius R(cm)
8.91
9.40
9.91
10.56
11.30
12.18
15.50
23.36
SystemCriticalMass(gm)
225
246
266
295
328
371
551
1161
« \
0.595
0.589
0.581
0.576
0.569
0.562
0.544
0.535
(l-vf)Ro
14.98
14.83
14.62
14.41
14.19
13.94
13.21
12.46
M2 (CM2)
20.7
23.2
26.0
29.5
33.8
39.2
61.0
111.8
IHI
-62-
B«0 thickness in the range 10-20 cm, contribution from the
thiok outer H20 reflector is significant, resulting in critic
oal mass savings of^85 gm. It is also found that the effect
on critical mass of a composite BeO-HgO mixture varies almost
linearly with volume fraction of BeO.
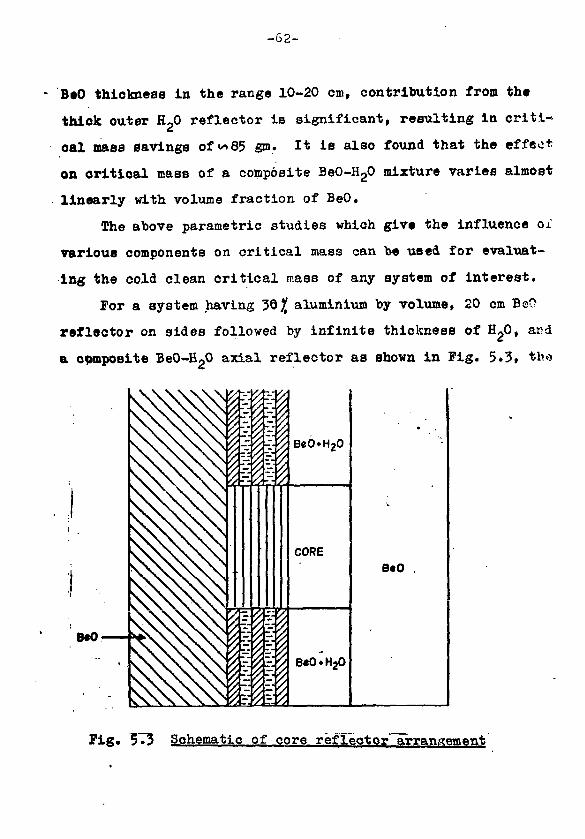
The above parametric studies which give the influence of
various components on critical mass can be used for evaluat-
ing the cold clean critical mass of any system of interest.
For a system having 39 £ aluminium by volume, 20 cm BeO
reflector on sides followed by infinite thickness of HgO, and
a composite BeO-HpO axial reflector as shown in Pig. 5*3, the
B«0
Pig. 573 Schematic of core reflector arrangement
-63-.
aritiaal maae m&y ba estimated as follows*
Critical mass of 20 cm thick BeO reflectedspherical homogeneous core with no ultimtnliimat * B/0233- ratic of 340 « 225 gm
Increase due to presence of aluminium, 50Vby volume, in core «* +90 gm
Decrease due to addition of thick outerwater reflector beyond the 20 cm thick BeO • -70 go
Shape factor correction from sphere to 'rectangular parallelepiped ••» 1.05
Increase in critical mass due to the 20 cmthick axial BeO reflector being replaced bya composite HgO-BeO reflector (70/H90 30£BeO by volume? * 2 « + 50 &
Corrected cold clean critical mass for systee =* 307 gaof interest
Reducing the thickness of inner side BeO reflector from
20 cm to 10 cm would enhance the critical mass by 125 gra to
Having understood the basic physical effects of various
parameters, calculations using a two dimensional transport
code IWOTRAN are underway to evaluate critical masses in rect-
angular geometry. Calculations are also being performed for
evaluating various reactivity coefficients of interest and
the effect of localised absorbers like control rods.
Heat transfer calculations using natural convection cool-
ing are being worked out and action has been initiated on the
procurement of essential components for the control system.
Preliminary engineering drawings of the core tank, reactor
tank and oore reflector arrangement have been prepared. The
civil works of the building is expected to be completed bj
•arly 1978 after which installation of reactor equipment will
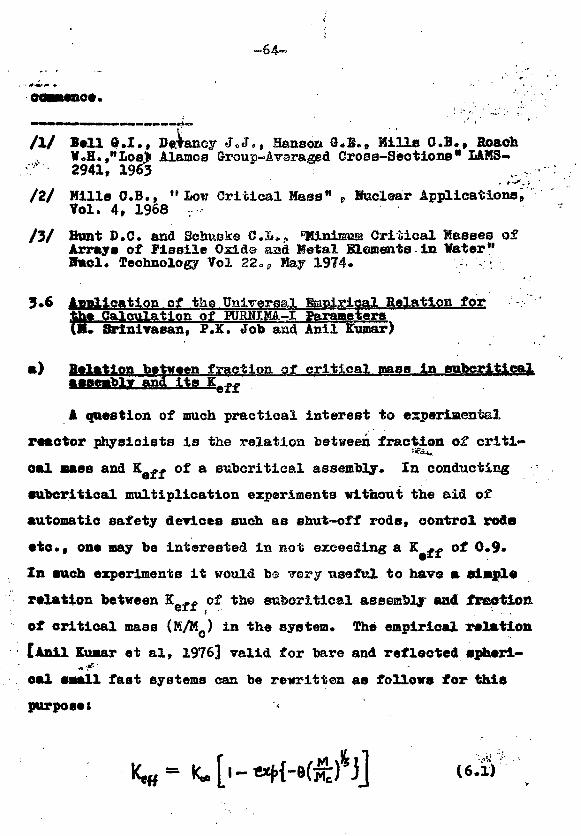
/ I / Ball G.I . , De.tanoy JcJ», Hanson O.B., Hi l l s C.B., HoachV.H.,HLos> Alamos Group-Avsraged Cross-Sections" LAM9-
- v 2941, 1965- > • • * . ••
/2/ Hills C.B., "Low Critical Hass" e Jfeclaar Applications,Vol. 4, 1968 ,
/3/ Bant D.C. and Schtiske C.li», "Hinliptua Oritical HaBses ofArrays of Fissile Oside aad Metal Slementsin Water"8KC1* Technology Vol 22*. ? Hay 1974. •;
3*6 Application ot the Universal ffinyivityal Relation forCalotelation of KJRHXMA—X ParametersSarlniTasan, P.K. Job and Anil Kumar)
0 B>l>tlon b»twen fraction of critical P^BB In ftiibcri.ti.cctlC8 JL_HM
eei t
A question of much practical interest to experiments!
reactor physicists is the relation between fraction ot criti-
cal aass and Keff of a subcritical assembly. In conducting
•uncritical multiplication experiments without the aid of
automatic safety devices such as shut-off rods, control rods
etc., one may be interested in not exceeding a E of 0.9*
In such experiments it would bs very useful to have a aimplo
relation between KQff of the suboritical assembly aad fraction
of oritioal mass (M/Mc) in the system. The empirical relation
[Anil Kumar et al, 1976] valid for bare and reflected spheri-
oal small fast systems can be rewritten as follows for this
purpose: •
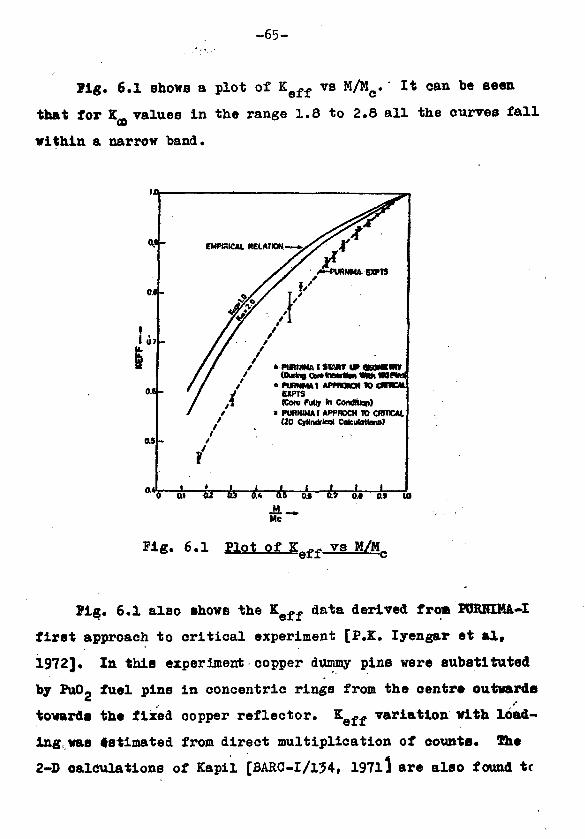
-65-
Pig. 6.1 shows a plot of K e f f vs M/Mc. It can be seen
that for K values in the range 1.8 to 2.8 all the curves fallCO
within a narrow band.
Of-
i U7
0.6-
0.S
CMPHICAL DELATION
» PURMMA i stwt vr<0 t
APnmai ID CMIBM.EIPTS(Core Fullr *" CondRkw)PURNIMAJ APPROCH 10 CRITICM.(20 Cylindrical CalcuWionol
I I I 1 Iat Hi55ft* as 53 EJ at of ib
Pig. 6.1 Plot Of V 3
Pig. 6.1 also shows the K e f f data derived froa HJRHIMA.-I
first approach to critical experiment [P.Z. Iyengar et al,
1972]. In this experiment copper dummy pins were substituted
by PuO2 fuel pins in concentric rings from the centre outwards
towards the fixed copper reflector. K e f f variation with load-
ing, was estimated from direct multiplication of counts. The
2-D calculations of Kapil [BARC-I/134, 19711 are also found tc
-66-
be in agreement with experimentally determined KQf£ variation
with OOTO loading., K^ of th© KffiHIMA-I core beings 2,8, it eaa
be seen from Fig. 6.1 .that the empirical relation gives a ^.••..
• higher estimate of 9ff ^hle discrepancy.is attributed to ttao
faot that the empirical relation la derived for reflected small: s*
•jdaeric&l fast systests wherein it ie assumed that as the core
size increases the reflector moves outwards keeping the thick-
ness of the reflector constant, whereas in the sxperiment thex*6
was a low density copper dummy region whose thickness dimini-
shed aa the cor© size increased0
In HJBNIMA-I the stationary copper-steel reflector QSSGSH
bly was fixed on a platform9 while the pore contatniag 180
fuel pins was raised slowly at a controlled rate from below
Into the reflector assembly to make the system critical
'fBARO-I/134., 1971] 0 At different core carriage positions during
start-up, corresponding to various ooupled-core-reflector con-
figurations the fissile mass required to attain critieality
Iras obtained from an analysis of the incore fiaaioa counter
data tp«K. Job and Mo Srinivasan.a 1973]. For example to make
the system critical in the shut down configuration (E -- «
0.77 with 180 PuO2 pins) the number of fuel elements needed waa
estimated to be 300 + 20 pins whereas on completion of. coreinsertion this number was 160. Thus M/H varied from (TQ§) to
(j^) during start-up. The Keff variation during start-up was
independently determined by various experiments for the 180
fuel pin core. The K e f f vs M/Mc of the start-up geometry con-
figuration is shown plotted in Fig. 6.1 alongwith the other
data, v I t la interesting *o note that -S&ese points also fall• * . * - • \ • .
th» approai*-fto-crtlaical curve, this shows thatthe empirical relation is valid to a good approximation even
for tat hlghlj as^rametric coupled eore-yefleetor geometry
such as obtained during KJBHIHA-I start-up. ;;: .
Mn worth
i^Slfferentlstion of the empirical relation
tat reactivity increase due to a given fractional
core mass at critical as follows!
Ihe product ©(K^-l) 1B only weakly dependent o a l _ a e t i f
varies only by<n 207 from 0.64 to O.ao tfaen SM varloa.---se
to 2.8$< MIUB i t would appear that the peripheral neve*
of fuel at cr i t ical i s an almost unive^eal constant in the
range (2.3 ± 0.3 ak)/percent change of oore mass at critical
'for a l l .ernll f*et ^sterns. For PUMIMA-I (K • 2.88) which
wa» oritioal with 180 fuel aleaenta the peripheral pin worth;
works out to be v> 75 0/pin from the above formula, this nay
be compared with the value of ~10/j>toa observed from the ex-
periments CF.K. Iyangar et aljl972J. The higher experimental
value ie again attributable to the decreasing thickness.of
low denaity copper dummy pin zone between oore and refleotor.• • ' • • • . • ' , " • •
0} Ttennerature coefficient of react ivi ty due "fro Xual, .,,," expansion '." ' .*>•'•..-.••''•
The prompt reduction in reactivity due to PuOg fuel
pellet staok expansion provides the-main Shutdown meohaniaii
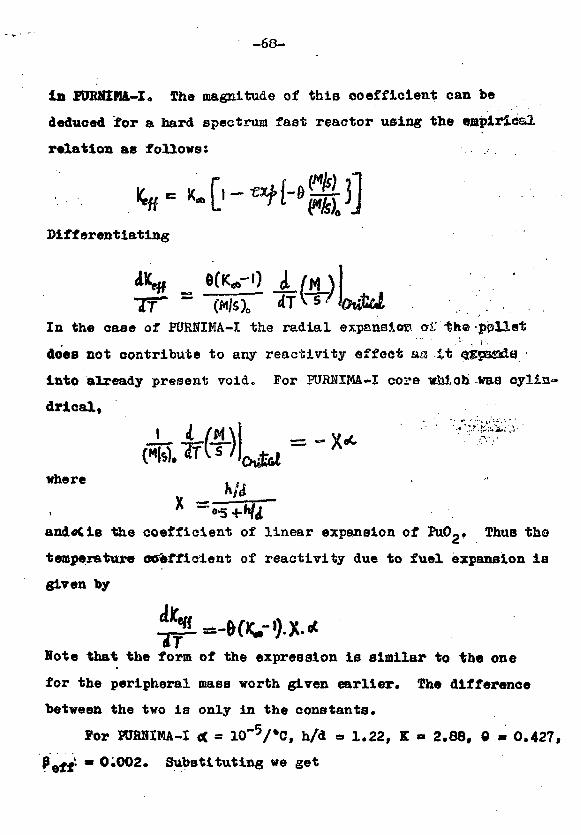
-68-
1B PURNIMA-I„ The magnitude of this coefficient can be
deduced for a bard spectrum fast reactor using the empirical
relation ae follows: .
Differentiating
TFIn the case of PURNIMA-I the radial expansion a£ th© ppllet
does not contribute to any reactivity effect as it <agjBS&8
into already present void. For RJMIM&-I core vMob vaa cylin-
drical.
where
the coefficient of linear expansion of FuO,* Thua tho
temperature eKfeffieient of reactivity due to fuel expansion ia
given by
Note that the form of the expression la similar to the one
for the peripheral mass worth given earlier. The difference
between the two is only in the constants.
Por OTRUIMA-I «( • 10"5/»C, h/d a 1.22, K a 2.88, 0 • 0.427,
0.002. Substituting we get
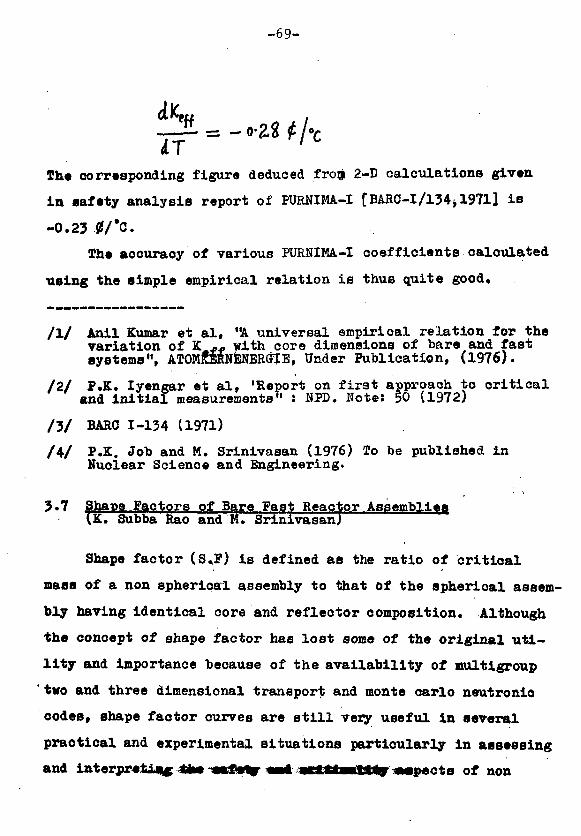
-69-
The corresponding figure deduced frog 2-D calculations given
i n safety analysis report of PURNIMA-I [BARC-I/l34il971] i s
-0.23 0/*C.
The aocuraoy of various PURNIMA-I coeff icients calculated
using the simple empirical relation i s thus quite good.
/ l / Anil Kumar et a l , "A universal empirical relation for thevariation of K -- ytlth. core dimensions of bare and fastsystems11, ATOMMSNENERGIE, Under Publication, (1976).
/ 2 / P.K. Iyengar et a l , 'Report on f i r s t approach to c r i t i c a land i n i t i a l measurements" : KPD. Note: 50 (1972)
/ 3 / BARO 1-134 (1971)
/4/ P.K. Job and M. Srinivasan (1976) To be published inNuolear Science and Engineering.
of Bare Fast Reaotor AssembliesI. Subba Rao and M. Srinivasan)
Shape factor (S,F) is defined as the ratio of critical
mass of a non spherical assembly to that of the spherical assem-
bly having identical core and reflector composition. Although
the concept of shape factor has lost some of the original uti-
lity and importance because of the availability of multigroup
two and three dimensional transport and monte carlo neutronio
codes, shape factor curves are still very useful in several
praotical and experimental situations particularly in assessing
and lnterpr«Uu»jp *fc* -*•£•%- *•* «!**•*&*%-aapects of non
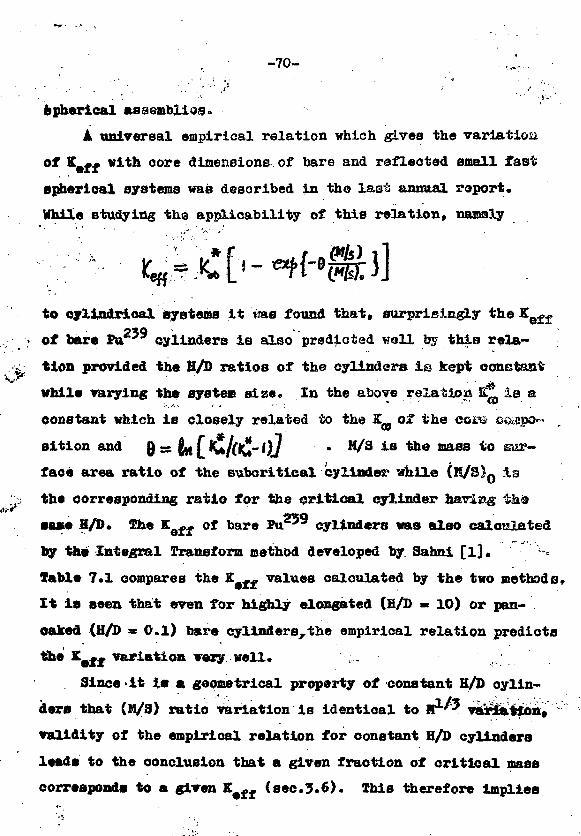
-70-
epherical
k universal empirical relation which gives the variation
of K e f f with oore dimensions of bare and reflected small fast
epherioal systems was described in the last annual report.
While studying the applicability of this relation, namely
to cylindrical systems it iiae found that, surprisingly the
of bare Ptt"" cylinders is also predicted well by this rela-
tion provided the H/D ratios of the cylinders is kept constant
while varying the system size. In the above relation E ^ is a
constant which is closely related to the X^ of the com e&spo"
sition and B = $M £ ICKl" l)J * M^3 ia the mass *° eur~face area ratio of the subcritical cylinder while (E/S)o is
the corresponding ratio for the critical cylinder having -iJi
U M H/D. The Kaf;f of bare P u ^ * cylinders was also calculated
by th« Integral Transform method developed by Sahni [l].
Table 7*1 compares the K ^ values calculated by the two methods*
It is seen that even for highly elongated (H/D » 10) or pan-
caked (H/D = 0.1) bare cylinders,the empirical relation predicts
the X-Uft variation veary well.
Since it is a geometrical property of constant H/D cylin-
ders that (K/3) ratio variation is identical to H l / 5 vartotion,
validity of the empirical relation for constant H/D cylinders
leads to the conclusion that a given fraotion of critical mass
corresponds to a given K # f f (sec.3.6). This therefore implies
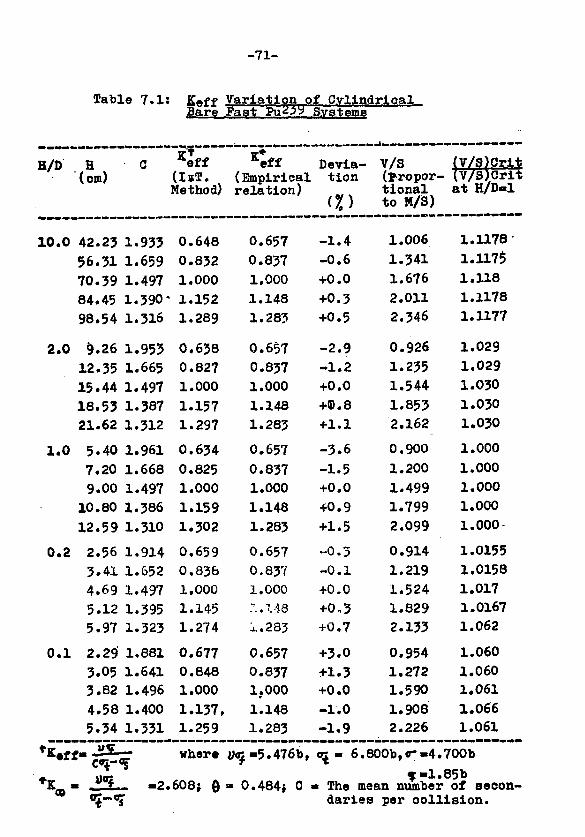
-71-
Table 7.1s Keff Variation of CylindricalBare Fast Pu^y SystemB
H/D
10.0
2 . 0
1 . 0
0 . 2
0 . 1
H(cm)
42.2356.3170.3984.4598.54
9.2612.3515.4418.5321.62
5.407.209.00
10.8012.59
2.563.414.695.125.97
2.29'3.053.824.585.34
C
1.9331.6591.4971.3901.316
1.9531.6651.4971.3871.312
1.9611.6681.4971.3861.310
1.9141.6521.4971.3951.323
1.8811.6411.4961.4001.331
*eff(IsT.Method)
0.6480.8321.000
* 1.1521.289
0.6380.8271.0001.1571.297
0.6340.8251.0001.1591.302
0.6590.8361.0001.1451.274
0.6770.8481.0001.137,1.259
I T *Keff(Empirical
relation)
0.6570.8371.0001.1481.283
0.6570.8371.0001.1481.283
0.6570.8371.0001.1481.283
0.6570.8371.000r..U81.283
0.6570.8371.0001.1481.283
Devia-tion
(%)
-1 .4-0.6+0.0+0.3+0.5
-2.9-1.2+0.0+<D.6+ 1 . 1
-3.6-1.5+0.0+0.9+1.5
-0.3-0 .1+0.0+0.3+0.7
+3.0+1.3+0.0-1.0-1.9
V/S(propor-tionalto M/S)
1.0061.3411.6762.0112.346
0.9261.2351.5441.8532.162
0.9001.2001.4991.7992.099
0.9141.2191.5241.8292.133
0.9541.2721.5901.9082.226
{V/S)Crit(V/S;<3ritat H/Dol
1.11781.11751.1181.11781.1177
1.0291.0291.0301.0301.030
1.0001.0001.0001.0001.000
1.01551.01581.0171.01671.062
1.0601.0601.0611.0661.061
where
- JlfL- -2.608;<%-*$
0.484; C
!j • 6.800b,o--4.700b
f-1.85bThe mean number of secon-daries per collision.
-72-
that published shape factor curves meant for critical systems
should also be applicable to aubcritioal and supercritical
systems, atleast in the case of bare fast oylinders. Fig. 7.1
2JO T T
u-
1.7
U -
1JB
1A
1.3
1.2
1.1
T
* TWOTRAN CALCULATIONS FOR K.0.7* TWOTRAN CALCULATIONS FOR K.1.0* TWOTRAN CALCULATIONS FOR K . 13A SHAPE FACTORS FROM EMPIRICAL RELATIONo EXPERIMENTAL SHAPE FACTORS FOR
BARE " ' u CYLINDERS
• •
0.9H/D
0.6 0.7
0.5+M/D
0.9 1.0
» 7.1 Shape factors of bare Plutonium cylinders
shows the 'universal* shape factor curve predioted by the
empirical relation. Note that this curve merely depicts a geo-
metrical property of cylinders, namely the variation of the
volume (or mass) of a cylinder withH/D ratio if its M/S ratio
is conserved.
lo study the dependence of shape factor ourves on
Table 7 .? ;
Keff =Height ofCylinder
(cm)
3.6
4.0
5.0
6.0
7.0
8.0
10.0
12.0
14.0
20.0
0.7H/D
10.5+H/D)
0.338
0.402
0.513
0.590
0.647
0.691
0.753
0.793
0.824
0.877
(6 group - TWOTRAN Calculations)
Keff 1.0
H/DS.P. Height ofCylinder (0.5+H/DJ(cm)
1.948
1.546
1.223
1.134
1.107
1.110
1.167
1.262
1.357
1.725
6.0
8.0
10.0
12.0
16.0
20.0
26.0
0.395
0.544
0.632
0.692
0.769
0.814
0.856
1.650
1.179
1.108
1.116
1.214
1.365
1.626
EeffS.P. Height of
Cylinder(cm)
1.3
H/D
8.0
10.0
12.0
16.0
20.0
24.0
30.0
34.0
(0.5+H/BT
0.360
0.494
0.578
0.682
0.744
0.785
0.827
0.846
3.F.
2.020
1.297
1.145
1.110
1.184
1.284
1.475
1.614
-74-
a muib«r of 2-D calculations were oarried out on bare ?u ™
cylinders using the TWOTRAN 00 eode. All the calculations
were done with 8^ quadrature and a convergence criterion of
£•10 . A 6-group oroas section set, collapsed fro» the first
12 group* of ABBN set, was used. The results are summarised
in Sable 7.2 and the Bhaps faotor curves plotted in Fig. 7.1.
As predicted the shape factors are not very sensitive to the
Keff value for H/D in the ranje fro* 0.5 to 2.5. Outside the
range 0.5<H/D <2.5, the suboritioal cylinders show a slightly
•flatter* behaviour as compared to super oritical cylinders.
Experimental shape factors of bare U2*' oritioal cylinders ma
reported by fftxton et al [l] are aleo shown in fig* 7.1 for
comparison with the shape factors of oritical Pu ™ cylinders
calculated by W02RAH.
/!/ Sahni D.O. (1972), J. Nucl. Energy, 26, 367.
/2/ Paxton H.O. (1964), TID - 7028.
tioal KasB of a Mlorofiasion Svetepiflector Density
(Anil Kunar and MT SrinivaeanJf'i'Wl"-1'!'l-( ! > + £ M J «
Vinterberg [l] . . has calculated the variation of criti-
oal aass with core and reflector density of a fast fissile
oore reflected by a high density neutron reflector in the con-
text of laser and relativistio electron bean imploded micro-
fission pellets using simple one group diffusion theory eon-
oepts. While a full fledged neutronio multigroup transport
theory calculation suoh as the one carried out by Erumbein
-75-
et al [2] , can always be relied upon to give critical maases
for any conbination of core and reflector densities,It Is of
academic interest to study the eystematies of critical mass
variation with core and reflector densities, A number of DTP-
IV calculations were therefore made to determine the critical
radii of reflected fast systems for various combinations of V
core and reflector densities. A representative system consis-
ting of a spherical plutonium core surrounded by s beryllium
reflector was studied. In these studies, (a) and ^ are
reference system oore and reflector densities respectively,
(b) \ and <h are core and reflector densities of the test;
system, (o) X is the thickness of the reflector, (d) 1^ and
ft are the critical oore radii of the reference and test ref-
lected systems respectively, (e) V s ^/JKM V A 4 r* ea *•
the oritical oore radius of the bare core of density f .
Note that1) is a convenient measure of the refleoted system ori-
tical mass expressed in terns of the bars oore critical mass
at oore density f^ (f) J rs tyt^ * l B **• * a e t o r by
which core is compressed relative to reference oore density
and B ^ y ^ is the factor by whioh refleotoFis com-
pressed, (g) X=r \foh is the relative degree of compres-
sion of the core with respect to that of the rtfleotor*••'.••• •"•..'*• '* - - M i - - a i * * ' * i f
Ideally X can vary from 0 to eoXoaa be made .eroeither by
making oore density very small as compared to fixed reflector
density or by making refleotor density very larjai keeping
core density constant. Since X ^*ries over a very wide
range a new variable X # giren by X*ssTOf •'•$&.
-76-
ttefined euoh that )f varies within the limit 0 to 1 for X
going from 0 to «.Q
In.the present studies as the Be •reflector density was
increased its thickne'BS was decreased such that the product
TD r was constant. It can be shown that under these conditions,
i.e. when thickness of reflector in terms of neutron mean free
path is constant, oritical mass -varies inversely as the square
of the oore density provided that core and refleotor densities
are changed by the same faetor (X • l). This implies that for
such systems oritioal radius measured in terms of neutron mean
free J?»ta is independent of bore and refleotor density* In
the present calculations the beryllium refleotor thickness was
taken as 16 em at a density of 1.8? gm/om .
Pig. 8.1 depicts the variation of t| against X for a Pu 2r
Be 7 system. It is noted that for high values of X (i.e. large
oore density) u approaches unity. This is as expeoted
Pig. 8.1 Plot of reflected to bare oore radius (V)re core reflector flensity^ratioFor Pa-Be system
kept constant)"frl?Ul atlon .
-77-
beoauee reflector becomes less effective at higher core densi-
ties. As the value of X decreases the reflector starts domina-
ting and y comes down. Fig. 8.2 shows the variation of y plotted
< 8.2
'if.
verflua the normal!zedcore/reflector densitymeter (Pu-Be avetem. Tconstant
tiara—
against X • It is interesting to note that y is almost a
straight line for X*>0.2. Efforts are under way to inter-
pret these results in terms of the los Alamos density exponent
formula [NlcnollB et al, 1961].
/I/ Vlntertoerg I*;, Naturforeeh, Z., 28a, 900 (1973).
/2/ Krumbein A.D., Trans. Am. Nuol. 3oc, 21, 64 (197S)
/3/ Nicholls, CM., Woodcock, E.R. and Giliieson, A*H. (1961)Nuclear Science and Technology Vol. 1, p. 394, AcademicPress, Inc. New York.
-78-
3o9 CIR, Blanket Weutronlcs StudiestP.K. lyengar, T.K. Basu, Anil Kumar, K. Subba Rao,and M. Srinivasan)
Bxceee neutrons to the extent of 0.3 to 0.4 per inoident
&4 MeV neutron is likely to be available for nuclear fuel
breeding after allowing for adequate tritium production in the
blankets of the first generation controlled thermonuclear
reaotors (CTR) based on the D-T reaotion tlideky, 1975).
These exoess neutrons can be used to breed fissile material
#ttOh as U 2 3 3 from Th232. The main reason for the high breed-
ing ratios in CTR blankets is the occurrence of (n,2n),(n,f)
and (n,n') reactions in the 2-14 MeV range. The reactions of
interest Vhioh lead to multiplication of fast neutrons are
summarised in Table 9*1.
Table 9.liProas-sections for Reactions Responsible forFast Heutron Multiplication
Type of Erie.. Jross-sectionMaterial cross- thx-eou- Ln 6-14 MeV
section energv range(MeV) (Bam)
Li7 (n, n'a) 6 0.4
Bo9 (n,2n) 2 0.55
Tb 2 3 2 (n,2n) 8 1.7
(n,f) 1.5 >.J
U 2 3 8 (n,2n), (n,3n) 3 X.5+
(n,f) 2 1.0
inoludes orons-section for (n»3n> reaction IIPO nbove 12 MeV.
-79-
Sinoe these are threshold reactions having varying
secondary neutron energy spectra the arrangement of these
materials in the blanket could influence the maximum neutron
multiplication obtainable in the system. In view of the long
term importance ot breeding of IT255 from thorium, the design
of blankets yielding maximum captures In thorium per incident
14 MeV neutron was studied.
Calculations were carried out using DTF-IV code with S^
angular quadrature. A 27-group cross-section set derived
from BNDF/B-IV files was used [Garg, 1976]. The group energy
structure Was Identical to the 26-group ABBN set of Abagyan
•t••l»[5j/T sxoept for the additional top group (15.0-10.5
MeV). The maximum multiplication per incident 14 MeV neutron
obtained in simple one and two region blankets in spherical
and slab geometry was first studied. Here multiplioation is
defined as the sum of neutron captures in blanket plus leakage
psr inoident 14 MeV neutron. 4\V'< ••' >^.,- ,*«., ••*£„•..,
Impure thorium blankets, neutron multiplioation is both
due to (n,2n) and (n,f) reactions. Although the threshold for
Th ' (n,2n) reaotipn is *•» 8 MeV, the oross-seotion is relati-
vely high (** 1.7 barns). The maximum total multiplioation
obtainable with a thiok ( >25 om) thorium blanket is *\ 2.08.
Sable 9.2 summarises the results* It is seen that the (n,2n)
contribution to total neutron multiplioation is more than the
fission contribution. As the thiokness is increased beyond
25 om, while the oapturea in thorium increases, the oattribu-
tion from (n,2n) and (n,f) remain constant. Fig. 9.1 shows
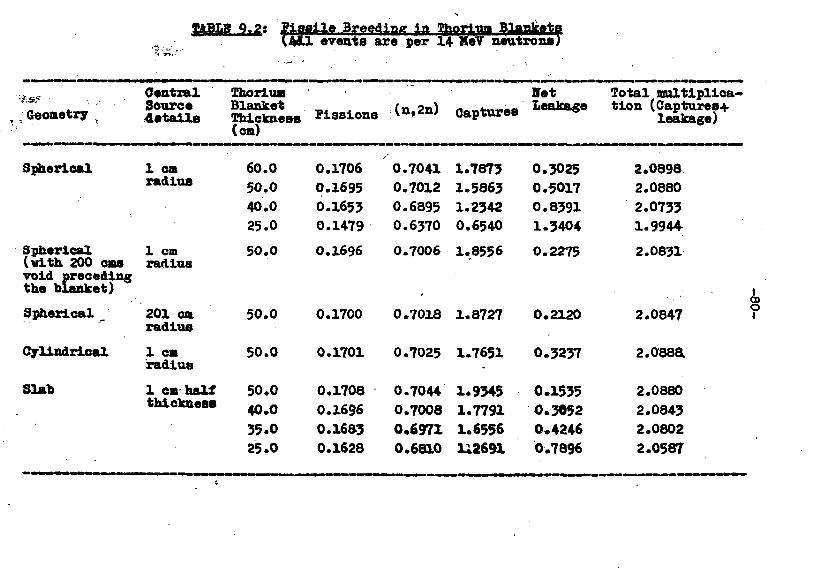
IABLB 9.2: Breeding la Thorium Blanketevents are per 14 MeV neutronsSnkejgsronsT
Geometry
Central ThoriumSource Blanketdetails Thickness Missions
(cm)CaptureB
Set Total multiplica-Leakage tion (Captures*
leakage)
Spherical
Spherical(with 200 cmsvoid precedingthe blanket)
Spherical _
Cylindrical
Slab
1 caradius
1 cmradius
201 cmradius
1 caradius
1 cm halfthickness
60.050.040.025.050.0
50.0
50.0
50.040.035.025.0
0.17060.16950.16530.14790.1696
0.1700
0.1701
0.17080.16960.16a?0.1628
0.70410.70120.68950.63700.7006
0.7018
0.7025
0.70440.70080.69710.6810
1.78731.58631.23420.65401.8556
1.8727
1.7651
1.93451.77911.6556U2691
0.30250.50170.83911.3404
0.2275
0.2120
0.3237
0.15350.30520.42460.7896
2.08982.08802.07331.9944
2.0831
2.0847
2.088a
2.03802.08432.08022.0587
?
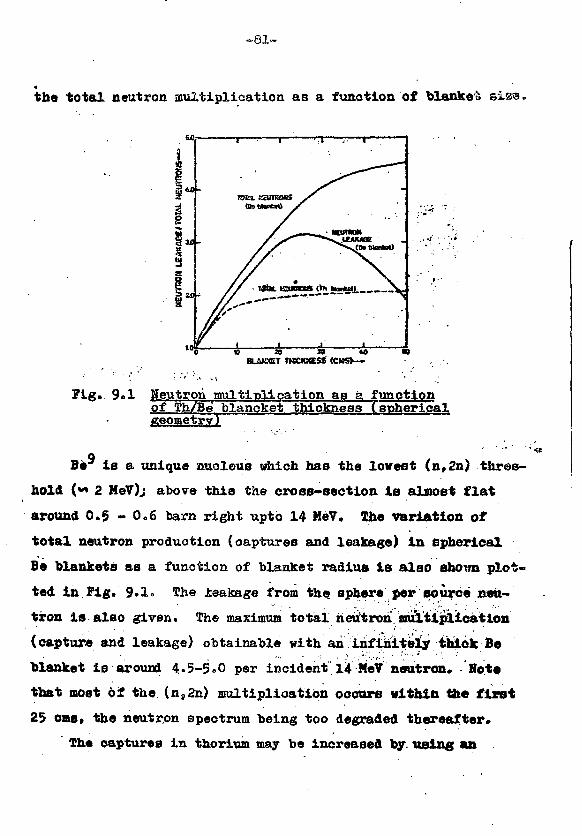
-81-
the total neutron multiplication as a function of blanket
£ 20 IS 108UMBET TKCKHESS (CHS>—
Fig. 9.1 Neutron imultlt>lication aa a functionof Th/Be blancket thickness (sphericalgeometryT
Be is a unique nucleus which has the lowest (n,2n) thres-
hold (*» 2 MeV)j above this the cross-section is almost flat
around 0.5 - 0.6 barn right upto 14 MeV. The variation of
total neutron production (captures and leakage) in spherical
Be blankets as a function of blanket radius is also shown plot-
ted in Fig. 9.1. The leakage from the. sphere per source neu-
tron is also given. The maximum totalneutron multiplication
(capture and leakage) obtainable with an infinitely thiok Be
blanket is around 4.5-5°O per incident 14 MeV neutron. Rot*
that most of the (ns2n) multiplication occurs within the first
25 one, the neutron spectrum being too degraded thereafter.
The captures in thorium may be increased by. using an
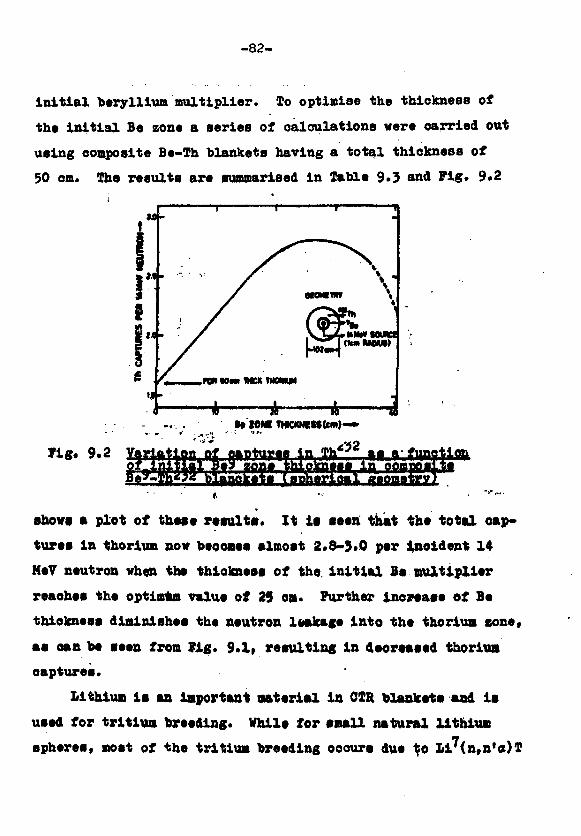
-82-
lnltlal beryllium multiplier. To optimise the thickness of
the Initial Be zone a series of calculations vere carried out
using composite Be-Th blankets having a total thickness of
50 cm. The results are summarised in Table 9.3 and Fig. 9.2
M WNf TMCKNCMCcm)—•
Fig. 9.2 Variation of captures in
show* a plot of these results. It it seen that the total oap-
tures in thorium nov becomes almost 2.8-3.0 per inoident 14
KeV neutron when the thickness of the. initial Be multiplier
reaches the optiumm value of 29 om« Further Increase of Be
thickness diminishes the neutron leakage into the thorium tone,
as oan be seen from fig. 9.1» resulting in deoreased thorium
captures.
Lithium is an Important material In OIR blankets and it
used for tritium breeding. While for small natural lithium
spheres, most of the tritium breeding occurs due to Li7<n,n'o)T
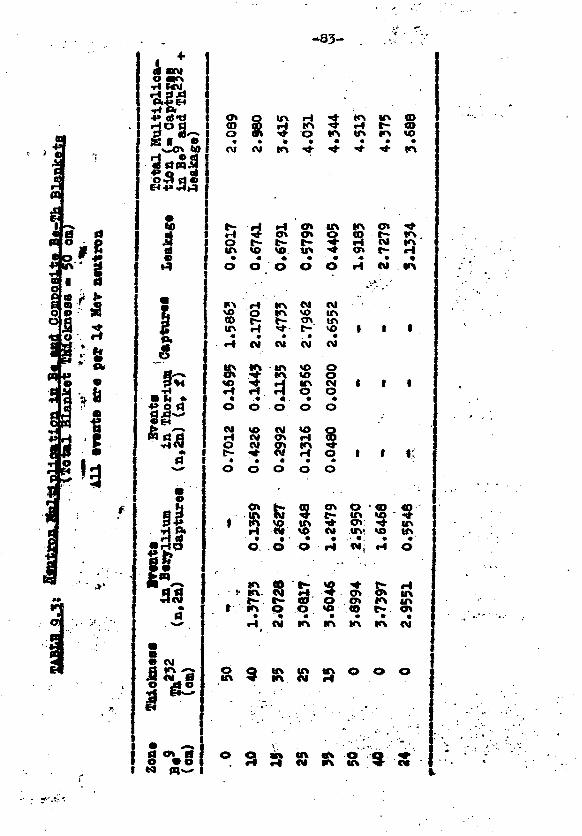
-83-
«M
1o rl
'3
*'
3ani
8
8I •
IPis *
•rini
*a3
o ch •* o« « « <*
in o o mO O . O O O H •• . lA
CO t - t - CT\ tf\in rl * • I - * I I Irf M <V Ol <M
i n «rt m to oo» •«*• to <o o
r4 in CM I I I
o o o o o
CM «© OI «O O
r • • CM H o i I I:o o o o o
Ot t*» CO O\ ^3 ; 00 -CO •''
J (f\ %O I^N ^* 4J i ! ^^ la^r l « y> CM «v «o ino o O H T3; H O
• v n v <M r l ^ , o» <J* i n^^ ' ^^* CO Ck O^ f^t 1^^
• ' " fl^\ 49 ^O ^ 1 ~ CO ^ ^ . O%
r l OI V\ H\ tf\ V\ <M
O Q m in in o © oin 5r * \ CM r l
O Q K« m «J> O. r l r« oi it\ m
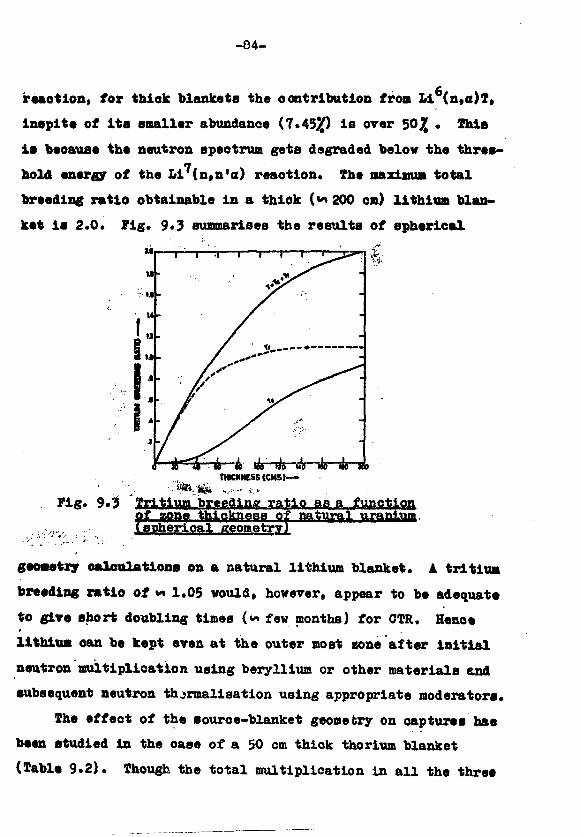
-04-
reaotlon, for tbiok blankets the oontributlon froa Li (n,o)T,
ineplte of its smaller abundance (7.45^) is over 50 jj . This
la beoauae the neutron speotrun gets degraded below the thres-
hold energy of the Li'(n,n'o) reaotion. The maximal total
breeding ratio obtainable in a thiok (*»200 cm) lithium blan-
ket is 2.0. Fig. 9«3 summarises the results of spherical
THICKNESS (CMS)-*
Fig. 9*3 Tritium breeding ratio aB a function
spherical geometrynatural uranium.
geometry calculations on a natural lithium blanket. A tritium
breeding ratio of v» 1.05 would, however, appear to be adequate
to give short doubling times (•* few months) for CTR. Hence
lithium oan be kept even at the outer most eone after initial
neutron multiplication using beryllium or other materials and
subsequent neutron thjrmaliaation using appropriate moderators.
Ihe effect of the source-blanket geometry on captures has
been studied in the case of a 50 cm thick thorium blanket
(Table 9.2). Though the total multiplication in all the three
-85-
geoaetries is the same, the capture is minimum in. the caeo of
* sphere with a central point source and maximum for dab geo-
••try with • plan* source. If a 200 cm radial gap it intro-
duced between the source and blanket in spherical geometry,
captures increase for the same thickness of blanket* These are
geometrical effeots following from the increased path length
available for the neutrons after collisions within the blanket.
Further studies of CTR blanket neutronics are in
/I/ Lidsky. L.M., M FisBion-Fusion Systems; Hybrid, Symbioticand Augean", Nucl. Fusion, 25. (1975)
/2/ Garg.S.B., BARC report to be published (1976)
/3/ Abagyan, L.P. et al, " Group Constants for NuclearReactor Calculations" (1964) : .
3*10 Neutron "I'tsBi.on Phenomena in Explodim? Wires andother Dense Plasmas(Anurag Shyani, M. irinivasan and R. Chidambaram)
SeTeral laboratories have observed neutron production
from dense plasmas created by pumping a few kilojoules of elec-
trical energy in deuterium or a mixture of deuterium and tri-
titra. While the neutron production is attributable to (DtO)
or (D,T) reactions depending on the observed neutron energy
there is considerable speculation as to whether the mechanism
of neutron production is thermonuclear in nature or la due to
acceleration of Ions in a local electric field. In recent
time* neutron production has also been reported from exploding
wires, of thin natural polymer fibres.
-86-
Bxperiaents have been initiated in this, field at froabay.
fo begin with the technique of deteotion of neutrons wae stan-
dardised. As the neutrons are emitted i» a very short dura- .
tion burst (««* 100 ns) and are aeoonpanieA by considerable
eleotromagaetle and x-ray background it was deoided to vac an
integrating type neutron detector. A silver foil aotivatios
counter was fabricated using a 12 oa dUmeter;'|«di;tl.OWv'*i -
tbiok silver foil. She foil thiokneM was optiiftised to «et
saxiauK neutron absorption and minima loss of betas due to
self absarptioa. . She 23 seoond half life Ag 1 0 9 aotiTity was
aeasured by a plastio (styrene) scintillation counter. A .5 oa
thick styrene Moderator va« kept between the neutron Board*- • « ! £ v * . • • • • i - r .. • ; ; . • .
and the silrer foil to thermaliso the 2.5 HeV neutrons pro<iuood
in (D»D) reaction. Several slabs of atyrene were a&to iitaokod.
all around to reduoe neutron leakage* The Befttp,.yat" oal&brated
using standard neutron eouroee and the deteotion efficiency of
the eyetca was found to be *i 2 to 5 x 10"" counte/neuiron
depending on the experimental arrangement.
Preliminary experimente were oonduoted by exploding ovdi*
nary nylon fibres of one om length and 50 s4ortH»:,<|isjMtsr. *;'.
coated with a4uadagr using a capacitor I^^^^^^il^^in^ •
at the fflasaa fhyslds Section of BARO* *o ng^tronf havs bsi»
deteoted so, far preeumebly beoaus^. of the large induotanas of
the sot up. It is .proposed to repeat thett ix|ioriatttit «Jln(
deuterated polyethylene fibres whioh are being prepares with
the help of Oheaistry Division, BARO.
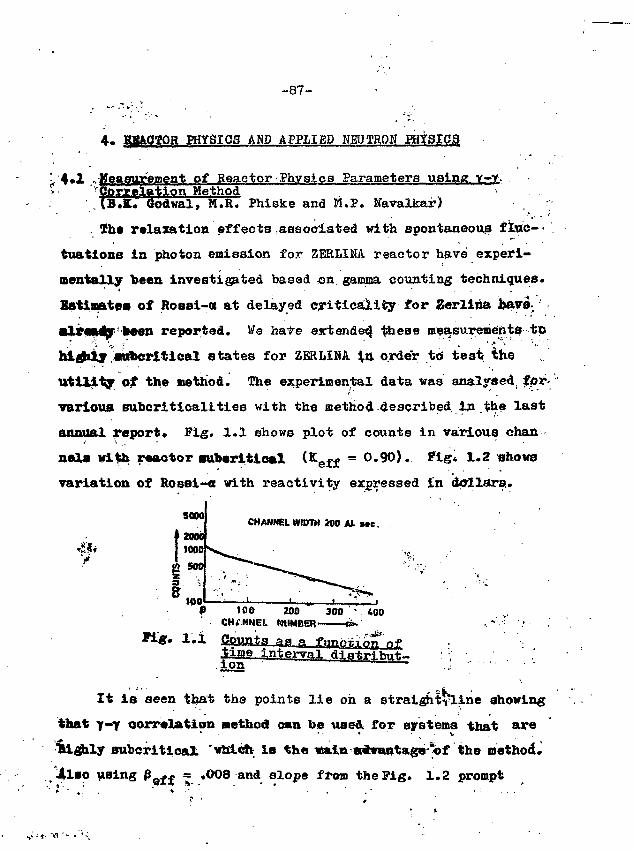
-87-
4. IpSAOIOR PHYSI03 AMD APPLIED NgUTROfl PHYSIC3
'• 4«X -Measurement of Reactor Physics Parameters using v-v.•» Cpry^lation Method •
' (B.k. Qodwal, M.R. Phiske and M.P. Navalkar) •;
... The relaxation effects associated with spontaneous fluc-
tuations in photon emission for ZERLINA reactor have experi-
mentally been investigated based on gamma counting techniques.
Estimates of Rossi-« at delayed criticaliiy for Zerlina bavo-
'keen reported. We hate extend©^ these measurements to
•nbcrltical states for ZERLIHA ^a order to* test; the
utility of the method. The experimental data was analysed, fpr-
various suhcriticalities with the method described in the last
annual report« Fig. 1.1 shows plot of counts in various chan
nela vita reactor suberitical ( eff = 0.90). Fig* 1.2 shows
variation of Rossi-a with reactivity expressed in (krllara.
5000CHANNEL W»TH 200 Ai. sec.
• 2000"£ii I 1000* I 500
»0OJ9 100 200 300 400
CHANNEL NUMBER B-
gWWta aw..a ttxme intervalion
It is seen that the points lie oh a stralghtrline showing
that y-Y correlation method can be used for systems that are
highly oubcritical waich is the «aln «t*antag«-%t the method.
4l«o using p rf, = .008 and slope from the Fig. 1.2 prompt
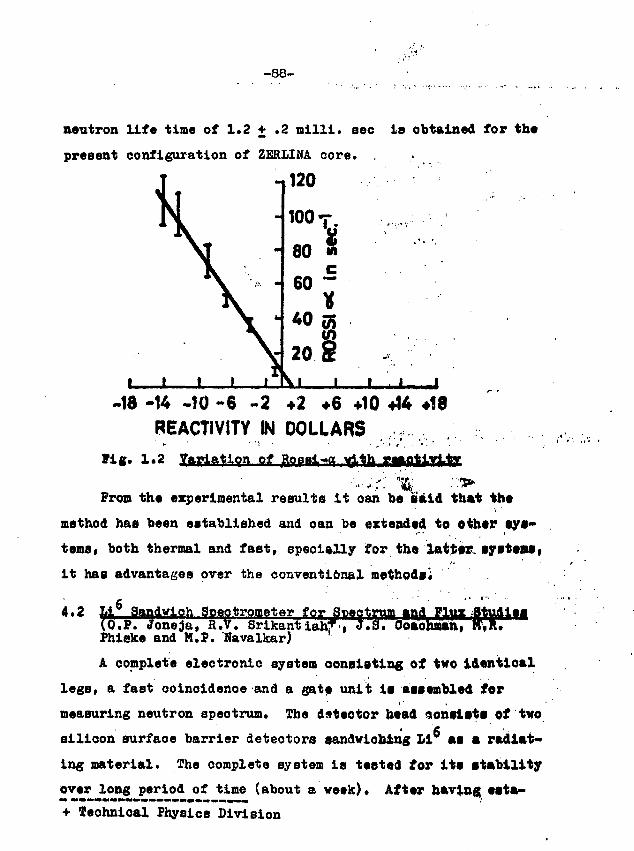
-88-
neutron life time of 1.2 + .2 nilli. sec is obtained for the
present configuration of ZERLINA core. , . •
V1 1 f 1 I
100
80
60
40
20se
c:
Sz • '
i i i p
-18 -14 -10 - 6 - 2 42 46 +10 +14 +18REACTIVITY IN DOLLARS
Fig, 1.2 of
• »
From the experimental results it oan be said that the
method has been established and oan be extended to other sys-
tems, both thermal and fast, specially for the latter, systems,
it has advantages over the conventibnal methodsi
,64.2 Sandwich Soectrometer for Snactrum and Flux Studi
. . oneja, R.v. SrikantiahT,Fhieke and M.F. Navalkar)
I! Ooaohman,
A complete electronic system consisting of two identioal
legs, a fast coincidence and a gate unit is assembled for
measuring neutron spectrum. The detector head consists of two
silicon surface barrier detectors sandwiching Li as a radiat-
ing material. The complete system is tested for its stability
over long period of time (about e week). After having, esta-
+ Technical Physics Division
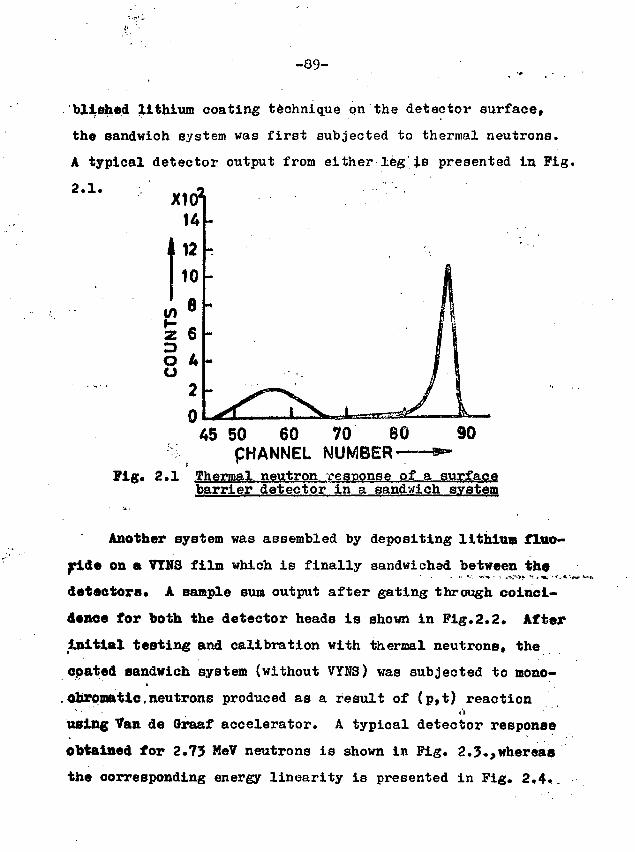
-89-
blished lithium coating technique on the detector surface,
the sandwich system was first subjected to thermal neutrons.
A typical detector output from either leg is presented in Fig.
2.1.
090
Fig. 2.1
45 50 60 70 80pHANNEL NUMBER
Thermal neutron response of a surfacebarrier detector in a sandwich system
Another system was assembled by depositing lithium fluo-
ride on a VYNS film which is finally sandwiched between the
detectors. A sample sum output after gating through coinci-
dence for both the detector heads is shown in Fig.2.2. After
initial testing and calibration with thermal neutrons, the
coated sandwich system (without VYNS) was subjected to mono-
.ohromatic,neutrons produced as a result of (pft) reaction
using Van de Graaf accelerator. A typical detector response
Obtained for 2.73 MeV neutrons is shown in Fig. 2.3.,whereas
the corresponding energy linearity is presented in Fig. 2,4..
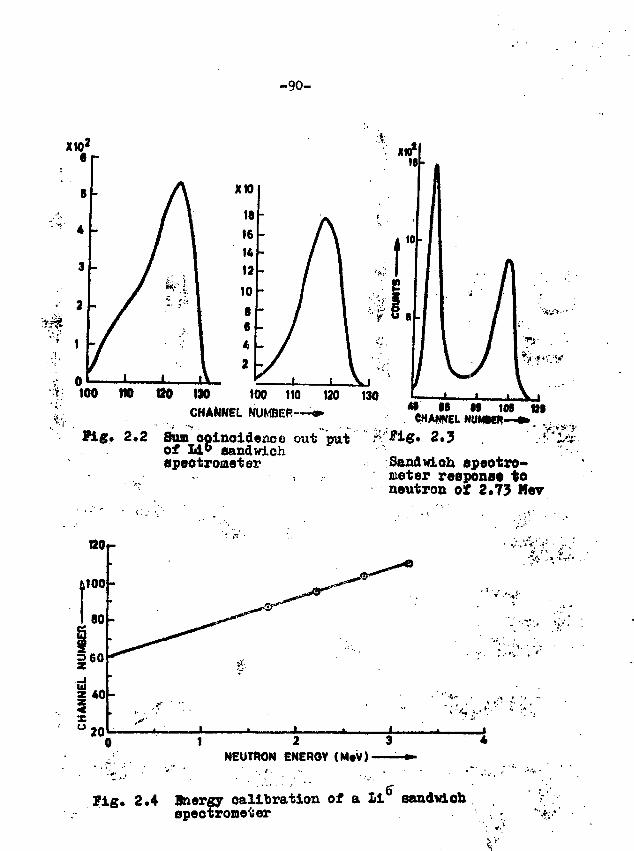
-90-
100
Fig
110 tOO 110
CHANNEL NUMBER-
2.2 Sum ooinoidenoe out patof Llb aandwiohspeotromater
«• IS M tM t»CHANNEL
Sandwioh epeotro-meter reaponst toaeutron of 2,73 Mev
BOr
so
60
xu
40
201 2 3
NEUTRON ENERGY (M»V) •
• v1
• . ' * ' ; • • ; ' • •
• • v .'-.,?•
• • " , >.••:•
Fig* 2.4 Bnergy calibration of a Li° sandwichepeotrometer
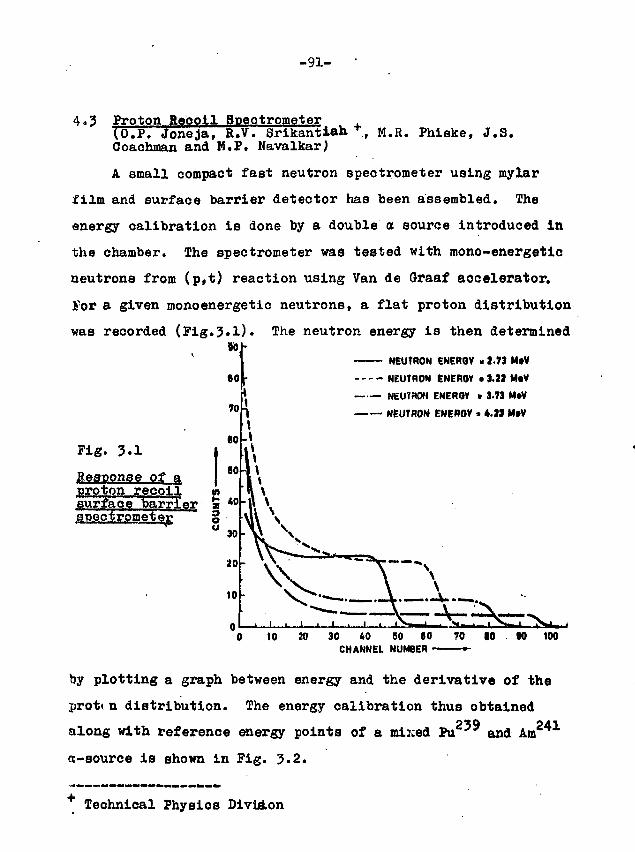
-91-
4.3 Proton Recoil Spectrometer(O.P. Joneja, R.V. Srikantiah *., M.R. Phiske, J.3.Coachman and M.P. Navalkar)
A small compact fast neutron spectrometer using mylar
film and surface barrier detector has been assembled. The
energy calibration is done by a double a source introduced in
the chamber. The spectrometer was tested with mono-energetic
neutrons from (p»t) reaction using Van de Graaf accelerator.
For a given monoenergetic neutrons, a flat proton distribution
was recorded (Fig.3.1). The neutron energy is then determined90
NEUTRON ENERGY »1.73 MtV
NEUTRON ENEROY • 3.21 M«V
— NEUTRON ENEROY • 3.7] MtV
SO
70 NEUTRON ENEROY . *.J3 M»V
(0
80
Fig. 3.1 I
Response of a jproton recoil «nsurface barrier z *° •spectrometer §
20
10
to 20 30 40 SO «0CHANNEL NUMBER -
70 •0 N
by plotting a graph between energy and the derivative of the
proti n distribution. The energy calibration thus obtained
along with reference energy points of a mijced Pu2'^ and Am 2 4 1
ct-source is shown in Fig. 3.2.
Technical Physics Dividon
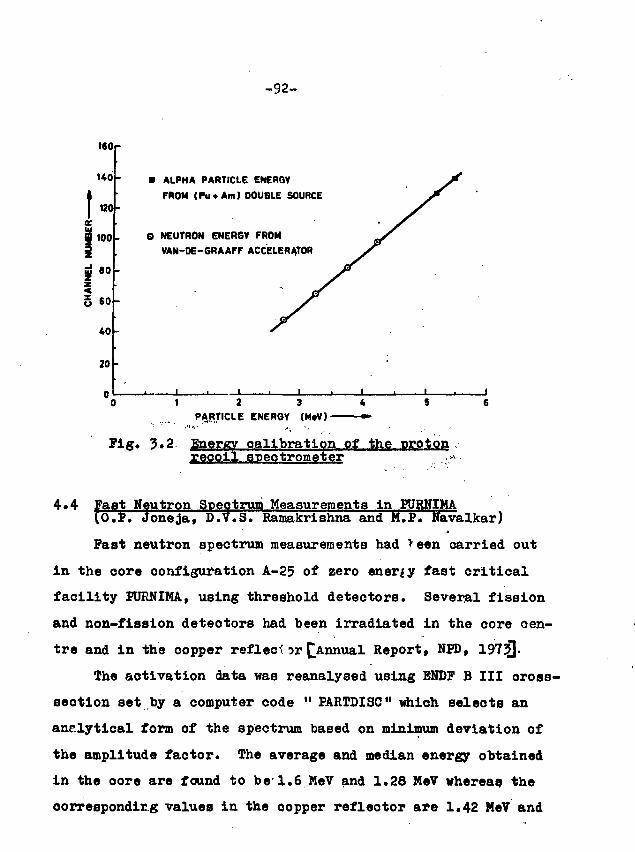
- 9 2 -
160 -
uo-
I 120-x| 100-
jjj 80 -
g 60 -
40 -
20 -
• ALPHA PARTICLE ENERGV
FROM ( P u t Am) DOUBLE SOURCE
© NEUTRON ENERGV FROM
VAN-DE-GRAAFF ACCELERATOR
0 1 2 3 4 5PARTICLE ENERGV (M»V) -
Fig. 3»2. Energy calibration of the protonrecoil spectrometer
4.4 Past Neutron Spectrum Measurements In PURNIMA
(o.P. Joneja, D.V.S. Ramakrishna and M.P. Navalkar)
Fast neutron spectrum measurements had >een carried out
in the oore configuration A-25 of zero energy fast critical
facility HJR.NIMA, using threshold detectors. Several fission
and non-fission detectors had been irradiated in the core cen-
tre and in the copper reflect or [ Annual Report, NPD, 1975]-
The activation data was reanalysed using BNDP B III cross-
section set by a computer code " PARTDISC" which selects an
analytical form of the spectrum based on minimum deviation of
the amplitude factor. The average and median energy obtained
in the oore are found to be 1.6 MeV and 1.26 MeV whereas the
oorrespondirg values in the copper reflector are 1.42 HeV and
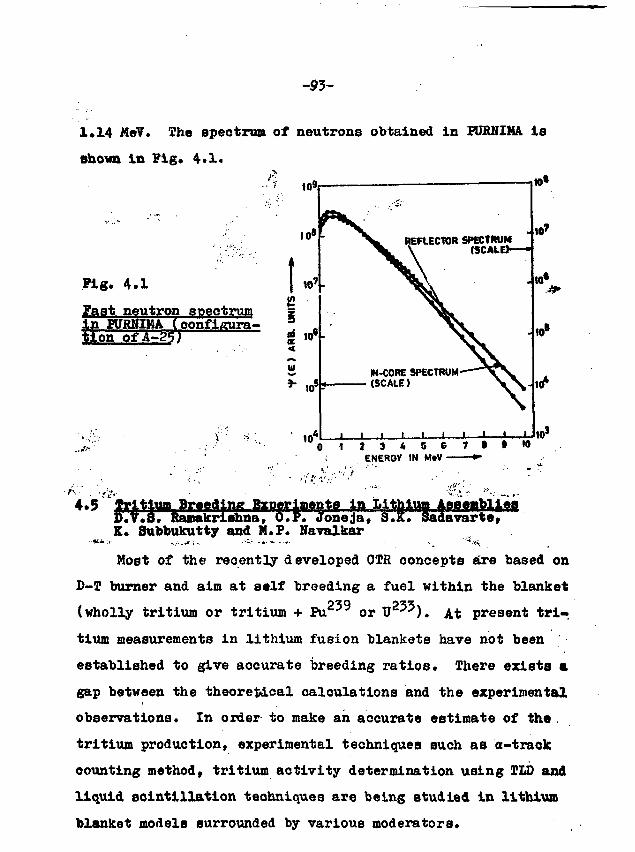
-93-
1.14 WeV. The spectrum of neutrons obtained in PUBNIMA. is
Bhovn in Fig. 4.1.
•A ,..
Pig. 4.1
fast neutron spectrumin FURHIKA tconfigura-tion of A«^25)
to' J U I I 1 ' • ' '
to«
2 3 4 5 6ENERGY IN MlV -
7 B t 10
•>"•• • •;:;<•••
4.5 tium in. L 1th It). Ramakrishna, O.P. Joneja, 8.K.
K. Subbukutty and M.P. Navalkar
Host of the recently developed OTR concepts tire based on
D-T burner and aim at self breeding a fuel within the blanket
(wholly tritium or tritium + Pu2'9 or U 2 ^ ' ) . At present tri-
tium measurements in lithium fusion blankets have not been
established to give aocurate breeding ratios. There exists %
gap between the theoretical calculations and the experimental
observations. In order to make ah accurate estimate of the
tritium production, experimental techniques such as a-track
counting method, tritium activity determination using TLD and
liquid scintillation techniques are being studied in lithium
blanket models surrounded by various moderators.
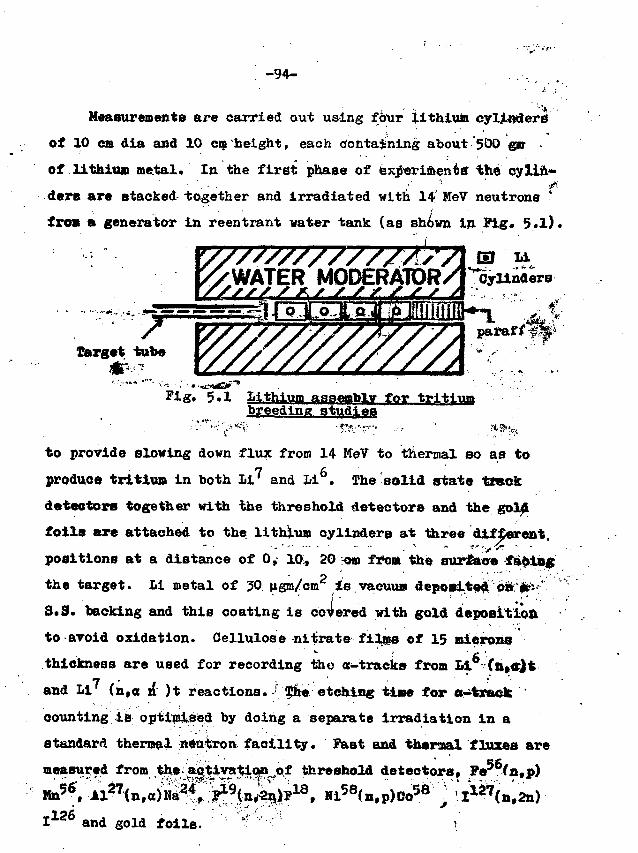
-94-
" • * .
Measurements are carried out using four lithium cylinders
of 10 cm dia and 10 cm height, each containing about '500 gnr •
of lithium metal* In the first phase of experiments" the cylin-
dere are stacked- together and irradiated with 14 MeV neutrons '
from a generator in reentrant water tank (as shown in Fig. 5.1).
^/WATER MODERATOR/
Pig, 5»1breeding studies
to provide slowing down flux from 14 MeV to thermal so as to
produce tritiun in both Li' and Li . The solid state track
detectors together with the threshold detectors and the gold
foils are attached to the lithium cylinders at three different,...... ..... • .... _ .. *--.,•£
positions at a distance of 0, 10, 20 KM from the surface fa6ing
the target. Li metal of 30 gm/cm2 is.vacuum deposited.''oSsr:*#t -*\
3.9. backing and this coating is cohered with gold deposition
to avoid oxidation. Cellulose nitrate films of 15 microns
thickness are used for recording the a-traeks from Li (a,a)t
and Li' (n,«t n )t reactions. The etching tiae for o-track
counting is optimised by doing a separate irradiation in a
standard thermal neutron facility. Fast and thermal fluxes are
measured from the activation of threshold detectors, Fe56/n,p)
I 1 2 6 and gold foils.
-95-
In a typical observation, for a total fluence of 2 x 10
neutrons,the ratio of tritium produced at a distance of 10 and
20 cm is found to be 5.5 + 10^ . Theoretical calculations
using Monte Carlo method gave a ratio of 3.0 +10J< Absolute tri-
tium breeding and breeding ratio per 14 MeV neutron is being
analysed.
Monte Carlo method in 2-D geometry is being applied .to
calculate tritium breeding per 14 MeV neutron with other mode-
rator assemblies such as graphite and beryllium oxide. The
experiments with these moderators are under progress.
4.6 Angular Distribution of Neutron Flux from a 14 MeVNeutron generator(B.V.3. Hamakrishna, S.K. Sadavarte and M.P. Navalkar)
Even though T (d,n)He* reaction is assumed to be ieotro-
pic in centre of mass frame of reference, the neutron flux
density obtained from a neutron generator employing this reac-
tion is not quite isotropic. Large variations in anisotropy of
the target neutron flux pattern, particularly in case of aged
targets,are observed by various workers. The isotropy is
influenced by the neutron kinetics and the target holder geo-
metry. It is therefore important to know the angular distribu-
tion of neutron density and energy for a (d,t) source.
Angular distribution of neutron flux from the generator
operating with a deutron beam of 140 KeV on a thick tritium
target, has been measured using threshold reaotion of P • (n,2n)
P . Teflon foils containing 75.98£'of flourine are utilised
for the purpose. The foils are attached to a metal frame of
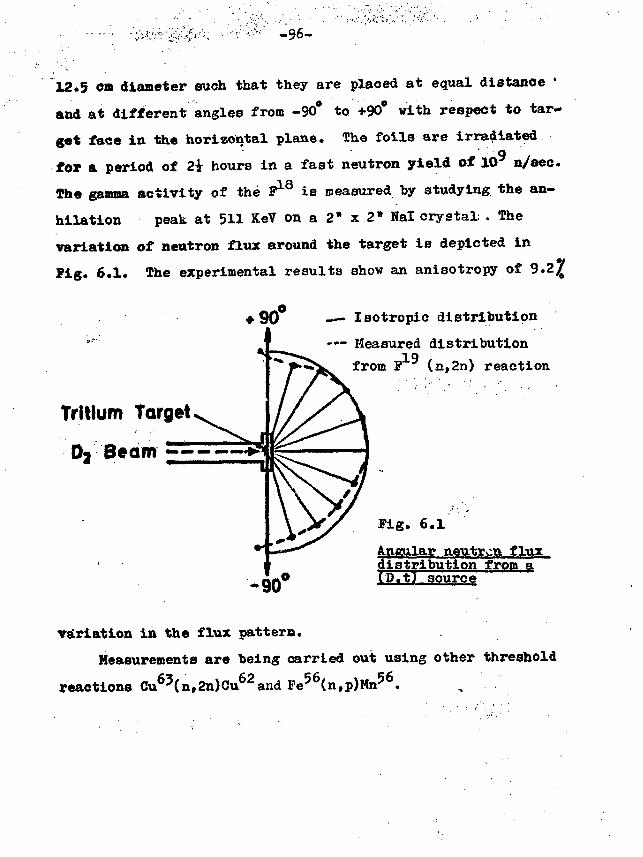
, ' . " - ' - ' • • " , . ' •
-96-
12.5 ca diameter such that they are placed at equal distance '
and at different angles from -90* to +90° with respect to tar-
get face in the horizontal plane. The foils are irradiated
for a period of 2i hours in a fast neutron yield of 10 n/sec.
The gamma activity of the P 1 8 is measured by studying the an-
hilation peak at 511 KeV on a 2' x 2* Hal crystal . The
variation of neutron flux around the target is depicted in
Pig. 6.1. The experimental results show an anisotropy of 9.2^
04-90 Isotropic distribution
— Measured distribution19
from P (nf2n) reaction
Tritium Target
D2 Beam «—— —
Pig. 6.1
Angular neutron fluxdistribution from a(D.t) source
variation in the flux pattern.
Measurements are being carried out using other threshold
reactions Cu63(n,2n)Cu62and Fe56(n,p)Hn56.
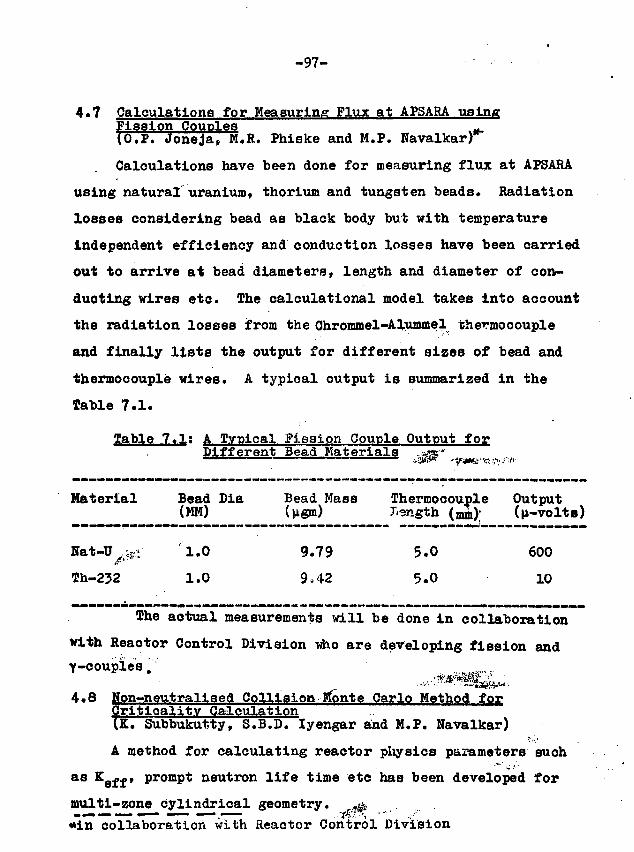
-97-
4.7 Calculations for Measuring Flux at APSARA usingFission Couples -
(O.P. Joneja, M.R. Phiske and M.P. Navalkar)
Calculations have been done for measuring flux at APSARA
using natural uranium, thorium and tungsten beads* Radiation
losses considering bead as black body but with temperature
independent efficiency and conduction losses have been carried
out to arrive at bead diameters, length and diameter of con-
ducting vires etc. The calculational model takes into account
the radiation losses from the Chrommel-Alummel thermocouple
and finally lists the output for different sizes of bead and
thermocouple wires. A typical output is summarized in the
Table 7.1.
Table 7.1: A Typical Pieaion Couple Output forDifferent Bead Materials «ss«
Material Bead Dia Bead Mass Thermocouple Output(MM) (ngm) length (mm); (n-volte)
Nat-U .;,-:- 1.0 9.79 5.0 600
Th-232 1.0 9,42 5.0 10
The aotual measurements will be done in collaboration
with Heaotor Control Division who are developing fission and
Y-couples.
4.8 Non—neutralised Collision-Mpnte Carlo Method forQrltloality Calculation(E. Subbukutty, S.B.D. Iyengar and M.P. Navalkar)
A method for calculating reactor physics parameters such
as Keff, prompt neutron life time etc has been developed for
multi-zone cylindrical geometry. ^
••in collaboration with Reactor Control Division
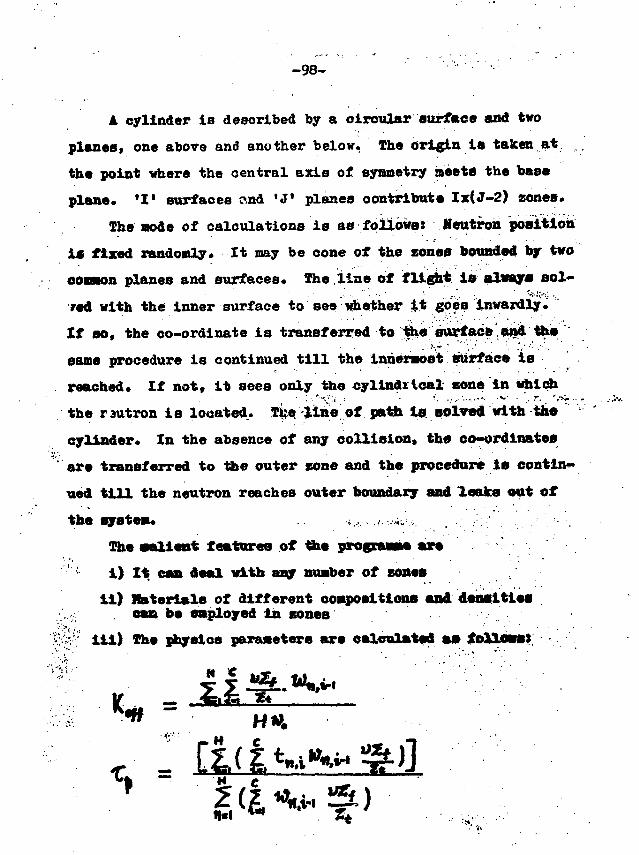
-98-
A cylinder is described by a circular surface and two
planes, one above and another below. The origin la taken at
the point where the central axis of symmetry meets the base
plane. 'I' surfaces end 'J* planes contribute Ix(J-2) zones.
The mode of calculations is as follows: Neutron position
is fixed randomly* It may be cone of the zones bounded by two
common planes and surfaces* The line of flight is always aol-
fsd with the inner surface to see whether it goes inwardly*
If so, the co-ordinate ia transferred to fee surface and ths
same procedure is continued till the innermost surface is
reached* If not, it sees only the cylindrical sons in which
the rsutron is located.. Tlbe, line of path Is solved with the
cylinder* In the absence of any collision, the co-ordinates
are transferred to the outer zone and the procedure is contin-
ued till the neutron reaches outer boundary and leaks out of
the system* .. . •.;.,,•. .<.-..-*v.;. . . .-::•• '.' . .' '..-- .
The salient features of the programme aare
' : 1) It can deal with any number of zones
11) Materials of different compositions and dsnsltles;'..,•; . can bs employed in zones
?,0 ill) The physios parameters are calculated a*
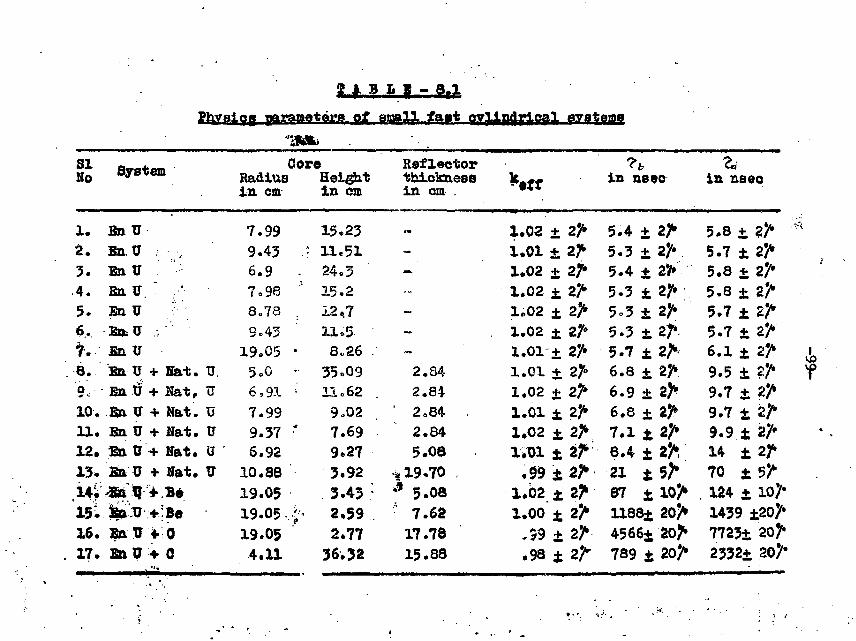
I f - 8f;L
Physio8 parsing taps of small fa>t oyi.iBdric&l
SINo System Core
Radius Heighti n cm i n em
Reflectorthicknessin cm .
in nsec in nseo
8.9c
1. BnU2 . Bn. U . .3 . BnU
.4. fin U. " ,•;•5. EnU :
6. SnvU :.
Bn U + Hat. U.En 3ff + Hat,. U
10. fin U + Nat. U11. Bn U + Nat. V12. En 0 + Nat. QT13* SnU + Nat. TJU i B4 IT > Be
16. BnV17. EnU
7.999.43 .*6.9 -7 = 988.78 .9c43
19.05 •5»0 -6,91 •'7.999.37 •6.92
10.8819.0519.05 ,.?'•19.054.11
15.2311.5124.315.212,7U.58*26 .
35»O911.62 .
9o027.699.273.92
. 3.43 :
2.592.77
36.52
--
-
2.342.84
' 2,842.845.08
•* 19.70** 5.08• 7.62
17.7815.88
1.021.011.021.021.021.021.011.011.021.011.02
+ 2>±Z?±2^±Z7>+ 2>± 2/*
2>
1.02 ±1.00 i
-39 +.98 ± 2^
5.4 + 2A5.3 + 2>5.4 + 2V»5.3 ± 2>5o3 + 2ft5.3 + 27*5.7 ±6.8 +6.9 ±6.8 +7.1 t8.4 ±21 t87 t1188± 20>4566± 20ft789 ± 20 ft
5.8 + 2)*5.7 t Zft5.8 + 2ft5.8 + 2>5.7 ± 2/"1
5.7+ 2>6.1 ± Zft9.5 ± ?7*9.7 + Zft9.7 ± Zft9.9 ± 27*14 ±2J*70 t 3ft124 ±14397723+2332+
-100-
<»'- HtO;
where "t-j is the time distance at the i* collision of the
Yl* neutron history from its origin and *^{-i *••> *n«
weight of the neutron at li-O^collision of TI** history.
During •tamclrtwg of each history, the numerator and denominator
are accumulated separately and K e f f and Tf 7L are found*
About 17 cylindrical systems were studied which are given
In Table 8.1.
4*9 A Dynamic Monte Carlo Method of Calculations for SmallEast Systems(X. Subbukutty, 8.B.D. Iyengar and M.P. Navalkar)
A multi-group* multi-zone Monte Carlo method of calcula-
tions has been developed for small fast systems to calculate
dynamic parameters such as neutron density, number of flesions
etc as a function of time for source neutrons introduced in
: the system. Various variance reduction techniques such as use1 -Vt
of weights, splitting, sampling at census times, russian rou-
lette etc have been employed.
The method was tested for spherical geometry like
JEZEBEls for v*iich parameters are known. Pig. 9.1 shows the
tine variation of neutron density introduced at the centre of
a spherical Pu 2 5 9 system. The oritical radius thus obtained
is 6.5± 0.2 cms, which is in very good agreement with the
reported value.
If6514
SPHERE RADIUS * 57 Cms.
j ^ y .0.032time when
equilibrium o£ is reached
C 2
c
t
sec""1
8 12 16 20 24t in n sees - ^
28 32 36
o
40
Fig. 9.1 lime variation of neutron denaitv for P pn ^system
-102-
4*10 Beutralised Collision Monte Carlo
TK7 Subbukutty, 3.B.D. Iyengar and M.P* Havalkar)
In the usual Monte Carlo method, the weights change ran-
domly* In order to reduce the variance, a Konte Carlo method
based on neutralised collision is used wherein the weight is
changed continuously with time while the collision parameters
are trausformed so that the expected number of neutrons, C ~
vif, T"*_ at every collision is always unity. This is
don* by using
V ~^m *~where 1 is the usual mean free path
L' is the transformed mean free path
v m velocity of the neutron
The weight is changed, as mentioned earlier, continuously with
time as follows:
Based on this method, a Konte Carlo programme for spheri-
cal geometry has been written. It has been tested for JSZBBEL
system for various degrees of oriticality to find critical
radius. Pig. 10.1 gives N(t) as a function of time for a radi-
us equal to*6 cm where as Fig. 10.2 shows a as a funetion of
radius. Proa the curve, a critical radius of 6.5 on is
obtained whioh is in good agreement with the reported value of
6.3 em.
10'
10
Fig. 10.1
Neutron density asa function of time
Sphef* WMJHIS • 6.0 Cms
ae •, 0.02 n Met"1
I 1 L i i
0 12 24 36 46 60 72 8* 96 108 120TIME W n MCS. s»
040 h
ao<
f ao2
^KLg. 10.2
» * >M/ 7.0 t4 »-0 io.9 Alpha as a function
RADIUS IN CM.-—». raaiua for a£ u a t£u_aystem
-104-
4.11 Feasibility Stndiea for Carbon-Oxygen Method for Oil
?'ell loggingD.V.S. Ramakrishna, S.K. Sadavarte, Jagir Singh,L.A. Marayana*and M.P. NavalkarJ. .
• • • • • . • . > s • '• • - .
The standard method for oil logging is the poised neutron
technique where neutron life time which is a function c> for-
mations is dat attained to find oil zones* However, such a
method cannot be used if fresh water* is present as in the
Assam fields unlike in Ankaleshwar where salinity is more than
30 %• This necessitates using other methods such as C/0 ratio
method which is of recent origin and not yet established*
Xaboratory experimenta^are -therefore undertaken 1 for feasi-
bility studies of such a method using 14 KeV neutron generator.
-. .. The C/0 ra+Iu method "consists in irradiating the forma-
tions with 14 Me? neutrons for a short duration and recording
inelaatically scattered y rays from carbon and oxygen. The
ratio of carbon to oxygen y rays establishes the presence of
hydrocarbons in the well, thereby differentiating oil and water
regions* ' • • . • • - • •-••••.-. •.-.• • > • : + v •• . -• .
Xaboratory experiments are performed by injecting the
neutron burst (20 usecs width with jr«patitioa rate of 3000 BZ
in a 2 1 dia x 31 length tank containing either water or oil
and detecting y I raja using Hal crystal. fi» 4ataotor ia shie>
ded from target by means of a steel plug of 4'* and a tins
gating circuit is used to do pulse height analysis of the y
spectrum to ensure counting of inelasticaUjr scattered y rays.
Fig* 11*1 shovif they rays spectrum recorded ritu inster and
oil depiotlng 6.13 MaT and 4.43 HeV photopaaks oharaOvt^ri0tl«0
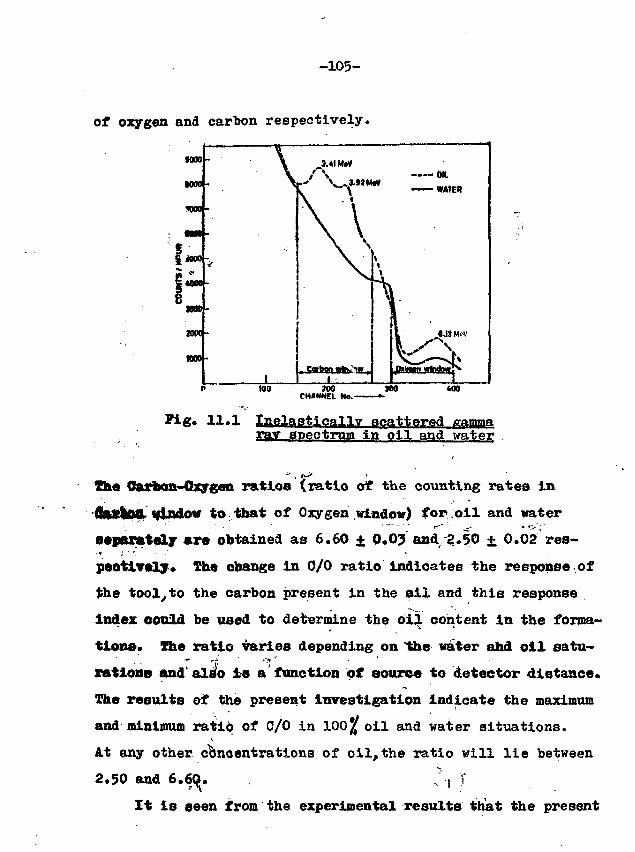
-105-
of oxygen and carbon respectively.
M O O -
1000 -
1000-
3080-
woo •
too
Fig* 11.1 Inelastically scattered gamma.in oil and water
Th« Carbon-Oxygen ratios (ratio of the counting rates in
flftxtttO. tfindow to that of Oxygen window) for oil and water
86par*tel7 are obtained as 6.60 ± 0.03 and 2.50 + 0.02 res-
peotiT«ly* The change in C/O ratio indicates the response of
the tool^to the carbon present in the ail and this response
index could be used to determine the oil content in the forma-
tions. The ratio varies depending on "the water and oil satu-
rations and'also ie a function of source to detector distance.
The results of the present Investigation indicate the maximum
and minimum ratio of C/0 in 100j|f oil and water situations.
At any other concentrations of oil,the ratio will lie between
2*50 and 6.60. .. I T
It is seen from the experimental results that the present
-106-
Method is feasible and can be applied for identifying the oil'
fcones in the formations • However, the experiments have to be
carried out to optimise the operational conditions for the
field applications using bore hole models and the detector
Bystem capable of withstanding elevated temperatures In the
neighbourhood of 120*C.
4.12 Development of Thermal Neutron Detectors working atElevated Temperatures for ONOGIY.DT Dande+, R.S. Udyavar+ and M.P. Navalkar)
OJfGC has imported pulsed neutron equipment for oil well
logging. It oonsists of eight BF, detectors which have to
operate at 120*C, 3Km down the bore hole. Prototype BF, and
Rtr detectors have been design ad, fabricated and tested in
laboratory to work at the elevated temperatures for a period
of .8 hours and have given satisfactory performance. The
detectors have been handed over for the field lests at
Ankalesbwar.
<;4.13 Progress Report on the Fabrication of a Sealed Neutron
"QJTv.S. Bamakrishna and T.S. Murthy)
A miniaturised sealed neutron tube for use in oil well
logging applications, is under development. An ion source Of
hot cathode type, consisting of a cylindrical anode and'a
tungsten cathode is utilised. Ferrite core magnet rings are:
used to produce about 300 Gauss field strength to increase the
helical path and to improve the ionization. Since, the proper
size magnets were not available, magnet rings of 1" i.d and
JL'iiL<>iL*_.}£ere .obtained in unmagnetised condition and the inter-
• Primary Isotope Section + Nuclear Physics Division ;•
-107-
nal diameter is increased to the suitable dimensions by ultra-
sonio impact grinding. The ion source output of 80 \ik is ob-
tained for deuterium filled at few micron pressure.
It is observed that when subjected to high voltage, there
is a pressure build up in the tube which is also responsible
for the high voltage breakdown. This is due to heavy degassing
of the components. It was therefore necessary to evacuate the
tube continuously in a furnace maintained at 400*0. Initially
the degassing rate was 100 |i/hr while it is reduced to 1 |i/hr
after 36 hours of degassing operation. The tube was later
operated for more than an hour with the ion source, under d-c
condition at 84 KV and the yield for (d-d) neutrons was obser-
ved to be about 10 fl/sec. Experiments are in progress to in-
vestigate various parameters involved in the fabrication of the
tube, such as degassing, order of loading components etc.
4.14 Design and Development of a 100 KV Pulse Generator
for the Neutron TubeJagir SinghJ
A 100 KV pulse having a width of 100 |isec and frequency of
400 HZ has been developed for testing of neutron tube.
IC(NE 555) is used as free running oscillator giving rec-
tangular pulses. The width and repetition rate of the oscilla-
tor can be controlled very conveniently by varying R & C. In
the present case they are adjusted for 100 (isec and 400 HZ
respectively. The IC output is used to drive the transistor
during circuit through a saturating toroidal core, which is
used as a base drive for the power transistors.
-108-
Number of power transistors are used in parallel to get t
sufficient colleotor current for the primary of the Transfor-
mer, which is-operated .at 50 volts DC. The current through
the primary of the transformer is turned 'on' and 'off by
switching action of power transistor. The 'on' period of the
transistors is dependent on the pulse width and the energy
t^nsfer takes place during this period. The energy transfer
from the primary of the transformer to the secondary as a high
voltage pulse is also dependent on the turns ratio of the
transformer and the primary current.
Inexpensive and locally available radio antenna ferrlte
cores are used as a core material for the transformer. Ferrite
being an insulating material, it can stand large voltage grad-
ient that appears along its length during the high voltage
pulse. The secondary of the transformer is made of sixteen
small sections each having 2500 turns. A special winding is
made to keep the capaaitance low and insulation high of each
coil. Mylar insulation is provided in each layers of the win-
ding to avoid layer to layer carona.
The pulse voltage was measured by spark method. The same
was verified by applying the pulse to a ten stage accelerator
tube using D-T reaction. The neutron output was compared with
f;3t obtained from accelerator operated with same pulse and
repetition rates. The pulse voltage was found to be 80 KV.
4.15 Puoplasmatron ion Source for 14 MeV Neutron Generator(S.K. Sadavarte)
In order to increase the neutron intensity of the genera-
tor a duoplaemetron Ion source4' has been fabricated* Tlu»V "
duoplaamatron la a high intensity source containing thrtefr . y, •:
electrodes and generates • electrons from a heated cathode. The
electrons are accelerated through an intermediate electrode
vhich also provides both electrostatic and magnetic focussing.n
I t has been assembled and vacuum tested. Various power sup}'
pl ies l ike filament supply, extractor supply, focusing supply-
•re-being made. ^
4*16 Pulaer for 14 MeY Meutron generator(M.a. FhLakm)
k palter baaed on bootstrap principle
of Turiable duration from 20-500 jieeo and a repetition rate of
3 KCS, Iheis been designed and dereloped'* I t i s used to pulse
th« ion eouroe of 14 HeV neutron generator. The puleer has
been used in connection with the feasibi l i ty studies of C/0
ratio method for o i l well logging.
+ H.8. Betigeri et a l . Nuclear Ihysios Division1
• • • • * i - r : . • • . • • . ' : • • • : * • • • : • * * • • ? . • • •• • • • - • * • • • •
-110-
5* 3B8B FHKKOMENOLOQY CAL0PLATION3
5*1 BBB Rock Mechanics Code Development(Satish C. Gupta, S.K. SIkka and R. Chidambaram)
a) Spherical Code ' "'
• brief description of the code was given in the 1974-75
annual report. The work on.this is almost completed. The
capabilities of the code are the calculations of
i) shock vaporization and melt radii •., <
ii) cavity growth
ill) shock and rarefaction waves positions
iv) distance (time) profiles for pressure, deviatoriestress, particle velocity, density etc.
v) vertical velocity of SGZ, initial mound growth,spal at a given depth and information about the*gao acceleration phase, if any. (For these, thecode gives approximate * results as the one-dimensional .symmetry of the problem is not validat the horizontal surface).
Further modifications envisaged are the introduction of tti»
effect of gravity, calculation of temperature profile* reeon-
ing and plotting of a given variable at a specified time.
,v The above code as applied- to the Pokaran test (V « 12 R >
gives the following results. The Hugioniot P-V data for shale
have been measured (Fig. l.l) and the 2 ys t (strength ourve)
estimated by a method proposed by us (the method is desoribed
la Seotion 5*2).
The vaporisation phase was found to be complete* at about
150 psec and the total mass of the rock vaporized was 640 -
•etric tons upto a radius of 4.1 meters from shot point.
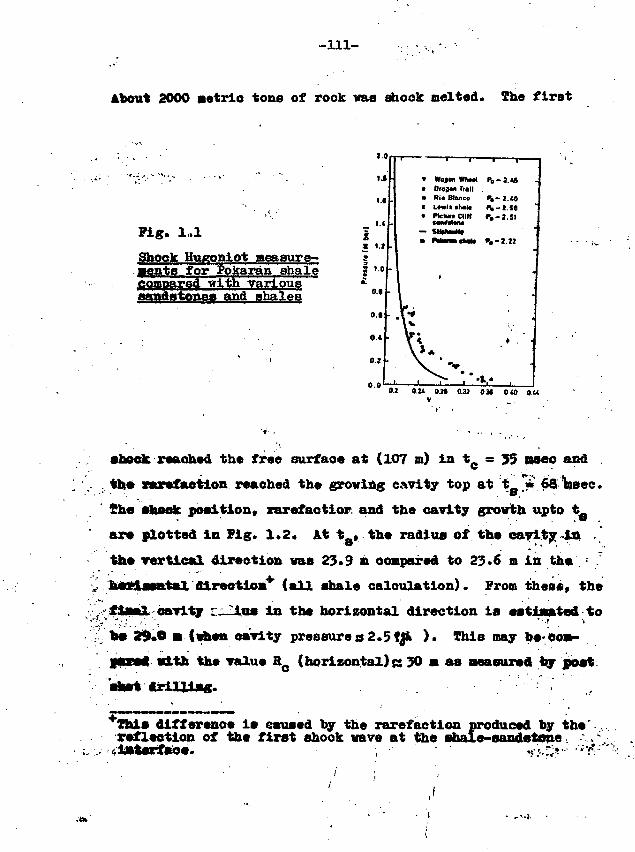
-111-
About 2000 aetrio tone of rook was shook melted. The first
Fig. 1.1Shock Hueoniot measure—yents for Pokaran shaleCQfflT
sandstones•with various
shales
02 O H 028 0.32 0]| 0 40 0.U
shock reaahed the free surface at (107 m) int c = 55 aseo aad .
. . the rarefaction reached the growing cavity top at t_ » 68 Wee.
tha shook position, rarefactior. and the cavity growth upto t
are plotted in Fig. 1.2. At to, the radius of the cavity, in .'
the vertical direction was 23*9 n oonpared to 23.6 m in the •
v ItMlssatal direction^ (all shale calculation). From these, the
fiaal cavity L^Iius in the horizontal direction ia estimated to• • • • « ? ' . • . ' . ' • . . • - . • • •
; b« 29.0 • (when cavity pressures 2.5 fjfc )• This may beeoo-
dLtb the value Rc (horizontal)« 30 si as oeasured toy post
4riUi»«.
This difference is caused by the rarefaction produced by the'reflection of the first shock wave at the shale-sandstone >~
r i * t « r f f t 6 e . ; •• • • •/'..:>••• •'••'?*-:
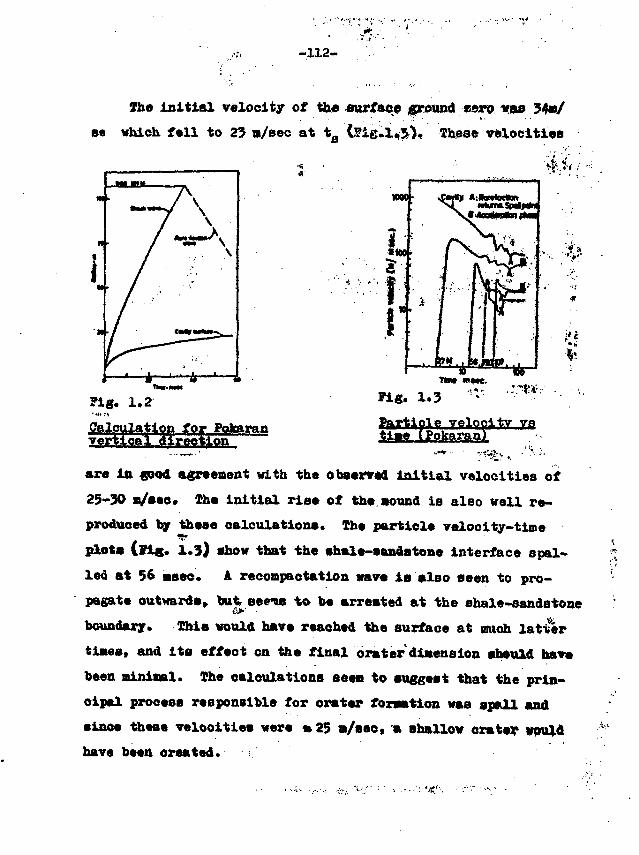
-112-
Ihe initial velocity of the surface ground *aro vae 34»/
a« which fell to 25 n/eec at t0 (£ig.l,3">. These velocities
?ig. 1.2
Calculation for fn*t*>r?_nvertical direction
Pig. 1.3
tlvelqeltv varan
are in «ood agreement with the obsenred initial velocities of
25-30 a/see* The initial rise of the «ound is aleo well re-
produced ty these oalculationa. The particle velocity-time
plots (Fig. 1.3) show that the shale-sandstone interface epal-
led at 56 msec. A recompaotation wave is also seen to pro-
pagate outwards» but Beetle to be arrested at the shale-sandstone
boundary. This would have reached the surface at much latiler
tiBest and its effect on the final braterdiaension sheuld have
been nininal. The calculations seen to suggest that the prin-
cipal process responsible for orater formation was spall and
since these velooities were » 25 a/sec, a shallow crater would
have been created. V
•••<••
I - 1 " -•the calculation in the oorisontal direction indioatea
the radius upto the initiation of fracture (actually failure)
is near 120 meters*. This is again in the region of obsarytfA • '
values 80-100 m. -...., ..., J.
b) Two Dimensional—AT!»I Svmmet'rJLo Code
This code is being developed to follow the cavity etfcl••*•'-•
mound growth after the shook reaches the free surface where
the one-dimensional code cannot be applied because of the
break-down of one dimensional symmetry. Thie code again uses
the finite-difference fora of the equations, describing the -. ,
conservation of mass, momentum and ©nergy. The typical calcu-
lational cycle is aimilar to that of spherical code. The code '
requires a memory of about 100 K and therefore, it has been
structured into overlays for adoption to BBSM-6 machine. I«t«ts-
aediate steps are stored on tapes* Debugging of the program •-••
is now over and some test runs are planned. ' **'
5*2 Strength Curvaa for Shales and Sandstgnes under»v Hydrostatic Co*rf±n^nfr Pressureo * ' *-••
(S.K. Sikka and SatishC.- Ouptal ; •
For production of the effects Of underground nuclear
explosions for peaceful applications by computer codes, the ;••
strength curve of the rock (oj»?0,)./2 va^ (Oj+Oj)/2* is an ;.
important input. This curve strongly iziflttfi&oes tha cavity
sise, crater sise atlarge^ depths of emplacement and deter- -
mines the amount of rock f raotuf ed by the underground explosion.The curve is experimentally derived from triaxial tests
icompressioni_tenaion ^ torgilon^eto.) on the rock camples, '*Also called failure envelope. a.ta9 and 0_ are the principalstresses at failure with o ^ a^y "3 •
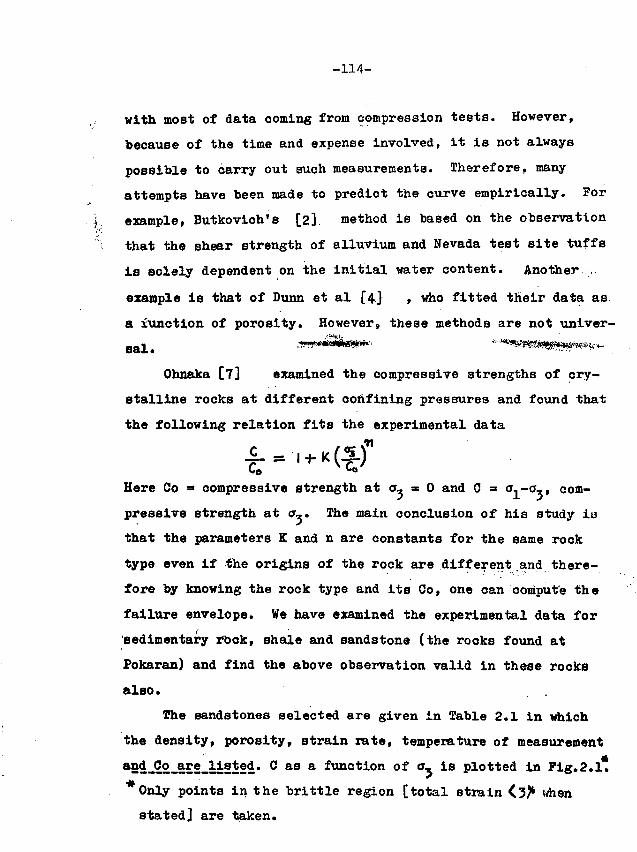
-114-
with most of data coming from compression tests. However,
because of the time and expense involved, it is not always
possible to carry out such measurements. Therefore, many
attempts have been made to predict the curve empirically. For
example, Butkovich's [2] method is based on the observation
that the shear strength of alluvium and Nevada test site tuffs
is solely dependent on the initial water content. Another .
example is that of Dunn et al [4} , who fitted their data as
a function of porosity. However, these methods are not univer-
Ohnaka [7] examined the compress!ve strengths of cry-
stalline rocks at different confining pressures and found that
the following relation fits the experimental data
Here Co =» compressive strength at a, = 0 and C = oy-cr,, com-
pressive strength at ov. The main conclusion of his study is
that the parameters K and n are constants for the same rock
type even if the origins of the rock are different and there-
fore by knowing the rock type and its Co, one oan compute the
failure envelope. Ve have examined the experimental data for
'sedimentary rock, shale and sandstone (the rocks found at
Pokaran) and find the above observation valid in these rocks
also. .
The sandstones selected are given in Table 2.1 in which
the density, porosity, strain rate, temperature of measurement
aS4_5.9._SE2_iiSiS^' C as a function of a- is plotted in Fig. 2.1.
#Only points in the brittle region [total strain <3> when
stated] are taken.
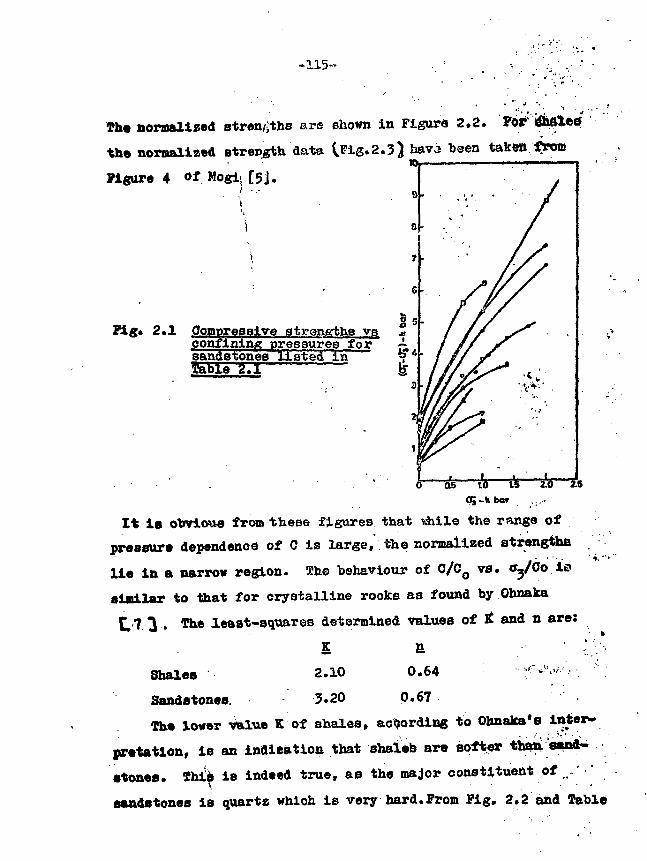
"115-
normalised strengths are ehown in Figurs 2.2. For
the normalized strength data {Vt@»2.3}
Figure 4 °* Mogi. [5j.
Pig. 2.1 Ctofflpressive strengths vsconfining pressures forsandstones listecHEntable 2.1
2.0 2505-fc bar ....
It is obvious from these figures that while the range of
pressure dependence of C is large, the normalized strengths,
lie in a narrow region. Th© behaviour of C/CQ vs. oyCo io
similar to that for crystalline rocks as found by Ohnaka
C-7 3 . The least-squares determined values of & and n are:
K a - •Shales 2.10 0.64 ••••-*-*?.;;.•;,•
Sandstones. 3.20 0.67
The lower value K of shales, according to Ohnaka•a
pretation, is an indiftation that shales are softer than sand-
stones. This is indeed true, as the major constituent o f , / '
sandetones is quartz which, is very hard.From Fig. 2.2 and Table
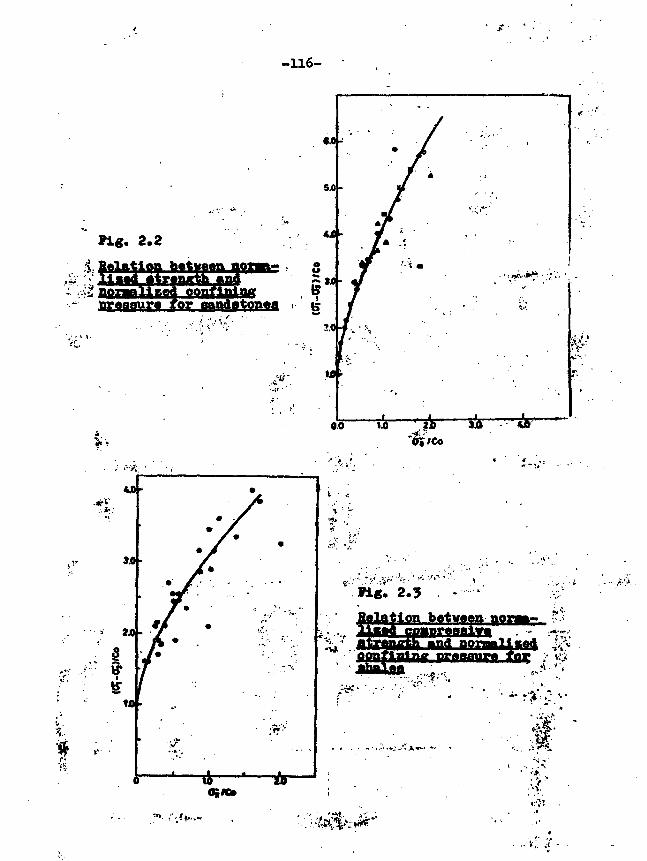
-116-
• • • > . ' • ' . .
' • ' , . . • ' • -
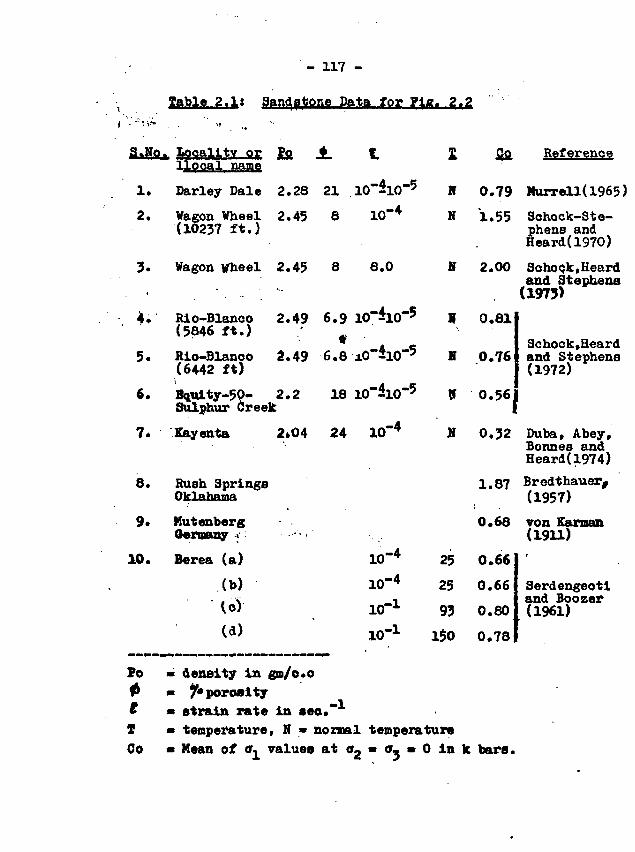
- 117 -
Table 2.1: Sandstone Data for Pig. 2.2
S.Nof locality or go •llocal name
1. Darley Dale 2.26 21
2. Wagon Wheel 2.45 8(10237 ft.)
Reference
10-4
3. Wagon Wheel 2.45 8 8.0
4. Rio-Blanoo 2.49 6.9 1O~$1O""5(5846 ft.) ' f
5. Hio-Blanco a.49 6.8 x0~$10""5(6442 ft)
6. Bquity-50- 2.2 18 1O~4IO~ 5
Sulphur Creek
Xayenta 2*04 24 10"
8. Rush SpringsOklahama
9* MutenbergQernany >
10. Berea (a)
(b)
(d)
10
10
10
10"
-4
-4
r1
Po
tTCo
-1
If
N
N
I
V
V
N
25
25
93
150
0.79
1.55
2.00
0.81
.0.76
0.56
0.32
1.87
0.68
0.66
0.66
0.80
0.78
Murrell(l965
Schoek-Ste-phens andHeard(l97O)
Sohock,Heardand Stephens(1973)
Schock,Heardand Stephens(1972)
Duba, Abey,Bonnes andHeard(l974)Brodthauer,(1957)
yon Karnan(1911)
Serdengeotiand Boozer(1961)
* density in gm/o*o• 7*porositym strain rate in •eo."m temperature, N • normal temperature* Mean of o^ values at o2 • ff- • 0 in k bars.
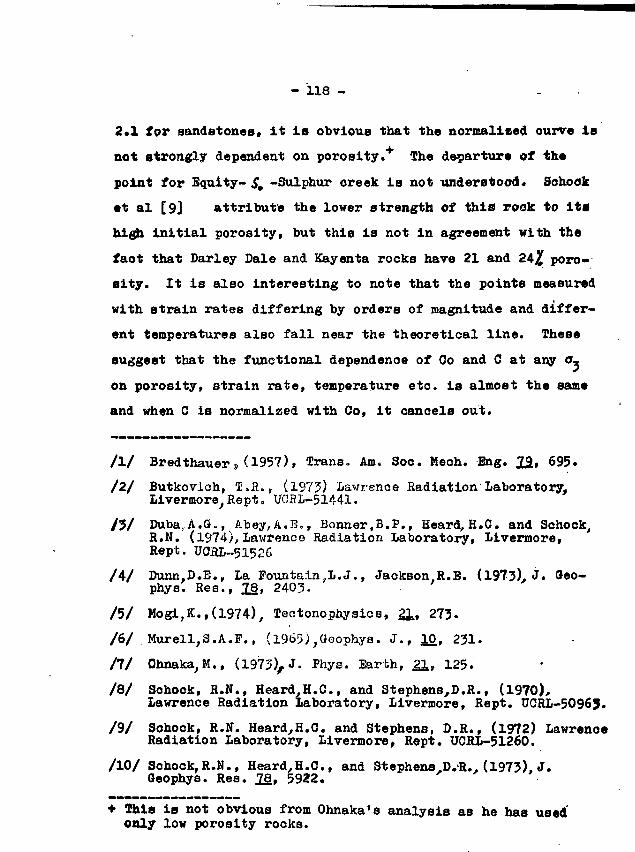
- 118 - -
2*1 for sandstones, it is obvious that the normalized ourve is
not strongly dependent on porosity."*" The departure of the
point for Equity- S, -Sulphur creek is not understood* Schook
•t al [9] attribute the lower strength of this rook to ita
high initial porosity, but this is not in agreement with the
faot that Darley Dale and Kayenta rocks have 21 and 24£ poro-
sity. It is also interesting to note that the points measured
with strain rates differing by orders of magnitude and differ-
ent temperatures also fall near the theoretical line. These
suggest that the functional dependence of Co and C at any o-
on porosity, strain rate, temperature etc. is almost the same
and when C is normalized with Co, it cancels out.
/l/ Bredthauer» (1957), Trans. Am. Soc. Meoh. Eng. 22» 695.
/2/ Butkovioh, T.fi., (1975) Lawrence Radiation'LaboratoryLivermore, Rept. UC3L-51441.
/3/ Duba,,A.G., Abey,A.B., Bonner.B.P,, Heard,H.C. and Schock,R.N. (1974), Lawrence Radiation Laboratory, Livermore,Rept. UCflL-51526
/4/ Dunn,D.E., La Founta±n,L.J., Jackson R.E. (1973), J« <*«o-phys. Res., JjB, 2403.
/5/ Mogi,K.,(l974), Teotonophysics, 21, 273.
/6/ Murell,S.A.P., (l965),Geophya. J., 10, 231.
/7/ 0hnaka;M., (1973), J. Phys. Earbh, 21* 125.
/&/ Schock, R.N., Heard H.C., and Stephens,D.R., (1970),Lawrence Radiation laboratory, Livermore, Rept. UCRL-50963.
/9/ Schock, R.N. Heard^H.C. and Stephens, D.R., (1972) LawrenceRadiation Laboratory, Livermore, Rept. UCRL-51260.
/10/ Schock,R.H., Heard^.C, and Stephens.D.-R., (1973), J.Geophys. Res. 2§, 5922.
+ This is not obvious from Ohnaka's analysis as he has usedonly low porosity rocks.
- 119 -
/ll/ Serdengecti, S. end Boozer, G.D., (1961), Penn. StateUniversity Min. Ind. Expt. Sta. Bull; J6, 83.
/12/ Von Karman Th., (l91l),Zeits Ver. deutsch. Ing. 5£, 1749.
5.3 Cavity Badius Calculation for Contained UndergroundNuclear Explosions(M.P. Hanga Rao+ and S.K. Sikka)
The radius of the cavity produced by a contained under-
ground nuclear explosion can be either calculated by numerical
computer codes from a knowledge of the material properties of
the medium in which the detonation takes place or estimated
from scaling laws of Higgins etal[3].The first""method involves
large oomputer time for one calculation while the second method
requires determination of the scaling constant from a large
number of shots in that medium. Its applicability to a new
rock in which no detonation have been previously carried out,
is limited. We have developed a method based on the analysis of
Chadwick et al [2] for cavity motion produced by TNT ex-
plosions in ideal soils. The ideal soils (clay, sand etc)
were assumed (a) to be incompressible and (b) to obey the
Coulomb'8 law for the onset of plastic flow. A two y adibatio
law was used for the expansion of TNT explosion products. Hogi
[4] has shown that the Coulomb's fracture criterion is
approximately valid for rocks except in the low pressure and
brittle ductile regions. Also, the nuclear cavity rock gases
obey the adibatic expansion law, with the exponent Y, a function
of the cavity radius. In view of these, we decided to apply
Ohadwick et al model to our problem. The results obtained
for the final cavity radii are surprisingly good, even though
J&ft.J'.2SJsS_J?ave been treated as incompressible.+ Mathematics Department, IIT, Bombay
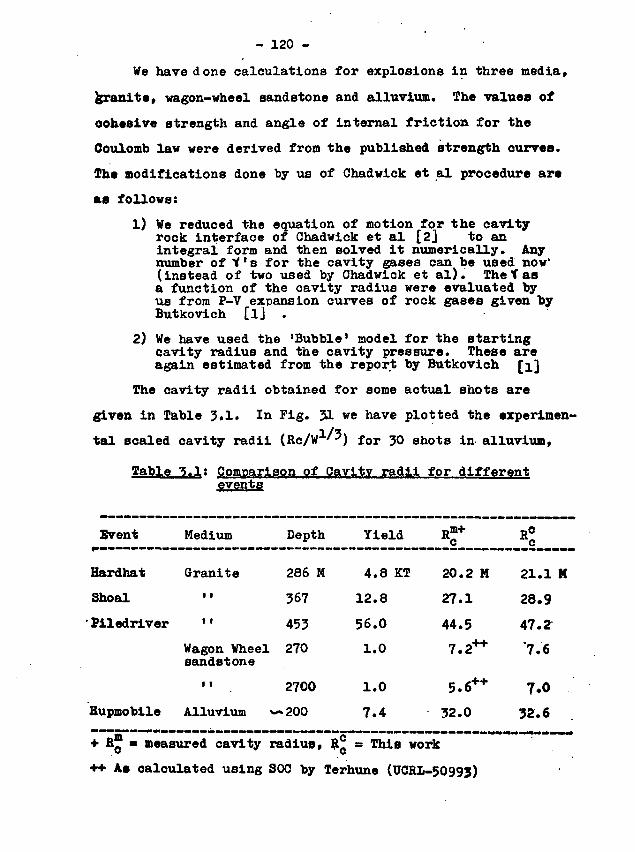
- 120 -
We have done calculations for explosions in three media,
granite, wagon-wheel sandstone and alluvium. The values of
cohesive strength and angle of internal friction for the
Coulomb law were derived from the published strength curves.
The modifications done by us of Chadwick et al procedure are
as follows:
1) We reduced the equation of motion for the cavityrock interface of Chadwick et al [2] to anintegral form and then solved it numerically. Anynumber of K's for the cavity gases can be used now'(instead of two used by Chadwick et al). Thef asa function of the cavity radius were evaluated byus from P-V expansion curves of rock gases given byButkovich [lj .
2) We have used the 'Bubble1 model for the startingcavity radius and the cavity pressure. These areagain estimated from the report by Butkovich ]
The cavity radii obtained for some actual shots are
given in Table 3.1« In Fig. 31 we have plotted the experimen-
tal scaled cavity radii (Rc/W1'') for 30 shots in alluvium,
Table 3.1: Comparison of Cavity radii for differentevents
Event
Hardhat
Shoal
Piledriver
Medium
Hupmobile
Granite
Wagon Wheelsandstone
Depth Yield
286 M
367
453
270
•• 2700
Alluvium ~200
4.8 KT
12.8
56.0
1.0
1.0
7.4
20.2 H
27.1
44.5
7.2++
32.0
+ fi™ • measured cavity radius, ?£ = This work
++ As calculated using SOC by Terhune (UCRL-50993)
21.1 H
28.9
47.2
'7.6
7.0
32.6
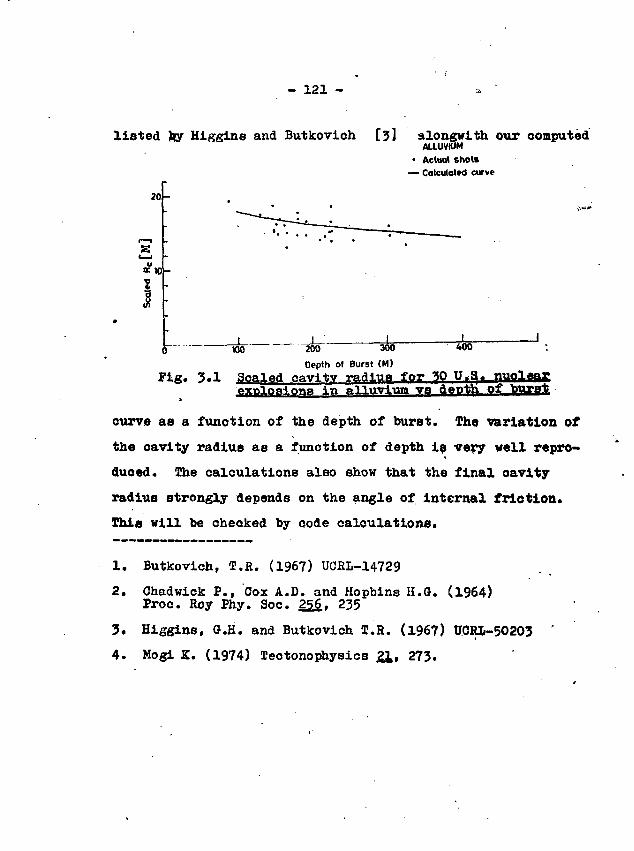
- 121 -
listed fcy Higgins and Butkovich [3] alongwith our computedALLUVIUM
• Actual shots— Calculated curve
2 0 -
»0 200"" "J_300
J
Depth of Burst (M>
Fig. 3.1 Scaled cavity radius for W l l ^ , nuclearexplosions in aUi|WrVam vs depth or Durst
curve as a function of the depth of burst. The variation of
the cavity radius as a function of depth is very well repro-
duced. The calculations also show that the final cavity
radius strongly depends on the angle of internal friction.
This will be checked by code calculations.
1. Butkovich, T.R. (1967) UCRL-14729
2. Chadwick P., Cox A.D. and Hopbins H.G. (1964)Proe. Roy Phy. Soc. 25£, 235
3. Higgins, G.H. and Butkovich T.R. (1967) U.CRIi-50203
4. Mogi K. (1974) Tectonophysics j>l» 273.
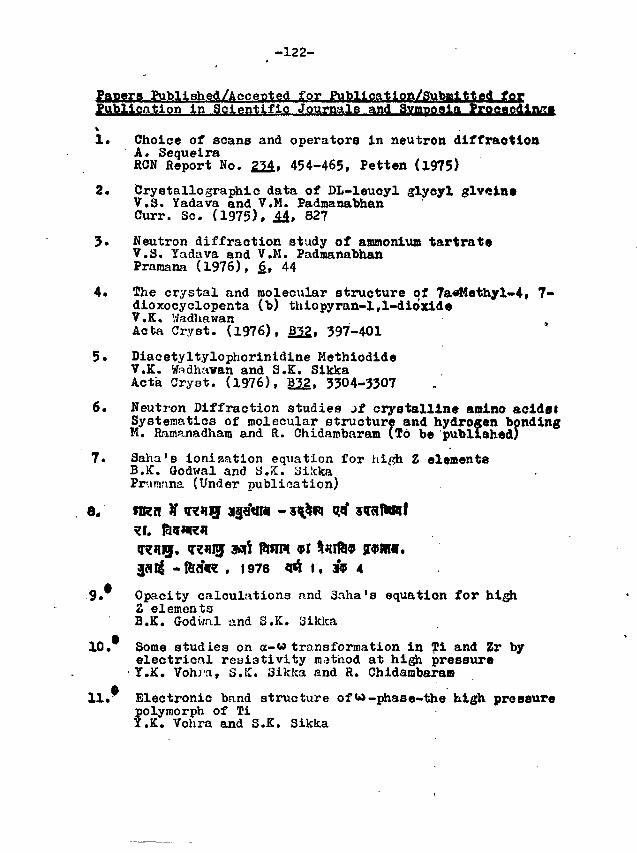
-122-
Paoera Published/Accepted for Pub^l,cation/ffubmitted fo,rPublication In Scientific Journals and Symposia Proeacdln/f
»1* Choice of scans and operators in neutron diffraction
A. SequeiraRON Report No. 22A, 454-465, Petten (1975)
2. Crystallographic data of DL-leucyl glyeyl glveineV.3. Yadava and V.M. PadmanabhanCurr. So. (1975), M> 827
5. Neutron diffraction study of ammonium tartrateV.S. Yadava and V.M. PadmanabhanPramana (1976), 6, 44
4. The crystal and molecular structure of 7a«Methyl-4» 7-dioxocyclopenta (b) thiopyran-l,l-dibxideV.K. V/adhawanActa Cryst. (1976), £22. 397-401
5. Diacetyltylophorinidine MethiodideV.K. Wadhavan and S.K. SikkaActa Oryst. (1976), B22, 3304-3307
6. Neutron Diffraction studies jf crystalline amlno acidsiSystematics of molecular structure and hydrogen bondingM. Ramanadham and R. Chidarobaram (To be published;
7« Saha's ioniz^tion equation for high Z elementsB.K. Godwal and S.K. yilckaPruranna (Under publioation)
3 1976 <rt 1. 3P5 4
9» Opacity calculations nnd Saha's equation forZ elementsB.K. Godwal and S.K. aildca
10* Some studies on <x-« transformation in Ti and Zr byelectrical resistivity method at hi^i pressure
• Y.K. Vohrn, S.K. Sikka and R. Chidambaram
11. Electronic band structure ofw-phase-the high pressurepolymorph of Ti •Y.K. Vohra and S.K. Sikka
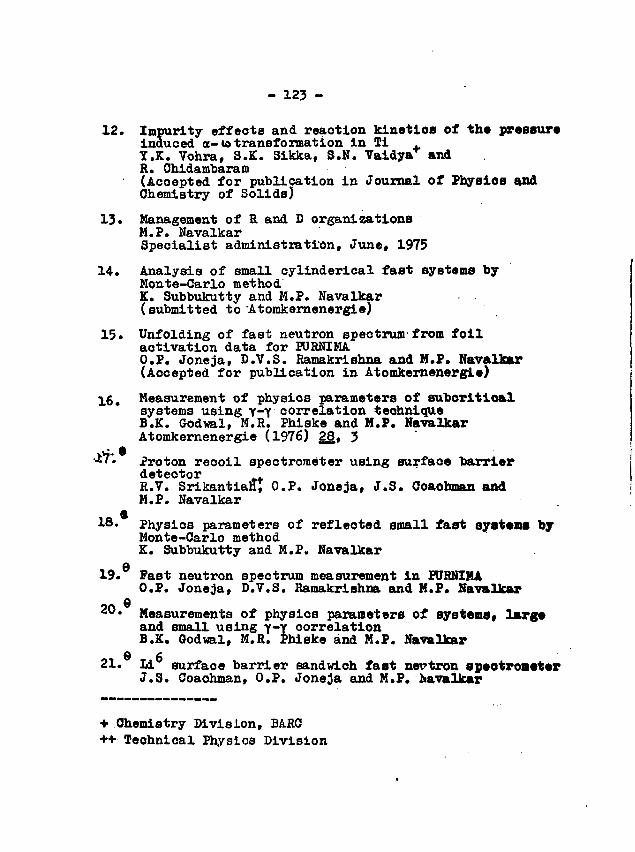
- 123 -
12. Impurity effects and reaotion kinetics of th« pressureinduced a-to transformation in Ti .Y.K. Vohra, S.K. Sikka, S.N. Valdya* andR. Chidambaram(Accepted for publication in Journal of Physios andChemistry of Solids)
13. Management of R and D organizationsM.P. NavalkarSpecialist administration, June, 1975
14. Analysis of small cylinderical fast systems byMonte-Carlo methodK. Subbukutty and M.P. Navalkar(submitted to Atomkernenergie)
15. Unfolding of fast neutron spectrum from foilactivation data for PURNIMAO.P. Joneja, D.V.S. Ramakrishna and M.P. Navalkar(Aocepted for publication in Atomkernenergie)
16 # Measurement of physics parameters of suborltioalsystems using Y-Y correlation techniqueB.K. Godrnl, M.R. Phiske and M.P. NavalkarAtomkernenergie (1976) 28, 3
-27*. Proton recoil spectrometer using surfaoe barrierdetector .R.V. Srikantian; O.P. Joneja, J.S. Coaohman andM.P. Navalkar
18* Physics parameters of reflected small fast systems byMonte-Carlo methodK. Subbukutty and M.P. Navalkar
19. Fast neutron spectrum measurement in PURNIMAO.P. Joneja, D.V.S. Ramakrishna and M.P. Navalkar
Q2°« Measurements of physics parameters of systems, larg*
and small using Y-Y correlationB.K. Godwal, M.R. Phiske and M.P. Navalkar
© 621. IdL surface barrier sandwich fast net'tron sp»otroa«t«r
J.S. Coaohman, O.P. Joneja and M.P. bavalkar
+ Chemistry Division, BARC++ Technical Physios Division
-124-
g22. Proposed extended stochastic model for reflected
SystemsB.K. Godwal and M.P. Navalkar
a23. A dynamic Monte-Carlo method of calculations for
small fast systemsK. Subbukutty, S.B.D. Iyengar and M.P. Navalkar
24. An experimental method for direct measurement oftritium breeding in Li blanket assembliesO.P. Joneja and M.P. Navalkar
25. Inverse kinetics determination of reactivity at Purnimazero energy fast reactorS. Das and M. SrinivasanAtomkernenergie (1976)> £2, 18
26. Parabolic coefficient of reactivity measurements forthe design of a repetitively pulsed fast reactorP.K. Iyengar, T.K.Basu, K. Ohandramoleshwar, S. Das,P.K. Job, V.R. Nargundka'r, C.S. Pasupathy, M. Srinivasanand K. Subba RaoAtomkernenergie (1976), 22, 87
a27. Review of new trends in reactor physics
(Inaugural address)P.K. Iyengar
28. Innovations in reactor physics experiments (Invited Talk)M, Srinivasan
Q29. Subcritical multiplication measurements with a BeO ref-
lected U-233 uranyl nitrate solution systemP.K. Job, M. Srinivasan, V.R. Nargundkar, K. Chandra- .moleshwar, C.S. Pasupathy, S. Das and P.C. Mayankutty
30.6 Purnima II: A BeO reflected U 2 5 5 uranyl nitrate solutionhomogeneous reactorK. Chandramoleshwar, S. Das, P.K. Job, P.C. Mayankutty,..V.R. Nargundkar, C.S. Pasupathy, R.K. Patil++, A.K. Rayand M. Srinivasan
631. Effect of reflector-returned neutrons on reactor kineties
S. Das and K. drinivasanQ
32. Magnitude of inertial pressure pulse due to fissiontrack nucleation in a beryllium oxide reflected U?53uranyl nitrate solution reactorS. Das
-125-
33. Proposed U -^ fuelled 30 KW tank type Bource reactorfor neutron radiography at KalpakkamC.S. Pasupathy and M. Srinivasan
34. Effect of heterogeneity on critical mass of waterreflected Pu0?-H?0 latticesT.K. Basu, M. Srinivasan, K. Subba Rao, V.R. NargundkarK. Chandramoleshwar, C.S. Pasupathy, P.K. Job and S.Das
55• A Universal empirical relation for the variation ofKeff with core dimensions of bare and reflected smallfast systemsAnil Kumar, M. Srinivasan, T.K. Basu and K. Subba Rao.
036. Studies with a time dependent transport code
K. Subba Rao, TsK. Basu, Anil Kumar and H. Srinivasan
637. Application of pulsed neutron technique for integral
neutron cross-section tests in the MeV rangeV.R. Nar^undkar
<H38. Effect of time constants of neutron detection channels
on control of PURWIKA reactorS. Das and M. Urinivasan
*39. Nuclear instrumentation of the zero energy fast reaetor-
Purnima design specifications and operational experienceC.S. Pasupathy, V.R. Nargundkar, K. Ohandraraoleshwar,M. Srinivasan, V.A. Pethe + + +
+ Fuel Reproceasing Division++ Reactor Control Division+++Nuclear Detection and Instrumentation Section
Symposium on Radiation Physics, Mysore, June, 1976
Symposium on Reactor Physics, BARC, March, 1976
Nuclear Physics and Solid State Physics Symposium,Ahmedabad, Dec. 1976
Symposium on nuclear reactor instrumentation,BARC, 1976.
- 126 -
Papers Presented or Accepted for Presentation at Symposia.Seminars. Conferences etc.
I. A neutron diffraction study of the structure andconformation at the nucleotide 5'-UMP Disodium saltS.C. Gupta, A. Sequeira, T.P. Seshadri andM.A. Viswaraitra
2® A neutron diffraction study of 5'-UMP Nap7H?0'S.C. Gupta, A. Sequeira, T.P. Seshadriand M.A. Viswamitra
y. An online computer controlled neutron diffractometerS.N. Momin, H. Rajagopal, A. Sequeira, J.N. Soni andR. Chidambaram
4. Neutron diffraction of Biomolecule (invited talk)A. Sequeira
5. Crystal structure of DL-Leucyl glycyl glycineK.N. Goswami, V.S, Yadav and V.M. Padmanabhan
6. Neutron diffraction study of Ammonia compoundsV.M. Padmanabhan, V.S. Yadav and V.K. Wadhavan
07. Crystal structure study of onitin a phenolic pterosln
from the fern Onychiura AuratumV.K. Wadhawan and S.K. Sikka
8. STACOM, A computer program for inter experimentalcomparison in crystal structure analysisM. Ramanadham and V.K. Wadhawan
Analysis of the crystal structure data on amino aoidsstudied by neutron diffractionH. Ramanadham and R. Chidambaram
10. Reactor safety studies through noise analysis techniqueH. SrinivasanConsultants meeting on safety research and trainingwith research f ac i l i t i esVienna 13-16 Dec. 1976
II . A simple technique of fabrication of paraboloidalconcentratorsM. Srinivaei..::^ • -r, /..-..j .:.:::\ ;>:J}. 0,3. PasupathyNational solar i.uaxgy convention, Jadhavpur. CalouttaSept. 1976
-127-
12. Human resource development in institutions academicand researchM.P. NavalkarFourth international training and development conf. onhuman resource development, experience and experiments,New Delhi, Nov. 1975
13. Neutron sources and breeding of nuclear fuelP.K. IyengarInternational conference on neutron interaction withmatter Lowell, Boston, U8A June 1976
+ Technical Physics Division
0 National crystallography conference N.P.L., H. Delhi(Dec. 1975)
• Tenth international congress of crystallography.Amsterdam (1975).
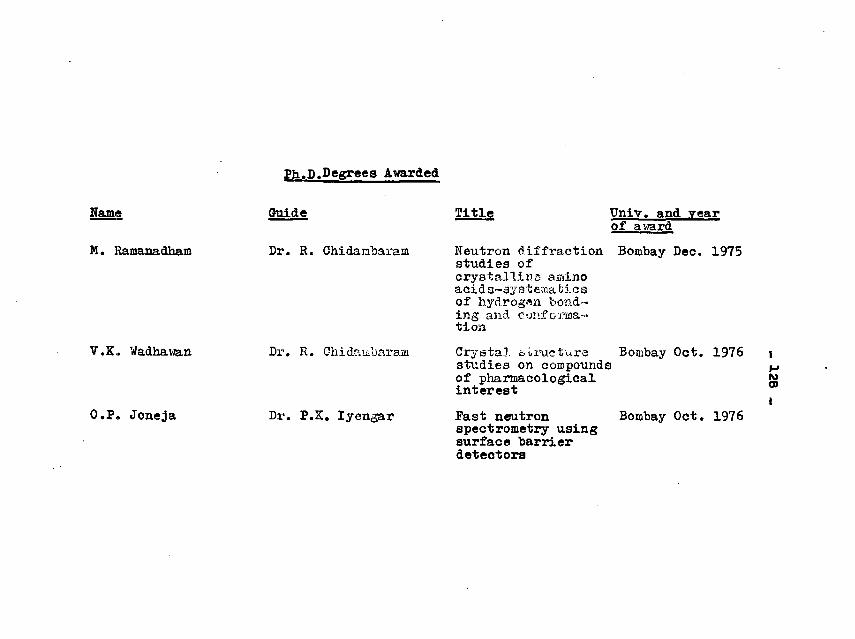
Ph.D.Degrees Awarded
Name Guide Title Univ. and yearof award
M. Ramanadham Dr. R. Ohidanbaram Neutron diffraction Bombay Dec. 1975studies ofcrys ta l l ine ainino
d t f c iof hydrogen bond-ing and conforma-tion
V.K.. Wadhawan Dr. R. Chidambaram Crystal &i,rueture Bombay Oct. 1976studies on compoundsof pharmacologicalinterest
O.P, Joneja Dr. P.K. Iyengar Past neutron Bombay Oct. 1976spectrometry usingsurface barrierdetectors
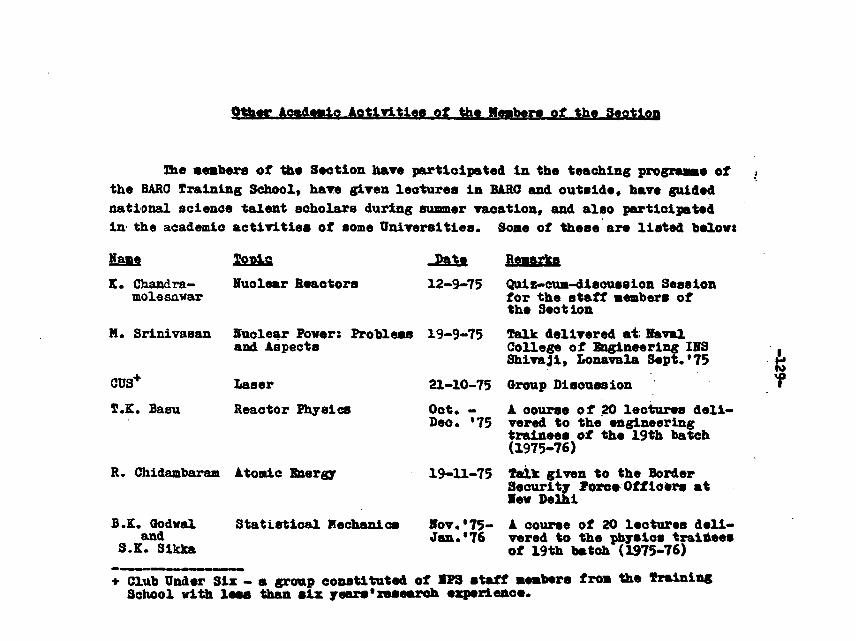
OthT Academic Activities of the Meabers of the Section
The aeabers of tb« Section hare participated in the teaching prograaae ofthe BARC Training School, hare given lectures in BARC and outside, have guidednational science talent soholars during summer vacation, and also participatedin the academic activities of some Universities. Some of these are listed belovt
Reaarks
QuiE-cum-diseussion Sessionfor the staff aenbers ofthe Seotion
Talk delirered at HavalCollege of Engineering IHSShivaJi, Lonavala Sept.'75
Group Discussion
A course of 20 lectures deli-vered to the engineeringtrainees of the 19th batch(1975-76)
Talk given to the BorderSecurity Force Of fleers atlev Delhi
A course of 20 lectures deli-vered to the physios traineesof 19th batoh (1975-76)
+ Club Under Six - a group constituted of VPS staff aeabers from the trainingSchool with less than six years'research experience.
Name
X. Chandra-molesawar
M. Srinivasan
CUS+
I.E. Basu
R. Chidambaram
B.K. Oodwaland
3.K. Sikka
Tonic
Huolear Reactors
Nuclear Power: Problemsand Aspects
laser
Reactor Physics
Atomic Energy
Statistical Mechanics
Date
12-9-75
19-9-75
21-10-75
Oct. -Deo. '75
19-11-75
Hov.»75-Jan.«76
f
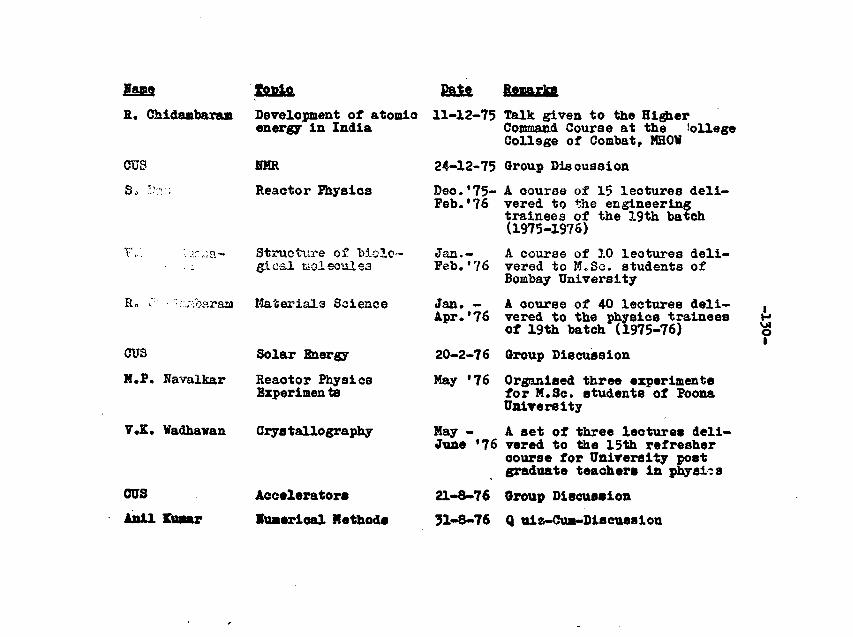
gama tot>lo
R. Chidambaram Development of atomicenergy in India
CUS HMR
S., V:i:; Reaetor Physics
TV. Var:_:a- Structure of t>io!c«.; gieal tioleculS3
R» ."'• "••::.r~o&ra3a Materials Science
CUS Solar Energy
M.P. Navalkar Reactor PhysicsBxperimen ts
V.K» Vadhavan Crystallography
CUS
Anil Kumar
Accelerators
luaerioal Hethoda
Date
11-12-75 Talk given to the HigaerCommand Course at the CollegeCollege of Combat, MHOV
24-12-75 Group Disoussion
Dee.'75- A course of 15 lectures deli-Peb.'76 vered to the engineering
trainees of the 19th batch(1975-1976)
Jan.- A course of 10 lectures deli-Feb.'76 vered to M.Sc. students of
Bombay University
Jan. - A course of 40 lectures deli-Apr. '76 vered to the physics trainees
of 19th batch (1975-76)
20-2-76
May '76
Group Discussion
Organised three experimentsfor M.Sc. students of PoonaUniversity
May -June
A set of three lectures deli-'76 vered to the 15th refresher
course for University postgraduate teachera in physics
21-8-76 Group Discussion
31-8-76 Q «l2-Cu«-Dlacuaslon
?
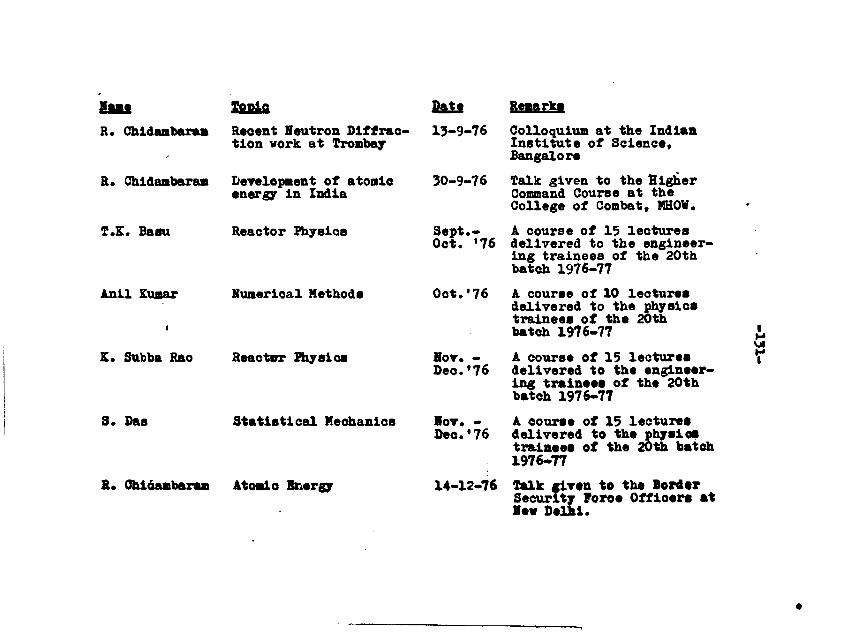
Sill Topic
R. Chidambaram Reoent Heutron Diffrac-tion work at Tronbay
R. Chidambaram Development of atomicenergy in India
T.E. Basu
Anil Kumar
3. Das
Reactor Physios
Nunerical Methods
K. Subba Rao Reactor Physic*
Statistical Mechanics
R. Chidambaram Atomic Energy
Date Remarks
13-9-76 Colloquium at the IndianInstitute of Science*Bangalore
30-9-76 Talk given to the HigherCommand Course at theCollege of Combat, MHOW.
Sept.* A course of 15 lecturesOct. '76 delivered to the engineer-
ing trainees of the 20thbatch 1976-77
Oct.'76 A course of 10 lecturesdelivered to the physicstrainees of the 20thbatch 1976-77
HOT. - A course of 15 lecturesDeo.'76 delivered to the engineer-
ing trainees of the 20thbatch 1976-77
Hov. - A course of 15 lecture*Dec.'76 delivered to the physios
trainees of the 20th batch1976-77
14-12-76 Talk given to the BorderSecurity Force Officers atlew Delhi.
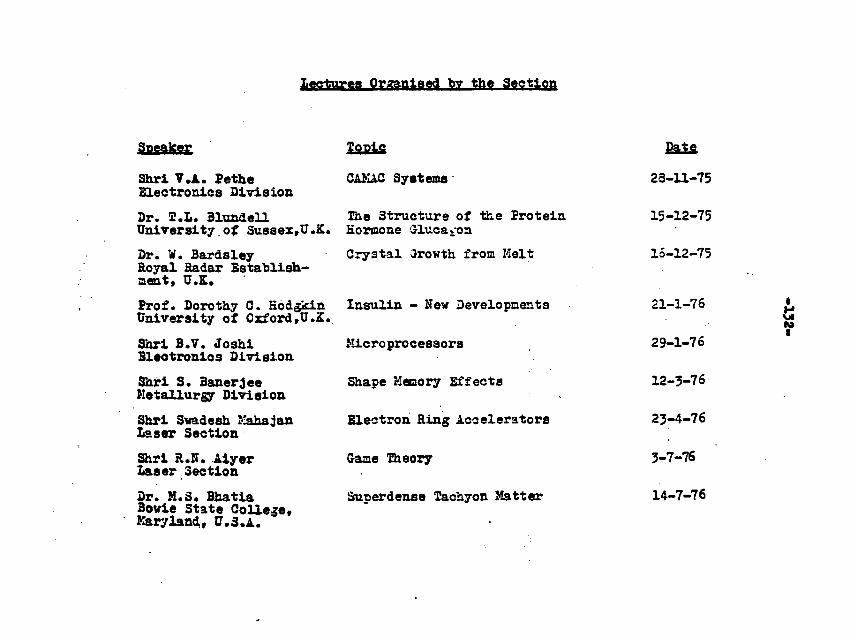
Lecturea Organised by the Section
Sneaker yopic Date
Shrl V.A.. Pethe CAKAC Systems 23-11-75Electronics DivisionDr. 2.L. Blundell Ihe Structure of the Protein 15-12-75University of Sussex,U.K. Hormone Jluca.on
Dr. ¥. Bardsley Crystal Jrowth from Melt 15-12-75Royal Radar Establish-ment, U.K.
Prof. Dorothy 0. Ebdgkin Insulin - New Developments 21-1-76 •University of Cxford.U.K. «Shrl B.V. Joshl Microprocessors 29-1-76Electronics DivisionShri S. Banerjee Shape Heoory Effects 12-3-76Metallurgy DivisionShri 3nadesh Kahajan Electron Ring Accelerators 23-4-76Laser Section .Shrl R.N. Alyer Gaae Iheory 3-7-76Laser SectionDr. U.S. Bhatia Suuerdense Tachyon Matter 14-7-763owie State College,Maryland, U.S.A.
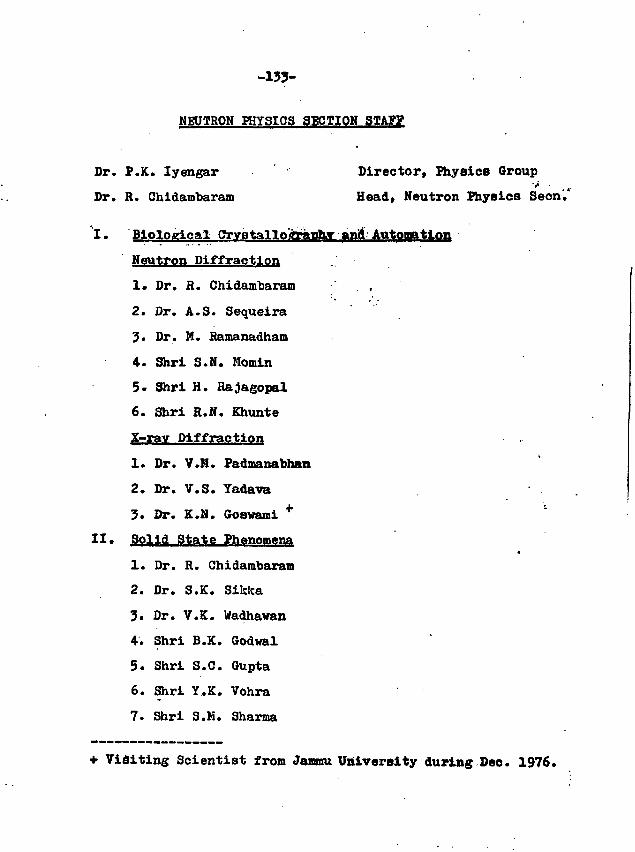
-133-
MEUTRON PHYSICS SECTION STAFF
Dr. P.K. Iyengar Director, Physics Group
Dr. R. Chidambaram Head, Neutron Physics Seen.
I. Biologies.! Cry8tallotfritPh.T and Auto*1**ti.on
Neutfon Diffraction
1. Dr. R. Chidambaram
2. Dr. A.S. Sequeira
3. Dr. M. Ramanadham
4. Shri S.N. Momin
5. Shri H. Rajagopal
6. Shri R.N. Khunte
X-rav Diffraction
1. Dr. V.M. Padmanabhan
2. Dr. V.S. Yadava
3. Dr. K.N. Goswami +
II* 3ol,id State Phenomena
1. Dr. R. Chidambaram
2. Dr. S.K. Sikka
3. Dr. V.K. Wadhawan
4. Shri B.K. Godwal
5* Shri S.C. Gupta
6. Shri Y.K. Vohra
7. Shri 3.M. Sharma
Visiting Scientist from Jammu University during Deo. 1976.
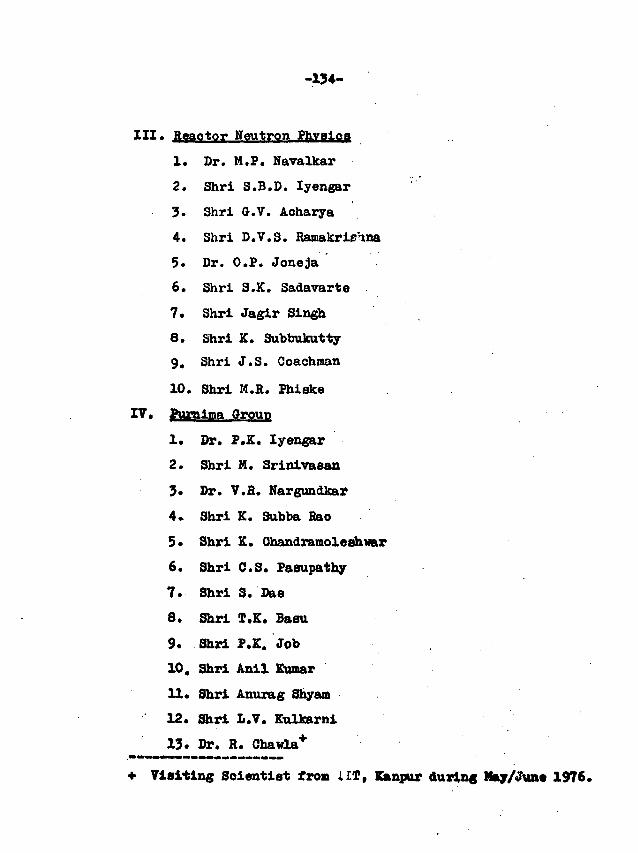
-134-
III. Reactor Neutron Physics
1. Dr. M.P. Navalkar
2. Shri S.B.D. Iyengar
3. Shri G.V. Acharya
4. Shri D.V.S. Ramakrichna
5. Dr. O.P. Joneja
6. Shri S.K. Sadavarte
7. Shri Jagir Singh
8. Shri K. Subbukutty
9. Shri J.S. Coachman
10. Shri M.R. Phiske
IV. Purnima group
1* Dr. P.K. Iyengar
2. Shri M. Srinivaean
3* Dr. V.R. Nargundkar
4. Shri X. Subba Rao
5* Shri K. Ohandramoleshmr
6. Shri C.S. Pasupathy
7. Shri 3. Das
8. Shri T.K. Basu
9* Shri P.K. Job
10. Shri Anil Kumar
11. Shri Anurag Shyam
12. Shri L.V. Kulkarni
13. Dr. R. Chawla*
+ Visiting Soientist from UT, Kanpur during Nay/Jun* 1976.
-135-
V. Supporting Staff
1. Smt. Usha Narayan
2* Shrl K.F. Rajasekharan
3. Shrl B.B. Gaikwad