Solution structure and dynamics of biomolecules from Raman optical activity
Upload
independentCategory
view
2download
0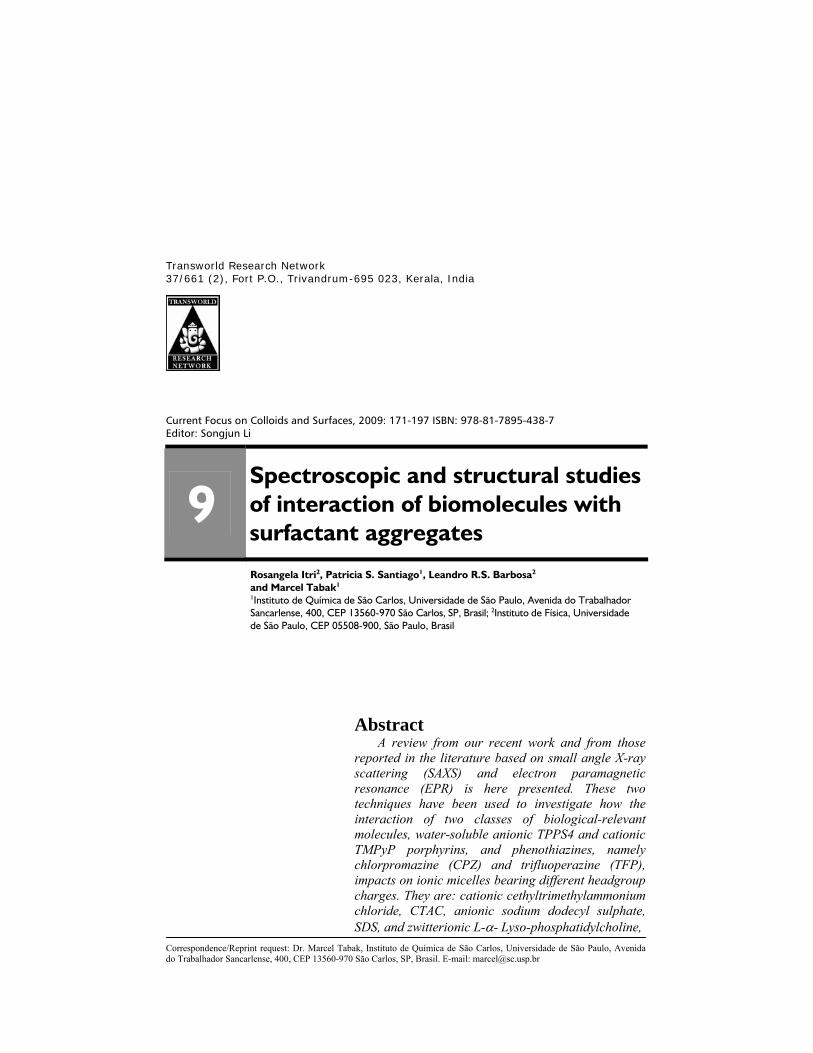
Transworld Research Network 37/661 (2), Fort P.O., Trivandrum-695 023, Kerala, India
Current Focus on Colloids and Surfaces, 2009: 171-197 ISBN: 978-81-7895-438-7 Editor: Songjun Li
9 Spectroscopic and structural studies of interaction of biomolecules with surfactant aggregates
Rosangela Itri2, Patricia S. Santiago1, Leandro R.S. Barbosa2 and Marcel Tabak1 1Instituto de Química de São Carlos, Universidade de São Paulo, Avenida do Trabalhador Sancarlense, 400, CEP 13560-970 São Carlos, SP, Brasil; 2Instituto de Física, Universidade de São Paulo, CEP 05508-900, São Paulo, Brasil
Abstract A review from our recent work and from those reported in the literature based on small angle X-ray scattering (SAXS) and electron paramagnetic resonance (EPR) is here presented. These two techniques have been used to investigate how the interaction of two classes of biological-relevant molecules, water-soluble anionic TPPS4 and cationic TMPyP porphyrins, and phenothiazines, namely chlorpromazine (CPZ) and trifluoperazine (TFP), impacts on ionic micelles bearing different headgroup charges. They are: cationic cethyltrimethylammonium chloride, CTAC, anionic sodium dodecyl sulphate, SDS, and zwitterionic L-α- Lyso-phosphatidylcholine,
Correspondence/Reprint request: Dr. Marcel Tabak, Instituto de Química de São Carlos, Universidade de São Paulo, Avenida do Trabalhador Sancarlense, 400, CEP 13560-970 São Carlos, SP, Brasil. E-mail: [email protected]
Rosangela Itri et al. 172
LPC, as well as 3-(N-hexadecyl-N,N-dimethylammonium) propane sulfonate, HPS. The SAXS results give support to conclude that: i) anionic porphyrin TPPS4 affects mainly the hydrophobic core of CTAC and HPS, leading to a micellar reassembling from prolate-like ellipsoidal aggregates of anisometries 3.0 and 1.5, respectively, into smaller prolate micelles; there is a shielding of headgroup micellar charges in the case of CTAC due to the binding of oppositely charged porphyrin, whereas the appearance of a surface charge in the original zwitterionic (overall neutral) HPS micelle takes place; ii) for SDS-TMPyP co-micelle only the neutralization of headgroup charges occurs; iii) addition of both cationic phenothiazines, CPZ and TFP, to HPS prolate micelle induces a reduction in the aggregate dimension without changing its morphology; iv) on the contrary, the addition of CPZ and TFP to negatively charged SDS prolate micelles favors a shape transformation to cylindrical-like aggregates, accompanied by an increase in the polar head electron density that must be also due to the location of the drug near the hydrophobic core – polar shell driven by hydrophobic and electrostatic forces; v) the effect of TFP and CPZ over LPC micelles also leads to a change in micellar shape from prolate ellipsoidal into a cylindrical micelle increasing its axial ratio; similarly to the effect of anionic porphyrin TPPS4 to HPS, the positively charged phenothiazine molecule must accommodate in the LPC micelle dipole layer close to the inner negative phosphate group (near the hydrophobic core), favored by both electrostatic and hydrophobic contributions. Overall, according to the SAXS results, the effects of the two classes of biomolecules upon micellar structure are consistent with their physico-chemical properties, and, in particular, to their well-known self-aggregation capacity and ability to bind to the micelles as judged from association binding constants. Porphyrin self-aggregates are large presenting around 3000 TPPS4 molecules assembled as a hollow cylinder. On the other hand, phenothiazine self-aggregates are much smaller, having some properties common to surfactant micelles. They present also quite different properties. They were modeled by a single electron density layer relative to the aqueous solvent and seem to maintain the symmetry found in single crystals of the compounds. Due to the low resolution at the appropriate scattering vector q range it was not possible to find a definite shape for phenothiazine aggregates, just their overall size. EPR spectra of 5- and 16-doxyl stearic acids (5- and 16-DSA, respectively) bound to CTAC and HPS micelles exhibited slight changes as a function of porphyrin concentration. Spectral simulations revealed an increase of mobility restriction for both spin probes, especially at higher porphyrin concentration. Similar effect was also observed for SDS- and HPS-phenothiazine systems. Overall, the packing density of the co-micellar aggregates is increased leading to a reduction of motional freedom for nitroxide probes. The two nitroxides exhibit a significant degree of motion relative to the whole micellar particle for mixed systems and only in phenothiazine aggregates at pH close to neutrality the motional restriction is enough to make the observed rotational correlation time comparable to that for the whole particle as estimated from SAXS data. Abbreviations SAXS - small angle X-ray scattering EPR - electron paramagnetic resonance TPPS4 - meso-tetrakis (4-sulfonatophenyl) porphyrin
Interaction of biomolecules with surfactant aggregates 173
TMPyP - meso tetrakis (4-N-methylpyridiniumyl) porphyrin CPZ - chlorpromazine TFP - trifluoperazine CTAC - cethyltrimethylammonium chloride SDS - sodium dodecyl sulphate LPC - L-α-Lysophosphatidylcholine HPS - 3-(N-hexadecyl-N,N-dimethylammonium) propane
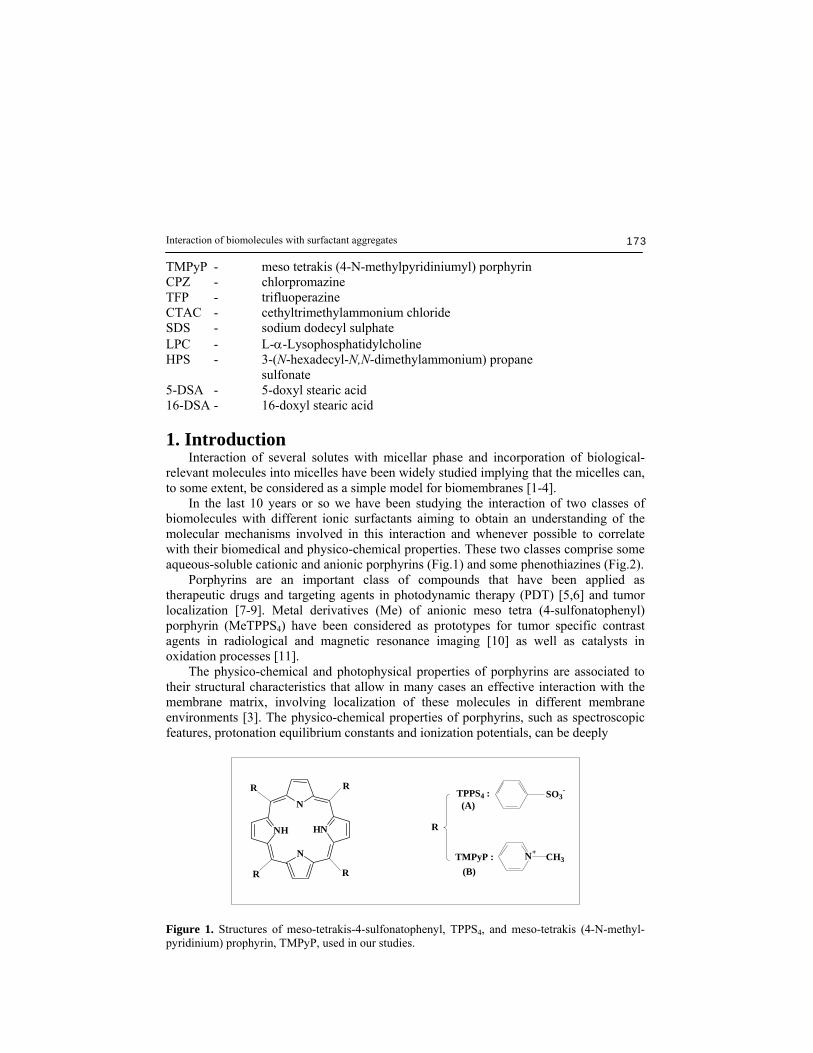
sulfonate 5-DSA - 5-doxyl stearic acid 16-DSA - 16-doxyl stearic acid 1. Introduction Interaction of several solutes with micellar phase and incorporation of biological-relevant molecules into micelles have been widely studied implying that the micelles can, to some extent, be considered as a simple model for biomembranes [1-4]. In the last 10 years or so we have been studying the interaction of two classes of biomolecules with different ionic surfactants aiming to obtain an understanding of the molecular mechanisms involved in this interaction and whenever possible to correlate with their biomedical and physico-chemical properties. These two classes comprise some aqueous-soluble cationic and anionic porphyrins (Fig.1) and some phenothiazines (Fig.2). Porphyrins are an important class of compounds that have been applied as therapeutic drugs and targeting agents in photodynamic therapy (PDT) [5,6] and tumor localization [7-9]. Metal derivatives (Me) of anionic meso tetra (4-sulfonatophenyl) porphyrin (MeTPPS4) have been considered as prototypes for tumor specific contrast agents in radiological and magnetic resonance imaging [10] as well as catalysts in oxidation processes [11]. The physico-chemical and photophysical properties of porphyrins are associated to their structural characteristics that allow in many cases an effective interaction with the membrane matrix, involving localization of these molecules in different membrane environments [3]. The physico-chemical properties of porphyrins, such as spectroscopic features, protonation equilibrium constants and ionization potentials, can be deeply
N
HN
N
NH
R
RR
R
R
SO3-TPPS4 :
N+ CH3TMPyP :
(A)
(B)
Figure 1. Structures of meso-tetrakis-4-sulfonatophenyl, TPPS4, and meso-tetrakis (4-N-methyl-pyridinium) prophyrin, TMPyP, used in our studies.
Rosangela Itri et al. 174
N
S
CF3
N N
S
N Cl
N
TFP CPZ
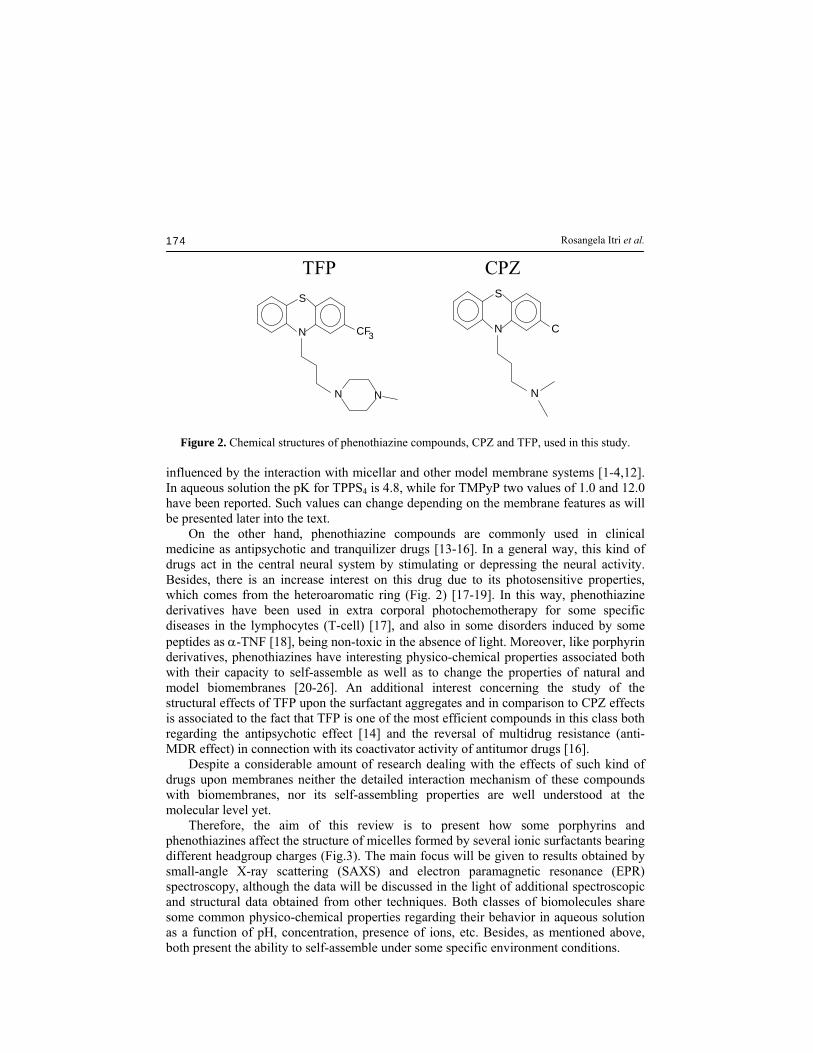
Figure 2. Chemical structures of phenothiazine compounds, CPZ and TFP, used in this study.
influenced by the interaction with micellar and other model membrane systems [1-4,12]. In aqueous solution the pK for TPPS4 is 4.8, while for TMPyP two values of 1.0 and 12.0 have been reported. Such values can change depending on the membrane features as will be presented later into the text. On the other hand, phenothiazine compounds are commonly used in clinical medicine as antipsychotic and tranquilizer drugs [13-16]. In a general way, this kind of drugs act in the central neural system by stimulating or depressing the neural activity. Besides, there is an increase interest on this drug due to its photosensitive properties, which comes from the heteroaromatic ring (Fig. 2) [17-19]. In this way, phenothiazine derivatives have been used in extra corporal photochemotherapy for some specific diseases in the lymphocytes (T-cell) [17], and also in some disorders induced by some peptides as α-TNF [18], being non-toxic in the absence of light. Moreover, like porphyrin derivatives, phenothiazines have interesting physico-chemical properties associated both with their capacity to self-assemble as well as to change the properties of natural and model biomembranes [20-26]. An additional interest concerning the study of the structural effects of TFP upon the surfactant aggregates and in comparison to CPZ effects is associated to the fact that TFP is one of the most efficient compounds in this class both regarding the antipsychotic effect [14] and the reversal of multidrug resistance (anti-MDR effect) in connection with its coactivator activity of antitumor drugs [16]. Despite a considerable amount of research dealing with the effects of such kind of drugs upon membranes neither the detailed interaction mechanism of these compounds with biomembranes, nor its self-assembling properties are well understood at the molecular level yet. Therefore, the aim of this review is to present how some porphyrins and phenothiazines affect the structure of micelles formed by several ionic surfactants bearing different headgroup charges (Fig.3). The main focus will be given to results obtained by small-angle X-ray scattering (SAXS) and electron paramagnetic resonance (EPR) spectroscopy, although the data will be discussed in the light of additional spectroscopic and structural data obtained from other techniques. Both classes of biomolecules share some common physico-chemical properties regarding their behavior in aqueous solution as a function of pH, concentration, presence of ions, etc. Besides, as mentioned above, both present the ability to self-assemble under some specific environment conditions.
Interaction of biomolecules with surfactant aggregates 175
H3C N+
H3C
H3C
CH3
CTAC
SDS
H3C
O
O
O-S
HPS
H3C N
H3C
H3C O
S
O
O-+
H3CC
O
O
C OHO
O
O P-
O
O
O
N+ H3C
H3C
H3CLPC
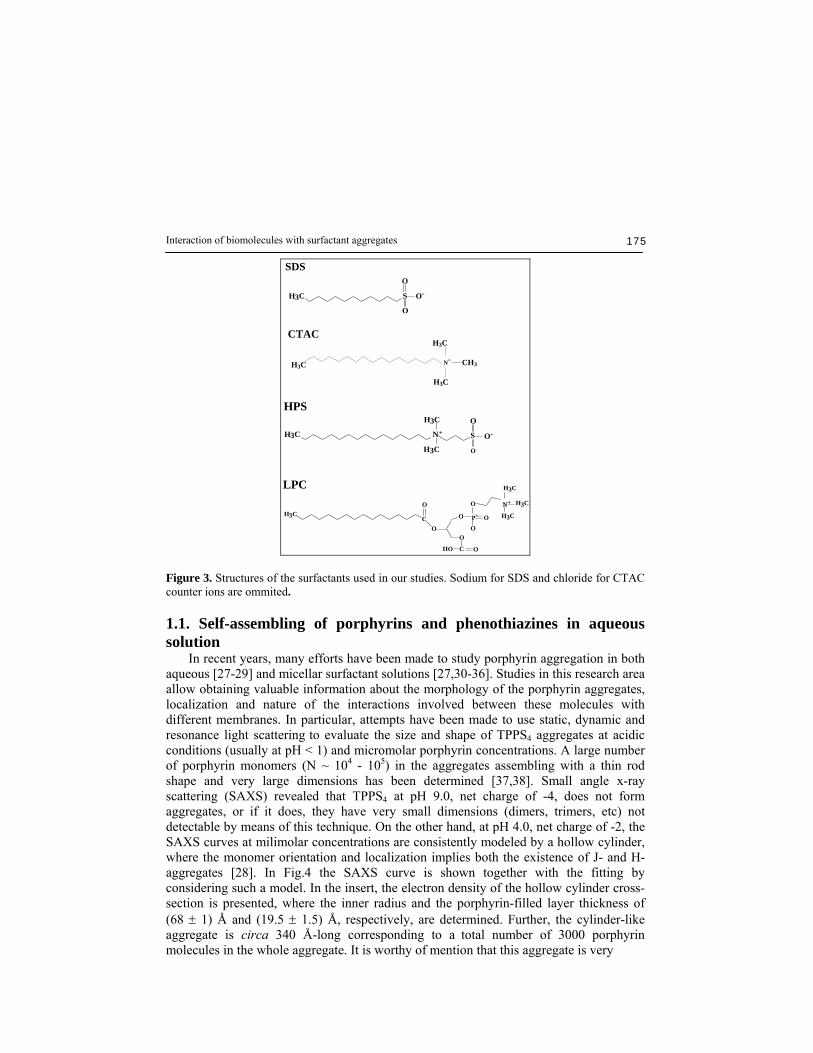
Figure 3. Structures of the surfactants used in our studies. Sodium for SDS and chloride for CTAC counter ions are ommited. 1.1. Self-assembling of porphyrins and phenothiazines in aqueous solution In recent years, many efforts have been made to study porphyrin aggregation in both aqueous [27-29] and micellar surfactant solutions [27,30-36]. Studies in this research area allow obtaining valuable information about the morphology of the porphyrin aggregates, localization and nature of the interactions involved between these molecules with different membranes. In particular, attempts have been made to use static, dynamic and resonance light scattering to evaluate the size and shape of TPPS4 aggregates at acidic
conditions (usually at pH < 1) and micromolar porphyrin concentrations. A large number of porphyrin monomers (N ~ 104 - 105) in the aggregates assembling with a thin rod shape and very large dimensions has been determined [37,38]. Small angle x-ray scattering (SAXS) revealed that TPPS4 at pH 9.0, net charge of -4, does not form aggregates, or if it does, they have very small dimensions (dimers, trimers, etc) not detectable by means of this technique. On the other hand, at pH 4.0, net charge of -2, the SAXS curves at milimolar concentrations are consistently modeled by a hollow cylinder, where the monomer orientation and localization implies both the existence of J- and H- aggregates [28]. In Fig.4 the SAXS curve is shown together with the fitting by considering such a model. In the insert, the electron density of the hollow cylinder cross-section is presented, where the inner radius and the porphyrin-filled layer thickness of (68 ± 1) Å and (19.5 ± 1.5) Å, respectively, are determined. Further, the cylinder-like aggregate is circa 340 Å-long corresponding to a total number of 3000 porphyrin molecules in the whole aggregate. It is worthy of mention that this aggregate is very

Rosangela Itri et al. 176
0.01 0.110-5
10-4
10-3
10-2
10-1
Inte
nsity
(a.u
.)
0 20 40 60 80 100
0.0
0.3
0.6
0.9
q , Å-1
ρ c(r)(a
.u)
r(Å)
Figure 4. Experimental (symbols) and theoretical fitting (thick line) of [TPPS4] = 10 mM; at pH 4.0. The insert corresponds to the ρc(r) function obtained from the adjustment procedure (see [28]). different from the one described by Collings et al [37] and Micali et al [38], and this difference could be explained by the difference in pH value and porphyrin concentration; an increase of the porphyrin concentration has been associated to an increase in the complexity of the aggregated species in solution [29]. In Fig.5 a schematic view of the model is shown, emphasizing the porphyrin assembling in a single layer and the contacts between the layers. Concerning the phenothiazine self aggregation properties, a recent study has explored the photochemical behavior of three phenothiazine derivatives in aqueous solution (thioridazine – TR, fluphenazine – TF, and trifluoperazine – TFP) in the monomeric and aggregated form [26], through several techniques, such as EPR, SAXS, electronic absorption, among others. The combined results gave support to conclude that, although the phenothiazines self-assembled at concentrations above 100 µM, only TR formed large lamellar-like structures at 25 mM, pH 4.0 [26]. Interestingly, such arrangement resembles that observed in its native crystallographic cell [39]. Small-angle neutron scattering (SANS) has been previously employed to investigate the structural properties of aqueous (D20) solutions of pure CPZ [40]. The data resulted to be characteristic of systems with strong correlations, mainly due to electrostatic interactions between charged aggregates. Furthermore, evidence from NMR studies [41-44] of the chemical shift changes of aromatic protons and carbon atoms of CPZ over a wide range of solution concentration has provided information on the spatial arrangements of the two molecules forming a dimer, where a concave-to-convex vertical stacking of the aggregate with the alkyl side-chains on alternate sides of the stack has been proposed [41-44]. We have also performed a study concerning the structural features of TFP and CPZ self-assembling, through SAXS and EPR techniques, in order to get more information on these two phenothiazine self-aggregation phenomena [45]. The measurements were conducted at high drug concentrations (in the milimolar range), due to the sensitivity of

Interaction of biomolecules with surfactant aggregates 177
-33 so-
- so3
N+
H H+N
N H H
N
-3
3- soso
3
3-+
NHHN+
NH
H
-
- so3
-3 so
-3
+
HN
NH H
so
-3 so
N
N
so
3 so-
N
+H
so
so
NH
+
HN
H H N
N+
-so3
-3so
3-so
so3
3 -so
+HH
HN
N
N+
NH
-so3
3so -
3so -
-N
H+H
NH
HN
N+
-so
3
-3so
3 -so
so3
3 -so
+HHH
N
N
N+
N
H
-so
3
3so -
3so -
-
NH+
HN
HH
NN+
-so3
-3so
3 -so
so3
3 -so
+HH
H
N
N
N+ NH
-so
3
3so-
3so-
-
NH
+
HN H
HN
N+
-so3
-3 so
3 -so so3
3-so
+H
H HN
N
N+
NH
-so3 3
so-3 so-
-N
H+
HN
HH
N
N+
- so3
-3 so
3- so
so3
3- so+HH
H
N
N
N+
N
H
- so3
3 so-
3 so-
-
NH+
HN
HHN N+
- so3
-3 so
3- so
so33- so
+H
H
H
N
N
N+
N
H
- so3
3 so-
3 so-
-
NH
+
HN
HHN
N+
- so3
- 3so
3- soso
3
3- so
+ HH
HN
N
N+
NH
- so3
3so-
3so-
-N
H+ H
NH
HN
N+
-so
3
- 3so
3-so
so3
3-s o
+ H HH
N
N
N+
N
H
-so
3
3so
-
3s o
-
-
N H+
H N
HH
NN +
-so 3
- 3so
3-so
so3
3-so
+ H H
H
N
N
N+N H -
so3
3so
-
3so-
-
N H
+
H NH
HN
N +
-so3
-3so
3-
soso 3
3-
so
+H
HH N
N
N +
NH
-so 33so
-3so-
-N
H+
HN
HH
N
N +
-so3
-3so
3-so
so3
3-so
+HH
H
N
N
N +
N
H
-so3
3so-
3so-
-
so3-
3so-
3-
NHN +
H
NH
+N H
so
3-so+
+H
HH
HN
N
N
N
-so3
-so3
-so3
-3
so
(A)
so 3
-
3s
o -
3s
o-
3s
o -
N
N
N
NHH H
H+
+ s o -3
s o
HN+
HN
H+
NH N
-3
-s o 3
-3
s o
-
-s o 3
-s o 3
3s o -
H
N
+N
N
N
HH
H+
s o -3
3s o
s o -3
s o 3-
3s o -
+N
NH
HN
H
+H
N
-
-s o 3
-s
o3 3s
o-
HN
+N
N
NH HH
+
s o -3
3so
so -
3
so
3-
3s o -
+N
NH
H NH
+HN
-
-s
o3
-s
o3
3
so-HN +
N
N
N
H
HH+
so- 3
3
so
so- 3
so
3-
3
so-
+N
NH
H
NH
+HN
-
-s
o3
-
so 3
3s
o-
H
N
+N
N
N
H
HH+
so- 3
3s
o
so- 3
so
3-
3s
o-
+
N
N
H
H
N
H+
H
N
-
-
so3
- so3
3
so-
H
N
+N
N
NH
H
H+
so- 3
3
so
so- 3
so3-
3s
o-
+N
N
H HN
H
+
HN
-
- so3
- so3
3 so-
H
N
+ N
N
N
H
HH
+
so- 3
3 so
so-3
so3-
3s
o-
+NN H H
NH
+ HN
-
- so3
- so3
3 so-
H
N
+ N
N
NH
HH+
so-3
3 so
so-3
so3-
3 so-
+ N
N HH
NH
+H
N
-
-so3
-s
o33s
o-
HN
+ N
N
N HHH
+
so-3
3s
os
o-3
so3 -
3 so-
+ N
NH
HN H
+H N
-
-s
o3
-s
o3
3
so -
H N+
N
N
N
H
H H +
so-3
3
so
so -3
so
3 -
3
so-
+
N
NH
H
N H
+H N
-
-s
o3
-
so3
3s
o -
H
N
+N
N
N
H
H H +
so -3
3s
o
so -3
so3 -
3s
o -
+
N
N
H
H
N
H +
H
N
-
-so3
-so 3
3
so -
H
N
+N
N
NH
H
H +
so
-3
3
so
so -3
so3 -
3s
o -
+N
N
HHN
H
+
HN
so 3
-
3s
o-
3s
o -
3s
o -
N
N
N
NHH
HH
+
+ s o -3
s o
HN+
HN
H+N
H N
-3
-s o 3
-3
s o
-
-s o 3
-s o 3
3s o -
H
N
+N
N
N
HH
H+
s o -3
3s o
s o -3
s o 3-
3s o -
+N
NH
HN
H
+H
N
-
-s o
3
-s
o3 3s
o -
HN
+N
N
NH HH
+
s o -3
3so
so-
3
so
3-
3so -
+N
NH
H NH
+
HN
-
-s
o3
-s
o3
3
so-HN +
N
N
N
H
HH+
so- 3
3
so
so- 3
so
3-
3so-
+N
NH
H
NH
+HN
-
-s
o3
-
so
3
3s
o-
H
N
+N
N
N
H
HH+
so- 3
3s
o
so
- 3
so
3-
3
so-
+
N
N
H
H
N
H+
H
N
-
-
so3
- so3
3
so-
H
N
+N
N
NH
H
H+
so- 3
3
so
so
- 3
so3-
3s
o-
+N
N
H HN
H
+
HN
-
- so3
- so3
3 so-
H
N
+ N
N
N
H
HH
+
so- 3
3 so
so- 3
so3-
3s
o-
+NN H H
NH
+ HN
-
- so3
- so3
3 so-
H
N
+ N
N
NH
HH+
so-3
3 so
so-3
so3-
3 so-
+ N
NH
HN
H
+H N
-
-so3
-s
o33s
o-
HN
+ N
N
N HHH
+
so-3
3s
os
o-3
so3 -
3 so-
+ N
NH
HN H
+
H N
-
-s
o3
-s
o3
3
so -
H N+
N
N
N
H
H H +
so-3
3
so
so -3
so
3 -
3
so-
+
N
NH
H
N H
+H
N
-
-s
o3
-
so3
3s
o-
H
N
+N
N
N
H
H H +
so -3
3s
o
so -3
so3 -
3s
o -
+N
N
H
H
N
H +
H
N
-
-so3
-so 3
3
so
-
H
N
+N N
NH
H
H +
so
-3
3
so
so -3
so3 -
3s
o -
+N
NHHN
H
+
HN
Figure 5. Proposed model for the aggregates that simulates the SAXS scattering curves at pH 4.0 of the diprotonated porphyrin (H4TPPS4)2-. A) Top view of the cross-sectional area underlying a single porphyrin layer; B) Overall view of the hollow cylinder underlying two separate porphyrin layers (see [28]). the SAXS technique. The scattering data were analysed through the modeling of the particle form factor and interference function. The best fits of SAXS data were achieved assuming several different particle form factors with a homogeneous electron density
(B)
Rosangela Itri et al. 178
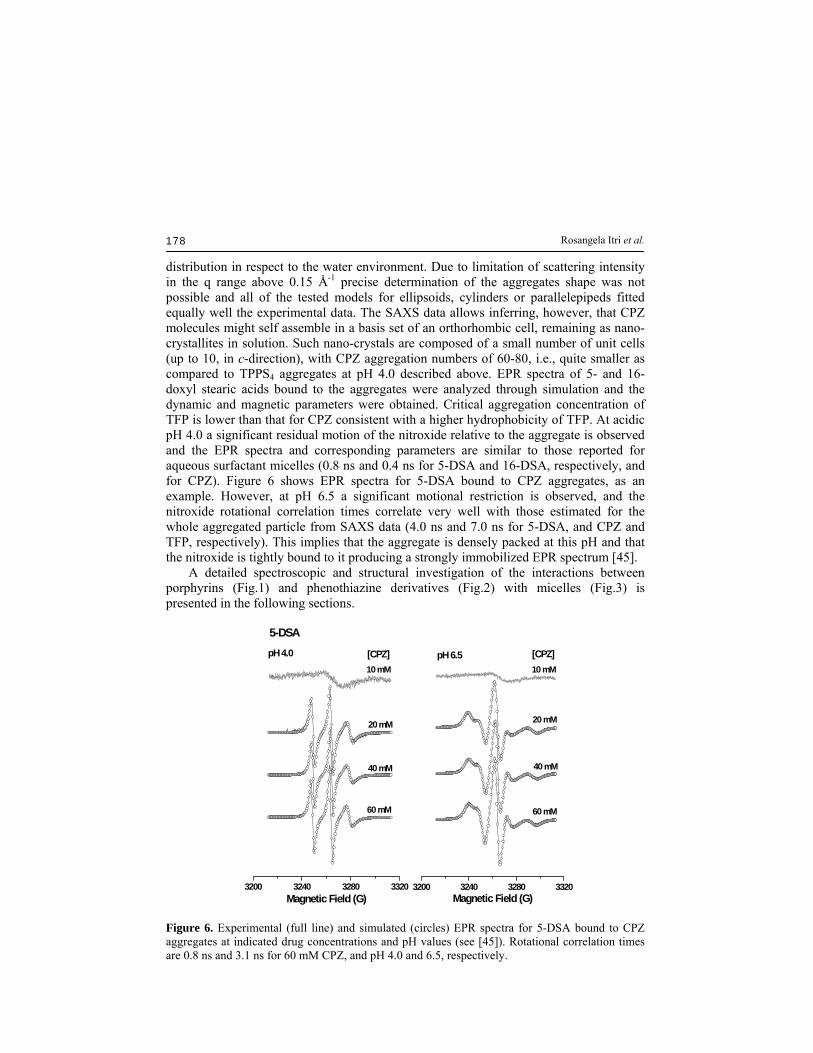
distribution in respect to the water environment. Due to limitation of scattering intensity in the q range above 0.15 Å-1 precise determination of the aggregates shape was not possible and all of the tested models for ellipsoids, cylinders or parallelepipeds fitted equally well the experimental data. The SAXS data allows inferring, however, that CPZ molecules might self assemble in a basis set of an orthorhombic cell, remaining as nano-crystallites in solution. Such nano-crystals are composed of a small number of unit cells (up to 10, in c-direction), with CPZ aggregation numbers of 60-80, i.e., quite smaller as compared to TPPS4 aggregates at pH 4.0 described above. EPR spectra of 5- and 16-doxyl stearic acids bound to the aggregates were analyzed through simulation and the dynamic and magnetic parameters were obtained. Critical aggregation concentration of TFP is lower than that for CPZ consistent with a higher hydrophobicity of TFP. At acidic pH 4.0 a significant residual motion of the nitroxide relative to the aggregate is observed and the EPR spectra and corresponding parameters are similar to those reported for aqueous surfactant micelles (0.8 ns and 0.4 ns for 5-DSA and 16-DSA, respectively, and for CPZ). Figure 6 shows EPR spectra for 5-DSA bound to CPZ aggregates, as an example. However, at pH 6.5 a significant motional restriction is observed, and the nitroxide rotational correlation times correlate very well with those estimated for the whole aggregated particle from SAXS data (4.0 ns and 7.0 ns for 5-DSA, and CPZ and TFP, respectively). This implies that the aggregate is densely packed at this pH and that the nitroxide is tightly bound to it producing a strongly immobilized EPR spectrum [45]. A detailed spectroscopic and structural investigation of the interactions between porphyrins (Fig.1) and phenothiazine derivatives (Fig.2) with micelles (Fig.3) is presented in the following sections.
3200 3240 3280 3320
60 mM
40 mM
20 mM
[CPZ][CPZ]
Magnetic Field (G)3200 3240 3280 3320
5-DSA
pH 6.5pH 4.010 mM10 mM
60 mM
40 mM
20 mM
Magnetic Field (G) Figure 6. Experimental (full line) and simulated (circles) EPR spectra for 5-DSA bound to CPZ aggregates at indicated drug concentrations and pH values (see [45]). Rotational correlation times are 0.8 ns and 3.1 ns for 60 mM CPZ, and pH 4.0 and 6.5, respectively.

Interaction of biomolecules with surfactant aggregates 179
2. Material and methods 2.1 SAXS and EPR experiments Samples used for SAXS and EPR experiments were prepared in 30 mM acetate-phosphate-borate buffer obtained as a mixture of the corresponding sodium salts (Mallinckrodt) in Milli-Q water. The buffer was adjusted at pHs 4.0, 6.0, 7.0 and 9.0 by addition of stock concentrated calibrated solutions of HCl and NaOH and measured using a Digimed pH meter. CTAC was obtained from Acros Organics (New Jersey, USA), SDS, HPS and LPC were from Sigma Chem. Co. (USA). For all surfactants an appropriate weighted amount was dissolved in aqueous solution to obtain a stock solution at 0.5 M. The weighted amounts of porphyrins (Midcentury, USA, sodium salt of TPPS and chloride salt for TMPyP) or phenothiazines (Sigma Chem. Co., USA) were dissolved in buffer to obtain a final porphyrin or phenothiazine stock solution in the range 2-10 mM. Suspensions of surfactant stock solutions of 0.5 M CTAC, SDS, HPS, LPC, in buffer solution, were added to porphyrins solutions in Eppendorf tubes in order to obtain the desired porphyrin or phenothiazine:surfactant molar ratio at each chosen pH. All products were used as received. For SAXS measurements, the samples containing 40mM and 100 mM of SDS, 100 mM CTAC, 30 mM of HPS and 30 mM of LPC, under the same conditions described previously, were maintained in equilibrium for at least 48 h, where the final volume of each sample was 0.6 ml. SAXS experiments were performed at the National Synchrotron Light Laboratory (LNLS), Campinas, Brazil, using a detector-to-sample distance of 930 mm. The scattering vector amplitude q is defined as q = 4πsinθ /λ, 2θ being the scattering angle and λ the X-ray wavelength of 1.608 Å. The experimental intensities were corrected for background, buffer contributions, sample attenuation, and detector homogeneity. The spin labels 5- and 16-doxyl stearic acids (5- and 16-DSA, respectively), were purchased from Aldrich Chem. Co. (Milwaukee, WI, USA). These spin labeled stearates have a paramagnetic group attached at C-5 and C-16 positions of acyl chain, respectively. A small aliquot of spin labels dissolved in ethanol (10-2 M) was placed in an eppendorf tube and the solvent was evaporated under a stream of nitrogen gas. The samples containing the final indicated surfactant concentration and the appropriate amount of porphyrin or phenothiazines were added directly to the thin film on the spin label, where the final concentration of spin labels was estimated to be 10-4 M. After labeling under gentle stirring, the samples were introduced into a capillary tube for EPR measurements. Continuous-wave EPR spectra were recorded at the microwave frequency of 9.4 GHz on a Varian E-9 spectrometer equipped with a computer acquisition system. Sample capillaries were placed in a quartz EPR sample tube and centered in a standard rectangular microwave cavity under critical coupling conditions. The spectral parameters were as follows: microwave power, 20 mW; modulation frequency, 100 KHz; modulation amplitude, 0.5-1.6 G; magnetic field scan, 100 G; sweep time, 4 min. All EPR experiments were performed at room temperature of 23oC. 2.2. EPR analysis The fittings of EPR spectra were performed using the nonlinear least-squares (NLLS) simulation program [46,47]. This program resolves the stochastic Liouville equation

Rosangela Itri et al. 180
using a modified Levenberg-Marquardt algorithm. For multicomponent EPR spectra, the NLLS program allows to obtain the relative population for each component by the separation-of-variables method, in which a subset of fitting parameters is independently minimized at each interation. This method increases the efficiency of this procedure since it reduces the number of parameters to be fitted by nonlinear least squares. For a complete description of the radical nitroxide reorientation, the simulation program makes use of several different coordinate systems. The magnetic g and A tensors are defined in a molecule-fixed-frame, where the diffusion tensor is also included [46]. By convention, the x-axis points along the N-O bond, the z-axis is parallel to the 2pz axis of the nitrogen atom, and the y-axis is perpendicular to x and z [46,48]. The NLLS program allowed to estimate the rotational diffusion constants around the x, y, and z axis (the diffusion tensor R). However, in order to reduce the correlation between the variable parameters and to simplify the spectral simulation, we assumed an axial rotational symmetry with Rx = Ry = R⊥ and Rz = R//. Thus, the average rotational rate constant will be given by 3
//2 RRR ⊥≡ , where a rotational anisotropy N ≡ R// / R⊥ ≡ 10 was chosen [47].
Assuming also a simple Brownian model for rotational reorientation of spin labels, the rotational correlation time is ( ) 16 −
= Rτ [48]. In order to improve the fittings additional
Lorentzian and Gaussian inhomogeneous broadening parameters were also employed. 2.3. SAXS analysis It is well known that the experimental small angle X-ray scattering for particles of monodisperse size and shape randomly distributed in a colloidal solution can be modeled by the equation [49,50] I(q) = knp P(q)S(q) (1) where np corresponds to the particle number density, k is a normalization factor related to the instrumental set-up. In our case, P(q) is the micelle-like aggregate form factor, reflecting the micelle size and shape, S(q) is the intermicellar structure factor. In this work, we make use of ellipsoidal-like and cylindrical-like micelle shapes, by considering the micelles presenting a two electron density levels: one associated to the paraffinic moiety and corresponding to the micellar hydrophobic core and the other one corresponding to the hydrated charged micellar headgroup. In the case of ellipsoids (Fig. 7) of no preferential orientation, the form factor is obtained from an average of all values of ψ, the angle between the ellipsoid long axis and the direction of the scattering vector, as [51]
ψψψϕρρψϕρρπ
dqRVqRVqP )cos())](()())(()[()( 22220211121
20
Θ−+Θ−= ∫ (2)
where 21
2222
21
2221
)(cos)(
)(cos)(
ψνψψ
ψνψψ
sen
sen
tot+=Θ
+=Θ
and R1 = paraffinic chain length of mean electron density ρ1 of 0.275 e/A3 and volume V1; ν= axial ratio; νtot = (νR1 +σ)/ R2 is the axial ratio of the

Interaction of biomolecules with surfactant aggregates 181
σpolνRpar Rpar
Apolar/hidrofóbica
Polar/hidrofílica
σ νR1
R1
ρ0
ρ1
ρ2
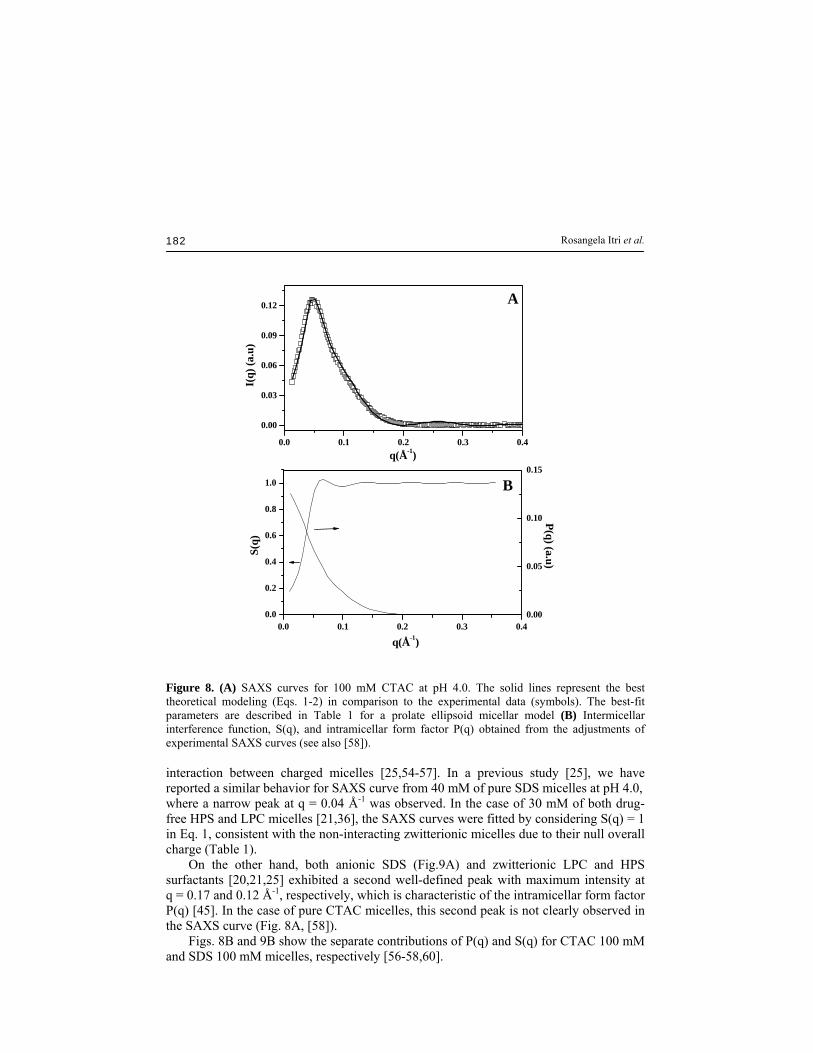
Figure 7. Schematic representation of a revolution prolate ellipsoid with two levels of different electron densities ρl and ρ2 relative to the medium ρ0. whole particle of volume V2; R2 = R1 +σ; and σ is the thickness of the polar shell of electron density ρ2; ρ0 = electron density of the solvent (0.33 e/A3 of aqueous solution). An appropriate similar expression is used for cylinder-like aggregates. [52,53]. The interparticle interference function S(q) can be calculated through the pair correlation function, g(r), which is related to the particle-particle interaction potential. In the present work, we made use of the Hayter and Penfold’s methodology [54,55], which associates the micelle as a charged sphere, interacting through a screened Coulomb potential in the mean spherical approximation (MSA). By doing so, the micellar form factor P(q) and the effective sphere for S(q) have equal inner-hydrocarbon-core volumes and are surrounded by polar shells of thickness σ [25]. The structural parameters and the micellar charge are then obtained by fitting the product P(q)S(q) to the experimental curve. It should be remarked that α has to be considered as an “effective value,” since as a free parameter it can suppress the deficiencies of the potential accounted for in this methodology [56]. The determination of k in Eq. (1) is here performed by considering the scattering intensity for a sodium dodecyl sulphate micellar solution as a standard curve since the respective P(q) and S(q) parameters are well known [56,57]. 3. Results and discussion 3.1. SAXS analysis of pure ionic micelles in the absence of biomolecules 3.1.1. Pure micelles Fig. 8A shows the SAXS data (symbols) obtained from a sample composed of 100 mM of pure CTAC at pH 4.0. Initially, the SAXS measurements were performed at lower CTAC concentration of 40 mM. However, the scattering intensities were not sufficient to perform adequate fittings. The best fitting for SAXS curves (solid lines) were obtained assuming the CTAC micelle as a prolate ellipsoid, with an axial ratio ν = 3.0 (Table 1, [58]). Noteworthy, the SAXS curve for pure CTAC micelles (Fig. 8A) exhibits a narrow peak at q = 0.06 Å-1, in good agreement with previous work [59]. This peak is a fingerprint of an interference function S(q), associated with a repulsive electrostatic
Rosangela Itri et al. 182
0.0 0.1 0.2 0.3 0.4
0.00
0.03
0.06
0.09
0.12
0.0 0.1 0.2 0.3 0.40.00
0.05
0.10
0.15
0.0
0.2
0.4
0.6
0.8
1.0
q(Å-1)
A
I(q)
(a.u
)
q(Å-1)
B
P(q) (a.u)
S(q)
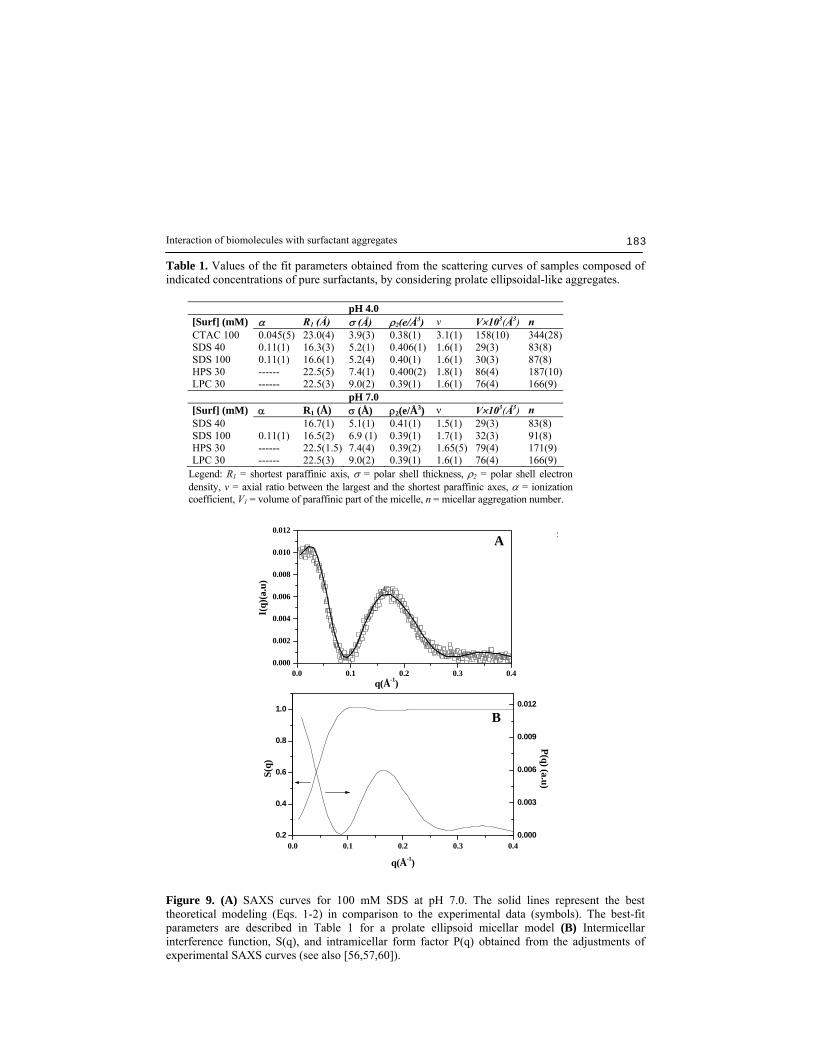
Figure 8. (A) SAXS curves for 100 mM CTAC at pH 4.0. The solid lines represent the best theoretical modeling (Eqs. 1-2) in comparison to the experimental data (symbols). The best-fit parameters are described in Table 1 for a prolate ellipsoid micellar model (B) Intermicellar interference function, S(q), and intramicellar form factor P(q) obtained from the adjustments of experimental SAXS curves (see also [58]). interaction between charged micelles [25,54-57]. In a previous study [25], we have reported a similar behavior for SAXS curve from 40 mM of pure SDS micelles at pH 4.0, where a narrow peak at q = 0.04 Å-1 was observed. In the case of 30 mM of both drug-free HPS and LPC micelles [21,36], the SAXS curves were fitted by considering S(q) = 1 in Eq. 1, consistent with the non-interacting zwitterionic micelles due to their null overall charge (Table 1). On the other hand, both anionic SDS (Fig.9A) and zwitterionic LPC and HPS surfactants [20,21,25] exhibited a second well-defined peak with maximum intensity at q = 0.17 and 0.12 Å-1, respectively, which is characteristic of the intramicellar form factor P(q) [45]. In the case of pure CTAC micelles, this second peak is not clearly observed in the SAXS curve (Fig. 8A, [58]). Figs. 8B and 9B show the separate contributions of P(q) and S(q) for CTAC 100 mM and SDS 100 mM micelles, respectively [56-58,60].
Interaction of biomolecules with surfactant aggregates 183
Table 1. Values of the fit parameters obtained from the scattering curves of samples composed of indicated concentrations of pure surfactants, by considering prolate ellipsoidal-like aggregates.
pH 4.0 [Surf] (mM) α R1 (Å) σ (Å) ρ2(e/Å3) ν V×103(Å3) n CTAC 100 0.045(5) 23.0(4) 3.9(3) 0.38(1) 3.1(1) 158(10) 344(28)SDS 40 0.11(1) 16.3(3) 5.2(1) 0.406(1) 1.6(1) 29(3) 83(8) SDS 100 0.11(1) 16.6(1) 5.2(4) 0.40(1) 1.6(1) 30(3) 87(8) HPS 30 ------ 22.5(5) 7.4(1) 0.400(2) 1.8(1) 86(4) 187(10)LPC 30 ------ 22.5(3) 9.0(2) 0.39(1) 1.6(1) 76(4) 166(9) pH 7.0 [Surf] (mM) α R1 (Å) σ (Å) ρ2(e/Å3) ν V×103(Å3) n SDS 40 16.7(1) 5.1(1) 0.41(1) 1.5(1) 29(3) 83(8) SDS 100 0.11(1) 16.5(2) 6.9 (1) 0.39(1) 1.7(1) 32(3) 91(8) HPS 30 ------ 22.5(1.5) 7.4(4) 0.39(2) 1.65(5) 79(4) 171(9) LPC 30 ------ 22.5(3) 9.0(2) 0.39(1) 1.6(1) 76(4) 166(9)
Legend: R1 = shortest paraffinic axis, σ = polar shell thickness, ρ2 = polar shell electron density, ν = axial ratio between the largest and the shortest paraffinic axes, α = ionization coefficient, V1 = volume of paraffinic part of the micelle, n = micellar aggregation number.
0.0 0.1 0.2 0.3 0.40.000
0.002
0.004
0.006
0.008
0.010
0.012
0.0 0.1 0.2 0.3 0.40.2
0.4
0.6
0.8
1.0
0.000
0.003
0.006
0.009
0.012
A
q(Å-1)
S
I(q)
(a.u
)
B
S(q)
q(Å-1)
P(q) (a.u)
Figure 9. (A) SAXS curves for 100 mM SDS at pH 7.0. The solid lines represent the best theoretical modeling (Eqs. 1-2) in comparison to the experimental data (symbols). The best-fit parameters are described in Table 1 for a prolate ellipsoid micellar model (B) Intermicellar interference function, S(q), and intramicellar form factor P(q) obtained from the adjustments of experimental SAXS curves (see also [56,57,60]).
Rosangela Itri et al. 184
From the fitting data presented in Table 1, it is clear that, in spite of having different paraffinic radii that are consistent with the corresponding extended chain length, HPS, LPC and SDS micelles in aqueous solution self-assemble as small prolate aggregates that are smaller than that formed by CTAC, independent of surfactant concentration and pH. 3.2. SAXS analysis of ionic CTAC and SDS micelles in the presence of biomolecules 3.2.1. Effects of porphyrins upon ionic micelles Spectroscopic characterization of porphyrin interaction with different micelles has been also investigated in the last decades [4,27,30,32,33,36,61]. Maiti et al. [30] have reported that porphyrins interact with surfactants leading to stable structures of porphyrin-surfactant aggregates. The kinetics of the formation of the aggregates and its structure depend on the forces between the ionic surfactant and the charged porphyrin. The structure of the porphyrin-surfactant aggregate depends upon the concentration of the surfactant and increasing this parameter leads to a sequential formation of J-, H- aggregates and finally solubilization of the porphyrin as monomers as shown in the following scheme: Monomer J H Micellized Monomer. We have studied the interaction of TPPS4 and TMPyP in the free base form, and metalloporphyrins, FeTPPS4, FeTMPyP and ZnTPPS4, with different surfactants [27,36,61,60,62]. The mechanisms of porphyrin interaction have been shown to imply both electrostatic and hydrophobic interactions with these systems. Our results, in agreement with literature data [30,32,33], suggested that these interactions depend on the surfactant headgroups and the pH of the medium. The propensity of TPPS4 to aggregate in acidic media, both in homogeneous solution [27,28,30], due to its transition to the diacid form (Figs. 1, 5): H2TPPS4
4- + 2H+ ⇔ H4TPPS4
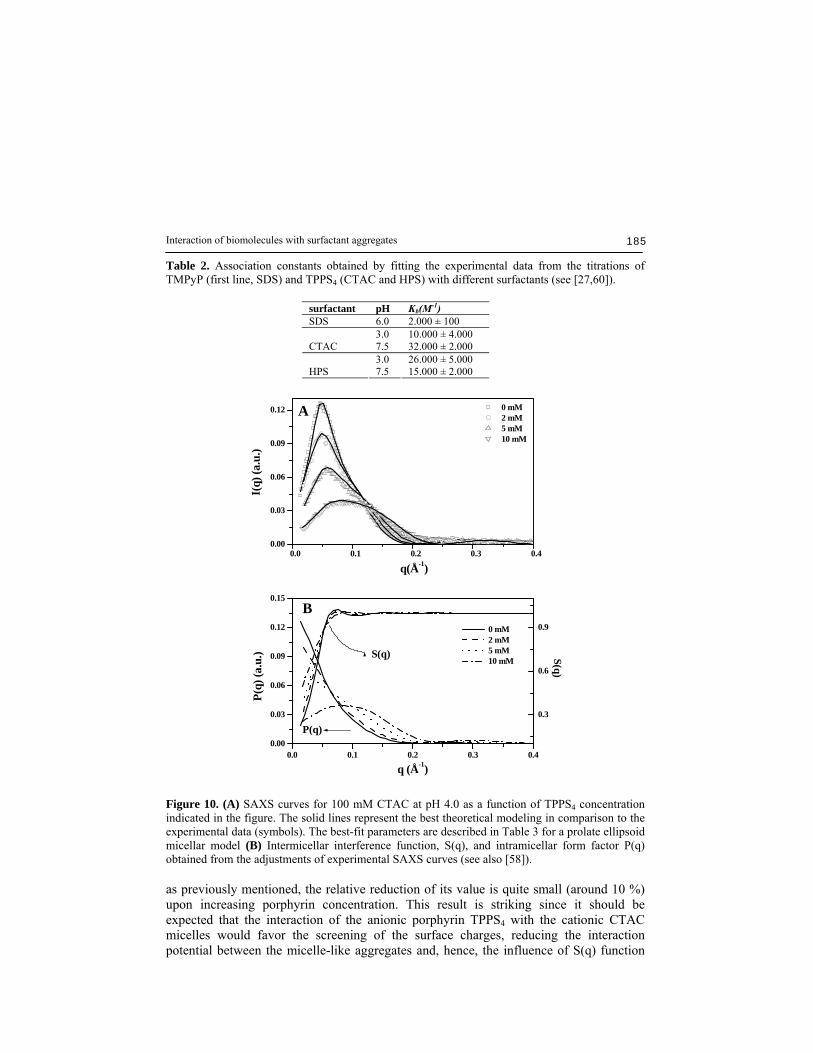
2-, and in the presence of cationic micelles [27,30], is well known. For TPPS4, the pKa = 4.52 for micromolar concentrations in 20 mM acetate-phosphate buffer solution is changed in the presence of micelles. The value of pKa decreases to 2.56 for cationic CTAC, while anionic SDS causes only a quite small, almost negligible, increase to pKa = 4.70. In the case of HPS, the absence of pKa has been associated to the partial protonation of the sulfonate groups of the surfactant, which are in large excess as compared to porphyrin, in the used pH range [27]. These pKa changes of the porphyrins induced by the micelles are consistent with a strong porphyrin-micelle interaction, which is also reflected by the association constants, Kb, on the order of 104 M-1 found for TPPS4 with HPS and CTAC [27,61]. The Kb value obtained from optical absorption experiments for TMPyP to SDS is 2x10³ M-1. Due to small spectral changes observed in the absorption spectra it was not possible to obtain a reliable estimate of Kb value for TMPyP-HPS system. Table 2 shows the Kb values for the porphyrins studied in our work in the presence of different surfactant solutions. According to the fitting parameters obtained from SAXS data and presented in the Table 3 (see also ref. [58]), the main action of TPPS4 molecules in the CTAC micelles is to induce a small size reduction in the hydrophobic region as evidenced by a decrease in R1 value. Fig. 10B shows the intermicellar interference function, S(q), and the intramicellar form factor, P(q), obtained from the fitting to the SAXS curves in Fig. 10A. Noteworthy, although the ionization coefficient must be considered as an effective value,
Interaction of biomolecules with surfactant aggregates 185
Table 2. Association constants obtained by fitting the experimental data from the titrations of TMPyP (first line, SDS) and TPPS4 (CTAC and HPS) with different surfactants (see [27,60]).
surfactant pH Kb(M-1) SDS 6.0 2.000 ± 100
3.0 10.000 ± 4.000 CTAC 7.5 32.000 ± 2.000
3.0 26.000 ± 5.000 HPS 7.5 15.000 ± 2.000
0.0 0.1 0.2 0.3 0.40.00
0.03
0.06
0.09
0.12
0.3
0.6
0.9
0.0 0.1 0.2 0.3 0.40.00
0.03
0.06
0.09
0.12
0.15
A
S(q)
0 mM 2 mM 5 mM 10 mM
I(q)
(a.u
.)
q(Å-1)
P(q)
S(q)
B
0 mM 2 mM 5 mM 10 mM
q (Å-1)
P(q)
(a.u
.)
Figure 10. (A) SAXS curves for 100 mM CTAC at pH 4.0 as a function of TPPS4 concentration indicated in the figure. The solid lines represent the best theoretical modeling in comparison to the experimental data (symbols). The best-fit parameters are described in Table 3 for a prolate ellipsoid micellar model (B) Intermicellar interference function, S(q), and intramicellar form factor P(q) obtained from the adjustments of experimental SAXS curves (see also [58]). as previously mentioned, the relative reduction of its value is quite small (around 10 %) upon increasing porphyrin concentration. This result is striking since it should be expected that the interaction of the anionic porphyrin TPPS4 with the cationic CTAC micelles would favor the screening of the surface charges, reducing the interaction potential between the micelle-like aggregates and, hence, the influence of S(q) function

Rosangela Itri et al. 186
over the SAXS curves. This screening effect is more evident if we estimate the effective micelle surface charge, z = α.n, which at pH 4.0, reduces from 15.5 in the absence of porphyrin (Table 1) to 8.3 at 10 mM of TPPS4 (Table 3). The tendency of z (and α) to decrease in CTAC micelles is consistent with partial surface charge neutralization by the porphyrin [58]. On the other hand, the P(q) function exhibited considerable changes as a function of TPPS4 concentration (Fig. 10, [58]), independent of the pH in the range from 4.0 to 9.0. Taken together, these findings indicate that the TPPS4 association with cationic micelles has a significant contribution of the hydrophobic interactions, in agreement with previous works [27,58,30]. SAXS data analysis demonstrated for SDS micelles a prolate ellipsoidal shape, and no significant changes in the micellar shape or size due to TMPyP addition were observed. The broad peak around q ≅ 0.17 Å−1, which is typical of the intramicellar form factor of SDS micelles, essentially, does not change upon increasing porphyrin concentration. Therefore, the SDS micellar hydrophobic core is not dramatically affected by the porphyrin addition. The presence of a second inner peak around q≅ 0.04 Å−1 is a fingerprint of an interference function due to the interaction between charged micelles [54-57]. This peak exists in the scattering curves without the porphyrin at pH 6.0. On the other hand, this interference peak decreases when 2, 5 and 10 mM of the porphyrin is added to the solution (Table 3). Therefore, the main effect of porphyrin, reduction of the ionization coefficient, is due to partial neutralization by the macrocycle of the micellar headgroup charges. In the CTAC- TPPS4 system, where a stronger binding occurs (see Table 2), the micellar core size is reduced at the highest porphyrin concentration, indicating that some porphyrin insertion into the polar interface must take place. It should be remarked that the electrostatic contribution is a major factor in the interaction between water-soluble porphyrins and surfactants, which is illustrated by the fact that the SDS-TMPyP interaction is smaller than that for CTAC-TPPS4 [60]. This because TPPS4 presents higher charge density on the sulfonate substituent groups, giving a major contribution to CTAC-TPPS4 interaction. SAXS data, corroborating the optical spectroscopies experiments, showed little effect of TMPyP upon SDS micelles [60]. Table 3. Values of the fit parameters obtained from the scattering curves of samples composed of 100 mM of SDS (first three lines, pH 6.0) and 100 mM CTAC (last three lines, pH 4.0), upon addition TMPyP and TPPS4, respectively, by considering prolate ellipsoidal-like aggregate (see also [58,60]).
[porphyrins] (mM) α R1 (Å) σ (Å) ρ2 (e/Å3) ν Vx103(Å3) n
0 0.065(5) 16.9(1) 6.90(1) 0.390(2) 1.9(1) 39(3) 111(10) 5 0.035(5) 17.0(1) 6.90(2) 0.390(1) 1.9(1) 39(3) 111(10) 10 0.020(1) 17.0(1) 6.92(2) 0.390(2) 1.9(1) 39(3) 111(10) 0 0.045(5) 23.0(4) 3.9(3) 0.38(1) 3.1(1) 158(13) 344(28) 5 0.038(3) 21.5(5) 4.0(3) 0.39(1) 3.0(2) 125(17) 272(37) 10 0.038(3) 20.0(5) 4.0(2) 0.40(1) 3.0(1) 100(11) 219(24)
Legend: R1 = shortest paraffinic axis, σ = polar shell thickness, ρ2 = polar shell electron density, ν = axial ratio between the largest and the shortest paraffinic axes, α = ionization coefficient, V1 = volume of paraffinic part of the micelle, n = micellar aggregation number.
Interaction of biomolecules with surfactant aggregates 187
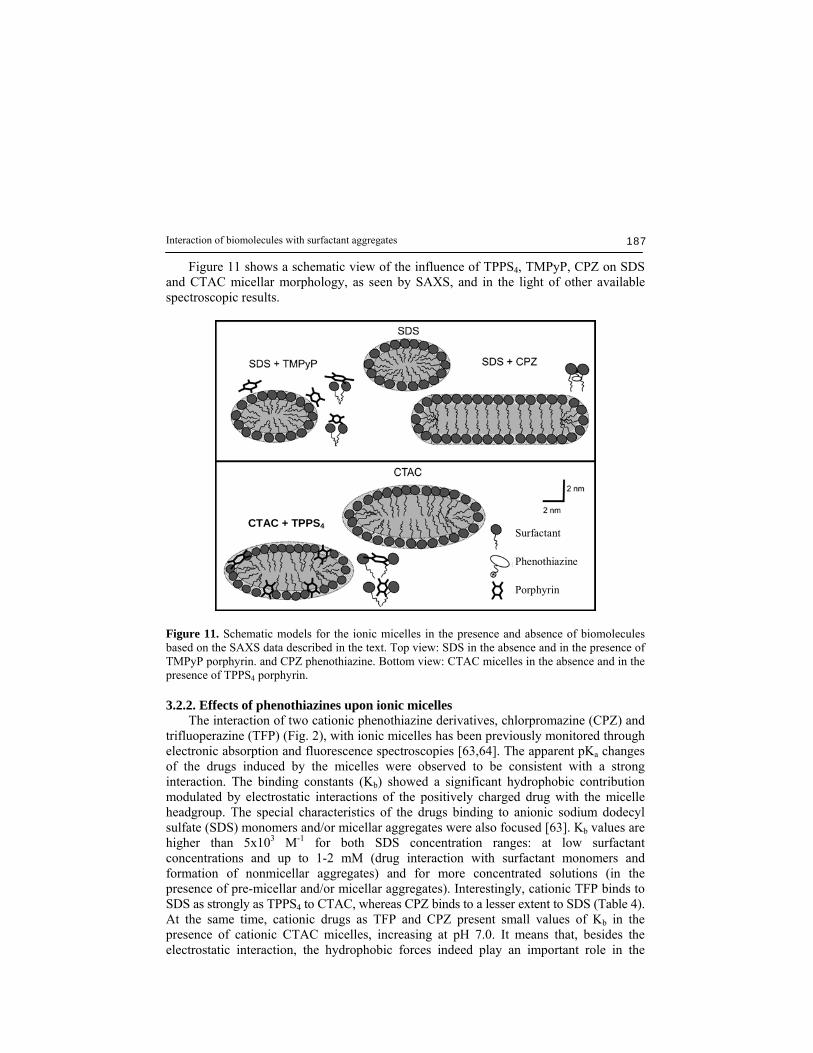
Figure 11 shows a schematic view of the influence of TPPS4, TMPyP, CPZ on SDS and CTAC micellar morphology, as seen by SAXS, and in the light of other available spectroscopic results.
Porphyrin
Phenothiazine
SurfactantCTAC + TPPS4
Figure 11. Schematic models for the ionic micelles in the presence and absence of biomolecules based on the SAXS data described in the text. Top view: SDS in the absence and in the presence of TMPyP porphyrin. and CPZ phenothiazine. Bottom view: CTAC micelles in the absence and in the presence of TPPS4 porphyrin. 3.2.2. Effects of phenothiazines upon ionic micelles The interaction of two cationic phenothiazine derivatives, chlorpromazine (CPZ) and trifluoperazine (TFP) (Fig. 2), with ionic micelles has been previously monitored through electronic absorption and fluorescence spectroscopies [63,64]. The apparent pKa changes of the drugs induced by the micelles were observed to be consistent with a strong interaction. The binding constants (Kb) showed a significant hydrophobic contribution modulated by electrostatic interactions of the positively charged drug with the micelle headgroup. The special characteristics of the drugs binding to anionic sodium dodecyl sulfate (SDS) monomers and/or micellar aggregates were also focused [63]. Kb values are higher than 5x10³ M-1 for both SDS concentration ranges: at low surfactant concentrations and up to 1-2 mM (drug interaction with surfactant monomers and formation of nonmicellar aggregates) and for more concentrated solutions (in the presence of pre-micellar and/or micellar aggregates). Interestingly, cationic TFP binds to SDS as strongly as TPPS4 to CTAC, whereas CPZ binds to a lesser extent to SDS (Table 4). At the same time, cationic drugs as TFP and CPZ present small values of Kb in the presence of cationic CTAC micelles, increasing at pH 7.0. It means that, besides the electrostatic interaction, the hydrophobic forces indeed play an important role in the

Rosangela Itri et al. 188
interaction between charged drugs and charged micelles. The balance between these two forces defines the co-micellization process in terms of drug location in the model membrane. Subsequently, small angle X-ray scattering (SAXS) study was performed on the interaction of CPZ with SDS micelles [25]. The results demonstrated that the shape and size of the drug/SDS mixed micelles are both SDS concentration and SDS:CPZ molar ratio dependent. Further, the SAXS data evidenced a micellar shape transformation from small prolate ellipsoid with axial ratio ν = 1.5 (for 40 mM SDS micelles in the absence of the drug) to cylinder of ν = 2.9 (with addition of 10 mM CPZ), without an impact on micellar core (Fig. 11). The micellar growth is triggered by a surface charge screening as the molar ratio drug:surfactant increases in the complex. Further, the influence of TFP on the micellar properties of SDS (40 mM) was also investigated by means of SAXS [20] and the results parallel those of CPZ. Interestingly, the SDS molecules assemble as cylinder-like aggregates of anisometry ν ≈ 4.2 in the co-micellization with 10 mM TFP [20]. The main difference related to the CPZ is that the TFP molecule possesses two pKa values atributted mainly to the nitrogens of the hydrophobic piperazinic group attached to the phenothiazine ring (pKa1 = 4.0 and pKa2 = 8.0, for micromolar concentrations in aqueous solution [63]) in comparison to the unique nitrogen of the CPZ alkyl amino-group attached to the phenothiazine heteroaromatic ring (Fig. 2, CPZ pKa = 9.3, for micromolar concentrations in aqueous solution [63]). In the presence of SDS micelles the pKa of CPZ increases to 10 [63]. In the case of TFP in the presence of micelles, a unique pKa is observed of 4.4 for SDS [63]. The highest pKa for TFP (8 in buffer) in the presence of surfactants was not observed suggesting that the second deprotonation is not so easy in the presence of surfactants. In this way, CPZ is always monoprotonated at acidic and neutral pH while at pH greater than 9 it is partially protonated to a greater or lesser extent depending on the surfactant. In the case of TFP it must be always monoprotonated at neutral and basic pH and appears to be partially diprotonated at pH below 4. These observations, probably, justify the extensive change in shape and size of SDS-phenothiazine co-aggregates. Table 4. Association constants obtained by fitting the experimental data from optical absorption titrations of TFP and CPZ with different surfactants at indicated pH values (see also [21,63]).
TFP CPZ
pH Kb(M-1) Kb(M-1)
2.0 >20.000 5.900±2005.0 >20.000 7.900±200
SDS
7.0 20.000±1.000 3.600±6002.0 25±1 47±2 5.0 326±27 40±1
CTAC
7.0 1.721±78 631±10 2.0 707±34 457±12 5.0 1.055±113 480±24
HPS
7.0 2.247±114 668±8 2.0 2.163 ± 60 2.116 ± 545.0 4145 ± 150 3.361 ± 53
LPC
7.0 4189 ± 63 3.319 ± 57
Interaction of biomolecules with surfactant aggregates 189
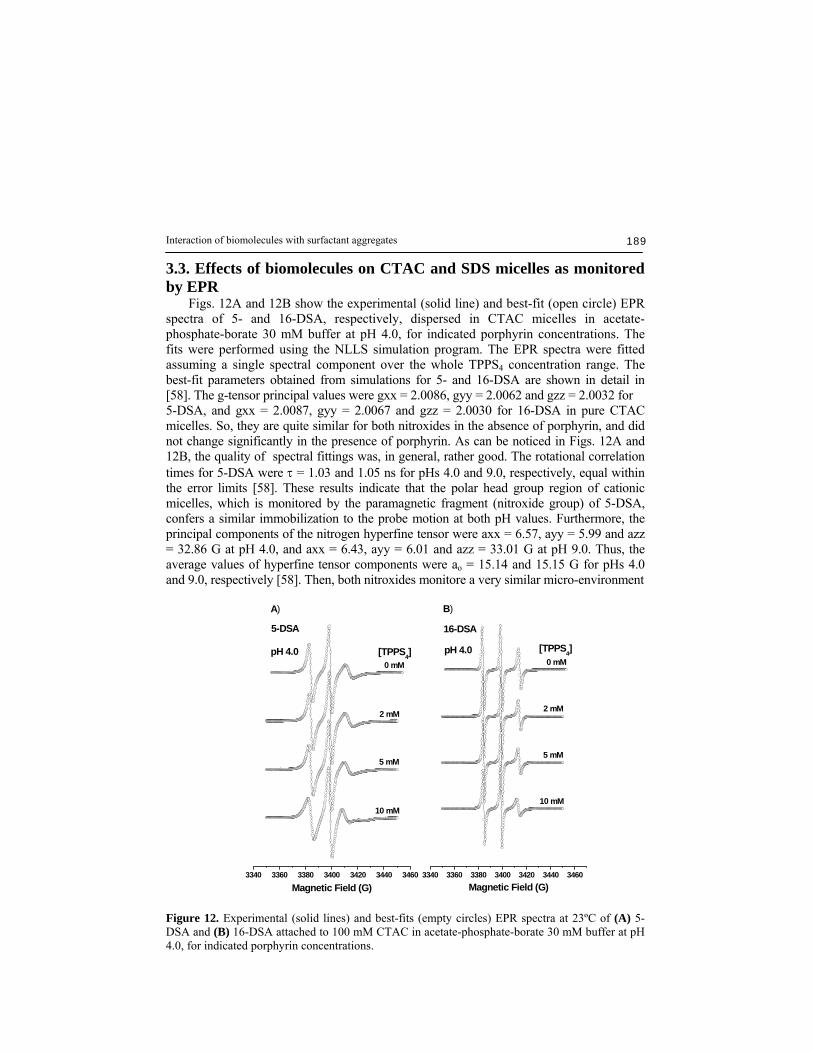
3.3. Effects of biomolecules on CTAC and SDS micelles as monitored by EPR Figs. 12A and 12B show the experimental (solid line) and best-fit (open circle) EPR spectra of 5- and 16-DSA, respectively, dispersed in CTAC micelles in acetate-phosphate-borate 30 mM buffer at pH 4.0, for indicated porphyrin concentrations. The fits were performed using the NLLS simulation program. The EPR spectra were fitted assuming a single spectral component over the whole TPPS4 concentration range. The best-fit parameters obtained from simulations for 5- and 16-DSA are shown in detail in [58]. The g-tensor principal values were gxx = 2.0086, gyy = 2.0062 and gzz = 2.0032 for 5-DSA, and gxx = 2.0087, gyy = 2.0067 and gzz = 2.0030 for 16-DSA in pure CTAC micelles. So, they are quite similar for both nitroxides in the absence of porphyrin, and did not change significantly in the presence of porphyrin. As can be noticed in Figs. 12A and 12B, the quality of spectral fittings was, in general, rather good. The rotational correlation times for 5-DSA were τ = 1.03 and 1.05 ns for pHs 4.0 and 9.0, respectively, equal within the error limits [58]. These results indicate that the polar head group region of cationic micelles, which is monitored by the paramagnetic fragment (nitroxide group) of 5-DSA, confers a similar immobilization to the probe motion at both pH values. Furthermore, the principal components of the nitrogen hyperfine tensor were axx = 6.57, ayy = 5.99 and azz = 32.86 G at pH 4.0, and axx = 6.43, ayy = 6.01 and azz = 33.01 G at pH 9.0. Thus, the average values of hyperfine tensor components were ao = 15.14 and 15.15 G for pHs 4.0 and 9.0, respectively [58]. Then, both nitroxides monitore a very similar micro-environment
3340 3360 3380 3400 3420 3440 3460 3340 3360 3380 3400 3420 3440 3460
B)A)
16-DSA
pH 4.0
5-DSA
10 mM
5 mM
2 mM
[TPPS4]0 mM
Magnetic Field (G)
10 mM
5 mM
2 mM
0 mM[TPPS4]pH 4.0
Magnetic Field (G) Figure 12. Experimental (solid lines) and best-fits (empty circles) EPR spectra at 23ºC of (A) 5-DSA and (B) 16-DSA attached to 100 mM CTAC in acetate-phosphate-borate 30 mM buffer at pH 4.0, for indicated porphyrin concentrations.
Rosangela Itri et al. 190
in terms of polarity. Altogether, these findings permit to conclude that the Stern layer region (polar headgroup region) does not change as a function of pH values used in the present work. It is worth mentioning that the foregoing statement is supported by the SAXS results obtained for pure CTAC micelles, where neither polar shell thickness (σpol) nor polar shell electron density (ρpol) show significant changes as a function of pH. Furthermore, for 16-DSA these values were, respectively 0.20 and 0.16 ns. As expected, the mobility of 16-DSA is greater as compared to 5-DSA. In the presence of 10 mM of TPPS4, the rotational correlation times increase by a factor of 2.5 at pH 4.0 and 3.0 at pH 9.0, respectively [58]. This increase is consistent with an increase in motional restriction in the co-micelles in the system CTAC-TPPS4. It is also worth mentioning that the increase in rotational correlation times observed for CTAC-TPPS4 is very similar to the observations for the phenothiazines-SDS system. In pure 40 mM SDS the rotational correlation time for 5-DSA is also around 1.0 ns, increasing upon addition of 10 mM CPZ by a factor of 2 [25]. As will be discussed below, this value is significantly lower as compared to the rotational correlation time for the whole particle, which can be easily estimated from SAXS data [25]. We will come back to this point below. 3.4. SAXS analysis of zwitterionic HPS and LPC micelles in the presence of biomolecules 3.4.1. Effects of porphyrins upon zwitterionic micelles The use of SAXS and EPR spectroscopy has proven to be an efficient tool to evaluate the interaction of TPPS4, at concentrations in the range 2-10 mM, with micelles of the zwitterionic surfactant HPS (30 mM) at pH 4.0 and 9.0 [36]. Theoretical modeling of the SAXS data demonstrated that, upon addition of all species of porphyrins (free base, iron and zinc forms), HPS micelles of prolate shape reduce their axial ratio from 1.8 ± 0.2 (in the absence of porphyrin) to 1.5 ± 0.1. Such an effect is accompanied by a shrinking of the paraffinic shortest semi-axis from 22.5 ± 0.5 Å to 18.0 ± 0.2 Å. This provides evidence that the micellar hydrophobic core is affected by porphyrins incorporation. Furthermore, increase of the porphyrin concentration induced the appearance of a repulsive interference function over the SAXS curve, which is typical of interaction between surface charged micelles. Such finding gives a strong evidence that the negatively charged porphyrin molecule must accommodate in the HPS micelle dipole layer close to the inner positive charges (near the hydrophobic core), inducing a surface charge (probably negative one associated to the HPS sulphonate external groups) in the original zwitterionic (overall neutral) micelle. Altogether, these findings denote that the porphyrin location is favored by both electrostatic and hydrophobic contributions, giving rise to binding constant values that are quite larger as compared to the binding of cationic drugs to HPS micelles (Tables 2 and 4, [20,27]). Similar results were also obtained for the interaction between cationic phenothiazine drugs and zwitterionic lysophosphatidylcholine (LPC) micelles, described below. It is worthy of notice that the dipole moment component along the methylene chain for HPS and LPC molecules differs significantly in the magnitude and sense [21]. SAXS data analysis demonstrated for HPS the mantainance of the prolate ellipsoidal shape, without significant changes in either the shape or size of micelles in the presence
Interaction of biomolecules with surfactant aggregates 191
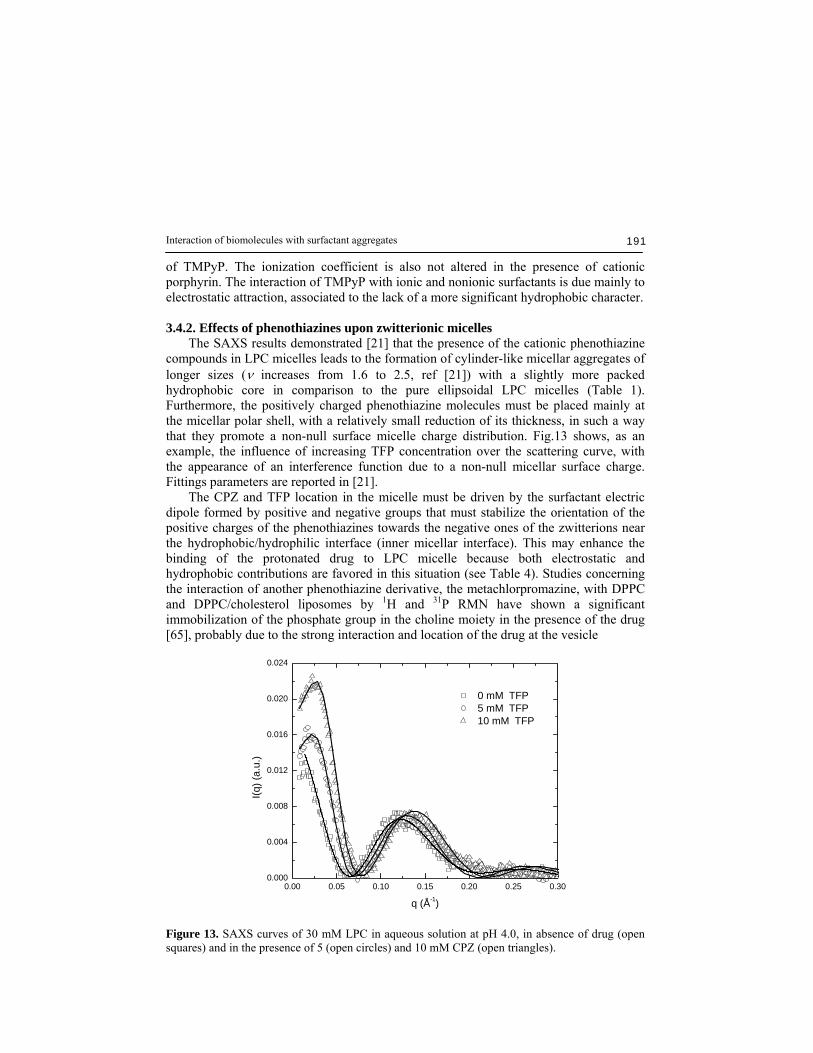
of TMPyP. The ionization coefficient is also not altered in the presence of cationic porphyrin. The interaction of TMPyP with ionic and nonionic surfactants is due mainly to electrostatic attraction, associated to the lack of a more significant hydrophobic character. 3.4.2. Effects of phenothiazines upon zwitterionic micelles The SAXS results demonstrated [21] that the presence of the cationic phenothiazine compounds in LPC micelles leads to the formation of cylinder-like micellar aggregates of longer sizes (ν increases from 1.6 to 2.5, ref [21]) with a slightly more packed hydrophobic core in comparison to the pure ellipsoidal LPC micelles (Table 1). Furthermore, the positively charged phenothiazine molecules must be placed mainly at the micellar polar shell, with a relatively small reduction of its thickness, in such a way that they promote a non-null surface micelle charge distribution. Fig.13 shows, as an example, the influence of increasing TFP concentration over the scattering curve, with the appearance of an interference function due to a non-null micellar surface charge. Fittings parameters are reported in [21]. The CPZ and TFP location in the micelle must be driven by the surfactant electric dipole formed by positive and negative groups that must stabilize the orientation of the positive charges of the phenothiazines towards the negative ones of the zwitterions near the hydrophobic/hydrophilic interface (inner micellar interface). This may enhance the binding of the protonated drug to LPC micelle because both electrostatic and hydrophobic contributions are favored in this situation (see Table 4). Studies concerning the interaction of another phenothiazine derivative, the metachlorpromazine, with DPPC and DPPC/cholesterol liposomes by 1H and 31P RMN have shown a significant immobilization of the phosphate group in the choline moiety in the presence of the drug [65], probably due to the strong interaction and location of the drug at the vesicle
0.00 0.05 0.10 0.15 0.20 0.25 0.300.000
0.004
0.008
0.012
0.016
0.020
0.024
I(q) (
a.u.
)
q (Å-1)
0 mM TFP 5 mM TFP 10 mM TFP
Figure 13. SAXS curves of 30 mM LPC in aqueous solution at pH 4.0, in absence of drug (open squares) and in the presence of 5 (open circles) and 10 mM CPZ (open triangles).
Rosangela Itri et al. 192
interface near the phospholipid headgroup. It is worthy of mention the fact that a significant negative charge is localized in the phosphate group [30], and that the dipole moment for LPC lies mostly perpendicular to the methylene chain facilitating the accomodation of the drug in the micellar polar shell. In the case HPS-phenothiazine interaction, similarly to the effect of TPPS4 in HPS, the main drug effect is to produce a shrinkage of the micelle, reducing the values of paraffinic radius, R1, and anisometry, ν. The micellar shape remains unaltered as a prolate ellipsoid [20]. The SAXS results correlate very well with Kb values found for TFP and CPZ to HPS (Table 4), much smaller as compared to the binding to LPC. Our results suggest that the binding of an anionic drug to HPS must be favored. This was indeed demonstrated for the binding of anionic porphyrin molecules to HPS (Table 2, [36]), where the Kb values are at least one order of magnitude higher than those of TFP (and CPZ) to HPS (Table 4, [42]) Besides, similarly to the data presented here, the corresponding SAXS curves also present interference function under the influence of negatively charged porphyrins in HPS micelles, probably reflecting the same drug location at the inner HPS micellar interface [36]. It should be noted, however, that both drug species, either positively charged as CPZ and TFP [20], or negatively charged as anionic porphyrins [36], lead to a reduction of the overall size of HPS micelle, without affecting its spheroidal form. On the other hand, the micellar growth accompanied by shape transformation from prolate ellipsoid to cylinder promoted by the presence of TFP and CPZ into LPC micelles parallels to the effects previously observed upon incorporation of both phenothiazines to anionic SDS micelles [20,25]. What is remarkable is that the cationic drug promotes a surface charge screening in SDS micelles, whereas it induces a non null surface charge density in zwitterionic LPC micelles [21]. Fig. 14 summarizes how TPPS4 and CPZ (TFP) act on zwitterionic micelles as revealed by SAXS. 3.5. Effects of biomolecules on HPS micelles as monitored by EPR In previous work [36], a different behavior for pure zwitterionic HPS micelles at pHs 4.0 and 9.0 was observed, where the τ values for 5-DSA were 0.91 and 2.46 ns, respectively. This remarkable result denotes that the polar head group region of zwitterionic surfactant was affected by pH value, independent of the presence of porphyrin, since the mobility of the probe was a factor of 2.7 lower (higher τ) in alkaline medium. This could be due to the partial protonation of the nitroxide at pH 4.0, reducing its interaction with the polar micellar headgroup at acidic pH, and increasing its motional rate. Moreover, the principal components of nitrogen hyperfine tensor were axx = 6.30, ayy = 5.86 and azz = 33.00 G at pH 4.0, and axx = 7.36, ayy = 7.50, and azz = 29.82 G at pH 9.0. This change suggests that the paramagnetic fragment of 5-DSA at alkaline pH is oriented in such a way that the contribution of electron density in the x and y directions is increased while in the z direction is reduced. The addition of anionic porphyrin, at 10 mM, leads to a very small increase in rotational correlation time. This result is also in agreement with the small changes in the micellar structure detected in the SAXS experiments (Fig. 14). For zwitterionic HPS surfactant [36], 16-DSA also monitored a similar environment in terms of mobility and polarity for both pH values. As occurs for CTAC, the rotational
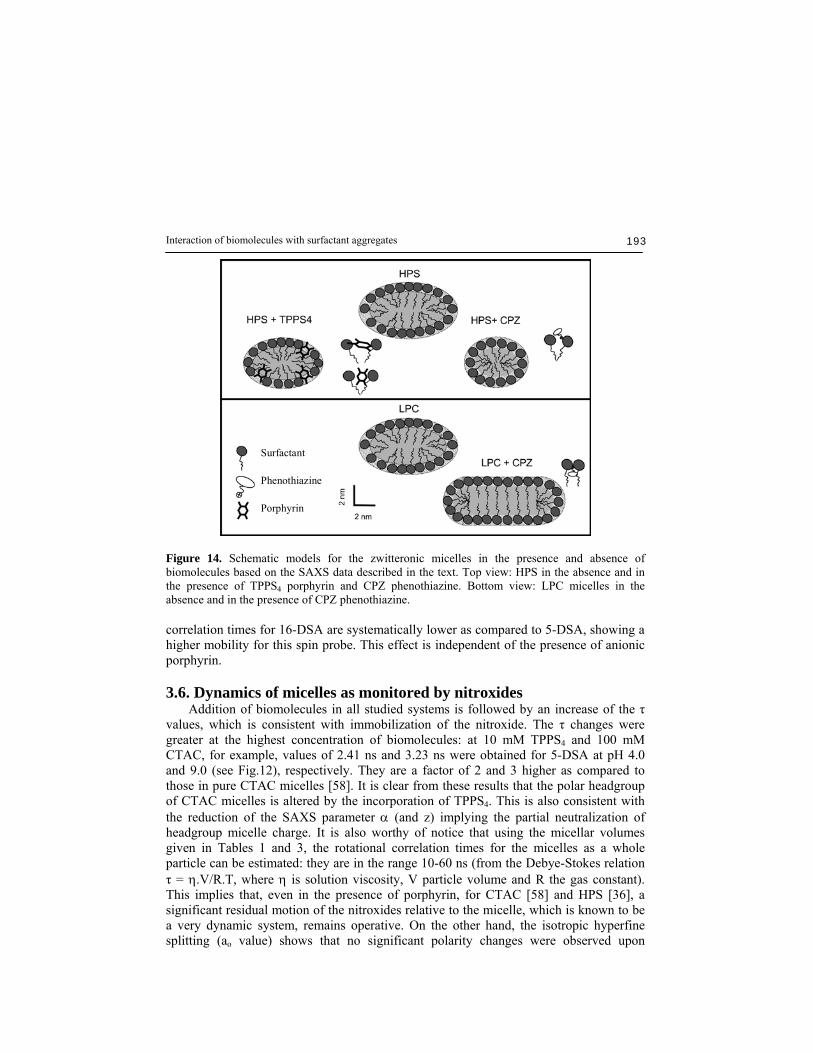
Interaction of biomolecules with surfactant aggregates 193
Porphyrin
Phenothiazine
Surfactant
Figure 14. Schematic models for the zwitteronic micelles in the presence and absence of biomolecules based on the SAXS data described in the text. Top view: HPS in the absence and in the presence of TPPS4 porphyrin and CPZ phenothiazine. Bottom view: LPC micelles in the absence and in the presence of CPZ phenothiazine. correlation times for 16-DSA are systematically lower as compared to 5-DSA, showing a higher mobility for this spin probe. This effect is independent of the presence of anionic porphyrin. 3.6. Dynamics of micelles as monitored by nitroxides Addition of biomolecules in all studied systems is followed by an increase of the τ values, which is consistent with immobilization of the nitroxide. The τ changes were greater at the highest concentration of biomolecules: at 10 mM TPPS4 and 100 mM CTAC, for example, values of 2.41 ns and 3.23 ns were obtained for 5-DSA at pH 4.0 and 9.0 (see Fig.12), respectively. They are a factor of 2 and 3 higher as compared to those in pure CTAC micelles [58]. It is clear from these results that the polar headgroup of CTAC micelles is altered by the incorporation of TPPS4. This is also consistent with the reduction of the SAXS parameter α (and z) implying the partial neutralization of headgroup micelle charge. It is also worthy of notice that using the micellar volumes given in Tables 1 and 3, the rotational correlation times for the micelles as a whole particle can be estimated: they are in the range 10-60 ns (from the Debye-Stokes relation τ = η.V/R.T, where η is solution viscosity, V particle volume and R the gas constant). This implies that, even in the presence of porphyrin, for CTAC [58] and HPS [36], a significant residual motion of the nitroxides relative to the micelle, which is known to be a very dynamic system, remains operative. On the other hand, the isotropic hyperfine splitting (ao value) shows that no significant polarity changes were observed upon
Rosangela Itri et al. 194
binding of porphyrin. Consistent with this observation, SAXS results showed that the Stern layer region is not affected by addition of porphyrin. EPR spectra of 16-DSA also showed sensitivity to the presence of porphyrin (Fig. 12). An increase of the τ values as a function of porphyrin concentration is also observed, indicating that the hydrophobic core of the CTAC micelles increases the mobility restriction to the nitroxide group of 16-DSA in the presence of porphyrin. This is consistent with an increase in packing of the micellar core. This effect is higher at the highest porphyrin concentration of 10 mM and the increase of τ is quite similar for 16-DSA and 5-DSA reported above. These results concerning the motion of 16-DSA are similar to previous data for 30 mM HPS micelles [36], where an immobilization of the probe was observed for increasing porphyrin concentrations. EPR results are in agreement with those obtained from SAXS, where the reduction of the shortest paraffinic axis (R1) is also interpreted as due to the packing effect upon the micellar hydrophobic core. Noteworthy, the motion of 16-DSA is for all micelles significantly faster as compared to 5-DSA for all samples studied in the present work, indicating that the micellar core is less organized as compared to Stern layer region. For pure CTAC micelles at pH 4.0, the τ values were 1.03 and 0.20 ns for 5- and 16-DSA, respectively. This means that the mobility of 16-DSA is a factor of 5 greater as compared to 5-DSA. Nonetheless, the 5- and 16-DSA probes monitored a very similar environment in terms of polarity when incorporated to pure cationic micelles. This result was unexpected, since the hydrophobicity in the micellar inner region monitored by 16-DSA is higher than that in Stern layer region, which is monitored by 5-DSA. Thus, this phenomenon could be related to a possible entrance of water into the hydrocarbon core of the micelle, or that molecules of doxyl stearates are found in such conformation in the CTAC and HPS micelles that the paramagnetic fragment of 5-DSA and 16-DSA are localized in the micelle nucleus at approximately similar distances from the interface. However, this phenomenon remains not very clearly understood yet. Moreover, a common behavior for both spin probes was observed in the presence of porphyrin, when an immobilization of nitroxide moiety groups was observed for increasing porphyrin concentrations. Earlier studies with phenothiazines in the presence of SDS and HPS also revealed the same trend of increase of probe immobilization upon drug addition to the micellar aggregates [20,25]. Here again a considerable motional freedom of the probe relative to the micellar aggregates remained. Values of τ comparable to those for the whole particle were only observed for phenothiazine self-aggregates at pH near to the neutrality (see Fig.6, [45]). 4. Conclusions In the present review we focused on the structure of micellar aggregates formed by two ionic surfactants, anionic SDS and cationic CTAC, and two zwitterionic ones, HPS and LPC. Our goal is to understand how the presence of two classes of relevant biomolecules impact on their structure aiming to obtain subsidies regarding the nature of the interactions between these compounds and biomembranes. Our SAXS data show that for all surfactants, in the absence of biomolecules, a prolate ellipsoidal shape model with two layers of electron density was able to adequately describe the scattering curves. The parameters from this model give useful structural information regarding the whole

Interaction of biomolecules with surfactant aggregates 195
micellar particle such as the paraffinic radius which is consistent with the extended surfactant methylene chain; the polar shell thickness and electron density that depend significantly on the hydration and charge interaction in this layer. Finally, the anisometry that reflects the particle shape and an effective parameter related to the interparticle interference function describing the interaction (electrostatic repulsion) between particles are also determined. The two classes of biomolecules described in this work affect in a different way the micellar properties: the studied porphyrins, being able to form large aggregates, at milimolar concentration, involving a few thousand of molecules, seem to affect the micelles only through relatively peripheral binding; even when located at the border of polar/apolar micellar interface, with relatively high binding constants, they are not able to produce dramatic micelle shape transformations, but only a core size shrinkage reducing the number of aggregated monomers. On the other hand, the phenothiazines, under favorable conditions, are able to induce dramatic changes in the shape of the aggregates reflected in the need for the use of a cylinder-like particle model to fit the experimental SAXS data. Interestingly, the strength of binding to the given micellar system correlates well with the produced effect upon the micellar structure: the effect of phenothiazine upon SDS and LPC is quite intense, being lower for HPS. It should be remarked that the phenothiazine self-aggregates are significantly smaller as compared to the porphyrin ones, being comparable to micellar aggregates of SDS. This, probably, facilitates co-micellization and induction in some cases of the observed drastic changes in shape and size of the co-aggregates. Our EPR spectroscopy data are also quite useful, contributing to shed light on the micellar dynamics as monitored by the nitroxide probes. In general, the nitroxides undergo a significant motional freedom relative to the micellar aggregate as judged from the smaller rotational correlation times in the micelles as compared to the correlation time of the whole particle, a parameter that can be easily estimated from SAXS data. The presence of the biomolecules in the co-micelle induces a reduction of motional freedom that is interpreted as consistent with the increase in packing density of the particles as observed from SAXS. Overall, a significant amount of information on the biomolecules-membrane model system is obtained, illustrating the usefulness of the simultaneous use of the presented methodologies in these investigations. 5. Acknowledgements The authors are indebted to the staff of the SAXS beam line in LNLS (National Laboratory of Synchrotron Light), Campinas, Brazil. This work was supported by FAPESP, CAPES and CNPq brazilian funding agencies. 6. References 1. Fendler, J.H. 1984, Science, 223, 888. 2. Zhang, Y.H., Guo, L., Ma, C., and Li, Q.L. 2001, Phys. Chem. Chem. Phys., 3, 583. 3. Guo, L., and Liang, Y.Q. 2003, Spectrochim. Acta Part A, 59, 219. 4. Scolaro, L.M., Donato, C., Castriciano, M., Romeo, A, and Romeo, R. 2000, Inorg. Chim.
Acta, 978, 300. 5. Dougherty, T.J., Gomer, C.J., Henderson, B.W., Jori, G., Kessel, D., Korbelik, M., Moan, J.,
and Peng, Q. 1998, J. Natl. Cancer Inst. 90, 889. 6. Bonnett, R. 1995, Chem. Soc. Rev., 24, 19. 7. Berg, K., Western, A., Bommer, J., and Moan, J. 1990, Photochem.Photobiol., 52, 775.
Rosangela Itri et al. 196
8. Kessel, D., Thompson, P., Saatio, K., and Nantwi, K.D. 1987, Photochem. Photobiol., 45, 787. 9. Dougherty, T.J. 1993, Photochem. Photobiol., 58, 895. 10. Nelson, J.A., and Schmiedl, U. 1991, Magn. Reson. Med., 22, 366. 11. Labat, G., Séris, J. L., and Meunier, B. 1990, Angew. Chem. Int. Ed. Engl., 29, 1471. 12. Fendler, J.H. 1982, Membrane Mimetic Chemistry, Wiley-Interscience, New York. 13. Parkanyi, C., Boniface, C., Aaron, J.J., and Maafi, M. 1993, Spectrochim. Acta, 12, 1715. 14. Ford, J.M., and Hait, W.N. 1990, Pharmacol. Rev. 42, 155. 15. Fowler, G.J.S., Rees, R.C., and Devonshire, R. 1990, Photochem. Photobiol. 52, 489. 16. Ramu, A., and Ramu, N., 1992, Cancer Chemother. Pharmacol. 30, 165. 17. van Iperen, H.P., and van Henegouwen, G.M.J.B. 1996, J. Photochem. Photobiol. B, 34, 217. 18. Wolnicka, A., Sarna, T., Knobler, R., Trautinger, F. 2002, Arch. Dermatol. Res., 294, 147. 19. Van den Broeke, L.T., and van Henegouwen, G.M.J.B. 1993, Int. J. Radiat. Biol., 63, 493. 20. Caetano, W., Barbosa, L.R.S., Itri, R., and Tabak, M. 2003, J. Colloid Interface Sci., 260, 414. 21. Barbosa, L.R.S., Caetano, W., Itri, R., Homem-de-Mello, P., Santiago, P.S., and Tabak, M.
2006, J. Phys. Chem. B, 110, 13086. 22. Luxnat, M., and Galla, H.J. 1986, Biochim. Biophys. Acta 856, 274. 23. Lieber, M.R., Lange, Y., Weinstein, R.S., and Steck, T.L. 1984, J. Biol. Chem. 259, 9225. 24. Rosso, J., Zachovski, A., and Devaux, P.F. 1988, Biochim. Biophys. Acta, 942, 271. 25. Caetano, W., Gelamo, E.L., Tabak, M., and Itri, R. 2002, J. Colloid Interface Sci, 248, 149. 26. Rodrigues, T., dos Santos, C.G., Riposati, A., Barbosa, L.R.S., di Mascio, P., Itri, R., Baptista,
M.S., Nascimento, O.R., and Nantes, I. 2006, J. Phys. Chem. B, 110, 12257. 27. Gandini, S.C.M., Yushmanov, V.E., Borissevitch, I.E. and Tabak, M. 1999, Langmuir, 15, 6233. 28. Gandini, S.C.M., Gelamo, E.L., Itri, R., and Tabak, M. 2003, Biophys. J., 85, 1259. 29. Ribó, J.M, Crusats, J., Farrera, J.A, and Valero, M.L. 1994, J. Chem. Soc. Chem. Commun., 681. 30. Maiti, N.C., Mazumdar, S., and Periasamy, N. 1998, J. Phys. Chem. B, 102, 1528. 31. Maiti, N.C., Mazumdar, S., and Periasamy, N. 1996, Curr. Sci., 70, 997. 32. Kadish, K.M., Maiya, G.B., Araullo-McAdams, C., and Guilard, R. 1989, Inorg. Chem., 28, 2725. 33. Kadish, K.M.; Maiya, G.B.; and Araullo-McAdams, C. 1991, J. Phys. Chem., 95, 427. 34. Tominaga, T. Endoh, S.; and Ishimaru, H. 1991, Bull. Chem. Soc. Jpn., 64, 942. 35. Mazumdar, S., Medhi, O. K., and Mitra, S. 1988, Inorg. Chem., 27, 2541. 36. Gandini, S.C.M., Itri, R., Neto, D.S., and Tabak, M. 2005, J. Phys. Chem. B 109, 22264. 37. Collings, P.J., Gibbs, E.J., Starr, T.E., Vafek, O., Yee, C., Pomerance, L.A., and Pasternack,
R.F. 1999, J. Phys. Chem. B, 103, 8474. 38. Micali, N., Mallamace, F., Romeo, A., Purrello, R., and Scolaro, L.M. 2000, J. Phys. Chem.B,
104, 5897. 39. McDowell, J.J.H. 1969, Acta Cryst, B25, 2175. 40. Perez-Villar, V., Vazquez-Iglesias, M.E., and de Geyer, A., 1993, J. Phys. Chem., 97, 5149. 41. Attwood, D. 1995, Adv. Colloid Interface. Sci, 55, 271. 42. Attwood, D., Waigh, R., Blundell, R., Bloor, D., Thévand, A., Boitard, E., Dubés, J., and
Tachoire, H. 1994, Mag. Res. Chem., 32, 468. 43. Atherton, A.D., and Barry, B.W. 1985, J. Colloid Interface Sci., 106, 479. 44. Florence, A.T., and Parfitt, R.T. 1971, J. Phys. Chem., 75, 3554. 45. Barbosa, L.R.S., Itri, R., Caetano, W., Sousa Neto, D., and Tabak, M. 2008, J. Phys. Chem. B
112, 4261. 46. Schneider, D.J, and Freed, J.H. 1989, Biological Magnetic Resonance; Berliner, L.J. and
Reuben, J. Eds; Plenum Press, New York, v.8, p 1-76. 47. Budil, D.E., Lee, S., Saxena, S., and Freed, J.H. 1996, J. Magn. Reson. A 120, 155. 48. Berliner, L.J. 1976, Ed., Spin labeling. Theory and applications, Academic Press, New York. 49. Bendedouch, D., and Chen, S.H. 1983, J. Phys. Chem. 87, 1653. 50. Kotlarchyck, M., and Chen, S.H. 1983, J. Chem. Phys. 79, 2461. 51. Marignan, J., Basserau, P., and Delord, P.J. 1986, Phys. Chem., 90, 645.

Interaction of biomolecules with surfactant aggregates 197
52. Guinier, A., and Fournet, G., 1955, Small angle scattering of X-rays, Wiley, New York. 53. Glatter, O., and Kratky, O., 1982, Small angle X-ray scattering, Academic Press, London. 54. Hayter, J.B., and Penfold, J. 1981, Mol. Phys. 42, 109. 55. Hansen, J.P., and Hayter, J.B. 1982, Mol. Phys. 46, 651. 56. Liu, Y.C., Chen, S.H., and Itri, R. 1996, J. Phys. A:Condensed Matter. 8, 169. 57. Itri, R., and Amaral, L.Q. 1993, Phy. Rev. E 47, 2551; Erratum in E 1998, 58, 1173. 58. Santiago, P.S., Sousa Neto, D., Barbosa, L.R.S., Itri, R., and Tabak, M. 2007, J. Colloid
Interface Sci., 316, 730. 59. Aswal, V.K., and Goyal, P.S. 2000, Phys. Rev. 61, 2947. 60. Santiago, P.S., Moreira, L.M., Gandini, S.C.M. and Tabak, M. 2008, J. Porph. Phtaloc., 12, 942. 61. Gandini, S.C.M., Yushmanov, V.E., and Tabak, M. 2001, J. Inorg. Biochem., 85, 263. 62. Santiago, P.S., Gandini, S.C.M., Tabak, M. 2005, J. Porph. Phtaloc., 9, 94. 63. Caetano, W., and Tabak, M. 1999, Spectrochim. Acta, 55A, 2513. 64. Caetano, W., and Tabak, M. 2000, J. Colloid Interface Sci., 225, 69. 65. Forrest, B.J., Linehan, P.T.P., and Mattai, J. 1984, Biochemistry 23, 2288.
Copyright © 2022 FDOKUMEN