characterization of illinois aggregates for subgrade ...
179
CHARACTERIZATION OF ILLINOIS AGGREGATES FOR SUBGRADE REPLACEMENT AND SUBBASE Prepared By Erol Tutumluer Debakanta Mishra University of Illinois at Urbana-Champaign Abbas A. Butt Engineering & Research Int'l, Inc. Research Report ICT-09-060 A report of the findings of ICT-R27-1 Characterization of Illinois Aggregates for Subgrade Replacement and Subbase Illinois Center for Transportation December 2009 CIVIL ENGINEERING STUDIES Illinois Center for Transportation Series No. 09-060 UILU-ENG-2009-2042 ISSN: 0197-9191
-
Upload
khangminh22 -
Category
Documents
-
view
0 -
download
0
Transcript of characterization of illinois aggregates for subgrade ...

CHARACTERIZATION OF ILLINOIS AGGREGATES FOR SUBGRADE REPLACEMENT AND SUBBASE
Prepared By
Erol Tutumluer Debakanta Mishra
University of Illinois at Urbana-Champaign
Abbas A. Butt Engineering & Research Int'l, Inc.
Research Report ICT-09-060
A report of the findings of
ICT-R27-1 Characterization of Illinois Aggregates for Subgrade Replacement
and Subbase
Illinois Center for Transportation
December 2009
CIVIL ENGINEERING STUDIES Illinois Center for Transportation Series No. 09-060
UILU-ENG-2009-2042 ISSN: 0197-9191

Technical Report Documentation Page
1. Report No.
FHWA-ICT-09-060
2. Government Accession No. 3. Recipient's Catalog No.
4. Title and Subtitle
Characterization of Illinois Aggregates for Subgrade Replacement and Subbase
5. Report Date
December 2009
6. Performing Organization Code
8. Performing Organization Report N o. 7. Author(s)
Erol Tutumluer, Debakanta Mishra, and Abbas A. Butt
ICT-09-060 UILU-ENG-2009-2042
9. Performing Organization Name and Address
Illinois Center for Transportation Department of Civil and Environmental Engineering University of Illinois at Urbana-Champaign 205 N. Mathews Ave., MC-250 Urbana, IL 61801
10. Work Unit ( TRAIS)
11. Contract or Grant No.
ICT-R27-1 13. Type of Report and Period Covered
12. Sponsoring Agency Name and Address
Illinois Department of Transportation Bureau of Materials and Physical Research 126 E. Ash Street Springfield, IL 62704
14. Sponsoring Agency Code
15. Supplementary Notes
16. Abstract
Construction of a pavement working platform is often needed on soft, unstable soils to provide sufficient stability and adequate immediate support for equipment mobility and paving operations without developing excessive rutting. The aggregate type and quality are important factors for determining the required treatment/ replacement thickness. The overall objective in this project has been to characterize strength, stiffness, and deformation behavior of three crushed and uncrushed aggregate materials, i.e., limestone, dolomite and uncrushed gravel, commonly used in Illinois for subgrade replacement and subbase. The goal has been to develop aggregate thickness correlations with aggregate properties to modify and improve the thickness requirement curve in IDOT’s Subgrade Stability Manual based on both laboratory and field performances. The initial laboratory phase of the study presented in this report considered both plastic and non-plastic fines (passing No. 200 sieve or 0.075 mm) blended in the engineered gradations of the limestone, dolomite and uncrushed gravel at 4%, 8%, 12%, and 16% target fines content. From the test results, the most important property at low fines contents (less than 8%) was the aggregate type governed by the angularity, i.e. crushed or uncrushed, and the amount of voids in the aggregate matrix. Especially when plastic fines with a plasticity index or PI of 10 or higher were included, the amount of fines had a drastic effect on aggregate performance.
17. Key Words
Unbound aggregates, pavement working platform, aggregate shape, type of fines, fines content, moisture-density, shear strength, resilient modulus, permanent defomation
18. Distribution Statement
No restrictions. This document is available to the public through the National Technical Information Service, Springfield, Virginia 22161.
19. Security Classif. (of this report)
Unclassified
20. Security Classif. (of this page)
Unclassified
21. No. of Pages
22. Price
Form DOT F 1700.7 (8-72) Reproduction of completed page authorized

i
ACKNOWLEDGMENT, DISCLAIMER, MANUFACTURERS’ NAMES
This publication is based on the results of R27-1, Characterization of Illinois Aggregates for Subgrade Replacement and Subbase. R27-1 was conducted in cooperation with the Illinois Center for Transportation; the Illinois Department of Transportation; and the U.S. Department of Transportation, Federal Highway Administration.
Members of the Technical Review Panel are the following:
Riyad M. Wahab, Chair Gregory B.Heckel William M. Kramer Sheila A. Beshears Thomas A. Ripka Edward M. Frank Brian Rice Terry L. McCleary Heather Z. Shoup Jan R. Twardowski
The contents of this report reflect the view of the authors, who are responsible for
the facts and the accuracy of the data presented herein. The contents do not necessarily reflect the official views or policies of the Illinois Center for Transportation, the Illinois Department of Transportation, or the Federal Highway Administration. This report does not constitute a standard, specification, or regulation.
Trademark or manufacturers’ names appear in this report only because they are considered essential to the object of this document and do not constitute an endorsement of product by the Federal Highway Administration, the Illinois Department of Transportation, or the Illinois Center for Transportation.

ii
EXECUTIVE SUMMARY
Construction of a pavement working platform is often needed on soft, unstable soils to provide sufficient stability and adequate immediate support for equipment mobility and paving operations without developing excessive rutting. Depending on the location of a subgrade soil project, IDOT districts use various locally available aggregates or granular materials to replace unsuitable soil. Further, IDOT’s standard specifications allow the use of a wide range of aggregate materials for subgrade applications regardless of aggregate properties. The aggregate type and quality are important factors for determining the required treatment/replacement thickness.
The overall objective in this project has been to characterize strength, stiffness, and deformation behavior of three crushed and uncrushed aggregate materials, i.e., limestone, dolomite and uncrushed gravel, commonly used in Illinois for subgrade replacement and subbase. The goal has been to develop aggregate thickness correlations with aggregate properties to modify and improve the thickness requirement curve in Figure A-2 of IDOT’s Subgrade Stability Manual based on both laboratory and field performances.
The initial laboratory phase of the study presented in this report considered both plastic and non-plastic fines (passing No. 200 sieve or 0.075 mm) blended in the engineered gradations of the limestone, dolomite and uncrushed gravel at 4%, 8%, 12%, and 16% target fines content. The laboratory tests consisted of standard Proctor moisture-density, Immediate Bearing Value (IBV), imaging based aggregate shape characterization, rapid shear strength, directional resilient modulus, and permanent deformation tests based on a comprehensive experimental test matrix established. From the test results, the most important property at low fines contents (less than 8%) was the aggregate type governed by the angularity, i.e. crushed or uncrushed, and the amount of voids in the aggregate matrix. The uncrushed gravel more quickly filled the voids at relatively lower fine percentages thus making gravel less tolerable to negative effects of increasing fines. When plastic fines with a plasticity index or PI of 10 or higher were included, the amount of fines had a drastic effect on aggregate performance. High amounts of plastic fines with higher than optimum moisture conditions were found to result in the lowest strength and modulus properties and the least resistance to permanent deformation accumulation, which was often indicated by the total collapse of the specimen due to the loss of particle to particle contact and load transfer in the aggregate matrix. Moisture when combined with plastic fines always created the worst effect.
Based on the results of the tests conducted on the limestone, dolomite, and gravel materials, a logical framework is presented in this report for the development of the aggregate thickness correction factors. The correction factors tentatively recommended in this report will need to be validated in a phase II field testing study to eventually be of use for modifying the aggregate thickness values from Figure A-2 of the Illinois Department of Transportation (IDOT) Subgrade Stability Manual (SSM).

iii
TABLE OF CONTENTS Page ACKNOWLEDGMENT, DISCLAIMER, MANUFACTURERS’ NAMES i EXECUTIVE SUMMARY ii CHAPTER 1: INTRODUCTION 1
1.1 Overview and Problem Statement 1 1.2 Research Objectives 2 1.3 Research Methodology 2 1.4 Report Organization 4
CHAPTER 2: BACKGROUND AND LITERATURE REVIEW 5 2.1 Soil Trafficability and Equipment Mobility 6 2.2 Working Platform and Aggregate Cover Thickness Requirements 7 2.3 Aggregate Properties Affecting Unbound Aggregate Layer Behavior 12
2.4 Summary 16
CHAPTER 3: DEVELOPMENT OF LABORATORY TEST MATRIX, SAMPLE PREPARATION AND TEST PROCEDURES
17
3.1 Development of the Laboratory Test Matrix 17 3.2 Moisture-Density and IBV Tests 22 3.3 Characterizing Aggregate Shape, Texture and Angularity 23 3.4 Rapid Shear Strength Testing of Aggregates 25 3.5 Resilient Modulus and Permanent Deformation Tests 28
3.6 Summary 34
CHAPTER 4: MOISTURE-DENSITY AND IBV RESULTS 35 4.1 Effect of Non-plastic Fines 35 4.2 Effect of Plastic Fines 40 4.3 Dependence of IBV on Moisture Content 44 4.4 Summary of Findings 46 CHAPTER 5: ANALYSES OF TEST RESULTS 47 5.1 Aggregate Shape, Texture and Angularity Test Results 47 5.2 Permanent Deformation Test Results 50 5.3 Resilient Modulus Test Results 61 5.4 Analysis of Shear Strength Behavior 67 5.5 Summary of Observations from Laboratory Testing 71 CHAPTER 6: CONCLUSIONS AND RECOMMENDATIONS FOR DEVELOPING AGGREGATE THICKNESS CORRECTION FACTORS
74
6.1 Recommended Approach for Developing Thickness Correction Factors 75 6.2 Development of Tentative Correction Factors from Laboratory Tests 76 6.3 Tentative Work Plan for Phase II Study 80 6.4 Construction of Test Sections for Field Validation 82 6.5 Proposed Field Test Section Configuration 82 REFERENCES 85 APPENDICES 88

1
CHAPTER 1 INTRODUCTION 1.1 OVERVIEW AND PROBLEM STATEMENT
Construction of a pavement working platform is often needed on soft, unstable soils to provide sufficient stability and adequate immediate support for equipment mobility and paving operations without developing excessive rutting. Subgrade stability refers to soil strength and repeated loading behavior of this lowest and often the weakest layer of the pavement structure. Subgrade stability influences pavement construction operations and long-term pavement performance. For any type of pavement to be constructed on an unprepared grade, the subgrade must be sufficiently stable to: (i) prevent excessive rutting and shoving during construction, (ii) provide good support for placement and compaction of paving layers, and (iii) limit permanent deformation buildup during pavement service life, which can happen due to climatic effects, such as a significant moisture content increase during spring thaw.
The Illinois Department of Transportation (IDOT) Subgrade Stability Manual (SSM) recommends that minimum levels of strength and stiffness be achieved in the subgrade soil to a depth influenced by construction traffic to ensure adequate equipment mobility and prevent excessive rutting of vehicle tires (IDOT SSM 2005). As per IDOT SSM, to be stable, the finished subgrade must have a minimum Immediate Bearing Value (IBV) of 6.0 if untreated, or 10.0 if treated, and a maximum rut depth of 0.5 in. (13 mm) under construction traffic. However, the Standard Specifications require an IBV of 8.0 for untreated subgrade. IBV is a measure of soil strength obtained by conducting the standard bearing ratio test, commonly known as the California Bearing Ratio (CBR) according to AASHTO T193, on molded soil samples immediately after compaction (without soaking). For untreated soils with IBV values less than 6.0, the SSM presents guidelines for several remedial options. Subgrade removal and aggregate replacement for cover is one of the most commonly used options for treating soft, unstable soils.
Subgrade treatment or replacement thickness is determined as a function of the soil’s IBV, cone index, shear strength, or unconfined compressive strength (Qu) according to Figure A-2 in the SSM (IDOT SSM 2005). However, the “Remedial Thickness versus IBV” chart in Figure A-2 does not differentiate between various aggregate properties when recommending aggregate thickness. Further, IDOT’s standard specifications allow the use of a wide range of aggregate materials for subgrade applications regardless of aggregate properties.
The aggregate type and quality are important factors for determining the required treatment/replacement thickness. Depending on the location of a subgrade soil project, IDOT districts use various locally available aggregates or granular materials to replace unsuitable soil. The results of a recent IDOT field study, “Experimental Feature IL 03-01,” indicate aggregate properties have a significant effect on their performance in subgrade applications (IDOT SSM 2005). Dense-graded aggregates with high fines (minus No. 200 sieve size or 0.075 mm) contents and/or excessive Plasticity Index (PI) values may exhibit increased or high moisture sensitivity effect on their performance in subgrade applications (IDOT SSM 2005).
A comprehensive evaluation of a variety of aggregates was needed to correlate Illinois aggregate properties such as aggregate type or angularity, fines content, PI, and moisture with IBV and other strength/stiffness properties. Correlations were needed to be developed between aggregate thickness and aggregate properties to complement the IL 03-01 findings, and to ultimately economize the use of aggregate in the State of

2
Illinois by either reducing thickness or avoiding failures due to poor quality aggregate cover performances. 1.2 RESEARCH OBJECTIVES
The main objective of this research project was to characterize strength, stiffness, and deformation behavior of various aggregates commonly used in the State of Illinois for an improved prediction of cover thickness requirements and field performances. The researchers aimed to achieve this objective by developing a comprehensive test matrix for a laboratory evaluation of different aggregate types and properties and also by conducting a field study to reinforce the laboratory test results. The ultimate goal was to help IDOT in determining the optimum thickness of aggregate cover depending on site conditions as well as aggregate properties. This would facilitate building economical pavements without risking the loss of construction equipment mobility due to subgrade failure. The focus of the project was therefore on pavement construction working platform issues. During this project, the researchers did not evaluate the benefits to long-term pavement performance. Moreover, Reclaimed Asphalt Pavement (RAP) was not included in this study. 1.3 RESEARCH METHODOLOGY
The original work plan for this research project involved six different tasks. However, modifications had to be made later on the original scope to divide laboratory and field evaluation research tasks. Accordingly, the project’s Technical Review Panel (TRP) was consulted in the revision of the work plan and the project was divided into two phases. This report presents the findings from phase I of the project, which involved laboratory testing of three different aggregate materials selected for this study. Brief descriptions on the scopes of individual tasks are presented below according to the modified work plan. Task 1: Characteristics of Illinois aggregates for subgrade replacement and subbase
The objectives of this task were to gather information on types, sources and properties of aggregates primarily used in Illinois for subgrade replacement and subbase. Previous aggregate research findings and performance records were collected for a comprehensive literature review including IDOT and other state DOT recent practices and field experimental features. Accordingly, three types of aggregate materials, i.e., limestone, dolomite and uncrushed gravel commonly used in Illinois for subgrade replacement and subbase application, were selected to study in this project. Task 2: Development of a laboratory aggregate test matrix
The goal of this task was to develop a laboratory test matrix in order to study the individual effects of aggregate shape including flatness and elongation, texture and angularity, type of fines, amount of fines, plasticity of fines, and moisture content in relation to the optimum compaction value on the performances of different types of aggregates commonly used in the state of Illinois. This project primarily focused on dense graded aggregates. Development of the test matrix involved establishing ranges for major aggregate properties to primarily influence strength, modulus, and deformation behavior.

3
Task 3: Laboratory strength, permanent deformation, and directional modulus testing
This task involved conducting laboratory experiments to study the strength, modulus, and permanent deformation behavior of the aggregates. The first part of this task involved establishing engineered gradations that would be representative of the commonly used dense graded aggregate specifications and corresponding requirements. After the aggregates were blended as per the engineered gradations, standard Proctor tests were conducted on each of the aggregates at the specified gradations to study the moisture-density behavior of the aggregates. The Proctor samples were used to determine the unsoaked CBR or IBV values of the aggregates. Subsequently, triaxial test samples were prepared at the engineered gradations to study the strength, deformation and resilient modulus performances of the three aggregate materials. Task 4: Establishing thickness correlations with aggregate properties
Based on the performance-based laboratory evaluations, trends in aggregate strength, modulus and deformation behavior were properly identified in this task for different aggregate qualities, and relationships were developed between different aggregate properties and strength/stiffness properties. Sensitivities of individual aggregate properties affecting performance were identified based on laboratory findings to make recommendations for developing correction factors in determining the optimum thickness of aggregate cover to be used in the field. Task 5: Final report from phase I and work plan for phase II
Based on the work done in phase I laboratory study of this project, a final report was prepared which included all research findings from the laboratory tests. The test results were analyzed to establish and recommend correction factors for use with the aggregate cover thickness requirements by the IDOT SSM (Figure A-2). The implementation of the research findings into the SSM is not possible without studying the field performances of the different aggregate types under different combinations of the aggregate properties studied in phase I. Therefore, representative field sections need to be constructed during the phase II of this research project to validate recommended correction factors. Task 6: Field test study and evaluation of field performances (phase II)
This task, which is now part of phase II of this project, will be essential for validating laboratory research findings with field performance evaluations. For this purpose, field test sections of the studied aggregate materials will be constructed as per recommendations made in this report from the phase I laboratory test findings. The field test section will be constructed at the Advanced Transportation Research and Engineering Laboratory (ATREL) facility of the University of Illinois, located in Rantoul, IL. A maximum of 1,000 load repetitions will be sufficient for evaluating field performances of the constructed aggregate layers. Field evaluations will also involve: (1) Dynamic Cone Penetrometer (DCP) tests for measuring IBV, (2) nuclear density tests for measuring density, and (3) LightWeight Deflectometer (LWD) tests for measuring modulus of the constructed aggregate layers. One of each of the Atterberg limit, Proctor (with 5 IBV tests), shear strength, directional modulus, and permanent deformation tests will be conducted on the aggregate materials used in each test section.

4
1.4 REPORT ORGANIZATION
Chapter 2 of this report reviews working platform and aggregate cover thickness requirements for the subgrade stability problem based on the practices in the U.S. and Europe. Major aggregate properties affecting strength and deformation behavior are also summarized in this chapter with important findings highlighted from previous research studies. Chapter 3 describes the scientific approach adopted in this research effort to develop a comprehensive laboratory test matrix for studying the effects of different aggregate properties on the performances of aggregate layers used as subgrade replacement and subbase. Relevant technical features of the laboratory equipment used to test the aggregate specimens are discussed first followed by the descriptions and details of the sample preparation and testing procedures. First, the moisture-density and IBV test results for all three aggregate materials studied, i.e., limestone, dolomite, and gravel, are discussed in Chapter 4. Chapter 5 presents the results from the imaging based aggregate shape characterization and the aggregate triaxial tests, which consist of permanent deformation, directional resilient modulus and shear strength tests and the analyses of the aggregate test data. Test results are interpreted for significant trends identified in aggregate strength and deformation behavior in accordance with the studied test matrix variables, and possible causes for differences in aggregate behavior are evaluated. Finally, the major findings of the research study are given in Chapter 6. Based on the laboratory test results, an approach is recommended for developing and using aggregate thickness correction factors to modify Figure A-2 of the IDOT SSM. A field validation study test matrix is also proposed for phase II of this research project.

5
CHAPTER 2 BACKGROUND AND LITERATURE REVIEW
Subgrade stability may create significant problems during pavement construction operations, especially in cases where the subgrade soil is weak, and is unable to carry the load of heavy construction equipment. The Illinois Department of Transportation (IDOT) SSM (2005) defines subgrade stability as “the strength and deformation (rutting) properties of the finished subgrade soils that impact pavement construction activities.” The IDOT SSM also limits the maximum rut depth to 0.5 in. (13 mm) under the construction traffic, prior to pavement construction.
Subgrade evaluation requires estimating a subgrade’s strength and stiffness properties from field and laboratory testing. A number of different test devices and procedures exist to guide the pavement engineer in the determination of these properties. For example, silty subgrade soils at or above 2-3% of optimum moisture contents are often unstable and may cause excessive rutting. Soils with high silt contents also exhibit excessive resilient (rebound) deflections that make them difficult to compact, even though they may meet subgrade stability requirements. Depending on the type, composition, and properties of the soil, there are often different requirements to ensure adequate subgrade stability. Various remedial procedures need to be applied to provide a stable working platform and adequate subgrade support such as, moisture-density control (temporary), cover placement with or without removal, admixture treatment, and geosynthetic stabilization.
Soil moisture and density control in the field only offers a temporary solution to subgrade stability problems. A soil might achieve 95% of the maximum dry density (AASHTO T 99) when compacted near its optimum moisture, but may not achieve stability. Soil drying is accomplished through evaporation of soil moisture by disking and tilling of the soil and thus reducing the size of soil lumps by increasing the surface area exposed to evaporation. The effectiveness of disking and tilling for drying the soil depends on groundwater elevation, and weather conditions such as air and soil temperatures, daily sunshine, humidity, rain, and wind velocity. If the groundwater is high, there may be a continual movement of moisture to the surface, which makes drying much slower. A dry crust may form at the surface, but wet, soft soils may remain below. The weather conditions require careful planning/scheduling of the construction activities. Field and laboratory data (IDOT, 1982) indicate that the compaction moisture, especially for silty materials, must be less than 110% of optimum to ensure an IBV of 6. Therefore, control of field moisture is essential to achieving compaction and stability.
Building a construction platform is the most commonly used approach to prevent sinking of the construction vehicles into the weak subgrade and to improve the mobility of construction vehicles. Proper construction equipment mobility is a concern for several different agencies, including the contractor, the designer, as well as the equipment manufacturer. Pavement working platforms (also referred to as pavement foundations) perform several functions during construction, and during the service life of the pavement. These functions can be summarized as follows (Frost et al., 2001): a. They must support construction vehicles during the construction of overlying layers
without experiencing excessive deformation. Moreover, the working platform should be stiff enough to reduce the stress levels experienced by the underlying subgrade. These layers typically experience a small number (usually no more than 1000 vehicle passes) of moderately high stress (around 500 kPa or 72.5 psi) applications due to the construction vehicles.

6
b. They must provide a stiff base for the placement and compaction of the overlying layers. The working platform must not experience large resilient deformations under compaction loads (in the range of 1000 kPa or 145 psi) applied by the compaction equipment, as this would create problems for adequate compaction of the overlying layers.
c. The working platform must, in long term, provide sufficient stiffness and strength of
support to the overlying bound layers, to prevent fatigue cracking of the structural layers. The vehicle loads must be distributed properly, so that the stress levels at the subgrade are not too large to cause excessive deformation, which could in turn lead to tensile cracking at the bottom of the bound structural layers.
The most unfavorable loading conditions for subgrade replacement and subbase
layers occur during the construction of overlying layers, as the stresses due to the construction vehicles are often very high. Therefore, the thickness design is almost carried out, targeting the stresses during the construction phase. This chapter summarizes soil trafficability and equipment mobility, working platform and aggregate cover thickness requirements, and aggregate properties affecting strength and deformation behavior. Emphases are given to the latest developments and improvements in working platform construction and unbound aggregate cover thickness requirements for the subgrade stability problem. These focus areas are highlighted in this chapter based on the practices in the U.S. and Europe. 2.1 SOIL TRAFFICABILITY AND EQUIPMENT MOBILITY
Soil trafficability and equipment mobility become important issues during the construction on the unprepared grade. Some of the subgrade stability problems related to rutting and shoving arise when sinkage requirements of the existing grade and/or the limitations of the construction equipment are not properly met. In addition to difficulties in equipment mobility and soil trafficability, equipment rutting or sinkage creates an uneven grade. This makes it difficult to control the thickness of subsequent pavement layers and can cause loss of equipment efficiency. Compaction effectiveness and efficiency are both influenced by subgrade support. Strict construction controls on pavement layer thickness often make rut depths in excess of 0.5 in. (13 mm) unacceptable. A minimum Immediate Bearing Value (IBV) of about 6 often checks favorably with the minimum stability required for construction sinkage control.
Proof rolling is also recommended as a helpful field procedure, which involves driving a loaded truck, or heavy construction equipment, typically 3 to 4 passes over the subgrade and observing the surface deflections and development of tire sinkage. It is intended to distress the soil to conditions anticipated during construction and identify unstable, soft soils. For example, pumping susceptible silty soils, which are often difficult to compact, can be detected by field proof rolling.
To mobilize the construction equipment, both tire rolling resistance and grade resistance due to climbing a sloping terrain have to be overcome. The rolling resistance is often estimated as a small percentage of the equipment gross weight and the tire’s unit sinkage or penetration. The latter is linked to the soil’s shear strength and equipment tire characteristics. Based on the relationships between these key concepts and variables, many equipment manufacturers provide readily established rimpull-speed-gradeability curves to define the mobility of their construction equipment. Figure 2.1 presents such a chart for a CaterpillarTM construction and mining truck (769D with 18.00 R33 tires) having a loaded gross weight of 157,000 lbf (71,400 kg) (CaterpillarTM

7
Performance Handbook, 2004). For a total (grade plus rolling) resistance determined as 10% of the gross weight, one can obtain the amount of rimpull needed to mobilize the scraper and operate it at a top speed of 9 mph (15 km/h). By limiting sinkage to less than 0.5 in. (13 mm), tire rolling resistance is minimized and equipment mobility can be achieved on the unprepared subgrade.
Figure 2.1. Typical construction equipment rimpull-speed gradeability curve
(CaterpillarTM Performance Handbook, 2004). 2.2 WORKING PLATFORM AND AGGREGATE COVER THICKNESS REQUIREMENTS
Pavement foundation is defined as the granular layer or layers placed over the subgrade or admixture-modified soil layer. Pavement foundations are designed primarily

8
to withstand construction traffic loading and act as a construction platform for the laying and compaction of the subsequent layers. In addition, the foundation protects the subgrade, if adverse weather occurs during construction, and contributes (to some degree) to the structural strength of the completed pavement during its service life. The foundation stresses are relatively high during construction, although the number of stress repetitions from construction traffic is relatively low; usually no more than 1,000 vehicle passes, and is not as channelized as normal service life traffic.
In the United Kingdom, pavement foundations are currently designed using established empirical relationships and a recipe specification, according to which specified materials are laid and compacted using specified methods. The pavement foundation thicknesses vary from 0 mm to 600 mm (0 in. to 12 in.). However, irrespective of the thickness, the procedure assumes that all foundation achieve a similar minimum level of performance, and hence, are treated equally (Frost et al., 2001). This design follows the HD25/94 (DMRB Vol.7) manual, which is a recipe approach. Figure 2.2 is used for this purpose. It is suggested that a capping layer having a laboratory CBR value greater than 15 should provide an adequate platform for construction of the subbase when compacted to the appropriate thickness. The subbase may be omitted on hard rock subgrades that are intact or, if granular material with a laboratory CBR of at least 30 is used. For a subgrade having a CBR greater than 15, the thickness of subbase is 150 mm (6 in.), this being controlled by the minimum practicable thickness for spreading and compaction. When the subgrade CBR is between 2.5 and 15, for flexible and flexible composite construction, there are two options available: (1) 150 mm (6 in.) of subbase can be used on a varying thickness of capping depending on the CBR value or, (2) an increasing thickness of subbase can be used with the decreasing CBR, with no requirement for capping. Based on the experience of practicing engineers in the state of Illinois, it has been observed that most aggregates found in the state, exhibit CBR values much higher than 30 due to the confined condition in the CBR mold. However, the cover thickness requirements in the field often exceed 6 in. This is probably due to the unconfined conditions of aggregate layers in the field. Figure 2.2 suggests all pavements on subgrades with CBR values below 2.5, and for rigid and rigid composite construction on CBR values less than 15, 150 mm (6 in.) of subbase on the varying thickness of capping must be used. When the subgrade CBR is below 2, such that capping with subbase becomes unsuitable as a pavement foundation, then different options are available: (1) the material can be removed, typically between 0.5 and 1.0 m (19.7 and 39.4 in.), and replaced by more suitable material; (2) if the soil is cohesive, a lime treatment may be an economic alternative with the overlying capping again designed on the basis of a subgrade with a CBR just under 2 (i.e., 600 mm or 23.6 in. capping in Figure 2.2); and (3) if the soil is reasonably permeable, a deeper than normal drainage system may be considered, together with a system of monitoring the improvement expected. On subgrades with CBR less than 15, the minimum thickness of a layer of aggregate (either capping or subbase) placed directly on the subgrade will be 150 mm (6 in.). At and below CBR 3, the first layer of aggregate will be at least 200 mm (8 in.) thick. The thickness resulting from Figure 2.2 is used to design foundations to limit deformation caused by construction traffic to a maximum of 40 mm (1.6 in.) for 1,000 passes of a standard axle (single axle load of 80 kN or 18 kips). Although the thickness values recommended by the United Kingdom design recipe have been found to perform adequately in the field, one important thing to note is that the procedure is highly empirical. The approach does not distinguish between different types of aggregate materials while recommending the thickness of the capping layer. The allowed granular capping materials can have fines (material passing the 0.075 mm sieve) anywhere in the range of 0% to 12% (Garcia and Thompson, 2003). As the

9
performances of granular layers are known to be dependent on the amount of fines, the “one thickness for all” approach recommended by the recipe is not likely to work for different conditions. Moreover, the design recipe cannot recommend adequate thicknesses for new recycled materials and marginal aggregates.
Figure 2.2. Capping and subbase thickness designs in the United Kingdom (HMSO, HD
25/94).
Recent research in the United Kingdom resulted in adoption of a performance based specification for pavement foundation construction (Frost et al., 2001, Fleming et al., 1998). The new specification facilitates the use of previously untried materials as well as provides some assurance of “as-constructed” quality. In a performance based approach, the material parameters are measured in the laboratory before design, using representative samples both of the subgrade and of the proposed foundation material, at anticipated environmental conditions. The same properties are again measured in situ on the same materials during construction, to confirm that the desired properties (in terms of stiffness and resistance to permanent deformation) have been achieved (Frost et al., 2001, Fleming et al., 1998).

10
Illinois Department of Transportation (IDOT) Approach The current IDOT SSM recommends the remedial aggregate thickness above subgrade based on an unsoaked CBR related performance index of the subgrade soil (IDOT SSM 2005). IDOT uses the Immediate Bearing Value (IBV) as an estimate of the unsoaked CBR of the subgrade, and uses the IBV value to recommend aggregate cover thicknesses. These thickness recommendations are presented in a graphical form in Figure A-2 in the IDOT SSM (see Figure 2.3). This chart was originally an outcome of a multi-year study of subgrade stability conducted at the University of Illinois (Thompson et al., 1977). During this study, the researchers conducted stress dependent finite element analyses of several pavement sections using AREA No. 4 ballast type granular material over very soft, soft, medium and stiff subgrades. Up to 5,000 coverages of a 32-kip tandem axle were considered. From the finite element analyses, they recommended a minimum subgrade IBV requirement of 6 to 8 to limit rutting to 0.5 in. or less, and for adequate support for compaction of the overlying layers (Heckel, 2009). The findings from the study were adopted by IDOT and were included in the 1982 IDOT subgrade stability manual. The thicknesses for a selected range of subgrade IBV values were recently validated (Tutumluer et al., 2005) using the ILLI-PAVE finite element analysis computer program (Raad and Figueroa, 1980; Thompson and Elliott, 1985) utilized in the development of IDOT’s flexible pavement design procedure. The current Illinois highway critical loading conditions are 20-kip (88.9-kN) single axles and 34-kip (151.1-kN) tandem axles. For ILLI-PAVE analysis purposes, Tutumluer et al. (2005) represented the 20-kip (88.9-kN) single axle by a 10-kip (44.4-kN) single wheel load at 115-psi (794-kPa) tire pressure. From the analyses, the researchers found that the computed surface deflections indicated good uniformity and the subgrade deviator stresses predicted were typically less than 75% of the subgrade’s unconfined compressive strength for the entire range of evaluated subgrade strengths and unbound aggregate thicknesses. It should be noted, that high subgrade deviator stresses (σDEV) and Subgrade Stress Ratios (SSR = σDEV/Qu where Qu is the unconfined compressive strength) indicate high “subgrade rutting potentials” and large surface deflections often lead to difficulty in compaction and even “tension cracking/tearing” on the surface of asphalt concrete layers. From the ILLI-PAVE analyses, they concluded that the current IDOT thickness requirements were reasonable for the 10-kip (44.4-kN) wheel loading conditions. However, the analysis results did not distinguish between the types of aggregates used for subgrade replacement and subbase cover purposes. The “one curve fits all” approach is not appropriate in all cases.

11
Figure 2.3. IBV based remedial action (IDOT SSM 2005). Dutch Approach Another approach presented recently by the Dutch (van Gurp and van Leest, 2002) considers as a starting point the subgrade characteristics and the maximum level of rutting in the base course that takes place during the construction stage. They recommended allowable rutting values of 20-50 mm (3/4 to 2 in.) during the construction stage. The total thickness of the base (hd), whose characteristics were not specified, can be calculated applying the equation below:
63.0
42.241214.294)log(52.496)log(7.125
undr
constrconstrd f
RDPNh −⋅−⋅+⋅= (2.1)
where during construction stage, Nconstr is the number of axle loads, P is the average load (N) RDconstr is the allowable rut depth at surface (m), and fundr = cohesion*1000 (Pa) is the undrained shear strength of the subgrade. Two correlations between fundr and CBR are also given, a factor of 20 [cohesion = 20*CBR (kPa)] is used for situations with a high groundwater table level, whereas a factor of 30 [cohesion = 30*CBR (kPa)] is used for conditions in which the groundwater table level is deeper than 0.5 m (19.7 in.) below the bottom of the base course (van Gurp and van Leest, 2002). Figure 2.4 compares the United Kingdom and IDOT approaches with eight applications of Equation 2.1 for “hd”, according to the combination of variables RD, N, and groundwater table level for an 80-kN (18-kip) load. The IDOT and the United Kingdom empirical method thickness requirements (curves 9 and 10) closely follow each other in the common range from CBR (IBV for IDOT approach) 2.5 to 8 and happen to be in the middle range of all plots generated except for higher thickness requirements obtained with the United Kingdom method for CBR (IBV) values greater than 15. In general, the eight curves tend to decrease and converge as the CBR (IBV) increases.

12
Curves 1 to 4 consider groundwater table less than 0.5 m (19.7 in.) and while curves 5 to 8 were for groundwater table conditions deeper than 0.5 m (19.7 in.). The Dutch method is not sensitive to a change in rut depth in the range analyzed. The largest difference is 1.8 cm (0.7 in.) when the CBR is 1, the number of axle loads is 500, and the groundwater table level is less than 0.5 m (19.7 in.) from the surface (curves 1 and 2). When comparing only the number of axle loads, the largest difference is 7.4 cm (2.9 in.) occurring when the groundwater table level is less than 0.5 m (19.7 in.) for a CBR of 1 (curves 2 and 4). Comparing only the effect of the groundwater table level, the largest difference is 17.3 cm (6.8 in.) when rut depth is 0.02 m (0.8 in.), the number of axle loads is 1,000, and the CBR is 1 (curves 1 and 5). Therefore, for the analyzed range and load, the most sensitive variable is the groundwater table level, followed by the number of axle loads, and being practically insensitive to the rut depth. Even in the approach proposed by van Gurp and van Leest (2002), it can be seen that only the subgrade strength parameter (undrained shear strength) is used in determining the thickness of the subbase required. The type of aggregate being used to construct the subbase, is not considered in the thickness determination process. However, the performance of an unbound aggregate layer in a pavement system is strongly dependent on the type and properties of the aggregate material being used. 2.3 AGGREGATE PROPERTIES AFFECTING UNBOUND AGGREGATE LAYER BEHAVIOR Aggregates are highly variable materials so it is important to understand how the different characteristics of an aggregate matrix as well as the individual particles themselves and their interactions affect strength and deformation behavior of unbound aggregate structural layers. Dry density, compaction, individual particle characteristics such as shape, texture and angularity, gradation, fines content, and moisture content all affect the behavior of aggregates. Density is used in pavement construction as a quality control measure to help determine the compaction level of the constructed layers. Generally, increasing the density of a granular material makes the aggregate layer stiffer and reduces the magnitude of the resilient and permanent deformation response to both static and dynamic loads (Seyhan, 2001). While some have found the research on density to be ambiguous in regards to the resilient behavior of soils causing little change in the resilient modulus (Knutson and Thompson, 1977; Elliott and Thornton, 1988; Lekarp et al., 2001) others have found that there is a general increase in the resilient modulus with increasing density (Rowshanzamir, 1995; Tutumluer and Seyhan, 1998). The impact of density seems to be larger on the permanent deformation behavior of aggregates. Decreased density, as measured by degree of compaction, substantially increases permanent deformation. Barksdale (1972) found that decreasing the degree of compaction from 100% to 95% of maximum dry density increased permanent axial strain by 185% (on average). Increasing density from the standard Proctor to the modified Proctor maximum density decreased permanent deformation 80% for crushed limestone and 22% for gravel (Allen, 1973). Moreover, van Niekerk (2002) reported that increasing the degree of compaction from 97% to 103% increased the axial stresses required to cause a similar magnitude of permanent axial strain for the investigated specimens. Holubec (1969) found that increased density improves properties of unbound aggregates with angular particles more than for aggregates with rounded particles, provided there is no increase in the transient pore pressure during repetitive loading.

13
Figure 2.4. Comparison of IDOT, UNITED KINGDOM and Dutch methods for aggregate thickness design.
Increasing particle angularity and roughness increases the resilient modulus while decreasing the Poisson‘s ratio (Hicks and Monismith, 1971; Allen and Thompson, 1974; Thom, 1988; Thom and Brown, 1988; Barksdale and Itani, 1989). The reported research indicates that aggregates made with uncrushed or partially crushed particles have a lower resilient modulus than those with angular crushed particles. This effect has been attributed to the higher number of contact points in crushed aggregates which distribute loads better and create more friction between particles (Lekarp et al., 2000). Allen (1973) and Barksdale and Itani (1989) investigated the effects of the surface characteristics of unbound aggregates and found that angular materials resisted permanent deformation better than rounded particles because of the improved particle interlock and higher angle of shear resistance between particles. Barksdale and Itani (1989) also concluded that blade shaped crushed particles are slightly more susceptible to rutting than other types of crushed aggregate and that cube-shaped, rounded river gravel with smooth surfaces is more susceptible than crushed aggregates. More recently, Rao et al. (2002) studied in the laboratory the impact of imaging based aggregate angularity index variations on the friction angle of different aggregate types and reported an increase in aggregate performance when the percentage of crushed particles was increased. An increase in crushed materials beyond 50% significantly increased friction angle obtained from rapid shear triaxial tests indicating a higher resistance to permanent deformation accumulation. Later on, Pan et al. (2005) found that increased surface texture and particle angularity as quantified from imaging
0
5
10
15
20
25
30
35
40
45
50
55
60
65
70
75
80
Subgrade CBR
Tota
l Thi
ckne
ss, h
d (c
m)
RD=0.02m, N=1000 (1)RD=0.05m, N=1000 (2)RD=0.02m, N=500 (3)RD=0.05m, N=500 (4)RD=0.02m, N=1000 (5)RD=0.05m, N=1000 (6)RD=0.02m, N=500 (7)RD=0.05m, N=500 (8)IDOT (9)UK (10)
10 20 50 1001 2 53 4 30 4086 7 9

14
increased the resilient modulus of asphalt concrete indicating that surface characteristics directly relate to permanent deformation resistance. Gradation and fines content are interconnected in their effects on strength and resilient and permanent deformation characteristics. For a dense-graded crushed aggregate base material having a 25-mm (1-in.) top size, Gray’s (1962) pioneering work indicated that maximum strength was achieved at a fines content of about 8%. As the maximum aggregate size increased, the optimum amount of fines that gave the maximum strength typically decreased. Well-graded aggregates have been found to have higher resilient modulus values up to the point where the fines content of the mixture displaces the coarse particles and the properties of the fines dominates (Jorenby and Hicks, 1986; Kamal et al., 1993; Lekarp et al., 2000). Barksdale and Itani (1989) found a dramatic 60% reduction in the resilient modulus when the fines content was increased from 0 to 10%. Thom and Brown (1988) found that the effect of grading varied with the compaction level; uniformly graded and uncompacted specimens resulted in the least permanent deformation buildup while all gradings at high compaction levels resulted in similar permanent deformations. Kamal et al. (1993) and Dawson et al. (1996) found the effect of grading to be more significant than degree of compaction with the densest mix having the highest permanent deformation resistance. Increasing the amount of fines in a mix reduces the permanent deformation resistance (Thom and Brown, 1988; Barksdale, 1972; Barksdale, 1991). Moreover, the type of fines in an aggregate layer has also been found to affect the performance significantly. The results of a recent IDOT field study, Experimental Feature IL 03-01, indicate that aggregate properties have a significant effect on their performance in subgrade applications (IDOT SSM, 2005). Seyhan and Tutumluer (2002) studied 13 aggregates with varying material properties obtained from eight different States in the U.S. This was part of the research activities undertaken for the NCHRP 4-23 project, entitled, “Performance Related Tests of Aggregates for Use in Unbound Pavement Layers.” Directional horizontal to vertical modulus ratios, applied due to vertical pulsing only to give vertical modulus and horizontal pulsing only to give horizontal modulus, were established as aggregate performance indicators relating these ratios to the quality and strength properties. Detailed analyses of the test data indicated that these modulus ratios could serve as aggregate performance indicators for determining the quality and strength properties of aggregates under various field-loading conditions and hence could be used to predict rutting potential of aggregates (Seyhan and Tutumluer, 2002). As part of the findings by Seyhan and Tutumluer (2002), Figure 2.5 captures a consistent trend of increasing directional modulus ratios of “Good Quality” materials with the shear stress ratios. In general, much lower modulus ratios were obtained for the “good quality” materials than those of the “poor quality” ones at some representative low, intermediate, and high stress states. In addition, “Good Quality” aggregates typically had low shear stress ratios (ratio of applied shear stress to strength) in the range of 0.2 to 0.5. For the PA Good material having only 0.9% fines, the same horizontal to vertical modulus ratios corresponding to the same shear stress ratios were constantly obtained in the lack of minus 0.075 mm (No. 200 sieve) size. This was in agreement with the findings by Tutumluer and Seyhan (2000) who concluded that directional dependency, anisotropy, of aggregate stiffnesses could successfully be used to quantify maximum allowable fines content in a given aggregate gradation. The particular amount of fines, which resulted in the lowest anisotropic modular ratios and high attainable aggregate moduli, was established to serve as an indicator of the maximum allowable fines percentage in an aggregate gradation. Using the approach, Tutumluer and Seyhan

15
(2000) determined an optimum fines content of 7% for a crushed limestone aggregate base material having an IDOT CA-6 dense gradation.
Note: Horizontal modulus (MRh) was obtained with pulsed horizontal stresses;
Vertical modulus (MRv) was obtained with pulsed vertical stresses.
Figure 2.5. Variations of horizontal to vertical modulus ratios with failure surface
shear stress ratio (after Seyhan and Tutumluer, 2002). Moisture can affect aggregates in three different ways: (1) make them stronger with capillary suction, (2) make them weaker by reducing causing lubrication between the soil particles, and (3) reduce the effective stress between particle contact points due to increasing pore water pressure thus decreasing the strength of the soil. Thompson and Robnett (1979) and Dempsey (1982) found that open graded aggregates did not develop pore pressures, but uniformly graded dense aggregates with higher fines contents did develop pore pressures and the resilient modulus decreased. Thom and Brown (1987) found that no noticeable pore water pressures developed below 85% saturation and that most of the reduction in resilient moduli was due to the lubricating effect of the water. It can also be assumed that increasing the water content in a soil reduces the capillary suction between particles thus decreasing the effective stress and the resilient moduli. Therefore, moisture can have a positive effect on unbound granular materials as long as the moisture increases the capillary suction between particles. Once the saturation reaches a point where it reduces the capillary suction, the moisture becomes a detriment to preventing residual deformation and can even cause a lubricating effect. And at even higher saturation levels where excess pore water pressure can develop and reduce the effective stress, the rutting resistance can decrease dramatically resulting in deeper ruts (Thom and Brown, 1987).
0.10 0.20 0.30 0.40 0.50 0.60Shear Stress Ratio, τf /τmax (kPa)
0.2
0.4
0.6
0.8
1.0
1.2
1.4
1.6
Low σ Intermediate σ High σMod
ular
Rat
io,
/M
RhM
Rv
Low 3569138
σ3(kPa) σd (kPa)
Intermediate High
69138276
σ
MN Fountain QuarryMN Shiely Elk RiverTX Yucom GravelTX Subgrade 1426IN Section #2538IN Section #2421VA Good QualityVA Poor QualityCA Good QualityOR Good QualityPA Good QualityPA Poor Quality
0.10 0.20 0.30 0.40 0.50 0.60Shear Stress Ratio, τf /τmax (kPa)
0.2
0.4
0.6
0.8
1.0
1.2
1.4
1.6
Low σ Intermediate σ High σMod
ular
Rat
io,
/M
RhM
RhM
RvM
Rv
Low 3569138
σ3(kPa) σd (kPa)
Intermediate High
69138276
σLow 35
69138
σ3(kPa) σd (kPa)
Intermediate High
69138276
σ
MN Fountain QuarryMN Shiely Elk RiverTX Yucom GravelTX Subgrade 1426IN Section #2538IN Section #2421VA Good QualityVA Poor QualityCA Good QualityOR Good QualityPA Good QualityPA Poor Quality

16
2.4 SUMMARY Subgrade stability refers to soil strength and repeated loading behavior. A minimum California Bearing Ratio (CBR) of about 6 is often needed for stability of the pavement foundation to provide mobility and sinkage control of the construction equipment, enable adequate compaction of the pavement layers, minimize resilient deflections after construction, and restrict the development of excessive permanent deformation buildup for the in-service pavement. Construction of an aggregate working platform on soft, unstable soils provides sufficient stability and adequate immediate support for equipment mobility and paving operations without developing excessive rutting. As part of the recent research at the University of Illinois, the subgrade stability and working platform thickness and material quality requirements were evaluated based on the practices in the U.S. and Europe. Aggregate type and quality is an important factor for determining the required aggregate cover thickness. Often the aggregate layer must have a minimum CBR of 15. Some agencies require a "higher quality" aggregate for the surface of the working platform (e.g., the UNITED KINGDOM method utilizes CBR >30 and a minimum thickness of 6 in.). The aggregate layer must not be “moisture sensitive” (experiences significant strength loss with small moisture changes). Dense-graded aggregates with high fines (minus No. 200 sieve size) contents and/or excessive Plasticity Index (PI) values may exhibit increased or high moisture sensitivity. When the subgrade soil is soft or silty, a geosynthetic fabric may be required to prevent the subgrade fines from infiltrating into the granular layer, and prevent the granular material from intruding into the subgrade.

17
CHAPTER 3: DEVELOPMENT OF LABORATORY TEST MATRIX, SAMPLE PREPARATION AND TEST PROCEDURES This chapter describes the scientific approach adopted in this research effort to develop a comprehensive laboratory test matrix for studying the effects of different aggregate properties on the performances of aggregate layers used as subgrade replacement and subbase. Relevant technical features of the laboratory equipment used to test the aggregate specimens are discussed first followed by the descriptions and details of the sample preparation and testing procedures. 3.1 DEVELOPMENT OF THE LABORATORY TEST MATRIX To perform its targeted functions, a subgrade replacement or subbase layer must possess two primary qualities: adequate stiffness to prevent large resilient deformations, and resistance to excessive permanent deformation (Garcia and Thompson, 2003).The laboratory testing effort for this research project was designed so as to enable the researchers to assess the relative importance of different parameters affecting aggregate behavior. The focus was on the characteristics and performances of dense graded structural layers for developing various aggregate property correction factors to determine aggregate working platform thickness. Based on IDOT Standard Specifications, CA-6 gradations are often required for constructing aggregate layers as subgrade replacement and subbase. Keeping these gradation requirements in mind, the experimental test matrix was developed for the three most commonly used aggregate types in the state of Illinois: uncrushed gravel, limestone, and dolomite. The primary objective was to establish ranges for major aggregate properties that primarily influence strength, modulus, and deformation behavior of aggregates thus governing the behavior of aggregate layers (both unbound and bound) in any pavement system. These major properties include: [1] fines content (defined in this research study as the amount of material passing sieve # 200 or 0.075 mm), [2] Plasticity Index (PI) of fines, [3] particle shape (flatness and elongation), angularity and surface texture, and [4] moisture content and dry density (compaction) properties. For studying the effect of fines on aggregate behavior, it was decided to test the laboratory specimens at four different fines contents. These fines contents were established, to range from very low to very high, as allowed in the field by IDOT specifications. The target fines contents to be studied were established to be 4%, 8%, 12% and 16% material passing sieve size # 200. To study the effect of type of fines on aggregate behavior, two different types of fines were used. One was non-plastic in nature such as mineral filler type (PI = 0), and the other was plastic such as cohesive fin-grained soil type (PI in the range of 10-12). The plasticity of fines was decided to be determined by testing the material passing sieve size # 40, as required by IDOT specifications. The effect of moisture content on aggregate performance was studied by testing the blended aggregate specimens at three different moisture contents: (1) optimum moisture content (OMC or wopt), (2) 90% of wopt, and (3) 110% of wopt, where the wopt was established through the standard Proctor (AASHTO T-99) test for each aggregate gradation. Therefore, in the end, the laboratory test matrix ended up being a 4x2x3 factorial (4 different fines contents, 2 different types of fines, 3 different moisture contents) for each aggregate type. The laboratory tests were conducted through the collaborative research efforts of Engineering and Research International, Inc. (ERI), and the University of Illinois at Urbana-Champaign. In accordance with the developed laboratory test matrix, Tables 3.1

18
and 3.2 list in detail the number of tests performed on the limestone, dolomite and uncrushed gravel materials.
Table 3.1. Moisture-Density and Strength Test Matrix Aggregate Materials
Test Description
Dolomite
No. of Tests
Limestone
No. of Tests
Uncrushed Gravel
No. of Tests
1. Moisture-Density (Std Proctor)
2. Unsoaked CBR or Immediate
Bearing Value (IBV)* [5 IBV points per Proctor test]
3. Atterberg Limits on Aggregate Fines 4. Rapid Shear Strength Test**
8
40
8
24
8
40
8
24
8
40
8
24 * Unsoaked CBR or IBV penetration test was performed on each standard Proctor (AASHTO T-99) test specimen. The moisture-density tests were performed using a 6-in. mold. ** Each Rapid Shear Strength test comprised of 3 different samples tested at 3 different confining pressures (5, 10 and 15 psi, respectively). The total number of samples tested was 72 for each aggregate type.
Table 3.2. Aggregate Shape, Modulus and Permanent Deformation Test Matrix
Aggregate Materials
Test Description
Dolomite
No. of Tests
Limestone
No. of Tests
Uncrushed Gravel No. of Tests
1. University of Illinois Aggregate Image
Analyzer (UIAIA) Shape Characterization a. Flatness and Elongation b. Angularity c. Surface Texture
2. Resilient Modulus (MR)** 3. Permanent Deformation ** 4. Directional Modulus (MR
h/MRv)
3*
24
24
24
3*
24
24
24
3*
24
24
24 * Replicate tests performed.
** Resilient modulus & permanent deformation determined from the same AASHTO T307-99 test.

19
Engineering the Aggregate Gradations One of the primary variables in any laboratory testing of aggregate materials is the grain size distribution. Differences in aggregate gradations can often lead to significantly different behavior for the same aggregate type. This is due to the different packing order and void distributions that play a crucial role in load carrying through particle to particle contact in an aggregate matrix. Therefore, before conducting any parametric study on the aggregate properties affecting behavior, it was deemed important to keep all sample gradations consistent. This would enable the control of particle size distributions and attribute any change in behavior to the induced changes in the aggregate properties, e.g., fines percentage, plasticity of fines and moisture content. As IDOT’s CA-6 is the most commonly used aggregate gradation for subgrade replacement/subbase applications in the state of Illinois, a midrange CA-6 gradation was selected for use in the laboratory portion of this study. Gradations were engineered, targeting the four different fines contents (4%, 8%, 12%, and 16%), established in the laboratory test matrix. The limits for the CA-6 gradation, corresponding to each sieve size, were kept in mind while developing the engineered gradation curves. Figure 3.1 shows the different engineered gradations for the target percent fines passing the No. 200 sieve. Table 3.3 lists the percent passing each sieve size for the different gradations.
Particle Size (mm)
0.010.1110100
0.010.1110100
Cum
ulat
ive
Per
cent
Pas
sing
0
20
40
60
80
100
4% Fines8% Fines12% Fines16% Fines
Figure 3.1. Engineered gradations for the target percent fines passing No. 200 sieve.

20
Table 3.3. Engineered Gradations for Sample Preparation
Sieve # Particle Size (mm) Targeted Average Cumulative Percent Passing
4% Fines 8% Fines 12% Fines 16% Fines
2.5" 63 100 100 100 100
2" 50 100 100 100 100
1.5" 37.5 100 100 100 100
1" 25 100 100 100 100
3/4" 19 95.6 96.0 96.4 96.8
1/2" 12.5 80.6 81.4 82.2 83.0
3/8" 9.5 69.9 71.1 72.3 73.5
#4 4.75 44.2 45.8 47.4 49.0
#8 2.36 28.0 30.0 32.0 34.0
#16 1.18 18.3 20.7 23.1 25.5
#50 0.3 7.8 11.0 14.2 17.4
#200 0.075 4.0 8.0 12.0 16.0
Sieving and Size Separation To control the gradation of an individual aggregate sample, sieving and separation of the aggregate materials by size was undertaken first. The stockpiles of all three aggregate materials received from IDOT were processed through a set of sieves in a rather long and carefully controlled sieving and separation procedure. The material retained on each sieve size was stored in separate barrels. The sieving was primarily conducted at the ATREL facility at the University of Illinois. The size separation was done based on dry sieving of the aggregate stockpiles. Figure 3.2 shows the coarse aggregate sieve shakers used for this purpose. Figure 3.3 shows the barrels containing different aggregate sizes.

Samp was tvs. actargewet sshowconteattribparticaggreeffectthe ta
Figu
ple Blendin
After sepato blend the chieved grad
eting the foursieve analysiwed that the aent during bluted to the s
cles during degate layer ats of fines onarget vs. act
Figure 3.2
ure 3.3. Size
ng and Wet A
arating indivaggregates
dation througr pre-determis was condactual fines ending. Thissignificant amdry sieving aas a whole. Tn aggregateual fines con
2. Sieve sha
e separation
And Dry Sie
vidual aggregas per the e
gh wet sievimined fines c
ucted on eacontent of a
s difference mount of fine
and contributTherefore, th strength anntents determ
21
kers used fo
of aggregat
eving
gate sizes inengineered gng of the saontents for ach of the sa
a sample wasin achieved es that remated towards hese fines s
nd deformatiomined in the
or size separ
tes into diffe
nto separate gradations, amples. Samall the three mples. The ws always higvs. target fin
ained stuck tchanging th
should be coon behaviore blended sa
ration.
rent barrels.
barrels, theand to check
mples were paggregate tywet sieving
gher than thenes content to the surface performannsidered wh. Table 3.4 l
amples.
.
e next step k the target repared ypes, and results e target fineswas
ces of larger nce of the hile studyingists in detail
s

22
Table 3.4. Target and Achieved Fines Contents
Target Fines Content (%) (based on dry sieving)
Actual Fines Content (%) (based on wet sieving)
Limestone Uncrushed Gravel Dolomite 0 4.4 2.9 0.71 4 8.1 6.8 4.68 8 11.8 10.6 8.65
12 15.5 14.5 12.62 16 19.2 18.3 16.60
Table 3.4 indicates that even a sample blend targeting 0% fines (material passing sieve # 200) contains 4.4% fines for limestone and 2.9% fines for uncrushed gravel. However, the dolomite sample contained less than 1% fines. This was because, the dolomite received from IDOT was washed material, and hence contained almost no fines. However, the limestone and uncrushed gravel stockpiles received were directly from the quarry and hence had significant amount of fines. For limestone, the achieved fines were almost always about 4% higher than the target fines (see Table 3.4). Similarly, for uncrushed gravel, the actual fines contents were about 2.5%-3.0% higher than the target fines. Therefore, it was decided that limestone and gravel samples would be blended targeting 0%, 4%, 8% and 12% fines, so that the actual fine contents would be in the order of 4%, 8%, 12%, 16%, respectively. As there was no noticeable difference between the achieved and target fine amounts for dolomite, dolomite samples were blended targeting 4%, 8%, 12%, and 16% fines. Figure 3.4 shows the modified engineered gradations, now also showing the 0% target fines curve. 3.2 MOISTURE-DENSITY AND IBV TESTS Before testing the aggregate samples for their strength and deformation behavior, the first task was to determine the compaction properties corresponding to each gradation. As pavement layers in the field are often compacted to pre-determined percentages of the maximum dry density values, it was important to establish the values of maximum dry density and optimum moisture content for each aggregate gradation. The objective of compaction is to improve the engineering properties of the soil mass; by compaction soil strength can be increased, bearing capacity of pavement subgrades can be improved, and undesirable volume changes, for example caused by frost action, swelling and shrinkage, may be controlled (Holtz, 1990). Compaction characteristics for the three aggregate types studied in this project, were established using the standard method specified in ASTM D698 and AASHTO T99. For each sample, a minimum of four moisture contents were used to conduct the Proctor tests and establish the maximum dry densities corresponding to the optimum moisture contents (OMCs). To better understand the moisture-density behavior of the materials; up to six moisture contents were used for some samples to establish the OMC and maximum dry density charts. It should be noted that at low fines contents, the samples can act as free draining material. Therefore, special care was taken to prevent the water from draining out of the mold during compaction by sealing the mold at the bottom. If draining of water from sample is not prevented, a good estimate about the actual water content that contributed towards achieving the maximum density cannot be obtained.

23
Moreover, it should be noted that AASHTO T-99 procedure does not require the mold to be sealed. Therefore, the Proctor test may not be the best procedure for studying moisture-density behavior of free draining aggregates unless proper care is taken to hold the compaction water inside the sample.
Particle Size (mm)
0.010.1110100
0.010.1110100
Cum
ulat
ive
Per
cent
Pas
sing
0
20
40
60
80
100
0% Fines4% Fines8% Fines12% Fines16% Fines
Figure 3.4. Final engineered gradations with 0% fines from dry sieving.
The Immediate Bearing Value (IBV) test was performed on the same specimens used to obtain the density by following AASHTO T-99 procedure with no soaking of the specimens. Conducting unsoaked CBR tests to determine IBV gives expedited results. The change in IBV with moisture content was determined at the previously listed fines contents to study the main trends in strength for each material with moisture changes. Detailed discussions of the results obtained from the standard Proctor moisture-density and IBV tests are presented in Chapter 4. 3.3 CHARACTERIZING AGGREGATE SHAPE, TEXTURE AND ANGULARITY As discussed in detail in Chapter 2, aggregate particle shape, texture and angularity have been found to affect the performances of aggregate layers (both bound as well as unbound) in pavement structures. Unbound aggregate layers having crushed particles have consistently performed superior compared to those with uncrushed gravel. Knowing the aggregate type, i.e., quantifiable measures of angularity and surface texture, to be used for subgrade replacement/subbase would help in determining the aggregate cover thickness requirements. Therefore, the three aggregate types studied in this research project were first tested for particle shape, texture and angularity characteristics. The use of a validated image analysis system, the University of Illinois

24
Aggregate Image Analyzer (UIAIA), was pursued in this project to give timely consideration to imaging based shape (flatness and elongation), angularity and surface texture property determinations of the selected coarse aggregate materials. The laboratory prototype UIAIA was identified and recommended by the NCHRP 4-30A project among the most promising aggregate imaging systems to provide an automated means to determine coarse aggregate size and shape properties (Tutumluer et al., 2000; Rao, 2001). The UIAIA system, as shown in Figure 3.5, can take images of an individual aggregate particle from three orthogonal views, which has been very effective in reconstructing three-dimensional (3-D) particle shape and computing accurately the volume and size and shape indices.
Figure 3.5. The University of Illinois Aggregate Image Analyzer (UIAIA) system. The UIAIA based image indicial data for coarse aggregate fall into the following two categories: (i) particle sizes, which include maximum, intermediate and minimum dimensions, and volume of the particle (Tutumluer et al., 2000; Rao, 2001); (ii) particle morphological or shape indices, which include the flat and elongated (F&E) ratio (Rao et al., 2001), angularity index AI (Rao et al., 2002), surface texture ST index (Rao et al., 2003). These two categories of imaging based coarse aggregate shape indices have been validated by successfully measuring aggregate properties and linking results to corresponding laboratory strength data and field rutting performances (Rao et al., 2002; Pan et al., 2004).

25
Approximately 250 aggregate particles were selected from each aggregate type and analyzed using the UIAIA through three replicate tests. Results from the UIAIA image analyses will be presented in Chapter 5. For selecting the particles from each aggregate type, care was taken not to select very small particles as the UIAIA results tend to be more accurate for intermediate to larger size aggregates. All the particles selected for the three aggregate types belonged to barrels corresponding to material retained on sieves #4 (4.75 mm) and #8 (2.36 mm). 3.4 RAPID SHEAR STRENGTH TESTING OF AGGREGATES To study the effect of different aggregate properties on the shear strength behavior, triaxial shear strength tests were run on the aggregate samples. The test procedure followed was that of “Rapid Shear Strength Test,” commonly performed at the University of Illinois ATREL on highway geomaterials. Compared to the conventional triaxial shear tests, a very high loading rate of 1.5 in./second is applied in rapid shear tests, causing 12.5% deformation in a 12-in. high specimen instantly. Due to the high loading rate, this test gives slightly higher peak stresses as compared to results from conventional shear strength tests. However, rapid shear tests are believed to better simulate the conditions of the actual pavement layer under the dynamic application of a moving wheel load. Three different samples were tested at confining pressures of 5, 10, and 15 psi to determine the shear strength properties, friction angle and cohesion, of the aggregate materials. Each shear strength test actually involved testing of three different samples, resulting in a total of 216 samples tested for rapid shear strength determination. Instead of friction angle and cohesion, the maximum deviator stress at failure or the peak deviator stress values can also be compared to evaluate strength properties of different aggregate samples. This will be the approach to present rapid shear strength results in Chapter 5. The shear strength tests were conducted at ATREL through the collaborative efforts between Engineering and Research International, Inc. (ERI) and University of Illinois research team members. The repeated load loading system used for this purpose was a Material Testing System (MTS) closed-loop servo hydraulic system, Model 407. The main part of the system consists of a controller, a loading frame, and a hydraulic power supply. The system is fitted with a 10-kip ram. The ram is fitted with an internal Linear Variable Differential Transducer (LVDT). The MTS-407 controller provides the electronics for closed-loop controls and system operations. The applied force and displacements are measured by the associated system transducers (load cell and the LVDT). The rapid shear strength tests were performed in a displacement-controlled mode, by programming the loading ram to push the sample down at a rate of 1.5 in./second. The data acquisition for the tests was done using the Labview software. Figure 3.6 shows a picture of the test equipment.

26
Figure 3.6. MTS 407 servo-hydraulic system used for rapid shear testing.
Sample Preparation for Rapid Shear Strength Tests The rapid shear strength tests were conducted on cylindrical specimens, 6-in. or 152-mm in diameter by 12-in. or 254-mm high. The samples were prepared using a split aluminum compaction mold (see Figure 3.7). A nitrile membrane, 0.6-mm thick, was attached to the bottom platen with an o-ring and the platen was placed in the split mold. The aggregate mixed with required amount of water was placed in the mold in five lifts and each lift was rodded 25 times using a standard rod for concrete testing. Figure 3.8 shows the split mold in assembled state with the nitrile membrane attached.
Figure 3.7. Split mold assemblies used in sample preparation and compaction.

27
Figure 3.8. Split mold assembled with nitrile membrane.
A pneumatic vibratory compactor was originally used for compacting the individual layers. However, as the optimum moisture contents for the samples were usually high (often as high as 10%), the vibratory compaction caused excessive splashing of water, and resulted free standing water on top of the specimen. Figure 3.9 shows a compacted sample with free standing water on top of the compaction plate.
Figure 3.9. Free standing water on top of compaction plate. To avoid excessive water loss due to splashing, and subsequent effects on aggregate behavior, the samples were compacted using an impact hammer, similar to the one used in standard Proctor tests. It should be noted that such similarity between compaction procedure and rapid shear test procedure used for the different tests would better correlate moisture-density behavior with strength and modulus results.

28
Specimen density was calculated by measuring the weight of material, and the compacted thickness of each lift, referenced to the top of the mold. Each lift was then scarified up to a depth of approximately 12-mm, and the next lift was placed, and compacted. After compaction, the final height and density of specimen were noted. When compaction was completed, a second membrane was placed on the specimen to provide vacuum and prevent air leakage in and out of the specimen. The load cell was then placed on top of the specimen with the specimen sitting in the upright position in the Plexiglas confining chamber of the triaxial setup. Before connecting the confining pressure, proper sealing of the Plexiglas chamber wall was accurately maintained with grease or liquid rubber latex. Extreme care was taken to reduce the time lag between removal of the compaction mold, and testing of the sample. This was done to reduce the amount of water lost due to free drainage through the sample. Figure 3.10 shows some water lost from the specimen after the compaction mold was removed. Through extreme care, the researchers were able to reduce the amount of water loss, and to control the difference between compaction water content and water content during the test. Figure 3.11 shows the deformed shape of the sample after completion of the test. Test results from the rapid shear strength tests are analyzed in Chapter 5. Data files from the tests are presented in the Appendix.
Figure 3.10. Water loss from sample upon removal of compaction mold.
3.5 RESILIENT MODULUS AND PERMANENT DEFORMATION TESTS Resilient modulus and permanent deformation tests were performed on specimens with applied confining pressures and deviator stresses according to AASHTO T307-99. The specimens were first conditioned for 1000 load cycles to characterize their permanent deformation behavior at an applied stress state of 15 psi deviator stress and

29
15 psi confining pressure. Then, resilient modulus tests were conducted at the 15 AASHTO T307 stress states.
Figure 3.11: Deformed Sample after Completion of Rapid Shear Strength Test Directional modulus tests were performed with pulsed stresses in both vertical and horizontal directions using an advanced triaxial testing machine, referred to as University of Illinois FastCell (UI-FastCell) with its unique loading capabilities. The University of Illinois-FastCell (UI-FastCell) is an innovative testing device having provisions for switching and pulsing of the major principal stresses both in the vertical and radial directions by the use of the two independently controlled stress channels. The UI-FastCell was custom-designed and manufactured mainly for determining in the laboratory the anisotropic and dynamic properties of unbound aggregates. Since it is not possible to reorient the granular samples in the triaxial cell, applying and switching of the various stress states on the same specimen facilitates determining primarily the load-induced anisotropy. The device is also suitable for simulating field stress conditions in the laboratory and for studying the effects of principle stress rotation due to moving wheel loads that involve a change in total shear stress direction. The UI-FastCell uses a fluid/air interface to minimize compressibility effects when conducting tests in which the horizontal stress on a specimen must be cycled. This is useful for investigating anisotropic effects and the response to loading in which a 90° rotation of planes of principal stress is important. The cell also provides a capability for on-specimen displacement measurements, which eliminate problems associated with compliance of the machine used to load the specimen. When on specimen vertical displacements are used as well, end effects are eliminated. Figure 3.12 shows a picture of the UI-FastCell with the confinement cell lowered down on the specimen for the testing position.

30
Figure 3.12. University of Illinois FastCell.
In UI-FastCell, an air actuator applies the axial pressure and the confining pressures are cycled through a hydraulic fluid within the rubber membrane. The driving cylinders on the back of the confining cell (not shown here) include an air-fluid interface which provides “fast” application and switching of the dynamic loading in the confinement “cell.” Some of the unique capabilities are as follows:
a) Measurement of on sample vertical and radial displacements, and axial force and displacement external to cell;
b) Measurement of pore pressures in undrained and/or cyclic loading by the use of a transducer, which can be installed in the bottom plate
c) A bladder type horizontal confinement chamber with a built-in membrane which is inflated to apply variable confining pressures during vertical cyclic loading;
d) Ability to independently apply both static and dynamic vertical and radial stresses in phase or out of phase under compression or extension type loadings;
e) Ability to reverse principal loading direction on the same specimen with applied radial pulse stresses exceeding the vertical ones.
The UI-FastCell cyclic loading system used is a Universal Testing Machine (UTM), a closed-loop servo control material testing machine. The main part of the system consists of loading frame, triaxial cell, air power supply, Control and Data Acquisition System (CDAS), and personal computer with an integrated software package. Within the servo hydraulic and servo pneumatic testing systems used together for horizontal confinement and axial loading, energy is transmitted to the specimen using high-pressure hydraulic fluid through a membrane and high-pressure air acting on a piston, respectively. The CDAS directly controls the servo valves to apply the requested loading rate or waveform. The associated system transducers, a load cell and LVDTs, measure force and displacement, respectively. While the specimen is being subjected to

31
loading forces, the CDAS captures data from the transducers and transfers these data, via a standard serial communication link, to the PC for processing, display, and storage. Since stresses can be cycled independently in the axial and radial directions, UI-FastCell is ideally suited for simulating dynamic field stresses on the sample and for studying the effects of stress-induced directional dependency of modulus and strength properties. The dynamic pulsed stress states were conveniently switched on the same aggregate specimen and the horizontal to vertical modulus ratios were established from the test data. Figure 3.13 presents a drawing of the cylindrical specimen, approximately 6-in. in diameter by 6-in. high, under the independently applied vertical and radial stresses and the instrumentation consisting of LVDTs measuring axial and radial specimen deformations.
Figure 3.13. Stress states in a triaxial test apparatus.
Sample Preparation Cylindrical specimens, 150 mm in diameter by 150 mm high (approximately 6-in. in diameter by 6-in. high), were prepared to fit in the confinement chamber of the UI-FastCell for the repeated load triaxial testing. A nitrile membrane, 0.6 mm (0.025 in.) thick, was attached to the bottom platen with an o-ring and the platen was placed in the split mold. The split mold was assembled and the membrane was folded over the top of the mold and secured with an o-ring. A vacuum line was attached to the mold to hold the membrane tight against the mold. A non-woven geofabric was placed on top of the bottom platen to prevent the drainage port from being clogged. The aggregate mixed with required amount of water was placed in the mold in three lifts and each lift was rodded 25 times using a standard rod for concrete testing. The surface of each lift was leveled after rodding, and a full-faced compaction foot with an air bubble leveling device on top was placed over the specimen. Similar to the case of rapid shear strength samples, the modulus and permanent deformation samples were also compacted using an impact hammer, instead of a vibratory compactor. Specimen density was calculated
σσvv -- σσc c = Repeated (Cyclic)= Repeated (Cyclic)Deviator StressDeviator Stress
= = σσddσσcc
σσ22 = = σσ3 3 = = σσcc
⎧⎨⎩
⎫⎬⎭
Total Axial Stress, Total Axial Stress, σσ11(major principal stress)(major principal stress)
Shear Stresses Shear Stresses τ = τ = 00ττ
τ = τ = 00MMRR = = σσdd / / εεrr

32
by measuring the weight of material, and the compacted thickness of each lift, referenced to the top of the mold. Each lift was then scarified up to a depth of approximately 12-mm (0.5-in.), and the next lift then placed, and compacted. After compaction, the vacuum was removed from the split mold and applied to the bottom of the platen to create suction through the specimen thereby causing a confinement by the membrane. Figure 3.14 shows a compacted sample inside a split mold with the vacuum line still connected to it. The loading platen was placed at the top of specimen. The split mold was then removed and a 0.3-mm (0.012-in.) thick nitrile membrane was placed on the specimen and secured to the top and bottom platens with o-rings. The second membrane was required because the first membrane generally was punctured while compacting the specimen. Some powder was applied on the second membrane to reduce the friction between the rubber membrane of confining cell and the nitrile membrane of specimen while lowering down, and raising up the confining cell. Next, the specimen was placed on the base plate, centered by the pivot screw on the base plate, and fitted the hole at the bottom of the bottom platen of specimen. Before lowering down the confining cell, the loading plate was lowered down to make sure that the specimen was in upright position by another pivot screw at the bottom of the loading plate, which fitted the hole on top of the top platen. Figure 3.15 shows a picture of the UI-FastCell with the confining cell raised. Figure 3.16 shows a sample set up under the loading ram, with the cell ready to be lowered.
Figure 3.14. Compacted sample with vacuum line connected.

33
Figure 3.15: UI-FastCell with confining cell raised.
Figure 3.16. Sample set-up ready to be tested under UI-FastCell.
Directional Modulus and Permanent Deformation Test Procedures The samples were first tested for permanent deformation behavior. This was done by setting the confining pressure to 15 psi (103.4 kPa) and applying a 1,000 repetitions of a load equivalent to a maximum deviator stress of 15 psi (103.4 kPa) using a haversine-shaped load pulse. After completion of the permanent deformation tests, resilient modulus tests were run on the same sample following the specifications of AASHTO T307-99. The specimens were subjected to 15 triaxial stress states that are typically less than the failure stress states. A haversine load waveform was applied with load pulse duration of 0.1-seconds, and a rest period of 0.9-seconds. After the 2-kPa (0.3-psi) hydrostatic seating stress was applied on the specimen, resilient modulus testing was conducted as noted in Table 3.5 in first the vertical (direction 1) and then the

34
radial (direction 3) pulsing directions with the applied (pulsed) deviator stresses σnd (n = 1 or 3). The pulsed deviator stresses, σnd, ranged from 21 to 276 kPa (3 to 40 psi) in both axial and radial directions whereas the hydrostatic pressures ranged from 21 to 138 kPa (3 to 20 psi). One hundred load repetitions were applied at each stress state. The test results from the permanent deformation and resilient modulus tests are discussed and analyzed in Chapter 5. The data files obtained from the tests are presented in the Appendix.
Table 3.5. Stress States Applied for Directional Resilient Modulus Testing
Sequence No.
Confining Pressure
(σnc) (psi)/(kPa)
Max Axial Stress (σnd)
(psi)/(kPa) No. of Load Applications
1 3 / 20.7 3 / 20.7 100 2 3 / 20.7 6 / 41.4 100 3 3 / 20.7 9 / 62.1 100 4 5 / 34.5 5 / 34.5 100 5 5 / 34.5 10 / 68.9 100 6 5 / 34.5 15 / 137.9 100 7 10 / 68.9 10 / 68.9 100 8 10 / 68.9 20 / 137.9 100 9 10 / 68.9 30 / 206.8 100
10 15 / 103.4 10 / 68.9 100 11 15 / 103.4 15 / 103.4 100 12 15 / 103.4 30 / 206.8 100 13 20 / 137.9 15 / 103.4 100 14 20 / 137.9 20 / 137.9 100 15 20 / 137.9 40 / 275.8 100
3.6 SUMMARY This chapter described the developed aggregate test matrix studied in the laboratory for determining individual effects of aggregate type including particle shape, texture and angularity, types and amounts of fines, and plasticity of fines on unbound aggregate layer strength and deformation characteristics. The laboratory test matrix was carefully followed by the use of engineered gradations based on wet sieving to perform moisture-density, IBV, shear strength, directional resilient modulus, and permanent deformation tests. The sample preparation and test procedures used were also highlighted in this chapter.

35
CHAPTER 4 MOISTURE-DENSITY AND IBV RESULTS The initial laboratory phase of the study presented in this chapter is comprised of Proctor moisture-density and Immediate Bearing Value (IBV) test results obtained from the experimental test matrix which considered both plastic and non-plastic fines (passing No. 200 sieve or 0.075 mm) blended in the engineered gradations of crushed and uncrushed aggregate materials at 4%, 8%, 12%, and 16% target fines content. This chapter compares the moisture-density and IBV results for all the three aggregate materials studied in this research project. Moisture-Density Test The objective of compaction is to improve the engineering properties of the soil mass; by compaction soil strength can be increased, bearing capacity of pavement subgrades can be improved, and undesirable volume changes, for example, caused by frost action, swelling and shrinkage, may be controlled (Holtz, 1990). Compaction characteristics for the three aggregate types, i.e. gravel, limestone and dolomite, studied in the project were established using the standard Proctor method specified in ASTM D698. For each sample, a minimum of four moisture contents were used to conduct the Proctor tests and establish the maximum dry densities corresponding to the optimum moisture contents (OMCs or wopt). To better analyze the moisture-density behavior of the materials, up to six moisture contents were used for some samples to establish the OMC and maximum dry density charts. It should be noted that at low fines contents, the samples can act as free draining material. Therefore, special care was taken to prevent water from draining out of the mold during compaction. Immediate Bearing Value (IBV) Test The IBV tests were performed on the same specimens used to obtain the moisture-density relationship, by following ASTM D1883 procedure with no soaking of the specimens. Conducting IBV tests provides expedited shear strength index test results after compacting specimens for the moisture-density tests. Any change in IBV results with moisture content was studied at different fines contents to determine the strength variation trends of each material with moisture content. Analyses of Test Results The results from the moisture-density and IBV tests, conducted primarily by Engineering Research International (ERI), Inc. are presented in this chapter. The values of the blended fines contents from dry sieving were presented in Chapter 3. Therefore, the legends in the figures represent the actual (washed) fines content of the samples but not the blended fines content. The figures also refer to IBV values as “Unsoaked CBR” to make it easier for any reader to follow the findings of research study since the use of “IBV” is normally limited to the state of Illinois. 4.1 EFFECT OF NON-PLASTIC FINES Standard Proctor tests and IBV tests were conducted on the samples prepared by adding different percentages of non-plastic fines, and the effects of percent fines

36
content on the moisture-density as well as strength characteristics of aggregates were studied (see Figures 4.1, 4.2 and 4.3). The upper part of Figure 4.1 shows the moisture-density behavior of limestone samples with non-plastic fines. Figure 4.1 shows that the maximum dry density values increase as the percentage of fines in the sample increases, with the highest maximum dry density value obtained at a fines content of 19.2%. As the addition of fines gradually fills the voids, the aggregate matrix continues to become denser thus making 19.2% sample the densest. The lower part of Figure 4.1 shows the change in IBV with moisture content for each of the Proctor samples. The dependence of IBV with moisture is erratic at low fines contents (4.4%, and 8.1%). However, at higher fines contents, the IBV value decreases rapidly with the increase in moisture. It can also be seen that the rate of decrease in the IBV value with moisture is higher at higher fines contents. A similar trend can be observed for dolomite samples (see Figure 4.2). As in the case of limestone, the behavior of IBV with moisture is somewhat erratic for low fines contents. However, as the fine content increases, a rapid fall in IBV value with increase in moisture content can be noticed. Figure 4.3 shows the moisture-density and IBV-moisture content behavior of uncrushed gravel samples blended with different percentages of non-plastic fines. As the fines content increases from 2.9% to 14.5%, the maximum dry density also increases. However, as the fines content is further increased to 18.3%, the maximum dry density value decreases. This can be explained from the fact that the uncrushed gravel matrix, comprised of rounded aggregate particles, has a lower amount of voids when compared to that of the limestone (limestone particles are 100% crushed). Therefore, as the fines content increases beyond a certain point, all the voids in the uncrushed gravel matrix gets filled, and the coarse particles are displaced by the fines. This results in a reduction in the overall dry density, as the specific gravity of the fines is lower than that of the coarse particles. A closer look at the IBV relationship with moisture content suggests a behavior similar to that of the limestone, with the change in IBV with moisture being erratic at low fines contents. However, as the fines content increases, there is a rapid decrease in IBV with increasing moisture content.

Figuure 4.1. Effect of non-pla
37
astic fines onn limestone aggregates.
.

38
Figure 4.2. Effect of non-plastic fines on dolomite aggregates.

Figure 44.3. Effect of
39
f non-plasticc fines on graavel.

40
4.2 EFFECT OF PLASTIC FINES Past research studies have shown that dense graded aggregate layers having highly plastic fines exhibited considerably higher moisture sensitivities when compared to the ones having only mineral filler type non-plastic fines. Section 1004 of the current IDOT Standard Specifications for Road and Bridge Construction gives detailed coarse aggregate quality class requirements for various pavement surface and road foundation applications. Article 1004.04(d), for example, states "the plasticity index (PI) requirement for crushed gravel, crushed stone and crushed slag may be waived if the ratio of the percent passing the 75 μm (No. 200) sieve to that passing the 425 μm (No. 40) sieve is 0.60 or less." Whether or not such a ratio of 0.60 is needed or if the material (even if plastic) should pass or be lower than the 0.60 may need to be studied with proper consideration given to the field application and performance requirements of the aggregate material. To study the effect of plastic fines on aggregate behavior, test samples were prepared at different percentages of plastic fines. The plastic fines used in the study had plasticity index (PI) values in the range of 8 to 14. Figure 4.4 shows the overall impact of plastic fines on the behavior of the limestone samples. The moisture-density behavior shows a pattern similar to that observed with the non-plastic fines. The attained maximum dry density values increase with increasing fines content from 6.6% to 15.3%. The lower part of Figure 4.4, i.e., graph relating IBV with moisture content, clearly captures the different influences of plastic and non-plastic fines. Unlike in the case of non-plastic fines, the IBV value decreases rapidly with increasing moisture content, even at low percentages of plastic fines Moreover, it should be noted that the IBV values for samples with plastic fines are appreciably lower than those with non-plastic fines, even at the same moisture contents. The findings outlined here certainly support the common belief that the type of fines affects aggregate behavior significantly. Therefore, limiting only the maximum amount of fines in an aggregate layer may not be the ideal method to ensure adequate pavement behavior. Figure 4.5 shows a similar plot for dolomite samples. For dolomite, the fall in IBV value with an increase in moisture content is not as rapid when the amount of fines is significantly low (4.7%). However, for higher fines contents, the IBV value falls rapidly with an increase in moisture content. Figure 4.6 shows the effect of plastic fines on gravel samples. The moisture density curves exhibit similar trends to those observed with non-plastic fines (maximum dry density falls at very high fines contents). However, the IBV-moisture content relationship exhibits a stronger effect of plastic fines on the aggregate strength characteristics, as already discussed for limestone.

Figure 44.4. Effect o
41
of plastic fine
es on limestoone.

42
Figure 4.5. Effect of plastic fines on dolomite.

Figuree 4.6. Effect
43
of plastic finnes on graveel.

44
4.3 DEPENDENCE OF IBV ON MOISTURE CONTENT The preliminary results of IBV values were graphed with percent fines at different moisture contents for all the three aggregate types. These relationships for the limestone, dolomite and uncrushed gravel are presented in Figures 4.7, 4.8 and 4.9, respectively. For all three aggregate types, the IBV value at a given fines content is typically the lowest when the moisture content is at 110% of the OMC. Moreover, the figures also show that samples having plastic fines at 110% of OMC have the lowest IBV values. Thus, for any pavement layer, the combination of plastic fines and high moisture content will result in the lowest shear strength properties.
% Fines
2 4 6 8 10 12 14 16 18 20
Uns
oake
d C
BR
(IB
V)
0
20
40
60
80
100IBV at 90% Wopt (PI = 0) IBV at Wopt (PI =0) IBV at 110% Wopt (PI =0)IBV at 90% Wopt (PI = 8 to 10)IBV at Wopt (PI = 8 to 10)IBV at 110% Wopt (PI = 8 to 10)
Figure 4.7. Relationship between IBV and fines content for limestone.

45
% Fines
4 6 8 10 12 14 16 18
Uns
oake
d C
BR (I
BV)
0
20
40
60
80
100
120IBV at 90% Wopt (PI =0)IBV at Wopt (PI =0) IBV at 110% Wopt (PI =0)IBV at 90% Wopt (PI = 8 to 9) IBV at Wopt (PI = 8 to 9) IBV at 110% Wopt (PI = 8 to 9)
Figure 4.8. Relationship between IBV and fines content for dolomite.
% Fines2 4 6 8 10 12 14 16 18 20
Uns
oake
d C
BR (I
BV
)
0
10
20
30
40
50
60
70
IBV at 90% Wopt (PI =0)IBV at Wopt (PI = 0)IBV at 110% Wopt (PI =0)IBV at 90% Wopt (PI = 11 to 14)IBV at Wopt (PI = 11 to 14)IBV at 110% Wopt (PI = 11 to 14)
Figure 4.9. Relationship between IBV and fines content for gravel.

46
% Fines2 4 6 8 10 12 14 16 18 20 22
Uns
oake
d C
BR
(IB
V)
20
30
40
50
60
70
80
Gravel : NonplasticGravel: PlasicLimestone: Nonplastic Limestone: Plastic Dolomite: NonplasticDolomite: Plastic
Figure 4.10. Relationship between IBV and fines content at optimum
moisture content. 4.4 SUMMARY OF FINDINGS For non-plastic fines, the variation of the IBV value with moisture content was somewhat erratic and did not indicate any significant trends at low fines contents. However, as the fines content was increased, the IBV decreased rapidly with the increasing moisture content. This trend was observed for all the three types of materials, i.e. limestone, dolomite, and uncrushed gravel, tested. From the test results, the presence of low amount of non-plastic fines in an aggregate layer may not adversely affect the pavement performance. However, for plastic fines, the IBV values showed rapid decreases with moisture contents even for low amounts of fines thus indicating increased moisture sensitivity. This implies that the specifications currently used in the state of Illinois may need to be re-evaluated to adequately take into consideration the effect of the plasticity of fines.

47
CHAPTER 5 ANALYSES OF TEST RESULTS Results from the moisture-density and Immediate Bearing Value (IBV) tests and their interpretations were given in the previous chapter. This chapter presents the results from the imaging based aggregate shape characterization and the aggregate triaxial tests, which consist of permanent deformation, directional resilient modulus and shear strength tests and the analyses of the aggregate test data. Test results are interpreted for significant trends identified in aggregate strength and deformation behavior in accordance with the studied test matrix variables, and possible causes for differences in aggregate behavior are evaluated. 5.1 AGGREGATE SHAPE, TEXTURE AND ANGULARITY TEST RESULTS The use of a validated image analysis system, the University of Illinois Aggregate Image Analyzer (UIAIA), was pursued during the course of this project to give timely consideration to imaging based shape (flatness and elongation), angularity and surface texture property determinations of the selected coarse aggregates. Basic components of the imaging equipment and its principle of operation have already been discussed in Chapter 3. The UIAIA based image indicial data for coarse aggregate fall into the following two categories: (i) particle sizes, which include maximum, intermediate and minimum dimensions, and volume of the aggregate particle (Tutumluer et al., 2000; Rao, 2001); (ii) particle morphological or shape indices, which include the flat and elongated (F&E) ratio (Rao et al., 2001), angularity index (AI) (Rao et al., 2002), and surface texture ST index (Rao et al., 2003). Both categories of these imaging based coarse aggregate shape indices have been validated in the past by measuring aggregate properties using the UIAIA and successfully linking results to corresponding laboratory strength data and field rutting performances (Rao et al., 2002; Pan et al., 2004). For quantifying the shape and angularity aspects of the three aggregate types studied in this project, approximately 250 particles of each aggregate type were analyzed using the UIAIA. The surface texture (ST) index and the angularity index (AI) were computed using the automated algorithms by Rao et al. (2002 and 2003). Figure 5.1 shows the ST index values graphed with particle number, for limestone. Figure 5.2 presents a similar graph for gravel. From both figures, the ST index values obtained for crushed limestone are typically much greater than those for gravel as expected. Similarly, Figures 5.3 and 5.4 present the AI values graphed for limestone and gravel, respectively. Note that crushed limestone, similar to dolomite, has significantly higher percentage of particles that have higher AI and ST values when compared to the uncrushed gravel. The ST and AI indices can be directly linked to shear strength and permanent deformation properties of the studied aggregates to realistically account for the contributions of crushed and uncrushed particles in the development of aggregate thickness correction factors.

48
Figure 5.1. Typical surface texture (ST) indices obtained for limestone particles.
Figure 5.2. Typical surface texture (ST) indices obtained for gravel particles.
0
1
2
3
4
5
6
7
8
9
10
0 50 100 150 200 250
ST In
dice
s
Particle Number
0
0.5
1
1.5
2
2.5
3
3.5
4
4.5
5
0 50 100 150 200 250
ST In
dice
s
Particle Number

49
Figure 5.3. Distribution of angularity index (AI) values by weight of
limestone particles.
Figure 5.4. Distribution of angularity index (AI) values by weight of
gravel particles.
0
10
20
30
Perc
enta
ge P
artic
les b
y W
eigh
t (%
)
AI
0
10
20
30
40
Perc
enta
ge P
artic
les b
y W
eigh
t (%
)
AI

50
Table 5.1 lists for the three aggregate types studied the average particle shape, texture and angularity characteristics measured in terms quantifiable imaging based shape indices using the UIAIA. Note that higher AI and ST values indicate more angular and rougher surface textured aggregates, i.e., the crushed dolomite and limestone particles. The uncrushed gravel particles are closer to spherical shapes with the lowest flatness and elongation ratios by weight among the three aggregate types.
Table 5.1. Average Aggregate Flatness and Elongation, Surface Texture (ST) and Angularity Indices (AI) Determined in this Study
Average Values Angularity Index (AI)
Surface Texture (ST) Index
Flat and Elongated Ratio
by Weight Gravel 330 1 1.9
Dolomite 428 1.3 3.3 Limestone 481 1.8 2.5
Table 5.2 lists typical AI and ST index values identified for uncrushed gravel, crushed gravel, crushed limestone, and crushed granite samples of 39 different coarse aggregate materials collected from the National Center for Asphalt Technology (NCAT) in Auburn, Alabama, seven other state highway agencies, and the Central Federal Lands and Highways Division participating in a recent pool fund study (Tutumluer et al., 2005). As the quality of the aggregate material gets better, i.e. uncrushed to crushed, both the AI and ST values increase. Note that the shape indices reported in Table 5.1 appropriately fall within the ranges given in Table 5.2.
Table 5.2. Typical Ranges and Mean Values of AI and ST
(Pan and Tutumluer, 2005)
Aggregate Type Angularity Index
(AI) Surface Texture (ST)
Index Range Mean Range Mean
Uncrushed Gravel 250-350 300 0.5-1.2 0.9
Crushed Gravel 300-450 400 1.0-1.5 1.2 Crushed
Limestone 400-550 500 1.2-1.8 1.6 Crushed Granite 500-650 550 1.8-2.9 2.2
5.2 PERMANENT DEFORMATION TEST RESULTS Repeated load triaxial testing has received major emphasis recently as a means to evaluate in the laboratory modulus–deformation characteristics of granular materials and subgrade soils. Both resilient modulus and permanent deformation accumulation can be quantified based on the appropriate repeated load testing data. Resilient behavior is typically realized after the specimen is shaken down during the conditioning stage, which generates the permanent deformation data for the soil and aggregate

51
sample tested. In a well designed pavement system the permanent strain accumulated per load cycle is very small compared to the total strain. As previously discussed in Chapter 3, permanent deformation tests were conducted by subjecting the triaxial cylindrical samples to 1,000 cycles of haversine type dynamic pulse loading applied at 0.1-second with a 0.9-second rest period at a confining stress level of 15 psi and an axial deviator stress of 15 psi. The permanent deformation values were recorded for each load cycle. It should be noted that permanent deformation behavior of an aggregate cover layer is one of the most important measures of performance in the field as it plays a significant role in governing the sinkage and mobility aspects of construction equipment. Therefore, the permanent deformation test results for the gravel, dolomite and limestone samples are presented first in this section. As observed from the moisture-density and IBV results, limestone and dolomite samples exhibit similar deformation trends in most of the cases. The UIAIA imaging results also showed that dolomite and limestone, both being crushed, have higher values for the angularity index and surface texture index. Based on these observations, one would predict the permanent deformation characteristics for limestone and dolomite would also be somewhat similar. This is indeed verified by first comparing the permanent deformation results for dolomite and limestone for several different cases. Figures 5.5 and 5.6 compare the permanent deformation trends of dolomite and limestone samples tested at two different text matrix conditions. Figure 5.5 shows the comparative behavior for samples with 4% non-plastic fines tested at 90% of wopt, while Figure 5.6 shows the same for samples containing 8% non-plastic fines tested at 110% of wopt. Interestingly, both figures indicate similar permanent deformation trends for the two aggregate types with dolomite giving slightly higher permanent deformations, which may be attributed to the slightly lower angularity and surface texture AI and ST indices given in Table 5.1. Although the magnitudes of permanent deformation were slightly different for the two aggregate types, the trends in behavior with change in different aggregate properties were similar. Therefore, to present more conservative results of crushed aggregate materials and for the sake of brevity, test results for dolomite samples will be only presented in this section with the complete limestone results given in the Appendix. As the dolomite samples were washed for engineering the gradations, controlling the amount of fines in different samples was also accomplished very accurately.

52
Number of Cycles
0 200 400 600 800 1000
Perm
anen
t Def
orm
atio
n (m
m)
0.0
0.1
0.2
0.3
0.4
0.5
0.6
DolomiteLimestone
Figure 5.5. Comparing limestone and dolomite with 4% non-plastic fines at 90% of wopt.
Number of Cycles
0 200 400 600 800 1000
Perm
anen
t Def
orm
atio
n (m
m)
0.0
0.1
0.2
0.3
0.4
0.5
DolomiteLimestone
Figure 5.6. Comparing limestone and dolomite with 8% non-plastic fines at wopt.
Figure 5.7 shows the effect of increasing the amount of non-plastic fines on the permanent deformation behavior of dolomite tested at dry of optimum moisture contents. It should be noted that the permanent deformation curve for 8% fines is lower than that for 4%. However, as the fines content increases from 8% to 12% and then subsequently to 16%, the permanent deformation values increase significantly.

optim5.9). aggresampbetteincreathere8% fimay with tlimit f
Figure 5
The exactmum water co
This behaviegate matrixple. As the ar rearrangemased beyond
efore, the pernes. Moreovlead to catasthe recommefor non-plast
.7. Percent n
t same trendontent as weor at relative
x due to the pmount of fin
ment and pad 8%, the bermanent defver, the permstrophic failuendation matic fines sho
non-plastic fdolomite
d can be obsell as at wet ely low fines presence of es is increas
acking of parehavior of thformation vamanent defoure of the agade by Tutumuld be set a
53
fines affectine at 90% of
served for noof optimum contents cahigh void sp
sed, the voidrticles. Howehe matrix staalue at 12% frmation at 1
ggregate layemluer and Seround 8% fo
ng permanenwopt.
on-plastic dowater conte
an be explainpace in the cds are graduever, as the arts to be govfines becom6% fines is er. This obseyhan (2000
or crushed a
nt deformatio
olomite finesent (see Figuned by the ucrushed doloually filled upfines contenverned by th
mes higher thdrastically hervation is in0) that an acggregate lay
on of
s tested at ures 5.8 andunstable omite p to provide nt is he fines, andhan that at higher and n agreementcceptable yers.
d
d
t

Figure 5
Figure 5.9
.8. Percent n
9. Percent N
non-plastic fdolo
Non-plastic FDolomite
54
fines affectinomite at wopt.
Fines Affectine at 110% of
ng permanen.
ng Permanef wopt.
nt deformatio
ent Deformat
on of
tion of

55
Figure 5.10 shows the permanent deformation trend of dolomite this time with plastic fines and when measured on the wet side of optimum moisture content. The typical trend of permanent deformations accumulating at much higher rates with increasing fines contents actually changes when the samples are tested on the wet side of optimum moisture content, as compared to the dry side, or at optimum conditions. For the dry and optimum conditions, the aggregate matrix develops much lower permanent deformations at 8% fines when compared to the samples tested at 4% fines. This can be attributed to the fact that at 4% fines the amount of voids in the aggregate structure was too high, and therefore, the particles had to move and rearrange to achieve a more stable configuration. However, Figure 5.10 shows that 8% fines gave higher permanent deformation values as compared to 4% fines. The samples at 12% and 16% fines were extremely unstable and the deformation values were too high for the LVDTs in the triaxial test device to measure these deformations immediately after load application. That is why, the permanent deformation values for samples tested at 12% and 16% fines are not given in Figure 5.10. When plastic fines got wet, they resulted in an immediate deteriorating effect on the aggregate performance, irrespective of the void structure of the aggregate matrix. This implies that different limits need to be established for maximum amount plastic and non-plastic fines, which should be allowed in the field for constructing aggregate cover layers. This is particularly important when the pavement is likely to be exposed to high amounts of moisture. In case of plastic fines, the allowable fines content should be kept at the lowest possible value. Further, an increase in moisture content combined with existing high percentages of plastic fines may lead to catastrophic failures. Figure 5.11 presents permanent deformation test results for the gravel samples with non-plastic fines tested at dry of optimum moisture conditions. From the figure, the permanent deformation values increase consistently when the amount of fines is increased. Unlike in the case of the crushed dolomite, the uncrushed gravel aggregate matrix does not show lower permanent deformation values at 8% fines when compared to the case at 4% fines. The exact same trend was observed for gravel with plastic fines; however, not all plots are shown in this chapter but rather given in the appendices.

56
Figure 5.10. Percent Plastic Fines Affecting Permanent Deformation of Dolomite at 110% of wopt
Figure 5.11. Percent Non-plastic Fines Affecting Permanent Deformation of Gravel at 90% of wopt.
0
0.05
0.1
0.15
0.2
0.25
0.3
0.35
0.4
0 100 200 300 400 500 600 700 800 900 1000
Perm
anen
t Def
orm
atio
n (m
m)
Number of Cycles
4% Fines
8% Fines
0
0.1
0.2
0.3
0.4
0.5
0.6
0 100 200 300 400 500 600 700 800 900 1000
Perm
anen
t Def
orm
atio
n (m
m)
Number of Cycles
4% Fines
8% Fines
12% Fines
16% Fines

57
Figure 5.12 compares the permanent deformation trends of the tested samples of gravel and dolomite. Both dolomite and gravel permanent deformation curves are plotted for samples with 4% and 8% non-plastic fines tested at dry of optimum moisture contents. Note that at 4% fines content, the dolomite sample accumulates much higher permanent deformations as compared to the gravel sample. The interpretation of results shown in Figure 5.12 is that at 4% fines, the crushed dolomite aggregate matrix contains higher void space, and therefore, the aggregate particles rearrange themselves to achieve a more stable configuration. As the amount of fines increases to 8%, permanent deformation values for the gravel become higher than those for the dolomite. This implies that when the amount of fines is somewhat low, crushed aggregates may show higher permanent deformation values than uncrushed aggregates due to lower packing orders. Standard compaction efforts are often unable to bring the crushed aggregate matrix to the densest configuration at low fines contents. Therefore, some rearrangement may take place under the application of construction traffic and as such, aggregate layers containing crushed particles should be better shaken down under construction equipment and traffic.
Figure 5.12. A Comparison of the Permanent Deformation Trends of Gravel and Dolomite at 90% Wopt.
By comparing the dry of optimum and optimum curves given in Chapter 4, it can be clearly seen that when the fines contents are in a range such that most of the voids in the aggregate matrix are not filled with fines, the effect of moisture is not as significant and the permanent deformation values are not affected as much. However, as the amount of fines is increased, the effect of moisture becomes much more apparent. This is particularly noticeable for 16% fines. Although the optimum moisture condition corresponds to the maximum dry density from Proctor compaction, the most resistance to permanent deformation may not necessarily be at the optimum moisture condition.
0
0.05
0.1
0.15
0.2
0.25
0.3
0.35
0.4
0 100 200 300 400 500 600 700 800 900 1000
Perm
anen
t Deo
form
atio
n (m
m)
Number of Cycles
Gravel Non‐Plastic 4% Fines
Dolomite Non‐Plastic 4% Fines
Dolomite Non‐Plastic 8% Fines
Gravel Non‐Plastic 8% Fines

58
Often, granular materials compacted on the dry side of optimum have higher shear strength properties and therefore, attaining a certain compaction such as maximum density alone may not be a good performance indicator in the field. Effects of Aggregate Angularity and Plasticity of Fines To better understand the suitability of different aggregate types for subgrade cover application, it is important to evaluate the relative impacts of the different test matrix variables on the permanent deformation behavior of the aggregate types. For this purpose, Figure 5.13 compares the relative impact levels of aggregate angularity and plasticity of fines on the permanent deformation behavior. The dolomite sample with 8% non-plastic fines tested at dry of optimum conditions is considered here as the reference curve. To compare the effect of aggregate type or angularity on permanent deformation behavior, the test results for the gravel have also been plotted under the same conditions. Note that the gravel shows higher permanent deformation accumulations as compared to the dolomite indicating that particle angularity is an important factor governing aggregate behavior. On the other hand, for the dolomite sample also tested with plastic fines under the exact same conditions, the test results clearly show that plastic fines resulted in the highest permanent deformations. This implies that if plastic fines are present, aggregate angularity or type affecting permanent deformation behavior may shift to become a secondary consideration.
Figure 5.13. Relative Effects of Angularity and Plasticity of Fines Evaluated on Dry Side of wopt.
Figure 5.14 shows a similar comparison for aggregate samples with 12% actual fines tested on the wet side of optimum water content. A drastic reduction in aggregate
0
0.05
0.1
0.15
0.2
0.25
0.3
0.35
0.4
0 100 200 300 400 500 600 700 800 900 1000
Perm
anen
t Def
orm
atio
n (m
m)
Number of Cycles
Dolomite 8% Non‐Plastic Fines
Gravel 8% Non‐Plastic Fines
Dolomite 8% Plastic Fines

perfohigh-optimtype theretype oactuaperm
5.
can bwheththesemixesthe maggre strennon-palonemay may
ormance canplastic fines
mum moisturis changed t
e is no signifiof fines is chal plastic fine
manent deform
.14. Relative
The effecbe quite diffeher the aggre experimens delivered t
maximum amegate materi
When plagth may be plastic or plae can no longbehave simiprimarily dic
n be clearly s. The gravee content hato crushed dicant changehanged fromes tested at mation accu
e Effects of A
cts of increaserent dependregate partictal findings, to constructi
mount of fineial is crushe
astic fines aredramatically
astic) are conger govern tilarly. Then,
ctate the beh
seen when eel sample witas been usedolomite (all e in the perm
m non-plastic110% of wop
umulation.
Angularity anat 1
sing percent ding on the vcles are crusthe amount on sites. Acs permitted d or uncrushe introducedy reduced. Fnsidered at ethe behavior, the types ahavior.
59
excess moistth 12% non-d here as ththe other pa
manent defoc to plastic (cpt), there is a
nd Plasticity 10% of wopt.
fines on thevoid structurshed or uncr
of fines mayccordingly, din the gradahed for the bd with excesurther, whenelevated mor, i.e. both unand amounts
ture is introd-plastic finese reference
arameters rermation behcurve plotteda significantly
of Fines Ev
e permanentre of the aggushed. As fy often vary different limitation dependbest field persive moisturn high amouoisture levelsncrushed ans of fines and
duced in the s tested at 11
curve. As themaining theavior. Howe
d for gravel wy higher rate
valuated at H
t deformationgregate matrfor the implicin actual ag
ts may needding on whetrformance. re; the aggreunts of fines s, the anguland crushed ad the moistu
sample with10% of he aggregatee same), ever, as the with 12% e of
High Fines
n behavior rix and cations of gregate to be set fo
ther the
egate layer (whether
ar particles aggregates re condition
h
e
or
s

60
Effects of Moisture Content and Plasticity of Fines Figure 5.15 compares relative impacts of moisture content and plasticity of fines on aggregate permanent deformation behavior. The comparisons are presented for dolomite with 12% fines and the reference curve is for non-plastic fines tested at 90% of optimum water content. As the moisture content is increased to 110% of wopt, the permanent deformation values increase by about 25%. This shows the adverse effect of moisture even on non-plastic fines at relatively high fines contents. However, if the type of fines is changed from non-plastic to plastic (represented by curves of dolomite with 12% plastic fines tested at wopt and 90% of wopt), the permanent deformation value increases even more dramatically. This clearly shows that increase in moisture content is not as critical for non-plastic fines when compared to the case of plastic fines. These results combined with the previously reported ones in Figure 5.14 indicate that the control of moisture is much more important for aggregate layers containing plastic fines than for those containing non-plastic fines. Moisture control and drainage provisions should become an essential concern during construction especially when plastic fines are present in the aggregate gradations.
Figure 5.15. Relative effects of varying moisture content and plasticity of fines at 12% fines content.
0
0.1
0.2
0.3
0.4
0.5
0.6
0.7
0 200 400 600 800 1000
Perm
anen
t Def
orm
atio
n (m
m)
Number of Cycles
Dolomite Non‐Plastic @ 90% Wopt
Dolomite Non‐Plastic @ 110% Wopt
Dolomite Plastic @ 90% Wopt
Dolomite Plastic @ Wopt

61
5.3 RESILIENT MODULUS TEST RESULTS Starting with the 1986 AASHTO Pavement Design Guide, resilient modulus has been used to characterize the stiffness behavior of subgrade soil and granular base/subbase layers subjected to repeated traffic loading. With the routine use of resilient modulus as a primary input into mechanistic-empirical pavement design procedures, many state highway agencies are now making an effort to establish the appropriate “resilient modulus” inputs for granular materials and subgrade soils. It should be noted that rutting is primarily controlled by shear strength, and therefore, resilient modulus is not a performance indicator of an aggregate layer. However, as a measure of a material’s ability to withstand loading, resilient modulus plays an integral part in the thickness design and long term performance of a pavement. The directional modulus testing using the UI-FastCell under both vertical and horizontal dynamic loads was successfully applied to evaluate aggregate response and performance by Seyhan and Tutumluer (2002). Horizontal to vertical directional modulus ratios are determined by applying horizontal pulsing only to give horizontal modulus and vertical pulsing only to give vertical modulus, respectively. Detailed analyses of the test data by Seyhan and Tutumluer (2002) indicated that these modulus ratios could serve as aggregate performance indicators for determining the quality and strength properties of aggregates under various field-loading conditions and hence could be used to predict rutting potentials of aggregates. Figure 5.16 shows the effect of aggregate type or angularity on the laboratory determined resilient modulus characteristics. The resilient moduli were computed at the applied 15 stress states for the dolomite and gravel both containing 8% plastic fines and tested at dry of optimum moisture conditions. The crushed dolomite sample gave consistently higher resilient modulus values as compared to uncrushed gravel. Moreover, it can be seen that at low values of bulk stress (first stress invariant), there are no significant differences between the resilient moduli obtained for the crushed and uncrushed aggregate particles. However, as the bulk stress value increases, the differences in the resilient response become more apparent. The crushed aggregate material exhibits higher stress hardening behavior as compared to the uncrushed gravel. These experimental findings may suggest that depending on the type of equipment used during pavement construction, the behavior of the aggregate cover layer for subbase will change. When constructing roads with small to intermediate sized equipment, no significant difference in stiffness characteristics of the crushed and uncrushed materials may be noticed. However, when heavy construction equipment needs to be used, crushed aggregates will probably provide much higher stiffnesses for the cover layer than the uncrushed material. The exact same trend can be seen in Figure 5.17, which shows the limestone and gravel materials containing 12% actual non-plastic fines tested at dry of optimum conditions.

62
Figure 5.16. Compared resilient responses of gravel and dolomite materials.
Bulk Stress (kPa)
0 200 400 600 800
Res
ilien
t Mod
ulus
(MPa
)
0
100
200
300
Gravel @ 12% NP Fines 90% WoptLimestone @ 12% NP fines 90% Wopt
Figure 5.17. Compared resilient responses of gravel and limestone materials.
y = 3.571x0.6911
R² = 0.9645
y = 5.5198x0.5962
R² = 0.9801
0
50
100
150
200
250
300
350
0 200 400 600 800
Axi
al R
esili
ent M
odul
us (M
pa)
Bulk Stress (kPa)
DolomiteGravel

Effec dolomthat adifferwere compcontethe achanggravemoistperceresilieconte
ct of Fines C
Figure 5.1mite materiaan increase rence in the applied, the
pared to the ent does not mount of finges. This cael material (sture contententage doesent behaviorent is change
Figu
Content on
18 shows thel tested within the amouresilient mod
e dolomite wsample withhave a notices is change
an be clearlysee Figure 5s. From Fig have a signr is concerneed by a sign
ure 5.18. Pe
Resilient B
e effect of fin plastic finesnt of fines frdulus behav
with 12% fineh 8% fines. Tceable effeced drasticall
y shown by p5.19) tested wgure 5.19, it cnificant damaed, the impaificant perce
ercentage of dolom
63
Behavior
nes content s at dry of oprom 8% to 12vior. Howevees resulted inThis shows tct on the resy, the resilie
plotting the rewith 4% andcan clearly baging effect
act of fines isentage.
fines affecti
mite material
on the resiliptimum mois2% did not c
er, when highn slightly lowhat the slighilient modulu
ent behavior esilient mod
d 16% plasticbe seen thaton the samp
s noticeable
ng resilient s.
ient behaviosture conditicause any siher bulk stre
wer modulus ht increase inus value. Houndergoes
dulus curves c fines at opt increasing ple. Therefoonly when t
response of
or of the ons. Note gnificant
ess levels values whe
n fines owever, whesignificant for the
ptimum the fines
ore, as far ashe fines
f
n
n
s

Direc aggretests that ito strFollowdirectand sthe sa valueat thelines confinshowpresskPa a
Figu
ctional Mod
This sectiegate samplwere succendicate qual
rength charawing the 15 tional modulsubsequentlyame stress s
Figures 5es for dolomie optimum mand the horning pressur
w clear stresssures, and band 138 kPa
ure 5.19. Pe
dulus Test R
ion presentses. As alreassfully usedlities of aggr
acteristics (Tstress statelus tests wey by applyinstates recom.20 and 5.21ite and grave
moisture conizontal onesre values. Its-softening becomes mu
a). This is be
ercentage of grav
Results
s results fromady mentione in the past
regate samputumluer an
e combinatiore performedg deviator s
mmended by1 show the vel, respectivtent. The ve
s with dashet can be seebehavior (sech more app
elieved to be
64
fines affecti
vel material.
m directionaled in Chapteto develop h
ples with diffend Seyhan, 2ns recommed first subjectress pulses
y AASHTO Tvertical and vely, both coertical moduld lines at ea
en that the hoee Figure 5.2parent for th
e an indicatio
ng resilient
modulus teers 2 and 3, horizontal to erent fines c2000; Seyhaended by AActing the sams in the horizT307-99. horizontal dintaining 4%i graphed ar
ach of the 5 Aorizontal mo21). This is tre highest co
on of materia
response of
sts conductedirectional mvertical mod
contents andan and TutumASHTO T 30mples to verzontal directi
irectional mo non-plastic re indicated AASHTO T3
oduli curves rue for all coonfining presal quality. At
f
ed on the modulus dulus ratios d relate themmluer, 2002)07-99, the rtical pulsingon only for
odulus fines testedwith solid
307-99 for gravel
onfining ssures (103 low
m ).
d

65
percentages of non-plastic fines, the type and amount of fines are not very significant in governing material behavior (as is evidenced from the permanent deformation trends). The main difference in aggregate behavior can be attributed to particle shape and surface texture properties. As shown in Figure 5.20, crushed dolomite does not show any significant stress softening behavior with respect the horizontal moduli, whereas in case of gravel, the poor material quality can be clearly seen from the decreasing trend in modulus values with increase in deviator stress. From the earlier study, Seyhan and Tutumluer (2002) presented higher vertical moduli than horizontal ones determined at all stress states, which was suggested as an indicative trend for identifying good quality aggregate materials. An interesting observation is that unlike the tests reported by Seyhan and Tutumluer (2002) on aggregate specimens compacted to 100% modified Proctor densities, Figures 5.20 and 5.21 indicate the vertical modulus values to be in general lower than the horizontal ones determined from horizontal pulsing. This is believed to be due to the fact that all aggregate samples tested in this study, even aggregates with the low 4% non-plastic fines highlighted in this section, were compacted to standard Proctor densities. Such major effect of density on aggregate strength and deformation behavior to change modular ratio trends is in agreement with previous research findings and was properly referenced in Chapter 2 (Barksdale 1972, Allen 1973, van Niekerk 2002).
Note: Solid lines show vertical modulus trends at each of the five AASHTO T307-99 confining pressures
Figure 5.20. Vertical and Horizontal Directional Modulus Results for Dolomite with 4% Non-Plastic Fines @ Wopt.
0
50
100
150
200
250
300
350
400
450
500
0 50 100 150 200 250 300
Res
ilien
t Mod
ulus
(MPa
)
Deviator Stress (kPa)
21 kPa
35 kPa
69 kPa
103 kPa
138 kPa
21 kPa_H
35 kPa_H
69 kPa_H
103 kPa_H
138 kPa_H

66
Figure 5.21. Vertical and horizontal directional modulus results for gravel
with 4% non-plastic fines @ Wopt. Similarly, Figures 5.22 and 5.23 also show the directional moduli determined for dolomite and gravel samples, respectively, this time both containing 16% plastic fines tested on dry of optimum. As observed in Figure 5.21, the horizontal modulus values (dashed lines) are consistently decreasing with an increase in deviator stress, which is a typical stress-softening modulus behavior of fine-grained soils or poor quality aggregate materials with excessive fines (see Figures 5.22 and 5.23). Note that the high amount of plastic fines has induced stress softening behavior in dolomite, which was not observed at 4% non-plastic fines in Figure 5.20. In gravel, the stress softening behavior is still apparent. However, it should be noted that at low fines contents it was the coarse aggregate quality (crushed vs uncrushed) that was governing material behavior. However, at high amounts of plastic fines, it is most likely the fines proportion that dictates behavior of the material. Moreover, the difference in quality between dolomite and gravel at high amounts (16%) of plastic fines is also apparent from the average modular ratio (MR
h/MRv) values. For dolomite, the ratio is 0.89, whereas for gravel, it is
1.63 indicating poor quality material, as observed by Seyhan and Tutumluer (2002) on samples compacted to modified Proctor densities and tested for directional modulus properties.
0
50
100
150
200
250
300
350
400
450
500
0 50 100 150 200 250 300
Res
ilien
t Mod
ulus
(Mpa
)
Deviator Stress (kPa)
21 kPa35 kPa69 kPa103 KPa138 kPa21 kPa_H35 kPa_H69 kPa_H103 kPa_H138 kPa_H

67
Figure 5.22. Vertical and horizontal directional modulus results for dolomite with 16% plastic fines @ 90% Wopt.
5.4 ANALYSIS OF SHEAR STRENGTH BEHAVIOR Triaxial shear tests were conducted on the three aggregate samples following the University of Illinois rapid shear strength procedure previously described in Chapter 3. Each aggregate sample was tested at three different confining pressures, i.e. 5 psi, 10 psi, and 15 psi, for determining the friction angle and cohesion as the shear strength properties and studying the effects of test matrix properties on the strength characteristics. The peak deviator stress recorded at specimen failure can be used as an indicator to evaluate the shear strength behavior of an aggregate sample for comparison purposes. The significant trends observed in the strength behavior of the three aggregate materials are reported in this section. Note that the rapid shear strength tests are conducted with displacement control; the loading ram is lowered on to the sample at a strain rate of 12.5% per second. The deviator stresses are then plotted against axial strains to obtain the peak value as the maximum deviator stress at failure. Figure 5.24 shows such a deviator stress and axial strain plot for a limestone sample containing 4% non-plastic fines tested at optimum moisture content. From the figure, the stress dependent behavior of the aggregate is clearly evident. As the confining pressure increases from 5 psi to 10 psi, the stress developed for a given strain value increases significantly. Therefore, the sample tested at 10 psi confining pressure showed a much higher value of the peak deviator stress.
0
50
100
150
200
250
300
350
400
0 50 100 150 200 250 300
Res
ilien
t Mod
ulus
(MPa
)
Deviator Stress (kPa)
21 kPa
35 kPa
69 kPa
103 kPa
138 kPa
21 kPa_H
35 kPa_H
69 kPa_H
103 kPa_H
138 kPa_H

68
However, as the confining pressure was increased from 10 psi to 15 psi, the increase in deviator stress for a given strain value was not significant. This particular trend was noticed for all the samples tested. The aggregates showed highly sensitive stress dependent behavior at low confining pressures. However, the increase in strength from 10 psi to 15 psi was not always noticeable.
Figure 5.23. Vertical and horizontal directional modulus results for gravel with 16% plastic fines @ 90% Wopt.
0
50
100
150
200
250
300
350
400
450
500
0 50 100 150 200 250 300
Res
ilien
t Mod
ulus
(Mpa
)
Deviator Stress (kPa)
21 kPa
35 kPa
69 kPa
103 KPa
138 kPa
21 kPa_H
35 kPa_H
69 kPa_H
103 kPa_H
138 kPa_H

69
Axial Strain (%)
0 10 20 30 40 50
Dev
iato
r Str
ess
(psi
)
0
20
40
60
80
100
5 psi Confining 10 psi Confining15 psi Confining
Figure 5.24. Rapid shear test results for limestone with 4% non-plastic fines at wopt.
To compare rapid shear strength results of all the samples tested, it was decided to average the peak deviator stresses obtained at the three confining pressures. This way, instead of using friction angles or cohesion intercepts, which may not be consistent when individually compared, the average peak deviator stress (maximum stress at failure) values have been used in this section to compare strength characteristics and draw conclusions regarding the effects of material type, amount of fines, type of fines, and moisture content on aggregate shear strength. Table 5.3 compares the average peak deviator stress values of the dolomite samples containing non-plastic fines with those containing plastic fines both tested at optimum moisture contents. The peak deviator stresses recorded at the three different confining pressures, i.e. 5 psi, 10 psi, and 15 psi, were simply averaged to report one strength value for comparison purposes. As listed in Table 5.3, the samples with plastic fines have a tendency to steadily decrease the average peak deviator stresses at failure when fines content is increased, whereas, an increase in non-plastic fines generally result in higher average peak deviator stresses except between 8% to 12% fines content where the shear strength did not considerably change. These results are similar to the IBV results presented in Chapter 4. Moreover, as the fines content increases beyond 8%, the average peak deviator stress values for the samples containing plastic fines become significantly lower than those containing non-plastic fines. Therefore, average peak deviator stress may not be very effectively used as a discriminating factor to judge shear strength behavior of plastic and non-plastic fines when the fines contents are low.

70
Table 5.3. Effect of fines type on the failure peak deviator stress of
dolomite at wopt.
Fines Content (%) (actual fines)
Dolomite Average Peak Deviator Stress (psi) Tested at wopt
Non-Plastic Fines Plastic Fines
4 82.06 84.73
8 97.91 63.96
12 94.00 56.72
16 111.02 58.10 Table 5.4 compares the average peak deviator stresses recorded for the gravel and dolomite samples, both containing non-plastic fines and tested on the dry side of optimum moisture conditions. Note that the crushed dolomite samples have consistently higher strength values when compared to the uncrushed gravel samples. The differences may become more pronounced as the fines percentage varies; at 8% fines dolomite becomes almost twice as strong. Therefore, as far as shear strength is concerned, which represents complete failure and destruction of the aggregate matrix, unlike permanent deformation or resilient modulus, aggregate type (i.e. crushed or uncrushed and the size of the void space) plays the most important role. The data listed in Table 5.4 indicate that the gravel samples have the maximum strength at 12% actual fines, which is around 8% of blended dry fines (with 4% accounted for existing fines sticking to larger particles). This means IDOT specifications allowing up to 12% fines may need to be revised for uncrushed gravel.
Table 5.4. Effect of aggregate type on the average peak deviator stress
at 90% of wopt.
Non-plastic Fines Content (%) (actual values)
Average Peak Deviator Stress (psi)
Gravel Dolomite
4 39.35 63.75
8 40.23 80.03
12 72.53 99.93
16 59.71 104.86

71
Similar to the observations made from the permanent deformation and resilient modulus test results, the worst impact of adding plastic fines at high moisture contents can be clearly seen on the shear strength test results. Table 5.5 lists the average peak deviator stress values for the gravel samples tested at the wet of optimum conditions. For the non-plastic fines, the peak deviator stress starts to decrease once the fines content increases beyond 8%, and becomes more noticeable beyond 12% fines. However, for plastic fines, as the fines increase from 4% to 8%, the average peak deviator stress, i.e. shear strength drops immediately.
Table 5.5. Effect of plasticity of fines on the gravel peak deviator stress at 110% of wopt.
Fines Content (%) (actual values)
Gravel Average Peak Deviator Stress (psi)
Non-Plastic Plastic
4 44.57 53.03
8 54.75 47.63
12 50.58 40.65
16 40.59 38.82
Table 5.6 captures the effect of moisture content on the peak deviator stress or the shear strength for limestone samples with non-plastic fines. Interestingly, for the low 4% and 8% fines contents, there is an apparent increase in the average peak deviator stress towards wopt and a further decrease at 110% of wopt. For the 12% fines content, dry of optimum and optimum moisture conditions are about the same and the wet of optimum moisture content values decreases. Finally, for the case with 16% fines, dry of optimum is the highest and as moisture content increases, there is a continual drop in the average peak deviator stress. This trend is often common with silty soils which exhibit a tremendous change in strength from dry to wet of optimum conditions. It is obvious that for 16% fines, the behavior is governed by fine grained particles that fill almost completely all the voids.
5.5 SUMMARY OF OBSERVATIONS FROM LABORATORY TESTING From the imaging based particle shape, texture and angularity characterizations and the triaxial tests presented in this chapter, it appears that the most important parameter at low fines contents is the aggregate type governing the angularity, i.e. crushed or uncrushed particles. Unless all voids in aggregate matrix are completely filled with fines, particle angularity, i.e. crushed or uncrushed particles, typically governs the strength and deformation behavior. This pattern is the most noticeable from permanent deformation tests. The second most important parameter that affected aggregate behavior was the plasticity of fines. High amounts of plastic fines at wet of optimum moisture conditions

72
were found to quickly destruct the aggregate load transfer matrix thus resulting in excessive permanent deformations.
Table 5.6. Effect of moisture on limestone peak deviator stress.
Non Plastic Fines Content (%) (actual values)
Average Peak Deviator Stress (psi)
90% of wopt wopt 110% of wopt
4 78.95 93.00 75.40
8 66.24 86.47 80.35
12 76.32 76.71 58.98
16 96.64 87.26 62.59
As far as resilient behavior is concerned, crushed aggregates performed better than uncrushed aggregates. However, at very low values of applied bulk stress, there was not much difference between crushed and uncrushed aggregates. This suggests that limits on the amount of fines can be established primarily depending on the type of crushed or uncrushed aggregate and the weight of construction equipment, i.e. stress state, to be used in the field. The horizontal to vertical modulus ratios determined from directional resilient modulus tests adequately indicated the excessive amount of fines affecting aggregate quality. Directional modulus ratios higher than 1.0 were obtained when the fines occupied all void spaces and governed the behavior of aggregate matrix instead of the aggregate to aggregate contact carrying the load in a good quality aggregate material. The low to high modulus ratio trends were not as significant when compared to the results of Seyhan and Tutumluer (2002) possibly due to the lower standard Proctor achieved densities in the tested specimens. Increasing the amount of fines did not result in significant decreases in aggregate modulus and strength behavior in the case of non-plastic fines. However, for plastic fines, the amount of fines had a drastic effect on aggregate performance. Moreover, small changes in the amount of fines did not affect the resilient modulus behavior significantly, although there were often significant differences in the modulus values when very low and very high, i.e. extreme, fines contents were evaluated. The effect of moisture content on aggregate performance varied significantly depending on the amount and plasticity of fines. For low percentages of non-plastic fines, moisture content did not have a significant effect on aggregate performance, and often aggregate type or angularity was the most important factor. However, for aggregates with plastic fines, moisture becomes the most important factor that governs aggregate behavior. Moisture when combined with plastic fines created the worst effect. To incorporate the most significant findings from these comprehensive laboratory test results, a flow chart based approach will need to be adopted for developing the correction factors for improving the aggregate thickness determination in the revised IDOT SSM. Accordingly, the moisture correction will make a drastic change based on whether the fines are plastic or non-plastic. Similarly, the correction factor for the amount

73
of fines will have to take into account the actual fines content including the fines sticking to larger particles in the case of gravel. When the fines content is low (often below 8%), there was not a significant effect of fines on aggregate strength and deformation behavior except for cases when plastic fines were combined with high moisture. Chapter 6 will present a tentative approach to develop these correction factors for the IDOT SSM aggregate cover thickness recommendations. This proposed approach will need to be verified by constructing the field test sections during phase II of this project, which will ultimately lead to the design and construction of most economical construction platforms in IDOT projects.

74
CHAPTER 6. CONCLUSIONS AND RECOMMENDATIONS FOR DEVELOPING AGGREGATE THICKNESS CORRECTION FACTORS This Illinois Center for Transportation (ICT) R27-1 research project at the University of Illinois aimed at studying the effect of different aggregate properties, i.e., particle shape and angularity, types and amounts of fines, moisture content, and number of traffic loadings, on the behavior of highway construction aggregates commonly used for subgrade replacement and subbase in the state of Illinois. The initial laboratory phase of the study presented in this report considered both plastic and non-plastic fines (passing No. 200 sieve or 0.075 mm) blended in the engineered gradations of three crushed and uncrushed aggregate materials, i.e., limestone, dolomite and uncrushed gravel commonly found in Illinois, at 4%, 8%, 12%, and 16% target fines content. The laboratory tests conducted comprised of standard Proctor moisture-density, Immediate Bearing Value (IBV), imaging based aggregate shape characterization, rapid shear strength, directional resilient modulus, and permanent deformation tests according to a comprehensive experimental test matrix. For non-plastic fines, the IBV behavior with moisture content was erratic at low fines contents. However, as the fines content was increased, the IBV decreased rapidly with increasing moisture content. This trend was observed for all the three types of materials tested (limestone, dolomite, and uncrushed gravel). From the test results, the presence of low amount of non-plastic fines in an aggregate layer may not adversely affect the pavement performance. However, for plastic fines, the IBV values showed rapid decrease with moisture contents even at low fines contents thus indicating increased moisture sensitivity. This means, the specifications may need to be reconsidered for taking into consideration the effect of plasticity of fines. As far as resilient behavior is concerned, crushed aggregates performed better than uncrushed aggregates. However, at very low values of applied confinement through bulk stress, there was not much difference between crushed and uncrushed aggregates. This suggests that limits on the amount of fines can be established primarily depending on the type of crushed or uncrushed aggregate and the weight of construction equipment, i.e. stress state, to be used in the field. The horizontal to vertical modulus ratios determined from directional resilient modulus tests adequately indicated the excessive amount of fines affecting aggregate quality. Directional modulus ratios higher than 1.0 were obtained when the fines occupied all void spaces and governed the behavior of aggregate matrix instead of the aggregate to aggregate contact carrying the load in a good quality aggregate material. The low to high modulus ratio trends were not as significant when compared to the results of Seyhan and Tutumluer (2002) possibly due to the lower standard Proctor achieved densities in the tested specimens. Increasing the amount of fines did not result in significant decreases in aggregate modulus and strength behavior in the case of non-plastic fines. However, for plastic fines, the amount of fines had a drastic effect on aggregate performance. Moreover, small changes in the amount of fines did not affect the resilient modulus behavior significantly, although there were often significant differences in the modulus values when very low and very high, i.e. extreme, fines contents were evaluated. From the permanent deformation tests conducted on crushed and uncrushed aggregate samples, it appears that the most important property at low fines (passing No. 200 sieve size or smaller than 0.075 mm) contents is the aggregate type governing the angularity, i.e. crushed or uncrushed particles. Unless all voids in aggregate matrix are

75
completely filled with fines, particle angularity, i.e. crushed or uncrushed particles, typically governs the permanent deformation behavior. The second most important property that affected aggregate behavior was the plasticity of fines. High amounts of plastic fines, considered here by a plasticity index or PI of 10, at wet of optimum moisture conditions were found to quickly destruct the aggregate load transfer matrix thus resulting in excessive permanent deformations. The effect of moisture content on aggregate performance varied significantly depending on the amount and plasticity of fines. For low percentages of non-plastic fines, moisture content did not have a significant effect on aggregate performance, and often aggregate type or angularity was the most important factor. However, for aggregates with plastic fines, moisture becomes the most important factor that governs aggregate behavior. Moisture when combined with plastic fines created the worst effect. Based on the results of the tests conducted on the limestone, dolomite and gravel materials, a logical framework is presented in this chapter that will enable the development of the aggregate thickness corrections factors. The thickness requirement curve in Figure A-2 of the Illinois Department of Transportation (IDOT) Subgrade Stability Manual (SSM) will be modified/ improved based on the following corrections (C) applied to the original thickness HSSM in accordance with the established effects of aggregate properties and traffic loading:
Hcorrected = HSSM*Cfines*CPI*Cangularity*Cmoisture*Ctraffic Note that the developed correction factors based on the experimental study will need to be verified through constructing and testing full-scale test sections with different aggregate cover options proposed here for the Phase II of this project. This is how the traffic correction factor can be developed and incorporated into the equation for Hcorrected. In addition, the findings from the comprehensive laboratory tests will this way be validated using results from the field sections, which will be essentially needed for developing the final aggregate thickness determination correction factors to be incorporated into the IDOT SSM. 6.1 RECOMMENDED APPROACH FOR DEVELOPING THICKNESS CORRECTION FACTORS From the results presented in Chapters 4 and 5, it is evident that any particular aggregate property affecting the behavior is dependent on the other engineered test matrix variables as well as the testing conditions. For example, the effect of moisture condition on aggregate behavior varies significantly depending on whether the fines present in the aggregate sample are plastic or non-plastic. Similarly, the amount of fines can have different effects on aggregate strength and deformation characteristics depending on whether the aggregate type used, i.e., crushed or uncrushed particles. Therefore, different weighting factors need to be assigned to different test matrix variables based on the aggregate cover material used and the field compaction and construction conditions. In the development of correction factors, a flow chart or decision-tree type approach is the most appropriate to consider the test matrix variables one by one for their impacts on aggregate behavior as evidenced from the laboratory results. Such an approach also enables evaluating several aggregate properties and construction conditions for correcting the aggregate cover thickness designs recommended in the IDOT SSM. The following guidelines present a step by step approach to assign weights to the listed aggregate test matrix variables:

76
1. Determine the type and amount of fines found in the aggregate sample.
2. At low percentages of fines, aggregate angularity plays the most important role.
Therefore, one should assign a high weighting factor (or simply weight hereafter) to the correction factor for aggregate angularity, i.e., crushed or uncrushed or partially crushed, when the fines content is typically less than 6%.
3. If the fines are non-plastic in nature:
a. Assign the highest weight to the correction factor for the amount of fines. b. The amount of non-plastic fines allowed can be higher than that for plastic
fines. From the laboratory study, the limit is suggested to be established around 8% actual fines content (determined by washed gradation).
c. Extreme care should be taken to ensure that the moisture content does not exceed optimum conditions in any case.
d. If the amount of fines in the gradation and moisture content are controlled adequately during construction, both crushed and uncrushed materials will yield acceptable permanent deformation and resilient behavior ensuring adequate shear strength under construction traffic loading.
4. If the fines are plastic in nature (non-zero plasticity index, PI):
a. Assign the highest weight to the correction factor for moisture. b. Change compaction specifications such that the aggregates are compacted
on dry side of optimum. Slight changes in moisture content may lead to drastic decreases in aggregate layer performance.
c. Limit the percent fines allowed to 6% actual fines content (determined by washed gradation). Even a slight increase in fines content may lead to considerably high settlement in the aggregate layer.
d. If the amount of fines in the gradation and the moisture content are controlled adequately during construction, both uncrushed and crushed aggregates should yield acceptable permanent deformation and resilient behavior ensuring adequate shear strength under construction traffic loading.
6.2 DEVELOPMENT OF TENTATIVE CORRECTION FACTORS FROM LABORATORY TESTS This section outlines a systematic decision making approach to determine the aggregate cover thickness requirements for constructing a pavement platform in the field. It should be noted that establishing adequately the correction factors to account for different aggregate property changes is not recommended without field validation of the laboratory results. However, completion of the laboratory test matrix provided a comprehensive set of test data to assess the relative importance of different aggregate properties studied in this research project. Accordingly, aggregate cover thickness “correction factors” have been proposed corresponding to the different aggregate properties and their impacts on aggregate performance. The proposed weights follow in logical order the “Recommended Approach for Developing Thickness Correction Factors” outlined in the previous section.

77
Step 1: Determine the aggregate type (crushed or uncrushed) and amount (low or high) and type of fines (non-plastic or plastic) in the aggregate to be used. The outcome of this assessment can result in any of the following eight combinations:
a. Crushed Aggregate with Low Amount of Non-Plastic Fines b. Crushed Aggregate with Low Amount of Plastic Fines c. Crushed Aggregate with High Amount of Non-Plastic Fines d. Crushed Aggregate with High Amount of Plastic Fines e. Uncrushed Aggregate with Low Amount of Non-Plastic Fines f. Uncrushed Aggregate with Low Amount of Plastic Fines g. Uncrushed Aggregate with High Amount of Non-Plastic Fines h. Uncrushed Aggregate with High Amount of Plastic Fines
Next, each combination will be discussed in detail and the proposed correction factors based on the laboratory findings will be tabulated in detail. Before doing that, the approximate fines contents to define the boundary between low and high amounts of fines are discussed first:
(1) For 100% crushed aggregates, such as limestone and dolomite studied in this research project, a fines content of less than or equal to 8% (≤ 8%) is recommended as LOW fines and fines exceeding 8% (> 8%) is defined as HIGH fines contents.
(2) For uncrushed aggregates, such as the gravel studied, the separation between high fines and low fines is recommended to be around 6% fines. Uncrushed aggregates having a fines content of more than 6% (> 6%) actual fines (from washed sieve analysis) will fall into the HIGH fines category.
As observed from both the strength and modulus tests, type of fines plays a major role in governing the behavior of aggregates at certain fines content. More importantly, the effect of plastic fines was observed to be more severe on uncrushed gravel as compared to crushed aggregates. Therefore, the limit for high and low fines in gravel with plastic fines needs be to set lower than the limits for non-plastic fines. The assumption used was that Figure A-2 of the IDOT SSM was developed for Crushed Aggregates with High Amounts of Plastic Fines at optimum moisture content. This decision was based on the observation from experimental feature IL03-01(personal communication with Greg Heckel, IDOT) that crushed aggregates with high amounts of non-plastic fines, performed better than aggregate cover thickness values recommended by Figure A-2 in IDOT SSM. Therefore, for the fourth of the eight possible combinations (combination d in step one), no correction factor will be assigned for aggregate angularity, amount of fines, or type of fines. The only correction factors proposed will be for moisture content and traffic. a. Crushed Aggregate with Low Amount of Non-Plastic Fines: Since Crushed
Aggregate with High Amount of Plastic Fines was taken as the reference for developing the relative importance or weighting factors (or simply weights), for the first combination (crushed aggregate with low amount of non-plastic fines), a value of 0.8 is recommended for both CFINES and CPI. This is based on the observation from the laboratory test results which indicate that aggregates with low fines contents usually perform much better than those with high fines contents. Similarly, non-plastic fines were found to be much less detrimental to aggregate behavior, as

78
compared to plastic fines. The recommended value for CANG for the first combination is 1.0 (as the reference material is made up of crushed particles too). From the strength and modulus tests, it was observed that for low amounts of non-plastic fines, there was not much difference in the performance of samples tested at dry of optimum and optimum conditions. Therefore, for dry of optimum and optimum moisture contents, the recommended value of CMOISTURE is 1.0. However, for wet of optimum conditions, a correction factor of 1.2 is recommended for use (20% increase in thickness as compared to dry and optimum conditions). The value of CTRAFFIC can only be proposed after studying the behavior of field constructed sections in phase II of the project.
b. Crushed Aggregate with Low Amount of Plastic Fines: At low fines contents,
plasticity of fines was not found to play a significant role in governing the behavior of crushed aggregates. At dry of optimum and optimum conditions, the aggregate behavior is not likely to be significantly different than a similar layer with non-plastic fines. Therefore, for dry of optimum and optimum conditions, the value of CMOISTURE should be 1.0. However, for wet of optimum conditions, a correction factor of 1.25 is recommended for use (25% increase in thickness as compared to drier moisture contents). The CMOISTURE proposed for this case is slightly higher than that for non-plastic fines, as moisture has been found to have a more severe effect on plastic fines when compared to non-plastic fines. At low fines percentages, there is no significant difference between non-plastic and plastic fines, the value of CPI proposed for this configuration is 0.8. Moreover, just like the previous combination, the recommended values for CFINES and CANG are 0.8 and 1.0, respectively.
c. Crushed Aggregate with High Amount of Non-Plastic Fines: High amount of
non-plastic fines can have a deteriorating effect on the behavior of aggregates, especially when there is noticeable loss in particle to particle interlock because of the void filling up with fines. In such a condition, the effect of moisture becomes extremely severe, as high fines with moisture can act as a lubricating material, making the aggregate layer unstable. The recommended value of CFINES for use with this combination is 1.0 (as the reference combination also has high fines content). Dry of optimum and optimum conditions will be similar, and hence a moisture correction factor of 1.0 (CMOISTURE = 1.0) should be used for both. For wet of optimum conditions, the effect of moisture on high amount of fines is much more severe than that for low fines. A correction factor of 1.4 (CMOISTURE = 1.4) is recommended for use in this case. The recommended value for CANG is kept constant at 1.0.
d. Crushed Aggregate with High Amount of Plastic Fines: As already mentioned,
this parametric combination at optimum moisture content, was taken as the reference for determining the relative weighting factors. Therefore, the only correction factors proposed for this combination are CMOISTURE and CTRAFFIC. From the strength, permanent deformation and modulus tests of the aggregates, it was observed that for high amount of plastic fines, the change in moisture, even when going from optimum to dry of optimum conditions, affected aggregate performance significantly. Therefore, for dry of optimum conditions, the suggested value of CMOISTURE is 0.8. Wet of optimum conditions should always be avoided when the aggregate layer contains high percentage of plastic fines. This should be done by providing proper drainage for the water, and also by covering the newly constructed layers. However, in situations where high moisture in the layer cannot be avoided, a correction factor of 1.4 (CMOISTURE = 1.4) is recommended for use (40% increase in

79
thickness as compared to the recommended value for optimum moisture content). This significant increase in recommended thickness is justified, as samples having plastic fines at high moisture contents, often proved to be unstable. As already discussed, the value of CTRAFFIC can only be proposed after studying the behavior of field constructed sections, in phase II of the project.
e. Uncrushed Aggregate with Low Amount of Non-Plastic Fines: At low amounts of
non-plastic fines, particle angularity plays the most important role. As it was assumed that Figure A-2 of the IDOT SSM was developed for crushed aggregates, a correction factor for aggregate angularity needs to be introduced when the layer contains uncrushed aggregates. Therefore, an angularity correction factor of 1.4 (CANG = 1.4) is recommended here to consider the important angularity effect. This was based on the ratio of average angularity index values, as obtained from the UIAIA imaging for aggregate particles. Similar to the case of crushed aggregates (case a), the other correction factors recommended for this combination are: CMOISTURE = 1.0 for dry of optimum and optimum conditions, and CMOISTURE = 1.2 for wet of optimum conditions. Similar to case a, the recommended values of CFINES and CPI are 0.8.
f. Uncrushed Aggregate with Low Amount of Plastic Fines: Similar to case e, the
value of CANG recommended for use is 1.4. Similar to case b, the other correction factors proposed for this combination are: CMOISTURE = 1.0 for dry of optimum and optimum conditions, and CMOISTURE=1.25 for wet of optimum conditions. As in case b, the values of CFINES and CPI should be 0.8 (for low amounts of plastic fines).
g. Uncrushed Aggregate with High Amount of Non-Plastic Fines: Similar to case e,
the value of CANG recommended for use is 1.4. As with case d, the recommended value of CFINES for this combination is also 1.0. For dry of optimum and optimum conditions CMOISTURE = 1.0 should be used. For wet of optimum conditions, CMOISTURE = 1.4 is recommended for use. Similar to other combinations with non-plastic fines, the recommended value of CPI is 0.8.
h. Uncrushed Aggregate with High Amount of Plastic Fines: This is no doubt the
worst combination. High amount of plastic fines can have a very severe effect on the behavior of uncrushed aggregates, especially when introduced with moisture. Ideally, this combination should never be allowed to be used in a project. The combination of uncrushed aggregates with high amounts of plastic fines will not perform adequately in the field no matter what the layer thickness is. However, for cases where this is the only material type available and no other material can be economically substituted, an extremely conservative approach needs to be adopted for constructing the layer. Similar to other cases with uncrushed aggregates, CANG = 1.4 is recommended for use in this case. The values of CFINES and CPI are kept at 1.0 (similar to case d. The value of CMOISTURE should be 1.0 for dry of optimum conditions, 1.2 for optimum conditions, and 1.5 for wet of optimum conditions. Similar to case d, proper drainage must be provided to avoid wet of optimum conditions. High amounts of plastic fines, combined with moisture will make the material extremely unstable, and it will not be able to sustain the loads of construction equipment
Table 6.1 shows a summary of all the correction factors recommended for use with the eight different combinations discussed in this section. It should be noted that

80
these factors are merely suggested as preliminary recommendations based on the laboratory test results and would need to be revised and finalized based on the phase II field validation study. Therefore, these factors (based on the findings from phase I of the project) should not be used yet to determine required aggregate cover thickness values. Apart from the factors listed in Table 6.1, depth of water table is another factor that needs to be considered during the construction of subgrade replacement and subbase layers (Thompson et al., 1977). A poor subgrade material due to shallow ground water table may affect the aggregate cover quality and performance adversely. Such conditions can be accounted for by incorporating CMOISTURE factors (or in other words, assuming that the layer will be subjected to wet of optimum conditions).
Table 6.1. Correction factors recommended for use based on laboratory findings.
Aggregate Type* Correction Factors CFINES CPI CANG CMOISTURE** CTRAFFIC
Crushed Aggregates with Low Amount of Non-Plastic Fines 0.8 0.8 1.0 1.0 (D/O)
1.2 (W)
Will
be
deve
lope
d fro
m F
ield
Tes
ting Crushed Aggregates with Low
Amount of Plastic Fines 0.8 0.8 1.0 1.0 (D/O) 1.25 (W)
Crushed Aggregates with High Amount of Non-Plastic Fines 1.0 0.8 1.0 1.0 (D/O)
1.4 (W)
Crushed Aggregates with High Amount of Plastic Fines 1.0 1.0 1.0
1.0 (D) 1.0 (O) 1.5 (W)
Uncrushed Aggregates with Low Amount of Non-Plastic Fines 0.8 0.8 1.4 1.0 (D/O)
1.2 (W) Uncrushed Aggregates with Low Amount of Plastic Fines 0.8 0.8 1.4 1.0 (D/O)
1.2 (W) Uncrushed Aggregates with High Amount of Non-Plastic Fines 1.0 0.8 1.4 1.0 (D/O)
1.4 (W)
Uncrushed Aggregates with High Amount of Plastic Fines 1.0 1.0 1.4
1.0 (D) 1.2 (O) 1.5 (W)
* For crushed aggregates, amount of fines is defined as: LOW ≤ 8% and HIGH > 8% For uncrushed aggregates, amount of fines is defined as: LOW ≤ 6% and HIGH > 6% ** D: Dry of optimum; O: Optimum; W: Wet of optimum. As a rule of thumb it is suggested that any correction factor combination that results in a total weighting factor (defined as CTOTAL = CFINES x CPI x CANG x CMOISTURE) value greater than or equal to 1.5 (denoting a 50% required increase in cover thickness as compared to IDOT SSM) should not be used. For example, the last parametric combination (case h) can be used only when the moisture content is dry of optimum (CTOTAL = 1.4). It should be noted that CTRAFFIC was not included in CTOTAL at this stage, and will be included after the completion of phase II of this project. 6.3 TENTATIVE WORK PLAN FOR PHASE II STUDY The aggregate thickness correction factors recommended based on the laboratory test results in the previous section will need to be validated by constructing

81
and testing field sections. This is needed for the successful completion of the ICT R27-1 project original scope and the intended development of the corrections/improvements to thickness requirement curve in Figure A-2 of the IDOT SSM in accordance with the established effects of aggregate properties and field traffic loading. Phase I of the project comprised comprehensive laboratory testing of the three common aggregate types used in the state of Illinois, for subgrade replacement and subbase purposes. The laboratory test results were analyzed to establish and recommend tentative correction factors for use with the aggregate cover thickness requirements by IDOT SSM. However, the implementation of these tentative correction factors into the SSM is not possible without studying the field performances of these different aggregate property combinations. Therefore, representative field sections need to be constructed during phase II of this research project to validate the recommended correction factors. The following paragraphs outline a tentative work plan for phase II of this project. The two main components of the proposed work in phase II include: a) Mechanistic evaluation of pavement layer response during construction, and b) Construction and testing of field sections. It should be noted, that the final work plan will be formalized after consultation with the Technical Review Panel (TRP) for phase II of the project. Mechanistic Evaluation of Pavement Layer Response During Construction To adequately design and construct the field sections to be tested during phase II of the project, it is important to properly assess the relative performances of different aggregate property combinations. To some degree, this can be accomplished by conducting mechanistic evaluation of the layer response parameters (stresses and strains experienced by the subgrade and the aggregate cover layer), due to the loads imposed by construction equipment. The research proposed here involves conducting evaluations using the finite element based pavement analysis program ILLI-PAVE, developed at the University of Illinois (Raad and Figueroa, 1980; Thompson and Elliott, 1985). ILLI-PAVE features non-linear, stress dependent resilient modulus material models, and failure criteria for granular materials, and fine-grained soils (Thompson, 1994) that enable it to predict the stresses and strains experienced by pavement layers in the field, with considerable accuracy. The laboratory test results from phase-I will be used to input aggregate cover strength and modulus properties into ILLI-PAVE program for analysis. Separate ILLI-PAVE analyses will be conducted for situations where different aggregates at different property combinations (particle shape, type and amount of fines and moisture content) as tested during phase I of the study are placed on top of subgrades with different strength characteristics. Subgrade strength will be characterized by the CBR value, which in turn, can easily be related to the shear strength and modulus values, by commonly used empirical correlations in Illinois found in the “IDOT Bureau of Local Roads & Streets Flexible Pavement Design Guide” and given by Garcia and Thompson (2003). The primary response parameters to be analyzed from the ILLI-PAVE runs are: subgrade stress ratio (SSR = subgrade deviator stress / unconfined compressive strength Qu) and surface deflection of the aggregate layer. Similar to the procedure adopted to develop the original IDOT cover thickness determination chart, the maximum SSR value allowed will be fixed to 0.75 indicating that the subgrade is subjected to shear stresses as high as 75% of its shear strength (Thompson et al., 1977). The cover layer thickness for different aggregate types will be adjusted such that the SSR value is less than 0.75 and the resilient surface deflections will be computed. Comparison of the

82
thickness values required for different aggregate configurations for different computed values of the subgrade stress and surface deflection values will help evaluate the applicability of the correction factors as proposed. Before constructing the field sections, additional laboratory testing will be performed on aggregate materials used in the test section construction for the chosen aggregate type, fines content, plasticity, and moisture content. One of each of the Atterberg limits, Proctor (with 5 IBV tests), shear strength, directional modulus, and permanent deformation tests will be conducted on the aggregate materials used in each test section. The aggregate properties determined from laboratory testing will then be used to run ILLI-PAVE analyses of the proposed test sections on top of subgrades with certain CBR values. The results will be checked with previous analysis results from the laboratory test matrix to evaluate test section designs and expected performances. 6.4 CONSTRUCTION OF TEST SECTIONS FOR FIELD VALIDATION It is proposed that the field testing during phase II of the project be conducted using the full-scale testing equipment ATLaS at the University of Illinois Advanced Transportation Research and Engineering Laboratory (ATREL) in Rantoul, Illinois. A major advantage of the ATREL location will be to provide a better controlled environment for building similar test sections using the same, consistent construction techniques and procedures. The constructed test section strength and stiffness and quality control can this way be achieved through nuclear gage moisture-density and dynamic cone penetrometer (DCP) test measurements during and after the construction. The DCP test may not adequately verify aggregate layer strength in the field due to high variability of results depending on the orientation of particles beneath cone. Improved monitoring of the performance using moisture, temperature and DCP tests for measuring IBV and LightWeight Deflectometer (LWD) tests for measuring modulus of the constructed aggregate layers will need to be considered in addition to the periodic rut depth measurements to be taken during trafficking of the sections with the ATLaS accelerated loading system. A maximum of 1,000 load repetitions of the standard 9-kip dual wheel assembly would be sufficient for evaluating performances of the constructed aggregate layers. Details of field testing using the ATLaS equipment will be finalized in a project TRP meeting after the completion of phase I of the project. The maximum number of test sections that can be evaluated will be decided based on the given equipment, space, construction, and cost constraints. Approximately 15 test sections in one test strip of 350 ft. in length are likely to be constructed for side by side field performance comparisons of the different aggregate pavement working platforms. Aggregate materials for the field test construction will be obtained from the same quarries/sources used for the laboratory study. . Based on the findings from the laboratory tests, the researchers have come up with a tentative plan on the number of test sections to be constructed, which is presented in the following section. It should be noted that the test sections proposed here are tentative only, and the final test section configurations will be decided after consultation with the project TRP. 6.5 PROPOSED FIELD TEST SECTION CONFIGURATION
The objective of the field testing effort is to study effects of aggregate angularity, type and amount of fines, and moisture content on the strength and repeated load behavior of constructed aggregate layers with different compositions and properties of

83
the gravel, limestone and dolomites studied. The approach is to compare the field performances of different aggregate cover test sections constructed with different laboratory test matrix combinations as delivered from the quarry/gravel pit sources. Therefore, to develop a correction factor for one test variable, it is necessary to compare the field performances of test sections having different values of the same variable. This will require a control section to be constructed following the current IDOT SSM aggregate cover thickness requirements. For example, to study the effect of aggregate angularity on performance, two test sections need to be constructed; the first section (control) with uncrushed gravel and the second with crushed dolomite/limestone constructed at the layer thickness required by Figure A-2 of the IDOT SSM. Effects of any differences in the gradations of two aggregate types (low non-plastic fines) on engineering behavior will have to be studied in the laboratory by conducting tests on samples with similar and engineered gradations. From construction trafficking with ATLaS equipment, the surface profiles will be measured to quantify the amount of rut accumulation with number of passes. The differences in the rut profiles of the two sections will be attributed to the combined effects of differences in gradation and aggregate type, i.e., particle angularity and surface texture. The differences in permanent deformation due to gradation change will be accounted for by normalizing the laboratory test data obtained during the first phase of the project with respect to the test results on the field constructed aggregate materials. As a result, rutting performances of the constructed crushed and uncrushed aggregate test sections will be adequately compared to emphasize the effect of aggregate type or angularity, and the results will be used to validate from field testing the developed correction factor C for aggregate angularity. The approach outlined above will be followed to quantify the effect of the other test variables, i.e., type and amount of fines and moisture conditions, on constructed aggregate layer performance. Note that multiple test sections may need to be constructed for validating effects of other test variables and consider repeatability in testing. Moreover, aggregate performance will be affected differently for low and high fines contents existing in the aggregate gradation and whether the fines are plastic or non-plastic in nature will require construction of special field test sections for validating findings of the comprehensive laboratory test results. Table 6.2 presents a proposed test matrix that indicates the number of full-scale test sections to be constructed in the phase II field validation project. A total of 15 test sections will be needed to adequately quantify the effects of different test matrix variables on aggregate layer performance. The generated field data will be sufficient to validate the established trends from the laboratory tests as well as to fully develop aggregate thickness corrections factors to be applied to the original HSSM thickness requirement from Figure A-2 of the IDOT SSM. To evaluate the effect of moisture, Table 6.2 recommends the construction of test sections, at 110% Wopt. The researchers do realize, that field sections constructed at moisture contents higher than optimum, may not pass quality control tests. However, such sections need to be tested in order to simulate cases of overnight heavy rainfall during construction. The test sections may need to be artificially flooded during load application to maintain moisture content values consistently higher than the optimum moisture content.

84
Table 6.2. Proposed Phase II Field Validation Study Test Matrix
Test Matrix Variable Number of
Test Sections
Comments
Aggregate Angularity 2 Uncrushed and crushed aggregate layers to be constructed at low to intermediate fines
contents (not exceeding 6% to 8%)
Plasticity of Fines 2 Uncrushed aggregate (gravel) layers to be
constructed at low to intermediate fines contents (not exceeding 8%)
Amount of Fines 4 Uncrushed and crushed aggregate layers to
be constructed at low fines (below 6% to 8%) and high fines (above 11%) contents
Moisture relative to optimum (wopt) condition 3 Uncrushed aggregate (gravel) layers to be
constructed at 90% wopt, wopt, and 110% woptCombination of
Moisture and Fines Type
2 Uncrushed aggregate (gravel) layers to be
constructed for plastic fines and non-plastic fines at 110% wopt
Special Considerations 2 Special interest to the project panel
(to be decided) Total: 15

85
REFERENCES Allen, J. (1973). The Effect of Non-constant Lateral Pressures of the Resilient Response
of Granular Materials. Ph.D. Thesis, University of Illinois at Urbana-Champaign, Urbana, IL.
Allen, J.J. and Thompson, M.R. (1974). “Resilient Response of Granular Materials Subjected to Time Dependent Lateral Stresses,” Transportation Research Record 510, Transportation Research Board, Washington, D.C., pp. 1-13.
Barksdale, R. D. (1972). “Laboratory Evaluation of Rutting in Base Course Materials,” Proceedings of the 3rd International Conference on Structural Design of Asphalt Pavements, pp. 161–174.
Barksdale, R.D. (1991). “The Aggregate Handbook,” National Stone Association, Washington, D.C.
Barksdale, R.D. and Itani, S.Y. (1989). “Influence of Aggregate Shape on Base Behavior,” Transportation Research Record 1227, TRB, National Research Council, Washington, D.C., pp. 173-182.
CaterpillarTM Performance Handbook (2004). Edition 35. Caterpillar Inc., Peoria, Illinois, October.
Dawson, A.R., Thom, N.H., and Paute, J.L. (1996). “Mechanical Characteristics of Unbound Granular Materials as a Function of Condition,” Flexible Pavements, Proceedings of European Symposium Euroflex 1993, A.G. Correia, ed., Balkema, Rotterdam, The Netherlands, pp. 35-44.
Dempsey, B.J. (1982). “Laboratory and Field Studies of Channeling and Pumping,” Transportation Research Record 849, Transportation Research Board, Washington D.C.
Elliot, R.P. and Thornton, S.I. (1988). “Resilient Modulus and AASHTO Pavement Design,” Transportation Research Record 1196, Transportation Research Board, Washington D.C., pp. 116-124.
Fleming, P.R., Rogers, C.D.F., and Frost, M.W. (1998). “Performance Parameter and Target Values for Construction of UNITED KINGDOM Road Foundations,” Fifth International Conference on the Bearing Capacity of Roads and Airfields, Trondheim, Norway, 6-8 July.
Frost, M.W., Fleming, P.R., and Rogers, C.D.F. (2001). “Assessment of Performance Specification Approach for Pavement Foundations,” Transportation Research Record 1757, Paper No. 01-2314, Washington, D.C.
Garcia, G. and Thompson, M.R. (2003). “Working Platform Requirements for Pavement Construction,” A white Paper Prepared for the Technical Review Panel, Project IHR-R30, “Upgrade Subgrade Stability Manual”.
Gray, J.E., (1962). “Characteristics of Graded Base Course Aggregates Determined by Triaxial Tests,” Engineering Research Bulletin No. 12, National Crushed Stone Association.
Heckel, G. “Aggregate Subgrade Thickness Determination”, Physical Research Report No. 154, Illinois Department of Transportation, April, 2009 (Publication Pending)
Hicks, R.G. and Monismith, C.L. (1971). “Factors Influencing the Resilient Properties of Granular Materials,” Transportation Research Record 345, TRB, National Research Council, Washington D.C., pp. 15-31.
HMSO, “Design Manual for Road and Bridges,” HD 25/94 Pavement Design and Maintenance – Foundations (DMRB 7.2.2), London, England.
Holtz, R.D. (1990). “Compaction Concepts,” Chapter 3, Guide to Earthwork Compaction, State of the Art Report 8, Transportation Research Board, Washington, D.C.

86
Holubec, I. (1969). “Cyclic Creep of Granular Materials,” Report No. RR147, Department of Highways, Ontario, Canada.
Illinois Department of Transportation – IDOT (1982). “Subgrade Stability Manual,” IDOT Bureau of Materials and Physical Research, Springfield, Illinois, March, 66 pages.
Illinois Department of Transportation – IDOT (2005). “Subgrade Stability Manual”, Bureau of Bridges and Structures, May 1, 2005, 27 pages.
(http://www.dot.il.gov/bridges/pdf/subgrade stability manual.exe) Jorenby, B.N. and Hicks, R.G. (1986). “Base Course Contamination Limits,”
Transportation Research Record 1095, Transportation Research Board, Washington D.C., pp. 86-101.
Kamal, M.A., Dawson, A.R., FaroUnited Kingdomi, O.T., Hughes, D.A.B., and Sha‘at, A.A. (1993). “Field and Laboratory Evaluation of the Mechanical Behavior of Unbound Granular Materials in Pavements,” Transportation Research Record 1406, Transportation Research Board, Washington, D.C., pp. 88-97.
Knutson, R.M. and Thompson, M.R. (1977). “Resilient Response of Railway Ballast,” Transportation Research Record 651, Transportation Research Board, Washington, D.C., pp 31-39.
Lekarp, F., Isacsson, U., and Dawson, A. (2000). “State of the art. I: Resilient Response of Unbound Aggregates,” Journal of Transportation Engineering, ASCE, Vol. 126 No. 1, pp. 66-75.
Pan, T. and Tutumluer, E., (2005). “Imaging Based Evaluation of Coarse Aggregate Size and Shape Properties Affecting Pavement Performance,” ASCE Geotechnical Special Publication No. 130, entitled, Advances In Pavement Engineering, Edited by C.W. Schwartz, E. Tutumluer, and L. Tashman.
Pan, T., Tutumluer, E. and Carpenter, S.H. (2004). “Imaging Based Evaluation of Coarse Aggregate Used in the NCAT Pavement Test Track Asphalt Mixes,” In Proceedings of the 1st International Conference on Design and Construction of Long Lasting Asphalt Pavements, Auburn, Alabama, June 7-10, 2004.
Pan, T., Tutumluer, E., and Carpenter, S.H. (2005). “Effect of Coarse Aggregate Morphology on Resilient Modulus of Hot-Mix Asphalt,” Transportation Research Record 1929, Journal of the Transportation Research Board, National Research Council, Washington, D.C., pp. 1-9.
Raad, L. and Figueroa, J.L. (1980). “Load Response of Transportation Support Systems,” Journal of Transportation Engineering Division, ASCE, Vol. 106, No. TE1, January.
Rao, C. (2001). “Determination of 3-D Image Analysis Techniques to Determine Shape and Size Properties of Coarse Aggregates,” Ph.D. Thesis, University of Illinois at Urbana-Champaign.
Rao, C., Pan, T., and Tutumluer, E. (2003). “Determination of Coarse Aggregate Surface Texture Using Imaging Analysis,” In Proceedings of the 16th ASCE Engineering Mechanics Conference, University of Washington, Seattle, WA.
Rao, C., Tutumluer, E., and Kim, I.T. (2002). “Quantification of Coarse Aggregate Angularity based on Image Analysis,” Transportation Research Record 1787, National Research Council, Washington DC, pp. 17-124.
Rao, C., Tutumluer, E., and Stefanski, J.A. (2001). “Flat and Elongated Ratios and Gradation of Coarse Aggregates Using a New Image Analyzer,” ASTM Journal of Testing and Standard, Vol. 29, No. 5, 2001, 79-89.
Rowshanzamir, M.A. (1995). Resilient Cross-Anisotropic Behavior of Granular Base Materials Under Repetitive Loading. Ph.D. Thesis, University of New South Wales, School of Civil Engineering, Australia.

87
Seyhan, U. (2001). Characterization of Anisotropic Granular Layer Behavior in Flexible Pavements. Ph.D. Thesis, University of Illinois at Urbana-Champaign, Urbana, IL.
Seyhan, U. and Tutumluer, E. (2002). “Anisotropic Modular Ratios As Unbound Aggregate Performance Indicators,” Journal of Materials in Civil Engineering, ASCE, Volume 14, Number 5, September/October, pp. 409-416.
Thom, N.H. (1988). Design of Road Foundations. Ph.D. Thesis, University of Nottingham, Department of Civil Engineering, May, 307 pages.
Thom, N.H. and Brown, S. F. (1987). “Effect of Moisture on the Structural Performance of a Crushed-Limestone Road Base,” Transportation Research Record 1121, Transportation Research Board, Washington, D.C., pp. 50-56.
Thom, N.H., and Brown, S.F. (1988). “The Effect of Grading and Density on the Mechanical Properties of a Crushed Dolomitic Limestone,” Proceedings of the 14th ARRB Conference, Part 7, pp. 94-100.
Thompson, M.R., Kinney, T.C., Traylor, M.L.,Bullard, J.R., and Figueroa, J.L. (1977). “Subgrade Stability”, Final Report, Project IHR-605. Illinois Cooperative Highway and Transportation Research Program, Department of Civil Engineering, University of Illinois at Urbana-Champaign.
Thompson, M.R. and Elliott, R.P. (1985). “ILLI PAVE Based Response Algorithms for Design of Conventional Flexible Pavements,” Transportation Research Record 1043, TRB, National Research Council, Washington, DC, pp. 50-57.
Thompson, M.R. and Robnett, Q.L. (1979). “Resilient Properties of Subgrade Soils,” Transportation Engineering Journal, ASCE, Vol. 105, NO. TE1.
Thompson, M.R. (1994). “ILLI-PAVE Based Thickness Design Concepts and Practices for Surface Treated Pavements,” Proceedings, The Fourth International Conference on the Bearing Capacity of Roads and Airfields, Minneapolis, MN, July, 1994
Tutumluer, E., Thompson, M.R., Garcia, G., and Kwon, J. (2005). “Subgrade Stability and Pavement Foundation Requirements”, Invited Keynote Paper, In Proceedings of the 15th Colombian Symposium of Pavement Engineering, Sponsored by the Pontificia Universidad Javeriana, Bogota, Columbia, March 9-12.
Tutumluer, E. and Seyhan, U. (1998). “Neural Network Modeling of Anisotropic Aggregate Behavior from Repeated Load Triaxial Tests,” Transportation Research Record 1615, Transportation Research Board, Washington, D.C., pp. 86-93.
Tutumluer, E. and Seyhan, U. (2000). “Effects of Fines Content on the Anisotropic Response and Characterization of Unbound Aggregate Bases,” Proceedings of the 5th International on Unbound Aggregates in Roads (UNBAR5), Unbound Aggregates in Road Construction, Edited by A.R. Dawson, A.A. Balkema, University of Nottingham, UNITED KINGDOM, pp. 153-161.
Tutumluer, E., Pan, T., and Carpenter, S.H. (2005). “Investigation of Aggregate Shape Effects on Hot Mix Performance Using An Image Analysis Approach,” Final Technical Report, Pooled Fund Study TPF-5(023), UILU-ENG-2005-2003, Federal Highway Administration IL Division, University of Illinois, Urbana, IL, Feb.
Tutumluer, E., Rao, C., and Stefanski, J.A. (2000). “Video Image Analysis of Aggregates,” Final Project Report, FHWA-IL-UI-278, Civil Engineering Studies UILU-ENG-2000-2015, University of Illinois Urbana-Champaign, Urbana, IL.
van Gurp, C.A.P.M. and van Leest, A.J. (2002). “Thin Asphalt Pavements on Soft Soil,” Proceedings of the 9th International Conference on Asphalt Pavements, International Society for Asphalt Pavements (ISAP), Copenhagen, Denmark, pp. 1-18.
van Niekerk, A.A. (2002). Mechanical Behavior and Performance of Granular Bases and Sub-Bases in Pavements. Ph.D. Thesis, Delft Technological University, Delft, The Netherlands.

88
APPENDICES

A-1
APPENDIX A
SHAPE AND SURFACE TEXTURE INDEX RESULTS FROM IMAGE ANALYSES

A-2
Shape and Surface Texture Properties for Dolomite
0
0.5
1
1.5
2
2.5
3
3.5
4
4.5
5
0 50 100 150 200 250
ST In
dice
s
Particle Number
0
10
20
30
40
50
Perc
enta
ge P
artic
les b
y W
eigh
t (%
)
AI

A-3
Shape and Surface Texture Properties for Gravel
0
0.5
1
1.5
2
2.5
3
3.5
4
4.5
5
0 50 100 150 200 250
ST In
dice
s
Particle Number
0
10
20
30
40
Perc
enta
ge P
artic
les b
y W
eigh
t (%
)
AI

A-4
Shape and Surface Texture Properties for Limestone
0
1
2
3
4
5
6
7
8
9
10
0 50 100 150 200 250
ST In
dice
s
Particle Number
0
10
20
30
Perc
enta
ge P
artic
les b
y W
eigh
t (%
)
AI
Limestone

B-1
APPENDIX B
EFFECT OF FINES CONTENT ON PERMANENT DEFORMATION AT DIFFERENT MOISTURE CONTENTS

B-2
0
0.1
0.2
0.3
0.4
0.5
0.6
0.7
0 200 400 600 800 1000
Perm
anen
t Def
orm
atio
n (m
m)
Number of Cycles
Percent Non-plastic Fines Affecting Permanent Deformation of Dolomite at 90% of Wopt
4% Fines
8% Fines
12% Fines
16% Fines
0
0.1
0.2
0.3
0.4
0.5
0.6
0 200 400 600 800 1000
Perm
anen
t Def
orm
atio
n (m
m)
Number of Cycles
Percent Plastic Fines Affecting Permanent Deformation of Dolomite at 90% of Wopt
4% Fines8% Fines12% Fines16% Fines

B-3
0
0.2
0.4
0.6
0.8
1
1.2
1.4
1.6
0 200 400 600 800 1000
Perm
anen
t Def
orm
atio
n (m
m)
Number of Cycles
Percent Non-plastic Fines Affecting Permanent Deformation of Dolomite at Wopt
4% Fines8% Fines12% Fines16% Fines
0
0.2
0.4
0.6
0.8
1
1.2
1.4
1.6
1.8
0 200 400 600 800 1000
Perm
anen
t Def
orm
atio
n (m
m)
Number of Cycles
Percent Plastic Fines Affecting Permanent Deformation of Dolomite at Wopt
4% Fines
8% Fines
12% Fines
16% Fines

B-4
0
0.1
0.2
0.3
0.4
0.5
0.6
0.7
0.8
0.9
1
0 200 400 600 800 1000
Perm
anen
t Def
orm
atio
n (m
m)
Number of Cycles
Percent Non-plastic Fines Affecting Permanent Deformation of Dolomite at 110% Wopt
4% Fines
8% Fines
12% Fines
16% Fines
0
0.1
0.2
0.3
0.4
0.5
0.6
0.7
0 200 400 600 800 1000
Perm
anen
t Def
orm
atio
n (m
m)
Number of Cycles
Percent Plastic Fines Affecting Permanent Deformation of Dolomite at 110% Wopt
4% Fines8% Fines12% Fines

B-5
0
0.1
0.2
0.3
0.4
0.5
0.6
0 200 400 600 800 1000
Perm
anen
t Def
orm
atio
n (m
m)
Number of Cycles
Percent Non-plastic Fines Affecting Permanent Deformation of Gravel at 90% of Wopt
4% Fines8% Fines12% Fines16% Fines
0
0.1
0.2
0.3
0.4
0.5
0.6
0 200 400 600 800 1000
Perm
anen
t Def
orm
atio
n (m
m)
Number of Cycles
Percent Plastic Fines Affecting Permanent Deformation of Gravel at 90% of Wopt
4% Fines
8% Fines
12% Fines
16% Fines

B-6
0
0.5
1
1.5
2
2.5
3
3.5
4
4.5
0 200 400 600 800 1000
Perm
anen
t Def
orm
atio
n (m
m)
Number of Cycles
Percent Non-plastic Fines Affecting Permanent Deformation of Gravel at Wopt
4% Fines
8% Fines
12% Fines
16% Fines
0
0.1
0.2
0.3
0.4
0.5
0.6
0.7
0.8
0.9
1
0 200 400 600 800 1000
Perm
anen
t Def
orm
atio
n (m
m)
Number of Cycles
Percent Plastic Fines Affecting Permanent Deformation of Gravel at Wopt
4% Fines8% Fines12% Fines16% Fines

B-7
0
0.5
1
1.5
2
2.5
3
0 200 400 600 800 1000
Perm
anen
t Def
orm
atio
n (m
m)
Number of Cycles
Percent Non-plastic Fines Affecting Permanent Deformation of Gravel at 110% of Wopt
4% Fines
8% Fines
12% Fines
16% Fines
0
0.5
1
1.5
2
2.5
3
0 200 400 600 800 1000
Perm
anen
t Def
orm
atio
n (m
m)
Number of Cycles
Percent Plastic Fines Affecting Permanent Deformation of Gravel at 110% of Wopt
4% Fines
8% Fines
12% Fines
16% Fines

B-8
0
0.1
0.2
0.3
0.4
0.5
0.6
0 200 400 600 800 1000
Perm
anen
t Def
orm
atio
n (m
m)
Number of Cycles
Percent Non-plastic Fines Affecting Permanent Deformation of Limestone at 90% of Wopt
4% Fines8% Fines12% Fines16% Fines
0
0.1
0.2
0.3
0.4
0.5
0.6
0 200 400 600 800 1000
Perm
anen
t Def
orm
atio
n (m
m)
Number of Cycles
Percent Plastic Fines Affecting Permanent Deformation of Limestone at 90% of Wopt
4% Fines8% Fines12% Fines16% Fines

B-9
0
0.05
0.1
0.15
0.2
0.25
0.3
0.35
0.4
0.45
0 200 400 600 800 1000
Perm
anen
t Def
orm
atio
n (m
m)
Number of Cycles
Percent Non-plastic Fines Affecting Permanent Deformation of Limestone at Wopt
4% Fines8% Fines12% Fines16% Fines
0
0.1
0.2
0.3
0.4
0.5
0.6
0 200 400 600 800 1000
Perm
anne
nt D
efor
mat
ion
(mm
)
Number of Cycles
Percent Plastic Fines Affecting Permanent Deformation of Limestone at Wopt
8% Fines
12% Fines
16% Fines

B-10
0
0.1
0.2
0.3
0.4
0.5
0.6
0 200 400 600 800 1000
Perm
anen
t Def
orm
atio
n (m
m)
Number of Cycles
Percent Non-plastic Fines Affecting Permanent Deformation of Limestone at 110% of Wopt
4% Fines8% Fines12% Fines16% Fines
0
0.1
0.2
0.3
0.4
0.5
0.6
0 200 400 600 800 1000
Perm
anen
t Def
orm
atio
n (m
m)
Number of Cycles
Percent Plastic Fines Affecting Permanent Deformation of Limestone at 110% of Wopt
4% Fines8% Fines12% Fines16% Fines

C-1
APPENDIX C: RESILIENT MODULUS TEST RESULTS

C-2
0
50
100
150
200
250
300
350
400
0 50 100 150 200 250 300
Res
ilien
t Mod
ulus
(MPa
)
Deviator Stress (kPa)
Resilient Modulus for Dolomite with 4% Non-Plastic Fines @ 90% Wopt
21 kPa
35 kPa
69 kPa
103 kPa
138 kPa
0
50
100
150
200
250
300
350
400
0 50 100 150 200 250 300
Res
ilien
t Mod
ulus
(MPa
)
Deviator Stress (kPa)
Resilient Modulus for Dolomite with 4% Non-Plastic Fines @ Wopt
21 kPa
35 kPa
69 kPa
103 kPa
138 kPa

C-3
0
50
100
150
200
250
300
350
400
0 50 100 150 200 250 300
Res
ilien
t Mod
ulus
(MPa
)
Deviator Stress (kPa)
Resilient Modulus for Dolomite with 4% Non-Plastic Fines @ 110% Wopt
21 kPa
35 kPa
69 kPa
103 kPa
138 kPa
0
50
100
150
200
250
300
350
400
0 50 100 150 200 250 300
Res
ilien
t Mod
ulus
(MPa
)
Deviator Stress (kPa)
Resilient Modulus for Dolomite with 8% Non-Plastic Fines @ 90% Wopt
21 kPa
35 kPa
69 kPa
103 kPa
138 kPa

C-4
0
50
100
150
200
250
300
350
400
0 50 100 150 200 250 300
Res
ilien
t Mod
ulus
(MPa
)
Deviator Stress (kPa)
Resilient Modulus for Dolomite with 8% Non-Plastic Fines @ Wopt
21 kPa
35 kPa
69 kPa
103 kPa
138 kPa
0
50
100
150
200
250
300
350
400
0 50 100 150 200 250 300
Res
ilien
t Mod
ulus
(MPa
)
Deviator Stress (kPa)
Resilient Modulus for Dolomite with 8% Non-Plastic Fines @ 110% Wopt
21 kPa
35 kPa
69 kPa
103 kPa
138 kPa

C-5
0
50
100
150
200
250
300
350
0 50 100 150 200 250 300
Res
ilien
t Mod
ulus
(MPa
)
Deviator Stress (kPa)
Resilient Modulus for Dolomite with 12% Non-Plastic Fines @ 90 % Wopt
21 kPa
35 kPa
69 kPa
103 kPa
138 kPa
0
50
100
150
200
250
300
350
0 50 100 150 200 250 300
Res
ilien
t Mod
ulus
(MPa
)
Deviator Stress (kPa)
Resilient Modulus for Dolomite with 12% Non-Plastic Fines @ Wopt
21 kPa
35 kPa
69 kPa
103 kPa
138 kPa

C-6
0
50
100
150
200
250
300
350
0 50 100 150 200 250 300
Res
ilien
t Mod
ulus
(MPa
)
Deviator Stress (kPa)
Resilient Modulus for Dolomite with 12% Non-Plastic Fines @ 110% Wopt
21 kPa
35 kPa
69 kPa
103 kPa
138 kPa
0
50
100
150
200
250
300
350
0 50 100 150 200 250 300
Res
ilien
t Mod
ulus
(MPa
)
Deviator Stress (kPa)
Resilient Modulus for Dolomite with 16% Non-Plastic Fines @ 90% Wopt
21 kPa
35 kPa
69 kPa
103 kPa
138 kPa

C-7
0
50
100
150
200
250
300
350
0 50 100 150 200 250 300
Res
ilien
t Mod
ulus
(MPa
)
Deviator Stress (kPa)
Resilient Modulus for Dolomite with 16% Non-Plastic Fines @ Wopt
21 kPa
35 kPa
69 kPa
103 kPa
138 kPa
0
50
100
150
200
250
300
350
0 50 100 150 200 250 300
Res
ilien
t Mod
ulus
(MPa
)
Deviator Stress (kPa)
Resilient Modulus for Dolomite with 16% Non-Plastic Fines @ 110% Wopt
21 kPa
35 kPa
69 kPa
103 kPa
138 kPa

C-8
0
50
100
150
200
250
300
350
400
0 50 100 150 200 250 300
Res
ilien
t Mod
ulus
(MPa
)
Deviator Stress (kPa)
Resilient Modulus for Dolomite with 4% Plastic Fines @ 90% Wopt
21 kPa
35 kPa
69 kPa
103 kPa
138 kPa
0
50
100
150
200
250
300
350
400
0 50 100 150 200 250 300
Res
ilien
t Mod
ulus
(MPa
)
Deviator Stress (kPa)
Resilient Modulus for Dolomite with 4% Plastic Fines @ Wopt
21 kPa
35 kPa
69 kPa
103 kPa
138 kPa

C-9
0
50
100
150
200
250
300
350
400
0 50 100 150 200 250 300
Res
ilien
t Mod
ulus
(MPa
)
Deviator Stress (kPa)
Resilient Modulus for Dolomite with 4% Plastic Fines @ 110% Wopt
21 kPa
35 kPa
69 kPa
103 kPa
138 kPa
0
50
100
150
200
250
300
350
0 50 100 150 200 250 300
Res
ilien
t Mod
ulus
(MPa
)
Deviator Stress (kPa)
Resilient Modulus for Dolomite with 8% Plastic Fines @ 90% Wopt
21 kPa
35 kPa
69 kPa
103 kPa
138 kPa

C-10
0
50
100
150
200
250
300
350
0 50 100 150 200 250 300
Res
ilien
t Mod
ulus
(MPa
)
Deviator Stress (kPa)
Resilient Modulus for Dolomite with 8% Plastic Fines @ Wopt
21 kPa
35 kPa
69 kPa
103 kPa
138 kPa
0
50
100
150
200
250
300
350
0 50 100 150 200 250 300
Res
ilien
t Mod
ulus
(MPa
)
Deviator Stress (kPa)
Resilient Modulus for Dolomite with 8% Plastic Fines @ 110% Wopt
21 kPa
35 kPa
69 kPa
103 kPa
138 kPa

C-11
0
50
100
150
200
250
300
350
0 50 100 150 200 250 300
Res
ilien
t Mod
ulus
(MPa
)
Deviator Stress (kPa)
Resilient Modulus for Dolomite with 12% Plastic Fines @ 90% Wopt
21 kPa
35 kPa
69 kPa
103 kPa
138 kPa
0
50
100
150
200
250
300
350
0 50 100 150 200 250 300
Res
ilien
t Mod
ulus
(MPa
)
Deviator Stress (kPa)
Resilient Modulus for Dolomite with 12% Plastic Fines @ 110% Wopt
21 kPa
35 kPa
69 kPa
103 kPa
138 kPa

C-12
0
50
100
150
200
250
300
350
0 50 100 150 200 250 300
Res
ilien
t Mod
ulus
(MPa
)
Deviator Stress (kPa)
Resilient Modulus for Dolomite with 16% Plastic Fines @ 90% Wopt
21 kPa
35 kPa
69 kPa
103 kPa
138 kPa
0
50
100
150
200
250
0 50 100 150 200 250 300
Res
ilien
t Mod
ulus
(MPa
)
Deviator Stress (kPa)
Resilient Modulus for Dolomite with 16% Plastic Fines @ Wopt
21 kPa
35 kPa
69 kPa
103 kPa
138 kPa

C-13
0
50
100
150
200
250
300
0 50 100 150 200 250 300
Res
ilien
t Mod
ulus
(Mpa
)
Deviator Stress (kPa)
Resilient Modulus of Gravel with 4% Non-Plastic Fines @ 90% Wopt
21 kPa35 kPa69 kPa103 KPa138 kPa
0
50
100
150
200
250
300
0 50 100 150 200 250 300
Res
ilien
t Mod
ulus
(Mpa
)
Deviator Stress (kPa)
Resilient Modulus of Gravel with 4% Non-Plastic Fines @ Wopt
21 kPa35 kPa69 kPa103 KPa138 kPa

C-14
0
50
100
150
200
250
300
350
0 50 100 150 200 250 300
Res
ilien
t Mod
ulus
(Mpa
)
Deviator Stress (kPa)
Resilient Modulus of Gravel with 4% Non-Plastic Fines @ 110% Wopt
21 kPa
35 kPa
69 kPa
103 KPa
138 kPa
0
50
100
150
200
250
300
0 50 100 150 200 250 300
Res
ilien
t Mod
ulus
(Mpa
)
Deviator Stress (kPa)
Resilient Modulus of Gravel with 8% Non-Plastic Fines @ 90% Wopt
21 kPa35 kPa69 kPa103 KPa138 kPa

C-15
0
50
100
150
200
250
300
0 50 100 150 200 250 300
Res
ilien
t Mod
ulus
(Mpa
)
Deviator Stress (kPa)
Resilient Modulus of Gravel with 8% Non-Plastic Fines @ Wopt
21 kPa
35 kPa
69 kPa
103 KPa
138 kPa
0
50
100
150
200
250
300
0 50 100 150 200 250 300
Res
ilien
t Mod
ulus
(Mpa
)
Deviator Stress (kPa)
Resilient Modulus of Gravel with 8% Non-Plastic Fines @ 110% Wopt
21 kPa
35 kPa
69 kPa
103 KPa
138 kPa

C-16
0
50
100
150
200
250
300
0 50 100 150 200 250 300
Res
ilien
t Mod
ulus
(Mpa
)
Deviator Stress (kPa)
Resilient Modulus of Gravel with 12% Non-Plastic Fines @ 90% Wopt
21 kPa35 kPa69 kPa103 KPa138 kPa
0
50
100
150
200
250
300
0 50 100 150 200 250 300
Res
ilien
t Mod
ulus
(Mpa
)
Deviator Stress (kPa)
Resilient Modulus of Gravel with 12% Non-Plastic Fines @ Wopt
21 kPa
35 kPa
69 kPa
103 KPa
138 kPa

C-17
0
50
100
150
200
250
0 50 100 150 200 250 300
Res
ilien
t Mod
ulus
(Mpa
)
Deviator Stress (kPa)
Resilient Modulus of Gravel with 12% Non-Plastic Fines @ 110% Wopt
21 kPa
35 kPa
69 kPa
103 KPa
138 kPa
0
50
100
150
200
250
0 50 100 150 200 250 300
Res
ilien
t Mod
ulus
(Mpa
)
Deviator Stress (kPa)
Resilient Modulus of Gravel with 16% Non-Plastic Fines @ 90% Wopt
21 kPa
35 kPa
69 kPa
103 KPa
138 kPa

C-18
0
50
100
150
200
250
300
0 50 100 150 200 250 300
Res
ilien
t Mod
ulus
(Mpa
)
Deviator Stress (kPa)
Resilient Modulus of Gravel with 4% Plastic Fines @ 90% Wopt
21 kPa
35 kPa
69 kPa
103 KPa
138 kPa
0
50
100
150
200
250
300
0 50 100 150 200 250 300
Res
ilien
t Mod
ulus
(Mpa
)
Deviator Stress (kPa)
Resilient Modulus of Gravel with 4% Plastic Fines @ Wopt
21 kPa
35 kPa
69 kPa
103 KPa
138 kPa

C-19
0
50
100
150
200
250
300
0 50 100 150 200 250 300
Res
ilien
t Mod
ulus
(Mpa
)
Deviator Stress (kPa)
Resilient Modulus of Gravel with 4% Plastic Fines @ 110% Wopt
21 kPa
35 kPa
69 kPa
103 KPa
138 kPa
0
50
100
150
200
250
300
0 50 100 150 200 250 300
Res
ilien
t Mod
ulus
(Mpa
)
Deviator Stress (kPa)
Resilient Modulus of Gravel with 8% Plastic Fines @ 90% Wopt
21 kPa
35 kPa
69 kPa
103 KPa
138 kPa

C-20
0
50
100
150
200
250
300
0 50 100 150 200 250 300
Res
ilien
t Mod
ulus
(Mpa
)
Deviator Stress (kPa)
Resilient Modulus of Gravel with 8% Plastic Fines @ Wopt
21 kPa
35 kPa
69 kPa
103 KPa
138 kPa
0
50
100
150
200
250
300
0 50 100 150 200 250 300
Res
ilien
t Mod
ulus
(Mpa
)
Deviator Stress (kPa)
Resilient Modulus of Gravel with 8% Plastic Fines @ 110% Wopt
21 kPa
35 kPa
69 kPa
103 KPa
138 kPa

C-21
0
50
100
150
200
250
300
0 50 100 150 200 250 300
Res
ilien
t Mod
ulus
(Mpa
)
Deviator Stress (kPa)
Resilient Modulus of Gravel with 12% Plastic Fines @ 90% Wopt
21 kPa
35 kPa
69 kPa
103 KPa
138 kPa
0
50
100
150
200
250
0 50 100 150 200 250 300
Res
ilien
t Mod
ulus
(Mpa
)
Deviator Stress (kPa)
Resilient Modulus of Gravel with 12% Plastic Fines @ Wopt
21 kPa
35 kPa
69 kPa
103 KPa
138 kPa

C-22
0
50
100
150
200
250
300
0 50 100 150 200 250 300
Res
ilien
t Mod
ulus
(Mpa
)
Deviator Stress (kPa)
Resilient Modulus of Gravel with 16% Plastic Fines @ 90% Wopt
21 kPa
35 kPa
69 kPa
103 KPa
138 kPa
0
50
100
150
200
250
0 50 100 150 200 250 300
Res
ilien
t Mod
ulus
(Mpa
)
Deviator Stress (kPa)
Resilient Modulus of Gravel with 16% Plastic Fines @ Wopt
21 kPa
35 kPa
69 kPa
103 KPa
138 kPa

C-23
0
50
100
150
200
250
300
350
0 50 100 150 200 250 300
Res
ilien
t Mod
ulus
(Mpa
)
Deviator Stress (kPa)
Resilient Modulus of Limestone with 4% Non-Plastic Fines @ 90% Wopt
21 kPa
35 kPa
69 kPa
103 KPa
138 kPa
0
50
100
150
200
250
300
350
400
0 50 100 150 200 250 300
Res
ilien
t Mod
ulus
(Mpa
)
Deviator Stress (kPa)
Resilient Modulus of Limestone with 4% Non-Plastic Fines @ Wopt
21 kPa
35 kPa
69 kPa
103 KPa
138 kPa

C-24
0
50
100
150
200
250
300
350
0 50 100 150 200 250 300
Res
ilien
t Mod
ulus
(Mpa
)
Deviator Stress (kPa)
Resilient Modulus of Limestone with 4% Non-Plastic Fines @ 110% Wopt
21 kPa35 kPa69 kPa103 KPa138 kPa
0
50
100
150
200
250
300
350
0 50 100 150 200 250 300
Res
ilien
t Mod
ulus
(Mpa
)
Deviator Stress (kPa)
Resilient Modulus of Limestone with 8% Non-Plastic Fines @ 90% Wopt
21 kPa35 kPa69 kPa103 KPa138 kPa

C-25
0
50
100
150
200
250
300
350
400
0 50 100 150 200 250 300
Res
ilien
t Mod
ulus
(Mpa
)
Deviator Stress (kPa)
Resilient Modulus of Limestone with 8% Non-Plastic Fines @ Wopt
21 kPa
35 kPa
69 kPa
103 KPa
138 kPa
0
50
100
150
200
250
300
350
0 50 100 150 200 250 300
Res
ilien
t Mod
ulus
(Mpa
)
Deviator Stress (kPa)
Resilient Modulus of Limestone with 8% Non-Plastic Fines @ 110% Wopt
21 kPa
35 kPa
69 kPa
103 KPa
138 kPa

C-26
0
50
100
150
200
250
300
350
0 50 100 150 200 250 300
Res
ilien
t Mod
ulus
(Mpa
)
Deviator Stress (kPa)
Resilient Modulus of Limestone with 12% Non-Plastic Fines @ 90% Wopt
21 kPa
35 kPa
69 kPa
103 KPa
138 kPa
0
50
100
150
200
250
300
350
400
0 50 100 150 200 250 300
Res
ilien
t Mod
ulus
(Mpa
)
Deviator Stress (kPa)
Resilient Modulus of Limestone with 12% Non-Plastic Fines @ Wopt
21 kPa
35 kPa
69 kPa
103 KPa
138 kPa

C-27
0
50
100
150
200
250
300
350
0 50 100 150 200 250 300
Res
ilien
t Mod
ulus
(Mpa
)
Deviator Stress (kPa)
Resilient Modulus of Limestone with 12% Non-Plastic Fines @ 110% Wopt
21 kPa
35 kPa
69 kPa
103 KPa
138 kPa
0
50
100
150
200
250
300
350
0 50 100 150 200 250 300
Res
ilien
t Mod
ulus
(Mpa
)
Deviator Stress (kPa)
Resilient Modulus of Limestone with 16% Non-Plastic Fines @ 90% Wopt
21 kPa
35 kPa
69 kPa
103 KPa
138 kPa

C-28
0
50
100
150
200
250
300
350
0 50 100 150 200 250 300
Res
ilien
t Mod
ulus
(Mpa
)
Deviator Stress (kPa)
Resilient Modulus of Limestone with 16% Non-Plastic Fines @ Wopt
21 kPa
35 kPa
69 kPa
103 KPa
138 kPa
0
50
100
150
200
250
300
350
0 50 100 150 200 250 300
Res
ilien
t Mod
ulus
(Mpa
)
Deviator Stress (kPa)
Resilient Modulus of Limestone with 16% Non-Plastic Fines @ 110% Wopt
21 kPa35 kPa69 kPa103 KPa138 kPa

C-29
0
50
100
150
200
250
300
350
0 50 100 150 200 250 300
Res
ilien
t Mod
ulus
(MPa
)
Deviator Stress (kPa)
Resilient Modulus for Limestone with 4% Plastic Fines @ 90% Wopt
21 kPa
35 kPa
69 kPa
103 kPa
138 kPa
0
50
100
150
200
250
300
350
0 50 100 150 200 250 300
Res
ilien
t Mod
ulus
(MPa
)
Deviator Stress (kPa)
Resilient Modulus for Limestone with 4% Plastic Fines @ 110% Wopt
21 kPa
35 kPa
69 kPa
103 kPa
138 kPa

C-30
0
50
100
150
200
250
300
350
0 50 100 150 200 250 300
Res
ilien
t Mod
ulus
(MPa
)
Deviator Stress (kPa)
Resilient Modulus for Limestone with 8% Plastic Fines @ 90% Wopt
21 kPa
35 kPa
69 kPa
103 kPa
138 kPa
0
50
100
150
200
250
300
350
400
0 50 100 150 200 250 300
Res
ilien
t Mod
ulus
(MPa
)
Deviator Stress (kPa)
Resilient Modulus for Limestone with 8% Plastic Fines @ Wopt
21 kPa
35 kPa
69 kPa
103 kPa
138 kPa

C-31
0
50
100
150
200
250
300
350
0 50 100 150 200 250 300
Res
ilien
t Mod
ulus
(MPa
)
Deviator Stress (kPa)
Resilient Modulus for Limestone with 8% Plastic Fines @ 110% Wopt
21 kPa
35 kPa
69 kPa
103 kPa
138 kPa
0
50
100
150
200
250
300
350
0 50 100 150 200 250 300
Res
ilien
t Mod
ulus
(MPa
)
Deviator Stress (kPa)
Resilient Modulus for Limestone with 12% Plastic Fines @ 90% Wopt
21 kPa
35 kPa
69 kPa
103 kPa
138 kPa

C-32
0
50
100
150
200
250
300
0 50 100 150 200 250 300
Res
ilien
t Mod
ulus
(MPa
)
Deviator Stress (kPa)
Resilient Modulus for Limestone with 12% Plastic Fines @ Wopt
21 kPa
35 kPa
69 kPa
103 kPa
138 kPa
0
50
100
150
200
250
300
350
0 50 100 150 200 250 300
Res
ilien
t Mod
ulus
(MPa
)
Deviator Stress (kPa)
Resilient Modulus for Limestone with 12% Plastic Fines @ 110% Wopt
21 kPa
35 kPa
69 kPa
103 kPa
138 kPa

C-33
0
50
100
150
200
250
300
0 50 100 150 200 250 300
Res
ilien
t Mod
ulus
(MPa
)
Deviator Stress (kPa)
Resilient Modulus for Limestone with 16% Plastic Fines @ 90% Wopt
21 kPa
35 kPa
69 kPa
103 kPa
138 kPa
0
50
100
150
200
250
300
350
0 50 100 150 200 250 300
Res
ilien
t Mod
ulus
(MPa
)
Deviator Stress (kPa)
Resilient Modulus for Limestone with 16% Plastic Fines @ Wopt
21 kPa
35 kPa
69 kPa
103 kPa
138 kPa

C-34
0
50
100
150
200
250
300
350
0 50 100 150 200 250 300
Res
ilien
t Mod
ulus
(MPa
)
Deviator Stress (kPa)
Resilient Modulus for Limestone with 16% Plastic Fines @ 110% Wopt
21 kPa
35 kPa
69 kPa
103 kPa
138 kPa

D-1
APPENDIX D: SHEAR STRENGTH BEHAVIOR FROM UIUC RAPID SHEAR STRENGTH TESTS

D-2
0
10
20
30
40
50
60
70
80
0 10 20 30 40 50
Deviator S
tress (psi)
Axial Strain (%)
Dolomite with 4% Non‐Plastic Fines at 90% Wopt
5 psi Confining
10 psi Confining
15 psi Confining
0
10
20
30
40
50
60
70
80
90
100
0 10 20 30 40 50
Deviator S
tress (psi)
Axial Strain (%)
Dolomite with 8% Non‐Plastic Fines at 90% Wopt
5 psi Confining
10 psi Confining
15 psi Confining

D-3
0
20
40
60
80
100
120
140
0 10 20 30 40 50
Deviator S
tress (psi)
Axial Strain (%)
Dolomite with 12% Non‐Plastic Fines at 90% Wopt
5 psi Confining
10 psi Confining
15 psi Confining
0
20
40
60
80
100
120
140
0 10 20 30 40 50
Deviator S
tress (psi)
Axial Strain (%)
Dolomite with 16% Non‐Plastic Fines at 90% Wopt
5 psi Confining
10 psi Confining
15 psi Confining

D-4
0
20
40
60
80
100
120
0 10 20 30 40 50
Deviator S
tress (psi)
Axial Strain (%)
Dolomite with 4% Plastic Fines at 90% Wopt
5 psi Confining
10 psi Confining
15 psi Confining
0
20
40
60
80
100
120
0 10 20 30 40 50
Deviator S
tress (psi)
Axial Strain (%)
Dolomite with 8% Plastic Fines at 90% Wopt
5 psi Confining
10 psi Confining
15 psi Confining

D-5
0
10
20
30
40
50
60
70
80
90
100
0 10 20 30 40 50
Deviator S
tress (psi)
Axial Strain (%)
Dolomite with 12% Plastic Fines at 90% Wopt
5 psi Confining
10 psi Confining
15 psi Confining
0
10
20
30
40
50
60
70
80
90
0 10 20 30 40 50
Deviator S
tress (psi)
Axial Strain (%)
Dolomite with 16% Plastic Fines at 90% Wopt
5 psi Confining
10 psi Confining
15 psi Confining

D-6
0
10
20
30
40
50
60
70
80
90
100
0 10 20 30 40 50
Deviator S
tress (psi)
Axial Strain (%)
Dolomite with 4% Non‐Plastic Fines at 100% Wopt
5 psi Confining
10 psi Confining
15 psi Confining
0
20
40
60
80
100
120
0 10 20 30 40 50
Deviator S
tress (psi)
Axial Strain (%)
Dolomite with 8% Non‐Plastic Fines at 100% Wopt
5 psi Confining
10 psi Confining
15 psi Confining

D-7
0
20
40
60
80
100
120
0 10 20 30 40 50
Deviator S
tress (psi)
Axial Strain (%)
Dolomite with 12% Non‐Plastic Fines at 100% Wopt
5 psi Confining
10 psi Confining
15 psi Confining
0
20
40
60
80
100
120
140
0 10 20 30 40 50
Deviator S
tress (psi)
Axial Strain (%)
Dolomite with 16% Non‐Plastic Fines at 100% Wopt
5 psi Confining
10 psi Confining
15 psi Confining

D-8
0
10
20
30
40
50
60
70
80
90
100
0 10 20 30 40 50
Deviator S
tress (psi)
Axial Strain (%)
Dolomite with 4% Plastic Fines at 100% Wopt
5 psi Confining
10 psi Confining
15 psi Confining
0
10
20
30
40
50
60
70
80
0 10 20 30 40 50
Deviator S
tress (psi)
Axial Strain (%)
Dolomite with 8% Plastic Fines at 100% Wopt
5 psi Confining
10 psi Confining
15 psi Confining

D-9
0
10
20
30
40
50
60
0 10 20 30 40 50
Deviator S
tress (psi)
Axial Strain (%)
Dolomite with 12% Plastic Fines at 100% Wopt
5 psi Confining
10 psi Confining
15 psi Confining
0
10
20
30
40
50
60
70
0 10 20 30 40 50
Deviator S
tress (psi)
Axial Strain (%)
Dolomite with 16% Plastic Fines at 100% Wopt
5 psi Confining
10 psi Confining
15 psi Confining

D-10
0
10
20
30
40
50
60
70
80
90
100
0 10 20 30 40 50
Deviator S
tress (psi)
Axial Strain (%)
Dolomite with 4% Non‐Plastic Fines at 110% Wopt
5 psi Confining
10 psi Confining
15 psi Confining
0
20
40
60
80
100
120
0 10 20 30 40 50
Deviator S
tress (psi)
Axial Strain (%)
Dolomite with 8% Non‐Plastic Fines at 110% Wopt
5 psi Confining
10 psi Confining
15 psi Confining

D-11
0
20
40
60
80
100
120
0 10 20 30 40 50
Deviator S
tress (psi)
Axial Strain (%)
Dolomite with 12% Non‐Plastic Fines at 110% Wopt
5 psi Confining
10 psi Confining
15 psi Confining
0
10
20
30
40
50
60
70
80
90
0 10 20 30 40 50
Deviator S
tress (psi)
Axial Strain (%)
Dolomite with 16% Non‐Plastic Fines at 110% Wopt
5 psi Confining
10 psi Confining
15 psi Confining

D-12
0
20
40
60
80
100
120
0 10 20 30 40 50
Deviator S
tress (psi)
Axial Strain (%)
Dolomite with 4% Non‐Plastic Fines at 110% Wopt
5 psi Confining
10 psi Confining
15 psi Confining
0
20
40
60
80
100
120
0 10 20 30 40 50
Deviator S
tress (psi)
Axial Strain (%)
Dolomite with 8% Plastic Fines at 110% Wopt
5 psi Confining
10 psi Confining
15 psi Confining

D-13
0
10
20
30
40
50
60
70
80
90
100
0 10 20 30 40 50
Deviator S
tress (psi)
Axial Strain (%)
Dolomite with 12% Plastic Fines at 110% Wopt
5 psi Confining
10 psi Confining
15 psi Confining
0
10
20
30
40
50
60
70
80
90
100
0 10 20 30 40 50
Deviator S
tress (psi)
Axial Strain (%)
Dolomite with 16% Plastic Fines at 110% Wopt
5 psi Confining
10 psi Confining
15 psi Confining

D-14
0
10
20
30
40
50
60
0 10 20 30 40 50
Deviator S
tress (psi)
Axial Strain (%)
Gravel with 4% Non‐Plastic Fines at 90% Wopt
5 psi Confining
10 psi Confining
15 psi Confining
0
10
20
30
40
50
60
70
0 10 20 30 40 50
Deviator S
tress (psi)
Axial Strain (%)
Gravel with 8% Non‐Plastic Fines at 90% Wopt
5 psi Confining
10 psi Confining
15 psi Confining

D-15
0
10
20
30
40
50
60
70
0 10 20 30 40 50
Deviator S
tress (psi)
Axial Strain (%)
Gravel with 12% Non‐Plastic Fines at 90% Wopt
5 psi Confining
10 psi Confining
15 psi Confining
0
5
10
15
20
25
30
35
40
45
50
0 10 20 30 40 50
Deviator S
tress (psi)
Axial Strain (%)
Gravel with 16% Non‐Plastic Fines at 90% Wopt
5 psi Confining
10 psi Confining
15 psi Confining

D-16
0
10
20
30
40
50
60
70
80
90
100
0 10 20 30 40 50
Deviator S
tress (psi)
Axial Strain (%)
Gravel with 4% Plastic Fines at 90% Wopt
5 psi Confining
10 psi Confining
15 psi Confining
0
10
20
30
40
50
60
0 10 20 30 40 50
Deviator S
tress (psi)
Axial Strain (%)
Gravel with 8% Plastic Fines at 90% Wopt
5 psi Confining
10 psi Confining
15 psi Confining

D-17
0
20
40
60
80
100
120
0 10 20 30 40 50
Deviator S
tress (psi)
Axial Strain (%)
Gravel with 12% Plastic Fines at 90% Wopt
5 psi Confining
10 psi Confining
15 psi Confining
0
10
20
30
40
50
60
70
80
90
100
0 10 20 30 40 50
Deviator S
tress (psi)
Axial Strain (%)
Gravel with 16% Plastic Fines at 90% Wopt
5 psi Confining
10 psi Confining
15 psi Confining

D-18
0
10
20
30
40
50
60
70
0 10 20 30 40 50
Deviator S
tress (psi)
Axial Strain (%)
Gravel with 4% Non‐Plastic Fines at 100% Wopt
5 psi Confining
10 psi Confining
15 psi Confining
0
10
20
30
40
50
60
0 10 20 30 40 50
Deviator S
tress (psi)
Axial Strain (%)
Gravel with 8% Non‐Plastic Fines at 100% Wopt
5 psi Confining
10 psi Confining
15 psi Confining

D-19
0
10
20
30
40
50
60
70
80
0 10 20 30 40 50
Deviator S
tress (psi)
Axial Strain (%)
Gravel with 12% Non‐Plastic Fines at 100% Wopt
5 psi Confining
10 psi Confining
15 psi Confining
0
10
20
30
40
50
60
70
80
90
0 10 20 30 40 50
Deviator S
tress (psi)
Axial Strain (%)
Gravel with 16% Non‐Plastic Fines at 100% Wopt
5 psi Confining
10 psi Confining
15 psi Confining
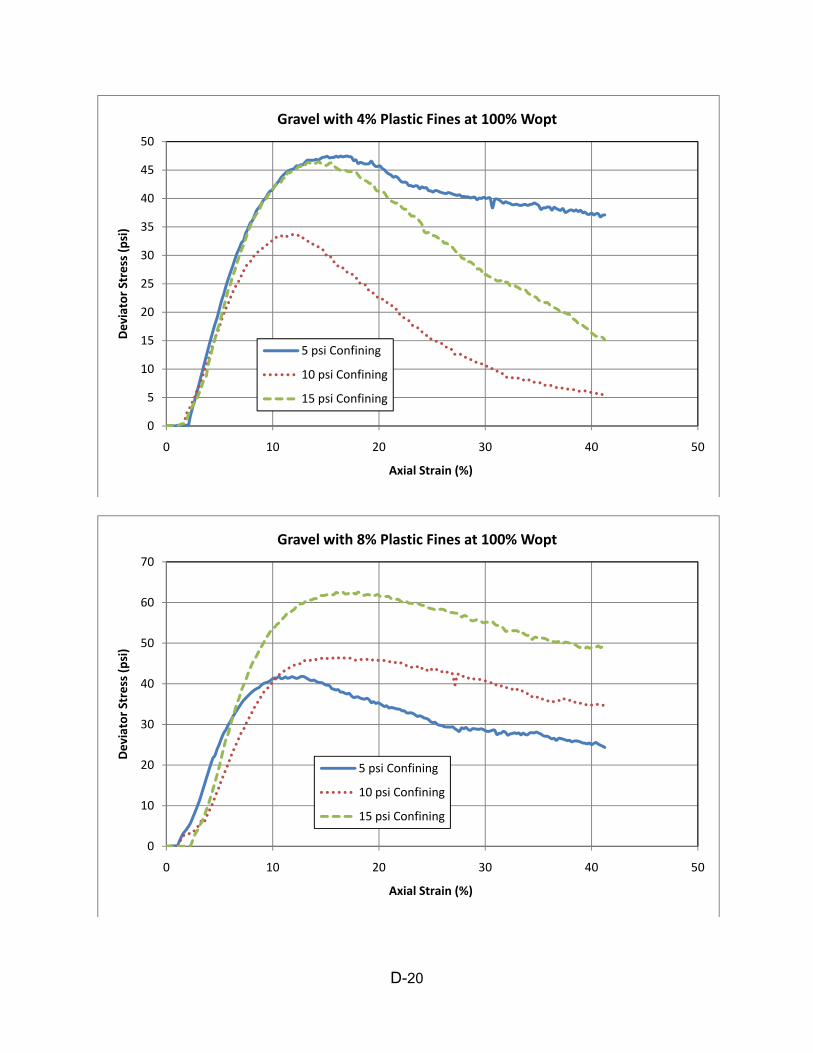
D-20
0
5
10
15
20
25
30
35
40
45
50
0 10 20 30 40 50
Deviator S
tress (psi)
Axial Strain (%)
Gravel with 4% Plastic Fines at 100% Wopt
5 psi Confining
10 psi Confining
15 psi Confining
0
10
20
30
40
50
60
70
0 10 20 30 40 50
Deviator S
tress (psi)
Axial Strain (%)
Gravel with 8% Plastic Fines at 100% Wopt
5 psi Confining
10 psi Confining
15 psi Confining

D-21
0
10
20
30
40
50
60
0 10 20 30 40 50
Deviator S
tress (psi)
Axial Strain (%)
Gravel with 12% Plastic Fines at 100% Wopt
5 psi Confining
10 psi Confining
15 psi Confining
0
10
20
30
40
50
60
70
0 10 20 30 40 50
Deviator S
tress (psi)
Axial Strain (%)
Gravel with 16% Plastic Fines at 100% Wopt
5 psi Confining
10 psi Confining
15 psi Confining

D-22
0
10
20
30
40
50
60
0 10 20 30 40 50
Deviator S
tress (psi)
Axial Strain (%)
Gravel with 4% Non‐Plastic Fines at 110% Wopt
5 psi Confining
10 psi Confining
15 psi Confining
0
10
20
30
40
50
60
70
80
90
0 10 20 30 40 50
Deviator S
tress (psi)
Axial Strain (%)
Gravel with 8% Non‐Plastic Fines at 110% Wopt
5 psi Confining
10 psi Confining
15 psi Confining

D-23
0
10
20
30
40
50
60
70
0 10 20 30 40 50
Deviator S
tress (psi)
Axial Strain (%)
Gravel with 12% Non‐Plastic Fines at 110% Wopt
5 psi Confining
10 psi Confining
15 psi Confining
0
10
20
30
40
50
60
0 10 20 30 40 50
Deviator S
tress (psi)
Axial Strain (%)
Gravel with 16% Non‐Plastic Fines at 110% Wopt
5 psi Confining
10 psi Confining
15 psi Confining

D-24
0
10
20
30
40
50
60
70
80
0 10 20 30 40 50
Deviator S
tress (psi)
Axial Strain (%)
Gravel with 4% Plastic Fines at 110% Wopt
5 psi Confining
10 psi Confining
15 psi Confining
0
10
20
30
40
50
60
0 10 20 30 40 50
Deviator S
tress (psi)
Axial Strain (%)
Gravel with 8% Plastic Fines at 110% Wopt
5 psi Confining
10 psi Confining
15 psi Confining

D-25
0
5
10
15
20
25
30
35
40
45
50
0 10 20 30 40 50
Deviator S
tress (psi)
Axial Strain (%)
Gravel with 12% Plastic Fines at 110% Wopt
5 psi Confining
10 psi Confining
15 psi Confining
0
5
10
15
20
25
30
35
40
45
0 10 20 30 40 50
Deviator S
tress (psi)
Axial Strain (%)
Gravel with 16% Plastic Fines at 110% Wopt
5 psi Confining
10 psi Confining
15 psi Confining

D-26
0
10
20
30
40
50
60
70
80
90
0 10 20 30 40 50
Deviator S
tress (psi)
Axial Strain (%)
Limestone with 4% Non‐Plastic Fines at 90% Wopt
5 psi Confining
10 psi Confining
15 psi Confining
0
10
20
30
40
50
60
70
80
90
0 10 20 30 40 50
Deviator S
tress (psi)
Axial Strain (%)
Limestone with 8% Non‐Plastic Fines at 90% Wopt
5 psi Confining
10 psi Confining
15 psi Confining

D-27
0
10
20
30
40
50
60
70
80
90
100
0 10 20 30 40 50
Deviator S
tress (psi)
Axial Strain (%)
Limestone with 12% Non‐Plastic Fines at 90% Wopt
5 psi Confining
10 psi Confining
15 psi Confining
0
20
40
60
80
100
120
0 10 20 30 40 50
Deviator S
tress (psi)
Axial Strain (%)
Limestone with 16% Non‐Plastic Fines at 90% Wopt
5 psi Confining
10 psi Confining
15 psi Confining

D-28
0
10
20
30
40
50
60
70
80
90
0 10 20 30 40 50
Deviator S
tress (psi)
Axial Strain (%)
Limestone with 4% Plastic Fines at 90% Wopt
5 psi Confining
10 psi Confining
15 psi Confining
0
10
20
30
40
50
60
70
80
90
100
0 10 20 30 40 50
Deviator S
tress (psi)
Axial Strain (%)
Limestone with 8% Plastic Fines at 90% Wopt
5 psi Confining
10 psi Confining
15 psi Confining

D-29
0
10
20
30
40
50
60
70
80
0 10 20 30 40 50
Deviator S
tress (psi)
Axial Strain (%)
Limestone with 12% Plastic Fines at 90% Wopt
5 psi Confining
10 psi Confining
15 psi Confining
0
20
40
60
80
100
120
140
0 10 20 30 40 50
Deviator S
tress (psi)
Axial Strain (%)
Limestone with 16% Plastic Fines at 90% Wopt
5 psi Confining
10 psi Confining
15 psi Confining

D-30
0
10
20
30
40
50
60
70
80
90
100
0 10 20 30 40 50
Deviator S
tress (psi)
Axial Strain (%)
Limestone with 4% Non‐Plastic Fines at 100% Wopt
5 psi Confining
10 psi Confining
15 psi Confining
0
10
20
30
40
50
60
70
80
90
100
0 10 20 30 40 50
Deviator S
tress (psi)
Axial Strain (%)
Limestone with 8% Non‐Plastic Fines at 100% Wopt
5 psi Confining
10 psi Confining
15 psi Confining

D-31
0
10
20
30
40
50
60
70
80
90
100
0 10 20 30 40 50
Deviator S
tress (psi)
Axial Strain (%)
Limestone with 12% Non‐Plastic Fines at 100% Wopt
5 psi Confining
10 psi Confining
15 psi Confining
0
10
20
30
40
50
60
70
80
90
100
0 10 20 30 40 50
Deviator S
tress (psi)
Axial Strain (%)
Limestone with 16% Non‐Plastic Fines at 100% Wopt
5 psi Confining
10 psi Confining
15 psi Confining

D-32
0
20
40
60
80
100
120
0 10 20 30 40 50
Deviator S
tress (psi)
Axial Strain (%)
Limestone with 4% Plastic Fines at 100% Wopt
5 psi Confining
10 psi Confining
15 psi Confining
0
10
20
30
40
50
60
70
80
90
100
0 10 20 30 40 50
Deviator S
tress (psi)
Axial Strain (%)
Limestone with 8% Plastic Fines at 100% Wopt
5 psi Confining
10 psi Confining
15 psi Confining

D-33
0
10
20
30
40
50
60
70
80
90
100
0 10 20 30 40 50
Deviator S
tress (psi)
Axial Strain (%)
Limestone with 12% Plastic Fines at 100% Wopt
5 psi Confining
10 psi Confining
15 psi Confining
0
10
20
30
40
50
60
70
80
0 10 20 30 40 50
Deviator S
tress (psi)
Axial Strain (%)
Limestone with 16% Plastic Fines at 100% Wopt
5 psi Confining
10 psi Confining
15 psi Confining

D-34
0
10
20
30
40
50
60
70
80
90
100
0 10 20 30 40 50
Deviator S
tress (psi)
Axial Strain (%)
Limestone with 4% Non‐Plastic Fines at 110% Wopt
5 psi Confining
10 psi Confining
15 psi Confining
0
10
20
30
40
50
60
70
80
90
100
0 10 20 30 40 50
Deviator S
tress (psi)
Axial Strain (%)
Limestone with 8% Non‐Plastic Fines at 110% Wopt
5 psi Confining
10 psi Confining
15 psi Confining

D-35
0
10
20
30
40
50
60
70
80
90
0 10 20 30 40 50
Deviator S
tress (psi)
Axial Strain (%)
Limestone with 12% Non‐Plastic Fines at 110% Wopt
5 psi Confining
10 psi Confining
15 psi Confining
0
10
20
30
40
50
60
70
0 10 20 30 40 50
Deviator S
tress (psi)
Axial Strain (%)
Limestone with 16% Non‐Plastic Fines at 110% Wop
5 psi Confining
10 psi Confining
15 psi Confining

D-36
0
10
20
30
40
50
60
70
80
90
100
0 10 20 30 40 50
Deviator S
tress (psi)
Axial Strain (%)
Limestone with 4% Plastic Fines at 110% Wopt
5 psi Confining
10 psi Confining
15 psi Confining
0
10
20
30
40
50
60
70
80
90
0 10 20 30 40 50
Deviator S
tress (psi)
Axial Strain (%)
Limestone with 8% Plastic Fines at 110% Wopt
5 psi Confining
10 psi Confining
15 psi Confining

D-37
0
10
20
30
40
50
60
70
80
90
0 10 20 30 40 50
Deviator S
tress (psi)
Axial Strain (%)
Limestone with 12% Plastic Fines at 110% Wopt
5 psi Confining
10 psi Confining
15 psi Confining
0
10
20
30
40
50
60
70
0 10 20 30 40 50
Deviator S
tress (psi)
Axial Strain (%)
Limestone with 16% Plastic Fines at 110% Wopt
5 psi Confining
10 psi Confining
15 psi Confining