Automatic Morphological Categorisation of Carbon Black Nano-aggregates
9
Automatic Morphological Categorisation of Carbon Black Nano-aggregates Juan L´ opez-de-Uralde † , Iraide Ruiz † , Igor Santos † , Agust´ ın Zubillaga † , Pablo G. Bringas † , Ana Okariz ‡ , and Teresa Guraya ‡ † S 3 Lab, University of Deusto, Bilbao, Spain {jlopezdeuralde,iraide.ruiz,isantos}@deusto.es {agustin.zubillaga,pablo.garcia.bringas}@deusto.es ‡ Universidad del Pa´ ıs Vasco UPV/EHU Bilbao, Spain {ana.okariz,teresa.guraya}@ehu.es Abstract. Nano-technology is the study of matter behaviour on atomic and molecular scale (i.e. nano-scale). In particular, carbon black is a nano-material generally used for the reinforcement of rubber compounds. Nevertheless, the exact reason behind its success in this concrete domain remains unknown. Characterisation of rubber nano-aggregates aims to answer this question. The morphology of the nano-aggregate takes an important part in the final result of the compound. Several approaches have been taken to classify them. In this paper we propose the first automatic machine-learning-based nano-aggregate morphology categori- sation system. This method extracts several geometric features in order to train machine-learning classifiers, forming a constellation of expert knowledge that enables us to foresee the exact morphology of a nano- aggregate. Furthermore, we compare the obtained results and show that Decision Trees outperform the rest of the counterparts for morphology categorisation. Key words: aggregate morphology classifying, image processing, machine- learning, carbon black 1 Introduction Matter behaviour on nano-scale is subject to quantum mechanics where mi- croscopic and macroscopic theories are no longer applicable [1]. On this scale, nano-technology is the science that studies the comportment of the matter. This science has experienced a great development in the last years. In fact, they are considered to be the basis for the next industrial revolution since they have been applied to different areas such as energy, health care, chemical industry and material production [2]. Therefore, these processes are leading material manu- facturers to a new generation of nano-material based products [2]. In the particular case of rubber compounds, reinforced materials with nano- particles, such as carbon black, are of great interest to the material industry.
-
Upload
independent -
Category
Documents
-
view
4 -
download
0
Transcript of Automatic Morphological Categorisation of Carbon Black Nano-aggregates

Automatic Morphological Categorisation ofCarbon Black Nano-aggregates
Juan Lopez-de-Uralde†, Iraide Ruiz†, Igor Santos†, Agustın Zubillaga†,Pablo G. Bringas†, Ana Okariz‡, and Teresa Guraya‡
†S3Lab, University of Deusto, Bilbao, Spain{jlopezdeuralde,iraide.ruiz,isantos}@deusto.es
{agustin.zubillaga,pablo.garcia.bringas}@deusto.es
‡Universidad del Paıs Vasco UPV/EHUBilbao, Spain
{ana.okariz,teresa.guraya}@ehu.es
Abstract. Nano-technology is the study of matter behaviour on atomicand molecular scale (i.e. nano-scale). In particular, carbon black is anano-material generally used for the reinforcement of rubber compounds.Nevertheless, the exact reason behind its success in this concrete domainremains unknown. Characterisation of rubber nano-aggregates aims toanswer this question. The morphology of the nano-aggregate takes animportant part in the final result of the compound. Several approacheshave been taken to classify them. In this paper we propose the firstautomatic machine-learning-based nano-aggregate morphology categori-sation system. This method extracts several geometric features in orderto train machine-learning classifiers, forming a constellation of expertknowledge that enables us to foresee the exact morphology of a nano-aggregate. Furthermore, we compare the obtained results and show thatDecision Trees outperform the rest of the counterparts for morphologycategorisation.
Key words: aggregate morphology classifying, image processing, machine-learning, carbon black
1 Introduction
Matter behaviour on nano-scale is subject to quantum mechanics where mi-croscopic and macroscopic theories are no longer applicable [1]. On this scale,nano-technology is the science that studies the comportment of the matter. Thisscience has experienced a great development in the last years. In fact, they areconsidered to be the basis for the next industrial revolution since they have beenapplied to different areas such as energy, health care, chemical industry andmaterial production [2]. Therefore, these processes are leading material manu-facturers to a new generation of nano-material based products [2].
In the particular case of rubber compounds, reinforced materials with nano-particles, such as carbon black, are of great interest to the material industry.
Concretely, the latter modifies the mechanical and electrical properties of theformer [3]. Although this process has been used in industrial production of rubberreinforced with carbon black [4] for the last years, the internal mechanisms thatmake that happen are not completely known.
In this way, there have been several studies about the morphology and micro-structure of carbonaceous particles, such as the ones produced by diesel combus-tion [5]. This engine-emitted particles were studied with the purpose of assessingtheir climate impact. Likewise, the waste-water treatment includes similar stepsto the ones needed for carbon black characterization: microscopic image process-ing, object segmentation, morphological characterisation and fractal analysis [6].Similarly, with CAT (Computerized Axial Tomography) scans the same proce-dure has been applied to evaluate the rank of a tumour [7]. Still, these methodsare performed in a semi-automatic or manual way with the consequent time andresource consumption.
Against this background, we present the first automatic machine-learning-based nano-aggregate morphology categorisation method. This method, basedupon geometrical and fractal features is able to train several machine-learningalgorithms in order to correctly determine the morphology of these aggregates.Specifically, we contribute to the state of the art in two main ways. Firstly, itconsists in automatically segmenting and characterising the carbon black aggre-gates within an image. This technique makes the geometrical characterisation ofcarbon black and other nano-particles easy and fast. Secondly, a machine learn-ing based classifier sorts carbon black aggregates according to their morphology.
2 Carbon Black
As we mentioned before, one of the principal carbon black applications is thereinforcement of rubber. This process creates a material with notably increasedtensile strength and better tear and abrasion resistance (i.e. the capacity of amaterial to withstand different forces). These changes are conditioned by molec-ular, chemical and rheological attributes of the elastomer, on the filler charac-teristics and on the mixing process and technology [8]. In addition, carbon blackprimary particles seem to be spherical, blended together forming aggregates[9].Following the Van der Waals forces, aggregates connect forming agglomerates[9]. Fig. 1 shows a graphic representation of the size of particles, aggregates andagglomerates.
Furthermore, the structure of carbon black particles ranges from crystallineto amorphous materials. Crystallite flat surfaces and amorphous carbon surfacesare less energetic areas, whereas crystallite edges are the most energetic ones [10].
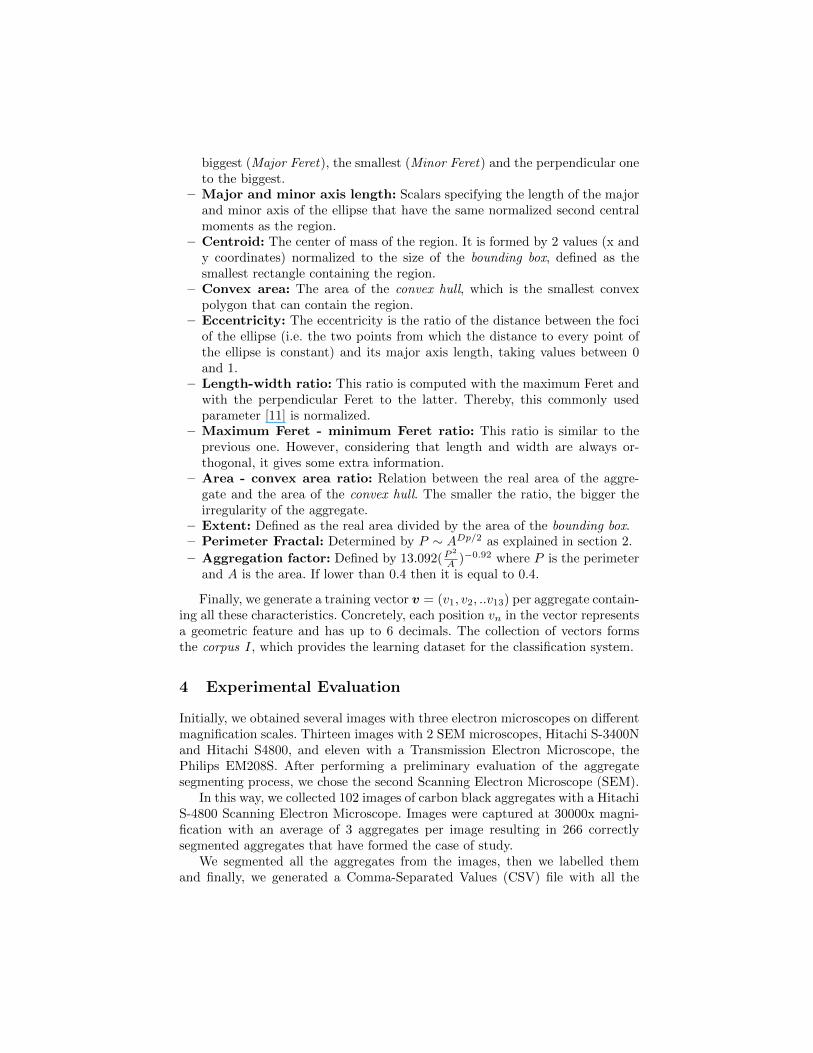
Commonly, the aggregates can be divided into four different types of mor-phologies [11] (shown on Fig. 2). To this end, an estimation for discerning be-tween the four categories is to calculate the aggregate length/width ratio andaggregate irregularity, however, this method is not an exact classification andincludes a difficult value to measure: irregularity [11]:
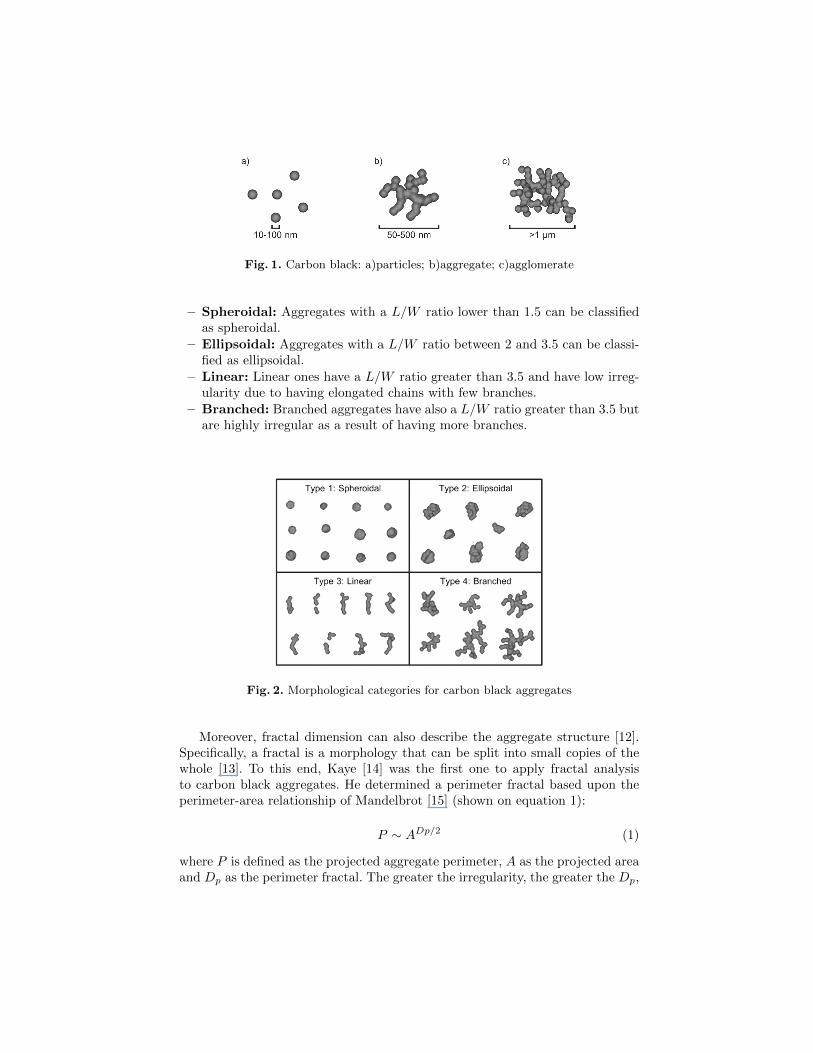
Fig. 1. Carbon black: a)particles; b)aggregate; c)agglomerate
– Spheroidal: Aggregates with a L/W ratio lower than 1.5 can be classifiedas spheroidal.
– Ellipsoidal: Aggregates with a L/W ratio between 2 and 3.5 can be classi-fied as ellipsoidal.
– Linear: Linear ones have a L/W ratio greater than 3.5 and have low irreg-ularity due to having elongated chains with few branches.
– Branched: Branched aggregates have also a L/W ratio greater than 3.5 butare highly irregular as a result of having more branches.
Fig. 2. Morphological categories for carbon black aggregates
Moreover, fractal dimension can also describe the aggregate structure [12].Specifically, a fractal is a morphology that can be split into small copies of thewhole [13]. To this end, Kaye [14] was the first one to apply fractal analysisto carbon black aggregates. He determined a perimeter fractal based upon theperimeter-area relationship of Mandelbrot [15] (shown on equation 1):
P ∼ ADp/2 (1)
where P is defined as the projected aggregate perimeter, A as the projected areaand Dp as the perimeter fractal. The greater the irregularity, the greater the Dp,

however, highly acicular particles with a smooth perimeter may also give a highperimeter fractal [4].
Considering the scale of carbon black aggregates, electron microscopes areneeded to analyse them. There are several types of microscope techniques basedon the use of a particle beam of electrons such as Transmission Electron Mi-croscopy (TEM) and Scanning Electron Microscopy (SEM).
3 Image Feature Extraction
Specifically, the aim of this treatment is to segment the aggregates and to ex-tract several geometric features from them. Not only basic ones, such as areaor perimeter, are considered but also more complex ones like perimeter fractal.Thereby, machine-learning classifiers will determine the morphology of unclas-sified aggregates using these features. Our algorithm follows the operations re-quired by the Standard Test Method for Carbon Black [16] for analysing imagescaptured by electron microscopes: background/noise elimination, thresholding,erosion and dilation.
In order to conduct the binarization, we start applying a Gaussian smoother[17], a 2-D convolution operator used to remove detail and noise. Second, we esti-mate a threshold for aggregate-background discrimination using Otsu’s method[18]. We adjust this threshold to be more adequate for SEM images. We generatea binary image considering that pixels with value below the threshold correspondto background and pixels above it are part of the aggregate area.
Although we accomplish a smoothing process for noise reduction in the bi-narization phase, undesired elements may still be present in the image. Theseelements can be easily confused with the desired aggregates, thus, it is mandatoryto eliminate them. To this end, we begin deleting minor areas and we continuefilling holes inside aggregates. Moreover we improve the edge quality by dilatingand eroding it with a disk shape morphological structuring element and we enddeleting incomplete aggregates touching the edge of the image. Besides, we iden-tify aggregates segmenting from the image the regions that surpass an specifiedarea.
Based on the output image from the previous phase, we extract some geo-metric features, the ones marked with an ‘*’ are the required ones according tothe Standard Test Method for Carbon Black [16]. These parameters are mea-sured in nm and when necessary estimated using stereological principles (i.e.the three-dimensional interpretation of two-dimensionally observed objects). Tostart with, the common ones are: perimeter*, area*, area-perimeter ratio, equiv-alent diameter, aggregate and particle volume, axis ratio, number of particlesper aggregate, occlusion factor, absorption and circularity. In the second placeare the parameters that require an explanation:
– Feret diameters*: A Feret diameter is defined as the distance between twotangents on opposite sides of the particle profile that are parallel to somefixed direction. So as to obtain valuable information related to the form ofthe particle, we extract 16 Ferets [16] separated by 11.5 degrees choosing the
biggest (Major Feret), the smallest (Minor Feret) and the perpendicular oneto the biggest.
– Major and minor axis length: Scalars specifying the length of the majorand minor axis of the ellipse that have the same normalized second centralmoments as the region.
– Centroid: The center of mass of the region. It is formed by 2 values (x andy coordinates) normalized to the size of the bounding box, defined as thesmallest rectangle containing the region.
– Convex area: The area of the convex hull, which is the smallest convexpolygon that can contain the region.
– Eccentricity: The eccentricity is the ratio of the distance between the fociof the ellipse (i.e. the two points from which the distance to every point ofthe ellipse is constant) and its major axis length, taking values between 0and 1.
– Length-width ratio: This ratio is computed with the maximum Feret andwith the perpendicular Feret to the latter. Thereby, this commonly usedparameter [11] is normalized.
– Maximum Feret - minimum Feret ratio: This ratio is similar to theprevious one. However, considering that length and width are always or-thogonal, it gives some extra information.
– Area - convex area ratio: Relation between the real area of the aggre-gate and the area of the convex hull. The smaller the ratio, the bigger theirregularity of the aggregate.
– Extent: Defined as the real area divided by the area of the bounding box.– Perimeter Fractal: Determined by P ∼ ADp/2 as explained in section 2.
– Aggregation factor: Defined by 13.092(P 2
A )−0.92 where P is the perimeterand A is the area. If lower than 0.4 then it is equal to 0.4.
Finally, we generate a training vector v = (v1, v2, ..v13) per aggregate contain-ing all these characteristics. Concretely, each position vn in the vector representsa geometric feature and has up to 6 decimals. The collection of vectors formsthe corpus I, which provides the learning dataset for the classification system.
4 Experimental Evaluation
Initially, we obtained several images with three electron microscopes on differentmagnification scales. Thirteen images with 2 SEM microscopes, Hitachi S-3400Nand Hitachi S4800, and eleven with a Transmission Electron Microscope, thePhilips EM208S. After performing a preliminary evaluation of the aggregatesegmenting process, we chose the second Scanning Electron Microscope (SEM).
In this way, we collected 102 images of carbon black aggregates with a HitachiS-4800 Scanning Electron Microscope. Images were captured at 30000x magni-fication with an average of 3 aggregates per image resulting in 266 correctlysegmented aggregates that have formed the case of study.
We segmented all the aggregates from the images, then we labelled themand finally, we generated a Comma-Separated Values (CSV) file with all the
characteristics and finally we performed machine learning studies to classify theaggregates.
In these experiments, we extracted 26 variables from each aggregate. Thedataset was not balanced for the four existing classes due to scarce data. Specif-ically, 9 aggregates were of type spheroidal, 86 ellipsoidal, 51 linear and 120branched. To address both problems (scarce and unbalanced data) we appliedSynthetic Minority Over-sampling TEchnique (SMOTE) [19], which is a combi-nation of over-sampling the less populated classes and under-sampling the morepopulated ones. Nevertheless, the over-sampling is performed by creating syn-thetic minority class examples. In this way, instances were still unique and classesbecame more balanced.
More accurately, we conducted the next methodology in order to test thesuitability of each machine-learning algorithm:
– SMOTE: We built a dataset that contains the result of applying SMOTE tothe original dataset in order to compare the results of the machine-learningclassifiers with and without this technique.
– Cross validation: This method is generally applied in machine-learningevaluation [20]. In our experiments, we performed a K-fold cross validationwith k = 10. In this way, our dataset is 10 times split into 10 different setsof learning (90 % of the total dataset) and testing (10 % of the total data).
– Learning the model: For each fold, we accomplished the learning step ofeach algorithm using different parameters or learning algorithms dependingon the specific model. In particular, we used the following models:
• Bayesian networks (BN): With regards to Bayesian networks we uti-lize different structural learning algorithms: K2 [21], Hill Climber [22]and Tree Augmented Naıve (TAN) [23]. Moreover, we also performedexperiments with a Naıve Bayes Classifier [20].
• Support Vector Machines (SVM): We performed experiments with apolynomial kernel [24], a normalized polynomial Kernel [25] and PearsonVII function-based universal kernel [26].
• K-nearest neighbour (KNN): We performed experiments with k = 1,k = 5, k = 10, k = 15, k = 20 and k = 25.
• Decision Trees (DT): We performed experiments with J48(the Weka [27]implementation of the C4.5 algorithm [28]) and Random Forest [29], anensemble of randomly constructed decision trees.
– Testing the model: We evaluated the percent of correctly classified in-stances and the area under the ROC curve (AUC) that establishes the rela-tion between false negatives and false positives [30].
Table 1 shows the obtained results in terms of accuracy percent. In this way,regarding the results without the use of SMOTE, most of the classifiers obtainedonly medium results, with the exception of Naıve Bayes method, which was theworst, with results lower than 50 %. Otherwise, when SMOTE technique wasapplied, every classifier improved its accuracy in a significant manner. Specially,Naıve Bayes increased its accuracy in more than 20 %. Furthermore, Random
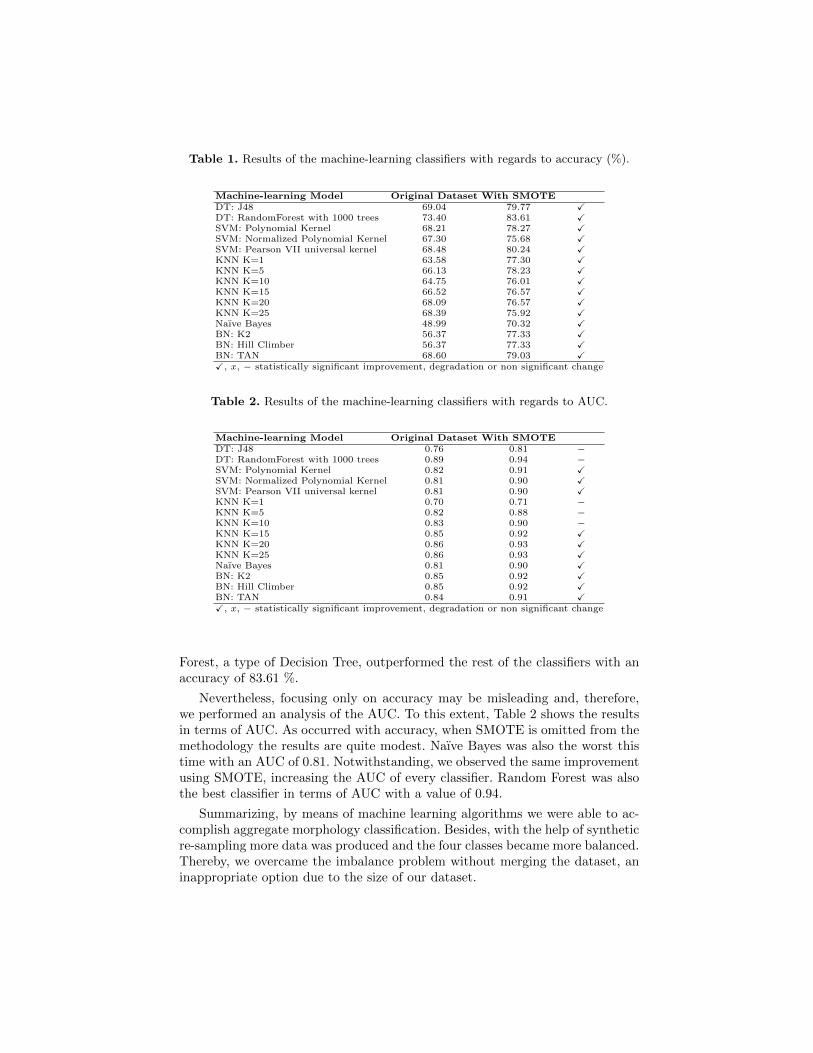
Table 1. Results of the machine-learning classifiers with regards to accuracy (%).
Machine-learning Model Original Dataset With SMOTEDT: J48 69.04 79.77 XDT: RandomForest with 1000 trees 73.40 83.61 XSVM: Polynomial Kernel 68.21 78.27 XSVM: Normalized Polynomial Kernel 67.30 75.68 XSVM: Pearson VII universal kernel 68.48 80.24 XKNN K=1 63.58 77.30 XKNN K=5 66.13 78.23 XKNN K=10 64.75 76.01 XKNN K=15 66.52 76.57 XKNN K=20 68.09 76.57 XKNN K=25 68.39 75.92 XNaıve Bayes 48.99 70.32 XBN: K2 56.37 77.33 XBN: Hill Climber 56.37 77.33 XBN: TAN 68.60 79.03 XX, x, − statistically significant improvement, degradation or non significant change
Table 2. Results of the machine-learning classifiers with regards to AUC.
Machine-learning Model Original Dataset With SMOTEDT: J48 0.76 0.81 −DT: RandomForest with 1000 trees 0.89 0.94 −SVM: Polynomial Kernel 0.82 0.91 XSVM: Normalized Polynomial Kernel 0.81 0.90 XSVM: Pearson VII universal kernel 0.81 0.90 XKNN K=1 0.70 0.71 −KNN K=5 0.82 0.88 −KNN K=10 0.83 0.90 −KNN K=15 0.85 0.92 XKNN K=20 0.86 0.93 XKNN K=25 0.86 0.93 XNaıve Bayes 0.81 0.90 XBN: K2 0.85 0.92 XBN: Hill Climber 0.85 0.92 XBN: TAN 0.84 0.91 XX, x, − statistically significant improvement, degradation or non significant change
Forest, a type of Decision Tree, outperformed the rest of the classifiers with anaccuracy of 83.61 %.
Nevertheless, focusing only on accuracy may be misleading and, therefore,we performed an analysis of the AUC. To this extent, Table 2 shows the resultsin terms of AUC. As occurred with accuracy, when SMOTE is omitted from themethodology the results are quite modest. Naıve Bayes was also the worst thistime with an AUC of 0.81. Notwithstanding, we observed the same improvementusing SMOTE, increasing the AUC of every classifier. Random Forest was alsothe best classifier in terms of AUC with a value of 0.94.
Summarizing, by means of machine learning algorithms we were able to ac-complish aggregate morphology classification. Besides, with the help of syntheticre-sampling more data was produced and the four classes became more balanced.Thereby, we overcame the imbalance problem without merging the dataset, aninappropriate option due to the size of our dataset.
5 Conclusions and Future Work
Since nano-particles are able to modify the mechanical and electrical proper-ties of materials [3], manufacturers have been led to a new generation of nanomaterial-based production. Moreover, depending on the aggregate type [11] andthe mixing process the obtained product varies [8].
In this paper, we have proposed the first automatic machine-learning-basednano-aggregate morphology categorisation method. This technique correctly de-termined the morphology of nano-aggregates, based on the use of geometricaland fractal characteristics as features for the training of several machine-learningclassifiers. Furthermore, the empirical validation showed that this method is ca-pable of classifying the morphology of aggregates with an accuracy of over 80%.
Future work will compare results based on original samples with the presentresults obtained with SMOTE re-sampling [19]. To this end, we will acquire moreSEM images in order to generate a larger training dataset. In addition, we areplanning to improve the image-processing algorithm so as to work with TEMimages. On the other hand, we will focus on developing a 3-dimensional tool inorder to accomplish skeletonization and 3D modelling of the aggregates.
Acknowledgements
We thank Mikel Salazar for the carbon black 3D simulation images created forthis paper. In addition, we thank the Basque Government for their support withthe project UEGV09/C19. Technical and human support provided by SGIker,specifically the EM laboratory of the Analytical Microscopy and High Resolutionin Biomedicine General Service, is gratefully acknowledged. Last but not leastwe are grateful to Maria Carmen Huarte for her invaluable corrections.
References
1. Roco, M., Bainbridge, W.: Societal implications of nanoscience and nanotechnol-ogy. Kluwer Academic Pub (2001)
2. Kiparissides, C., Clausen, B., Boehm, L., Wilkins, T., Kellermayer, M., Baraton,M., Hossain, K.: NMP expert advisory group (EAG) position paper on future RTDactivities of NMP for the period 2010 - 2015. Technical report
3. Mather, P., Thomas, K.: Carbon black/high density polyethylene conducting com-posite materials: Part I Structural modification of a carbon black by gasificationin carbon dioxide and the effect on the electrical and mechanical properties of thecomposite. Journal of materials science 32(2) (1997) 401–407
4. Donnet, J., Bansal, R., Wang, M.: Carbon black: science and technology. CRC(1993)
5. Soewono, A.: Morphology and microstructure of diesel particulates. Master’s thesis6. Amaral, A.: Image analysis in biotechnological processes: applications to wastew-
ater treatment. PhD thesis, Universidadde Do Minho (2003)7. Al-Kadi, O.: Tumour Grading and Discrimination based on Class Assignment and
Quantitative Texture Analysis Techniques. PhD thesis, University of Sussex (2009)

8. Frohlich, J., Niedermeier, W., Luginsland, H.: The effect of filler–filler and filler–elastomer interaction on rubber reinforcement. Composites Part A 36(4) (2005)449–460
9. Donnet, J.: Black and white fillers and tire compound. Rubber chemistry andtechnology 71(3) (1998) 323–341
10. De, S., Naskar, K., White, J.: Rubber Technologist’s Handbook, Volume 2.Smithers Rapra (2008)
11. Herd, C., McDonald, G., Hess, W.: Morphology of carbon-black aggregates: fractalversus euclidean geometry. Rubber chemistry and technology 65(1) (1992) 107–129
12. Meakin, P.: Formation of fractal clusters and networks by irreversible diffusion-limited aggregation. Physical Review Letters 51(13) (1983) 1119–1122
13. Mandelbrot, B.: The fractal geometry of nature. W.H. Freeman, San Francisco(1982)
14. Kaye, B.: Fractal description of fineparticle systems. Particle Characterization inTechnology: Morphological analysis (1984) 81
15. Mandelbrot, B.: Form, chance, and Dimension. Chance and Dimension. Freeman,San Francisco (1977) 1–234
16. for Testing, A.S., Materials: ASTM D3849-02 - Standard Test Method for Car-bon Black - Morphological Characterization of Carbon Black Using Electron Mi-croscopy (2002) Testing method.
17. Pajares, G., de la Cruz, J.M.: Vision por Computador. Ra-Ma Publishers (2007)18. Otsu, N.: A threshold selection method from gray-level histograms. Automatica
11 (1975) 285–29619. Chawla, N., Bowyer, K., Hall, L., Kegelmeyer, W.: SMOTE: synthetic minority
over-sampling technique. Journal of Artificial Intelligence Research 16(3) (2002)321–357
20. Bishop, C.M.: Neural Networks for Pattern Recognition. Oxford University Press(1995)
21. Cooper, G.F., Herskovits, E.: A bayesian method for constructing bayesian beliefnetworks from databases. In: Proceedings of the 7th conference on Uncertainty inartificial intelligence. (1991)
22. Russell, S.J., Norvig: Artificial Intelligence: A Modern Approach (Second Edition).Prentice Hall (2003)
23. Geiger, D., Goldszmidt, M., Provan, G., Langley, P., Smyth, P.: Bayesian networkclassifiers. In: Machine Learning. (1997) 131–163
24. Amari, S., Wu, S.: Improving support vector machine classifiers by modifyingkernel functions. Neural Networks 12(6) (1999) 783–789
25. Maji, S., Berg, A., Malik, J.: Classification using intersection kernel support vectormachines is efficient. In: Proc. CVPR. Volume 1. (2008) 4
26. Ustun, B., Melssen, W., Buydens, L.: Visualisation and interpretation of supportvector regression models. Analytica chimica acta 595(1-2) (2007) 299–309
27. Garner, S.: Weka: The Waikato environment for knowledge analysis. In: Proceed-ings of the New Zealand Computer Science Research Students Conference. (1995)57–64
28. Quinlan, J.: C4. 5 programs for machine learning. Morgan Kaufmann Publishers(1993)
29. Breiman, L.: Random forests. Machine learning 45(1) (2001) 5–3230. Singh, Y., Kaur, A., Malhotra, R.: Comparative analysis of regression and machine
learning methods for predicting fault proneness models. International Journal ofComputer Applications in Technology 35(2) (2009) 183–193