40098357.pdf - International Atomic Energy Agency
819
-
Upload
khangminh22 -
Category
Documents
-
view
0 -
download
0
Transcript of 40098357.pdf - International Atomic Energy Agency

Programme - 21 February 2005
Chair: Vladimír Hecl, Energy Centre Bratislava 9.00-11.00 Session 1: RES Policies, strategies, political background
09:00 Vladimír Hecl, ECB, welcome speach , Slovakia
09:05 Zsolt Simon, Minister, Ministry of Agriculture SK, Development and recent changes in Biomass sector in Slovakia, Slovakia
09:15 Representative, Ministry of Economy SK, Renewable energy development and Slovak Energy Policy, Slovakia
09:25 Representative, EC Representative, EU Trends and position of European Commission,
09:35 Friedrich Rauter, Amt der NÖ Landesregierung, Renewable Energy in Lower Austria , Austria
09:45 Pavel Manchev, Eneffect Center for Energy Efficiency, Biomass situation in Bulgaria, Bulgaria
10:25 Jaroslav Jakubes, Enviros s.r.o., Biomass situation in Czech Republic, Czech Republic
10:35 Krzystof Gierulski, EC BREC, Biomass situation in Poland, Poland
10:45 Discussion

Chair : Fiona Santokie, Natsource Europe Ltd , UK
11.20-13.30 Session 2: Bioenergy markets, tools and influence factors
11:20 Fiona Santokie, Natsource Europe Ltd., Biomass international markets situation and development scenarios, United Kingdom
11 :40 Ján Ilavský, Finnish Forest Research Institute, Energy Wood Potential of Forests in the European Union, Finland
11:55 Alexandra Langenheld, Ministry of Environment DE, REFITs / service or contradiction?, Germany
12:10 Kees Kwant, SenterNovem, Green Certificates, a tool for market development, Netherlands
12:25 Helena Princová, Ministry of Environment SK, Kyoto flexible mechanisms - past and current situation, reaching the objective ?, Slovakia
12:40 Karol Dvorák, Regulatory Authority SK, Regulation framework for RES in Slovakia, Slovakia
12:55 Irena Plocková, Ministry of Industry and Trade CZ, Sustainable construction and renewable energy, the Czech Republic
13:10 Discussion
Chair : Karol Vinš, State Forests Company, SK
14.30-18.05 Session 3: Biomass fuels production and trading
14:30 Karol Vinš, State Forests Company SK, Biomass potential in Slovakia, processing of biomass fuels, Slovakia
14:45 Michael Wild, EBES, Biomass fuels trading, Austria
15:00 Jozef Mikulec, Slovnaft Vurup, Strategy for Production and Utilisation of Alternative Fuels, Must or Pain?, Slovakia
15:15 Roman Réh, Association of wood-processing industries, Utilization of biomass in woo-processing industry, Slovakia
15:30 Michael Golser, Holzforschunginstitute Austria, Production of wood pellets – R&D and standardisation , Austria
15:45 Wieslaw Denisiuk, POLBIOM- Ekolog, Straw heating technologies, Poland
16:00 Discussion

Chair : Jozef Víglaský, SK BIOM
16:35 Štefan Molnár, Renem, s.r.o., Production of bio-oils, situation in CEEC, Slovakia
16:50 Kent Nystrom, Swedish Bioenergy association SVEBIO, Biomass pellets markets, situation and development trends, Sweden
17:05 Marián Laššák, Doka Drevo, s.r.o., Biomass briquetts markets, situation and development trends,, Slovakia
17:20 Pentti Hakkila, VTT, Large scale woodchips production, Finland
17:35 Jozef Víglaský, SK BIOM, Energy crops utilisation and perspectives, Slovakia
17: 50 Discussion
Programme - 22 February 2005
Chair : Miroslav Mravec, Herz, SK 9.00-11.20 Parallel Session 4: Biomass firing technologies
09:00 Milan Novák, Thermo/solar Žiar, s.r.o., Biomass/solar installations, Slovakia
09:20 Claus Justsen, Justsen Energiteknik A/S, Technologies with installed capacity over 1 MW, Denmark
09:40 Miroslav Mravec, Herz, s.r.o., Technologies with installed capacity under 1 MW, Slovakia
10:00 Horst Jauschneg, Austrain Biomass Association, Development of the pellets market and of the pellets technologies, Austria
10:20 Ladislav Novák, TTS Eko Třebíč, Wood residues firing technologies, the Czech Republic
10:40 Ľubomír Šooš, Slovak Technical University, Biomass production technologies, Slovakia
11:00 Discussion

Chair : Pavel Manchev, EnEffect Consult, BG
9.00-11.20 Parallel Session 5: Municipal projects uptake
09:00 Martin Cahn, Energie Cites, Are European Cities going towards « greener « future, Belgium
09:20 Christian Aichernig, Repotec GmbH, biomass CHP Plant Gussing – Reliable solution for Fossil Free Municipality, Austria
09:40 Miroslava Knotková, City of Zlín, Realisation of Biomass projects in Zlin Region, the Czech Republic
10:00 Adam Gula, AGH-University of Science and Technology, Krakow, Project example in Poland, Poland
10:20 Kristina Dely, Delfy Bt. , Project example in Hungary, Hungary
10:40 Juraj Zamkovský, CEPA, Utilisation of biomass in small municipalities in Central Slovakia
11:00 Discussion
Chair : Pavol Švarc, Utilities Novaky. SK
11:40-13:20 Parallel Session 6: Biomass large and small CHP
11:40 Eloi Piel, EUROHEAT and Power, Opportunities for CHP/DH, EU
12:00 Pavol Švarc, Energy Utilities Nováky, Biomass/coal co-firing in Utilities, Slovakia
12:20 Matthias Lieblich, WIP Germany, Mini and Micro CHP technologies, Germany
12:40 Ján Gaduš, Slovak Agriculture University, Aplication of biogas in fuel cells, Slovakia
13:00 Ivan Ďuďák, Intech Ltd., Marketing of CHP technologies in Slovakia, Slovakia
13:20 Discussion

Chair : Representative of European Commission
11:40-13:20 Parallel Session 7: Environmental biomass technologies
11:40 Nominated representative, DG Enviro, European Commission, EC requirements related to legislation
12:00 Julius Bizoň, SES Tlmače, Ash processing and recycling, Slovakia
12:20 Jiří Balajka, ECOSYS, Exploitation of biomass within the emissions trading and JOINT IMPLEMENTATION, Slovakia
12:40 Jozef Šoltés, Slovak Energy Agency, Emissions metering methodology in Slovakia, Slovakia
13:00 Klaus Grepmeier, ZREU, European progress within environmental technologies, Germany
13:20 Discussion
Chair : Alexandra Amerstorfer, Kommunalkredit, Austria
14:40-16:40 Session 8: Biomass projects financing roundtable
14:40 Martin Kedro, SARC, R+D Programmes, Slovakia
14:50 Representative, European Commission, Energy Intelligent – Europe Programme
15:00 Alexandra Amerstorfer, Kommunalkredit Austria, Austrian JI/CDM Programme, Austria
15:10 Drahoslav Kvašovský, Slovak energy Agency, Structural funds, Slovakia
15:20 Dária Juhasová, Ministry of Economy SK, Interreg III C, Slovakia
15:30 Bronislava Herdová, ECB, Guarantee programmes, Slovakia
15:40 Marian Rutšek, EE TEK, Private financing, Slovakia
15:50 Vladimír Vacho, Dexia, Banking, Slovakia
16:00 Kristina Vilimaite, The Regional Environmental Centre for Central and Eastern Europe , Grants/foundations, Hungary
16:10 Discussion
16:30 End of conference, Vladimír Hecl, ECB

ADDRESS OF THE MINISTER OF AGRICULTURE OF THE SLOVAK REPUBLIC
Zsolt Simon Minister of Agriculture of the Slovak Republic Ministry of Agriculture of the Slovak Republic Phone: + 421 2 592 66 241 E-mail: [email protected] Ladies and Gentlemen!
I am very glad to be able to participate in the event starting today, the topic of which I consider to be of utmost importance. It is without doubt that the issue of sustainable development from the viewpoint of food and energy production draws the attention of all countries of the world. The speed of depletion of energy sources and the growing consumption of energies force people all over the world to seek solutions that would ensure high-quality life for the present and future generations, and, at the same time, sustainable development for our planet. That is why no country can act as if this problem did not concern it.
The Slovak Republic, of course, is not an exception in this regard. Our country is dependent on imports of primary energy sources, of which we import almost 90%. Domestic energy sources are limited to renewable sources and brown coal. In 2003, the Government of the Slovak Republic approved the “Concept of Utilisation of Renewable Energy Sources”. The sector of agriculture responded to the document by presenting a “Concept of Utilisation of Agricultural and Forestry Biomass for Energy Purposes” to the Government. After an inventory we arrived at a conclusion that the total energy potential was 63.4 PJ, of which 46 PJ was in agricultural biomass. In agriculture, this includes particularly straw, waste wood, excrement of livestock and green mass for the production of biogas, and growing of oil crops and cereals for production of biofuels. However, it needs to be said objectively that the energy potential mentioned can be used in the sector only to a limited extent. Our effort is to utilise it particularly in heat generation and in agricultural drying plants. However, we have a lot of work ahead of us to implement measures to ensure gradual replacement of a proportion of motor fuels with biofuels, to introduce generation of “green” electric power, and to increase heat generation in the municipal sector using biomass.
Several examples from Slovakia already indicate that this is possible. At Kysucký Lieskovec, they started production of wooden pallets; forestry organisations operate 14 boiler houses using forest dendromass; the greatest consumer of forest wood is a machinery manufacturer, the company of Stredoslovenské energetické strojárne Tlmače; agricultural biomass (straw, natural seeding of forest tree species) is used in heat generation at the agricultural cooperative of Liptovský Ondrej and that of Prašice; biogas is generated at the agricultural cooperative of Brezov, Agros Bátka, SPU Nitra, and it is about to be launched at the agricultural cooperative of Kapušany. Almost 100 tons of

production capacities for plant oil esters are ready and construction of a distillery for dry bioethanol is in preparation. These projects are waiting for adoption of the “National Programme for Biocomponent Production Support in the Slovak Republic and Its Application in Internal Market in Motor Fuels with Subsequent Use in Transportation”.
The main source of dendromass in Slovakia is the forestry, where portion of the wood unsuitable for use in wood processing industry can be utilised; but also the wood processing industry itself, which produces waste suitable for energy use. The total annual potential of Slovakia in production of forest dendromass suitable for energy use will reach approximately 1,810 thousand tons by 2010, which represents an energy equivalent of 16.9 PJ. The energy value of useful waste of wood processing industry represents 18.1 PJ (1,410 thousand tons of waste per annum). The largest concentrations of useful biomass from mechanical wood processing are in the districts of Čadca, Brezno, Lučenec and Svidník.
Promising sources of fuel biomass include the growths of fast-growing tree species (poplar, willow, locust, aspen, alder), annual and perennial energy crops. Energy crop growths may be established only on land unsuitable for classical agricultural and forestry production; on soils temporarily excluded from agricultural production, suitable only for non-food purposes; and also on devastated areas in industrial agglomerations.
On the basis of a zoning of land suitable for energy forests done in the years 2000 – 2001 in the Slovak Republic, locations were selected with the area of 8,400 ha in the forestry soil stock and 37,000 ha of agricultural lands, where for a very short, 3 – 5 years’ turnover, an average increment of about 10 tons of dry mass per year could be achieved. To verify the possibilities of production, experimental growths of cultivated poplars, willows and locust have been established, which confirm the realistic possibilities of utilisation of energy crop growths thus established.
In the state budget for 2005, the Rural Development Plan was allocated SKK 72,800 thousand for afforestation of agricultural land, which represents state budget funds for afforestation of 500 ha of agriculturally unused land in 2005. These funds can be used also for establishment of the so-called energy crop growths.
On the basis of a resolution of the Government of the Slovak Republic on the Concept presented by us, we are monitoring the present effect of the valid legislation on the support for use of renewable energy sources; jointly with the Ministry of Education, we are examining the possibilities of adding the issue of biomass to the existing public programmes of science and research in the field of energy; and last but not least we expect that the Higher Territorial Units will prepare their own energy concepts as requested by the Government. Our experts from the Technical and Testing Agricultural Institute at Rovinka and from the Forestry Research Institute at Zvolen are ready to provide consulting assistance in their preparation.
Ladies and Gentlemen, use of biomass and other renewable energy sources enables us to become more independent of energy imports, to reduce foreign currency expenditures due to growing energy prices, to reduce volumes of carbon dioxide emissions, to create new jobs, and to develop new technologies. We also

must not forget about rural development and landscape enhancement. At the presently changing Common Agricultural Policy of the countries of the European Union, production of biomass for energy purposes is a chance for our agriculture. However, it is a chance also for the Slovak technical intelligentsia to engage in solution of problems related to utilisation of biomass and renewable energy sources, and also a chance for the machinery industry to become involved in international cooperation in manufacture of necessary machines and installations. For the purpose of exchange of experience obtained in the field of utilisation of biomass in agriculture, we are presently preparing a trilateral special seminar with participation of leading experts from Austria, Hungary and Slovakia to be held this May.
Ladies and Gentlemen, it was not my intention to summarise and name all issues we have to solve, I rather wanted to suggest that the use of biomass and renewable energy sources is impossible without cooperation. Farmers and foresters cannot do without people from energy sector and it is not possible to progress without science and research and the entire process must also be supported by economic tools. In conclusion, let me express a wish that this conference show paths to solutions benefiting further progress in biomass use and thereby contribute to general development of the Slovak Republic.
Thank you for your attention.

RENEWABLE ENERGY IN LOWER AUSTRIA Dipl.Ing. Friedrich Rauter Head of Department of Environmental Technology Amt der Niederösterreichischen Landesregierung Landhausplatz 1, A 3109 Sankt Pölten, Austria Phone: 0043 2742 9005/14250 E-mail: [email protected] ABSTRACT The year 2004 was very successful for renewable energy in Lower Austria and more biomass district heating plants, biomass power plants, biogas plants and windmills were built then the years before. Renewable energy has become an important factor in energy supply. About 7% of electricity in Lower Austria is produced by wind, biomass and biogas. Investments of about 185 million Euros were effected by supports and are also important for the economy. There are 240 biomass district heating plants with 282 MW thermal output in operation. The fuel need of 1,4 million cubic meters wood and 15.000 tons straw per year safeguards jobs in rural areas. After the decision of the Ecological Electricity Act 2002 a biogas campaign started in Lower Austria. Biogas plants for renewable resources and agricultural products are supported by subsidies and regulated prices for renewable electricity which is fed into the national grid. There was also a considerable increase of windmills in the year 2004 and today 197 plants with 251 MW output are in operation.

121. 2. 2005
Renewable Energy in Lower Austria
Dipl.Ing. Friedrich RauterOffice of the Government of Lower AustriaDepartment of Environmental Technology

221. 2. 2005
Energy in Austria
natural gas18,7%
crude oil47,3%
district heating
3,1%
coal2,1%
renewable energy10,5%
electricity18,3%
Final energy consumption in Lower Austria 2002: 210.640 TJ

321. 2. 2005
Energy in Lower Austria
natural gas29,4%
crude oil25,8%
waste0,5%
wood14,6%
biogenous fuels7,1%
heat pump1,2%
wind,PV0,4%
hydropower21,1%
Energy production in Lower Austria 2002: 137.687 TJ

421. 2. 2005
Energy Plan of Lower Austria
• implementation of a comprehensive protection of climate and environment
• sparing use of resources• to ensure the basis for life and economy• to achieve a wide participation and cooperation
521. 2. 2005
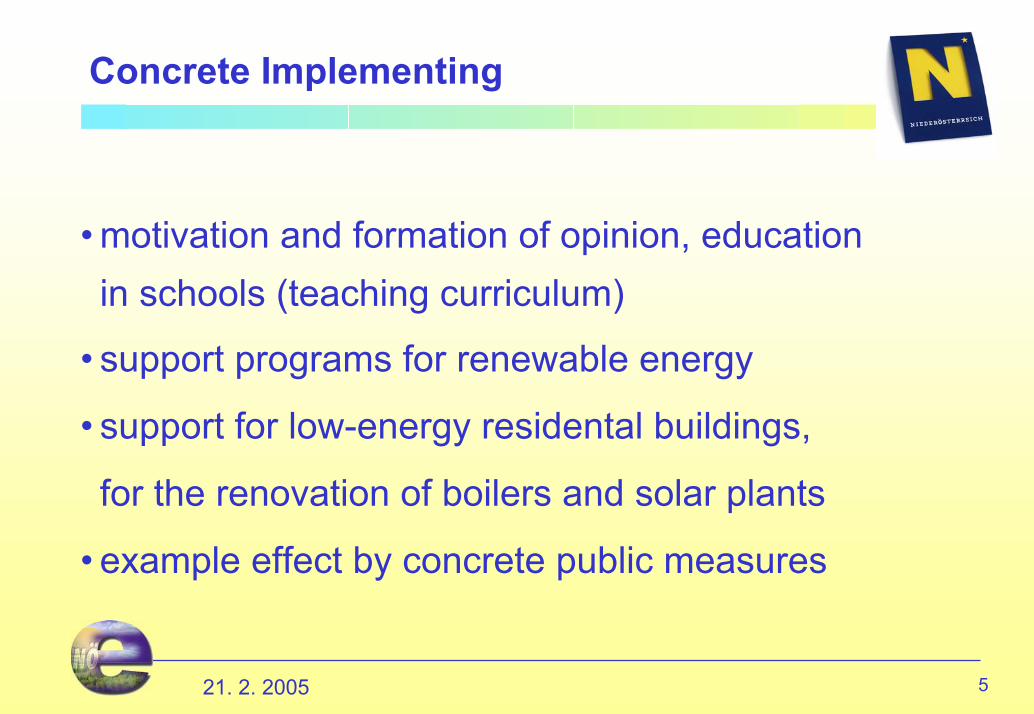
Concrete Implementing
• motivation and formation of opinion, educationin schools (teaching curriculum)
• support programs for renewable energy
• support for low-energy residental buildings,
for the renovation of boilers and solar plants
• example effect by concrete public measures

621. 2. 2005
Hydropower
• About 70% of the Austrian electricity consumption issupplied by hydropower.
• 394 small-scale hydropower plants supply about 4% of the demand of electricity in Lower Austria,the continuance is ensured by regulatedprices for feeding into the grid.
• The hydropower plants a the Danube providean essential share in the total productionof electricity in Austria.

721. 2. 2005
Energy from Biomass
• Support of numerous research and developmentprojects for the use of bioenergy (development ofboilers and etc.)
• Subsidies for the construction of municipal districtheating plants
• Subsidies for biomass boilers in residential buildings• Assured tariffs for electricity from biomass and
biogas• Subsidies for biomass power plants

821. 2. 2005
Support for Biomass
Success by a consistent support:
• Increasing share in electricity supply• Ensured income for the forestry and agriculture• Independence from imports• Technological progress for boilers and fuel technology• Export of combustion plants• Rising acceptance for the thermal use of biomass

921. 2. 2005
Support for Biomass
240 plants• 282 MW thermal output• 380 km pipelines• 1,4 million cubicmeters
fuel consumption• 680 GWh heat supply
Biomass district heatingplants:

1021. 2. 2005
Woodfired boilers in Austria
Small heating plants for woodchips and woodpellets from 1989 to 2003:a total of 49.158 plants
woodchips woodpellets
Annual increment
1121. 2. 2005
Basis of Subsidies for Ecological Electricity
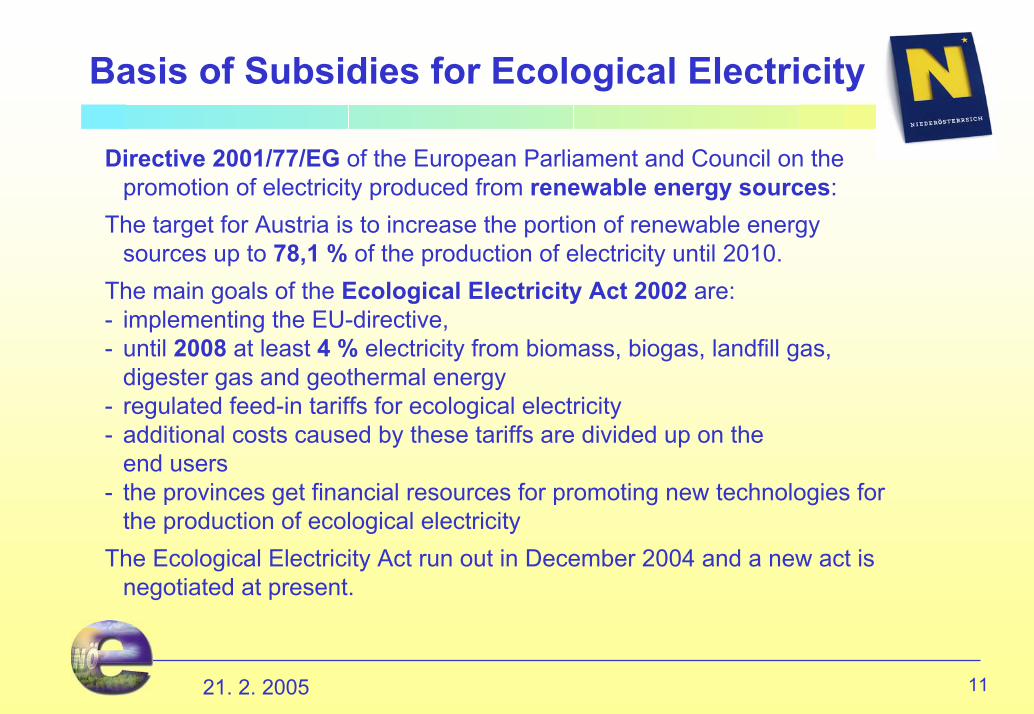
Directive 2001/77/EG of the European Parliament and Council on thepromotion of electricity produced from renewable energy sources:
The target for Austria is to increase the portion of renewable energysources up to 78,1 % of the production of electricity until 2010.
The main goals of the Ecological Electricity Act 2002 are:- implementing the EU-directive,- until 2008 at least 4 % electricity from biomass, biogas, landfill gas,
digester gas and geothermal energy- regulated feed-in tariffs for ecological electricity- additional costs caused by these tariffs are divided up on the
end users- the provinces get financial resources for promoting new technologies for
the production of ecological electricityThe Ecological Electricity Act run out in December 2004 and a new act is
negotiated at present.

1221. 2. 2005
Electricity from Biomass
Present state in Lower Austria:
1 plant with 5 MW, commanded heat, in operation1 identical plant in construction1 plant with 2 MW, commanded by heat, in construction2 ORC plants (about 500 kW) in operation1 plant with biodiesel 1,3 MW in operation1 plant with 600 kW in test operationseveral small plants with biodiesel and vegetable oilSeveral plants with 5 MW and plants withwood-distilling are in planning.
by

1321. 2. 2005
Biogas Campaign in Lower Austria
Target: 1% electricity from biogas- information and advice- well-defined responsibility for advice, approval
and subsidisation- standardized approval procedures- clear and simply understandable guidelines for
subsidiesUp till now the biogas campaign is verysuccessful.There will be increases if the economic conditions will last.

1421. 2. 2005
Biogas Campaign in Lower Austria
End of December 2004 there were 32 biogas plants with a total electrical output of 9,15 MW in operation and 17 furtherplants are in construction. The target of 1% (about 15 MW) will be reached this year.

1521. 2. 2005
Support for Windmills
• In the nineties there were voluntaryagreements with the operators of the gridabout feed-in tariffs.
• Since 1999 there were legal regulations in the provinces about the obligation of theoperators of distribution networks to purchase electricity generated by wind.The feed-in tariffs were regulated by theprovinces and financed by price surchargesfor end users.There were also additional subsidies fromthe federal government.
• Since 2002 a federal regulation about theobligatory purchase of ecological electricitywith fixed tariffs took place.The provinces can allocate additional supports.

1621. 2. 2005
Windmills
• 197 windmills with a total electrical output of 251 MW (about 5 % of the consumption of electricity) are in operation in Lower Austria.
• There will be a continuous increase of wind turbines within the next years if the economic conditions will last.

1721. 2. 2005
Balance of Ecological Electricity
Biomass: 16 plants with 8,5 MWBiogas: 32 plants with 9.15 MWWind: 197 plants with 251 MWlandfill gasand digester gas: 7 plants with 1,5 MW
Biomass and biogas plants produce about 2% and windmills about 5% of the consumption of electricity in Lower Austria.
A further considerable increase can be awaitedwithin the next years.

1821. 2. 2005
Solar Energy
The use of direct solar energy for water heating has a long tradition in Lower Austria.Several years ago most facilities were built by self-constructiongroups.Today most solar plants are produced and put up by professionals. Within the last years a solid market was set up by specific support.There are several instruments for promoting solar plants for residentialbuildings as well as for trade.Solar plants also are important exportable goods.

1921. 2. 2005
Renewable Energy in Lower Austria
Thank You for Your Attention!

BIOMASS SITUATION IN THE CZECH REPUBLIC
Jaroslav Jakubes Senior Consultant ENVIROS, s.r.o., Na Rovnosti 1, 130 00 Praha 3, Czech Republic Phone: +420 284 007 493 E-mail: [email protected] ABSTRACT In the context of implementation of RES-E Directive 2001/77/EC, Czech Republic has adopted an indicative target for RES-E share in gross electricity consumption the level of 8% in 2010. In addition, an updated Energy Policy from 2004 sets indicative target for share of RES at the level of 15-16% TPES in 2030. Biomass is the renewable energy resource with key current share as well as with key potential contribution to meeting the indicative targets in the future. Although positively directed, the current development of the biomass utilisation in the Czech Republic is, however, a result of uncoordinated and often contradictory and contraproductive efforts. The maximal utilisation of biomass potential needs a quick adoption of new support schemes for both RES-electricity and RES-heat, coordinated approach with agricultural policies, support to project development, clear rules for investment support as well as stimulation of development of local biomass market.

International Slovak Biomass Forum, Bratislava 2005

International Slovak Biomass Forum, Bratislava 2005
International Slovak Biomass Forum, Bratislava 21.02.2005
Biomass Situationin the Czech Republic
Jaroslav Jakubes, ENVIROS, Prague

International Slovak Biomass Forum, Bratislava 2005
- Biomass Utilisation and Potential in the Czech Republic
- Current RES Support Policy in the Czech Republic
- Barriers and Constraints
- Outlook for RES Support Policy in the CR
- Conclusions
Contents of Presentation

International Slovak Biomass Forum, Bratislava 2005
Updated RES statistics for the Czech Republic 2003
0
5
10
15
20
25
30
35
40
PJ/
year
Hydro (excl.pumpedstorage)
Solid biomass Biodegradablepart of waste
Solar thermal Geothermal(heat pumps)Wind Liquid
biofuelsBiogas
Solar PV
Ministry of Industry and Trade - PHARE project - updated RES statistics since 2003- higher biomass consumption compared to previous data - especially in small sources
- Total consumption of primary RES in 2003:- approx. 49,2 PJ = 2,8% of TPES- lower share of hydro energy than in 2002- share of wind energy still negligible
Biomass + biogass:37,4 PJ of primary fuel => 29,6 PJ heat + 481 GWh electricity

International Slovak Biomass Forum, Bratislava 2005
Current utilisation of biomass in the Czech Republic - facts
• 2003: 29,6 PJ heat + 481 GWh electricity from biomass + biogas• > 35 thous. biomass boilers (< 50 kW) in family houses (woodchips,
log wood), smaller number of pellets boilers• Industry & commerce: approx. 80 biomass boilers >1 MW + approx.
30 waste wood boilers up to 3 MW in wood processing industry • > 25 small district heating systems with BM sources
(0,5 - 9 MW, woodchips, straw) installed in 1994 – 2003• Extensive RME (biodiesel) market - result of “Oleoprogram” (started
1992) - support for production capacities of RME + subsidies + tax. exempts - current prod. capacity approx. 75 000 t/year
• Energy crops – commercial production just in the beginning (approx. 1250 ha in 2004, growing tendency)

International Slovak Biomass Forum, Bratislava 2005
Biomass potentials in the Czech Republic
Type of Biomass (biofuel)Current utilisation
2003[PJ/year]
Available potentials 2010[PJ/year]
Firewood and waste wood, other solid biofuels 37,2
0,040,2
~ 02,66
~ 0Biogas 1,7 4,7 - 7 (21,8)TOTAL 41,8 72,4 – 121,6 (176,9)
32,8 - 39,3 *
Cereal straw 6 - 22,4Rapeseed straw 9,7 - 12,2Energy crops 6 - 22,5 (63)Biodiesel 4,2 - 9,2Bioethanol < 9
Source – potentials: National Energy Efficiency Study – Czech Republic 1999 (lower estimate), CZ BIOM 2002(higher estimate)* underestimated ???

International Slovak Biomass Forum, Bratislava 2005
RES support policy in the Czech Republic– current status
• Energy Act (458/2000) and Energy Management Act (406/2000)• Decrees - definition of RES (214/2001), buy-out of electricity from RES and
CHP (252/2001)• 2001 - 2005 Feed-in tariffs for RES electricity (incl. from biomass or biomass
co-firing with fossil fuels)• Integration of RES into local/regional energy plans• Continuation of updated National programme for promotion of EE and wider
use of RES: investment + non-investment support for RES projects (Czech Energy Agency, State Environmental Fund, Ministry of Agriculture)
– Investment subsidies for individual projects (BM boilers, CHP)– Production subsidies - energy crops, RME + bioethanol (non-food
agricultural production)• Continuation and update of framework measures – partially tax incentives,
Kyoto mechanisms (JI, ET)

International Slovak Biomass Forum, Bratislava 2005
0
0,5
1
1,5
2
2,5
3
2002 2003 2004 2005
CZK
/kW
h
0
2
4
6
8
10
€c/k
Wh
Solid biomass and biogas(installations until 2004)Biogas (installations after 2004)
Woodchips / sawdust co-firing
Wood waste / straw co-firing
Energy crops co-firing
Biomass-produced electricity supportProblems with large-scale co-firing

International Slovak Biomass Forum, Bratislava 2005
RES support mechanisms and relatedproblems
• Tax incentives:• reduced VAT rate (5% instead of 19%) for biomass-based
fuels and selected RES + RUE equipment• zero excise tax on biodiesel and bioethanol and• reduced VAT (5% instead of 19%) on heat from district heating
• Carbon/energy tax: several studies/analyses already done, introduction desirable but “wait for EU” position
• RES-E support scheme:• fixed feed-in tariffs since 2002 announced by ERO annually, • no long-term guarantee, • problems with large scale biomass co-firing, • new Renewable Energy Law more than 2 years under discussion with
no results

International Slovak Biomass Forum, Bratislava 2005
Barriers for wider use of biomass in the Czech Republic (1)
• Current biomass market = result of framework conditions, variousother factors, efforts and developments, very often unbalanced andcontraproductive => non-existence of stable biomass market with clear rules
• Energy policy - current targets for RES - non-binding, inconsistent, still missing framework support mechanism(s) – not only for RES-E but also for RES-heat ! Priority must be given to biomass incl. energy crops – necessary close coordination of Ministries of Industry and Agriculture
• Differences in individual country markets – not supportive to development - prices of briquettes, pellets - distortion given by low prices of competitive fuels (coal) and high prices of biofuels in neighbour countries (AT, DE) => export rather than local use of refined biofuels

International Slovak Biomass Forum, Bratislava 2005
Barriers for wider use of biomass in the Czech Republic (2)
• Information about realistic possibilities and potentials of BM oftenconfusing - contradictory information on pollution from BM combustion (dioxins), uncritical promotion of energy crops monocultures, etc..
• Most of larger biomass projects dependent on grant support: grant financing + pressure of technology suppliers => low economic efficiency of projects (oversized, inadequate technology, low connection rate)
• Low quality of project development (economic and technology asssessment, biomass logistics) => several examples of problematic projects

International Slovak Biomass Forum, Bratislava 2005
RES support policy in the Czech Republic– what next?
• New Renewable Energy Law under preparation since 2003 –now 2nd reading in the Parliament
- compliance with RES-E Directive 2001/77/EC and White Paper- indicative targets for RES and RES-E - 8% RES-E in 2010
(currently approx. 2.5 % RES, 2-4% RES-E) => very ambitioustarget
- priority on biomass – will be clear after adoption of implementingDecrees
- RES-E support - most probably „green bonus“ scheme (more/lessmodified current feed-in tariff scheme)
- BIG QUESTION - new support scheme for heat from RES – not found its way into current version of Renewable Energy Law proposal

International Slovak Biomass Forum, Bratislava 2005
Conclusions• Biomass – key contributor to meeting of RES indicative targets in the CR• Necessary new support schemes for RES-E and RES-heat – hopefully
during 2005• Necessary to balance support to co-firing of biomass• Financing support – rather soft loans than grant support• Necessary to support improvement of project development• Necessary to stimulate local solid biofuels market (wood pellets,
briquettes, woodchips) - biomass logistics / market information / fuelsexchange
• Need for initial support for increase of production capacities of refined biofuels (pellets)
• Necessary coordination of energy / agricultural / regional policies(support of non-food agricultural production – biofuels, energy crops)

International Slovak Biomass Forum, Bratislava 2005
Thank you for your attention
Contact:
Jaroslav JakubesEnviros, s.r.oNa Rovnosti 1130 00 Praha 3Czech Republic
tel.: +420 284 007 493fax: +420 284 861 245e-mail: [email protected]: www.enviros.cz

POTENTIAL AND TRADING OPPORTUNITIES FOR BIOMASS IN POLAND
Dr Magdalena Rogulska Deputy Director EC Baltic Renewable Energy Centre (EC BREC/IBMER) Centre of Excellence and Competence in Renewable Energy in Poland RECEPOL ul. Rakowiecka 32, Warsaw, Poland +48 22 8484832 Mr Krzysztof Gierulski Deputy Director EC Baltic Renewable Energy Centre (EC BREC/IBMER) Ul. Reduta Zbik 5, Gdansk, Poland +48 58 3016636 www.ecbrec.pl ABSTRACT Rural areas are a vital element in the Polish economy. Agricultural lands occupied about 60% of the Poland territory. Agriculture and forestry give only 4.8% of GDP but 27% of the employed in Poland work in agriculture (0.4% in forestry). Local renewable energy sources can play a significant role in the development of rural areas in Poland. Biomass energy has been recognised as a most promising and most important renewable energy source in near future for Polish conditions. The total technical potential for biomass resource has been calculated at 755 PJ. Largest resources relates to the agricultural residues, forestry residues and forestry fuel wood. Energy crops will play more important role in mid and long term perspective. The development of biomass technologies is the fastest growing RE branch in Poland. In the paper actual situation of biomass sector in Poland is presented as well as trends of development in short and mid term perspective.
BACKGROUND Rural areas are a vital element in the Polish economy. There are some regions where agriculture is still the major sector of the economy. The share of agriculture in GDP (including hunting and forestry) was 4.8% in 2001 with a continuous downward trend (in 1988, it was 11.8% as compared to 6.4% in 1994). Reduced share of agriculture in GDP results from declining prices and volume of agricultural output accompanied by the rapidly growing prices and output volume in other sectors of the economy, especially industry. The average employment in agriculture (including hunting and forestry) reaches almost 4 million people, i.e. 25.8% of the total labour force. Agriculture is the main source of income for 4 390

thousand people, i.e. over 11% of Poland's total population, including 27.4% of the rural population. Rural areas have a very high unemployment rate reaching even 50% in some places. Additionally, rural areas show a negative economic balance - a large part of agricultural incomes often outflow to urban areas, e.g. with expenses related to energy costs [1]. The Polish agricultural sector covers many farms which are considerably vary in terms of their organisation structure, type of ownership, farm size and output volume. Unpredictable weather conditions and fluctuating profitability of various production lines result in a lack of agricultural production stability. The agricultural production in Poland is not regulated with a quota regime and the producer bears the entire production risk, with only few crop deliveries based on supply contracts (made between a producer and food processing plants), e.g. sugar beets, rape seed, flower and vegetable seeds. Mixed type of farming with crop growing accompanied with animal production prevails in most farms in Poland and the majority of them lack clearly defined specialisation. In the group of bigger farms with the acreage of over 50 hectares, over 38% have plant production only, 17% - animal production and 45% of such farms are involved in mixed farming. Only in 16.2% of all farms there are no livestock. Of the total number of farms, 64% have cattle and over 50% keep pigs. Total crops area in 2000 year was 12.4 million ha. In total structure basic cereals occupied 8.8 million ha (71.0%), potatoes - 1.3 million hectares (10.1%) and industrial crops - 0.8 million ha (6.5%). Crop structure was slightly changing during the last decade. Except for cereals acreage of which increased from 59.9% in 1990 to 71.0% in 2000, area of other crop production was decreasing. In Poland animal production is rather traditional, in small scale requiring high labour inputs, in bigger scale - consuming a lot of energy. Yearly quantities of cattle and swine excrements in Poland, estimated on the basis of analysis of the actual state of animal production and Ministry of Agriculture and Rural Development forecasts equal approximately 38 million m3 of liquid manure and 51 million tons of dung per year. In connection with those data it is obvious that in the whole country activities tending towards proper animal wastes storage and management should be carried out. Rational management of agricultural wastes based on their proper removal from livestock buildings, storage and afterwards utilization have enormous meaning for natural environment. Moreover, development of the complementary sanitation systems in agriculture, including anaerobic wastes treatment installations, is necessary for solving problems in rural regions connected with three main types of organic pollution sources: human liquid and solid wastes, animal production wastes and wastes from small agro-food industry. Agriculture is this branch of the economy in which there are the most favourable conditions for practical realisation of the principles of sustainable development by way of production of wholesome food, by proper management of the environment and by implementation of technologies utilising renewable sources of energy. Conventional methods of cultivation are more and more often regarded as unfavourable to sustainable development. The progress of technology and intensification permit greater production but the costs, quality, waste and adverse effects on the environment are becoming a problem. On the other hand, agriculture

is a producer of a large volume of biomass which is generally not used as a source of income for farms. The creation of new jobs as well as the generation of additional income is one of the priorities of sustainable regional development. The utilisation of local sources of energy in order to satisfy local energy requirements makes the local market stronger and additional income supports the local community.
NATIONAL POLICY SUPPORTING BIOENERGY The problem of the renewable energy sources (RES), in that bioenergy, covers the issues that are traditionally within the scope of responsibilities of several ministries; thus the works on the documents referring to various aspects of RES utilisation were initiated in different institutions. The policy-making documents are of strategic nature and deal with specific areas of the country’s development. When talking of the important documents which touch upon RES development, the following should be mentioned: ‘National Development Plan’1, ‘Initiative, Development, Labour’2, ‘Development Plan of the Polish Rural areas 2004-2006’3, ‘National Environmental Policy for the period 2003-2006 with the 2007-2010 perspective’4.
One of the key strategic documents is the ‘National Development Plan 2004-2006’ which sets the strategic objective of creation of competitive economy based on knowledge and initiative, assuring long-term, sustainable development, employment-rate increase and ability to catch up with the EU economic and social standards both on regional and governmental level. The following objectives considered of prior importance in the document can contribute to the RES development: high level of environmental protection, increase of share of high value added sectors (e.g. biomass), support for all regions and social groups to participate in the development and modernisation processes. Structural transformations in agriculture and fisheries constitute one of the social and economic development axes of NDP. Financial resources to support the achievement of the objectives set in the document will be provided by the EU (structural funds and coherence funds) as well as by the national institutions (central budget, local governments’ budget and targeted funds). The Sectoral Operational Programme (SOP) The Restructuring and Modernisation of the Food Sector and Rural Development constitutes one of the elements of the social and economic development strategy defined in the National Development Plan.
1 The Council of the Ministers. 2003 ‘National Development Plan for the years 2004-2006’, 2 The Council of the Ministers. 2002. ‘Initiative, Development, Labour. Economy Strategy of the Coalition SLD-PSL’ 3 Ministry of Agriculture and Rural Development 2002. ‘Rural Areas Development Plan for Poland for the years 2004-2006’ 4 The Council of Ministers. 2002. ‘National Environmental Policy for the period 2003-2006 with the 2007-2010 perspective’

The following objectives have been defined in the SOP strategy: 1) enhancing the competitiveness of agriculture and the food economy, 2) sustainable development of rural areas. The above will be implemented within the three priorities of the programme: I. Supporting change and adjustment in agriculture. II. Sustainable development of rural areas. III. Development and adjustment to EU norms regarding to the processing of agricultural production. The SOP covers the years 2004-2006 and its implementation will be based on EU funds together with domestic funds (state budget, local government and support beneficiaries’ own funds). The Polish policy regarding renewable energy is guided by the accession to the EU and the adherence to the Kyoto Protocol. The end of 90-s is the period of increased political engagement in creating conditions for renewable energy development. In 2000, the Council of Ministers adopted the document ‘Development Strategy of Renewable Energy Sources‘, then it was endorsed by the Parliament in 2001. It is the first policy document relating to the whole renewable energy sector, pointing the basic goals and conditions for its development to 2020. It was elaborated in response to the EU White Paper ‘Energy for the future: Renewable Energy Sources’. The ‘Strategy’ calls for 7,5% contribution of renewable energy to the primarily energy of the balance in 2010 and 14% in 2020, as development targets for renewable. Such increase of renewable in the energy balance would require production of 340 PJ of ‘green energy’ in 2010, i.e. growth by 235 PJ compared with 1999, assuming the energy needs of Poland in 2010 at 4570 PJ. Such targets oblige the government to take actions to actively support renewable in Poland. The amounts are ambitious: in comparison to ca.2,5% share in 1999, it means triple increase in utilisation of energy produced from renewable sources during the coming ten years. The document ‘Environmental Policy for the period 2003-2006, with the 2007-2010 long-term perspective’, an up-dated version of the Second Environmental Policy, gives much attention to the RES use, in that bioenergy as well. The process of Poland’s accession to the EU and the transposition of the Polish legal system resulted in gradual adoption of the EU regulations in the field of the RES development to the Polish conditions, what has also significant impact on bioenergy sector. For example Directive 2001/80/EC on the limitation of emissions of certain pollutants into the air from large combustion plants is a strong driving force for development of co-firing biomass with coal at large scale in the country. BIOMASS POTENTIAL Poland posses large potential for the most kind of various bio-energy resources, but in the short period the most important are :
• wood from forests, tree cuttings, orchard waste and short rotation coppice;

• straw and other by-products and/or wastes from agricultural production; • liquid/solid manure used for methane fermentation; • oil seeds processed into esters used as bio diesel; • potatoes, cereals and other crops or wastes processed into ethanol.
Estimates of the present use of bioenergy are uncertain, because there is lacking statistics on that subject. Technical potential for biomass resources has been calculated at the level of over 755 PJ but Poland's geographical location as well as its diversified water and climate conditions may contribute to the growth of the potential of biomass allocated for energy purposes. Largest resources relates to the agricultural residues - basic cereals straw and hay c.12 mln t/year (195 PJ) [2], forestry residues 6-7 mln m3 and forestry fuel wood 2,5 mln m3 (41,6 PJ). Wood industry by-products, which equals ca. 8,3 mln m3 (58,1 PJ) are also potential resource for energy production. Diversification of regional economic development causes possibility for finding, relatively rich logging-residue and agricultural areas in Poland, where it might be supplied to the district heating systems. Table 1. Theoretical and technical energy potential of straw in Poland [2].
Type Total quantity(mln tons)
Utilisation factor
(%)
Quantity available for
energy purposes (mln ton)
Technical potential
(PJ)
Cereals straw 21,5 50 8,9 147 Rape straw 2,4 70 1,4 23
Hay 18,1 10 1,5 25 TOGETHER 11,8 mln t 195
The use of straw for energy was estimated on 40 ktons in 2001, or about 0.5 PJ. In 2002 there were about 65 small and medium scale (0,5 – 7 MWt) straw fired district heating plants, the first of which were implemented as demonstration projects in 1995. In addition there were perhaps 150 straw fired boilers in agricultural dwellings. It was estimated in Polish conditions that for every 1 MWt straw-fired district heating, it is needed employment of 3÷4 people [2]. Some results shows the costs of straw-fired small-scale district heating as the cheapest among the other sources of fuels, although the investment cost are relatively higher than natural-gas or fuel-oil. Utilisation of biogas in terms of digestion of liquid manure, sewage sludge and landfill gas production plays less important role than solid biofuels. Energy crops will play more important role in mid and long term perspective. Currently there has been several pilot and research short rotation coppice (SRC) plantations. Poland has not implemented internal governmental support system for energy crops, therefore further development is expected to be achieved by CAP regulations provided by the EU.

There are 2,3 Mha of unused land and about 645 thou. ha of contaminated agricultural land which may be withdrawn from agricultural use [1]. Using this area for short rotation coppice would result in c.424 PJ. Thus, the near term potential is much more greater than the present bioenergy use.
B io g a s5 %
O th e r e n e rg y c ro p s5 6 %
F o re s t re s id u e s &
w o o d w a s te1 3 %
S tra w , h a y2 6 %
Figure 1. Estimation of technical biomass potential in Poland, PJ (EC BREC/IBMER 2003) ENERGY CROPS Among energy crops tested in the country conditions are: short rotation coppice of willow (e.g. Salix viminalis), perennial grasses like Miscanthus s. giganteus, Miscanthus s sacchariflorus, artichoke, Rosa multiflori and Sida hermaphrodita. At present Salix Viminalis is most common energy crop. Total area currently cultivated is not exceeding 2000 ha. Willow plantations are used as biological sewage-treatment plants especially in rural regions. High annual growth of biomass indicates usefulness of those plantations for energy purposes. First trials showed that it is possible to gain 15-20 tons of dry matter per year from 1 hectare. Willow is also a good filter trapping toxic compounds from soil. These species however require special habitat conditions, mainly water and this fact must be taken into account while planning future energy plantations. Shortage of equipment for willow harvest on Polish market is another barrier for wider implementation. Pilot Salix plantations have been established and analysed by the Warmia-Mazury University in Olsztyn [3]. The pilot plants were established close to the University in Olsztyn (North-East) and second pilot plantations close to the Vistula river (North). Conducted tests included investigations of the yield mass in dependence on different factors (density of plants, cutting cycle, different clones). Usefulness of chosen perennial grasses of C-4 photosynthesis with a high biomass production also was tested in Polish conditions as potential raw material for energy production. Many species of potential energy grasses were analysed in the Institute of Growing and Acclimatisation of Plants and particularly by its Botanical Garden in

Bydgoszcz. Since 1971 there were collected over 400 species of grasses. The species included: Miscanthus giganteus, Miscanthus sacchariflorus, Miscanthus sinensis, Spartina pectinata (Praerie cordgras), Andropogon gerardi (big bluestem), Panicum virgatum (switchgrass), Arundo donax. The results of analysis had shown that amongst investigated species mainly Arundo donax and Miscanthus giganteus were interesting for energy purposes due to high yields [4]. Tolerant to heavy metals concentrations indicate that these species may be suitable for planting along the roadsides. Perspective breeding programs for 'alternative grasses' in Poland should cover: soil and climatic requirements, multiplication, agricultural methodology and technology of processing. LIQUID BIO-FUEL (RME, ETHANOL) Liquid biofuels, ethanol and biodiesel, have attracted huge interest in Poland and “hot” discussion from several years. Surplus production of ethanol stimulated the first experiments with using ethanol as an additive to gasoline in 1991. Raw materials include molasses and low quality grain, potatoes or other agricultural products. In 1997 ethanol additive to gasoline reached 100 ktons/a then dropped to c.50 ktons/a and remains stable until 2003. As concerning rape methyl ester (RME) Poland has only some small production on a pilot scale and some projects under development phase. A key driving force was the expectation that liquid biofuels can facilitate rural industrialization and reduce the high unemployment rates in rural regions. Act on Biofuels and Biocomponents was prepared in 2002 but since it was vetoed by the President the whole legislative procedure was undertaken which resulted in new proposal of the act (March 2003) adopted by Parliament in October 2003. However this version of Biofuel Act was also neglected, this time by Constitution Tribunal. So at that moment future of liquid biofuels in Poland is not clear.
BIOGAS National Sanitary Inspectorate in 1997 classified over 60% of the controlled rural water wells as polluted. Anaerobic digestion of animal manure is one of the options to minimise negative environmental impact of animal farms. The most responsible for water pollution in the rural areas in Poland is animal production and intensive fertilising. Until now, biogas plants in agriculture have been developed mainly to generate thermal energy only and, in some cases, to produce high quality fertiliser as a by-product. In the recent 20 years in Poland 10 biogas installations have been developed at individual farms. The majority of them are not working for both economic and technical reasons. Prospective investors has been discouraged by high investment costs and the lack of adequately proven technologies. However, there is a an interest in biogas production for energy at big industrial pig or cattle breeding farms and several, centralised co-fermentation biogas plants are being under development. The total biogas technical potential was estimated as 34 PJ in Poland [5]. Current utilisation of biogas is only around 1,5 PJ. The biggest is the technical potential of agricultural biogas. Landfill biogas also presents significant technical potential.

Poland has about 30 biogas systems in waste water treatment plants with an installed capacity of about 38,9 MW producing approximately 250 TJ heat and 72 GWh electricity. This equals together 1 PJ primary energy from municipal biogas.
15,2
11,5
4,6
1,7 0,9
02468
10121416
agriculturalbiogas
landfill biogas municipalbiogas
industrialbiogas
park greenwaste
PJ
Figure 2. Biogas potentials in Poland [5]
IMPLEMENTATION OF BIOENERGY TECHNOLOGIES The development of biomass technologies based on solid biofuels is the fastest growing RE branch in Poland. Successfully implemented several demonstration biomass DHP systems since 1990 pushed the market pressure causing great DHP operators interest in bioenergy. Wood-processing together with pulp and paper industry utilises majority of waste biomass since early 80’s so the sector development is at the advanced level. It may be predicted further intensive growth of production and import of domestic systems based on fuel wood and straw. The nearest bioenergy challenge is implementation of full chain biofuels production and larger scale biofuels market development. Further relevant renewable policy objectives improvement and solid biofuels market development should create basis for larger scale biomass electricity production and cogeneration in long term perspective. Development of liquid biofuels market waits on final political decisions. Detailed analysis of biomass market potential shows huge perspectives for bioenergy development in Poland. Solid-biofuels may play a very important role in the development of rural areas energy systems in short and mid-term. Elaboration of the renewable energy related policy within next years should be one of strongest factor in bioenergy development support. Current needs in short-term perspective in a field of solid biofuel utilisation include among other: prooven small-scale technology for domestic dwellings (<40 kW) from ecological and economical point of view, intensive district heating straw-fired technologies implementation (0,5–5MW), full chain equipment import or production (chippers, forwarders, transporters, containers handling and storage facilities) for forestry fuel production, elaboration and implementation of local forestry wood fuels production and supply demonstration projects, experience in planning, consulting and implementation of medium-scale projects.

Table 2. Biomass energy technologies implemented in Poland– state in 2002 (ECBREC & GUS, 2003)
Energy production per year* Type of installation
Power installed MW th/el Electricity
GWh Thermal
TJ CHP systems in pulp&paper and furniture industry
450 500 5000
Automatic wood-fired heating plants >500 kW
450 - 6750
Straw district heating plants >500 kW 90 - 920 Wood small and medium-scale boilers <500 kW
5 500 - 98800
Straw small and medium scale boilers <500 kW
23 - 230
Biogas plants (CHP and DH) 43 / 18 38 450 Landfill gas plants (CHP and DH) 19 / 7 22 200
In Poland the production of wood briquettes started in early 90’s, while production of wood pellets has started 3-4 years ago. At present on Polish market there are 15 producers of briquettes (in that one producer of straw briquettes) and 16 producers of pellets. Most of technologies of pellets/briquettes production is based in sawmills or manufactories consuming wood industry by-products. Wood briquettes (roughly estimated production - 65.000 t/year) are produced for Polish and EU market, while pellets are mainly exported to Germany, Denmark and Sweden. Data on production level has not been proved yet, as the market is in the initial phase however it can be estimated current production of pellets on c.130.000 t/year. BIOENERGY FINANCING Strong financial support for bioenergy at district heating sector and industrial projects has been developed in the last years. On average all investments in industrial and district heating applications have been supported with 30-50% investment subsidies. A rough estimate is that over 40 mln and 20 mln PLN as investment grants and soft loans subsidised bio-energy investments since 1990 mainly through national and bilateral financing. Some of the bioenergy industrial and district heating projects were funded through bilateral co-operation programmes with Sweden, Denmark, Finland and the Netherlands. EU structural funds and coherence funds are being expected to increase bioenergy applications especially in rural areas. There are also expectations that JI-projects (as Kyoto Protocol flexible mechanisms) will be a source of funding for bioenergy investments. Since 1995 several AIJ and JI pilot projects have been implemented in the country, notably

together with Norway, Canada, Finland and The Netherlands. Poland has signed MoU (Memorandum of Understanding) with Canada, Finland, The Netherlands and others are currently being under development. National guidelines for JI are being drafted, showing that 50-130 Mt CO2 equivalent may be available for the first commitment period. National priorities for JI are renewable energy (especially small- and medium-scale biomass district heating and wind), CHP, energy efficiency improvement and forestry activities. SUMMARY Taking into account analysis on both the utilization and technical potential of renewable energy sources in Poland one may state that, first of all, the use of biomass for heating sector and co-combustion in large plants will grow in the first phase, since it is a very cost-effective option. Also on the mid-term bioenergy production will play a crucial role in the development of renewable energy in Poland. It is expected that bioenergy will be the main contributor (more than wind and hydro) in green electricity target in Poland. Development of biofuels for transport sector depends on final political decisions. The only question – will be enough biomass available for fulfilling all targets in short term? The most important activities on bioenergy utilisation include elaboration of long-term strategy of bioenergy sector development in Poland. The main objective of it is an assessment of possible Polish input in development of biomass-energy technologies and technologies of production of liquid, solid and gaseous fuels as well as support to integration process of Polish agriculture with EU agriculture. Results should help reaching of quantities targets of RES share in energy balance, implementation of Kyoto protocol, improvement of energy security in enlarged European Union (EU25) and identify conditions for sustainable development of rural areas (in that assessment of external costs and benefits). These actions to be taken in the near future will enhance the development of bioenergy market in Poland although it is clear that through close regional co-operation, especially with neighbouring countries, a stronger synergic effect can be achieved through better transfer of experience/technology, development of common standards and financial frameworks for joint projects. Concluding it should be stated that despite major expectations (national RES Strategy for Poland) and forecasting for technical opportunities relating to bioenergy deployment in Poland (ECBREC, 2000) the sector faces difficulties in entering the market due to various imperfections of the legal/policy framework in Poland. Closer co-operation and joint research within the enlarged EU may help design solutions suitable for wider implementation of bioenergy in the region.
REFERENCES
[1] GUS – Central Statistical Office. Statistical Yearbook of Poland, Warszawa, 2003.
[2] GRZYBEK A., GRADZIUK P., KOWALCZYK K.. Straw-as a fuel, Warsaw POLBIOM, 2001.
[3] SZCZUKOWSKI S., BUDNY J., „Wierzba krzewiasta – roślina energetyczna. Poradnik” (Willow as an energy crop. Guideline), Olsztyn 2003.
[4] MAJTKOWSKI W. Perennial grass species as energy crops in Poland. Proceedings of the international conference “Renewable energy sources on the verge of the XXI century”. Warsaw 10-11th December 2001.
[5] ONISZK-POPŁAWSKA A. , ZOWSIK M., NOWAKOWSKI S. State of the art and perspectives for development of different biogas technologies in Poland. VIII Polish-Danish Workshop on Biomass for Energy, Starbienino, June 2003

ENERGY WOOD POTENTIAL OF FORESTS IN THE EUROPEAN UNION
Ján Ilavský, Timo Karjalainen, Antti Asikainen Finnish Forest Research Institute Joensuu Research Centre Yliopistokatu 6, 80101 Joensuu, Finland Tel.: +358 10 211 3296 E-mail: [email protected]
ABSTRACT The potential sources of forest fuels in 25 EU member countries are presented. Felling residues and stumps from current fellings as well as the roundwood balance between the net annual increment and current fellings were identified as potential energy wood resources. It was estimated that felling residues total 173 mill. m3
annually. Annually harvestable felling residues were estimated to be 63 mill. m3. In addition, about 9 mill. m3 stump wood from current fellings (out of 78 mill. m3 total potential) could be used for energy production. When 25 % of the roundwood balance, including above ground biomass, is directed to energy use, 64 mill. m3 of above ground biomass and about 4 mill. m3 of stump wood could be used for energy annually. Thus the available forest fuel totals about 140 mill. m3 per year, i.e. about 56 mill. owen dry tons of wood, which corresponds to about 280 TWh of energy or 24 Mtoe. This would be about 24% of the current use of renewables in EU25.

ISBF 2005, Bratislava, 21 – 22 February 2005
1
METSÄNTUTKIMUSLAITOSSKOGSFORSKNINGSINSTITUTETFINNISH FOREST RESEARCH INSTITUTEwww.metla.fi
Energy Wood Potential of Forests
in the European UnionJán Ilavský, Timo Karjalainen, Antti Asikainen
Finnish Forest Research Institute, Joensuu Research CentreYliopistokatu 6, 80101 Joensuu, Finland
Tel.: +358 10 211 3296, e-mail: [email protected]

ISBF 2005, Bratislava, 21 – 22 February 2005
2
METSÄNTUTKIMUSLAITOSSKOGSFORSKNINGSINSTITUTETFINNISH FOREST RESEARCH INSTITUTEwww.metla.fi
Contract from VTT Processes:results utilised in BioFuture project: Impact of increased use of bioenergy in Europe on forestand energy industries
Aim:estimation of energy wood potential in EU25, based on available statistics and reports reflecting the situation in late 1990’s - early 2000

ISBF 2005, Bratislava, 21 – 22 February 2005
3
METSÄNTUTKIMUSLAITOSSKOGSFORSKNINGSINSTITUTETFINNISH FOREST RESEARCH INSTITUTEwww.metla.fi
Gross Inland Consumption
Country group Country All fuels Renewables Biomass % of
renewables Finland 33.2 7.6 84Sweden 51.6 15.0 54Nordics
Total 84.8 22.6 Estonia 5.0 0.5 100Latvia 4.3 1.5 84Lithuania 8.2 0.7 96
Baltics
Total 17.5 2.7 Austria 30.3 6.7 45Czech Republic 41.0 0.7 74Hungary 25.1 0.4 95Poland 90.2 4.1 95Slovakia 18.5 0.7 41
C-E Europe
Total 205.1 12.6 France 262.3 18.6 65Germany 348.8 9.9 72Luxembourg 3.8 0.1
C-W Europe
Total 614.9 28.6 Belgium 55.6 0.8 88Denmark 19.9 2.2 82Ireland 14.4 0.3 67The Netherlands 77.6 1.6 94United Kingdom 232.5 2.7 85
N-W Europe
Total 400.0 7.6 Portugal 24.2 3.4 62Spain 126.3 8.3 50Iberia
Total 150.5 11.7 Cyprus 2.4 0.04 3Greece 28.9 1.3 77Italy 176.6 13.5 46Malta 0.9 - Slovenia 6.6 0.7 55
S & S-E Europe
Total 215.4 15.5 Grand total 1688.2 101.3
EU15•6% renewables•biomass 62% of the renewables
new member countries• 4.6% renewables•biomass 84% of the renewables
most of the biomass used for energy is wood

ISBF 2005, Bratislava, 21 – 22 February 2005
4
METSÄNTUTKIMUSLAITOSSKOGSFORSKNINGSINSTITUTETFINNISH FOREST RESEARCH INSTITUTEwww.metla.fi
Three parts of analysis:
3) Estimation of felling residues from forestsavailable for wood supply
1) Estimation of roundwood balance on forest available for wood supply, i.e. estimation of unutilised roundwood potential that could be used for energy purposes, but also for manufacturing conventional products in the forest based industries or not harvested
• Roundwood balance calculated as a difference between net annual increment and fellings
2) Roundwood and conventional fuelwood production

ISBF 2005, Bratislava, 21 – 22 February 2005
5
METSÄNTUTKIMUSLAITOSSKOGSFORSKNINGSINSTITUTETFINNISH FOREST RESEARCH INSTITUTEwww.metla.fi
Methods• background data
– data for net annual increment (NAI), fellings, and balance between NAI and fellings from the UN-ECE/FAO Forest Resources Assessment 2000 report (national data adjusted to fit internationally agreed terms and definitions)
– data for Cyprus from 1980’s – early 1990’s, for the other countries from mid 1990’s
– Estimation of roundwood and fuelwoodproduction based on the data from the Finnish Statistical Yearbooks 1999-2001 (FAOSTAT Forestry Data)

ISBF 2005, Bratislava, 21 – 22 February 2005
6
METSÄNTUTKIMUSLAITOSSKOGSFORSKNINGSINSTITUTETFINNISH FOREST RESEARCH INSTITUTEwww.metla.fi
Results on roundwood balance• standing volume (growing stock + dead
trees)18 140 million m3 (65% conif.)• growing stock 17 930 million m3
– 66% in five countries: France, Germany, Sweden, Finland and Poland
– 32% in Germany and France• forest resources increasing, since 1950
– forest cover +8%– average growing stock +10%– average net annual increment +25%

ISBF 2005, Bratislava, 21 – 22 February 2005
7
METSÄNTUTKIMUSLAITOSSKOGSFORSKNINGSINSTITUTETFINNISH FOREST RESEARCH INSTITUTEwww.metla.fi
NAI Fellings Roundwood balance
Coniferous species dominated forests 384.9 277.1 107.8
Broadleaved species dominated forests 190.7 112.2 78.5
Total 575.6 389.3 186.3
Results on roundwood balance, continued
• fellings 68% of the NAI– 72% in conif.– 59% in broadl.
• roundwood balance 186 million m3/yr, i.e. unutilised increment 32% of the NAI
• more than 16% of the fellings used for energy production (industrial residues and recovered products)
•use of rounwood for energy purposes would depend of the prices for roundwood, wood-based products, energy
ISBF 2005, Bratislava, 21 – 22 February 2005
8
METSÄNTUTKIMUSLAITOSSKOGSFORSKNINGSINSTITUTETFINNISH FOREST RESEARCH INSTITUTEwww.metla.fi
020
406080
100
120140160
180200
Nordics Baltics C-E-Europe
C-WEurope
N-WEurope
Iberia S & S-EEurope
Mill
ion
m3/
yr o
.b.
NAI
Fellings
Roundwood balance
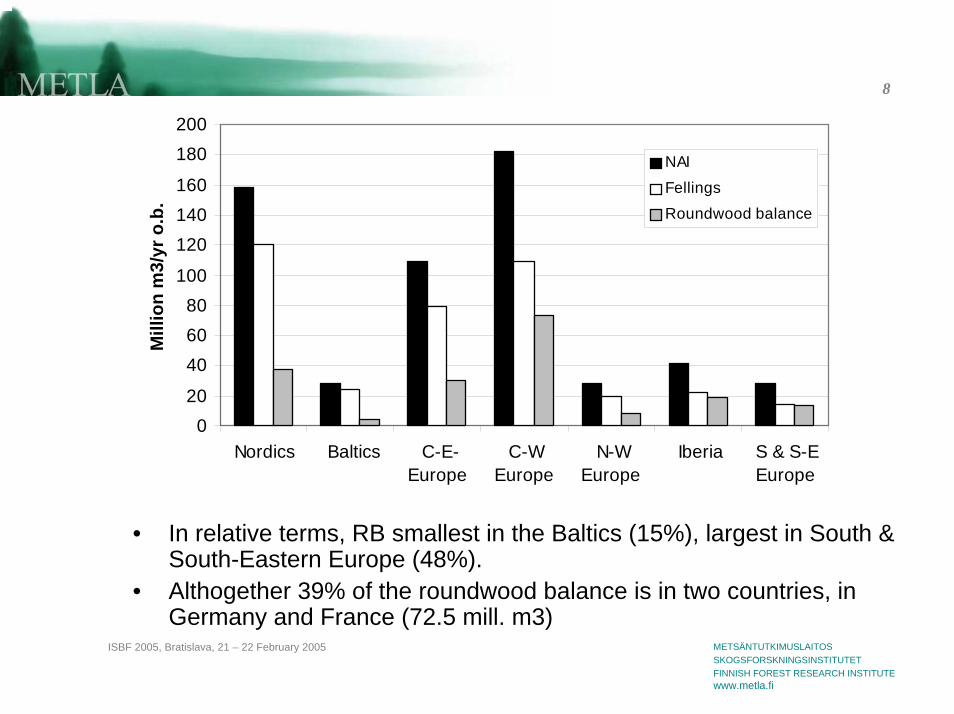
• In relative terms, RB smallest in the Baltics (15%), largest in South & South-Eastern Europe (48%).
• Althogether 39% of the roundwood balance is in two countries, in Germany and France (72.5 mill. m3)

ISBF 2005, Bratislava, 21 – 22 February 2005
9
METSÄNTUTKIMUSLAITOSSKOGSFORSKNINGSINSTITUTETFINNISH FOREST RESEARCH INSTITUTEwww.metla.fi
Roundwood production (RP)
• wood over bark harvested from forests and used for commercial wood processing and fuelwood purposes during a year
• 368 million m3 per year in late 1990s (15% higher in 2000 than in 1997)– Approximately 69% softwood– Relative proportion of softwood logs 63% and hardwood logs
52%– 62% in Sweden, Finland, Germany and France
• Conventional fuelwood production – 48,4 million m3 per yearor – 13% of RP

ISBF 2005, Bratislava, 21 – 22 February 2005
10
METSÄNTUTKIMUSLAITOSSKOGSFORSKNINGSINSTITUTETFINNISH FOREST RESEARCH INSTITUTEwww.metla.fi
Estimation of felling residues from fellings of forests available for wood supply
Main sources of felling residues:
1. Residues from fellings of roundwood (branches, needles, tops, off cuts)
2. Potential residues from felling balance
3. Stumps and coarse roots

ISBF 2005, Bratislava, 21 – 22 February 2005
11
METSÄNTUTKIMUSLAITOSSKOGSFORSKNINGSINSTITUTETFINNISH FOREST RESEARCH INSTITUTEwww.metla.fi
Estimation of biomass components:
Roots estomation Roots estomation(Nordic and Baltic countries) (rest of Europe)
BROADLEAVED Group / 14.7%8.0%78.2% 12.1% 1.7%
67.7%
19.1%
19.3%
Stem+stembark Branches Needles
55% 24% 11%
TOTAL
SPRUCE Group
PINE Group 8%
Tops
2%
17.7% 4.6% 2%
Decayed stem
8% 100%
100%
100%
21.9%
19.8%
22.4%

ISBF 2005, Bratislava, 21 – 22 February 2005
12
METSÄNTUTKIMUSLAITOSSKOGSFORSKNINGSINSTITUTETFINNISH FOREST RESEARCH INSTITUTEwww.metla.fi
ResultsTheoretical forest fuel resources of EU25:logging residues + balance = 560 mill. m3 (+144%)
BIOMASSCOMPONENTS
ROOTS 78
BRANCHES 93,9
9,7
NEEDLES
TOPS
28,8
OFF CUTS 40,8
LOGGING RESIDUES
million m3/y
(STEM+STEMBARK) (389.3)
BIOMASSCOMPONENTS
BALANCE = NAI - FELLINGS
46
million m3/y
STEM+STEMBARK 186.3
ROOTS 37.7
13,6
4,8
NEEDLES
TOPS
OFF CUTS 20,3
BRANCHES
ISBF 2005, Bratislava, 21 – 22 February 2005
13
METSÄNTUTKIMUSLAITOSSKOGSFORSKNINGSINSTITUTETFINNISH FOREST RESEARCH INSTITUTEwww.metla.fi
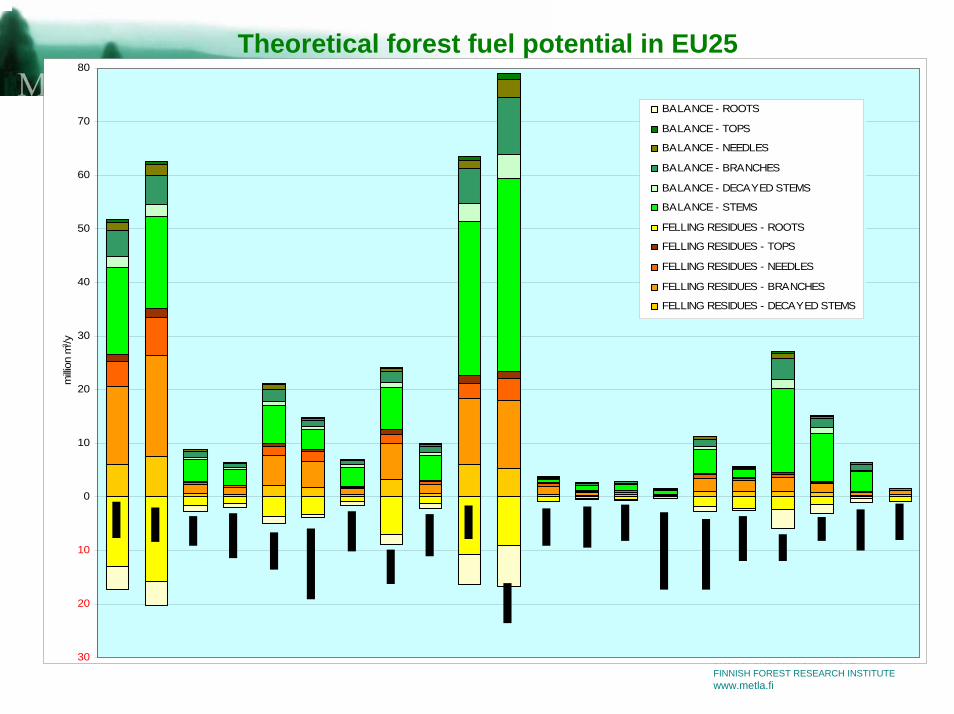
Theoretical forest fuel potential in EU25
30
20
10
0
10
20
30
40
50
60
70
80m
illion
m3 /y
BALANCE - ROOTS
BALANCE - TOPS
BALANCE - NEEDLES
BALANCE - BRANCHES
BALANCE - DECAYED STEMS
BALANCE - STEMS
FELLING RESIDUES - ROOTS
FELLING RESIDUES - TOPS
FELLING RESIDUES - NEEDLES
FELLING RESIDUES - BRANCHES
FELLING RESIDUES - DECAYED STEMS

ISBF 2005, Bratislava, 21 – 22 February 2005
14
METSÄNTUTKIMUSLAITOSSKOGSFORSKNINGSINSTITUTETFINNISH FOREST RESEARCH INSTITUTEwww.metla.fi
Estimation of technically harvestableforest fuel potential
REDUCTION FACTORS:
1. On 75% of clearcut sites and on 45% of thinning sites, residues can be harvested
65% of residues from mechanized cutting are recoverable
50% of residues from manual cutting are recoverable
2. 20% of volume of roots from clearcuts are harvestable
3. 25% of volume of balance is harvestable(roots volume of balance is not taken under consideration)

ISBF 2005, Bratislava, 21 – 22 February 2005
15
METSÄNTUTKIMUSLAITOSSKOGSFORSKNINGSINSTITUTETFINNISH FOREST RESEARCH INSTITUTEwww.metla.fi
Volume of available forest fuels by country
Share of timber Share of Total felling AVAILABLE RESIDUES AVAILABLE RESIDUES FELLING RESIDUES BALANCEfrom clearcuts mechanization in residues OF FELLING OF BALANCE VOLUME OF ROOTS VOLUME OF ROOTS
Austria 18 % 30 % 10,1 2,9 2,7 0,2 0,1
Belgium (70% by default) 80 % 2,6 1,1 0,3 0,1 0,0
Cyprus
Czech Republic 83 % 10 % 8,9 3,2 1,5 0,5 0,1
Denmark 70 % 50 % 1,2 0,4 0,4 0,0 0,0
Estonia 73 % 55 % 1,6 0,6 0,0 0,1
Finland 79 % 97 % 26,7 11,4 6,3 1,8 0,6
France 76 % 40 % 22,6 8,6 10,2 1,6 0,9
Germany 5 % 35 % 23,4 6,0 13,9 0,1 0,1
Greece 6 % 0 %
Hungary 72 % 15% A.A. estimation 2,0 0,7 1,2 0,1 0,1
Ireland 82 % 95 % 1,3 0,6 0,4 0,1 0,0
Italy 20 % 2 % 2,9 0,7 3,1 0,1 0,1
Latvia 76 % 5 % 2,9 1,0 1,5 0,2 0,2
Lithuania 50 % 0 % 2,2 0,7 1,1 0,1 0,1
Luxembourg
Malta
The Netherlands 80 % 25 % 0,6 0,2 0,3 0,0 0,0
Poland 44 % 2,0% 12,5 3,6 2,9 0,6 0,2
Portugal (70% by default) (40% by default) 3,6 1,3 0,5 0,3 0,0
Slovakia 40,2% 0,7% 3,0 0,9 1,7 0,1 0,1
Slovenia 0 % 0,7% 1,1 0,3 1,3 0,0 0,0
Spain (70% by default) (40% by default) 4,4 1,6 5,7 0,3 0,5
Sw eden 70 % 98 % 35,2 15,0 6,9 2,2 0,6
United Kingdom (70% by default) 90 % 4,4 1,8 1,7 0,2 0,1
COUNTRY
TOTAL 173,2 62,6 63,5 9,0 3,8
% cutting % (mill. m3 /y) (mill. m3 /y) (mill. m3 /y) AVAILABLE (mill. m3 /y) AVAILABLE (mill. m3 /y)

ISBF 2005, Bratislava, 21 – 22 February 2005
16
METSÄNTUTKIMUSLAITOSSKOGSFORSKNINGSINSTITUTETFINNISH FOREST RESEARCH INSTITUTEwww.metla.fi
Volume of technically available forest fuels in EU25:71.6 mill. m3 from felling residues + 67.3 mill m3 from balance = 138.9 mill. m3
= approximately 25% of the theoretical potential 560 mill. m3
TOTAL AVAILABLE AVAILABLE VOLUME OF ROOTS VOLUME OF ROOTSFELLING RESIDUES SHARE AVAILABLE AVAILABLE
RESIDUES OF FELLING OF BALANCE FROM FELLINGS FROM BALANCE(mill. m3 /y) (mill. m3 /y) (mill. m3 /y) (mill. m3 /y) (mill. m3 /y)
3,8173,2 62,6 63,5 9,0
above ground 36% ofresidues
25% of above ground balance
14% on top of above ground availablefelling residues
6% on top of above groundavailable balance

ISBF 2005, Bratislava, 21 – 22 February 2005
17
METSÄNTUTKIMUSLAITOSSKOGSFORSKNINGSINSTITUTETFINNISH FOREST RESEARCH INSTITUTEwww.metla.fi
The whole study is available in PDFformat at:
http://www.metla.fi/julkaisut/workingpapers/2004/mwp006.htm
Thank you for your attentionĎakujem za pozornosť

REFITS – AN INSTRUMENT FOR RENEWABLES’ MARKET LAUNCH BESIDES OTHERS
Alexandra Langenheld, Christof Stein Division “Solar energy, Biomass, Geothermal energy, market incentive pro-grammes for renewable energies” Federal Ministry for the Environment, Nature Conservation and Nuclear Safety, Alexanderplatz 6, 10178 Berlin, Germany +49 1888 305-3625 [email protected] ABSTRACT Achieving a sustainable energy supply requires the global turn of energy policy: Phasing out nuclear technology, cutting off the „oil-drip“ and replacing them by re-newable energies, economical use of energy and energy efficiency. To reach the German Federal Government’s goal of meeting 20 % of the needs of electricity by renewable energies until 2020 the increasing use of biomass – providing a reason-able mix of all lines of renewable energies – is an important premise in the future. Biomass is predicted to have a promising future because of its exceeding potential. It is the most multifaceted type of energy use requiring a well adapted and flexible raft of measures: Renewable Energy Sources Act, Market Incentive Programme and Ac-companying Ecological Research are the Federal Government’s instruments to sup-port biomass on its way to competitiveness on the energy market. INTRODUCTION Achieving a sustainable energy supply requires the global turn of energy policy: Phasing out nuclear technology, cutting off the „oil-drip“ and replacing them both by renewable energies instead of fossil resources, economical use of energy and en-ergy efficiency. To reach the Federal Government’s goal of meeting 20 % of the needs of electricity and 10 % of the needs of primary energy consumption by renewable energies until 2020 the increasing use of biomass – providing a reasonable mix of all lines of re-newable energies – is an important premise in the future. CONTENT 1. Energy policy and sustainability strategies 2. Challenges – Climate protection, economic efficiency and securing the energy
supply 3. Policy targets in the development of renewable energies – Where do we
stand?! 4. Biomass – The most multifaceted and oldest type of energy use 5. Political framework: Policy instruments for promoting renewable energies espe-
cially biomass – Renewable Energy Sources Act, Market Incentive Programme, Ecological Accompanying Research
6. Outlook – Market launch of biomass

ENERGY POLICY AND SUSTAINABILITY STRATEGIES Achieving a future-orientated energy supply is one of the Federal Government’s prime goals. In this, equal emphasis is laid on the following objectives: • conservation of the environment and resources, especially climate protection, • economic efficiency for producers and consumers and • securing the energy supply. Germany has initiated a new direction in energy policy. The key aspects are: • massive expansion of renewable energies, • marked improvements in energy efficiency and economical use of energy and • phasing out nuclear technology and its attendant risks. Additional information can be derived from the official website of the Federal Envi-ronment Ministry: http://www.bmu.de/de/800/js/base/ or the website especially for renewable energies: http://www.erneuerbare-energien.de/1024/. CHALLENGES …of climate protection On a worldwide basis, 70 % of the greenhouse effect is due to energy-induced CO2-emissions. In Germany the figure is as high as 88 %. Therefore Germany has under-taken to make a 21 % reduction in its emissions of the six greenhouse gases listed in the Kyoto Protocol from 1990 levels by 2008/ 12. Germany, along with the EU, advocates ambitious targets in the international nego-tiations that are starting on further development of the Kyoto targets after 2012 (sec-ond commitment period). Mentioned must be here the recently submitted special report of the WBGU (Scientific Advisory Council on Global Environmental Change) “Climate Protection Strategies for the 21st Century”. The Renewable Energy Sources Act is one of the most efficient instruments for cli-mate protection in Germany. In 2003 about 50 million tons of carbon dioxide have been saved by using renewable energies. But furthermore, there is a need to develop a new energy supply structure in view of climate protection. This is being done under the lead management of the Federal Chancellor’s Office as part of the First Progress Report on the Federal Government’s National Sustainability Strategy. …of economic efficiency Germany is faced with fundamental decisions with regard to energy policy. The age structure of the country’s power stations means that over the next 20 years it will be necessary to replace some 40,000 to 60,000 MW of electric power station capacity (about half of the existing power stations). This offers a real opportunity to achieve a structural change towards more decentral-ised energy supplies in an economically efficient way. Phasing out nuclear technol-ogy will support this necessary process of modernisation. …of securing the energy supply The task of further improving economic efficiency, improving the quality of life, as well as eliminating poverty around the world at the same time, requires reliable and

economic energy supplies. In view of the largely deregulated energy market in the EU, uniform framework conditions are a precondition for efficient, reliable and envi-ronmentally sound energy supply structures in the Member States. Therefore there is a need for further harmonisation in the field of opening markets (to date only Germany, the United Kingdom, Finland and Sweden have fully opened their electricity markets to the competition). Most of the other EU countries, however, have only partially opened up their markets, resulting in unequal competitive condi-tions in the EU. Globalisation of industry and access to energy supplies for developing countries are central challenges as well. POLICY TARGETS IN THE DEVELOPMENT OF RENEWABLE ENERGIES The short-term target is to double the share of renewable energies in Germany be-tween 2000 and 2010: • in electricity generation to 12.5 %, • in total primary energy consumption to 4.2 %. With the revised Renewable Energy Sources Act, the Federal Government has agreed on a medium-term target for 2020: to increase the share to at least 20 % of electricity consumption. The Federal Government’s long-term objective is that renewable energies are to ac-count for at least 50 % of total energy supplies by 2050 at national and global level. The German Government’s political objectives in the energy sector are closely re-lated to the challenges of climate protection. In the long term a marked reduction in CO2-emissions is required. The Bundestag Committee of Inquiry on Climate Issues considered that a reduction of 80 % in emissions by the industrialised countries by 2050 was necessary. For Germany there is no alternative to this target. The follow-ing steps are necessary to achieve this target: • 2020 minus 40 %, • 2030 minus 50 % and • 2040 minus 65 %. It was agreed in the coalition agreement that Germany would aim to achieve a re-duction of 40 % in Kyoto gas emissions by 2020, if the EU undertook to achieve a reduction of 30 %. …Where do we stand?! • Renewable energies in Germany account for about 3 % of primary energy and
about 10 % of electricity consumption. • The reduction in Kyoto gas emissions in Germany in 2002 is compared to 1990
by 19.4 %. The target of 21 % can be achieved by 2010. • The energy productivity in Germany shows a rise of 1.8 % a year from 1990-
2002. The doubling target seems to be very ambitious. • The primary energy consumption is increasing worldwide by 2 % per annum
and will double by 2035. There is no discernible trend towards energy saving. • 2 billion people in developing countries still have no access to electricity! • Insufficient internalisation of external costs results in macro-economically ineffi-
cient investment decisions, impedes the market access for renewable energies and hinders investment in efficient energy conversion and use.

BIOMASS …the most multifaceted and oldest type of energy use Biomass is the most multifaceted and oldest type of energy use: • energy (with and without CHP), • heat and • bio fuels can be provided. Biomass is an energy source which is predicted to have a promising future because of its exceeding potential. Until 2020 biomass can share about 10 % of each electric-ity and heat generation as well as fuels. Until 2030 the share of electricity can achieve 16 % and 15 % of fuels. As biomass would provide the lion’s share of that – even more than coal – a rediscovered source of energy steps into the limelight. Already today, energy is being produced from biomass: predominantly in heating with forest wood in fireplaces at home, and in the use of by-products in large power plants, e. g., from the timber industry. In comparison, the potentials of agriculture, forestry, and waste management have hardly been developed, and could sustainably provide much more than they do now. Around half of all final energy from renewable energy sources is provided by bio-mass (heat, electricity, transport fuels). In terms of heat generation from renewable energy sources, biomass (primarily wood) accounts for a share of about 90 %. In comparison, in terms of electricity generation, the renewable energy source wind power tops the league accounting for a share of more than 50 % (biomass: about 15 %). There are good arguments to use these available supplies: bioenergy is not subject to natural fluctuations, relieves the strain on the environment, creates jobs and strengthens regional economies. What importance will biomass have in the future supplying for our energy? Which technologies will catch on? What costs will its development have and how greatly will it effect the environment and employment? The Biomass Material-Flow Analysis (MFA) Project supported by the Federal Minis-try of the Environment has found answers to these questions and has looked ahead to the year 2030. Implementing the findings and policy recommendations for the na-tional level the project called “BioRegio” which has started with the beginning of this year develops strategies for the sustainable use of biomass in five selected model regions. POLITICAL FRAMEWORK The further development of the ecological finance reform, as agreed in the coalition agreement, takes place against the background of the overall economic situation, the competitive situation of German industry, and social acceptability. This is concerned with the abolition of environmentally harmful subsidies under tax laws. In 2004 important decisions have been made in the field of bio fuels. Since 1.1.2004 all types of bio fuels – intermixture as well – are released from petroleum tax. The abolition leads in the field of petrol to prosperous markets meeting high quality stan-dards at the same time.

Biogas, together with synthetic gasoline and diesel from solid biomass, bioethanol, biomethanol and hydrogen from biomass, will be exempted from the mineral the min-eral oil tax during 2004 and 2009. Europe-wide trading in emissions rights started on 1.1.2005. This applies to power stations, chemical industry incineration plants, and firing plants and production facili-ties in the steel, cement, glass, ceramic, cellulose and paper industries. Trading will take place throughout Europe and will enable individual installation op-erators to exceed their prescribed emission limits by purchasing additional emission certificates. Conversely, it will be possible to sell surplus emissions rights. By making arrangements more flexible, emissions trading is an economically very efficient instrument: avoidance costs occur at the points of lowest costs, while at the same time there is a permanent incentive to search for new and innovative reduction options. The emissions trading system will also integrate the emission credits resulting from international climate protection projects under the Kyoto Protocol (“Joint Implementa-tion” and “Clean Development Mechanisms”). …policy instruments for promoting renewable energies especially biomass The Federal Government aims to ensure that in the medium to long term, renewable energies will be able to compete on the energy market. In the long term, a balanced mix of fossil and renewable energies is seen as the way forward. Implementing these objectives calls for a whole raft of measures: • Renewable Energy Sources Act, • Market Incentive Programme for renewable energies and • Accompanying Ecological Research. In the foreseeable future, renewable energies will only be truly competitive if they continue to receive these targeted support. …Renewable Energy Sources Act The Renewable Energy Sources Act is one of the central elements of the Federal Government’s energy policy, which came into force on 1 April 2000. The Renewable Energy Sources Act has helped to considerably improve the grid feeding and pay-ment systems introduced in favour of renewable energies under the Electricity Feed Act in 1991 by adjusting them to conditions on the liberalised electricity market. Particularly, in comparison to other countries the Renewable Energy Sources Act emerged as an outstanding effective instrument for the renewables’ extension in the electricity sector. The young markets of renewable energies are supported breadth-ways, the potentials of innovation and economy of scale fully tapped. The Act deals with the purchase of, and the compensation to be paid for, electricity generated exclusively from renewable energies by grid operators. The Renewable Energy Sources Act imposes three obligations on network operators: • They are obligated to connect to their grids installations generating electricity
from renewable energies. • They must first purchase all of the electricity produced from these installations
as a priority. • They must pay fixed rates for the electricity. Besides of the priority purchase, transmission and payment of the electricity by the system operators, the Act also provides for a nation-wide compensation scheme.

The fees are fixed for a period of 20 years. This brings investment security for the renewable energy industry. Their levels have been set so that, with rational man-agement, economical operation of the installations is possible. Tariffs vary by energy sources (wind power, biomass, solar power, geothermal power, hydropower), locations, and installation size. The Act provides for an annual degression of fees for all capacity levels in new plants, with the exception of geothermal power plants and offshore wind power in-stallations, where the degression will apply at a later point in time. The rates of de-gression are adjusted to the efficiency potentials of the different capacities. Thus, significant incentives are given to lower the costs and increase the efficiency. Tariffs are to be reviewed and adopted to market trend regularly. Therefore, the Re-newable Energy Sources Act had been revised. The amendment entered into force on 1st August 2004. The amendment of the Renewable Energy Sources Act in particular responded to the almost completely exploited cheap biomass fractions (esp. matured timber), the insufficient incentives to utilise innovative and efficient technologies in the field of biomass, the decreasing costs for the wind energy supply as well as the increasing resistance against using wind energy onshore. A number of studies had shown that the previous rates for small biomass plants were much too low to tap potential to a desirable extent. A new payment category at the higher rate of 11.5 cents/ kWh has, therefore, been introduced for capacity up to 150 kW (the lowest category under the previous Act was 9.5 cent/ kWh for up to 500 kW). Under the new provision, the minimum rate will decrease at a rate of 1.5 % p.a. Payments for biomass power will continue for 20 years. Bonus for regenerative raw materials: Another finding to emerge from studies was that the rates paid under the old Act were not sufficient to encourage the use of re-generative raw materials, such as energy-rich plants. As a consequence, the rates will now increase whenever power is derived exclusively from plants or parts of plants left over from agriculture, silvicultural or horticultural operations or landscape management which have not been subjected to any further treatment or modification beyond the requirements of harvesting, conserving or conversion in a biomass facil-ity and/ or from liquid manure or specific types of distiller’s residue. Payments for up to 500 kW are increased by 6.0 cents/ kWh and for up to 5 MW by 4.0 cents/ kWh. There is no exception to this: if power is derived from wood burning the rate from 500 kW to 5 MW only rises by 2.5 cents/ kWh. This reflects the higher costs incurred when using regenerative raw materials. It is a key factor in developing additional biomass options, now that the potential for using waste wood and organic waste is largely exhausted. The bonus for regenerative raw materials applies to both new and existing plant. Bonus for CHP power: The minimum rates have risen by another 2.0 cents/ kWh for power cogenerated in plants where cogeneration is at least partially in operation and if biomass was converted by means of innovative processes (e. g. thermochemical gasification, fuel cells, gas turbines, the organic Rankine cycle, the Kalina cycle of Stirling engines). …Market Incentive Programme for renewable energies The Market Incentive Programme, commissioned by the German Federal Govern-ment, promotes measures for the utilization of renewable energies by investment grants or the provision of long-term low interest loans, financed by the Reconstruc-

tion Loan Corporation’s equity capital, partially by the cancellation of a debt to some extent for early redemption. Appropriation is refinanced by the Ecological Tax Re-form. In the main focus of the programme is the promotion of solar collectors, facilities for the combustion of solid biomass for heating, biogas plants and hydropower. The programme started in 1999 and is limited in time till 2006. Since the starting of the programme about 350.000 projects were funded in the field of renewable energies’ usage. The volume of assistance via the Market Incentive Programme in the last five years came to 550 million euro. This made it possible to set in motion investment spending totally 1.6 billion euro. The programme is to increase to around 200 million euro a year by 2006. In the field of using bioenergy, facilities for the combustion of solid biomass for heat-ing, biogas plants and facilities for the combustion of solid biomass for cogeneration are concerned. Since the starting of the programme about 32.000 small biomass systems up to 100 kW were promoted by investment grants of about 55 million euro. Besides this, almost 500 bigger biomass systems were promoted by loan commit-ments of about 63 million euro. The fundings’ conditions are determined by the directive which is adapted to the market trend regularly. The Federal Environment Ministry therefore has put forward a new guideline. Signifi-cant changes are: • inclusion of manual-feed biomass systems with a capacity of 15 kW upwards in
the assistance programme, • improvements in assistance levels for small biomass systems, • adaptation of emissions limit values for biomass systems to the latest state of
the art, • adaptation of technical criteria for solar collector systems to the state of the art
as from 1. June 2004 in line with RAL-UZ 73, • extension of assistance for eligibility to include solar collector systems for swim-
ming baths, • assistance for local heat networks through partial debt relief in conjunction with
measures to establish plants for utilising deep geothermal heat or automatic-feed plants for incineration of solid biomass,
• inclusion of local authority projects including contracting. The guideline is extended until 31 December 2006. With the new directive which came into force on 1st January 2004 the fundings’ con-ditions were improved esp. for the promotion of biomass facilities. Automatically-feed biomass systems already were promoted according to the former directive. There-fore, the Market Incentive Programme substantially contributed to the boom in the field of pellet heating. But since 2004, the promotion has become even more attrac-tive. Facilities up to 100 kW are funded by 60 euro per kW, however, not less than by 1,700 euro. The allowed cancellation of a debt to some extent for early redemption accounts for 60 €/ kW, 300,000 euro per facility at most. Important for the cost effectiveness of municipal facilities for wood energy is the di-rective’s expansion to allow municipalities to submit applications. In 2004 the Federal Environment Ministry evaluated the Market Incentive Pro-gramme. The following results can be summarised: Figure 1 shows the development of small biomass systems up to 100 kW per month.

Antragszahlen kleine Biomasse
0
200
400
600
800
1000
1200
1400
1600
1800
2000
Jan 02
Feb 02
Mrz 02
Apr 02
Mai 02
Jun 02
Jul 0
2
Aug 02
Sep 02
Okt 02
Nov 02
Dez 02
Jan 03
Feb 03
Mrz 03
Apr 03
Mai 03
Jun 03
Jul 0
3
Aug 03
Sep 03
Okt 03
Nov 03
Dez 03
Jan 04
Feb 04
Mrz 04
Apr 04
Mai 04
Jun 04
Monat
Figure 1: Chronological development of application numbers (reference: ZEW, un-published) From the beginning of 2002 till 30.06.2004 25,393 applications for investment grants for biomass-feed central-heating boilers were submitted to the Federal Office of Economics and Export Control. The directive’s amendment on 15.03.2002 increased the submitted applications by leaps and bounds. Esp. small biomass systems up to 25 kW and facilities up to 40 kW benefited from the amendment. The short-term increase and the following collapse in autumn 2003 can be explained by the announcing in summer 2003 that the promotion of biomass-boilers would probably be stopped which proved to be wrong. A further increase in the first part of the year 2004 resulted from the introduction of the promotion of carburettor boilers for split logs since the beginning of 2004. The efficiency does not seem to be relevant for private households as well as the extent of funding but the promotion should be noticable. Manufacturer are important multipliers. In the past, only the applications of automatically-feed biomass systems up to 100 kW were evaluated. The current evaluation of the Market Incentive Programme moreover allows statements for the period since 01.01.2004 for the share of pellet heating (Pelletsheizung) and carburettor boilers (Scheitholzvergaserkessel) as well as the allocation of several sizes:

Anträge kleine Biomasse 1.Hj. 2004 Aufteilung nach Brennstoff
Holzhackschnitzel6%
Pellets30%
Scheitholz64%
Figure 2: Applications in the first part of 2004 analysed by the type of substrate (ref-erence: ZSW, unpublished)
All in all, the focal point of applications shifted from smaller biomass systems up to 20 kW to facilities between 20 kW up to 50 kW. In the first run, the development can be ascribed to carburettor boilers for split logs, whereas for pellet heating the em-phasis lays upon facilities up to 20 kW. The allocation of the several sizes is illustrated by figure 3:
Anträge kleine Biomasseanlagen 2002 - 2004Verteilung auf Größenklassen
< 20kW46%
20 - 50 kW47%
50 - 100 kW7%
Figure 3: Percentage of the application analysed by sizes (reference: ZSW, unpub-lished)

More than 90 % of the applications were submitted by private households. Re-markably is the diversification of the applications’ allocation. Almost half of the appli-cations were submitted in Bavaria, followed by Baden-Wuertemberg and North Rhine-Westphalia. ...Accompanying Ecological Research The Federal Environment Ministry is the precursor for an ecologically optimised bio-mass policy. A detailed planning, the embedding in the local circumstances, an adapted application of technology, the considerateness to a minimum of ecological criteria as well as a healthy mix of several renewable energy sources ensure a maximum of efficiency and environmental compatibility for the energy supply. The Federal Environment Ministry therefore – within the scope of the so called Ac-companying Ecological Research of several renewable energy sources – promotes the detailed analysis of the pros, cons and synergies as well as strategies and measures for the ecologically optimised extension of renewable energies. The fol-lowing projects have been started to the beginning of this year: • Monitoring of the effects of the amended Renewable Energy Sources Act on
the development of electricity generation of biomass (intended to be medium- up to long-term),
• BioRegio – Strategies for the sustainable use of biomass in five selected model regions. The results are thought to be transferable to other regions all over Germany as well as applicable on the European level.
CONCLUSIONS – MARKET LAUNCH OF BIOMASS The premium on fermentation of again growing resources „NawaRo-Bonus“ bridges a gap in the Renewable Energy Sources Act and presently causes a dynamic for the use of biomass comparable to that having had in the field of wind energy. The inter-est of generating biomass has been increased by leaps and bounds since the pro-duction of biogas represents an interesting source of income for many farmers. The industry expects biogas plants to double in 2005 up to about 4,000 facilities (German Biogas Association, January 2005). The Market Incentive Programme lays emphasis on heat generation from renewable energies and already set important incentives: Market launch has been relieved for innovative biomass technologies meeting strict emission limits like pellet heating and carburettor boiler for split logs.

GREEN CERTIFICATES, A TOOL FOR MARKET DEVELOPMENT
Ir. Kees W. Kwant, SenterNovem P.O. Box 8242, 3503 RE Utrecht The Netherlands Phone : +31-30-2393458 E-mail : [email protected] ; www.senternovem.org ABSTRACT To achieve a place for renewable energy the Government of the Netherlands has followed a market oriented approach. In view of the rapidly emerging liberalized energy market the government followed an approach with both support to producers and a demand-driven approach. With a fully liberalized market for green electricity with free consumer choice and the tradable certificate for renewable energy a market has been developed. In view of the slow domestic growth in production a new support mechanism was introduced called the environmental quality of power production (MEP) for renewable electricity in the Netherlands in 2003. This paper evaluates the market development over the last years with the green certificate system and the rapid growing market of green electricity. In 2004 the green certificate is EU-wide replaced by the Certificate of Origin.
1 Introduction
To achieve a place for renewable energy the Government of the Netherlands has followed a supply oriented policy approach during 90's. In view of the rapidly emerging liberalized energy market government is changing its focus from support to producers to a demand-driven approach in 2000, however in 2002 it was noted that supply was not stimulated by increased demand due to EU market distortions and supply support was added again. Key elements of the Dutch policy for the promotion of renewable energy over the past decade were: − the energy tax on the use of electricity and natural gas − fiscal instruments to lower investment costs − voluntary agreements with the energy sector and industry − various subsidy schemes to increase the attractiveness of new initiatives. In view of the upcoming, liberalized energy market 2 major instruments were added in 2001: (i) a fully liberalized market for green electricity with free consumer choice;

(ii) a tradable certificate for renewable energy. The lay-out of the Dutch policy for renewable energy, with its focus on the demand side, has a rather unique position within Europe. Firstly, because of its focus on the demand side, and, secondly, because of its emphasis on voluntary action.
In view of the slow domestic growth in production a new support mechanism was introduced called the environmental quality of power production (MEP) for renewable electricity in the Netherlands This paper evaluates the market development over the last years with the green certificate system and the rapid growing market of green electricity. In 2004 the green certificate is EU-wide replaced by the Certificate of Origin.
2 Objectives
Europe To achieve the EU climate target of 7% CO2 reduction in 2008 – 2012, doubling the share of renewable energy (12% of gross inland energy production 2010); and an increase of 18% by 2010 compared to 1995 in energy efficiency, the European Commission has developed policies in the form of White and Green papers and a number of Directives (the White Paper on Energy Policy, the White Paper on RES, and the Green Paper on Security of Supply). The White Paper on Energy Policy invites national governments and local authorities to adopt policies mobilising significant resources of RES. The White Paper on RES acknowledges that RES constitutes in the long term the main sustainable energy source and calls for a strategy on RES development. It sets out the community strategy and action plan to double the share of renewable energy. The Green Paper on the Security of Energy Supply addresses the securing of the EU’s energy supply. The Directives on the Promotion of Electricity from Renewable Energy Resources sets obligations for each member country to establish national targets for future consumption of RES. It also provides an indication of these national targets and the possibilities for Member States to have access to renewable energy in the internal market. The Directive on Liquid Biofuels mandates for a minimum use of biofuels in 2005 and 2010 with indicative targets and taxation. In the area of waste management, the EU has set the landfill directive and directives for emissions. Netherlands Renewable energy policies are driven by the well-recognised need for a sustainable society. Within Dutch government policies, targets for renewable energy are addressed in environmental programmes, white papers on energy and on climate change. The Dutch government aims in its Third White Paper on Energy (1995) at 2 major goals for 2020 [3]: − 33% improvement of the efficiency with which energy is used by continuing energy savings
and use of more efficient technologies (with this efficiency target total energy consumption should remain effectively at the 1990 level despite economic growth)

− 10% of all energy used should be provided from renewable sources. Currently, the total domestic production of electricity is 48 PJ, or 1.5% of the domestic use of primary energy sources. The total domestic consumption of renewable energy, (including the imported renewable energy) is 4.2% of the domestic use of primary energy sources. The renewable electricity consumption is 13% of the total domestic consumption. For 2020, the target of 10% renewable energy represents a supply of 380 PJ based on the most recent projections of long-term economic growth and energy consumption. In the Energy Report from 1999 the governments presents its policies in view of a liberalised market: − A consumer driven approach in the renewable energy market − Voluntary agreements with specific sectors in the market − Greening the fiscal system by increasing the energy tax − Encouraging research and development through specific programs. Recently, our government published its Action Plan on Climate Policy. This plan contains the actions which are required to comply with the reduction targets of the Kyoto Protocol. By the end of the Kyoto budget period, the emissions of greenhouse gases should be 6% lower than in 1990 (according to the EU agreement on the burden sharing of the Kyoto target over its member states). [4] Based on projections of greenhouse emissions a reduction of about 50 million tons of CO2 is required. Domestic measures should cover 25 million tons of the total reduction (the remaining 25 million tons will come from Joint Implementation, CDM-projects and emission trading). Renewable energy forms part of the domestic measures to reduce CO2. To implement this reduction, a firm target has been set at a share by renewables of 5% to the total energy consumption (180 PJ). In terms of CO2 reduction, this target should reduce 4 million tons of CO2.
Use of renewable energy [in PJ]
0
100
200
300
400
1990 1995 1999 2000 2010 2020
Realized Target
Figure 1 Targets for renewable energy in the Netherlands according to government policy

3 Policy design
Following the publication of the Third White Paper on Energy Policy in 1995, Government recognized that its subsidy schemes and fiscal instruments to decrease investment costs of renewables were insufficient to achieve its intermediate target for 2000. Also, the level of investment and subsidies from the energy distribution sector up to 1995 would be inadequate to reach this target. The actions of the energy sector formed part of a voluntary agreement with the Minister of Economic Affairs on the implementation of an environmental action plan (Milieu Actie Plan, MAP). This agreement was up for renewal in 1996. Considering the intermediate target for renewables in 2000, government and the energy sector agreed on including a specific goal for renewable energy as part of the new voluntary agreement. During the negotiations this goal was finally set at 1.700 GWh of renewable electricity which the distributors would supply to their customers in 2000. Mid 1997 the energy sector concluded that a tradable certificate system for renewable energy would be the best option to realise a burden sharing system.and a tradable certificate for renewable energy, the so-called Greenlabel was introduced. The system was fully implemented and operational by January 1998. [2] Following the introduction of the energy tax in 1996, one distribution company (PNEM, now part of Essent) started with selling green electricity (“Groene Stroom”) to its customers. The exemption of the energy tax for green electricity helped to lower the higher price of such a product. Although still more expensive than “regular” electricity, a niche market appeared to exist with customers willing to pay extra for a green product. Given the success of the first product, other distributors followed with their own products. In 1999 the Minister of Economic Affairs evaluated the position of renewable energy in a liberalized market. The energy sector had made it clear, in a position paper called Energy and Enviroment in the 21st Century, that it wasn’t prepared to renew any voluntary agreement after 2000. The sector feared that if they would take on voluntary agreements, new entrants in the market would not follow this example, but instead go for market share and lower price. According to the position paper, energy saving and renewable energy are considered important, but only at the specific request of customers. The further introduction of renewable energy should, in the opinion of the energy sector, be based on selling products like green electricity. Government recognized the implications of the liberalized energy market. In the Energy Report of 1999, the Minister of Economic Affairs lays down the approach for the coming years. The most crucial step was opening a fully competitive green market in 2001. This market opening with free consumer choice is ahead of the market opening for mid-sized and small consumers (in 2002 and 2004 respectively). To facilitate the market, a legally based certificate system was put in place. These certificates are issued for renewable production and receive their value on the market place as they are eligible for tax exemption when used to sell green electricity to consumers. As a third step, the tariffs of the energy tax are increased substantially, while the exemption for green electricity remains in tact. With the tax levels of 2001, green products can become cheaper in price than regular electricity despite the extra costs of renewable energy, however the European Commission, with the law on free trading does not allow for sales of green electricity at a lower price than normal electricity.

4 POLICY MECHANISMS
The shift to a sustainable and prosperous society can be supported by ecologising (or greening) the fiscal system. Within this context, in the Netherlands the Regulated Energy Tax was introduced. since 1996. The energy tax encourages energy conservation and the use of renewable energy by making fossil energy much more expensive. The reduction in the energy tax and the zero tariff for ‘green’ electricity, provide a further strong incentive to use renewable energy. Further the system, with specific fiscal instruments, focuses on supporting investments.
4.1 Support for Investments Investment support in the Netherlands is entirely based on fiscal measures. The following schemes to improve the profitability of renewable energy are available: a) Green Funds: Investors in “green projects” (such as renewable energy) can obtain loans at a
lower interest rate (about 1 percentage point) from Green Funds. These Funds are created by savings by private persons, who are exempted from paying income tax on the interest received. About 2.000 million Dutch guilders are available in green funds.
b) Accelerated Depreciation: The VAMIL scheme offers entrepreneurs a financial advantage because accelerated depreciation is permitted on equipment which is included in the VAMIL list. The accelerated depreciation reduces tax payments on company profit
c) Tax Credit: The EIA scheme makes it possible that investments in technologies on the EIA list may be offset against taxable profit. The tax credit offered varies from 52.5% to 40% (depending on the size of the investment).
From these three instruments EIA provides the strongest investment support. The combination of Green funds, Vamil and EIA equals a subsidy on the investment of about 25 - 35 %, depending on the profit and fiscal situation of the company. Banks now offer lease constructions on renewable energy equipment where these fiscal measures are incorporated, making financing easy and also available to parties who are not fully able to use these instruments.
4.2 Higher payment for electricity from renewables Households and Enterprises pay an energy tax on electricity and natural gas. These consumers pay their energy tax –as part of the energy bill– to their supplier, who in turn pass the revenues on to the taxation authorities (Ministry of Finance). The Environmental Taxes Law which forms the basis of the energy tax includes two special provisions on renewable energy: − producers from renewable energy which is delivered to the public grid are eligible for a support
payment from the proceeds of the energy tax (art. 36o) − consumers who buy “green energy” under a contract with a supplier are exempted from paying
the energy tax. (art. 36 i)
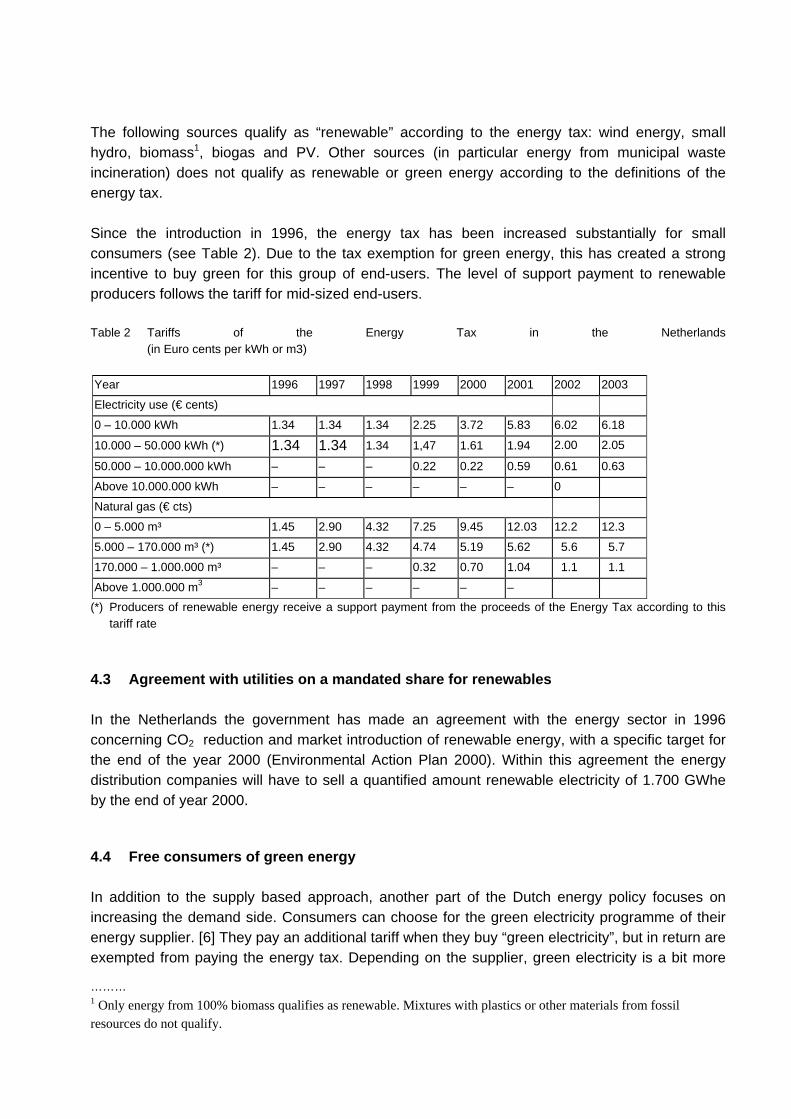
The following sources qualify as “renewable” according to the energy tax: wind energy, small hydro, biomass1, biogas and PV. Other sources (in particular energy from municipal waste incineration) does not qualify as renewable or green energy according to the definitions of the energy tax. Since the introduction in 1996, the energy tax has been increased substantially for small consumers (see Table 2). Due to the tax exemption for green energy, this has created a strong incentive to buy green for this group of end-users. The level of support payment to renewable producers follows the tariff for mid-sized end-users. Table 2 Tariffs of the Energy Tax in the Netherlands
(in Euro cents per kWh or m3) Year 1996 1997 1998 1999 2000 2001 2002 2003
Electricity use (€ cents)
0 – 10.000 kWh 1.34 1.34 1.34 2.25 3.72 5.83 6.02 6.18
10.000 – 50.000 kWh (*) 1.34 1.34 1.34 1,47 1.61 1.94 2.00 2.05
50.000 – 10.000.000 kWh – – – 0.22 0.22 0.59 0.61 0.63
Above 10.000.000 kWh – – – – – – 0
Natural gas (€ cts)
0 – 5.000 m³ 1.45 2.90 4.32 7.25 9.45 12.03 12.2 12.3
5.000 – 170.000 m³ (*) 1.45 2.90 4.32 4.74 5.19 5.62 5.6 5.7
170.000 – 1.000.000 m³ – – – 0.32 0.70 1.04 1.1 1.1
Above 1.000.000 m3 – – – – – – (*) Producers of renewable energy receive a support payment from the proceeds of the Energy Tax according to this
tariff rate
4.3 Agreement with utilities on a mandated share for renewables In the Netherlands the government has made an agreement with the energy sector in 1996 concerning CO2 reduction and market introduction of renewable energy, with a specific target for the end of the year 2000 (Environmental Action Plan 2000). Within this agreement the energy distribution companies will have to sell a quantified amount renewable electricity of 1.700 GWhe by the end of year 2000.
4.4 Free consumers of green energy In addition to the supply based approach, another part of the Dutch energy policy focuses on increasing the demand side. Consumers can choose for the green electricity programme of their energy supplier. [6] They pay an additional tariff when they buy “green electricity”, but in return are exempted from paying the energy tax. Depending on the supplier, green electricity is a bit more
……… 1 Only energy from 100% biomass qualifies as renewable. Mixtures with plastics or other materials from fossil resources do not qualify.

expensive or about as expensive as regular electricity (for which the tariff includes the energy tax). On average, green electricity is sold at a premium rate of about 7 €cents (excl. VAT) above the normal price. The additional tariff is used to pay the producers of renewable electricity about 1 - 3 €cents, and the other 4 - 6 €cents is used for administration, marketing and profit. The exemption was reduced in 2003 to 2.9 €cts and will even be lowered in 2004, and in 2005 the ecotax on green electricity will be equal to normal electricity. The major power companies have all begun individual programmes for the development and marketing of green products that are intended to win new customers and retain existing customers. [7] The first is the NUON power company. NUON now has customers for its Natuurstroom (‘Natural Power’, July 2001). NUON presents itself as the green-energy company of the Netherlands. The company is making a great deal of effort in general advertising and sponsoring designed to achieve NOUN’s recognition as a green company. Large amounts of funds are also devoted to the marketing of their renewable products – in NUON’s instance their Zonnestroom (‘Solar power’, solely from the Sun) and Natuurstroom (solar, wind and water power, but not biomass power). Essent is another company devoting a great deal of effort to presenting itself as a green company. Essent (formerly known as PNEM) is one of the first companies to have registered its own brand name: Groene Stroom (‘Green Power’), for which it enlisted the support of the WNF. Essent’s Groene Stroom has exhibited a growth of customers. In contrast to NUON, Essent has chosen a regional approach to green energy – i.e. Essent is convinced that the use of the local media and a focus on individual target groups will ultimately prove to be a more successful approach to the marketing of green energy. Eneco is a power company that now has its green product, known as Ecostroom (‘Eco current’). Since the green electricity market was liberalised in 2001 a number of new providers of green energy emerged.[7] The liberalisation of green energy enables consumers to choose where they purchase their green energy. This renders green energy even more interesting to power companies, since operations in this segment of the market offer them an opportunity to win customers in areas serviced by other power companies. The variety of approaches adopted by the power companies indicates that they aim to evoke different emotions, and that they may even target different segments of the market. In analogy with their approach to marketing, the power companies have also adopted different strategies for the procurement of renewable energy. For example Essent, commensurate with its more regional approach, has decided not to import green energy. This restricts the definition of Groene Stroom even further, i.e. to green energy generated in the Netherlands. As a result of this decision Essent is compelled to generate a large quantity of green energy in the Netherlands. Essent had already always been traditionally involved in many biomass projects. NUON markets its special Zonnestroom product, which is more expensive than “ordinary” green energy. Alongside its Zonnestroom it also markets Natuurstroom, which does not include energy from biomass. Consequently NUON is responsible for a large number of photo-voltaic solar

projects, vigorously promotes wind-power projects, and imports 20% of its green energy. The company states that, for the time being, these imports will ensure that it has sufficient supplies of green energy at its disposal. NUON’s imports include the purchase of power generated from land-fill gas in New Jersey, and hydropower from Switzerland. NUON is also involved in the construction of a wind-turbine park in China. Eneco is the first power company to have purchased RECS certificates. The RECS is a collaborative arrangement between market players that has for some time been engaged in the design of a system of European trade in renewable energy. To this end Eneco has concluded a contract with the Swedish Vattenfall company for the supply of power generated in small-scale hydroelectric power stations. The EU is very interested in the system. In its latest directive the EU has incorporated a stipulation whereby all Member States are required to have established a green-energy trading system within a period of 5 years.
4.5 The Green Certificate system The government has introduced production certificates to enable a distinction to be made between electricity produced in an ecologically sound manner and ‘standard’ electricity. These certificates constitute a ‘guarantee of origin’ and serve as proof that electricity was produced in an ecologically sound manner. CertiQ is the organisation managing the certificate issue system. [ The certificate system enables registration and hence monitoring of the entire path from production of renewable electricity or electricity generated by combined heat and power (CHP) units all the way to ultimate use by the final consumer. This is done by means of certificates representing the green value or CHP value of the electricity. The system distinguishes between three types of certificates, viz. green certificates, RECS certificates and CHP certificates. To qualify for a certificate, the electricity must be generated in a plant designated as renewable or by a CHP unit. Generating units are eligible for production certificates only if the grid administrator can unequivocally meter the amount of electricity generated. Only units generating electricity based on wind, solar, biomass or hydropower are eligible for both green and RECS certificates. As of 1 January 2002, it has been possible for production sites outside the Netherlands to qualify for certificates as well, but only if the electricity was physically imported into the Netherlands by a trader. The green certificate process A producer registered in the certificate system produces renewable electricity. The regional grid administrator (or foreign metering body) meters net supply to the power grid. The metering results are dispatched to CertiQ each month. The metering data are automatically received in the certificate system. On the basis of these metering data, certificates are produced and put on the account of the trader specified by the producer. Certificates based on foreign production are not produced until evidence has been submitted of physical electricity import. If the producer has specified an aggregator (an intermediary between producer and trader), the aggregator may specify the distribution of the metering data over the different traders on behalf of the producer.

For biomass additional information is required to be able to produce the certificates. An aggregator should specify the percentages of production that are renewable. Subsequently, he should specify the amounts of the different types of biomass used in the relative period. The certificates are produced after all required data have been provided by the authorised parties. The trader owns the certificates. He may sell them to other traders or supply renewable electricity direct to the consumer. In the latter instance, he redeems the certificates and thereby becomes eligible for the tax cut. This type of trader is called a supplier. The system started on 1 July 2001 and issued its first batch of certificates on 19 July 2001. As of 1 January 2002, it has become possible to have certificates produced for renewable electricity generated outside the Netherlands as well. From that moment on, the production of certificates has increased substantially, providing the energy companies with a sufficient number of certificates to meet the needs of the market. Moreover, on 1 January 2002 CertiQ (then still Green Certificate Management) became the executive organisation for RECS (Renewable Energy Certificate System).[13]
4.6 Reducing cost price and increasing green payment The mixture of Dutch policy instruments to strengthen the competitiveness of renewables works in two directions: (i) reducing the cost price of producers and (ii) increasing the ability to pay for renewables by end-users. A schematic representation how all instruments work together is given in fig. x.
The principle of making renewableinteresting for power producers
Cost PriceRenewableElectricity5,4-8,0 EUct
Price PowerProducers3,2 EUct
ProfitGreen funds
Fiscal instruments
Sales pricenormalelectricity17,1 EUct
Sales pricegreenelectricity18,1 EUct
Energy Tax5,9 EUct
Green Electr.6,8 EUct
Payback1,9 EUct
GreenCertificate
Profit
Figure 2 A schematic diagram how Dutch policy instruments achieve competing prices for renewable energy between
2001 and 2003. On the supply side, instruments help to lower the cost price of renewables and allow competitive prices for electricity. The tradable certificate a producer receives can be sold on a separate market. Fair prices are possible through the demand side instrument of green tariffs and the energy tax.

Money flows in the following way in the system: − cost price reduction by 2.5 – 4 Eurocents per kWh
• all fiscal instruments relating to the investment lower the production costs of an installation with about 1 – 2 Eurocents per kWh
• the support payment from the energy tax for each renewable kWh produced lowers the cost price with 1.5 – 2 Eurocents per kWh
− competitive prices on electricity and certificate markets • the producer can now offer his electricity for regular prices on the “fossil” electricity market • in addition, he receives a tradable certificate which can be sold on a separate market
− increase the ability to pay for green by 6 Eurocents per kWh • the exemption of the energy tax for small consumers allows a tariff of around 6 €cents per
kWh till 2003 for “green electricity” which is competitive with “regular” electricity • with these revenues suppliers can buy green certificates on the market from producers or traders.

5 Production support by the Environmental support scheme (MEP)
The favourable fiscal support for renewable electricity through an ecotax exemption on final electricity consumption and a production subsidy from the ecotax revenues, in combination with the opening of the retail market for renewable electricity led to a dramatic increase of the demand as of July 2001. As domestic supply was limited in the short run the majority of the demand growth was met through imports of renewable electricity. These imports, however, created several adverse effects, which recently led to changes in the renewable electricity policy framework. The surge of renewable electricity imports primarily led to considerable tax revenue losses to the Dutch government. Furthermore, the fiscal incentives provided by the ecotax regulations in the Netherlands hardly stimulated additional capacity investments abroad. As imports principally came from existing installations, the additionality of the policy was very questionable. Moreover, competition from low-cost imports weakened the position of domestic producers and investors. Considering the above complications, the market anticipated changes of the policy framework. Thus the ecotax regulations no longer provided an effective long-term incentive for investment in renewable generating capacity in the Netherlands. In November 2002 the anticipated policy changes came in the form of a proposal for an amendment to the Electricity Law of 1998, called ‘environmental quality of electricity production’ (MEP). The MEP aims to increase certainty to investors and improve the costeffectiveness of renewable electricity support. The MEP provides for operating support through a combination of feed-in tariffs and a reduced ecotax exemption. The feed-in tariffs are financed through an annual levy on electricity connections. They are the primary means to increasing certainty for investors. The reduction of the ecotax exemption seeks to reduce the level of imports, while maintaining the dynamics of the renewable electricity market and associated green certificate trade. Under the MEP the total level of operating support is determined by the sum of the MEP feed-in tariff and the value ecotax exemption. However, the law does contain a maximum feed-in tariff, which is set at 7 €ct/kWh (Article 72p). The government guarantees this total level of support for a period of 10 years after entering into operation. The table below gives an overview of the MEP feed-in tariffs, the ecotax exemption, and thus the total level of operating support per renewable electricity category. On 3 June 2003, the Dutch Upper House gave its approval to the Bill on environmental quality of electricity production (Dutch acronym: MEP). This act took effect as from 1 July 2003. In september 2003 it was announced that the ecotax reduction for green electricity would be reduced over the next years. This would allow for an additional revenu for the Ministry of Finance.

Table xx : Feed in tariffs support Renewable Electricity after juli 2003. [€ct/kWh] Change after Juli 2003 Jan 2004 Juli 2004 Jan 2005 Ecotax reduction green electricity 2.9 2.9 1.5 0 Biomass > 50MW (3yr) 4.8 4.0 5.5 7.0
Mixed waste/biomass 2.9 2.9 2.9 2.9 Biomass <50 MW 6.8 6.7 8.2 9.7 Wind at sea/solar 6.8 6.7 8.2 9.7 Wind at land 4.9 4.9 6.4 7.8
The general architecture of the new support framework is best explained by first considering the position of the producer. The producer derives its income from three main sources of revenue: the electricity market, the green certificate market and the MEP feed-in tariff. The producer sells its electricity on the electricity market like any other electricity producer. In addition, based on its production the producer receives green certificates (GC) from the Green Certificate Body: Certiq [9] and sells these green certificates on the green certificate market at a market price. Finally, based on its metered output the producer receives a MEP feed-in tariff from the national transmission system operator, EnerQ [10] In accordance with the MEP, producers of electricity from renewable energy sources can apply for a feed-in tariff. The MEP feed-in tariff is disbursed by the national transmission system operator, EnerQ [10]. Once EnerQ has approved the application from a producer, the producer receives a contract under which it receives the MEP feed-in tariff. The level of the MEP feed-in tariff is fixed at the level of the tariff in the first year that the MEP tariff was requested for a duration of maximum 10 years following the start of operation of an installation. The MEP feed-in tariffs are financed through an annual MEP levy on all connections to the electricity grid in the Netherlands. The MEP levy is essentially a type of system benefits charge that is collected by the distribution network operators and consequently passed on to the national transmission system operator. The levy amounts to € 34 per connection in 2003 and is increased to € 40 in 2006.
After 1-7-’03 (REB+MEP)
Cost pricegreen power
5,4-11,0 €ct/kWh
Verschil
Cost priceregular power3,2 €ct/kWh
Green-financing
EIA / VAMILEIA / VAMIL
Sales priceregular power17,1 €ct/kWh
EcoTax = REB6,4 €ct/kWh
Profit
Sales priceregular power17,1 €ct/kWh
ProfitGreen Power2,9 €ct/kWh
EcoTax = REB3,5 €ct/kWh
Groencertificaat
MEP

6 Monitoring and evaluation of policy instruments
In 2002 the Renewable Energy consumption was 4.2 percent with a domestic production of 1,5 %. About 13 % of the domestic consumption of electricity is from renewable sources. Import of renewable electricity is for 60% produced from biomass and 40% from hydro electricity. The total import was 10 350 GWh in 2002. The import is driven by the fiscal support of renewable electricity in the Netherlands and as a result reduced in 2003.
0
500
1000
1500
2000
2500
3000
3500
4000
1990 1992 1994 1996 1998 2000 2002Bio-energie WindenergieWaterkracht Zonne-energie
Bron: CBS/ NOVEM
GWh
0
1
2
3
4
5
6
1990 1992 1994 1996 1998 2000 2002
IDomestic Production Import
%
Bron: CBS/NOVEM
Domestic consumption of Renewable Energy. Domestic production of Renewable Electricity In 2002 the domestic production increased by 24 %, mainly cofiring biomass in coal fired power plants. Electricity from biomass produces 2,3 % of the domestic power consumption. The domestic production from windenergy increased by 10% and now produces 0,8 % of the domestic power consumption. This was caused by installing an additional 132 windmills in 2002, increasing the windcapacity by 40%. Hydro electricity produces 0.1% of the domestic consumption. Due to the large quantity of imported renewable electricity and the domestic production the supply is 4 times larger than the demand. The demand for green electricity increased from 800.000 to 1.400.000 consumers, with a demand of 3700 GWh. The surplus of greencertificates is stored and can be used in the future or sold as grey power. See [9]: www.certiq.nl/english/ and click on statistics.

Fiscal support for the green electricity market The fiscal support fort the green electricity market was increased in 2001to an exemption of almost 6 €cts and after 2003 decreased till 0 in 2005. see graph below.
Ecotax and tax exemption
01234567
2000 2001 2002 2003* 2004* 2005*
year
€cts
Ecotax
Taxexcemptionfor greenelectricity
There has been a considerable growth in the green electricity market, and at the end of 2003, more than 2 milion consumers, (more than 30% of the consumers) buy green electricity. The not received tax money by the government exceeded 200 Million Euro in 2002 and was one of the reasons to reduce the tax exemption, and the need to increase governmental income made it necessary to reduce it even further to zero in 2005. It is difficult how the market will react in 2004 and 2005 on the change in the fiscal support. Due to the fact that the market will be fully liberalised in 2004, it can be expected that the utilities will try to keep their customers, even when the fiscal profit is much less. However this remains to be seen.
Green electricity Sales and fiscal support
01000200030004000500060007000
2000
2001
2002
2003
*20
04*
2005
*
Year (* estimate)
Sale
s [G
Whe
]
050100150200250
Tax
supp
ort [
M€]
salesGWH
annualcostsM€
In the period 2000 - 2005 the government has given a total tax support of about 550 million Euro to reach a clientele of about 2 million customers, buying 6000 GWh renewable electricity.

Comparison with other EU member states In comparison with other European countries, the Netherlands have the broadest and most diverse use of support mechanisms for renewable energy (see Table 4), however most countries are enlarging the set of instruments as well [14]. The lay-out of the Dutch policy for renewable energy has a rather unique position within Europe: it focuses on strengthening the demand side and places a strong emphasis on voluntary action. The advantages of this approach are a better “fit” with the new setting of the liberalised market with full competition and free consumer choice. On the other hand, the approach is vulnerable. The deployment of renewable energy strongly depends on market conditions and reactions. Having the broadest range of policy instruments does not necessarily mean it creates the most effective approach. For instance, countries as Denmark, Spain and Germany reach faster growing levels of renewables than the Netherlands through their policies of feed-in tariffs2. For that reason the Netherlands introduced in 2003 a fixed feed in tariff (MEP), with a guarantee of 10 years. Table 4 Use of policy instruments for deploying renewable energy in EU member states [ 2 ]
Belg
ium
Den
mar
k
Ger
man
y
Net
herla
nds
Fran
ce
Finl
and
Gre
ece
Irela
nd
Italy
Aus
tria
Portu
gal
Spai
n
U.K
.
Swed
en
energy tax on fossil fuel
investment subsidies
fiscal investment benefits
feed-in tariffs electricity 5 5 5 5
exploitation subsidies
voluntary agreements
Obligation
tradable certificates
tax advantage green pricing
competition through tenders explanation:
Applied for certain sources 5 (high) rates obliged under development
……… 2 A feed-in tariff is an obliged, fixed (high) tariff for which grid operators have to buy electricity from specific sources, such as renewable energy or combined heat and power production.

7. Conclusions 1. The green energy system in the Netherlands has given the utilities and the consumers a
unique possibility to learn about marketing mechanisms in a liberalised market. These lessons are needed because the market for small consumers will be fully liberalised in 2004.
2. The marketing of green energy in all its forms has brought renewable energy to the attention of a wide public and has made the public aware of the need for sustainable energy supply. It also made them aware of the need to take action and buy the green electricity and more than 30% of the consumers have made the change. These consumers could have a strong influence on the market in the future.
3. Energy in the form as green energy has become a commodity that can be traded. In the past electricity was felt as a service, provided by a utility, now it is more a product that can be bought.
4. The Netherlands has introduced the green label and green certificate as the unit to be traded for the green energy product. This has now been implemented as a Certificate of Origin all over Europe and has made power a tradable product with a traceable quality.
5. Because of a lack of a harmonised European market, the demand side support for green electricity in the Netherlands realised a market but not additional production.
References [1] Kwant, K.W.; Dijk, G.J. van; Policy, strategy and implementation of bioenergy in the Netherlands, 1st World Conference on Biomass for Energy and Industry, Seville, Spain, 5 – 9 June 2000, page 1217 – 1219. [2] Deployment of Renewable Energy in a liberalised energy market by Fiscal Instruments in the Netherlands, Kwant, K.W.; Ruijgrok, W.; Paper for IEA Market deployment project, http://www.iea.org/impag/deploy/ (2001) [3] Ministry of Economic Affairs, government papers: http://www.ez.nl/nota/den/action.pdf or http://www.minez.nl [4] Climate memo: http://www.minvrom.nl/minvrom/pagina.html?id=1314 [5] Gaseous and liquid fuels in the Netherlands, http://www.novem.org/gave [6] Grid operator Tennet: http://www.tennet.org/ [7] Overview of sales of green electricity at www.greenprices.com [8] Monitoring Duurzame Energie in Nederland 2002, Novem, CBS, September 2003
EEP2011 [9] www.certiq.nl issuer of green certificates [10] www.enerq.nl/english administration of funding Renewable Energy supply [11] http://www.renewable-energy-policy.info [12] report on policy support for renewable energy in the European Union.
http://www.ecn.nl/library/reports/2003/c03113.html [13]RECS : Renewable Energy Certificate System : www.recs.org [14]REACT: Reneable Energy Action: www.react.novem.org

ACCESS OF RONI TO THE RENEWABLE ENERGY SOURCES
Ladislav Jediný Regulatory Office for Network Industries Bajkalská 27, 821 01 Bratislava Slovak Republic Phone: + 421 2 5810 0463 E-mail: [email protected] ABSTRACT: 1) EU preferences in the energy policy 2) Fundamental EU documents 3) Principal requirements of the Directive No. 2001/77/EC 4) Basics and presumptions for support of electricity production from RER’s 5) Legislation in force in SR 6) Current support situation in SR

17.2.2005REGULATORY OFFICE FOR NETWORK
INDUSTRIES ( RONI ) 1
Access of RONI to the Renewable Energy SourcesIng. Ladislav Jediný

17.2.2005REGULATORY OFFICE FOR NETWORK
INDUSTRIES ( RONI ) 2
Access of RONI to the Renewable Energy SourcesSummary
1) EU preferences in the energy policy2) Fundamental EU documents 3) Principal requirements of the Directive No.
2001/77/EC4) Basics and presumptions for support of electricity
production from RER’s5) Legislation in force in SR6) Current support situation in SR

17.2.2005REGULATORY OFFICE FOR NETWORK
INDUSTRIES ( RONI ) 3
Access of RONI to the Renewable Energy Sources1) EU´s preferences in the energy policy
Decrease in power demands and primary power consumptionPower efficiency increaseSecurity of sustainable environment by reducing the greenhouse gases production, in particular CO2Increase in security and reliability of power suppliesSecurity of transparent and non-discriminatory environment on the internal electricity market
17.2.2005REGULATORY OFFICE FOR NETWORK
INDUSTRIES ( RONI ) 4
Access of RONI to the Renewable Energy Sources
2) Fundamental EU documents
Directive 2001/77/EC on promotion of electricity produced from RER’sDirective 2004/8/EC on promotion ofcogeneration based on a useful heatDirective 2003/54/EC on common rules for the internal market in electricity

17.2.2005REGULATORY OFFICE FOR NETWORK
INDUSTRIES ( RONI ) 5
Access of RONI to the Renewable Energy Sources3) Principal requirements of the Directive No. 2001/77/EC
Increase of the RER’s share in the total energy consumptionIncrease of electricity production share from RER’s in gross energy consumptionIncrease of heat production share from RER’sParticipation in active climate protection by reduction of greenhouse gases and other pollutant emissionsIncrease of diversification and decentralization of energy sources and thus increase of energy supply security

17.2.2005REGULATORY OFFICE FOR NETWORK
INDUSTRIES ( RONI ) 6
Access of RONI to the Renewable Energy Sources4) Basics and presumptions for energyproduction from RER ’s
Speed-up of issue of executive regulations for new actsCompulsory buyout of energy produced from RER’sPrice of energy produced from RER’s is set by regulation authority as a fixed price

17.2.2005REGULATORY OFFICE FOR NETWORK
INDUSTRIES ( RONI ) 7
Access of RONI to the Renewable Energy Sources
5) Legislation in force in SR
Till 31.12.20041) Act No. 70/1998 on Energy2) Act No. 276/2001 on Regulation in NetworkIndustries
Since 1.1.20051) Act No. 656/2004 on Energy2) Act No.657/2004 on Heating3) Amendment No. 658/2004 to Act. No 276/2001 on Regulation

17.2.2005REGULATORY OFFICE FOR NETWORK
INDUSTRIES ( RONI ) 8
Access of RONI to the Renewable Energy SourcesFundamental differences in legislation before and after31.12.2004
Till 31.12.2004 Compulsory buyout of electricity produced from RER’sElectricity price is a result of the agreement between producer and purchaserCompetency of RONI for setting maximum prices only
Since 1.1.2005Buyout of electricity produced from RER’s is not compulsoryElectricity price from RER’s is set by RONIRONI can set fixed pricesRONI issues statements on energy origin

17.2.2005REGULATORY OFFICE FOR NETWORK
INDUSTRIES ( RONI ) 9
Access of RONI to the Renewable Energy Sources
A producer generating electricity from renewableenergy sources shall have the priority right to electricity transmission, electricity distribution and supply.A producer of electricity from renewable energysources shall have the right to a guarantee oforigin in respect of electricity generated.In a general economic interest, the Ministry maydetermine, in a decision, an obligation to providepriority access and priority connection to thesystem, priority transmission, priority distributionand priority supply of the electricity generatedfrom renewable sources of energy.

17.2.2005REGULATORY OFFICE FOR NETWORK
INDUSTRIES ( RONI ) 10
Access of RONI to the Renewable Energy Sources6) Current support situation in respect of RER’s in SR
Price regulation in electro-energy sector is determinated by legal low grade measure –by desree of RONIA part of electricity transport and distribution price are justified costs for reasonabletransport and distribution losses RONI enables to cover the losses by purchase of electricity produced from RER’s

17.2.2005REGULATORY OFFICE FOR NETWORK
INDUSTRIES ( RONI ) 11
Access of RONI to the Renewable Energy Sources
This possibility forms space for contractual agreement, compulsory duties cannot be imposed by low grade measure in the Slovak RepublicMentioned problems are not actual in heat production from biomassFor price regulation in heating the costs are taken into account, producer has the right to include economically justified costs in prices for heating

17.2.2005REGULATORY OFFICE FOR NETWORK
INDUSTRIES ( RONI ) 12
Access of RONI to the Renewable Energy Sources
For electricity price determination from RER’sthe following general problems have to be taken into account:Setting of minimum ( fixed ) buyout electricityprice from RER’s energy by source type (production technology)Choosing of obligatory purchasers for electricity produced from RER’sDevelopment of mechanism for compensation of higher expenditures for mandatory buyout of electricity from RER’s

17.2.2005REGULATORY OFFICE FOR NETWORK
INDUSTRIES ( RONI ) 13
Access of RONI to the Renewable Energy Sources
Development of mechanism to project the higher expenditures from electricity buyoutfrom RERs into price for final consumersFor setting the fixed price for electricity produced from biomass to distinguish, if the energy is produced by new for that purposespecialiced technology or if additional combustion is used in the current adjusted equipment (fluidized bed boilers or grateboiler)

17.2.2005REGULATORY OFFICE FOR NETWORK
INDUSTRIES ( RONI ) 14
Access of RONI to the Renewable Energy Sources
Thank you
Ing. Ladislav Jedinýtel. 02/58100463
e - mail : jediny @ urso . gov . skweb : www . urso . gov . sk

SUSTAINABLE CONSTRUCTION AND RES IN THE CZECH REPUBLIC
Irena Plocková Ministry of Industry and Trade CR Na Františku 32, Praha, Czech Republic Phone: 00420 224 852 211 E-mail: [email protected] Abstract Sustainable construction is very closed connected with energy efficiency and energy performance in buildings. The technical potential was rated 48%, the economic potential has been estimated at 32% and the market potential has been estimated to a significant 11%. Households are the second largest group of end-use energy consumers of which about 60% are detached multi-family blocks of flats and space heating accounts for about 71% of final energy consumption. Tertiary sector is the third largest end-use energy sector with a share of 13% of the total final energy consumption in the Czech Republic. Space heating accounts for about 49% of final energy consumption, hot water production for about 33%, and electricity consumption for 18%. The tertiary sector shows a technical saving potential of 43%. The Energy Management Act and the Decrees introducing details of heat consumption with respect to thermal protection and requirements of energy audit for EE and RES. DG Enterprise EC - Agenda pro udržitelné stavění v Evropě charakterizuje tento proces jako: - používání environmentálně vhodných stavebních materiálů
- snížení energetické náročnosti budov - nakládání se stavebními materiály a jejich odpadem - celoživotní cyklus hodnocení staveb.
Aktuálním rámcem, který se vztahuje k snižování energetické náročnosti budov jako jednoho z indikátorů udržitelného stavění jsou: - Státní energetická koncepce jako výraz státní odpovědnosti za vytváření podmínek pro spolehlivé a dlouhodobě bezpečné dodávky energie za přijatelné ceny a za vytváření podmínek pro její efektivní využití, které nebudou ohrožovat životní prostředí a budou v souladu se zásadami udržitelného rozvoje. Je zřejmé, že minimalizace energetické náročnosti výrobní i provozní a maximálně možné využívání národního potenciálu energie z obnovitelných zdrojů jsou významným přínosem pro řešení tzv. kritické infrastruktury energetiky; - Národní program změny klimatu, vláda ČR na svém zasedání dne 3. března 2004 projednala a vydala usnesení č.187/2004, ve kterém schvaluje Národní program a ukládá ministrům životního prostředí, průmyslu a obchodu, dopravy, místního rozvoje, financí, zemědělství a ministryním školství a zdravotnictví zahrnout do činnosti resortů Redukční cíle, z kterých pro stavebnictví je zásadní: snížit energetickou náročnost v oblasti výroby, distribuce a konečné spotřeby energie na

úroveň 60 % až 70 % současné spotřeby primárních energetických zdrojů v roce 2030. V oblasti spotřeby energie u malospotřebitelů to znamená - zvýšení informovanosti veřejnosti o energeticky účinných koncových spotřebičích, tedy i budovách a jejich technických zařízení jako koncových spotřebičích, - podporu dalšího rozvoje energetických auditů, energetické certifikace budov, zavedení pravidelné kontroly účinnosti malých a středních zdrojů vytápění, - zkvalitnění tepelných izolací budov, zvýšení účinnosti osvětlovacích a ventilačních systémů a zlepšení územního plánování a budování infrastruktur, - podporu udržitelného stavění s nízkým energetickým standardem a zvyšování standardů účinnosti v průmyslových procesech, tedy i stavební výroby; - Národní strategie udržitelného rozvoje z ledna t.r.Ve vztahu ke stavění je kladen důraz na upřednostňování rekonstrukce a modernizace stávajícího fondu budov před novou výstavbou a orientaci již používaných stavebních lokalit před záborem nových ploch. Podmínkou takových rozhodování je jejich ekonomická přijatelnost a výrazné snížení zátěže životního prostředí. Neopomenutelným faktorem je ve všech případech energetická náročnost provozu budov. Je samozřejmé, že snižování spotřeby primární energie se dosahuje kvalitnější tepelnou ochranou budov, vyšší účinností jejich technických zařízení ale i vyšším využíváním obnovitelných nebo druhotných energetických zdrojů. Cílem s vysokou prioritou, směřující k maximalizaci úspor tepla v budovách ve sféře podnikatelské, státní, komunální i u drobných odběratelů (domácností) je využití potenciálu úspor modelovaného v Národním programu úspor. Dalším cílem, jímž jsou naplňovány priority nezávislosti, bezpečnosti i udržitelného rozvoje je podpora výroby elektřiny a tepelné energie z obnovitelných zdrojů energie. Stát bude podporovat využívání všech zdrojů energie, které lze dlouhodobě reprodukovat a jejichž používání přispěje k posilování nezávislosti státu na cizích zdrojích energie a k ochraně životního prostředí. Preferovat se budou všechny typy obnovitelných zdrojů – zdroje využívající sluneční energii, energii větru a vodních toků, geotermální energii i biomasu jako zdroje pro výrobu elektřiny a tepelné energie. Preferovat se bude rovněž využití druhotných zdrojů energie a alternativních paliv v dopravě. Národní program byl na základě § 5 zákona č.406/2000 Sb., o hospodaření energií formulován poprvé v r. 2001. Analýzy spotřeby energie v jednotlivých sektorech ukázaly závažnost spotřeby v terciálním, nevýrobním, sektoru s cca 33 % a ve výrobním s cca 42 % spotřeby energie. Konečná spotřeba energie v terciálním sektoru má stále ještě tradiční skladbu spotřeby s 33 % zemního plynu, 21 % pevného paliva, 19 % elektřiny, 21 % centrálně připravovaného tepla a jen 5 % bioenergie. Ohodnocení výše potenciálu úspor bylo provedeno jednak z hlediska celkového technického potenciálu a v návaznosti na ekonomické podmínky. Potenciál energie z obnovitelných zdrojů činí v elektřině cca 2300 GWh, v teple 25 PJ, celkem tedy 33 PJ. Udržitelný způsob stavění musí respektovat platné právní předpisy v oblasti navrhování a provádění budov, které je v ČR v současné době upraveno zejména vyhláškou č.137/1 137/1998 Sb., Ministerstva pro místní rozvoj ze dne 9. června 1998 o obecných technických požadavcích na výstavbu. Ministerstvo pro místní rozvoj stanoví podle § 143 odst. 1 písm.k) zákona č. 50/1976 Sb., o územním plánování a stavebním řádu (stavební zákon), ve znění zákona č. 83/1998 Sb., základní požadavky na územně technické řešení staveb a na účelové a stavebně
technické řešení staveb, které náleží do působnosti obecných stavebních úřadů a orgánů obcí podle § 117, 118, 119, 123 a 124 stavebního zákona. Posuzování energetické náročnosti budov se řídí ustanovením části druhé, obecné požadavky na bezpečnost a užitné vlastnosti staveb, odd. 2 ochrana zdraví, zdravých životních podmínek a životního prostředí, § 23 Denní osvětlení, větrání a vytápění. Odst. 1 paragrafu stanovuje postup při navrhování denního osvětlení, které se posuzuje společně zejména s možností sdruženého a umělého světlení, s vytápěním, chlazením, větráním, ochranou proti hluku, prosluněním včetně vlivu okolních budov a naopak vlivu navrhované stavby na stávající zástavbu za účelem dosažení vyhovujících podmínek zrakové pohody s minimální celkovou spotřebou energií v souladu s normovými hodnotami. Podle odst.2 Obytné místnosti, musí být zajištěno dostatečné denní osvětlení, přímé větrání a místnosti musí být dostatečně vytápěny s možností regulace tepla. Odst. 3 se týká vnitřního prostředí v pobytových místnostech, kde se navrhuje denní osvětlení v závislosti na jejich funkčním využití a na délce pobytu osob. V odůvodněných případech lze navrhovat sdružené, popřípadě umělé osvětlení v souladu s normovými hodnotami. Pobytové místnosti musí mít zajištěno přímé nebo nucené větrání a musí být dostatečně vytápěny s možností regulace tepla. Ze znění vyhlášky je pak vyvozena i právní úprava týkající se platnosti českých technických norem. Dalším právním předpisem, který se týká navrhování, provádění a provozování budov s požadovaným vnitřním prostředím je zákon č.406/2000 Sb., ve smyslu pozdějších znění a některé ze souboru provádějících vyhlášek k tomuto zákonu. Jedná se o vyhlášky k provedení § 6 zákona Účinnost užití energie a § 9 Energetický audit. Společně s ostatními zeměmi Evropského společenství je ČR povinna zabezpečit k 6.1.2006 implementaci Směrnice 2002/91/ES o energetické náročnosti budov do svého právního řádu. Pro členské státy ES vstoupila v platnost tato povinnost počátkem roku 2003, pro ČR prvním květnem 2004. Svým obsahem se týká zejména budov pro bydlení a nevýrobního sektoru a vychází ze směrnice Rady 89/106/EHS o sbližování předpisů o stavebních výrobcích, která stanoví nutná opatření k zabezpečení co nejnižší spotřeby tepla a energie na provozování budov a to v návaznosti na místní klimatické podmínky a při respektování ostatních základních požadavků na budovy. Závěrem je možno konstatovat, že realizace nastupující Směrnice 2002/91/ES o energetické náročnosti budov je velmi propracovaný konzistentní proces vedoucí k zvýšení kvality staveb a jejich technických zařízení při současném snižování nároků na zajištění dodávek energie a zlepšování životních podmínek obyvatel vyšší pohodou vnitřního prostředí a snižováním zátěže životního prostředí. Jedná se tedy jednoznačně o podporu udržitelného stavění jako součásti udržitelného rozvoje společnosti, který má v podmínkách ČR značný potenciál jak při výstavbě nových budov tak zejména při rekonstrukci a modernizaci stávajícího fondu budov.

INTERREGIONAL TRADE TO SECURING FUEL SUPPLY
FOR BIOMASS INSTALLATIONS
Michael Wild CEO European Bio Energy Services AG Auhofstrasse 142a, 1130, Vienna, Austria Phone: +431 879 9957-30 E-mail: [email protected]

©EBES
EBES AGEuropean Bio Energy ServicesEuropean Bio Energy Services
Michael Wild, 21.02.2005
A – 1130 Vienna; Auhofstraße 142 a
T: +43 (0)1/879 99 57 F: +43 (0)1/879 99 57 60 e-mail: [email protected] ; www.ebes.at
INTERREGIONAL TRADE INTERREGIONAL TRADE TO SECURING TO SECURING
FUEL SUPPLY FOR FUEL SUPPLY FOR BIOMASS INSTALLATIONSBIOMASS INSTALLATIONS

©EBES
fuel consumption for power generation in EU-15
0
50
100
150
200
250
300
350
400
450
1990 1995 2000 2005 2010 2015 2020 2025 2030
Mio
tons
GeothermieBiomasseErdgasErdölKohle
EBESEuropean Bio Energy Services
Source: Energie Verwertungsagentur
0
100
200
300
400
500
600
700
2000 2005 2010 2015 2020 2025 2030
feed in gap
Gig
awat
t
feed in gapMiscellaneousgascoalnuclear energywater
Substitution of power plants and resulting feed in gap
:
:Source: Cooretec, 2004

©EBES
EBESEuropean Bio Energy Services
RESULTING FACTS FOR RESRESULTING FACTS FOR RES
•Numerous new installations needed•Number of RES power plants quickly increasing•Broadening of spectrum of installation size•Average size (MW) of installation increasing•Broadening of the investment basis•From local initiatives to international investmentprojects

©EBES AG
EBESEuropean Bio Energy Services
•Numerous new installations in development•Number of „bio“ power plants quickly increasing•Typical 20MWel installation •Co-firing in very large scale coal power plants
• Doubling of demand for biogenic fuels• Shift in demand structure for biogenic fuels• Volumes demanded at single locations increase• Security of supply and risk hedging
possibilities requested • Dis-satisfaction with currently available
structures
RESULTING FACTS RESULTING FACTS BiomassBiomass
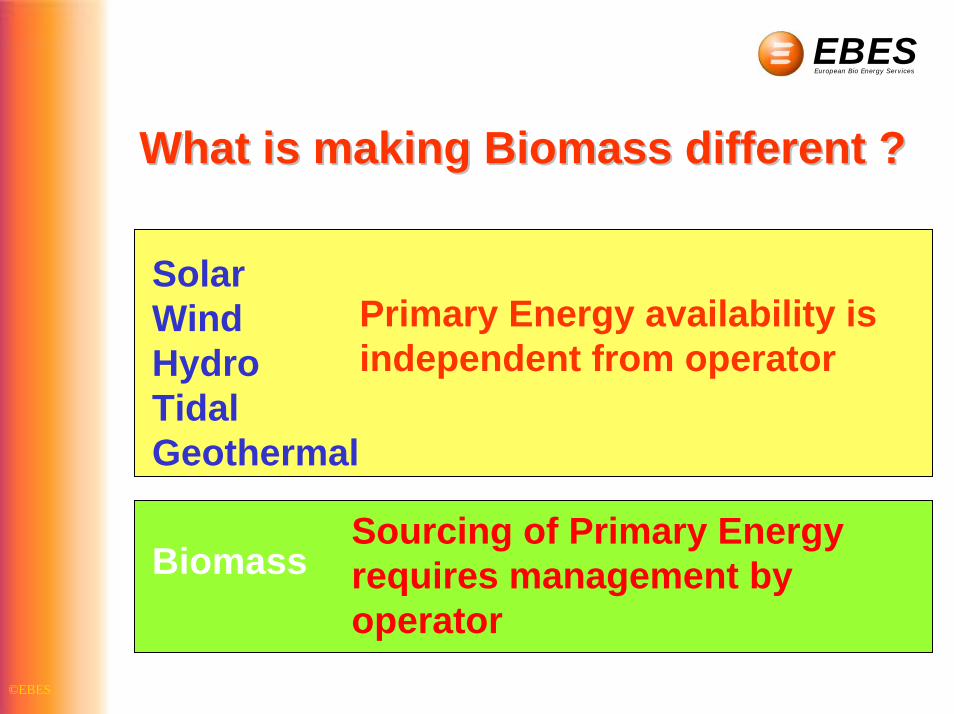
WhatWhat isis makingmaking BiomassBiomass different ?different ?
©EBES
EBESEuropean Bio Energy Services
SolarWindHydroTidalGeothermal
Biomass
Primary Energy availability isindependent from operator
Sourcing of Primary Energyrequires management by operator

BIOMASS BIOMASS Projects imposeProjects impose a a longlong termterm responsibilityresponsibility on on thethe operatoroperator to to securesecure thethe
availabilityavailability of of fuelfuel at at anyany timetime
©EBES
EBESEuropean Bio Energy Services
Security of supply for the fuel is the basis for financing of any biomass project

ChallengesChallenges to to fuelfuel managementmanagement
©EBES
EBESEuropean Bio Energy Services
How much of which Quality is needed
How to bundle supply sources
Local versus interregional supply
Long term / short term / spot acquisitions
Hedging against price increases
What if suppliers default

©EBES
Current situation for large scale Current situation for large scale biobio-- fuel buyers fuel buyers
Limited no. of known large scale sellersLimited no. of known large scale sellersPPP dominates marketPPP dominates marketDemand rapidly increasingDemand rapidly increasingRegional price volatility Regional price volatility Limited internat. Trade expertise availableLimited internat. Trade expertise availableDifferent levels of market Different levels of market developmentdevelopmentDifferent (understanding of) quality standardsDifferent (understanding of) quality standardsLong term (Long term (bankablebankable) contracts rarely ) contracts rarely
availableavailable

©EBES
Current situation for large scale Current situation for large scale biogenicbiogenic fuel suppliers fuel suppliers
Limited no. of known large scale buyersLimited no. of known large scale buyers20+ languages20+ languagesMultiple bordersMultiple bordersDifferent levels of market Different levels of market developmentdevelopmentDifferent (understanding of) quality standardsDifferent (understanding of) quality standardsInvolvement in project finance schemes Involvement in project finance schemes
requiredrequiredInflexible rail cargo companiesInflexible rail cargo companieslow level in logisticslow level in logistics spezialisationspezialisation

Supplier Buyertransport-logistics
©EBES – EUROPEAN BIO ENERGY SERVICES
access to a much bigger marketeasy and simple accessibleclearly defined goodscomplete supply chain service offeredoptimised logisticslong term contracts on demandrisk hedging tools available
©EBES
EBESEuropean Bio Energy Services

©EBES
Advantages
Short transport distances
Added value within region
Personal contacts
Believed higher relyability
Less bureaucracy
Quality claims easier
No phytosanitation costs
Disadvantages
Limited number of suppliers
Dependency high
High risk resulting from single performance failures
Complete exposure to local developments
Limited ways to avoid ruinous competition
Limited ressources
Local SupplyLocal Supply
EBESEuropean Bio Energy Services
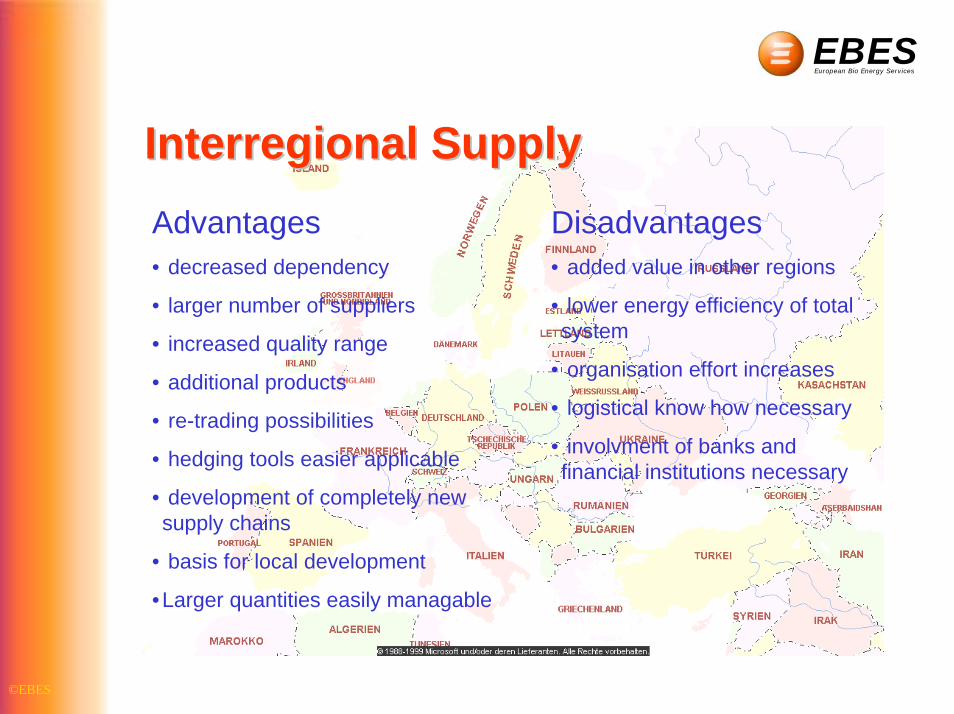
©EBES
Advantages• decreased dependency
• larger number of suppliers
• increased quality range
• additional products
• re-trading possibilities
• hedging tools easier applicable
• development of completely new supply chains
• basis for local development
•Larger quantities easily managable
Disadvantages• added value in other regions
• lower energy efficiency of total system
• organisation effort increases
• logistical know how necessary
• involvment of banks and financial institutions necessary
Interregional SupplyInterregional Supply
EBESEuropean Bio Energy Services

©EBES
50%
20%50%
50%
locallocal optionsinterregionalinterregional options
ProcurementProcurement portfolioportfolio; ; a a proposal for proposal for an an efficient strategyefficient strategy
EBESEuropean Bio Energy Services

©EBES
“FUTURES, Forward contracts”• intermediation and realization of contracts• setting of standards for futures in the area
of biofuels in order to get them tradeable• offering the trading platform • taking the position of a clearing house
„OPTIONS“• setting of standards for options in the area
of biofuels in order to get them tradeable
„SWAPS“• Development of first SWAPS based on and
index to be developed at BioXXchange
Forward Forward BusinessBusiness

©EBES
EBES is building physical stocks EBES is holding options and forward contracts onbiogenic materialPower plant operator is buying an option at fixed or variable terms Option fees payable at annual basisDelivery after utilization of option within 6 weeks Accounting unit MWhOptions fully transferableIncreased security for continuous operationIncreased independence
SECURITY STOCKS SECURITY STOCKS ––an an insurance serviceinsurance service of EBESof EBES
EBESEuropean Bio Energy Services

©EBES wwwwwwwww...ebesebesebes.at.at.at
Additional Services Additional Services Offered Offered
Complete supplyComplete supply of of installationsinstallations via via brokerage servicesbrokerage services
strategical partnerships strategical partnerships in in fuel developmentfuel development
partner partner in in developmentdevelopment of of logisticallogistical systemssystems
partnerships with project developerspartnerships with project developers
BIOENERGY BIOENERGY -- CONTRACTINGCONTRACTING

Production BioXchangeTrade
Europe
OverseasTrader
Broker
Consumer
daytrade
futures
options/driv.
Registered brokers
deposits
Production
ByProducts
GrowingHarvestingProcessingStoringClearing for transport
CollectingProcessingBlendingStoringClearing for transport
Transport
Ready to load
Ready to harvest
(central+decentral
StorageProduction BioXchangeTrade
Europe
OverseasTrader
Broker
Consumer
daytrade
futures
options/driv.
Registered brokers
deposits
Production
ByProducts
GrowingHarvestingProcessingStoringClearing for transport
CollectingProcessingBlendingStoringClearing for transport
Transport
Ready to load
Ready to harvest
(central+decentral
StorageProduction BioXchangeTradeTrade
Europe
OverseasTrader
Broker
Consumer
daytrade
futures
options/driv.
Registered brokers
deposits
Production
ByProducts
GrowingHarvestingProcessingStoringClearing for transport
CollectingProcessingBlendingStoringClearing for transport
Transport
Ready to load
Ready to harvest
(central+decentral
StorageStorage
EBES EBES –– basic structurebasic structure

©EBES
forest wood and residues agrobiomassindustrial secondary wood and residual productspyrolyse oils, talloilsoil seeds and oils, RMEenergy cropsby-products of agro industryethanoletc.
What is traded What is traded at and at and byby EBESEBES
EBESEuropean Bio Energy Services

©EBES
EBESEuropean Bio Energy Services
• EBESs target to reduce transport costs per energy unit supplied.
• Surprisingly this is resulting partly in increasesof transport distances
• Nevertheless, off the shipping routes costs resulting from transport distance is still the barrier for interregional supply chains
• EBESs supply in 2004 is totalling appr. 75000 metric tons or biogenic energy fuels equal to 400 000MWh
• This can fire 65MWth and about 95% of thismaterial is transported for more than 5000km. Only 5% traded locally

©EBES
EBES Forms of TransportEBES Forms of Transport
By trainBy train
By truckBy truck
By ship By ship (ocean or river(ocean or river))

©EBES
EBES shipping routesEBES shipping routes
By train, truckBy ship
From the
Americas

©EBES
70
75
80
85
90
95
100
coal GUS gas importGUS
gas mix local biomass interregionalbiomass
per
cent
EBESEuropean Bio Energy ServicesENERGY EFFICIENCYENERGY EFFICIENCY
ratio ratio secundarysecundary//primary eneryprimary enery
Source: GEMIS

©EBES
EBESEuropean Bio Energy Services
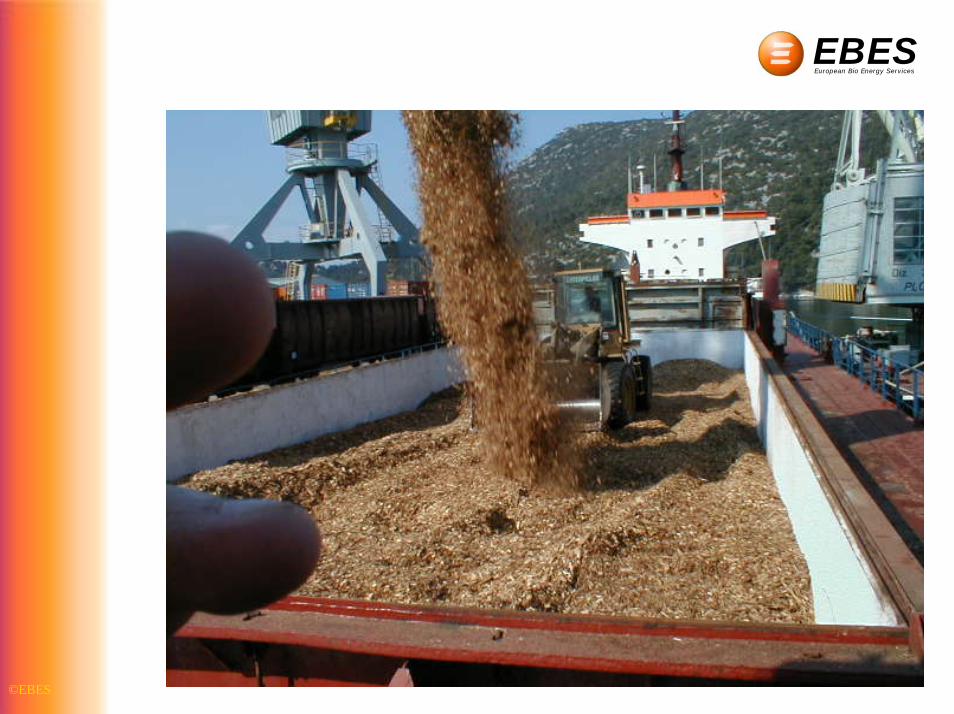
©EBES
EBESEuropean Bio Energy Services

©EBES
EBESEuropean Bio Energy Services
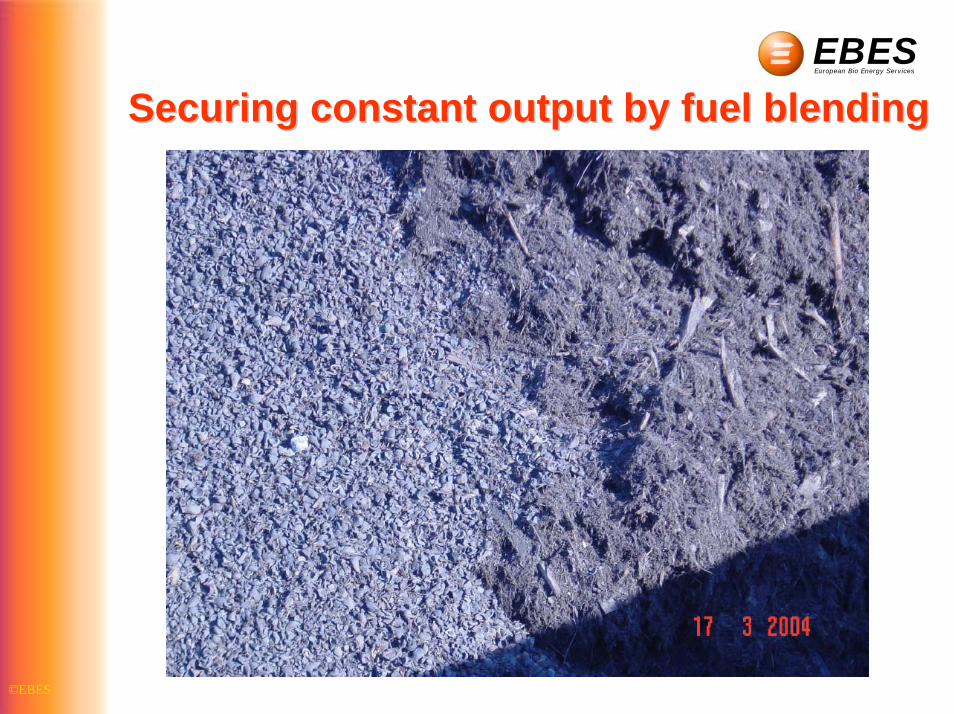
©EBES
EBESEuropean Bio Energy Services
Securing constant output by fuel blendingSecuring constant output by fuel blending

STRATEGY FOR PRODUCTION AND USE OF ALTERNATIVE FUELS
Jozef Mikulec1, Ján Cvengroš2, Eva Romančíková3, Peter Lauko4
Managing director 1Slovnaft VÚRUP, a.s., Vlčie Hrdlo, 824 12 Bratislava, Slovakia Phone:00421 2 45 248 824, E-mail: [email protected] 2Faculty of Chemical & Food Technolgy, Slovak University of Technology 3Faculty of Economy, Finance Department, University of Economy 4Slovak Ministry of Economy Abstract The use of biocomponents in the former Czechoslovakia has a long tradition. It was mandatory to add biofermentation ethanol into petrol in the 1930s. Rapeseed oil methylesters production and sales were quickly and successfully launched in the 1990s. The current fall in their consumption has been caused by changes in taxation and price support. One of major obstacles to more extensive use of biofuels in the transport sector is their price. Currently it is more difficult to effectively sell biofuels than to produce them. Some specific properties of biofuels require to make changes in logistics, storage, particularly long-term one, as well as to introduce mandatory certification of producers and to make inspections in the petrol station network. Fuel price depends mainly on taxes and crude oil price. The biofuel production sector should be stabilized by defining and implementing a medium-term national strategy. The Slovak Republic has a chance to cut unemployment and to use its surplus farm products and forest wastes for the production of high-quality biocomponents for transport. Slovakia’s Motor Fuel Market Three types of lead-free car petrol with different research octane numbers are being sold in the Slovak market. Their respective market shares are 17:79:4. The marketshare of BA91 petrol declines while the share of BA91 petrol rises in the long run. Petrol with octane number over 99 has a minimum market share. For diesel engines, low-sulphur diesel fuel is available on the market. Some companies offer also diesel fuel with upgraded properties – with better detergent properties, filtration limit temperature and sulphur content. LPG sales are increasing although its potential is limited and car conversion is expensive. CNG use in buses is gathering pace, but the growth rate is limited by the number of supply points and the number of vehicles. A conversion for CNG is expensive as well. The consumption of these fuels increases thanks to lower excise taxes in comparison with petrol and diesel oil. From January 1, 2005, only petrol and diesel fuel with a sulphur content below 10 mg/kg are sold in Slovakia, which allows operations of the latest models of cars fitted with the aftertreatment system that produce only a very small amount of emissions and CO2. All biofuels currently produced in Slovakia are exported abroad. Domestic consumption is virtually nonexistent. For indication purposes, the average values of the best-selling summer-time petrol BA95 in 2003 are given below.

Table 1
Analytical and statistical results Limit values under 98/70/EC, Annex II
Parameter
Unit
Min. Max. Average Standard deviation
Min. Max.
Octane number* (RON)
- 95.0 96.2 95.59 0.236 95.0 -
Octane number** (MON)
- 85.1 87.2 86.32 0.478 85.0 -
sulphur content
mg/kg 0.60 10.60 4.57 2.02 - 150
vapour pressure, RVP
kPa 49.8 60.4 55.59 2.117 - 60
olefin content
%(V/V) 0.90 17.90 8.67 3.64 - 18.0
aromatics content
%(V/V) 23.90 41.99 33.24 3.48 - 42.0
benzene content
%(V/V) 0.30 0.72 0.542 0.090 - 1.00
MTBE content
%(V/V) 1.40 4.99 2.61 0.778 15
* octane number determined by research method ** octane number determined by motor method Current and Future Motor Fuel Consumption Table 2 shows energy consumption breakdown by type and sector of use. Liquid fuels account for 103.53 PJ, i.e. 2.3 % of the total consumption. The transport sector‘s consumption is 54.59 PJ in the form of liquid fuels, i.e. 11.37% of the total consumption. Table 2
2000 figures Solid fuels [PJ]
Liquid fuels [PJ]
Gas fuels [PJ]
Heat [PJ] Electricity [PJ]
Total [PJ]
Industry 68.40 23.19 113.23 0.39 36.84 242.04 Transport 0.00 54.59 0.00 0.00 3.47 58.07 Agriculture 0.41 6.65 2.03 0.50 2.22 11.81 Trade, services 9.31 1.85 20.42 12.37 18.96 62.91 Households 2.07 0.45 60.36 16.25 19.51 98.64 Non-energetic consumption
0.00 16.80 20.50 0.00 0.00 37.30
Total 80.18 103.53 216.54 29.52 81.00 510.76 Source: EGU-energetický ústav, a.s. (EGU-Energy Institute, Inc.) The following table summarizes motor fuel consumption since 1999 with an outlook towards 2010. The fuel consumption data will be used as a basis for prognosing biofuel consumption.

Table 3 Year Petrol,
‘000 tonne/year Diesel fuel,
‘000 tonne/year LPG, ‘000
tonne/year
CNG, ‘000
tonne/year
Total motor fuels, ‘000 tonne/year
1999 686 794 1 480 2000 611 734 1 345 2001 644 781 25 1 450 2002 659 879 29 1 567 2003 672 923 32 1 628 2004 686 970 35 3 1 693 2005* 699 1 018 39 5 1 761 2006* 713 1 069 42 7 1 831 2007* 728 1 122 46 9 1 905 2010* 772 1 179 50 11 2 012
Historical Consumption of Motor Fuels and Prediction up to 2010
Annual consumption growth rates: gasoline 1%, diesel 5%
1998 2000 2002 2004 2006 2008 2010 2012
Year
-200
0
200
400
600
800
1 000
1 200
1 400
1 600
1 800
2 000
2 200
Con
sum
ptio
n of
Fue
ls,
kt/r
Gasoline, kt/r Diesel, kt/r Total motor fuels, kt/r LPG, kt/r CNG, kt/r

Historical Consumption of Motor Fuesl and Prediction up to 2010 in toe/y
Proposed interannual chnge of growth: gasoline 1%, diesel 5%
1998 2000 2002 2004 2006 2008 2010 2012
Years
400 000
600 000
800 000
1 000 000
1 200 000
1 400 000
1 600 000
1 800 000
2 000 000
2 200 000
Cons
umpt
ion
of m
otor
fuel
s, to
e/r
Gasoline, toe/r Diesel, toe/r Motor fuels, toe/r
New types of vehicles with a lower fuel consumption are being introduced on the market, but at the same time the number of vehicles in operation increases and so does the annual mileage. Unless excise tax rates and their mutual ratios change substantially, petrol consumption will be flat, while the consumption of diesel fuel, LPG and CNG will rise constantly (until 2010). Intensive research of engines running on liquefied petroleum gases (LPG) and compressed natural gas (CNG) was made in the past decade. They produce much less emissions than ordinary engines. LPG has become an attractive fuel owing to its low price. A further rise in LPG consumption as a motor fuel is limited by the extensive use of LPG as a raw material in refineries and as a substitute for natural gas. In addition, LPG is not a very energy-efficient fuel (production, storage, compression before transport in railway waggons or tanker trucks). For comparison: natural gas is easier to transport, contains 25% hydrogen and is therefore a very clean fuel. It has a higher energy density than LPG, and also a higher energy efficiency when used in a proper stechiometric engine. It readily mixes with air thereby ensuring easy cold-engine starts, has no volatile emissions, its sulphur-content is lower than that of petrol, and its hydrocarbon emissions are not toxic and reactive. It is a safe fuel, burning at 650oC. CNG is an exclusive solution for city bus transport. Its drawback is that as much as 1,000 litres of natural gas is needed to supply the same amount of energy as 1 litre of diesel fuel. Even when compressed, a car running on natural gas needs a five times larger fuel tank than a car running on diesel oil. Special Fuel Market During the 8 years between 1995 and 2003, the number of cars rose by 25 % to 1,879,854. The structure of vehicles is in the table below. The number of cars rose particularly fast in towns, notably in Bratislava which accounts for 18 % of all passenger cars registered in Slovakia.

Table 4 Number of vehicles
1993 1995 1997 1998 1999 2000 2001 2002 2003
passenger 994 933 1 015 794 1 135 914 1 196 109 1 236 396 1 274 244 1 292 843 1 326 891 1 356 185trucks and
vans 101 552 102 634 103 080 111 081 115 981 110 714 120 399 130 334 142 140
special 46 121 45 797 45 376 43 690 41 670 39 188 36 082 34 150 32 033 tractor trucks
* . 600 1 721 2 306 3 281 4 994 6 837 8 851
buses 12 655 11 812 11 235 11 293 11 101 10 920 10 649 10 589 10 568 tractors 65 150 64 536 63 145 63 448 63 493 64 351 63 422 62 644 61 690
trailers and semi-trailers
167 174 175 740 182 893 191 241 197 917 201 269 206 627 213 167 218 517
motorcycles 81 263 81 847 81 062 100 891 44 215 45 647 46 676 47 900 48 709
other * * * * * 2 226 1 507 1 306 1 161 Total
number of vehicles
1 468 848 1 498 160 1 623 305 1 719 474 1 713 079 1 751 840 1 783 199 1 833 818 1 879 854
*registered as special vehicles in 1993-1999 Source: Slovak Statistical Office In many countries, attempts are made to identify the fuel market for special vehicles. It is desirable that these vehicles use biofuels and alternative fuels for environmental reasons. This market has several common signs: • A large percentage of the national biofuel consumption can be realised in this segment, • The group consists of a limited number of consumers, • The consumer market is rather uniform, • Refuelling points are separated from public petrol stations. Several user groups in Slovakia meet the above conditions: • Bus transport, notably in major cities (the number of buses is 10,600), • Farm and forest tractors (61,690 pieces, soil protection in the event of rupturing the fuel
tank, protection of drinking-water sources and ecosystem), • Trucks and special vehicles operating in places of water protection, • Railway locomotives, • Taxis.

Number of Road Transport Vehicles
1992 1994 1996 1998 2000 2002 2004
Years
0
20 000
40 000
60 000
80 000
100 000
120 000
140 000
160 000
Num
ber o
f Veh
icle
s
trucks & vehicles special vehicles tractors buses motorcycles
Administrative deregistration of disused motorcycles
trucks and vans = -7,7535E6+3936,6537*x special vehicles = 3,1335E6-1547,5087*x tractors = 5,0709E5-221,987*x buses = 3,867E5-187,8918*x The Need of a Long-Term Strategy Biofuel production and use bring a couple of beneficial effects which, when appraised, would increase the cost effectiveness of adopted measures. The most important effects of biofuel production and use include: • environmental • energetic • economic The environmental beneficial effects comprise: • reduction of greenhouse gas emissions, • cleaner air, particularly locally, • land reclamation, • safety, simple use and decomposition when leaked in accidents, • biofuels are appropriate for use in environmentally sensitive or protected areas.

Energetic Benefits • some degree of the country’s energy security, • lower reliance on imported raw materials necessary for energy production. Economic Benefits • wider offer of energetic fuels, • new business activity (employment in agriculture and industry, GDP growth), • effects resulting from a cleaner air. The above benefits from biofuel production can be appraised only on the basis of rather extensive database which often is not available. The appraisal can be made by a combination of several methods dominated by a cost-benefit analysis. The developments in biofuel production and consumption between 1991 and 1999 have proved that the potential of farm products can be quickly utilized in production if suitable business conditions are created. However, the subsequent developments have shown how vulnerable all these productions are as their support and benefit appreciation were only verbal, and no serious benefit calculations were made. A further development requires to prepare and approve a medium-term strategy for this business area which will ensure equal conditions and stability for all parties concerned. As the resources are inadequate, a political support must also be obtained. CNG is currently promoted by a lower tax rate, although it does not come from renewable resources, all of it is imported, and requires a costly car conversion. The tax system should prefer fuels on the basis of a benefit analysis. Government Support to Biofuel Production An analysis of major factors which control the success of biocomponent-use-in-motor-fuels projects has resulted in the following main conclusions: • In all countries where a biocomponent production program was successfully
implemented, agriculture was one of the parties involved. From a political point of view, alternative fuels play a major role in the development of farming and rural areas.
• As the production costs of alternative fuels are much higher than the cost of fuels produced from fossil resources, a support is necessary to eliminate this difference. Where this support is nonexistent or has been cancelled, the production has not started or has been interrupted.
• In many cases, biofuel production was successfully implemented by petroleum companies (distributors, blenders) with appropriate state aid.
• The parties concerned require fixed rules with preferences valid over a rather long period of time. The rules include necessary fuels legislation and an extensive financial support.
Before the government decides to assist in resolving problems associated with biofuel production, it should know the answers to the following questions: • What should be the extent of the state aid? • Can the state aid result in a change in the behaviour of biofuel producers and
consumers, will biocomponent producers be willing to produce fuels with the proposed amount of aid, and will consumers buy them,
• Will the effects of biocomponent use exceed the expenses of the state to support them?
• Is the cost of supporting biofuel production and consumption associated with the highest efficiency rate of spending public money?
• What form of state aid is the most suitable?

Theoretically, state aid could be given either to the production sector, i.e. to producers of farm products – farmers or to processors – the industry, or to the consumption area. Theoretically, support to biofuel processors can be provided as a direct state aid or an indirect state financial aid. A direct state financial aid may have the following forms: subsidies, contribution, grant, refundable financial aid, etc. An indirect state financial aid may have the form of a state guarantee, reduced taxes or penalties or complete waiver of penalties and fines, and tax deferral. The currently used forms include mainly various tax relieves, investment grants and soft loans up to the full amount of investment costs with deferred repayments. A tax relief is a financial category closely connected to public and business finances. It is an indirect financial tool of financial policy which, unlike direct financial incentives, includes no fiscal financial operations in the form of incomes or expenses of public budgets. Because of this fact, tax relieves can be regarded as a form of indirect subsidy stimulating the business sector to take decisions in accordance with the intentions of the tax relieve provider. However, before granting tax relieves in the implementation of its fiscal monetary policy, each government must solve the financial problems listed below: • selection of the tax or taxes which should be cut, • definition of the subject of the tax relief, • determination of the form to provide the tax relief. Decisions relating to the tax selection, i.e. suitability of the tax, are based on the amount of the collected tax and whether the tax is regularly recurrent or one-off. These criteria are met by income-type taxes. But it does not mean that other direct taxes are not suitable for granting tax relieves. Tax relieves can also apply to property taxes as well as indirect taxes such as mineral oil excise tax and value added tax. Tax relieves for biofuel processors in Slovakia may have the following forms: • reduction of tax rate on mineral oils and its differentiation based on regional conditions, • reduction of the base of corporate profit tax, • deduction from the tax base of a certain amount of capital expenses on biogas production up to a certain pre-determined percentage of the tax base1. Despite some differences, all tax incentives always reduce the tax liability of the company concerned. Macroeconomic Evaluation of FAME Use
� Borodovčák, M.: Daňové právo s vysvetlivkami (Tax law with explanations), IURA EDITION Bratislava 1993, updated edition 2003

Like petrol and diesel fuel production, the production of biocomponents suitable for these fuels also has some specific features. Therefore the evaluation of the effects is different as well. As for the costs, the increased costs are reflected in the selling price. Tax relieves for biodiesel fuel are currently in place. On the cost side, excise tax collection will therefore fall. Costs – lost mineral oil excise tax, rate SKK 14,400/ 1000 l
year 2005 2006 2007 2008 2009 2010 Biodiesel consumption, ‘000 t/yr
45 60 80 90 90 90
Lost tax, SKK million
782 977 1 303 1 153 1 153 1 153
Revenues On the revenues side, biodiesel use may be evaluated from three aspects: A. environmental effects, B. economic effects, C. effects in farming and development of rural areas. A. Environmental Effects A. . Reduction of greenhouse gas (GHG) emissions and compliance with the Kyotó protocol
Rapeseed biodiesel ULSD Costs :
€/l 0.56 0.29 €/km 0.039 0.016
Reduction of CO2 emissions (%)
57 -
Emissions, g CO2/km 85 198 ∗Cost of emission reduction, €/t CO2
206 -
∗Cost of reduction of CO2 emissions = extra costs (€/km) / CO2 reduction (g/km) * 106
A.2 Reduction of Air, Water and Soil Pollution Biodiesel’s advantages comprise a more suitable emissions profile and greater biological degradability in the event of leaking into the natural environment. Biodiesel is particularly suitable for use in diesel engines in railways where the risk of soil contamination is high. The use of pure biodiesel should be mandatory in diesel engines used on recreational bodies of water and in forest management. A.3 Reduction of Environmental Pollution in Special Areas As biodiesel generates less emissions of particles, it is suitable for use in public transport in big cities and in towns with adverse dispersion conditions and in areas subject to special protection. In such areas, biodiesel is a recommended source of energy for heating and electricity generation. One example is the use of 3,000 tonnes of biodiesel per year for heating in the German Parliament in Berlin.

B. Economic Effects B.1. Job Creation Data from Austria and Spain indicate that 1,000 tonnes of biodiesel per year create 26 jobs. The calculation is based on a monthly salary of SKK 12,000.
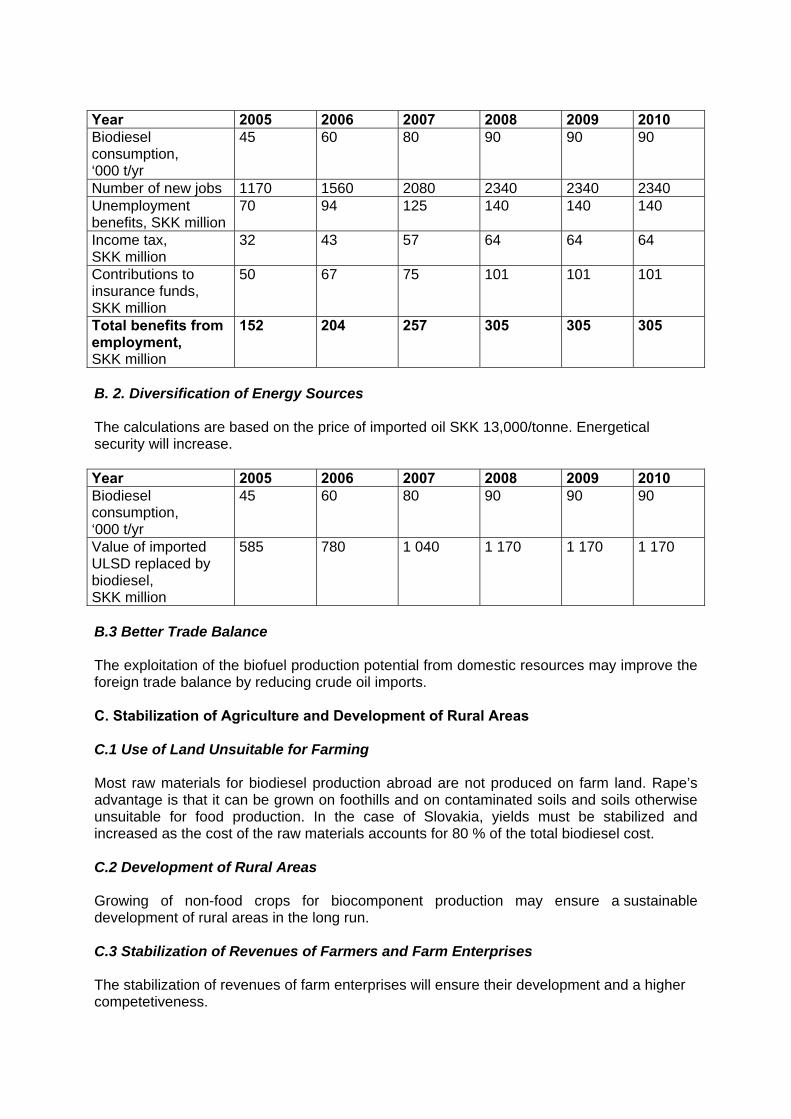
Year 2005 2006 2007 2008 2009 2010 Biodiesel consumption, ‘000 t/yr
45 60 80 90 90 90
Number of new jobs 1170 1560 2080 2340 2340 2340 Unemployment benefits, SKK million
70 94 125 140 140 140
Income tax, SKK million
32 43 57 64 64 64
Contributions to insurance funds, SKK million
50 67 75 101 101 101
Total benefits from employment, SKK million
152 204 257 305 305 305
B. 2. Diversification of Energy Sources The calculations are based on the price of imported oil SKK 13,000/tonne. Energetical security will increase. Year 2005 2006 2007 2008 2009 2010 Biodiesel consumption, ‘000 t/yr
45 60 80 90 90 90
Value of imported ULSD replaced by biodiesel, SKK million
585 780 1 040 1 170 1 170 1 170
B.3 Better Trade Balance The exploitation of the biofuel production potential from domestic resources may improve the foreign trade balance by reducing crude oil imports. C. Stabilization of Agriculture and Development of Rural Areas C.1 Use of Land Unsuitable for Farming Most raw materials for biodiesel production abroad are not produced on farm land. Rape’s advantage is that it can be grown on foothills and on contaminated soils and soils otherwise unsuitable for food production. In the case of Slovakia, yields must be stabilized and increased as the cost of the raw materials accounts for 80 % of the total biodiesel cost. C.2 Development of Rural Areas Growing of non-food crops for biocomponent production may ensure a sustainable development of rural areas in the long run. C.3 Stabilization of Revenues of Farmers and Farm Enterprises The stabilization of revenues of farm enterprises will ensure their development and a higher competetiveness.


C.4 Increased Honey Production Honey production is approximately 20 kg per hectare per one colony of bees, the revenues from one bee colony are SKK 6,000, the cost is SKK 3,360, and the net profit is SKK 2,640 per hectare of rape. At the average yield of 2.75 tonnes per hectare, the results are as follows: Year 2005 2006 2007 2008 2009 2010 Biodiesel consumption, ‘000 t/yr
45 60 80 90 90 90
Profit from honey production, SKK million
9.8 13.1 17.4 19.6 19.6 19.6
C.5 Support to Market-Oriented Agriculture The production of raw materials for biocomponents will support the creation of a multifunctional agriculture if wastes and by-products are increasingly processed (use of hey for energetic purposes, better utilization of waste glycerine, use of waste salts as fertilizers, etc.). The very simplified calculation indicates that the state support to FAME production and sales is necessary from a macroeconomic point of view. Proposed Strategy of Supporting Alternative Fuel Production and Use To ensure the implementation of the Guidelines, Slovakia will have to adopt new legislative and economic rules: 1. Preparation of a synthetic document evaluating Slovakia‘s biomass potential, available
technologies for biocomponent production, and a macroeconomic evaluation with the objective to select optimum alternatives from an economic point of view. The document must be in line with biomass utilization for energetical purposes.
2. Declaration of a state program of supporting production and use of biocomponents and alternative fuels produced primarily from biomass and wastes with objectives until 2015. The program should set basic indicative consumption objectives and the manner of support.
3. Within the new program, support should be given to the research and development of technologies and equipment, and launching of pilot projects for processing farm products, wastes and other biomass.
4. Support to a pilot project of synthetic fuel production by BTL technologies for which Slovakia has suitable raw material resources.
5. Support to the use of clean biofuels in certain fleets of vehicles (buses for public transport, forest management companies, stationary engines). In justified cases, the use of biofuels should be mandatory (bodies of water).
6. Introduction of suitable incentives (depreciation policy, free parking, etc.) to support the use of biofuel-driven cars which can be used in places with high emission concentrations.
7. The program should be combined with support to regions with a high unemployment and underdeveloped regions, potentially with aid from EU funds.
8. Before the programme is adopted, an extensive public discussion and a promotional campaign should be launched with the objective to familiarize the wide spectrum of consumers with the latest knowledge.
9. The obligations resulting from the biofuel-promotion guidelines should not be fulfilled by mandatory adding of biocomponents to fuels, but appropriate economic and tax

incentives should be used instead, including production quotas designed to stimulate improvements in the economic parameters of production. This model has long been used in France.
10. Issuance of a Slovak government regulation to stimulate biofuel production by introducing a subsidy to the price of biofuel. These subsidies should only be paid to biofuel producers (agricultural enterprise/farm, biocomponent producer, producer of fuel-biocomponent mixture) and the amount of the subsidy should be derived from the price of diesel fuel and petrol, price of oil seeds and grain, price of groats and distillery refuse.
11. Fast preparation of a biocomponent quality standard and its acceptance into the system of Slovak technical standards (STN).
12. Introduction of a mandatory certification of biocomponent producers under ISO 9001 standards.
13. Preparation of an amendment to the Slovak Environment Ministry’s fuel quality regulation. The STN EN 14 214 standard must be mandatory including an ethanol quality standard.
14. Introduction of regular biofuel-quality inspections in the sales network. 15. The Mineral Oil Excise Tax should be amended if necessary. 16. Amending the Wastes Act and supporting the collection of used cooking oils by the long-
term unemployed. Biocomponent Production and Use Program Proposal Given the current state of biocomponent production, the biofuel guidelines should be implemented in Slovakia in at least two stages. The outlook should be regularly updated as the biofuel issues change very dynamically. In the first stage until 2005, biofuels can only be produced by adding biodiesel to petroleum diesel fuel. The production facilities built in the past are sufficient to produce 65,000 t/yr of oil equivalent, i.e. 3.6 % of the total motor fuel consumption (reference consumption in 2005). More capacities will be necessary from 2008 onwards as the increased consumption of 73,000 t/yr of oil equivalent until 2010 will presumably be satisfied by the intensification of the current production facilities. 250,000 tonnes of rape seed will have to be grown in the target year 2010 alone to produce the required amount of ester. Considering the average yield in the EU countries of 2.75 tonnes per hectare, 90,000 hectares of land will be necessary to meet the goal. 125,000 hectares would be needed if the yields remained on the current level of 2 tonnes per hectare. A natural requirement is to eliminate great variations in the yields. Some improvements can also be made in the collection of used oils and their use as an energy source. From a technical viewpoint, biodiesel and petroleum diesel oil can be blended before shipment in terminals as such a mixture should not be transported by a product pipeline nor should it be stored for a long time. The launching of the first stage of the project is only possible if petroleum diesel and biodiesel blending facilities are built in terminals in companies where this does not contradict the Mineral Oil Excise Tax Act. This investment will be worth € 3 million. In the second stage it will be necessary to prepare investments and to instal facilities for the production of water-free bioethanol which will preferentially be converted into ETBE. The company MOL which operates the Slovnaft refinery in Bratislava will convert its facilities to ETBE production as early as second half of 2005. ETBE is a natural and desirable component of petrol, and therefore no other investment is necessary except for changes in the production unit. A limited isobutene capacity is a drawback. Ethanol blending is only possible in terminals, hence investment in a blending facility will be necessary. This stage can realistically be implemented in 2007 – 2008 at the earliest. In the event of a favourable investment environment, the change can be made very quickly. The constraints include the size of land for growing necessary raw amounts, yields per hectare and stable yields. A secure fuel production with the biofuel proportion of 5.75% in an optimistic alternative of

fuel consumption will require the production and blending of both fatty acid esters and ETBE/ethanol. Setting a maximum limit on oxygenous substances blended with petrol is worth considering. The maximum amount of bioethanol and ETBE in 2010 can be 80,000 tonnes, and the remaining 35,000 tonnes must be substituted by an increased ester production (26,000 t/yr) which will entail construction of a new facility and intensification of rapeseed growing. The production of 90,000 tonnes of ethanol will make it necessary to produce 325,000 tonnes of wheet. At the average yield of 3.5 tonnes per hectare, 108,000 hectares of farm land will be needed. Because of the increasing price of natural gas, it is worth considering to support the use of sunflower esters as an energy source, notably in rural areas and in areas with heavy air pollution. In the case of a favourable market environment and well designed support schemes, the biofuel production and consumption program will succeed.

STRATEGY FOR PRODUCTION AND USE OF ALTERNATIVE FUELS
Jozef Mikulec1, Ján Cvengroš2, Eva Romančíková3, Peter Lauko4 Managing director
1Slovnaft VÚRUP, a.s., Vlčie Hrdlo, 824 12 Bratislava, Slovakia Tel.:00421 2 45 248 824, E-mail: [email protected]
2Faculty of Chemical & Food Technolgy, Slovak University of Technology 3Faculty of Economy, Finance Department, University of Economy
4Slovak Ministry of Economy Abstract The use of biocomponents in the former Czechoslovakia has a long tradition. It was mandatory to add biofermentation ethanol into petrol in the 1930s. Rapeseed oil methylesters production and sales were quickly and successfully launched in the 1990s. The current fall in their consumption has been caused by changes in taxation and price support. One of major obstacles to more extensive use of biofuels in the transport sector is their price. Currently it is more difficult to effectively sell biofuels than to produce them. Some specific properties of biofuels require to make changes in logistics, storage, particularly long-term one, as well as to introduce mandatory certification of producers and to make inspections in the petrol station network. Fuel price depends mainly on taxes and crude oil price. The biofuel production sector should be stabilized by defining and implementing a medium-term national strategy. The Slovak Republic has a chance to cut unemployment and to use its surplus farm products and forest wastes for the production of high-quality biocomponents for transport. Slovakia’s Motor Fuel Market Three types of lead-free car petrol with different research octane numbers are being sold in the Slovak market. Their respective market shares are 17:79:4. The marketshare of BA91 petrol declines while the share of BA91 petrol rises in the long run. Petrol with octane number over 99 has a minimum market share. For diesel engines, low-sulphur diesel fuel is available on the market. Some companies offer also diesel fuel with upgraded properties – with better detergent properties, filtration limit temperature and sulphur content. LPG sales are increasing although its potential is limited and car conversion is expensive. CNG use in buses is gathering pace, but the growth rate is limited by the number of supply points and the number of vehicles. A conversion for CNG is expensive as well. The consumption of these fuels increases thanks to lower excise taxes in comparison with petrol and diesel oil. From January 1, 2005, only petrol and diesel fuel with a sulphur content below 10 mg/kg are sold in Slovakia, which allows operations of the latest models of cars fitted with the aftertreatment system that produce only a very small amount of emissions and CO2. All biofuels currently produced in Slovakia are exported abroad. Domestic consumption is virtually nonexistent. For indication purposes, the average values of the best-selling summer-time petrol BA95 in 2003 are given below.

Table 1
Analytical and statistical results Limit values under 98/70/EC, Annex II
Parameter
Unit
Min. Max. Average Standard deviation
Min. Max.
Octane number* (RON)
- 95.0 96.2 95.59 0.236 95.0 -
Octane number** (MON)
- 85.1 87.2 86.32 0.478 85.0 -
sulphur content
mg/kg 0.60 10.60 4.57 2.02 - 150
vapour pressure, RVP
kPa 49.8 60.4 55.59 2.117 - 60
olefin content %(V/V) 0.90 17.90 8.67 3.64 - 18.0 aromatics content
%(V/V) 23.90 41.99 33.24 3.48 - 42.0
benzene content
%(V/V) 0.30 0.72 0.542 0.090 - 1.00
MTBE content
%(V/V) 1.40 4.99 2.61 0.778 15
* octane number determined by research method ** octane number determined by motor method Current and Future Motor Fuel Consumption Table 2 shows energy consumption breakdown by type and sector of use. Liquid fuels account for 103.53 PJ, i.e. 2.3 % of the total consumption. The transport sector‘s consumption is 54.59 PJ in the form of liquid fuels, i.e. 11.37% of the total consumption. Table 2
2000 figures Solid fuels [PJ]
Liquid fuels [PJ]
Gas fuels [PJ]
Heat [PJ] Electricity [PJ]
Total [PJ]
Industry 68.40 23.19 113.23 0.39 36.84 242.04 Transport 0.00 54.59 0.00 0.00 3.47 58.07 Agriculture 0.41 6.65 2.03 0.50 2.22 11.81 Trade, services 9.31 1.85 20.42 12.37 18.96 62.91 Households 2.07 0.45 60.36 16.25 19.51 98.64 Non-energetic consumption
0.00 16.80 20.50 0.00 0.00 37.30
Total 80.18 103.53 216.54 29.52 81.00 510.76 Source: EGU-energetický ústav, a.s. (EGU-Energy Institute, Inc.) The following table summarizes motor fuel consumption since 1999 with an outlook towards 2010. The fuel consumption data will be used as a basis for prognosing biofuel consumption.

Table 3 Year Petrol,
‘000 tonne/year Diesel fuel,
‘000 tonne/year LPG,
‘000 tonne/yearCNG,
‘000 tonne/year Total motor fuels, ‘000 tonne/year
1999 686 794 1 480 2000 611 734 1 345 2001 644 781 25 1 450 2002 659 879 29 1 567 2003 672 923 32 1 628 2004 686 970 35 3 1 693
2005* 699 1 018 39 5 1 761 2006* 713 1 069 42 7 1 831 2007* 728 1 122 46 9 1 905 2010* 772 1 179 50 11 2 012
Historical Consumption of Motor Fuels and Prediction up to 2010
Annual consumption growth rates: gasoline 1%, diesel 5%
1998 2000 2002 2004 2006 2008 2010 2012
Year
-200
0
200
400
600
800
1 000
1 200
1 400
1 600
1 800
2 000
2 200
Con
sum
ptio
n of
Fue
ls,
kt/r
Gasoline, kt/r Diesel, kt/r Total motor fuels, kt/r LPG, kt/r CNG, kt/r

Historical Consumption of Motor Fuesl and Prediction up to 2010 in toe/y
Proposed interannual chnge of growth: gasoline 1%, diesel 5%
1998 2000 2002 2004 2006 2008 2010 2012
Years
400 000
600 000
800 000
1 000 000
1 200 000
1 400 000
1 600 000
1 800 000
2 000 000
2 200 000
Cons
umpt
ion
of m
otor
fuel
s, to
e/r
Gasoline, toe/r Diesel, toe/r Motor fuels, toe/r
New types of vehicles with a lower fuel consumption are being introduced on the market, but at the same time the number of vehicles in operation increases and so does the annual mileage. Unless excise tax rates and their mutual ratios change substantially, petrol consumption will be flat, while the consumption of diesel fuel, LPG and CNG will rise constantly (until 2010). Intensive research of engines running on liquefied petroleum gases (LPG) and compressed natural gas (CNG) was made in the past decade. They produce much less emissions than ordinary engines. LPG has become an attractive fuel owing to its low price. A further rise in LPG consumption as a motor fuel is limited by the extensive use of LPG as a raw material in refineries and as a substitute for natural gas. In addition, LPG is not a very energy-efficient fuel (production, storage, compression before transport in railway waggons or tanker trucks). For comparison: natural gas is easier to transport, contains 25% hydrogen and is therefore a very clean fuel. It has a higher energy density than LPG, and also a higher energy efficiency when used in a proper stechiometric engine. It readily mixes with air thereby ensuring easy cold-engine starts, has no volatile emissions, its sulphur-content is lower than that of petrol, and its hydrocarbon emissions are not toxic and reactive. It is a safe fuel, burning at 650oC. CNG is an exclusive solution for city bus transport. Its drawback is that as much as 1,000 litres of natural gas is needed to supply the same amount of energy as 1 litre of diesel fuel. Even when compressed, a car running on natural gas needs a five times larger fuel tank than a car running on diesel oil. Special Fuel Market During the 8 years between 1995 and 2003, the number of cars rose by 25 % to 1,879,854. The structure of vehicles is in the table below. The number of cars rose particularly fast in towns, notably in Bratislava which accounts for 18 % of all passenger cars registered in Slovakia.

Table 4 Number of
vehicles 1993 1995 1997 1998 1999 2000 2001 2002 2003
passenger 994 933 1 015 794 1 135 914 1 196 109 1 236 396 1 274 244 1 292 843 1 326 891 1 356 185
trucks and vans
101 552 102 634 103 080 111 081 115 981 110 714 120 399 130 334 142 140
special 46 121 45 797 45 376 43 690 41 670 39 188 36 082 34 150 32 033
tractor trucks * . 600 1 721 2 306 3 281 4 994 6 837 8 851
buses 12 655 11 812 11 235 11 293 11 101 10 920 10 649 10 589 10 568
tractors 65 150 64 536 63 145 63 448 63 493 64 351 63 422 62 644 61 690
trailers and semi-trailers
167 174 175 740 182 893 191 241 197 917 201 269 206 627 213 167 218 517
motorcycles 81 263 81 847 81 062 100 891 44 215 45 647 46 676 47 900 48 709
other * * * * * 2 226 1 507 1 306 1 161
Total number of vehicles
1 468 848 1 498 160 1 623 305 1 719 474 1 713 079 1 751 840 1 783 199 1 833 818 1 879 854
*registered as special vehicles in 1993-1999 Source: Slovak Statistical Office In many countries, attempts are made to identify the fuel market for special vehicles. It is desirable that these vehicles use biofuels and alternative fuels for environmental reasons. This market has several common signs: • A large percentage of the national biofuel consumption can be realised in this segment, • The group consists of a limited number of consumers, • The consumer market is rather uniform, • Refuelling points are separated from public petrol stations. Several user groups in Slovakia meet the above conditions: • Bus transport, notably in major cities (the number of buses is 10,600), • Farm and forest tractors (61,690 pieces, soil protection in the event of rupturing the fuel tank,
protection of drinking-water sources and ecosystem), • Trucks and special vehicles operating in places of water protection, • Railway locomotives, • Taxis.

Number of Road Transport Vehicles
1992 1994 1996 1998 2000 2002 2004
Years
0
20 000
40 000
60 000
80 000
100 000
120 000
140 000
160 000
Num
ber o
f Veh
icle
s
trucks & vehicles special vehicles tractors buses motorcycles
Administrative deregistration of disused motorcycles
trucks and vans = -7,7535E6+3936,6537*x special vehicles = 3,1335E6-1547,5087*x tractors = 5,0709E5-221,987*x buses = 3,867E5-187,8918*x The Need of a Long-Term Strategy Biofuel production and use bring a couple of beneficial effects which, when appraised, would increase the cost effectiveness of adopted measures. The most important effects of biofuel production and use include: • environmental • energetic • economic The environmental beneficial effects comprise: • reduction of greenhouse gas emissions, • cleaner air, particularly locally, • land reclamation, • safety, simple use and decomposition when leaked in accidents, • biofuels are appropriate for use in environmentally sensitive or protected areas.

Energetic Benefits • some degree of the country’s energy security, • lower reliance on imported raw materials necessary for energy production. Economic Benefits • wider offer of energetic fuels, • new business activity (employment in agriculture and industry, GDP growth), • effects resulting from a cleaner air. The above benefits from biofuel production can be appraised only on the basis of rather extensive database which often is not available. The appraisal can be made by a combination of several methods dominated by a cost-benefit analysis. The developments in biofuel production and consumption between 1991 and 1999 have proved that the potential of farm products can be quickly utilized in production if suitable business conditions are created. However, the subsequent developments have shown how vulnerable all these productions are as their support and benefit appreciation were only verbal, and no serious benefit calculations were made. A further development requires to prepare and approve a medium-term strategy for this business area which will ensure equal conditions and stability for all parties concerned. As the resources are inadequate, a political support must also be obtained. CNG is currently promoted by a lower tax rate, although it does not come from renewable resources, all of it is imported, and requires a costly car conversion. The tax system should prefer fuels on the basis of a benefit analysis. Government Support to Biofuel Production An analysis of major factors which control the success of biocomponent-use-in-motor-fuels projects has resulted in the following main conclusions: • In all countries where a biocomponent production program was successfully implemented,
agriculture was one of the parties involved. From a political point of view, alternative fuels play a major role in the development of farming and rural areas.
• As the production costs of alternative fuels are much higher than the cost of fuels produced from fossil resources, a support is necessary to eliminate this difference. Where this support is nonexistent or has been cancelled, the production has not started or has been interrupted.
• In many cases, biofuel production was successfully implemented by petroleum companies (distributors, blenders) with appropriate state aid.
• The parties concerned require fixed rules with preferences valid over a rather long period of time. The rules include necessary fuels legislation and an extensive financial support.
Before the government decides to assist in resolving problems associated with biofuel production, it should know the answers to the following questions: • What should be the extent of the state aid? • Can the state aid result in a change in the behaviour of biofuel producers and consumers, will
biocomponent producers be willing to produce fuels with the proposed amount of aid, and will consumers buy them,
• Will the effects of biocomponent use exceed the expenses of the state to support them? • Is the cost of supporting biofuel production and consumption associated with the highest
efficiency rate of spending public money? • What form of state aid is the most suitable?
Theoretically, state aid could be given either to the production sector, i.e. to producers of farm products – farmers or to processors – the industry, or to the consumption area.

Theoretically, support to biofuel processors can be provided as a direct state aid or an indirect state financial aid. A direct state financial aid may have the following forms: subsidies, contribution, grant, refundable financial aid, etc. An indirect state financial aid may have the form of a state guarantee, reduced taxes or penalties or complete waiver of penalties and fines, and tax deferral. The currently used forms include mainly various tax relieves, investment grants and soft loans up to the full amount of investment costs with deferred repayments. A tax relief is a financial category closely connected to public and business finances. It is an indirect financial tool of financial policy which, unlike direct financial incentives, includes no fiscal financial operations in the form of incomes or expenses of public budgets. Because of this fact, tax relieves can be regarded as a form of indirect subsidy stimulating the business sector to take decisions in accordance with the intentions of the tax relieve provider. However, before granting tax relieves in the implementation of its fiscal monetary policy, each government must solve the financial problems listed below: • selection of the tax or taxes which should be cut, • definition of the subject of the tax relief, • determination of the form to provide the tax relief. Decisions relating to the tax selection, i.e. suitability of the tax, are based on the amount of the collected tax and whether the tax is regularly recurrent or one-off. These criteria are met by income-type taxes. But it does not mean that other direct taxes are not suitable for granting tax relieves. Tax relieves can also apply to property taxes as well as indirect taxes such as mineral oil excise tax and value added tax. Tax relieves for biofuel processors in Slovakia may have the following forms: • reduction of tax rate on mineral oils and its differentiation based on regional conditions, • reduction of the base of corporate profit tax, • deduction from the tax base of a certain amount of capital expenses on biogas production up to a certain pre-determined percentage of the tax base1. Despite some differences, all tax incentives always reduce the tax liability of the company concerned. Macroeconomic Evaluation of FAME Use Like petrol and diesel fuel production, the production of biocomponents suitable for these fuels also has some specific features. Therefore the evaluation of the effects is different as well. As for the costs, the increased costs are reflected in the selling price. Tax relieves for biodiesel fuel are currently in place. On the cost side, excise tax collection will therefore fall.
� Borodovčák, M.: Daňové právo s vysvetlivkami (Tax law with explanations), IURA EDITION Bratislava 1993, updated edition 2003

Costs – lost mineral oil excise tax, rate SKK 14,400/ 1000 l
year 2005 2006 2007 2008 2009 2010 Biodiesel consumption, ‘000 t/yr
45 60 80 90 90 90
Lost tax, SKK million
782 977 1 303 1 153 1 153 1 153
Revenues On the revenues side, biodiesel use may be evaluated from three aspects: A. environmental effects, B. economic effects, C. effects in farming and development of rural areas. A. Environmental Effects A. . Reduction of greenhouse gas (GHG) emissions and compliance with the Kyotó protocol
Rapeseed biodiesel ULSD Costs :
€/l 0.56 0.29 €/km 0.039 0.016
Reduction of CO2 emissions (%) 57 - Emissions, g CO2/km 85 198 ∗Cost of emission reduction, €/t CO2
206 -
∗Cost of reduction of CO2 emissions = extra costs (€/km) / CO2 reduction (g/km) * 106 A.2 Reduction of Air, Water and Soil Pollution Biodiesel’s advantages comprise a more suitable emissions profile and greater biological degradability in the event of leaking into the natural environment. Biodiesel is particularly suitable for use in diesel engines in railways where the risk of soil contamination is high. The use of pure biodiesel should be mandatory in diesel engines used on recreational bodies of water and in forest management. A.3 Reduction of Environmental Pollution in Special Areas As biodiesel generates less emissions of particles, it is suitable for use in public transport in big cities and in towns with adverse dispersion conditions and in areas subject to special protection. In such areas, biodiesel is a recommended source of energy for heating and electricity generation. One example is the use of 3,000 tonnes of biodiesel per year for heating in the German Parliament in Berlin. B. Economic Effects B.1. Job Creation Data from Austria and Spain indicate that 1,000 tonnes of biodiesel per year create 26 jobs. The calculation is based on a monthly salary of SKK 12,000.

Year 2005 2006 2007 2008 2009 2010 Biodiesel consumption, ‘000 t/yr
45 60 80 90 90 90
Number of new jobs 1170 1560 2080 2340 2340 2340 Unemployment benefits, SKK million
70 94 125 140 140 140
Income tax, SKK million
32 43 57 64 64 64
Contributions to insurance funds, SKK million
50 67 75 101 101 101
Total benefits from employment, SKK million
152 204 257 305 305 305
B. 2. Diversification of Energy Sources The calculations are based on the price of imported oil SKK 13,000/tonne. Energetical security will increase. Year 2005 2006 2007 2008 2009 2010 Biodiesel consumption, ‘000 t/yr
45 60 80 90 90 90
Value of imported ULSD replaced by biodiesel, SKK million
585 780 1 040 1 170 1 170 1 170
B.3 Better Trade Balance The exploitation of the biofuel production potential from domestic resources may improve the foreign trade balance by reducing crude oil imports. C. Stabilization of Agriculture and Development of Rural Areas C.1 Use of Land Unsuitable for Farming Most raw materials for biodiesel production abroad are not produced on farm land. Rape’s advantage is that it can be grown on foothills and on contaminated soils and soils otherwise unsuitable for food production. In the case of Slovakia, yields must be stabilized and increased as the cost of the raw materials accounts for 80 % of the total biodiesel cost. C.2 Development of Rural Areas Growing of non-food crops for biocomponent production may ensure a sustainable development of rural areas in the long run. C.3 Stabilization of Revenues of Farmers and Farm Enterprises The stabilization of revenues of farm enterprises will ensure their development and a higher competetiveness.
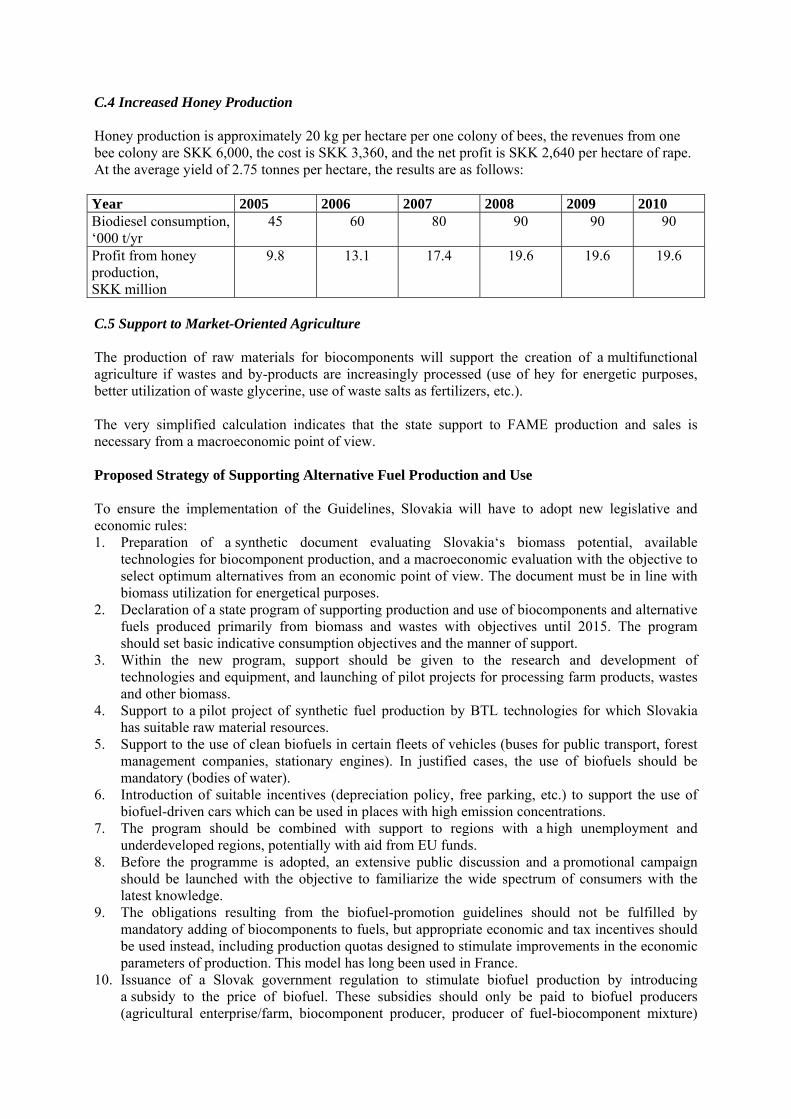
C.4 Increased Honey Production Honey production is approximately 20 kg per hectare per one colony of bees, the revenues from one bee colony are SKK 6,000, the cost is SKK 3,360, and the net profit is SKK 2,640 per hectare of rape. At the average yield of 2.75 tonnes per hectare, the results are as follows: Year 2005 2006 2007 2008 2009 2010 Biodiesel consumption, ‘000 t/yr
45 60 80 90 90 90
Profit from honey production, SKK million
9.8 13.1 17.4 19.6 19.6 19.6
C.5 Support to Market-Oriented Agriculture The production of raw materials for biocomponents will support the creation of a multifunctional agriculture if wastes and by-products are increasingly processed (use of hey for energetic purposes, better utilization of waste glycerine, use of waste salts as fertilizers, etc.). The very simplified calculation indicates that the state support to FAME production and sales is necessary from a macroeconomic point of view. Proposed Strategy of Supporting Alternative Fuel Production and Use To ensure the implementation of the Guidelines, Slovakia will have to adopt new legislative and economic rules: 1. Preparation of a synthetic document evaluating Slovakia‘s biomass potential, available
technologies for biocomponent production, and a macroeconomic evaluation with the objective to select optimum alternatives from an economic point of view. The document must be in line with biomass utilization for energetical purposes.
2. Declaration of a state program of supporting production and use of biocomponents and alternative fuels produced primarily from biomass and wastes with objectives until 2015. The program should set basic indicative consumption objectives and the manner of support.
3. Within the new program, support should be given to the research and development of technologies and equipment, and launching of pilot projects for processing farm products, wastes and other biomass.
4. Support to a pilot project of synthetic fuel production by BTL technologies for which Slovakia has suitable raw material resources.
5. Support to the use of clean biofuels in certain fleets of vehicles (buses for public transport, forest management companies, stationary engines). In justified cases, the use of biofuels should be mandatory (bodies of water).
6. Introduction of suitable incentives (depreciation policy, free parking, etc.) to support the use of biofuel-driven cars which can be used in places with high emission concentrations.
7. The program should be combined with support to regions with a high unemployment and underdeveloped regions, potentially with aid from EU funds.
8. Before the programme is adopted, an extensive public discussion and a promotional campaign should be launched with the objective to familiarize the wide spectrum of consumers with the latest knowledge.
9. The obligations resulting from the biofuel-promotion guidelines should not be fulfilled by mandatory adding of biocomponents to fuels, but appropriate economic and tax incentives should be used instead, including production quotas designed to stimulate improvements in the economic parameters of production. This model has long been used in France.
10. Issuance of a Slovak government regulation to stimulate biofuel production by introducing a subsidy to the price of biofuel. These subsidies should only be paid to biofuel producers (agricultural enterprise/farm, biocomponent producer, producer of fuel-biocomponent mixture)

and the amount of the subsidy should be derived from the price of diesel fuel and petrol, price of oil seeds and grain, price of groats and distillery refuse.
11. Fast preparation of a biocomponent quality standard and its acceptance into the system of Slovak technical standards (STN).
12. Introduction of a mandatory certification of biocomponent producers under ISO 9001 standards. 13. Preparation of an amendment to the Slovak Environment Ministry’s fuel quality regulation. The
STN EN 14 214 standard must be mandatory including an ethanol quality standard. 14. Introduction of regular biofuel-quality inspections in the sales network. 15. The Mineral Oil Excise Tax should be amended if necessary. 16. Amending the Wastes Act and supporting the collection of used cooking oils by the long-term
unemployed. Biocomponent Production and Use Program Proposal Given the current state of biocomponent production, the biofuel guidelines should be implemented in Slovakia in at least two stages. The outlook should be regularly updated as the biofuel issues change very dynamically. In the first stage until 2005, biofuels can only be produced by adding biodiesel to petroleum diesel fuel. The production facilities built in the past are sufficient to produce 65,000 t/yr of oil equivalent, i.e. 3.6 % of the total motor fuel consumption (reference consumption in 2005). More capacities will be necessary from 2008 onwards as the increased consumption of 73,000 t/yr of oil equivalent until 2010 will presumably be satisfied by the intensification of the current production facilities. 250,000 tonnes of rape seed will have to be grown in the target year 2010 alone to produce the required amount of ester. Considering the average yield in the EU countries of 2.75 tonnes per hectare, 90,000 hectares of land will be necessary to meet the goal. 125,000 hectares would be needed if the yields remained on the current level of 2 tonnes per hectare. A natural requirement is to eliminate great variations in the yields. Some improvements can also be made in the collection of used oils and their use as an energy source. From a technical viewpoint, biodiesel and petroleum diesel oil can be blended before shipment in terminals as such a mixture should not be transported by a product pipeline nor should it be stored for a long time. The launching of the first stage of the project is only possible if petroleum diesel and biodiesel blending facilities are built in terminals in companies where this does not contradict the Mineral Oil Excise Tax Act. This investment will be worth € 3 million. In the second stage it will be necessary to prepare investments and to instal facilities for the production of water-free bioethanol which will preferentially be converted into ETBE. The company MOL which operates the Slovnaft refinery in Bratislava will convert its facilities to ETBE production as early as second half of 2005. ETBE is a natural and desirable component of petrol, and therefore no other investment is necessary except for changes in the production unit. A limited isobutene capacity is a drawback. Ethanol blending is only possible in terminals, hence investment in a blending facility will be necessary. This stage can realistically be implemented in 2007 – 2008 at the earliest. In the event of a favourable investment environment, the change can be made very quickly. The constraints include the size of land for growing necessary raw amounts, yields per hectare and stable yields. A secure fuel production with the biofuel proportion of 5.75% in an optimistic alternative of fuel consumption will require the production and blending of both fatty acid esters and ETBE/ethanol. Setting a maximum limit on oxygenous substances blended with petrol is worth considering. The maximum amount of bioethanol and ETBE in 2010 can be 80,000 tonnes, and the remaining 35,000 tonnes must be substituted by an increased ester production (26,000 t/yr) which will entail construction of a new facility and intensification of rapeseed growing. The production of 90,000 tonnes of ethanol will make it necessary to produce 325,000 tonnes of wheet. At the average yield of 3.5 tonnes per hectare, 108,000 hectares of farm land will be needed. Because of the increasing price of natural gas, it is worth considering to support the use of sunflower esters as an energy source, notably in rural areas and in areas with heavy air pollution. In the case of a favourable market environment and well designed support schemes, the biofuel production and consumption program will succeed.

STRATÉGIA PRE VÝROBU A A VYUŽÍVANIE ALTERNATÍVNYCH PALÍV
Jozef Mikulec1, Ján Cvengroš2, Eva Romančíková3, Peter Lauko4
Managing director 1Slovnaft VÚRUP, a.s., Vlčie Hrdlo, 824 12 Bratislava, Slovakia Phone:00421 2 45 248 824, E-mail: [email protected] 2Faculty of Chemical & Food Technolgy, Slovak University of Technology 3Faculty of Economy, Finance Department, University of Economy 4Slovak Ministry of Economy Abstrakt Používanie biozložiek má priestore bývalého Československa dlhú tradíciu. Biofermentačný etanol sa v 30. rokoch povinne pridával do benzínu. V 90. rokoch sa rýchlo a úspešne zaviedla výroba metylesterov repkového oleja a ich predaj. Súčasný útlm spotreby má vzťah k zmeneným podmienkam ich zdaňovania a cenovej podpory Jedna z najväčších prekážok rozšírenia biopalív v sektore dopravy je ich cena. V súčasnosti je väčší problém efektívneho predaja biopalív ako jeho výroby. Niektoré špecifické vlastnosti biozložiek si vyžiadajú zmeny v logistike, pri skladovaní najmä dlhodobom, vyžadujú si zavedenie povinnej certifikácie výrobcov a kontroly výrobkov v sieti čerpacích staníc. Na cenu paliva okrem daní najviac vplýva cena ropy. Stabilizáciu sektora výroby biopalív je potrebné stabilizovať formuláciou a realizáciou strednodobej národnej stratégie. Slovenská republika má šancu znížiť nezamestnanosť a využiť domáce poľnohospodárske prebytky a odpady z lesov na výrobu kvalitných biozložiek pre dopravu. Trh motorových palív v SR Na trhu motorových palív sa v SR používajú tri druhy bezolovnatého autobenzínu, ktoré sa líšia oktánovým číslom stanoveným výskumnou metódou. Percentuálny podiel sa pohybuje v pomere 17:79:4. Z dlhodobého hľadiska klesá podiel spotreby benzínu BA91 v prospech benzínu BA95. Minimálny podiel zaberá podiel benzín s OČ vyšším ako 99. Pre vznetové motory je na trhu nízkosírna motorová nafta, niektoré spoločnosti ponúkajú aj naftu so zlepšenými vlastnosťami – majú zlepšené detergentné vlastnosti, teplotu medznej filtrovateľnosti a obsah síry. Významne sa zvyšuje predaj LPG hoci jeho potenciál je obmedzený a prestavba vozidiel je finančne náročná. Používanie CNG v autobusoch sa začína rozvíjať, tempo rastu je limitované počtom čerpacích miest a počtom vozidiel. Ich prestavba je tiež finančne veľmi náročná. Spotreba palív v tomto segmente rastie vďaka výhodným spotrebným daniam v porovnaní s benzínom a naftou. Od 1.1.2005 sa v SR predáva len benzín a motorová nafta s obsahom síry nižším ako 10mg/kg čo umožňuje prevádzku najnovších vozidiel so systémom aftertreatment, ktoré produkujú veľmi malé množstvo emisií a tiež CO2. V súčasnosti sa biopalivá na území SR vyrábajú výlučne na export. Domáca spotreba je prakticky nulová.

Pre ilustráciu uvádzame vybrané priemerné hodnoty najpredávanejšieho benzínu BA95 pre letné obdobie stav v roku 2003. Tabuľka 1
Analytické a štatistické výsledky
Limitné hodnoty podľa 98/70/EC,
Annex II
Parameter
Jednotka
Min. Max. Priemer smerodajná odchýlka
Min. Max.
Oktánové číslo* (RON)
- 95,0 96,2 95,59 0,236 95,0 -
Oktánové číslo** (MON)
- 85,1 87,2 86,32 0,478 85,0 -
obsah síry mg/kg 0,60 10,60 4,57 2,02 - 150 tlak pár, RVP
kPa 49,8 60,4 55,59 2,117 - 60
obsah olefínov
%(V/V) 0,90 17,90 8,67 3,64 - 18,0
obsah aromátov
%(V/V) 23,90 41,99 33,24 3,48 - 42,0
obsah benzénu
%(V/V) 0,30 0,72 0,542 0,090 - 1,00
obsah MTBE
%(V/V) 1,40 4,99 2,61 0,778 15
* oktánové číslo výskumnou metódou ** oktánové číslo motorovou metódou Súčasná a budúca spotreba motorových palív V tabuľke 2 je rozdelenie spotreby energií podľa typu a sektora použitia. Na kvapalné palivá pripadá podiel spotreby 103,53 PJ čo predstavuje 2,3 % celkovej spotreby. V doprave sa spotrebuje 54,59 PJ vo forme kvapalných palív čo predstavuje 11,37% celkovej spotreby. Tabuľka 2
Údaje rok 2000 Tuhé palivá,
[PJ]
Kvapalné palivá, [PJ]
Plynné palivá,
[PJ]
Teplo, [PJ]
El. energia,
[PJ]
Spolu, [PJ]
Priemysel 68,40 23,19 113,23 0,39 36,84 242,04 Doprava 0,00 54,59 0,00 0,00 3,47 58,07 Poľnohospodárstvo 0,41 6,65 2,03 0,50 2,22 11,81 Obchod, služby 9,31 1,85 20,42 12,37 18,96 62,91 Domácnosti 2,07 0,45 60,36 16,25 19,51 98,64 Neenergetická spotreba
0,00 16,80 20,50 0,00 0,00 37,30
Celkom 80,18 103,53 216,54 29,52 81,00 510,76 Zdroj: EGU-energetický ústav, a.s.

V nasledujúcej tabuľke je sumarizovaná spotreba motorových palív od roku 1999 s výhľadom do roku 2010. Z údajov o spotrebe palív sa budú odvodzovať prognózy spotreby biopalív. Tabuľka 3
Rok Benzín, kt/r
Motorová nafta, kt/r
LPG kt/r
CNG, kt/r
Spolu motorové palivá, kt/r
1999 686 794 1 480 2000 611 734 1 345 2001 644 781 25 1 450 2002 659 879 29 1 567 2003 672 923 32 1 628 2004 686 970 35 3 1 693 2005* 699 1 018 39 5 1 761 2006* 713 1 069 42 7 1 831 2007* 728 1 122 46 9 1 905 2010* 772 1 179 50 11 2 012
*Tempo rastu: benzín 1%, nafta 5% medziročné zvýšenie spotreby
Historická spotreba palív a predikcia do roku 2010
Predpokladané tempo rastu za rok: benzín 1%, nafta 5%
1998 2000 2002 2004 2006 2008 2010 2012
Rok
-200
0
200
400
600
800
1 000
1 200
1 400
1 600
1 800
2 000
2 200
Spot
reba
pal
ív, k
t/r
Benzín, kt/r Motorová nafta, kt/r Spolu motorové palivá, kt/r LPG, kt/r CNG, kt/r
*Tempo rastu: benzín 1%, nafta 3% medziročné zvýšenie spotreby

Historická spotreba palív a projekcia do roku 2010 v toe/r
Rast spotreby benzínu 1% ročne, rast spotreby nafty 5% ročne
1998 2000 2002 2004 2006 2008 2010 2012
Roky
400 000
600 000
800 000
1 000 000
1 200 000
1 400 000
1 600 000
1 800 000
2 000 000
2 200 000
Spot
reba
pal
ív, t
oe/r
Benzín, toe/r Motorová nafta, toe/r Motorové palivá, toe/r
Na trh sa dostávajú nové typy vozidiel s nižšou spotrebou palív, ale zároveň rastie počet vozidiel v prevádzke a ročný priebeh kilometrov. Ak sa podstatne nezmenia sadzby spotrebných daní a ich vzájomné relácie, bude stagnovať spotreba benzínu a trvalo bude rásť spotreba motorovej nafty, LPG a CNG ( do roku 2010). V poslednom desaťročí sa uskutočnil intenzívny výskum motorov plnených skvapalnenými ropnými plynmi (LPG) a stlačeným zemným plynom (CNG). Pri ich prevádzkovaní vzniká podstatne nižšia tvorba emisií ako pri bežných motoroch. Zaujímavým palivom sa stal LPG pre jeho nízku cenu. Výraznejšiemu použitiu LPG ako paliva bráni jeho široké uplatnenie ako surovinového zdroja v rafinériách a ako náhrady za zemný plyn. LPG naviac nie je tiež veľmi energeticky efektívne palivo (výroba, skladovanie, jeho kompresia pred transportom železničnými vagónmi alebo autotankami). Pre porovnanie: zemný plyn sa dopravuje jednoduchšie, obsahuje 25 % vodíka, a je to teda veľmi čisté palivo. Má väčšiu energetickú hustotu ako LPG a pri správnom stechiometrickom motore väčšiu tepelnú účinnosť. Dobre sa zmiešava so vzduchom, čím zabezpečuje dobrú štartovateľnosť za studena, má nulové prchavé emisie, nižší obsah síry ako benzín a emisie uhľovodíkov sú netoxické a nereaktívne. Je to bezpečné palivo, horí pri 650 oC. CNG je exkluzívnym riešením pre mestskú autobusovú dopravu. Jeho mínusom je fakt, že je ho treba až 1 000 l na získanie rovnakej energie ako z 1 l motorovej nafty. Napriek tomu, že sa stláča, auto na tento pohon potrebuje päťnásobne väčšiu palivovú nádrž ako je nádrž na motorovú naftu Špeciálny trh s palivami Počet vozidiel sa v priebehu 8. rokov od roku 1995 do roku 2003 zvýšil o 25% na 1 879 854. Štruktúra vozidlového parku je v pripojenej tabuľke. Percentuálne vyšší rast počtu automobilov je v mestách a špeciálne v Bratislave je 18% z celkového počtu registrovaných osobných áut.

Tabuľka 4 Počty
vozidiel 1993 1995 1997 1998 1999 2000 2001 2002 2003
osobné 994 933 1 015 794 1 135 914 1 196 109 1 236 396 1 274 244 1 292 843 1 326 891 1 356 185nákladné a dodávkové
101 552 102 634 103 080 111 081 115 981 110 714 120 399 130 334 142 140
špeciálne 46 121 45 797 45 376 43 690 41 670 39 188 36 082 34 150 32 033 ťahače * . 600 1 721 2 306 3 281 4 994 6 837 8 851
autobusy 12 655 11 812 11 235 11 293 11 101 10 920 10 649 10 589 10 568 traktory 65 150 64 536 63 145 63 448 63 493 64 351 63 422 62 644 61 690
prívesy a návesy
167 174 175 740 182 893 191 241 197 917 201 269 206 627 213 167 218 517
motocykle 81 263 81 847 81 062 100 891 44 215 45 647 46 676 47 900 48 709
ostatné * * * * * 2 226 1 507 1 306 1 161 Počet
vozidiel spolu
1 468 848 1 498 160 1 623 305 1 719 474 1 713 079 1 751 840 1 783 199 1 833 818 1 879 854
*v rokoch 1993-9 zahrnuté medzi špeciálne vozidlá ZDROJ:ŠÚ SR V mnohých krajinách sa pozornosť sústreďuje na identifikáciu trh s palivami pre osobitnú skupinu vozidiel. V nej je používanie biopalív a alternatívnych palív žiadúce z hľadiska ochrany životného prostredia. Pre tento trh je možné nájsť viac spoločných rysov: • Veľký podiel národnej spotreby biopalív sa dá splniť v tomto segmente, • V skupine je obmedzený počet spotrebiteľov, • Spotrebiteľský trh je pomerne homogénny, • Miesta čerpania palív sú oddelené od bežnej verejnej spotreby. V SR sa dá vyčleniť viac skupín užívateľov, ktoré by spĺňali vyššie uvedené znaky: • Autobusová doprava najmä vo väčších mestách ( počet autobusov je 10 600 ks), • Poľnohospodárske a lesné traktory ( 61 690 ks, ochrana pôdy pri poškodení nádrže,
ochrana zdrojov pitnej vody a ekosystému), • Nákladné a špeciálne autá operujúce v miestach ochrany vôd, • Železničné hnacie lokomotívy, • Taxíky.

Vývoj počtu vozidiel v cestnej doprave
1992 1994 1996 1998 2000 2002 2004
roky
0
20 000
40 000
60 000
80 000
100 000
120 000
140 000
160 000po
čet v
ozid
iel
nákladné a dodávkové špeciálne traktory autobusy motocykle
administratívne vyradenie neprevádzkovaných motocyklov
nákladné a dodávkové = -7,7535E6+3936,6537*x špeciálne = 3,1335E6-1547,5087*x traktory = 5,0709E5-221,987*x autobusy = 3,867E5-187,8918*x Potreba stratégie na dlhšie obdobie Výroba a používanie biopalív je spätá so vznikom viacerých úžitkov - efektov, ktorých ocenením by došlo k zvýšeniu nákladovej efektívnosti prijatých opatrení. Medzi najvýznamnejšie efekty, ktoré plynú z výroby a používania biopalív možno zaradiť: • environmentálne • energetické • ekonomické K environmentálnym úžitkom možno zaradiť: • zníženie emisií plynov spôsobujúcich skleníkový efekt, • zlepšenie kvality ovzdušia najmä na lokálnej úrovni, • revitalizáciu pôdy, • bezpečnosť, jednoduchosť použitia a schopnosť rozkladu pri nehodách, • vhodnosť využitia biopaliva v environmentálne citlivých alebo chránených oblastiach

Energetický efekt • určitý stupeň energetickej bezpečnosti štátu, • zníženie závislosti na dovoze výrobných vstupov potrebných na výrobu energie Ekonomické úžitky • rozšírená ponuka energetických palív, • nová ekonomická aktivita (zamestnanosť v poľnohospodárstve, priemysle, rast HDP), • efekty plynúce zo zlepšenia kvality ovzdušia. Oceniť spomenuté úžitky, ktoré z výroby biopalív plynú, predpokladá disponovať pomerne širokou bázou dát, ktorá často nie je k dispozícii. Samotné ocenenie je možné vykonať kombináciou viacerých metód, pričom analýza nákladov a úžitkov by mala byť dominujúcou. Predchádzajúci vývoj v oblasti výroby a spotreby biopalív v rokoch 1991-1999 ukázal, že ak sa vytvoria vhodné ekonomické podmienky, je možné v krátkej dobe využiť potenciál poľnohospodárskych surovín na výrobu. Nasledujúci vývoj však ukázal zraniteľnosť všetkých výrob, pretože systém podpory a ocenenia úžitkov bol iba v rovine verbálnej a neboli urobené seriózne prepočty úžitkov. Vypracovanie a schválenie strednodobej stratégie v tejto oblasti, ktorá zabezpečí všetkým zainteresovaným rovnaké podmienky a stabilitu je pre ďalší rozvoj nevyhnutná. Pri nedostatku zdrojov je potrebné získať aj potrebnú politickú podporu. V súčasnej dobe je zvýhodnená sa sadzba na CNG, hoci nie je z obnoviteľných zdrojov, je v plnom rozsahu dovážaný a vozidlá sa musia nákladne prestavovať. Je žiadúce v daňovej sústave zvýhodniť palivá podľa analýzy úžitkov. Štátna pomoc pre výrobu biopalív Analýza najvýznamnejších faktorov, ktoré determinujú úspešnosť projektov používania biozložiek v motorových palivách poukazuje najmä na nasledujúce závery: • Vo všetkých krajinách v ktorých sa úspešne implementoval program výroby biozložiek
bolo poľnohospodárstvo jednou zo zúčastnených strán. Politicky zohrávajú alternatívne palivá významnú úlohu v rozvoji poľnohospodárstva a rozvoja vidieka.
• Pretože náklady na výrobu alternatívnych palív sú oveľa vyššie ako palív vyrobených z fosílnych zdrojov podpora, ktorá zahŕňa vyrovnanie týchto rozdielov je nevyhnutná. Tam kde podpora neexistuje alebo bola zrušená výroba nezačala alebo bola prerušená.
• V mnohých prípadoch bola úspešná implementácia výroby biopalív realizované ropnými spoločnosťami (distribútormi, blendermi) pri vhodne nastavenej štátnej pomoci.
• Zúčastnené strany požadujú pevné pravidlá, s výhodou platné dlhšie časové obdobie. Pravidlá obsahujú potrebnú legislatívu v oblasti palív a rozsiahlu finančnú podporu.
Skôr ako sa vláda rozhodne pomôcť pri riešení problémov spojených s výrobou biopalív mala by poznať odpovede nasledovné otázky: • V akej výške by mala byť poskytnutá štátna pomoc, • Či poskytnutím štátnej pomoci je možné dosiahnuť zmenu správania výrobcov
a spotrebiteľov biopalív, či výrobcovia biozložiek pri stanovenej výške podpory budú ochotní palivá vyrábať a spotrebitelia ich kupovať,
• Či efekty z využitia biozložiek prevýšia náklady , ktoré štát vynaloží na ich podporu, • Či náklady spojené s podporou výroby a spotreby biopalív sú spojené s najvyššou
mierou efektívnosti vynakladania verejných financií, • Aká forma štátnej pomoci je najvýhodnejšia.
Teoreticky je možné štátnu podporu poskytnúť buď do oblasti výroby, ktorá sa môže týkať podpory jej pestovateľom plodín, to znamená poľnohospodárom, resp. spracovateľom – priemyslu, alebo do oblasti spotreby.

Teoreticky podporu spracovateľom biopalív je možné poskytnúť formou priamej štátnej pomoci a nepriamej štátnej finančnej pomoci. Priama štátna finančná pomoc môže mať nasledovné formy: dotácie, príspevok, grant, návratná finančná pomoc a podobne.
Nepriama štátna finančná pomoc môže nadobudnúť formu: prevzatia štátnej záruky, poskytnutia úľav na daniach alebo penále alebo odpustenia penále a pokuty, odklad platenia dane. V súčasnosti sa však využívajú hlavne rôzne daňové úľavy, investičné granty a zvýhodnené úvery, a to až do výšky investičných nákladov s odložením splátky. Daňová úľava je finančnou kategóriou, ktorá je úzko spätá s verejnými a podnikateľskými financiami. Je nepriamy finančný nástroj fiškálnej politiky, ktorý na rozdiel od priamych finančných nástrojov sa odlišuje tým, že neprebehne fiškálna peňažná operácia nadobúdajúca formu príjmov a výdavkov verejných rozpočtov. V náväznosti na túto skutočnosť je možné poskytovanie daňovej úľavy vnímať ako formu nepriamej dotácie stimulujúcej podnikateľskú sféru v smere prijímania rozhodnutí v intenciách zámerov jej poskytovateľa. Skôr však, ako tá ktorá vláda pri realizácia fiškálnej peňažnej politiky začne uplatňovať daňové úľavy, musí sa zaoberať riešením nasledovných finančných problémov: • výberu dane, resp. daní, ku ktorým sa môže daňová úľava vzťahovať • vymedzenia predmetu daňovej úľavy • určenia formy, ako sa bude príslušná daňová úľava uplatňovať Rozhodnutia týkajúce sa výberu dane, to znamená jej vhodnosti, ovplyvní rozsah výnosu z výberu dane, ale aj to, či ide o pravidelne sa opakujúcu alebo jednorázovú daň. Tieto predpoklady spĺňajú dane dôchodkového typu. Neznamená to však, že iné priame dane nie sú vhodné pre poskytovanie daňových úľav. Na poskytnutie daňových úľav je vhodné uplatniť aj majetková dane, ale aj nepriame dané, akými sú daň z minerálnych olejov a daň z pridanej hodnoty. Poskytnutie daňových úľav spracovateľom biopalív v SR môže nadobudnúť formu: • zníženia daňovej sadzby dane z minerálnych olejov, ale aj jej diferenciácia vo väzbe k regionálnym podmienkam • zníženia daňového základu dane z príjmov právnických osôb • odpočtu určitého percenta sumy kapitálových výdavkov vynaložených na výrobu bioplynu, najviac však do výšky vopred stanoveného percenta zo základu dane1. Daňové úľavy napriek odlišnostiam v uplatňovaných formách vždy znižujú daňové zaťaženie príslušného podnikateľského subjektu.
1 Borodovčák, M. :Daňové právo s vysvetlivkami, IURA EDITION Bratislava 1993, aktualizované vydanie 2003

Makroekonomické hodnotenie použitia FAME Výroba benzínu a motorovej nafty má svoje špecifiká podobne ako je tomu u výroby biozložiek vhodných na použitie týchto palív. Preto aj hodnotenie účinkov je rozdielne. V prípade nákladov sa zvýšené náklady prejavujú v ponukovej cene. V súčasnej dobe sú pre bionaftu schválené daňové úľavy. Stranu nákladov je potom možné hodnotiť aj znížením výberu spotrebnej dane. Náklady – výpadok v spotrebnej dani z minerálnych olejov , sadzba 14 400 SKK/ 1000 l
rok 2005 2006 2007 2008 2009 2010 Spotreba bionafty, kt/r
45 60 80 90 90 90
Výpadok dane, mil. Sk
782 977 1 303 1 153 1 153 1 153
Výnosy Na strane výnosov možno použitie bionafty hodnotiť v troch základných rovinách: A. účinky na životné prostredie B. ekonomické účinky C. účinky v oblasti poľnohospodárstva a rozvoja vidieka A. Enviromentálne účinky A. . Zníženie emisií skleníkových plynov (GHG) a plnenie protokolu z Kyotó
Bionafta z repky ULSD Náklady :
€/l 0,56 0,29 €/km 0,039 0,016
Redukcia emisií CO2, (%) 57 - Emisie, g CO2/km 85 198 ∗Cena za redukciu emisií €/t CO2
206 -
∗Cena za redukciu emisii CO2 = extra náklady (€/km)/zníženie CO2 (g/km) * 106
A.2 Zníženie enviromentálneho zaťaženia ovzdušia, vody, pôdy Výhodou použitia bionafty je výhodnejší emisný profil, ľahšia biologická odbúrateľnosť v prípade, že sa dostane do prostredia. Veľmi výhodné by bolo použitie bionafty pre pohon dieselagregátov na železnici, kde je potenciálna možnosť kontaminácie pôdy vysoká. V prípade použitia naftových motorov by mala byť zakotvená povinnosť na vodných rekreačných plochách a v lesnom hospodárstve ich prevádzkovať výlučne na čistú bionaftu. A.3 Zníženie enviromentálneho zaťaženia v osobitne určených oblastiach Výhodou použitia bionafty je nižšia emisia častíc, a preto je výhodné jej použitie v dopravných podnikoch veľkých miest a miest s osobitne nepriaznivými rozptylovými podmienkami a v oblastiach so zvláštnou ochranou. V takýchto oblastiach je výhodné použiť bionaftu aj ako energonosič na výrobu tepla a elektriny. Príkladom môže byť použitie 3 000 t bionafty/r v Nemeckom spolkovom sneme v Berlíne na výrobu tepla.

B. Ekonomické účinky B.1. Zvýšenie zamestnanosti, Podľa údajov z Rakúska a Španielska na 1kt/r bionafty sa vytvorí 26 pracovných miest. Výpočet urobený na príjem 12 tis. SKK/mesiac. rok 2005 2006 2007 2008 2009 2010 Spotreba bionafty, kt/r
45 60 80 90 90 90
Počet nových pracovných pozícií
1170 1560 2080 2340 2340 2340
Dávky v nezamestnanosti mil. Sk
70 94 125 140 140 140
Daň z príjmu, mil. Sk
32 43 57 64 64 64
Odvody do fondov, mil. Sk
50 67 75 101 101 101
Spolu účinky zamestnanosti mil. Sk
152 204 257 305 305 305
B. 2. Diverzifikácia zdrojov energie Pre kalkulácie sa vychádzalo s ceny za dovoz nafty za 13 000 SKK/t. Zvyšuje sa energetická bezpečnosť. rok 2005 2006 2007 2008 2009 2010 Spotreba bionafty, kt/r
45 60 80 90 90 90
Hodnota dovozu ULSD nahradenej bionaftou, mil. SKK
585 780 1 040 1 170 1 170 1 170
B.3 Zlepšenie salda obchodnej bilancie Využitie potenciálu výroby biopalív z domácich zdrojov môže prispieť k zlepšeniu salda obchodnej bilancie znížením potreby dovozu ropy. C. Stabilizácia poľnohospodárstva a rozvoj vidieka C.1 Využívanie pôdy vyňatej z obrábania Väčšina surovín na výrobu bionafty v zahraničí sa pestuje na pôde vyňatej z obrábania. Výhodou pestovanie repky je možnosť pestovanie v podhorských oblastiach a aj na pôdach kontaminovaných a nevhodných na pestovanie potravín. V prípade SR je potrebné stabilizovať a zvýšiť výnosy, pretože náklady na suroviny predstavujú 80% nákladov na bionaftu.

C.2 Rozvoj vidieka Produkcia technických plodín na výrobu biozložiek môže zabezpečiť trvalo udržateľný rozvoj vidieka v dlhodobom horizonte. C.3 Stabilizácia príjmov farmárov/poľnohospodárskych podnikov Stabilizácia príjmov poľnohospodárskych podnikov umožní ich rozvoj a vyššiu konkurenčnú schopnosť. C.4 Zvýšenie produkcie medu Produkcia medu je približne 20kg/ha pre jedno včelstvo, náklady na jedno včelstvo sú 6000 SKK, náklady 3360 SKK, čistý zisk je 2640 SKK /ha repky. Pri priemernej úrode 2,75 t/ha sú výsledky nasledovné: rok 2005 2006 2007 2008 2009 2010 Spotreba bionafty, kt/r
45 60 80 90 90 90
Zisk z produkcie medu, mil. SKK
9,8 13,1 17,4 19,6 19,6 19,6
C.5 Podpora trhovo-orientovaného poľnohospodárstva Výroba surovín pre biozložky podporí vznik multifunkčného poľnohospodárstva v prípade, že sa vo väčšej miere budú spracúvať ak odpady a vedľajšie výrobky (použitie slamy na energetické účely, vyššie využitie odpadného glycerínu, odpadných solí na hnojenie , atď.) Veľmi zjednodušený výpočet indikuje, že štátna podpora výroby a predaja FAME je z makroekonomického pohľadu potrebná. Návrh stratégie podpory výroby a využívania alternatívnych palív Pre zabezpečenie naplnenia Smernice je potrebné v SR prijať nové legislatívne a ekonomické pravidlá: 1. Vypracovať syntetický materiál hodnotiaci potenciál biomasy v SR, dostupné technológie
výroby biozložiek a makroekonomické hodnotenie s cieľom vybrať ekonomicky optimálne varianty. Zosúladiť materiál s využitím biomasy pre energetické účely.
2. Vyhlásiť štátny program podpory výroby a využitia biozložiek a alternatívnych palív prednostne vyrábaných z biomasy a odpadov s cieľmi do roku 2015. V programe stanoviť základné indikatívne ciele spotreby a spôsob podpory.
3. V rámci nového programu podporovať výskum a vývoj technológií a zariadení, budovanie pilotných projektov na spracovanie poľnohospodárskych produktov, odpadu a ostatnej biomasy.
4. Podporovať pilotný projekt výroby syntetických palív technológiami BTL pre ktoré má SR vhodné surovinové zázemie.
5. Podporovať použitie čistých biopalív v uzavretých autoparkoch (autobusy verejnej dopravy, lesné závody, stacionárne motory). V odôvodnených prípadoch požívanie biopalív urobiť záväzným ( vodné plochy).
6. Podporovať rozširovanie automobilov, ktoré môžu používať biopalivá v miestach s vysokou emisnou záťažou vhodnými stimulačnými nástrojmi ( odpisová politika, bezplatné parkovanie, atď.).
7. Program spojiť s podporou regiónov s vysokou nezamestnanosťou a zaostávajúcich regiónov s potenciálnou podporou fondov EÚ.

8. Pred prijatím programu usporiadať rozsiahlu verejnú diskusiu a propagačnú kampaň s cieľom priniesť najnovšie poznatky širokému okruhu spotrebiteľov.
9. Na splnenie záväzkov smernice o podpore používania biopalív nezvoliť povinné pridávanie do palív, ale vhodné ekonomické a daňové nástroje s použitím výrobných kvót, ktoré budú stimulovať zlepšenie ekonomických parametrov výroby. Tento model dlhodobo funguje vo Francúzsku.
10. Vydať nariadenie vlády SR, v ktorom sa na podporu programu výroby biopalív stanoví výška podpory na cenu biopaliva, a to iba jeho výrobcovi (poľnohospodársky podnik/farma, výrobca biozložky, výrobca zmesi palivo-biozložka) tak, aby sa podpora odvíjala od ceny motorovej nafty a benzínu, ceny olejnatých semien a obilia, ceny šrotov a výpalkov.
11. Urýchlene vypracovať alebo prevziať do sústavy STN normy kvality na biozložky. 12. Zaviesť povinnú certifikáciu výrobcov biozložiek podľa noriem ISO 9001. 13. Novelizovať vyhlášku MŽP SR o kvalite palív, pričom STN EN 14 214 musí byť záväzná,
vo vyhláške zozáväzniť normu na kvalitu etanolu. 14. Zaviesť pravidelnú kontrolu kvality biopalív určených v predajnej sieti palív. 15. V prípade potreby pripraviť novelu zákona o spotrebnej dani z minerálnych olejov. 16. Pripraviť novelu zákona o odpadoch a stimulovať zber použitých jedlých olejov
prostredníctvom dlhodobo nezamestnaných. Návrh programu realizácie výroby a používania biozložiek Pri súčasnom stave v oblasti výroby biozložiek možno usúdiť, že implementácia smernice o biopalivách v SR musí mať minimálne dve fázy. Prognóza by mala byť pravidelne aktualizovaná, pretože oblasť biopalív je mimoriadne dynamická. V prvej fáze od roku 2005 je možné vyrábať biopalivá len s prídavkom bionafty do ropnej motorovej nafty. Výrobné kapacity vybudované v minulosti sú dostatočné na výrobu 65 ktoe/r čo predstavuje 3,6 % spotreby motorových palív ( referenčná spotreba v roku 2005). Od roku 2008 je potrebná vyššia kapacita, ale je predpoklad, že zvýšenú potrebu do roku 2010 vo výške 73 ktoe/r je možné zabezpečiť intenzifikáciou súčasných výrobných kapacít. Na výrobu esteru v cieľovom roku 2010 je potrebné vypestovať ročne 250 kt semena repky. Pri priemernej úrodnosti štátov EÚ 2,75 t/ha by bolo potrebné 90 000 ha pôdy. Ak by zostali súčasné výnosy na úrovni 2 t/ha potrebná plocha je 125 000 ha. Samozrejmou požiadavkou je, že nesmú byť také veľké výkyvy vo výnosoch. Rezerva je aj v časti prípravy zberu opotrebovaných olejov a ich spracovania na energetické účely. Z technického hľadiska je miešanie bionafty a nafty možné pred expedíciou na termináloch, pretože takáto zmes by sa nemala prepravovať produktovodom ani dlhšie skladovať. Nevyhnutnou podmienkou realizácie zahájenia prvej fázy projektu je vybudovanie blendovania motorovej nafty a bionafty na termináloch v tých podnikoch, ktorým to umožňuje zákon o spotrebnej dani z minerálnych olejov. Výška takejto investície má hodnotu 3 mil. €. V druhej fáze je potrebné investične pripraviť a vybudovať aj kapacity na výrobu bezvodého bioetanolu a ten prednostne konvertovať na ETBE. Spoločnosť MOL, ktorá prevádzkuje rafinériu v Slovnafte Bratislava, konvertuje svoje jednotky na výrobu ETBE už v druhom polroku 2005. ETBE je prirodzenou a želanou zložkou benzínu a okrem zmeny na výrobnej jednotke nie sú potrebné žiadné iné vyvolané investície. Nevýhodou je obmedzená kapacita izobuténu. Miešania etanolu je možné len na termináloch , čo si vyžiada investície do blendovacej jednotky. Táto etapa je reálna najskôr od roku 2007-8. V prípade vhodného investorského prostredia je zmena možná veľmi rýchlo. Limitujúcimi faktormi je veľkosť plochy na pestovanie potrebných surovín, výška hektárových výnosov a stabilita produkcie. Pre bezpečnú výrobu palív s podielom biozložiek pri optimistickom variante spotreby palív a podiele biopalív 5,75 % musia byť vyrábané a miešané aj estery mastných kyselín aj ETBE/etanol. Treba zvážiť aj obmedzenie pridávania maximálne podielu kyslíkatých látok do benzínu.

Maximálne množstvo bioetanolu a ETBE v roku 2010 môže byť 80 kt, zostávajúcich 35 kt musí byť nahradené výrobou väčšieho množstva esterov (26 kt/r) čo už si vyžaduje postavenie novej jednotky a tiež intenzifikáciu produkcie repkového semena. Na výrobu 90kt etanolu je potrebné vypestovať 325 0000 ton pšenice. Pri priemernej úrode 3,5 t/ha je potrebná pestovateľská plocha 108 000 ha. Vzhľadom k zvyšujúcim sa cenám zemného plynu treba uvažovať s podporou používania esterov vyrobených zo slnečnice na výrobu energie, najmä vo vidieckych sídlach a emisne zaťažených územiach. V prípade vhodného trhového prostredia, dobre nastavených podporných schém bude program výroby a spotreby biopalív úspešný. References

POTENTION OF THE BIOMASS UTILIZATION IN THE SLOVAK WOOD PROCESSING SECTOR
Assoc. Prof. Roman Réh, PhD. Secretary General Association of Wood Processing Manufacturers of the Slovak Republic Phone: + 421 45 5206 806 E-mail: + 421 45 5330 278 ABSTRACT Association of Wood Processing Manufacturers of the Slovak Republic is the independent, voluntary and non-political organization of Slovak employers. It unites national enterprises from the wood processing and furniture sector and it consists of number 153 member enterprises from the furniture and wood-processing sector. Softwood Processing Capacity in 2005 in the Slovak Republic is in saw milling raw material 2 600 000 m3, in softwood small diameter logs 1 500 000 m3, in total 4 100 000 m3. Softwood Wood Waste Created (35 % from the total processing volume) in constituting the actual potention of the biomass production in the Slovak Wood Processing Sector - Total 1 435 000 m3 in 2005.

BRATISLAVA February 21-22, 2005
Potention of the Biomass Utilization in the Slovak Wood
Processing Sector

ZSD SR
Independent, voluntary, nonIndependent, voluntary, non--political political organization of organization of Slovak Slovak employersemployersIt It uunitesnites national enterprises from the wood national enterprises from the wood processing and furniture sprocessing and furniture sectorectorEstablished on 15Established on 15thth April 1997 with April 1997 with the the headquarters in the city of headquarters in the city of ZvolenZvolenIt It cconsistsonsists of n. 1of n. 15353 member enterprises from member enterprises from the furniture and wood processing sthe furniture and wood processing sectorector

ZSD SR
ProfessionalProfessional Sections of the Sections of the AssociationAssociation
• Wood Processing Section
• Furniture Section
• Section of the Producers and Importers of the Machines, Tools and Materials for Wood Processing and Furniture Industry
• Section of the Wood ConstructionsProducers
• Section of the Traders with the Slovak Furniture

ZSD SR
Membership Membership CCompaniesompanies of the of the Association of the Wood ProcessingAssociation of the Wood ProcessingManufacturers of the Slovak RepublicManufacturers of the Slovak Republic
19 27 34 47 57
91
123147 153
020406080
100120140160
IV.1997
XII.1997
XII.1998
XII.1999
XII.2000
XII.2001
XII.2003
XII.2004
II.2005

ZSD SR
The Association is integrated into:The Association is integrated into: CEI-Bois (European Confederation of the
Woodworking Industries)- 20 Members, not every Association from CEE
countries is integrated into CEI-Bois
UEA (European Federation of Furniture Producers)Intensive dialog Project Business Support Programme II from April 2003 to April 2005
EUMABOIS (European Federation of Woodworking Machinery Manufacturers)

ZSD SR
AtAt the national level it is the national level it is a a proper proper member of:member of:
Association of Industrial Federations of Association of Industrial Federations of the Slovak Republic the Slovak Republic (ZPZ SR)(ZPZ SR)
Centre for Development of Wood Centre for Development of Wood Processing, Furniture and PulpProcessing, Furniture and Pulp--Paper IndustriesPaper Industries
Republic Federation of Employers Republic Federation of Employers (R(RÚÚZ)Z)

ZSD SR
1995 1997 1999 2001 2003
Sawnwood total 646 767 1244 1263 1255softwood 427 501 841 845 845hardwood 219 266 403 418 410
Wood based panels
341 339 321 378 388
Veneer sheets 17 22 13 19 20Plywood 27 32 33 43 41Particleboard 243 221 220 246 260Fibreboard 56 58 65 70 67
ProductionProduction (in (in thousandsthousands m3)m3)

ZSD SR
After the collapse of the communism, the wood industry After the collapse of the communism, the wood industry suffered from a decline in outputsuffered from a decline in outputSince 1993, the sector stagnatedSince 1993, the sector stagnatedSaw millingSaw milling of wood is the largest subof wood is the largest sub--branch, accounting branch, accounting for 42for 42 % of the sector% of the sector´́s production, followed bys production, followed by woodwood--based panels based panels and and builders, carpentrybuilders, carpentry and and joineryjoineryAround 1 000 companies operating in sectorAround 1 000 companies operating in sectorPrivatisation has been completedPrivatisation has been completedForeign ownership reaches approximately 30Foreign ownership reaches approximately 30 % of the % of the forestforest--based industriesbased industries
Economic InformationEconomic Information on on Woodworking IndustryWoodworking Industry

ZSD SR
StrengthsStrengths are based on production of profiled are based on production of profiled plywood, particleboardplywood, particleboard andand fibfiberberboardoardWeaknessesWeaknesses are mainly in the are mainly in the outdated outdated technologytechnologyA lot A lot of of small producers do not reach the small producers do not reach the efficiency and quality of productionefficiency and quality of productionThe The insufficient level of financial meansinsufficient level of financial means needed needed for investment is a further drawbackfor investment is a further drawback
Economic InformationEconomic Information on on Woodworking IndustryWoodworking Industry
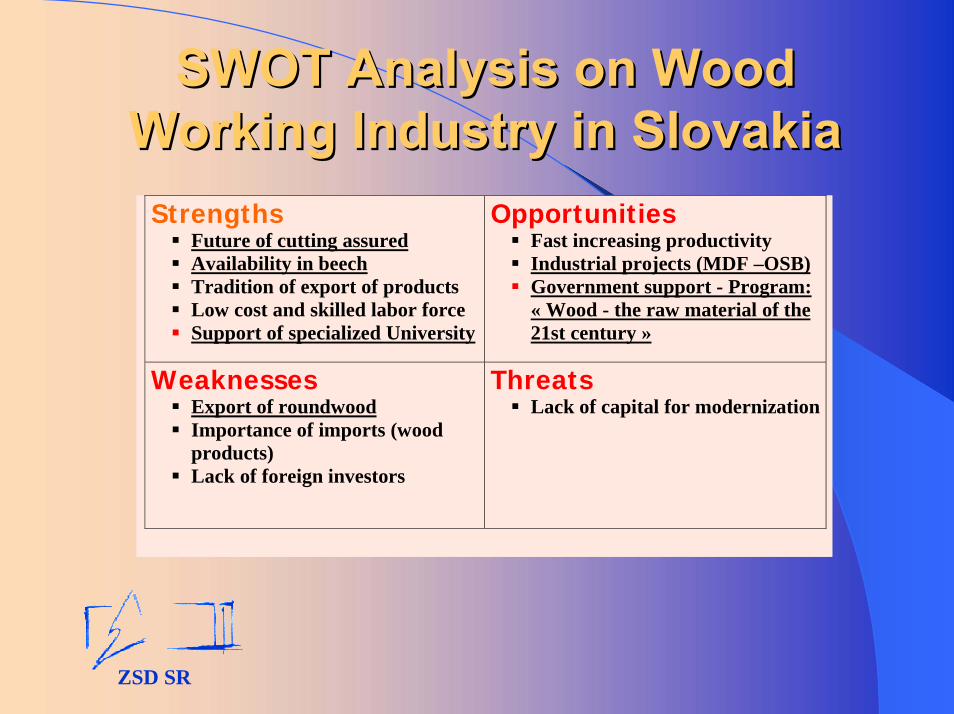
ZSD SR
SWOT Analysis on Wood SWOT Analysis on Wood Working Industry in SlovakiaWorking Industry in Slovakia
Strengths Future of cutting assured Availability in beech Tradition of export of products Low cost and skilled labor force Support of specialized University
Opportunities Fast increasing productivity Industrial projects (MDF –OSB) Government support - Program:
« Wood - the raw material of the 21st century »
Weaknesses Export of roundwood Importance of imports (wood
products) Lack of foreign investors
Threats Lack of capital for modernization

ZSD SR
Production ofProduction of FurnitureFurniturein in countriescountries 15 EU 15 EU
( mld. ( mld. EurEur))..2
0,2
19
,8
8,6
8,5
8,0
2,6
2,6
2,2
2,2
2,0
1,3
1,2
0,8
0,5
-4,1
-2,4
-6,1
1,3
-1,0
-7,5
1,5
-1,1 -0,5 0,0 1,
0 1,2
3,0
2,5
0
5
10
15
20
25
I D F ES UK NL DK B+L A S P SF GR IRL-10
-5
0
5
'03 '03/02

ZSD SR
Production of Furniture Production of Furniture in new and in new and futurefuture EU EU countries countries
((v v milmil. . EUR)EUR)3300
1510
895755 695
430 398 290 275139
12,0
2,17,3
1,1
41,0
22,0
-25,0
15,012,0 11,3
0
500
1000
1500
2000
2500
3000
3500
PL CZ ROM SLV SK BG HU LT EST LV-30-25-20-15-10-5051015202530354045
'03 '03/02

ZSD SR
Future ProspectsFuture ProspectsSaw milling industrySaw milling industry and and panel industrypanel industry in in short termshort term as well asas well as in long termin long term may derive may derive benefits of benefits of the presentthe present tendenctendenciesiesThe The exexport of port of sawnwoodsawnwood and woodand wood--based based panels will probably increasepanels will probably increaseDomestic producers of woodDomestic producers of wood--based panelbased panels s and flooringand flooringss wiwilll have an access to a better l have an access to a better market market Important part of the biological potential of Important part of the biological potential of fellingsfellings could be used in thecould be used in the energy marketenergy market

ZSD SR
AActivitctivitiesies of the Associationof the Association
Campaign for the promotion Campaign for the promotion of the wooden products of the wooden products
consumption: consumption:
„„PProductsroducts from from the the Slovak Slovak woodwood have the good qualityhave the good quality““
The The campaign started in March 2004campaign started in March 2004
it is directed it is directed toto the general publicthe general public

ZSD SR
General campaign forthe promotion of the utilization of the products made of woodEtiquettes with the campaign logo are sold to the companies
The campaign runs in journals, radio, etc.
Campaign Campaign „„ Very good qualityVery good quality ofof thethe pproductsroducts
from from the the Slovak woodSlovak wood““

ZSD SR
Needs Analysis of the Slovak Wood Processing Manufactutrers for Wood Raw Material from State Forests for 2005 According to the Wood Species
260000
144300
693200
6200
26000049300
97020
10005210
51510
3700
0
200000
400000
600000
800000
1000000
1200000
Raw Material Volumein m3
SPRUCE BEECH OTHER
Small diameter logs III. C III. AB II.

ZSD SR
TATRA TIMBER
PILVUD
PRP
AMICO DREVO
P.F.A:
PÍLA ČER. SK.
SPEKTRUM0
50 000
100 000
150 000
200 000
250 000
300 000
Raw Material Volume in m3
Small diameter logs III. C III. AB
Needs Analysis of the Slovak Wood Processing Manufactutrers for Wood Raw Material from State
Forests for 2005 According to the Wood Processing Manufacturers - spruce

ZSD SR
BADGER
SLOVLEPEX
ROVEN
HOLDES
PÍLA- PALI
EKOLAN
PÍLA ĽUBIETOVÁ
SMREČINA0
10000
20000
30000
40000
50000
60000
70000
80000
Raw Material Volume in m3
Small diameter logs III. C III. AB II.
Needs Analysis of the Slovak Wood Processing Manufactutrers for Wood Raw Material from State
Forests for 2005 According to the Wood Processing Manufacturers - spruce

ZSD SR
BUKÓZA
BUČINA
BEKY
A.N.B.
.
.
KLI
QUERCUS, LC
QUERCUS, KA
TRENEX
0
50000
100000
150000
200000
250000
300000
Raw MaterialVolumein m3
Small diameter logs III. C III. AB II.
Needs Analysis of the Slovak Wood Processing Manufactutrers for Wood Raw Material from State
Forests for 2005 According to the Wood Processing Manufacturers - beech

ZSD SR
KOŠICE
LIP. HRÁDOK
ČADCA
VRANOV n./TOP.
Č. BALOG
NÁMESTOVO
KRIVÁŇ
020000400006000080000
100000120000140000160000180000
Raw Material Volume in m3
other beech spruce
Needs Analysis of the Slovak Wood Processing Manufactutrers for Wood Raw Material from State
Forests for 2005 According Forest Enterprises

ZSD SR
ŽILINA
R. SOBOTA
ŽARNOVICA
PRIEVIDZA
TRENČÍN
TOPOĽČIANKY0
5000
10000
15000
20000
25000
30000
35000
Raw Material Volume in m3
other beech spruce
Needs Analysis of the Slovak Wood Processing Manufactutrers for Wood Raw Material from State
Forests for 2005 According Forest Enterprises

ZSD SR
BEŇUŠ
PREŠOV
SLOVENSKÁ ĽUPČA
ROŽŇAVA
BARDEJOV
POVAŽSÁ BYSTRICA
SOBRANCE
0
10000
20000
30000
40000
50000
60000
Raw Material Volume in m3
other beech spruce
Needs Analysis of the Slovak Wood Processing Manufactutrers for Wood Raw Material from State
Forests for 2005 According Forest Enterprises

ZSD SR
Current Processing Capacities in the Slovak Republic
▪▪ Immediate and existing processing of the softwood saw milling raw material – 2 600 000 m3 in 2005,
▪ Immediate and existing processing of the softwood small diameter logs – 1 500 000 m3 in 2005,
▪ Possible storage of softwood raw material or softwood small diameter logs in 2005 – 400 000 m3.

ZSD SR
Average yield of the ordinary saw milling unit – 65 %
It is created 35 % of the wood waste in the shape of cut-offs (20 %) and sawdust (15 %)
Wood waste is suitable for the:
▪ Production of wood composites
• Pulp and paper production
• Energetic utilization

ZSD SR
Softwood Processing Capacity 2005 in the Slovak Republic:
– saw milling raw material 2 600 000 m3
– softwood small diameter logs 1 500 000 m3
– total 4 100 000 m3
Softwood Wood Waste Created (35 %) =
Actual potention of the Biomass Production in the Slovak Wood Processing Sector
- 1 435 000 m3
ZSD SR
AddressAddressSecretariat
Association of the Wood Processing Manufacturers of the Slovak Republic
T. G. Masaryka 24
SK-960 53 Zvolen
Ph.: +421 45 5206 806
Fax: +421 45 5330 278
http://www.zsdsr.sk

ZSD SR
Thank you

PRODUCTION OF WOOD PELLETS R&D and Standardisation
Michael Golser Holzforschung Austria, A- 1030 Vienna, Franz Grill Straße 7 Department “Roundwood, Sawn timber and Bioenergy” Phone: ++ 43 1 798 26 23 0 Email: [email protected] Abstract Due to the rapidly increasing market of wood pellets new standards and certification systems especially for high quality pellets have been developed in Austria and Germany. An overview about the most important standards and about the market situation are given. Apart from national standardization activities on European level 28 standards for solid biofuels are being elaborated. At Holzforschung Austria a four year research project on woodpellets deals with specifically influencing parts of the pellet production process: preconditioning of raw material (storage conditions, drying, softening of lignin), alternative pressing aids, cooling of pellets and post-treatment with coating substances in order to increase pellet quality. The main objective is to improve abrasion resistance and hygroscopicity of the pellets. The tests have been mainly carried out with a ring-die laboratory pellet press. Introduction The agreements reached in 1997 in the Kyoto Protocol on the drastic reduction of greenhouse gases until 2008-2012, as well as the objectives stipulated in the White Book of the European Union "Energy for the future: Renewable Energy Resources for Energy" increasingly force European countries to substitute fossil energy sources for renewable ones. This process is being enhanced by a number of national and European support programmes for research (e.g. “BioNorm” – a research project with 33 european partners funded by the European Commission - Vth Framework Programm) and investments (e.g. investment subsidies in Austria for new pellet furnaces and for the changeover to pellet furnaces), as well as by unification of technical standards (CEN/TC 335 “Solid Biofuels”; in 2000 the European Commission gave a mandate to the European Standardisation Institute CEN to develop new standards for solid biofuels). Status of pellet production in Sweden, Austria and Germany Starting in Scandinavia, an interesting alternative is now being established in several other European countries – the production of woodpellets. Already in the 80ies, the first industrial wood pellet production plants for processing sawdust and shavings were built in Sweden. In 1995, the estimated production capacity was 180.000 tons/year (Hahn et al. 2000). Six years later 22 swedish pellet factories - with a maximum capacity of 1.000.000 tons/year - produced 715.000 tons of wood pellets per year (Stahl et al. 2002). Thus, Sweden is one of the world's most important producer of woodpellets besides Canada and the USA. So far in Sweden, woodpellets are mainly used in medium-sized boilers with capacities between 0.5 - 4 MW and in a large-scale central CHP (combined heat and power) plant near Stockholm (Hahn et al. 2000). But within the last years also the private house market

expanded. In 2002 in Sweden around 25.000 small houses are heated by pellets and the expectations for this market are very high – up to 30.000 new installations per year (Löfgren 2002). Austria's first production plant for woodpellets is in operation since the mid-nineties. In the meantime, 13 woodpellet producers account for a production capacity of almost 373.000 in 2004. The expectations for the production capacity in 2005 are over a half million tons of wood pellets and for 2006 about 640.000t/a. The amount produced per plant ranges between 5.000 and 100.000 tons/year (www.timber-online.net). In Germany the production capacity in 2004 was around 136.000t/a. The expectations for 2005 are nearly 200.000t/a (www.timber-online.net). In contrast to Sweden, woodpellets in Austria and Germany are mainly used for stoves and boilers for central heating systems in single family houses. The development of the Austrian pellet market was influenced by the fact that during recent years, a strongly increasing number of pellet heating systems were taken into operation.
Production of Woodpellets – Overview of Procedure The pelletising process comprises the following steps: Drying of wet raw material: Raw material with a water content exceeding 12 – 15 % may hardly be pelletized and therefore has to be dried. The most common dryers, e.g. tube bundel dryer, belt dryer or superheated steam dryer, may be used for this purpose. Grinding: Large shavings have to be grinded in order to ensure a long lifespan of the roller and die. Grinding is usually done by means of a hammer mill. Conditioning: A well-adjusted addition of water or steam ensures constant quality in spite of variations in raw material characteristics. Moreover, the advantage of hot steam is the pre-softening of the wood-owned binder lignin before the pellets are being pressed. For homogenization purposes, the material is stored in a buffer container for a certain period of time after water or steam have been added, and is being mixed by means of a stirrer. Pelletisation: For pressing, two main procedures are known – ring die pelletisers (vertical mounted die rotates) and flat die pelletisers (stationary flat mounted die, rollers rotate) (Payne et al. 1991). In both technologies roller pressure squeeze the material through a die. Afterwards knives cut the compressed material to pellets. Especially in Austria biological additives like starch, maize or rey flour (see definition in ÖNORM M 7135) are used in the pelletising process to get a better pellet quality (= higher durability) and to reduce the costs of pelletizing. Cooling/Drying: After pressing, the woodpellets are quite hot (80-95°C), wet and not extremely solid due to the soft lignin. By cooling the pellets, e.g. by means of counterflow- or horizontal belt coolers, the moisture content is reduced, they cool down, the lignin hardens and the pellets obtain their final strength. In a final step the pellets are sieved, the seperated fines returned to the process and the pellets – now free from dust - are stored in silos or packed in bags or big bags.
HFA-Research Activities to optimize the Production Process In 2001 Holzforschung Austria was nominated "Competence Centre for Wood Technology" (www.holzforschung.at) by the Austrian Ministry of Economic Affairs. The grants connected with this status have among others helped to start a research project on woodpellets which will deals with specifically influencing parts of the previously mentioned pellet production process:
• Preconditioning of raw material (storage conditions, drying, softening of lignin), • Alternative pressing aids, • Cooling of pellets and

• Post-treatment with coating substances
in order to increase pellet quality. The main objective is to improve abrasion resistance and hygroscopicity of the pellets. Latest results of R&D activities will be presented at the conference (see also Herzog & Golser 2004, Golser & Hahn 2004, Temmermann et al 2004).
Standardisation and Certification of Wood pellets In order to comply with the positive image of woodpellets, it is necessary to ensure a high pellet quality. The criteria required to determine the respective quality are usually stipulated in standards or guidelines. In Europe, however, standardization of woodpellets has rather been an exception than a rule. Only Germany, Norway, Sweden, Switzerland and Austria have established standards for woodpellets. For the development of the pellet market in Austria the existence of a practical pellet standard has been highly important (Golser 2001). The Austrian standard ÖNORM M 7135 (2000) not only describes the technical criteria (Table 1) which have to be complied with, but also stipulates a mandatory quality control of the production site by an accredited test institute, which shall be carried out once a year without prior notice. Due to the mandatory external monitoring, companies are now entitled to mark their products with the label of the Austrian Institute for Standardization "ÖNORM M 7135 certified". During recent years, the standard ÖNORM M 7135 (2000) has become an immensely important marketing instrument for pellet producers. Far more than 90% of the Austrian pellet production comply with the requirements regulated in ÖNORM M 7135 and are monitored and labeld accordingly. The monitoring activities are carried out by the Holzforschung Austria. Since this standard has also gained importance outside Austria, our institute supervises production sites in neighbouring countries, such as Slovakia, Czech Republic, Italy and Germany, too. Table 1: Standardised requirements for woodpellets in Austria, Germany and
Sweden
ÖNORM M 7135 DINplus Woodpellets SS 18 71 20
(HP1) (HP5) Group 1 Group 2 Group 3
Dimension D: 4 – 10 mm L: ≤ 5 x D D: 4 – 10 mm
L: ≤ 5 x D
∅ : ≤ 25 mmL: max. 4 x
∅
∅ : ≤ 25 mm
L: max. 5 x ∅
∅ : ≤ 25 mm
L: max. 6 x ∅
Gross density ≥ 1,12 kg/dm3 ≥ 1,12 kg/dm3
Water content ≤ 10 % ≤ 10 % ≤ 10 % ≤ 10 % ≤ 12 %
Bulk density ≥ 600 kg/m3 ≥ 500 kg/m3 ≥ 500 kg/m3
Abraison 2,3 % 2,3 % Ash content* ≤ 0,5 % ≤ 0,5 % ≤ 0,7 % ≤ 1,5 % ≤ 1,5 % Net calorific value* ≥ 18 MJ/kg * ≥ 18 MJ/kg * ≥ 16,9
MJ/kg **≥ 16,9 MJ/kg**
≥ 15,1 MJ/kg**

Sulfur* ≤ 0,04 % ≤ 0,04 % ≤ 0,08 % ≤ 0,08 % to be stated
Nitrogen* ≤ 0,3 % ≤ 0,3 %
Chlorine* ≤ 0,02% ≤ 0,02% ≤ 0,03% ≤ 0,03% to be stated
Arsenic* ≤ 0,8 mg/kg Cadmium* ≤ 0,5 mg/kg Chromium* ≤ 8 mg/kg Copper* ≤ 5 mg/kg Mercury* ≤ 0,05 mg/kg Lead* ≤ 10 mg/kg Zinc* ≤ 100 mg/kg EOX* ≤ 3 mg/kg Pressing Aids ≤ 2 % ≤ 2 % to be stated
* dry basis ** as received
The German standard DIN 51731 for woodpellets and woodbriquettes issued in 1996 lacks some parameter essential for the description of pellet quality, such as abrasion, pressing aids or the control of the production site by an test institute once a year without prior notice. For this reason, the certification unit of the German Institute for Standardization, DinCertco, has issued a separate certification programme "DINplus – Woodpellets for Use in Small Heating Systems" (2002),, combining the contents of DIN 51735 with those of ÖNORM M 7135 on the highest level. Thus, an efficient quality label for woodpellets is now available for the growing German market. Apart from national standardization activities, unified standards for solid biofuels are being elaborated on a European level for more than four years now. In CEN/TC 335 "Solid Biofuels" 28 European standards for solid biofuels will be established on aspects such as terminology, fuel classification, quality assurance, sampling and sampling reduction, as well as physical-mechanical and chemical test procedures. These standards will be valid throughout Europe. Several of these first European standards for biofuels are already published.
Conclusion Woodpellets are a biofuel with extremely positive prospects for the future. Summarizing the advantages - such as neutral with regard to carbon dioxide, clean, good smell, abundant raw material in Central and Northern Europe, short transport distances to final customer, no transport- or storage risk compared to oil, standardized quality, high convenience of heating systems etc. – the prospects seem to be more than justified. Market development in Sweden, Austria and now also Germany demonstrates the economic perspectives and proves the competitive strength of woodpellets compared to fossil fuels. Present activities on national and international levels in standardization and research show that this ecological and economic potential has been discovered and is being further promoted. To use the possibilities now at hand will be one of the important tasks of the future.

References: DIN 51731 (1996): Testing of solid biofuels - Compressed untreated wood - Requirements and testing. Deutsches Institut für Normung (Ed.), Berlin/Germany. DINplus Zertifizierungsprogramm (2002): Holzpellets zur Verwendung in Kleinfeuerungsstätten. DinCertco (Ed.), Berlin/Germany. Golser, M., Hahn, B. (2004): Optimierung der Pelletsqualität. Nachwachsende Rohstoffe, Nr. 33, 12. Golser, M. (2001): Österreich mit Zuwächsen bei Holzpellets-Heizungen – Hohe Qualitätsanforderungen und angepasste Normung sind Grundlage des anhaltenden Markterfolges. Holz-Zentralblatt 147: 1870. Hahn, B., Malisius, U., Jauschnegg, H., Nilsson, B., Rapp, S., Strehler, A., Huber, R., Kessler, D. & Whitfield, J.(2000): Holzpellets in Europa – Status, Technologien, Aktivitäten, Märkte. Bundesministerium für Verkehr, Innovation und Technologie (Ed.). Berichte aus der Umweltforschung 9/2000, 93 pp. Herzog, P., Golser, M. (2004): Forschung zur Verbesserung der Pelletsqualität. Proceedings. European Pellet Conference 2004. 3.-4.03.2004 Wels. 297-315. Löfgren, B. E. (2002): Pellet burner for small houses: An overview. In: Proceedings of the First World Conference on Pellets, 2.- 4. September 2002, Stockholm/ Sweden: 45 – 48. ÖNORM M 7135 (2000): Compressed wood and compressed bark in natural state – Pellets and briquettes - Requirements and test specifications. Österreichisches Normungsinstitut (Ed.), Vienna/Austria. ÖNORM M 7136 (2002): Compressed wood in natural state – Woodpellets – Qualtiy assurance in the field of logistic of transport and storage. Österreichisches Normungsinstitut (Ed.), Vienna/Austria. Payne, J., Rattink, W., Smith, T. & Winowiski, T. (1991): The pelleting handbook. Borregaard Lignotech (Ed.). 67 pp. Stahl, M., Granström, K., Berghel, J. & Renström, R. (2002): Properties of wood pellets. In: Proceedings of the First World Conference on Pellets, 2.-4. September 2002, Stockholm/ Sweden: 87 – 92. SS 18 71 20 (1998): Biofuels and Peat – Fuel pellets – Classification. Swedish Standards Institution (Ed.), Stockholm/Sweden. Temmerman, M., Rabier, F., Daugberg Jensen, P., Hartmann, H., Böhm, T., Golser, M., Tuomi, S. (2004): Comparision between to methods for wood pellets durability testing. Proceedings. European Pellet Conference 2004. 3.-4.03.2004 Wels. 340.

TECHNOLOGY OF STRAW BURNING TECHNOLOGIA SPAĽOVANIA SLAMY
Dr. inž. Wieslaw Denisiuk „EKOLOG“ Zakład Energetyki Cieplnej i Usług Bytowych w Zielonkach 82-410 Stary Targ, Vojvodstvo pomorskie, POLSKA tel./fax +48 55 2771374 e-mail: [email protected] Polskie Towarzystwo Biomasy „POLBIOM“, 02-532 Warszawa, ul. Rakowiecka 32, p. 320, POLSKA www.polbiom.pl, Tel. +48 22 849-09-74
ABSTRACT
The paper deals with the example of application of straw as fuel for a power plant with capacity of 1 MW, which is reconstructed from an old coal power plant. The article shows the advantages of straw as a source of energy, analyses the physical and chemical characteristics and temperature parameters, typical for straw. Moreover it indicates the specific circumstances of the straw burning processes. The paper focuses also on preparation and storing of straw for public use and in the energy sector. Comparing with fossil fuel, straw is a low-caloric natural source, whose energy value reached to 14-19 MJ/kg. This value depends partly on the kind of straw and its water or moisture content (MC). To the basic characteristics of energy aspects belong:
- energy or heating value (HV) MJ/kg (in LPG it is MJ/ m3 ) - burning temperature - melting point - temperature of ash - weight kg/m3 - density - Energy density MWh /m3 - Energy potential GJ/t - Size-homogeneousity of straw - Water or Moisture Content (MC) -
The above mentioned characteristics have an influence on technical parameters of straw-burning boiler. These parameters define conditions process of straw preparation.
1

ABSTRAKT V článku je predstavený príklad využitia slamy ako biopaliva v podmienkach energetického zdroja s tepelným výkonom 1MW, ktorý bol získaný rekonštrukciou pôvodného tepelného zdroja na báze zemného plynu. Príspevok poukazuje na možnosti zhodnotenia slamy ako paliva, analyzuje jej fyzikálno-chemické vlastnosti a tepelné parametre charakteristické pre túto fytomasu, ďalej upozorňuje na zvláštnosti v technike spaľovania slamy. Rovnako je venovaná pozornosť skladovaniu a príprave slamy pre jej využitie v sektore komunálnej a priemyselnej energetiky. Pri porovnaní so zemným plynom slama je nízko-kalorickou energetickou surovinou a jej výhrevnosť kolíše v rozsahu 14 - 19 MJ.kg-1. Táto veličina je ovplyvňovaná čiastočne druhom obilniny, ale hlavne obsahom vody – relatívnou vlhkosťou. Medzi základné charakteristické vlastnosti potenciálnej energetickej suroviny patrí [2]:
- výhrevnosť MJ.kg-1 (u plynu je to v MJ.m-3 ), - teplota horenia °C, - teplota tavenia popola oC, - sypná hustota kg.m-3, - hustota t.m-3, - objemová hmotnosť t.m-3, - energetická hustota MWh.m-3, - energetický potenciál GJ.ha–1, - rozmerová homogénnosť slamy, - obsah vody - relatívna vlhkosť.
Uvedené vlastnosti ovplyvňujú konštrukčné parametre energetického zdroja prevádzkovaného na báze slamy, a tým sú dané aj požiadavky na spracovanie prírodnej slamy ako základnej suroviny pre výrobu rôznych druhov biopalív a ich uplatnenie v sektore energetiky.
1. ÚVOD
Je všeobecne známe, že spotreba energie vo svete stále rastie a jej charakter nadobudol neudržateľný trend v poslednom storočí, najmä po II. svetovej vojne. Pritom je taktiež známe, že priemyselne rozvinutá časť sveta, ktorá dosahuje necelých 25% svetovej populácie, spotrebuje takmer 80% ročnej spotreby energie vo svete [1]. Výroba tepla a elektrickej energie sa dnes realizuje vo väčšine prípadov v teplárňach a výhrevniach spaľovaním fosílnych palív. Veľká väčšina z týchto prevádzok má zastaranú technológiu, a tým aj nežiaduci - negatívny vplyv na životné prostredie. Znečisťujúce i nežiaduce látky, medzi nimi najmä CO2, sú produktom procesu spaľovania fosílnych palív a sú známe svojou podporou skleníkového efektu. Pre striktnú ochranu životného prostredia, zníženie závislosti na importe energie a palív, či zaistenie energetickej bezpečnosti EÚ, komisia EÚ schválila tri základné dokumenty [5]:
1. „Biela kniha - White Paper“ je základný dokument Komisie EÚ prijatý v novembri 1997, ktorý stanovil základné ciele pre rozvoj vo využívaní zdrojov obnoviteľných foriem energie (ZOFE). Cieľom Komisie EÚ je zdvojnásobiť
2

podiel ZOFE (6%) z ročnej spotreby energie v roku 1997 na 12% v roku 2010, pritom využitie biomasy by sa malo strojnásobiť (zo 45 Mtoe na 135 Mtoe).
2. Protokol z Kyoto (XII 1997) sa zaoberá ochranou ovzdušia, a to cestou zníženia produkcie skleníkových plynov. Prijatý limit na obmedzenie emisií CO2 je pre SR 8% pod objem generovaný v roku 1990 do obdobia rokov 2008 až 2012.
3. „Zelená kniha - Green Paper“ je dokument Komisie EÚ prijatý pre zaistenie energetickej bezpečnosti - sebestačnosti v energetickom zásobovaní krajín EÚ. S veľkým dôrazom na potenciál ZOFE mimoriadny záujem je o biomasu. Cieľom je znížiť import energie do EÚ, aby sa zachovala aspoň rovnováha medzi domácimi a importovanými zdrojmi energie. Pri zachovaní súčasného trendu v náraste importovanej energie sa predpokladá, že do roku 2030 to bude až 70%.
Na základe súčasného trendu vo výstavbe, či v rekonštrukcii kotolní s prechodom na biopalivá - slamu a drevné štiepky v Poľsku, je možné povedať, že energetickú sebestačnosť v komunálnej sfére a zníženie produkcie emisií CO2, je možné pomerne s úspechom riešiť pomocou lokálnych energetických systémov [2]. Tieto systémy centrálneho zásobovania teplom (CZT) a čiastočne aj elektriny je možné úspešne riešiť s aplikáciou kogenerácie. Veľká systémová elektro-energetika aj napriek tomu, že v Poľsku vládne nariadenia a vyhlášky požadujú z roka na rok rovnomerne zvyšovať podiel bio-elektriny a bio-tepla v ročnej bilancii spotreby energie, tento problém zatiaľ rieši cestou hybridných systémov – spoluspaľovaním biopalív s fosílnymi palivami. Túto úlohu veľká energetika zabezpečuje vo väčšine prípadov pomocou spoločného spaľovania uhlia s drevnými štiepkami, tzv. lesné energetické štiepky na báze poťažbových zvyškov ťaženého dreva, príp. sa začína s využívaním energetických plantáží, napr. Sida hermaphrodita Rusby, vŕba Salix,Miskantus, atď. Vo väčšine prípadov je zmena - technický zásah do stávajúceho systému energetickej technológie obmedzený na prispôsobenie systému zásobovania kotla zmesou uhlia a biomasy. Názory na tento spôsob energetického využitia biomasy sú zväčša negatívne. Súbežné spaľovanie uhlia s biopalivom sa doporučuje aplikovať najmä pri fluidnej technológii, tzv. fluidnom kotle s vylúčením použitia slamy. 2. TECHNICKÉ A TECHNOLOGICKÉ VLASTNOSTI SLAMY. Slamu ako energetickú surovinu určujú nasledovné parametre a charakteristické vlastnosti[2]:
- výhrevnosť MJ.kg-1 (u plynu je to v MJ.m-3 ), - teplota horenia °C, - teplota tavenia prachov oC - sypná hustota kg.m-3, - hustota t.m-3, - objemová hmotnosť t.m-3 - energetická hustota MWh.m-3, - energetický potenciál GJ.ha –1,
3

- rozmerová homogénnosť slamy - obsah vody - relatívna vlhkosť.
Výhrevnosť slamy závisí najmä na druhu a akosti slamy, pričom akosť je ovplyvnená okrem obsahu vody aj fázou zberu slamy (slama zberaná priamo za kombajnom - slama žltá, slama zberaná po niekoľkých dňoch po zbere zrna – slama sivá). V takom prípade výhrevnosť je v rozsahu: pri vlhkosti 5% - 19 MJ.kg-1, t.j. slama sivá, a pri vlhkosti 20% - 13,5 MJ.kg-1, t.j. slama žltá.
Aby určité technologické prvky kotla mohli správne fungovať, je potrebné dodržať optimálnu teplotu horenia slamy, tá by mala byť v intervale 750 až 900 oC. To je dôležité hlavne z aspektu nežiaduceho tavenia popola, čo ovplyvňuje aj technické riešenie odvodu popola z kotla. Z týchto dôvodov je problematické využívať jačmennú slamu pre energetické účely [2].
Tabuľka č.1: Parametre slamy v závislosti na rozmerovej homogénnosti.
Stav - úprava slamy Sypná hustota kg.m-3
Objemová hmotnosť
m3.t-1
Energetická hustotaMWh.m-3
Slama voľná 20-50 20-50 0,16-0,7 Slama rezaná 40-60 10-25 0,13-0,19 Slama viazaná do malých balíkov
50-110 9-20 0,16-0,36
Slama v okruh. balíkoch 60-90 11-16 0,19-0,29 Slama v „big“ baloch 70-130 7,7-14 0,23-0,49 Slama ako brikety / pelety
300-450 2,3-3,3 0,99-1,48
Spotrebu slamy pre prepočítaný výkon kotla udávame cestou energetického
potenciálu obilnej plochy, pre vyjadrenie ktorého platí, že zostávajúca slama vyjadrená pomerom zrno / slama, t.j. z:s= 1:0,56. Na základe pokusov bolo dokázané, že pre energetický účel je možné získať z jedného hektára obilia 0,8 až 5,0 ton slamy. To je závislé na odrode, úrode a druhu obilia.
Technické riešenie zásobovania energetickej jednotky slamou určuje technológia zberu, respektíve zhutňovania tejto energetickej suroviny. V tab. č. 1 sú udané parametre slamy v závislosti na jej rozmerovej homogénnosti.
2. KOTLY A ZARIADENIA PRE ENERGETICKÉ VYUŽITIE SLAMY Slama začala byť atraktívna ako energetická surovina už na začiatku 70-tych rokov, ale aj pod tlakom neskorších smerníc, ktoré zakázali voľné pálenie slamy na poliach. Po stránke technickej sa jednalo hlavne o to, ako riešiť otázku predĺženia horenia slamy v spaľovacej komore kotla. Všeobecne známe základné údaje o horení slamy [3,4]:
- vysoká rýchlosť horenia pri voľnom prístupe vzduchu, - relatívne vysoká teplota horenia (1400 až 1430 oC), - relatívne vysoký plameň (z balíka slamy o priemere 1m až do výšky 1,5 m).
Tieto údaje boli základnou informáciou vo vývoji kotlov, ktoré boli konštrukčne riešené ako dvojplášťová komora na spaľovanie balíkov slamy. Spalinovod bol integrovanou súčasťou kotla – spaľovacej komory, a preto tieto systémy sa často vyznačovali nízkou účinnosťou a tiež nedopalmi slamy ako TZL sa bežne dostávali
4

do ovzdušia. Vývoj kotlov sa orientoval hlavne na zväčšenie výmenníkovej - teplosmennej plochy. Na obrázku 1 je znázornený typický kotol tejto konštrukcie[2]. Obr.1: Kotol na slamu.
Legenda: 1- teplomer, 2- dymový kanál, 3- keramická výmurovka, 4- regulátor otáčok ventilátora, 5- ventilátor, 6- slama, 7- vodný plášť kotla, 8- tepelná izolácia kotla. Dodávka slamy do tohto typu kotla bola zabezpečená pre výkony 20 až 100 kW ako balíky o hmotnosti 10 – 15 kg, ktorých dodávka do spaľovacej komory je na úrovni 2 až 5 kusov. Pre výkony od 100 do 500 kW bola slama balená do valcových, prípadne štvorcových balíkov, ktorých hmotnosť sa pohybovala od 100 do 300 kg. Na začiatku 80-tych rokov boli už komerčne dostupné systémy kotlov vybavené s automatickým riadením, s plynulou dodávkou biopaliva na báze slamy. Technické riešenie týchto kotlov bolo ovplyvnené už známou koncepciou kotlov na zemný plyn. Z aspektu zohľadnenia diferencie parametrov slamy ako paliva vs zemný plyn (napr. hustota slamy, obsah TZL v spalinách zo slamy, teplota horenia a relatívna vlhkosť - obsah vody v slame), kotly na slamu boli dodatočne: 1. vybavené predradenou časťou spaľovacej komory, v ktorej prebieha proces sušenia biopaliva – redukcia obsahu vody a následne proces suchej destilácie – pyrolýzny rozklad slamy na pyrolýzny plyn. Táto predradená časť spaľovacej komory bola obyčajne riešená ako jej prvý stupeň a plynulo prechádzala do spaľovacej komory. Jednoducho povedané, táto časť je porovnateľná s funkciou karburátora u spaľovacích motorov; 2. ako bezroštové kotly - vybavené zariadením pre vnútornú dopravu popola; 3. vybavený výmurovkou - keramickou vložkou vo vnútri kotla za účelom chrániť kotol pred poškodením - deštrukciou z titulu vysokej teploty v spaľovacej komore a hlavne za účelom zabezpečenia úplného spaľovania biopaliva na báze slamy. Pri rekonštrukcii kotla na zemný plyn na biopalivo – slamu, mal rekonštruovaný kotol iba štvrtinový výkon oproti pôvodnému kotlu na zemný plyn. Na obrázku 2. je znázornený automatický kotol na slamu s dodávkou drtenej slamy [2,3]. Obr. 2: Automaticky kotol na slamu: 1- drvič slamy, 2- cyklón, 3- protipožiarna stena, 4- ventilátor, 5- závitovkový dopravník, 6- predspaľovacia komora, 7- spaľovacia komora, 8- keramická výmurovka, 9- izolačná vrstva, 10- vodný plášť kotla, 11- spalinový - dymový ventilátor.
5

ZÁVERY 1. Biopalivo na báze slamy je z energetického aspektu výrazne odlišné (nízko-kalorické palivo) a porovnávanie so zemným plynom a naftou (ušľachtilé vysoko-kalorické palivo) je len ťažko akceptovateľné. Ako palivo je celkom odlišne klasifikované. 2. Pri horení slamy sú intenzívne uvoľňované prchavé látky, ich obsah je cca 46 %. 3. Obsah popola je závislý od druhu slamy, jeho obsah je obyčajne od 4 do 7 %. 4. Kotly na slamu, pracujúce v nízko-teplotnom režime, sú vybavené s predradenou spaľovacou komorou, v ktorej prebieha suchá destilácia – pyrolýzny rozklad slamy na pyrolýzny plyn. Kotly pracujúce vo vysoko-teplotnom režime vyžadujú vyriešiť otázku tavenia popolov, pre odstránenie čoho sa montujú komplikované drtiče a dopravníky. 5. Pri priamej adaptácii – rekonštrukcii plynového kotla na kotol pre spaľovanie slamy sa získava energetická jednotka s podstatne nižším výkonom, o cca 25% vztiahnuté k výkonu pôvodného kotla na zemný plyn. 6. Vlastnosti slamy ako paliva si vyžadujú špeciálnu konštrukciu kotlov pokiaľ sa majú vyrovnať kotlom spaľujúcim klasické fosílne palivá.
LITERATÚRA 1. Budny J. 2000. Czy węgiel kamienny może konkurować z paliwami płynnymi.
Materiały konferencji naukowej „Problemy gospodarki energią i środowiskiem w mleczarstwie“, Licheń 4-6 IX 2000, s. 4-8.
2. Denisiuk W. 1998. Analiza technologiczna, organizacyjna, i finansowa kotłowni opalanej słomą“. Materiały konferencji naukowej „Wykorzystania energii odnawialnej w rolnictwie“. Warszawa 29-30 IX 1998, s. 161-172.
3. Nikolaison L. 1998. Straw for energy produktion. The centre of biomass technology, Denis.
4. Víglaský J. 2001. Straw as a Fuel and its Characteristics. In: Acta Facultatis Technicae Zvolen V. – Zborník vedeckých prác Fakulty environmentálnej a výrobnej techniky Technickej univerzity vo Zvolene, No. 1, s. 139-148, Slovensko.
5. Manifesto, AE-BIOM. Brussels, Belgium, 2003.
6

BIOMASS PELLETS MARKETS, SITUATION AND DEVELOPMENT TRENDS
Kent Nystrom Managing Director, Swedish Bioenergy Association - Svebio Vice President European Biomass Association – AEBIOM Torsgatan 12, 11123 Stockholm, Sweden Phone: +46 070-6768538 E-mail: [email protected] ABSTRACT The presentation deals with what is happening on a global level with fossil oil and gas. Something about the greenhouse effect and what we can do about it on a global, regional and national level. The bioenergy development in Sweden is shown and commented. The pellets market in Sweden is described as well as actual steering instruments for stimulating a faster implementation

Biomass pellets markets, situation and development trends
Bratislava, 20050220
Kent NystromSwedish Bioenergy Association, Svebio
European Biomass Association, AEBIOM

The Swedish Bioenergy Association, Svebio, is a non profit, non governmental member association with 400 members, whereof 300 enterprisesSvebio’s mission is to increase the use of bioenergy in an environmentally friendly and economically optimal way
Equipment manufactors
Producers of pellets andbriquettesDistrict heating companies
Biomass traders
Education/Consultants
Others
The Swedish Bioenergy Association

Contents• Highlights on fossil oil and gas • Highlights on the climate• What do we do about the greenhouse effect?
Globally, regionally, locally?• News on the EU level• Biofuel in Sweden• The pellets market• Conclusions
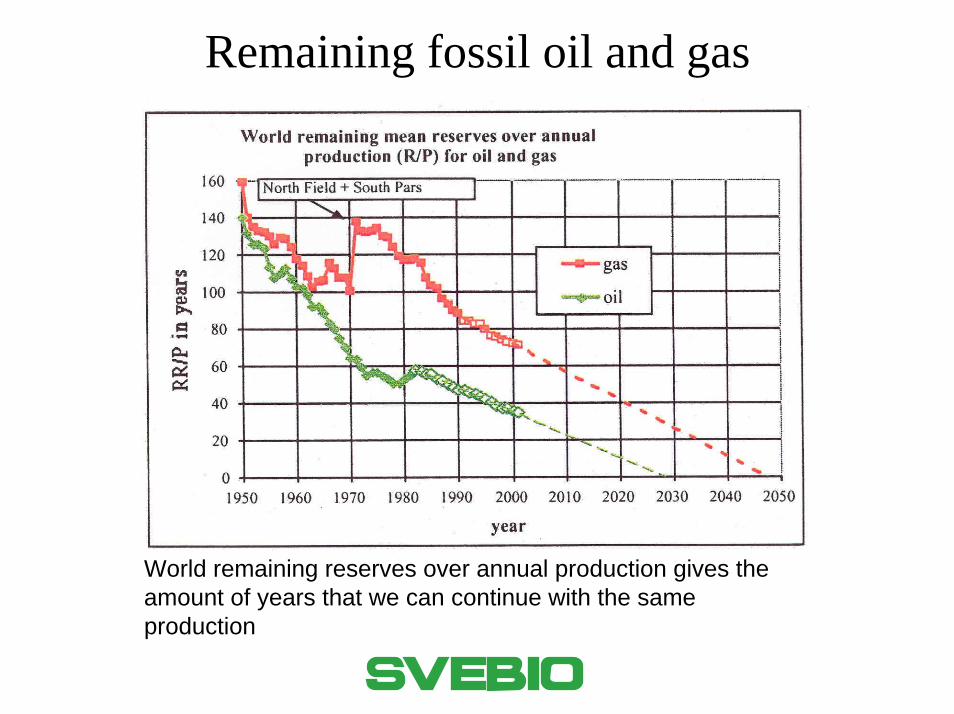
Remaining fossil oil and gas
World remaining reserves over annual production gives the amount of years that we can continue with the same production

QuickTime och enTIFF (LZW)-dekomprimerare
krävs för att kunna se bilden.

1000 1500 2000
380
360
350
340
330
320
310
8
7
6
5
1.0
0.5
0.0
-0.5
1000 1500 2000
1000 1500 2000
Temperature Change (oF)
Fossil Carbon Emissions (Billions Tonnes)
CO2 Concentration (PPM)
Consequences of the greenhouse effect
1. Globally:The Kyoto agreement: It is a small step but a very important one, because it is global. And 20050216 the agreement was taken into operation as Russia has ratified the protocol.Of course it is important that the USA have not ratified it. (But I think that they will find an own way to join).That is the very important break through: Making a globally accepted agreement on an environmental problem, the greenhouse effect.

2. On a European level:
Important EU- decisions influencing the member states’energy politics:
• The White Paper on Renewable Energy Sources, November 1997: 6 -> 12% from 1995 to 2010 => trebling of bioenergy: 45- �> 135 Mtoe
• Kyoto- agreement December 1997: The EU’s member states shall decrease their CO2-emissions with 8% as an average from 1990 to 2008-12
• The Green Paper ” Towards a European strategy for the security of energy supply”, November 2000: Decrease the imports of energy to the EU. It is now more than 50% and will reach 70% within 20-30 years with business as usual

Important EU- directives
• Directive on the promotion of electricity from RES
• Directive establishing a scheme for greenhouse gas emission allowance trading
• Directive on the promotion of the use of biofuels or other renewable fuels for transport
• Directive on the promotion of cogeneration based on a useful heat demand
• Directive on the energy performance of buildings

3. On a national level:Bioenergy development in Sweden
0
20
40
60
80
100
120
1970 1980 1990 2000
From 1970: + 2,0 TWh/yearFrom 1980: + 2,5 TWh/yearFrom 1990: + 3,1 TWh/year
2000-2010: + 3 or 4 or 5 TWh/year???
Now 23% of the total demand

The bioenergy share of the total energy utilization in Sweden
• 1970: 9%• 1980: 11%• 1990: 15%• 2000: 20%• 2003: 23%

2. Austrian Biomass Association - ABA
3. Bulgarian Biomass Association - BBA
4. British Biogen
6. Czech Biomass Association - CZBIOM
7. Danish Biomass Association - DANBIO
9. Estonian Biofuels Association - EBA
10. Finnish Bioenergy Association - FINBIO
11. European Wood Energy Technical Institute – ITEBE (France)
12. German Bioenergy Association - BBE
13. Greek Biomass Association - HELLABIOM
14. Hungarian Biomass Association - HBA
15. Irish Bioenergy Association - IrBEA
16. Italian Biomass Association - ITABIA
18. Netherlands Bioenergy Association – NL-BEA
19. Norwegian Biomass Association - NOBIO
20. Polish Biomass Association - POLBIOM
22. Slovenian Biomass Association - SLOBIOM
23. Swedish Bioenergy Association - SVEBIO
24. Slovak Biomass Association - SKBIOM
1. Association for extension of biomass in Spain - ADABE
26. Swiss Farmers Union - SBV
27. Ukrainian Bioenergy Association - UBA
28. Valorisation of Biomass – ValBiom (Belgium)
17. Latvian Bioenergy Association - LATBIO
5. CARMEN (Germany)
AEBIOM members
25. South Tyrol Biomass Association8. Energy Utilisation Biomass Association – EUBA (Bulgaria)
21. Russian Biomass Association - RBA

According to the European Biomass Association, AEBIOM, the biomass implementation speed is too slow.
Manifesto of AEBIOM:
•National targets for biomass followed by effective steering instruments.•Introduction of certificates on heat from RES.•A market for biomass must be created within the individual MS and the Union.•Minimum level of carbon dioxide taxation at Union level must be introduced.•Develop public awareness and education about the potential of biomass.•High priority to biomass implementation in the new member states.•Evaluate the use, advantages and effect of different national steering instruments on national and Union basis. Reliable models capable to predict the effects of different incentives, steering instruments and measures must be developed.

Reaching the targets 2010?
Due to the EU Commission:
• The “Electricity from RES- directive”: 22% for EU 15 and 21% for EU 25 will be 18% with current steering instruments
• The “Alternative liquid fuel- directive”: 5,75% will be 3% without stronger steering instruments
• The share of RES: 12% according to the white paper, will be 8%. 10% if the 21% and the 5,75% will be reached. To reach 12%, it demands very strong actions on the heating and cooling markets, and the commission advertises such actions.

New plans and targets
• The commission is so far disappointed of the biofuel development and demands stronger steering instruments.
• The commission will present an ”Action plan for biomass” before this summer.
• The commission will 2007 decide about new targets for the period after 2010.
• The parliament announces already a 20% CO2-decrease to 2020. Will put heavy demands on bio fuels and equipment.
• The parliament will give priority to a directive on heating from RES. The commission could perhaps present a draft this autumn.

Swedish CO2-emission politics• EU’s burden sharing agreement: + 4% for
Sweden from 1990 until 2008-2012• The Swedish parliament’s decision: - 4%

The Swedish bioenergy market is very extensive
• Heating• Electricity production• Liquid biofuel
• Small scale• Medium scale• Large scale

The pellets market
• A big one family house campaign right now: ”Pellets heating-the heating for the future”
• Tax reduction for labour costs when converting to pellets from April 15, 2004 to june 30, 2005
• Tax reduction for labour and material costs for public buildings 2005 and 2006 when converting from oil and electricity heating.

Svedish pellets market development 1992 - 2003.
0
100 000
200 000
300 000
400 000
500 000
600 000
700 000
800 000
900 000
1992 1993 1994 1995 1996 1997 1998 1999 2000 2001 2002 2003
<25 kW
26-2000 kW
>2000 kW
Tons
Source:Pelletsindustrins Riksförbund, PiR
Total demand in Sweden 2003PIR production: 700 000Other producers in Sweden: 180 000Imports: 270 000 Total: 1 150 000

Delivery to one family houses (PiR) < 25 kW
0
50 000
100 000
150 000
200 000
250 000
300 000
1992 1993 1994 1995 1996 1997 1998 1999 2000 2001 2002 2003
89 %
-5 %41 %
49 %
113 %
268 %58 %71 %
Antal ton
41 %
Antal levererade ton på den Svenska villamarknadenfrån producenter inom Pelletsindustrins Riksförbund, PiR. 28%
Källa:Pelletsindustrins Riksförbund, PiR

Installed number of pellets burners < 25 kW.
300 7001 800
5 000
7 700
12 000
2 5003 5003 200
7 500
0
5 000
10 000
15 000
20 000
25 000
30 000
35 000
40 000
45 000
50 000
1994 1995 1996 1997 1998 1999 2000 2001 2002 2003
AntalAntal per årAntal ackumulerat
Källa: Swedish Heating Boilers and Burners Association

Installed number of pellets stoves
1000 1000 1200
3500
500
0
1000
2000
3000
4000
5000
6000
7000
8000
9000
10000
11000
1994 1995 1996 1997 1998 1999 2000 2001 2002 2003
AntalAntal per årAntal ackumelerat
Källa: Swedish Heating Boilers and Burners Association

Installed number of burners 26 - 300 kW
50100
200 200
320
150
265
100
0
100
200
300
400
500
600
700
800
900
1000
1100
1200
1300
1400
1500
1996 1997 1998 1999 2000 2001 2002 2003
AntalAntal per årAntal ackumulerat
Denna statistik innefattas endast av medlemsföretag organiserade inom Swedish Heating Boilers and Burners Association, SBBA.
Källa: Swedish Heating Boilers and Burners Association

Conclusion• Dramatic surrounding world• EU disappointed of the bioenergy development. Now
tougher actions.• Bioenergy 103 TWh in Sweden (23% of the total energy
demand)• Pellets market increases rapidly due to high oil and
electricity prises.• The politicians are positive. Media starts recognise what’s
happening.

PELLETS 20062nd World Conference on Pellets
”Taking you fromknow-how to show-how”
”Pellets for the World”
www.svebio.se

LARGE-SCALE PRODUCTION OF WOOD CHIPS FOR FUEL
Pentti Hakkila Professor VTT Processes, Box 1601, 02044 VTT, Finland Phone: +358 400 208 789 [email protected] ABSTRACT The paper is based on the results of the national Wood Energy Technology Programme in 1999 – 2004 and the practical experiences of forest fuel production organizations in Finland. Traditionally, the major barriers to the large-scale use of forest residues for fuel are high cost of production, unsatisfactory fuel quality and unreliable supply. To overcome the barriers, the supply system must be integrated with the existing timber procurement organizations of the forest industries, procurement logistics must be refined, productivity of work must be improved through machine and system development and through learning, and the receiving and handling of chips at a plant must be adapted to wood fuels of variable quality. When the special requirements are met, wood chips are a viable and environmentally friendly fuel for large heating and CHP plants.

VTT TECHNICAL RESEARCH CENTRE OF FINLAND1
VTT PROCESSES
Alternative Production Systems
A chip production system is built around the comminution phase
Comminution in the terrainComminution at landingComminution at a plant
– Transport of loose residues– Transport of residue bales
Comminution at a terminal
In large-scale operations, the trend is toward centralizedcomminution due to easier process control

VTT TECHNICAL RESEARCH CENTRE OF FINLAND2
VTT PROCESSES
Advantages of Residue Balesin Large-Scale Operations
Machines operate independently of each otherFlexible integration in the procurement of industrial woodAccurate real-time information about the inventoriesLess problems of noise, dust and litterReduced space requirement, simple storageReduced transport and overhead costsImproved control of fuel flow, reliable deliveries
The advantages have to be weightedagainst the extra cost of baling

VTT TECHNICAL RESEARCH CENTRE OF FINLAND3
VTT PROCESSES
Receiving, Handling and Blending
Their importance is not always recognized in system planningPlanning should be carried out jointly by the plant and the fuelprocurement organization.
– Receiving station: flexible unloading prevents queuing of trucks.
– Minimum chip handling capacity: 3 m3 loose/h/MW of fuel capacity of the boiler. No bottlenecks.
– Crusher at plant makes it possible to receive unprocessed biomass. Only large plants can afford one.
– Disk screen combined with a chipper for over-sized pieces improves the fluidity of chips .
– Buffer storage ensures the fuel supply during week ends etc.Investment for the receiving and handling is about 9 % of the total cost a CHP plant.

VTT TECHNICAL RESEARCH CENTRE OF FINLAND4
VTT PROCESSES
Quality Control of Fuel
Chip quality affects the useability of a plant and efficiency of combustionThe higher the share of chips, the more pronounced is the role of qualityLarge plants and FBC boilers are more tolerantAn important goal of quality control is to reduce variation of qualityMoisture control is a central quality factor, since it affects:
– Effective heating value– Efficiency of combustion– Amount of emissions– Fluidity of chips in winter– Deterioration of biomass during storage– Weight of a truck load
Energy density of fuel becomes important as transport distances grow

VTT TECHNICAL RESEARCH CENTRE OF FINLAND5
VTT PROCESSES
Users of Forest Chips in Finland
2002
Use, m3
200 - 500500 - 1 0001 000 - 5 0005 000 - 10 00010 000 - 50 00050 000 - 100 000over 100 000
200
400
600
800
1000
1200
1400
Smallhouses
Heatentre-
preneurs
Largehouses,districtheating
Districtheatingplants
Forestindustries
763
226
1004892
1332
Total 2.1 mill.m3 = 4.2 TWh
Heat only
Heat and powerSmall scale
Large scaleUse in 2003GWh

Large-Scale Production of Wood Chips for Fuel
Pentti HakkilaVTT Processes
International SlovakBiomass Forum 2005

VTT TECHNICAL RESEARCH CENTRE OF FINLAND2
VTT PROCESSES
Preconditions for Large-Scale Production
Sufficient availability of forest biomass without endangering the raw material base of forest industriesStrong government supportWide acceptance by all actors: forest sector, energy sector, policy makers, environmentalists, general publicSufficient plant capacity to handle and combust wood fuelsPossibility to cofire chips with other fuels (security)

VTT TECHNICAL RESEARCH CENTRE OF FINLAND3
VTT PROCESSES
Raw Materials of Forest Chips
Small trees from thinnings Residue bales from final fellings
Stump and root wood Wood fuels are blended

VTT TECHNICAL RESEARCH CENTRE OF FINLAND4
VTT PROCESSES
Production Organizations
Forest fuel production should be integrated into conventional forest managementForest fuel flow should be integrated with the flow of industrial raw materialForest industries’ wood procurement organizations suit well for fuel production because:
– They want to control the wood flow in its entirety– They have good access to biomass residues– Removing residues may be a trump card in the timber trade– Fuel production may help to smooth seasonal fluctuation of forest
work– Renewable energy enhances the green image of the forest industries
Networks of forest machine contractors suit well for smaller local operations.
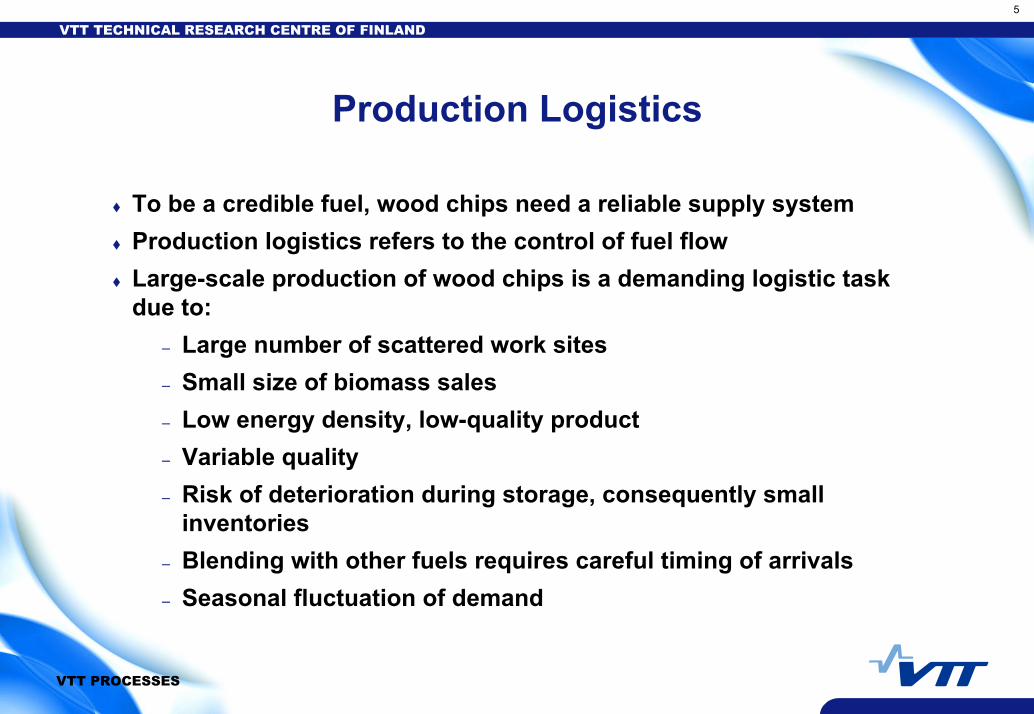
VTT TECHNICAL RESEARCH CENTRE OF FINLAND5
VTT PROCESSES
Production Logistics
To be a credible fuel, wood chips need a reliable supply systemProduction logistics refers to the control of fuel flowLarge-scale production of wood chips is a demanding logistic task due to:
– Large number of scattered work sites– Small size of biomass sales– Low energy density, low-quality product– Variable quality– Risk of deterioration during storage, consequently small
inventories– Blending with other fuels requires careful timing of arrivals– Seasonal fluctuation of demand

VTT TECHNICAL RESEARCH CENTRE OF FINLAND6
VTT PROCESSES
Technology for Large-Scale Operations
Multi-tree handling Chipping logging residues
Large-capacity truck Receiving and handling

CURRENT UTILIZATION AND PERSPECTIVE OF SHORT ROTATION ENERGY CROPS
Jozef Viglasky President of SK-BIOM Slovak Biomass Association / SK-BIOM Technical University in Zvolen T.G. Masaryka 24, 960 53 Zvolen, the Slovak Republic Phone: + 421 45 5206875 E-mail: [email protected] ABSTRACT World-wide, there is an increasing demand for phytomass for production of renewable CO2-neutral fuel and as an inexpensive environmentally friendly raw material source for food and industry production. Together with the development of appropriate technology, is becoming a matter of paramount importance. Amaranth species hold much promise in fulfilling these demands. Amaranth could be characterised as a high energy multipurpose C4 plant, fits the bill as a true „4F crop“ (Food, Feed, Fuel and Fibre) as well as being a short cycle, drought and salinity tolerant crop. The Amaranth agro-ecological system is a key link in the sustainable production of agriculture. It will play an important role in „healthy“ food as well as environmental protection in the next century. From the environmental point of view it should be mentioned that Amaranth is the plant species, which is also suitable for marginal lands and contaminated soils. It is known for its dry or saline land resistance as well as contamination by radioactive dust or other harmful material. Keywords: Amaranth, energy crops, yield, biomass characteristics, ash, polluting elements, heavy
metals.
1. INTRODUCTION
Biomass generally has been taken as the only indigenous renewable energy resource capable of displacing large amounts of solid, liquid, and gaseous fossil fuels. As a widely dispersed, naturally occurring carbon resource, biomass was a logical choice as a raw material for the production of a broad range of fossil fuel substitutes. Amaranth is a plant species with the C4 photosynthetic pathway. These plant species are distinguished by a significantly high dry matter (DM) yield potential and lower quality in comparison with plant species with the C3 photosynthetic pathway. Amaranth is something different. It is known for its significantly high yield as well as quality. Chosen plant species are growing as resource of healthy food (high nutritional value of seeds) and unprocessed biomass is mostly used as fodder in

many countries but especially in Central America by the Indians as original cultivator. Utilization of biomass as renewable energy source for some advanced bio-energy systems indicates, however, that biomass can be an excellent and perspective biofuel. It has become clear, that nowadays knowledge of biomass physical properties especially by new energy crops or plants cultivated in the polluted fields is not enough for any further optimization of industrial energy plants or domestic bio-energy units. For this reason it is necessary to explore biomass especially new energy plant species as fed to the bio-energy system. Without this, there can be no guarantee that the biofuel will perform satisfactorily under operating conditions. It is clear that our research on Amaranth as a potential energy crop has not included a definitive taxonomic study but it could be an important key link in future environmental protection. Objectives: • To study physical properties inclusive thermal behaviour of Amaranth-
phytomass as fuel; • To determine:
♦ ♦
heating value of Amaranth phytomass, ash content and its chemical composition.
2. MATERIAL AND METHODS
2.1 Crop material The crop samples of Amaranth for chemical analyses and bomb calorimetry were obtained from experimental sites of the SAU in Nitra. The actual and potential yield of Amaranth is still being investigated for Slovak climate and soil conditions. Yields of Amaranth biomass are in the range of 50-250 tonnes of green matter (GM) (or 10-50 t of DM) per hectare and growing season, depending on chosen plant species and location of cultivation inclusive soil condition. 2.2 Methods used for the characterisation of Amaranth-phytomass
Solid fuels: Amaranth phytomass dry matter energy value (Combustion heat) was determined by means of adiabatic instrument IKA C4000 (Analysentechninik Heitersheim). Gross calorific value and heat capacity of the calorimetric system determination was done by a software programme C-402, according to the DIN 51900 standard.
Biofuels: Determinations of ash content and its chemical composition, analyses of basic properties of waste - combustion residues, the Statute of Slovak Government No. 15/1996 Digest about the treatment of waste. 2.3 Experimental part Thermooxidation reactions from the given samples of Amaranth phytomass were carried out under laboratory conditions at controlled burning temperature by means of air oxygen. The surplus that remained after oxidation samples were gravimetricaly fixed and adapted for analytic fixing of chosen elements.

The analysis consisted in preparation of water lye with de-ionised water and the following process of elution with solid matter in 3 % solution of nitric acid, purified for spectral analysis. Eluates were analytically prepared and individual elements were fixed by AAS, AAS - ICP methods. Mercury was fixed by mercury analyser.
3. RESULTS
Different crops are likely to have a similar calorific value per unit weight of DM [4]. In general, moisture content (MC), ash content (AC), as well as growing parameters (e.g. location, different fertilisation treatments, nutrient balance, ley year, and others) mainly effect calorific value of phytomass as potential raw material for biofuel production. 3.1 Calorific value of Amaranthus cruentus - Giganteus The lower and higher heating values were determined according to DIN 51900. Data on proximate and ultimate compositions and heating values are given on dry basis. HH value of Amaranth DM varies from 15.5 to 17.0 MJ.kg-1, LH value is range 13-14 MJ.kg-1 at 10 % MC. The analysis results confirm Amaranth phytomass to be a low-grade fuel in comparison with coal. A summary of the results obtained in laboratory analyses of Amaranth phytomass as a fuel is presented in Table 1. Thermal conversion quality is determined by many factors, including water content at harvest, and ash, alkali, Cl and N content. Limited data available shows that as a low input C4 plant with a low water requirement, Amaranth has high ash and alkali content in comparison with a typical wood crop and a typical C3 crop like grass species. Table 1: Results of lab-analyses of Amaranth cruentus “Giganteus” phytomass Fuel Amaranth matter, 2001 Amaranth matter,
2000 Type Inflorescenc
e & leaves Stems Averag
e
Stems
Measured value Unit
MC as received Wt-r % 11.80-19.70 12.80-20.10 14.70-22.40
Ave. Wt-r % 15.75 16.45 16.10 18.60 MC in analytical sample W-a % 6.94 6.18 6.56 6.05
Ash content, A-d % 15.40 10.17 12.79 13.03 Sulphur content, St-d % 0.57 0.11 0.34 0.18 Carbon content, C-d % 41.00 43.50 42.25 40.00 Hydrogen content, H-d % 5.70 6.20 5.95 5.10 Nitrogen content, N-d % 2.50 0.80 1.65 1.20 HHV
Analytical sample, Qs-d MJ/kg 15.72 16.61 16.17 15.48
LHV

DM Qi-d MJ/kg 14.48 15.26 14.87 14.35 “as received”, Ave. MC Qi-r MJ/kg 11.81 12.34 12.08 11.23
3.2 Ash analyses of Amaranth Ash content and its chemical component is one of the most important data for thorough analyses and classification of potential biomass as a fuel. 3.3 Ash content Other aspect of biofuel quality is mineral content. Silicon and other mineral contents are important in that they affect quantity and quality of ash, therefore these values should be clearly defined. This parameter connected with Amaranth is not common in literature and published values are considerably different (from 5 - 22 %). This difference is expressive and if true it is necessary to explore it by making further experiments. Experimental findings of ash content in Amaranth phytomass: The fixed state of Amaranth ash was carried out on five weighed air dried samples, with material weighing from 1 - 5 grams, annealing at 520 °C, for 48 hours. The solid matter remaining after annealing - ash were determined by gravimetric method, gained value was 19.09 % (Sx = 0.18). 3.4 Chemical composition of ash Ash from our experiments was used for fixing state of individual elements, while particular attention was paid to ascertaining the presence of heavy metal, and aimed at the following groups of elements:
1. mercury, thallium, cadmium, 2. arsenic, nickel, chromium, cobalt, 3. lead, copper, manganese.
These data are important in view of the proposal, respectively recommended working parameters of the technological equipment, which should use Amaranth phytomass as biofuel. Results of the analyses were numbered on account of their original solid surplus matter, which remained after thermooxidation reaction and are listed in Table 2 as well as plotted by a column graph in Figure 1.

0
5
10
15
20
25
30
35
sum
[mg.
kg-1] i
n as
h
F Pb Cd Cr Co Cu Ni Zn As Sb Sn Se Hg B
elements
Rad1
Figure1: Representation of chosen elements in water lye and lye of 3 % nitric acid from solid matter
4. DISCUSSION
The analyses of A-th samples were directed on products which arise during annealing and remain in the experimental system as solid material. Our experiment was placed under laboratory standards and should be the basis for realisation of larger experiments in the 4th prevailing criteria. At this planned experiment, fully fledged analyses should take place, which would be directed also on the study of gas production, which occurs during process of thermal oxidation. Analyses of solid matter after thermooxidation were made. In case of utilisation of parts of Amaranth for technical purposes on production of heat energy, occurrence of solid parts can be expected. These from the point of view of evaluation of technological processes in the aspect of environmental protection are part of solid emissions and also solid waste, which belongs to waste management within the category of dangerous waste [1, 2, 3]. The realised measurements and analyses showed that, in solid matter after thermooxidation compound elements are found, which have unfavourable physiological effects regarding the health of the human organisms. From elements with cancerous characteristics, cadmium (Cd) was found in solid matter (in ash) in concentration 1 mg.kg-1, further chromium (CrVI), cobalt (Co) and nickle (Ni) under the laws re-atmosphere [1] and its exacting in G SR No. 92/96 [2, 3] belong to Group 1 - polluted materials with cancerous activity and their content is with Cd limited by burning at 0.2 mg.m-3 the same goes for Cr, Co and Ni at 2 mg.m-3. Another noticeable and dangerous element, was ascertainment of mercury (Hg) whose concentration was found to be at the value of 13.4 µg.kg-1 which is unfavourable, and that Cobalt and Mercury are found in parts and in water soluble form. Further observed elements, law protected in the atmosphere and waste materials are copper, lead, zinc and chromium (CrIII). These elements like emissions belong to Group 3, under Group 2 polluted materials and their emission
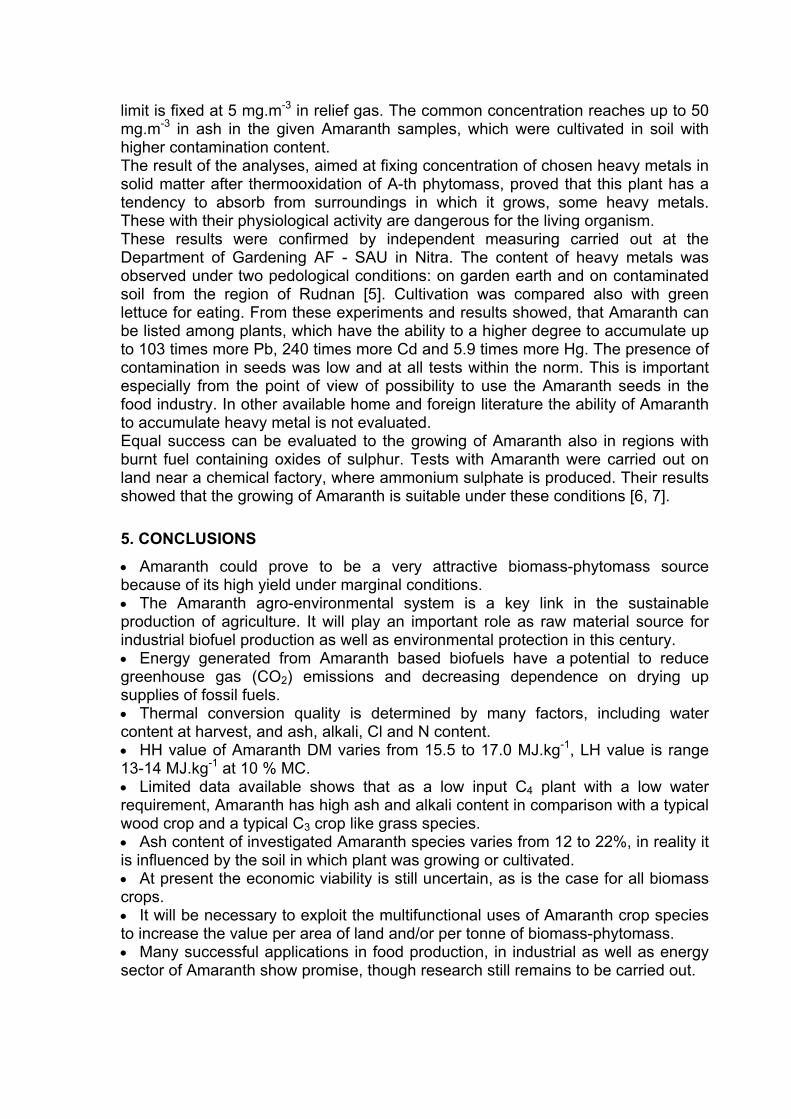
limit is fixed at 5 mg.m-3 in relief gas. The common concentration reaches up to 50 mg.m-3 in ash in the given Amaranth samples, which were cultivated in soil with higher contamination content. The result of the analyses, aimed at fixing concentration of chosen heavy metals in solid matter after thermooxidation of A-th phytomass, proved that this plant has a tendency to absorb from surroundings in which it grows, some heavy metals. These with their physiological activity are dangerous for the living organism. These results were confirmed by independent measuring carried out at the Department of Gardening AF - SAU in Nitra. The content of heavy metals was observed under two pedological conditions: on garden earth and on contaminated soil from the region of Rudnan [5]. Cultivation was compared also with green lettuce for eating. From these experiments and results showed, that Amaranth can be listed among plants, which have the ability to a higher degree to accumulate up to 103 times more Pb, 240 times more Cd and 5.9 times more Hg. The presence of contamination in seeds was low and at all tests within the norm. This is important especially from the point of view of possibility to use the Amaranth seeds in the food industry. In other available home and foreign literature the ability of Amaranth to accumulate heavy metal is not evaluated. Equal success can be evaluated to the growing of Amaranth also in regions with burnt fuel containing oxides of sulphur. Tests with Amaranth were carried out on land near a chemical factory, where ammonium sulphate is produced. Their results showed that the growing of Amaranth is suitable under these conditions [6, 7]. 5. CONCLUSIONS
•
•
•
•
•
•
•
•
•
•
Amaranth could prove to be a very attractive biomass-phytomass source because of its high yield under marginal conditions.
The Amaranth agro-environmental system is a key link in the sustainable production of agriculture. It will play an important role as raw material source for industrial biofuel production as well as environmental protection in this century.
Energy generated from Amaranth based biofuels have a potential to reduce greenhouse gas (CO2) emissions and decreasing dependence on drying up supplies of fossil fuels.
Thermal conversion quality is determined by many factors, including water content at harvest, and ash, alkali, Cl and N content.
HH value of Amaranth DM varies from 15.5 to 17.0 MJ.kg-1, LH value is range 13-14 MJ.kg-1 at 10 % MC.
Limited data available shows that as a low input C4 plant with a low water requirement, Amaranth has high ash and alkali content in comparison with a typical wood crop and a typical C3 crop like grass species.
Ash content of investigated Amaranth species varies from 12 to 22%, in reality it is influenced by the soil in which plant was growing or cultivated.
At present the economic viability is still uncertain, as is the case for all biomass crops.
It will be necessary to exploit the multifunctional uses of Amaranth crop species to increase the value per area of land and/or per tonne of biomass-phytomass.
Many successful applications in food production, in industrial as well as energy sector of Amaranth show promise, though research still remains to be carried out.

These are the main reasons for increasing interest to explore phytomass quality of different A-th species especially giant Amaranth and to receive their definitive taxonomic studies. Giant Amaranth species e.g. Amaranthus Australis L. or Amaranthus Cruentus L. is one of the main crops being considered as source of raw material for solid biomass based production processes to receive one of main products - high quality biofuel. This research is expected to be partially funded by the Commission of the European Communities within the Sixth Framework Programme. ACKNOWLEDGEMENTS
This research has been sponsored through the grant from the Scientific Grant Agency of Ministry of Education SR and Slovak Academy of Sciences, under the contract KEGA agency No. 3/1182/03 “Complex Use of Biomass in Agro-Forestry”. The authors are indebted to mentioned institutions for sponsoring this research work. REFERENCES
[1] Anonymous (1991). The Act No. 309/1991 digest, about the air protection against polluting matters.
[2] Anonymous (1996). The statute of the government of the SR No. 15/1996 digest about waste treatment.
[3] Anonymous (1996). The statute of the government of the SR No. 92/1996 digest about the air protection against polluting matters.
[4] GRIMM, A., STREHLER, A. (1987). „Harvest and compaction of annual energy crops for heat generation“, in: Producing Agricultural Biomass for Energy - Report and Proceedings of CNRE (European Co-operative Network on Rural Energy) Workshop. CNRE Bulletin Number 17, 97-102. Rome: FAO, 129 p.
[5] KONA, J. (1995). Accumulation of heavy metals by Amaranth. In: Proceedings from the conference „Biologization of a plant production VI.“, SAU, Nitra, pp. 120-123.
[6] VERESOVA, A. AND HOFFMANOVA, Z. (1995). The evaluation of an experimental growing of Amaranth. In: „Biologization of a plant production VI.“, SAU, Nitra, pp. 172-180.
[7] KUNCA, V. - SKVARENINA, J. - MAJERCAK, J., 2000: Acid atmospheric deposition in National Nature Reserve Kotlov zlab - Latana. Zpravodaj Beskydy: "Influence of Imission on Forest and Forest Economy Beskyd", 13, Edit Centrum of Mendel Agriculture and Forest University in Brno, pp. 15-18.

THE DEVELOPMENT OF THE PELLETS MARKET AND OF PELLETS TECHNOLOGIES IN AUSTRIA
Dipl.-Ing. Dr. Horst Jauschnegg Austrian Biomass Association Phone: 0043 316 8050 1277 E-mail: [email protected] ABSTRACT The market for pellets in the residential sector in Austria is presently expanding rapidly. About 30 manufacturers of small-scale pellet furnaces are currently active. An overall number of 21,959 pellet central heating systems with an entire nominal boiler capacity of 404,742 kW have been installed in Austria until the end of 2003. In 2004 15 pellet producers produced 325,000 tons of pellets. For 2005 an increase of the domestic pellets production up to 520,000 tons is forecasted. For 2010 a production capacity of one million tons of pellets is possible. Depending on the oil price a surplus pellets production of 40,000 t to 90,000 tons is forecasted for 2005. In the second half of 2004 the price for pellets was 219 €/ton for small bags (single), 199 €/ton for small bags (on pallet), 167 €/ton for bulk (< 6,000 kg) incl. delivery and 159 €/ton for bulk (> 6,000 kg) incl. delivery. REFERENCES [1] HAHN, B.: European Pellet Centre, 2005. [2] LEITINGER, H.P.: Pellets – halt der Markt was er verspricht?,
Jahreskongress holz 2004. [3] JONAS, A.: Zahlenmäßige Entwicklung der modernen Holz- und
Rindenfeuerungen in Österreich, Gesamtbilanz 1989-2003, NÖ-LLWK, 2004.
[4] OBERNBERGER, I., THEK, G.: The current state of Austrian Pellet boiler technology, BIOS BIOENERGIESYSTEME GMBH, 2002.

Feb. 05Nr.: 1Austrian Biomass Association
The development of the pellets The development of the pellets market and of pellets market and of pellets
technologies in Austriatechnologies in Austria
DI Dr. Horst JauschneggAustrian Biomass Association
22 February 2005
Vth International Slovak Biomass Forum Bratislava

Feb. 05Nr.: 2Austrian Biomass Association
Programme of the Austrian Programme of the Austrian Government to increase RESGovernment to increase RES
coal12,1%
hydro power11,7%
other renewables11,0%
oil42,4%
gas22,8%
Primary energy supply 2001: 1.289 PJ
target: share of RES+ 1 % per year
+ 75% biomassrequires until 2010: +66 PJ
e.g. 1 Mio. solid m³ wood = 7 - 10 PJ
Source: E.V.A.

Feb. 05Nr.: 3Austrian Biomass Association
Source: ÖSTAT
Heating of dwellings in AustriaHeating of dwellings in AustriaSeptember 2002September 2002
wood16,0%
coal2,4%
heating oil27,0%
electricity7,7%
gas29,0%
district heat16,6%
other fuels1,3%

Feb. 05Nr.: 4Austrian Biomass Association
Biomass district heating plants in AustriaBiomass district heating plants in Austria
number heat output in MW kW/1000 inhabitants
843 plants, 1005 MW (31/12/2003)
Source: LLWK-NÖ
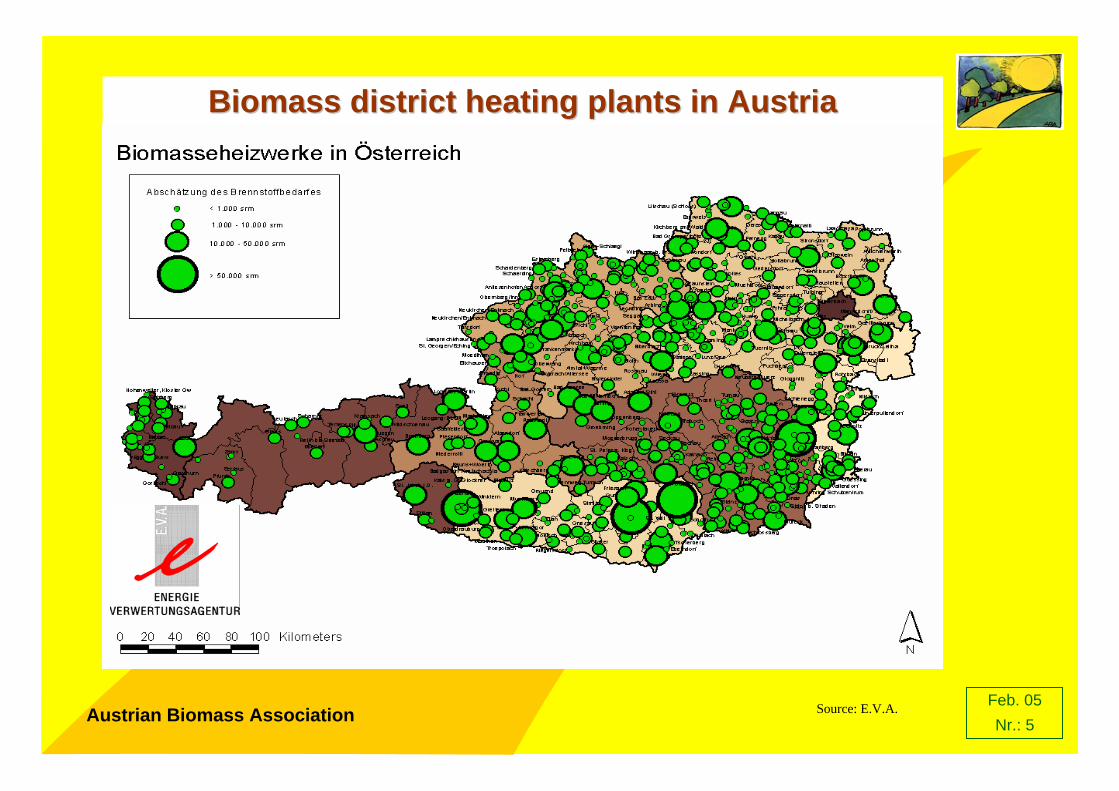
Feb. 05Nr.: 5Austrian Biomass Association
Biomass district heating plants in AustriaBiomass district heating plants in Austria
Source: E.V.A.

Feb. 05Nr.: 6Austrian Biomass Association
BiomassBiomass--CHP plants in AustriaCHP plants in Austria
Source: E.V.A.

Feb. 05Nr.: 7Austrian Biomass Association
Woodchips and pellet heating in AustriaWoodchips and pellet heating in Austriaadditionally installed systems/yearadditionally installed systems/year
49,158 heating systems below 100 kW (1621 MW)• 27,199 woodchip heating systems• 21,959 pellet heating systems
Wood chips Woodpellets
Source: LLWK-NÖ

Feb. 05Nr.: 8Austrian Biomass Association
What are pellets?What are pellets?
• Compacted sawdust and shavings• Diameter 6 mm • Max. 2 % additives, only natural • Unit density: 1.2 kg/dm³• Bulk density: 650 kg/m³• Net calorific value: > 4.9 kWh/kg • Moisture content: max. 10 %• Ash content: max. 0.5 %• Fines before delivery to customer:
max. 1 %
Source: Leitinger
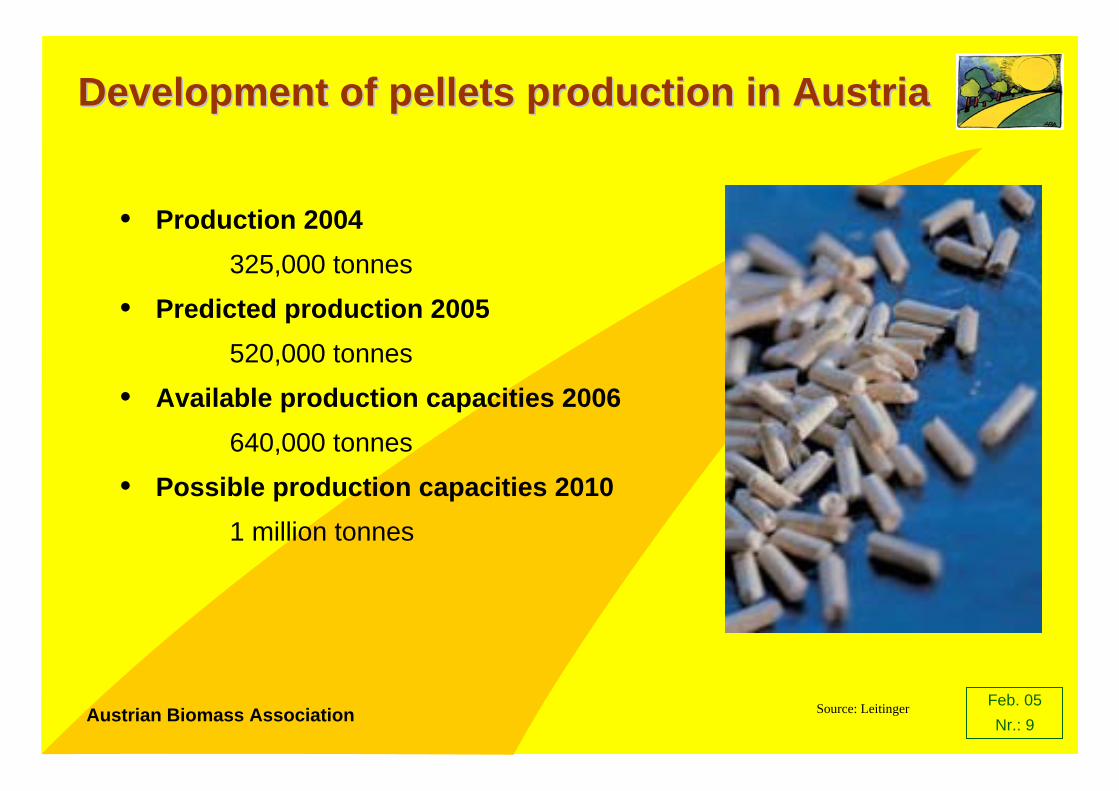
Feb. 05Nr.: 9Austrian Biomass Association
Development of pellets production in AustriaDevelopment of pellets production in Austria
• Production 2004325,000 tonnes
• Predicted production 2005520,000 tonnes
• Available production capacities 2006640,000 tonnes
• Possible production capacities 20101 million tonnes
Source: Leitinger

Feb. 05Nr.: 10Austrian Biomass Association
Development of pellets market 2005Development of pellets market 2005
Oil price Var1 ~ 50USD Var2 ~ 40USD
Domestic market 2004 ~ 210.000 t ~ 210.000 t
Demand new pellet boilers ~ 80.000 t ~ 50.000 t
Domestic market ~ 290.000 t ~ 260.000 t
Domestic production ~ 520.000 t ~ 520.000 t
Export Italy, Germany ~ 190.000 t ~ 170.000 t
Surplus ~ 40.000 t ~ 90.000 t
Source: Leitinger

Feb. 05Nr.: 11Austrian Biomass Association
Price development of wood pellets in Price development of wood pellets in AustriaAustria
159159160170170bulk (>6000 kg) incl. delivery
167170170179180bulk (<6000 kg) incl. delivery
199199200200210Small bags (on pallet)
219219225235235Small bags (single)
€/ton
2004/32004/22004/12003/42003/3
Source: European Pellets Centre

Feb. 05Nr.: 12Austrian Biomass Association
General framework in AustriaGeneral framework in Austria
• Investment subsidies granted in Austria on average 25 % (depending on the Austrian provinces)
• Currently 15 pellet producers active in Austria• Pellet quality regulated by ÖNORM M 7135• Quality of pellet furnaces regulated by ÖNORM EN 303-5• Supply of pellets in Austria assured throughout the
country by a well organised distribution network• About 30 manufacturers of small-scale pellet furnaces in
Austria

Feb. 05Nr.: 13Austrian Biomass Association
Standard for furnaces fired with pellets Standard for furnaces fired with pellets in Austria in Austria –– ÖÖNORM EN 303NORM EN 303--55
• valid for heating boilers with a nominal boiler capacity up to 300 kW• testing required by law• maximum organic carbon (OGC) emission 40 mg/MJNCV
• maximum CO emission 500 mg/MJNCV
• maximum NOx emissions 150 mg/MJNCV
• maximum dust emissions 60 mg/MJNCV
• minimum combustion efficiency– < 10 kW 76 %– 10 – 200 kW (68,3 +7,7 log Pn) %– > 200 kW 86 %

Feb. 05Nr.: 14Austrian Biomass Association
Pellet single stovesPellet single stoves• as warm air stove
- additional heating system• advantages:
- cheap- simple installation
• disadvantages:- filling in the living-room- sometimes noisy ventilators- convection
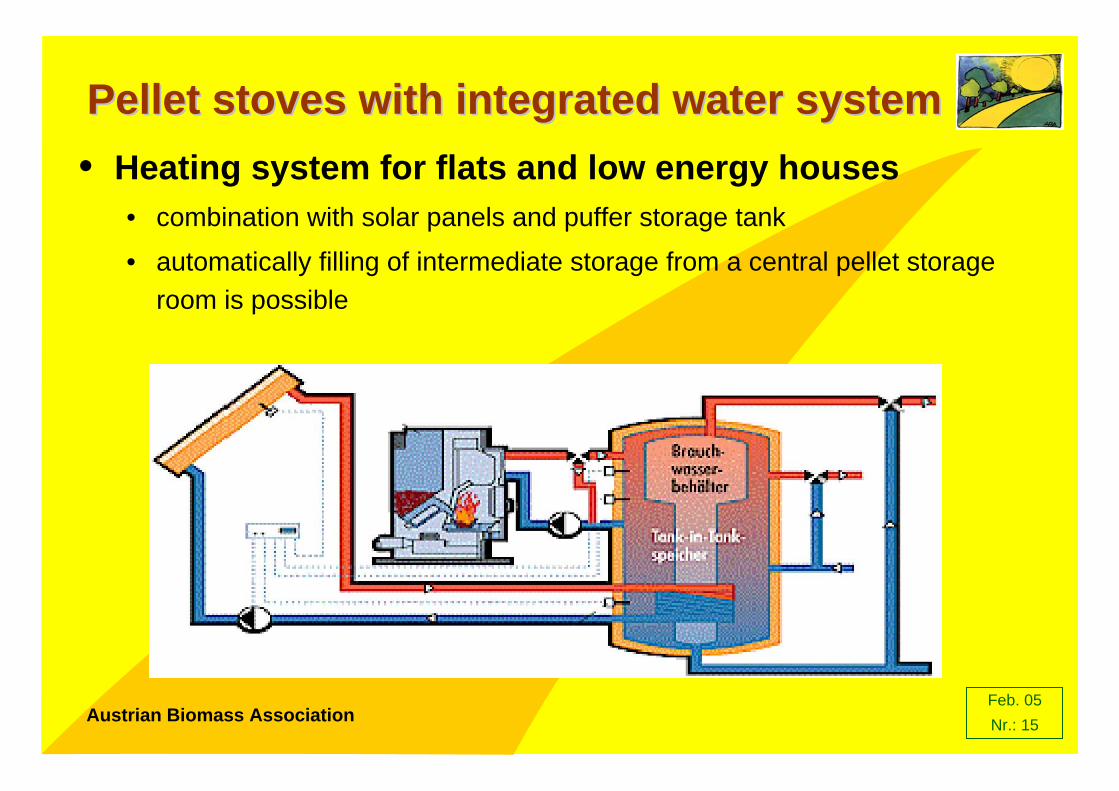
Feb. 05Nr.: 15Austrian Biomass Association
Pellet stoves with integrated water systemPellet stoves with integrated water system• Heating system for flats and low energy houses
• combination with solar panels and puffer storage tank
• automatically filling of intermediate storage from a central pellet storage room is possible
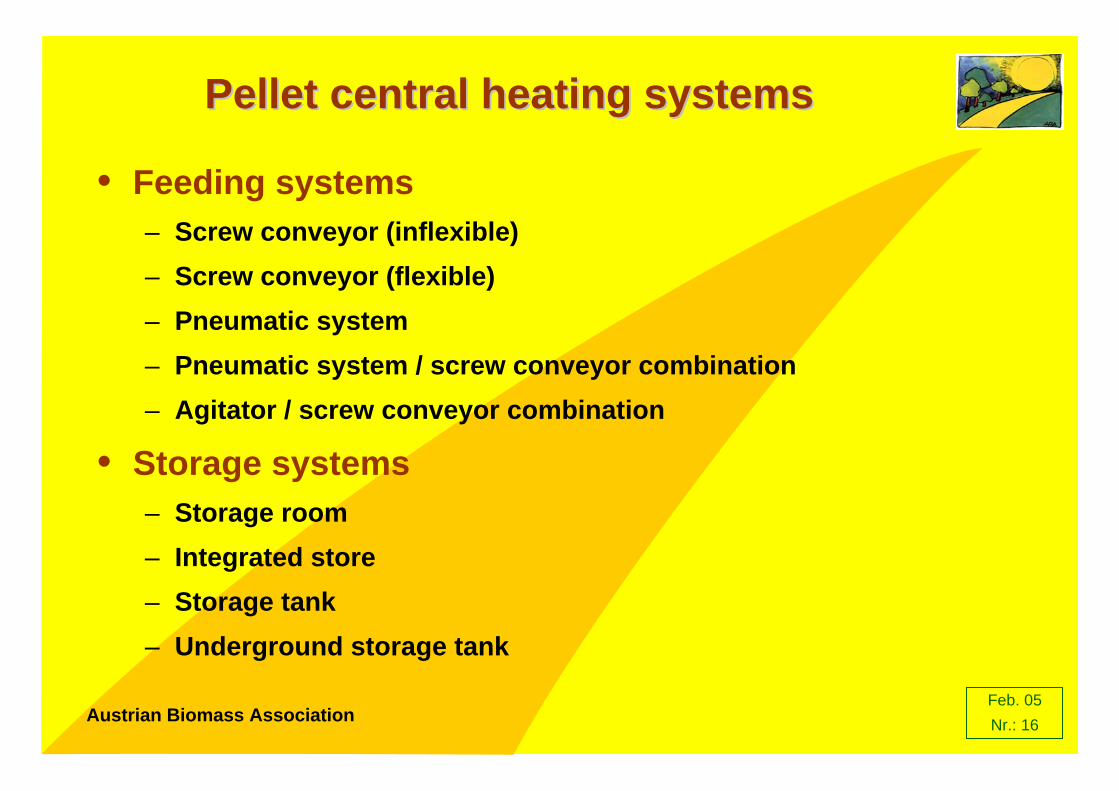
Feb. 05Nr.: 16Austrian Biomass Association
Pellet central heating systemsPellet central heating systems
• Feeding systems– Screw conveyor (inflexible)– Screw conveyor (flexible)– Pneumatic system– Pneumatic system / screw conveyor combination– Agitator / screw conveyor combination
• Storage systems– Storage room– Integrated store– Storage tank– Underground storage tank

Feb. 05Nr.: 17Austrian Biomass Association
Feeding systems Feeding systems –– screw conveyorscrew conveyor
inflexible
flexibleagitator / screw conveyor combination
Source: KWB

Feb. 05Nr.: 18Austrian Biomass Association
pipe up to 20 m
screw conveyor
Pneumatic feeding systemsPneumatic feeding systems
Source: Windhager

Feb. 05Nr.: 19Austrian Biomass Association
Pellet storage roomPellet storage room
rubber mat
Source: KWB

Feb. 05Nr.: 20Austrian Biomass Association
Pellet storage tanksPellet storage tanks
underground
Source: Ökofen

Feb. 05Nr.: 21Austrian Biomass Association
Basic principles of wood pellet burnersBasic principles of wood pellet burners
• Underfed burners• Overfed burners• Horizontally fed burners

Feb. 05Nr.: 22Austrian Biomass Association
BoilersBoilers
• Geometry– Usually vertical fire tube boilers (one or three-pass boilers)
• Boiler Cleaning– Fully automatic by spiral scrapers in the fire tubes– Semi-automatic by spiral scrapers in the fire tubes with a leaver
from the outside– Manually
Automatic boiler cleaning systems increase the efficiency and reduce dust emissions

Feb. 05Nr.: 23Austrian Biomass Association
Underfed burnerUnderfed burner
Fuel supply (stoker screw)
Primary air
Secondary air
Heat exchanger
Boiler with spiral scrapers
Burn-backprotection systemCellular wheel sluice, fireproof valve, fall shaft, extinguisher system
Ash box
Conveying screw
Source: KWB

Feb. 05Nr.: 24Austrian Biomass Association
BurnBurn--back protection systemsback protection systems
Cellular wheel sluice
fireproof valve
Source: Regionalenergie Steiermark

Feb. 05Nr.: 25Austrian Biomass Association
Overfed burnerOverfed burner
fan
spiral scrapers(Semi-automatic)
Heat exchanger
Secondary air
Primary air
Conveying screw
Fall shaft

Feb. 05Nr.: 26Austrian Biomass Association
DeDe--ashingashing systemssystems
• Usually ash collection in an ash box– ash box must be emptied periodically
• Ash compaction systems partly applied– ash box must be emptied periodically in longer periods of time
• Fully automatic de-ashing system by a screw conveyor in an external container– ash box must be emptied only about once a year

Feb. 05Nr.: 27Austrian Biomass Association
Pellet deliveryPellet delivery
Pipes up to 30 m
Fan with filter Storage room

Feb. 05Nr.: 28Austrian Biomass Association
New developmentsNew developments
• Medium-scale combustion systems (nominal boiler capacity up to 500 kW)
• Condensation technology exploits the heat in the combustion gases (recovery of 10 to 20 % of heat energy)
• Reduction of particulate emissions• Utilisation of non-woody biomass fuels• Combination of pellets with solar systems• Small-scale CHP systems (e.g. Stirling engine)
Source: Obernberger

Feb. 05Nr.: 29Austrian Biomass Association
SummarySummary
• Rapidly expanding pellet market in Austria• Several actors, quality standards and subsidies supporting
this development• Proven feeding and combustion technologies available from
many furnace manufacturers which ensure a fully automatic operation
• Low emissions with a decreasing tendency for new furnaces• Several research activities and promising developments
focusing on new fields of application, new biomass fuels and emission reduction
TECHNOLOGIES FOR BIOMASS COMBUSTION Ing. Ladislav Novák Organisation and address, TTS eko, s.r.o. Třebíč, Czech republic Phone: + 420 602 703 615 E-mail: [email protected] ABSTRACT The lecture is focused on presenting of experiences with biomass combustion and its utilization for producing heat and electricity. The author concentrates on presenting practical experiences with use biomass for energy purposes in the town Třebíč.

ARE EUROPEAN MUNICIPALITIES MOVING TOWARDS A GREENER FUTURE?
Martin Cahn Project Manager Energie-Cites Phone: +48 12 272 2850 E-mail: [email protected] ABSTRACT Municipalities are keenly interested in future energy policy, not only because a drive for renewables and energy efficiency implies action at local level, but also because they are directly interested in educating the next generation. This presentation looks at which renewables have been most successfully incorporated in schools, and poses a few questions about how to turn the commitment of local authorities into action. The action of the best is a beacon to others and often has led the mainstream. Most active developments lie with solar energy which is of a scale that permits investment by individual schools. But the scale of development varies from integrated design to small add-on units such as mini wind turbines. Each has a role since schools are first and foremost places of teaching in which simple financial rules may not be the determining factors.

Bratislava, 21st February 2005
Martin CahnEnergie-Cités
Are European Municipalites moving towards a Greener Future? :

Municipalities mould the new generation
Education of our young is a
local authority responsibility
We can develop attitudes to
shape our future

Energie-Cités
The European municipalassociation that
promotes sustainableenergy policy at local
level
Directly or indirectly involving more than 400 municipalities from 25 countries

SchooBIE-DO
Project under Intelligent Energy for Europe –ALTENER led by Energie-Cités
Appraising opportunities for energy efficiency and renewable energy in schools
Partners in Poland, Romania and Ireland
Reviewing policy of others
Schools have already been pioneers of renewable energy ideas

What renewables are used in Schools?
SolarWind
GeothermalBiomass
Passive solar design

An Honourable Tradition
St George’s School, Wallasey
Designed by Emslie Morgan
in 1962
Large scale use of passive solar design
No heating for 16 years

An Honourable Tradition
Wind turbine pioneerPoul de la Cour Building wind
turbines to generate
electricity in Denmark in
the 1890s
At Askov Folk High School: Wind was on his curriculum

Solar
•Popular in many countries•Visible demonstration of commitment•Especially PV units•Often primarily demonstration –
energy contribution small•Some new ideas

Solar Thermal
Modern solar collectors on a state of the art schoolKingsmead, Cheshire
Parents and children worked together to install solar heating in this school
swimming pool
Hagbourne, Oxfordshire
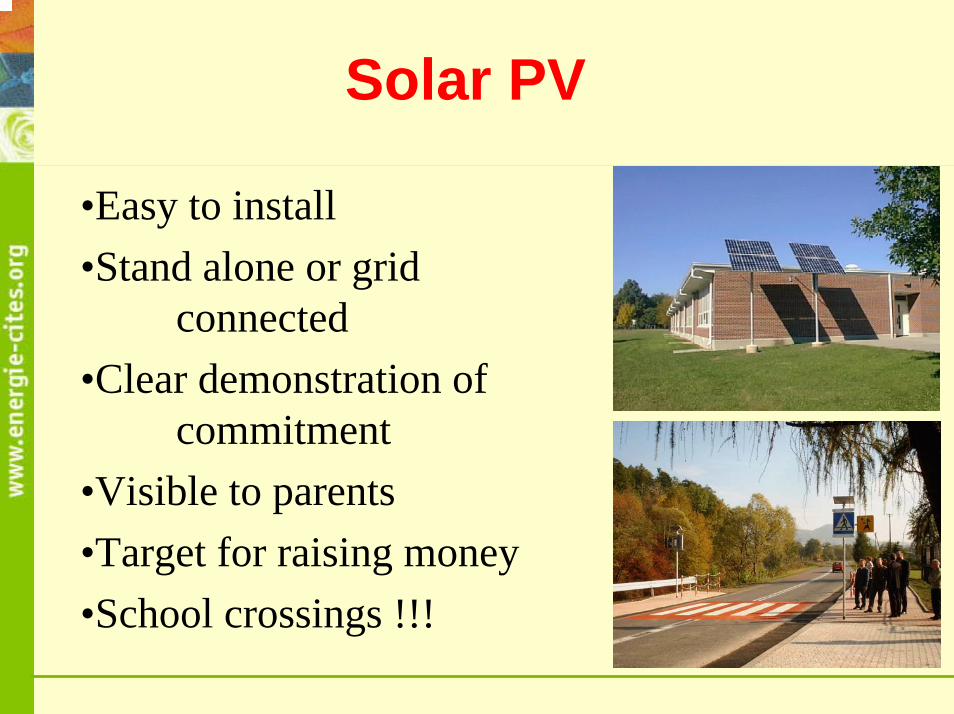
Solar PV
•Easy to install•Stand alone or grid
connected•Clear demonstration of
commitment•Visible to parents•Target for raising money•School crossings !!!

Solar Air Collectors
Durham County CouncilPioneer in 1982
Transpired Solar collectors
Cheap – payback can be 3-4 years
Cold and sunny
Can combine with PV
Units available for €400
Northern Canada
Ushaw Moor
Maine

Wind• Highly visible form of renewables• Most economic form of renewables for
electricity – may raise funds for school• Can be small or very big units

Wind turbines
Thinking BIGInvesting
Raising funds
Spirit Lake, IowaEuropean Style –
Liniclate, Benbecula
60 kW
Kid-Size
Collydean
Fife
2.5kWUS Style
Carlton College
1.65 MW

Geothermal
Philip, SouthDakota
Not many schools have their own borehole!
Ground Source Heat Pumps are booming – over 1500 systems in US schools
Best with warm air and air conditioning
Also in Atlantic ClimateVancouver,
Canada80% of heat demand, 30% of load.
Great economies

Geothermal in Europe
Dickleburgh – installed in 1985
Gaelscoil an Eiscir Riada Tullamore, IRL
Only 20% of energy of traditional school
Ground Source Heat PumpNo CO2 emissions –
green power.
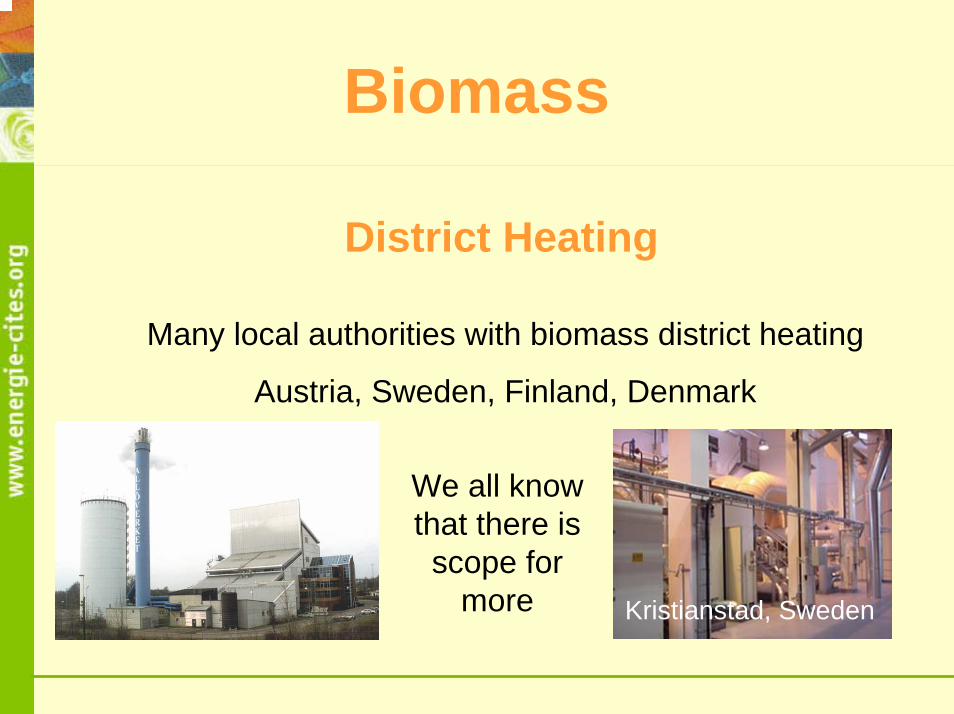
Biomass
District Heating
Many local authorities with biomass district heating
Austria, Sweden, Finland, Denmark
Kristianstad, Sweden
We all know that there is scope for
more

Biomass
Individual BoilersLogwood
• If one has staff available to stoke the boiler• With large cordwood the boiler only needs
charging infrequently.
Bielawa Poland

Wood chips or Pellets?
Weobley UK
Chips
large storage needed,
but cheap
Pellets
Get rid of waste
More compact
Can convert coal boilers
DurhamUK
Durham UK

Clip on biomass
Containerised units
All included – just connect up
Shenstone School UK

Integrated programmes
Zilina Slovakia
New pellet plant
12000 ton output
44 schools to be converted to biomass
Some use for district heating

Integrated Schools
Gaelscoil in Tullamore has• passive solar design, • natural lighting,• CO2 neutral operation• Reuse of rainwater etc.
Biomass boiler for 70% of demand
Solar water, solar electricity
Passive solar design

So are are municipalities developing a Green future?
• Widespread interest in the environment
• Pilot projects for renewables
• Many local authorities buy Green electricity for their buildings – UK, Netherlands, Germany etc.
• But still capital costs are a major constraint

Changing attitudes is vital
We need to develop the attitudes we teach our young in our municipalities themselves
•Standards for renewables and energy efficiency in planning and procurement
• Renewables requirements
•Purchasing green electricity
•Carbon free developments
•Distributed generation and cogeneration

Some new ideas, new management
•Choice in the heat market?
•Gasification of biomass
•Promotion of anaerobic digesters
•Small community heating systems
•Pellets from straw
•Grain for fuel

Energie-Cités:Secretariat :2, chemin de PalenteF - 25000 BesançonTel : +33 3.81.65.36.80Fax : +33 3.81.50.73.51E-mail : [email protected]
Brussels’ Office :157 Avenue BrugmannB - 1190 BruxellesTel : +32 2.544.09.21Fax : +32 2.544.15.81E-mail : [email protected]
www.energie-cites.org
BIOMASS CHP PLANT GÜSSING:
RELIABLE SOLUTION FOR FOSSIL FREE MUNICIPALITY C. Aichernig – REPOTEC GmbH, Güssing (A) H. Hofbauer, R. Rauch – TU Vienna, Inst. f. Process Engineering R. Koch – Biomassekraftwerk Güssing GmbH & Co. KG, Güssing
Abstract The start up of the biomass gasification CHP plant in 2002 marked the last step of the small Austrian town of Güssing towards the supply with 100 % biomass based renewable energy. Furthermore a sustainable process of regional development has been set into force, which turned this former poor region into a prospering European centre of renewable energy. Reaching an electric efficiency of 25 % and a total efficiency of 80 %, the process of steam blown gasification and gas utilisation in an engine enables economic operation even in small plants. For more than 11.000 operating hours the system could prove its reliability. Due to the favourable characteristics of the product gas research projects beyond electricity production were already started. Corresponding address: Christian Aichernig REPOTEC - Renewable Power Technologies Umwelttechnik GmbH Nordbahnstraße 36/3/2.5 A-1020 Wien, Austria Phone:++43 1 2161895 502 Fax:++43 1 2161895 15 Mobile:++43 664 2048369 mailto:[email protected]
http://www.repotec.at

Biomass CHP Plant Güssing:
Reliable Solution for Fossil Free Municipality C. Aichernig – REPOTEC GmbH, Güssing (A) H. Hofbauer, R. Rauch – TU Vienna, Inst. f. Process Engineering R. Koch – Biomassekraftwerk Güssing GmbH & Co. KG, Güssing
1. Güssing: European Centre of Renewable Energy The town of Güssing, situated in the south – easterly corner of Austria, was one of the poorest regions of the country, marked by high unemployment and migration. In the year 1991 the community of Güssing set up a new energy concept, which included the coverage of the total energy demand by local biomass. Since that time this concept has been consequently implemented. Therefore a bio diesel plant and a district heating system, based on biomass, were installed. 95% of the heat demand and more than 100% of the fuels, which are needed in the region, are now produced from renewables. As a result of these efforts in the area of renewables, a “European Centre for Renewable Energy” was established in Guessing. The latest plant of this successful row was a biomass fuelled CHP plant, based on a steam blown gasifier, producing heat and power with a gas engine, with the capacity to cover the total electricity demand in Guessing. Since the start up of this plant Guessing has totally changed the energy supply to renewable sources.
0
10
20
30
40
50
60
70
80
90
100
World EU Austria Güssing
Ren
ewab
le %
Figure 1: Renewable Share of Total Energy Consumtion Furthermore a sustainable process of regional development has been set into force, which turned this former poor region into a prospering centre of renewable energy.
http://www.repotec.at

2. Process Description A new type of power plant was specially designed for the production of electricity at small, decentralized sites. A gasification process, which has explicit advantages over combustion at combined heat and power (CHP) applications, has been utilized. 1.760kg of wood per hour produce 2.000kW electricity and 4.500kW district heat. Steam Gasification: As gasification technology a steam blown fluidised bed gasifier is used, which produces a nitrogen free gas with a high calorific value (12 MJ/Nm3) and a low of tar content. The heart of the plant, the fluidized bed steam gasifier, consists of two connected fluidized bed systems. In the gasification zone at approximately 850°C the biomass is being gasified with steam. By utilizing steam instead of air as gasifying agent a nitrogen free product gas with a low tar content and a high heating value is produced. When gasifying the biomass three major reactions take place: C + H2O → CO + H2 C + CO2 → 2CO C + ½ O2 → CO The produced gas consists of the following components: H2O, CO, H2, CO2, CH4 Besides that a low quantity of by-products (e.g. C2H4, C2H6) and impurities (e.g. tar, NH3, H2S). To keep the energy balance for the gasification process additional heat has to be fed into the gasifier. Not completely gasified carbon (charcoal) is partly fed into the combustion zone together with the circulating bed material, which serves as a heat carrier, and is burned. The exothermic reaction in the combustion zone provides the energy for the endothermic gasification with steam. Two seperated gas streams are produced: a flue gas stream, comparable to flue gases from a conventional combustion and the product gas stream. The containing heat of the two gas streams is used for the production of district heat.
steam air
biomass
gasification
producer gas flue gas
char coal
heat
combustion
Figure 2: principle of the gasification
http://www.repotec.at

Gas Cooling and Cleaning: When applying a gas engine it is necessary to cool down and clean the product gas. The heat thereby incurred is used for the production of district heat. A gas cooling and a two stage gas cleaning system makes sure that the gas engine gets a proper gas. The gas is dedusted in a fabric filter. The separated dust is recycled to the combustion chamber to utilize the contained carbon. In the following scrubber the concentrations of tar, ammonia and acid gas impurities are reduced. As the gas is further cooled water and tars are condensed. The condensing water is utilized to produce the steam for the gasification process. In this way all residues can be recycled. Therefore, the gas cleaning process works free of residues and waste water or condensates.
Figure 3: Process flow diagramm Gas Engine: The gas engine converts the chemically energy of the product gas into electricity. It is a turbo-charged “Otto”-type engine from GE Jenbacher which had been specially adapted to the properties of the producer gas. The flue gas of the gas engine is catalytically oxidised to reduce the CO emissions. The dissipated heat of the engine is used for district heating. Thus, efficiencies are achieved which were unreached in biomass usage until now. The electrical efficiency is app. 25 %. The total efficiency (electricity and heat) even obtains 80%. The plant has a fuel capacity of app. 8 MW and produces 2 MW of electricity and 4,5 MW of district heat, which is fed into the heating grid. The total investment for the plant was app. 9 million €.
Table 1: characteristic data of Biomass-CHP
Start of errection September 2000 Start up November 2001 Fuel: wood chips Fuel Power 8000 kW Electrical output 2000 kW Thermal output 4500 kW Electrical efficiency 25,0 % Thermal efficiency 56,3 % Total efficiency 81,3 %
http://www.repotec.at

3. Operation Results After roughly two years of operation the plant has fulfilled all the expectations. It worked well for over 11.000 hours, shows a very constant and stable operation and fulfils the entire requirements from the authorities. From the very first moment the constancy of the gas composition and heating value were impressive. The insensibility on the water content of the fuel, which is a major advantage of the steam gasification enables a stable composition.
0
5
10
15
20
25
30
35
40
45
50
9.3.2002 10.3.2002 11.3.2002 12.3.2002 13.3.2002 14.3.2002 15.3.2002 16.3.2002 17.3.2002
conc
entr
atio
n [v
ol%
dry
]
0,0
1,0
2,0
3,0
4,0
5,0
6,0
7,0
8,0
9,0
10,0
11,0
12,0
13,0
heat
ing
valu
e [M
J/N
m³]
CO2 CO CH4 N2 H2 heating value
Figure 4: Producer gas composition The gas cleaning process has proven to be reliable and fail-safe. Even after 8.000 hours of operation no deposits inside the engine could be found. The maintenance costs of the engine are in the range of natural gas fuelled gas engines. By producing large quantities of heat and electricity the full commercial operation of the plant could be proven. As all residues from the cleaning of the producer gas are recycled the plant works without any effluent and completely burned fly ashes are the only residue.
Figure 4: Photo of the plant
http://www.repotec.at

4. Economy From the very beginning the aim of the project was the sustainable supply of electricity for the town of Güssing. Compared to an ordinary research plant, which is operated only during certain test runs, it is necessary, that this plant can be operated without running subsidies. The revenues, which originate from the sales of electricity (75%) and heat (25%) have to cover the expenses, mainly for the fuel and the repayment instalment. Except for national and EU investment grants, which seem to be justifiable for the first realisation of a very efficient renewable power plant process, the plant can completely cover its expenses. The Austrian “Ökostromgesetz”, a law which guarantees the feed in tariffs for renewable electricity provides the basis. By utilisation of the potential of optimisation, which still can be seen for the plant, this favourable situation will even improve during the next years.
5. Further R&D Works The favourable characteristics of the product gas (low nitrogen content, high hydrogen content) make it a preferred source for high sophisticated gas usage. Research projects concerning the production of SNG (synthetic natural gas), Fischer-Tropsch Diesel and electricity in a SOFC (solid oxide fuel cell) have been started. Fischer Tropsch Synthesis: Within the EC-project RENEW (Renewable Fuels for Advanced Power Trains) in the 6th Framework programme a bypass flow of about 10Nm³/h will be converted via Fischer-Tropsch synthesis into diesel. The gas will be taken after the existing gas treatment, compressed to 20-25bar, cleaned from sulphur and chlorine components and converted in a slurry reactor to waxes. From these waxes the diesel will be produced via hydrotreating. The FT-reactor should be finished till end of 2004 and in spring 2005 first results are expected. Methanation: This work is done partly under the EC-project RENEW and partly financed by national funds from Switzerland and Austria. The work is done in co-operation with the Paul-Scherrer Institute from Switzerland. A test rig for methanation was designed to perform experiments in a 2 kW scale. The tendency of catalysts towards coking was tested at PSI with model compounds of light biomass gasification tars. The most promising catalyst then was used in an experiment with a slip stream of the FICFB gasifier in Guessing during summer 2003. After more than 120 h on stream the catalyst still showed an outstanding performance. Under the heaviest conditions more than 98% CO-conversion and 99% tar-conversion to methane was achieved. The chemical efficiency of the process is depending strongly on the load of tars in the syngas; 83% for “tar-free” syngas and 85% for “tar-loaded” syngas. Based on these results from the experiments the next step is to run long term experiments of more than 1000 h under pressurized operation conditions at the Güssing plant.
http://www.repotec.at

SOFC: This work is performed together with the Austrian Bioenergy Center and with the Department of Energy and Process Engineering, NTNU in Trondheim. Coupling of a solid oxide fuel cell (SOFC) with a biomass gasifier gives electric efficiencies up to 43% and overall efficiencies of more than 80%. These high efficiencies can only be reached, if the gas cleaning is done at high temperatures. Therefore the work programme focuses also on the removal of dust, chlorine and sulphur components in a temperature area of 500-800°C. At the moment fundamental research is going on, first tests can be expected in early 2005.
6. Conclusion The start up of the biomass gasification CHP plant in 2002 marked the last step of Güssing towards the supply with 100 % biomass based renewable energy. Furthermore a sustainable process of regional development has been set into force, which turned this former poor region into a prospering centre of renewable energy. Reaching an electric efficiency of 25 % and a total efficiency of 80 %, the process of steam blown gasification and gas utilisation in an engine enables economic operation even in small plants. For more than 11.000 operating hours the system could prove its reliability. Due to the favourable characteristics of the product gas research projects beyond electricity production were started. First results were achieved with the methanation of product gas to produce synthetic natural gas (SNG), first results from other R & D projects can be expected during 2005.
7. Acknowledgements The authors would like to thank the collaborators of the research network RENET Austria, and the Austrian ministry of economy and labour and the federal states of Niederösterreich and Burgenland for their financial support. Corresponding address: Christian Aichernig REPOTEC - Renewable Power Technologies Umwelttechnik GmbH Nordbahnstraße 36/3/2.5 A-1020 Wien, Austria Phone:++43 1 2161895 502 Fax:++43 1 2161895 15 Mobile:++43 664 2048369 mailto:[email protected]
http://www.repotec.at

REALISATION OF BIOMASS PROJECTS IN ZLÍN REGION Miroslava Knotková Project manager Zlín region Tř.Tomáše Beti 21,761 90 Zlín, Czech Republic Phone: +420 577 043 442,+420 606 803 406 E-mail: [email protected] ABSTRACT: The Zlin region which neighbours with the Slovak republic abounds in biomass suitable for energetic utilization. On the example of four municipal boiler houses we would like to point out that above-ground biomass burning not only contributes to environmental improvement but it promotes employment and municipal development as well. Also entrepreneurs can reduce their operating costs by biomass burning. Our examples also prove that biomass burning is feasible in the city centre and, moreover, above-ground biomass can be utilized for central heating of spa houses and farm, for example. 1. Bohuslavice Nursery and Primary school, 1997 Heat source: hot water boiler VERNER-Golem 350 kWt Fuel: wood chips (147 tons/year) 2. Hostětín Heat source: hot water boiler KARA (The Netherlands) 732 kWt District heating network: 2 500 m Fuel: wood chips (600 tons/year) Connected: 67 houses (83 %)
700 visitors annually information and educational centre to be build
Joined financing from home and foreign sources Pilot project Activities Implemented Jointly
• annual savings 1.450 t CO2 3. Slavičín- reconstruction of communal heating system in Slavicin biomass boiler installation reconstruction of heating grid 34 heat exchangers (100 - 390 kW), monitoring Heat source: biomass boiler KOHLBACH K8, capacity 1,6 MW Fuel: bark and wood chips (14000 m³/year), sawdust (2 150 m³/year)

4. Roštín, communal heating system 3/2002 Heat source: hot water boiler (The Denmark) - 4 MWt Fuel: straw (1200 tons/year) District heating network: 8 300 m, Connected: 164 houses and 6 municipality building 5. Koryčany - central heating of furniture factory KORYNA,10/1999 Heat source: biomass boiler VYNCKE,capacity 6 MW Fuel: wood chips and sawdust (8 000 m³/year) 6. Kostelec u Zlína - central heating of spa houses Heat source: boiler Mephisto 300 kWt Fuel: sawdust (450 tons/year) 7. Štítná nad Vláří Javorník CZ, s.r.o. - central heating
agricultural farm with processing (bakery, saw mill) bad state of heating system, problem with wood residues from processing further prepared projects (herbs and fruit drying)
Heat source: two boilers HAMONT KWB,total output 0,72 MW Fuel: mixture of wood residues and straw (rape). Summary: - an absence of high quality project engineer - an absence of experiences and technologies in utilization of biomass - the development of the gas net - an absence of technologies for manipulation with waste biomass after timber
production - insufficient dissemination of information REFERENCES [1] Text and foto : Archive Region Energy Agency KEA - Region Zlín, 2004

REGION ZLREGION ZLÍÍNN
Realisation of Biomass projects in Zlín Region,
Czech Republic
ISBF, Bratislava 22.February 2005

REGION ZLREGION ZLÍÍNN

REGION ZLREGION ZLÍÍNNDensityDensity od od forestforest landland

REGION ZLREGION ZLÍÍNN•share of renewables is 5% of primary energy sources•biomass prevails (90%)
Štítná
Kostelec

REGION ZLREGION ZLÍÍNNBohuslavice Bohuslavice –– NurseryNursery andand PrimaryPrimary schoolschool,1997 ,1997
Heat source: hot water boiler VERNER-Golem 350 kWtFuel: wood chips (147 tons/year)

REGION ZLREGION ZLÍÍNN
fuel storage
heat distribution for more objects in the school
BohuslaviceBohuslavice

REGION ZLREGION ZLÍÍNNHostHostěěttíínn -- historyhistory
1993 preparation phase (biomass use study) 1996 questionnaire done by municipality to find out local inhabitant's opinion of
biomass boiler1997 fundraising first solar panels1998 information campaign and excursion to Kautzen (Austria)1999 common Czech – Dutch project for municipal biomass heating plant in
Hostetin2000 biomass boiler started
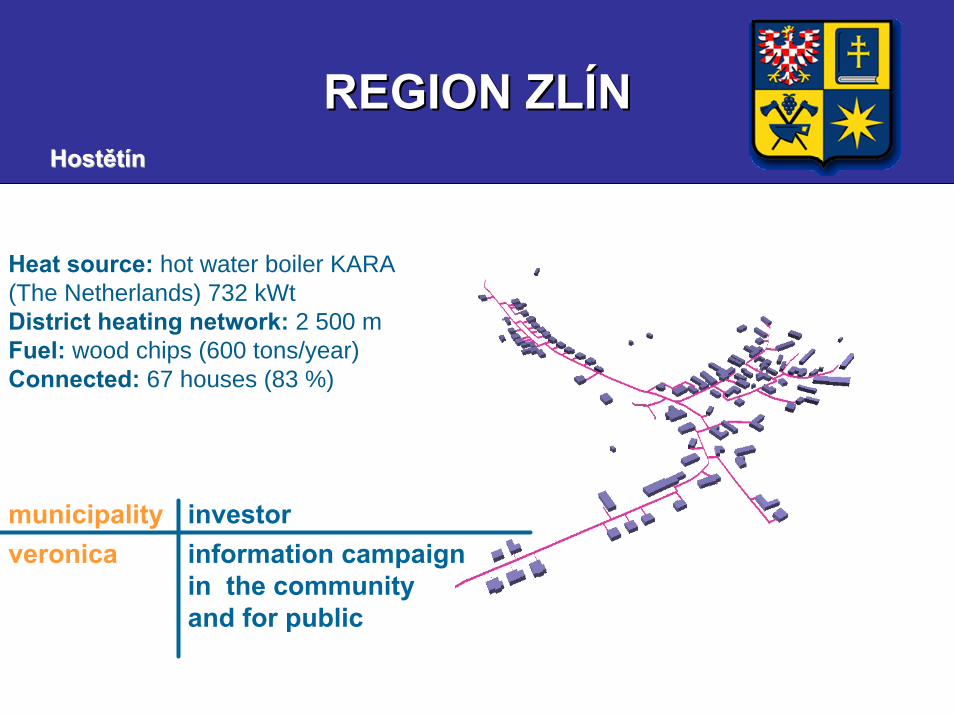
REGION ZLREGION ZLÍÍNNHostHostěěttíínn
municipality investorveronica information campaign
in the communityand for public
Heat source: hot water boiler KARA (The Netherlands) 732 kWtDistrict heating network: 2 500 mFuel: wood chips (600 tons/year)Connected: 67 houses (83 %)

REGION ZLREGION ZLÍÍNN
Boiler is operated by automatic control system supervised by operators.
Boiler operation is monitored by personal computer
Control system enables remote control and management.
municipal biomass boilermunicipal biomass boilerschschemeeme of boiler houseof boiler house
HostHostěěttíínn

REGION ZLREGION ZLÍÍNNHostHostěěttíínn
•joined financing from home and foreign sources
SENTER – Dutch governmentState Environmental FundCzech Energy Agencymunicipality of Hostetin ,Region Uherské HradištěJMP,a.s. Brno and inhabitants of Hostetin•pilot project ActivitiesImplemented Jointly•annual savings 1.450 t CO2
700 visitors annuallyinformation and educational centre to be build

REGION ZLREGION ZLÍÍNN
Sustainable projects realized in last 10 years:• water• energy• landscape• ecological buildings
1 town hall2 biomass heating plant3 juice plant4 reed bed treatment plant5 drying kiln6 information centre – plan
solar panels
43
5
6
1
2
HostHostěěttíínn

REGION ZLREGION ZLÍÍNN
juice plant
ecological buildingssolar panels
reed bed treatment plant
HostHostěěttíínn

REGION ZLREGION ZLÍÍNNSlaviSlaviččíínn
Heat source: biomass boiler KOHLBACH K8, capacity 1,6 MWFuel: bark and wood chips (14000m³/year),sawdust (2 150 m³/year)

REGION ZLREGION ZLÍÍNNSlaviSlaviččíínn
district heating management:optimal operation of biomass boiler, cogeneration unit and gas boilers

REGION ZLREGION ZLÍÍNN
Heat source: hot water boiler - The Danish technology - 4 MWtFuel: straw (1200 tons/year)District heating network: 8 500 m, Connected: 170 houses
RoRoššttíínn, , communal heating systemcommunal heating system 3/20023/2002

REGION ZLREGION ZLÍÍNNRoRoššttíínn
optimal operation of biomass boiler

REGION ZLREGION ZLÍÍNNRoRoššttíínn
supply of fuel

REGION ZLREGION ZLÍÍNNKoryKoryččanyany
KORYNA KORYNA furniturefurniture factoryfactory,10/1999,10/1999Heat source: biomass boiler VYNCKE,capacity 6 MWFuel: wood chips and sawdust(8 000 m³/year)

REGION ZLREGION ZLÍÍNN
control centre
KoryKoryččanyany

Kostelec u ZlKostelec u Zlíínana
Hotel Hotel -- SpaSpa

REGION ZLREGION ZLÍÍNNKostelec u ZlKostelec u Zlíínana
Heat source: boiler Mephisto 300 kWtFuel: sawdust (450 tons/year)

REGION ZLREGION ZLÍÍNNŠŠttíítntnáá nad nad VlVláářříí
JavornJavorníík CZ, s.r.o.k CZ, s.r.o.agricultural farm with processing (bakery, saw mill)
bad state of heating system, problem with wood residues from processing
further prepared projects (herbs and fruit drying)

REGION ZLREGION ZLÍÍNNŠŠttíítntnáá nad nad VlVláářříí
two boilers HAMONT KWBtotal output 0,72 MW

REGION ZLREGION ZLÍÍNNŠŠttíítntnáá nad nad VlVláářříí
mixture of wood residues and straw (rape)

REGION ZLREGION ZLÍÍNNŠŠttíítntnáá nad nad VlVláářříí
heat distribution for more objectsin the company
fuel storage

MUNICIPAL BIOMASS PROJECTS IN POLAND SELECTED PROBLEMS AND EXAMPLES
Adam Gula Professor Arthur Wyrwa Researcher AGH-University of Science and Technology Al. Mickiewicza 30, 30-059 Krakow, Poland Tel. +48-12-6173428 [email protected] [email protected] ABSTRACT The general framework for the development of the biomass sector in Poland is described. Several barriers are listed and discussed with the focus put on small-scale biomass use for space heating. The main barrier is the lack of investments funds. It is pointed out that this barrier can be overcome by a combined approach of financial support and effect of scale. It is argued that energy planning, which in Poland is delegated by law to the lowest administration unit (NUTS5) is not optimal as far as biomass is concerned and should be rather shifted to the NUTS3 level. It is also argued that research targeted at optimisation of the use of the available biomass potential is lacking and needed. In this context a joint project of four Krakow universities is briefly described. INTRODUCTION
With the transition to a market economy and withdrawal of most of the subsidies, the energy prices increased in Poland by nearly an order of magnitude [1]. In early 90-ties most of the energy intensive industries drastically reduced their production or closed their facilities; other increased their energy efficiency. As a result the energy intensity of Poland’s economy improved significantly [2]. The economic necessity has lead to increased energy awareness and development of businesses offering services such as thermal insulation of buildings. Other instruments (legal, financial support), however important, seem to have played a rather secondary or supplementary role [3]. The situation is different as regards Renewable Energy Sources. Economic motivation without additional financial support (state or external) has turned out to be not sufficient. The driving factors of the development of RES have been Poland’s international obligations, in particular the Kyoto Protocol, which was signed in 1998 and ratified in 2002. The GHG emissions reduction commitment - as trends indicate - is likely to be achieved or even exceeded [4]. The main legal framework for RES is the Development Strategy of Renewable Energy Sources, adopted by the Polish Parliament in 2001. The Strategy sets goals to increase the RES share in Poland’s primary energy balance from the present ca. 2.5% to 7.5% in 2010 and 14% in 2020. The goal is ambitious and achieving it will

not be easy. Poland is predominantly a flat country with little hydro-energy potential. The same applies to wind with the exception of the Baltic coast or offshore sites. Geothermal potential is significant, but investment costs prevent any fast progress in this area in the foreseeable future. Solar potential is moderate, typical for this geographic latitude. The dominant RES is biomass, which will constitute up to ca 85% in the RES mix in Poland in short and medium term [5]. Therefore, it is of primary importance to identify and overcome the existing barriers and enhance the mechanisms supporting the development of the biomass sector. These are briefly discussed below. BARRIERS The investment cost constitutes the main barrier to a wider use of biomass for energy production. This barrier is relatively well addressed by the existing domestic grant and soft loan schemes. Still, huge biomass potential remains untapped due to the lack of capital. Over the past decade the main sources of financial support have been the National Fund for Environmental Protection (NFOS) and its 17 regional (voivodship) fees and penalties paid by industrial enterprises operating in Poland. Both subsidies and soft loans are granted, the latter channeled largely by the Bank of Environmental Protection (BOS). In 1989-2000, NFOS alone disbursed 710 million USD1 in support to air pollution reduction measures (SO2, NOX, particulates, efficiency) [6]. Disaggregated data for biomass are not available, however, the funding was very substantial and has been increasing over the past few years. The other important source is ECOFUND, which distributes the debt-for-nature swap money (eco-conversion of Poland’s debt to the Paris Club). The policies of these funding sources differ in details, however; support is given primarily to public institutions (municipalities in particular). For example, ECOFUND supports projects only by grants in the implementation stage, i.e. it does not provide finance for project preparation or documentation. During the 10 years of its activity (1992-2002) ECOFUND distributed nearly 230 mln USD in environmental protection projects, which generated projects’ total of 1250 mln USD [7]. In recent years increasing emphasis is put on biomass projects. In 2002 alone 14-biomass boiler plants and other biomass-related investments were supported at the average level of ca. 35%, which constituted nearly half of the 32 mln USD dedicated to RES as a whole. One should mention, however, that the aforementioned schemes included initially also a substantial support for conversion from coal to gas or oil in space heating, with the aim to decrease local air pollution from individual inefficient coal stoves. Such support was, no doubt, justified in urban areas. Unfortunately, it was also often used to build gas grids in areas with scattered settlement structure. From the environmental perspective this support has been rather counterproductive, as in those mostly rural areas the biomass potential is usually sufficient to replace large fraction of coal used for heating. Moreover, the ability of the individual investor to finance the gas or oil installation, often did not match his ability to pay high bills for the new fuel, as the prices of these carriers increased significantly afterwards. Consequently, many people who had not dismantled their coal stoves (old, inefficient and polluting) started using them again as their primary heat source. In some cases, alas rarely, gas or oil boilers have later on been replaced by biomass ones. One could expect many more such “reverse” fuel conversions, would ECOFUND or the
1 Throughout this paper we use the approximate average exchange rate 1USD = 4PLN

NFOS/WFOS have included them in their support portfolios. Unfortunately this is not the case. Another tool to address the cost barrier is the effect of scale. Considering the structure of the agricultural sector in Poland, where small and medium-size farms dominate, there exists a huge market for biomass boilers of low-to-medium capacity (25-300 kW) for straw or wood in various forms (chips, forest residues, willow from energy plantations, etc). The estimates give a potential of ca. 400 000 units that could be installed countrywide. The first pilot project of this kind has been developed by one of the co-authors (KT) in the commune of Trzcianne in northeastern Poland, where 41 small individual boilers and 3 larger ones have been installed in a single project. The success was due to the combination of two factors: effect of scale and financial support. The support to the hardware component was given by NFOS and the regional WFOS in Bialystok while Small Grants Program of the Global Environment Facility (GEF) contributed to the design of the project. Replication of the project is presently under development in southern Poland in the Krakow area. While in Trzcianne the fuel was wood in the other project it will be post-harvest straw. It should be noted that in both cases the biomass fuel for thee boilers will be locally produced (mostly auto-produced). This will lower the energy bills of the users and create local jobs as installation and maintenance is left to local companies. If the “400000 program” is launched countrywide, jobs will be also created at the national level as the boiler manufacturers and the related industries (e.g. metallurgical) will face an increased demand. Local energy planning is another essential barrier to a wider and optimal use of biomass as an energy resource. The Polish Energy Act or 1997, which delegates the development of local energy plans for heat, electricity and gas supplies to the basic territorial units, gmina (NUTS5). Due to its local character biomass presents there very often an important alternative as an energy source, and its use may potentially have a significant impact on the social, economic and spatial development of the municipality. According to the Energy Act, the regional governor reviews the compliance of local energy development plans with the national energy policy. Additionally, regional (NUTS2) government should assess co-ordination with the plans of other municipalities in the region. However, in case of RES or DSM this co-ordination does not exist in practice. Moreover, even if it were attempted, this level would not be relevant to the biomass role in energy supplies, as in such small units the biomass potential cannot be effectively optimised. Very often re-allocation of surplus biomass from biomass rich area to the communes where the demand is higher than the existing potential would be much more cost-effective. Therefore, the effective solution would be to bring the energy planning to a NUTS3 level (a county or a group of counties), as the Polish voivodeships (NUTS2) are territorially too large and inhomogeneous in this respect. THE AKCENT INITIATIVE Another barrier to an optimal use of the potentially available biomass resources is lack of funding for related research and pilot projects. A particular example is the recent explosion of interest in plantations of fast rotation willow. This may often lead to freezing for up to 30 years (lifetime of the willow plantation) the money that could be put into planting more efficient energy species. The stranded costs can be huge countrywide. Without research that would indicate the optimal solutions, the decisions
of the investors can hardly be optimal. Therefore, support to decision-making, based on research analysis of local conditions is very needed. In view of the scarcity of research funds, four Krakow universities, representing technical, agricultural and fundamental sciences, decided to form a consortium to jointly conduct a research biomass program. One faces here a multidimensional optimization problem of a multidisciplinary character, covering the whole range research: from plant selection, agricultural techniques, processing into final fuel (solid, liquid or gaseous), to the final use (combustion for heat and/or power generation) or trade. The idea is to minimize the costs of research by a better use of human potential, sharing – to the extent possible – of equipment and laboratory space and co-ordination of research plans. The Project has both research and demonstration components. It covers the whole chain of processes: selection of optimal plant species, planting, harvesting, storing, processing, and combustion, up to treating the final combustion products. Alternative routes of using biomass are also considered: i.e. gasification and production of liquid biofuels. Consequently, the project covers a very broad spectrum of research: biotechnology, agriculture, boiler and combustion engineering, chemistry and physics. At present, 32 research teams joined the common programme. A map of equipment and human resources has been drawn to avoid doubling of efforts or equipment purchases. Coordination of research activities has been agreed upon. In particular, one of the partners, the Jagiellonian University has offered to the AKCENT Project its former agricultural research facility near Krakow. It comprises 400 hectares of arable land, which will be used for experiments with energy plantations. The reconstructed or adapted buildings will host the laboratories for the biomass. In particular, space will be made available to teams working on advanced biomass boilers in the capacity range 25-500 kW (including fluidised bed technology), co-firing of biomass with coal, exhaust gas analyses, monitoring of dioxins, gasification of biomass, production and investigation of properties of liquid biofuels, testing and development of motors using biofuels. At present the procedures needed to obtain the construction permits as well as financial engineering are in progress. Independently, the coordinated research plan has been drafted and presented to the Polish government. On this basis, earlier in 2004, AKCENT has been granted the status of a Centre of Advanced Technologies, which is very important from the point of view of possible funding the investment and research. It is no doubt a long-term effort still the first steps have been done [8]. CONCLUSIONS The general legal framework opens ways for the development of the biomass sector, although it certainly requires further changes and improvements directed at a more active involvement of the government in the promotion or, in general, the renewable energy sources. According to many sources biomass offers in Poland the greatest benefit from the combined environmental, energy and social point of view. As in the case of the legal framework, the same remarks apply to the financial support. However, the financial institutions should treat with more caution spending public money on supporting RES projects, which are of secondary importance for Poland. The main barrier to a more dynamic development of the biomass sector is the lack of investments funds. It is pointed out that this barrier can be overcome by a combined approach of financial support and effect of scale. It is argued that energy planning,

which in Poland is delegated by law to the lowest administration unit (NUTS5) is not optimal as far as biomass is concerned and should be rather shifted to the NUTS3 level. It is also argued that research targeted at optimisation of the use of the available biomass potential is lacking and needed. ACKNOWLEDGEMENTS This work has bee been supported by the statutory funding of AGH # 11.11.210.64 REFERENCES [1] W. Bojarski et al., Polish Energy Policy and Outline of the Program until 2010 (in
Polish), Ed. Ministry of Industry and Trade, Warsaw, 1992 [2] Polish Ministry of Economy, Current Situation in Energy Sector,
http://www.mg.gov.pl [3] A. Wyrwa, A. Gula, A. Figorski, Policy Instruments for Support of Energy
Efficiency in Poland, Proc.Vth ENER Forum, Bucharest, 16-19 Oct.04. p. 65 to be published in
Energy and Environment [4] H.Gaj et al. Draft Proposal of the National Climate Policy, (in Polish), Int. Rep.
for the Ministry of Environment, Warsaw, 2002 [5] G. Wisniewski, Development Strategy of Renewable Energy Sector, Proc. VII
Polish-Danish Workshop “Biomass for Energy”, Starbienino, 7-10 Dec. 2000, Ed. P. Kowalik, Gdansk Tech. Univ., p. 195
[6] NFFEP&WM Activities, http://www.nfosigw.gov.pl/site/main_en/pomoc_lista_programow.phb
[7] Report on ECOFUND Operation in 2002, http://www.ekofundusz.org.pl/us/index.htm
[8] A. Gula, D.Oblakowska, Krakow Initiative: Inter-University Consortium AKCENT, (in Polish), Czysta Energia, 13/2004, p.18

MICRO-REGIONAL ENERGETIC COOPERATION BASED ON BIOMASS
The name of the author: Krisztina Dely Position: Environmental and Organizational Development Consultant Organisation and address: Delfy Bt., Hungary, 2890 Tata Agostyani u.68. Phone: +36 20 322 5468 E-mail: [email protected] ABSTRACT Municipalities, especially small municipalities of micro-regions face various challenges in Hungary today: steeply increasing energy costs, obsolete energy systems of municipality institutions and migration towards large cities due to lack of employment opportunities. In most cases for making the necessary improvements and right decisions they dispose nether the required financial sources, nor crucial information and expertise in energy management. In my presentation I introduce a case study of a small Hungarian municipality Tata, where an integrated energy efficiency development program was launched on external initiative. Recognized the challenges and opportunities in energy liberalization and cooperation among municipalities in micro-regions, a broader project initiative, the framework of a biomass-based micro-regional energetic cooperation has been set up. This project initiative is part of the Hungarian National Development Plan today.

Bratislava, 22nd February 2005
Towards a cheaper, greener andTowards a cheaper, greener andsustainable energy systemsustainable energy system……
MicroMicro--regional energy cooperation regional energy cooperation based on biomassbased on biomass
Project initiative from HungaryProject initiative from Hungary
Laszlo Dely Engineer,
Energy Efficiency Consultant
Krisztina Dely Economist,
Environmental & Organizational Development Consultant

2
1. Symptoms of ‘unsustainability’
2. Why micro-regional energy
management matters?
3. Hindrances for energetic
development
4. Case of Tata municipality
5. Lessons learned:
Conditions of sustainability
6. Cooperation cluster model in
the Tata basin
7. Following steps &
expected results
The Tata basin
TATABTATABÁÁNYANYA
OROSZLOROSZLÁÁNYNY
TATABÁNYA
OROSZLÁNY
TATA
AgendaAgenda
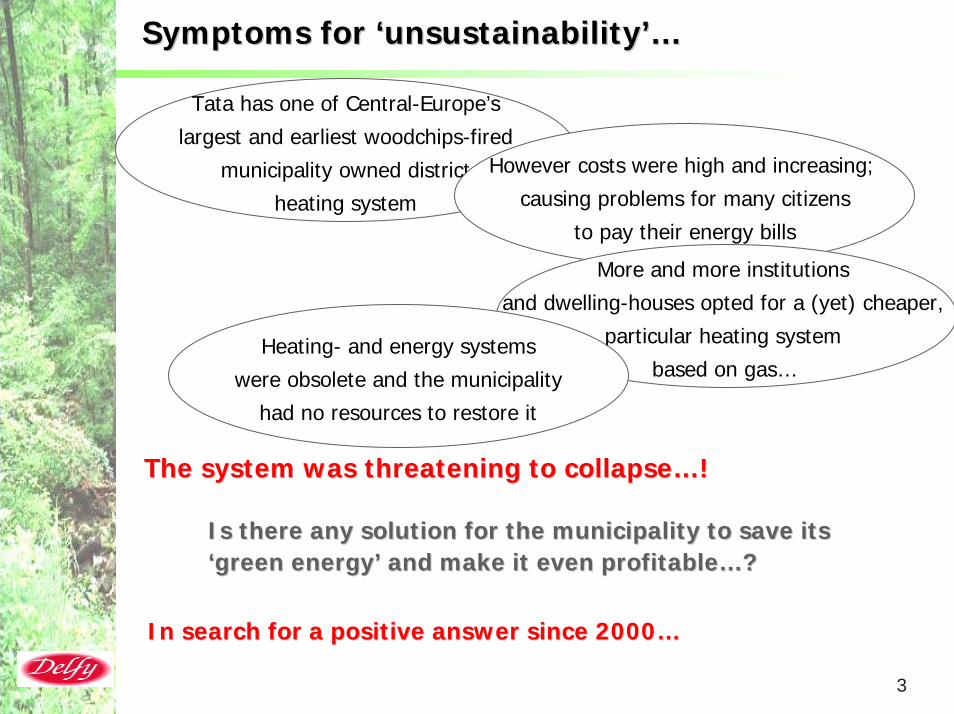
3
Symptoms for Symptoms for ‘‘unsustainabilityunsustainability’…’…
Tata has one of Central-Europe’s
largest and earliest woodchips-fired
municipality owned district
heating system
However costs were high and increasing;
causing problems for many citizens
to pay their energy bills
More and more institutions
and dwelling-houses opted for a (yet) cheaper,
particular heating system
based on gas…Heating- and energy systems
were obsolete and the municipality
had no resources to restore it
The system was threatening to collapseThe system was threatening to collapse……! !
Is there any solution for the municipality to save its Is there any solution for the municipality to save its ‘‘green energygreen energy’’ and make it even profitableand make it even profitable……? ?
In search for a positive answer since 2000In search for a positive answer since 2000……

4
Why micro regional energy management matters? Why micro regional energy management matters?
At micro-regional level:
Over 50% of heating power is consumed in rural areas in Hungary
Almost half of maintenance costs at municipality institutions derive from
energy
Energy prices increase in excess of the inflation
Higher costs and pollution ‘due’ to low efficiency in energy production
and use
At national level: Hungary is approximately 70% dependent on imported energy -> to reduce this ratio would be a national interest
At global level: Climatic changes; extreme weather phenomena due to CO2 emission

5
Hindrances for energetic developments Hindrances for energetic developments
Lack of resourcesLack of funds, low state subsidies Solvency problems -> difficulties in getting bank loans
Lack of expertiseSmall municipalities -> no energy manager No expertise in energy -> no energy management No energy management -> high lobbying power of energy service providers
Lack of regulationInsufficient and bureaucratic state incentive system -> lack of interest in energy efficiency Legislative gap on energy efficiency
Further issues:
UrbanizationRisk: High rural unemployment -> low retention power of smaller settlementsOpportunity: Local energy production based on local resources
Liberalization of Energy marketRisk: Lack of a coherent energy concept, energy expertise Opportunity to optimize on energy management, cut energy cost

6
Case study of Tata municipalityCase study of Tata municipality
Results: Primer side modernization of the district heating system and installation of a new cogeneration gas motor involving an ESCO.Further results from energy savings and electricity production: Municipality institutions’ energy costs could be covered, of which buildings can be refurbished Micro regional energy manager training has been launched.
Tata in numbers: 25,000 inhabitants1,700 flats and further institutions heated based on biomass district heating system5 Mw Woodchips fired boiler producing heating power
Challenges: Increasing energy prices due to waning number of buildings on district heating: ‘vicious circle’Maintain, cost efficiently refurbish and increase competitiveness of the woodchips fired boilerChange mind-set: energy-consciousness of citizens and municipality leaders
Solution:Weekly energy consumption data was gathered and analyzed.
Involving relevant partners, energy-experts:Energy-audit of 20 institutions and the district heating system has been realized.Energy-Concept of Tata municipality has been prepared.

7
Energy efficiency development program of TataEnergy efficiency development program of Tata
Programdesign,
coordination
ENERGYFORUM
Municipality decisions
Energyaudit
Feasibilitystudy for
investments
EnergyConcept
EnergystrategyTO
WS
SWOTSWOTanalysisanalysis
Proposals
Information for decision makers
and citizens Weekly energy monitoring and analysis
Energy efficiencymeasures
Cost savings Cost savings
Cost savingsCost savings
Following stepsFollowing steps
Delfy©, 2001

8
Lessons learned: Conditions of sustainabilityLessons learned: Conditions of sustainability
Commitment & PartnershipCommitted energy manager –interested in savings on energy (incentives) Voluntary participation of municipalities, based on recognized (common) interestPartnership & cooperation among all participants
Drive & ContinualityContinuous coordination, consultation between partnersRegular energy monitoring(consumption data collection, analysis, feedback) Regular search for cost-savings, optimization
Access & SharingExperience sharing among co-operating partners, at micro-regional, (inter)national level Knowledge- and technology transfer, access to online knowledge-bases Access to financial resources(Financing coordination work; access to tenders, Energy-savings funds)
Transparency & promotionBroad communication of measures and results towards the media and citizensCivil control on results – accessible municipality reports on energy efficiencyPromoting best practices(tourism, conferences, Energy efficiency offices, publications)

9
Biomass production and usage Biomass production and usage –– cooperation cluster model for the Tata basincooperation cluster model for the Tata basin
EEEnnneeerrrgggyyy ppplllaaannntttsss ppprrroooddduuuccctttiiiooonnn
CCCllluuusssttteeerrr mmmaaannnaaagggeeemmmeeennnttt
IIITTT,,, pppaaarrrtttnnneeerrrdddaaatttaaabbbaaassseee
EEEcccooonnnooommmiiiccceeexxxpppeeerrrtttiiissseee /// ttteeennndddeeerrriiinnnggg
TTTeeeccchhhnnniiicccaaalll eeexxxpppeeerrrtttiiissseee
UUUnnniiivvveeerrrsssiiittt iiieeesss BBBiiiooommmaaassssss,,, EEEnnneeerrrgggyyy KKKnnnooowwwllleeedddgggeee bbbaaassseee
RRReeegggiiiooonnnaaalll eeennneeerrrgggyyyppplllaaannnttt hhhaaarrrvvveeessstttiiinnnggg aaannnddd ppprrroooccceeessssssiiinnnggg
cccooommmpppaaannnyyy
WWWoooooodddccchhhiiipppsss fffiiirrreeeddd bbboooiiillleeerrrsss
PPPrrriiivvvaaattteeecccooommmpppaaannniiieeesss,,, ttteeeccchhhnnnooolllooogggyyy
eeexxxpppeeerrrtttsss
CCCiiivvviiilllooorrrgggaaannniiizzzaaatttiiiooonnnsss
MMMuuunnniiiccciiipppaaallliiittt iiieeesss
Delfy©, 2002

10
Following stepsFollowing steps
Establishment of a work organization that will:
Pull together an ‘Energy-savings fund’
Prepare the set-up of the energy cluster
Keep contact and exchange information with partners
(developers, universities, researchers)
2005-2007:
Position paper and Feasibility studies for the 3 micro-regions of the Tata basin Energy monitoringEnergy audit Energy concepts
2007-2013:
Energetic investments

11
Expected resultsExpected results
Refined, integrated model for a Biomass-based
energy cluster – serving as a a reference model
Cost-efficient and sustainable energy and
environmental management in micro-regions
Local employment opportunities and alternative
revenue sources
Energy- and conference tourism

Bratislava, 22nd February 2005
Thanks for your attention! Thanks for your attention!
[email protected][email protected]
[email protected]@mail.eol.hu

MINI AND MICRO CHP TECHNOLOGIES : OPPORTUNITIES OF
BIO-FUELLED MICROTURBINES
Matthias Liebich, Scientific Collaborator, Dr. Rainer Janssen, Project Manager, WIP – Renewable Energies, Sylvensteinstrasse 2, 81369 Munich, Germany Phone: +49 89 720 12735 E-mail: [email protected] ABSTRACT Microturbines are a distributed generation technology with a power output of 30 – 250 kWe. They are single-stage, single-shaft, low pressure ratio gas turbines that produce a high-quality electrical output at an efficiency of 21 –31%. Due to the high-value heat stream of the exhaust gas, it is a promising technology for small-scale heat and power generation with an overall efficiency of 75 – 81%. Microturbine systems offer very low maintenance costs, low supervision, and extremely low emissions of NOx and CO without exhaust gas treatment. Beside natural gas, the most frequently used fuel, various bio-gases and liquid bio-fuels, like methanol can be used. Despite difficult economics, microturbines can match other generation technologies even today. An example for this is the low-BTU-gas utilisation at landfills. Current research investigates micro-turbine operation on vegetable oil, for safe stand-alone generation in environmentally sensitive areas.


REFERENCES [1] Final Report of BIOTURBINE PROJECT 2004, ALTENER Project No.
4.1030/Z/02-011/2002, 2004. [2] LIEBICH, M.: Chances and Obstacles of Liquid Bio-fuelled Microturbines,
presentation on BIOTURBINE-Workshop, Brussels, Belgium, Sep. 2004 [3] WILLENBRINK, B.: Pro2 Biogas CHP – A Success Story, presentation on
BIOTURBINE-Workshop, Brussels, Belgium, Sep. 2004 [4] LOMBARD, X.: Return of Experience for Microturbines, presentation on
BIOTURBINE-Workshop, Brussels, Belgium, Sep. 2004 [5] PEDERSEN, A.H.: Microturbine Energy Systems – The OMES Project,
Public Report, DONG, June 2004 [6] SCHMELLEKAMP, Y.: Rapeseed oil in a Capstone C30, presentation on
BIOTURBINE-Workshop, Brussels, Belgium, Sep. 2004 [7] JANSSEN, R., PIGAHT, M., CARIELLO, F., CAPACCIOLI, S., GRASSI, G.,
FJALLSTROM, T., NORDIN, J.: Bioturbines – Challenge for a New Bioenergy Market, proceedings of the 2nd World Conference and

Technology Exhibition on Biomass for Energy, Industry and Climate Protection, Rome, Italy, May 2004

BIOMASS/COAL CO-FIRING IN UTILITIES Ing. Pavel Švarc Head of Technical support division SE, a.s., Elektrárne Nováky power plant 972 43 Zemianske Kostoľany, Slovak Republic Phone: + 421 46 560 2108 E-mail: [email protected] ABSTRACT Intention of co-firing of biomass and boiler coal on fluid bed boiler FK1 of SE-ENO A plant In Slovak Electricity Company, Power Plant Nováky, currently it is being prepared a combustion test scheduled on a seven days period. It is planned to co-fire about 30 % of biomass of the total power input of the fluid bed boiler FK1. Considering the hourly consumption of coal 35 t/h, thus consumtion of the biomass is about 10 t/h. That represents consumption of 1700 t of biomass during the combustion test. The mixture of coal and biomass should be transported into fuel boiler bunker of the FK1 boiler by using of existing coaling system. The boiler FK1 is designed for using of circulating fluid bed technology. For the preparation of the operational test are exploited the experience gained so far at combustion of mixture of coal and biomass on fluid bed boilers of Electricity company ČEZ, a.s. and the combustion of wood chips on fire-grate boiler of SES, a.s. Tlmače. Zámer spoluspaľovania biomasy s energetickým uhlím na FK1 ENO A V Slovenských elektrárňach , a.s. Elektrárňach Nováky sa v súčasnosti pripravuje spaľovacia skúška rozvrhnutá na obdobie 7 dní. Je plánované spoluspaľovať asi 30 % biomasy z celkového príkonu fluidného kotla FK1. Ak uvážime hodinovú spotrebu uhlia 35 t/h, tak spotreba biomasy je asi 10 t/h. Uvedené reprezentuje spotrebu asi 1700 ton biomasy počas spaľovacej skúšky. Zmes uhlia a biomasy sa má dopravovať do palivového zásobníka fluidného kotla použitím existujúceho systému zauhľovania. Kotol je konštrukčne riešený tak, že využíva cirkulačnú fluidnú technológiu. Pre prípravu prevádzkovej skúšky sú využité skúsenosti získané doposiaľ pri spaľovaní zmesi uhlia a biomasy na fluidných kotloch ČEZ, a.s. a pri spaľovaní drevných štiepkov na roštovom kotli SES, a.s. Tlmače.

BIOGAS APPLICATION IN FUEL CELLS Ján GADUŠ Associate Professor Slovak Agricultural University in Nitra, Tr. A. Hlinku 2, 949 76 Nitra, Slovakia Phone: +421-37-6508 108 E-mail: [email protected] ABSTRACT The article presents a description of the use of fuel cells for combined production of energy. Attention is paid to biogas powered Molten Carbonate Fuel Cells (MCFC). The Molten Carbonate Fuel Cells were tested in a biogas power plant at the University Agricultural Farm Ltd. in Kolíňany, which belongs to the facilities of the Slovak Agricultural University in Nitra. The tests were carried out within an EU project: Holistic integration of MCFC technology towards a most effective systems compound using biogas as a renewable source of energy, EFFECTIVE-Project N°: NNE5-1999-00224. The main objective of the project was to perform long-term endurance experiments of 3 MCFC stacks in condition of a large-scale biogas plant using a specially developed test bed. INTRODUCTION Current energy production is strongly world wide centralised and characterised by high power and often by long distances from the end users. Therefore now-a-day one of the main tasks of the energy policy is to decentralise, deregulate and liberalise the electric and heat power market. From this point of view the sources with lower powers, which are able to generate electricity and heat in a clear and efficient way, have become very perspective. Fuel cells can be put to such ecologically clean sources. In their operational conditions they can cover local consumptions of both heat and power with a higher efficiency of the energy production (more than 50 %) in comparison with traditional energy sources (less than 35 %). MOLTEN CARBONATE FUEL CELLS A fuel cell is a device that generates electricity by the means of a chemical reaction. Every fuel cell has two electrodes, one positive and one negative, called, respectively, the cathode and anode. The reactions that produce electricity take place at the electrodes. Every fuel cell also has an electrolyte, which carries electrically charged particles from one electrode to the other, and a catalyst, which speeds up the reactions at the electrodes. Hydrogen is the basic fuel, but fuel cells also require oxygen. In practice, many fuel cells are usually assembled into a stack. A cell or a stack, the principles are the same. The basic workings of a fuel cell may not be difficult to illustrate. But building inexpensive, efficient, reliable fuel cells is a far more complicated business. Today, the main electrolyte types are alkali, molten carbonate, phosphoric acid, proton exchange membrane and solid oxide. The first three are liquid electrolytes; the last two are solids.

Molten Carbonate Fuel Cells (MCFC) use high-temperature compounds of salt (like sodium or magnesium) carbonates (chemically, CO3) as the electrolyte. Efficiency ranges from 60 to 80 percent, and operating temperature is about 650 degrees C. Units with output up to 2 megawatts (MW) have been constructed, and designs exist for units up to 100 MW. The high temperature limits damage from carbon monoxide "poisoning" of the cell and waste heat can be recycled to make additional electricity. Their nickel electrode-catalysts are inexpensive compared to the platinum used in other cells. But the high temperature also limits the materials and safe uses of MCFCs—they would probably be too hot for home use. Also, carbonate ions from the electrolyte are used up in the reactions, making it necessary to inject carbon dioxide to compensation.
Figure 1 MCFC Operational Diagram A molten carbonate fuel cell operates at approximately 650°C. The high operating temperature is needed to achieve sufficient conductivity of its carbonate electrolyte yet allow the use of low cost metal cell components. An effect associated with this high temperature is that noble catalysts are not required for the cell electrochemical oxidation and reduction processes. Molten carbonate fuel cells are being developed for natural gas and goal-based power plants for industrial, electrical utility and military application. Currently Europe has three developers pursuing the technology of the MCFC: Brandstofel Netherland B.V (BCN), MTU Friedrichshafen, Ansaldo (Italy). MTU Friedrichshafen is a European leader of the MCFC technology with a new MCFC product “Hot Module”. One Hot Module has an output approximately 250 - 300 kW with efficiency at about 65 %. Simple operating principle of MCFC Individual cells are built as flat sandwiches. Two electrodes (anode and cathode) enclose a foil, which is filled with the electrolyte lithium and potassium carbonate. When the hydrogen flows over one electrode and there are flows over the other one in an environment of 600°C, a process is started which generates electricity. This process employs low flow velocities at atmospheric pressure. The electron exchange takes place via the molten electrolyte with carbonate ions (CO3
2-). They discharge on the anode side, give off an oxygen atom that combines with the hydrogen flowing by
forming water (H2O). The carbon dioxide (CO2) takes one electron and an oxygen atom from the air, which flows by and returns to the process as carbonate ion (CO3
2-
). The CO2 content remains balanced. The hydrogen splits off from the natural gas (or biogas) at a catalyst in the anode chamber. High-temperature MCFCs can extract hydrogen from a variety of fuels using either an internal or external reformer. They are also less prone to carbon monoxide "poisoning" than lower temperature fuel cells, what makes coal-based fuels more attractive for this type of fuel cell. MCFCs work well with catalysts made of nickel which is much less expensive than platinum. MCFCs exhibit up to 60 percent efficiency, and this can rise to 80 percent if the waste heat is utilised for cogeneration. Factors affecting the selection of operating conditions are stack size, heat transfer rate, voltage level, load requirement and cost. The performance curve is defined by cell pressure, temperature, gas composition an utilisation. Typical MCFC will generally operate in the range of 100 to 200 mA/cm2 at 750 to 900 mV/cell. Typical cathode performance curves obtained at 650°C with an oxidant composition (12,6 % O2, 18,4 % CO2, 69 % N2) that is anticipated for use in MCFC. Experiences with biogas powered MCFC In the period of the years 2000 – 2004 the Slovak Agricultural University (SAU) in Nitra participated in a EU project of the fifth framework programme Holistic integration of MCFC technology towards a most effective systems compound using biogas as a renewable source of energy, EFFECTIVE-Project N°: NNE5-1999-00224. The main project task of SAU in Nitra was to perform long-term endurance experiments with 3 MCFC stacks in condition of its large-scale biogas plant using a specially developed test bed. The Molten Carbonate Fuel Cells were tested in a biogas power plant at the University Agricultural Farm Ltd. in Kolíňany, which belongs to the facilities of the Slovak Agricultural University in Nitra. The supplier of the biogas powered MCFC for their testing in the test bed was MTU CFC Solutions GmbH Ottobrunn, Germany. The parameters of the tested fuel cells stacks were:
• type MCFC with an internal reforming of the biogas • installed performance of the fuel cell 300W – nominal • fuel hydrogen, natural gas, biogas (mixture CH4/CO2) • operating temperature 600 – 650°C • output voltage 7, 5 V (max. 11V – min. 6,5V) • output current 35 A (max. 41A – min. 0A) • active surface of the cell 250 cm2
The project objective was to carry out a long-term endurance testing of MCFC stacks operating on biogas at various operating modes. By then there had been used only MCFC stacks operating on the natural gas or hydrogen for which the achieved parameters have been usually the following:
• current density (loading) 100 – 200 mA.cm-2 • achieved voltage 750 – 900 mV
In our experiments influence of difference parameters on the stack operation was monitored: influence of the gas operating pressure (overflow), operating temperature,

gas contaminants, current density and operating time. As an energy source for our MCFC stack we used a biogas, which is a product of an anaerobic fermentation process. The processed biomass was a cattle manure with these characteristic values: 55 – 60 % CH4, 1 – 5 ppm H2S, max 3 % O2, 45 – 40 % CO2. The first run of the long-term endurance test was performed from October 2002 to April 2003 (app. 2500 operating hours). Maximal output voltage of the stack Umax = 10351 mV was reached at the operation time 432 hours and maximal performance P = 182,7 W at 1245 hours of the operation time (Fig. 4). At an optimal current loading 100 – 140 mA.cm-2 the fuel cells showed a right function: the reached voltages on the separate cells at the maximal loading 140 mA.cm-2 were within an interval 750 – 800 mV while the usual voltage value of the fuel cells operating on the natural gas at similar load ranges from 750 to 900 mV (Fig. 5).
Figure 2 MCFC stack tested in the Biogas power plant in Kolíňany
Figure 3 MCFC tested in the Biogas power plant in Kolíňany

The second and third runs of the experiments were performed in May – October 2003 (app. 3200 operating hours) and in December 2003 – May 2004 (app. 3400 operating hours). The results of both these cycles of the long-term endurance experiments proved the above-mentioned parameters reached in the first cycle.
CONCLUSION The long-term endurance tests of the biogas powered fuel cells run by the Slovak Agricultural University were focused on exploring composition of the biogas entering into the process, output voltage on the fuel cell in dependence on the load (current density), fuel cell output performance and on the temperature of the separate cells in the stack. The results of all three performed cycles have proved that the use of the MCFC fuel cells operating on a biogas is possible, because the achieved performance parameters are comparable with the other up to now tested or runing fuel cells operating mostly on the natural gas.
Priebeh napätia na článku počas prevádzky
History of Stack Voltage
0
2000
4000
6000
8000
10000
12000
0,23
25,0
8
99,1
0
204,
42
261,
42
396,
32
428,
00
463,
17
525,
42
624,
17
691,
08
724,
08
770,
42
818,
92
856,
33
1058
,50
1122
,58
1123
,58
1171
,33
1263
,75
1340
,92
Doba prevádzky, hodOperating hours, hour
Nap
ätie
na čl
ánku
, mV
Stac
k Vo
ltage
, mV
Napätie
Figure 4 Curve of the voltage on the stack during the operation
Figure 5 Polarization curves of the MCFC stack

REFERENCES [1] Holoubek, D.: Palivové články – decentralizovaný zdroj blízkej budúcnosti,
Magazín Energia, 2001 [2] Kessler, M.; Ziegler, S.; Hoffmannn, J.: Brenstoffzellen – Ein Energiekonzept fur
Zukunft, 2001 [3] M.C. Power Corporation: Molten Carbonate Fuel Cell Product Development
Test – Final Report (September 1992- March 1997) for U.S. Department of Energy, Morgantown, West Virginia
[4] Trogisch, S. et. al.: Biogas Powered Fuel Cells : Case Studies for their Implementation. Trauner Verlag, Linz 2004. ISBN 3-85487-626-2

MARKETING KOGENERÁCIE V PODMIENKACH SLOVENSKA
Cogeneration marketing in conditions of Slovakia Mgr. Ivan Ďuďák INTECH Slovakia, s.r.o. Palárikova 31, Bratislava, Slovak republic Phone: + 421 903 426 535 E-mail: [email protected] ABSTRACT: The lecture is focused on presenting actual possibilities for electricity and heat producing from biomass in Slovakia. The author concentrates on summary of actual technical possibilities and definitions economical and legislative limitations for their wider use in Slovakia.

Marketing kogenerMarketing kogeneráácie v cie v podmienkach Slovenskapodmienkach Slovenska
MgrMgr. Ivan . Ivan ĎĎuuďďáákk

Aktuálne možnosti na Slovensku
Aktuálne možnosti na Slovensku
VyuVyužžitie bioplynu na itie bioplynu na ČČOVOVVyuVyužžitie bioplynu v itie bioplynu v popoľľnohospodnohospodáárstverstveVyuVyužžitie sklitie skláádkovdkovéého plynuho plynuORC ORC –– vyuvyužžitie drevnitie drevnéého ho odpaduodpadu

ČOVČOV

Naše skúsenostiNaše skúsenosti
-- LuLuččenec enec -- SereSereďď-- BanskBanskáá BystricaBystrica-- KomKomáárnorno-- ZirardovZirardov (Po(Poľľsko)sko)-- WartauWartau ((ŠŠvajvajččiarsko)iarsko)
-- ŠŠumperkumperk a ina inéé
ČČOVOV

Využitie exkrementovVyužitie exkrementov

Naše skúsenostiNaše skúsenosti
PoPoľľnohospodnohospodáárstvorstvo-- KolKolííňňanyany-- SlavkovSlavkov u Brna u Brna -- Atlas Atlas SeisSeis (Portugalsko)(Portugalsko)-- GuGu AnAn HebeiHebei ((ČČíína)na)
-- TeletnTeletnííkk RoRožžnnáá ininéé

KolíňanyKolíňany

KolíňanyKolíňany
17
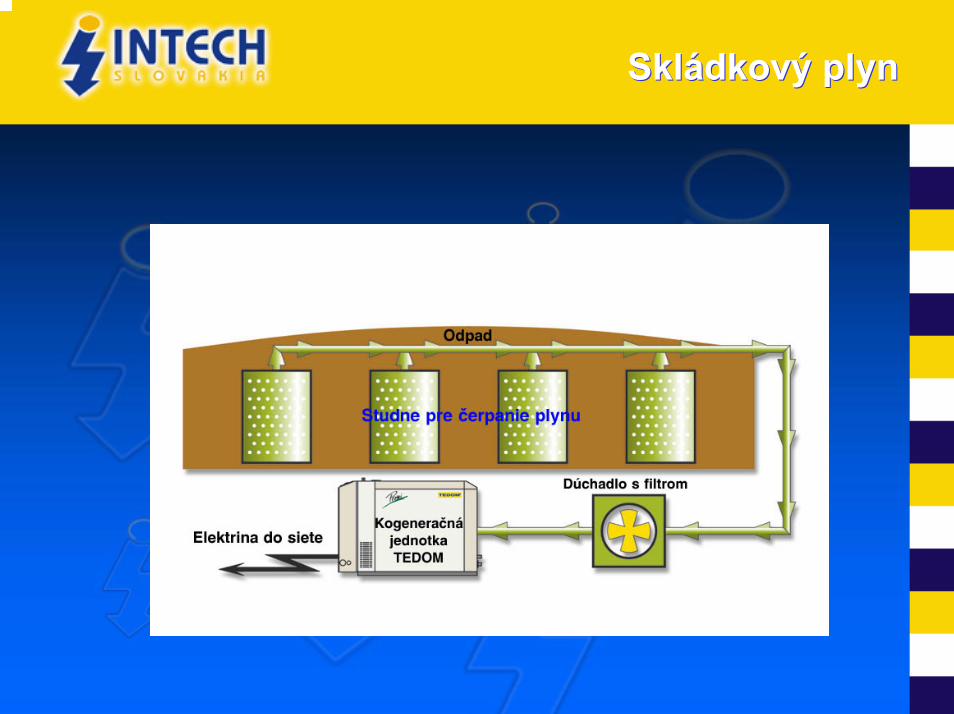
Skládkový plynSkládkový plyn

ORCORC
170 °C
250 °C
300 °C
275 °C
80 °C
225 °C
60 °C

ORC MODUL 1.1 MWeORC MODUL 1.1 MWeKondenzátor
RegenerátorVýparníkTurbína
ORCORC

ĎĎakujem za akujem za pozornospozornosťť
www.intechenergo.skwww.intechenergo.sk

ASH PROCESSING AND RECYCLING Július Bizoň Director SES a.s. Tlmače, Továrenská 210, 935 28 Tlmače, Slovakia Phone: 00421 36 6382585 E-mail: [email protected]
ABSTRACT
Ladies and Gentlemen,
I would like to clarify briefly genesis of development and transition of our heating system from brown coal and natural gas combustion to biomass utilization. After increasing the demands for environmental protection our company SES a.s. Tlmače was looking for ways how to decrease power consumption intensity and influence of power sources on surrounding. Using the programmes and projects flexibly responding to actual requirements of environmental protection our company reacted and looked for alternative fuels, too. The main target of the program was and still is to get a general view of the ways using various European Union countries to solve practically specific issues at enforcing laws concerning environmental protection and to support exchange of best experience and practice. One of those programmes analyses in details our company transition to biomass utilization in the heating system and subsequent utilization of ash without any adverse environmental effects. Fuel Change in SES a.s. Till 2000 there was used brown coal and natural gas for heating the building within our company premises. As the demands for environmental protection and natural gas prices were continuously increasing, we looked for alternative fuel types. The most effective way seemed to be the option of biomass combustion. It is economically acceptable, environmental friendly and renewable. In spring 2001 we started testing run of 35 MW boiler K5 with combustion of wooden chips. The test results were very good. The only minor problem was transport of wooden chips to the boiler. Coal could be led from the hopper onto the grate by gravity, but for wooden chips modification had to be done. There was installed pushing-in equipment into the boiler. Designers were limited by the existing opening to avoid intervention in the boiler pressure system. The feeding equipment could feed the boiler with wooden chips that ensure the boiler loading of only 14 MW. This capacity was sufficient for heating the company buildings up to max. –5°C external ambient temperature. When the external ambient temperature dropped under the temperature, it was also necessary to put into operation 8 MW boiler K2 with natural gas combustion. Heat generation of natural gas is more expensive and in-house consumption of the boiler house was increased due to operation of other equipment and pumps. Therefore we looked for solutions how to increase capacity of the boiler K5 with wooden chips combustion. The new solution was applied in 2003 when the grate feeding with variable speed gearbox was replaced with hydraulic feeding. There was created a

room to increase the pushing-in equipment. This modification increased the fuel rate into the combustion chamber and consequently the boiler loading up to 25 MW allowing to heat the company buildings even when the external ambient temperature dropped as low as to –15°C. The combustion quality and loading depend also on wooden chips quality. The most suitable water content is up to 27 % when the calorific value is about 12 GJ/ton. This requires wooden chips of hard wood. From the technological point of view there are also important dimensions of wooden chips. It means any dimension should not exceed 3 cm and the sawdust content should not exceed 1 % due to filter fouling and solids leakage through a stack into atmosphere. Currently, we have been modifying the wood chips stockyard to avoid deterioration of biomass and to ensure its easier handling. Biomass Utilization: Advantages: a) decrease of emission rate b) decrease of slag (ash) rate c) more economical than coal and particularly than natural gas Disadvantages: a) necessity to store wooden chips (our supplier Lesy SR (Forest of Slovak
Republic) is not able to provide required quantity in winter months) b) lower efficiency of plant when wooden chips are combusted than in case of
natural gas combustion Utilization of Ash and Recycling in SES a.s. At full operation of the boiler and optimal supplies we combust 20 000 tons of forest biomass annually in form of oak chips with 10 % - 20 % addition of acacia and poplar whereby about 200 tons ash is produced. This is based on data of ash content in forest biomass for oak and acacia wood of about 1.3 %. The values were achieved at combustion temperature of 550°C. In our plant with biomass combustion there are achieved temperatures of 850 oC. Based on data from literature (MISRA 1994) at the combustion temperature above 1000°C the ash rate of oak wood drops by more than 20%, therefore in calculation and estimation of expected ash production it was considered a value of 1%. The actual ash rate depends also on flue gas precipitator efficiency and it might be somewhat lower. The table shows a review of combusted biomass rate during the heating season 2002 up to 2003 and of ash production rate. 2002 2003 months X. XI. XII. I. II. III. combusted biomass (t)
185 3796 3064 3328 2605 1359
2

2002 2003 ash production (t) 1,9 38,0 30,6 33,1 26,0 13,5 This table compares the maximal concentrations of hazardous elements in ash and STN standard (mg/kg –1).
Hg Cd Pb Cr As Cu Mo Ni Zn SES a.s. Tlmače (max.)
0,006
1,5 6,4 41,1 28,8 68,1 3,1 27,4 151
STN 465735 10 13 500 1000 50 1200 25 200 3000 Having compared the maximal concentrations measured in all the samples and the limits for the elements given in STN 465735 Industrial composts, we find that all the samples of ours comply with the parameters of raw materials for composting. Therefore we can recommend the ash from SES a.s. to be used as fertilizer compound for composting to add nutrients as well as due to environment friendly and economical convenient recycling of ash as waste of forest biomass utilization. We are going to negotiate with entities interested in this waste type. Based on the act of waste SES a.s. Tlmače can offer waste in form of ash of biomass for further recovery to other entities, as we do not recover it further. Further recovery is possible in agricultural or forest companies for composting. The ash addition quantity will depend on further composting mixtures and required properties of resulting products. There are various trends of forest biomass ash utilization as fertilizer in our country and abroad. In foreign countries direct application is often considered to be one of the most reasonable way of disposal preferred from social as well as agricultural point of view. SES a.s. Tlmače is an important producer in power engineering involved in manufacture of equipment for biomass combustion and ecological equipment for local as well as foreign customers. We are ready and willing to cooperate with any entity, local or foreign, in projects of utilization and recovery of biomass.
We thank you for your kind attention. Ing. Július Bizoň SES a.s. Tlmače Slovak Republic
3

EXPLOITATION OF BIOMASS WITHIN THE EMISSION TRADING AND JOINT IMPLEMENTATION
Balajka Jiří Consultant ECOSYS, 85106Bratislava Šášovská 12 Phone: 00421263828503, 00421905734924 E-mail: [email protected] ABSTRACT Increasing use of biomass in national energy balance is consistent with the objectives of energy policy of Slovakia, focused on the reliable energy supply at acceptable cost and on the lowering of negative environmental impact of energy system. The use of biomass is influenced by environmental factors. This paper illustrates on the practical examples how the biomass extend use is stimulated by environmental legislation together with CO2 emission trading. The both, EU trading scheme and Kyoto flexible mechanism framework were analysed as the tool for biomass penetration in energy market.

1. INTRODUCTION The main objective of the National economy strategy SR is to ensure the sustainable economic development of SR. This is, however, conditioned by securing safe and reliable energy supplies at optimal costs, taking into account environmental aspects, and with an emphasis on self-sufficiency in power generation [1] [2]. The role of biomass in national energy balance is closely connected with the sustainable economic development, preferably considering the impact on energy supply reliability and environmental impact of energy system. On the national level the factors stimulating the extend use of biomass in national energy balance can be summarized as follows:
1. Decrease the dependencies on the energy import, which represents approximately 60% from national TPES balance. Nevertheless this balance considers primary nuclear heat as indigenous TPES, although fuel cells for nuclear power plant are imported too. Taking in account the nuclear fuel cells as import, the energy import represents closely 90%.
2. In the framework of Protocol of acidification, eutrofication and ground layer
ozone Slovakia established its national cap of SO2 emission at 110kt/year in 2010 level. It stimulates the use of sulphur free fuels as are NG and biomass. [3]
3. In the framework of Kyoto Protocol Slovakia accepted its national goal to
reduce GHG emission in period 2008 to 2012 of 8% from the 1990 level.[3] It again stimulate the use of less carbon intensive or CO2 neutral emission fuels as are NG and biomass.
These national objectives should be applied on the individual energy and industrial utilities level by regulatory and economical tools. The main driving force for biomass penetration in energy market is the fuel price per energy units (GJ) together with other cost connected with its implementation in energy service. This paper is focused on the following issues that can stimulate the extend use of biomass in energy market as are:
1. Environmental legislation, preferably stack emission concentration limits of SO2, NOx, CO and SP. [4][5][6]
2. EU scheme of CO2 emission trading [9] 3. Kyoto flexible mechanism [3]
This paper gives some practical examples of biomass use in relation of above issues.

2. ENVIRONMENTAL LEGISLATION AS DRIVING FORCE FOR BIOMASS IMPLEMENTATION
The national legislation, especially Decree of the Ministry of Environment of the Slovak Republic No. 706/2002 established new stack emission concentration limits [6]. For energy units more decisive role play the limits for base pollutants as are SO2, NOx, CO and SP. Preferably emission limit for SO2 can stimulate the fuel switch from sulphur reach fuels (coal or HFO) to sulphur free one, preferably biomass and NG. While total fuel switch needs the investment for energy technology retrofit or repowering, the addition of this sulphur free fuels to existing fuel mix can be applied with lower investment cost. One advantage for use of biomass as auxiliary fuel with coal mix lies in the fact, that biomass in present legislation is considered as solid fuel with the same SO2 concentration limit. Next figure compares the fuel mix of coal with biomass or NG, applied in order to comply the environmental legislation, i.e. emission limits. In our case the existing boiler with 100MW thermal capacity is considered. There are applied two system of emission limit for period before year 2008 and past year 2007. In the first case emission limit in the fuel mix is determined as the limit for prevailing fuel (>50% thermal input). In the second period the prevailing fuel determines emission limit only in the range of 100 -70% of its thermal input and in the range 30 - 70% is used mixed emission limit according the thermal input of used fuels. The black solid line indicates the SO2 flue gas concentration, depending on thermal input of sulphur free fuels. Blue solid line represents the emission limit in first period, red line emission limit past the year 2007. We can see that in the case of coal & NG fuel mix, the emission limit can be achieved only in the range of 30 - 50% of NG thermal input for the period before year 2008. This mix is not sufficient to achieve this limit in second period. In the case of coal & biomass mix is situation more simple. The same limit is applied for the both period and at fuel mix > as 30% of biomass input the emission limit can be achieved. Fig. 1 SO2 emission concentration and emission limits in dependence of sulphur free fuel thermal input Fuel mix coal and NG Fuel mix coal and biomass
0
500
1000
1500
2000
2500
0% 10% 20% 30% 40% 50% 60% 70% 80% 90% 100%
mgS
O2.
Nm
-3
Konc. ZL EL<2008 EL>2007
0
500
1000
1500
2000
2500
0% 10% 20% 30% 40% 50% 60% 70% 80% 90% 100%
mgS
O2.
Nm
-3
emission EL The use biomass is more effective approach for fuel mix change, applied in order to achieve SO2 emission limit.

3. EU SCHEME OF CO2 EMISSION TRADING Directive EC of the European Parliament and of the Council [9][8] established a scheme for greenhouse gas emission allowance trading within the Community. Emission trading in EU scheme can stimulate the use of biomass in existing coal boilers in order to decrease of CO2 emission and strengthen position on CO2 allowance market. Similarly as in the case of SO2 emission, the biomass represents CO2 emission neutral fuel and its CO2 emission is not included in national emission balance. Next example compares the impact of wood implementation as fuel in existing coal boilers. Tables 1 and 2 illustrate the structure of boiler house together with share of thermal input of used fuel. Two option are considered. In Existing Option - EO only NG is used in small share for combustion stabilization at the case of coal boilers (#1,#2,#3), while in Abatement Option - AO is share of coal in these boilers decreased and replaced by wood. Table 1 Existing option - EO Boiler MWt �
h/year maxTJ/yea
r Fuel 1 Fuel 1
Input %Fuel 2 Fuel 2
Input %
Boiler #1 100 75 4500 1620 HC 98 NG 2 Boiler #2 100 75 6500 2340 BC 98 NG 2 Boiler #3 100 75 6500 2340 BC 98 NG 2 Boiler #4 45 90 6500 1053 NG 100 Table 2 Abatement option - AO Boiler MWt �
h/year maxTJ/year Fuel 1 Fuel 1
Input %Fuel 2 Fuel 2
Input % Fuel 3 Fuel 3
Input %
Boiler #1 100 75 4500 1620 HC 70 WOOD 28 NG 2 Boiler #2 100 75 6500 2340 BC 70 WOOD 28 NG 2 Boiler #3 100 75 6500 2340 BC 70 WOOD 28 NG 2 Boiler #4 45 90 6500 1053 NG 100 Next table compare aggregated CO2 emission factor per fuel mix input as well as rated fuel mix cost for both options. The thermal output limitation of individual boilers is presented too. Table 3 Thermal output limitation, aggregated CO2 emission factor and rated fuel mix cost in 1st period EU trading scheme.
Max output
EFCO2 Fuel cost Sk/GJ Fuel cost Sk/GJ Fuel cost Sk/GJ
tCO2/TJ 2005 2006 2007
�
TJ/y AO EO AO EO AO EO AO EO %
Boiler #1 1620 67.0 93.3 59.1 65.2 60.5 67.1 61.9 69.1 75 Boiler #2 2340 71.9 100.2 81.4 96.5 82.8 98.4 84.3 100.4 75 Boiler #3 2340 71.9 100.2 81.4 96.5 82.8 98.4 84.3 100.4 75 Boiler #4 1053 58.6 58.6 104.5 104.5 107.7 107.7 110.9 110.9 90

Using the above data, the optimization of thermal output of individual boilers together with CO2 emission trading balance was compared for above option, using the programme TRADE. This boiler house has CO2 emission allowance 1000 kt CO2 for 1st trading period (2005 - 2007) Following thermal output is proposed:
TJ/year 2005 TJ/year 2006 TJ/year 2007 3511 3528 3546
The market CO2 emission cost is considered at 12EUR/tCO2 level. The results are presented in the next series of figures, comparing Existing and Abatement options:
1. First series of figures presents thermal output of individual boilers (area graph) together with CO2 allowance distribution per year - CAP (black solid line) and emission level in individual years. (green solid line) While at the Existing Option - EO the emission is higher as emission cap, the implementation of wood as part of fuel mix decreases the emission under the emission allowance level. (Abatement Option- AO) The output of boiler #1, combusting HC as main fuel is practically same in both options. At the abatement option the output of brown coal boilers (#2 and #3) is increased, while output of NG boiler (#4) is decreased. The later effect is due the increasing NG purchase price at the end of followed period
2. The second series of figures summarize year by year (column diagram)
values of CO2 emission, emission trading balance - (value < 0 representing the allowance purchased, value> 0 represented the allowance sale) and total balance of emission (emission + allowance trade). The red solid line represents the allowance level for whole period and black dash line represents gradual summarization of yearly emission cap, which value achieve at the end of period the total allowance level.
3. The third series of figures gradually summarizes fuel cost, emission
trading balance and total balance of fuel cost and emission trading. While in the case of Existing Option the allowance purchase brings the increase of total operation cost, in the case of Abatement Option this cost is reduced.

Fig 2 Impact of wood on operation and emission characteristics. 98% Coal, 2% NG 70% coal, 28% wood, 2% NG Thermal output of individual boilers, emission level and allowance distribution/year
0500
1000150020002500300035004000
2005 2006 2007
TJ.ry
ear
200
250
300
350
400
Boiler #1 Boiler #2 Boiler #3Boiler #4 Emission CAP
0500
1000150020002500300035004000
2005 2006 2007
TJ.ry
ear
200220240260280300320340360
Boiler #1 Boiler #2 Boiler #3Boiler #4 Emission CAP
Emission, emission trading and allowance - additive diagrame through period 2005 - 2007
-1000-500
0500
10001500
2005 2006 2007
kt C
O2
Emission Trade BalancePeriod cap Cap/year
-1000-500
0500
10001500
2005 2006 2007kt
CO
2
Emission Trade BalancePeriod cap Cap/year
Fuel cost, emission trading balance and total cost balance additive diagram through period 2005 - 2007
0
20000
40000
60000
2005 2006 2007
thou
sand
d of
EU
R
fuel cost ET balance Total
-20000
0
20000
40000
2005 2006 2007
thou
sand
d of
EU
R
fuel cost ET balance Total

4. KYOTO FLEXIBLE MECHANISM The approach of Ministry of Environment to Kyoto flexible mechanism is presented at this conference [10] . Its application was long time uncertain due the situation with Kyoto protocol ratification. The new situation due the accession of Russian Federation to Kyoto protocol opens the door for its application. Similarly as in the case of EU emission trading, the biomass use represents very useful way of CO2 abatement. As well as EU trading scheme is concentrated on the short period (3 years) [7][8] and selected emission source, the activity in this framework don't stimulate any action with investment intensive energy source repowering. On the other side, the action in Kyoto flexible mechanism framework (Allowance Trading - AT and Joint Implementation - JI) is focused on the longer time schedule, at least to the end of Kyoto period (2012). Therefore it open the door for activity connected with energy source retrofit or repowering. In the case of biomass use, this action could be represented by the total repowering of boiler house to biomass combustion, connected with the investment in new boiler technology for bomass combustion. As practical example, the JI is considered, representing the change of coal for wood combustion of boiler with 50MW thermal capacity. Next tables illustrate the main indicators for baseline case (coal combustion in existing boiler) and JI case (wood combustion in new boiler). The fuel cost per energy unit (GJ) includes not only the purchase price, but also other cost connected with individual fuel exploitation (transport, preparation, etc.) The thermal output of boiler considers the same level 1043TJ in 2006 with production increase of 3%/year. Both cases are calculated for period 2006 -2012 as the end of Kyoto period. Table 4 Main indicators of baseline and JI case. Case Unit Baseline JI Thermal input MWt 50 50Efficiency % 80 75Investment cost milSk.MWt 0.5 2Main fuel BC Wood Fuel cost Sk/GJ 94.4 98.4Fuel cost escalation 2.0 0.5EF*1 of main fuel kgCO2/GJ 101.0 0.0Auxiliary Fuel NG NG Fuel cost Sk/GJ 101 59Share of AF % 2 5Fuel cost escalation % 3.2 3.2EF of auxiliary fuel kgCO2/GJ 58.6 58.6Fuel mix cost Sk/GJ 94.6 96.4AEF*2 kgCO2/GJ 100.152 2.93*1 emission factor, *2 aggregated emission factor for fuel mix
Results of abatement calculation is presented in next table

Table 5 Abatement CO2 emission cost at JI with wood implementation unit Baseline JI � NPV total DR = 5% mil. Sk 903 990 87Emission total ktCO2 1000 31 969ER = 30Sk/EUR EUR/t CO2 3
The abatement cost of this case is very sensitive on the relation of real coal and wood cost, i.e. cost including the all expenditures connected with these fuels utilization. It can change from case to case. Next figure illustrates the dependence of CO2 abatement cost on the ratio of wood to coal cost. Fig. 3 Dependence of CO2 abatement cost on the ratio of wood to coal cost.
-10
-5
0
5
10
15
70% 80% 90% 100% 110% 120% 130% 140%wood/coal cost
EU
R/tC
O2
As is seen from previous figure, at some relation the abatement cost reach the negative value. It means, that project doesn’t need any external financial resources needed for its implementation. Application of this project in JI framework should be questionable, from the requirements on the project additionality. Nevertheless approach of Ministry of Environment enable to apply this type of project in the Allowance Trading (AT) framework[10].
5. CONCLUSION The extent use of biomass in national energy balance can be stimulated by the following environmental oriented issues
1. Environmental legislation, preferably the stack emission concentration limit stimulates the use of sulphur free fuel as are NG and biomass. The use of biomass has advantage, that emission limit for coal and wood combustion is same and fuel mix will not bring the more strict requirements on the emission limit achievement as is the case of NG and coal fuel mix.
2. For short period of EU scheme of CO2 emission trading scheme (2005 - 2007) can coal and wood fuel mix solve the problem of CO2 emission allowance achievement. The increase of biomass share in fuel mix balance can even reverse the situation needed of CO2 allowance purchase to the

situation when this allowance could be sold. It has benefit effect on the operation cost balance.
3. For the long time period, the flexible mechanism of Kyoto protocol can be applied. It stimulates not only the biomass share increase in fuel mix but some boilers repowering from coal to biomass combustion boilers. At some lower ratio of wood/coal fuel cost the CO2 emission abatement cost achieved the negative value.
6. REFERENCES [1] MINISTRY OF ECONOMY OF THE SR , Energy Policy of the Slovak Republic,
Bratislava, 2000 [2] MINISTRY OF ECONOMY OF THE SR, Review of Energy policy in IAE countries -
Slovak Republic 2005, Ministry of Economy of SR, Bratislava 1994 [3] MINISTRY OF ENVIRONMENT OF THE SR, International Environmental Agreements
and Protocols Accepted or Prepared for Acceptance in the Slovak Republic, Bratislava 1999
[4] Act No. 478/2002 on Air Protection as amended by Acts No. 245/2003, No. 525/2003, No. 572/2004 and No. 541/2004
[5] Decree of the Ministry of Environment of the Slovak Republic No. 705/2002 on air quality.
[6] Decree of the Ministry of Environment of the Slovak Republic No. 706/2002 on air pollution sources, on emission limits, on technical requirements and general operational conditions, on list of pollutants, on categorization of air pollution sources and on requirements of emission’s dispersion as amended by Decree No. 410/2003
[7] Decree of the Ministry of Environment of the Slovak Republic No.60/2003 determining national emissions ceilings and emission quotas
[8] MINISTRY OF ENVIRONMENT OF THE SR, National Allocation Plan for 2005-2007, Bratislava 2005
[9] Directive 2003/87/EC establishing a scheme for greenhouse gas emission allowance trading within the Community and amending Council Directive 96/61/EC
[10] PRINCOVÁ.H. Kyoyo Flexible Mechanism - Past and Current Situation, Reaching the Objectives. Slovak Biomass Forum 2005 Conference, Bratislava 2005

EMMISSIONS METERING METHODOLOGY IN SLOVAKIA Dr.Ing. Jozef Šoltés, CSc. Accreditation Section Manager Slovak Energy Agency, Rudlovská cesta 53, Banská Bystrica Phone: +421 48 4714630 E-mail: [email protected] ABSTRACT: In 2003 according to new law 478/2002 s.b., ordinances 410/2003 s.b. 408/2003 s.b., 202/2003 s.b. and settlement of 500/2003-6.1 of the Ministry for Environment Protection it was created new law frame to make measuring of emissions in Slovakia. This way it was created condition for realisation eligible measuring of emissions on high quality level enabling high objectiveness and credibility. Existing experience with this new legislation highlights the need of early novelization which has to solve number of open questions.

BIOMASS IN EU FRAMEWORK PROGRAMS
Martin Kedro Director SARC, Staré grunty 52, 84244 Bratislava Phone: +421 2 654 20 308 E-mail: [email protected] ABSTRACT A brief overview on research topics related to biomass, as appeared in the calls for project proposals in FWP5 and FWP6, is given. Energy policy targets are discussed in frame of new class of RTD projects. An example of specific support project is shown. Criticism of present status of FWP6 is followed by some recommendation concerning the rest of FWP6 and future possibilities in FWP7.

BIOMASSIN EU RTD
FRAMEWORK PROGRAMMES
Martin Kedro
ISBF 2005 Bratislava, February 21 and 22
ECOTECH
Global change and ecosystems:greenhouse gaswater cyclebiodiversitydesertification,natural disasterssustainable land managementoperational forecasting and modelingcomplementary research
Sustainable energy systems:short term impact (clean energy sources, savings and efficiency,alternative motor fuels)long term impact (fuel cells, carriers/transport storage, renewable energy technologies, capture and sequestration of CO2

Energy Policy Targets:Meeting Kyoto Objectives8% CO2 reduction between 2008 and 2012 compared to 1990 level
Doubling the Share of Renewable Energy SourcesFrom 6% to 12% final energy EUROSTAT convention
Improving Energy EfficiencyIncrease by 18% until 2010 compared to 1995
Maintaining Security of Supply
• Integrating multidisciplinary and multisectoral activities, involving private-public sector partnerships and end-users from business, industrial and policy-making areas;
• Combining different types of RTD actions, notably research, demonstration & accompanying measures
• Proposing outstanding developments, with a significant impact at European scale, presenting cost-effective RTD arrangements that require substantial human and financial resources (order of magnitude of millions of €)
to encourage the submission of a new class ofprojects
Target Actions

Target ActionsShortShort--termterm
Fuel Cells and HFuel Cells and H22: : Application driven fuel cellsApplication driven fuel cellsBiomass for the Production of heat and electricity: Biomass for the Production of heat and electricity: BioBio--
electricityelectricityIntegration of Integration of REsREs and distributed generation of energy and distributed generation of energy
systems: systems: Sustainable CommunitiesSustainable CommunitiesRational Use of Energy: Rational Use of Energy: Clean Urban TransportClean Urban TransportRational Use of Energy: Rational Use of Energy: EcoEco--buildingsbuildingsClean Power Generation: Clean Power Generation: Gas Power GenerationGas Power Generation
Demonstrate and disseminate the benefits of using biomass and waste either in dedicated facilities or in
co-utilisation with fossil fuels
innovative approaches to the large scale production and use of bio-electricity including CHP applications;
minimum installed capacity of 10Mwe and activity based at least 60% on the income from sale bio-electricity.
Short-term TargetBio-electricity
Future Energy Technologies forEnlarged European Union
FET-EEUSSA coordinated by IPPTSlovak participant TUZVO
WP 2: Building awareness and interactions establishment
Establishing of the project web site
Second thematic workshop „Integrated Research in New Energy Technologies – electricity, bio-energy, and energy from sun, wind and water – in SLOVAKIA
First thematic workshop „New concepts for renewableenerrgy technologies in Europe – hydrogen and fuelcells“
FP6 awareness building by info-days for potentialpartners of FP6 Priority 6.1 projects from ACC
Activity
FWP6 calls 2003/4
* failure of NoEs (limited new calls)* doubts on IPs (core vs RoW)* oversubsription (mobility, IPs)* EC loosing trust and credit
Next calls
+ use CORDIS+ stress on STREPS + supplementary participants into IPs

Next calls: SR* SSA* networks* evaluators* PC delegates/experts
FWP7: looking forward (?)
* 40 bilions Euro
* 5 pillerscontinuitymobility
coordinationbasic research
technology platforms
2/2/2005 New start forthe Lisbon Strategy


BIOMASSIN EU RTD
FRAMEWORK PROGRAMMES
Martin Kedro
ISBF 2005 Bratislava, February 21 and 22

ECOTECH
Global change and ecosystems:greenhouse gaswater cyclebiodiversitydesertification,natural disasterssustainable land managementoperational forecasting and modelingcomplementary research
Sustainable energy systems:short term impact (clean energy sources, savings and efficiency,alternative motor fuels)long term impact (fuel cells, carriers/transport storage, renewable energy technologies, capture and sequestration of CO2

Energy Policy Targets:Meeting Kyoto Objectives8% CO2 reduction between 2008 and 2012 compared to 1990 level
Doubling the Share of Renewable Energy SourcesFrom 6% to 12% final energy EUROSTAT convention
Improving Energy EfficiencyIncrease by 18% until 2010 compared to 1995
Maintaining Security of Supply

Target Actionsto encourage the submission of a new class of
projects • Integrating multidisciplinary and multisectoral activities,
involving private-public sector partnerships and end-users from business, industrial and policy-making areas;
• Combining different types of RTD actions, notably research, demonstration & accompanying measures
• Proposing outstanding developments, with a significant impact at European scale, presenting cost-effective RTD arrangements that require substantial human and financial resources (order of magnitude of millions of €)

Target ActionsShortShort--termterm
Fuel Cells and HFuel Cells and H22: : Application driven fuel cellsApplication driven fuel cellsBiomass for the Production of heat and electricity: Biomass for the Production of heat and electricity: BioBio--
electricityelectricityIntegration of Integration of REsREs and distributed generation of energy and distributed generation of energy
systems: systems: Sustainable CommunitiesSustainable CommunitiesRational Use of Energy: Rational Use of Energy: Clean Urban TransportClean Urban TransportRational Use of Energy: Rational Use of Energy: EcoEco--buildingsbuildingsClean Power Generation: Clean Power Generation: Gas Power GenerationGas Power Generation

Short-term TargetBio-electricity
Demonstrate and disseminate the benefits of using biomass and waste either in dedicated facilities or in
co-utilisation with fossil fuels
innovative approaches to the large scale production and use of bio-electricity including CHP applications;
minimum installed capacity of 10Mwe and activity based at least 60% on the income from sale bio-electricity.

Future Energy Technologies forEnlarged European Union
FET-EEUSSA coordinated by IPPTSlovak participant TUZVO

WP 2: Building awareness and interactions establishment
Establishing of the project web site
Second thematic workshop „Integrated Research in New Energy Technologies – electricity, bio-energy, and energy from sun, wind and water – in SLOVAKIA
First thematic workshop „New concepts for renewableenerrgy technologies in Europe – hydrogen and fuelcells“
FP6 awareness building by info-days for potentialpartners of FP6 Priority 6.1 projects from ACC
Activity

FWP6 calls 2003/4
* failure of NoEs (limited new calls)* doubts on IPs (core vs RoW)* oversubsription (mobility, IPs)* EC loosing trust and credit

Next calls
+ use CORDIS+ stress on STREPS + supplementary participants into IPs

Next calls: SR* SSA* networks* evaluators* PC delegates/experts

FWP7: looking forward (?)
* 40 bilions Euro
* 5 pillerscontinuitymobility
coordinationbasic research
technology platforms
2/2/2005 New start forthe Lisbon Strategy

THE AUSTRIAN JI/CDM PROGRAMME DI Alexandra Amerstorfer Head of the Climate and Energy Department Kommunalkredit Public Consulting GmbH, Türkenstr. 9, 1092 Wien Phone: 0043-1-31631-240 E-mail: [email protected] ABSTRACT The Austrian Government introduced in August 2003 the Austrian JI/CDM Programme and Kommunalkredit Public Consulting (KPC) was appointed for the Programme Management and acts on behalf of the Austrian Federal Ministry of Agriculture, Forestry, Environment and Water Management in this respect. In accordance with the National Climate Strategy Austria purchases emission reductions generated by Joint Implementation (JI) and Clean Development Mechanism (CDM) projects and use these to meet its Kyoto target supplementarily to domestic measures. In October 2004 already the second Calls for JI and CDM projects were published. The presentation describes the Austrian JI/CDM Programme: which projects are eligible, what is the procedure for submitting proposals, which possibilities exist for covering costs of project development and what are the experiences so far from the first two calls for JI and CDM projects and gives an outlook on the future activities.

17.02.2005 SR6030-00-01 1
Head of the Climate and Energy DepartmentKommunalkredit Public Consulting
DI Alexandra Amerstorfer
The Austrian JI/CDM Programme
22. Februar 2005

17.02.2005 SR6030-00-01 2
Contents
• The Austrian Kyoto Target and the Austrian National Climate Strategy
• The Austrian JI/CDM Programme- Background and Status- Project Cycle
• Experiences so far

17.02.2005 SR6030-00-01 3
Austrian Kyoto Target andNational Climate Strategy
EU target - 8 %EU "Burden Sharing": Austrian target - 13 %
Domestic measures: Austrian National Climate StrategyKyoto mechanisms (supplementary): JI and CDM
Responsible Authority: Austrian Ministry of EnvironmentProgramme Management: Kommunalkredit Public Consulting
Austria has to reduce GHG emissions by 17 mill. t CO2e annually
Austrian JI/CDM Programme

17.02.2005 SR6030-00-01 4
Austrian JI/CDM ProgrammeTarget and Means
Main Aim Closing the gap between the Austrian Kyoto targetand national emission reduction potential
Means - Purchase of ERUs/CERs from JI/CDM projects(incl. financing of project-related immaterial costs)
- Investment in Carbon Funds
Responsible Authority: Austrian Ministry of EnvironmentProgramme Management: Kommunalkredit Public Consulting
Budget 2003 EUR 1 mill. 2004 EUR 11 mill. 2005 EUR 24 mill. > 2006 EUR 36 mill. (per year)
At least 3 mill. t CO2e per year

17.02.2005 SR6030-00-01 5
Austrian JI/CDM ProgrammeLegal Basis
Kyoto Protocol and relevant COP-decisions (e.g. Marrakech Accords)
Austrian Environmental Support Act
Directive for the Austrian JI/CDM Programme
Memoranda of Understanding: Bulgaria, China, Czech Republic,Hungary, Latvia, Morocco, Romania, Slovakia, Bolivia, Argentinia, New Zealand (several others in preparation)

17.02.2005 SR6030-00-01 6
The Austrian JI/CDM – ProgrammePriority Project Categories
Combined Heat and Power Installations
Fuel Switch to Renewables or less carbon intensive fuels
Renewable Energy Production Plants
Energy Efficiency Projects
Waste Management Measures
Other projects types also eligible

17.02.2005 SR6030-00-01 7
Project Cycle
Joint Implementation(JI)
Clean Development Mechanism(CDM)
Project Idea Note (PIN)
Project Design Document (PDD)
Validation
Registration
Certification
Emission Reduction Purchase Agreement
Monitoring
Verification
Transfer and Payment

17.02.2005 SR6030-00-01 8
Austrian JI/CDM Programme2nd Call for JI/CDM Projects
Negotiation procedure with prior public announcement
Publication11 October 2004
Closure30 June 2005
Expressionof
InterestProposal Negotiations ERPA
Project cycle

17.02.2005 SR6030-00-01 9
Austrian JI/CDM Programme Experiences so far (September 2004)
0
10
20
30
40
Negotiations/Contracted
Invitation forProposal
Expression ofInterest
Officially 51 projects (1st round) have been submitted:
2 projects are contracted
2 projects are being negotiated
14 projects have beeninvitated for a detailedProposal
33 further projects are in the first phase of the tender procedure (EoI)

17.02.2005 SR6030-00-01 10
Experience and ExpectationsSpecific Features of Austrian JI/CDM Programme
Flexibility and efficiency within the tendering procedure
Continuous approval procedure (number of selected projects is limited by the annual budget only)
Additional project benefits are considered in price negotiation
Possibility of prepayment
Possibility of financial support for Baseline, Validation, Monitoring, Verificationand Certification
No minimum level of emission reductions offered
No specific country restriction

17.02.2005 SR6030-00-01 11
Austrian JI/CDM Programmewww.ji-cdm-austria.at/

17.02.2005 SR6030-00-01 12
Thank you!
www.ji-cdm-austria.at/
DI Alexandra Amerstorfre
Tel: ++43 -1-31 6 31 – 240

STRUCTURAL FUNDS Ing. Drahoslav Kvašovský Accreditation Section Manager Slovak Energy Agency, Rudlovská cesta 53, Banská Bystrica Phone: +421 48 4142625 E-mail: [email protected] ABSTRACT
Structural funds EC - Sector operational program Industry and Services. Priority 1. Competition growth of industry and services by using
development of home growth potential Measure 1.4. Support of energy savings and renewable energy sources utilization Measure 1.3. Support of enterprise, innovations and applicable research

SupportSupport ofof EnergyEnergy SavingsSavings andandUseUse ofof RenewableRenewable EnergyEnergy SourcesSources
Ing. Drahoslav Ing. Drahoslav KvaKvaššovskýovskýSlovakSlovak EnergyEnergy AgencyAgency

SectoralSectoral OperationalOperational ProgrammeProgramme IndustryIndustry and and ServicesServices
Priority 1.Priority 1. Growth in competitiveness of industry and services using Growth in competitiveness of industry and services using domestic growth potentialdomestic growth potential
MeasureMeasure 1.1.44.. Support of Support of eenergynergy ssavingsavings andand useuse ofof rrenewableenewable eenergynergyssourcesources
MeasureMeasure 1.3.1.3. SupportSupport ofof businessbusiness, , innovationsinnovations and and appliedapplied researchresearch
SlovakSlovak EnergyEnergy AgencyAgency, , www.sea.gov.skwww.sea.gov.sk

Support of Energy Savings and Support of Energy Savings and UseUse ofof Renewable Energy SourcesRenewable Energy SourcesCommonCommon AimAim::
ØØ ApproachApproach thethe energyenergy demandsdemands ofof thethe industryindustry to to thethecomparablecomparable EU EU standardsstandards: :
üü ennergyennergy savingssavings,,
üü increaseincrease ofof productionproduction efficiencyefficiency,,
üü increasingincreasing thethe energyenergy and and heatingheating productionproduction shareshare fromfromrenewablerenewable energyenergy sourcessources..
SlovakSlovak EnergyEnergy AgencyAgency, , www.sea.gov.skwww.sea.gov.sk

ØØ EfficiencyEfficiency increaseincrease ofof primaryprimary energyenergy resourcesresources utilizationutilization in in thethe processprocess ofof energyenergy conversionconversion, ,
ØØ DecreaseDecrease ofof energyenergy demadsdemads forfor processesprocesses connectedconnected withwithproductionproduction, , conversionconversion and and transmissiontransmission ofof energyenergy, ,
ØØ DecreaseDecrease ofof primaryprimary sourcessources consumptionconsumption forfor energyenergyproductionproduction and and more more extensiveextensive useuse ofof alternativealternative energyenergyresourcesresources,,
ØØ DecreaseDecrease thethe import import dependencedependence forfor primaryprimary energyenergyresourcesresources..
SlovakSlovak EnergyEnergy AgencyAgency, , www.sea.gov.skwww.sea.gov.sk
Support of Energy Savings and Support of Energy Savings and UseUse ofof Renewable Energy SourcesRenewable Energy SourcesCommonCommon AimAim::

SlovakSlovak EnergyEnergy AgencyAgency, , www.sea.gov.skwww.sea.gov.sk
ØØ ReconstructionReconstruction and and renovationrenovation ofof existingexisting sourcessources basedbased on on fossilfossil fuelsfuels, , e.ge.g. :. :üü increaseincrease efficiencyefficiency ofof equipmentequipment, , üü increaseincrease annualannual levellevel ofof utilizationutilization, , üü decreasedecrease thethe homehome consumptionconsumption ofof energyenergy and and energyenergy
mediamedia ...,...,
ØØ ReconstructionReconstruction, , renovationrenovation and and constructionconstruction ofof sourcessources forforcombinedcombined productionproduction ofof heatheat andand powerpower on on basedbased fossilfossilfuelsfuels,,
Support of Energy Savings and Support of Energy Savings and UseUse ofof Renewable Energy SourcesRenewable Energy SourcesCommonCommon AimAim::

SlovakSlovak EnergyEnergy AgencyAgency, , www.sea.gov.skwww.sea.gov.sk
ØØ ReconstructionReconstruction ofof existingexisting energyenergy distributiondistribution systemssystems and and energyenergy mediamedia in in industryindustry and and servicesservices, , e.ge.g. :. :üü improvingimproving thethe insulationinsulation ofof pipepipe distributiondistribution, , üü replacementreplacement ofof distributiondistribution equipmentequipment forfor energyenergy mediamedia,,üü implementationimplementation ofof systemssystems forfor monitoring monitoring leaksleaks ofof energyenergy
mediamedia, , üü reconstructionreconstruction ofof heatheat exchangerexchanger stationsstations (HES) ...,(HES) ...,
ØØ ReconstructionReconstruction ofof buildingsbuildings to to improveimprove thethe thermothermo--technicaltechnical characteristicscharacteristics,,
Support of Energy Savings and Support of Energy Savings and UseUse ofof Renewable Energy SourcesRenewable Energy SourcesCommonCommon AimAim::

ØØ ImplementationImplementation thethe measuringmeasuring and and controllingcontrolling systemssystems to to decreasedecrease thethe energyenergy consumptionconsumption,,
ØØ ReconstructionReconstruction ofof existingexisting energyenergy demandingdemanding technologicaltechnologicalequipmentequipment or or itsits substitutionsubstitution,,
ØØ BuildingBuilding, , reconstructionreconstruction and and renovationrenovation ofof equipmentequipment forforutilizationutilization ofof alternatealternate energyenergy sourcessources ((biomassbiomass, , hydrohydroenergyenergy, , solarsolar energyenergy, , geothermalgeothermal energyenergy, , municipalmunicipal wastewasteetcetc.),.),
ØØ ProcessingProcessing ofof studiesstudies and and conceptionsconceptions relatedrelated to to thethemeasuremeasure..
SlovakSlovak EnergyEnergy AgencyAgency, , www.sea.gov.skwww.sea.gov.sk
Support of Energy Savings and Support of Energy Savings and UseUse ofof Renewable Energy SourcesRenewable Energy SourcesActivitiesActivities::

SlovakSlovak EnergyEnergy AgencyAgency, , www.sea.gov.skwww.sea.gov.sk
ØØ State State aidaid schemescheme::üü State State aidaid schemescheme forfor supportsupport ofof energyenergy savingsaving and and
utilizationutilization ofof renewablerenewable energyenergy sourcessources,,
ØØ De De minimisminimis schemescheme::üü SchemeScheme forfor supportsupport ofof sustainablesustainable developmentdevelopment..
Support of Energy Savings and Support of Energy Savings and UseUse ofof Renewable Energy SourcesRenewable Energy SourcesState State aidaid rulesrules::

SlovakSlovak EnergyEnergy AgencyAgency, , www.sea.gov.skwww.sea.gov.sk
PROVIDERPROVIDER
MinistMinistryry ofof EconomyEconomyofof thethe SlovSlovakak RRepubliepubliccMierovMierováá 19,19,827 15 Bratislava827 15 Bratislavatel.: tel.: +421 +421 22 4854 11114854 1111web sweb siteite::www.economy.gov.skwww.economy.gov.sk
EXECUTOREXECUTOR
SlovSlovaakk EEnergnergyy AAgengencycyBajkalskBajkalskáá 2727827 99 Bratislava 27827 99 Bratislava 27tel.: tel.: +421 +421 22 58248 11158248 111fax: fax: +421 +421 22 53421 01953421 019web sweb siteite::www.sea.gov.skwww.sea.gov.sk
Support of Energy Savings and Renewable Energy Sources UtilizatiSupport of Energy Savings and Renewable Energy Sources UtilizationonProviderProvider and and ExecutorExecutor ofof thethe GrantGrant::

SlovakSlovak EnergyEnergy AgencyAgency, , www.sea.gov.skwww.sea.gov.sk
ØØ PrivatePrivate sectorsector –– businessbusiness subjectssubjects in in thethe ObjectiveObjective 11 areasareas::üü westernwestern Slovakia (Trnava, TrenSlovakia (Trnava, Trenččíín, Nitra n, Nitra regionsregions),),üü middlemiddle Slovakia (BanskSlovakia (Banskáá Bystrica, Bystrica, ŽŽilina ilina regionsregions),),üü easterneastern Slovakia (KoSlovakia (Koššice, Preice, Preššov ov regionsregions),),
üü SmallSmall and and middlemiddle--sizedsized enterprisesenterprises ((SMEsSMEs))üü Big Big enterprisesenterprises,,üü OrganisationsOrganisations establishedestablished by state by state administrationadministration and and publicpublic
administrationadministration bodiesbodies (min. (min. shareshare ofof privateprivate sectorsector 51%)51%)
Support of Energy Savings and Support of Energy Savings and UseUse ofof Renewable Energy SourcesRenewable Energy SourcesState State aidaid schemescheme –– BeneficiariesBeneficiaries::

ØØ ProjectsProjects thatthat representrepresent, or are part , or are part ofof, , startingstarting investmentinvestment: :
üü investmentsinvestments forfor establishingestablishing a new a new enterpriseenterprise,,
üü expansionexpansion ofof existingexisting enterpriseenterprise,,
üü runrun--upup ofof activityactivity whichwhich needsneeds massivemassive modificationmodification ofofproductproduct or or productionproduction processprocess in in anan existingexisting enterpriseenterprise
-- rationalisationrationalisation, , -- diversificationdiversification,,-- renovationrenovation..
SlovakSlovak EnergyEnergy AgencyAgency, , www.sea.gov.skwww.sea.gov.sk
Support of Energy Savings and Support of Energy Savings and UseUse ofof Renewable Energy SourcesRenewable Energy SourcesState State aidaid schemescheme –– RegionalRegional AidAid –– EligibleEligible ProjectsProjects::

§§ EnergyEnergy savingssavings,,§§ CombinedCombined productionproduction ofof heatheat and and powerpower basedbased ofof fossilfossil fuelfuel
withwith maximum maximum installedinstalled capacitycapacity upup to 10MWto 10MWee,,§§ UseUse ofof renewablerenewable energyenergy sourcessources –– constructionconstruction, , renewalrenewal or or
reconstructionreconstruction ofof: : üü smallsmall hydrohydro powerpower--stationsstations withwith capacitycapacity upup to 10 MW,to 10 MW,üü equipmentequipment forfor energyenergy useuse ofof biomassbiomass
(min. (min. capacitycapacity 50kW50kWtt or 50kWor 50kWee),),üü equipmentequipment forfor useuse thethe solarsolar energyenergy,,üü equipmentequipment forfor useuse ofof geothermalgeothermal energyenergy,,üü eguipmenteguipment forfor useuse ofof windwind energyenergy..
SlovakSlovak EnergyEnergy AgencyAgency, , www.sea.gov.skwww.sea.gov.sk
Support of Energy Savings and Support of Energy Savings and UseUse ofof Renewable Energy SourcesRenewable Energy SourcesState State aidaid schemescheme –– RegionalRegional AidAid –– EligibleEligible ProjectsProjects::

SlovakSlovak EnergyEnergy AgencyAgency, , www.sea.gov.skwww.sea.gov.sk
ØØ AcquisitionAcquisition costscosts forfor tangibletangible operationaloperational assetsassets ((landland, , buildingsbuildings, , machinesmachines, , appliancesappliances andand equipmentequipment),),
ØØ AcquisitionAcquisition costscosts ofof intangibleintangible operationaloperational assetsassets (patent (patent rightsrights, , licencieslicencies, , knowknow--howhow or or nonnon--patentedpatented technicaltechnical knowknow--howhow) : ) : üü costscosts shareshare cannotcannot exceedexceed 25% 25% ofof eligibleeligible investmentinvestment costscosts,,üü mustmust bebe exclusivlyexclusivly usedused by by thethe beneficiarybeneficiaryüü assetsassets mustmust bebe depreciabledepreciable,,üü mustmust bebe boughtbought fromfrom thirdthird partiesparties accordingaccording to to thethe marketmarket conditionsconditions,,üü mustmust bebe includedincluded to recipient to recipient propertyproperty forfor a a periodperiod ofof min. min. nextnext 5 5
yearsyears..
Support of Energy Savings and Support of Energy Savings and UseUse ofof Renewable Energy SourcesRenewable Energy SourcesState State aidaid schemescheme –– RegionalRegional AidAid –– EligibleEligible CostsCosts::

SlovakSlovak EnergyEnergy AgencyAgency, , www.sea.gov.skwww.sea.gov.sk
ØØ AidAid intensityintensity::üü 50% 50% ofof eligibleeligible costscosts++ 15 %, 15 %, in in casecase beneficiairybeneficiairy meetsmeets thethe SMEsSMEs criteriacriteria,,
ØØ AmountAmount ofof aidaid::üü min. 50 000,min. 50 000,-- EUR,EUR,üü max. 5 mil. EUR.max. 5 mil. EUR.
Support of Energy Savings and Support of Energy Savings and UseUse ofof Renewable Energy SourcesRenewable Energy SourcesState State aidaid schemescheme –– RegionalRegional AidAid –– AidAid IntensityIntensity::

SlovakSlovak EnergyEnergy AgencyAgency, , www.sea.gov.skwww.sea.gov.sk
ØØ RegionalRegional aidaid isis notnot providedprovided forfor followingfollowing branchesbranches::üü agricultureagriculture, , üü fishingfishing, , üü coalcoal industryindustry, , üü steelsteel industryindustry, , üü shipbuildingshipbuilding, , üü syntheticsynthetic fibrefibre industryindustry, , üü automotiveautomotive,,üü transportationtransportation,,üü activitiesactivities relatedrelated withwith productionproduction, , processingprocessing andand salesale ofof
productsproducts mentionedmentioned in in AnnexAnnex 1 1 ofof TreatyTreaty establishingestablishingEuropeanEuropean CommunitiesCommunities..
Support of Energy Savings and Support of Energy Savings and UseUse ofof Renewable Energy SourcesRenewable Energy SourcesState State aidaid schemescheme –– RegionalRegional AidAid –– ExceptionsExceptions::

SlovakSlovak EnergyEnergy AgencyAgency, , www.sea.gov.skwww.sea.gov.sk
ØØ EnergyEnergy savingssavings ((activitiesactivities thatthat enableenable thethe beneficierybeneficiery to to decreasedecrease thethe energyenergy usedused in in productionproduction processprocess),),
ØØ CombinedCombined productionproduction ofof heatheat and and powerpower basedbased on on fossilfossil fuelfuelwihwih maximum maximum capacitycapacity upup toto 50MW50MWe e (in (in casecase thethe activitiesactivitiesproveprove protectionprotection ofof environmentenvironment; ; whichwhich arisesarises fromfrom extra extra highhighefficiencyefficiency transformationtransformation –– RegulationRegulation nn°° 8/2004/EC)8/2004/EC)
Support of Energy Savings and Support of Energy Savings and UseUse ofof Renewable Energy SourcesRenewable Energy SourcesState State aidaid schemescheme –– EnvironmentalEnvironmental AidAid -- EligibleEligible ProjectsProjects::

SlovakSlovak EnergyEnergy AgencyAgency, , www.sea.gov.skwww.sea.gov.sk
ØØ UtilizationUtilization ofof renewablerenewable energyenergy sourcessources –– constructionconstruction, , renewalrenewal or or reconstructionreconstruction ofof: : üü smallsmall hydrohydro powerpower--stationsstations withwith capacitycapacity to 10MW,to 10MW,üü equipmentequipment forfor energyenergy useuse ofof biomassbiomass
(min. (min. setset--upup capacitycapacity 500kW500kWtt or 500kWor 500kWee),),üü equipmentequipment forfor useuse ofof solarsolar energyenergy,,üü equipmentequipment forfor useuse ofof geothermalgeothermal energyenergy,,üü equipmentequipment forfor useuse ofof windwind energyenergy..
Support of Energy Savings and Support of Energy Savings and UseUse ofof Renewable Energy SourcesRenewable Energy SourcesState State aidaid schemescheme –– EnvironmentalEnvironmental AidAid -- EligibleEligible ProjectsProjects::

SlovakSlovak EnergyEnergy AgencyAgency, , www.sea.gov.skwww.sea.gov.sk
ØØ Extra Extra investmentinvestment costscosts, , borneborne by by thethe firmfirm comparedcompared with a with a conventional power plant with the same capacityconventional power plant with the same capacity in terms of in terms of the effective production of energythe effective production of energy..
netnet ofof allall benefits accruing from any increase in capacity, costbenefits accruing from any increase in capacity, costsavings engendered during the first five years of the lifesavings engendered during the first five years of the life of the of the investment and additional ancillary productioninvestment and additional ancillary production during that fiveduring that five--year period year period (in (in netnet presentpresent valuevalue))
Support of Energy Savings and Support of Energy Savings and UseUse ofof Renewable Energy SourcesRenewable Energy SourcesState State aidaid schemescheme –– EnvironmentalEnvironmental AidAid -- EligibleEligible CostsCosts::

ØØ SupportSupport ratesrates::üü 40%40% ofof eligibleeligible costscosts or 50% or 50% ifif selfself--sufficiency at sufficiency at
supplying of energy bysupplying of energy by RESRES for intended urban areasfor intended urban areas isisguaranteedguaranteed (min. 3000 inhabitants(min. 3000 inhabitants),),
++ 10 %,10 %, ifif enterpreneurenterpreneur meetsmeets thethe SME SME criteriacriteria,,++ 1010 %,%, if the project is if the project is locatedlocated in in anan ObjectiveObjective 1 1 areaarea
((according according toto the art. 87the art. 87 ofof thethe TreatyTreaty establishingestablishing EC),EC),ororüü 50% 50% ofof eligibleeligible costscosts (max(maximumimum RegionalRegional aidaid),),++ 10 %, 10 %, ifif enterpreneurenterpreneur meetsmeets thethe SME SME criteriacriteria,,
SlovakSlovak EnergyEnergy AgencyAgency, , www.sea.gov.skwww.sea.gov.sk
Support of Energy Savings and Support of Energy Savings and UseUse ofof Renewable Energy SourcesRenewable Energy SourcesState State aidaid schemescheme –– EnvironmentalEnvironmental AidAid –– AidAid IntensityIntensity::
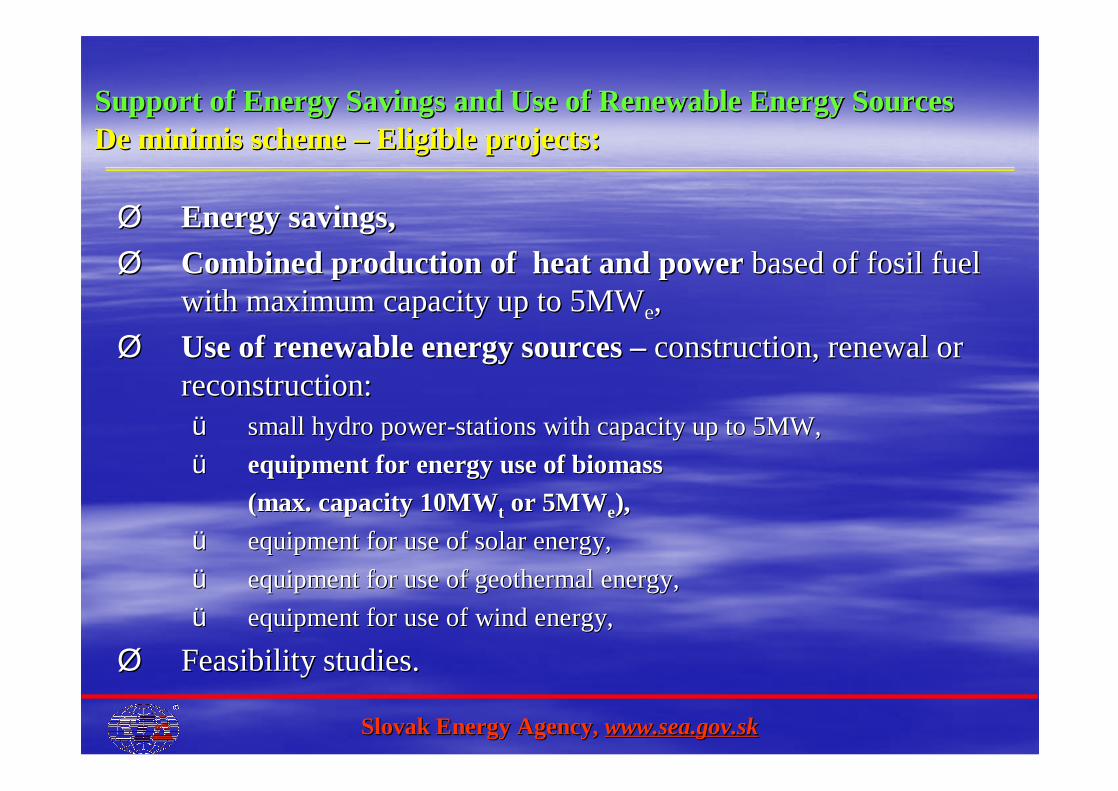
SlovakSlovak EnergyEnergy AgencyAgency, , www.sea.gov.skwww.sea.gov.sk
ØØ EnergyEnergy savingssavings,,ØØ CombinedCombined productionproduction ofof heatheat and and powerpower basedbased ofof fosilfosil fuelfuel
withwith maximum maximum capacitycapacity upup to 5MWto 5MWee,,ØØ UseUse ofof renewablerenewable energyenergy sourcessources –– constructionconstruction, , renewalrenewal or or
reconstructionreconstruction: : üü smallsmall hydrohydro powerpower--stationsstations withwith capacitycapacity upup to 5MW,to 5MW,üü equipmentequipment forfor energyenergy useuse ofof biomassbiomass
(max. (max. capacitycapacity 10MW10MWtt or 5MWor 5MWee),),üü equipmentequipment forfor useuse ofof solarsolar energyenergy,,üü equipmentequipment forfor useuse ofof geothermalgeothermal energyenergy,,üü equipmentequipment forfor useuse ofof windwind energyenergy,,
ØØ FeasibilityFeasibility studiesstudies..
Support of Energy Savings and Support of Energy Savings and UseUse ofof Renewable Energy SourcesRenewable Energy SourcesDe De minimisminimis schemescheme –– EligibleEligible projectsprojects::

SlovakSlovak EnergyEnergy AgencyAgency, , www.sea.gov.skwww.sea.gov.sk
ØØ AidAid intensityintensity::üü max. 65% max. 65% ofof eligibleeligible costscosts
ØØ AidAid amountamount::üü min. 100 000,min. 100 000,-- SKK,SKK,üü max. 100 000,max. 100 000,-- EUR in EUR in threethree consecutiveconsecutive yearsyears
Support of Energy Savings and Support of Energy Savings and UseUse ofof Renewable Energy SourcesRenewable Energy SourcesDe De minimisminimis schemescheme –– AidAid IntensityIntensity and and AmountAmount::

SlovakSlovak EnergyEnergy AgencyAgency, , www.sea.gov.skwww.sea.gov.sk
ØØ De De minimisminimis aidaid is not provided for:is not provided for:üü agriculture, agriculture, üü culture,culture,üü fishery,fishery,üü water managementwater managementüü steel industry, steel industry, üü shipbuilding, shipbuilding, üü automobile industry,automobile industry,üü transport,transport,üü activity joined with production, processing or marketing of prodactivity joined with production, processing or marketing of products ucts
mentioned in Annex I mentioned in Annex I ofof thethe TreatyTreaty establishingestablishing ECECüü activity joined with export, mainly straightactivity joined with export, mainly straightlyly connected connected toto exportexport quantitquantitiesies, ,
setting up and processing setting up and processing ofof distributiondistribution networksnetworksüü projectsprojects preferringpreferring domestic products to imported products.domestic products to imported products.
Support of Energy Savings and Support of Energy Savings and UseUse ofof Renewable Energy SourcesRenewable Energy SourcesDe De minimisminimis schemescheme –– EligibleEligible projectsprojects::

SlovakSlovak EnergyEnergy AgencyAgency, , www.sea.gov.skwww.sea.gov.sk
Support of Support of businessbusiness, innovations, innovations andand applied researchapplied researchPurposePurpose::
ØØ growth in competitiveness of industry and servicesgrowth in competitiveness of industry and services throughthrough: :
üü Development of researchDevelopment of research aandnd developmentdevelopment implementedimplementedby by enterprisesenterprises,,
üü Supporting the new innovation technologies, processes Supporting the new innovation technologies, processes and productsand products,,
üü Developing steady bonds Developing steady bonds betweenbetween enterprisesenterprises and and R&D R&D instituionsinstituions. .

SlovakSlovak EnergyEnergy AgencyAgency, , www.sea.gov.skwww.sea.gov.sk
ØØ State State aidaid schemescheme::üü GrantGrant schemescheme in in supportsupport ofof industrialindustrial researchresearch and and prepre--
competitivecompetitive developmentdevelopment,,
ØØ De De minimisminimis schemescheme::üü GrantGrant sschemecheme inin support of research and development, support of research and development,
implementation of quality management systems, implementation of quality management systems, protection of protection of industrindustrialial rights and rights and implementationimplementation ofoftechnical standards technical standards intointo industrialindustrial practicepractice and and servicesservices(de (de minimisminimis schemescheme))
Support of Support of businessbusiness, innovations, innovations andand applied researchapplied researchState State aidaid rulesrules::
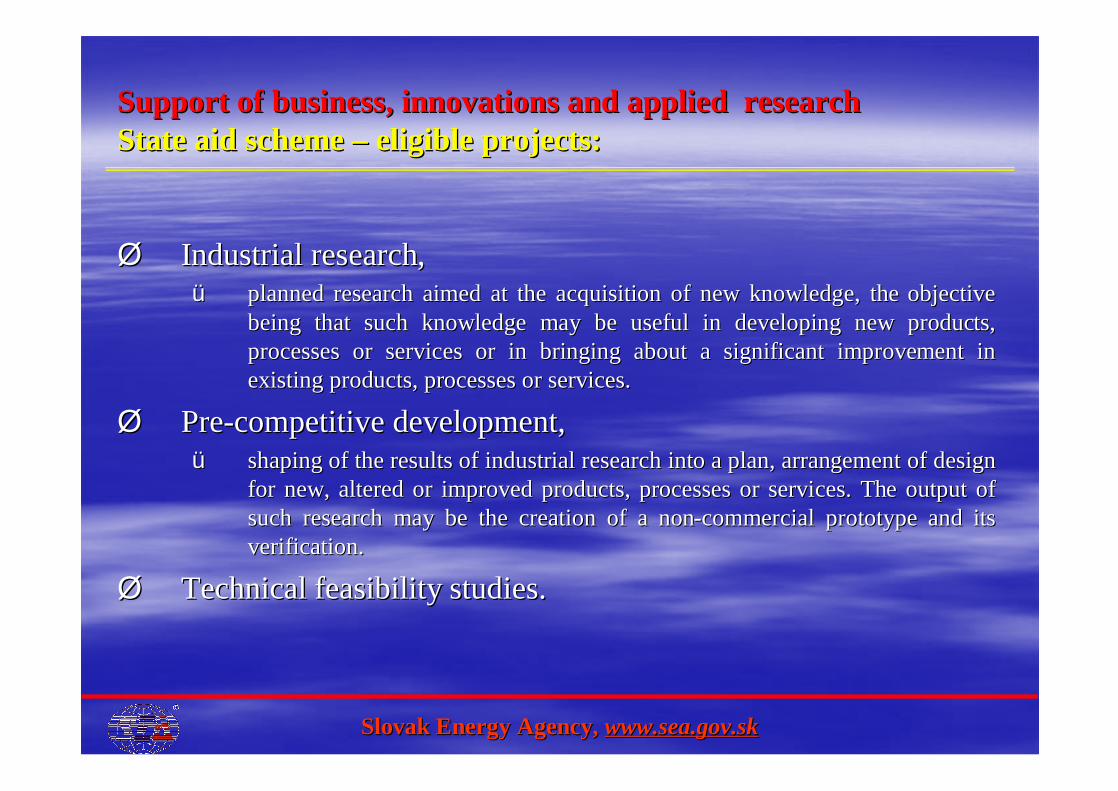
SlovakSlovak EnergyEnergy AgencyAgency, , www.sea.gov.skwww.sea.gov.sk
ØØ IndustrIndustrialial researchresearch,,üü planned research aimed at the acquisition of new knowledge, the planned research aimed at the acquisition of new knowledge, the objective objective
being that such knowledge may be useful in developing new producbeing that such knowledge may be useful in developing new products, ts, processes or services or in bringing about a significant improveprocesses or services or in bringing about a significant improvement in ment in existing products, processes or services.existing products, processes or services.
ØØ PrePre--competitive development,competitive development,üü shaping of the results of industrial research into a plan, arranshaping of the results of industrial research into a plan, arrangement of design gement of design
for new, altered or improved products, processes or services. Thfor new, altered or improved products, processes or services. The output of e output of such research may be the creation of a nonsuch research may be the creation of a non--commercial prototypecommercial prototype and and itsitsverificationverification. .
ØØ TechnicalTechnical feasibilityfeasibility studiesstudies..
Support of Support of businessbusiness, innovations, innovations andand applied researchapplied researchState State aidaid schemescheme –– eligibleeligible projectsprojects::

SlovakSlovak EnergyEnergy AgencyAgency, , www.sea.gov.skwww.sea.gov.sk
ØØ Product processes and Product processes and systems that are oriented on systems that are oriented on technological machining, welding and creation technological machining, welding and creation ofof construction construction complexes, process andcomplexes, process and chemical engineering, the new product chemical engineering, the new product elements for pharmacy andelements for pharmacy and agragroo--chemistry, technology with chemistry, technology with positive effectpositive effectss on environment,on environment,
ØØ The new material for next utilization in machine, electro, The new material for next utilization in machine, electro, chemical, building, mining, food industry and other chemical, building, mining, food industry and other industrialindustrialsectorsectorss,,
ØØ Materials from waste recycling,Materials from waste recycling,ØØ Modern technology, Modern technology, e.ge.g.. intelintellligentigent control systems, control systems,
nanotechnologies, biotechnologies...,nanotechnologies, biotechnologies...,
Support of Support of businessbusiness, innovations, innovations andand applied researchapplied researchState State aidaid schemescheme –– eligibleeligible projectsprojects::

SlovakSlovak EnergyEnergy AgencyAgency, , www.sea.gov.skwww.sea.gov.sk
ØØ Technologies for Technologies for useuse ofof naturalnatural primaryprimary sources targetsources targetededon environmenton environmentalal protectioprotectionn,,
ØØ Technologies for Technologies for energyenergy and and nonnon--energyenergy useuse of fuel and carbon of fuel and carbon materials,materials,
ØØ Technologies for rational Technologies for rational useuse of energy,of energy,ØØ Technologies for Technologies for useuse of renewable of renewable energyenergy sources.sources.
Support of Support of businessbusiness, innovations, innovations andand applied researchapplied researchState State aidaid schemescheme –– eligibleeligible projectsprojects::

SlovakSlovak EnergyEnergy AgencyAgency, , www.sea.gov.skwww.sea.gov.sk
ØØ AAcquisitioncquisition costscosts ofof::üü consumed materials incurred solely within the assisted consumed materials incurred solely within the assisted
project,project,üü instruments, equipment and land and premises used solely instruments, equipment and land and premises used solely
and on a continual basis for the research activity,and on a continual basis for the research activity,üü external consultancy or similar services incurred solely in external consultancy or similar services incurred solely in
connection with the implementation of projects,connection with the implementation of projects,üü implementation of research, new technologies or the implementation of research, new technologies or the
purchase of intellectual property rights directly linked to purchase of intellectual property rights directly linked to the implementation of projects.the implementation of projects.
Support of Support of businessbusiness, innovations, innovations andand applied researchapplied researchState State aidaid schemescheme –– eligibleeligible costscosts::

SlovakSlovak EnergyEnergy AgencyAgency, , www.sea.gov.skwww.sea.gov.sk
ØØ ProcessingProcessing costscosts::üü Personnel costs of staff employed solely on the research Personnel costs of staff employed solely on the research
and development activity. These costs cover the time and development activity. These costs cover the time necessary to implement a project, necessary to implement a project,
üü costscosts forfor healthhealth insuranceinsurance, , pensionarypensionary insuranceinsurance,,unemploymentunemployment insuranceinsurance etcetc. . ofof thethe staffstaff employed solely employed solely on the research and development activityon the research and development activity
Support of Support of businessbusiness, innovations, innovations andand applied researchapplied researchState State aidaid schemescheme –– eligibleeligible costscosts::

SlovakSlovak EnergyEnergy AgencyAgency, , www.sea.gov.skwww.sea.gov.sk
ØØ ProcessingProcessing costscosts::üü traveltravel costscosts ((homehome and and foreignforeign) ) directlydirectly relatedrelated to to thethe
projectproject realisationrealisation, , üü transport transport costscosts forfor goodsgoods incurred solely in connection incurred solely in connection
with the implementation of projectswith the implementation of projects,,üü depreciationdepreciation ofof propertyproperty usedused solely in connection with solely in connection with
the implementation of projectsthe implementation of projects, , üü Additional overheads incurred directly as a result of the Additional overheads incurred directly as a result of the
research activityresearch activity. .
Support of Support of businessbusiness, innovations, innovations andand applied researchapplied researchState State aidaid schemescheme –– eligibleeligible costscosts::

SlovakSlovak EnergyEnergy AgencyAgency, , www.sea.gov.skwww.sea.gov.sk
ØØ IndustrialIndustrial researchresearch::üü 50% 50% ofof eligibleeligible costscosts++ 10 %, 10 %, ifif beneficiarybeneficiary meetsmeets thethe SMEsSMEs criteriacriteria,,++ 1010 %, %, ifif thethe projectproject isis locatedlocated in in ObjectiveObjective 1 1 areasareas,,++ 1515 %, %, ifif thethe projectproject followsfollows thethe samesame objectivesobjectives asas a a
currentcurrent EC EC FrameworkFramework programmeprogramme forfor R&DR&Düü cumcummmulationulation maxmax.. 7575 % % ofof eligibleeligible costscosts
Support of Support of businessbusiness, innovations, innovations andand applied researchapplied researchState State aidaid schemescheme –– AidAid IntensityIntensity::

SlovakSlovak EnergyEnergy AgencyAgency, , www.sea.gov.skwww.sea.gov.sk
ØØ PrePre--competitivecompetitive developmentdevelopment::üü 25% 25% ofof eligibleeligible costscosts++ 10 %, 10 %, ifif beneficiarybeneficiary meetsmeets thethe SMEsSMEs criteriacriteria,,++ 1010 %, %, ifif thethe projectproject isis locatedlocated in in ObjectiveObjective 1 1 areasareas,,++ 1515 %, %, ifif thethe projectproject followsfollows thethe samesame objectivesobjectives asas a a
currentcurrent EC EC FrameworkFramework programmeprogramme forfor R&DR&Düü cumcummmulationulation maxmax.. 5050 % % ofof eligibleeligible costscosts
Support of Support of businessbusiness, innovations, innovations andand applied researchapplied researchState State aidaid schemescheme –– AidAid IntensityIntensity::

SlovakSlovak EnergyEnergy AgencyAgency, , www.sea.gov.skwww.sea.gov.sk
ØØ TechnicalTechnical FeasibilityFeasibility StudiesStudies::üü max. 75% max. 75% in in casecase study study relatesrelates to to industrialindustrial researchresearch,,üü max. 50% max. 50% in in casecase study study relatesrelates to to prepre--competitivecompetitive
developmentdevelopment,,
ØØ AidAid amountamount::üü min. 50 000,min. 50 000,-- EUR,EUR,üü max. 5 mil. EUR.max. 5 mil. EUR.
Support of Support of businessbusiness, innovations, innovations andand applied researchapplied researchState State aidaid schemescheme –– AidAid IntensityIntensity and and AmountAmount::

SlovakSlovak EnergyEnergy AgencyAgency, , www.sea.gov.skwww.sea.gov.sk
ØØ IndustrialIndustrial researchresearch,,ØØ PrePre--competitivecompetitive developmentdevelopment,,ØØ TechnicalTechnical feasibilityfeasibility studiesstudies,,ØØ QualityQuality managementmanagement systemssystems,,ØØ ProtectionProtection ofof industrialindustrial rightsrights,,ØØ CertificationCertification ((productsproducts, , authoritiesauthorities) and ) and accreditationaccreditation
((laboratorieslaboratories, , productionproduction processesprocesses, , organisationsorganisations),),ØØ IImplementationmplementation of technical standards into industrial practice of technical standards into industrial practice
and servicesand services..
Support of Support of businessbusiness, innovations, innovations andand applied researchapplied researchDe De minimisminimis schemescheme –– EligibleEligible projectsprojects::

SlovakSlovak EnergyEnergy AgencyAgency, , www.sea.gov.skwww.sea.gov.sk
ØØ AidAid IntensityIntensity::üü max. 65% max. 65% ofof eligibleeligible costscosts
ØØ AidAid amountamount::üü min. 10 000,min. 10 000,-- SKK,SKK,üü max. 100 000,max. 100 000,-- EUR in EUR in inin threethree consecutiveconsecutive yearsyears
Support of Support of businessbusiness, innovations, innovations andand applied researchapplied researchDe De minimisminimis schemescheme –– AidAid IntensityIntensity and and AmountAmount::

Podpora úspor energie a využitiaobnoviteľných energetických zdrojov
Ing. Drahoslav KvaIng. Drahoslav KvaššovskýovskýSlovenskSlovenskáá energetickenergetickáá agentagentúúrara

Sektorový operačný program Priemysel a služby
Priorita 1. Rast konkurencieschopnosti priemyslu a služieb s využitím rozvoja domáceho rastového potenciálu
Opatrenie 1.4. Podpora úspor energie a využitia obnoviteľných zdrojov energie
Opatrenie 1.3. Podpora podnikania, inovácií a aplikovaného výskumu
SlovenskSlovenskáá energetickenergetickáá agentagentúúra, ra, www.sea.gov.skwww.sea.gov.sk

SlovenskSlovenskáá energetickenergetickáá agentagentúúra, ra, www.sea.gov.skwww.sea.gov.sk
Podpora úspor energie a využitia obnoviteľných zdrojov energieVšeobecný cieľ:
ØØ priblpriblíížženie energetickej nenie energetickej náároroččnosti priemyslu nosti priemyslu úúrovni rovni porovnateporovnateľľnej snej s EEÚÚ: :
üü úúspory energie,spory energie,
üü zvýzvýššenie efektenie efektíívnosti výroby,vnosti výroby,
üü zvýzvýššenie podielu výroby elektriny aenie podielu výroby elektriny a tepla tepla zz obnoviteobnoviteľľných energetických zdrojov.ných energetických zdrojov.

Podpora úspor energie a využitia obnoviteľných zdrojov energieŠpecifické ciele:
ØØ zvyzvyššovanie efektovanie efektíívnosti vyuvnosti využžitia primitia primáárnych energetických rnych energetických zdrojov vzdrojov v procese premeny energie, procese premeny energie,
ØØ zniznižžovanie energetickej novanie energetickej náároroččnosti procesov spojených nosti procesov spojených ss výrobou, premenou a rozvodom energie, výrobou, premenou a rozvodom energie,
ØØ znzníížženie spotreby primenie spotreby primáárnych surovrnych surovíín pre výrobu energin pre výrobu energiíí a a rozsiahlejrozsiahlejššie vyuie využžíívanie alternatvanie alternatíívnych zdrojov energivnych zdrojov energiíí,,
ØØ zniznižžovanie zovanie záávislosti na dovoze primvislosti na dovoze primáárnych energetických rnych energetických zdrojov.zdrojov.
SlovenskSlovenskáá energetickenergetickáá agentagentúúra, ra, www.sea.gov.skwww.sea.gov.sk

SlovenskSlovenskáá energetickenergetickáá agentagentúúra, ra, www.sea.gov.skwww.sea.gov.sk
Podpora úspor energie a využitia obnoviteľných zdrojov energieAktivity:
ØØ rekonrekonšštrukcia atrukcia a modernizmodernizáácia existujcia existujúúcich zdrojov na bcich zdrojov na bááze ze fosfosíílnych pallnych palíív napr.:v napr.:üü zvyzvyššovanie ovanie úúččinnosti zariadeninnosti zariadeníí, , üü zvyzvyššovanie roovanie roččnnéého stupho stupňňa vyua využžitia, itia, üü zniznižžovanie vlastnej spotreby energie aovanie vlastnej spotreby energie a energetických energetických
mméédidiíí ...,...,
ØØ rekonrekonšštrukcia, moderniztrukcia, modernizáácia acia a výstavba zdrojov na výstavba zdrojov na kombinovankombinovanúú výrobu elektriny avýrobu elektriny a tepla na btepla na bááze fosze fosíílnych lnych palpalíív,v,

SlovenskSlovenskáá energetickenergetickáá agentagentúúra, ra, www.sea.gov.skwww.sea.gov.sk
Podpora úspor energie a využitia obnoviteľných zdrojov energieAktivity:
ØØ rekonrekonšštrukcia existujtrukcia existujúúcich systcich systéémov rozvodov energie a mov rozvodov energie a energetických menergetických méédidiíí v priemysle a sluv priemysle a služžbbáách napr.:ch napr.:üü zlepzlepššenie izolenie izoláácie potrubných rozvodov, cie potrubných rozvodov, üü výmena dopravných zariadenvýmena dopravných zariadeníí energetických menergetických méédidiíí,,üü zavzaváádzanie systdzanie systéémov na sledovanie mov na sledovanie úúniku energetických niku energetických
mméédidiíí, , üü rekonrekonšštrukcia OST ...,trukcia OST ...,
ØØ rekonrekonšštrukcia stavebných objektov za trukcia stavebných objektov za úúččelom zlepelom zlepššenia ich enia ich tepelnotepelno--technických vlastnosttechnických vlastnostíí,,

ØØ zavzaváádzanie systdzanie systéémov merania amov merania a riadenia sriadenia s ciecieľľom om zniznižžovania spotreby energie,ovania spotreby energie,
ØØ rekonrekonšštrukcia existujtrukcia existujúúcich energeticky ncich energeticky náároroččných ných technologických zariadentechnologických zariadeníí resp. ich nresp. ich nááhrada za novhrada za novééenergeticky menej nenergeticky menej náároroččnnéé,,
ØØ výstavba, rekonvýstavba, rekonšštrukcia atrukcia a modernizmodernizáácia zariadencia zariadeníí na na vyuvyužžitie alternatitie alternatíívnych zdrojov energie (biomasa, vodnvnych zdrojov energie (biomasa, vodnááenergia, energia slnka, geotermenergia, energia slnka, geotermáálna energia, komunlna energia, komunáálny lny odpad aodpad a pod.),pod.),
ØØ spracovanie spracovanie ššttúúdidiíí aa koncepcikoncepciíí ssúúvisiacich svisiacich s prioritou.prioritou.
Podpora úspor energie a využitia obnoviteľných zdrojov energieAktivity:
SlovenskSlovenskáá energetickenergetickáá agentagentúúra, ra, www.sea.gov.skwww.sea.gov.sk

SlovenskSlovenskáá energetickenergetickáá agentagentúúra, ra, www.sea.gov.skwww.sea.gov.sk
Podpora úspor energie a využitia obnoviteľných zdrojov energiePravidlá poskytovania pomoci:
ØØ schschéémy my ššttáátnej pomocitnej pomoci::üü SchSchééma ma ššttáátnej pomoci na podporu tnej pomoci na podporu úúspor energie a spor energie a
vyuvyužžíívania obnovitevania obnoviteľľných energetických zdrojovných energetických zdrojov,,
ØØ schschéémy my minimminimáálnej pomoci:lnej pomoci:üü SchSchééma na podporu ma na podporu trvalo udrtrvalo udržžateateľľnnéého rozvoja.ho rozvoja.

SlovenskSlovenskáá energetickenergetickáá agentagentúúra, ra, www.sea.gov.skwww.sea.gov.sk
Podpora úspor energie a využitia obnoviteľných zdrojov energiePoskytovateľ a vykonávateľ pomoci:
POSKYTOVATEĽ
Ministerstvo hospodárstvaSlovenskej republikyMierová 19,827 15 Bratislavatel.: 02/4854 1111webová stránka:www.economy.gov.sk
VYKONÁVATEĽ
Slovenská energetická agentúraBajkalská 27827 99 Bratislava 27tel.: 02/58248 111fax: 02/53421 019webová stránka:www.sea.gov.sk

SlovenskSlovenskáá energetickenergetickáá agentagentúúra, ra, www.sea.gov.skwww.sea.gov.sk
Podpora úspor energie a využitia obnoviteľných zdrojov energieSchéma štátnej pomoci - príjemcovia pomoci:
ØØ ssúúkromný sektor kromný sektor podnikatepodnikateľľskskéé subjekty v regisubjekty v regióónoch noch ciecieľľa 1:a 1:üü ZZáápadnpadnéé Slovensko (Trnavský kraj, TrenSlovensko (Trnavský kraj, Trenččiansky kraj, iansky kraj,
Nitriansky kraj),Nitriansky kraj),üü StrednStrednéé Slovensko (Banskobystrický kraj, Slovensko (Banskobystrický kraj, ŽŽilinský kraj),ilinský kraj),üü VýchodnVýchodnéé Slovensko (KoSlovensko (Koššický kraj, Preický kraj, Preššovský kraj),ovský kraj),
üü malmalíí a stredna stredníí podnikatelia,podnikatelia,üü veveľľkkíí podnikatelia,podnikatelia,üü organizorganizáácie zriadencie zriadenéé orgorgáánmi nmi ššttáátnej a verejnej sprtnej a verejnej spráávy (min. vy (min.
podiel spodiel súúkromnkromnéého sektora 51%)ho sektora 51%)

Podpora úspor energie a využitia obnoviteľných zdrojov energieSchéma štátnej pomoci – regionálna pomoc – oprávnenéprojekty:
ØØ projekty, ktorprojekty, ktoréé predstavujpredstavujúú alebo salebo súú ssúúččasasťťou poou poččiatoiatoččnej nej investinvestíície: cie:
üü investinvestíície do zalocie do založženia novenia novéého podniku,ho podniku,
üü rozrozšíšírenie existujrenie existujúúceho podniku,ceho podniku,
üü rozbehnutie rozbehnutie ččinnosti, ktorinnosti, ktoráá si vysi vyžžaduje podstatnaduje podstatnúú zmenu zmenu výrobku alebo výrobnvýrobku alebo výrobnéého procesu vho procesu v existujexistujúúcom podnikucom podniku
-- racionalizracionalizáácia, cia, -- diverzifikdiverzifikáácia,cia,-- modernizmodernizáácia.cia.
SlovenskSlovenskáá energetickenergetickáá agentagentúúra, ra, www.sea.gov.skwww.sea.gov.sk

Podpora úspor energie a využitia obnoviteľných zdrojov energieSchéma štátnej pomoci – regionálna pomoc – oprávnenéprojekty:
§§ úúspory energie,spory energie,§§ kombinovankombinovanáá výroba elektriny avýroba elektriny a teplatepla na bna bááze fosze fosíílnych lnych
palpalíív sv s maximmaximáálnym inlnym inšštalovaným výkonom do 10MWtalovaným výkonom do 10MWee,,§§ vyuvyužžíívanie obnovitevanie obnoviteľľných zdrojov energiených zdrojov energie, t.j. výstavba, , t.j. výstavba,
modernizmodernizáácia alebo rekoncia alebo rekonšštrukcia: trukcia: üü malých vodných elektrmalých vodných elektráárnrníí ss výkonom do 10MW,výkonom do 10MW,üü zariadenzariadeníí na energetickna energetickéé vyuvyužžitie biomasy itie biomasy
(min. in(min. inšštalovaný výkon 50kWtalovaný výkon 50kWtt alebo 50kWalebo 50kWee),),üü zariadenzariadeníí na vyuna využžitie slneitie slneččnej energie,nej energie,üü zariadenzariadeníí na vyuna využžitie geotermitie geotermáálnej energie,lnej energie,üü zariadenzariadeníí na vyuna využžitie veternej energie.itie veternej energie.
SlovenskSlovenskáá energetickenergetickáá agentagentúúra, ra, www.sea.gov.skwww.sea.gov.sk

SlovenskSlovenskáá energetickenergetickáá agentagentúúra, ra, www.sea.gov.skwww.sea.gov.sk
Podpora úspor energie a využitia obnoviteľných zdrojov energieSchéma štátnej pomoci – regionálna pomoc – oprávnenénáklady:
ØØ nnááklady na obstaranie klady na obstaranie hmotnhmotnéého investiho investiččnnéého majetkuho majetku((pozemky, budovy, stroje, prpozemky, budovy, stroje, príístroje astroje a zariadenia),zariadenia),
ØØ nnááklady na obstaranie klady na obstaranie nehmotnnehmotnéého investiho investiččnnéého majetkuho majetku((patentovpatentovéé prprááva, licencie, va, licencie, knowknow--howhow alebo nepatentovanalebo nepatentovanéétechnicktechnickéé vedomosti) : vedomosti) : üü podiel npodiel náákladov nesmie presiahnukladov nesmie presiahnuťť 25% opr25% opráávnených investivnených investiččných ných
nnáákladov,kladov,üü výluvýluččne poune použžíívaný u prvaný u prííjemcu pomoci (v podniku, ktorý dostjemcu pomoci (v podniku, ktorý dostááva va
pomoc),pomoc),üü odpisovateodpisovateľľnýný majetok,majetok,üü zakzakúúpený od tretpený od tretíích strch stráán na zn na zááklade trhových podmienok,klade trhových podmienok,üü zaradený do majetku przaradený do majetku prííjemcu pomoci na dobu minimjemcu pomoci na dobu minimáálne plne pääťť rokov.rokov.

Podpora úspor energie a využitia obnoviteľných zdrojov energieSchéma štátnej pomoci – regionálna pomoc – intenzita pomoci, výška pomoci:
SlovenskSlovenskáá energetickenergetickáá agentagentúúra, ra, www.sea.gov.skwww.sea.gov.sk
ØØ intenzita pomoci:intenzita pomoci:ü 50% oprávnených nákladov+ 15 %, ak podnikateľ spĺňa kritériá definície MSP,
ØØ vývýšška pomoci:ka pomoci:ü min. 50 000,- EUR,ü max. 5 mil. EUR.

SlovenskSlovenskáá energetickenergetickáá agentagentúúra, ra, www.sea.gov.skwww.sea.gov.sk
Podpora úspor energie a využitia obnoviteľných zdrojov energieSchéma štátnej pomoci – regionálna pomoc – výnimky:
ØØ RegionRegionáálna pomoc sa neposkytuje pre nasledujlna pomoc sa neposkytuje pre nasledujúúce odvetvia:ce odvetvia:üü popoľľnohospodnohospodáárstvo, rstvo, üü rybrybáárstvo, rstvo, üü uhouhoľľný priemysel, ný priemysel, üü oceliarsky priemysel, oceliarsky priemysel, üü lodiarsky priemysel, lodiarsky priemysel, üü priemysel syntetických vlpriemysel syntetických vláákien, kien, üü automobilový priemysel,automobilový priemysel,üü doprava,doprava,üü ččinnosti spojeninnosti spojenéé ss výrobou, výrobou, spracovanspracovaníímm aa predajompredajom
výrobkovvýrobkov uvedených vuvedených v PrPríílohelohe II ZmluvyZmluvy oo zalozaložženeníí ES.ES.

SlovenskSlovenskáá energetickenergetickáá agentagentúúra, ra, www.sea.gov.skwww.sea.gov.sk
Podpora úspor energie a využitia obnoviteľných zdrojov energieSchéma štátnej pomoci – pomoc na životné prostredie –oprávnené projekty:
ØØ úúspory energie spory energie (opatrenia na (opatrenia na úúsporu energie ssporu energie súú ččinnosti, ktorinnosti, ktorééumoumožžnia prnia prííjemcovi znjemcovi zníížžiiťť mnomnožžstvo energie poustvo energie použžitej vitej v jeho jeho výrobnom procese),výrobnom procese),
ØØ kombinovankombinovanáá výroba elektriny avýroba elektriny a teplatepla na na bbááze ze fosfosíílnychlnychpalpalíívv ss maximmaximáálnymlnym ininšštalovanýmtalovaným výkonomvýkonom do 50MWdo 50MWe e (za (za predpokladupredpokladu, , žže e sasa preukpreukáážžee prospeprospeššnosnosťť opatrenopatreníí na ochranu na ochranu žživotnivotnéého ho prostrediaprostredia zz dôvodudôvodu zvlzvlášášťť vysokejvysokej úúččinnosti innosti premenypremeny –– SmernicaSmernica EC/2004/8)EC/2004/8)

Podpora úspor energie a využitia obnoviteľných zdrojov energieSchéma štátnej pomoci – pomoc na životné prostredie –oprávnené projekty:
SlovenskSlovenskáá energetickenergetickáá agentagentúúra, ra, www.sea.gov.skwww.sea.gov.sk
ØØ vyuvyužžíívanie obnovitevanie obnoviteľľných zdrojov energiených zdrojov energie, t.j. výstavba, , t.j. výstavba, modernizmodernizáácia alebo rekoncia alebo rekonšštrukcia: trukcia: üü malých vodných elektrmalých vodných elektráárnrníí ss výkonom do 10MW,výkonom do 10MW,üü zariadenzariadeníí na energetickna energetickéé vyuvyužžitie biomasy itie biomasy
(min. in(min. inšštalovaný výkon 500kWtalovaný výkon 500kWtt alebo 500kWalebo 500kWee),),üü zariadenzariadeníí na vyuna využžitie slneitie slneččnej energie,nej energie,üü zariadenzariadeníí na vyuna využžitie geotermitie geotermáálnej energie,lnej energie,üü zariadenzariadeníí na vyuna využžitie veternej energie.itie veternej energie.

SlovenskSlovenskáá energetickenergetickáá agentagentúúra, ra, www.sea.gov.skwww.sea.gov.sk
Podpora úspor energie a využitia obnoviteľných zdrojov energieSchéma štátnej pomoci – pomoc na životné prostredie –oprávnené náklady – OZE:
ØØ zvýzvýššenenéé investiinvestiččnnéé nnáákladyklady, ktor, ktoréé musmusíí podnikatepodnikateľľ znznášášaaťťvv porovnanporovnaníí ss konvenkonvenččnou elektrnou elektráárrňňou sou s rovnakým výkonom rovnakým výkonom vv podmienkach efektpodmienkach efektíívnej výroby energie.vnej výroby energie.
znzníížženenéé oo vvššetky etky úúspory vonkajspory vonkajšíších nch náákladov akladov a o tro tržžby by dosiahnutdosiahnutéé vv ssúúvislosti svislosti s realizrealizááciou projektu po dobu piatich ciou projektu po dobu piatich po sebe nasledujpo sebe nasledujúúcich rokov od ukoncich rokov od ukonččenia realizenia realizáácie projektu cie projektu ((prepoprepoččetet na na ssúúččasnasnúú hodnotu khodnotu k termtermíínu nu podaniapodania žžiadostiiadosti))

ØØ Intenzita pomoci:Intenzita pomoci:ü 40% oprávnených nákladov resp. resp. 50%50% pri pri
zabezpezabezpeččeneníí sebestasebestaččnosti znosti záásobovania sobovania energiou zenergiou z OZE pre danOZE pre danúú obytnobytnúú oblasoblasťť (min. (min. 30000 30000 obyvateobyvateľľov),ov),
+ 10 %, ak podnikateľ spĺňa kritériá definície MSP,+ 10 %, ak miesto realizácie projektu patrí do regiónu
podľa čl. 87, ods. 3 písm. a) Zmluvy o založení ES,
resp.resp.ü 50% oprávnených nákladov (max. reg. pomoc),(max. reg. pomoc),+ 10 %, ak podnikateľ spĺňa kritériá definície MSP,
Podpora úspor energie a využitia obnoviteľných zdrojov energieSchéma štátnej pomoci – pomoc na životné prostredie – intenzita pomoci – OZE:
SlovenskSlovenskáá energetickenergetickáá agentagentúúra, ra, www.sea.gov.skwww.sea.gov.sk

SlovenskSlovenskáá energetickenergetickáá agentagentúúra, ra, www.sea.gov.skwww.sea.gov.sk
Podpora úspor energie a využitia obnoviteľných zdrojov energieSchéma minimálnej pomoci – oprávnené projekty:
ØØ úúspory energie,spory energie,ØØ kombinovankombinovanáá výroba elektriny avýroba elektriny a teplatepla na bna bááze fosze fosíílnych lnych
palpalíív sv s maximmaximáálnym inlnym inšštalovaným výkonom do 5MWtalovaným výkonom do 5MWee,,ØØ vyuvyužžíívanie obnovitevanie obnoviteľľných zdrojov energiených zdrojov energie, t.j. výstavba, , t.j. výstavba,
modernizmodernizáácia alebo rekoncia alebo rekonšštrukcia: trukcia: üü malých vodných elektrmalých vodných elektráárnrníí ss výkonom do 5MW,výkonom do 5MW,üü zariadenzariadeníí na energetickna energetickéé vyuvyužžitie biomasy itie biomasy
(max. in(max. inšštalovaný výkon 10MWtalovaný výkon 10MWtt alebo 5MWalebo 5MWee),),üü zariadenzariadeníí na vyuna využžitie slneitie slneččnej energie,nej energie,üü zariadenzariadeníí na vyuna využžitie geotermitie geotermáálnej energie,lnej energie,üü zariadenzariadeníí na vyuna využžitie veternej energie,itie veternej energie,
ØØ ššttúúdie realizovatedie realizovateľľnosti.nosti.

SlovenskSlovenskáá energetickenergetickáá agentagentúúra, ra, www.sea.gov.skwww.sea.gov.sk
Podpora úspor energie a využitia obnoviteľných zdrojov energieSchéma minimálnej pomoci – intenzita pomoci, výška pomoci:
ØØ intenzita pomoci:intenzita pomoci:ü max. 65% oprávnených nákladov
ØØ vývýšška pomoci:ka pomoci:ü min. 100 000,- Sk,ü max. 100 000,- EUR po dobu troch po sebe nasledujúcich
rokov

Podpora úspor energie a využitia obnoviteľných zdrojov energieSchéma minimálnej pomoci – intenzita pomoci, výška pomoci:
SlovenskSlovenskáá energetickenergetickáá agentagentúúra, ra, www.sea.gov.skwww.sea.gov.sk
ØØ pomoc depomoc de--minimis sa neposkytuje pre:minimis sa neposkytuje pre:üü popoľľnohospodnohospodáárstvo, rstvo, üü rybrybáárstvo, rstvo, üü kultkultúúra,ra,üü vodohospodvodohospodáárstvo,rstvo,üü oceliarsky priemysel, oceliarsky priemysel, üü lodiarsky priemysel, lodiarsky priemysel, üü automobilový priemysel,automobilový priemysel,üü dopravu,dopravu,üü ččinnosti spojeninnosti spojenéé ss výrobou, výrobou, spracovanspracovaníímm aleboalebo marketingommarketingom výrobkovvýrobkov
uvedených vuvedených v PrPríílohelohe II ZmluvyZmluvy oo zalozaložženeníí ES,ES,üü ččinnosti sinnosti súúvisiace svisiace s vývozom, hlavne priamo prepojenvývozom, hlavne priamo prepojenéé ss vyvezenými vyvezenými
mnomnožžstvami, zriastvami, zriaďďovanie aovanie a prevpreváádzkovanie distribudzkovanie distribuččných sietných sietíí,,üü projekty, kde je podmienenprojekty, kde je podmienenéé uprednostnenie domuprednostnenie domáácich tovarov pred cich tovarov pred
dovdováážžanými.anými.

SlovenskSlovenskáá energetickenergetickáá agentagentúúra, ra, www.sea.gov.skwww.sea.gov.sk
Podpora podnikania, inovácií a aplikovaného výskumu Všeobecný cieľ:
ØØ zvýzvýššenie konkurencieschopnosti priemyslu prostrednenie konkurencieschopnosti priemyslu prostrednííctvom: ctvom:
üü rozvoja výskumu a vývoja realizovanrozvoja výskumu a vývoja realizovanéého podnikmi,ho podnikmi,üü podpory nových inovapodpory nových inovaččných technolných technolóógigiíí, postupov a , postupov a
výrobkov,výrobkov,üü rozvrozvííjania pevnejjania pevnejšíších vch vääzieb medzi podnikmi a zieb medzi podnikmi a
výskumnými a vývojovými organizvýskumnými a vývojovými organizááciami. ciami.

SlovenskSlovenskáá energetickenergetickáá agentagentúúra, ra, www.sea.gov.skwww.sea.gov.sk
Podpora podnikania, inovácií a aplikovaného výskumu Pravidlá poskytovania pomoci:
ØØ schschéémy my ššttáátnej pomocitnej pomoci::üü SchSchééma ma ššttáátnej pomoci na podporu priemyselntnej pomoci na podporu priemyselnéého ho
výskumu a výskumu a predspredsúúťťaažžnnééhoho vývojavývoja,,
ØØ schschéémy my minimminimáálnej pomoci:lnej pomoci:üü SchSchééma na podporu výskumu a vývoja, zavma na podporu výskumu a vývoja, zaváádzania dzania
systsystéémov manamov manažžéérstva kvality, ochrany priemyselných rstva kvality, ochrany priemyselných prprááv av a zavzaváádzania technických noriem do výrobnej praxe dzania technických noriem do výrobnej praxe aa do sludo služžiebieb

SlovenskSlovenskáá energetickenergetickáá agentagentúúra, ra, www.sea.gov.skwww.sea.gov.sk
Podpora podnikania, inovácií a aplikovaného výskumu Schéma štátnej pomoci - oprávnené projekty:
ØØ priemyselný výskum,priemyselný výskum,ü systematická činnosť zameraná na získanie nových poznatkov a ich praktické
využitie pri vývoji nových výrobkov, procesov, technologických postupov a zariadení alebo služieb alebo pri podstatnom zdokonalení existujúcich výrobkov, procesov, technologických postupov a zariadení alebo služieb.
ØØ predspredsúúťťaažžnýný vývoj,vývoj,ü usmernenie výsledkov výrobného výskumu do plánu, projektu, úpravy alebo
návrhu nového, zmeneného alebo vylepšeného výrobku, postupu alebo služby určených na predaj alebo používanie a ich systematické využívanie pri výrobe materiálov, zariadení, systémov, metód a procesov. Výstupom tohto procesu môže byť aj zhotovenie prvého nekomerčného prototypu a jeho overenie.
ØØ technicktechnickéé ššttúúdie realizovatedie realizovateľľnosti.nosti.

Podpora podnikania, inovácií a aplikovaného výskumu Schéma štátnej pomoci - oprávnené projekty:
SlovenskSlovenskáá energetickenergetickáá agentagentúúra, ra, www.sea.gov.skwww.sea.gov.sk
Ø výrobné procesy a systémy orientované na technologickéobrábanie, spájanie a tvorbu konštrukčných celkov, procesnéa chemické inžinierstvo, nové výrobné prvky pre farmáciu a agrochémiu, technológie s priaznivým účinkom na životnéprostredie,
Ø nové materiály pre použitie v strojárenskom, elektrotechnickom, chemickom, stavebnom, ťažobnom, potravinárskom priemysle a ďalších spracovateľských odvetviach,
Ø materiály získané recykláciou odpadu,Ø moderné technológie napr. inteligentné systémy riadenia,
nanotechnológie, biotechnológie ...,

SlovenskSlovenskáá energetickenergetickáá agentagentúúra, ra, www.sea.gov.skwww.sea.gov.sk
Podpora podnikania, inovácií a aplikovaného výskumu Schéma štátnej pomoci - oprávnené projekty:
Ø technológie na využitie prírodných zdrojov s cieľom ochrany životného prostredia,
Ø technológie na energetické a neenergetické využitie uhlia a uhlíkatých surovín,
Ø technológie na racionálne využitie energie,Ø technológie na využívanie obnoviteľných energetických
zdrojov.

SlovenskSlovenskáá energetickenergetickáá agentagentúúra, ra, www.sea.gov.skwww.sea.gov.sk
Podpora podnikania, inovácií a aplikovaného výskumu Schéma štátnej pomoci - oprávnené náklady:
ØØ nnááklady obstarania,klady obstarania,ü náklady na spotrebovaný materiál, ktorý je spotrebovaný
výlučne v rámci podporovaného projektu,ü náklady na prístroje, zariadenia, pozemky a priestory
používané výlučne a nepretržite na výskumnú činnosť,ü náklady na externé konzultačné alebo poradenské služby
vynaložené výlučne v súvislosti s realizáciou projektu,ü náklady na obstaranie nových technológií alebo obstaranie
priemyselných práv v priamej spojitosti s realizáciou projektu.

SlovenskSlovenskáá energetickenergetickáá agentagentúúra, ra, www.sea.gov.skwww.sea.gov.sk
Podpora podnikania, inovácií a aplikovaného výskumu Schéma štátnej pomoci - oprávnené náklady:
ØØ nnááklady spracovania:klady spracovania:ü mzdové a ostatné osobné náklady pracovníkov
zapojených výlučne do výskumnej a vývojovej činnosti v rámci projektu, ktoré pokrývajú čas práce nevyhnutnej na realizáciu projektu,
ü náklady na zdravotné a nemocenské poistenie, dôchodkové zabezpečenie a na príspevok na poistenie v nezamestnanosti tuzemských zamestnancov platenézamestnávateľom podľa osobitných predpisov, ktoré sa viažu k osobným nákladom pracovníkov zapojených do výskumnej a vývojovej činnosti,

SlovenskSlovenskáá energetickenergetickáá agentagentúúra, ra, www.sea.gov.skwww.sea.gov.sk
Podpora podnikania, inovácií a aplikovaného výskumu Schéma štátnej pomoci - oprávnené náklady:
ØØ nnááklady spracovania:klady spracovania:ü cestovné náklady (tuzemské a zahraničné) priamo
súvisiace s realizáciou projektu, ü náklady na dopravu tovaru, ktorý sa vzťahuje k predmetu
riešenej úlohy výskumu a vývoja,ü odpisy majetku využívaného na riešenie projektu
s výnimkou motorových vozidiel všetkých foriem, ü režijné náklady súvisiace s realizáciou projektu.

SlovenskSlovenskáá energetickenergetickáá agentagentúúra, ra, www.sea.gov.skwww.sea.gov.sk
Podpora podnikania, inovácií a aplikovaného výskumu Schéma štátnej pomoci – intenzita pomoci:
ØØ priemyselný výskum:priemyselný výskum:ü 50% oprávnených nákladov+ 10 %, ak podnikateľ spĺňa kritériá definície MSP,+ 10 %, ak miesto realizácie projektu patrí do regiónu podľa
čl. 87, ods. 3 písm. a) Zmluvy o založení ES,+ 15 %, ak projekt má rovnaké zámery a ciele ako aktuálny
rámcový program Európskej únie v oblasti výskumu a vývoja, avšak len za predpokladu, že výsledky projektu sa dajú aplikovať vo viacerých odvetviach priemyslu.
ü kumulácia do max. 75 % oprávnených nákladov

SlovenskSlovenskáá energetickenergetickáá agentagentúúra, ra, www.sea.gov.skwww.sea.gov.sk
Podpora podnikania, inovácií a aplikovaného výskumu Schéma štátnej pomoci – intenzita pomoci:
ØØ predspredsúúťťaažžnýný vývoj:vývoj:ü 25% oprávnených nákladov+ 10 %, ak podnikateľ spĺňa kritériá definície MSP,+ 10 %, ak miesto realizácie projektu patrí do regiónu podľa
čl. 87, ods. 3 písm. a) Zmluvy o založení ES,+ 15 %, ak projekt má rovnaké zámery a ciele ako aktuálny
rámcový program Európskej únie v oblasti výskumu a vývoja, avšak len za predpokladu, že výsledky projektu sa dajú aplikovať vo viacerých odvetviach priemyslu.
ü kumulácia do max. 50 % oprávnených nákladov
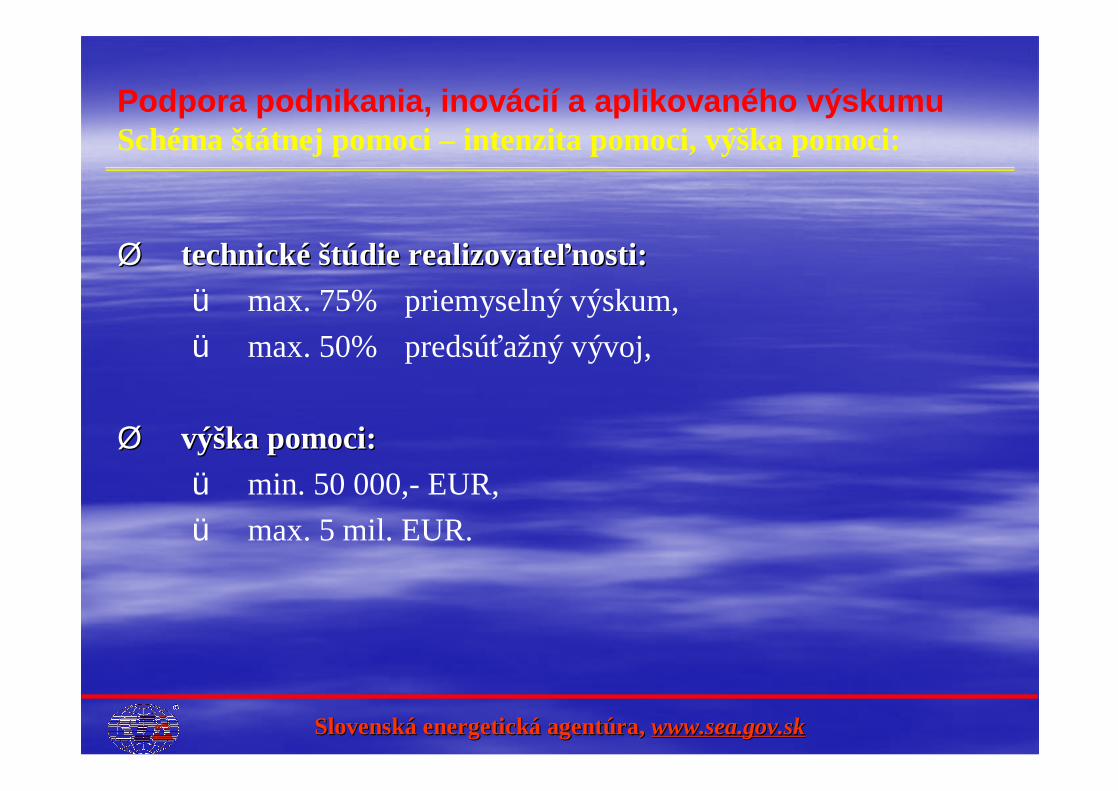
SlovenskSlovenskáá energetickenergetickáá agentagentúúra, ra, www.sea.gov.skwww.sea.gov.sk
Podpora podnikania, inovácií a aplikovaného výskumu Schéma štátnej pomoci – intenzita pomoci, výška pomoci:
ØØ technicktechnickéé ššttúúdie realizovatedie realizovateľľnosti:nosti:ü max. 75% priemyselný výskum,ü max. 50% predsúťažný vývoj,
ØØ vývýšška pomoci:ka pomoci:ü min. 50 000,- EUR,ü max. 5 mil. EUR.

SlovenskSlovenskáá energetickenergetickáá agentagentúúra, ra, www.sea.gov.skwww.sea.gov.sk
ØØ priemyselný výskum,priemyselný výskum,ØØ predspredsúúťťaažžnýný vývoj,vývoj,ØØ technicktechnickéé ššttúúdie realizovatedie realizovateľľnosti,nosti,ØØ systsystéémy manamy manažžéérstva kvality,rstva kvality,ØØ ochrana priemyselných prochrana priemyselných prááv,v,ØØ certifikcertifikáácia (výrobky, orgcia (výrobky, orgáány) a akreditny) a akreditáácia (laboratcia (laboratóóririáá, ,
výrobnvýrobnéé procesy, organizprocesy, organizáácie),cie),ØØ implementovanie technických noriem do výrobnej praxe a implementovanie technických noriem do výrobnej praxe a
sluslužžieb.ieb.
Podpora podnikania, inovácií a aplikovaného výskumu Schéma minimálnej pomoci – oprávnené projekty:

SlovenskSlovenskáá energetickenergetickáá agentagentúúra, ra, www.sea.gov.skwww.sea.gov.sk
Podpora podnikania, inovácií a aplikovaného výskumu Schéma minimálnej pomoci – intenzita pomoci, výška pomoci:
ØØ intenzita pomoci:intenzita pomoci:ü max. 65% oprávnených nákladov
ØØ vývýšška pomoci:ka pomoci:ü min. 10 000,- Sk,ü max. 100 000,- EUR po dobu troch po sebe nasledujúcich
rokov


INTERREG III C Dária Juhásová Ministry of Economy of the Slovak Republic Pre-Accession Aid and Interregional Cooperation Department Mierová 19, 827 15 Bratislava, Slovak Republic, Phone: +421 2 485 450 19 E-mail: [email protected]

Ministry of Economy of the Slovak Republic
Dária JuhásováPre-Accession Aid and International Slovak Biomass ForumInterregional Cooperation Department Bratislava, February 22, 2005

The INTERREG Community Initiative
INTERREG is one of the most successful EU funding
programmes
INTERREG III receives 50% of the funds dedicated to
Community Initiatives (CI).
In the current funding period it is the biggest CI with
4,875 billion ERDF

The INTERREG InitiativeMain objectives
economic and social cohesion
balanced and sustainable development of the• European territory
territorial integration with candidate and other neighbouring countries

Co-operation Area
entire EU territory including insular and outermost regions
Norway, Switzerland
new member states and new candidate countries
MEDA countries
other interested countries

INTERREG III components
INTERREG IIIABilateral cooperation in all fields of public policy
INTERREG IIIB
Transnational cooperation for spatial and regional development in greater EU areas
INTERREG IIIC
Interregional cooperation for regional policy development and Structural Funds efficiency over the whole EU territoriy

Responsibility – National authorityaccording to the government resolution No.359/2002
INTERREG III
cross-borderco-operation
transnationalco-operation
interregionalco-operation
INTERREG IIIA INTERREG IIICINTERREG IIIB
Ministry of Economy of theSlovak Republic
Ministry of Constructionand Regional Developmentof the Slovak Republic
Ministry for EnvironmentOf the Slovak Republic

Budget of INTERREG III
Total – € 4 875 milion
IIIC
IIIA
IIIB
IIIA – € 3 266 millionIIIB – € 1 316 millionIIIC – € 293 million

Focus on INTERREG IIIC

Programme Zones - INTERREG III C
Joint Technical Secretariats
North: Rostock, GermanyEast: Vienna, AustriaSouth: Valencia, SpainWest: Lille, France
North
East
South
West

Topics for CooperationActivities can cover a wide rage of themes closely related to regional development policy. These are divided into five key topics:
Structural Funds Objective 1 and 2INTERREG programmesUrban developmentInnovative ActionsOther appropriate subjects
Additional topic for co-operation in the North, East and South zone - „Border region operations“.

Types of Operations

Participation
??? Who can participate???
For Individual and network projects:public authorities and public equivalent bodies
For RFOs: regional public bodies or regional public equivalent bodies

Lead Partner principle
LP has full responsibility for administrative co-ordinationand financial management of the operation
LP concludes subsidy contract with MA on ERDF and isresponsible for project implementation according to contract
LP needs to set up efficient administrative managementand control systems
LP needs to produce regular progress reports and finalreport at the end of the operation
LP is responsible for ensuring proper communication withpartners, timely reporting and payments

ERDF Budgets per Programme Zone
Altogether 293 million EUR ERDF funds are available for co-financing operations plus 2.7 million EUR Norwegian national funds as well as 15 million EUR for border region operations.

Number of applications received (1st – 4th round) All zones
21 2793
18
159
2964
118
40
251
3366
156
40
295
27
11558
200
110
272
367
156
905
0
100
200
300
400
500
600
700
800
900
1000
North East South West Total
1st round 2nd round 3rd round 4th round Total

EU 25 partners All zones279
235
182
141120 120
101
71 69 64 63 60 5840 36 35 33 30 27 25 24 22 15 10 3
0
50
100
150
200
250
300
Italy
Spai
nGer
man
yFr
ance
Greec
e
Unite
d Ki
ngdo
mPo
land
Portu
gal
Hunga
ryFin
land
Nethe
rland
sAu
stria
Swed
en
Czec
h Re
publ
icLit
huan
iaBe
lgiu
mSl
oven
iaIre
land
Esto
nia
Denm
ark
Slov
ak R
epub
licLa
tvia
Malt
aCy
prus
Luxe
mbu
rg


Calls
1st Call October 2002 – January 20031 project partner
2nd Call June 2003 – September 200312 project partners
3rd Call March 2004 – April 20049 project partners
4th Call June 2004 – November 20042 + project partners


Example of INTERREG IIIC project:
ROBINWOOD
Both, Prešov and Košice Self-government regions will be involvedinto the project ROBINWOOD, which aims at solving, at the regional level, the problems of utilization of biomass.
Main objective:integrated forestry development and creation of a woodland chain processin rural areas
Specific objectives:1. To introduce suistainable development of forests and protection of biodiversity2. To remedy hydrogeological instability.3. To use regional sources for wood as a fuel source.4. To increase socio-economic potential for the forestry sector
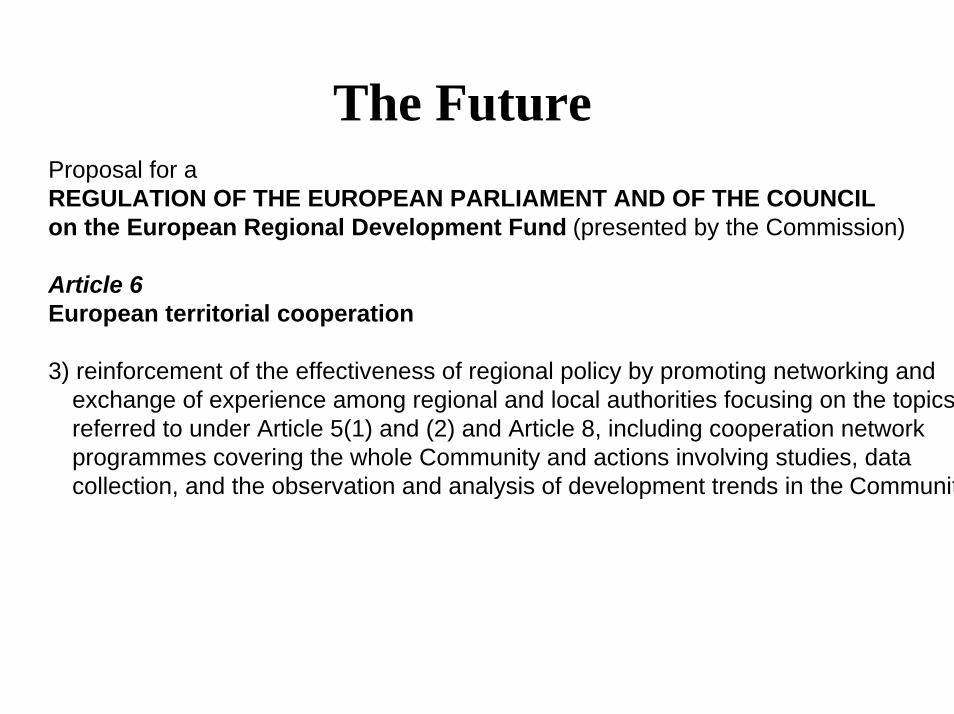
The FutureProposal for aREGULATION OF THE EUROPEAN PARLIAMENT AND OF THE COUNCILon the European Regional Development Fund (presented by the Commission)
Article 6European territorial cooperation
3) reinforcement of the effectiveness of regional policy by promoting networking andexchange of experience among regional and local authorities focusing on the topicsreferred to under Article 5(1) and (2) and Article 8, including cooperation networkprogrammes covering the whole Community and actions involving studies, datacollection, and the observation and analysis of development trends in the Communit

Thank you
For
Your
Attention

GUARANTEE PROGRAM SUPPORTING ENRGY EFFICIENCY INVESTMENT IN SLOVAKIA
Ing. Bronislava Herdová Energy centre Bratislava, Ambrova 35, 831 01 Bratislava, Slovakia Phone: 00421 2 59 30 00 91 E-mail: [email protected] Ing. Pavol Vajda Regional Program Manager International Finance Corporation Michalská 23, 811 03 Bratislava, Slovakia Phone: 00421 2 5441 1182 E-mail: [email protected] ABSTRACT This article describes support program developed by IFC in cooperation with the Global Environment Facility “Commercializing Energy Efficiency Finance (CEEF). The aim of this program is to support energy efficiency through mobilizing private capital investment through commercially-based investment, and establishing sustainable commercial lending businesses. CEEF is designed to ensure a lasting developmental impact by building a self-sustaining market for financing EE investment. The project works through multiple FI partners in seeking to catalyze investment across a broad range of end-user groups and market segments. In addition, the project's technical assistance component is targeted at building energy efficiency finance expertise in the financial sector and among local project developers. By lowering barriers to local FIs entering the EE financing market, the CEEF program helps to increase the local financial sectors' experience and capacity to provide EE project finance on an ongoing, and eventually, on an independent basis. COMMERCIALIZING ENERGY EFFICIENCY FINANCE PROGRAM (CEEF) Central European countries remain three to five times more inefficient in energy use than their Western European neighbours. This means that for producing the same product or for achieving the same room thermal comfort, the energy consumption is three times higher than the European Union standard. This inefficiency impairs economic competitiveness, creates social pressures, causes air pollution, and poses challenges in relation to EU membership. The demand for new, energy-efficient technologies is strong, but there is little capital available. Experiences show that one of the most important barriers, which prevent increasing energy efficiency and using of renewable energy sources, is lack of available investment capital. Relatively long payback and less known technical solutions are the reasons why banks evaluate these projects as more risky in

comparison to other types of projects. This finally means for investors higher interest rates and requirement on certain bank guarantee. Bank guarantee programs are on the first place, whereas also the Slovak government recently stated by the evaluation of small and medium enterprising that accession of entrepreneurs to investment capital makes harder mostly lack of bank guarantees. To promote implementation of energy efficiency projects and support using of renewable energy sources, IFC, in partnership with the Global Environment Facility and with the support of international donors including Finland, Spain and the USA, has established The Commercializing Energy Efficiency Finance (CEEF) facility to provide a partial guarantee for loans made by local financial intermediaries when they invest in energy efficiency projects. The goal is to build a sustainable market for financing energy efficiency. The initiative uses a combination of technical assistance and credit enhancement instruments to enable local financial institutions to develop a profitable business in energy efficiency lending. This effort will have significant economic, environmental, and social benefits, and it supports the participating countries’ targets for EU membership. Examples of program impacts in Hungary include investments in projects to upgrade street lighting in small towns, replacement of outdated and unreliable heating technologies or reconstructions of blockhouses. The program is available in Czech Republic, Estonia, Latvia, Lithuania and Slovakia. HOW DOES CEEF WORK? Based on a successful pilot energy efficiency finance guarantee program that has been running since 1997 in Hungary, CEEF works in partnership with local financial institutions (banks and leasing companies), project developers (e.g. Energy Service Companies [ESCOs], equipment suppliers, operating and maintenance companies) and investors. CEEF offers partial guarantees to financial institutions to share the risk of loans provided for energy efficiency investments, which these institutions would fund with their own resources. In addition to the partial guarantees the program also provides Technical Assistance (TA) to assist all program participants in development and assessment of their projects. WHAT IS A PARTIAL GUARANTEE ?
• IFC will provide the commercial financial lender with a guarantee of up to 50% of the outstanding principal of the loan, to a maximum amount of $1,875,000 for a seven year term.
• There is no minimum size for an individual loan if we are considering a portfolio of small projects, however, the minimum size of a standalone guarantee is US$50 000 .
PROJECT REQUIREMENTS Each project has to meet specific requirements in order to qualify for an IFC CEEF guarantee:
• Implementation of a project has to lead to energy savings and, directly or indirectly, to a reduction in greenhouse gas emissions.

• The project has to be economically feasible and, in particular, has to meet specific credit requirements of the financial institution.
EXAMPLES OF ELIGIBLE PROJECT Energy efficiency measures can be found everywhere that energy is produced, transmitted, delivered, consumed or stored. CEEF can support most projects that save energy. Some typical project examples include:
• energy efficiency measures in buildings (wall insulation, pipe work insulation, heating controls, boiler replacement, heating substation installation or replacement, lighting system modernization);
• street lighting upgrades; • district heating refurbishment or boiler improvements; • cogeneration systems; • projects aimed at improving the efficiency of energy use in industrial
processes. (for example, lighting, boiler upgrades and controls, cogeneration
• systems, energy management control systems, variable speed motors, power factor correction, waste heat recovery);.
• various renewable energy projects such as biomass, small hydro power plants, wind energy, solar energy and geothermal energy;
TECHNICAL ASSISTANCE An important part of the CEEF program is an extensive Technical Assistance (TA) component, to help local financial institutions assess the projects and market their Energy Efficiency financing products. This donor funding can help project developers prepare projects for investment, and assist energy efficiency businesses in building their marketing and financing capacities. The scope of assistance provided is very broad and covers a number of different areas such as: energy audits, review of feasibility studies, detailed banking product development, assistance to raise corporate finance for an ESCO, development of a tender to bring international ESCOs into a market. Technical assistance work is delivered by a team of international and local experts and teams are tailored specifically to the assignment needs. REFERENCES [1] www.ifc.org/ceef

ENERGY EFFICIENCY PROJECTS FINANCING FROM PRIVATE SOURCES
Marián Rutšek Project Director EETEK Slovakia, spol. s r.o., Zochova 6-8, 811 01 Bratislava Phone: + 421 905 509 302 E-mail: [email protected]
ABSTRACT The paper deals with financing energy efficiency projects from an Energy Service Company (ESCO) point of view, within the framework of energy systems outsourcing. Energy system outsourcing represents a progressive framework for energy efficiency project financing. The ESCO provides its partner with turn-key technical and financial services in order to achieve its expected goal. The post-outsourcing energy efficiency investments should trigger a decrease of partner‘s overall energy costs and increase of the energy system reliability and technical level. Financial costs associated with the investment should be covered from achieved savings as well. The paper introduces the framework terms to be fulfilled for financing of energy systems upgrading following its outsourcing from current structure.
CRITERIA OF ENERGY EFFICIENCY PROJECT Energy Service Companies arrange comprehensive service for its partners that have decided to cooperate with them on the field of energy efficiency projects implementation, to achieve mutual benefits. Energy efficiency project is attractive for both partners if it generates enough savings for covering of investment repayment and in addition it brings benefit for both partners from the beginning of upgraded system operation. Requirement of attractiveness is fulfilled if:
• Simple payback of investment is shorter than 5 years • Investment repayment period is up 8 years • Generated savings can cover the loan repayment • Savings are sufficient to cover repayment of equity provided by investor • Total partner’s costs level including financial costs is lower than one
before project implementation • Both partners can benefit from the costs difference before and after
implementation

ENERGY EFFICIENCY PROJECT IMPLEMENTATION IN THE TERM OF OUTSOURCING Energy efficiency project can be designed and implemented by various arrangements. One of the progressive approaches how to achieve the successful goal is its implementation after outsourcing of energy system from the actual organizational and economical structure. Energy system will be operated as independent company that creates space for combination of effective operation and energy efficiency project implementation. Partner will be unloaded from the issues of energy system operation and its reconstruction. At the same time he will be reliably supplied by energy with lower overall costs as before outsourcing. To achieve this expected goal the ESCO provides turn – key service to its partner:
• Outsourcing of energy system from its actual organizational structure • Energy efficiency project identification • Detailed technical and economical audit of energy system • Development and proposal of energy system upgrading • Development and arrangement of project financing • Project implementation to increase efficiency and reliability of energy
system • Energy supply with new unit prices • Operation, monitoring and evaluation of the project • Further improvement of energy system efficiency during the contractual
period ENERGY EFFICIENCY PROJECT FINANCING EETEK Slovakia as potential investor has stated following framework terms for energy efficiency projects financing within outsourcing concept:
• Investment financing in the full range is arranged by investor • Investment is financed by combination of investor’s equity and bank loan
taken by investor • Minimal investment costs: 1 mil. € • Investment repayment period 7 – 8 years • Contractual period: 15 – 20 years • Investor purchase of rent partner’s energy assets • Investor is owner of implemented assets up to the end of contractual
period • Exit fee of the project is predetermined to the whole contractual period • Investor organizes tenders to identify contractors with the aim of optimal
technical and price investment level securing

CONCLUSION: Process of energy efficiency project financing in the framework of outsourcing is favourable for partner, as he achieves energy supply in required quality and quantity arranged from reliable upgraded energy system. His total energy bill is lower than before without necessity of own resources investment.

BUILDING THE PARTNERSHIP FOR SUSTAINABLE ENERGY: REEEP FOR CEE AND TURKEY
Kristina Vilimate The Regional Environmental Center for Central and Eastern Europe (REC) Ady Endre u. 9-11, 2000, Szentendre, Hungary Phone: +36-26-504-000 E-mail: [email protected] ABSTRACT The Renewable Energy and Energy Efficiency Partnership (REEEP) is an active global partnership that structures policy initiatives for clean energy markets, and facilitates financing for energy projects. The Regional Environmental Center for Central and Eastern Europe serves as a regional REEEP secretariat serving 15 countries in Central and Eastern Europe and Turkey. REEEP and its projects focus on two themes: policy and regulation, and finance. In financing field REEEP supports the creation of new sources of finance to underwrite the higher risk stages of project implementation, creates lasting engagements with local financial institutions, and then replicates these approaches worldwide. In policy field REEEP is working to ensure that regulatory structures encourage the integration of clean energy, promote the efficient use of power, and attract investment to the renewable sector.

www.rec.org
REEEP Regional Secretariat for Central and Eastern Europe and Turkey
Kristina Vilimaite
Project ManagerThe Regional Environmental Center
for Central and Eastern Europe
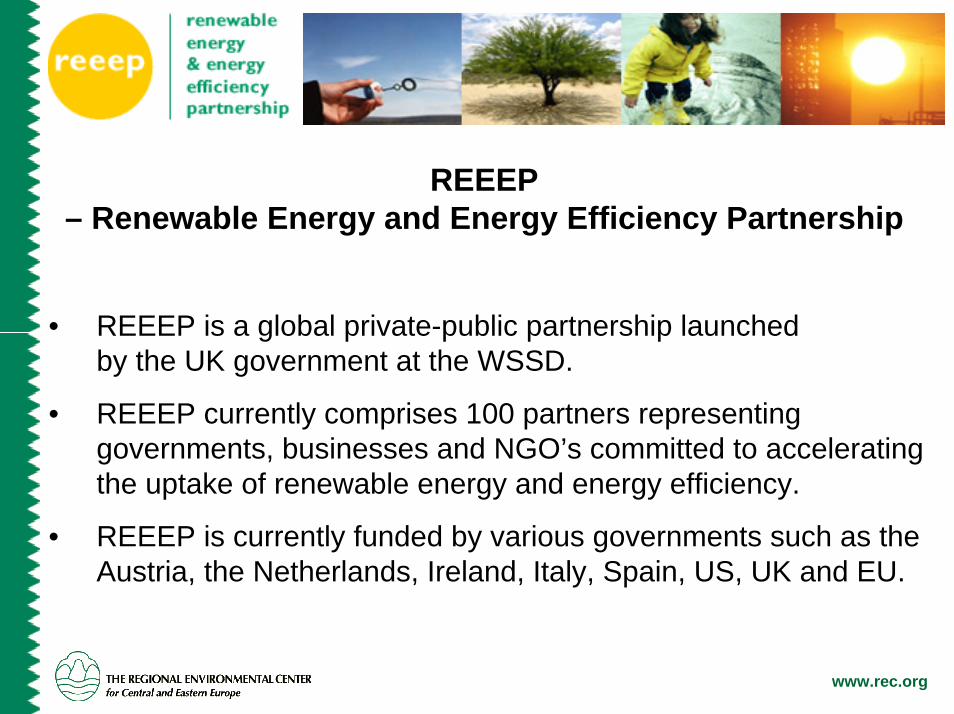
www.rec.org
• REEEP is a global private-public partnership launchedby the UK government at the WSSD.
• REEEP currently comprises 100 partners representing governments, businesses and NGO’s committed to accelerating the uptake of renewable energy and energy efficiency.
• REEEP is currently funded by various governments such as the Austria, the Netherlands, Ireland, Italy, Spain, US, UK and EU.
REEEP– Renewable Energy and Energy Efficiency Partnership

www.rec.org
• Stimulation of a significant global increase of investments in RES energy sources
• Stimulation of significant increase in the global use of energy efficiency measures
• Improvement of rural energy supply in developing and transition countries by utilisation of RES and increase of energy efficiency
REEEP Objectives“generate green kilowatts & save energy”

www.rec.org
Composition of REEEP Partnership
Currently 100 partners:
24 Governments
• 30 International Organizations
• 20 NGO’s
• 26 Companies

www.rec.org
REEEP Structure Guarantees a Good Governance
Programme BoardAmal-Lee Amin
Finance CommitteeJames Cameron
Governing BoardHenry Derwent
International SecretariatMarianne Moscoso-Osterkorn, Director
RS Central & Eastern Europe
REC
RS (East) AsiaCREIA
RS Latin America & the Caribbean
OAS
REEEP Advisory PanelMeeting of Partners /
General AssemblyHenry Derwent
Auditors
RS North AmericaACORE
RS (Southern) AfricaAGAMA

www.rec.org
REEEP Regional Office Africa
REEEP Regional Office Central Europe
REEEP Regional Office East Asia
REEEP Regional Office Latin America &
Caribbean
REEEP Regional Office North America
Delivering Value via Regional Secretariats
REEEP Local Focal Point MEDREP
REEEP Local Focal Point UK High Commission

www.rec.org
Specific Responsibilities of the Regional Offices
• Operate as a regional clearinghouse of information regarding RES/EE
• Serve as coordinator of regional capacity building initiatives
• Identify regional key opportunities for REEEP
• Support REEEP projects and partner interests in a region
• Establish regional REEEP infrastructure
• Call for tender and pre-select projects for funding by REEEP International Secretariat

www.rec.org
REC serves as CEE/Turkey Regional REEEP SecretariatThe REC is:• legally based on a charter signed by the governments of 28
countries and the European Commission • Inter-governmental organisation
– 200 staff– Over 300 running projects– 12 million EUR annual turnover
• 16 Country Offices• Head Office: Szentendre, Hungary• Operation beyond CEE!

www.rec.org
REEEP intends to work with established partnerships across the sustainable energy sector. These partnerships can provide complementary services and skills to the REEEP network.
Examples are:
MEDREP UNIDO WWF UNEPASEAN JREC OAS CREIAGVEP CLASP IEA CDIGNESD US Clean Energy Initiative
Leveraging Existing Partnerships
www.rec.org
REEEP Activities
ServicesProjects
Regulatory and Policy Issues
Innovative Finance
Added Value of REEEP:Replication
ImplementationLeverage
InformationClearinghouse
Dialogue Platform
Awareness Raising andCapacity Building
Project Market Place

www.rec.org
REEEP Funding
ServicesProjectsNational Programs areDedicated to REEEP
•38 Projects financed &managed through GOF(UK)•2 projects financed through BMWA (Austria) & managed through REEEP•CALL 1: 17 projects financed through GOF & managed through REEEP•CALL 2: 30 projects financed through DEFRA
Annual Donation of Donor Countries
Project Administration Fee (10% of the project volume)
Donations from Businessand Organisations
Sell Services

www.rec.org
Policy & Regulation• Assisting governments with sustainable energy blueprints and
regulatory frameworks• Focus on distributed generation and off-grid systems• Enhance the stakeholders capacity and promote Awareness
raising Finance• Leverage local Capital Markets• Reducing Transaction Costs and Managing Risk• Improve Awareness and Capacity of financiers and investors• Dissemination of Data
REEEP Projects Focus on Two Themes

www.rec.org
• Development of sustainable energy plans for three Caribbean islands (Dominica, St. Lucia, Granada)
• Development of a sustainable energy plan for a local district of a Chinese Province
• Sustainable Energy Regulations Network (SERN) in Africa
• Development of regional energy efficiency standards across APEC countries
• Renewable Energy International Law (REIL) project
Examples of Regulatory and Policy Projects

www.rec.org
• Development of business plan for small scale hydro in South Africa
• Funding an investor road show in India to promote a $30M private equity fund for renewables
• Development of business model and community fund for solar water pumps in Brazil
• Assessment of potential for TRECs to finance renewables in Brazil, South Africa & China
• Setting up renewable energy Financing Foundation for ASEAN region
Examples of Finance Projects

www.rec.org
• Contacts with decision makers within partner countries
• Reduced investment risk in developing countries via policy support
• Demonstrate Corporate Social Responsibility
• Increased project credibility
• Easy access to innovative finance
• Marketing of best practice
Benefits of Becoming a REEEP Partner

www.rec.org
• Attract investment (public & private) into the partnership and into RES/EE projects
• Build membership base to increase global presence
• Expand the regional secretariat network for local need assessment and delivery
• Build capacity from existing projects in order to ‘scale-up’learnings into other markets
• Best use of resources through strengthened collaboration with existing energy initiatives (e.g. MEDREP, JEREC)
Priorities of REEEP Moving Forward

www.rec.org
More information:www.reeep.org
REEEP Regional Secretariat for Central and Eastern Europe and Turkey www.rec.org/reeep
The Regional Environmental Center for Central and Eastern Europewww.rec.org
Kristina [email protected]

RATIONALIZATION OF GLYCEROL REFINEMENT
Kocsisová Teodora PhD student Faculty of Chemical and Food Technology STU, Radlinského 9, 812 37 Bratislava Phone: 02 59325 531 E-mail: [email protected] ABSTRACT The article describes the partial refinement of crude glycerol from KOH alkali-catalysed transesterification of vegetable oils and/or animal fats. Heavier liquid phase from transesterification, where glycerol in concentration of 56 – 64 wt. % is present, especially together with alkali potassium soaps, is decomposed with mineral acids HCl, H2SO4, H3PO4 with concentrations 36 – 40 %, in case of H3PO4 85 %. The lowest content of salts at the level of 1.45 wt. % in partially refined glycerol is achieved when H2SO4 is used, at the concentration of glycerol in the raffinate above 95 %. Low raffinate colour at the level of 3 is achieved by adsorption on activated clay or on a mixed adsorbent of clay and active coal. The article yields experimental data and information on the preparation of the crude glycerol, on its partial refinement, as well as on the possibility of its further commercial utilisation. INTRODUCTION Methyl esters of higher fatty acids (ME) are used as alternative fuel, or its component for diesel engines from renewable sources. EU defined the programme of replacement of 2 % of the consumption of liquid fuels by 2005 and 5.75 % by 2010 with biofuels, where ME should be the key component. They are usually prepared by alkali-catalysed transesterificiation of vegetable oils and animal fats with methanol [1]. In order to maintain the production of ME economically attractive, especially with respect to high price of inputs, the attention is focused both at cheaper sources of acylglycerols (AG), especially on used edible oils and fats, and at economical utilisation of by-products from the production of ME. Especially glycerol (G), which is formed as a heavier separate liquid phase, so called glycerol phase (GP) belongs to these products. The fraction of GP represents approximately 16 – 18 % of the weight of the input oil/fat and its composition is not stable. It is influenced by several factors, especially by the acidity number of the input oil. It contains 56 – 64 % of G, 14 – 16 % of alkalies especially in the form of alkali soaps and hydroxides, 18 – 20 % of ME, 10 – 12 % of methanol (MeOH), 2 –3 % of water and further components. The GP itself can be utilised in the production of ME in the treatment of oils and fats with increased acidity [2].

Currently is the offer of GP higher than demand, which results in significant decrease of prices. Tab. 1 summarises the qualitative parameters and prices of commercially utilisable commodities in the area of semi-refined G [3]. Naturally, certain adjustment and partial refinement of GP is necessary, at least to an extent, which meets the requirements for some of the commodity classes. Total refinement of G by vacuum distillation in a film evaporator is both economically and technically demanding. The effort is concentrated on such partial refinement of G, which allows the utilisation of refined G in selected technologies. Ideal utilisation of modified G is possible in the field of fuels, where for example, ketals, acetals, ethers of G with lower alcohols can easily fulfil the function of cetane improver [4], lubrication enhancer [4,5], low temperature properties additive, oxygenate additive with the influence on the composition of exhaust gases, or other parameters [5]. Tab 1. Quality parameters and prices of semi-refined G
(NOR – non-volatile organic residue, MONG – matter organic non-glycerol) Quality G,
min. % wt. Ash,
max. % wt.
MeOH, max. % wt.
NOR, max. % wt.
MONG, max. % wt.
Price, €/kg
A B C
80,0 70,0 90,0
8,0 9,8 2,0
0,5 0,5 0,5
3,0 3,0 1,0
2,0 3,0 1,0
0.171-0.185 0.118-0.131 0.421-0.474
The aim of the presented article is primarily to select such refinement processes with minimum content of salts in partially refined G, but secondarily also to find such refining possibilities even with higher content of salts, but potentially usable for selected application. EXPERIMENTAL Materials. For the study of partial refinement of G from glycerol layer (GL) the GP from alkali-catalysed transesterification of rapeseed oil with KOH/MeOH was used [1]. For the measurements 300 g of GP was used. Three types of mineral acids, HCl 36 % wt., H2SO4 40 % wt., H3PO4 85 % wt. were used for decomposition. The used acids were of pure grade. Methodology of evaluation. The acid number (AN) was determined according to the STN EN 65 6070, sulphate ash according to the STN EN 65 6063. The colour of G was determined according to the colour scale STN 58 0101 on selected specimens only. The content of MONG was not followed in this set of measurements. Working procedure. Decomposition of GP was carried out in a glass vessel at intensive stirring and gradual input of the acid at the temperature of 60 °C. The process of decomposition is monitored by the pH measurement with a pH probe (OMEGA). Four pH values (4.5, 4.0, 3.5, 2.5) were selected by the GP decomposition. After the selected pH value was achieved, the stirring was stopped and the bottom GL was separated. Filtration at elevated temperature is a helpful factor for decomposition, as it removes the formed interlayer. The AN of OL was

determined after the separation, and the balance between OL and GL was carried out. Subsequently, the pH of GL was adjusted to 6 using the 15 % water solution of KOH. After the removal of water and MeOH from GL on a film rotor evaporator at the temperature of 120 – 130 °C and at the pressure of 2 kPa, the GL was cooled a precipitated salts were removed by filtration. RESULTS AND DISCUSSION Tables 2 – 4 summarise the results of measurement of the content of salts in refined G.
Tab.2: Decomposition of G-phase with HCl (36%) Test
No.
pH
end
HCl, mol GL:OL
wt.:wt
AN of OL,
mg KOH/g
KOH for neutr., mol Ash , %
wt.
1
2
3
4
4,5
4,0
3,5
2,5
0,269
0,281
0,293
0,298
77,1:22,9
78,9:21,1
79,4:20,6
77,5:22,5
187,9
181,9
193,9
176,9
0,0067
0,0105
0,0132
0,0141
6,62
6,58
6,79
6,62
Tab.3: Decomposition of G-phase with H3PO4 (85%) Test
No.
pH
end
H3PO4,
mol
GL:OL
wt.:wt
AN of OL,
mg KOH/g
KOH for neutr., mol Ash , %
wt.
5
6
7
8
4,5
4,0
3,5
2,5
0,297
0,309
0,319
0,378
76,6:23,4
78,1:21,9
78,6:21,4
82,7:17,3
187,2
194,5
195,6
194,2
0,0161
0,0182
0,0227
0,0664
4,27
3,25
3,32
3,82
Tab.4: Decomposition of G-phase with H2SO4 (40%) Test
No.
pH
end
H2SO4,
mol
GL:OL
wt.:wt
AN of OL,
mg KOH/g
KOH for neutr., mol Ash , %
wt.
9
10
11
12
4,5
4,0
3,5
2,5
0,306
0,312
0,318
0,322
80,2:19,8
80,1:19,9
80,7:19,3
77,8:22,2
184,5
185,6
190,6
190,8
0,0094
0,0127
0,0136
0,0149
1,46
1,41
1,54
1,74

The results show several interesting points: 1. Based on the measured data the weight ratio GL to OL as well as the AN of
OL does not change after the pH value from 4.5 to 4.0 is achieved, which corresponds with total decomposition of GP.
2. The lowest content of salts (at the level of about 1.5. wt. %) was achieved during the decomposition of the potassium rapeseed GP with sulphuric acid. On the other hand, production of sulphates as by-products is not desirable. It is necessary to realise, that the production of, for example, 1 kg of partially refined G by this process results at the same time in formation of approximately 180 g K2SO4, including the return of the pH value to the final value of 6. From this point of view the formation of potassium phosphates, where the inorganic waste can be used as a fertilizer, would be more beneficial, provided the increased content of salt is not deleterious for the presumptive reactions with partially refined G.
3. The low content of salts in GL, which corresponds to the process with sulphuric acid, will not cause cardinal problems during the total refinement of this GL in vacuum evaporators. In the case of sodium-based GP the results are expected to be even better, as the solubility of Na salts is generally lower.
4. Decomposition of GP with HCl prevails in real production, despite of drawbacks mentioned above (high ash content, ecology): decisive factor is apparently the low price of HCl.
5. The result of the partially refinement of GL using our standard treatment (acidic decomposition, water and MeOH vacuum evaporation, cooling, filtration or centrifugation) is marketable semi-refined G (quality C).
6. Low raffinate colour at the level of 3 of the colour scale STN 580101 is achieved by adsorption on activated clay or on a mixed adsorbent of clay and active coal.
CONCLUSION The results of study of partial refinement of G coupled with bleaching showed that simple processes are available, which lead to acquiring of G concentrates with low content of residual salts with high yield of G, which have a good chance to become starting materials for further synthesis without further difficult refinement steps, e.g. vacuum distillation in evaporators with wiped film. Acknowledgement
The financial support from the Science & Technology Assistance Agency, grant 20-014702, is greatly acknowledged..

REFERENCES
[1] Cvengroš J., Považanec F.: Production and Treatment of Rapeseed Oil Methyl Esters as Alternative Fuels for Diesel Engines. Biores. Technol. 55 (1996) 145-152.
[2] Cvengroš J., Hóka Cs., Molnár Š.: Method for Treating of Vegetable Oils and Animal Fats. SK Pat. Appl. 1229-2000.
[3] Personal communication fa Biorafineria SK, a.s., Liptovský Mikuláš, SR. [4] Wessendorf R.: Glycerinderivate als Kraftstoffkomponenten. Erdol und Kohle-
Erdgas. 48 (1995) 138-143. [5] Delgado P. J: Procedure to obtain biodiesel fuel with improved properties at
low temperature. EP Pat. 1 331 260 A3, 2003.

MOŽNOSTI VYUŽITIA SLAMY NA ENERGETICKÉ ÚČELY Ing. Štefan Pepich Vedúci oddelenia výskumu strojov a technológií Technický s skúšobný ústav pôdohospodársky 900 41 Rovinka, Slovakia ABSTRAKT Pri riešení otázok znižovania nákladov na energiu sa v poslednom období dostávajú do popredia obnoviteľné zdroje energie. Na Slovensku to nie je ani tak otázka ekologická, teda snaha o znižovanie produkcie oxidu uhličitého, ako skôr otázka ekonomická. Enormný nárast cien palív v posledných rokoch (zemný plyn, nafta, benzín, vykurovací olej) má za následok zvýšenie nákladov na výrobu poľnohospodárskych produktov. Napríklad náklady na energiu pri sušení kukurice zemným plynom stúpli od roku 2000, keď' tvorili 29 %-ný podiel, až na 61% v roku 2004.
Z tohto dôvodu sa hľadajú nové a lacnejšie zdroje energie, ktoré by mali nahradiť súčasné tradičné uhľovodíkové palivá. Z tohoto hľadiska sa javí najperspektívnejšia slama. Či už slama obilná alebo repková, slnečnicová alebo kukuričná, ktoré sa v súčasnosti spravidla drvia pri zbere plodín a následne zapracovávajú do pôdy. Slama sa ukazuje ako vhodné palivo z dvoch hlavných dôvodov:
- má vysokú výhrevnosť', ktorá je v priemere okolo 15 MJ/kg, čím sa slama radí v
tabuľke výhrevnosti pred drevné štiepky, dubové i smrekové drevo, hnedé uhlie aj piliny,
- má nízke výrobné náklady na i tonu; ktoré sa pohybujú okolo 150 až 400 Sk/t (lisovanie, zber, odvoz).
Pri využívaní slamy v sušiarenstve sa dajú znížiť náklady na energiu v ideálnom prípade až o 80 %. Slama ako zdroj tepla sa dá však v poľnohospodárskej praxi využívať' nielen v sušiarenstve ale aj na ohrev teplej úžitkovej vody, na ohrev technologickej vody a aj na vykurovanie objektov, či sú to objekty živočíšnej výroby, dielne alebo administratívne priestory.
Možno jednoznačne konštatovať, že využívanie slamy ako zdroja tepla a energie je hľadiska ekonomického vysoko efektívne a perspektívne. Zároveň je potrebné poznamenať, že je aj ekologické, Najbližšie roky, v ktorých bude podpora projektov na využívanie obnoviteľných zdrojov energie narastať, sa tak stanú veľmi vhodným obdobím na investovanie do nových, progresívnych a moderných technológií využívania slamy ako zdroja energie. Pri ich rýchlej návratnosti sa tieto technológie stávajú vysoko efektívnymi.

BIOMASS/SOLAR INSTALLATIONS
Milan Novák General Director Thermosolar Žiar, s.r.o., Na vartičke, 965 01 Žiar nad Hronom, SR Phone: +421 45 6016000 e-mail: [email protected] ABSTRACT As far as solar radiation is not even in various periods of a year and in winter is very low, it is usually necessary to combine solar systems with other energy sources. From economical and environmental points of view it is extremely usefull to connect it with biomass boilers. The solar collectors ensure thermal energy for sanitary hot water in summer period and in winter they can pre-heat the cold water or they can cover some part of thermal energy for central heating. There are good results achieved in many european countries.

Biomass / solar installations
Ing. Milan Novák, CSc.THERMO/SOLAR Žiar s.r.o. Žiar nad Hronom

Svetová ponuka obnoviteľných energií

Žiarenie dopadajúce na zemeguľu

Žiarenie dopadajúce na územie SR[ kWh.m-2 / rok ]

Obmedzenia solárnych termických zariadení :
1. Slnko poskytuje energiu síce v obrovskom prebytku ale v „zriedenej“forme (pri jasnej oblohe a kolmom dopade slnečných lúčov max. 1000 W/m2 ) a nerovnomerne (zima - leto, noc - deň, počasie..). Preto zatiaľzachytávanie a skladovanie (akumulácia) slnečnej energie je investične náročné.
2. Najefektívnejšie sú v oblasti teplôt do 80°C.
3. Potreba doplnkových energetických zdrojov, spojenie s biomasou.


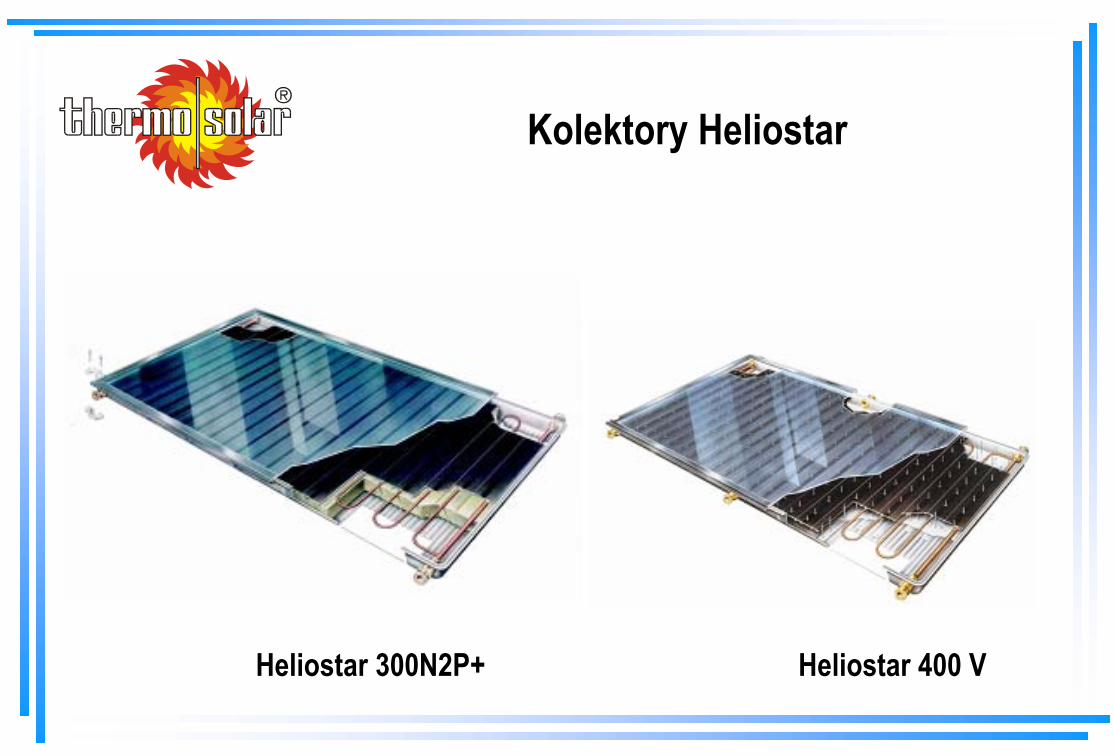
Kolektory Heliostar
Heliostar 300N2P+ Heliostar 400 V


BIOMASS FOR HEATING OF PUBLIC FACILITIES IN BANSKA BYSTRICA REGION
Juraj Zamkovsky CEPA- The Center for Environmental Public Advocacy Phone: +421 48 4193324 E-mail: [email protected]

Juraj ZamkovskyFriends of the Earth-CEPA / CEE Bankwatch Network
BIOMASS FOR HEATING OF PUBLIC FACILITIES
IN BANSKA BYSTRICA REGION
Pilot project

Project idea
• To replace the current obsolete heating systems in 32 public buildings in 9 (10) rural villages in Central Slovakia with modern woodchips-based systems.
• To encourage other rural regions with similar renewableenergy potential to use their local resources.
• Expected project costs: appr. 1 MEUR
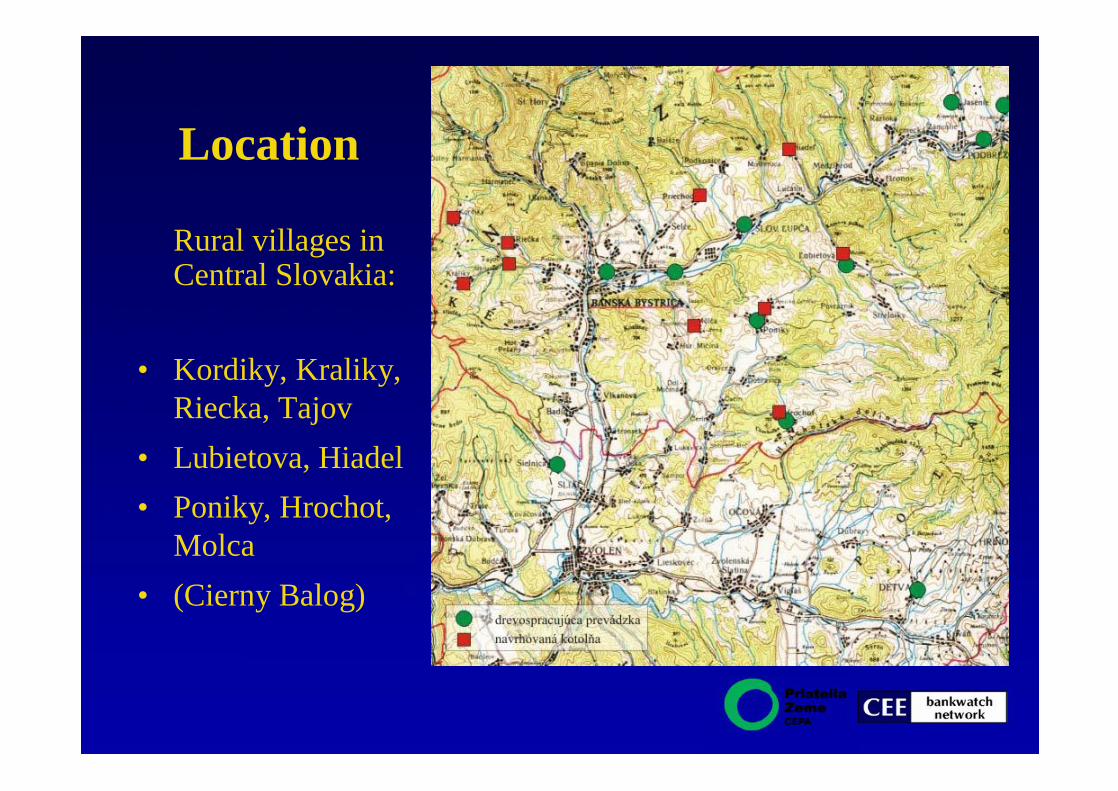
Location
Rural villages in Central Slovakia:
• Kordiky, Kraliky, Riecka, Tajov
• Lubietova, Hiadel• Poniky, Hrochot,
Molca• (Cierny Balog)

Expected impacts
àSustainability: the project will enhance economic self-sufficiency of rural areas through the use of local biomasspotential for local energy needs.
àSavings: municipal expenses for heating of public buildings will decrease and savings will become available for regional development.
àEmissions: the total CO2 emissions will be reduced by approximately 8.5 thousand tons in 10 years.

àModernization: Public buildings will be equipped with efficient heating systems. Most of the current boilers and heat distribution systems require serious reconstruction anyway.
àFollow-up: the project will test opportunities for its broader introduction to other regions
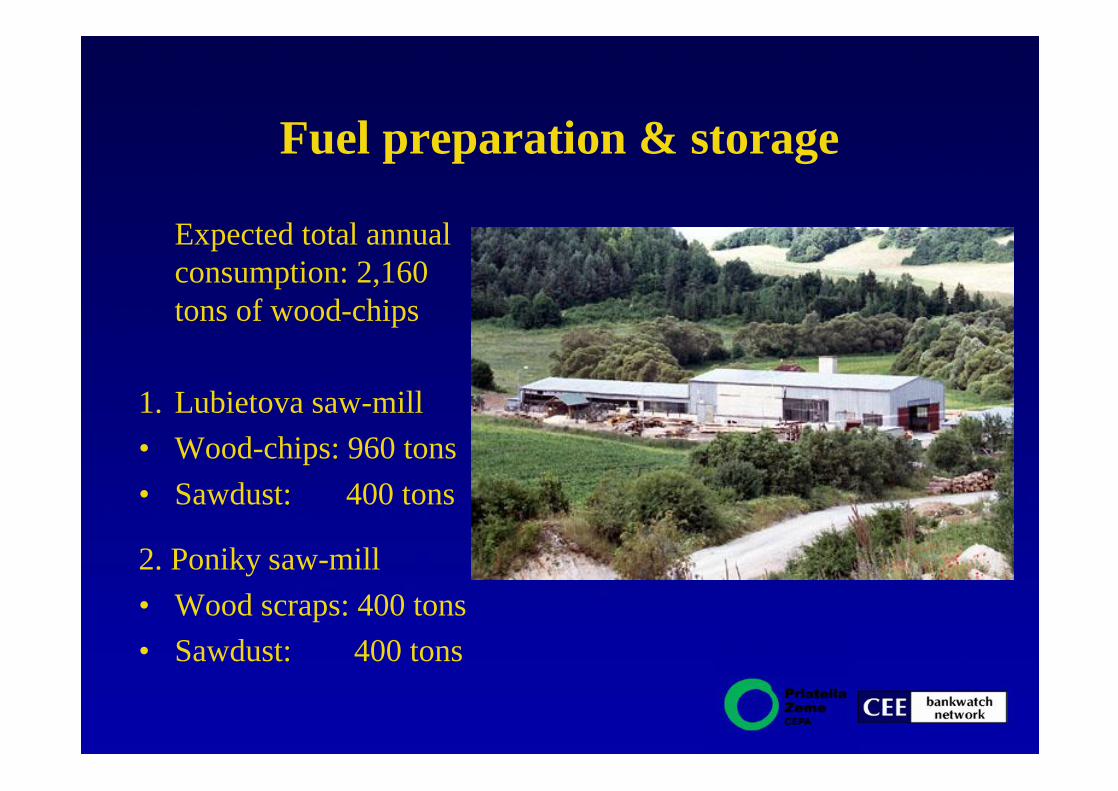
Fuel preparation & storage
Expected total annualconsumption: 2,160 tons of wood-chips
1. Lubietova saw-mill• Wood-chips: 960 tons• Sawdust: 400 tons
2. Poniky saw-mill• Wood scraps: 400 tons• Sawdust: 400 tons

Expected costs of fuel production
Average price of fuel• Wood-chips: ~700 SKK/ton (~€18.50/ton)• Wood-chips + sawdust ~550 SKK/ton (~€14.50/ton)
Investment costs• Saw-mill in Lubietova: constructions 500,000 SKK
technologies 400,000 SKK• Saw-mill in Poniky: constructions 600,000 SKK
technologies 500,000 SKK

Biomass potential in the region
Remains from logging 3,250 tonsWood waste from saw-mills 38,210 tonsWaste of piece-wood 24,940 tonsSawdust 13,270 tonsLower-quality range of wood-goods 8,500 tons
Total 49,960 tons

Basic figuresMunicipality Boiler output
(kW) Annual need of heat
(GJ) Annual need of fuel
(tons) Hiadel 150 + 80 537 + 303 63 + 35
Hrochot 1000 5987 700
Kordiky 150 1383 161
Kraliky 200 1132 132
Lubietova 300 + 200 1388 + 1003 162 + 117
Molca 150 755 88
Poniky 250 + 300 1134 + 1304 132 + 120
Riecka 110 + 150 582 + 722 68 + 77
Tajov 110 674 79
Total (9 villages) 3150 16 907 1934

Hrochot
Facilities to be heated:Municipal office, Nursery, Primary school – old and new buildings, Gymnasium, Store, Pub Nursery, Old and new curias, Cultural center, Food store, Health center
Installed output: 1000 kW
Length of heat pipes: 770 m


Lubietova
Facilities to be heated:
Municipal office, Post office
Installed output: 200 kW
Facility to be heated:
Primary school
Installed output: 300 kW
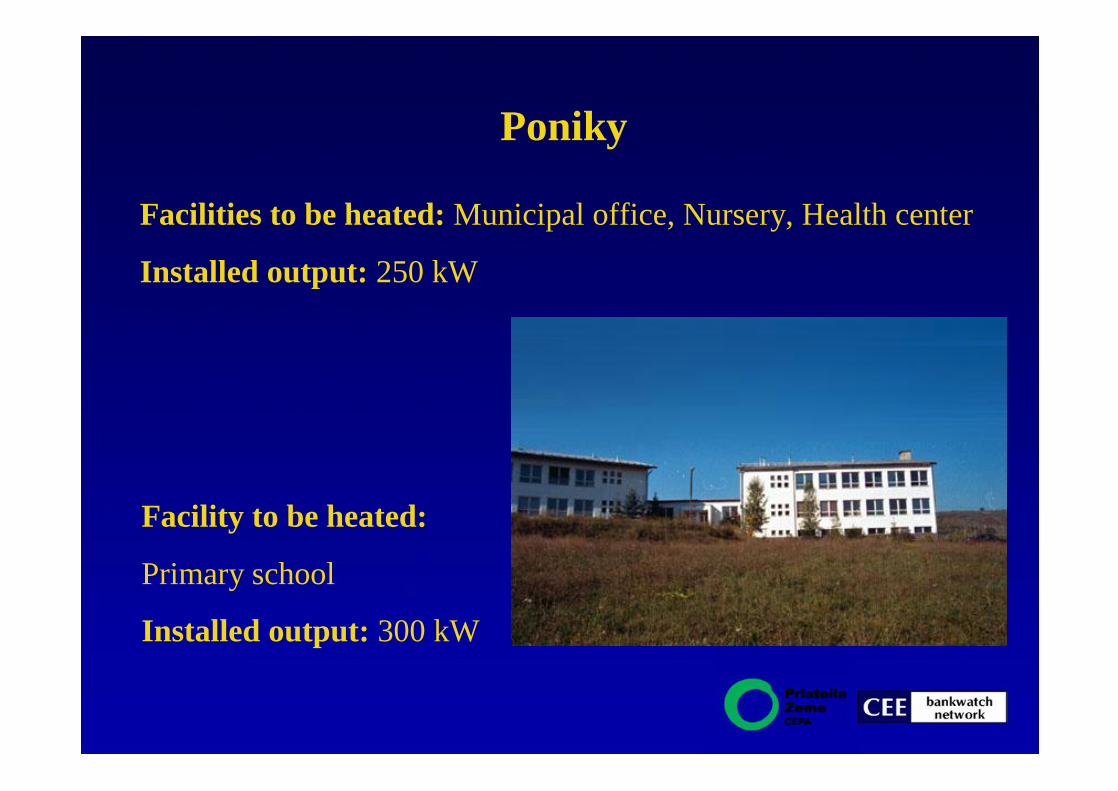
Poniky
Facility to be heated:
Primary school
Installed output: 300 kW
Facilities to be heated: Municipal office, Nursery, Health center
Installed output: 250 kW

Expectedexpenses on heat production
Municipality Expenses (SKK.GJ-1) 299,6-666,2
Hiadeľ 372,8-706,0
Hrochoť 189,6-400,9
Kordíky 209,0-346,3
Králiky 263,1-483,8
206,0-391,8 Ľubietová
242,2-461,5
Môlča 259,6-527,2
254,0-503,5 Poniky
211,0-380,5 283,4-642,4
Riečka 245,1-511,0
Tajov 252,2-580,0
Average expenses:231,7 - 464,5 SKK.GJ-1
(€ 6.1 – 12.3 per GJ)

Globalizácia versus lokalizácia
• lokalizovaný výrobno-spotrebný cyklus: export akomožnosť, nie nutnosť
PREPARATION OF WOOD-CHIPS
MUNICIPALITY 2
FUEL PREPARATION (MUNICIPAL SAW-MILLS)
DELIVERY/SALE OF FUEL
PREPARATION OF WOOD-CHIPS
MUNICIPALITY 1 DELIVERY/SALE OF FUEL
REPORTING
PROVISION OF TECHNOLOGY FOR PREPARATION OF WOOD-CHIPS
SUPERVISION ON FULFILMENT OF OBLIGATIONS (RE UTILIZATION OF
TECHNOLOGY & FUEL QUALITY)
PROJECT ORGANIZATIONAL SCHEME
DELIVERY/SALE OF FUEL, PROVISION OF BOILERS & RELATING TECHNOLOGY
FOR HEATING, SUPERVISION ON FULFILMENT OF
OBLIGATIONS (RE UTILIZATION OF TECHNOLOGY)
PROVISION OF TECHNOLOGY FOR PREPARATION OF WOOD-CHIPS
SUPERVISION ON FULFILMENT OF OBLIGATIONS (RE UTILIZATION OF
TECHNOLOGY & FUEL QUALITY)
ASSOCIATION OF MUNICIPALITIES
MUNICIPALITY 1
MUNICIPALITY 2
MUNICIPALITY 3
MUNICIPALITY 4
MUNICIPALITY 5
MUNICIPALITY 6
MUNICIPALITY X
PROJECT MANAGEMENT(ASSOCIATION OF MUNICIPALITIES)
HEATING OF PUBLIC FACILITIES
(MUNICIPALITIES)
CLEAR AND LONG-TERM RELATIONSHIPSBINDING AND ENFORCEABLE AGREEMENTS
CLEAR AND LONG-TERM RELATIONSHIPSBINDING AND ENFORCEABLE AGREEMENTS
BOILER-ROOM 1
BOILER-ROOM 2
BOILER-ROOM 3
BOILER-ROOM 4
BOILER-ROOM 5
BOILER-ROOM 6
BOILER-ROOM 7
BOILER-ROOM 8
BOILER-ROOM 9
BOILER-ROOM X

2003: project idea preparationdeveloping contacts
2004: preparation of technical design and preliminary analysesbuilding regional partnershipidentifying financing scheme
2005: building an organisationensuring funds for project implementationproject implementation
2006: project operation(transfer to other rural regions)
Activities

Partners
Project leaderFriends of the Earth-CEPA, a member group of
Friends of the Earth InternationalFriends of the Earth EuropeCEE Bankwatch NetworkSF Team Central Europe
Project partnersMunicipalities of Poniky, Hrochot, Lubietova, Kraliky, Kordiky, Riecka, Tajov, Molca and Hiadel, ESOZ -Energeticka spolocnost pre obnovitelne zdroje, Energy Center Bratislava, Civic Association Elias

For more information:
Juraj Zamkovsky, Executive Director
Friends of the Earth-CEPAPonicka Huta 65, 976 33 Poniky, Slovakiatel/fax: +421 48 4193 324e-mail: [email protected]/cepa

BIOMASS SITUATION IN BULGARIA
Pavel Manchev Eneffect Center for Energy Efficiency Consult ltd. Phone: +359 296 321 69 E-mail: [email protected]
Biomass situation in BulgariaBiomass situation in Bulgaria
BratislavaBratislava, , 2121--2222 FebruaryFebruary 20020055
Pavel ManchevPavel ManchevManager Manager
International Slovak Biomass ForumInternational Slovak Biomass Forum
Consult Ltd.Consult Ltd.

National policy on the utilization of renewable energy National policy on the utilization of renewable energy sourcessources
Biomass situation inBiomass situation in
qq ForestryForestry
qq AgricultureAgriculture
qq LivestockLivestock
qq LandfieldsLandfields
BariersBariers
Financial conditionsFinancial conditions
ConclusionsConclusions
ContentContentBiomass situation in BulgariaBiomass situation in Bulgaria

Key PreconditionsKey Preconditionsqq Bulgaria imports over 70% of energy carriersBulgaria imports over 70% of energy carriers
qq Basic domestic energy resource low quality lignite Basic domestic energy resource low quality lignite ––generate 35% of electricitygenerate 35% of electricity
qq Two reactors in NPP Two reactors in NPP Kozloduy Kozloduy were closed and 2were closed and 2more will be closes till 2007more will be closes till 2007
qq The electricity is substantial part of Bulgarian exportThe electricity is substantial part of Bulgarian export
Biomass situation in BulgariaBiomass situation in Bulgaria
National policy on the utilization of National policy on the utilization of renewable energy sourcesrenewable energy sources

Institutional frameworkInstitutional frameworkqq Ministry of energy and Energy ResourcesMinistry of energy and Energy Resources
qq Energy Efficiency AgencyEnergy Efficiency Agency
qq State Energy Regulatory CommissionState Energy Regulatory Commission
qq Ministry of Agriculture and ForestryMinistry of Agriculture and Forestry
qq Ministry of Environment and WatersMinistry of Environment and Waters
qq Executive Agency on Environmental ProtectionExecutive Agency on Environmental Protection
Biomass situation in BulgariaBiomass situation in Bulgaria
National policy on the utilization of National policy on the utilization of renewable energy sourcesrenewable energy sources

Programs, StrategiesPrograms, Strategiesqq National Energy Strategy National Energy Strategy
qq National Programme for Renewable Energy SourcesNational Programme for Renewable Energy SourcesRES generate 0.4% from annual consumptionRES generate 0.4% from annual consumptionTarget Target –– 8% in 20108% in 2010(about 1000 projects)(about 1000 projects)
qq National Agriculture and Rural Development Plan National Agriculture and Rural Development Plan –– SAPARDSAPARD
qq National Forestry Policy and Strategy National Forestry Policy and Strategy
qq National Program for Reduction the number of National Program for Reduction the number of landfieldslandfields
qq National Program for Management of National Program for Management of Landfields Landfields –– DirectiveDirective1999/31/EC1999/31/EC
Biomass situation in BulgariaBiomass situation in Bulgaria
National policy on the utilization of National policy on the utilization of renewable energy sourcesrenewable energy sources

Legal FrameworkLegal Frameworkqq Energy Act Energy Act -- incentivesincentives
qq Energy Efficiency ActEnergy Efficiency Act
qq Forestry Act Forestry Act -- incentivesincentives
qq Law on Municipal and State PropertyLaw on Municipal and State Property
qq Concession ActConcession Act
qq Relevant regulations and secondary legislation Relevant regulations and secondary legislation
Biomass situation in BulgariaBiomass situation in Bulgaria
National policy on the utilization of National policy on the utilization of renewable energy sourcesrenewable energy sources

qq The forested area The forested area -- between 31.7% and 34%between 31.7% and 34%
qq Forest resource area of 3.88 to 3.91 Forest resource area of 3.88 to 3.91 mlnmln. ha. ha
qq Types of forests Types of forests Coniferous forests Coniferous forests -- 32.8%.32.8%.Deciduous forests Deciduous forests -- 67.2%.67.2%.
qq Average age of the Bulgarian forests is 49 yearsAverage age of the Bulgarian forests is 49 years
qq State to nonState to non--state owned forests is 85.2% to 14.8% state owned forests is 85.2% to 14.8%
qq Management Management -- National Forestry Board and 16 regionalNational Forestry Board and 16 regionalforest boards in the countryforest boards in the country
Biomass situation in BulgariaBiomass situation in Bulgaria
Present status of Bulgarian forest Present status of Bulgarian forest and wood biomassand wood biomass

Biomass situation in BulgariaBiomass situation in Bulgaria
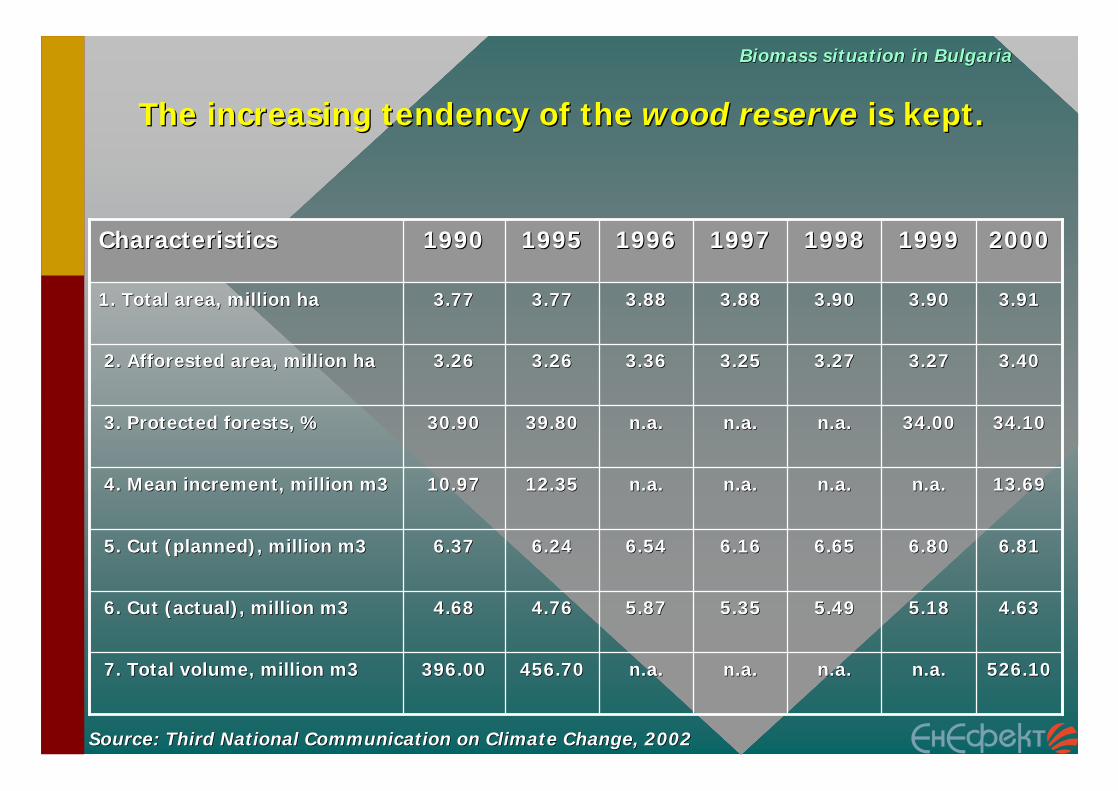
The increasing tendency of the The increasing tendency of the wood reservewood reserve is kept. is kept.
Biomass situation in BulgariaBiomass situation in Bulgaria
526.10526.10n.a.n.a.n.a.n.a.n.a.n.a.n.a.n.a.456.70456.70396.00396.007. Total volume, million m37. Total volume, million m3
4.634.6355.18.185.495.495.355.355.875.874.764.764.684.686. Cut (actual), million m36. Cut (actual), million m3
6.816.816.806.806.656.656.166.166.546.546.246.246.376.375. Cut (planned), million m35. Cut (planned), million m3
13.6913.69n.a.n.a.n.a.n.a.n.a.n.a.n.a.n.a.12.3512.3510.9710.974. Mean increment, million m34. Mean increment, million m3
34.1034.1034.0034.00n.a.n.a.n.a.n.a.n.a.n.a.39.8039.8030.9030.903. Protected forests, %3. Protected forests, %
3.403.403.273.273.273.273.253.253.363.363.263.263.263.262. Afforested area, million ha2. Afforested area, million ha
3.913.913.903.903.903.903.883.883.883.883.773.773.773.771. Total area, million ha1. Total area, million ha
20002000199919991998199819971997199619961995199519901990CharacteristicsCharacteristics
Source: Third National Communication on Climate Change, 2Source: Third National Communication on Climate Change, 2002002

qq A constantly increasing increment of the forest biomassA constantly increasing increment of the forest biomassis observed. Recently it reached 13.7is observed. Recently it reached 13.7 mln mln m3. m3.
qq The planned annual cut cannot be fulfilled due to theThe planned annual cut cannot be fulfilled due to thesharp decrease of the demand for timber wood. sharp decrease of the demand for timber wood.
qq The increasing discrepancy between the planned andThe increasing discrepancy between the planned andreal cuts is leading disturbance of the normal turnoverreal cuts is leading disturbance of the normal turnoverof the forest trees.of the forest trees.
qq The amount of The amount of wood wood biomass was generally very littlebiomass was generally very littleinfluenced by the meteorological conditions, and variedinfluenced by the meteorological conditions, and variedinsignificantly from year to year.insignificantly from year to year.
qq These trends indicate that Bulgaria has produced aThese trends indicate that Bulgaria has produced astable amount of forest biomass that could be utilizedstable amount of forest biomass that could be utilizedfor energy purposes. for energy purposes.
Biomass situation in BulgariaBiomass situation in Bulgaria
CharacteristicsCharacteristics

The wood wastes from:The wood wastes from:
qq processing standing wood processing standing wood
qq thinning in the conifer stands thinning in the conifer stands
qq cut of wood biomass from the coppice cut of wood biomass from the coppice
qq lowlow--stem forestsstem forests
could total at more than 7 million could total at more than 7 million mm33 /year with energy /year with energy content of 13 content of 13 TWhTWh
Biomass situation in BulgariaBiomass situation in Bulgaria
Potential of wood biomassPotential of wood biomass

The biggest part of firewood and wood wastes is used by The biggest part of firewood and wood wastes is used by households for heating and cookinghouseholds for heating and cooking
qq Biomass used in 2002 Biomass used in 2002 –– 639 000 tons 639 000 tons
qq Biomass used by households Biomass used by households –– 585 000 tons 585 000 tons
Biomass situation in BulgariaBiomass situation in Bulgaria
Utilization of wood biomassUtilization of wood biomass

Implemented projectsImplemented projects
qq HospitalsHospitals
qq SchoolsSchools
qq Residential buildings Residential buildings
qq SawSaw--millsmills
qq Furniture producersFurniture producers
qq HotelsHotels
qq Pulp factoryPulp factory
Biomass situation in BulgariaBiomass situation in Bulgaria
Utilization of wood biomassUtilization of wood biomass

Biomass situation in BulgariaBiomass situation in Bulgaria
Utilization of wood biomassUtilization of wood biomass

qq StrowStrow 34%34%
qq Maize Maize stemsstems 40%40%
qq Sunflower stemsSunflower stems 19%19%
qq Other Other 7%7%(grape, tobacco, trees) (grape, tobacco, trees)
Biomass situation in BulgariaBiomass situation in Bulgaria
Agriculture biomassAgriculture biomass
Main sources of agriculture residuesMain sources of agriculture residues
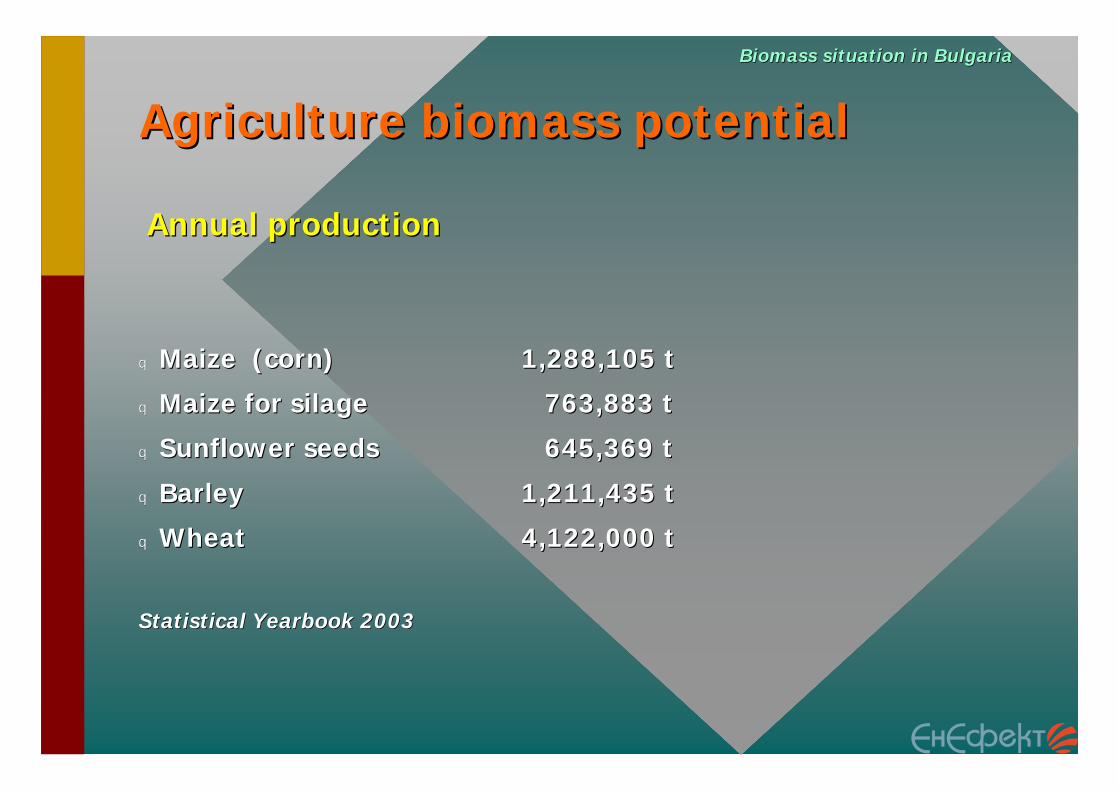
qq Maize (corn)Maize (corn) 1,288,105 t1,288,105 t
qq Maize for silage Maize for silage 763,883 t763,883 t
qq Sunflower seedsSunflower seeds 645,369 t645,369 t
qq Barley Barley 1,211,435 t1,211,435 t
qq Wheat Wheat 4,122,000 t4,122,000 t
Statistical Yearbook 2003Statistical Yearbook 2003
Biomass situation in BulgariaBiomass situation in Bulgaria
Agriculture biomass potentialAgriculture biomass potential
Annual productionAnnual production

Straw ~ Wheat Straw ~ Wheat 4,122,000 t4,122,000 t
Straw energy equivalentStraw energy equivalent 15 GJ/t15 GJ/t
Energy potential Energy potential 17.2 17.2 TWhTWh
If the rest of residues are equal to straw (must be more) the toIf the rest of residues are equal to straw (must be more) the total tal energy from agriculture energy from agriculture crops is about 34crops is about 34 TWhTWh
Biomass situation in BulgariaBiomass situation in Bulgaria
Agriculture biomass potentialAgriculture biomass potential
Annual productionAnnual production

qq Physical personsPhysical persons -- 14.4%14.4%
qq Legal entities Legal entities -- 85.6% (56.3% of them co85.6% (56.3% of them co--operatives)operatives)
Biomass situation in BulgariaBiomass situation in Bulgaria
Agriculture biomass utilizationAgriculture biomass utilization
Farms AreaFarms Area
ProjectsProjectsProduction of Production of briquetsbriquets

qq Cattle Cattle 691,225691,225
qq PigsPigs 996,481996,481
qq SheepSheep 1,728,3571,728,357
qq PoultryPoultry 14,990,94614,990,946
Statistical Yearbook 2003Statistical Yearbook 2003
Biomass situation in BulgariaBiomass situation in Bulgaria
Livestock numbersLivestock numbers
Main groupsMain groups

Biomass situation in BulgariaBiomass situation in Bulgaria
Livestock numbersLivestock numbersMain groupsMain groups
cattle pigs poultry*biogas Nm3/d 1,5 0,16 12Caloricity MJ/Nm3 20 4,6 92Energy kWhel. 3 0,32 24th. 6 0,64 48Total energy 9 0,96 72
Number 691225 996481 14990946Energy total kWh 6221025 956622 1079348Grand Total TWh 8,26
* for one thousand

qq 663 by December 2001663 by December 2001
qq 59 servicing settlements population above 20000 (70% of total59 servicing settlements population above 20000 (70% of total
populationpopulation
qq Categorization and registry Categorization and registry
qq 16 new landfills 16 new landfills –– ISPA and State Budget (2003)ISPA and State Budget (2003)
qq National Program for Management of National Program for Management of Landfields Landfields –– 54 investment54 investment
projects for reconstructionprojects for reconstruction
Biomass situation in BulgariaBiomass situation in Bulgaria
LANDFIELSLANDFIELS

Biomass situation in BulgariaBiomass situation in Bulgaria
LANDFIELSLANDFIELS
Recorded quantities of municipal solid waste and rates of waste production
5055057,928,901*7,928,901*6,360,0646,360,0643,210,8463,210,84620012001
5185188,149,4688,149,4686,402,1546,402,1543,318,0223,318,02220002000
5065068,190,8768,190,8766,353,1336,353,1333,213,3493,213,34919991999
4984988,230,3718,230,3716,414,9486,414,9483,196,8363,196,83619981998
Rate of Rate of waste waste
productionproduction
Kg/capita/yearKg/capita/year
Total Total number of number of population population
Serviced Serviced populationpopulation
Collected Collected quantities quantities
tonnestonnes
YEARYEAR

Biomass situation in BulgariaBiomass situation in Bulgaria
LANDFIELSLANDFIELS
0% 5% 10% 15% 20% 25% 30% 35% 40%
Paper Products
Textiles
Plastics
Glass
Metals
Other waste
Other organic material
Composition of about 55% biodegradable stockComposition of about 55% biodegradable stock

Biomass situation in BulgariaBiomass situation in Bulgaria
LANDFIELSLANDFIELS
Estimated PotentialEstimated Potential
qq annual wastes/ inhabitant annual wastes/ inhabitant 200 kg 200 kg qq average energy equivalent of average energy equivalent of 1.16 1.16 MWhMWh/t/tqq inhabitants inhabitants 8 mil.8 mil.
Total energy is Total energy is
ЕЕ = 1.16 x 0.2 x 8 = 1.85 = 1.16 x 0.2 x 8 = 1.85 TWhTWh.. [5][5]

Biomass situation in BulgariaBiomass situation in Bulgaria
Total PotentialTotal Potential
Estimated Biomass Technical PoteEstimated Biomass Technical Potential (ntial (TWTWthth))EBRD, Strategic Assessment of the Potential Renewable EnerEBRD, Strategic Assessment of the Potential Renewable Energy in the EBRD Countries of gy in the EBRD Countries of Operation, 2003Operation, 2003

Biomass situation in BulgariaBiomass situation in Bulgaria
Total PotentialTotal Potential
Biomass Resources AssessBiomass Resources AssessmentmentEBRD, Strategic Assessment of the Potential Renewable EnerEBRD, Strategic Assessment of the Potential Renewable Energy in the EBRD Countries of gy in the EBRD Countries of Operation, 2003Operation, 2003

Main ObstaclesMain Obstacles
Biomass situation in BulgariaBiomass situation in Bulgaria
qq AwarenessAwareness
qq Lack of capacityLack of capacity
qq Production and trade of biomass fuelsProduction and trade of biomass fuels
qq Information about applicable technologies, Information about applicable technologies, energy crops etc.energy crops etc.
qq EquipmentEquipment

Financial conditionsFinancial conditions for for implementation of biomass projectsimplementation of biomass projects
Biomass situation in BulgariaBiomass situation in Bulgaria
qq Increasing prices of fossil fuels and electricityIncreasing prices of fossil fuels and electricity
qq Bankable projectsBankable projects
qq Supportive banking sectorSupportive banking sector
qq EBRD fund EBRD fund –– 20% grant for RES projects20% grant for RES projects
qq Bulgarian EE FundBulgarian EE Fund
qq New EBRD fund for RES New EBRD fund for RES
qq IncentivesIncentives

ConclusionsConclusions
Biomass situation in BulgariaBiomass situation in Bulgaria
qq Bulgaria ranks at one of the first placed among the Bulgaria ranks at one of the first placed among the former socialist countries in terms of biomass potential former socialist countries in terms of biomass potential
qq The political and investment climate create better The political and investment climate create better prerequisites for utilization of biomass prerequisites for utilization of biomass
qq Despite the above findings the existing potential isDespite the above findings the existing potential isutilized to a very low extentutilized to a very low extent

ConclusionsConclusions
Biomass situation in BulgariaBiomass situation in Bulgaria
qq Expand the activities on promotion of the use ofExpand the activities on promotion of the use ofbiomass biomass
qq Set up marketSet up market--based conditions for production of andbased conditions for production of andtrade in biotrade in bio--fuels and equipment for their combustionfuels and equipment for their combustion
qq Ensure prerequisites for segregated collection ofEnsure prerequisites for segregated collection ofmunicipal solid wastemunicipal solid waste
qq Develop financial incentives, which can support projectDevelop financial incentives, which can support projectimplementation and make the projects bankable implementation and make the projects bankable
It is necessary to:It is necessary to:

Thank You!Thank You!
Biomass situation in BulgariaBiomass situation in Bulgaria

EUROPEAN UNION AND RES IN 2005 Ing. Miroslav Mariaš Ministry of Economy of the Slovak Republic Phone: :+421/2/48587074 E-mail: [email protected]

EurEuróópska pska úúnia nia a a obnoviteobnoviteľľnnéé zdroje energie zdroje energie
v roku 2005v roku 2005
Biomass Biomass Forum 2005Forum 2005

EurEuróópska Komisiapska Komisia
nn EurEuróópsky psky program na program na zmenu klzmenu klíímymy–– SmerniceSmernice 2001/77, 2003/30 a 2003/962001/77, 2003/30 a 2003/96
nn SprSpráávy o pokroku vy o pokroku rozvoja rozvoja OZE OZE podpodľľa a 2001/772001/77
nn KomunikKomunikáácia Komisiecia Komisie z 26.4.2004 z 26.4.2004 nn SprSpráávy o stave biopalvy o stave biopalíív v podpodľľa a
2003/302003/30

EurEuróópska Komisiapska Komisia
nn NovNovéé smerovanie Lisabonskej smerovanie Lisabonskej stratstratéégiegie
nn zmena priorzmena prioríít t z 3 na 1 z 3 na 1 -- hospodhospodáársky rsky rast rast a konkurencieschopnosa konkurencieschopnosťť so zameranso zameraníím m na na zvyzvyššovanie zamestnanostiovanie zamestnanosti
nn znzníížženie enie priority TUR a priority TUR a socisociáálnej lnej oblastioblastinn novnovéé dokumenty a Lisabonský dokumenty a Lisabonský akakččný ný
programprogramnn pravdepodobne schvpravdepodobne schváálenielenie 2222--23.3.200523.3.2005

EurEuróópska Komisiapska Komisia
nn Lisabonský Lisabonský akakččný ný programprogram–– rast rast cez inovcez inovááciecie, , zlepzlepššenie zavedenia enie zavedenia
ICT a ICT a efektefektíívne vyuvne využžíívanie zdrojovvanie zdrojov
nn EnvironmentEnvironmentáálne technollne technolóógiegieEnergetickEnergetickáá efektefektíívnosvnosťť a OZEa OZE–– podpora RD&D, podpora RD&D, ekoeko--inovinovááciecie, ,
výkonnostnvýkonnostnéé cieleciele, , financovanie financovanie –– EurEuróópska iniciatpska iniciatííva pre energetickva pre energetickúú
efektefektíívnosvnosťť -- ZelenZelenáá kniha 2005kniha 2005

PracovnýPracovný program EK program EK na rok 2005na rok 2005
nn ččasasťť žživotnivotnéé prostredieprostredie–– plnplnáá implementimplementááciacia ECCPECCP–– implementimplementáácia Akcia Akččnnéého ho plpláánu nu pre pre
environmentenvironmentáálne technollne technolóógie gie a a nnáárodných akrodných akččných plných pláánovnov
–– ttéématickmatickéé stratstratéégie efektgie efektíívneho vneho vyuvyužžíívania zdrojovvania zdrojov

PracovnýPracovný program EK program EK na rok 2005na rok 2005
nn ččasasťť energetikaenergetika–– TOP PRIORITY TOP PRIORITY -- energetickenergetickáá efektefektíívnosvnosťť
nn KomunikKomunikááciacia, , akakččný ný plpláán a program na 5 n a program na 5 rokovrokovnn Sustainable energy Sustainable energy forum 1H2005 forum 1H2005
–– 2.priorita 2.priorita -- OZE OZE nn doriedorieššenie otenie otáázok financovania zok financovania a podpory a podpory nn KomunikKomunikáácia cia a a AkAkččný ný plpláán o n o biomase biomase nn Biomasa Biomasa kkľľúúččovováá pre pre rozvoj RESrozvoj RES
–– 8.priorita 8.priorita -- Smernica Smernica o o ččistých istých vozidlvozidlááchch

EUEU Biomass Action PlanBiomass Action Plan
nn 1. 1. Stretnutie vypracovateStretnutie vypracovateľľov ov nn 4. 4. marcamarca 2005 2005 nn budova budova CharlemagneCharlemagne, Brusel, Brusel
nn prihlprihlášáška ka na MH SRna MH SRnn ((IngIng. . MariaMariašš, , IngIng. Nov. Nováák)k)

Ing. Ing. Miroslav Miroslav MariaMariašškoordinkoordináátor refertor referáátu Agendy Etu Agendy EÚÚ
Sekcia výrobných a sieSekcia výrobných a sieťťových odvetvových odvetvííMH SRMH SR
2222. . februfebruáárr 20020055, Bratislava, Bratislava
KomunitKomunitáárnyrny programprogramInteligentnInteligentnáá energia energia -- EurEuróópa pa
20032003--20062006

InteligentnInteligentnáá energia pre Eurenergia pre Euróópu pu –– IEEIEE
nn IEE IEE -- program EK, ktorý rieprogram EK, ktorý riešši i netechnologicknetechnologickéé baribariééry ry
nn Nepodporuje investiNepodporuje investiččnnéé financovanie, financovanie, ani výskum aani výskum a vývojvývoj
nn Podprogramy: Podprogramy: –– SAVE SAVE -- energetickenergetickáá efektefektíívnosvnosťť–– ALTENER ALTENER -- obnoviteobnoviteľľnnéé zdroje energiezdroje energie–– STEER STEER -- dopravadoprava–– COOPENER COOPENER -- spoluprspoluprááca sca s trettretíími krajinamimi krajinami–– HKA HKA –– HorizontHorizontáálne klne kľľúúččovovéé akcieakcie
ZZáákladnkladnéé ciele IEE (1)ciele IEE (1)
nn SAVESAVE–– zvyzvyššovanie energetickej efektovanie energetickej efektíívnostivnosti–– znzníížženie energetickej nenie energetickej náároroččnosti 1% ronosti 1% roččne ne –– znzníížženie sklenenie sklenííkových plynov na kových plynov na úúroveroveňň
KyKyóótskehotskeho protokoluprotokolu–– postupný rozvoj výroby elektriny zpostupný rozvoj výroby elektriny z KGJKGJ
nn ALTENERALTENER–– akcie na podporu lokakcie na podporu lokáálnej implementlnej implementáácie cie
legislatlegislatíívnych opatrenvnych opatreníí vv OEZOEZ–– dosiahnutie ciedosiahnutie cieľľa va v Bielej Knihe, 12% PEZ vBielej Knihe, 12% PEZ v 20102010–– vytvorenie trhových podmienokvytvorenie trhových podmienok

nn STEER:STEER:–– ččististáá doprava v mestdoprava v mestááchch–– podpora podpora biopalbiopalíívv–– zlepzlepššenie energetickej efektenie energetickej efektíívnosti v vnosti v
doprave doprave nn COOPENER:COOPENER:
–– podpora podpora KyKyóótskehotskeho protokoluprotokolu
ZZáákladnkladnéé ciele IEE (2)ciele IEE (2)

nn analýzy trhu, strategickanalýzy trhu, strategickéé ššttúúdie, die, šštandardy, tandardy, miestne amiestne a regionregionáálne energeticklne energetickéé plpláánovanienovanie
nn rozvoj mechanizmov finanrozvoj mechanizmov finanččnej podpory nej podpory aa nnáástrojov trhu, podpora syststrojov trhu, podpora systéémov amov a zariadenzariadenííspojujspojujúúcich prechod medzi demoncich prechod medzi demonšštrtrááciou ciou projektov k ich komerprojektov k ich komerččnnéému vyumu využžitiuitiu
nn informainformaččnnéé aa nnááuuččnnéé šštrukttruktúúry, podpora ry, podpora zvyzvyššovania povedomia, transfer ovania povedomia, transfer knowknow--howhow
nn monitorovanie implementmonitorovanie implementáácie a dopadu politcie a dopadu politííkk
nn zhodnocovanie dopadu akcii azhodnocovanie dopadu akcii a programu IEE.programu IEE.
Typy akciTypy akciíí IEEIEE

nn kombinovankombinovanáá podpora strpodpora stráán dodn dodáávky a spotreby pre vky a spotreby pre obnoviteobnoviteľľnnéé zdrojezdroje
nn integrintegráácia ncia náástrojov ako bola definovanstrojov ako bola definovanáá vv zelenej zelenej knihe oknihe o bezpebezpeččnosti dodnosti dodáávky energie (kombinujvky energie (kombinujúúca ca legislatlegislatíívu, technolvu, technolóógie, informgie, informáácie, cie, výukuvýuku aa pod.)pod.)
nn integrintegráácia cia úúččastnastnííkov zo vkov zo vššetkých oblastetkých oblastíí na vna vššetkých etkých úúrovniachrovniach
nn zlepzlepššenie koordinenie koordináácie medzi politikami na cie medzi politikami na úúrovni rovni SpoloSpoloččenstva aenstva a ČČlenských lenských ššttáátovtov
PrincPrincíípy IEEpy IEE
nn Pracovný program sa pripravuje kaPracovný program sa pripravuje kažždorodoroččne, ne, obsahuje obsahuje ššpecifikpecifikáácie priorcie prioríít a rozpot a rozpoččet. et. Okrem tohto dokumentu EK pripravuje Okrem tohto dokumentu EK pripravuje ďďalalššie ie 3 dokumenty: 3 dokumenty: –– Call for proposalCall for proposal, v, v ktorom sktorom súú detailne stanovendetailne stanovenéé
kritkritééria na hodnotenie projektov, urria na hodnotenie projektov, urččenenéé priority priority aa termtermííny; ny;
–– Detailný popis kDetailný popis kľľúúččových akciových akciíí; a; a–– Metodiku pre Metodiku pre predkladatepredkladateľľovov projektov.projektov.
nn Vyhodnocovanie projektov EurVyhodnocovanie projektov Euróópska Komisia pska Komisia aa VýkonnVýkonnáá agentagentúúra (prra (prííprava kontraktov, prava kontraktov, dozor nad plnendozor nad plneníím, rozpom, rozpoččet) et)
nn ÚÚččasasťť: : ččlensklenskéé krajiny, krajiny EFTA, krajiny, krajiny EFTA, prpríístupovstupovéé krajiny, kandidkrajiny, kandidáátske krajiny.tske krajiny.
ImplementImplementáácia IEEcia IEE

nn SAVE SAVE 69,6 MEUR 69,6 MEUR nn ALTENER ALTENER 80 MEUR 80 MEUR nn STEER STEER 32,6 MEUR 32,6 MEUR
nn COOPENER COOPENER 17,6 MEUR17,6 MEUR
Financie IEE 2003 Financie IEE 2003 -- 20062006

nn Call for proposal Call for proposal –– iniciatiniciatííva trhuva trhu–– spolufinancovaniespolufinancovanie 50%50%–– dotdotáácia 50%cia 50%–– momožžnosnosťť vyuvyužžíívania výsledkov projektu EK vania výsledkov projektu EK
nn Call for tendersCall for tenders–– iniciatiniciatííva zva z EKEK–– 100% 100% grantygranty–– výsledky svýsledky súú ururččenenéé pre EKpre EK
nn ŠŠpecifickpecifickéé projekty projekty –– Rozhoduje Riadiaci výbor IEE Rozhoduje Riadiaci výbor IEE
PravidlPravidláá úúččasti aasti a spolufinancovaniaspolufinancovania

nn Typ 1: 3 nezTyp 1: 3 nezáávislvisléé organizorganizáácie zcie z 3 3 rôznych krajrôznych krajíín (COOPENER 2 nezn (COOPENER 2 nezáávislvislééorganizorganizáácie zcie z 2 rôznych EU alebo EEA 2 rôznych EU alebo EEA krajkrajíín alebo KK + jasnn alebo KK + jasnéé definovanie definovanie rozvojových krajrozvojových krajíín)n)
nn Typ 2: 2 partneri zTyp 2: 2 partneri z KK aKK a 1 z1 z ČČK alebo EEAK alebo EEAnn Typ 3: 1 organizTyp 3: 1 organizáácia zcia z ľľubovolnej krajinyubovolnej krajiny
Minimum partnerov vMinimum partnerov v projektochprojektoch

OprOpráávnenvnenéé nnáákladyklady
nn FinanFinanččnnéé nariadenie 181IR nariadenie 181IR nn Priame nPriame nááklady: klady:
–– OsobnOsobnéé nnááklady expertovklady expertov–– NNááklady na cestovnklady na cestovnéé a stravna stravnéé–– prenprenáájom miestnosti jom miestnosti –– subkontraktysubkontrakty, at, atďď. .
nn Nepriame nNepriame nááklady:klady:–– strop 7% zstrop 7% z priamych npriamych náákladovkladov

Hodnotenie projektovHodnotenie projektov
nn KritKritééria oprria opráávnenosti/formvnenosti/formáálne kritlne kritééria ria ––ÁÁNO/NIENO/NIE
nn VýberovVýberovéé kritkritééria: prria: práávna, finanvna, finanččnnáá aa operaoperaččnnáákontrola kontrola –– ÁÁNO/NIENO/NIE
nn Hodnotiace kritHodnotiace kritééria: hodnotenie kvality ria: hodnotenie kvality ––SKSKÓÓRERE

CallCall for for proposalsproposals 20032003
nn Projekty vyhodnocovalo 53 expertov zProjekty vyhodnocovalo 53 expertov z 20 kraj20 krajíínnnn VV ččasti SAVE/ALTENER/STEER/COOPENER/HKA asti SAVE/ALTENER/STEER/COOPENER/HKA
celkom 256 celkom 256 –– 15 projektov15 projektov–– SAVE 95SAVE 95–– ALTENER 81 ALTENER 81 –– STEER 9STEER 9–– COOPENER 29 COOPENER 29 –– HKA 28, vrHKA 28, vráátane 7 agenttane 7 agentúúrr
nn CelkovCelkovéé navrhnutnavrhnutéé nnááklady 263,6 MEUR; klady 263,6 MEUR; popožžadovanadovanéé grantygranty 132,4 mil. EUR. 132,4 mil. EUR.
nn Celkom 1800 subjektov zCelkom 1800 subjektov z 20 kraj20 krajíín; 52% n; 52% zz navrhovatenavrhovateľľov SMEov SME

CallCall for for proposalsproposals 20032003
nn 90 pozit90 pozitíívne ohodnotených projektovvne ohodnotených projektovnn ZZ toho 60% podali vltoho 60% podali vláádne adne a neziskovneziskovéé
organizorganizááciecienn GrantyGranty EU: EU:
–– 41.903.484 EUR za SAVE/ALTENER/STEER/HKA41.903.484 EUR za SAVE/ALTENER/STEER/HKA–– 1.944.913 EUR pre COOPENER. 1.944.913 EUR pre COOPENER.
nn SAVE SAVE 70% projektov v oblasti budov. 70% projektov v oblasti budov. nn ALTENER ALTENER 50%+ 50%+ biomasabiomasa, výroba tepla, 18 , výroba tepla, 18
. agent. agentúúr vr v rráámci 10 projektov. mci 10 projektov. nn STEER STEER 3 projekty 3 projekty

Priority SAVE 2004Priority SAVE 2004
nn VKA2 VKA2 –– Obnova sociObnova sociáálnych domovlnych domov–– zvýzvýššenie povedomia, výuenie povedomia, výuččby aby a trtrééninguningu–– tvorba finantvorba finanččných schných schéém m ššitých na mieruitých na mieru–– pokropokroččililéé integrovanintegrovanéé momožžnosti obnovynosti obnovy–– prpráávne avne a ininšštituciontitucionáálne zmenylne zmeny
nn VKA4 VKA4 –– Energeticky efektEnergeticky efektíívne zariadenia vne zariadenia aa výrobkyvýrobky–– podpora aplikpodpora aplikáácie a zlepcie a zlepššenia povedomia enia povedomia
kk energetickenergetickéému mu ššttíítkovaniu atkovaniu a šštandardom tandardom minimminimáálnej technickej lnej technickej úúččinnosti vinnosti v rráámci Emci EÚÚ
–– obstaranie technolobstaranie technolóógie, iniciatgie, iniciatíívny nvny náákupca kupca aa prpríístupy kstupy k akcelerakceleráácii transformcii transformáácie trhucie trhu
–– monitorovanie transformmonitorovanie transformáácie trhu acie trhu a prprííprava prava priestoru pre novpriestoru pre novéé politickpolitickéé iniciatiniciatíívyvy
Priority ALTENER 2004Priority ALTENER 2004nn VKA7 VKA7 –– AplikAplikáácie OEZ malých výkonovcie OEZ malých výkonov
–– solsoláárny ohrev vody, vykurovanie arny ohrev vody, vykurovanie a chladeniechladenie–– výroba elektriny výroba elektriny fotovoltaikoufotovoltaikou–– biomasabiomasa pre dompre domááce vykurovaniece vykurovanie–– KGJ malých výkonov aKGJ malých výkonov a tepelntepelnéé ččerpadlerpadláá
nn VKA8 VKA8 –– AlternatAlternatíívne pohony vozidielvne pohony vozidiel–– legislatlegislatííva, va, fifišškkáálnelne rerežžimy,imy, palivovpalivovéé šštandardy tandardy
aa normynormy–– rereťťazec dodazec dodáávatevateľľov aov a šštrukttruktúúru trhu pre ru trhu pre biopalivbiopaliváá–– rereťťazec dodazec dodáávatevateľľov aov a šštrukttruktúúru trhu pre alternatru trhu pre alternatíívne vne
palivpaliváá potrebujpotrebujúúce samostatný rece samostatný reťťazec dodazec dodáávatevateľľovov–– potreba trhu pre vozidlpotreba trhu pre vozidláá ss alternatalternatíívnym pohonomvnym pohonom–– ssúúvisiace opatreniavisiace opatrenia

Priority STEER 2004Priority STEER 2004
nn VKA9 VKA9 –– PolitickPolitickéé opatrenia pre efektopatrenia pre efektíívne vne vyuvyužžíívanie energie vvanie energie v dopravedoprave–– znzníížženie potreby energie venie potreby energie v dopravedoprave–– zlepzlepššenie energetickej enie energetickej úúččinnosti zinnosti z pohpohľľadu dopravyadu dopravy–– presun dopravy do menej energeticky npresun dopravy do menej energeticky náároroččnnéého ho
rerežžimuimu–– ekonomickekonomickéé nnáástroje astroje a stimulystimuly–– informovanie, povedomie ainformovanie, povedomie a šškoleniakolenia
nn VKA10 VKA10 –– Posilnenie vedomostPosilnenie vedomostíí miestnych miestnych riadiacich agentriadiacich agentúúr vr v rezorte dopravyrezorte dopravy–– šškolenia miestnych agentkolenia miestnych agentúúr vr v oblasti alternatoblasti alternatíívnych vnych
palpalíív av a vyuvyužžíívania energie vvania energie v dopravedoprave–– podpora miestnych hrpodpora miestnych hrááččov kov k spoluprspoluprááci na ci na
programoch a projektochprogramoch a projektoch
Priority COOPENER 2004Priority COOPENER 2004
nn VKA11 VKA11 –– EnergetickEnergetickéé politiky, legislatpolitiky, legislatííva va aa trhovtrhovéé podmienky pre umopodmienky pre umožžnenie nenie znzníížženia chudoby venia chudoby v rozvojových rozvojových krajinkrajinááchch–– kkľľúúččovovéé zameranie na zameranie na SubSub--saharsksaharskúú Afriku Afriku
aa LatinskLatinskúú AmerikuAmeriku
nn VKA12 VKA12 –– Posilnenie miestnych Posilnenie miestnych energetických expertenergetických expertííz vz v rozvojových rozvojových krajinkrajinááchch

Priority HKA 2004Priority HKA 2004
nn HKA1HKA1-- TrvaloudrTrvaloudržžateateľľnnéé energetickenergetickééspolospoloččenstvenstváá
nn HKA2HKA2-- Mysli globMysli globáálne, konaj loklne, konaj lokáálnelnenn HKA3HKA3-- FinanFinanččnnéé mechanizmy amechanizmy a stimulystimulynn HKA4HKA4-- Monitorovanie a VyhodnocovanieMonitorovanie a Vyhodnocovanie
Celkový rozpoCelkový rozpoččet v 2004: 67,605 et v 2004: 67,605 MEUR.MEUR.
Call for tendersCall for tenders 20042004
nn Rozvoj eurRozvoj euróópskej platformy pre podpornpskej platformy pre podpornééopatrenia vopatrenia v ssúúlade so smernicou lade so smernicou oo energetickej hospodenergetickej hospodáárnosti budovrnosti budov
nn PokraPokraččovanie iniciatovanie iniciatíívy vy ManagEnergyManagEnergynn PrehPrehľľad zad záákladných kladných úúdajov pre indikdajov pre indikáátory tory
energetickej efektenergetickej efektíívnosti vvnosti v sektore budovsektore budovnn NovNovéé aplikaplikáácie vcie v biopalivbiopalivááchchnn ŠŠttúúdia na prdia na príípravu novely smernice pravu novely smernice
oo ššttíítkovantkovaníí kotlovkotlov

IEE 2004, 2005 IEE 2004, 2005 –– ĎĎalalššie krokyie kroky
nn Call for proposalsCall for proposals 2004: 2004: od 6.1.2005od 6.1.2005nn InformaInformaččnnéé dni:dni: december 2004, janudecember 2004, januáár r
20052005nn Pracovný program 2005: Pracovný program 2005: 1Q 20051Q 2005nn Call for proposalsCall for proposals 2005:2005: junjun--jjúúl 2005l 2005nn Nový Nový komunitkomunitáárnyrny program IEE 2007program IEE 2007--
20132013: : predstavený v polovici roka 2005 predstavený v polovici roka 2005 po zhodnotenpo zhodnoteníí doterajdoterajššieho priebehu IEE ieho priebehu IEE 20032003--2006 2006

ĎĎakujem za pozornosakujem za pozornosťť
Ing. Ing. Miroslav Miroslav MariaMariašš
koordinkoordináátor refertor referáátu Agendy Etu Agendy EÚÚSSekcia výrobných a sieekcia výrobných a sieťťových odvetvových odvetvííMH SR, MierovMH SR, Mierováá 19 tel:+421/2/48519 tel:+421/2/4858707487074827 15 Bratislava fax:+421/2/43339287827 15 Bratislava fax:+421/2/43339287
email: email: [email protected]@economy.gov.sk

TECHNOLOGIES WITH CAPACITY UP TO 1 MW Miroslav Mravec Herz, s.r.o. Phone: +421 2 624 119 10 E-mail: [email protected]

Technológie s výkonom do 1 MW
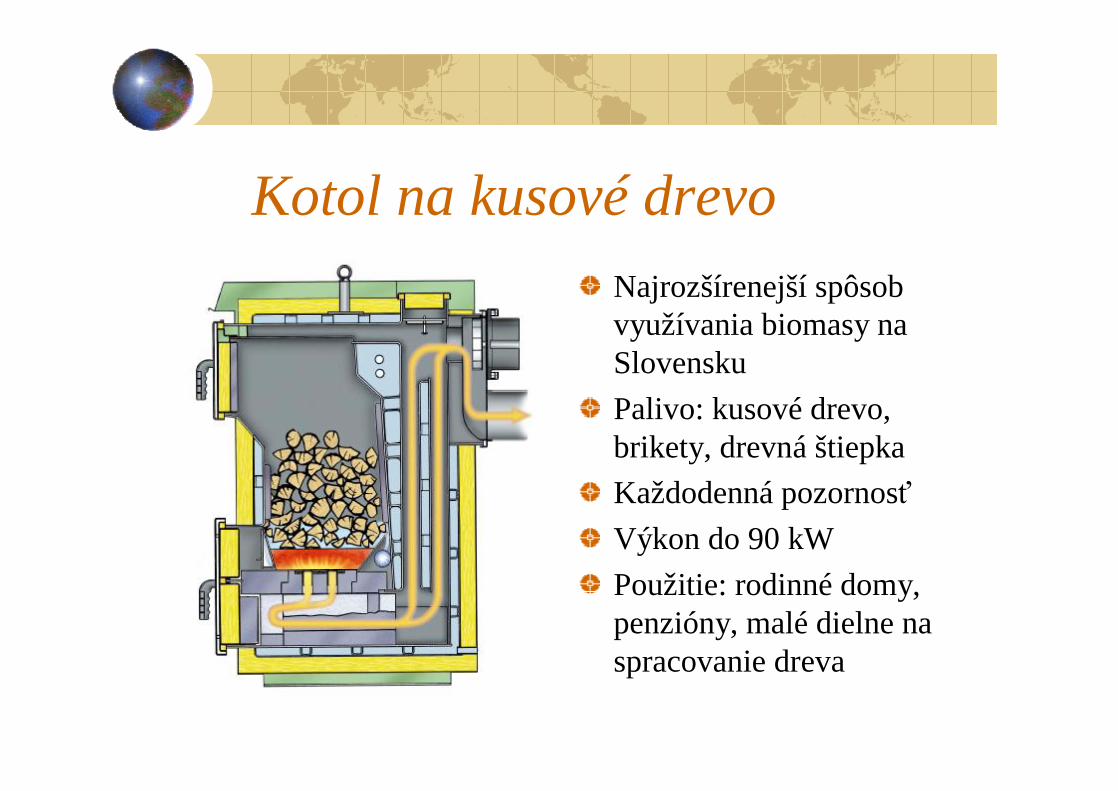
Kotol na kusové drevoNajrozšírenejší spôsob využívania biomasy na SlovenskuPalivo: kusové drevo, brikety, drevná štiepkaKaždodenná pozornosťVýkon do 90 kWPoužitie: rodinné domy, penzióny, malé dielne na spracovanie dreva

Plnoautomatický systém

Kotol na spaľovanie pelietPalivo: peletyPoužitie: rodinné domy, penziónyPlnoautomatickézariadenieJednoduchá obsluhaAutomatické zapaľovanieOchrana proti spätnému vznieteniu palivaLambda sonda

Kotly s výkonom nad 30 kW

Kotly s výkonom nad 30 kWPalivo: pelety, drevnáštiepka, briketyPoužitie: bytové domy, objekty verejnej správy, Flexibilné zostaveniezariadenia a návrh podľaželania zákazníka
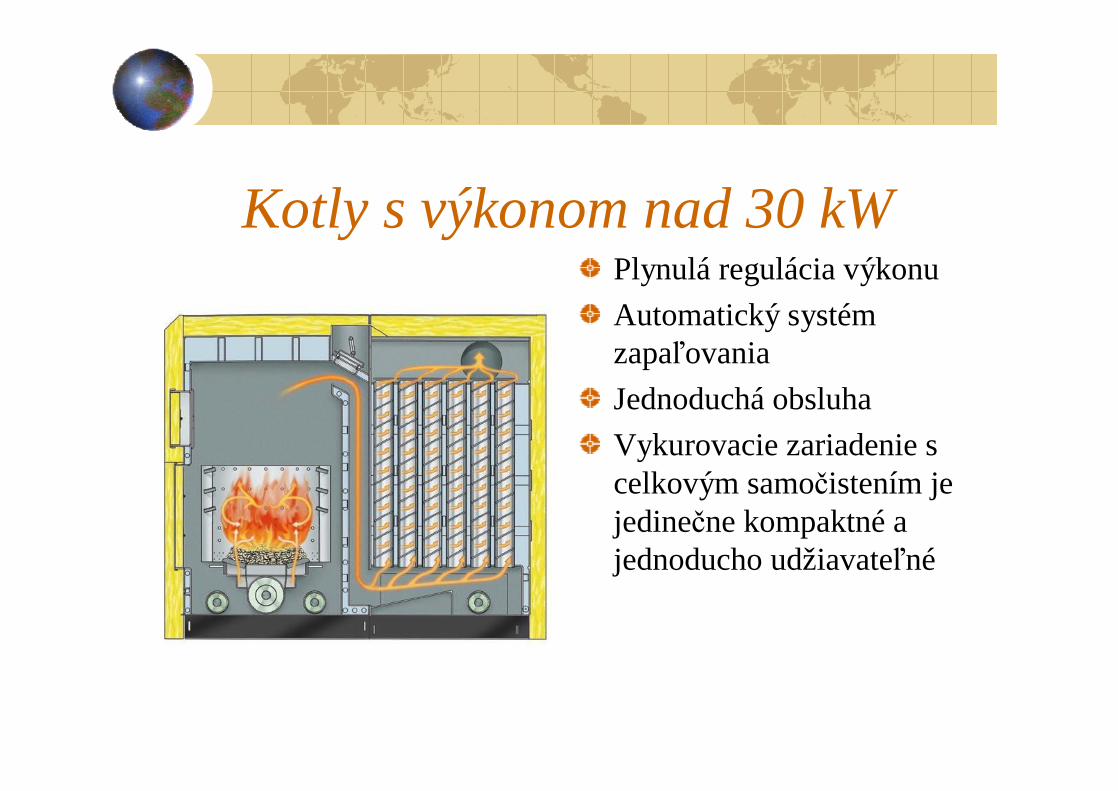
Kotly s výkonom nad 30 kWPlynulá regulácia výkonuAutomatický systém zapaľovaniaJednoduchá obsluhaVykurovacie zariadenie s celkovým samočistením je jedinečne kompaktné a jednoducho udžiavateľné

Doprava paliva

Schéma zapojenia kotolne

Vizualizácia

Ďakujem za pozornosťKontakt:Ing. Miroslav MravecHerz, spol. s r.o.Šustekova 16, 850 05 BratislavaTel.: +421 2 6241 1909, 6241 1910E-mail: [email protected]

BIOMASS OPPORTUNITIES FOR CHP & DH ELOI PIEL European Affairs Officer, Euroheat & Power Phone: 0032 2740 21 10 E-mail: [email protected]

EUROHEAT & POWER
International Slovak Biomass Forum, Bratislava
21-22 February 2005
BIOMASS
OPPORTUNITIES FOR CHP & DH
ELOI PIEL
European Affairs Officer, Euroheat & Power

EUROHEAT & POWER
Euroheat & Power
“Association of Associations“Members in 32 countries, including 21 national
CHP/DHC associations:
Austria, Czech Republic, Denmark, Estonia, Germany, Finland, France, Hungary, Iceland, Italy, Lithuania, Latvia, Netherlands, Norway, Poland, Romania,Slovakia, Sweden, Switzerland, Russia, UK

EUROHEAT & POWER
BIOMASS AND DH/CHP
Ø Proven technology
Ø Infrastructure relating local sources to heat load
Ø Experience with diversity of fuels, biomass included
Surplus heatfrom industry
Municipal waste
Fossil fuelsCHP Biofuels

EUROHEAT & POWER
DH MARKET SHARE
Iceland 95 % Estonia 52 %Poland 52 % Denmark 51 %Sweden 45 % Slovakia 40 %Finland 48 % Hungary 16Austria 14,5 % Germany 12 %Netherlands 03 % UK 01 %
EU 15: From 1 to 50% in FinlandCEEC: 40%= 23 million customers in EU15 and 40 millions in CEEC

EUROHEAT & POWER
INPUT FUELS IN DH/CHP productionFuels:Coal still strong positionGas becoming fuel of choiceRES: ~ 11% and 1% in new 10 Members
CHPAverage EU 15: 70%CEEC: 35 to 70%
INPUT FUELS in NEW 10
48%
11%
33%
3%1% 4% coal
oilNatural Gas
waste
renewablesothers
INPUT FUEL in EU 15
34%
6%31%
10%
11%8% coal
oilNatural Gaswasterenewablesothers

EUROHEAT & POWER
BIOMASS IN DH
High share of RES in DH:Austria: 21%Finland: 26.1%Sweden: 28%Denmark: 9%
Lower share: CEEC (1%), France, Italy (1%)
Figures for 2001: EHP

EUROHEAT & POWER
GOOD PRACTISE
FORSSA (Finland)• 19 000 inhabitants city• New biomass plant in
1996• 65 MW CHP Plant• Fuels: Industrial wood
residues, forest chips, peat
Ø Replaced fossil fuelØ Stability of priceØ Use of local resources

EUROHEAT & POWER
REVIEW OF KEY ASPECTS IN THE DEVELOPMENT OF BIOMASS
Market prices/CompetitionInternalisation of real cost of fuelsBiomass market/Alternative use of biomassTaxationInformation Administrative barriers

EUROHEAT & POWER
POSSIBLE SUPPORT MECHANISM
POLICY FRAMEØ TaxationØ Feed-in Tariffs Ø Certificate schemes
ADDITIONAL ASPECTSInvestment supportBuilding/planning regulationsInformation..
Key factors to succeed:
ØOverall scheme addressing the entire biomass cycle
ØStability/Coherence of legislation

GREENHOUSE GAS & RENEWABLES MARKETS
Fiona Santokie Natsource Europe Ltd Phone: +44 –20–7827–2942 E-mail: [email protected]

Gre
enho
use
Gas
&G
reen
hous
e G
as &
Ren
ewab
les
Mar
kets
Ren
ewab
les
Mar
kets
BROKERAGE BROKERAGE SERVICESSERVICES
International Slovak Biomass International Slovak Biomass Forum Forum
21 February 200521 February 2005
Fiona SantokieNatsource Europe Ltd

NatsourceNatsourceGlobal Presence.– New York, Washington, London, Tokyo, Toronto,
Oslo.Major environmental commodity broker.– Greenhouse gases, renewables, SO2, NOx.
Strategic consulting.– Multinationals, EC, Dutch government, UK
registry, World Bank, etc.Emission Trading Management.
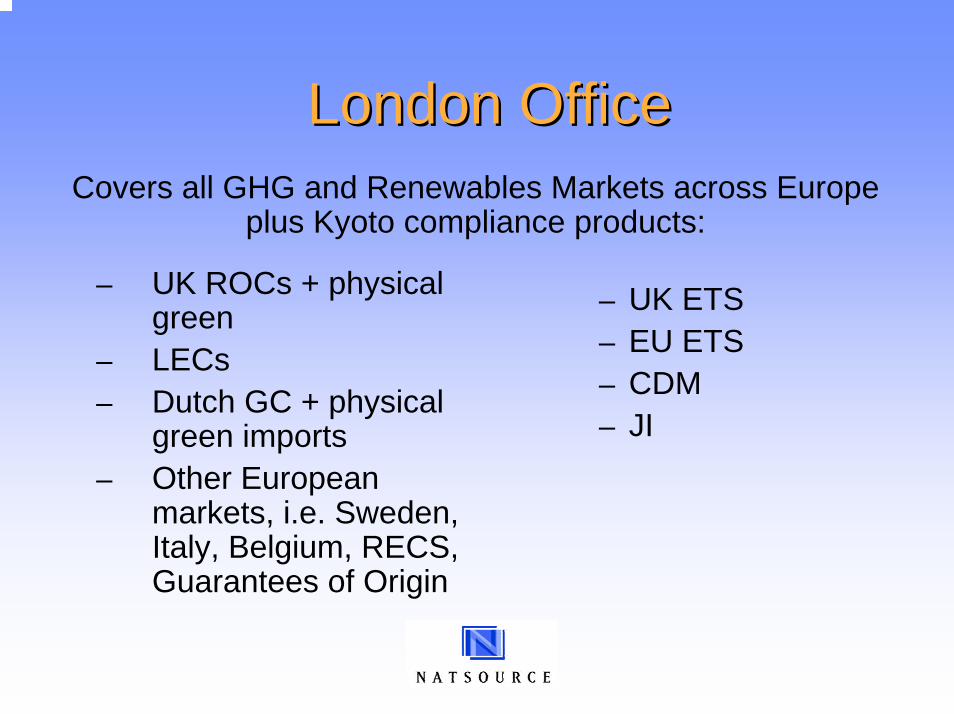
London Office London Office Covers all GHG and Renewables Markets across Europe
plus Kyoto compliance products:
– UK ROCs + physical green
– LECs– Dutch GC + physical
green imports– Other European
markets, i.e. Sweden, Italy, Belgium, RECS, Guarantees of Origin
– UK ETS– EU ETS– CDM– JI

Summary of European Green Summary of European Green Certificate MarketsCertificate Markets
Country/GC Market Last traded price (for current vintage)
UK Renewables Obligation £46.90 (€68)
UK Levy Exemption Certificates 88% = £3.78 (€5.48)CCL = £4.30 (€6.23)
Swedish Electricity Certificates 230 SEK (€25.25)
Belgian Green Certificates €101 (Flanders) €92 (Wallonia)
Italian Green Certificates 96% = €93.49GRTN reference price = €97.39
Guarantees of Origin €0.25

Problems experienced with Biomass Problems experienced with Biomass in Green Certificate Markets in Green Certificate Markets
Definition of Biomass– Differing interpretation of the EU definition of
biomass from country to country– Can conflict with domestic definition of waste
and therefore may be subject to other laws which may impact on the economics of using some particular biomass fuels
– Can take time to get definitive answer from authorities -

Problems experienced with Biomass Problems experienced with Biomass in Green Certificate Marketsin Green Certificate Markets
Revocation of certificates – i.e. being struck off by authorities. More likely to happen with biomass than wind or landfill gas – especially where mixed fuels are used such as with cofiring.Delays in certificates being issued – again because of qualification of fuel mix

Problems experienced with Biomass Problems experienced with Biomass in Green Certificate Marketsin Green Certificate Markets
Security of fuel supply – Buyers of long term green power purchasing agreements want to see evidence of fuel supply contracts.

Potential Opportunities for Biomass Potential Opportunities for Biomass
Cofiring in the UK – a number of companies with large fossil fuelled facilities have cofiring for last couple years in order to gain ROCsConversion of smaller fossil fuelled facilities to 100% biomass in order to gain GCs EU Emissions trading scheme – by converting fossil fuel facilities to part or wholly biomass

Project Finance Project Finance -- ExampleExampleCompany A has an allocation of 1m allowances per year under NAP and an expected surplus of 300,000 allowances.Opportunity to generate additional 20,000 allowance surplus per month (240,000 p.a) through projects if EUR 1.5 million funding is sourced – project will take 6 months to implementLimited resources to put in place contracts and go through credit checksNo appetite to speculate on the price of EU allowances

Suggested StrategySuggested StrategyTrade 1– Natsource arranges a sale of 250,000
allowances at price of EUR 7 per allowance. Delivery of allowances as soon as allocated into registry (March 2004 likely), Natsource will arrange payment to be made after delivery (10-20 business days)
– Receives EUR 1.75m in March 2004– Provides funding for investment in new project,
project started 1 April 2005

Suggested StrategySuggested StrategyTrade 2– Project completed end September 2005. On a
monthly basis, Natsource manages sale of 20,000 allowances per week from 1 October for through spot market according to strategy
Results– Project Implemented– Revenue maximised– Limited administrative burden– Concentrate on core business

Natsource EU ETS Transaction Natsource EU ETS Transaction ServicesServices
Brokerage services to installations:Price informationMarket Advice and UnderstandingRoute to market and Trade execution
EU ETS Managed Transaction Services– Provides a single route to market and
reduces administration requirements– Leaves client free to focus on core
business

Managed ServicesManaged ServicesGoals:– Market Access: Through Natsource’s contacts and
experience in the market, clients can access all market opportunities (Wholesale and Retail Market)
– Agreed Trading Stragegy to hedge price risk: purchases or sales of set volumes are made periodically over the year, orPrice Triggers - pre-determined price levels both above and below the current market level
– Simplicity: Natsource will handle the transaction, contractural and settlement of trades taking the burden off the client;
– Flexibility: if market conditions or client positions change the strategy can be quickly adjusted.
– Small Companies: Can aggregate installations who only have small volumes to transact into sector groups

Natsource Green Power Market Natsource Green Power Market Transaction Services Transaction Services
Expertise in structuring and negotiating long term green power purchase contracts – have concluded transactions as far forward as 2013, just received bids for contract out until 2016. Have covered all major technologies.Natsource’s knowledge and experience with the markets means that the process is speeded up for our clientsLarge client base across Europe established over a number of years.

Gre
enho
use
Gas
&G
reen
hous
e G
as &
Ren
ewab
les
Mar
kets
Ren
ewab
les
Mar
kets
BROKERAGE BROKERAGE SERVICESSERVICES
Contact informationContact information
Brokerage & Advisory services:
Tel: +44 –20–7827–[email protected]
www.natsource.comCalgary – Houston – London – New York – Oslo
Ottawa – Tokyo – Toronto – Washington DC

1
NOVÉ DRUHY ZHUTŇOVANÝCH MATERIÁLOV
Doc. Ing. Ľubomír Šooš, PhD. Ing. Ľudovít Kolláth, PhD. Ing. Peter Križan Ing. Peter Krížik Slovak University of Technology, Nám. Slobody 17, 812 31, Bratislava, Slovakia Phone: +421 2 572 965 39 E-mail: [email protected]
ABSTRACT This Report discusses new developmental trends at field of briquetting and pelletting technology used for compressing of the solid organic waste in order to energy utilization. Many a time mainly in operation of pellet ting engines fall problems because breach of entry fraction parameters (mainly dimensions of sawdust). Therefore comes new developed shape of wood fuel briquettes and some ideas about new production engine for it. Nowadays it is very important question considering actual costs of energy and situation in ecology.
1 ÚVOD Jednou z ciest ako efektívne energeticky zhodnoti ť tuhý odpad, je jeho
dezintegrácia, úprava na požadovanú vlhkosť a nakoniec zhutnenie. Produkt zhutnenia – výlisok je potom možné tak materiálovo ako aj energeticky zhodnoti ť. Technológie zhutňovania sú rozšírené najmä v USA, Nemecku, Rakúsku, Švédsku, či Dánsku. Na Slovensku sú tieto technológie ešte stále málo využívané. Za účelom následného materiálového zhodnotenia sú známe aplikácie v strojárenstve, poľnohospodárstve, hutníctve. Stále rastie počet požiadaviek z praxe na spracovanie a energetické zhodnotenie organických odpadov.
Pre následné energetické zhodnotenie sa na Slovensku vyrábajú brikety a pelety, pričom viac ako 95 % vyrobenej produkcie sa exportuje. Úspech rozšírenia technológií zhutňovania bude závisieť aj od výskumných aktivít v tejto oblasti.
Cieľom tohto príspevku je bližšie popísať výskum a vývoj v oblasti zhutňovania tuhých odpadov, ktorý realizujeme na Katedre výrobnej techniky Strojníckej fakulty STU v Bratislave.
Realizované výskumné aktivity na katedre môžeme rozdeli ť do dvoch základných smerov, (obr. 1) na výskum zhutňovania nových druhov materiálov a vývoj nových konštrukcií zhutňovacícch strojov.
Jadrom predkladaného príspevku je prezentovanie nových druhov zhutňovaných materiálov.
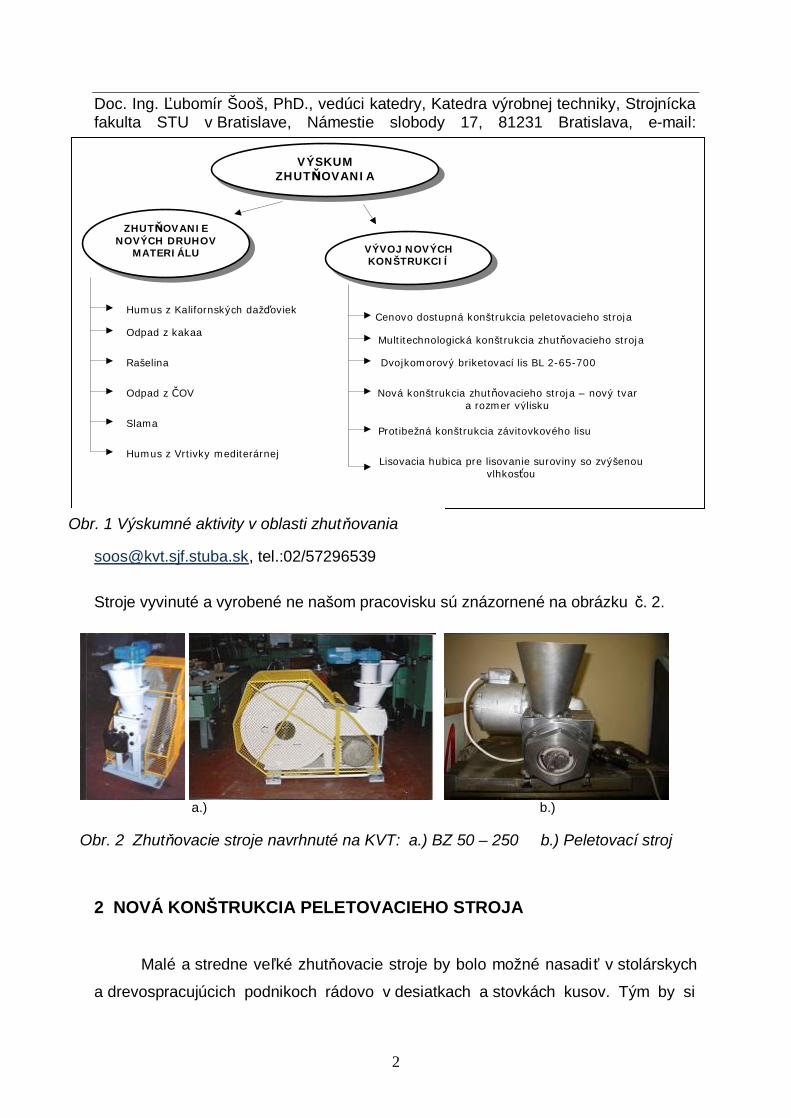
2
Doc. Ing. Ľubomír Šooš, PhD., vedúci katedry, Katedra výrobnej techniky, Strojnícka fakulta STU v Bratislave, Námestie slobody 17, 81231 Bratislava, e-mail:
[email protected], tel.:02/57296539
Stroje vyvinuté a vyrobené ne našom pracovisku sú znázornené na obrázku č. 2.
2 NOVÁ KONŠTRUKCIA PELETOVACIEHO STROJA
Malé a stredne veľké zhutňovacie stroje by bolo možné nasadiť v stolárskych
a drevospracujúcich podnikoch rádovo v desiatkach a stovkách kusov. Tým by si
a.) b.)
Obr. 2 Zhutňovacie stroje navrhnuté na KVT: a.) BZ 50 – 250 b.) Peletovací stroj
Cenovo dostupná konštrukcia peletovacieho stroja
Multitechnologická konštrukcia zhutňovacieho stroja
Dvojkomorový briketovací lis BL 2-65-700
Nová konštrukcia zhutňovacieho stroja – nový tvar a rozmer výlisku
Protibežná konštrukcia závitovkového lisu
Lisovacia hubica pre lisovanie suroviny so zvýšenou vlhkosťou
Humus z Kalifornských dažďoviek Odpad z kakaa
Odpad z ČOV
Slama
Humus z Vrtivky mediterárnej
Rašelina
VÝSKUM ZHUTŇOVANIA
ZHUTŇOVANIE NOVÝCH DRUHOV
MATERIÁLU VÝVOJ NOVÝCH KONŠTRUKCIÍ
Obr. 1 Výskumné aktivity v oblasti zhutňovania

3
viaceré firmy riešili problém s vykurovaním. Problémom je vysoká cena klasických
peletovacích strojov.
Jedným z možných riešení novej cenovo dostupnej konštrukcie peletovacieho
stroja je lis s axiálno – rotačnými valcami vyvinutý na našej katedre. V súčasnosti
sme dokončili zostavné výkresy a 3D modelovanie ideového návrhu (obr. 3).
Obr. 3 Pohľad na konštrukčný model novej konštrukcie peletovacieho stroja

4
Uvedený peletovací lis sme na katedre vyrobili, (obr. 2, 4) už prebehli aj prvé
overovacie skúšky na drevných pilinách a na slame (obr. 4). Na peletovacom lise sa
nám podarilo dosiahnuť želateľný výsledok – zlisovanie slamy (obr. 5), prípadne
zmesi slamy a MDF (obr. 8). Kvalitu výliskov a výkon je možné pod ľa nášho názoru
ešte zvýšiť.
3 NOVÉ MATERIÁLY
Výskum na Katedre výrobnej techniky sa ale neorientuje len na vývoj nových
konštrukcií zhutňovacích strojov, ale aj na výskum zhutňovania nových druhov
materiálov.
3.1 Odpad z Kalifornských dážďoviek
Kalifornské dážďovky (Eisenia foetída) sa chovajú na výrobu špeciálnej zmesi
enzýmov potrebných pre výrobu naprosto čistých bielkovín. Tieto dážďovky sú
pestované v špeciálnom humuse. Humus obsahuje ve ľké množstvo živín a je
Obr. 4 Peletovací stroj novej generácie
a.) b.) Obr. 5 Príklady peletovania: a.) peletovanie slamy b.) peletovanie zmesi (slama 50% + odpad z MDF 50%)

5
výhodné ho použiť ako hnojivo pre kvety. K tomu je ale potrebná vhodná granulácia
humusu. Z tohto dôvodu vzišla požiadavka zhutňovať humus do tvaru tyčiniek
vhodných pre aplikáciu izbových kvetov.
3.2 Odpad z kakaa
Odpad z kakaa je možné zhutniť do peletiek. Takto zhutnený odpad možné
ďalej tak materiálovo ako aj energetický zhodnocovať.
Obr. 6 Pelety z humusu z kalifornských ďažďoviek lisované 5. 9.2004
Obr.7 Pelety z kakaových šupiek: a- lisované 18.6.2004, b- lisovane 21.9.2004

6
3.3 Rašelina
Jedná sa o potenciálny energetický zdroj, ktorý má ve ľmi podobné parametre
ako hnedé uhlie. Zhutňovanie rašeliny sme realizovali pre jednu Slovenskú firmu.
Firma uvažuje briketovať rašelinu na našich briketovacích lisoch v Rusku a na
Ukrajine a časť z takéhoto paliva dovážať aj na Slovensko.
3.4 Odpad z ČOV
Ide o veľmi problematický odpad vzhľadom na jeho vlhkosť a množstvo.
V neupravenom stave sa jedná sa o kašovitý odpad s 95 - 98 % relatívnou vlhkos ťou.
Odpad pritom obsahuje 65 – 80 % organického materiálu. Po odstredení, tlakovom
lisovaní, naviazaní na základný nosič, fermetrácii a následnom lisovaní je možné
z odpadu získať alternatívne palivo s výhrevnosťou 9 – 11 MJ/ kilogram. Už prvé
experimentálne výsledky ukázali, že je to spôsob ako z odpadu možno získa ť vhodné
alternatívne palivo.
Obr.8 Pelety z rašeliny

7
3.5 Slama
Na Slovensku sa v súčasnosti seje pšenica asi na 800 tisíc hektároch.
Z jedného hektára pritom získame asi 4 tony pšenice a približné také isté množstvo
aj slamy. Pritom táto slama nie je vhodná ani na kŕmenie ani na podstielku dobytka.
Výhrevnosť slamy je asi 14,5 MJ/Kg. Z uvedeného je zrejmé, že ide
o nezanedbateľný energetický potenciál. Pre príklad úspešného energetického
zhodnotenia slamy stačí cestovať len niekoľko kilometrov do rakúskeho
mestečka Wolstahl.
Obr. 9 Pelety z kalu z ČOV a/ 100 % kal b/ 50 % kal – 50 %% slama
Obr. 10 Pelety zo slamy a/ lisované 8.12.2004 b/ lisovane 9.12.2004

8
3.6 Humus z Vrtivky mediterárnej
Vrtivka mediterárna je jedným z najväčších poľnohospodárskych škodcov na
svete. Inštitúcia APHIS v roku 1993 predbežne stanovila, že ročné straty spôsobené
týmto škodcom v USA, by mohli 1,5 miliardy dolárov. Na jej zneškodnenie bol
vytvorený projekt SIT(Steril Insekt Technique). Pri tejto metóde je škodca chovaný v
umelých podmienkach, sterilizovaný a vypúšťaný do postihnutých oblastí.
Pri chove sú dodržiavané jednotlivé štádia vývoja. Po vyliahnutí sú vajíčka
umiestnené v špeciálnej zmesi zloženej z otrúb, cukru, vody, sušených pivných
kvasníc a ďalších zložiek. Kŕmna zmes svojím obsahom byť nahrádza dužinu plodiny
a je živnou pôdou pre vývoj larvičiek. Výživná zmes je určená iba na jedno použitie.
Likvidácia tohoto odpadu predstavuje enviromentálny ako aj ekonomický problém.
Najvýhodnejším spôsobom likvidácie kašovitého odpadu vychádza použitie
technológie peletovaním. Výsledným produktom sú pelety s vlhkosťou maximálne
8%, čo umožňuje ich ľahšiu manipuláciu, balenie ako aj možnosť krátkodobého
uskladnenia. Nedochádza pritom k zníženiu nutričnej hodnoty zmesi a pelety sú
vhodným doplnkovým krmivom pre zvieratá.

EXPERIENCES FROM PREPARATION AND FINANCING OF BIOMASS PROJECTS
Ing. Vladimír Vacho Department of project finance and large customers, Dexia banka Slovensko Phone: +421 903 565 126 E-mail: [email protected], [email protected]

Dexia banka Slovensko a.s.
Experiences from preparation and financing of biomass projects
International Slovak Biomass Forum 2005
February 2005
Ing. Pavol StašíkIng. Vladimír VachoDepartment of project finance and large customers, Dexia banka Slovensko, a.s.

2Dexia banka Slovensko
Experiences from preparation and financing of biomass projectsWho is Dexia banka Slovensko, a.s.?
PKB has been formed from its establishment in 1993 as an universal bank for Slovak financial market. As the bank was found by the municipalities, its main goal was financing necessities of municipal customers. All the financial sources used for financing of municipal customers ensure providing of public services /utilities/ and meet subsistence of Slovak population.
In 2000 an international strategic investor Dexia Group became the major owner of the bank. This group belongs to the world most important institution in the area of public finance and utilities. In October 2003 it has been changed its name to Dexia banka Slovensko, a.s.
The worldwide experiences from financing of municipal customers as well as the leverage of the Group provide DBS three main advantages:
• long-term financing /10-15 years/,
• knowledge all of the specific risks in municipal financing and their mitigation,
• capacity and know-how of team of specialists in the area of project finance.
All these advantages and experiences providing to all municipal and corporate customers possibility to realize carefully prepared investments oriented on improvement of municipal infrastructure.

3Dexia banka Slovensko
Experiences from preparation and financing of biomass projectsPhase of preparation
Project company
External environment:
Customermarket analysesfinancial model
1
Technology supplier
information and analyses of technology2
Biomass supplier
biomass information3
Financial sources /loan, subsidy, lease .../
exchange of information
feedback
4
Owner
strong support 5

4Dexia banka Slovensko
Experiences from preparation and financing of biomass projectsPhase of construction
Project company
External environment:
Biomass supplier
Technology supplier
contracts
1
Financial sources /loan, subsidy, lease .../
exchange of information drawings
2
Owner
strong support 5
Municipalities
4support
Customercommunicationinformation
3support
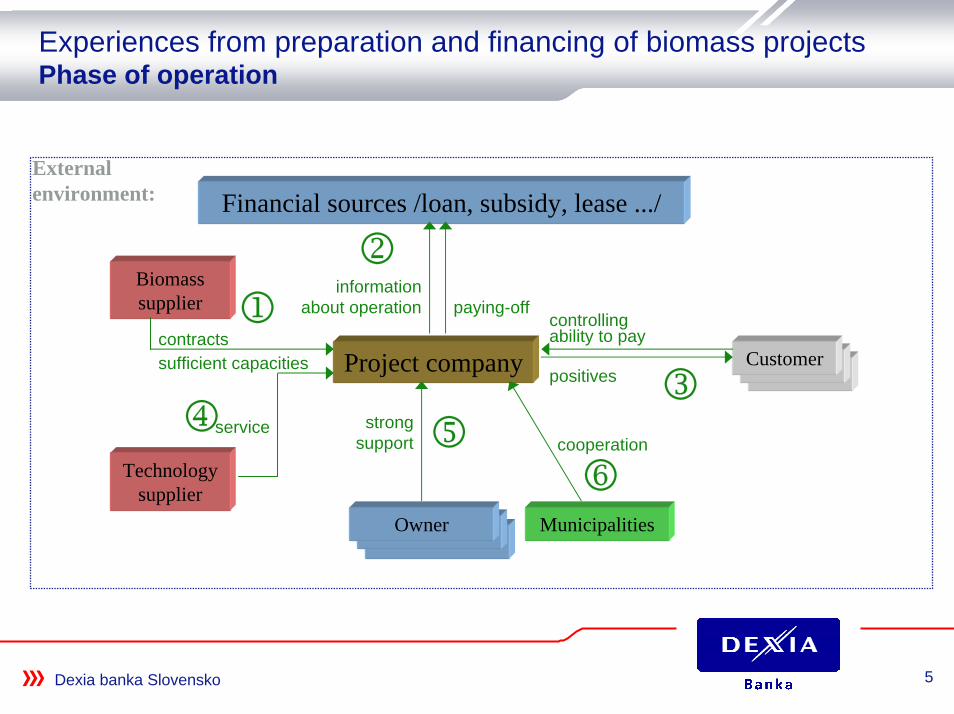
5Dexia banka Slovensko
Experiences from preparation and financing of biomass projectsPhase of operation
Project company
External environment: Financial sources /loan, subsidy, lease .../
information about operation paying-off
2
Technology supplier
service4
Owner
strong support 5
Customerpositives
ability to pay
3
controlling
Biomass supplier 1
contractssufficient capacities
Municipalities
cooperation
6

6Dexia banka Slovensko
Experiences from preparation and financing of biomass projectsDexia banka Slovensko’s references – 2002 až 2004
Project finance in energy sector:
YearNo. of
projectsInvestment costs of
projects in SKKLoans provided by
DBS in SKK
2002 8 467 159 000 348 500 000
2003 11 564 967 000 422 412 000
2004 18 1 467 905 000 816 061 000
Together 37 2 500 031 000 1 586 973 000
7Dexia banka Slovensko
Experiences from preparation and financing of biomass projects
Address:Dexia banka Slovensko, a.s.Department of project finance and large customers
Obchodná 1, Bratislava
www.dexia.sk
e-mail: [email protected]@dexia.sk

FORESTS OF THE SLOVAK REPUBLIC - STRATEGIC BIOMASS PRODUCER
Karol Vinš General Director LESY SR š.p. Phone: +421 48 43 44 260 E-mail: [email protected]

LESY Slovenskej republiky, š.p. (FORESTS of the Slovak Republic, state enterprise)
Strategic Biomass Producer
LESY SRš.p. Banská Bystrica

FORESTS of the Slovak Republic, state enterprise – most significant forest management enterprise in
Slovakia
LESY SRš.p. Banská Bystrica
• manages 52% of the country woodlands • the most significant renewable resource
• Logging output per year:
renewable – 2,600,000m3
cultivation – 780,000m3
• a significant potential resource of dendromass forheat production purposes

020406080
100120140160
2004 2005 2006
Amount ofwoodchipsin mt
Capital investment scheme – splitting machines procurement schedule
LESY SRš.p. Banská Bystrica
Biomass Exploitation Project and its Implementation
Why the biomass:Our prospective potential for biomass resources : 1,100,000 mt yearlyWe currently produce approx. 20,000 mt of wood chips.
Our target:
Capital investments must be made to achieve this.
0123456789
10
2004 2005 2006
Planned purchasesplitting machinesNumber of mach. currently owned

LESY SRš.p. Banská Bystrica
PROJECT IMPLEMENTATION
Palárikovo
RC Trenčín
RC LeviceRC R.Sobota
NámestovoČadca
BIOMASSCENTRE
KošiceRevúca
The Biomasss Plant was established in Levice and regional centres were established in Levice, Trenčín and Rimavská Sobota, by 1st January 2005
Further regional centres will be established before 30th September 2005 in Čadca, Revúca, Palárikovo, Námestovo and Košice

LESY SRš.p. Banská Bystrica
STRATEGIC TARGETS
l Create the markets, obtain the customers and develop thestrategies leading to success
l Build a network of our own high performance splittingmachines, capable of achieving high productivity
l Establish an organisation that would be flexible, decentralisedand perfectly manageable, being a network of people workingand learning how to work efficiently in a highly concurrentmanner
l Modern technologies and superior quality wood splittingmachines enabling low-cost operation are the necessaryprerequisites in order to achieve a leading position on themarket.

LESY SRš.p. Banská Bystrica
PRIORITY CHARACTER OF REGIONAL PROJECTS
– Construction of new regional heating plants based on woodchips burning is of prime importance
New regional projects- City of Poprad, -Kysucké Nové Mesto-Martin heating plant-City of Púchov, Jelšava-Zvolen, Hnúšťa, Tisovec-Revúca Region-City of Komárno, Šamorín-City of Humenné, Vranov nad Topľou Consumption of woodchips 25,000 mt per year
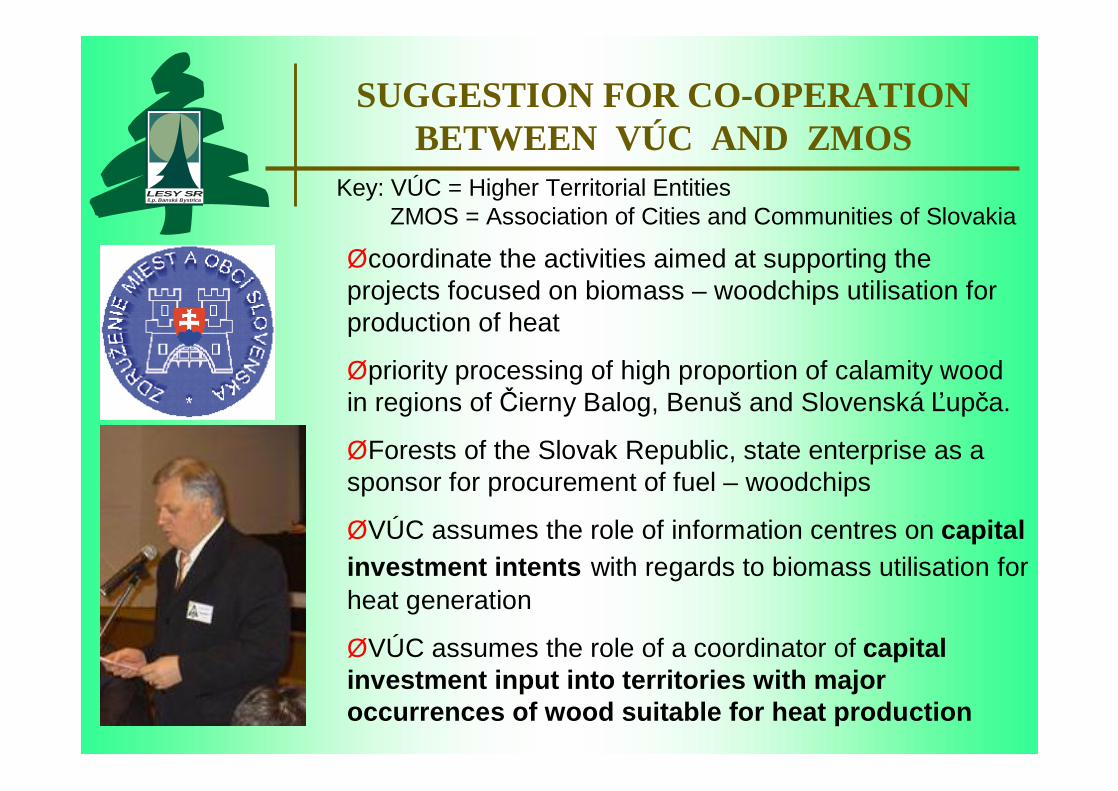
LESY SRš.p. Banská Bystrica
SUGGESTION FOR CO-OPERATION BETWEEN VÚC AND ZMOS
Øcoordinate the activities aimed at supporting the projects focused on biomass – woodchips utilisation for production of heat
Øpriority processing of high proportion of calamity wood in regions of Čierny Balog, Benuš and Slovenská Ľupča.
ØForests of the Slovak Republic, state enterprise as a sponsor for procurement of fuel – woodchips
ØVÚC assumes the role of information centres on capital investment intents with regards to biomass utilisation for heat generation
ØVÚC assumes the role of a coordinator of capital investment input into territories with majoroccurrences of wood suitable for heat production
Key: VÚC = Higher Territorial EntitiesZMOS = Association of Cities and Communities of Slovakia

LESY SRš.p. Banská Bystrica
STATE ENTREPRISE FORESTS´INTENTS
1.The raw material „WOODCHIPS“suitable for heat production, offered for sale to boroughs and municipalities will help these to cut down the costs required in connection with production of heat and use the saved funds for financing the development in other areas
2. Much emphasis is laid on ecological aspects. By processing residual wood following thelogging of calamity wood we would like toachieve that the overall status of vegetation health is improved, especially in areas withincreased occurrence of pollution and naturalcalamities hazard.

LESY SRš.p. Banská Bystrica
STATE ENTREPRISE FORESTS´INTENTS
3. Co-operate with forest owners while utilising the potential biomass resources. Ensure the purchase and thenecessary processing of biomass from woodlands heldby private owners.
4. Coordinate, in co-operation withresearch institutes and heating plantsmanufacturers, all the activities aimed tosupporting the implementation ofregional projects based on the use ofdendromass for heat production.
5. Achieve a prospective increase of raw material basis as well as an improvement in the area of landscaping by planting the vegetation suitable for production of heat.
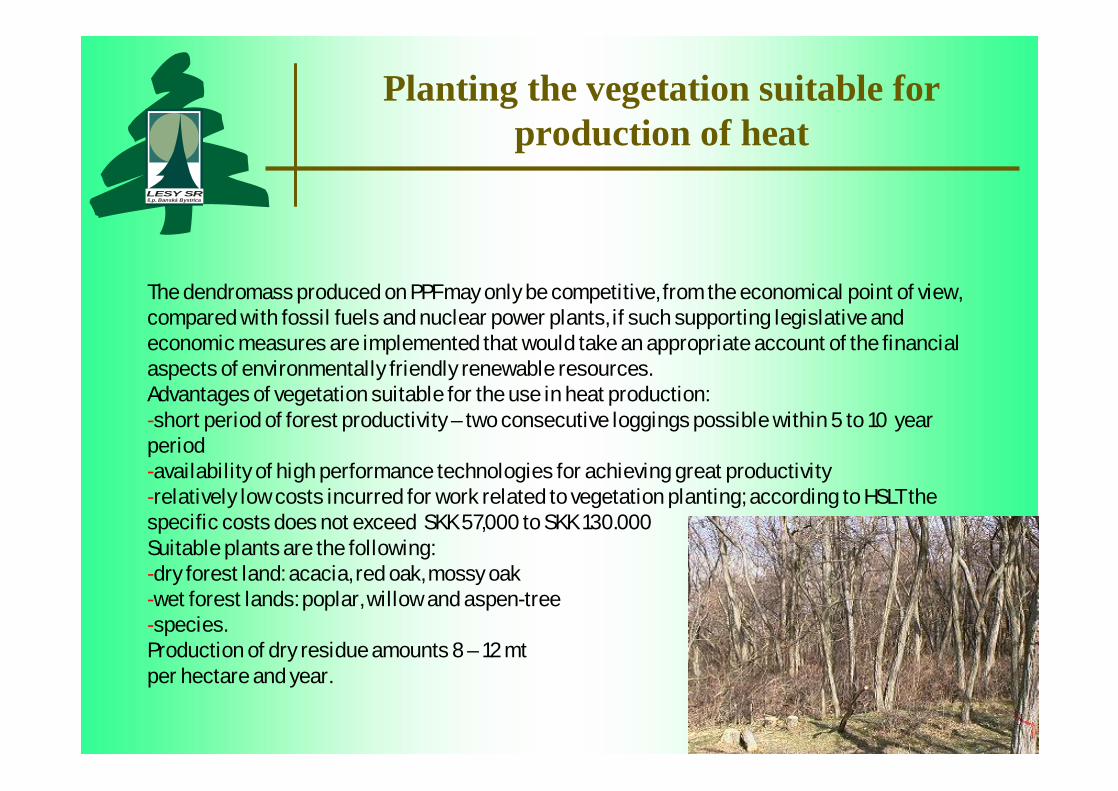
Planting the vegetation suitable for production of heat
The dendromass produced on PPF may only be competitive, from the economical point of view, compared with fossil fuels and nuclear power plants, if such supporting legislative and economic measures are implemented that would take an appropriate account of the financial aspects of environmentally friendly renewable resources.Advantages of vegetation suitable for the use in heat production:-short period of forest productivity – two consecutive loggings possible within 5 to 10 year period-availability of high performance technologies for achieving great productivity-relatively low costs incurred for work related to vegetation planting; according to HSLT the specific costs does not exceed SKK 57,000 to SKK 130.000Suitable plants are the following: -dry forest land: acacia, red oak, mossy oak-wet forest lands: poplar, willow and aspen-tree -species. Production of dry residue amounts 8 – 12 mt per hectare and year.
LESY SRš.p. Banská Bystrica

LESY SRš.p. Banská Bystrica
Assumed land area intended for planting the woods suitable for production of heat on PF within
Lesy Slovenskej republiky, š.p. Banská Bystrica
825,000within Lavce group
Aspen + mixed species
81,300Acacia
811,500Refined willow trees
12900Refined poplars
in dry state( ha )
mt / ha / yearbefore 2015
ProductionLand area assumed for the useTree

LESY SRš.p. Banská Bystrica
Cooperation with the Zvolen Forest Plant in the area of the use of biomass
for heat energy production
Cooperation subject:
Ø Optimisation of production and exploitation of acacia and other fast growing wood species
Ø Evaluation of ecologic and technical and economic impacts of thecomprehensive processing of biomass in regions of Orava, Kysuce and Slovenské Rudohorie
Ø Evaluation of ecologic and economic parameters of heat production in relationship to biomass quality
Ø Utilisation of solid residuals following biomass burningØ Preparation and realisation of regional projects of the biomass use for
production of heat
Cooperation objective:Ø Increase of fuel biomass local consumption in all areas of the economy
in SlovakiaØ Application of the ecologically friendly processes of biomass production
in forestry and its subsequent use for production of heat under conditions of sustainable development in SR.

The programme of Biomass use in regions of Revúca – Beňuš – Č. Balog– Slov. Ľupča
An ecological project is currently underway in cooperation with the LVÚZvolen intended to suppress the increase of extent of calamity wood exploitation extent through processing of tree tops
Secondary product of burning – ash will be used during the forestation process by using it directly at the points of planting new nursling plants to improve the chemical and physical properties of soil
LESY SRš.p. Banská Bystrica

Barriers limiting the use of biomass for power engineering needs
Ø Current legislation does not address the problems related to renewable resources of energy in a comprehensive manner, and does not provide for sufficient motivation in connection with the use of biomass for power engineering needs
Ø High investment requirements due to import of the needed technologies
Ø Insufficient support by the government with regards to projects related to the use of biomass
Ø Non-advantageous purchase price of energy produced from dendromass for supply via public networks
Legislative barriers prove to be the main obstacles which have caused that Slovakia is falling behind in the effort of increasing the proportion of energy produced from renewable resources.
LESY SRš.p. Banská Bystrica

ESSENTIAL PRIORITIE - VISIONS
LESY SRš.p. Banská Bystrica
The horizon of 2010 orientation to future:- Independence on foreign resources- Safety character of renewable energy resources- Reliability of supplies, development of regions- Environmental protection
Focusing on the problem:- support of energy production from renewable resourcesTools: Law on OZE support
Law on regulation in power engineering industrial areas
/determination of minimum purchase prices/
Issue
Vision: Production300 to 400 th. mt ofwoodchips

Prerequisites of a successful Biomass project implementation
LESY SRš.p. Banská Bystrica
• Significant increase of energy costs, of gas in particular will provide for an increased demand for woodchip suitable for heat production
• Pilot regional program held by SES, a.s. Tlmače is the guarantee of success and independence on other resources
• Legislation criteria with regards to air pollution are becoming more stringent – accordingly the heating plants are seeking for new opportunities by replacing the coal and lignite with woodchips
• A significant raw material basis operated by ŠL is the guarantee of the project success and of the environmental protection
• An active and motivating government support may speed up the process initiated in connection with the use of the biomass for heat production, currently widely pursued in the ECC countries.

LESY Slovenskej republiky, š.p. Strategický producent biomasy
LESY SRš.p. Banská Bystrica

Lesy Slovenskej republiky š.p. – najvýznamnejší lesohospodársky podnik
na Slovensku
LESY SRš.p. Banská Bystrica
• obhospodarujú 52% lesnej pôdy • najvýznamnejší obnoviteľný surovinový zdroj
•ročná ťažba:
obnovná – 2 600 000m3
výchovná – 780 000m3
• významný potencionálny zdroj dendromasy na energetické účely

0
20
4060
80
100
120
140
160
2004 2005 2006
množstvoštiepky vtonách
Investičný zámer – harmonogram nákupu štiepkovačov
LESY SRš.p. Banská Bystrica
Projekt využitia biomasy a jeho realizácia
Prečo biomasa:Náš perspektívny potenciál zdrojov biomasy je : 1 100 000 ton ročne.V súčasnosti produkujeme cca 20 000 ton lesnej štiepky.
Náš cieľ:
Aby sme ho dosiahli budeme investovať. 0123456789
10
2004 2005 2006
plánovaný nákupštiepkovačovPočet vlastnýchštiepkovačov
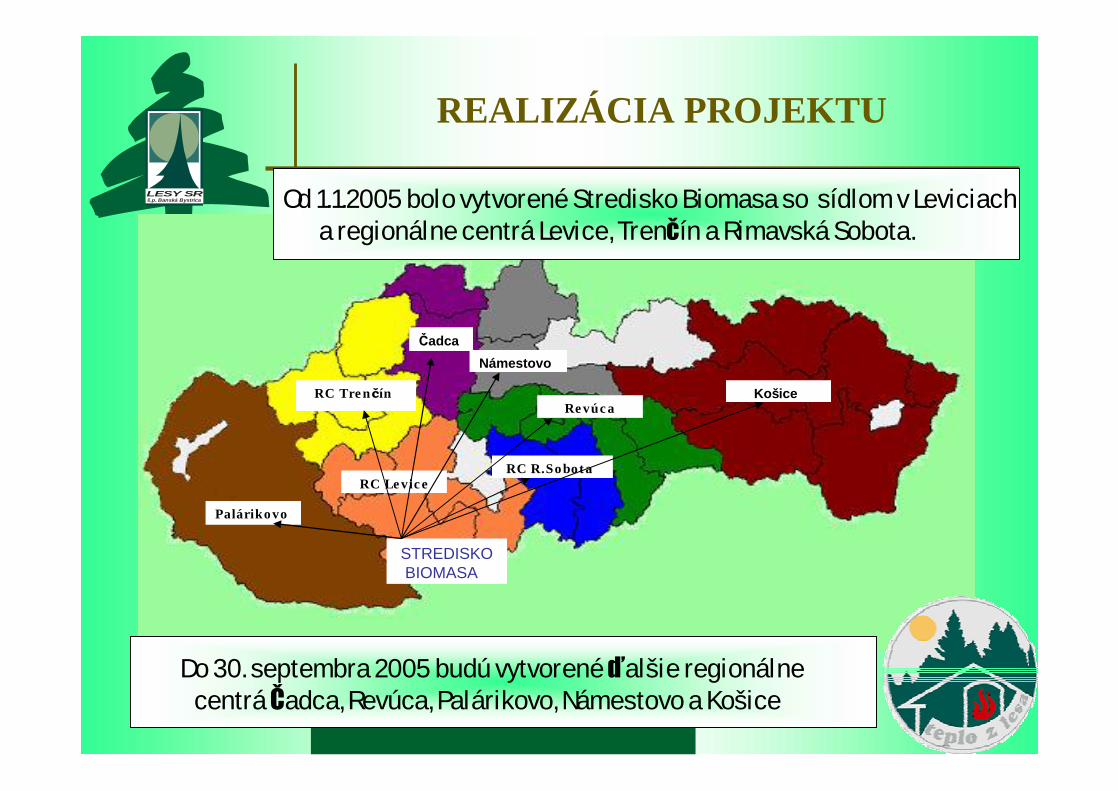
LESY SRš.p. Banská Bystrica
REALIZÁCIA PROJEKTU
Palárikovo
RC Trenčín
RC LeviceRC R.Sobota
NámestovoČadca
STREDISKO BIOMASA
KošiceRevúca
Od 1.1.2005 bolo vytvorené Stredisko Biomasa so sídlom v Leviciach a regionálne centrá Levice, Trenčín a Rimavská Sobota.
Do 30. septembra 2005 budú vytvorené ďalšie regionálne centrá Čadca, Revúca, Palárikovo, Námestovo a Košice

LESY SRš.p. Banská Bystrica
STRATEGICKÉ CIELE
lVytvárať trhy, získavať zákazníkov a vyvíjať stratégie vedúce k úspechu
lVybudovať vlastnú sieť výkonných štiepkovacích strojov, dosahujúcich vysokú produktivitu práce
lVybudovať organizáciu, flexibilnú decentralizovanú dokonale ovládateľnú, bude to sieť ľudí spoločne pracujúcich a spoločne sa učiacich
lModerné technológie a špičková štiepkovacia technika zabezpečujúca výrobu s nízkymi nákladmi sú základom pre dosiahnutie prioritného postavenia na trhu.

LESY SRš.p. Banská Bystrica
PRIORITA REGIONÁLNYCH PROJEKTOV
Najvyššou prioritou je – výstavba nových regionálnych teplárni na využitie
lesnej štiepky Nové regionálne projekty
- mesto Poprad, -Kysucké Nové Mesto-Martinská tepláreň-mesto Púchov, Jelšava-Zvolen, Hnúšťa, Tisovec-región Revúca-mesto Komárno, Šamorín-mesto Humenné, Vranov nad Topľou Ročná spotreba až 25 000 ton štiepky.

LESY SRš.p. Banská Bystrica
NÁVRH SPOLUPRÁCE S VÚC A ZMOS
Økoordinovať svoje aktivity smerujúce k podpore realizácie projektov energetického využitia biomasy –lesnej štiepky
Øprioritné spracovanie vysokého podielu kalamitného dreva v regióne Čierny Balog, Benuš a Slovenská Ľupča.
ØLesy Slovenskej republiky, š.p. ako garant zabezpečenia paliva – lesnej štiepky
ØVÚC ako informátor o investičných zámeroch pre využitie biomasy na výroby energie
ØVÚC ako koordinátor smerovania investícií do oblastí s najvyššími zásobami energetického dreva

LESY SRš.p. Banská Bystrica
ZÁMERY ŠTÁTNYCH LESOV
1.Pre samosprávy miest a obcí ponúkame surovinu – energetickú „ŠTIEPKU“, pomocou ktorej môžu dosiahnuť výraznézníženie nákladov na výrobu tepla a úsporu zdrojov potrebných pre vlastný rozvoj.
2.Veľký dôraz kladieme na ekologickú stránku projektu. Spracovaním zbytkov po kalamitných ťažbách chceme dosiahnuťzlepšenie zdravotného stavu porastov, hlavne v emisne a kalamitne ohrozených územiach.

LESY SRš.p. Banská Bystrica
ZÁMERY ŠTÁTNYCH LESOV
3. Spolupracovať s vlastníkmi lesov pri využívanípotencionálnych zdrojov biomasy. Pre nové reg. projekty zabezpečíme výkup i spracovanie biomasy z porastov súkromných vlastníkov lesov.
4. V spolupráci s výskumnými ústavmi a výrobcami energet. kotolníkoordinovať svoje aktivity smerujúcek podpore realizácie regionálnych projektov pre energet. využitie dendromasy.
5. Zakladaním energet. porastov dosiahnuťperspektívne zvýšenie surovinovej základne a zlepšenie v oblasti krajinotvorby.

Zakladanie energetických porastov
Dendromasa produkovaná na PPF z ekonomického hľadiska môže byť konkurencie schopná voči fosílnym a jadrových elektrárňam až v prípade zavedenia takých podporných legislatívnych a ekonomických opatrení, ktoré aj finančne zohľadňujúenvirometnálnu výhodnosť obnoviteľných zdrojov.
Výhody energetických porastov:-krátka doba návratu ťažieb – rubný vek 5 až 10 rokov-výkonná špičková ťažbová technológia zabezpečujúca vysokú produktivitu-pomerne nízke náklady na pestovnúčinnosť, nákladovánáročnosť je podľa HSLT od 57.000,- do 130.000,-Sk
Vhodné dreviny na:-suchých stanovištiach: agát biely, dub červený, dub cerový
-vlhších stanovištiach: klony topoľov, vŕb a osiky.
Ročná produkcia sušiny je 8 – 12 ton/ha.
LESY SRš.p. Banská Bystrica

LESY SRš.p. Banská Bystrica
Predpokladaná plošná výmera energetických porastov na PF v rámci
Lesov Slovenskej republiky, š.p. Banská Bystrica
825000v rámci skupiny Lavce
Osika + krížence
81300Agát biely
811500Šľachtené vŕby
12900Šľachtené topole
v suchom stave( ha )
t / ha / rokdo r. 2015
ProdukciaPlošná výmera s horizontomDrevina

LESY SRš.p. Banská Bystrica
Spolupráca s LVÚ Zvolen v oblasti energetického využitia biomasy
Predmet spolupráce:
Ø Optimalizácia produkcie a ťažby energetických porastov agáta bieleho a rýchlorastúcich drevínØ Hodnotenie ekologických a technicko – ekonomických dôsledkov
komplexného spracovania biomasy v kalamitných oblastiach Oravy, Kysúc a Slovenského RudohoriaØ Hodnotenie ekologických a ekonomických parametrov výroby energie
v závislosti od kvality biomasyØ Využitie tuhých zvyškov po spaľovaní biomasyØ Príprava a realizácia regionálnych projektov využitia palivovej biomasy
Cieľ spolupráce:Ø Zvýšenie tuzemskej spotreby palivovej biomasy vo všetkých odvetviach
hospodárstva SRØ Aplikácia ekologicky vhodných postupov výroby palivovej biomasy
v lesníctve a jej následného následného energetického využitia pre zabezpečenie dlhodobo udržateľného rozvoja v podmienkach SR

Program využitia biomasy v reg. Revúca – Beňuš – Č. Balog– Slov. Ľupča
Je pripravovaný ekologický projekt v spolupráci s LVÚ Zvolen pre utlmenie nárastu kalamitných ťažieb spracovaním korunovej časti poškodených stromov.
Druhotný produkt spaľovania – popol sa použije pri zalesňovaníbodovou aplikáciou priamo k sadeniciam na zlepšenie fyzikálnych aj chemických vlastnostípôdy.
LESY SRš.p. Banská Bystrica

Bariéry realizácie využívania biomasy na energetické účely
Ø Súčasná legislatíva nerieši problematiku obnoviteľných zdrojov energie komplexne, nedostatočne motivuje využívanie biomasy na energetické účely
Ø Vysoká investičná náročnosť dovážaných zariadeníØ Nedostatočná štátna podpora projektov na využívanie
biomasyØ Znevýhodnená výkupná cena energií z dendromasy do
rozvodných sietí
Legislatívne bariéry sa javia ako hlavnépríčiny zaostávania Slovenskej republiky vo zvyšovaní podielu výroby energie z obnoviteľných zdrojov.
LESY SRš.p. Banská Bystrica

ZÁKLADNÉ PRIORITY - VÍZIE
LESY SRš.p. Banská Bystrica Horizont 2010 orientácia na budúcnosť:
- Nezávislosť na cudzích zdrojoch- Bezpečnosť obnoviteľných zdrojov energie- Spoľahlivosť dodávok, rozvoj regiónov- Ochrana životného prostredia
Orientácia na problém:- podpora výroby energie z obnoviteľných zdrojovNástroje: Zákon o podpore OZE
Zákon o regulácii v sieťových odvetviach /stanovenie minimálnych výkupných sadzieb/
Problém
Vízia: výroba 300 až 400tis ton štiepky

Predpoklady úspešnosti realizácie projektu Biomasa
LESY SRš.p. Banská Bystrica
• Výrazné zvýšenie cien energií, hlavne zemného plynu, dáva predpoklady na zvýšený odbyt energetickej štiepky
• Pilotný regionálny program SES, a.s. Tlmače je zárukou úspešnosti a nezávislosti na cudzích zdrojoch.
• Sprísnenie zákonných kritérií pri produkcii emisií –Teplárne hľadajú možnosti náhrady za uhlie a lignit lesnú energetickú štiepku
• Výrazná surovinová základňa u ŠL je garantom úspešnosti projektu a ochrany životného prostredia
• Aktívna motivačná podpora štátu môže urýchliťnaštartovaný proces využívania biomasy na energetické účely tak, ako je to samozrejmosťou v štátoch EÚ.

TURN-KEY UNIT CONCEPT Justsen Energiteknik A/S
Claus Justsen General Manager Justsen Energiteknik A/S E-mail: [email protected]

TURN-KEY UNIT CONCEPTJustsen Energiteknik A/S
International Slovak Biomass Forum2005
Boiler Systems for Wood Waste
Claus Justsen General Manager

We are here because
Slovakia starts develop towards EUEnergy and environment - future importanceJustsen just finished NOVA DUBNICAJustsen has sole agent in Slovakia -DatathermCustomers has expressed interest in TKUHow can we help each other ?
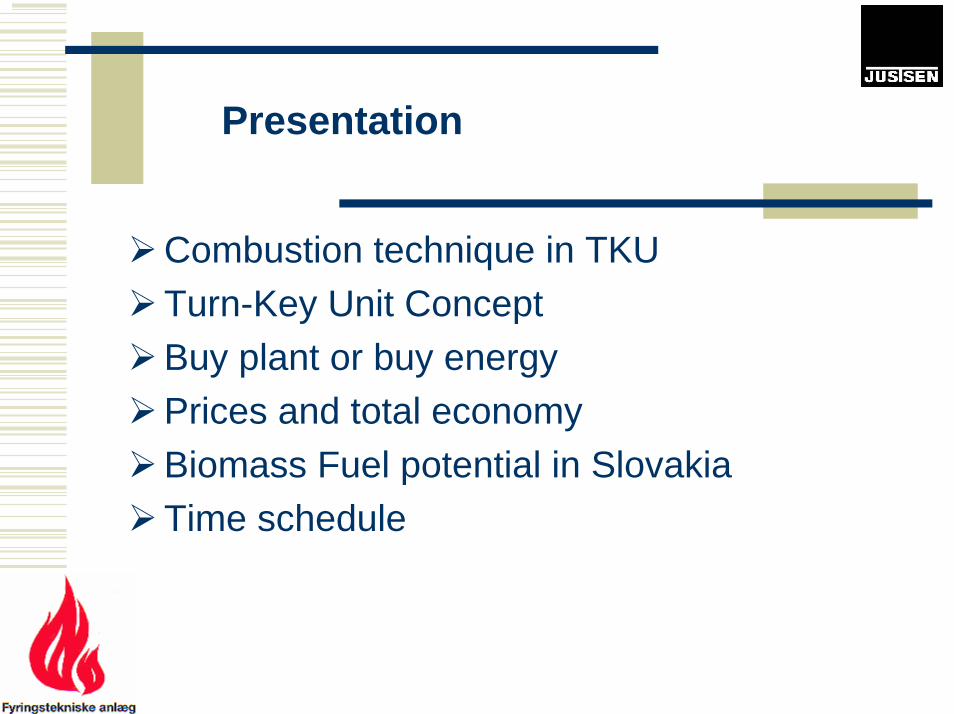
Presentation
Combustion technique in TKUTurn-Key Unit ConceptBuy plant or buy energyPrices and total economyBiomass Fuel potential in SlovakiaTime schedule

Movable water cooled grate Five turns+oxygen measurement = high efficiency

Multi cyclone

Ash transportation

TKU Side view

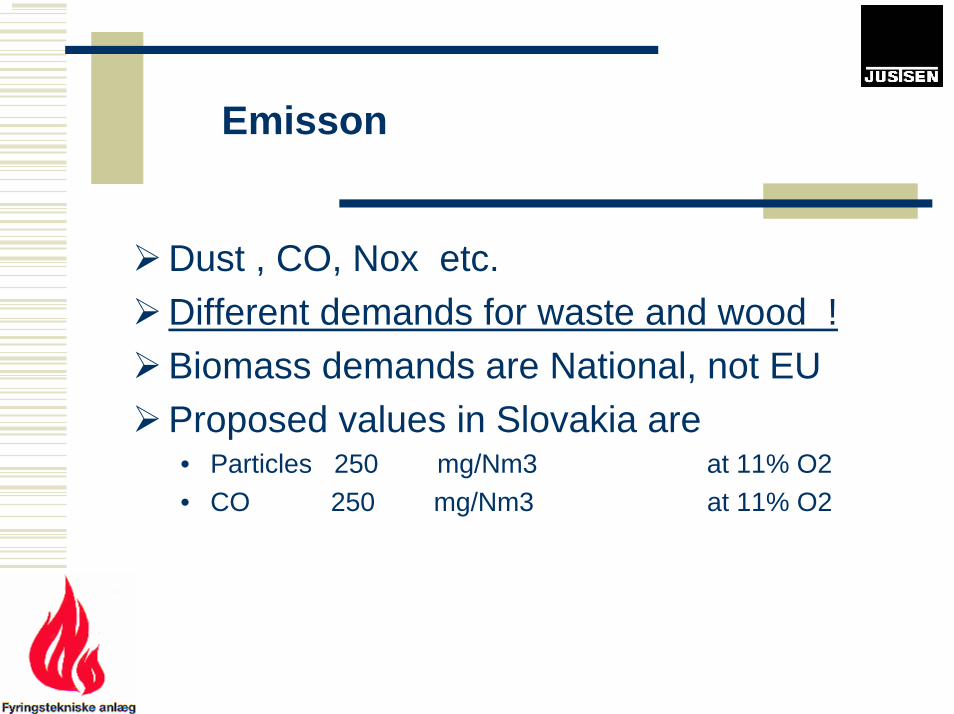
Emisson
Dust , CO, Nox etc.Different demands for waste and wood !Biomass demands are National, not EUProposed values in Slovakia are• Particles 250 mg/Nm3 at 11% O2• CO 250 mg/Nm3 at 11% O2
Boiler plants for free !
New concept – 2 MW Turn-key unit for freeComplete boiler system delivered at nearly no investments Buy energy at 30-40% lower price.Use savings to renew district heating gridOr buy the Biomass boiler for even better economy when You are convinced

Turn-key units - Conditions
1.Boiler type: Justsen Turnkey unit up to 2.0 MW2.Fuel: Sawdust 20-50% water content ( total weight )3.The customer provides:
- concrete foundation- main power cable- water supply- connection to district heating grid- fuel, power and water- personnel for operating the system
Turn key units commercial
No Financial Guarantee required
Two Months Pre pay subscription
Only sale to District heating companies
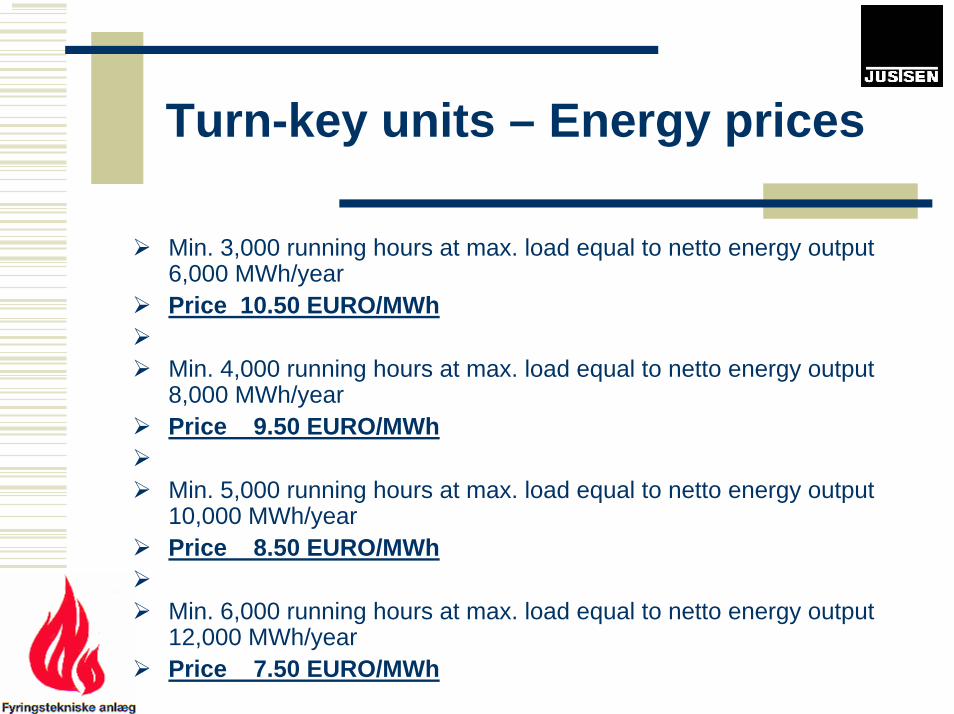
Turn-key units – Energy prices
Min. 3,000 running hours at max. load equal to netto energy output 6,000 MWh/yearPrice 10.50 EURO/MWh
Min. 4,000 running hours at max. load equal to netto energy output 8,000 MWh/yearPrice 9.50 EURO/MWh
Min. 5,000 running hours at max. load equal to netto energy output 10,000 MWh/yearPrice 8.50 EURO/MWh
Min. 6,000 running hours at max. load equal to netto energy output 12,000 MWh/yearPrice 7.50 EURO/MWh

Price comparison
Prices [MWh] SKK
Slovakian producers 1330 - 1500Justsen 500 – 1000
Big savings !

Or buy the Turn-key unit
For even better economyPrice SKK 11,5 mil – 12 mil.Delivery time 12 –14 weeksPay back time 3-4 yearsInformation in the brochuresPrice reduction for customers if more units
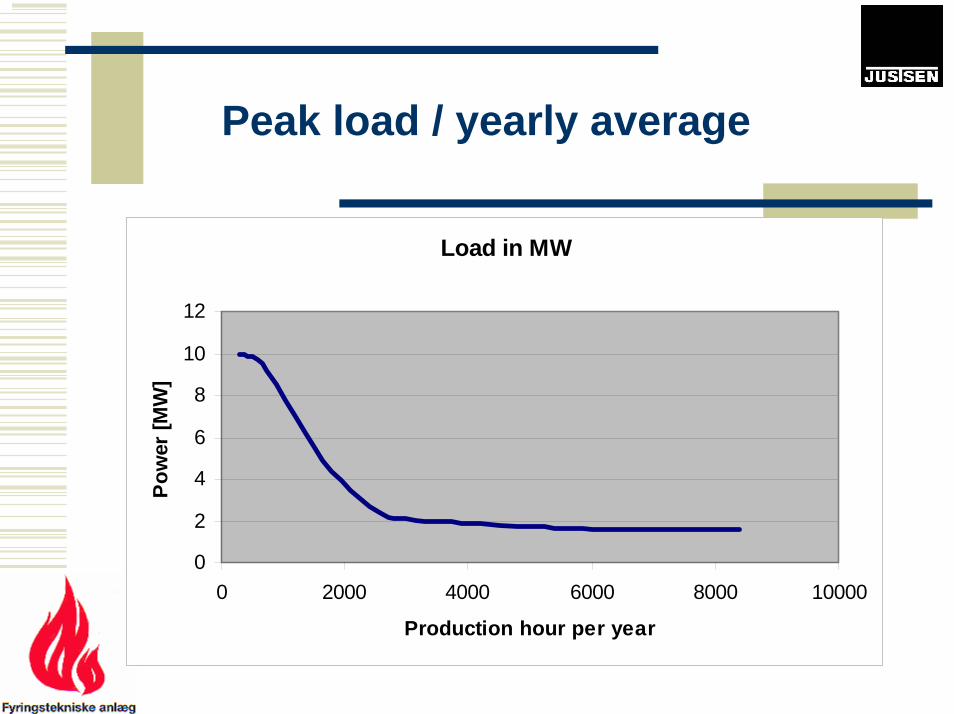
Peak load / yearly average
Load in MW
0
2
4
6
8
10
12
0 2000 4000 6000 8000 10000
Production hour per year
Pow
er [M
W]

The right size
Don’t make it too big !
Minimum 25% load on biomass systems
Combine with existing systems
Secure fuel supplies
Biomass fuel also in the future


ENERGY POLICY OF SLOVAKIA AND RENEWABLE ENERGY SOURCES
Ing. Michal Duranko Generálny riaditeľ sekcie výrobných a sieťových odvetví Ministry of Economy of the Slovak Republic MH SR, Mierová 19, 827 15 Bratislava, Slovakia E-mail: [email protected]
EnergetickEnergetickáá politika politika Slovenskej republiky Slovenskej republiky
a obnovitea obnoviteľľnnéé zdroje energiezdroje energie
Ing. Michal DurankoIng. Michal Duranko
GenerGeneráálnylny riaditeriaditeľľ sekciesekcie výrobnýchvýrobných a a siesieťťovýchových odvetvodvetvíí
MH SRMH SR

EnergetickEnergetickáá politikapolitika SRSR
PrijatPrijatáá vlvláádoudou SR 12. SR 12. janujanuáárara 20002000
Tri Tri zzáákladnkladnéé pilierepiliere::prpríípravaprava nana integrintegrááciuciu nana vnvnúútornýtorný trhtrhEurEuróópskejpskej úúnieniebezpebezpeččnosnosťť doddodáávkyvky energieenergietrvalotrvalo udrudržžatelnýatelný rozvojrozvoj

NovNováá energetickenergetickáá politika SRpolitika SR
NNáárodohospodrodohospodáárskarska stratstratéégiagia SRSR–– zjednoteniezjednotenie vvššetkýchetkých sektorových sektorových politpolitííkk–– podpora rozvoja podpora rozvoja nnáárodnrodnééhoho hospodhospodáárstvarstva
NovNováá legislatlegislatíívava SRSRVstup SR do EVstup SR do EÚÚ–– vývoj vývoj ciecieľľovov a a priorprioríítt EEÚÚ–– novnováá legislatlegislatíívava EEÚÚ

NovNováá energetickenergetickáá politika SRpolitika SR
Hlavný cieHlavný cieľľ
ZabezpeZabezpeččeneníím bezpem bezpeččnej a sponej a spoľľahlivej dodahlivej dodáávky vky energie prienergie pri optimoptimáálnych nlnych náákladoch skladoch s prihliadnutprihliadnutíím m na aspekty na aspekty žživotnivotnéého prostredia a sho prostredia a s dôrazom dôrazom nana sebestasebestaččnosnosťť výroby elektrinyvýroby elektriny vytvorivytvoriťťpodmienky pre dosiahnutie trvalo udrpodmienky pre dosiahnutie trvalo udržžateateľľnnéého ho ekonomickekonomickéého rastu SRho rastu SR

NovNováá energetickenergetickáá politika SRpolitika SR
PrijatPrijatáá v Porade vedenia MH SR v Porade vedenia MH SR 2.12.20042.12.2004
PredloPredložženenáá na MPK na MPK 8.12.20048.12.2004

NovNováá energetickenergetickáá politika SRpolitika SRCCieleiele
ZabezpeZabezpeččiiťť bezpebezpeččnnúú a a spospoľľahlivahlivúúdoddodáávkuvku vvššetkýchetkých foriemforiem energieenergievv popožžadovanomadovanom mnomnožžstvestve aa kvalitekvalite aa priprioptimoptimáálnychlnych nnáákladochkladoch pre pre potrebypotrebytrvalotrvalo udrudržžateateľľnnééhoho ekonomickekonomickééhohorasturastuZZabezpeabezpeččiiťť sebestasebestaččnosnosťť výrobyvýrobyelektrinyelektrinyZniZnižžovaovaťť energetickenergetickúú nnáároroččnosnosťť
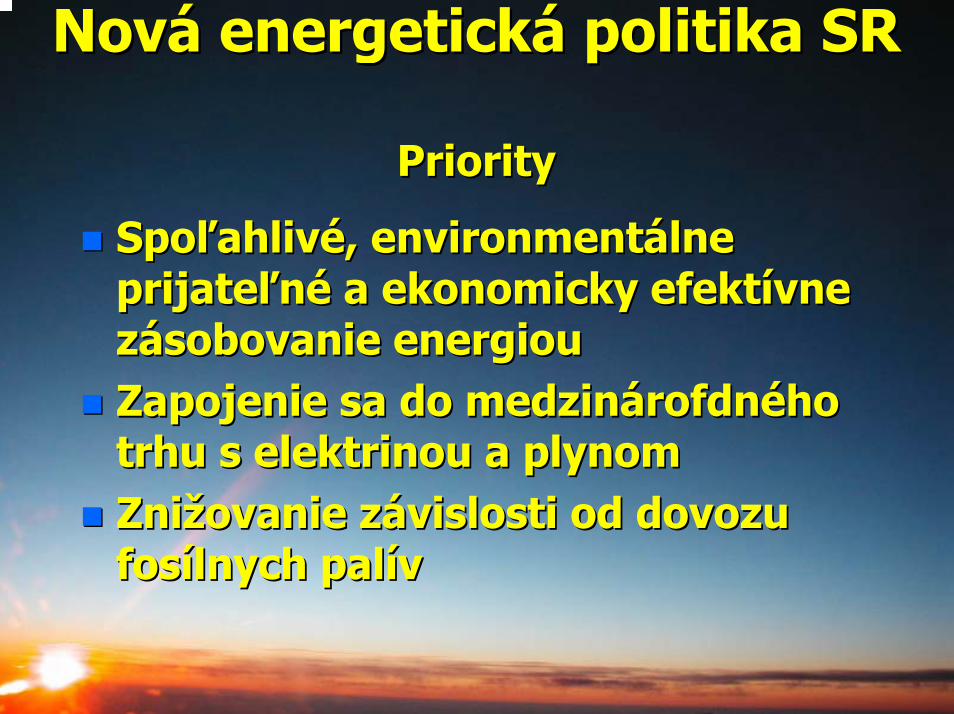
NovNováá energetickenergetickáá politika SRpolitika SR
PPriorityriority
SpSpooľľahlivahlivéé, , environmentenvironmentáálnelneprijateprijateľľnnéé aa ekonomickyekonomicky efektefektíívnevnezzáásobovaniesobovanie energiouenergiouZapojenie sa do Zapojenie sa do medzinmedzináárofdnrofdnééhohotrhu s elektrinou a plynomtrhu s elektrinou a plynomZnZniižžovaovanienie zzáávislosvislostiti odod dovozudovozufosfosíílnychlnych palpalíívv

Pre zniPre znižžovanie zovanie záávislosti od dovozu vislosti od dovozu fosfosíílnych pallnych palíív je potrebnv je potrebnéé::
VyuVyužžíívavaťť domdomáácece primprimáárnerne energetickenergetickéézdrojezdroje vv ssúúladelade so so surovinovousurovinovou politikoupolitikouZvýZvýššiiťť vyuvyužžíívanie obnovitevanie obnoviteľľných ných zdrojov energiezdrojov energiePodporiPodporiťť vyuvyužžíívanievanie zdrojovzdrojovss kombinovanoukombinovanou výrobouvýrobou elektrinyelektrinyaa teplateplaZavZaváádzadzaťť novnovéé technoltechnolóógiegie

PotenciPotenciáál obnovitel obnoviteľľných ných zdrojovzdrojov
BiomasaBiomasaVodnVodnáá energiaenergiaVeternVeternáá energiaenergiaSlneSlneččnnáá energiaenergiaGeotermGeotermáálna energialna energia

NovNováá legislatlegislatíívava v v energetikeenergetike
–– ZZáákon kon čč.656/2004 Z.z. o .656/2004 Z.z. o energetikeenergetike
–– ZZáákon kon čč.658/2004 Z.z. ktorý .658/2004 Z.z. ktorý menmeníía a dopdopĺňĺňaa zzáákon kon čč. 276/2001 Z.z. o . 276/2001 Z.z. o regulregulááciicii v v siesieťťovýchových odvetviachodvetviach
–– ZZáákon kon čč.657/2004 Z.z. o tepelnej .657/2004 Z.z. o tepelnej energetikeenergetike

ĎĎakujemakujem za za pozornospozornosťť
Ing. Michal DurankoIng. Michal Durankogenergeneráálnylny riaditeriaditeľľsekciasekcia výrobnýchvýrobných a a siesieťťovýchových odvetvodvetvííMH SR, MH SR, MierovMierováá 1919827 15 Bratislava827 15 Bratislava
Duranko@[email protected]

EMMISSIONS METERING METHODOLOGY IN SLOVAKIA Dr.Ing. Jozef Šoltés, CSc. Accreditation Section Manager Slovak Energy Agency, Rudlovská cesta 53, Banská Bystrica Phone: +421 48 4714630 E-mail: [email protected] ABSTRACT: In 2003 according to new law 478/2002 s.b., ordinances 410/2003 s.b. 408/2003 s.b., 202/2003 s.b. and settlement of 500/2003-6.1 of the Ministry for Environment Protection it was created new law frame to make measuring of emissions in Slovakia. This way it was created condition for realisation eligible measuring of emissions on high quality level enabling high objectiveness and credibility. Existing experience with this new legislation highlights the need of early novelization which has to solve number of open questions.

Slovenská energetická agentúra, www.sea.gov.sk
International Slovak Biomass Forum
1
Meranie emisiína Slovensku

Slovenská energetická agentúra, www.sea.gov.sk
International Slovak Biomass Forum
2
Legislatíva
• Zákon č. 478/2002 Z. z. – o ochrane ovzdušia a ktorým sa dopĺňa zákon č. 401/1998 Z. z. o poplatkoch za znečisťovanie ovzdušia v zneníneskorších predpisov (zákon o ovzduší),
• Vyhláška MŽP SR č. 706/2002 Z. z. - o zdrojoch znečisťovania ovzdušia , o emisných limitoch, o technických požiadavkách a o všeobecných podmienkach prevádzkovania, o zozname znečisťujúcich látok, o kategorizácii zdrojov znečistenia ovzdušia a o požiadavkách zabezpečenia rozptylu emisií znečisťujúcich látok,
• Vyhláška MŽP SR č. 408/2003 - o monitorovaní emisií a kvality ovzdušia.

Slovenská energetická agentúra, www.sea.gov.sk
International Slovak Biomass Forum
3
Legislatíva
• Vyhláška MŽP SR č. 410/2003 Z. z. - ktorou sa mení a dopĺňa vyhláška MŽP SR č. 706/2002 Z. z. o zdrojoch znečisťovania ovzdušia, o emisných limitoch, o technických požiadavkách a o všeobecných podmienkach prevádzkovania, o zozname znečisťujúcich látok, o kategorizácii zdrojov znečisťovania ovzdušia a o požiadavkách zabezpečenia rozptylu emisií znečisťujúcich látok,
• Vyhláška MŽP SR č. 202/2003 Z. z. – ktorou sa upravujú podrobnosti o odbornom posudzovaní a o oprávnení na meranie emisií a kvality ovzdušia,
• Výnos MŽP SR č. 1/2003 z 15. mája 2003 – o technickom zabezpečeníoprávnených meraní a metodikách monitorovania emisií a kvality ovzdušia,
• Oznámenie MŽP SR - OOO č. 500/2003-6.1.

Slovenská energetická agentúra, www.sea.gov.sk
International Slovak Biomass Forum
4
Zákon č. 478/2002 Z. z.
• § 19 - Povinnosti prevádzkovateľov veľkých zdrojov a prevádzkovateľov stredných zdrojov
• § 25 - Meranie emisií na stacionárnych zdrojoch a meranie úrovne znečistenia ovzdušia
• § 26 – Zmena zrušenie a zánik oprávnenia
• § 41 písm. j, k, l, n – Splnomocňovacie ustanovenia na sekundárnu legislatívu
• Príloha č. 3 – Zásady výkonu oprávneného merania

Slovenská energetická agentúra, www.sea.gov.sk
International Slovak Biomass Forum
5
Vyhl. č. 706/2002 Z. z.
• Zmenená a doplnená Vyhláškou č. 410/2003 Z. z.
• Príloha č. 1 – Zoznam znečisťujúcich látok a vybraných znečisťujúcich látok, pre ktoré sa určujú emisné limity, emisné kvóty a všeobecnépodmienky prevádzkovania
• Príloha č. 2 – Kategorizácia veľkých zdrojov a stredných zdrojov
• Príloha č. 3 – Všeobecné emisné limity a všeobecné podmienky prevádzkovania zdrojov
• Príloha č. 4 – Špecifické emisné limity a všeobecné podmienky prevádzkovania zdrojov znečisťovania

Slovenská energetická agentúra, www.sea.gov.sk
International Slovak Biomass Forum
6
Vyhl. č. 408/2003 Z. z.
• § 5 – Diskontinuálne meranie údajov o dodržaní určených emisných limitov
• § 7 – Energetické zariadenia
• Príloha č. 2 – Podrobnosti o členení technológií, o podmienkach diskontinuálneho merania a hodnotenia dodržania určeného emisného limitu

Slovenská energetická agentúra, www.sea.gov.sk
International Slovak Biomass Forum
7
Vyhláška MŽP SR č. 202/2003 Z. z.
• § 9 – Kvalifikačné a personálne zabezpečenie
• §10 – Oprávnená osoba
• §11 – Žiadosť o vydanie oprávnenia
• §12 – Overenie splnenia podmienok a požiadaviek na vydanie oprávnenia
• §13 - Správa o oprávnenom meraní
• Príloha č. 2 – Náležitosti správy

Slovenská energetická agentúra, www.sea.gov.sk
International Slovak Biomass Forum
8
Výnos MŽP SR č. 1/2003 Z. z.
• § 2 – Meracie prístroje a zariadenia
• § 3 – Požiadavky na oprávnené metodiky
• Príloha č. 1, 2, 3, 4, 5– Zoznam oprávnených metód a metodík
• Príloha č. 6 – Náležitosti interných metodík a pracovných postupov

Slovenská energetická agentúra, www.sea.gov.sk
International Slovak Biomass Forum
9
Oznámenie MŽP SR č. 500/2003-6.1.
• Stanovenie požiadaviek pre špecifickú oblasť oprávnených meraní a kontrol
• Obsahy vyhlásení štatutárneho zástupcu oprávnenej osoby, zodpovednej osoby a štatutárneho zástupcu stáleho subdodávateľa

Slovenská energetická agentúra, www.sea.gov.sk
International Slovak Biomass Forum
10
Skúsenosti s legislatívou
Problémové miesta v rámci oprávnených meraní
• stanovenie osobitných podmienok oprávneného merania,
• kategorizácia zdrojov podľa vyhl. MŽP SR č. 706/2002 Z. z.,
• výpočet neistôt,
• technologické zariadenia, dokumentácia,
• prevádzkové režimy zariadení.

Slovenská energetická agentúra, www.sea.gov.sk
International Slovak Biomass Forum
11
Skúsenosti s legislatívou
Aj keď je dotknutá legislatíva účinná len niečo viac ako rok, je predpoklad jej skorej novelizácie. Novelizáciou by sa mali riešiť najmänasledujúce okruhy otázok:
• Vypustenie požiadaviek na monitorovanie emisií skleníkových plynov v súvislosti s vydaním zákona č. 572/2004 Z. z. o obchodovaní s emisnými kvótami a o zmene a doplnení niektorých zákonov.
• Vypustenie požiadavky na „opätovné schválenie“ postupov výpočtov množstva emisie, ak ide o zdroje schválené do účinnosti vyhlášky 408/2003 Z. z. (15. 10. 2003).
• Vypustenie obmedzenia na najneskorší termín vykonania prvého oprávneného merania do 31. 12. 2004, ak porušením predpisu meranie nebolo vykonané do 31. 12. 2003.

Slovenská energetická agentúra, www.sea.gov.sk
International Slovak Biomass Forum
12
Skúsenosti s legislatívou
• Spresnenie podmienok diskontinuálnych meraní:
•CO a NOx pri minimálnom tepelnom príkone zariadení na spaľovanie palív,
•emisných faktorov, emisného stupňa a stupňa odsírenia a meraníhmotnostnej koncentrácie.
• Dostupné zjednodušenie podmienok diskontinuálnych meraní, ak ide o zariadenia na spaľovanie „ušľachtilých“ palív za účelom vytvorenia predpokladov na premeranie všetkých zdrojov a zariadení v určených troj.- resp. šesťročných intervaloch.

Slovenská energetická agentúra, www.sea.gov.sk
International Slovak Biomass Forum
13
Skúsenosti s výkonomemisných meraní
• Oprávnená osoba musí byť:• autorizovaná,• akreditovaná.
• Z akreditácie resp. autorizácie vyplýva:• striktné dodržiavanie pracovných postupov uvedených v interných
metodikách, interných pracovných postupoch a dotknutých normách,
• dodržiavanie zásad uvedených v príručke kvality a dotknutej legislatíve,
• subdodávky prác v rámci emisných meraní, dodávky kalibrácií resp. referenčných materiálov musia byť realizované len cez akreditovanésubjekty,

Slovenská energetická agentúra, www.sea.gov.sk
International Slovak Biomass Forum
14
Skúsenosti s výkonomemisných meraní
• Dotknuté orgány ochrany ovzdušia:• MŽP SR,• Slovenská inšpekcia životného prostredia,• Obvodné úrady.
• Zdroje znečisťovania ovzdušia – najčastejšie nedostatky• nesprávna kategorizácia,• nesprávne uvádzané parametre, ktoré majú vplyv na spôsob
vykonania merania,• chýbajúca dokumentácia.
• Prevádzkovatelia – najčastejšie nedostatky• neznalosť platnej legislatívy,• prevádzkovanie zdrojov v rozpore s 3E (ekológia, ekonomika,
energetika).
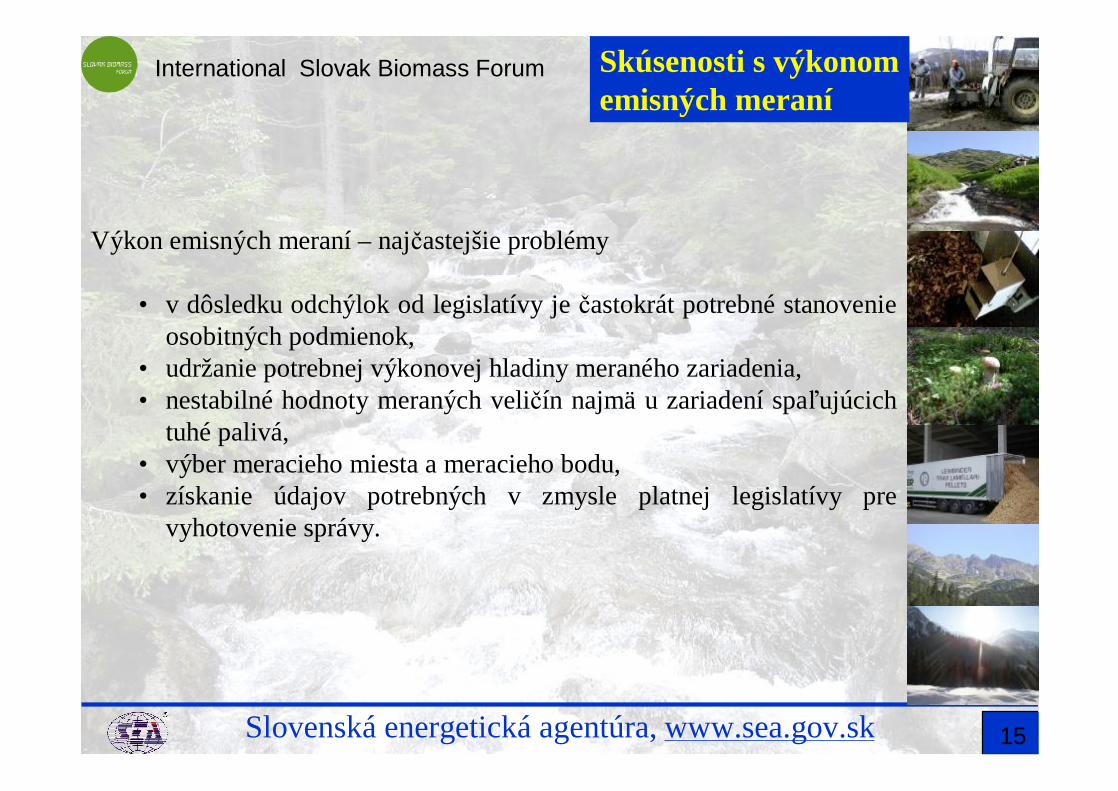
Slovenská energetická agentúra, www.sea.gov.sk
International Slovak Biomass Forum
15
Skúsenosti s výkonomemisných meraní
Výkon emisných meraní – najčastejšie problémy
• v dôsledku odchýlok od legislatívy je častokrát potrebné stanovenie osobitných podmienok,
• udržanie potrebnej výkonovej hladiny meraného zariadenia,• nestabilné hodnoty meraných veličín najmä u zariadení spaľujúcich
tuhé palivá,• výber meracieho miesta a meracieho bodu,• získanie údajov potrebných v zmysle platnej legislatívy pre
vyhotovenie správy.

Slovenská energetická agentúra, www.sea.gov.sk
International Slovak Biomass Forum
16
Záver
V dôsledku vysokých nárokov, kladených na oprávnenú osobu v rámci autorizácie a následnej akreditácie je zaručená:
• vysoká kvalita oprávnených meraní,
• objektívnosť a dôveryhodnosť vykonávaných meraní,
• neovplyvniteľnosť výsledkov.

Slovenská energetická agentúra, www.sea.gov.sk
International Slovak Biomass Forum
17
Dr. Ing. Jozef Šoltés, [email protected]
Slovenská energetická agentúra, Bratislava
www.sea.gov.sk