4000 YEARS OF PHENOTYPIC CHANGE IN AN ISLAND BIRD: HETEROGENEITY OF SELECTION OVER THREE...
18
ORIGINAL ARTICLE doi:10.1111/j.1558-5646.2008.00437.x 4000 YEARS OF PHENOTYPIC CHANGE IN AN ISLAND BIRD: HETEROGENEITY OF SELECTION OVER THREE MICROEVOLUTIONARY TIMESCALES Sonya M. Clegg, 1,2 Francesca D. Frentiu, 3,4 Jiro Kikkawa, 3,5 Giacomo Tavecchia, 6,7 and Ian P. F. Owens, 1,8,9 1 Division of Biology, Imperial College London, Silwood Park, Ascot, Berkshire SL5 7PY, United Kingdom 2 E-mail: [email protected] 3 School of Integrative Biology, The University of Queensland, Brisbane, Queensland 4072, Australia 4 E-mail: [email protected] 5 Email: [email protected] 6 Institut Mediterrani d’Estudis Avanc ¸ats, CSIC/UIB c. M. Marques 21 07190, Esporles, Spain 7 Email: [email protected] 8 NERC Centre for Population Biology, Imperial College London, Silwood Park, Ascot, Berkshire SL5 7PY, United Kingdom 9 E-mail: [email protected] Received August 30, 2007 Accepted May 15, 2008 Pronounced phenotypic shifts in island populations are typically attributed to natural selection, but reconstructing heterogeneity in long-term selective regimes remains a challenge. We examined a scenario of divergence proposed for species colonizing a new environment, involving directional selection with a rapid shift to a new optimum and subsequent stabilization. We provide some of the first empirical evidence for this model of evolution using morphological data from three timescales in an island bird, Zosterops lateralis chlorocephalus. In less than four millennia since separation from its mainland counterpart, a substantial increase in body size has occurred and was probably achieved in fewer than 500 generations after colonization. Over four recent decades, morphological traits have fluctuated in size but showed no significant directional trends, suggesting maintenance of a relatively stable phenotype. Finally, estimates of contemporary selection gradients indicated generally weak directional selection. These results provide a rare description of heterogeneity in long-term natural regimes, and caution that observations of current selection may be of limited value in inferring mechanisms of past adaptation due to a lack of constancy even over short time-frames. KEY WORDS: Directional selection, displaced optimum, mark-recapture, microevolutionary rates, survival, Zosterops. Natural selection is commonly invoked to explain a wide spec- trum of patterns of biological variation (reviews in Kinnison and Hendry 2001; Reiseberg et al. 2002), from those seen at small temporal and spatial scales, such as variation in survival across seasons (Grant 1985; Brown and Brown 1998; Badyaev et al. 2000), through to macroevolutionary patterns, such as the ten- dency for species within a lineage to evolve toward larger body size (Kingsolver and Pfennig 2004). It is, however, recognized that the tempo of selection is likely to be heterogeneous during the development of adaptive divergence with the strength and form of selection, and the ability of a population to respond to selection, varying over time (Kinnison and Hendry 2001). This 2393 C 2008 The Author(s). Journal compilation C 2008 The Society for the Study of Evolution. Evolution 62-9: 2393–2410
Transcript of 4000 YEARS OF PHENOTYPIC CHANGE IN AN ISLAND BIRD: HETEROGENEITY OF SELECTION OVER THREE...

ORIGINAL ARTICLE
doi:10.1111/j.1558-5646.2008.00437.x
4000 YEARS OF PHENOTYPIC CHANGE IN ANISLAND BIRD: HETEROGENEITY OF SELECTIONOVER THREE MICROEVOLUTIONARYTIMESCALESSonya M. Clegg,1,2 Francesca D. Frentiu,3,4 Jiro Kikkawa,3,5 Giacomo Tavecchia,6,7 and Ian P. F. Owens,1,8,9
1Division of Biology, Imperial College London, Silwood Park, Ascot, Berkshire SL5 7PY, United Kingdom2E-mail: [email protected]
3School of Integrative Biology, The University of Queensland, Brisbane, Queensland 4072, Australia4E-mail: [email protected]: [email protected]
6Institut Mediterrani d’Estudis Avancats, CSIC/UIB c. M. Marques 21 07190, Esporles, Spain7Email: [email protected]
8NERC Centre for Population Biology, Imperial College London, Silwood Park, Ascot, Berkshire SL5 7PY, United Kingdom9E-mail: [email protected]
Received August 30, 2007
Accepted May 15, 2008
Pronounced phenotypic shifts in island populations are typically attributed to natural selection, but reconstructing heterogeneity
in long-term selective regimes remains a challenge. We examined a scenario of divergence proposed for species colonizing a
new environment, involving directional selection with a rapid shift to a new optimum and subsequent stabilization. We provide
some of the first empirical evidence for this model of evolution using morphological data from three timescales in an island bird,
Zosterops lateralis chlorocephalus. In less than four millennia since separation from its mainland counterpart, a substantial increase
in body size has occurred and was probably achieved in fewer than 500 generations after colonization. Over four recent decades,
morphological traits have fluctuated in size but showed no significant directional trends, suggesting maintenance of a relatively
stable phenotype. Finally, estimates of contemporary selection gradients indicated generally weak directional selection. These
results provide a rare description of heterogeneity in long-term natural regimes, and caution that observations of current selection
may be of limited value in inferring mechanisms of past adaptation due to a lack of constancy even over short time-frames.
KEY WORDS: Directional selection, displaced optimum, mark-recapture, microevolutionary rates, survival, Zosterops.
Natural selection is commonly invoked to explain a wide spec-
trum of patterns of biological variation (reviews in Kinnison and
Hendry 2001; Reiseberg et al. 2002), from those seen at small
temporal and spatial scales, such as variation in survival across
seasons (Grant 1985; Brown and Brown 1998; Badyaev et al.
2000), through to macroevolutionary patterns, such as the ten-
dency for species within a lineage to evolve toward larger body
size (Kingsolver and Pfennig 2004). It is, however, recognized
that the tempo of selection is likely to be heterogeneous during
the development of adaptive divergence with the strength and
form of selection, and the ability of a population to respond to
selection, varying over time (Kinnison and Hendry 2001). This
2 3 9 3C© 2008 The Author(s). Journal compilation C© 2008 The Society for the Study of Evolution.Evolution 62-9: 2393–2410

SONYA M. CLEGG ET AL.
heterogeneity is suggested to account for the frequent observation
that evolutionary rates measured over long timescales are substan-
tially less than those measured over short timescales (Reznick
et al. 1997; Kinnison and Hendry 2001). Heterogeneity in selec-
tion strength has implications both for predicting the evolutionary
trajectory of a population (Merila et al. 2001b; Grant and Grant
2002) and for extrapolating from the current form of selection to
study historical patterns of adaptation and divergence, because ap-
plying an assumption of constancy of selection becomes increas-
ingly unrealistic as the time frame under consideration lengthens.
In a situation in which a species experiences a new or sub-
stantially altered environment, such as colonizing an island, the
opportunity for strong directional selection is likely to be greatest
in the early stages of divergence (Reznick et al. 1997; Hendry et al.
2000; Reznick and Ghalambor 2001). It is suggested that follow-
ing an initially rapid directional change, the rate of divergence
slows as a new optimum is approached or additive genetic varia-
tion is exhausted. Subsequently small shifts around this optimum
may occur due to the action of stabilizing selection, directional
selection in opposite directions as relatively small environmen-
tal fluctuations ensue, or random fluctuations due to drift (Lande
1976; Reznick et al. 1997; Hendry et al. 2000; Kinnison and
Hendry 2001; Estes and Arnold 2007). An analysis of phenotypic
divergence over a broad range of study species suggests that this
model, referred to as the displaced optimum model, is generally
appropriate across different timescales (Estes and Arnold 2007).
Also, studies of historically introduced species and those subject
to anthropogenic alterations show that rapid phenotypic evolution
frequently follows exposure to a new environment (Kinnison and
Hendry 2001; Hendry et al. 2008). Beyond such historical time-
frames, it becomes increasingly difficult to reconstruct the tempo-
ral dynamics of divergence (but see Hunt et al. 2008). However,
it is possible to draw inferences about evolutionary history over
long timescales given a predivergence reference point, an estimate
of divergence time, information on temporal patterns of morpho-
logical shifts over some historical timeframe, and knowledge of
current microevolutionary processes operating in a population.
This set of circumstances is rarely seen in natural systems be-
cause of the short timescales of most studies (but see Kruuk et al.
2001; Grant and Grant 2002; Coulson et al. 2003; Garant et al.
2004). Even for those populations where there is long-term data
on the form of selection, the ancestral state is often not obvious,
such that recent selection cannot be set in the context of broader
scale patterns of historical isolation.
Here, we study evolutionary divergence in a population of
island land bird for which we have multiple sources of informa-
tion on the pattern of morphological adaptation and selection.
The Capricorn silvereye, Zosterops lateralis chlorocephalus, on
Heron Island, Australia, is a relatively young form that is char-
acterized by pronounced phenotypic size changes compared to
its mainland ancestor (Kikkawa 1976; Higgins et al. 2006). The
islands inhabited by this subspecies have been formed no earlier
than 4400 years ago and vegetated for 4000 years at most (Hopley
1982). This combined with mitochondrial DNA evidence support-
ing the recent origin of the population (Degnan and Moritz 1992)
places an upper limit to the age of the population. Population age
limits, combined with other evidence, have previously been used
to suggest that the form of morphological divergence in this and
related species is more consistent with natural selection than it is
with either short-term founder effects or long-term genetic drift
(Clegg et al. 2002a,b).
In this study, we examine patterns of morphological
change in the Capricorn silvereye across three microevolution-
ary timescales, providing a rare insight into the temporal dynam-
ics of evolutionary change in a natural system. First, we com-
pared morphological measurements between Heron Island and
mainland Zosterops to quantify the long-term microevolutionary
change that represents a shift to, or toward, the new optimum phe-
notype. Second, we compared morphological trends across four
decades within the Heron Island population to examine temporal
trends in morphology. In particular, we tested for the existence
of directional trends that would suggest the action of continuing
directional selection consistent with the long-term morphological
divergence pattern, or a lack of trends, that would indicate that
the population has reached a new optimum. Third, we used three
years of recent census data from the Heron Island population to
construct an individual-level model that best described survival
in terms of individual phenotype in combination with age, time,
and seasonal effects. To determine the type and strength of selec-
tion currently operating in this system, we estimate univariate and
multivariate selection gradients for time periods identified from
the survival analysis as being important predictors of variation in
survival. Generally weak current directional selection would be
expected for traits that reached the new optimum at some time in
the past. We reconcile information on selective patterns over the
three timescales to determine if the combined evidence is consis-
tent with the expectations of divergence in a population subject
to a novel selective regime, that is rapid evolution toward a dis-
placed optimum, followed by stasis or oscillation around the new
optimum.
MethodsHERON ISLAND STUDY POPULATION
The Capricorn silvereye is restricted to island cays of the south-
ern Great Barrier Reef (the Capricorn-Bunker Group) and Bushy
Island 290 km to the north (Fig. 1). On Heron Island (23◦26′ S,
151◦57′ E), the silvereye is the predominant breeding passer-
ine (Kikkawa 1976) and the population size varies between 225
and 500 individuals (McCallum et al. 2000). There is very little
2 3 9 4 EVOLUTION SEPTEMBER 2008

HETEROGENEITY OF SELECTION IN AN ISLAND BIRD
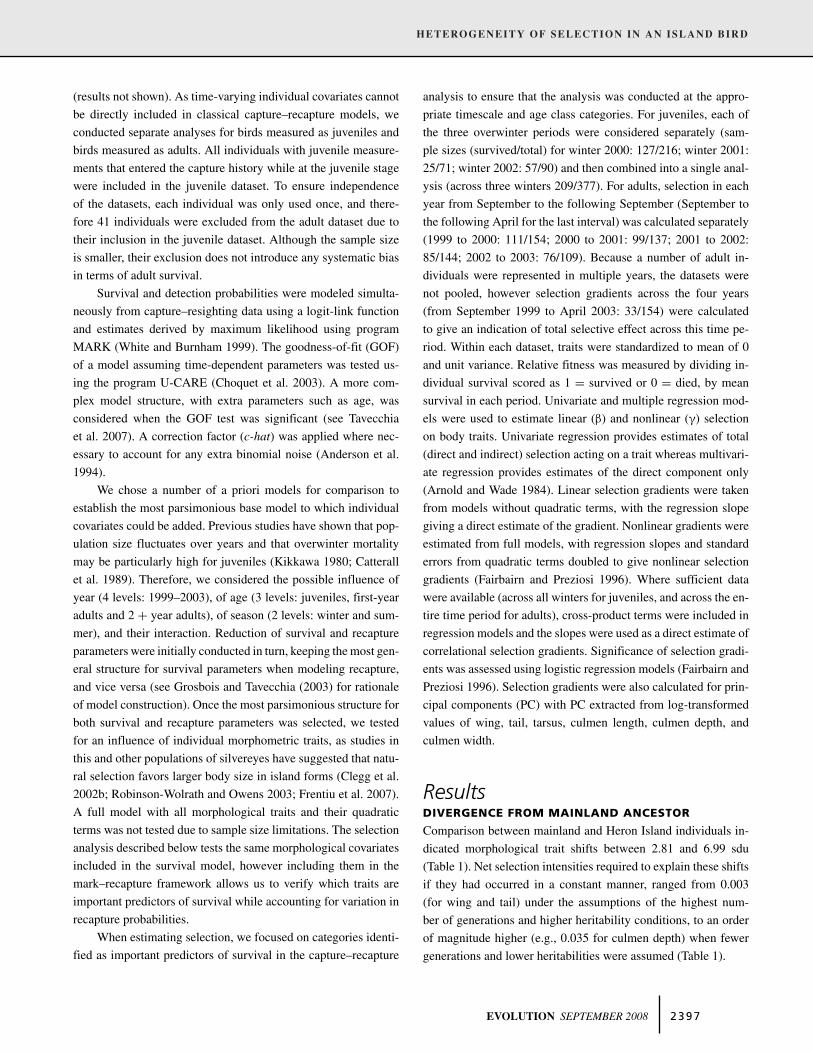
Figure 1. Map showing the position of Heron Island (in bold) in the Capricorn Bunker Group of the southern Great Barrier Reef of
Australia. Z. l. chlorocephalus occurs on all named islands. Inset shows the mainland sample site of Brisbane and the relative location of
the Capricorn Bunker Group (boxed region).
movement among the islands of the Capricorn-Bunker Group
(<1% per generation) and therefore the population on Heron
is effectively closed from a demographic viewpoint (Brook and
Kikkawa 1998; McCallum et al. 2000). In population genetic
terms, the Heron Island population is part of a metapopulation
comprising the other Capricorn Bunker islands (Degnan 1993),
and there is no observational or genetic data to suggest that gene
flow between the island and mainland currently occurs (Kikkawa
1970; Degnan and Moritz 1992).
DIVERGENCE FROM MAINLAND ANCESTOR
The island form examined here is larger than any of the Australian
mainland Zosterops (Higgins et al. 2006) and is also different in
shape, having a relatively broader, deeper bill and longer wings
for their size (see Clegg et al. 2002b for multivariate compar-
isons). To quantify the form of size divergence between the island
population and its ancestor, we compared a sample of 29 Z. l. corn-
walli from the mainland (Brisbane, Australia, 27◦17′S, 153◦2′E,
measured in 1998) with 103 adult Z. l. chlorocephalus caught on
Heron Island (all measured by SMC between 2002 and 2003). The
mainland individuals represent a typical sample of the presumed
mainland ancestor, with mean morphological values comparable
to ranges reported from museum specimens and live-caught birds
measured by other people (wing: SMC mean = 59.5, reported
ranges 55–61, 56–66 and 56–63; tail: SMC mean = 42.1, re-
ported ranges 40–47, 38–49 and 37–45; tarsus: SMC mean =16.3, reported ranges 16.4–18.5, 15.1–20.1 and 15.3–18.6) (re-
ported ranges from Higgins et al. 2006). Likewise, the Heron
Island sample is representative of the adult morphology of that
population (wing: SMC mean = 64.1, range of adult measure-
ments [measured 1966 to 1998] by JK 59–69; tail: SMC mean =47.7, JK range 43.5–54; tarsus: SMC mean = 19.11, JK range
17.6–24). In this comparison, we assume that the morphology
of the current mainland population is approximately the same as
the mainland ancestor of the Heron Island form. If the mainland
form has since decreased in body size, then we will overestimate
the amount of divergence that has occurred and if the mainland
ancestor was larger than both the current mainland and island
forms, then we will also misconstrue the direction of change. As
the mainland form represented in this study is typical of other
mainland Zosterops forms (Mees 1969; Higgins et al. 2006), it is
extremely unlikely that the mainland form has decreased in body
size since separation of the island form. Morphological shifts in
the island form for each trait were calculated in standard deviation
units (henceforth referred to as sdu), using log-transformed data
and pooled standard deviation estimates. Net selection intensi-
ties, which estimate the amount of constant directional selection
per generation required to explain observed morphological shifts,
were estimated following Kinnison and Hendry (2001). First, the
rate of evolution in Haldanes (sdu per generation) was calculated
for each trait. Generation time of Heron Island silvereyes is be-
tween 2 and 3 years (mean breeding age over a 15 year period was
2.8 years). Separation ages of 3000 or 4000 years (the maximum
time the island has been vegetated, (Hopley 1982)) were con-
sidered, resulting in minimum evolutionary rate estimates made
across 2000 generations (2 year generation time, 4000 years of
separation) and maximum rates across 1000 generations (3 year
generation time, 3000 years of separation). To convert to net
EVOLUTION SEPTEMBER 2008 2 3 9 5
SONYA M. CLEGG ET AL.
selection intensity we used two estimates of heritability (h2), the
first based on a current estimate for adult culmen traits (h2 = 0.2)
(SMC, unpublished data), and the second using a typical value
for avian morphology (h2 = 0.5) (Lynch and Walsh 1998), as the
current estimate may not reflect long-term heritability.
As an alternative to assuming a steady rate of change, we
examined evolution toward the new optimum following coloniza-
tion of the new environment using a displaced optimum model
of phenotypic evolution (Lande 1976; Estes and Arnold 2007).
Calculations were made with a spreadsheet provided by Estes and
Arnold (2007). The variables required to apply this model are the
shift in phenotypic sdu, the effective population size (Ne), trait
heritability (h2), and the width of the fitness function (ω2) that
describes the strength of stabilizing selection (Estes and Arnold
2007). The shift in sdu for each trait was calculated as above, us-
ing log-transformed data and pooled standard deviation estimates.
The long-term Ne of the Heron Island population is between 103
and 182 (Kikkawa and Degnan 1998). However, we used a lower,
more conservative estimate (Ne = 50), as divergence following
founding would likely have occurred at lower Ne values. The use
of a higher value for Ne resulted in narrower confidence intervals
(not shown). Two measures of heritability (h2 = 0.2 and h2 = 0.5)
were assumed as before. The approach to the optimum (assumed
to be the current island phenotype), was modeled across three val-
ues of ω2 (5, 10, and 50). These values correspond to a range from
strong (5) to weak (50) stabilizing selection and are within a range
of reasonable values identified by Estes and Arnold (2007).
TRACKING MORPHOLOGY OVER FOUR DECADES
Morphological measures of wing, tail, tarsus and culmen lengths,
and weight, taken between the years of 1966 to 1999, were ex-
amined for consistent, directional size shifts that would indicate
continuity of directional selection. All measurements in this his-
torical dataset were made by the same person (JK). The first four
measures are the same traits measured for the survival analysis de-
scribed below. However culmen length was originally measured
from the tip of the culmen to the point where feathering begins,
and therefore cannot be directly compared to the culmen length
measure reported in the survival study described below. Also, cul-
men depth and width were not measured in this 34-year period.
Despite these differences, relative size shifts of culmen length
are useful in assessing the occurrence of consistent and sustained
shifts. Adults and juveniles were analyzed separately and indi-
viduals of unknown age were excluded, as were any measures of
wing or tail taken from molting individuals. The smallest sample
size for juveniles was 8 and largest was 334, and for adults, 5 and
59, respectively. Unless otherwise specified, all statistical tests
were conducted in the R statistical framework (R Development
Core Team 2004). Means and 95% confidence intervals of mea-
sures were estimated over 10,000 bootstrap replicates. Directional
trends were assessed using Spearman’s rank correlation, and the
means for starting (1966) and end (1999) values compared with
a t-test. Additionally, a Wilcoxon test was used to determine if
there was any association between direction and magnitude of
shift from year to year, specifically to determine if size increases
or decreases were gradual or abrupt. This was limited to juveniles,
and only from 1975 to 1999 (1979 to 1999 for weight), where gaps
in years were minimal. Analyses of variance (ANOVAs) and post
hoc Tukey’s HSD tests were used to evaluate the significance of
year-to-year shifts in means.
MODELING RECENT SURVIVAL AND ESTIMATING
SELECTION
Survival probabilities were estimated from individual capture his-
tories using capture–recapture statistical analysis (Lebreton et al.
1992). The capture–recapture analysis is a standard statistical
framework for the analysis of longitudinal presence–absence data
in which survival and detection probabilities are modeled simul-
taneously through logistic regressions, and is the only analytical
method available to obtain robust estimates of survival probability
from presence–absence data (see Burnham et al. (1987); Lebreton
et al. (1992) and Williams et al. (2002) for a detailed description
of the methodology). Moreover, the flexible analytical framework
allows an extensive modeling of the factors influencing survival
and detection probabilities. It therefore allows us to fully appreci-
ate the variables contributing to variation in survival, controlling
for any bias in detection probabilities.
To estimate survival we used the capture history of juve-
nile and adult birds captured and resighted from the period of
September 1999 to April 2003. Captured birds were marked with
a unique combination of color bands (modified from Kikkawa
1997). At banding, six morphological measurements were taken:
wing, tail and tarsus length, culmen length, depth, and width.
Weight was not included in this analysis due to the large daily
and seasonal variation typical of this measure (Kikkawa 1980).
Resightings were made twice per year, during April at feeding sta-
tions, and in September in conjunction with mapping of territories
in the breeding season (see also Kikkawa 1987; Robinson-Wolrath
and Owens 2003), to distinguish summer versus winter survival.
Birds were categorized into three age groups based on leg color
and plumage condition (Kikkawa 2003): juvenile, first year adult,
and adults of two years and over (referred to as 2+ year adults).
The vast majority of newly marked individuals in the population
were nestlings or juveniles, although survival from nestling to
juvenile age was not included in this analysis. Rarely, an indi-
vidual was banded as an adult of unknown age and these were
included in the 2+ year adult category. Most of the birds were
measured only once, either as a juvenile or an adult. However the
measurement of 103 individuals at both life stages indicated that
all traits in juveniles, except tarsus, had not reached full adult size
2 3 9 6 EVOLUTION SEPTEMBER 2008
HETEROGENEITY OF SELECTION IN AN ISLAND BIRD
(results not shown). As time-varying individual covariates cannot
be directly included in classical capture–recapture models, we
conducted separate analyses for birds measured as juveniles and
birds measured as adults. All individuals with juvenile measure-
ments that entered the capture history while at the juvenile stage
were included in the juvenile dataset. To ensure independence
of the datasets, each individual was only used once, and there-
fore 41 individuals were excluded from the adult dataset due to
their inclusion in the juvenile dataset. Although the sample size
is smaller, their exclusion does not introduce any systematic bias
in terms of adult survival.
Survival and detection probabilities were modeled simulta-
neously from capture–resighting data using a logit-link function
and estimates derived by maximum likelihood using program
MARK (White and Burnham 1999). The goodness-of-fit (GOF)
of a model assuming time-dependent parameters was tested us-
ing the program U-CARE (Choquet et al. 2003). A more com-
plex model structure, with extra parameters such as age, was
considered when the GOF test was significant (see Tavecchia
et al. 2007). A correction factor (c-hat) was applied where nec-
essary to account for any extra binomial noise (Anderson et al.
1994).
We chose a number of a priori models for comparison to
establish the most parsimonious base model to which individual
covariates could be added. Previous studies have shown that pop-
ulation size fluctuates over years and that overwinter mortality
may be particularly high for juveniles (Kikkawa 1980; Catterall
et al. 1989). Therefore, we considered the possible influence of
year (4 levels: 1999–2003), of age (3 levels: juveniles, first-year
adults and 2 + year adults), of season (2 levels: winter and sum-
mer), and their interaction. Reduction of survival and recapture
parameters were initially conducted in turn, keeping the most gen-
eral structure for survival parameters when modeling recapture,
and vice versa (see Grosbois and Tavecchia (2003) for rationale
of model construction). Once the most parsimonious structure for
both survival and recapture parameters was selected, we tested
for an influence of individual morphometric traits, as studies in
this and other populations of silvereyes have suggested that natu-
ral selection favors larger body size in island forms (Clegg et al.
2002b; Robinson-Wolrath and Owens 2003; Frentiu et al. 2007).
A full model with all morphological traits and their quadratic
terms was not tested due to sample size limitations. The selection
analysis described below tests the same morphological covariates
included in the survival model, however including them in the
mark–recapture framework allows us to verify which traits are
important predictors of survival while accounting for variation in
recapture probabilities.
When estimating selection, we focused on categories identi-
fied as important predictors of survival in the capture–recapture
analysis to ensure that the analysis was conducted at the appro-
priate timescale and age class categories. For juveniles, each of
the three overwinter periods were considered separately (sam-
ple sizes (survived/total) for winter 2000: 127/216; winter 2001:
25/71; winter 2002: 57/90) and then combined into a single anal-
ysis (across three winters 209/377). For adults, selection in each
year from September to the following September (September to
the following April for the last interval) was calculated separately
(1999 to 2000: 111/154; 2000 to 2001: 99/137; 2001 to 2002:
85/144; 2002 to 2003: 76/109). Because a number of adult in-
dividuals were represented in multiple years, the datasets were
not pooled, however selection gradients across the four years
(from September 1999 to April 2003: 33/154) were calculated
to give an indication of total selective effect across this time pe-
riod. Within each dataset, traits were standardized to mean of 0
and unit variance. Relative fitness was measured by dividing in-
dividual survival scored as 1 = survived or 0 = died, by mean
survival in each period. Univariate and multiple regression mod-
els were used to estimate linear (β) and nonlinear (γ) selection
on body traits. Univariate regression provides estimates of total
(direct and indirect) selection acting on a trait whereas multivari-
ate regression provides estimates of the direct component only
(Arnold and Wade 1984). Linear selection gradients were taken
from models without quadratic terms, with the regression slope
giving a direct estimate of the gradient. Nonlinear gradients were
estimated from full models, with regression slopes and standard
errors from quadratic terms doubled to give nonlinear selection
gradients (Fairbairn and Preziosi 1996). Where sufficient data
were available (across all winters for juveniles, and across the en-
tire time period for adults), cross-product terms were included in
regression models and the slopes were used as a direct estimate of
correlational selection gradients. Significance of selection gradi-
ents was assessed using logistic regression models (Fairbairn and
Preziosi 1996). Selection gradients were also calculated for prin-
cipal components (PC) with PC extracted from log-transformed
values of wing, tail, tarsus, culmen length, culmen depth, and
culmen width.
ResultsDIVERGENCE FROM MAINLAND ANCESTOR
Comparison between mainland and Heron Island individuals in-
dicated morphological trait shifts between 2.81 and 6.99 sdu
(Table 1). Net selection intensities required to explain these shifts
if they had occurred in a constant manner, ranged from 0.003
(for wing and tail) under the assumptions of the highest num-
ber of generations and higher heritability conditions, to an order
of magnitude higher (e.g., 0.035 for culmen depth) when fewer
generations and lower heritabilities were assumed (Table 1).
EVOLUTION SEPTEMBER 2008 2 3 9 7

SONYA M. CLEGG ET AL.
Table 1. Morphological shift in Heron Island silvereyes (standard deviation units, sdu) compared to a mainland sample. Maximum and
minimum values for evolutionary rates (Haldanes) assume 1000 and 2000 generations of separation, respectively. Net selection intensities
required to explain these rates, assuming constant selection, are calculated for two estimates of heritability (h2=0.2 and h2=0.5). CulL,
culmen length to posterior nostril opening; CulD, culmen depth at anterior nostril opening; CulW, culmen width at anterior nostril
opening.
Trait Shift Evolutionary rate Net selection intensity(sdu)
(Haldanes) h2=0.2 h2=0.5
t=1000 t=2000 t=1000 t=2000 t=1000 t=2000
Wing 2.85 0.0028 0.0014 0.014 0.007 0.006 0.003Tail 2.81 0.0028 0.0014 0.014 0.007 0.006 0.003Tarsus 3.85 0.0039 0.0019 0.019 0.010 0.008 0.004CulL 4.90 0.0049 0.0023 0.026 0.012 0.010 0.005CulD 6.99 0.0070 0.0035 0.035 0.018 0.014 0.007CulW 3.65 0.0037 0.0018 0.018 0.009 0.007 0.004Weight 3.77 0.0038 0.0019 0.019 0.009 0.008 0.004
Application of the displaced optimum model to our data
demonstrated that shifts are likely to have occurred very quickly,
followed by many generations of relative stasis (Fig. 2). For all
traits the approach to the optimum plateaued after only 100 gener-
ations had passed when the two stronger selection pressures were
assumed (ω2 = 5 or 10). Even under a more conservative scenario
Figure 2. Displaced optimum models of divergence showing time of approach to the optimum (indicated by horizontal line) for three
levels of selection: ω2 = 5 (circles, 5% and 95% confidence intervals = dashed line; ω2 = 10 (squares, confidence intervals = dotted line);
ω2 = 50 (triangles, confidence intervals = dash-dotted line). Trait heritability h2 = 0.5. Vertical line indicates 1000 generations, a minimum
estimate of divergence time for the island population. Time refers to the number of elapsed generations and divergence is measured in
standard deviation units.
of weak selection, the optimum was reached by 500 generations,
well below the 1000 generation minimum we estimate has oc-
curred since the establishment of the island silvereye population.
The optimum was also reached before this minimum divergence
time when lower trait heritability (h2 = 0.2) was assumed (results
not shown).
2 3 9 8 EVOLUTION SEPTEMBER 2008
HETEROGENEITY OF SELECTION IN AN ISLAND BIRD
TRACKING MORPHOLOGY ACROSS FOUR DECADES
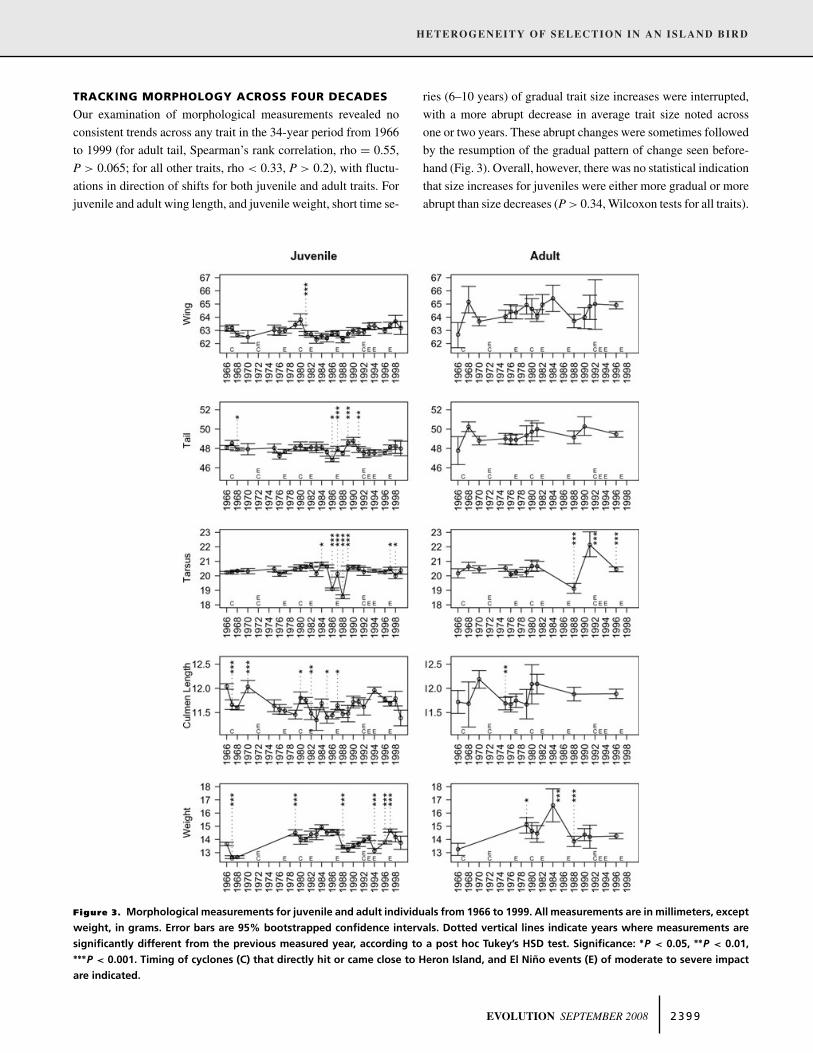
Our examination of morphological measurements revealed no
consistent trends across any trait in the 34-year period from 1966
to 1999 (for adult tail, Spearman’s rank correlation, rho = 0.55,
P > 0.065; for all other traits, rho < 0.33, P > 0.2), with fluctu-
ations in direction of shifts for both juvenile and adult traits. For
juvenile and adult wing length, and juvenile weight, short time se-
Figure 3. Morphological measurements for juvenile and adult individuals from 1966 to 1999. All measurements are in millimeters, except
weight, in grams. Error bars are 95% bootstrapped confidence intervals. Dotted vertical lines indicate years where measurements are
significantly different from the previous measured year, according to a post hoc Tukey’s HSD test. Significance: ∗P < 0.05, ∗∗P < 0.01,∗∗∗P < 0.001. Timing of cyclones (C) that directly hit or came close to Heron Island, and El Nino events (E) of moderate to severe impact
are indicated.
ries (6–10 years) of gradual trait size increases were interrupted,
with a more abrupt decrease in average trait size noted across
one or two years. These abrupt changes were sometimes followed
by the resumption of the gradual pattern of change seen before-
hand (Fig. 3). Overall, however, there was no statistical indication
that size increases for juveniles were either more gradual or more
abrupt than size decreases (P > 0.34, Wilcoxon tests for all traits).
EVOLUTION SEPTEMBER 2008 2 3 9 9
SONYA M. CLEGG ET AL.
Posthoc Tukeys HSD tests show years where mean values
were significantly different from the previous year or the last
available datapoint (Fig. 3). There were no obvious patterns across
all traits, however significant year-to-year shifts in juvenile tail,
tarsus, and culmen length clustered in the 1980s. The perturbation
of juvenile tarsus in the mid to late 1980s was particularly con-
spicuous in comparison to the stability of this measure observed
at other times. No significant net size shift was observed from the
beginning to the end of the time-series for juvenile wing (t-test,
t = −0.08, P > 0.9), tail (t = 0.18, P > 0.8), tarsus (t = −0.7,
P > 0.4) and weight (t = −0.3, P > 0.7), and adult tarsus (t =−1.3, P > 0.1) and culmen length (t = −1.3, P > 0.1). Juvenile
culmen length decreased significantly from 1966 to 1999 (t =4.3, P < 0.0005). Adult traits that displayed a significant increase
were wing (t = −5.7, P < 0.0005), tail (t = −3.4, P < 0.01), and
weight (t = −3.6, P < 0.005).
Overall, net shifts were observed in some traits, but trends
were very variable and appeared episodic in nature. We examined
the possibility that either cyclones or El Nino events coincided
with morphological fluctuations. Four major cyclones hit or came
in close proximity to Heron Island, in 1967, 1972, 1980, and
1992 (McCallum et al. 2000). An inspection of Figure 3 shows no
consistent phenotypic impacts associated with cyclones in the data
series. A significant decrease in juvenile tail and culmen length
followed the 1967 cyclone, but in 1980, juvenile culmen length
increased following the cyclone. Decreased juvenile weight was
noted in the same or following year for two cyclones. Apart from
these few associations, cyclones did not coincide with abrupt trait
size changes. Likewise, there was limited evidence that El Nino
events influenced the phenotype of the population. During the
34-year period, eight El Nino events occurred (one consisting of
multiple years 1992 to 1994), of which six had a moderate to very
strong impact in the region (marked in Fig. 3; Australian Bureau
of Meteorology). Fluctuations in wing, tail, tarsus, and culmen
lengths were not obviously associated with El Nino cycles. Abrupt
decreases in average juvenile weight did coincide with El Nino
years (1987, 1994, and 1997), although no such decrease was seen
in 1982.
MODELING RECENT SURVIVAL AND ESTIMATING
SELECTION
Juvenile traits and survival probabilityJuvenile parameters were estimated from the capture histories of
510 birds that were measured and entered the encounter history as
a juvenile (Table 2A). Model assessment preceding the inclusion
of individual covariates is shown in Appendix 1A. A significantly
large portion of variance remained unexplained under the sim-
plest model of time variation in survival and recapture (Model 0,
Appendix 1A) (GOF: χ219 = 43.51, P = 0.001) and a more gen-
eral model including specific parameters for juvenile, first-year
adults, and 2+ year adults (Model 1) provided a better descrip-
tion of the data (χ29 = 13.52, P = 0.14). The correction factor
calculated from Model 1 was 1.503 (13.52/9), and was used to
scale the deviance of subsequent models to correct for possible
individual heterogeneity due to differences in covariate values.
Note that when individual covariates were later included in mod-
els, the scale parameter was not used as these models already
account for individual heterogeneity. In the most parsimonious
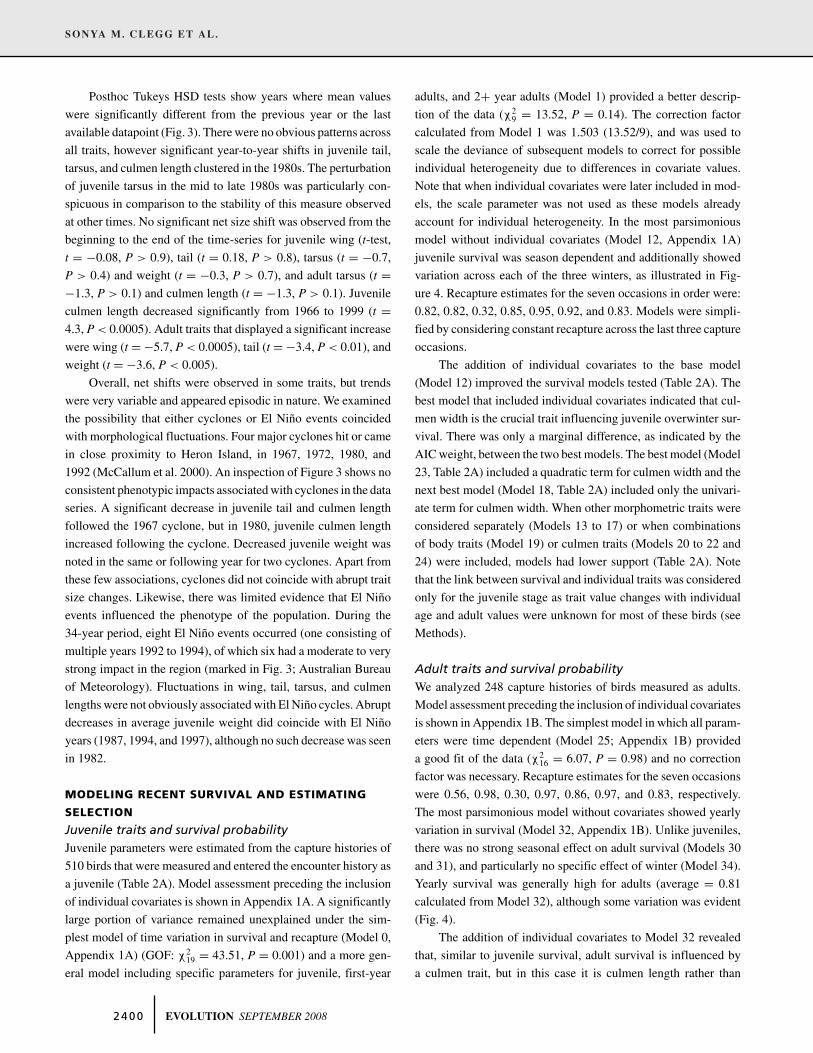
model without individual covariates (Model 12, Appendix 1A)
juvenile survival was season dependent and additionally showed
variation across each of the three winters, as illustrated in Fig-
ure 4. Recapture estimates for the seven occasions in order were:
0.82, 0.82, 0.32, 0.85, 0.95, 0.92, and 0.83. Models were simpli-
fied by considering constant recapture across the last three capture
occasions.
The addition of individual covariates to the base model
(Model 12) improved the survival models tested (Table 2A). The
best model that included individual covariates indicated that cul-
men width is the crucial trait influencing juvenile overwinter sur-
vival. There was only a marginal difference, as indicated by the
AIC weight, between the two best models. The best model (Model
23, Table 2A) included a quadratic term for culmen width and the
next best model (Model 18, Table 2A) included only the univari-
ate term for culmen width. When other morphometric traits were
considered separately (Models 13 to 17) or when combinations
of body traits (Model 19) or culmen traits (Models 20 to 22 and
24) were included, models had lower support (Table 2A). Note
that the link between survival and individual traits was considered
only for the juvenile stage as trait value changes with individual
age and adult values were unknown for most of these birds (see
Methods).
Adult traits and survival probabilityWe analyzed 248 capture histories of birds measured as adults.
Model assessment preceding the inclusion of individual covariates
is shown in Appendix 1B. The simplest model in which all param-
eters were time dependent (Model 25; Appendix 1B) provided
a good fit of the data (χ216 = 6.07, P = 0.98) and no correction
factor was necessary. Recapture estimates for the seven occasions
were 0.56, 0.98, 0.30, 0.97, 0.86, 0.97, and 0.83, respectively.
The most parsimonious model without covariates showed yearly
variation in survival (Model 32, Appendix 1B). Unlike juveniles,
there was no strong seasonal effect on adult survival (Models 30
and 31), and particularly no specific effect of winter (Model 34).
Yearly survival was generally high for adults (average = 0.81
calculated from Model 32), although some variation was evident
(Fig. 4).
The addition of individual covariates to Model 32 revealed
that, similar to juvenile survival, adult survival is influenced by
a culmen trait, but in this case it is culmen length rather than
2 4 0 0 EVOLUTION SEPTEMBER 2008

HETEROGENEITY OF SELECTION IN AN ISLAND BIRD
Table 2. Modeling survival and recapture probability including individual covariates for (A) birds measured as juveniles, and (B) birds
measured as adults. For birds measured as juveniles, individual covariates were added to a base model (Model 12 Appendix 1A) of
survival: 2age.seas.yr‡∗ and recapture: 2age.seas.yr§. For birds measured as adults, individual covariates were added to a base model
(Model 32, Appendix 1B) of survival: yr and recapture: seas.yr. (See Appendix 1 for model notation.) AICc, Akaike’s Information Criterion;
Np, number of estimable parameters; Weight, Akaike weights; DEV, model deviance. Individual covariate labels as in Table 1. Squared
values refer to quadratic effects. For juveniles, individual covariate effects were applied to winter time-periods only, except Model 24,
where the individual covariates were modeled across all time periods. The best model in each case is shown in bold.
Model Covariate AICc Np �AICc Weight DEV
(A)13 wing 1926.62 13 6.48 0.015 1900.2914 tail 1926.72 13 6.58 0.015 1900.3415 tarsus 1925.59 13 5.45 0.026 1899.2716 culL 1926.81 13 6.67 0.014 1900.4917 culD 1926.75 13 6.61 0.014 1900.4318 culW 1920.30 13 0.16 0.363 1893.9719 wing+tail+tarsus 1928.97 15 8.84 0.005 1898.5520 culL+culD+culW 1922.86 15 2.72 0.101 1892.4321 culL+culL2 1926.88 14 6.74 0.014 1898.5022 culD+culD2 1928.78 14 8.64 0.005 1900.4023 culW+culW2 1920.14 14 0 0.393 1891.76
24 culW+culW2 1924.95 14 4.81 0.035 1896.58(B)
36 wing 1135.21 11 9.36 0.006 1112.8137 tail 1133.97 11 8.13 0.011 1111.5838 tarsus 1133.51 11 7.67 0.014 1111.1239 culL 1128.12 11 2.28 0.198 1105.7340 culD 1137.33 11 11.48 0.002 1112.8641 culW 1131.45 11 5.6 0.038 1109.0542 wing+tail+tarsus 1136.92 13 11.08 0.002 1110.3743 culL+culD+culW 1133.79 14 7.94 0.012 1105.1544 culL+culL2 1125.85 12 0 0.619 1101.38
45 culD+culD2 1133.60 12 7.75 0.013 1109.1346 culW+culW2 1129.76 12 3.92 0.087 1105.29
width (Model 44, Table 2B). In contrast to the juvenile analysis in
which the difference between the two best models was marginal,
including a quadratic effect for adult culmen length improved the
fit of the model more than threefold according to the AIC weights.
The inclusion of other traits, either considered separately (Models
36 to 41) or as suites of body and bill traits (Models 42, 43, 45,
and 46), resulted in less well-supported models of adult survival
(Table 2B). Note that PC rather than single traits were also used
as individual covariates in juvenile and adult survival models.
However these resulted in less well-supported models than those
based on single traits (results not shown).
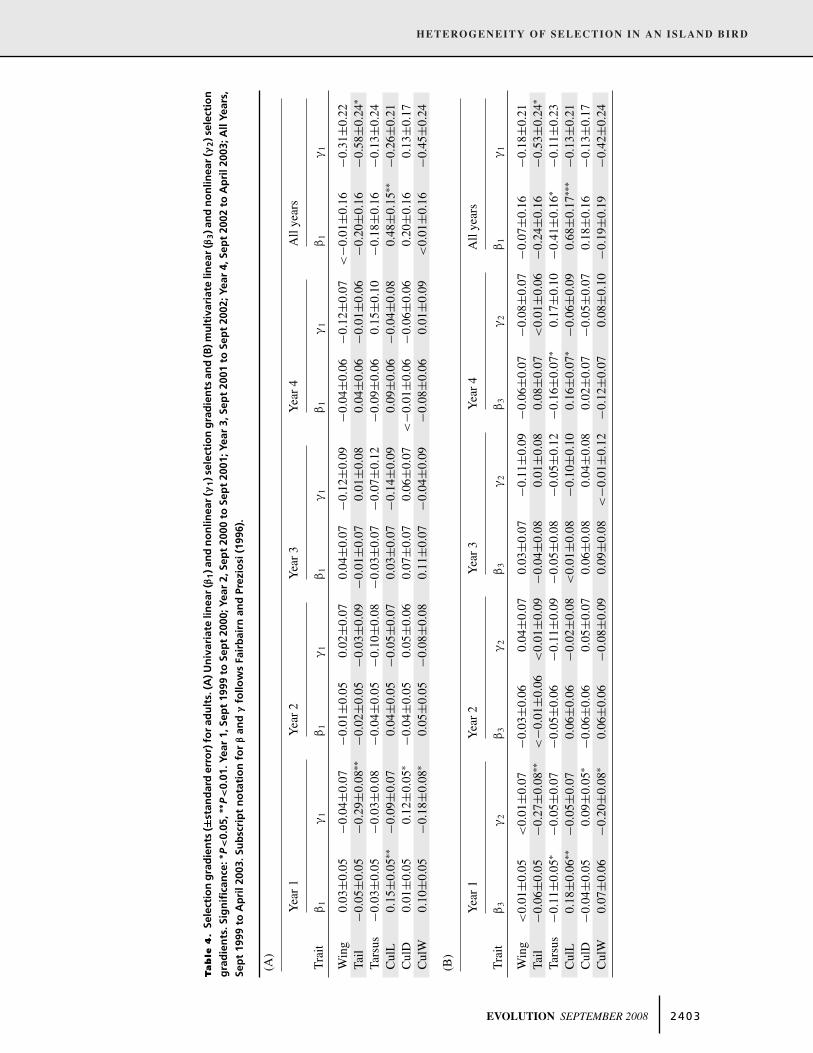
Selection gradientsSelection gradients are given in Tables 3 and 4 for juveniles and
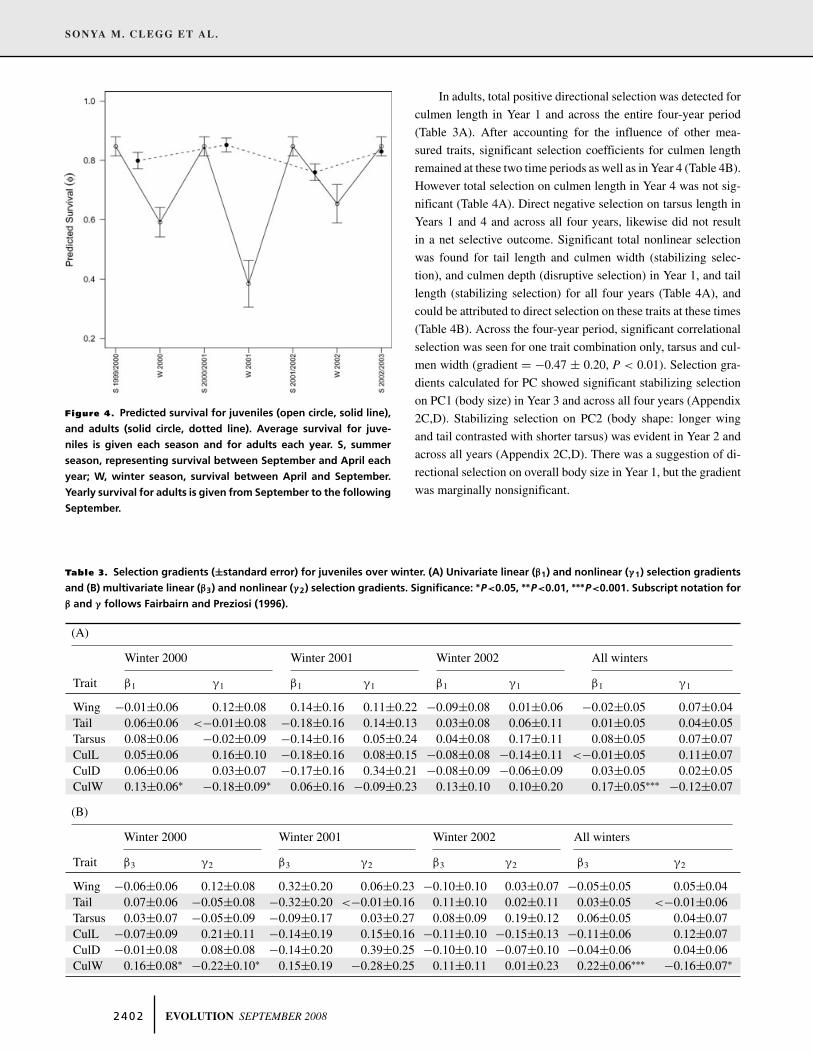
adults, respectively. In juveniles, significant selection gradients
were detected for one trait only, culmen width (Table 3A,B). The
total (direct plus indirect) effect of selection on juvenile culmen
width was positive and highly significant in the first winter and
when all winters were considered together (Table 3A). Analysis
using multivariate selection gradients indicated that selection on
culmen width was not influenced by indirect effects from other
traits in the model (Table 3B). Significant negative γ values addi-
tionally indicate a net stabilizing effect on juvenile culmen width
(Table 3A), again not influenced by other traits included in the
model (Table 3B). Across all winters, significant correlational
selection gradients were detected for tail and culmen width (gra-
dient = 0.18 ± 0.07, P < 0.05). A negative correlational gradient
between tarsus and culmen length was marginally nonsignifi-
cant (gradient = −0.14 ± 0.07, P = 0.052). Selection gradients
calculated for PC were not significant, although positive direc-
tional selection on PC1 (overall body size) in the first winter,
and stabilizing selection on PC2 (body shape: longer wing and
tail contrasted with narrower culmen width) across all winters,
approached significance (Appendix 2A,B).
EVOLUTION SEPTEMBER 2008 2 4 0 1
SONYA M. CLEGG ET AL.
Figure 4. Predicted survival for juveniles (open circle, solid line),
and adults (solid circle, dotted line). Average survival for juve-
niles is given each season and for adults each year. S, summer
season, representing survival between September and April each
year; W, winter season, survival between April and September.
Yearly survival for adults is given from September to the following
September.
Table 3. Selection gradients (±standard error) for juveniles over winter. (A) Univariate linear (β1) and nonlinear (γ1) selection gradients
and (B) multivariate linear (β3) and nonlinear (γ2) selection gradients. Significance: ∗P<0.05, ∗∗P<0.01, ∗∗∗P<0.001. Subscript notation for
β and γ follows Fairbairn and Preziosi (1996).
(A)
Winter 2000 Winter 2001 Winter 2002 All winters
Trait β1 γ1 β1 γ1 β1 γ1 β1 γ1
Wing −0.01±0.06 0.12±0.08 0.14±0.16 0.11±0.22 −0.09±0.08 0.01±0.06 −0.02±0.05 0.07±0.04Tail 0.06±0.06 <−0.01±0.08 −0.18±0.16 0.14±0.13 0.03±0.08 0.06±0.11 0.01±0.05 0.04±0.05Tarsus 0.08±0.06 −0.02±0.09 −0.14±0.16 0.05±0.24 0.04±0.08 0.17±0.11 0.08±0.05 0.07±0.07CulL 0.05±0.06 0.16±0.10 −0.18±0.16 0.08±0.15 −0.08±0.08 −0.14±0.11 <−0.01±0.05 0.11±0.07CulD 0.06±0.06 0.03±0.07 −0.17±0.16 0.34±0.21 −0.08±0.09 −0.06±0.09 0.03±0.05 0.02±0.05CulW 0.13±0.06∗ −0.18±0.09∗ 0.06±0.16 −0.09±0.23 0.13±0.10 0.10±0.20 0.17±0.05∗∗∗ −0.12±0.07
(B)
Winter 2000 Winter 2001 Winter 2002 All winters
Trait β3 γ2 β3 γ2 β3 γ2 β3 γ2
Wing −0.06±0.06 0.12±0.08 0.32±0.20 0.06±0.23 −0.10±0.10 0.03±0.07 −0.05±0.05 0.05±0.04Tail 0.07±0.06 −0.05±0.08 −0.32±0.20 <−0.01±0.16 0.11±0.10 0.02±0.11 0.03±0.05 <−0.01±0.06Tarsus 0.03±0.07 −0.05±0.09 −0.09±0.17 0.03±0.27 0.08±0.09 0.19±0.12 0.06±0.05 0.04±0.07CulL −0.07±0.09 0.21±0.11 −0.14±0.19 0.15±0.16 −0.11±0.10 −0.15±0.13 −0.11±0.06 0.12±0.07CulD −0.01±0.08 0.08±0.08 −0.14±0.20 0.39±0.25 −0.10±0.10 −0.07±0.10 −0.04±0.06 0.04±0.06CulW 0.16±0.08∗ −0.22±0.10∗ 0.15±0.19 −0.28±0.25 0.11±0.11 0.01±0.23 0.22±0.06∗∗∗ −0.16±0.07∗
In adults, total positive directional selection was detected for
culmen length in Year 1 and across the entire four-year period
(Table 3A). After accounting for the influence of other mea-
sured traits, significant selection coefficients for culmen length
remained at these two time periods as well as in Year 4 (Table 4B).
However total selection on culmen length in Year 4 was not sig-
nificant (Table 4A). Direct negative selection on tarsus length in
Years 1 and 4 and across all four years, likewise did not result
in a net selective outcome. Significant total nonlinear selection
was found for tail length and culmen width (stabilizing selec-
tion), and culmen depth (disruptive selection) in Year 1, and tail
length (stabilizing selection) for all four years (Table 4A), and
could be attributed to direct selection on these traits at these times
(Table 4B). Across the four-year period, significant correlational
selection was seen for one trait combination only, tarsus and cul-
men width (gradient = −0.47 ± 0.20, P < 0.01). Selection gra-
dients calculated for PC showed significant stabilizing selection
on PC1 (body size) in Year 3 and across all four years (Appendix
2C,D). Stabilizing selection on PC2 (body shape: longer wing
and tail contrasted with shorter tarsus) was evident in Year 2 and
across all years (Appendix 2C,D). There was a suggestion of di-
rectional selection on overall body size in Year 1, but the gradient
was marginally nonsignificant.
2 4 0 2 EVOLUTION SEPTEMBER 2008
HETEROGENEITY OF SELECTION IN AN ISLAND BIRD
Ta
ble
4.
Sele
ctio
ng
rad
ien
ts(±
stan
dar
der
ror)
for
adu
lts.
(A)U
niv
aria
telin
ear
(β1)a
nd
no
nlin
ear
(γ1)s
elec
tio
ng
rad
ien
tsan
d(B
)mu
ltiv
aria
telin
ear
(β3)a
nd
no
nlin
ear
(γ2)s
elec
tio
n
gra
die
nts
.Sig
nifi
can
ce:∗
P<
0.05
,∗∗ P
<0.
01.Y
ear
1,Se
pt
1999
toSe
pt
2000
;Yea
r2,
Sep
t20
00to
Sep
t20
01;Y
ear
3,Se
pt
2001
toSe
pt
2002
;Yea
r4,
Sep
t20
02to
Ap
ril2
003;
All
Year
s,
Sep
t19
99to
Ap
ril2
003.
Sub
scri
pt
no
tati
on
for
βan
dγ
follo
ws
Fair
bai
rnan
dPr
ezio
si(1
996)
.
(A)
Yea
r1
Yea
r2
Yea
r3
Yea
r4
All
year
s
Tra
itβ
1γ
1β
1γ
1β
1γ
1β
1γ
1β
1γ
1
Win
g0.
03±0
.05
−0.0
4±0.
07−0
.01±
0.05
0.02
±0.0
70.
04±0
.07
−0.1
2±0.
09−0
.04±
0.06
−0.1
2±0.
07<
−0.0
1±0.
16−0
.31±
0.22
Tail
−0.0
5±0.
05−0
.29±
0.08
∗∗−0
.02±
0.05
−0.0
3±0.
09−0
.01±
0.07
0.01
±0.0
80.
04±0
.06
−0.0
1±0.
06−0
.20±
0.16
−0.5
8±0.
24∗
Tars
us−0
.03±
0.05
−0.0
3±0.
08−0
.04±
0.05
−0.1
0±0.
08−0
.03±
0.07
−0.0
7±0.
12−0
.09±
0.06
0.15
±0.1
0−0
.18±
0.16
−0.1
3±0.
24C
ulL
0.15
±0.0
5∗∗−0
.09±
0.07
0.04
±0.0
5−0
.05±
0.07
0.03
±0.0
7−0
.14±
0.09
0.09
±0.0
6−0
.04±
0.08
0.48
±0.1
5∗∗−0
.26±
0.21
Cul
D0.
01±0
.05
0.12
±0.0
5∗−0
.04±
0.05
0.05
±0.0
60.
07±0
.07
0.06
±0.0
7<
−0.0
1±0.
06−0
.06±
0.06
0.20
±0.1
60.
13±0
.17
Cul
W0.
10±0
.05
−0.1
8±0.
08∗
0.05
±0.0
5−0
.08±
0.08
0.11
±0.0
7−0
.04±
0.09
−0.0
8±0.
060.
01±0
.09
<0.
01±0
.16
−0.4
5±0.
24
(B)
Yea
r1
Yea
r2
Yea
r3
Yea
r4
All
year
s
Tra
itβ
3γ
2β
3γ
2β
3γ
2β
3γ
2β
1γ
1
Win
g<
0.01
±0.0
5<
0.01
±0.0
7−0
.03±
0.06
0.04
±0.0
70.
03±0
.07
−0.1
1±0.
09−0
.06±
0.07
−0.0
8±0.
07−0
.07±
0.16
−0.1
8±0.
21Ta
il−0
.06±
0.05
−0.2
7±0.
08∗∗
<−0
.01±
0.06
<0.
01±0
.09
−0.0
4±0.
080.
01±0
.08
0.08
±0.0
7<
0.01
±0.0
6−0
.24±
0.16
−0.5
3±0.
24∗
Tars
us−0
.11±
0.05
∗−0
.05±
0.07
−0.0
5±0.
06−0
.11±
0.09
−0.0
5±0.
08−0
.05±
0.12
−0.1
6±0.
07∗
0.17
±0.1
0−0
.41±
0.16
∗−0
.11±
0.23
Cul
L0.
18±0
.06∗∗
−0.0
5±0.
070.
06±0
.06
−0.0
2±0.
08<
0.01
±0.0
8−0
.10±
0.10
0.16
±0.0
7∗−0
.06±
0.09
0.68
±0.1
7∗∗∗
−0.1
3±0.
21C
ulD
−0.0
4±0.
050.
09±0
.05∗
−0.0
6±0.
060.
05±0
.07
0.06
±0.0
80.
04±0
.08
0.02
±0.0
7−0
.05±
0.07
0.18
±0.1
6−0
.13±
0.17
Cul
W0.
07±0
.06
−0.2
0±0.
08∗
0.06
±0.0
6−0
.08±
0.09
0.09
±0.0
8<
−0.0
1±0.
12−0
.12±
0.07
0.08
±0.1
0−0
.19±
0.19
−0.4
2±0.
24
EVOLUTION SEPTEMBER 2008 2 4 0 3
SONYA M. CLEGG ET AL.
DiscussionThe examination of evolutionary divergence of a morphologi-
cally distinct island-dwelling bird population, considered over
three microevolutionary timescales has provided a rare empirical
insight into the tempo and mode of divergence in a natural sys-
tem. The Zosterops population on Heron Island has undergone a
substantial body size increase since colonization, a maximum of
4000 years ago. Theoretically, sustained directional selection can
produce large-scale shifts, even with weak selection pressures
(Kingsolver and Pfennig 2004). However, constancy of selec-
tion is likely to be an unrealistic assumption in most systems
(Kinnison and Hendry 2001; Estes and Arnold 2007). In Heron
Island Zosterops, this issue is highlighted when comparing cur-
rent selection strengths with net selection intensities required to
explain the long-term morphological shift. Current selection was
higher, frequently an order of magnitude higher, than the net selec-
tion intensity required to explain long-term divergence for many
traits, and was interpreted as evidence of heterogeneity in form
and strength of selection over the divergence period (Kinnison
and Hendry 2001).
CHARACTERIZING HETEROGENEITY IN SELECTION
Establishing the presence of heterogeneity in selection operating
in a system is a first step to understanding the divergence process.
However, reconstructing that heterogeneity across evolutionary
time is a difficult task. In the case presented here, three lines of
evidence support a scenario of rapid evolution toward a new op-
timum followed by many generations of minimal change. First,
the comparison of mainland and island phenotypes shows that
a substantial shift in the optimum phenotype accompanied the
colonization of the island environment. Second, tracking the mor-
phology of the island population over a period of four decades
demonstrates a lack of directional change that would be consis-
tent with ongoing directional selection. Finally, recent estimates
of selection gradients based on survival analysis show that cur-
rent selection is relatively weak for most traits that have increased
significantly in size in the island form.
The rate at which the silvereye population shifted toward the
new island optimum after colonization was explored using the dis-
placed optimum model (Estes and Arnold 2007). Under a range of
potential adaptive landscapes, the approach to the new optimum
occurred in far fewer generations than even the lowest estimate of
divergence time (1000 generations). This supports the hypothesis
that under novel selective conditions on the island, the bulk of
the evolutionary difference observed developed rapidly, possibly
in the first couple of hundred generations after colonization. This
would represent at least a doubling of the maximum evolutionary
rate reported in Table 1, and even if we assume the shift occurred
over a conservative 500 generations, all estimates of evolutionary
rates would be above the median value (5.3 × 10⁻³) reported
by Kinnison and Hendry (2001). Historically documented colo-
nizations by Zosterops lateralis from Australia to New Zealand
and outlying islands indicate that morphological shifts can occur
quickly, too quickly to be accounted for by drift alone (Clegg
et al. 2002b). We can only speculate on the proximate causes
of selection during the period following colonization. However
given that the newly established population was experiencing a
novel environment in numerous aspects of ecology (e.g., changes
in interspecific competition, predator and parasite pressures, and
resource availability), physiology (e.g., changes in response to the
new abiotic environment), and behavior (e.g., changes in domi-
nance behavior associated with levels of intraspecific competi-
tion), it is likely that a complex and multifaceted selection regime
was operating.
Following an initial phase of rapid divergence we suggest
that the population has since remained relatively stable, with os-
cillations occurring around the optimum phenotype. In support of
this, we find no consistent directional trends for any trait over a 34-
year period. Fluctuations in the direction of change also resulted
in a lack of net size shifts when comparing the beginning and end
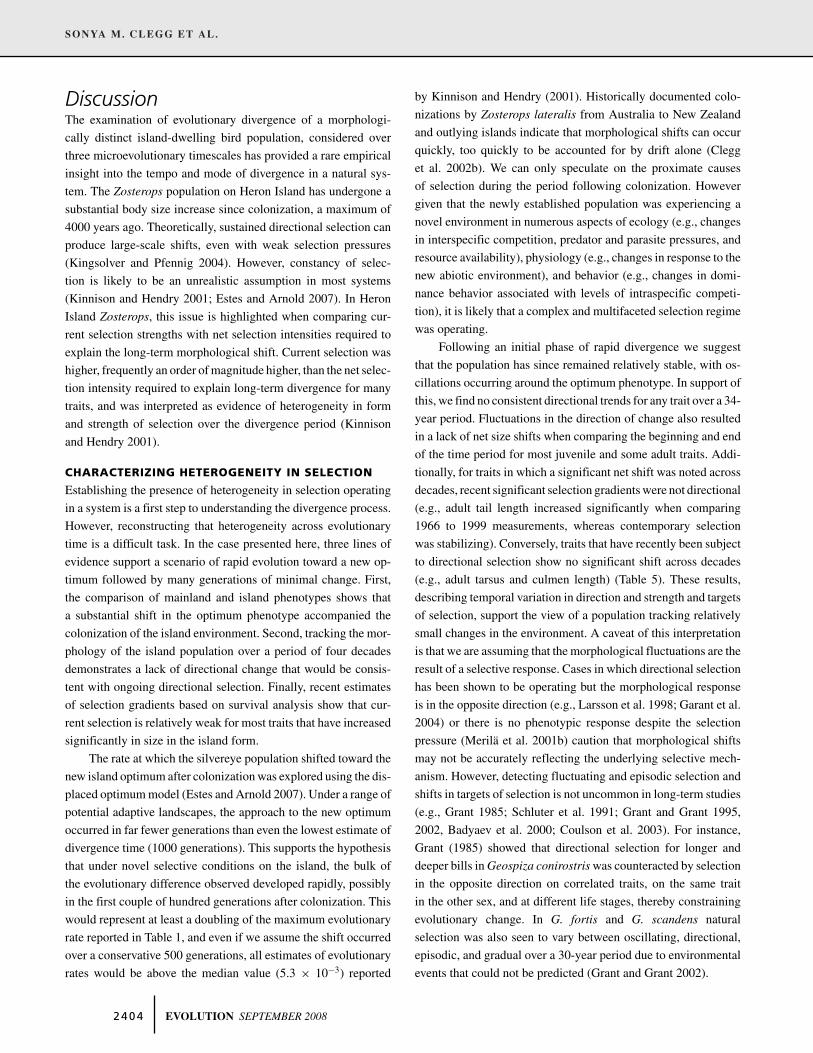
of the time period for most juvenile and some adult traits. Addi-
tionally, for traits in which a significant net shift was noted across
decades, recent significant selection gradients were not directional
(e.g., adult tail length increased significantly when comparing
1966 to 1999 measurements, whereas contemporary selection
was stabilizing). Conversely, traits that have recently been subject
to directional selection show no significant shift across decades
(e.g., adult tarsus and culmen length) (Table 5). These results,
describing temporal variation in direction and strength and targets
of selection, support the view of a population tracking relatively
small changes in the environment. A caveat of this interpretation
is that we are assuming that the morphological fluctuations are the
result of a selective response. Cases in which directional selection
has been shown to be operating but the morphological response
is in the opposite direction (e.g., Larsson et al. 1998; Garant et al.
2004) or there is no phenotypic response despite the selection
pressure (Merila et al. 2001b) caution that morphological shifts
may not be accurately reflecting the underlying selective mech-
anism. However, detecting fluctuating and episodic selection and
shifts in targets of selection is not uncommon in long-term studies
(e.g., Grant 1985; Schluter et al. 1991; Grant and Grant 1995,
2002, Badyaev et al. 2000; Coulson et al. 2003). For instance,
Grant (1985) showed that directional selection for longer and
deeper bills in Geospiza conirostris was counteracted by selection
in the opposite direction on correlated traits, on the same trait
in the other sex, and at different life stages, thereby constraining
evolutionary change. In G. fortis and G. scandens natural
selection was also seen to vary between oscillating, directional,
episodic, and gradual over a 30-year period due to environmental
events that could not be predicted (Grant and Grant 2002).
2 4 0 4 EVOLUTION SEPTEMBER 2008
HETEROGENEITY OF SELECTION IN AN ISLAND BIRD
Table 5. Summary of directions of phenotypic shift and current
selection for each trait over three timescales. Trait labels as in
Table 1. J, juvenile; A, adult. Pop. Div. is the direction in change
of the island compared to the mainland population. Net change
indicates if a significant size shift in a positive (+) or negative di-
rection (−) was observed from 1966 to 1999 or if no net shift (no
�) occurred (but note that no consistent trends were observed
for any trait across decades). Codes for total (univariate linear)
and direct (multivariate linear) selection are: −ns, negative direc-
tion but nonsignificant;+ns, positive direction but nonsignificant;
−, significant negative selection; +, significant positive selection;
na=not assessed. Bold indicates significant results.
Trait Pop. Div. Net change Selection(millennia) (decades) (years)
Indirect Direct
J A J A J A
Wing + no � + −ns −ns −ns −nsTail + no � + +ns −ns +ns −nsTarsus + no � no � +ns −ns +ns −CulL + − no � −ns + −ns +CulD + na na +ns +ns −ns +nsCulW + na na + +ns + −nsWeight + no � + na na na na
Reviews of estimates of selection gradients and differentials
across a range of studies indicate generally weak directional se-
lection for morphological traits (median |β| = 0.17) (Kingsolver
et al. 2001), tending to be weaker still when calculated using
viability (survival) analysis and conducted over a timescale of
years, (median |β| = 0.07) (Hoekstra et al. 2001). The esti-
mates of selection presented here are therefore in line with other
studies of this kind (morphological studies based on survival
across a number of years), and with few exceptions discussed
below, are consistent with a generally weak directional selection
regime. The weak strength of recent directional selection on in-
dividual traits and cases of stabilizing selection on overall body
size and some shape parameters during some years supports the
idea of maintenance near an optimum as directional selection
wanes and stabilizing selection becomes more prevalent (Hunt
et al. 2008).
Significant directional selection was detected for culmen
measurements and tarsus length from 1999 to 2003. This find-
ing remains compatible with the maintenance of the population
near some optimum according to a number of scenarios that have
been invoked to explain the existence of stasis in systems that are
subject to directional selection (see Merila et al. 2001b). First, the
current directional selection on culmen traits and tarsus length
may be transient, and opposing selection at other times and life-
history stages may negate any directional shifts (Schluter et al.
1991; Grant and Grant 2002). Second, the traits may appear to
be under direct selection due to selection on other traits that are
highly genetically correlated. Shifts in direction of selection on
any correlated traits could therefore limit change in the traits of
interest. Third, selection can only produce a response if it acts on
a heritable trait rather than one that is largely or entirely plastic
(Falconer and Mackay 1996). Morphological traits such as those
of interest here, culmen length and width, and tarsus length, gen-
erally have a significant additive genetic variation component in
birds (Merila and Sheldon 2001). For Heron Island silvereyes,
analysis in progress indicates heritability estimates in the order
of 0.7 for tarsus and 0.2 for culmen measures (S. M. Clegg, F. D.
Frenitu, I. P. F. Owens, and M. Blows, unpubl. results). There-
fore, for culmen measures at least, there is the possibility that the
directional selection detected will not result in an evolutionary
response. Finally, even if a trait is highly heritable, such as tarsus
length, selection may act entirely or partly on the remaining envi-
ronmental component of phenotypic variation rather than directly
on the genetic component, limiting an evolutionary response (e.g.,
Alatalo et al. 1990). Long-term studies of wild bird populations
have demonstrated selection acting on environmental deviations,
however concurrent selection on genetic components were also
evident (Merila et al. 2001a; Garant et al. 2004).
We cannot fully assess which, if any, of these alternatives may
limit evolutionary change despite directional selection on tarsus
and culmen measures without a more complete understanding of
the underlying quantitative genetic parameters in the population.
However, morphological trends over the previous decades indi-
cate that changes in the direction of selection at different times
is a plausible mechanism to explain why traits under current di-
rectional selection have not exhibited an evolutionary shift over
decades. Short series of trends in the data suggest that at times
in previous years, larger bills in both juveniles and adults may
have conferred a selective advantage, but reversals of direction
of selection have resulted in no net change. Our selection study
may have therefore coincided with a time period when having a
larger bill directly improved chances of survival. There is also
some indication that opposing selection directions at different
life-history stages may operate. The multivariate selection coeffi-
cient for culmen width in juveniles is matched by a coefficient of
similar magnitude, but opposite sign in adults, although the adult
estimate is not significant due to small sample sizes. Selection
on correlated traits is also possible in this system. Significant or
near-significant correlational selection was noted for a limited set
of traits, and depending on the genetic correlation between them,
the response to selection may be limited.
ENVIRONMENTAL INFLUENCES ON MORPHOLOGY
The proximate environmental causes of morphological fluctua-
tions across decades and years are not easily identified. Two types
of large-scale recurring environmental disturbances that possibly
EVOLUTION SEPTEMBER 2008 2 4 0 5
SONYA M. CLEGG ET AL.
influence the pattern of morphological fluctuations are tropical cy-
clones and El Nino events. Tropical cyclones may act as a selective
agent, with a particular phenotype gaining a selective advantage
during and immediately after a cyclone, similar to what has pre-
viously been shown to occur in birds that experience extreme
and abrupt environmental events (e.g., Bumpus 1899; Brown and
Brown 1998). High mortality rates from cyclones (Brook and
Kikkawa 1998; McCallum et al. 2000) could also provide con-
ditions conducive to rapid, drift-mediated phenotypic shifts. El
Nino events are less abrupt, lasting from months to years, and
lead to lower than expected average rainfall with severe events
characterized by extreme and extended drought conditions. How-
ever, despite the potential for either cyclones or El Nino events
to affect morphological fluctuations in the population, we found
little evidence that either type of event produced a consistent ef-
fect in the Heron Island silvereye population. Surviving a cyclone
may simply be due to chance but drift may not have an oppor-
tunity to affect the phenotypic distribution due to rapid recovery
from postcyclone population decreases (McCallum et al. 2000).
El Nino events vary in their severity and therefore, it may be un-
reasonable to expect consistent impacts across separate events. A
more detailed analysis of survival at these times would be required
to fully assess the impact of these complex environmental events,
as has been done for Darwin’s finches on the Galapagos Islands
where selective episodes were driven by El Nino cycles (Grant
and Grant 1993).
Environmental fluctuations that result in an interplay of fac-
tors affecting food abundance and population density (Brook and
Kikkawa 1998; McCallum et al. 2000) are a likely explanation
for the variation in survival probability and selection for differ-
ent ages, seasons and years seen across the survival study. The
age-related differences in survival may reflect successful passage
through earlier selection filters, or be due to increases in com-
petence gained through experience throughout the lifetime of an
individual (Forslund and Part 1995). The evidence that adult birds
are not released from selection, despite having passed through pre-
vious selection filters, along with changes in aggressive behavior
across the lifetime of individuals (Kikkawa 1987), and shifts in
juvenile and adult foraging strategies (Catterall et al. 1989; Jansen
1989) implies an important role for experience gained with age in
determining survival.
Previous studies of the population have noted that when
population densities were very high, larger individuals had
higher overwinter survival (Kikkawa 1980; Robinson-Wolrath
and Owens 2003). Under high-density conditions, links between
bill size and foraging ability or efficiency, such as that found in
other avian species (e.g., Boag and Grant 1981; Grant 1986; Smith
1987; Benkman 1993) may be more pronounced. Alternatively,
a less direct mechanism may be at play, where larger sized indi-
viduals have an advantage in aggressive interactions and thereby
control of food resources (Robinson-Wolrath and Owens 2003). In
the Heron Island population, larger bill size and overall body size
has been shown to be positively associated with the proportion of
fights won (Kikkawa 1980), making this mechanism a contender
for explaining the advantages of large bill over short timescales.
However, whether fluctuations in these traits seen over decades
and years represent a plastic or genetic response to selection re-
quires additional quantitative treatment.
ConclusionsDirectional selection has been an important force in the divergence
of the Capricorn silvereye from its mainland ancestor. However
evidence from three microevolutionary timescales indicates that
there has been temporal variation in the form and strength of se-
lection in the 4000 years or less since colonization. A model of
rapid directional evolution toward a new phenotypic optimum,
followed by an extended time of proximity around the acquired
optimum is consistent with the substantial phenotypic shift, rela-
tive phenotypic stability across four recent decades and generally
weak current directional selection for morphological traits. Traits
that are subject to contemporary directional selection may not
have an evolutionary response if selection is reversed over time,
is in opposing directions at different life-history stages, or if ge-
netic correlations limit a response to selection. Additionally, there
is a possibility that additive genetic variation in the direction of
the observed morphological shift has been depleted via the action
of directional selection. A full multivariate quantitative genetic
approach is needed to assess how limited the population may be
in terms of its ability to mount an evolutionary response to any
further optimum shifts, particularly if the direction is an extension
of the preceding trajectory.
ACKNOWLEDGMENTSWe thank S. Arnold, M. Blows, T. Coulson, M. Crawley, S. Estes, H. Hol-locher, R. Lande, D. Orme, A. Phillimore, and J. Worthington Wilmerfor comments on the manuscript and suggestions or help with analyses;C. Catterall, P. Fisk, C. Edwards, M. Losiak, F. Manson, S. Robinson-Wolrath, S. Scott, and C. Wiley for contributions to field work; P. Douglasfor early database management; Heron Island Research Station, P & OHeron Island Resort, Queensland Museum, and M. Blows for logisticalsupport. Insightful comments from three anonymous referees greatly im-proved the manuscript. All work was conducted under permits from theAustralian Bird and Bat Banding Scheme, Queensland EnvironmentalProtection Agency and Animal Ethics Committee of The University ofQueensland. Funding was provided by grants from Natural EnvironmentResearch Council (UK) and the Australian Research Council.
LITERATURE CITEDAlatalo, R. V., L. Gustafsson, and A. Lundberg. 1990. Phenotypic selection on
heritable size traits: environmental variance and genetic response. Am.Nat. 135:464–471.
2 4 0 6 EVOLUTION SEPTEMBER 2008
HETEROGENEITY OF SELECTION IN AN ISLAND BIRD
Anderson, D. R., K. P. Burnham, and G. C. White. 1994. AIC model selectionin overdispersed capture-recapture data. Ecology 75:1780–1793.
Arnold, S. J., and M. J. Wade. 1984. On the measurement of natural and sexualselection: theory. Evolution 38:709–719.
Badyaev, A. V., G. E. Hill, A. M. Stoehr, P. M. Nolan, and K. J. McGraw. 2000.The evolution of sexual size dimorphism in the house finch II. Populationdivergence in relation to local selection. Evolution 54:2134–2144.
Benkman, C. W. 1993. Adaptation to single resources and the evolution ofcrossbill (Loxia) diversity. Ecol. Monogr. 63:305–325.
Boag, P. T., and P. R. Grant. 1981. Intense natural selection in a population ofDarwin’s finches (Geospizinae) in the Galapagos. Science 214:82–85.
Brook, B. W., and J. Kikkawa. 1998. Examining threats faced by island birds: apopulation viability analysis on the Capricorn silvereye using long-termdata. J. Appl. Ecol. 35:491–503.
Brown, C. R., and M. B. Brown. 1998. Intense natural selection on body sizeand wing and tail asymmetry in Cliff swallows during severe weather.Evolution 52:1461–1475.
Bumpus, H. C. 1899. The elimination of the unfit as illustrated by the intro-duced sparrow, Passer domesticus. Biol. Lect., Woods Hole Mar. Biol.Station 6:209–226.
Burnham, K. P., D. R. Anderson, G. C. White, C. Brownie, and K. H. Pollock.1987. Design and analysis methods for fish survival experiments basedon release-recapture. Am. Fish. Soc. Monogr. 5. American FisheriesSociety, Bethesda MD.
Catterall, C. P., J. Kikkawa, and C. Gray. 1989. Inter-related age-dependentpatterns of ecology and behaviour in population of silvereyes (Aves:Zosteropidea). J. Anim. Ecol. 58:557–570.
Choquet, R., A. M. Reboulet, R. Pradel, O. Gimenez, and J. D. Lebreton. 2003.User’s manual for U-CARE. Mimeographed document, CEFE/CNRS,Montpellier (ftp://ftp.cefe.cnrs-mop.fr/biom/Soft-CR/)
Clegg, S. M., S. M. Degnan, J. Kikkawa, C. Moritz, A. Estoup, and I. P. F.Owens. 2002a. Genetic consequences of sequential founder events byan island-colonizing bird. Proc. Natl. Acad. Sci. USA 99:8127–8132.
Clegg, S. M., S. M. Degnan, C. Moritz, J. Kikkawa, A. Estoup, and I. P. F.Owens. 2002b. Microevolution in island forms: the roles of drift anddirectional selection in morphological divergence of a passerine bird.Evolution 56:2090–2099.
Coulson, T., L. E. B. Kruuk, G. Tavecchia, J. M. Pemberton, and T. H. Clutton-Brock. 2003. Estimating selection on neonatal traits in red deer usingelasticity path analysis. Evolution 57:2879–2892.
Degnan, S. M. 1993. Genetic variability and population differentiation inferredfrom DNA fingerprinting in silvereyes (Aves: Zosteropidae). Evolution47:1105–1117.
Degnan, S. M., and C. C. Moritz. 1992. Phylogeography of mitochondrialDNA of two species of white-eyes in Australia. Auk 109:800–811.
Estes, S., and S. J. Arnold. 2007. Resolving the paradox of stasis: models withstabilizing selection explain evolutionary divergence on all timescales.Evolution 169:227–244.
Fairbairn, D. J., and R. F. Preziosi. 1996. Sexual selection and the evolution ofsexual size dimorphism in the water strider, Aquarius remigis. Evolution50:1549–1559.
Falconer, D. S., and T. F. C. Mackay. 1996. Introduction to quantitative ge-netics. 4th edn. Longman, New York.
Forslund P., and T. Part. 1995. Age and reproduction in birds—hypothesesand tests. Trends Ecol. Evol. 10:374–378.
Frentiu, F. D., S. M. Clegg, M. Blows, and I. P. F. Owens. 2007. Large bodysize in an island dwelling bird: a microevolutionary analysis. J. Evol.Biol. 20:639–649.
Garant, D., L. E. B. Kruuk, R. H. McCleery, and B. C. Sheldon. 2004. Evo-lution in a changing environment: a case study with Great Tit fledglingmass. Am. Nat. 164:E115–E129.
Grant, B. R. 1985. Selection on bill characters in a population of Darwin’sfinches: Geospiza conirostris on Isla Genovesa, Galapagos. Evolution39:523–532.
Grant, P. R. 1986. Ecology and Evolution of Darwin’s Finches. PrincetonUniv. Press, Princeton, NJ.
Grant, P. R., and B. R. Grant. 1993. Evolution of Darwin finches caused by arare climatic event. Proc. R. Soc. Lond. B. 251:111–117.
———. 1995. Predicting microevolutionary responses to directional selectionon heritable variation. Evolution 49:241–251.
———. 2002. Unpredictable evolution in a 30-year study of Darwin’s finches.Science 296:707–711.
Grosbois, V., and G. Tavecchia. 2003. Modeling dispersal with capture-recapture data: disentangling decisions of leaving and settlement. Ecol-ogy 84:1225–1236.
Hendry A. P., J. K. Wenburg, P. Bentzen, E. C. Volk, and T. P. Quinn. 2000.Rapid evolution of reproductive isolation in the wild: evidence fromintroduced salmon. Science 290:516–518.
Hendry, A. P., T. J. Farrugia, and M. T. Kinnison. 2008. Human influenceson rates of phenotypic change in wild animal populations. Mol. Ecol.17:20–29.
Higgins, P. J., J. M. Peter, and S. J. Cowling (eds). 2006. Zosterops lateralisSilvereye. Pp. 1745–1792 in Handbook of Australian, New Zealand andAntarctic Birds. Volume 7: Boatbill to Starlings. Oxford Univ. Press,Melbourne.
Hoekstra H. E., J. M. Hoekstra, D. Berrigan, S. N. Vignieri, A. Hoang, C.E. Hill, P. Beerli, and J. G. Kingsolver. 2001. Strength and tempo ofdirectional selection in the wild. Proc. Natl. Acad. Sc. USA 98:9157–9160.
Hopley, D. 1982 The geomorphology of the great barrier reef: quaternarydevelopment of coral reefs. John Wiley and Sons, New York.
Hunt, G., M. A. Bell, and M. P. Travis. 2008. Evolution toward a new adaptiveoptimum: phenotypic evolution in a fossil stickleback lineage. Evolution62:700–710.
Jansen, A. 1989. Acquisition of foraging skills by Heron Island SilvereyesZosterops lateralis chlorocephala. Ibis 132:95–101.
Kikkawa, J. 1970. Birds recorded at Heron Island. Sunbird 1:34–48.———. 1976. The birds of the Great Barrier Reef. Pp. 279–341 in O. A. Jones
and R. Endean, eds. Biology and geology of coral reefs. Academic Press,New York.
———. 1980. Winter survival in relation to dominance classes among sil-vereyes Zosterops lateralis chlorocepahla of Heron Island, Great BarrierReef. Ibis 122:437–446.
———. 1987. Social relations and fitness in silvereyes. Pp. 253–266 in Y. Ito,J. L. Brown and J. Kikkawa, eds. Animal societies: theories and facts.Japan Sci. Soc. Press, Tokyo.
———. 1997. Individual colour banding for 8000 birds. Corella 21:26–31.———. 2003. The Capricorn white-eye Zosterops chlorocephalus. Sunbird
33:64–76.Kikkawa, J., and S. M. Degnan. 1998. Effective population size of an is-
land passerine. Proceedings of the 22nd International OrnithologicalCongress, Durban, South Africa, August 16–22, 1998, p. 213.
Kingsolver, J. G., and D. W. Pfennig. 2004. Individual-level selection as acause of Cope’s rule of phyletic size increase. Evolution 58:1608–1612.
Kingsolver J. G., H. E. Hoekstra, J. M. Hoekstra, D. Berrigan, S. N. Vignieri,C.E. Hill, A. Hoang, P. Gilbert, and P. Beerli. 2001. The strength ofphenotypic selection in natural populations. Am. Nat. 157: 245–261.
Kinnison, M. T., and A. P. Hendry. 2001. The pace of modern life II: fromrates of contemporary microevolution to pattern and process. Genetica112–113:145–164.
Kruuk, L. E. B., J. Merila, and B. C. Sheldon. 2001. Phenotypic selection ona heritable size trait revisited. Am. Nat. 158:557–571.
EVOLUTION SEPTEMBER 2008 2 4 0 7
SONYA M. CLEGG ET AL.
Lande, R. 1976. Natural selection and random genetic drift in phenotypicevolution. Evolution 30:314–334.
Larsson, K., H. P. van der Jeugd, I. T. van der Veen, and P. Forslund. 1998.Body size declines despite positive directional selection on heritable sizetraits in a barnacle goose population. Evolution 52:1169–1184.
Lebreton, J-D., K. P. Burnham, J. Colbert, and D. R. Anderson. 1992. Model-ing survival and testing biological hypotheses using marked animals: aunified approach with case studies. Ecol. Monogr. 62:67–118.
Lynch M. and B. Walsh. 1998. Genetics and analysis of quantitative traits.Sinauer Associates, Sunderland, MA.
McCallum, H., J. Kikkawa, and C. Catterall. 2000. Density dependence in anisland population of silvereyes. Ecol. Lett. 3:95–100.
Mees, G. 1969. A systematic review of the Indo-Australian Zosteropidae (PartIII). Zool. Verh (Leiden) 102:1–390.
Merila, J., and B. C. Sheldon. 2001. Avian quantitative genetics. Pp. 179–255in V. Nolan Jr, and C. F. Thompson, eds. Current ornithology Vol. 16.Kluwer Academic/Plenum, New York.
Merila, J., L. E. B. Kruuk, and B. C. Sheldon. 2001a. Natural selection onthe genetical component of variance in body condition in a wild birdpopulation. J. Evol. Biol. 14:918–929.
Merila, J., B. C. Sheldon, and L. E. B. Kruuk. 2001b. Explaining stasis: mi-croevolutionary studies in natural populations. Genetica 112–113:199–222.
R Development Core Team. 2004. R: a language and environment for statisticalcomputing. Vienna, Austria. R Foundation for Statistical Computing.
Reiseberg, L., A. Widmer, A. M. Arntz, and J. M. Burke. 2002. Directionalselection is the primary cause of phenotypic diversification. Proc. Natl.Acad. Sci. USA 99:12242–12245.
Reznick D. N., and C. K. Ghalambor. 2001. The population ecology of contem-porary adaptations: what empirical studies reveal about the conditionsthat promote adaptive evolution. Genetica 112–113:183–198.
Reznick D. N., F. H. Shaw, F. H. Rodd, and R. G. Shaw. 1997. Evaluation of therate of evolution in natural populations of guppies (Poecilia reticulata).Science 275:1934–1937.
Robinson-Wolrath, S. I., and I. P. F. Owens. 2003. Large size in an island-dwelling bird: intraspecific competition and the Dominance Hypothesis.J. Evol. Biol. 16:1106–1114.
Schluter, D., T. D. Price, L. Rowe. 1991. Conflicting selection pressures andlife history trade-offs. Proc. R. Soc. Lond. B. 246:11–17.
Smith, T. B. 1987. Bill size polymorphism and intraspecific niche utilizationin an African finch. Nature 329:717–719.
Tavecchia, G., E. Mingues, A. De Leon, M. Louzao, and D. Oro. 2007.Living close, doing differently: small-scale asynchrony in demographicparameters in two species of seabirds. Ecology 89:77–85.
White, G. C., and K. P. Burnham. 1999. Program MARK: survival estimationfrom populations of marked animals. Bird Study 46:S120–S139.
Williams, B. K., J. D. Nichols, and M. J. Conroy. 2002. Analysis and man-agement of animal populations. Academic Press, San Diego.
Associate Editor: H. Hollocher
2 4 0 8 EVOLUTION SEPTEMBER 2008
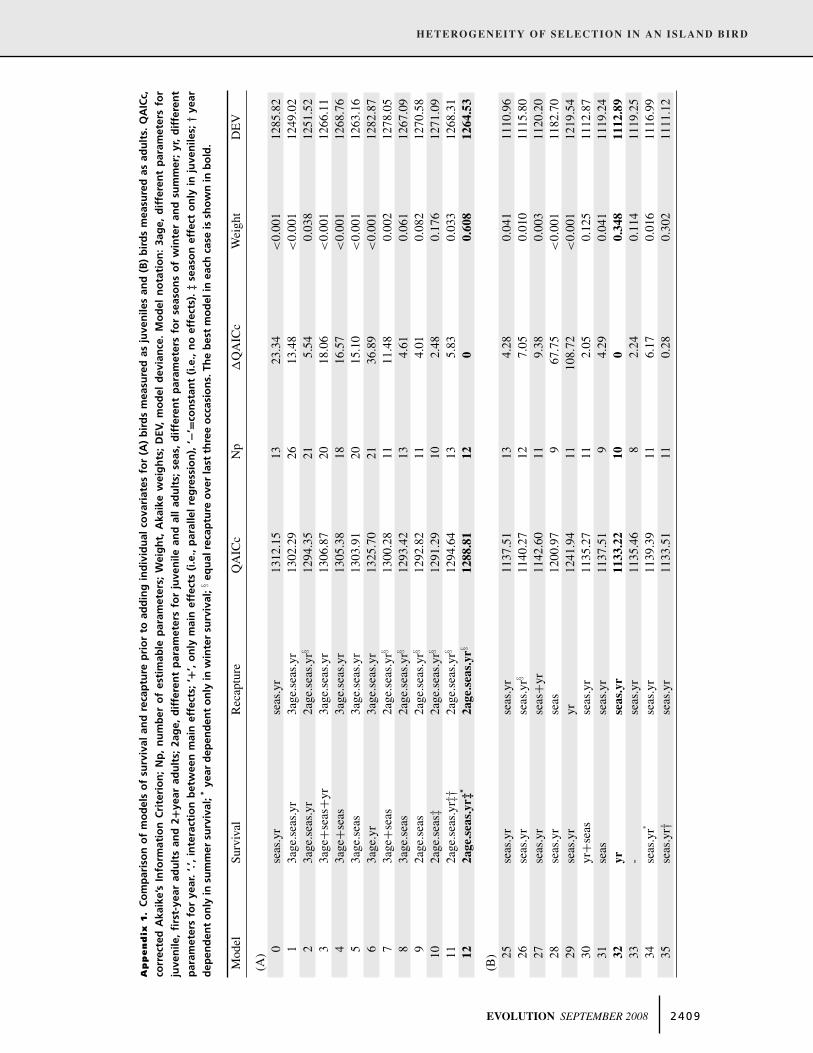
HETEROGENEITY OF SELECTION IN AN ISLAND BIRD
Ap
pen
dix
1.
Co
mp
aris
on
of
mo
del
so
fsu
rviv
alan
dre
cap
ture
pri
or
toad
din
gin
div
idu
alco
vari
ates
for
(A)
bir
ds
mea
sure
das
juve
nile
san
d(B
)b
ird
sm
easu
red
asad
ult
s.Q
AIC
c,
corr
ecte
dA
kaik
e’s
Info
rmat
ion
Cri
teri
on
;N
p,
nu
mb
ero
fes
tim
able
par
amet
ers;
Wei
gh
t,A
kaik
ew
eig
hts
;D
EV,
mo
del
dev
ian
ce.
Mo
del
no
tati
on
:3a
ge,
dif
fere
nt
par
amet
ers
for
juve
nile
,fi
rst-
year
adu
lts
and
2+ye
arad
ult
s;2a
ge,
dif
fere
nt
par
amet
ers
for
juve
nile
and
all
adu
lts;
seas
,d
iffe
ren
tp
aram
eter
sfo
rse
aso
ns
of
win
ter
and
sum
mer
;yr
,d
iffe
ren
t
par
amet
ers
for
year
.‘.’
,in
tera
ctio
nb
etw
een
mai
nef
fect
s;‘+
’,o
nly
mai
nef
fect
s(i
.e.,
par
alle
lre
gre
ssio
n),
‘−’=
con
stan
t(i
.e.,
no
effe
cts)
.‡
seas
on
effe
cto
nly
inju
ven
iles;
†ye
ar
dep
end
ent
on
lyin
sum
mer
surv
ival
;∗ye
ard
epen
den
to
nly
inw
inte
rsu
rviv
al;§
equ
alre
cap
ture
ove
rla
stth
ree
occ
asio
ns.
The
bes
tm
od
elin
each
case
issh
ow
nin
bo
ld.
Mod
elSu
rviv
alR
ecap
ture
QA
ICc
Np
�Q
AIC
cW
eigh
tD
EV
(A) 0
seas
.yr
seas
.yr
1312
.15
1323
.34
<0.
001
1285
.82
13a
ge.s
eas.
yr3a
ge.s
eas.
yr13
02.2
926
13.4
8<
0.00
112
49.0
22
3age
.sea
s.yr
2age
.sea
s.yr
§12
94.3
521
5.54
0.03
812
51.5
23
3age
+sea
s+yr
3age
.sea
s.yr
1306
.87
2018
.06
<0.
001
1266
.11
43a
ge+s
eas
3age
.sea
s.yr
1305
.38
1816
.57
<0.
001
1268
.76
53a
ge.s
eas
3age
.sea
s.yr
1303
.91
2015
.10
<0.
001
1263
.16
63a
ge.y
r3a
ge.s
eas.
yr13
25.7
021
36.8
9<
0.00
112
82.8
77
3age
+sea
s2a
ge.s
eas.
yr§
1300
.28
1111
.48
0.00
212
78.0
58
3age
.sea
s2a
ge.s
eas.
yr§
1293
.42
134.
610.
061
1267
.09
92a
ge.s
eas
2age
.sea
s.yr
§12
92.8
211
4.01
0.08
212
70.5
810
2age
.sea
s‡2a
ge.s
eas.
yr§
1291
.29
102.
480.
176
1271
.09
112a
ge.s
eas.
yr‡†
2age
.sea
s.yr
§12
94.6
413
5.83
0.03
312
68.3
11
22
ag
e.se
as.
yr‡
∗2
ag
e.se
as.
yr§
12
88
.81
12
00
.60
81
26
4.5
3
(B) 25
seas
.yr
seas
.yr
1137
.51
134.
280.
041
1110
.96
26se
as.y
rse
as.y
r§11
40.2
712
7.05
0.01
011
15.8
027
seas
.yr
seas
+yr
1142
.60
119.
380.
003
1120
.20
28se
as.y
rse
as12
00.9
79
67.7
5<
0.00
111
82.7
029
seas
.yr
yr12
41.9
411
108.
72<
0.00
112
19.5
430
yr+s
eas
seas
.yr
1135
.27
112.
050.
125
1112
.87
31se
asse
as.y
r11
37.5
19
4.29
0.04
111
19.2
43
2y
rse
as.
yr
11
33
.22
10
00
.34
81
11
2.8
9
33-
seas
.yr
1135
.46
82.
240.
114
1119
.25
34se
as.y
r∗se
as.y
r11
39.3
911
6.17
0.01
611
16.9
935
seas
.yr†
seas
.yr
1133
.51
110.
280.
302
1111
.12
EVOLUTION SEPTEMBER 2008 2 4 0 9
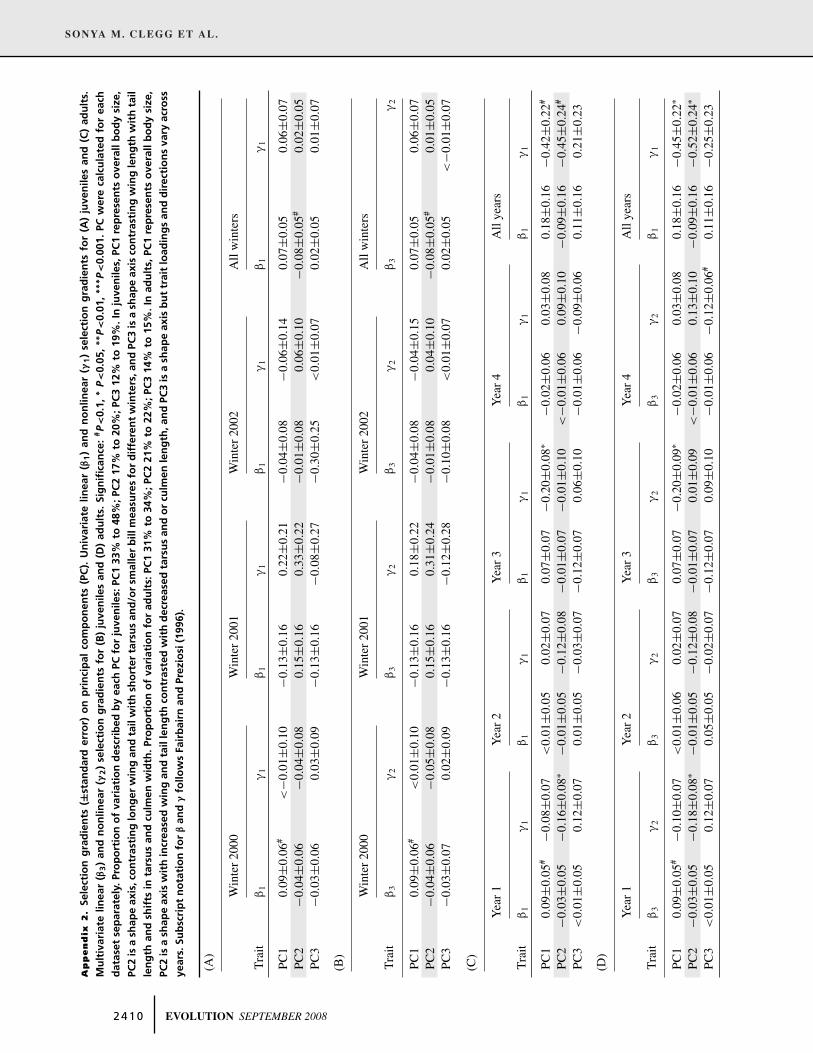
SONYA M. CLEGG ET AL.
Ap
pen
dix
2.
Sele
ctio
ng
rad
ien
ts(±
stan
dar
der
ror)
on
pri
nci
pal
com
po
nen
ts(P
C).
Un
ivar
iate
linea
r(β
1)
and
no
nlin
ear
(γ1)
sele
ctio
ng
rad
ien
tsfo
r(A
)ju
ven
iles
and
(C)
adu
lts.
Mu
ltiv
aria
telin
ear
(β3)
and
no
nlin
ear
(γ2)
sele
ctio
ng
rad
ien
tsfo
r(B
)ju
ven
iles
and
(D)
adu
lts.
Sig
nifi
can
ce:
#P<
0.1,
∗P<
0.05
,∗∗
P<
0.01
,∗∗
∗ P<
0.00
1.PC
wer
eca
lcu
late
dfo
rea
ch
dat
aset
sep
arat
ely.
Pro
po
rtio
no
fva
riat
ion
des
crib
edb
yea
chPC
for
juve
nile
s:PC
133
%to
48%
;PC
217
%to
20%
;PC
312
%to
19%
.In
juve
nile
s,PC
1re
pre
sen
tso
vera
llb
od
ysi
ze,
PC2
isa
shap
eax
is,c
on
tras
tin
glo
ng
erw
ing
and
tail
wit
hsh
ort
erta
rsu
san
d/o
rsm
alle
rb
illm
easu
res
for
dif
fere
nt
win
ters
,an
dPC
3is
ash
ape
axis
con
tras
tin
gw
ing
len
gth
wit
hta
il
len
gth
and
shif
tsin
tars
us
and
culm
enw
idth
.Pro
po
rtio
no
fva
riat
ion
for
adu
lts:
PC1
31%
to34
%;P
C2
21%
to22
%;P
C3
14%
to15
%.I
nad
ult
s,PC
1re
pre
sen
tso
vera
llb
od
ysi
ze,
PC2
isa
shap
eax
isw
ith
incr
ease
dw
ing
and
tail
len
gth
con
tras
ted
wit
hd
ecre
ased
tars
us
and
or
culm
enle
ng
th,a
nd
PC3
isa
shap
eax
isb
ut
trai
tlo
adin
gs
and
dir
ecti
on
sva
ryac
ross
year
s.Su
bsc
rip
tn
ota
tio
nfo
rβ
and
γfo
llow
sFa
irb
airn
and
Prez
iosi
(199
6).
(A)
Win
ter
2000
Win
ter
2001
Win
ter
2002
All
win
ters
Tra
itβ
1γ
1β
1γ
1β
1γ
1β
1γ
1
PC1
0.09
±0.0
6#<
−0.0
1±0.
10−0
.13±
0.16
0.22
±0.2
1−0
.04±
0.08
−0.0
6±0.
140.
07±0
.05
0.06
±0.0
7PC
2−0
.04±
0.06
−0.0
4±0.
080.
15±0
.16
0.33
±0.2
2−0
.01±
0.08
0.06
±0.1
0−0
.08±
0.05
#0.
02±0
.05
PC3
−0.0
3±0.
060.
03±0
.09
−0.1
3±0.
16−0
.08±
0.27
−0.3
0±0.
25<
0.01
±0.0
70.
02±0
.05
0.01
±0.0
7
(B)
Win
ter
2000
Win
ter
2001
Win
ter
2002
All
win
ters
Tra
itβ
3γ
2β
3γ
2β
3γ
2β
3γ
2
PC1
0.09
±0.0
6#<
0.01
±0.1
0−0
.13±
0.16
0.18
±0.2
2−0
.04±
0.08
−0.0
4±0.
150.
07±0
.05
0.06
±0.0
7PC
2−0
.04±
0.06
−0.0
5±0.
080.
15±0
.16
0.31
±0.2
4−0
.01±
0.08
0.04
±0.1
0−0
.08±
0.05
#0.
01±0
.05
PC3
−0.0
3±0.
070.
02±0
.09
−0.1
3±0.
16−0
.12±
0.28
−0.1
0±0.
08<
0.01
±0.0
70.
02±0
.05
<−0
.01±
0.07
(C)
Yea
r1
Yea
r2
Yea
r3
Yea
r4
All
year
s
Tra
itβ
1γ
1β
1γ
1β
1γ
1β
1γ
1β
1γ
1
PC1
0.09
±0.0
5#−0
.08±
0.07
<0.
01±0
.05
0.02
±0.0
70.
07±0
.07
−0.2
0±0.
08∗
−0.0
2±0.
060.
03±0
.08
0.18
±0.1
6−0
.42±
0.22
#
PC2
−0.0
3±0.
05−0
.16±
0.08
∗−0
.01±
0.05
−0.1
2±0.
08−0
.01±
0.07
−0.0
1±0.
10<
−0.0
1±0.
060.
09±0
.10
−0.0
9±0.
16−0
.45±
0.24
#
PC3
<0.
01±0
.05
0.12
±0.0
70.
01±0
.05
−0.0
3±0.
07−0
.12±
0.07
0.06
±0.1
0−0
.01±
0.06
−0.0
9±0.
060.
11±0
.16
0.21
±0.2
3
(D)
Yea
r1
Yea
r2
Yea
r3
Yea
r4
All
year
s
Tra
itβ
3γ
2β
3γ
2β
3γ
2β
3γ
2β
1γ
1
PC1
0.09
±0.0
5#−0
.10±
0.07
<0.
01±0
.06
0.02
±0.0
70.
07±0
.07
−0.2
0±0.
09∗
−0.0
2±0.
060.
03±0
.08
0.18
±0.1
6−0
.45±
0.22
∗
PC2
−0.0
3±0.
05−0
.18±
0.08
∗−0
.01±
0.05
−0.1
2±0.
08−0
.01±
0.07
0.01
±0.0
9<
−0.0
1±0.
060.
13±0
.10
−0.0
9±0.
16−0
.52±
0.24
∗
PC3
<0.
01±0
.05
0.12
±0.0
70.
05±0
.05
−0.0
2±0.
07−0
.12±
0.07
0.09
±0.1
0−0
.01±
0.06
−0.1
2±0.
06#
0.11
±0.1
6−0
.25±
0.23
2 4 1 0 EVOLUTION SEPTEMBER 2008