4-1. Surface Hydrology Assessment (GRM).pdf - EPA WA
133
T: (+61 8) 9433 2222 F: (+61 8) 9433 2322 ABN: 97 107 493 292 A: 15 Harborne Street, Wembley, WA 6014 P: Po Box 442, Bayswater, WA 6933 Prepared for Calidus Resources Ltd Suite 12, 11 Ventnor Street WEST PERTH, WA, 6005 Report Distribution No. Copies 1 Calidus Resources Ltd (hard copy with electronic copy enclosed) 1 Groundwater Resource Management Pty Ltd Report J1827R01 Final 29 May 2019 HYDRO‐METEOROLOGICAL & SURFACE WATER MANAGEMENT STUDY WARRAWOONA GOLD PROJECT PRE‐FEASIBILITY STUDY
-
Upload
khangminh22 -
Category
Documents
-
view
3 -
download
0
Transcript of 4-1. Surface Hydrology Assessment (GRM).pdf - EPA WA

T: (+61 8) 9433 2222 F: (+61 8) 9433 2322 ABN: 97 107 493 292 A: 15 Harborne Street, Wembley, WA 6014
P: Po Box 442, Bayswater, WA 6933
Prepared for
Calidus Resources Ltd
Suite 12, 11 Ventnor Street
WEST PERTH, WA, 6005
Report Distribution
No. Copies
1 Calidus Resources Ltd (hard copy with electronic copy enclosed)
1 Groundwater Resource Management Pty Ltd
Report J1827R01 Final 29 May 2019
HYDRO‐METEOROLOGICAL & SURFACE WATER
MANAGEMENT STUDY
WARRAWOONA GOLD PROJECT
PRE‐FEASIBILITY STUDY

EXECUTIVE SUMMARY
J1827R01 Final 29 May 2019
i
Calidus Resources Limited (Calidus) proposes to develop their Warrawoona Gold Project (WGP),
located approximately 25 km southeast of Marble Bar in the Pilbara Region of Western Australia. The
project comprises several prospects, with the Klondyke and Copenhagen deposits the focus of the
current pre‐feasibility study (PFS).
The Klondyke deposit sits along the local surface and groundwater divide formed by the Warrawoona
Ridge and is proposed to be mined by open pit methods to a maximum depth of about 150 m along
an approximate 2 km strike length. The Copenhagen deposit is located about 9.5 km along strike to
the northwest of the Klondyke deposit and was mined previously by others. Calidus proposes to
develop a small open pit to about 50 m depth at Copenhagen. In addition an on‐site processing plant,
tailings storage facility, waste rock dump, accommodation village and other related infrastructure will
be constructed at the Klondyke deposit as part of the WGP.
Calidus engaged Groundwater Resource Management Pty Ltd (GRM) to undertake both the
groundwater and surface water studies for the Warrawoona PFS. This report presents the findings
from the hydro‐meteorological and surface water management study. Following an initial site visit,
these studies were completed using public domain climate and mapping data, along with Calidus’
topographical and preliminary mine planning information.
The key findings made as a result of the hydro‐meteorological study are as follows:
The regional climate is one of extremes and droughts and major floods can occur in the same
area within a few years of each other. The climate in this region is highly variable, both
spatially and temporally, and this can make hydrologic analysis and the design of water
management measures challenging.
Although situated in a semi‐arid region with mean annual rainfalls in the order of 360 mm,
significant short duration rainfall events can occur during the summer months when Tropical
cyclones and related low‐pressure systems cross the Pilbara coast. Such events have delivered
daily rainfall totals in excess of 330 mm locally.
The mean annual rainfalls for local rainfall stations range from about 310 to 400 mm, while
the median values range from some 280 to 375 mm. However, the Marble Bar Combined
station, located some 24 km northwest of the proposed site, remains open and has over 117
years of high quality annual data (99.3% complete) and its mean and median annual rainfalls
of 360 and 344 mm are recommended for use where relevant in the design of Project
infrastructure.
Tropical cyclones (TC) bring heavy rains to the Pilbara region and although erratic in nature,
occur relatively frequently and must therefore be considered in the design of infrastructure
and surface water management measures. An analysis of cyclone data for the last 48 years
shows that, on average, one cyclone will pass within 200 km of the WGP every one to two
years and approximately once every two to three years a cyclone will pass within 100 km of
the site. Ten cyclones were found to have passed within 50 km of the WGP site over the 48
year period analysed.
Locally the wettest day on record occurred on 7 March 2000 when 332 mm was recorded at
Bamboo Creek, located some 57 km northeast of the WGP. That rainfall was attributed to TC
Steve which was a very significant event, making landfall four times as it passed across the top
end of Australia, leaving in excess of $100 million of damage in its wake. Frequency analyses
EXECUTIVE SUMMARY
J1827R01 Final 29 May 2019
ii
show that the 332 mm rainfall total has an annual exceedance probability (AEP) in the order
of 0.33%. The local 1% AEP daily rainfall is estimated to be some 250 mm.
A point rainfall intensity‐frequency‐duration (IFD) relationship was developed for the WGP
using the updated dataset produced by the Bureau of Meteorology (BoM) in 2016. In
summary, the 1% AEP point rainfall intensities for 1, 3, 12, 24 and 72 hr duration events are
72.4, 35.3, 15.2, 9.6 and 3.9 mm/hr respectively, giving equivalent rainfall depths of
approximately 72, 106, 182, 231 and 280 mm. An estimate of the 72 hour duration probable
maximum precipitation (PMP) is in the order of 2,230 mm.
Average evaporation data for the Marble Bar station indicates that the WGP can expect a
mean annual pan evaporation of some 3,315 mm, approximately 65% to 70% of which can be
expected to evaporate from shallow freshwater ponds and dams on site.
A review of Marble Bar temperature data indicates that typically there are in the order of 105
days each year with daily maximum temperatures in excess of 40°C, approximately three
quarter of which will occur between October and January. Highest and lowest daily
temperatures of 49.2°C and 1.1°C have been recorded in January and June respectively.
Wind data for Port Hedland Airport indicates that easterly’s and south‐easterly’s predominate
in the morning, while north‐westerly’s and northerly’s prevail in the afternoon. Mean wind
speeds are typically between 20 to 25 km/h in the afternoon during summer and exceed
summer morning wind speeds which generally range between 14 and 18 km/h. Maximum
wind gusts in excess of 200 km/h have been recorded at Port Hedland Airport
The WGP site is situated along the Warrawoona Ridge which forms the local surface water
divide, with the Brockman Hay Cutting/Sandy/Camel Creek system located to the south of the
ridge and Brockman Creek to the north. The Brockman Hay Cutting/Sandy/Camel Creek
system reports directly to the Coongan River approximately 20 km west of the WGP site with
a combined upstream catchment area of some 502.1 km2. The Brockman Creek reports to the
Talga River about 35 km to the north of the site with an upstream catchment area of
approximately 396.8 km2, which continues for a further some 20 km before also discharging
into the Coongan River. The Coongan River reports to the De Grey River about 100 km north
of the WGP which continues in a north‐westerly direction for approximately 80 km before
ultimately emptying into the Indian Ocean at Poissonnier Point, northeast of Port Hedland.
The WGP and the Brockman Hay Cutting/Sandy/Camel Creek system and Brockman Creek are
located centrally within DWER’s Coongan River Catchment (area = 7,080 km2), which itself is
situated in the mid‐part of the much larger De Grey River Basin (area = 56,800 km2). Although
located within the Pilbara Surface Water Area, inspection of the DWER Spatial database
indicates that neither of the creek systems in the vicinity of the WGP intersects any proclaimed
Surface Water Management Area or Irrigation Area. Inspection of the 1:250,000 scale
topographical mapping indicates that there are no permanent pools within the Hay
Cutting/Sandy/Camel Creek system or Brockman Creek catchments.
While there is a sparsity of flow gauging data across the region, the Coongan River and both
the creek systems in the vicinity of the WGP are typical of rivers in the Pilbara in that they are
ephemeral and only carry runoff following significant rainfall events. Typically over three
quarters of the annual streamflow occurs during January, February and March with local rivers
usually drying up around July or August.
EXECUTIVE SUMMARY
J1827R01 Final 29 May 2019
iii
The closest flow gauging station is located on the Coongan River at Marble Bar approximately
25 km northwest of the WGP site. This station has an upstream catchment area of about
3,735 km2 and remains open, having been commissioned in late 1966. Data for this station
indicates that annual and monthly flows are highly variable with a several order of magnitude
increase between minimum and maximum values. The Coongan River median annual flow at
Marble Bar is in the order of 144 GL/year which represents an average annual runoff yield of
about 11%. The highest instantaneous flow of 2,529 m3/s was recorded at Marble Bar on 16
December 1998 following heavy rainfalls earlier in the month, when a two‐day rainfall total
of 239 mm was recorded.
The key findings made as a result of the surface water management study are as follows:
There are several relatively minor ephemeral watercourses and drainage lines that cross the
WGP site on the south side of the Warrawoona Ridge which align in a roughly northeast to
southwest direction, the most significant of which are Brockman Hay Cutting Creek and Sandy
Creek with catchment areas of some 46.5 and 199.2 km2 respectively, recorded upstream of
their confluences with Camel Creek (these areas represent some 0.7% and 2.8% of the total
Coongan River catchment area respectively).
Given that the majority of the proposed mining areas are situated within the Warrawoona
Ridge with some 80 m relief and in the headwaters of both the Brockman Hay Cutting Creek
and Sandy Creek, the catchment areas upstream of the proposed project facilities are very
limited and impacts on the hydrological regime downstream are expected to be minimal.
Consequently flood protection and surface water management measures required for the
WGP will be relatively modest.
A preliminary quantitative assessment of potential impacts indicates that runoff from
approximately 2.3% and 0.2% of the Brockman Hay Cutting Creek and Sandy Creek catchment
areas will be “lost” to downstream catchments. The combined area is in the order of 1.43
km2, which represents approximately 0.02% of the total Coongan River catchment area. Post‐
mining runoff volumes that will report downstream from Brockman Hay Cutting Creek and
Sandy Creek catchment areas is estimated to be about 97.7% and 99.8% of the pre‐mining
volume respectively for the same rainfall event.
A number of bat roosting areas have been identified (by others) within historical underground
workings in the vicinity of the proposed Klondyke mining area. Of the thirteen historical
workings closest to the proposed Klondyke mining area, eight are situated between 5 and 9
m above the proposed ultimate tailings beach elevation and no potential flooding risks are
anticipated, while the remaining five are all located outside the proposed TSF catchment area
and no modifications to the local hydrological regime are envisaged.
It is recommended that a 1% AEP event be adopted for the design of all open pit protection
and TSF surface water management measures during Operations. A minimum 10% AEP
criterion is considered appropriate for the design of all other surface water management
measures during Operations.
Pit flood protection works will comprise the following:

EXECUTIVE SUMMARY
J1827R01 Final 29 May 2019
iv
o Copenhagen Pit – a combination of a strategically placed waste rock dump and diversion
channel will be used to ameliorate the potential risk of runoff from an approximately 2.2
km2 upstream catchment area; and,
o Klondyke, St George East and West and Copenhagen Pits ‐ flood protection will be
provided to all the proposed pits by a combination of the following measures:
Waste rock dumps strategically placed along the upstream side of all pits where
possible;
Sections of rock‐armoured flood protection bund/diversion drain placed around pit
crests where practicable (bunds will be offset sufficiently far from pit crests to also
serve as Abandonment Bunds as required);
Pit crest/safety bund placed as close as geotechnically possible to pit crest to minimise
runoff from areas adjacent to pit crests;
“Roll‐over” at the top of pit ramps; and,
Ex‐pit roadside drains to direct runoff away from the pits.
An estimate of in‐pit runoff volume resulting from rainfall within the various pit crests ranges
between some 114,300 and 5,500 m3 for the Klondyke and Copenhagen Pits respectively for
the 1% AEP‐72 hour duration event. It is envisaged that mobile pumps will be used
periodically to remove in‐pit run‐off, with pumpage delivered either ex‐pit or possibly to an
adjoining, non‐active pit. If underground mining activities are planned in the future the
provision of appropriately design in‐pit sumps and fixed pumping infrastructure should be
considered.
Surface water management during Operations will include (but not be limited to) the
following measures:
o Process Plant Area – runoff within wet processing areas will be collected within bunded
areas and returned to the process. Alternatively, if of acceptable quality, such water may
be used for dust suppression within the process area.
o Mine Services Area/Workshops Area ‐ surface water runoff and wash‐down water will be
captured in open drains which report to a Water Management/Sedimentation Pond(s)
for temporary storage prior to reuse. Drains in areas potentially impacted by
hydrocarbons, e.g. fuel storage and dispensing areas, truck wash, workshops etc. will first
report to an oily water separator (OWS).
o Hazardous Materials Storage Areas‐ All chemical, oil and other hazardous material
storage areas within the Plant or Mine Services/Workshop Area will be enclosed within
bunds in accordance with the relevant codes and standards. Water collected within the
bunds will be assessed and, if suitable, will be discharged to a Water
Management/Sedimentation Pond(s), or alternatively, if found to be impacted, will be
disposed of appropriately.
o Disturbed Areas ‐ Source controls will be deployed within pits, waste rock dumps, topsoil
stockpiles, ROM, TSF and access and haul roads in order to improve runoff quality. Runoff
from such facilities will be directed to Sedimentation Traps and Ponds where practical to
ensure that water reporting off‐site satisfies Total Suspended Sediment requirements.
Source controls within pits will comprise practices such as mining from upper benches or
processing stockpiled material following significant rainfall events. In‐pit sumps will be

EXECUTIVE SUMMARY
J1827R01 Final 29 May 2019
v
used to settle out sediment from collected runoff prior to pumping to surface for re‐use
or discharge off‐site.
All dump tops and upper surfaces will be back‐graded and/or edge bunding used to
ensure positive drainage and to prevent runoff from reporting over dump crests and
eroding dump slopes. Intermediate benches on dumps will be back‐graded to break up
long slope lengths and longitudinal grades will be used on benches to direct runoff either
off the dump or to rock‐armoured chutes and drains.
Run‐off from disturbed and undisturbed catchment areas upstream of the TSF will report
to the reclaim pond where it will be temporarily stored before being returned to the Plant
for re‐use. The TSF will function as a “zero‐discharge” facility during Operations and
sufficient freeboard will be provided on the embankment to store runoff from upstream
areas in addition to the tailings impoundment for the 1% AEP‐72 hour duration event
(280 mm).
o Undisturbed Areas ‐ All practical steps will be taken to divert runoff from undisturbed
catchment areas around all proposed mine facilities to minimise potential lowering of
water quality. Diversion channels around mining areas will be designed for the 1% AEP
event or for the 10% AEP event for diversions around less sensitive facilities. Flow
velocities along all diversion channels will be limited to minimise erosion and the
generation of sediment.
Surface water management at Closure will include the diversion of runoff from undisturbed
areas around remnant mining facilities, while maximising runoff from disturbed catchment
areas that can be directed in‐pit. All dump tops and upper surfaces will be graded in order to
promote infiltration where possible. An engineered spillway will be constructed on the
abutment of the TSF embankment and will be designed to safely pass the peak of the PMF
event.
The design of Operational and Closure flood protection and surface water management
measures will be developed further at the Feasibility Study (FS) stage of the WGP.
J1827R01 Final 29 May 2019
vi
GLOSSARY OF HYDROLOGICAL TERMS
Annual Exceedance Probability (AEP)
The probability that a given rainfall total accumulated over a given duration will be exceeded in any one year.
Antecedent Soil Moisture
Water present in the soil prior to a rainfall event.
Average Recurrence Interval (ARI)
The average or expected value of the periods between exceedances of a given rainfall total accumulated over a given duration. It is implicit in this definition that the periods between exceedances are generally random.
Australian Rainfall and Runoff (ARR)
National guideline document, data and software suite that can be used for the estimation of design flood characteristics in Australia. Currently in its 4th edition it is commonly referred to as ARR2016.
Australian Hydrological Geospatial Fabric (AHGF)
The Australian Hydrological Geospatial Fabric (Geofabric) is a specialised Geographic Information System (GIS). It identifies and registers the spatial relationships between important hydrological features such as watercourses, water bodies, canals, aquifers, monitoring points and catchments
Backwater Water backed‐up or retarded in its course as compared with its normal or natural condition of flow
Baseflow The component of streamflow supplied by groundwater discharge
Basin A tract of country, generally larger catchment areas, drained by a river and its tributaries.
Catchment The land area draining to a point of interest, such as a water storage or monitoring site on a watercourse.
Channel An artificial or constructed waterway designed to convey water. Often described as open channels to distinguish them from pipes.
Control Physical properties of a cross‐section or a reach of an open channel, either natural or artificial that govern the relation between stage and discharge at a location in the open channel.
Dead Storage In a water storage, the volume of water stored below the level of the lowest outlet (the minimum supply level). This water cannot be accessed under normal operating conditions.
Discharge Volume of liquid flowing through a cross‐section in a unit time.
Drainage Division Representation of the catchments of the 12‐major surface water drainage systems across Australia, generally comprising a number of river basins.
Endorheic Basin A closed surface water drainage basin that retains water and has no outflow to the sea.
Environmental Flow The streamflow required to maintain appropriate environmental conditions in a waterway or water body.
Ephemeral Something which only lasts for a short time. Typically used to describe rivers, lakes and wetlands that are intermittently dry.
Evapotranspiration (ET) The sum of evaporation and plant transpiration from the earth’s land surface to the atmosphere.
Evaporation A process that occurs at a liquid surface, resulting in a change of state from liquid to vapour.
Floodplain Flat or nearly flat land adjacent to a stream or river that experiences occasional or periodic flooding
Full Supply Level (FSL) The normal maximum operating water level of a water storage when not affected by floods. This water level corresponds to 100% capacity.

GLOSSARY OF HYDROLOGICAL TERMS
J1827R01 Final 29 May 2019
vii
Generalised Short‐Duration Method (GSDM)
Appropriate for estimating probable maximum precipitation for durations up to six hours and for an area of less than 1000 square kilometres.
Generalised Tropical Storm Method – Revised (GTSMR)
Appropriate for estimating probable maximum precipitation in regions of Australia affected by tropical storms.
Intensity‐Frequency‐Duration (IFD)
Design rainfall intensities (mm/h) or design rainfall depths (mm) corresponding to selected standard probabilities, based on the statistical analysis of historical rainfall.
Minimum Supply Level (MSL)
The lowest water level to which a water storage can be drawn down (0% full) with existing outlet infrastructure; typically, equal to the level of the lowest outlet, the lower limit of accessible storage capacity.
Precipitation All forms in which water falls on the land surface and open water bodies as rain, sleet, snow, hail, or drizzle.
Probable Maximum Flood (PMF)
The PMF is the largest flood that could conceivably occur at a particular location, usually estimated from probable maximum precipitation (PMP, and coupled with the worst flood producing catchment conditions.
Probable Maximum Precipitation (PMP)
The theoretically greatest depth of precipitation for a given duration under modern meteorological conditions for a given size storm area at a particular location at a particular time of the year, with no allowance made for long‐term climatic trends.
Rainfall The total liquid product of precipitation or condensation from the atmosphere, as received and measured in a rain gauge
Riparian An area or zone within or along the banks of a stream or adjacent to a watercourse or wetland; relating to a riverbank and its environment, particularly to the vegetation.
Stage The water level, typically measured at a water monitoring site
Storage A pond, lake or basin, whether natural or artificial, for the storage, regulation and control of water.
Surface Runoff Water from precipitation or other sources that flows over the land surface. Surface runoff is the fraction of precipitation that does not infiltrate at the land surface and may be retained at the surface or result in overland flow toward depressions, streams and other surface water bodies
Sustainable Yield The level of water extraction from a particular system that would compromise key environmental assets, or ecosystem functions and the productive base of the resource, if it were exceeded.
Total Suspended Solids (TSS)
The sum of all particulate material suspended (i.e. not dissolved) in water. Usually expressed in terms of milligrams per litre (mg/L). It can be measured by filtering and comparing the filter weight before and after filtration.
Transpiration Evaporative loss of water from the leaves of plants through the stomata; the flow of water through plants from soil to atmosphere.
Watercourse A river, creek or other natural watercourse (whether modified or not) in which water is contained or flows (whether permanently or from time to time).
Wind Run The product of the average wind speed and the period over which that average speed was measured
Ref: Australian Water Information Dictionary, Bureau of Meteorology, Commonwealth of Australia 2017
(http://www.bom.gov.au/water/awid/all.shtml)
J1827R01 Final 29 May 2019
viii
TABLE OF CONTENTS
1.0 INTRODUCTION ........................................................................................................................... 1
2.0 DESKTOP HYDRO‐METEOROLOGICAL STUDY ............................................................................. 2
2.1 Data Sources ....................................................................................... 2
2.1.1 Bureau of Meteorology (BoM) Data: .................................................. 2
2.1.2 Department of Water (DoW): ............................................................. 4
2.1.3 Department of Agriculture: ................................................................ 4
2.1.4 Mapping Data ..................................................................................... 4
2.2 Desktop Study Findings ....................................................................... 4
2.2.1 General Location ................................................................................. 4
2.3 Meteorological Conditions ................................................................. 5
2.3.1 General ............................................................................................... 5
2.3.2 Regional Rainfall ................................................................................. 6
2.3.3 Local Rainfall ....................................................................................... 6
2.3.4 Evaporation ....................................................................................... 15
2.3.5 Temperature ..................................................................................... 16
2.3.6 Wind Speed and Direction ................................................................ 17
2.4 Hydrological Conditions .................................................................... 18
2.4.1 General ............................................................................................. 18
2.4.2 Review of Existing Data ..................................................................... 19
3.0 HYDROLOGICAL ASSESSMENT................................................................................................... 23
3.1 Catchment Delineation & Runoff Volume Estimation ...................... 23
3.1.1 Existing Pre‐Mining Catchment Delineation ..................................... 23
3.2 Proposed Post‐Mining Catchment Delineation ................................ 23
3.2.1 Proposed Mining Area Catchment Runoff Volume Estimates .......... 27
4.0 SURFACE WATER MANAGEMENT ............................................................................................. 30
4.1 Surface Water Management Objectives ........................................... 30
4.2 Hydrological Risk ............................................................................... 31
4.3 Pit Flood Protection .......................................................................... 32
4.4 In‐Pit Runoff Volume Estimate ......................................................... 32
4.5 Site Wide Surface Water Management ............................................ 33
4.5.1 Process Plant Area ............................................................................ 34
4.5.2 Mine Services/Workshops Area ........................................................ 34
4.5.3 Hazardous Materials Storage Areas .................................................. 34
J1827R01 Final 29 May 2019
ix
4.5.4 Disturbed Areas ................................................................................ 34
4.5.5 Undisturbed Areas ............................................................................ 35
4.5.6 Bat Roosting Areas ............................................................................ 35
4.6 Drainage and Sediment Control Design Criteria ............................... 36
4.6.1 Peak Flow Estimation ........................................................................ 36
4.6.2 Channel Design ................................................................................. 37
4.6.3 Drainage Design ................................................................................ 38
4.6.4 Water Management/Sedimentation Pond Design ........................... 38
4.6.5 Oily Water Separator Design ............................................................ 39
4.7 Closure Surface Water Management ............................................... 39
4.7.1 Ex‐pit Undisturbed Areas .................................................................. 39
4.7.2 Ex‐pit Disturbed Areas ...................................................................... 39
5.0 PFS ENGINEERING Design ......................................................................................................... 40
5.1 Copenhagen Pit/Northeast Creek Diversion ..................................... 40
5.1.1 General ............................................................................................. 40
5.1.2 Hydrological Analysis ........................................................................ 40
5.1.3 Hydraulic Design ............................................................................... 40
5.2 WRD Drainage Measures .................................................................. 41
5.3 Mine Access Road Floodways ........................................................... 42
5.4 Plant Access Road Drainage Measures ............................................. 44
5.5 Klondyke Plant/Raised Access Road Sedimentation Pond ......... Error!
Bookmark not defined.
5.6 Pit Flood Protection Bunds ............................................................... 44
6.0 CONCLUSION & RECOMMENDATIONS ..................................................................................... 46
TABLES
Table 1 Climate Summaries for Regional BoM Stations 2
Table 2 Daily Rainfall Records for Local BoM Stations 2
Table 3 Flow Data Records for DoW Gauging Stations 3
Table 4 Local Rainfall Stations Annual Rainfall 5
Table 5 Local Rainfall Stations Annual Rain Days and Duration without Rain 6
Table 6 Marble Bar Combined Monthly Rainfall 8
Table 7 Local Rainfall Stations Maximum Monthly Rainfall 9
Table 8 Rainfall Duration Frequency Analysis for Marble Bar Combined 9
Table 9 Maximum Daily Rainfall 10
Table 10 Local Stations Maximum Two, Three and Seven Day Rainfalls 11
Table 11 Regional Stations Maximum Recorded Six & Sixty‐Minute Rainfall Intensity 11
J1827R01 Final 29 May 2019
x
Table 12 WGP Point Rainfall IFD Relationship 12
Table 13 Combined GSDM & GTSMR PMP Rainfall Depth Estimates 13
Table 14 Mean Monthly Pan Evaporation 14
Table 15 Monthly Temperature Data for Marble Bar Comparison Station 15
Table 16 Mean Monthly 9 am and 3 pm Wind Speed and Maximum Wind Gusts for Port Hedland Airport Station
16
Table 17 Total Annual Flow and Annual Maximum Daily Flow at Marble Bar, Coolenar Pool and North Pole Mine for Water Years 1967/1968 to 2017/18
18
Table 18 Monthly Flow Parameters (ML) for Marble Bar, Coolenar Pool and North Pole Mine DoW Flow Monitoring Stations
20
Table 19 Existing Pre‐Mining Catchment Areas 21
Table 20 Proposed Post‐Mining Catchment Areas 22
Table 21 Runoff Coefficients for Mine Site Catchments 25
Table 22 Existing Pre‐Mining Catchment Runoff Volume Estimates 25
Table 23 Proposed Post‐Mining Catchment Runoff Volume Estimates 27
Table 24 Percentage Probability of N‐Year AEP Flood Event Occurring During 10, 20 and 30 Year Operational Periods
29
Table 25 In‐Pit Rainfall‐Runoff Volume Estimates 31
Table 26 Bat Roosts in Vicinity of Proposed Klondyke Mining Area Facilities 34
Table 27 Run‐off Coefficients 34
Table 28 Roughness Coefficients 35
Table 29 Northeast Creek Upstream of Copenhagen ‐ Peak Flow Estimates 38
Table 30 Copenhagen Pit/Northeast Creek Diversion Channel Preliminary Design Parameters
39
Table 31 Summary of Mine Access Road Upstream Catchments & Peak Flow Estimates 41
Table 32 Mine Access Road Floodway Widths 41
FIGURES
Figure 1 Warrawoona Gold Project Location Plan with Regional BoM Synoptic Stations
Figure 2 Warrawoona Gold Project Location Plan with Local BoM Rainfall Stations
Figure 3 Warrawoona Gold Project Regional Catchment Delineation and DWER Gauging Stations
Figure 4 Warrawoona Gold Project Local Catchment Delineation
Figure 5 Warrawoona Gold Project Site Wide Catchment Delineation
Figure 6 Warrawoona Gold Project Bat Roosting Locations over Local Catchment Delineation
Figure 7 Warrawoona Gold Project Bat Roosting Areas in Vicinity of Project
Figure 8 Warrawoona Gold Project Copenhagen Mining Area Northeast Creek Catchment Delineation
Figure 9 Warrawoona Gold Project Copenhagen Pit/Northeast Creek Diversion Channel Preliminary Design
Figure 10 Warrawoona Gold Project Mine access Road Preliminary Floodway Design
J1827R01 Final 29 May 2019
xi
APPENDICES
Appendix A Hydro‐Meteorological Summary Data
Appendix B Warrawoona Rainfall Intensity‐Duration‐Frequency Relationship
Appendix C Cyclone Path Analysis
Appendix D Probable Maximum Precipitation Estimate
Appendix E Pre & Post‐Mining Catchment Delineation
Appendix F Water Management Calculations
DRAWINGS
J1827R01‐D01 Warrawoona Gold Project – Existing Pre‐Mining Catchment Delineation
J1827R01‐D02 Warrawoona Gold Project – Proposed Post‐Mining Catchment Delineation
J1827R01 Final 29 May 2019
1
1.0 INTRODUCTION Calidus Resources Limited (Calidus) proposes to develop their Warrawoona Gold Project (WGP),
located approximately 25 km southeast of Marble Bar in the Pilbara Region of Western Australia (see
Figure 1). The project comprises several prospects, with the Klondyke and Copenhagen deposits the
focus of the current pre‐feasibility study (PFS).
The Klondyke deposit sits along the local surface and groundwater divide formed by the Warrawoona
Ridge and is proposed to be mined by open pit methods to a maximum depth of about 150 m along
an approximate 2 km strike length. The Copenhagen deposit is located about 9.5 km along strike to
the northwest of the Klondyke deposit and was mined previously by others. Calidus proposes to
develop a small open pit to about 50 m depth at Copenhagen. In addition an on‐site processing plant,
tailings storage facility, waste rock dump, accommodation village and other related infrastructure will
be constructed at Klondyke deposit as part of the WGP.
Calidus engaged Groundwater Resource Management Pty Ltd (GRM) to undertake both the surface
and groundwater studies for the Warrawoona PFS. This report presents the findings from the
hydrological/meteorological desktop study, along with pre‐feasibility engineering designs of the
necessary surface water management measures required to protect the proposed mine and
associated facilities.
The scope of work comprised the following surface water tasks:
Hydrological/meteorological desktop study ‐ completed using data obtained from the relevant
government bodies and mapping information provided by Calidus.
Site Visit ‐ findings from a two‐day visit to site in September 2018.
Floodwater management ‐ hydrologic and hydraulic analyses.
Surface water and sediment management ‐ philosophy and design criteria.
Pre‐Feasibility level design of water management measures ‐ described in the report and
presented on preliminary engineering drawings.
The desktop hydro‐meteorological study is presented in the following section. The hydrological
assessment of the local catchment areas is presented in Section 3.0 and the design philosophy for
floodwater and surface water management measures is presented in Section 4.0. PFS level
engineering designs for those measures are then presented in Section 5.0.
The hydrologic and hydraulic calculations required as part of this study have been presented in the
Appendices. The accompanying drawings have been completed to a level suitable for inclusion in the
project PFS and will form part of the future FS level design of the project.

J1827R01 Final 29 May 2019
2.0 DESKTOP HYDRO‐METEOROLOGICAL STUDY
2.1 DATA SOURCES No on‐site rainfall or steamflow data were available for the proposed Project site. The hydrological
desktop study therefore made use of available local and regional data from the following sources:
2.1.1 Bureau of Meteorology (BoM) Data: The following BoM data were obtained and used in the completion of the desktop study, as shown in
Figures 1 and 2 (all stations are currently open unless noted otherwise):
Table 1: Climate Summaries for Regional BoM Stations
BoM Station Name Station No.
Data Periodnote 1 Distance from
Site
Marble Bar 04106 2000‐2018 23.5 km NW
Marble Bar Comparisonnote2 04020 1895‐2006 23.5 km NW
Nullagineclosed 04027 1897‐2004 64.5 km SE
Redmontclosed 04043 1925 ‐ 2012 117 km SW
Port Hedland Airport 04032 1942‐2018 170 km NW
Wittenoom 05026 1949 ‐ 2018 190 km SW
Telfer Aero 13030 1974‐2018 245 km SE Note 1: Data period varies depending on climate parameter.
Note 2: “Marble Bar Combined” comprises Marble Bar Comparison (No. 04020) 1 Feb 1907 to 31 Aug 2006 and Marble Bar (No. 04106) 1
Sep 2006 to 31 Jul 2018. Marble Bar Comparison was closed on 31 Aug 2006, while Marble Bar was opened on 1 May 2001 and remains
open.
Table 2: Daily Rainfall Records for Local BoM Stations
BoM Station Name Station No.
Data Period % Complete2
Distance from Site
Mount Edgarclosed 04021 1‐Apr‐1907 ‐ 31‐Dec‐1978 99.3 17 km E
Marble Bar Combinednote 1
04020 & 04106
1‐Feb‐1901 ‐ 31‐Jul‐2018 99.3 23.5 km NW
Bamboo Creek 04004 1‐Jan‐1907 ‐ 30‐Apr‐2018 77.5 56.5 km NE
Nullagineclosed 04027 1‐Jan‐1907 ‐ 31‐Mar‐2004
89.7 64.5 km SE
Hillside Station 04015 1‐Jan‐1917 ‐ 31‐May‐2018
77.4 66.5 km SW
Bonney Downs 04006 1‐Jan‐1907 ‐ 31‐May‐2018
97.0 93.5 km S
Note 1: Marble Bar Combined comprises two records: Marble Bar Comparison (Sta. No. 04020) from 1 Feb 1901 to 31 Aug 2006 (99.9 %
complete) and Marble Bar (Sta. No. 04106) from 1 Sep 2006 to 31 Jul 2018 (94.0% complete).
Note 2: % Complete = No. of Daily Observations ÷ (End Date of Record ‐ Start Date of Record)
Regional and local catchment boundary information was extracted from the BoM Australian
Hydrological Geospatial Fabric (V 2.1, February 2013) as necessary.

DESKTOP HYDRO‐METEOROLOGICAL STUDY
J1827R01 Final 29 May 2019
3
The BoM’s swept path data sets for Australian cyclones from 1969/1970 to 2017/2018 cyclone seasons
(http://www.bom.gov.au/cyclone/history/tracks/index.shtml) were also used in the study.
DESKTOP HYDRO‐METEOROLOGICAL STUDY
J1827R01 Final 29 May 2019
4
2.1.2 Department of Water (DoW): The following DoW data were obtained and used in the completion of the desktop study:
Table 3: Flow Data Records for DoW Gauging Stations
DoW Site Name Site No. Data Period Distance from Site
Marble Bar (Coongan River) 710204 Dec 1966 – Feb 2019 25 km NW
North Pole Mine (Shaw River) 710229 Feb 1967 – Feb 2019 66 km NW
Coolenar Pool (De Grey River) 710003 Nov 1974 – Feb 2019 132 km NW
2.1.3 Department of Agriculture: Data presented in the Department’s Evaporation Data for Western Australia, Resource Management
Technical Report No. 65, October 1987.
2.1.4 Mapping Data The following mapping data were used in the completion of the desktop study:
1:250,000 scale electronic topographic data for Marble Bar (SF 50‐08) and Nullagine (SF 51‐
05) map sheets.
1 m Digital Surface Model captured October 2018.
ESRI World Imagery.
Hydro Enforced 1‐Second SRTM DEM from Geoscience Australia.
ASTER Global DEM (V2) Worldwide Elevation Data.
Preliminary mine infrastructure layout provided by Calidus in April 2019.
2.2 DESKTOP STUDY FINDINGS
2.2.1 General Location The WGP site lies approximately 5 km east of the Corunna Downs Road some 25 km southeast of
Marble Bar within the Shire of East Pilbara, Western Australia (see Figure 1). The Klondyke deposit is
centred about approximate grid location 800,500 m E and 7,637,500 m N (UTM Zone 50) and the
Copenhagen mining area about 791,800 m E and 7,641,5000 m N (UTM Zone 50).
The WGP site is situated along the Warrawoona Ridge which forms the local surface water divide. The
Brockman Hay Cutting/Sandy/Camel Creek system is located to the south of the ridge, while Brockman
Creek is located to the north. The former creek system reports directly to the Coongan River some 20
km west of the WGP site, while the latter creek empties into the Talga River about 35 km to the north
of the site which carries on for some 20 km before reporting to the Coongan River. The Coongan River
continues in a northerly direction for approximately 48 km before discharging into the De Grey River
which discharges into the Indian Ocean at Poissonnier Point some 70 km northeast of Port Hedland.
Given that the WGP is situated within the Warrawoona Ridge there will be very limited catchment
areas upstream of the proposed mining areas. However, there are several relatively minor creeks or

DESKTOP HYDRO‐METEOROLOGICAL STUDY
J1827R01 Final 29 May 2019
5
watercourses that cross the Project site on the south side of the ridge in a roughly northeast to
southwest direction including Brockman Hay Cutting Creek and Sandy Creek, both of which report to
Camel Creek. All of the creeks or watercourses in the immediate vicinity of the Project site are
ephemeral and only carry runoff following significant rainfall events. Inspection of the 1:250,000 scale
mapping indicates that there are no permanent pools within the Brockman Hay Cutting/Sandy/Camel
Creek system or Brockman Creek catchments.
The topography of the WGP site is directly related to the ridge that it is situated within. This ridge
provides in the order of 80 m relief with ground elevations rising from about 250 mAHD on the plains
on either side of the ridge to about 330 mAHD at the highest point in the immediate vicinity of the
proposed Klondyke mining area.
2.3 METEOROLOGICAL CONDITIONS
2.3.1 General The Pilbara climate is one of extremes, with severe droughts and major floods occurring in the same
area within a few years of each other. The climate in this region is highly variable, both spatially and
temporally, and this can make hydrologic analysis and the design of water management facilities
difficult.
Climatic conditions in the Pilbara are dominated, to a greater degree than in any other part of Western
Australia, by tropical cyclones; and the coastal region between Broome and Karratha is considered the
most cyclone‐prone region of Australia1. Cyclones occur in all summer months, but predominantly in
January to March and normally form over the Indian Ocean between northern Australia and Indonesia.
They typically adopt a south‐westerly course parallel to the Pilbara coast as far as the North West
Cape, before continuing south. In the majority of cases cyclones will change direction towards the
southeast, crossing the coast and bringing heavy rainfall to the arid interior, while gradually
weakening. This change in direction, while parallel to the Pilbara coast, is the most likely means of
generating high intensity rainfall in the vicinity of the Project site, causing runoff to report to local
watercourses. On occasion runoff flows may be high, particularly in Hay Cutting Creek and other on‐
site watercourses and diversion and flood protection measures will be required around the proposed
mine facilities.
Alternatively, prolonged periods without significant rainfall or runoff can and frequently do occur in
the Pilbara. For example, the Shaw River at the North Pole Mine station located some 66 km
northwest of the WGP drains a catchment area in excess of 6,500 km2 and has recorded no flow for
periods in excess of 28 months. Given the spatial variability of the region’s cyclonic rainfall it is likely
that the duration of no‐flow periods on rivers and creeks draining smaller areas could be considerably
longer. Therefore, any proposed project use of surface water drawn directly from local watercourses
would be limited to opportunistic use only. If required, any impounding water supply dams would
have to be designed for multi‐year drought conditions. It is highly unlikely therefore that a surface
water impoundment could be built in the vicinity of the site that could reliably supply the Project’s
entire water supply needs. At best, some form of seasonal runoff harvesting may be worthy of further
1 Ruprecht, J.K. and Ivansecu, S. (1996). Surface Hydrology of the Pilbara Region. Water and Rivers Commission.

DESKTOP HYDRO‐METEOROLOGICAL STUDY
J1827R01 Final 29 May 2019
6
investigation. Neither surface impounding nor runoff harvesting water supply sources have been
considered as part of this study.
2.3.2 Regional Rainfall The Pilbara region is semi‐arid2 with the mean annual rainfall varying from approximately 460 mm at
Wittenoom to 315 mm at Port Hedland (see Figure 1 for location of regional climate stations). The
Pilbara becomes progressively wetter towards the northeast, with rainfall occurring mainly in the
summer months, giving maxima from January to March as a result of tropical cyclones and related
low‐pressure events. There is almost no rainfall between July and October in the northeast Pilbara.
In the southern and western parts of the Pilbara, around Onslow, not only is the average annual rainfall
lower, but winter rains from the southwest are also a feature. This winter rainfall is usually due to
low‐pressure trough systems acting in conjunction with the northern component of large southerly
frontal systems. This can lead to two rainfall maxima in the year, one in summer and the other in
winter.
2.3.3 Local Rainfall In order to analyse rainfall conditions local to the Project site daily rainfall data were obtained for six
BoM rainfall stations, all of which fall within a 100 km radius of the site (see Figure 2). Rainfall data
and summary charts are presented in Appendix A.
Annual Rainfall Table 4 gives the maximum, minimum, mean and median annual rainfall for the local rainfall stations
considered in the desktop review, while Table 5 gives the minimum, maximum and mean number of
rain days per year and maximum duration without rain.
Table 4: Local Rainfall Stations Annual Rainfall
Station Namesee note Maximum Annual
Rainfall (mm)
Minimum Annual
Rainfall (mm)
Mean Annual Rainfall (mm)
Median Annual Rainfall (mm)
No. of Complete Years
Mount Edgarclosed 669.8 (1917) 22.3 (1924) 312.5 300.0 67
Marble Bar Combined 797.9 (1980) 71.1 (1924) 359.8 343.8 108
Bamboo Creek 1,156.8 (2000) 84.9 (1944) 401.4 373.9 59
Nullagineclosed 693.0 (1942) 45.3 (1924) 322.0 337.2 85
Hillside Station 1,049.8 (2000) 23.6 (1924) 356.8 333.2 62
Bonney Downs 823.9 (2000) 46.8 (1944) 323.8 282.9 97 Note: Annual Rainfall values above calculated using complete years of data only.
2 In the temperate zones of Australia the classification of arid generally refers to areas with a mean annual rainfall of less than 250 mm.

DESKTOP HYDRO‐METEOROLOGICAL STUDY
J1827R01 Final 29 May 2019
7
Table 5: Local Rainfall Stations Annual Rain Days and Duration without Rain
Station Namesee note
No. of Rain Days per Year Periods Without Rain
Min. Max. Mean Maximum Duration
From To
Mount Edgarclosed 7 53 29.7 254 20 Feb 1962 1 Nov 1962
Marble Bar Combined 12 67 36.8 217 7 Apr 1934 10 Nov 1934
Bamboo Creek 9 63 32.6 297 23 Jan 1940 15 Nov 1940
Nullagineclosed 12 64 34.1 211 20 Mar 1935 5 Nov 1935
Hillside Station 5 58 29.5 292 28 Mar 2007 14 Jan 2008
Bonney Downs 4 65 29.9 257 17 Apr 1961 30 Dec 1961 Note: All Annual Rainfall values above calculated using complete years of data only.
It should be noted that, following checks for meteorological similarity3, the Marble Bar Comparison
(No. 04020) and Marble Bar (No. 04106) records were combined to give a daily rainfall record spanning
over 117 years. The combined record is therefore referred to as “Marble Bar Combined” in this report.
In addition, two of other the stations are currently closed i.e. Mount Edgar and Nullagine. However,
given their proximity to the WGP site and the length and high quality of their records, their inclusion
in the desktop study was considered beneficial.
It should also be noted that only full or complete years of data were used in the daily rainfall data
analyses. This meant that length of some of the data sets was reduced in order to remove incomplete
years.
All the annual rainfall data demonstrated right‐hand or positive skewness typical of the region,
particularly data for stations with 50 years or more gap‐free data4. Median annual rainfall was
therefore calculated (in addition to mean values) as it is generally considered to be a more
representative reflection of rainfall central tendency for areas with skewed rainfall data. This is the
case in the Pilbara where exposure to a few, or even a single, cyclonic rainfall event can have a
disproportionate effect on the mean, but has much less effect on the median, given that it is based on
ranked data.
Table 4 shows that the mean annual rainfalls for the local stations range from about 312 to 401 mm,
while the median values range from some 283 to 374 mm. For design purposes it is recommended
that the data for the Marble Bar Combined station, with a mean and median annual rainfall of 360
and 344 mm respectively, be utilised given it remains open, is located some 24 km northwest of the
Project site and has 108 years of complete annual data and 118 years of relatively high quality daily
data (99.3% complete).
Points of note from the analysis of the complete annual rainfall data sets for Marble Bar Combined
and the other local stations are as follows:
3 A double mass curve analysis for the period of overlap (1 May 2001 to 31 Aug 2006) showed that both stations were well correlated (r2 = 0.9996). 4 The property of skewness is of questionable statistical value in hydrology when it must be estimated from less than 50 sample data points.
DESKTOP HYDRO‐METEOROLOGICAL STUDY
J1827R01 Final 29 May 2019
8
Typically there is at least a one order of magnitude range between maximum and minimum
annual rainfalls at all of the local stations. There is no obvious spatial rainfall distribution
between the local rainfall stations.
Local annual rainfalls are also highly temporally variable, and notably significantly wet and dry
years can occur in consecutive years. This temporal variation is reflected in the data for the
local stations where four or fivefold year‐on‐year increases or decreases are common. A local
example of this year‐on‐year variability was noted in the data for Bonney Creek which show
an annual rainfall of 56 in 1924, followed by 494 mm in 1925 i.e. a near nine fold year‐on‐year
increase.
A frequency analysis of the 108 years of complete Marble Bar Combined rainfall data (using a
Log‐Pearson III Distribution) indicates that the 797.9 mm that occurred in 1980 and the 71.1
mm that was recorded in 1924 had annual exceedance probabilities (AEP) of less than 1%.
The 1% AEP wettest and driest years would result in local rainfall totals of approximately 725
mm and 85 mm of respectively.
The local annual maximum of 1,156.8 mm recorded at Bamboo Creek in 2000 was due largely
to tropical cyclone activity and depression related events in the first half of the year (984 mm
were recorded in the three months to 31 March alone). Particularly heavy rainfalls were
associated with Tropical Cyclone (TC) Steve with a daily total of 332 mm recorded on 7 March
at Bamboo Creek. It should be noted that 2000 was also the wettest year on record at Hillside
Station and Bonney Downs and second wettest at Marble Bar Combined (Nullagine data were
incomplete for 2000 and were discarded and Mount Edgar was closed).
The local minimum rainfall of 22.3 mm recorded at Mount Edgar in 1924 is typical of
conditions that year when there was no cyclone activity along the W.A. coast. Indeed many
regional rainfall gauges recorded no measurable rain at all that year. These conditions led to
what many consider the worst heatwave ever recorded when Marble Bar Combined
experienced 160 consecutive days when the maximum daily temperature reached or
exceeded 37.8 °C (100.0 °F). Severe drought prevailed across the Western Australian tropics
that year and stock losses were heavy. The 1924 rainfall is well in excess of the 1% AEP annual
drought.
Locally, the longest continuously dry period was 297 days recorded between 23 January 1940
and 15 November 1940. The maximum drought periods were broken at all the local stations
by the on‐set of the tropical cyclone season, typically in late December or early January.
The average number of rain days per year recorded locally ranges from between 30 and 37
days, with a mean of 32 days. However as many as 67 rain days per year (Marble Bar
Combined in 2000) and as few as 4 rain days per year (Bonney Downs in 1944) have been
recorded locally.
Monthly Rainfall Maximum, minimum and mean monthly rainfall values were determined for all six of the local daily
rainfall stations, with the results for Marble Bar Combined shown in Table 6. It should be noted that
this 1377 complete months within this data set is larger than the 108 year complete annual data set
used for determination of the mean and median annual rainfall as some of the incomplete years
contained complete months of data.
DESKTOP HYDRO‐METEOROLOGICAL STUDY
J1827R01 Final 29 May 2019
9
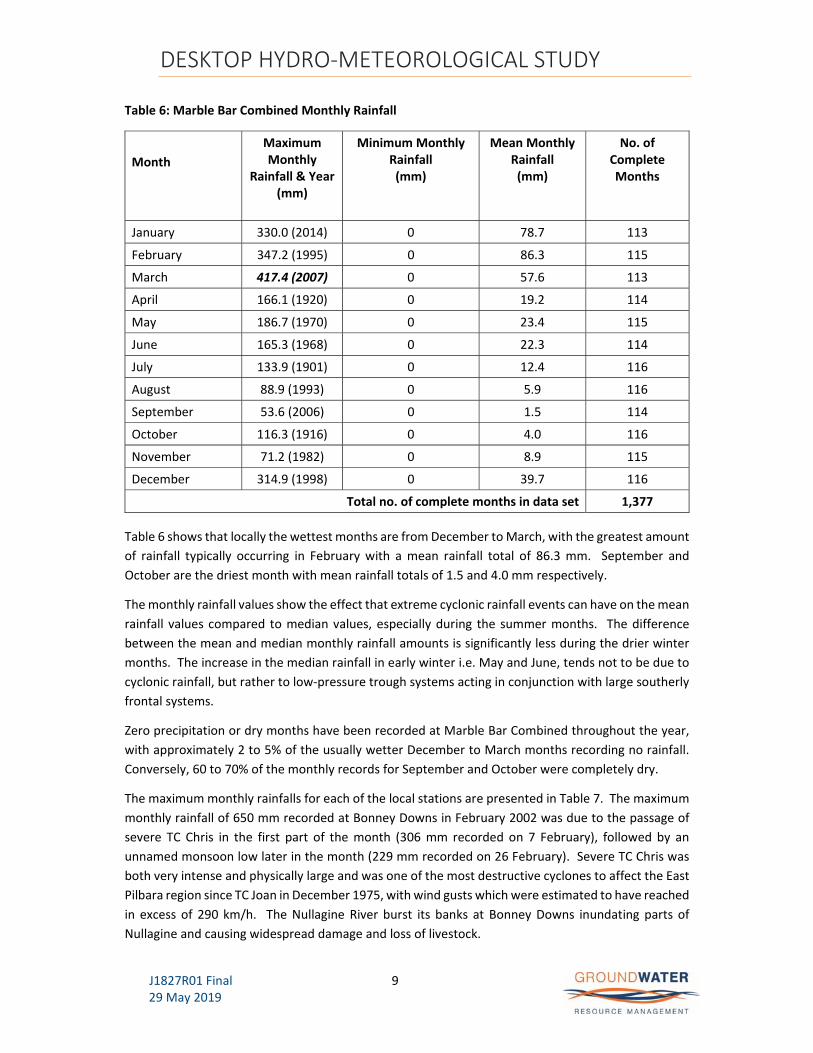
Table 6: Marble Bar Combined Monthly Rainfall
Month
Maximum Monthly
Rainfall & Year (mm)
Minimum Monthly Rainfall (mm)
Mean Monthly Rainfall (mm)
No. of Complete Months
January 330.0 (2014) 0 78.7 113
February 347.2 (1995) 0 86.3 115
March 417.4 (2007) 0 57.6 113
April 166.1 (1920) 0 19.2 114
May 186.7 (1970) 0 23.4 115
June 165.3 (1968) 0 22.3 114
July 133.9 (1901) 0 12.4 116
August 88.9 (1993) 0 5.9 116
September 53.6 (2006) 0 1.5 114
October 116.3 (1916) 0 4.0 116
November 71.2 (1982) 0 8.9 115
December 314.9 (1998) 0 39.7 116
Total no. of complete months in data set 1,377
Table 6 shows that locally the wettest months are from December to March, with the greatest amount
of rainfall typically occurring in February with a mean rainfall total of 86.3 mm. September and
October are the driest month with mean rainfall totals of 1.5 and 4.0 mm respectively.
The monthly rainfall values show the effect that extreme cyclonic rainfall events can have on the mean
rainfall values compared to median values, especially during the summer months. The difference
between the mean and median monthly rainfall amounts is significantly less during the drier winter
months. The increase in the median rainfall in early winter i.e. May and June, tends not to be due to
cyclonic rainfall, but rather to low‐pressure trough systems acting in conjunction with large southerly
frontal systems.
Zero precipitation or dry months have been recorded at Marble Bar Combined throughout the year,
with approximately 2 to 5% of the usually wetter December to March months recording no rainfall.
Conversely, 60 to 70% of the monthly records for September and October were completely dry.
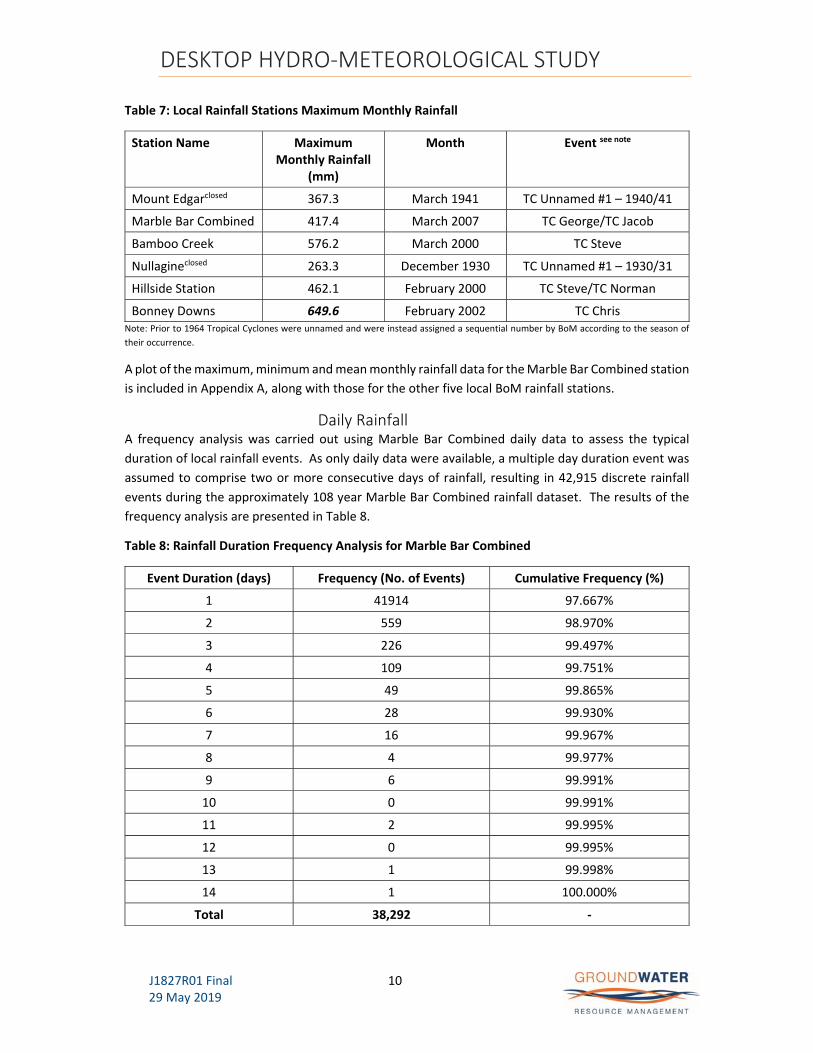
The maximum monthly rainfalls for each of the local stations are presented in Table 7. The maximum
monthly rainfall of 650 mm recorded at Bonney Downs in February 2002 was due to the passage of
severe TC Chris in the first part of the month (306 mm recorded on 7 February), followed by an
unnamed monsoon low later in the month (229 mm recorded on 26 February). Severe TC Chris was
both very intense and physically large and was one of the most destructive cyclones to affect the East
Pilbara region since TC Joan in December 1975, with wind gusts which were estimated to have reached
in excess of 290 km/h. The Nullagine River burst its banks at Bonney Downs inundating parts of
Nullagine and causing widespread damage and loss of livestock.
DESKTOP HYDRO‐METEOROLOGICAL STUDY
J1827R01 Final 29 May 2019
10
Table 7: Local Rainfall Stations Maximum Monthly Rainfall
Station Name Maximum Monthly Rainfall
(mm)
Month Event see note
Mount Edgarclosed 367.3 March 1941 TC Unnamed #1 – 1940/41
Marble Bar Combined 417.4 March 2007 TC George/TC Jacob
Bamboo Creek 576.2 March 2000 TC Steve
Nullagineclosed 263.3 December 1930 TC Unnamed #1 – 1930/31
Hillside Station 462.1 February 2000 TC Steve/TC Norman
Bonney Downs 649.6 February 2002 TC Chris Note: Prior to 1964 Tropical Cyclones were unnamed and were instead assigned a sequential number by BoM according to the season of
their occurrence.
A plot of the maximum, minimum and mean monthly rainfall data for the Marble Bar Combined station
is included in Appendix A, along with those for the other five local BoM rainfall stations.
Daily Rainfall A frequency analysis was carried out using Marble Bar Combined daily data to assess the typical
duration of local rainfall events. As only daily data were available, a multiple day duration event was
assumed to comprise two or more consecutive days of rainfall, resulting in 42,915 discrete rainfall
events during the approximately 108 year Marble Bar Combined rainfall dataset. The results of the
frequency analysis are presented in Table 8.
Table 8: Rainfall Duration Frequency Analysis for Marble Bar Combined
Event Duration (days) Frequency (No. of Events) Cumulative Frequency (%)
1 41914 97.667%
2 559 98.970%
3 226 99.497%
4 109 99.751%
5 49 99.865%
6 28 99.930%
7 16 99.967%
8 4 99.977%
9 6 99.991%
10 0 99.991%
11 2 99.995%
12 0 99.995%
13 1 99.998%
14 1 100.000%
Total 38,292 ‐

DESKTOP HYDRO‐METEOROLOGICAL STUDY
J1827R01 Final 29 May 2019
11
A review of the results of the rainfall duration frequency analysis shows that by far the greatest
amount (about 97.7%) of rainfall events are discrete, single‐day events. Two and three‐day events
represent some 1.3% and 0.5% of all rainfall events respectively. The longest period of consecutive
daily rainfall at Marble Bar Combined was found to be 14 days and occurred between 23 January and
6 February 2017 when several tropical lows (including 14U and 15U) were passing across the Pilbara
region.
An analysis of daily rainfall data was carried out for the six local BoM stations. The ten wettest days
are shown in Table 9 along with the recording station, date and tropical cyclone name where related.
Table 9: Maximum Daily Rainfall
Station Name Date Precipitation to 9 am (mm)
Rank Event Namesee note
(if known)
Bamboo Creek 7 Mar 2000 332.4 1st TC Steve
Bonney Downs 7 Feb 2002 306.0 2nd TC Chris
Marble Bar Combined 2 Mar 1941 304.8
3rd TC Unnamed #1 –
1940/41
Hillside Station 29 Dec 1947 260.1
4th TC Unnamed #1 –
1947/48
Bamboo Creek 2 Mar 1941 254.0
5th TC Unnamed #1 –
1940/41
Bonney Downs 26 Feb 2002 229.0 6th Monsoon Low (Unnamed)
Mount Edgarclosed 12 Jan 1939 228.6
7th TC Unnamed #1 –
1939/40
Hillside Station 29 Mar 1988 198.8 8th Unknown
Mount Edgarclosed 3 Mar 1941 195.6
9th TC Unnamed #1 –
1940/41
Nullagineclosed 27 Mar 1999 192.0 10th TC Vance Note: Prior to 1964 Tropical Cyclones were unnamed and were instead assigned a sequential number by BoM.
It should be noted that the top ranked daily event (332.4 mm) is of the same order of magnitude as
the mean and median annual rainfall at Marble Bar Combined (359.8 and 393.8 mm respectively).
This maximum daily event can be attributed to TC Steve which was a very significant event, making
landfall four times as it passed across the top end of Australia between Cairns, QLD and Shark Bay,
WA, before turning to the southeast and eventually dissipating near Esperance on the south coast of
WA. It left in excess of $100 million of damage, mostly as a result of flooding.
A frequency analysis was carried out on the Marble Bar Combined daily rainfall record (using a Wakeby
Distribution) which showed that the 332 mm event which was recorded on 7 March 2000 had an AEP
in the order of 0.33%. The local 1% AEP daily rainfall was estimated to be in the order of 250 mm.
A listing of the ten wettest days at each of the local rainfall stations is provided in Appendix A.
Maximum two, three and seven day rainfalls recorded at each of the local rainfall stations are shown
in Table 10.

DESKTOP HYDRO‐METEOROLOGICAL STUDY
J1827R01 Final 29 May 2019
12

DESKTOP HYDRO‐METEOROLOGICAL STUDY
J1827R01 Final 29 May 2019
13
Table 10: Local Stations Maximum Two, Three and Seven Day Rainfalls
Station Name Maximum
Two‐Day Rainfall (mm)
Maximum Three‐Day Rainfall (mm)
Maximum Seven‐Day Rainfall (mm)
Mount Edgarclosed 360.7 367.3 378.5
Marble Bar Combined 388.6 388.6 391.9
Bamboo Creek 434.3 458.3 492.2
Nullagineclosed 192.0 205.0 209.6
Hillside Station 284.0 314.0 338.0
Bonney Downs 333.0 345.2 358.4
The local maximum two, three and seven day rainfall depths of 434, 458 and 492 mm were recorded
at Bamboo Creek during the first week of March 2000 when TC Steve was crossing the Pilbara region.
Sub‐Daily Rainfall Pluviograph data from four regional pluviographic stations at Marble Bar Comparison (23.5 km NW),
Abydos (100 km W), Port Hedland (170 km NW) and Whim Creek (220 km NW) were assessed. Table
11 shows the maximum six‐minute and sixty‐minute duration rainfall intensities recorded at each of
the pluviograph stations.
Table 11: Regional Stations Maximum Recorded Six & Sixty‐Minute Rainfall Intensity
Station Name
Max. Six‐
Minute
Intensity
(mm/hr)
Date Max. Sixty‐
Minute
Intensity
(mm/hr)
Date
Marble Bar Comparison closed 110.0 5 Jan 2000 44.4 31 Dec 2005
Abydos closed 123.2 29 Apr 1966 69.5 29 Apr 1966
Port Hedland Airport 140.0 22 Mar 2007 79.8 22 Mar 2007
Whim Creek 130.0 23 Jan 2000 99.4 23 Jan 2000
Notes:
1. Marble Bar Comparison values based on approximately 8 years of data collected between 1997 and 2006 (54% complete).
2. Abydos values based on approximately 3 years of data collected between 1963 and 1968 (22% complete).
3. Port Hedland Airport values based on approximately 63 years of data collected between 1953 and 2015 (71% complete).
4. Whim Creek values based on approximately 16 years of data collected between 1997 and 2015 (27% complete).
The maximum recorded six‐minute and one‐hour intensities shown above compare well with the
calculated 1% AEP six‐minute duration Intensity‐Frequency‐Duration (IFD) intensities presented in the
following section.
DESKTOP HYDRO‐METEOROLOGICAL STUDY
J1827R01 Final 29 May 2019
14
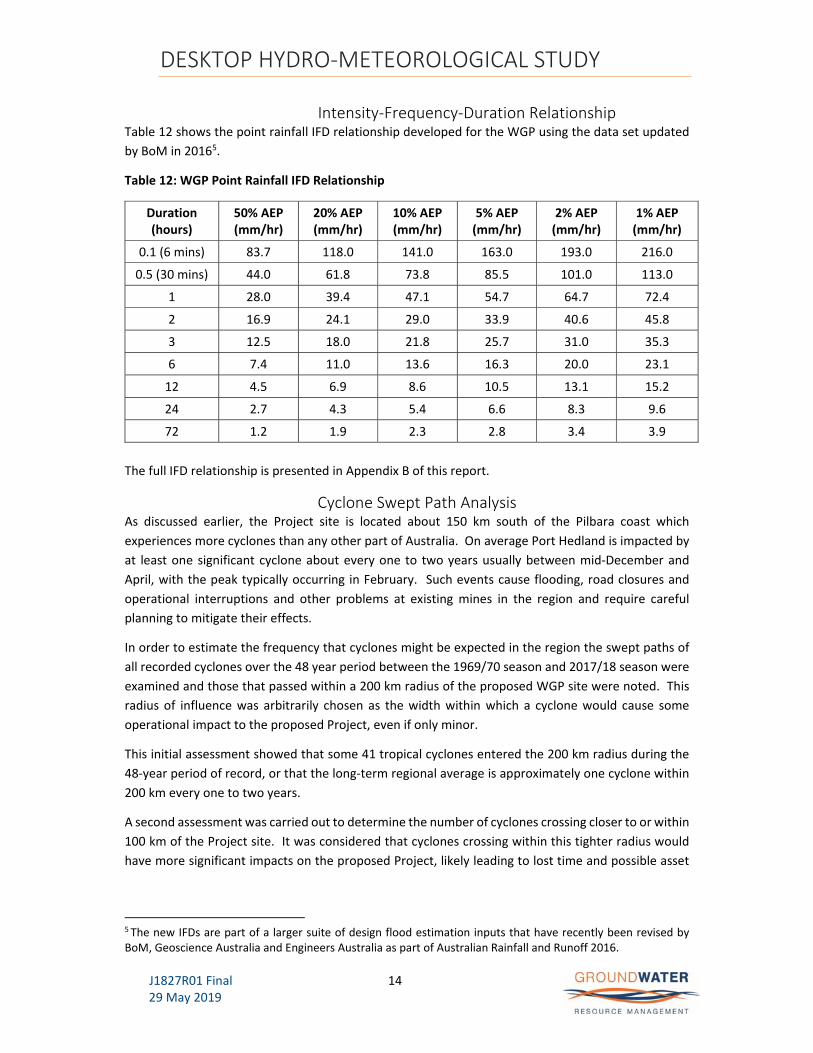
Intensity‐Frequency‐Duration Relationship Table 12 shows the point rainfall IFD relationship developed for the WGP using the data set updated
by BoM in 20165.
Table 12: WGP Point Rainfall IFD Relationship
Duration (hours)
50% AEP (mm/hr)
20% AEP (mm/hr)
10% AEP (mm/hr)
5% AEP (mm/hr)
2% AEP (mm/hr)
1% AEP (mm/hr)
0.1 (6 mins) 83.7 118.0 141.0 163.0 193.0 216.0
0.5 (30 mins) 44.0 61.8 73.8 85.5 101.0 113.0
1 28.0 39.4 47.1 54.7 64.7 72.4
2 16.9 24.1 29.0 33.9 40.6 45.8
3 12.5 18.0 21.8 25.7 31.0 35.3
6 7.4 11.0 13.6 16.3 20.0 23.1
12 4.5 6.9 8.6 10.5 13.1 15.2
24 2.7 4.3 5.4 6.6 8.3 9.6
72 1.2 1.9 2.3 2.8 3.4 3.9
The full IFD relationship is presented in Appendix B of this report.
Cyclone Swept Path Analysis As discussed earlier, the Project site is located about 150 km south of the Pilbara coast which
experiences more cyclones than any other part of Australia. On average Port Hedland is impacted by
at least one significant cyclone about every one to two years usually between mid‐December and
April, with the peak typically occurring in February. Such events cause flooding, road closures and
operational interruptions and other problems at existing mines in the region and require careful
planning to mitigate their effects.
In order to estimate the frequency that cyclones might be expected in the region the swept paths of
all recorded cyclones over the 48 year period between the 1969/70 season and 2017/18 season were
examined and those that passed within a 200 km radius of the proposed WGP site were noted. This
radius of influence was arbitrarily chosen as the width within which a cyclone would cause some
operational impact to the proposed Project, even if only minor.
This initial assessment showed that some 41 tropical cyclones entered the 200 km radius during the
48‐year period of record, or that the long‐term regional average is approximately one cyclone within
200 km every one to two years.
A second assessment was carried out to determine the number of cyclones crossing closer to or within
100 km of the Project site. It was considered that cyclones crossing within this tighter radius would
have more significant impacts on the proposed Project, likely leading to lost time and possible asset
5 The new IFDs are part of a larger suite of design flood estimation inputs that have recently been revised by BoM, Geoscience Australia and Engineers Australia as part of Australian Rainfall and Runoff 2016.
DESKTOP HYDRO‐METEOROLOGICAL STUDY
J1827R01 Final 29 May 2019
15
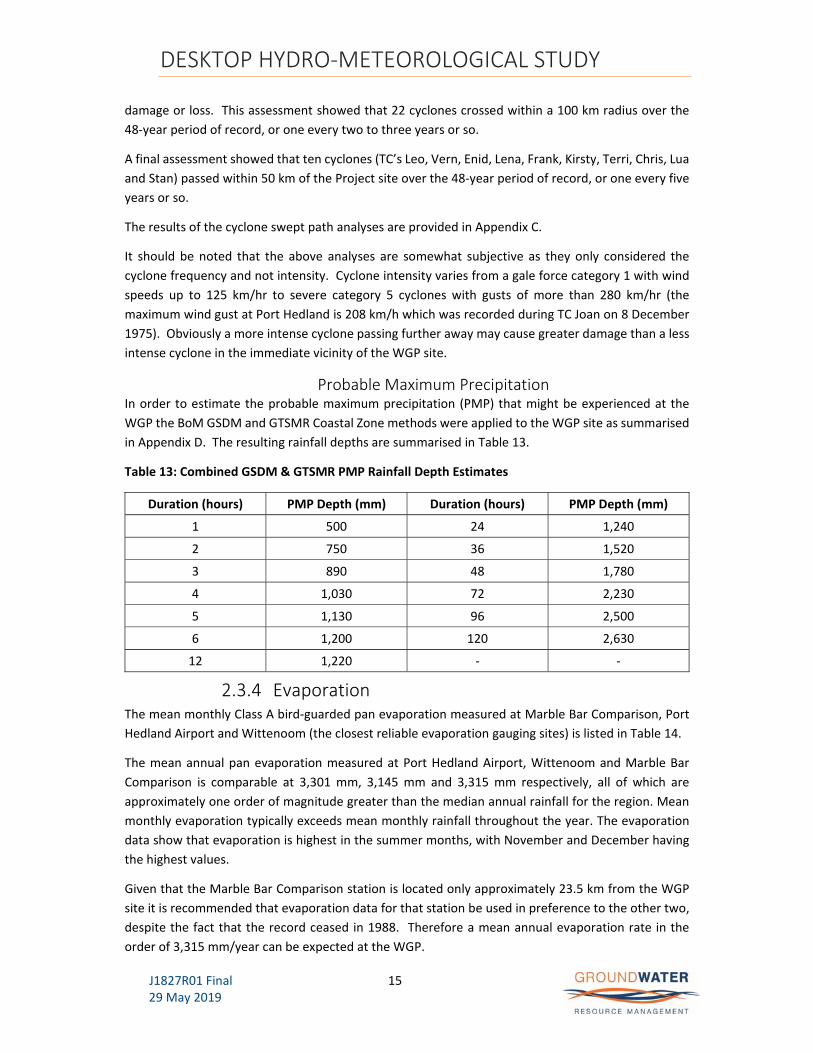
damage or loss. This assessment showed that 22 cyclones crossed within a 100 km radius over the
48‐year period of record, or one every two to three years or so.
A final assessment showed that ten cyclones (TC’s Leo, Vern, Enid, Lena, Frank, Kirsty, Terri, Chris, Lua
and Stan) passed within 50 km of the Project site over the 48‐year period of record, or one every five
years or so.
The results of the cyclone swept path analyses are provided in Appendix C.
It should be noted that the above analyses are somewhat subjective as they only considered the
cyclone frequency and not intensity. Cyclone intensity varies from a gale force category 1 with wind
speeds up to 125 km/hr to severe category 5 cyclones with gusts of more than 280 km/hr (the
maximum wind gust at Port Hedland is 208 km/h which was recorded during TC Joan on 8 December
1975). Obviously a more intense cyclone passing further away may cause greater damage than a less
intense cyclone in the immediate vicinity of the WGP site.
Probable Maximum Precipitation In order to estimate the probable maximum precipitation (PMP) that might be experienced at the
WGP the BoM GSDM and GTSMR Coastal Zone methods were applied to the WGP site as summarised
in Appendix D. The resulting rainfall depths are summarised in Table 13.
Table 13: Combined GSDM & GTSMR PMP Rainfall Depth Estimates
Duration (hours) PMP Depth (mm) Duration (hours) PMP Depth (mm)
1 500 24 1,240
2 750 36 1,520
3 890 48 1,780
4 1,030 72 2,230
5 1,130 96 2,500
6 1,200 120 2,630
12 1,220 ‐ ‐
2.3.4 Evaporation The mean monthly Class A bird‐guarded pan evaporation measured at Marble Bar Comparison, Port
Hedland Airport and Wittenoom (the closest reliable evaporation gauging sites) is listed in Table 14.
The mean annual pan evaporation measured at Port Hedland Airport, Wittenoom and Marble Bar
Comparison is comparable at 3,301 mm, 3,145 mm and 3,315 mm respectively, all of which are
approximately one order of magnitude greater than the median annual rainfall for the region. Mean
monthly evaporation typically exceeds mean monthly rainfall throughout the year. The evaporation
data show that evaporation is highest in the summer months, with November and December having
the highest values.
Given that the Marble Bar Comparison station is located only approximately 23.5 km from the WGP
site it is recommended that evaporation data for that station be used in preference to the other two,
despite the fact that the record ceased in 1988. Therefore a mean annual evaporation rate in the
order of 3,315 mm/year can be expected at the WGP.

DESKTOP HYDRO‐METEOROLOGICAL STUDY
J1827R01 Final 29 May 2019
16
Table 14: Mean Monthly Pan Evaporation
Month
Mean Monthly Pan Evaporation (mm)
Port Hedland Airport1 Wittenoom2 Marble Bar
ComparisonClosed, 3
January 322 350 353
February 271 277 294
March 288 279 301
April 264 231 258
May 229 177 202
June 195 135 162
July 205 149 167
August 233 189 195
September 267 258 261
October 329 344 341
November 345 372 381
December 353 384 400
Mean Annual Pan Evaporation (mm)
3,301 3,145 3,315
Notes:
1. Port Hedland Airport values based on BoM’s analysis of 48 years of data collected between 1967 and 2015.
2. Wittenoom values based on BoM’s analysis of 49 years of data collected between 1967 and 2018.
3. Marble Bar Comparison values based on BoM’s analysis of 16 years of data collected between 1968 and 1988.
The Department of Agriculture’s (DoA) Technical Report No. 65 referenced earlier states that a 7%
coefficient of variation can be applied to mean annual evaporation rates in WA. Applying this
coefficient to the WGP mean annual evaporation of 3,315 mm gives a standard deviation of 232 mm.
Assuming that evaporation data are normally distributed, estimates of annual pan evaporation with
10%, 2% and 1% AEP will therefore be in the order of 3,700 mm, 3,780 mm and 4,010 mm respectively.
The DoA report also states that a “pan to dam” coefficient in the order of 65‐70% is appropriate for
use for shallow dams and ponds (less than 4 m deep) storing freshwater in the Pilbara. Consequently
mean annual evaporative rates in the order of 2,155 mm to 2,320 mm might be expected from
freshwater storage ponds at the WGP.
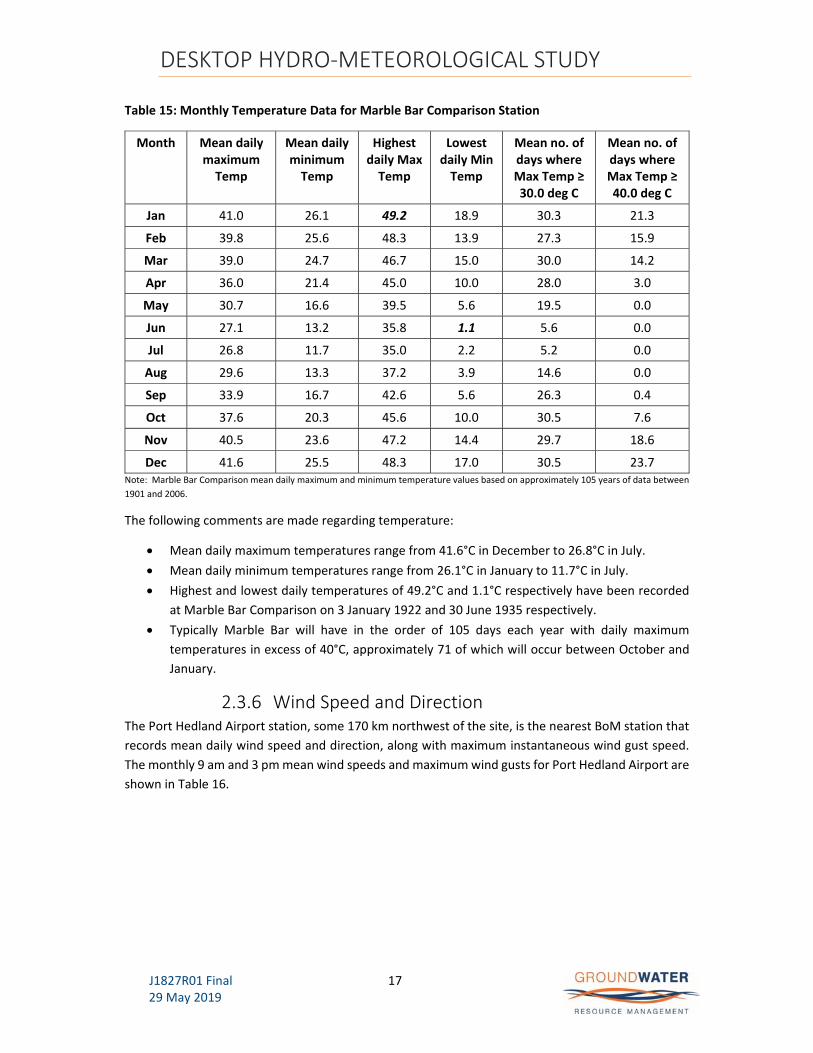
2.3.5 Temperature Temperature data for the Marble Bar Comparison station, some 23.5 km northwest of the WGP site,
are shown in Table 15 below.
DESKTOP HYDRO‐METEOROLOGICAL STUDY
J1827R01 Final 29 May 2019
17
Table 15: Monthly Temperature Data for Marble Bar Comparison Station
Month Mean daily maximum Temp
Mean daily minimum Temp
Highest daily Max Temp
Lowest daily Min Temp
Mean no. of days where Max Temp ≥ 30.0 deg C
Mean no. of days where Max Temp ≥ 40.0 deg C
Jan 41.0 26.1 49.2 18.9 30.3 21.3
Feb 39.8 25.6 48.3 13.9 27.3 15.9
Mar 39.0 24.7 46.7 15.0 30.0 14.2
Apr 36.0 21.4 45.0 10.0 28.0 3.0
May 30.7 16.6 39.5 5.6 19.5 0.0
Jun 27.1 13.2 35.8 1.1 5.6 0.0
Jul 26.8 11.7 35.0 2.2 5.2 0.0
Aug 29.6 13.3 37.2 3.9 14.6 0.0
Sep 33.9 16.7 42.6 5.6 26.3 0.4
Oct 37.6 20.3 45.6 10.0 30.5 7.6
Nov 40.5 23.6 47.2 14.4 29.7 18.6
Dec 41.6 25.5 48.3 17.0 30.5 23.7 Note: Marble Bar Comparison mean daily maximum and minimum temperature values based on approximately 105 years of data between
1901 and 2006.
The following comments are made regarding temperature:
Mean daily maximum temperatures range from 41.6°C in December to 26.8°C in July.
Mean daily minimum temperatures range from 26.1°C in January to 11.7°C in July.
Highest and lowest daily temperatures of 49.2°C and 1.1°C respectively have been recorded
at Marble Bar Comparison on 3 January 1922 and 30 June 1935 respectively.
Typically Marble Bar will have in the order of 105 days each year with daily maximum
temperatures in excess of 40°C, approximately 71 of which will occur between October and
January.
2.3.6 Wind Speed and Direction The Port Hedland Airport station, some 170 km northwest of the site, is the nearest BoM station that
records mean daily wind speed and direction, along with maximum instantaneous wind gust speed.
The monthly 9 am and 3 pm mean wind speeds and maximum wind gusts for Port Hedland Airport are
shown in Table 16.

DESKTOP HYDRO‐METEOROLOGICAL STUDY
J1827R01 Final 29 May 2019
18
Table 16: Mean Monthly 9 am and 3 pm Wind Speed and Maximum Wind Gusts for Port Hedland
Airport Station
Month Mean 9 am Wind Speed (km/h)
Mean 3 pm Wind Speed (km/h)
Highest Recorded Wind Gust (km/h)
Jan 14.6 25.6 170.6 (19 Jan 1987)
Feb 14.4 23.6 192.6 (1 Feb 1980)
Mar 15.1 21.6 200.2 (27 Mar 1977)
Apr 16.9 19.6 153.7 (8 Apr 1983)
May 19.9 18.3 85.3 (19 May 1996)
Jun 20.8 17.9 76.0 (25 Jun 2013)
Jul 20.8 18.7 81.7 (13 Jul 1984)
Aug 20.2 20.1 85.3 (14 Aug 1995)
Sep 18.4 22.3 81.7 (27 Sep 1990)
Oct 17.9 25.3 92.5 (17 Oct 1969)
Nov 16.0 26.5 81.7 (14 Nov 1972)
Dec 15.2 26.8 207.7 (8 Dec 1975) Note: Port Hedland mean values based on approximately 69 years of data recorded between 1942 and 2012, while wind gust values based
on approximately 64 years of data recorded between 1954 and 2018.
Mean annual wind roses for the 9 am and 3 pm observations at the Port Hedland Airport station are
provided in Appendix A. These show that easterly’s and south‐easterly’s predominate in the morning,
but by the afternoon north‐westerly’s and northerly’s prevail. For the morning observation time it was
noted that it was calm for about 7% of the year, while afternoons are nearly always windy with calm
conditions noted only about 0.5% of the time.
2.4 HYDROLOGICAL CONDITIONS
2.4.1 General The WGP site is located centrally within the Coongan River catchment (area = 7,080 km2) which itself
is situated centrally within the much larger De Grey basin catchment (56,800 km2), within the Indian
Ocean drainage division, as shown in Figure 3. Although located within the Pilbara Surface Water
Area, inspection of the DWER Spatial database6 indicates that neither the watercourses in the vicinity
of the WGP nor any within the entire Coongan River catchment intersect any proclaimed Surface
Water Management Area or Irrigation Area. A preliminary quantitative assessment of the impact of
the WGP on the local hydrological regime is presented in Section 3.0 of this report.
While there is a sparsity of flow gauging data across the region, the Coongan River is typical of rivers
in the Pilbara in that it is ephemeral and highly variable with flows increasing from zero to many
hundreds of cubic metres per second in a matter of hours following major storm events.
6 See http://atlases.water.wa.gov.au/idelve/dowdataext/download/default.html

DESKTOP HYDRO‐METEOROLOGICAL STUDY
J1827R01 Final 29 May 2019
19
Typically over three quarters of the annual streamflow occurs during January, February and March
with local rivers usually drying up during the dry season around July or August and leaving a series of
disconnected pools which are often recharged by groundwater. There is strong interaction between
the surface water and groundwater hydrology at the catchment scale but little is known at a more
localised scale. Surface water flow in the local rivers and flood plains recharges the alluvium through
the river bed during the wet season. During the dry season, river flow is initially maintained by
groundwater discharge, until declining levels drop below the river bed.
The WGP site is situated along the Warrawoona Ridge which forms the local surface water divide, with
the Brockman Hay Cutting/Sandy/Camel Creek system located to the south of the ridge and Brockman
Creek to the north. Both of these creek systems are ephemeral, only conveying runoff following
periods of significant rainfall. The Brockman Hay Cutting/Sandy/Camel Creek system reports directly
to the Coongan River approximately 20 km west of the WGP site with a combined upstream catchment
area of some 502.1 km2, while the Brockman Creek reports to the Talga River about 35 km to the north
of the site with an upstream catchment area of approximately 396.8 km2. Downstream of its
confluence with Brockman Creek, the Talga River continues for some 20 km before also discharging
into the Coongan River, as shown in Figure 4.
The Coongan River continues in a northerly direction for roughly 48 km before discharging into the De
Grey River which ultimately discharges into the Indian Ocean at Poissonnier Point some 70 km
northeast of Port Hedland.
There are several relatively minor ephemeral watercourses and drainage lines that cross the WGP site
on the south side of the Warrawoona Ridge in a roughly northeast to southwest direction, the most
significant of which are Brockman Hay Cutting Creek and Sandy Creek with catchment areas of some
46.5 and 199.2 km2 respectively, as shown in Figure 5. However, given that the majority of the
proposed mining areas are situated within the ridge in the headwaters of these creeks, there are very
limited catchment areas upstream of the proposed project facilities.
2.4.2 Review of Existing Data Daily flow data were obtained for the DoW’s flow monitoring stations at Marble Bar on the Coongan
River, North Pole Mine on the Shaw River and Coolenar Pool on the De Grey River, as summarised in
Table 3 earlier and shown on Figure 3. These data were analysed and the key results are presented in
Tables 17 and 18.
It should be noted that “water years” i.e. 1 July to 30 June were used in the flow data analyses as flow
in the local rivers generally results from runoff tropical cyclones and other depression related events
that usually straddle the calendar year end.
Inspection of the flow data indicates the following:
Annual flows are highly variable with a several order of magnitude increase between
minimum and maximum values.
Years with zero flow have been recorded at North Pole Mine and Coolenar Pool gauging
stations, while months with zero flow have been recorded at all stations during all months of
the year.
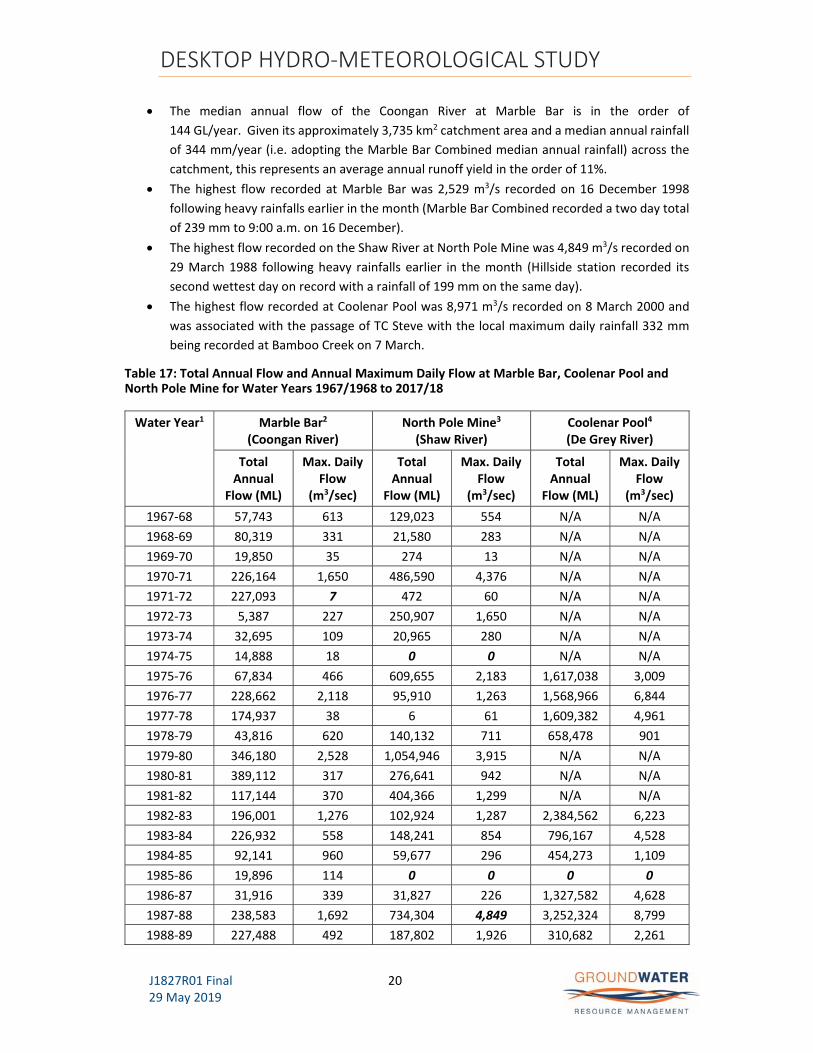
DESKTOP HYDRO‐METEOROLOGICAL STUDY
J1827R01 Final 29 May 2019
20
The median annual flow of the Coongan River at Marble Bar is in the order of
144 GL/year. Given its approximately 3,735 km2 catchment area and a median annual rainfall
of 344 mm/year (i.e. adopting the Marble Bar Combined median annual rainfall) across the
catchment, this represents an average annual runoff yield in the order of 11%.
The highest flow recorded at Marble Bar was 2,529 m3/s recorded on 16 December 1998
following heavy rainfalls earlier in the month (Marble Bar Combined recorded a two day total
of 239 mm to 9:00 a.m. on 16 December).
The highest flow recorded on the Shaw River at North Pole Mine was 4,849 m3/s recorded on
29 March 1988 following heavy rainfalls earlier in the month (Hillside station recorded its
second wettest day on record with a rainfall of 199 mm on the same day).
The highest flow recorded at Coolenar Pool was 8,971 m3/s recorded on 8 March 2000 and
was associated with the passage of TC Steve with the local maximum daily rainfall 332 mm
being recorded at Bamboo Creek on 7 March.
Table 17: Total Annual Flow and Annual Maximum Daily Flow at Marble Bar, Coolenar Pool and North Pole Mine for Water Years 1967/1968 to 2017/18
Water Year1 Marble Bar2 (Coongan River)
North Pole Mine3
(Shaw River) Coolenar Pool4
(De Grey River)
Total Annual
Flow (ML)
Max. Daily Flow
(m3/sec)
Total Annual
Flow (ML)
Max. Daily Flow
(m3/sec)
Total Annual
Flow (ML)
Max. Daily Flow
(m3/sec)
1967‐68 57,743 613 129,023 554 N/A N/A
1968‐69 80,319 331 21,580 283 N/A N/A
1969‐70 19,850 35 274 13 N/A N/A
1970‐71 226,164 1,650 486,590 4,376 N/A N/A
1971‐72 227,093 7 472 60 N/A N/A
1972‐73 5,387 227 250,907 1,650 N/A N/A
1973‐74 32,695 109 20,965 280 N/A N/A
1974‐75 14,888 18 0 0 N/A N/A
1975‐76 67,834 466 609,655 2,183 1,617,038 3,009
1976‐77 228,662 2,118 95,910 1,263 1,568,966 6,844
1977‐78 174,937 38 6 61 1,609,382 4,961
1978‐79 43,816 620 140,132 711 658,478 901
1979‐80 346,180 2,528 1,054,946 3,915 N/A N/A
1980‐81 389,112 317 276,641 942 N/A N/A
1981‐82 117,144 370 404,366 1,299 N/A N/A
1982‐83 196,001 1,276 102,924 1,287 2,384,562 6,223
1983‐84 226,932 558 148,241 854 796,167 4,528
1984‐85 92,141 960 59,677 296 454,273 1,109
1985‐86 19,896 114 0 0 0 0
1986‐87 31,916 339 31,827 226 1,327,582 4,628
1987‐88 238,583 1,692 734,304 4,849 3,252,324 8,799
1988‐89 227,488 492 187,802 1,926 310,682 2,261
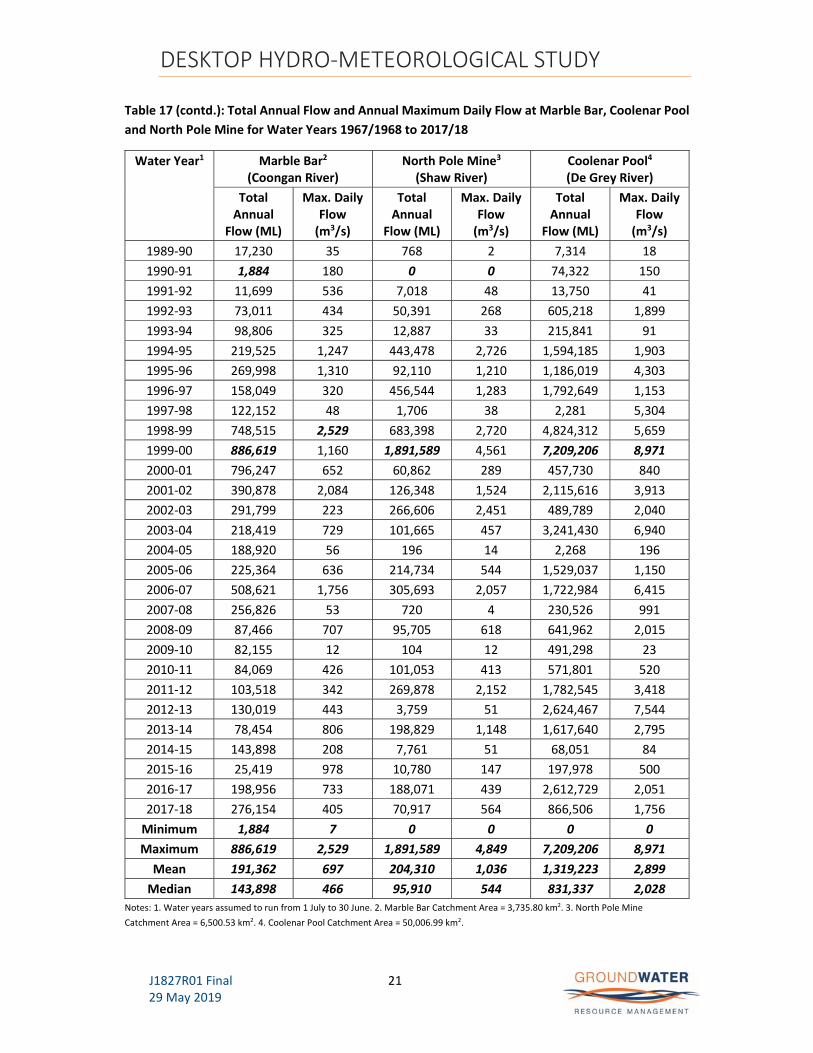
DESKTOP HYDRO‐METEOROLOGICAL STUDY
J1827R01 Final 29 May 2019
21
Table 17 (contd.): Total Annual Flow and Annual Maximum Daily Flow at Marble Bar, Coolenar Pool
and North Pole Mine for Water Years 1967/1968 to 2017/18
Water Year1 Marble Bar2 (Coongan River)
North Pole Mine3
(Shaw River) Coolenar Pool4
(De Grey River)
Total Annual
Flow (ML)
Max. Daily Flow (m3/s)
Total Annual
Flow (ML)
Max. Daily Flow (m3/s)
Total Annual
Flow (ML)
Max. Daily Flow (m3/s)
1989‐90 17,230 35 768 2 7,314 18
1990‐91 1,884 180 0 0 74,322 150
1991‐92 11,699 536 7,018 48 13,750 41
1992‐93 73,011 434 50,391 268 605,218 1,899
1993‐94 98,806 325 12,887 33 215,841 91
1994‐95 219,525 1,247 443,478 2,726 1,594,185 1,903
1995‐96 269,998 1,310 92,110 1,210 1,186,019 4,303
1996‐97 158,049 320 456,544 1,283 1,792,649 1,153
1997‐98 122,152 48 1,706 38 2,281 5,304
1998‐99 748,515 2,529 683,398 2,720 4,824,312 5,659
1999‐00 886,619 1,160 1,891,589 4,561 7,209,206 8,971
2000‐01 796,247 652 60,862 289 457,730 840
2001‐02 390,878 2,084 126,348 1,524 2,115,616 3,913
2002‐03 291,799 223 266,606 2,451 489,789 2,040
2003‐04 218,419 729 101,665 457 3,241,430 6,940
2004‐05 188,920 56 196 14 2,268 196
2005‐06 225,364 636 214,734 544 1,529,037 1,150
2006‐07 508,621 1,756 305,693 2,057 1,722,984 6,415
2007‐08 256,826 53 720 4 230,526 991
2008‐09 87,466 707 95,705 618 641,962 2,015
2009‐10 82,155 12 104 12 491,298 23
2010‐11 84,069 426 101,053 413 571,801 520
2011‐12 103,518 342 269,878 2,152 1,782,545 3,418
2012‐13 130,019 443 3,759 51 2,624,467 7,544
2013‐14 78,454 806 198,829 1,148 1,617,640 2,795
2014‐15 143,898 208 7,761 51 68,051 84
2015‐16 25,419 978 10,780 147 197,978 500
2016‐17 198,956 733 188,071 439 2,612,729 2,051
2017‐18 276,154 405 70,917 564 866,506 1,756
Minimum 1,884 7 0 0 0 0
Maximum 886,619 2,529 1,891,589 4,849 7,209,206 8,971
Mean 191,362 697 204,310 1,036 1,319,223 2,899
Median 143,898 466 95,910 544 831,337 2,028
Notes: 1. Water years assumed to run from 1 July to 30 June. 2. Marble Bar Catchment Area = 3,735.80 km2. 3. North Pole Mine
Catchment Area = 6,500.53 km2. 4. Coolenar Pool Catchment Area = 50,006.99 km2.

DESKTOP HYDRO‐METEOROLOGICAL STUDY
J1827R01 Final 29 May 2019
22
Table 18: Monthly Flow Parameters (ML) for Marble Bar, Coolenar Pool and North Pole Mine DoW Flow Monitoring Stations
Month Minimum Monthly Flow (ML) Maximum Monthly Flow (ML) Mean Monthly Flow (ML) Median Monthly Flow (ML)
Marble Bar1
Coolenar Pool2
North Pole3
Marble Bar1 Coolenar Pool2
North Pole3
Marble Bar1
Coolenar Pool2
North Pole3
Marble Bar1
Coolenar Pool2
North Pole3
Jan 0 0 0 123,423 1,518,232 284,424 13,707 228,209 35,852 1,734 2,244 220
Feb 0 0 0 239,388 1,606,690 587,190 33,281 280,581 67,550 6,041 127,123 7922
Mar 0 0 0 394,251 4,579,212 1,037,026 33,542 490,396 64,182 3,744 71,161 4092
Apr 0 0 0 102,493 1,898,478 366,451 10,528 185,377 18,437 131 5,562 2.5
May 0 0 0 25,590 219,299 21,197 1,421 19,958 1,484 42 2,117 0
Jun 0 0 0 79,547 328,525 106,993 2,564 15,970 3,642 58 800 0
Jul 0 0 0 5,488 104,647 13,367 347 6,716 474 26 259 0
Aug 0 0 0 12,951 67,490 20,258 501 4,301 618 5 0 0
Sep 0 0 0 737 7,135 168 35 507 4 0 0 0
Oct 0 0 0 193 2,432 0 10 152 0 0 0 0
Nov 0 0 0 1,763 2,759 257 57 114 7 0 0 0
Dec 0 0 0 230,537 1,077,815 339,679 5,834 62,437 17,068 0 0 0
Notes:
1. Marble Bar results based on 366 months of data recorded between February 1985 and July 2015. (Catchment Area = 3,735.80 km2).
2. North Pole Mine results based on 560 months of data recorded between March 1967 and September 2015. (Catchment Area = 6,500.53 km2).
3. Coolenar Pool results based on 472 months of data recorded between March 1973 and May 2015. (Catchment Area = 50,006.99 km2).
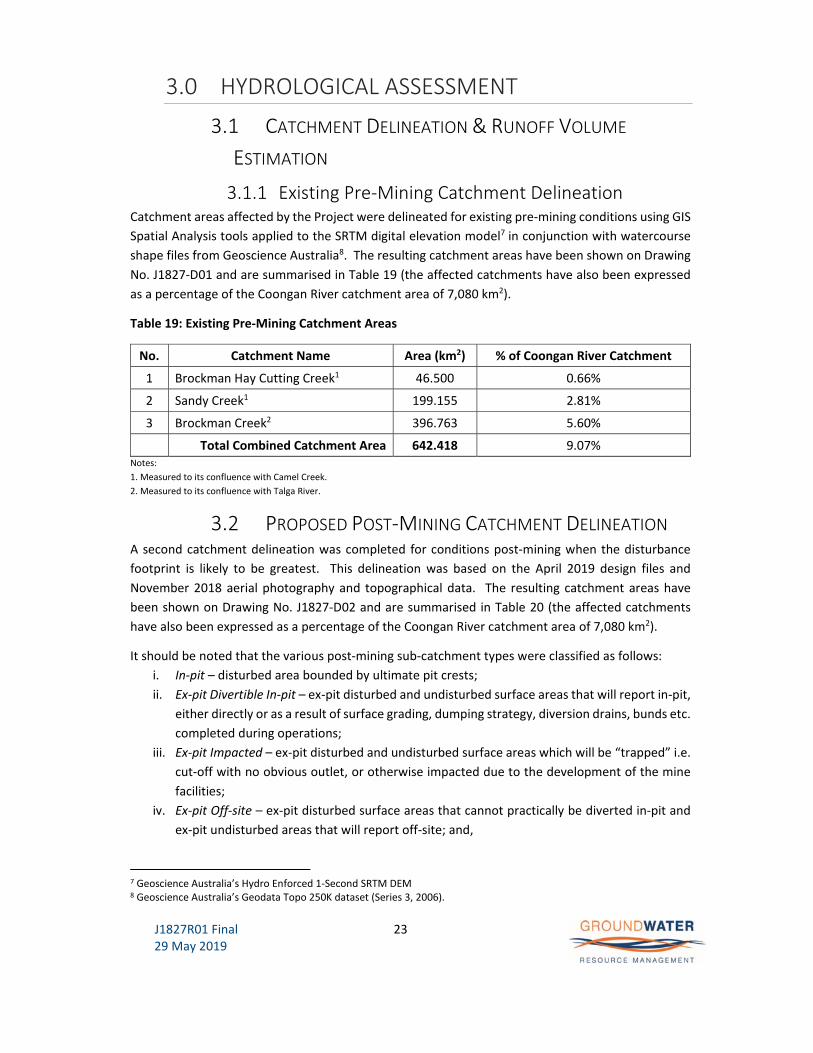
J1827R01 Final 29 May 2019
23
3.0 HYDROLOGICAL ASSESSMENT
3.1 CATCHMENT DELINEATION & RUNOFF VOLUME
ESTIMATION
3.1.1 Existing Pre‐Mining Catchment Delineation Catchment areas affected by the Project were delineated for existing pre‐mining conditions using GIS
Spatial Analysis tools applied to the SRTM digital elevation model7 in conjunction with watercourse
shape files from Geoscience Australia8. The resulting catchment areas have been shown on Drawing
No. J1827‐D01 and are summarised in Table 19 (the affected catchments have also been expressed
as a percentage of the Coongan River catchment area of 7,080 km2).
Table 19: Existing Pre‐Mining Catchment Areas
No. Catchment Name Area (km2) % of Coongan River Catchment
1 Brockman Hay Cutting Creek1 46.500 0.66%
2 Sandy Creek1 199.155 2.81%
3 Brockman Creek2 396.763 5.60%
Total Combined Catchment Area 642.418 9.07% Notes:
1. Measured to its confluence with Camel Creek.
2. Measured to its confluence with Talga River.
3.2 PROPOSED POST‐MINING CATCHMENT DELINEATION A second catchment delineation was completed for conditions post‐mining when the disturbance
footprint is likely to be greatest. This delineation was based on the April 2019 design files and
November 2018 aerial photography and topographical data. The resulting catchment areas have
been shown on Drawing No. J1827‐D02 and are summarised in Table 20 (the affected catchments
have also been expressed as a percentage of the Coongan River catchment area of 7,080 km2).
It should be noted that the various post‐mining sub‐catchment types were classified as follows:
i. In‐pit – disturbed area bounded by ultimate pit crests;
ii. Ex‐pit Divertible In‐pit – ex‐pit disturbed and undisturbed surface areas that will report in‐pit,
either directly or as a result of surface grading, dumping strategy, diversion drains, bunds etc.
completed during operations;
iii. Ex‐pit Impacted – ex‐pit disturbed and undisturbed surface areas which will be “trapped” i.e.
cut‐off with no obvious outlet, or otherwise impacted due to the development of the mine
facilities;
iv. Ex‐pit Off‐site – ex‐pit disturbed surface areas that cannot practically be diverted in‐pit and
ex‐pit undisturbed areas that will report off‐site; and,
7 Geoscience Australia’s Hydro Enforced 1‐Second SRTM DEM 8 Geoscience Australia’s Geodata Topo 250K dataset (Series 3, 2006).

HYDROLOGICAL ASSESSMENT
J1827R01 Final 29 May 2019
24
v. Off‐site/Downstream – areas that will not be affected by the Project.
Table 20: Proposed Post‐Mining Catchment Areas
No. Catchment Name & Sub‐Catchment
Type Area3 (km2)
% of Creek Catchment
Area
% of Coongan River Catchment
Area
1 Brockman Hay Cutting/Camel/Sandy Creek Catchment Area1
i In‐pit 0.296 0.64% <0.01%
ii Ex‐pit Divertible In‐pit 0.777 1.67% 0.01%
iii Ex‐pit Trapped 0 0% <0.01%
iv Ex‐pit Off‐site 4.835 10.40% 0.07%
v Off‐site/Downstream 40.593 87.30% 0.57%
Sub‐Total 46.500 100% 0.66%
2 Sandy Creek Catchment Area1
i In‐pit 0.094 0.05% <0.01%
ii Ex‐pit Divertible In‐pit 0.263 0.13% <0.01%
iii Ex‐pit Trapped 0 0% <0.01%
iv Ex‐pit Off‐site 0.426 0.21% 0.01%
v Off‐site/Downstream 198.372 99.61% 2.80%
Sub‐Total 199.155 100% 2.81%
3 Brockman Creek Catchment Area2
i In‐pit 0.087 0.02% <0.01%
ii Ex‐pit Divertible In‐pit 0 0% <0.01%
iii Ex‐pit Trapped 0 0% <0.01%
iv Ex‐pit Off‐site 0 0% <0.01%
v Off‐site/Downstream 396.676 99.98% 5.60%
Sub‐Total 396.763 100% 5.60%
Total Combined Catchment Area 642.418 100% 9.07% Notes:
1. Measured to its confluence with Camel Creek.
2. Measured to its confluence with Talga River.
3. Areas progressively rehabilitated during life of project have not been included in areas above.
The post‐mining sub‐catchment types were allocated to the pre‐mining catchment area within which
they were located and were summarised as follows:
Brockman Hay Cutting Creek Catchment Area – upon completion of mining this catchment
will encompass the majority of the Klondyke and all of the St George West Pits, approximately

HYDROLOGICAL ASSESSMENT
J1827R01 Final 29 May 2019
25
two thirds of the Klondyke Waste Rock Dump (WRD) and all of the Tailings Storage Facility
(TSF), including the tailings and reclaim pipeline corridor. In addition, the entire Copenhagen
Pit and both Copenhagen WRD’s will be located within the western part of the Brockman Hay
Cutting Creek catchment area.
The Klondyke pit crest area will be approximately 354,700 m2, with some 260,700 m2 of this
area within the Brockman Hay Cutting Creek catchment, along with all (18,690 m2) of the St
George West and the Copenhagen (16,810 m2) open pits, yielding a combined in‐pit Type i
sub‐catchment area of approximately 296,200 m2.
Much of the top surface of the Klondyke WRD and both Copenhagen WRD’s will be shaped
and graded to direct runoff into the Klondyke and Copenhagen Pits respectively. Runoff from
the western dump top and northern face of the Klondyke WRD (526,000 m2) and the narrow
strip of remaining natural ground between the pit and the WRD (118,000 m2) will be directed
into the Klondyke Pit, along with 65,000 m2 on the north side of the Pit. Runoff from all of
the Copenhagen North WRD (22,500 m2) and the dump top and northern face of the
Copenhagen South WRD (23,000 m2) will be diverted into the Copenhagen Pit, along with
22,000 m2 of remaining natural ground around the pit crest. The total ex‐pit divertible in‐pit
(Type ii) sub‐catchment area will therefore be about 776,500 m2.
The Klondyke WRD has been located and specifically designed to minimise impacts on the
existing drainage system by constructing dumps, where possible, within the uppermost parts
of the local catchments. A diversion channel will be constructed around the Copenhagen
mining area. As a result, no notable “trapped” or ex‐pit impacted (Type iii) sub‐catchment
areas will remain post‐mining within the Brockman Hay Cutting Creek catchment area.
At the cessation mining runoff from the southern faces of the Klondyke WRD (156,000 m2),
undisturbed areas upstream of the TSF impoundment (3,330,000 m2) and the ultimate tailings
surface (1,339,000 m2) will report off‐site via the TSF closure spillway. The southern face of
the Copenhagen South WRD (10,000 m2) will also report off‐site, giving a total Type iv sub‐
catchment area of approximately 4,835,000 m2.
The remaining undisturbed catchment area (Type v sub‐catchment) will therefore be in the
order of 40.6 km2 or approximately 87% of the pre‐development Brockman Hay Cutting Creek
catchment area.
Sandy Creek Catchment Area – upon completion of mining this catchment will encompass the
southeast corner of the Klondyke Pit, approximately one third of the Klondyke WRD, all of
the Plant, Camp and access roads (none of the Copenhagen mining area is located with the
Sandy Creek catchment area).
The south‐eastern corner of the Klondyke pit crest area will be within the Sandy Creek
catchment, yielding an in‐pit Type i sub‐catchment area of approximately 54,000 m2.
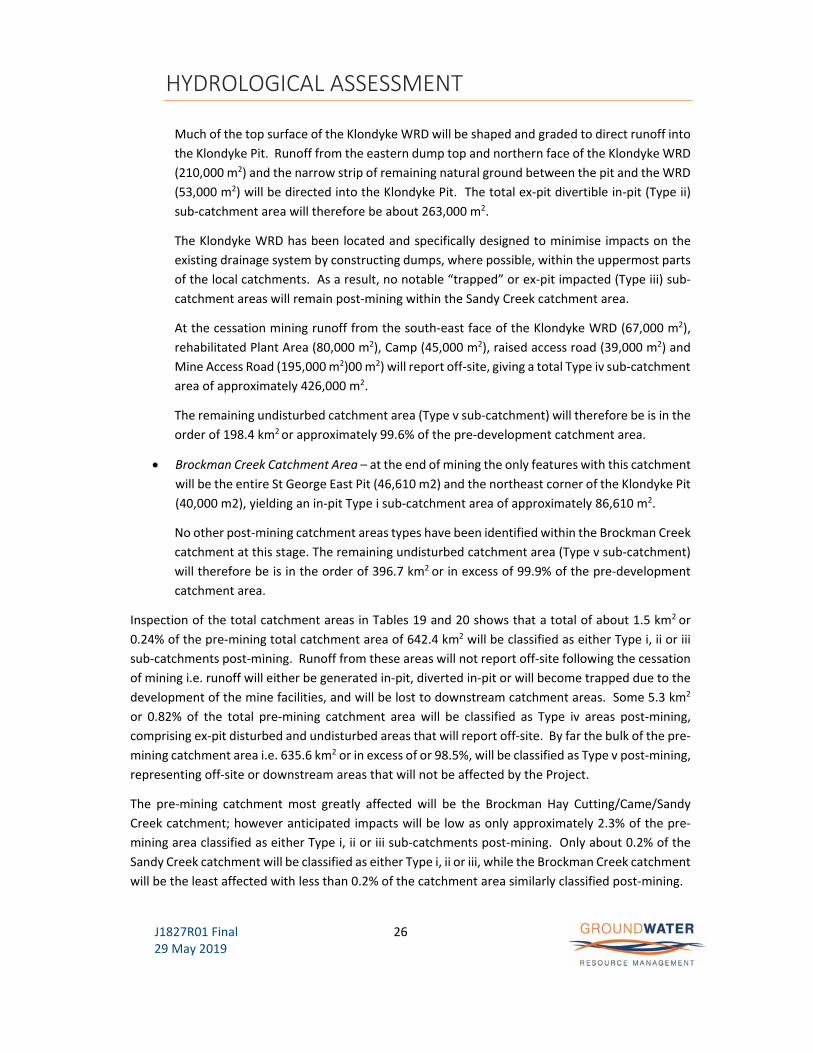
HYDROLOGICAL ASSESSMENT
J1827R01 Final 29 May 2019
26
Much of the top surface of the Klondyke WRD will be shaped and graded to direct runoff into
the Klondyke Pit. Runoff from the eastern dump top and northern face of the Klondyke WRD
(210,000 m2) and the narrow strip of remaining natural ground between the pit and the WRD
(53,000 m2) will be directed into the Klondyke Pit. The total ex‐pit divertible in‐pit (Type ii)
sub‐catchment area will therefore be about 263,000 m2.
The Klondyke WRD has been located and specifically designed to minimise impacts on the
existing drainage system by constructing dumps, where possible, within the uppermost parts
of the local catchments. As a result, no notable “trapped” or ex‐pit impacted (Type iii) sub‐
catchment areas will remain post‐mining within the Sandy Creek catchment area.
At the cessation mining runoff from the south‐east face of the Klondyke WRD (67,000 m2),
rehabilitated Plant Area (80,000 m2), Camp (45,000 m2), raised access road (39,000 m2) and
Mine Access Road (195,000 m2)00 m2) will report off‐site, giving a total Type iv sub‐catchment
area of approximately 426,000 m2.
The remaining undisturbed catchment area (Type v sub‐catchment) will therefore be is in the
order of 198.4 km2 or approximately 99.6% of the pre‐development catchment area.
Brockman Creek Catchment Area – at the end of mining the only features with this catchment
will be the entire St George East Pit (46,610 m2) and the northeast corner of the Klondyke Pit
(40,000 m2), yielding an in‐pit Type i sub‐catchment area of approximately 86,610 m2.
No other post‐mining catchment areas types have been identified within the Brockman Creek
catchment at this stage. The remaining undisturbed catchment area (Type v sub‐catchment)
will therefore be is in the order of 396.7 km2 or in excess of 99.9% of the pre‐development
catchment area.
Inspection of the total catchment areas in Tables 19 and 20 shows that a total of about 1.5 km2 or
0.24% of the pre‐mining total catchment area of 642.4 km2 will be classified as either Type i, ii or iii
sub‐catchments post‐mining. Runoff from these areas will not report off‐site following the cessation
of mining i.e. runoff will either be generated in‐pit, diverted in‐pit or will become trapped due to the
development of the mine facilities, and will be lost to downstream catchment areas. Some 5.3 km2
or 0.82% of the total pre‐mining catchment area will be classified as Type iv areas post‐mining,
comprising ex‐pit disturbed and undisturbed areas that will report off‐site. By far the bulk of the pre‐
mining catchment area i.e. 635.6 km2 or in excess of or 98.5%, will be classified as Type v post‐mining,
representing off‐site or downstream areas that will not be affected by the Project.
The pre‐mining catchment most greatly affected will be the Brockman Hay Cutting/Came/Sandy
Creek catchment; however anticipated impacts will be low as only approximately 2.3% of the pre‐
mining area classified as either Type i, ii or iii sub‐catchments post‐mining. Only about 0.2% of the
Sandy Creek catchment will be classified as either Type i, ii or iii, while the Brockman Creek catchment
will be the least affected with less than 0.2% of the catchment area similarly classified post‐mining.

HYDROLOGICAL ASSESSMENT
J1827R01 Final 29 May 2019
27
3.2.1 Proposed Mining Area Catchment Runoff Volume
Estimates In order to develop runoff volume estimates from the existing pre‐mining and proposed post‐mining
delineated catchments the Rational Method runoff coefficients shown in Table 21 were applied to 24
hour and 72 hour rainfall depths developed previously for the WGP (refer to rainfall intensity‐
frequency‐duration relationship in Appendix B).
Table 21: Runoff Coefficients for Mine Site Catchments
Catchment Type Runoff Coefficient, C
Undisturbed catchments 25%
In‐pit slopes and benches 100%
Rock Dump Top (no capping, no rehab) 15%
Rock Dump Sides (no capping, no rehab) 40%
Recently graded areas (gravelly soil, no rehab) 55%
Haul Roads, sheeted 70%
The resulting runoff volume estimates for the existing pre‐mining and proposed end of mining
catchments for 24 and 72 hour durations events with a range of ARI’s are shown in Tables 22 and 23
(a calculation worksheet is presented in Appendix E).
Table 22: Existing Pre‐Mining Catchment Runoff Volume Estimates
No. Catchment Name
Runoff Volume (GL) for 24 hour Duration Events
Runoff Volume (GL) for 72 hour Duration Events
20% AEP
10% AEP
5% AEP
2% AEP
1% AEP
20% AEP
10% AEP
5% AEP
2% AEP
1% AEP
1
Brockman Hay Cutting Creek
1.20 1.51 1.85 2.31 2.69 1.56 1.96 2.36 2.87 3.26
2 Sandy Creek
5.13 6.47 7.92 9.91 11.50 6.67 8.41 10.11 12.30 13.94
3 Brockman Creek
10.22 12.89 15.77 19.74 22.91 13.29 16.76 20.14 24.50 27.77
Total 16.54 20.88
25.54
31.96
37.10
21.52
27.14
32.60
39.67
44.97
Review of the volumetric estimates shown in Table 22 indicate that the existing pre‐mining catchment
areas jointly produce between 16.5 and 37.1 GL of runoff as a result of 20 to 1% AEP‐24 hour duration

HYDROLOGICAL ASSESSMENT
J1827R01 Final 29 May 2019
28
events respectively. Runoff volumes of between 21.5 and 45.0 GL are estimated as a result of 20 to
1% AEP‐72 hour duration events respectively. Given that this is for pre‐mining conditions, all of this
runoff would report off‐site, downstream of the proposed mining areas.
Table 23 for post‐mining conditions shows that the combined Type iv and v runoff volumes that will
report off‐site/downstream is about 99.8% of the pre‐mining volume for the same events i.e.
approximately 0.2% of the pre mining catchment runoff volume will either be generated in‐pit,
diverted in‐pit or become trapped due to the development of the mine facilities and will be lost to
downstream catchment areas.
The catchment most greatly affected as a result of mining activities will be the Brockman Hay Cutting
Creek catchment with approximately 97.7% of the pre‐mining runoff volume being generated post‐
mining. Sandy Creek catchment will generate approximately 99.8% of pre‐mining runoff volumes,
while impacts on the Brockman Creek catchment north of the Warrawoona ridge will be negligible
with greater than 99.9% of pre‐mining runoff volumes being generated post‐mining.

HYDROLOGICAL ASSESSMENT
J1827R01 Final 29 May 2019
29
Table 23: Proposed Post‐Mining Catchment Runoff Volume Estimates
(Note: Refer to Table 20 for an assessment based on Proposed Post‐Mining Catchment Areas)
No. Catchment Name Sub‐Catchment Runoff Volume (GL) for 24 hour Duration Events
Runoff Volume (GL) for 72 hour Duration Events
20% AEP
24 hour
10% AEP
24 hour
5% AEP
24 hour
2% AEP
24 hour
1% AEP
24 hour
5 yr AEP
72 hour
10 yr AEP
72 hour
20 yr AEP
72 hour
50 yr AEP
72 hour
100 yr AEP
72 hour
1 Brockman Hay Cutting Creek
i In‐pit 0.03 0.04 0.05 0.06 0.07 0.04 0.05 0.06 0.07 0.08
ii Ex‐pit Divertible In‐pit 0.03 0.04 0.05 0.06 0.07 0.04 0.05 0.06 0.08 0.09
iii Ex‐pit Trapped 0.00 0.00 0.00 0.00 0.00 0.00 0.00 0.00 0.00 0.00
iv Ex‐pit Off‐site 0.12 0.16 0.19 0.24 0.28 0.16 0.20 0.25 0.30 0.34
v. Off‐site/Downstream 1.05 1.32 1.61 2.02 2.34 1.36 1.72 2.06 2.51 2.84
Sub‐Total 1.23 1.56 1.90 2.38 2.76 1.60 2.02 2.43 2.96 3.35
2 Sandy Creek
i In‐pit 0.01 0.01 0.01 0.02 0.02 0.01 0.02 0.02 0.02 0.03
ii Ex‐pit Divertible In‐pit 0.01 0.01 0.02 0.02 0.02 0.01 0.02 0.02 0.03 0.03
iii Ex‐pit Trapped 0.00 0.00 0.00 0.00 0.00 0.00 0.00 0.00 0.00 0.00
iv Ex‐pit Off‐site 0.01 0.01 0.02 0.02 0.02 0.01 0.02 0.02 0.03 0.03
v. Off‐site/Downstream 5.11 6.45 7.89 9.87 11.46 6.65 8.38 10.07 12.25 13.89
Sub‐Total 5.14 6.49 7.93 9.93 11.53 6.69 8.43 10.13 12.32 13.97
3 Brockman Creek
i In‐pit 0.01 0.01 0.01 0.02 0.02 0.01 0.01 0.02 0.02 0.02
ii Ex‐pit Divertible In‐pit 0.00 0.00 0.00 0.00 0.00 0.00 0.00 0.00 0.00 0.00
iii Ex‐pit Trapped 0.00 0.00 0.00 0.00 0.00 0.00 0.00 0.00 0.00 0.00
iv Ex‐pit Off‐site 0.00 0.00 0.00 0.00 0.00 0.00 0.00 0.00 0.00 0.00
v. Off‐site/Downstream 10.21 12.89 15.77 19.73 22.91 13.29 16.76 20.13 24.49 27.77
Sub‐Total 10.22 12.90 15.78 19.75 22.93 13.30 16.77 20.15 24.52 27.79
Total 16.60 20.95 25.62 32.06 37.22 21.59 27.23 32.71 39.80 45.11
Total Volume Off‐Site ‐ Types iv & v (GL) 16.50 20.83 25.48 31.88 37.01 21.47 27.08 32.53 39.58 44.86
Pre‐Mining Volume (GL) 16.54 20.88 25.54 31.96 37.10 21.52 27.14 32.60 39.67 44.97
% of Pre‐Mining Volume 99.8% 99.8% 99.8% 99.8% 99.8% 99.8% 99.8% 99.8% 99.8% 99.8%

J1827R01 Final 29 May 2019
30
4.0 SURFACE WATER MANAGEMENT
4.1 SURFACE WATER MANAGEMENT OBJECTIVES The following three goals define the surface water management objectives for the WGP:
Reduce Potential Risk of Loss of Life, Health Hazards or Property Damage:
provide protection for life, livelihood, and property;
control the incidence of nuisance or damage related to flooding, poor drainage and
sedimentation to an acceptable level; and,
protect project infrastructure.
Preserve the Environment
minimise the potential project impacts such as changes in the stream‐flow regime, alteration
of habitat, pollution or increased erosion and sedimentation;
where feasible, maintain the shape and composition (geomorphology) of the natural
watercourse geometry, natural biological indicator conditions and flow conditions;
employ protection measures to prevent adverse hydrological and water quality impacts for
all recognised watercourses within the site limits;
promote sound development that respects the natural environment; and,
rehabilitate any watercourses that are impacted as soon as practicable.
Conserve Social and Financial Resources
treat water as a resource, ensuring that water management facilities are functional and
integrate multi‐use objectives where possible;
provide a system of infrastructure that enhances site personnel convenience and safety, and
allows development to proceed according to the mine plan;
sustain future mine development, support orderly and managed development of resources
and integration of land uses within the site limits;
use best management water and sediment practices where feasible; and,
encourage economic design of drainage systems.
These objectives are intended to ensure a consistent approach to:
planning and analyses required for surface water management;
constructing new operational phase surface water management works; and,
installing future closure phase surface water management works
The design philosophy and design criteria for pit flood protection and surface water management are
presented in the following sections. The PFS level design of the various water management facilities
is presented in Section 5.0

SURFACE WATER MANAGEMENT
J1827R01 Final 29 May 2019
31
4.2 HYDROLOGICAL RISK All the watercourses and drainages in the vicinity of the WGP are ephemeral. However, flows will
occur periodically during the summer months from January to March, when the potential exposure
to high intensity rainfall is greatest. Consequently runoff will report to the watercourses in the vicinity
of the project and, on occasion, flows may be high and may cause flooding if appropriate measures
are not in place.
The hazard that such flooding poses to project infrastructure depends, amongst other things, on the
following:
the magnitude of the flood event;
the proximity of the facility to the watercourse in flood;
the sensitivity of the facility to flooding; and,
the level of protective flood measures provided to the facility.
While the latter three factors can be controlled or engineered to some degree, the magnitude of the
naturally occurring rainfall‐runoff events may lead to flooding that cannot be controlled.
Although significant rainfall‐runoff events do not occur cyclically, especially in a climatic region as
variable as this, their probability of occurrence within any given period can be estimated. The
reciprocal of this probability is typically expressed as an AEP and is the time that, on average, elapses
between two events that equal or exceed the magnitude in question.
Table 24 shows the percentage probability for a range of different AEP flood events that could occur
during assumed 10, 20 and 30 year long operational periods.
Table 24: Percentage Probability of N‐Year AEP Flood Event Occurring During 10, 20 and 30 Year
Operational Periods
Annual Exceedance Probability (AEP)
20% AEP
10% AEP
5% AEP
2% AEP
1% AEP
0.5% AEP
0.2% AEP
Probability of Occurrence in 10 yrs 89.3% 65.1% 40.1% 18.3% 9.6% 4.9% 2.0%
Probability of Occurrence in 20 yrs 98.8% 87.8% 64.2% 33.2% 18.2% 9.5% 3.9%
Probability of Occurrence in 30 yrs 99.9% 95.8% 78.5% 45.5% 26.0% 14.0% 5.8%
Typically a range of AEP events are used for the design of various mine facilities, depending on the
consequences of failure and the period of exposure. Clearly, as the duration of the exposure period
increases due to a longer operational life, the probability of a rainfall event of a certain severity
occurring is greater. It is recommended that a 1% AEP event be adopted for the design of all open
pit protection and TSF surface water management measures during Operations. A minimum 10% AEP
criterion is considered appropriate for the design of all other surface water management measures.
SURFACE WATER MANAGEMENT
J1827R01 Final 29 May 2019
32
4.3 PIT FLOOD PROTECTION The site visit findings and inspection of the available topographical data and aerial photography
indicate that the greatest potential flood risks to the proposed Pits relate to the following:
Copenhagen Pit Upstream Catchment Area – an approximately 2.2 km2 upstream catchment
area lies to the northeast of the proposed Copenhagen Pit. A combination of strategically
placed WRD and diversion channel will be used to ameliorate the potential risk of runoff from
this area reporting in‐pit (the preliminary engineering design of the diversion is described in
more detail in Section 5.0); and,
Klondyke, St George East and West and Copenhagen Pit Crest Catchments ‐ flood protection
will be provided to all the proposed pits by a combination of the following measures:
o Waste rock dumps strategically placed along the upstream side of all pits where possible;
o Sections of rock‐armoured flood protection bund/diversion drain placed around pit crests
where practicable (bunds will be offset sufficiently far from pit crests to also serve as
Abandonment Bunds as required);
o Pit crest/safety bund placed as close as geotechnically possible to pit crest to minimise
runoff from areas adjacent to pit crests;
o “Roll‐over” at the top of pit ramps; and,
o Ex‐pit roadside drains to direct runoff away from the pits.
It should be noted that as mining proceeds, numerous, relatively small upslope catchment areas and
drainages will be intersected by the development of the pit crests. In many cases it will be impractical
to construct flood protection bunds and drains and runoff reporting from such areas will have to be
dealt with in‐pit. This is discussed further in the following section.
4.4 IN‐PIT RUNOFF VOLUME ESTIMATE Even with the provision of the surface water management measures identified above some amount
of runoff will still report to the floor of the Klondyke, St George East and West and Copenhagen pits
from direct precipitation and from small, adjacent trapped catchments. Such rainfall‐runoff will
typically collect at the lowest points on the pit floors and will need to be removed using in‐pit sump
pumps in order to minimise interruptions to operations (given that underground workings are not
currently proposed, it is not considered to pose a significant mine safety risk).
An estimate of the anticipated rainfall‐runoff volume from a range of events is presented in Table 25
for all four proposed open pits. The volumes were based on pit crest areas plus a 15% allowance for
small trapped areas adjacent to the pit crests, a 100% runoff coefficient and rainfall depths of 86,
134, 169, 203, 247 and 280 mm for 2, 5, 10, 20, 50 and 1% AEP‐72 hour duration events (refer to
rainfall IFD in Appendix B).
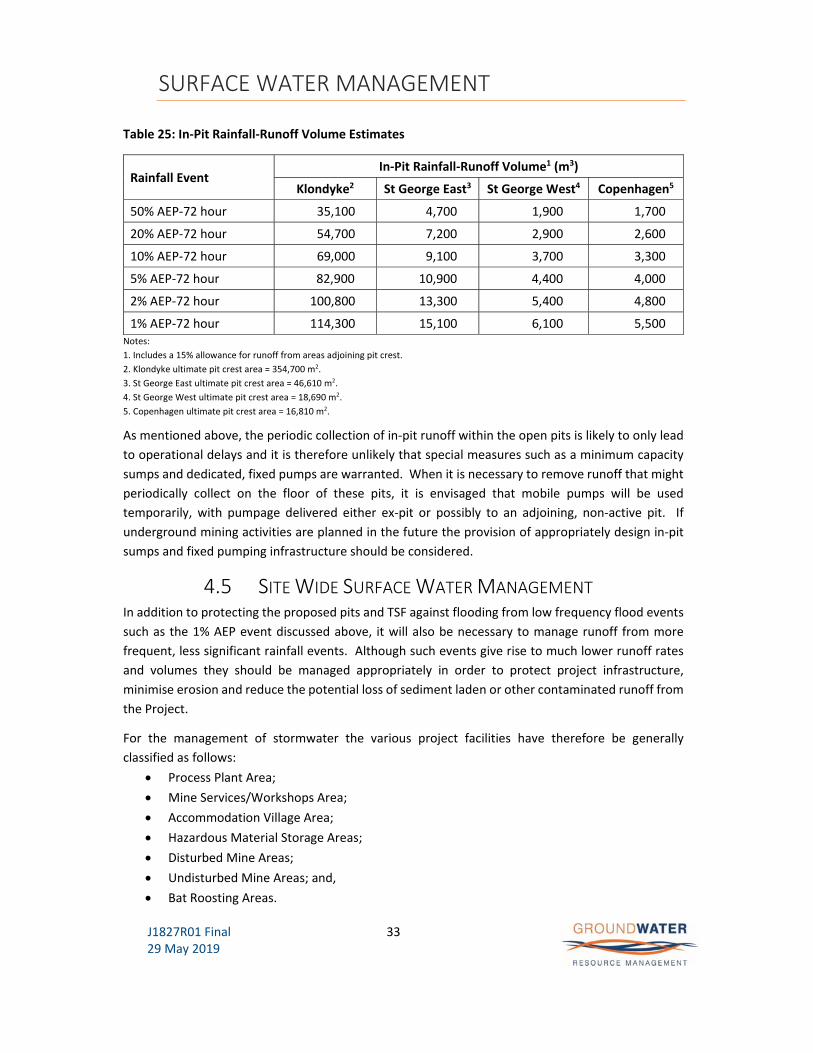
SURFACE WATER MANAGEMENT
J1827R01 Final 29 May 2019
33
Table 25: In‐Pit Rainfall‐Runoff Volume Estimates
Rainfall Event In‐Pit Rainfall‐Runoff Volume1 (m3)
Klondyke2 St George East3 St George West4 Copenhagen5
50% AEP‐72 hour 35,100 4,700 1,900 1,700
20% AEP‐72 hour 54,700 7,200 2,900 2,600
10% AEP‐72 hour 69,000 9,100 3,700 3,300
5% AEP‐72 hour 82,900 10,900 4,400 4,000
2% AEP‐72 hour 100,800 13,300 5,400 4,800
1% AEP‐72 hour 114,300 15,100 6,100 5,500 Notes:
1. Includes a 15% allowance for runoff from areas adjoining pit crest.
2. Klondyke ultimate pit crest area = 354,700 m2.
3. St George East ultimate pit crest area = 46,610 m2.
4. St George West ultimate pit crest area = 18,690 m2.
5. Copenhagen ultimate pit crest area = 16,810 m2.
As mentioned above, the periodic collection of in‐pit runoff within the open pits is likely to only lead
to operational delays and it is therefore unlikely that special measures such as a minimum capacity
sumps and dedicated, fixed pumps are warranted. When it is necessary to remove runoff that might
periodically collect on the floor of these pits, it is envisaged that mobile pumps will be used
temporarily, with pumpage delivered either ex‐pit or possibly to an adjoining, non‐active pit. If
underground mining activities are planned in the future the provision of appropriately design in‐pit
sumps and fixed pumping infrastructure should be considered.
4.5 SITE WIDE SURFACE WATER MANAGEMENT In addition to protecting the proposed pits and TSF against flooding from low frequency flood events
such as the 1% AEP event discussed above, it will also be necessary to manage runoff from more
frequent, less significant rainfall events. Although such events give rise to much lower runoff rates
and volumes they should be managed appropriately in order to protect project infrastructure,
minimise erosion and reduce the potential loss of sediment laden or other contaminated runoff from
the Project.
For the management of stormwater the various project facilities have therefore be generally
classified as follows:
Process Plant Area;
Mine Services/Workshops Area;
Accommodation Village Area;
Hazardous Material Storage Areas;
Disturbed Mine Areas;
Undisturbed Mine Areas; and,
Bat Roosting Areas.

SURFACE WATER MANAGEMENT
J1827R01 Final 29 May 2019
34
4.5.1 Process Plant Area Rain falling within wet processing areas will be collected within bunded areas and returned to the
process. Provision will be made for the return of such flows to the process by means of drains,
launders, sumps, pumps etc. Alternatively, if of acceptable quality, such water may be used for dust
suppression within the process area.
4.5.2 Mine Services/Workshops Area The Mine Services/Workshop Area will include surface water runoff and wash‐down water drainage
and recovery systems. Rainfall runoff from the Mine Services/Workshops area including roads,
building roofs, laydown yards etc. will be captured in open drains. The drains will report to Water
Management/Sedimentation Pond(s) where water will be temporarily stored prior to reuse.
To aid management of runoff from areas likely to be impacted by hydrocarbons, e.g. fuel storage and
dispensing areas, truck wash and workshops, runoff from these areas will be captured using open
drains that report to an oily water separator (OWS) provided upstream of Water
Management/Sedimentation Pond(s).
Mine Services/Workshops area drains will be sized for the peak of the 10% AEP event as a minimum.
Flow velocities along such drains will be limited to minimise erosion and the generation of sediment.
4.5.3 Hazardous Materials Storage Areas All chemical, oil and other hazardous material storage areas within the Plant or Mine
Services/Workshop Area will be enclosed within a bund in accordance with the relevant codes and
standards. Water collected within the bunds will be assessed and, if suitable, will be discharged to
Water Management/Sedimentation Pond(s).
Water collected within the bunds, that is found to be impacted, will be disposed of appropriately.
4.5.4 Disturbed Areas Outside the Plant and Mine Services/Workshops areas the mine facilities will comprise various pits,
waste rock dumps, topsoil stockpiles, ROM, TSF and access and haul roads. Source controls will be
used to improve the quality of runoff from these facilities. Runoff from these facilities will be directed
to Water Management/Sedimentation Pond(s) where possible.
For runoff within the proposed pit, source controls will comprise practices such as mining from upper
benches or processing stockpiled material following significant rainfall events. In‐pit sumps will be
used to settle out sediment from collected runoff prior to pumping to surface for re‐use or discharge
off‐site.
All dump tops and upper surfaces will be back‐graded and/or edge bunding used to ensure positive
drainage and to prevent runoff from reporting over dump crests and eroding dump sloped.
Intermediate benches on dumps will be back‐graded to break up long slope lengths and longitudinal

SURFACE WATER MANAGEMENT
J1827R01 Final 29 May 2019
35
grades will be used on benches to direct runoff either off the dump or to rock‐armoured chutes and
drains. Toe drains leading to sediment traps and basins constructed opportunistically along the WRD
toe will be used to temporarily detain runoff and to ensure that water reporting off‐site satisfies Total
Suspended Sediment requirements.
Run‐off from disturbed and undisturbed catchment areas upstream of the TSF will report to the
reclaim pond where it will be temporarily stored before being returned to the Plant for re‐use. The
TSF will function as a “zero‐discharge” facility during Operations and sufficient freeboard will be
provided on the embankment to store runoff from upstream areas in addition to the tailings
impoundment for the 1% AEP 72 hour duration event (280 mm).
4.5.5 Undisturbed Areas All practical steps will be taken to divert runoff from undisturbed catchment areas around all
proposed mine facilities to minimise potential lowering of water quality. Diversion channels around
mining areas will be designed for the 1% AEP event or for the 10% AEP event for diversions around
less sensitive facilities. Flow velocities along all diversion channels will be limited to minimise erosion
and the generation of sediment.
4.5.6 Bat Roosting Areas Bat roosting areas have been identified (by others) within historical underground workings in the
vicinity of the proposed Klondyke mining area, in addition to one located at the abandoned Comet
Mine located approximately 18 km to the northwest. The bulk of these have been identified as
nocturnal or night refuges/roosts, while several of them have been classified as maternity or diurnal
roosts as described in more detail elsewhere in the Project documentation.
With the exception of the remote Comet Pit roost and Criterion roost, all of the other identified areas
are located within the Brockman Hat Cutting catchment area, as shown in Figure 6. The thirteen
historical workings closest to the proposed Klondyke Pit, WRD and TSF are shown in Figure 7 and are
summarised in Table 26, along with their approximate height above the proposed ultimate tailings
beach where relevant. Inspection of these heights indicates the following:
Eight underground workings adjacent to the proposed TSF are situated between 5 and 19 m
approximately above the ultimate tailings beach elevation; and,
Five of the underground workings i.e. Gauntlet, Gauntlet Northwest 1, Golden Gauntlet, Gift
Decline and Criterion, are located outside of the proposed TSF upstream catchment area.
The entrance to the Klondyke Queen underground workings at elevation 281.0 mAHD is also situated
some 8 m above the 273.0 mAHD invert elevation of the ephemeral watercourse immediately to the
southeast of the roost and approximately 2 m above the lowest crest elevation of 279.0 mAHD at the
western end of the Klondyke Pit. Therefore no potential flooding impacts are envisaged at this stage
as a result of developing the TSF or Klondyke Pit within the Brockman Hay Cutting Creek catchment.

SURFACE WATER MANAGEMENT
J1827R01 Final 29 May 2019
36
The entrance to the Bow Bells South workings is located some 4 km northwest of the proposed
Klondyke mining area near a ridge crest at approximate elevation 300 mAHD. As such the entrance
to these workings is in the order of 30 m above the ephemeral watercourses along either side of the
ridge.
Table 26: Bat Roosts in Vicinity of Proposed Klondyke Mining Area Facilities
Roost ID Existing Elevation (mAHD)
TSF Ultimate Beach Elevation
(mAHD)
Roost Height above TSF Ultimate Beach
(m)
Klondyke Queen ‐ Adit 281.0 269.0 12.0
Klondyke No 1 West 277.4 268.5 8.9
Wheel of Fortune East 284.1 268.5 15.6
Dawson City 273.0 268.0 5.0
Klondyke Boulder 275.8 268.0 7.8
Trible Event 284.3 265.0 19.3
Trible Event NW 279.5 265.0 14.5
Gauntlet SE 283.4 265.0 18.4
Gauntlet 292.4 N/A
Roosts located outside TSF upstream catchment area
Gauntlet Northwest 1 275.7 N/A
Golden Gauntlet 269.0 N/A
Gift ‐ Decline 259.0 N/A
Criterion 287.7 N/A
4.6 DRAINAGE AND SEDIMENT CONTROL DESIGN CRITERIA The following design criteria will be applied to drainage measures for the project facilities:
4.6.1 Peak Flow Estimation Peak discharges from catchment areas of less than 10 hectares will be estimated using the Rational
Method (i.e. Q = CIA). The average run‐off coefficient (C) will be based on the values presented in
Table 27 below.
Table 27: Run‐off Coefficients
Catchment Type Run‐off Coefficient
Undisturbed areas 0.20
Gravel roads and yard areas 0.50
Asphalt, concrete and roof areas 0.90
Rainfall intensity (I) for the event duration will be interpolated from the rainfall Intensity Duration
Frequency (IDF) relationship developed for the LRGP provided in Appendix B. The time of

SURFACE WATER MANAGEMENT
J1827R01 Final 29 May 2019
37
concentration of each catchment area will be determined in accordance with the Kirpich Equation as
follows:
Tc = 0.00032 × L0.77 ÷ S0.385
Where:
Tc = Time of concentration (hours).
L = Maximum length of water travel (m).
S = Average Slope (m/m).
The minimum time of concentration to be used for design purposes will be 5 minutes. Catchment
areas (A) will either be measured directly in the field or calculated using CAD tools and the latest field
survey data.
Peak discharge estimates from areas larger than 10 hectares will be obtained by using hydrologic
modelling methods such as those presented in ARR16.
4.6.2 Channel Design Channel design parameters will be determined using Manning’s Equation as follows:
Q = (A R2/3 S1/2)/n
Where:
Q = flow rate (m3/sec).
A = cross‐sectional area of channel (m2).
n = roughness coefficient, as per values presented below (dimensionless).
R = hydraulic radius, i.e. cross‐sectional area, A, divided by wetted perimeter, P (m)
S = channel slope (m/m).
Roughness coefficients will be based on the values presented in Table 28 below:
Table 28: Roughness Coefficients
Channel Type Roughness Coefficient
Unlined Earth, Clean, recently completed 0.016‐0.018
Unlined Earth, With short grass, few weeds 0.022‐0.027
Unlined Rock, Smooth and uniform 0.035‐0.040
Unlined Rock, Jagged and irregular 0.040‐0.045
Lined, Formed concrete 0.017‐0.020
Lined, Random stone mortar 0.020‐0.023
Lined, Dry rubble (rip‐rap) 0.023‐0.033

SURFACE WATER MANAGEMENT
J1827R01 Final 29 May 2019
38
4.6.3 Drainage Design Open Drain Construction
Open drain construction will be based upon the following criteria:
Minimum self‐cleansing velocity of 0.7 m/sec for a 50% AEP event;
Maximum velocity of 1.0 m/s for a 10% AEP event for unlined earth channels with no specific
erosion protection;
Minimum 250 mm freeboard on open drains; and,
Channel erosion control protection in the form of appropriate drop structures, rock check
dams, rock‐lined channels or concrete lined channels.
Culvert Installation The minimum culvert diameter will be 450 mm. Culverts will be installed at slopes that will provide
self‐cleansing minimum velocities of 0.7 m/s for one‐third depth of full‐flow wherever possible.
Hardstand Area Drainage Hardstand area drainage will be designed with a minimum surface grade of 0.5% in open yard areas
and a minimum grade of 2% for a distance of 25 m away from structures.
Hardstand areas with finished elevations 1 m or greater above natural surface elevations will have a
safety bund constructed along their outside edge. Suitably spaced breaks will be placed along the
bund to allow runoff to escape. Rock or geomembrane lined slope drains will be constructed at these
breaks to minimise erosion of fill material.
4.6.4 Water Management/Sedimentation Pond Design For preliminary design purposes water management/sedimentation ponds will be designed to store
runoff from the 10% AEP 24‐hour rainfall event i.e. 130 mm rainfall, without discharge.
The detailed design of sedimentation ponds will be based on removing the settleable fraction down
to a selected minimum design particle size based on an analysis of the sediment particle size
distribution reporting to the pond. The adopted design particle size will correspond to 25% of the
sample passing by weight or an absolute minimum particle size of 20 micron (unless chemical
coagulant dosing is used). The required pond surface area will be estimated using the peak inflow
rate and design particle settling velocity according to Stokes Law and applying published
sedimentation efficiency factors9.
9 The Constructed Wetlands Manual (Volumes 1 & 2), Department of Land and Water Conservation,
New South Wales, 1998.
SURFACE WATER MANAGEMENT
J1827R01 Final 29 May 2019
39
Sedimentation ponds will have a minimum live settling depth of 1 m and an aspect ratio (length:
width) of not less than 3:1 and preferably 5:1. Sufficient provision for dead (sediment) storage and
freeboard will also be made.
4.6.5 Oily Water Separator Design All potentially hydrocarbon impacted water from washdown and re‐fuelling facilities will be directed
to a suitable gravity type OWS prior to collection and re‐use.
4.7 CLOSURE SURFACE WATER MANAGEMENT Catchment areas affects at the cessation of mining were discussed earlier in Section 3.0 and an
estimate was made of runoff volume impacts for 24 and 72 hour events for a range of different ARI’s.
The following general principles will be adopted for surface water management at the end of the
operational life of the Project to ameliorate these impacts (it should be noted that more detailed
Closure criteria and measurement tools have been developed by others and have been presented
elsewhere in the Project documentation).
4.7.1 Ex‐pit Undisturbed Areas Similar to requirements during operations, run‐off from undisturbed areas within the Project
boundaries will be diverted around remnant facilities and into existing natural watercourses or
drainage lines by providing diversion bunds and drains. Flow velocities along all diversion drains will
be limited to minimise erosion and the generation of sediment.
4.7.2 Ex‐pit Disturbed Areas All practical steps will be taken to maximise the disturbed catchment areas that can be diverted
towards the various pit voids at the end of operations. A range of measures including modified
dumping strategies, revised road grading, training bunds, channel cuttings etc. will be used to ensure
that the minimum amount of runoff from disturbed catchment areas reports off‐site.
All dump tops and upper surfaces will be graded in order to promote infiltration where possible.
An engineered spillway will be constructed on the left hand (southern) abutment of the TSF
embankment and will be designed to safely pass the peak of the PMF event. The design of the Closure
TSF Spillway (by others) is reported elsewhere in the Project documentation.
Haul road drainage will be directed in‐pit wherever possible. For roads downstream of the pits,
following the cessation of operations, roads will be breached at various locations and drainage lines
reinstated to a natural, pre‐development state.
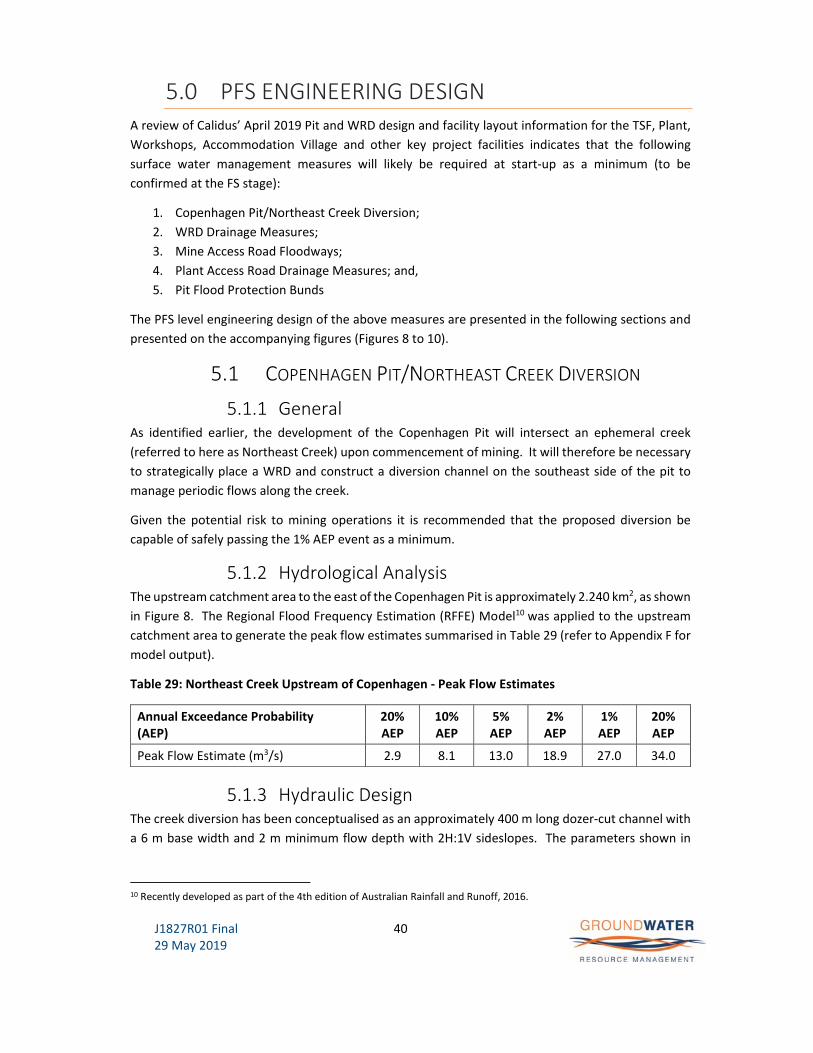
J1827R01 Final 29 May 2019
40
5.0 PFS ENGINEERING DESIGN A review of Calidus’ April 2019 Pit and WRD design and facility layout information for the TSF, Plant,
Workshops, Accommodation Village and other key project facilities indicates that the following
surface water management measures will likely be required at start‐up as a minimum (to be
confirmed at the FS stage):
1. Copenhagen Pit/Northeast Creek Diversion;
2. WRD Drainage Measures;
3. Mine Access Road Floodways;
4. Plant Access Road Drainage Measures; and,
5. Pit Flood Protection Bunds
The PFS level engineering design of the above measures are presented in the following sections and
presented on the accompanying figures (Figures 8 to 10).
5.1 COPENHAGEN PIT/NORTHEAST CREEK DIVERSION
5.1.1 General As identified earlier, the development of the Copenhagen Pit will intersect an ephemeral creek
(referred to here as Northeast Creek) upon commencement of mining. It will therefore be necessary
to strategically place a WRD and construct a diversion channel on the southeast side of the pit to
manage periodic flows along the creek.
Given the potential risk to mining operations it is recommended that the proposed diversion be
capable of safely passing the 1% AEP event as a minimum.
5.1.2 Hydrological Analysis The upstream catchment area to the east of the Copenhagen Pit is approximately 2.240 km2, as shown
in Figure 8. The Regional Flood Frequency Estimation (RFFE) Model10 was applied to the upstream
catchment area to generate the peak flow estimates summarised in Table 29 (refer to Appendix F for
model output).
Table 29: Northeast Creek Upstream of Copenhagen ‐ Peak Flow Estimates
Annual Exceedance Probability (AEP)
20% AEP
10% AEP
5% AEP
2% AEP
1% AEP
20% AEP
Peak Flow Estimate (m3/s) 2.9 8.1 13.0 18.9 27.0 34.0
5.1.3 Hydraulic Design The creek diversion has been conceptualised as an approximately 400 m long dozer‐cut channel with
a 6 m base width and 2 m minimum flow depth with 2H:1V sideslopes. The parameters shown in
10 Recently developed as part of the 4th edition of Australian Rainfall and Runoff, 2016.

PFS ENGINEERING DESIGN
J1827R01 Final 29 May 2019
41
Table 30 were therefore adopted for preliminary hydraulic design purposes (refer to diversion plan
and longitudinal section in Figure 9):
Table 30: Copenhagen Pit/Northeast Creek Diversion Channel Preliminary Design Parameters
Parameter Unit Value Comment
Channel Length m 400 ‐
Inlet Invert Elevation mRL 238.0 Based on 1 m contour set
Outlet Invert Elevation mRL 237.0 Based on 1 m contour set
Minimum Channel Slope m/m 0.0025 0.25 %
Manning’s Roughness ‘n’ ‐ 0.035 Assumed unlined
Channel Base Width m 6 ‐
Channel Sideslope Angle ‐ 26.6° 2H:1V
Channel Flow Depth m 2.0 1% AEP peak flow depth
Channel Freeboard (min.) m 0.5 ‐
Channel Depth (min.) m 2.5 ‐
Channel Width (min.) m 16 Width between shoulders
Horizontal Curve Radius (min) m 40.0 ‐
The proposed diversion alignment comprises several horizontal curve and straight sections with a
combined length of approximately 400 m aligned in a roughly east to west direction and offset 15 m
from the toe of the Copenhagen South WRD. The channel cutting will be approximately 4.0 m deep
at the deepest point, some 210 m downstream of the inlet.
The channel inlet and outlet will be formed by placement of select rock from the channel excavation
and will be lined with riprap to provide additional security. The inlet and outlet design will be
considered in more detail at the detailed design stage.
Preliminary earthworks modelling indicates that approximately 5,500 m3 of cut will be required to
construct the diversion channel.
5.2 WRD DRAINAGE MEASURES Staged WRD construction plans were unavailable to the current PFS, but will likely be available to the
FS. It was therefore currently not possible to prepare staged surface water management plans for
the development of the various WRD drainage measures.
Nevertheless, it is recommended that a standardised approach be adopted by Calidus when
constructing the various WRD’s to facilitate surface water management during Operations. This
standardised approach should generally comprise the following:
Benches should be graded back at 5% from dump edge and longitudinally at 0.25‐0.50% to
the closest “contact” channel or slope drain.

PFS ENGINEERING DESIGN
J1827R01 Final 29 May 2019
42
Contact channels should be constructed where practicable in in‐situ ground i.e. not on dump
fill, along the “contact” between the natural hillside and dump material. Contact channels
should be constructed in advance of dump construction and should be sized for the 10% AEP
peak flow with freeboard allowance. A broken rock (riprap) lining, rock check dams and drop
structures should be used to reduce flow velocity and minimise erosion.
Slope drains should be either dozer‐cut or machine excavated diagonally across the face of
the slope i.e. not straight down the slope. Excavated material should be placed along the
downstream edge and tamped or compacted to form a small windrow.
Slope drains should have a maximum gradient of 10%, although flatter is preferable, and
should be in the order of 3 to 4 m wide and 1 to 2 m deep. The spacing of slope drains should
vary from roughly 80‐100 m apart on the upper slopes of dumps to spacings of approximately
50‐70 m on the lower slopes i.e. a greater drainage density is required on the lower dump
slopes. All slope drains should be riprap lined.
It is recommended that dump slopes are reshaped and rehabilitated progressively and that
it commences as soon as active dumping starts on the next lift. It is essential that adequate
slope revegetation is achieved rapidly, as failure to do so may mean reducing inter‐bench
heights in order to reduce slope lengths and erosion impacts.
A small (500 mm high maximum) windrow should be constructed along the bench crest in
order to prevent runoff from going over the edge onto newly revegetated surfaces.
5.3 MINE ACCESS ROAD FLOODWAYS The proposed Mine Access Road (MAR) will be approximately 6.7 km long and will extend in a
generally west to east direction from a junction with the Corunna Down Road to the start of the
Raised Plant Access Road. The MAR will cross a number of ephemeral drainages that rise along the
Warrawoona Ridge and flow in a south‐westerly direction towards Sandy Creek as shown in Figure
10. It will therefore be necessary to construct floodway type crossings along the MAR to ensure
adequate road serviceability.
A high‐level desktop based catchment delineation was completed for nine proposed floodway
crossing locations along the MAR using the available topographic data and satellite imagery. The
resulting catchment areas have been summarised in Table 31, along with peak flow estimates which
were generated using the RFFE Model (refer to Appendix F for calculation worksheets).
The design of the MAR crossings was based on passing flows for events of between 50% and 1% AEP
over the roadway via a floodway with a maximum depth of 300 mm. It was assumed that once the
flow depth is greater than 300 mm the flow would extend beyond the floodway and the road would
be closed as is common practice at mine sites.
The hydraulic design assumed that the floodways have a trapezoidal section with 25H:1V (4%) entry
and exit slopes, an average channel slope of 0.25% and a Manning’s roughness coefficient (n) of
0.035. The resulting minimum floodway widths required to pass the peak flow from a range of
hydrologic events are summarised in Table 32.
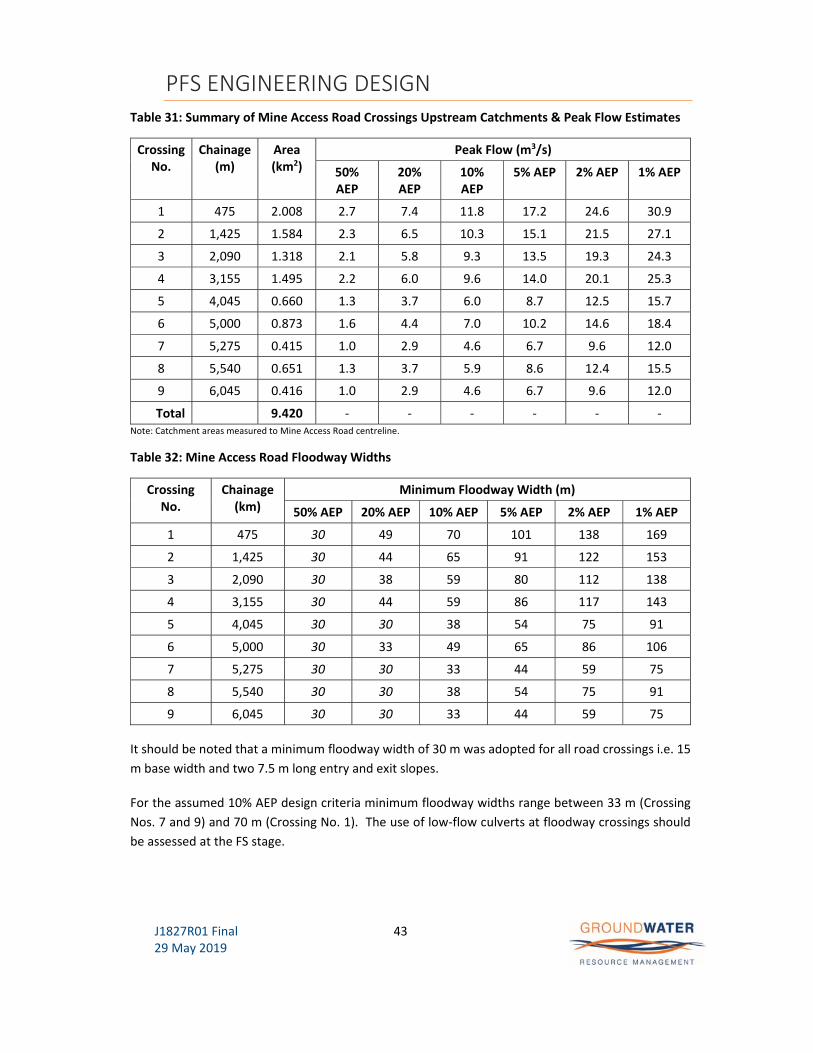
PFS ENGINEERING DESIGN
J1827R01 Final 29 May 2019
43
Table 31: Summary of Mine Access Road Crossings Upstream Catchments & Peak Flow Estimates
Crossing No.
Chainage (m)
Area (km2)
Peak Flow (m3/s)
50% AEP
20% AEP
10% AEP
5% AEP 2% AEP 1% AEP
1 475 2.008 2.7 7.4 11.8 17.2 24.6 30.9
2 1,425 1.584 2.3 6.5 10.3 15.1 21.5 27.1
3 2,090 1.318 2.1 5.8 9.3 13.5 19.3 24.3
4 3,155 1.495 2.2 6.0 9.6 14.0 20.1 25.3
5 4,045 0.660 1.3 3.7 6.0 8.7 12.5 15.7
6 5,000 0.873 1.6 4.4 7.0 10.2 14.6 18.4
7 5,275 0.415 1.0 2.9 4.6 6.7 9.6 12.0
8 5,540 0.651 1.3 3.7 5.9 8.6 12.4 15.5
9 6,045 0.416 1.0 2.9 4.6 6.7 9.6 12.0
Total 9.420 ‐ ‐ ‐ ‐ ‐ ‐ Note: Catchment areas measured to Mine Access Road centreline.
Table 32: Mine Access Road Floodway Widths
Crossing No.
Chainage (km)
Minimum Floodway Width (m)
50% AEP 20% AEP 10% AEP 5% AEP 2% AEP 1% AEP
1 475 30 49 70 101 138 169
2 1,425 30 44 65 91 122 153
3 2,090 30 38 59 80 112 138
4 3,155 30 44 59 86 117 143
5 4,045 30 30 38 54 75 91
6 5,000 30 33 49 65 86 106
7 5,275 30 30 33 44 59 75
8 5,540 30 30 38 54 75 91
9 6,045 30 30 33 44 59 75
It should be noted that a minimum floodway width of 30 m was adopted for all road crossings i.e. 15
m base width and two 7.5 m long entry and exit slopes.
For the assumed 10% AEP design criteria minimum floodway widths range between 33 m (Crossing
Nos. 7 and 9) and 70 m (Crossing No. 1). The use of low‐flow culverts at floodway crossings should
be assessed at the FS stage.

PFS ENGINEERING DESIGN
J1827R01 Final 29 May 2019
44
5.4 PLANT ACCESS ROAD DRAINAGE MEASURES The proposed Plant Access Road (PAR) will be approximately 675 m long and will be aligned along an
existing north‐south valley between the end of the MAR and the entrance to the Plant. The ground
elevation at the end of the MAR is approximately 270 mAHD and the ground elevation at the entrance
to the Plant is about 280 mAHD, yielding an average longitudinal gradient of some 1.5%.
The design of the PAR is being completed by others, but it is understood that two possible alignment
options are being considered; one being a raised road or “Skyway” constructed along the centre of
the valley and the second being a road constructed along the western side of the valley using cut and
fill earthworks. The former option could be constructed with a drainage channel constricted along
both sides of the Skyway, while culverts would be required for the second option to direct runoff
form adjacent upstream catchments beneath the road and into the existing creekline.
The selected road design was not available to the current PFS, but road drainage will be considered
at the FS stage.
In addition, it is understood that a sedimentation pond is being designed by others that will be
constructed at the lower end of the PAR and will be used to collect runoff from the road surface and
temporarily store it in order to reduce the total suspended sediment (TSS) concentration to
acceptable levels. The detailed design of this sedimentation pond using a specific particle size will be
considered at the FS stage. However, based upon storing runoff from the 10% AEP 24 hour rainfall
event (130 mm) from the PAR running surface (i.e. 675 m x 10 m x 100% runoff) a minimum pond
capacity of about 900 m3 will be necessary, not including allowance for freeboard and dead storage.
5.5 PIT FLOOD PROTECTION BUNDS Staged mine plans were unavailable to the current PFS, but will likely be available to the FS. It was
therefore currently not possible to prepare staged surface water management plans for the
development of the various WRD drainage measures.
Although the catchment areas upstream of Klondyke and St George Pits are relatively insignificant, it
may be necessary on occasion to construct flood protection bunds to prevent runoff from entering
mining areas. Although the height of each bund should be addressed on a case by case basis, the
minimum height should be set at 2 m above existing ground level. They should not be constructed
by end dumping of waste materials in piles, but instead the footprint should be cleared, and the bund
should be built from select waste material placed and compacted in controlled layers. The upstream
(outside) face of flood bunds should be armoured with suitable, graded broken rock. The key
specifications for the flood bunds are as follows:
Upstream maximum side slope = 2:1 (H:V);
Downstream maximum side slope = 1.5:1 (H:V);
Minimum height above existing ground = 2 m;
Minimum base width = 10 m;

PFS ENGINEERING DESIGN
J1827R01 Final 29 May 2019
45
Maximum compacted layer thickness = 500 mm;
Minimum compaction standard = 95 % standard maximum dry density;
Moisture conditioning = ± 2% optimum moisture content;
Bund fill material to be select graded clayey gravel material from pit excavation with
maximum particle size of 150 mm; and
Riprap specification to be Dmax= 450 mm, D50= 300 mm and thickness = 700 mm.
The location and design of flood bunds will be confirmed in the future, during the next phase of the
project (FS).

J1827R01 Final 29 May 2019
46
6.0 CONCLUSION & RECOMMENDATIONS This hydro‐meteorological and surface water management report presents the results of an in‐depth
desktop study of regional and local climate data and combines the findings from a site visit with mine
planning data to provide pre‐feasibility engineering level designs of the works required to protect the
proposed mine and associated facilities.
The following surface water tasks were completed as part of this study:
Site Visit – two‐day visit to site in September 2018.
Hydrologic assessment.
Floodwater and surface water management philosophy and design criteria.
Pre‐Feasibility level design of water management measures.
The hydrologic and hydraulic calculations required as part of this study have been presented in the
Appendices. The accompanying figures and drawings have been completed to a level suitable for
inclusion in the project PFS and may form part of the future detailed engineering design of the project.
Groundwater Resource Management Pty Ltd
Alistair R Lowry Peter Mayers
CIVIL ENGINEERING HYDROLOGIST PRINCIPAL HYDROGEOLOGIST
Doc Ref: J1827R01 Calidus Klondyke Surface Water Final Report 190529.docx
This report has been printed on paper that contains a proportion of recycled material as a gesture of Groundwater Resource Management’s
commitment to sustainable management of the environment.

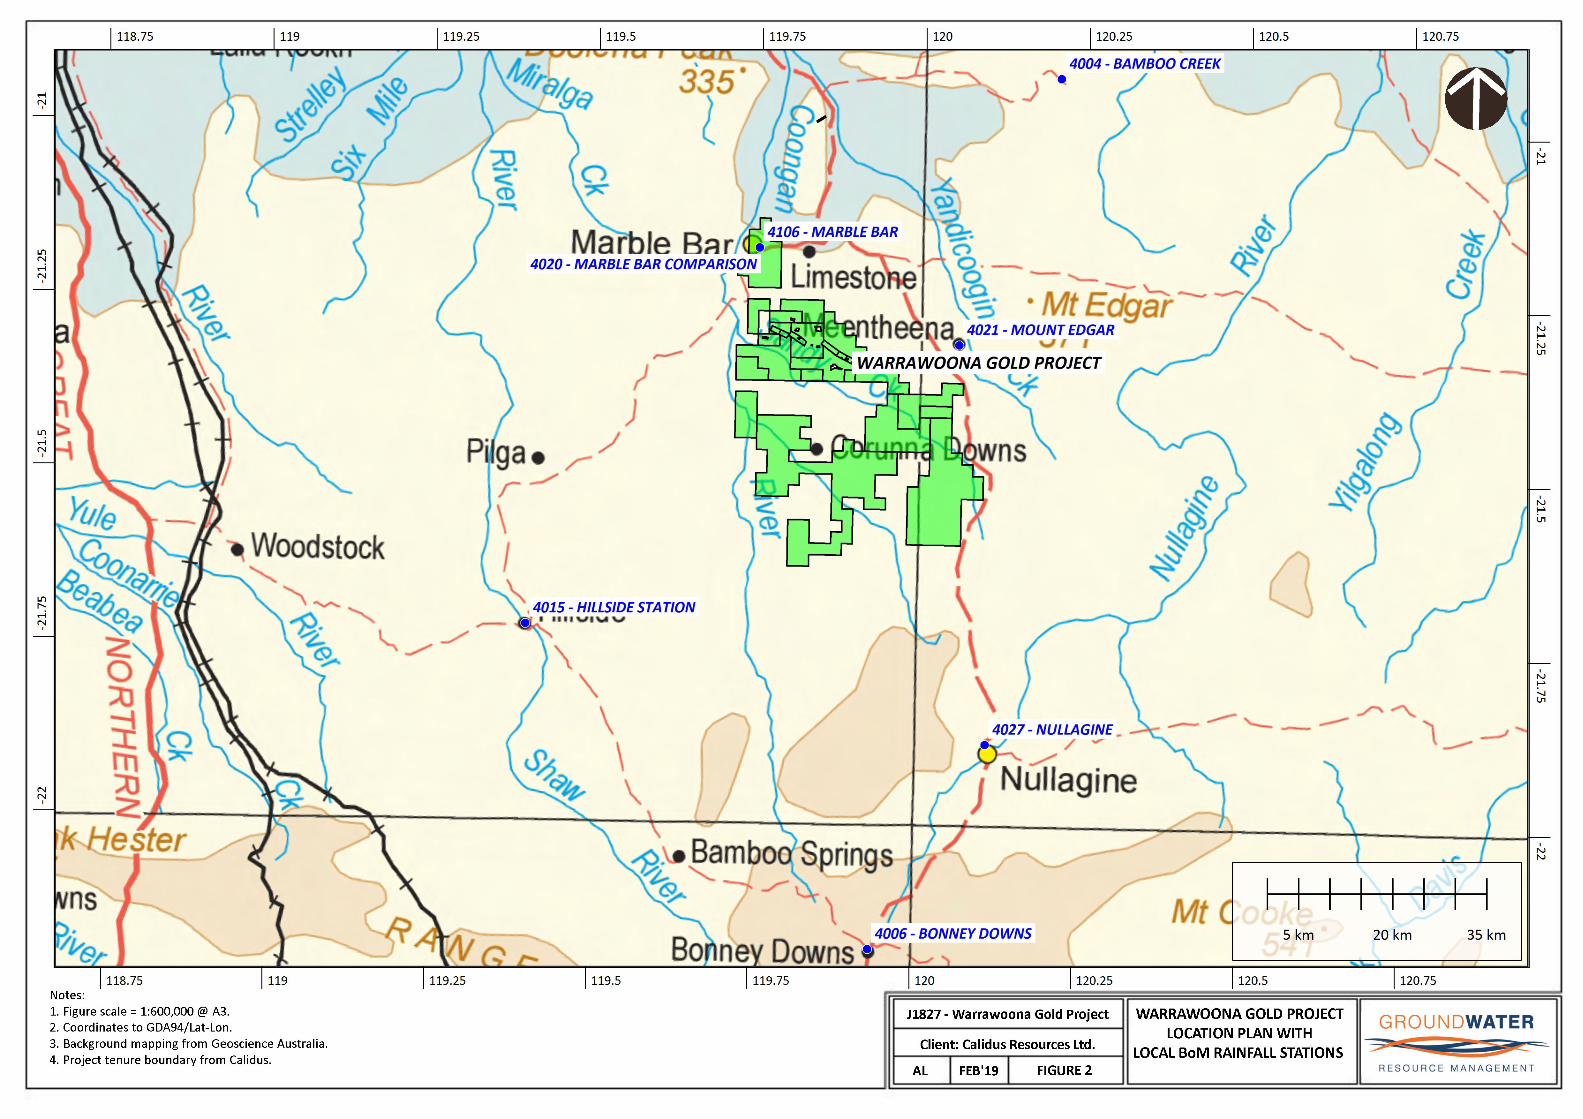

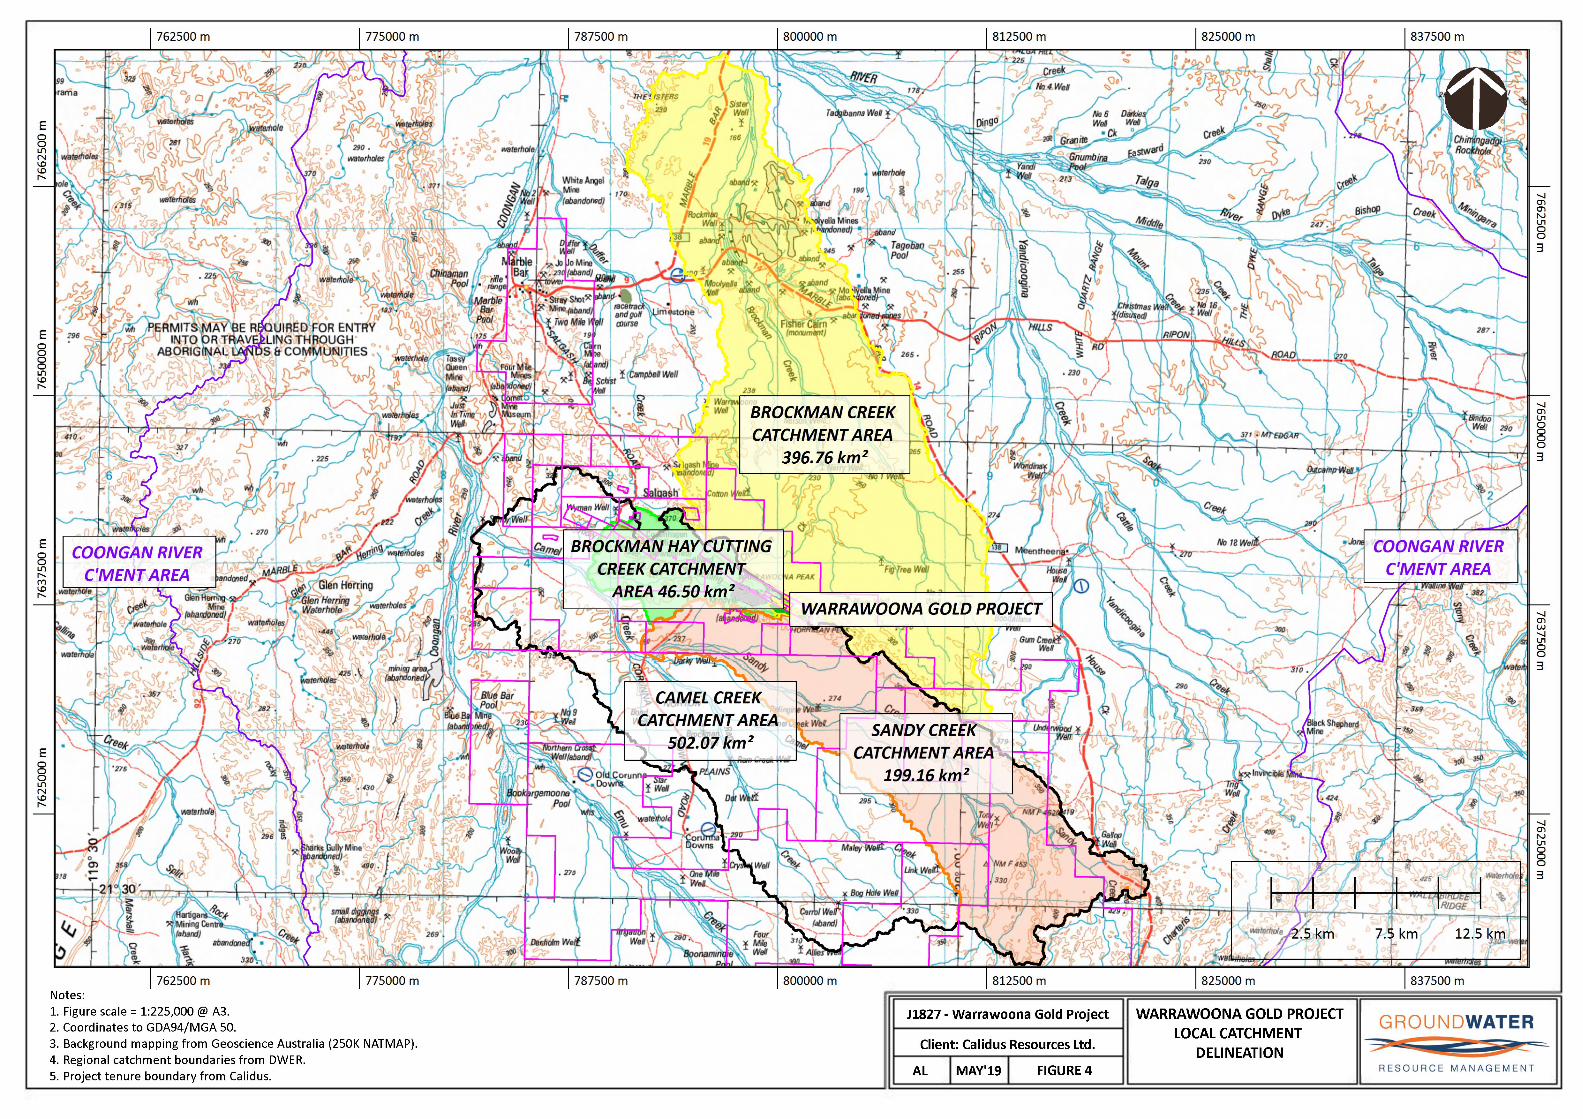
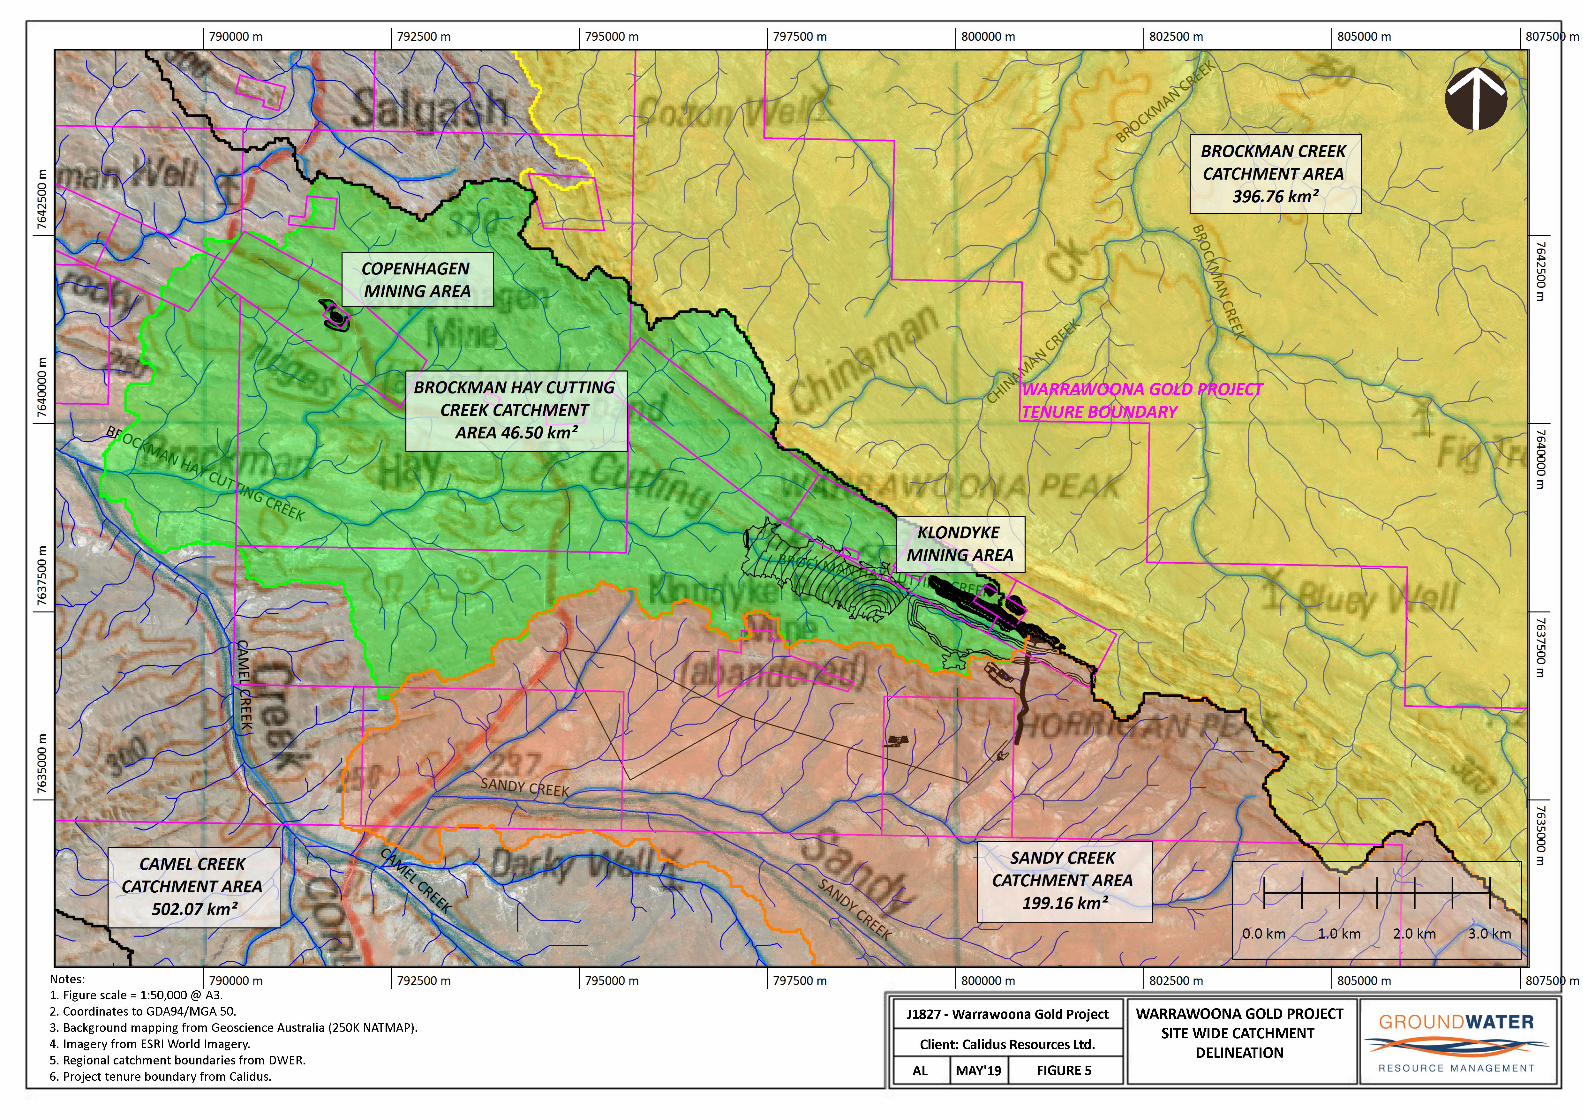
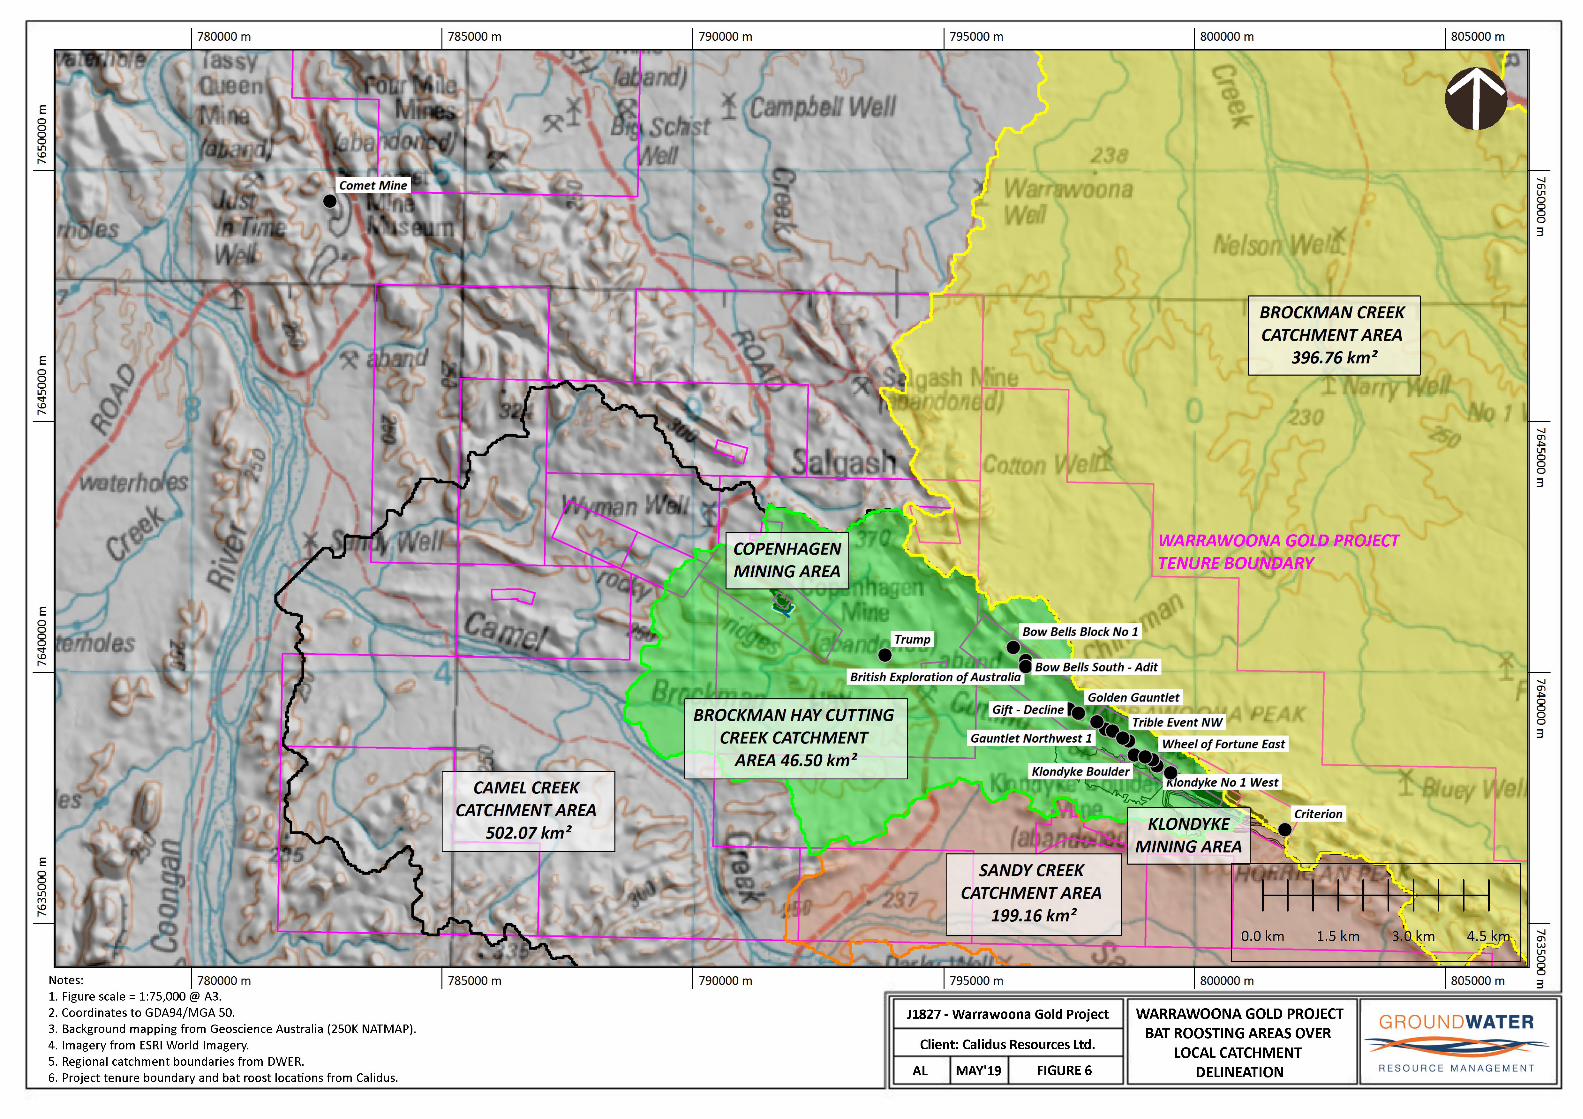
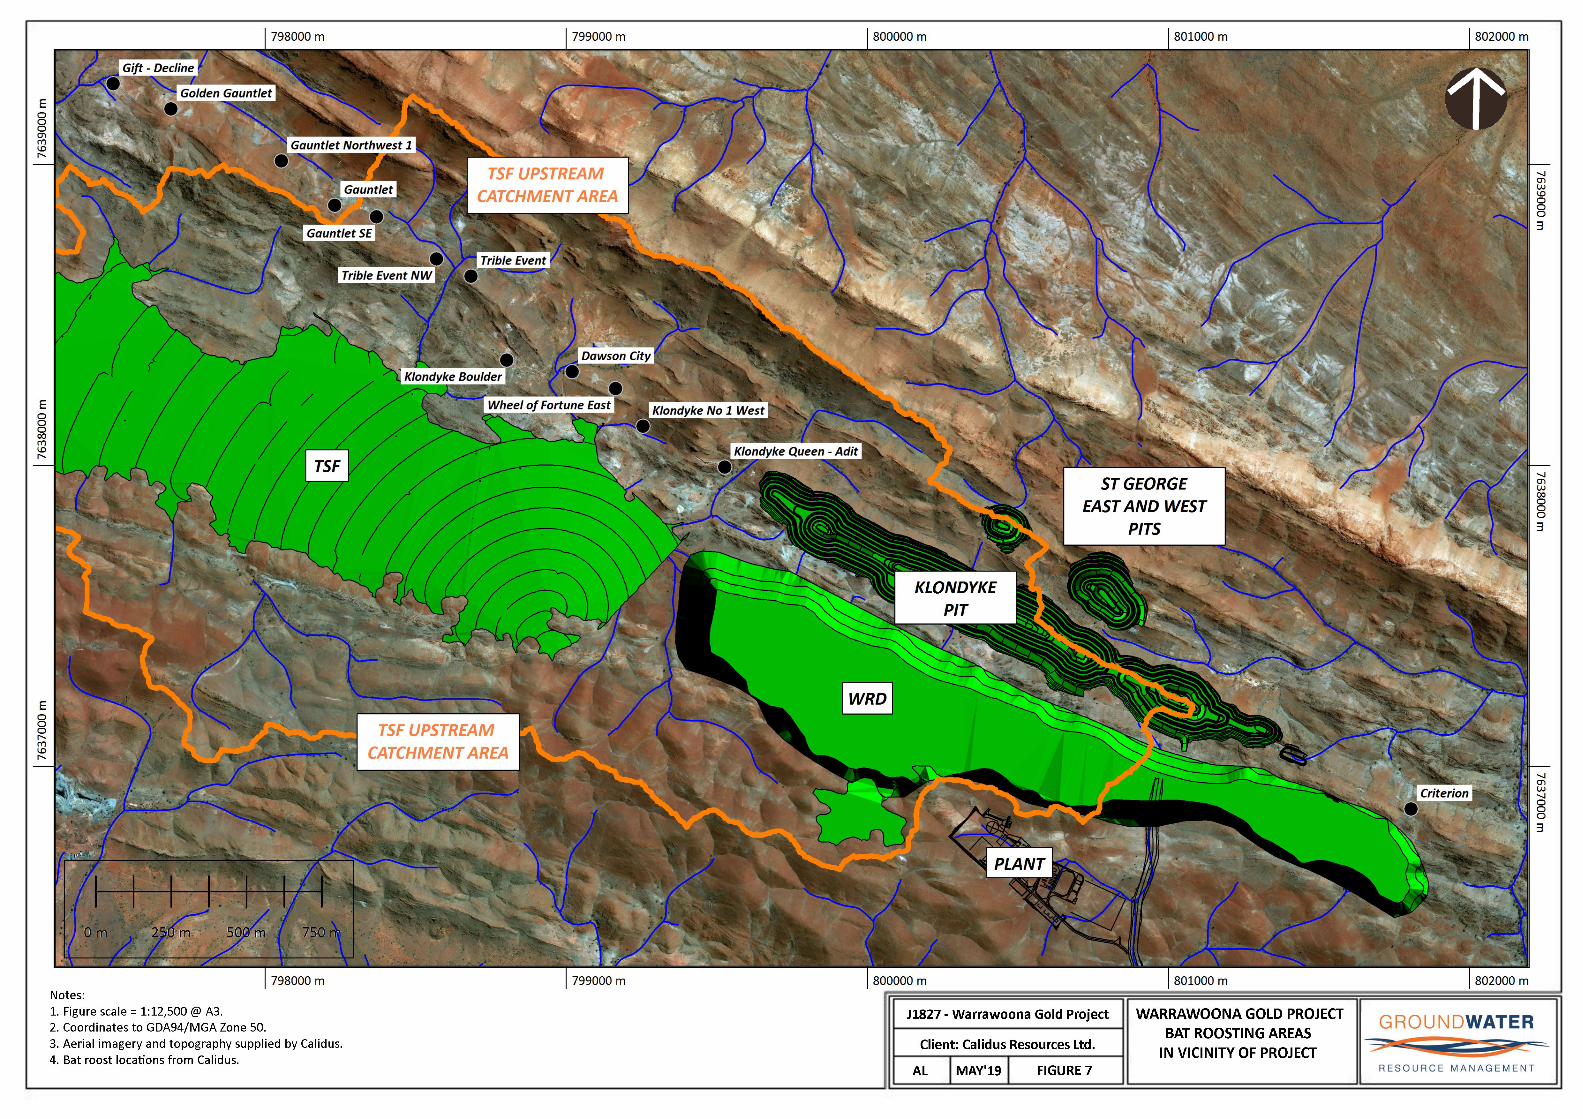

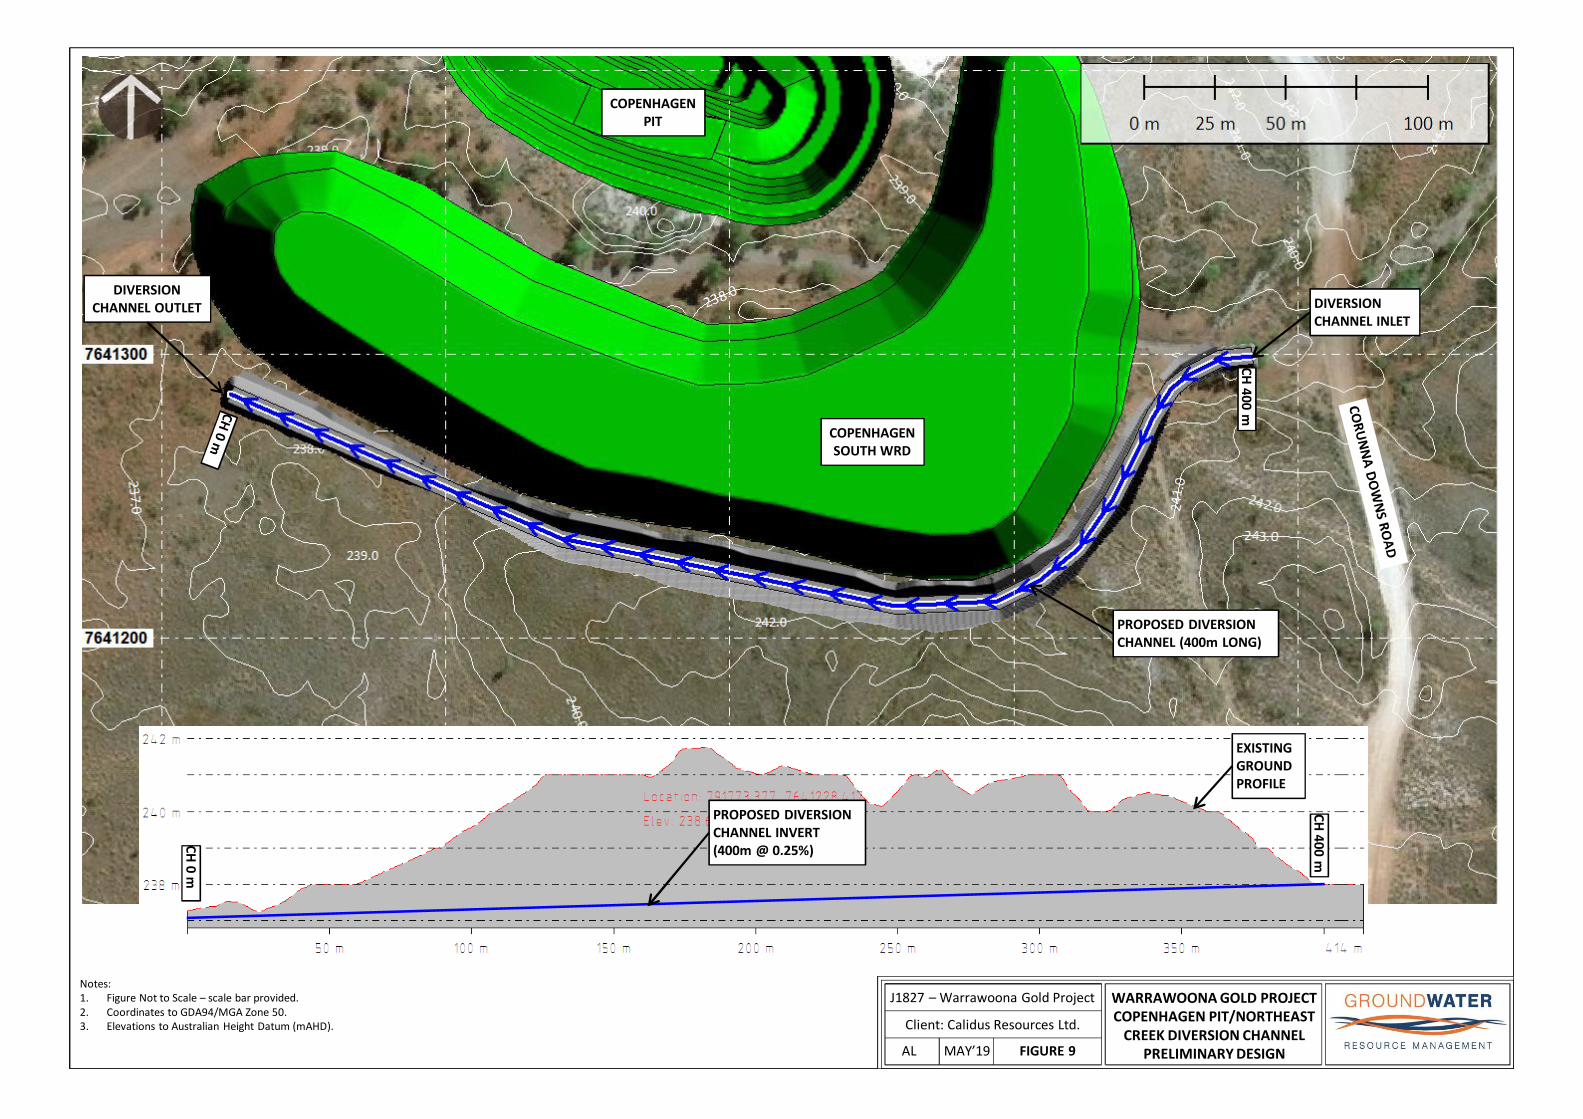
J1827 – Warrawoona Gold Project
Client: Calidus Resources Ltd.
FIGURE 9 AL MAY’19
Notes:1. Figure Not to Scale – scale bar provided.2. Coordinates to GDA94/MGA Zone 50.3. Elevations to Australian Height Datum (mAHD).
PROPOSED DIVERSION CHANNEL (400m LONG)
COPENHAGEN SOUTH WRD
DIVERSION CHANNEL INLET
WARRAWOONA GOLD PROJECTCOPENHAGEN PIT/NORTHEAST
CREEK DIVERSION CHANNEL PRELIMINARY DESIGN
CH 400 m
CH 400 m
CH 0 m
COPENHAGEN PIT
DIVERSION CHANNEL OUTLET
PROPOSED DIVERSION CHANNEL INVERT (400m @ 0.25%)
EXISTING GROUND PROFILE


A112
H
11108 96 74 531 2
H
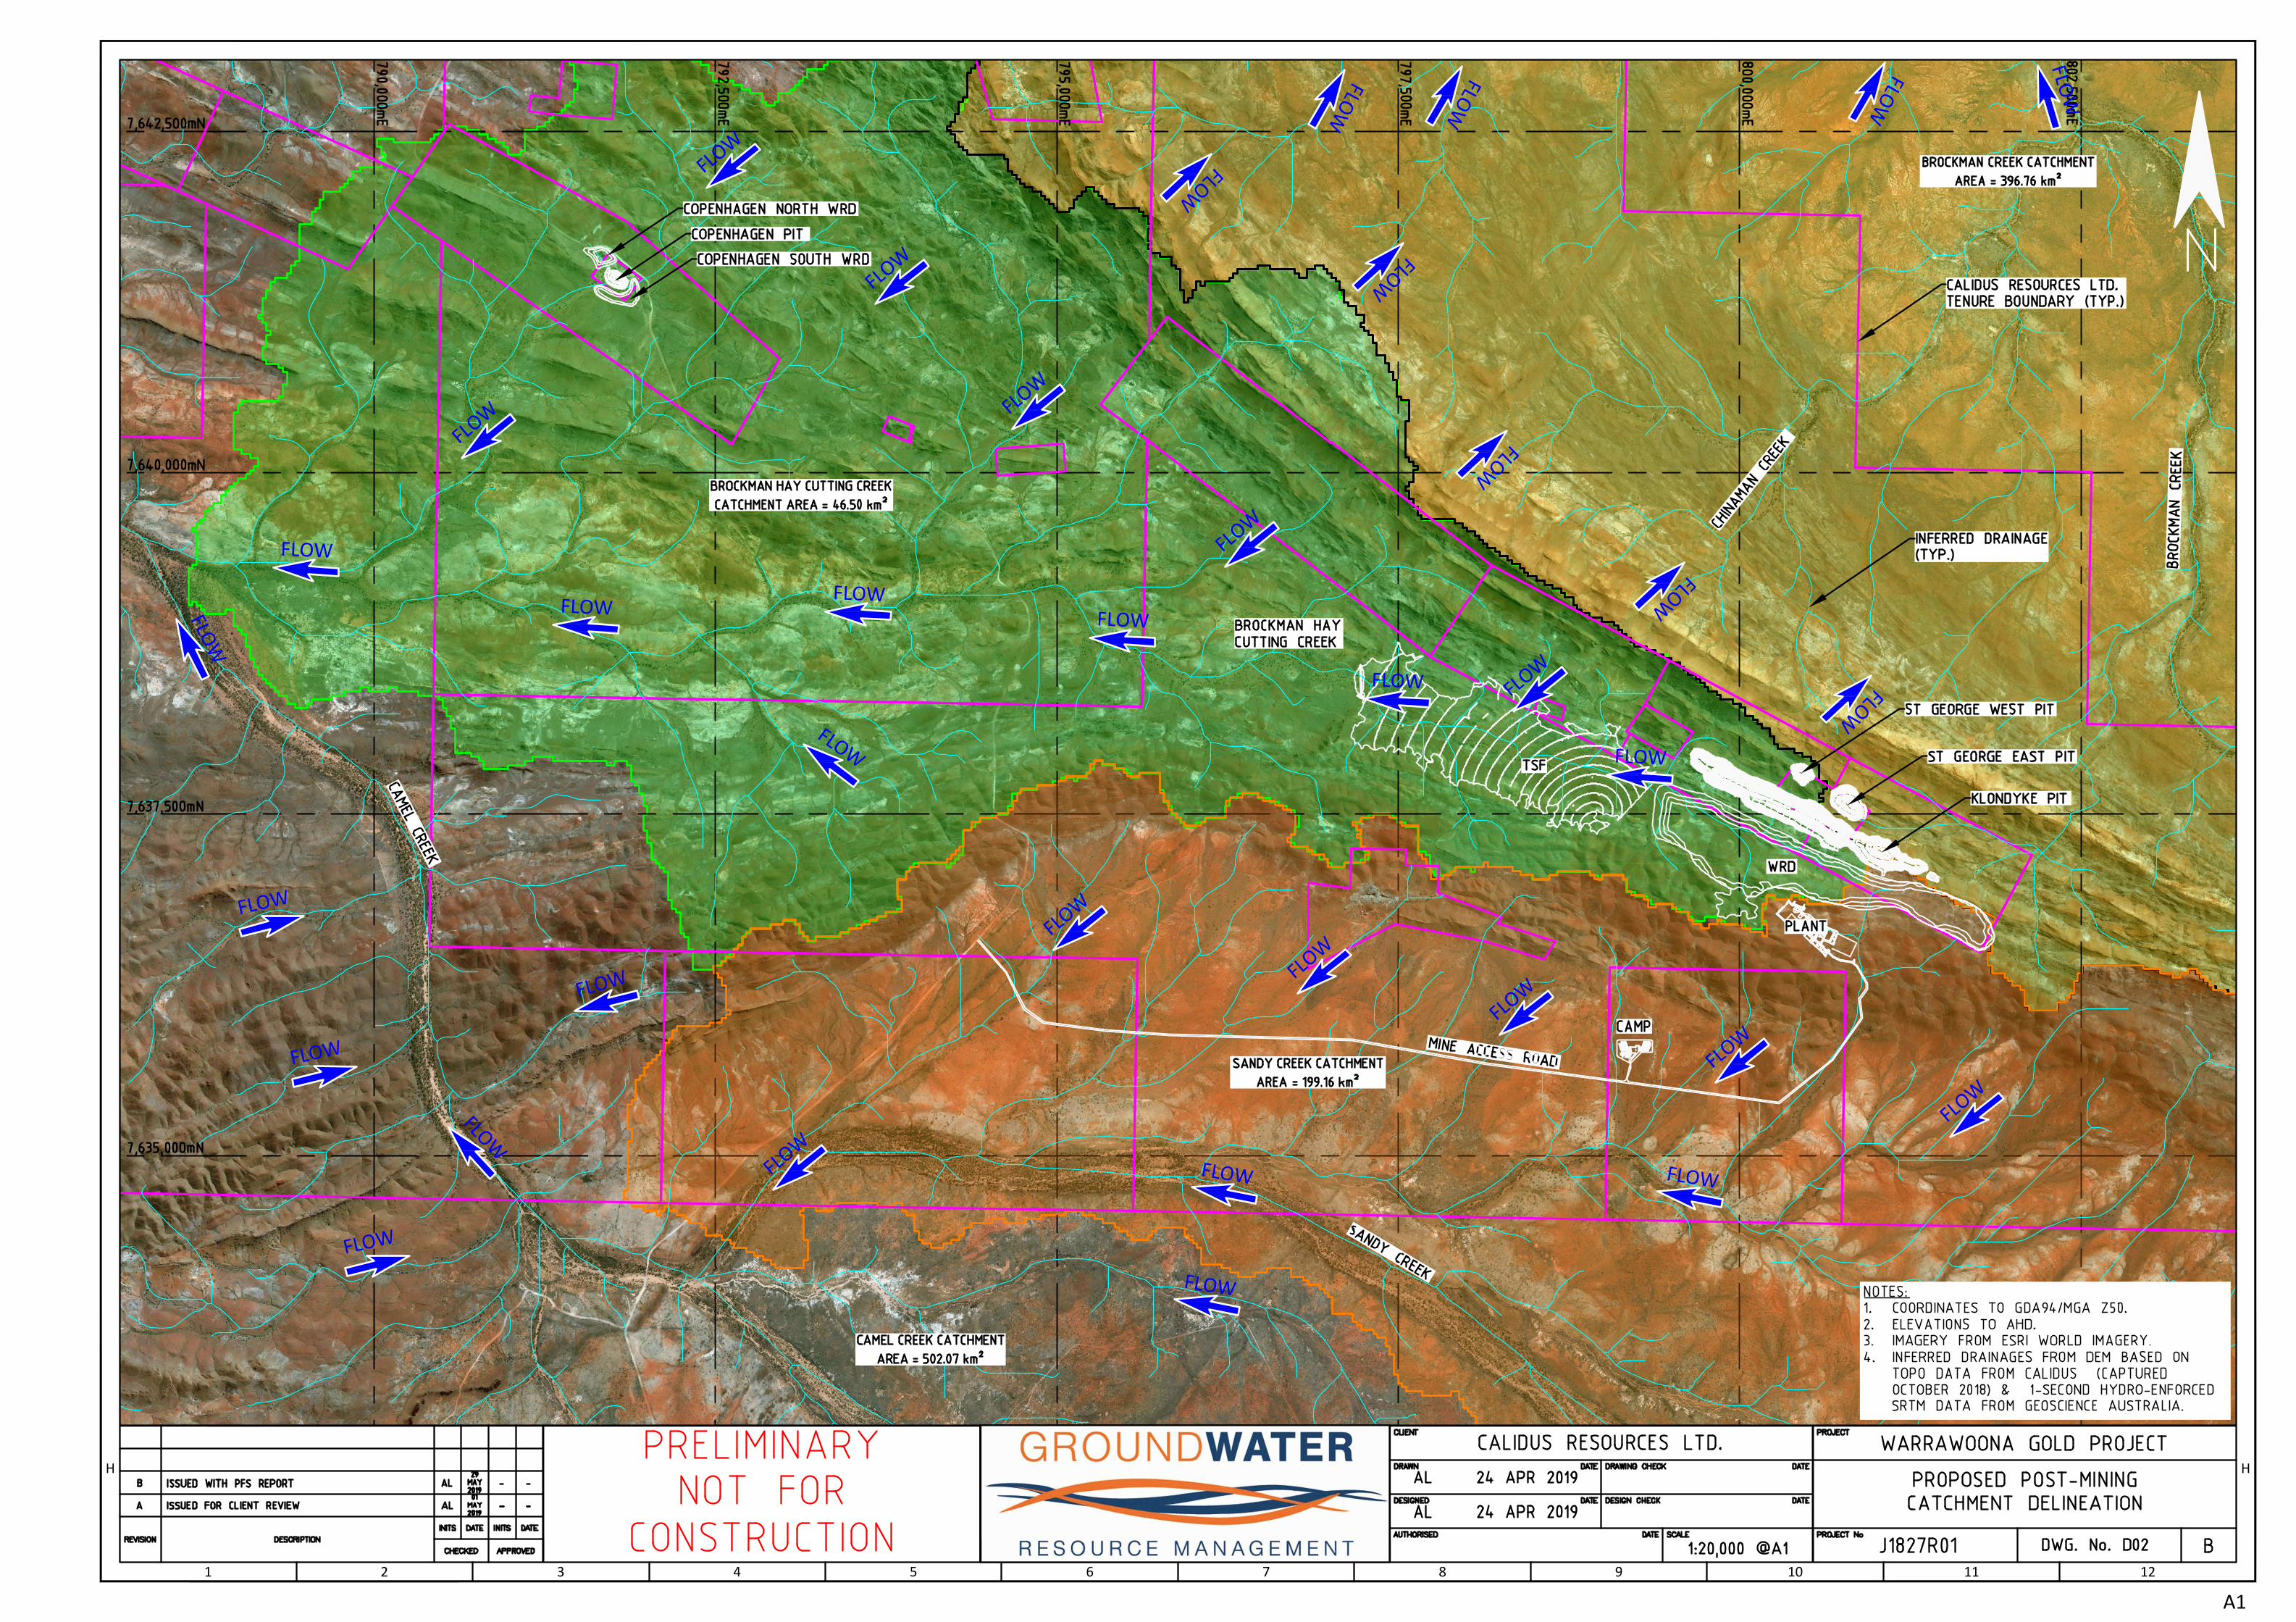
A112
H
11108 96 74 531 2
H
FLOW
FLOW
FLOW
FLOW
FLOW
FLOW
FLOW
FLOW
FLOW
FLOW
FLOW
FLOW
FLOW
FLOW
FLOW
FLOW
FLOW
FLOW
FLOW
FLOW
FLOW
FLOW
FLOW
FLOW
FLOW
FLOWFLOW
FLOW
FLOW
FLOW
FLOW
FLOW
FLOW
FLOW
FLOW
FLOW
FLOW

J1827R01 Final 29 May 2019
A1
APPENDIX A
Hydro‐Meteorological Summary Data

Min Annual
Max Annual
Mean Annual
Median Annual
Mean Max Min Count Mean Max Min Count Mean Max Min Count Mean Max Min Count Mean Max Min Count Mean Max Min Count
Jan 77.6 355.9 0 70 78.7 330 0 113 89.3 421.4 0.0 91 67.3 251.1 0 87 74.2 260.4 0.0 71 69.7 401.0 0.0 108
Feb 59.2 247.0 0 71 86.3 347.2 0 115 97.0 503.2 0.0 89 72.8 235 0 87 88.3 462.1 0.0 72 72.0 649.6 0.0 104
Mar 49.7 367.3 0 70 57.6 417.4 0 113 67.0 576.2 0.0 84 47.1 255.4 0 88 49.4 296.4 0.0 72 52.7 287.2 0.0 106
Apr 15.5 189.9 0 72 19.2 166.1 0 114 14.6 115.8 0.0 89 20.4 183.8 0 84 17.1 183.6 0.0 78 22.3 174.5 0.0 109
May 21.0 162.5 0 72 23.4 186.7 0 115 24.8 185.4 0.0 90 21.3 156.7 0 85 15.7 122.1 0.0 78 19.9 153.2 0.0 107
Jun 27.2 230.9 0 72 22.3 165.3 0 114 26.3 206.2 0.0 90 24.7 185.1 0 86 17.1 187.1 0.0 81 19.1 140.9 0.0 107
Jul 7.2 61.4 0 71 12.4 133.9 0 116 8.9 116.0 0.0 86 10.6 91 0 86 12.4 108.2 0.0 82 9.3 92.2 0.0 108
Aug 4.8 31.0 0 70 5.9 88.9 0 116 3.9 64.8 0.0 84 6.0 76.6 0 86 5.3 64.6 0.0 82 6.3 66.4 0.0 111
Sep 1.1 24.4 0 72 1.5 53.6 0 114 1.5 37.6 0.0 86 1.7 36.1 0 87 0.9 32.2 0.0 85 1.5 34.6 0.0 110
Oct 3.8 95.8 0 72 4.0 116.3 0 116 3.5 83.8 0.0 84 4.6 80.8 0 86 2.9 38.1 0.0 81 4.7 58.9 0.0 109
Nov 9.0 60.7 0 70 8.9 71.2 0 115 8.2 84.9 0.0 84 12.6 95.5 0 86 6.8 71.9 0.0 76 10.3 87.9 0.0 108
Dec 31.8 204.5 0 72 39.7 314.9 0 116 47.7 414.3 0.0 81 38.1 263.3 0 86 36.4 276.9 0.0 72 30.1 137.4 0.0 105
No. of Complete Months 854 1,377 1,038 1034 930 1,292
Notes:
312.5 359.8
300.0 343.8
22.3 71.1
669.8 797.9
BONNEY DOWNS
97 Complete Years
46.8
823.9
MOUNT EDGAR
67 Complete Years
MARBLE BAR COMBINED
108 Complete Years
HILLSIDE STATION
62 Complete Years
23.6
1049.8
356.8
333.2
Annual and Monthly Rainfall Values
for Local BoM Rainfall stations (all within approxiamtely 100 km of Klondyke Project)
1. Monthly values based on only complete months of daily data.
2. Annual values based on only complete years of daily data.
NULLAGINE
85 Complete Years
BAMBOO CREEK
59 Complete Years
84.9
1156.8
401.4
373.9
45.3
693.0
322.0
337.2
323.8
282.9
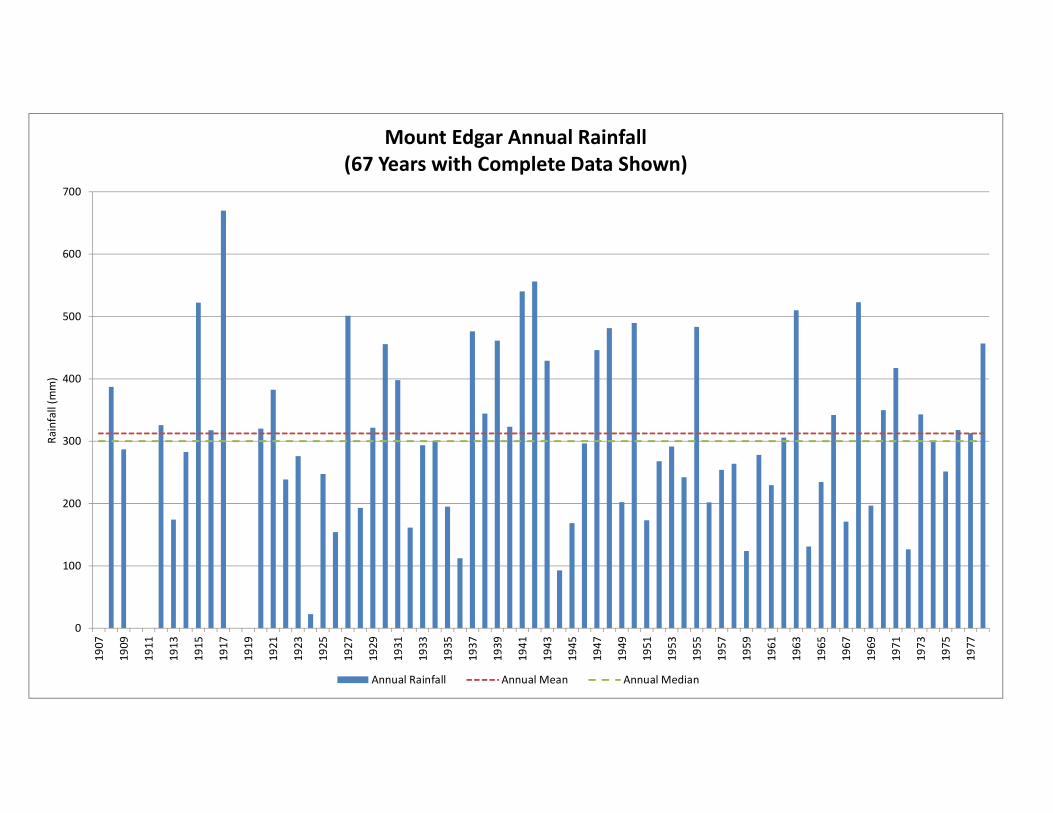
0
100
200
300
400
500
600
700
19
07
19
09
19
11
19
13
19
15
19
17
19
19
19
21
19
23
19
25
19
27
19
29
19
31
19
33
19
35
19
37
19
39
19
41
19
43
19
45
19
47
19
49
19
51
19
53
19
55
19
57
19
59
19
61
19
63
19
65
19
67
19
69
19
71
19
73
19
75
19
77
Ra
infa
ll (
mm
)
Mount Edgar Annual Rainfall
(67 Years with Complete Data Shown)
Annual Rainfall Annual Mean Annual Median
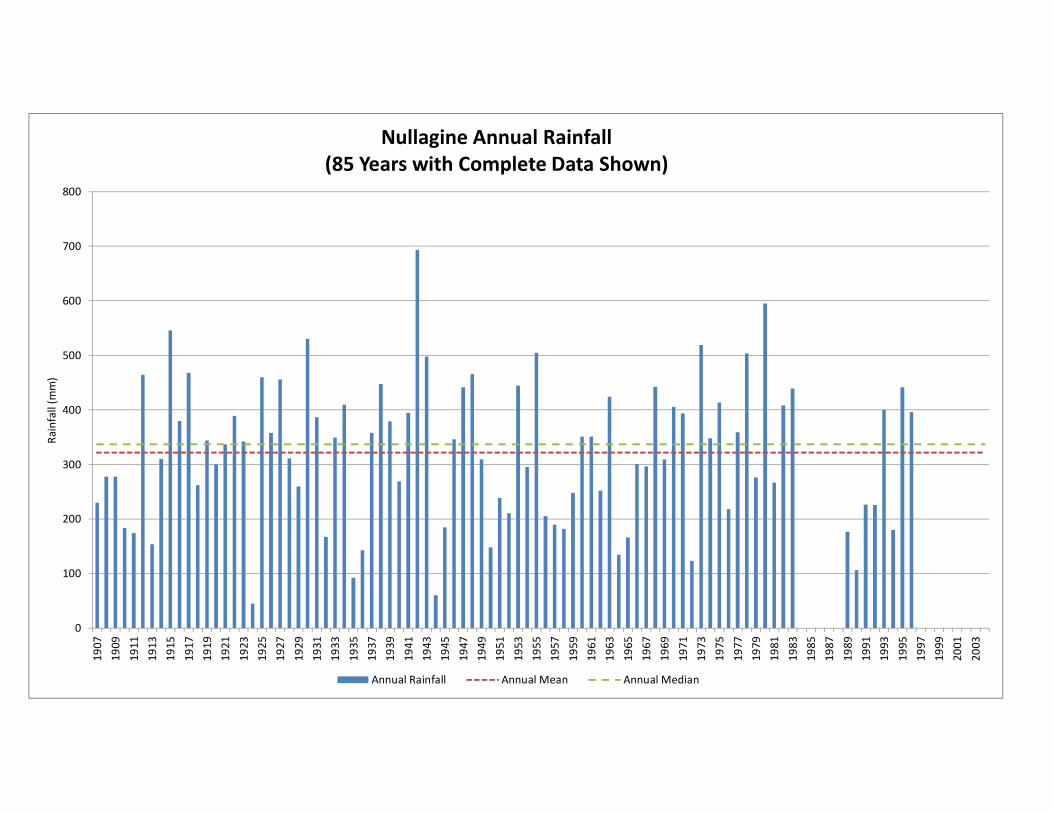
0
100
200
300
400
500
600
700
800
19
07
19
09
19
11
19
13
19
15
19
17
19
19
19
21
19
23
19
25
19
27
19
29
19
31
19
33
19
35
19
37
19
39
19
41
19
43
19
45
19
47
19
49
19
51
19
53
19
55
19
57
19
59
19
61
19
63
19
65
19
67
19
69
19
71
19
73
19
75
19
77
19
79
19
81
19
83
19
85
19
87
19
89
19
91
19
93
19
95
19
97
19
99
20
01
20
03
Ra
infa
ll (
mm
)
Nullagine Annual Rainfall
(85 Years with Complete Data Shown)
Annual Rainfall Annual Mean Annual Median

0
200
400
600
800
1000
1200
19
07
19
09
19
11
19
13
19
15
19
17
19
19
19
21
19
23
19
25
19
27
19
29
19
31
19
33
19
35
19
37
19
39
19
41
19
43
19
45
19
47
19
49
19
51
19
53
19
55
19
57
19
59
19
61
19
63
19
65
19
67
19
69
19
71
19
73
19
75
19
77
19
79
19
81
19
83
19
85
19
87
19
89
19
91
19
93
19
95
19
97
19
99
20
01
20
03
20
05
20
07
Ra
infa
ll (
mm
)
Hillside Station Annual Rainfall
(62 Years with Complete Data Shown)
Annual Rainfall Annual Mean Annual Median

0
200
400
600
800
1000
1200
19
07
19
09
19
11
19
13
19
15
19
17
19
19
19
21
19
23
19
25
19
27
19
29
19
31
19
33
19
35
19
37
19
39
19
41
19
43
19
45
19
47
19
49
19
51
19
53
19
55
19
57
19
59
19
61
19
63
19
65
19
67
19
69
19
71
19
73
19
75
19
77
19
79
19
81
19
83
19
85
19
87
19
89
19
91
19
93
19
95
19
97
19
99
20
01
20
03
20
05
20
07
20
09
20
11
20
13
20
15
Ra
infa
ll (
mm
)
Bonney Downs Annual Rainfall
(97 Years with Complete Data Shown)
Annual Rainfall Annual Mean Annual Median
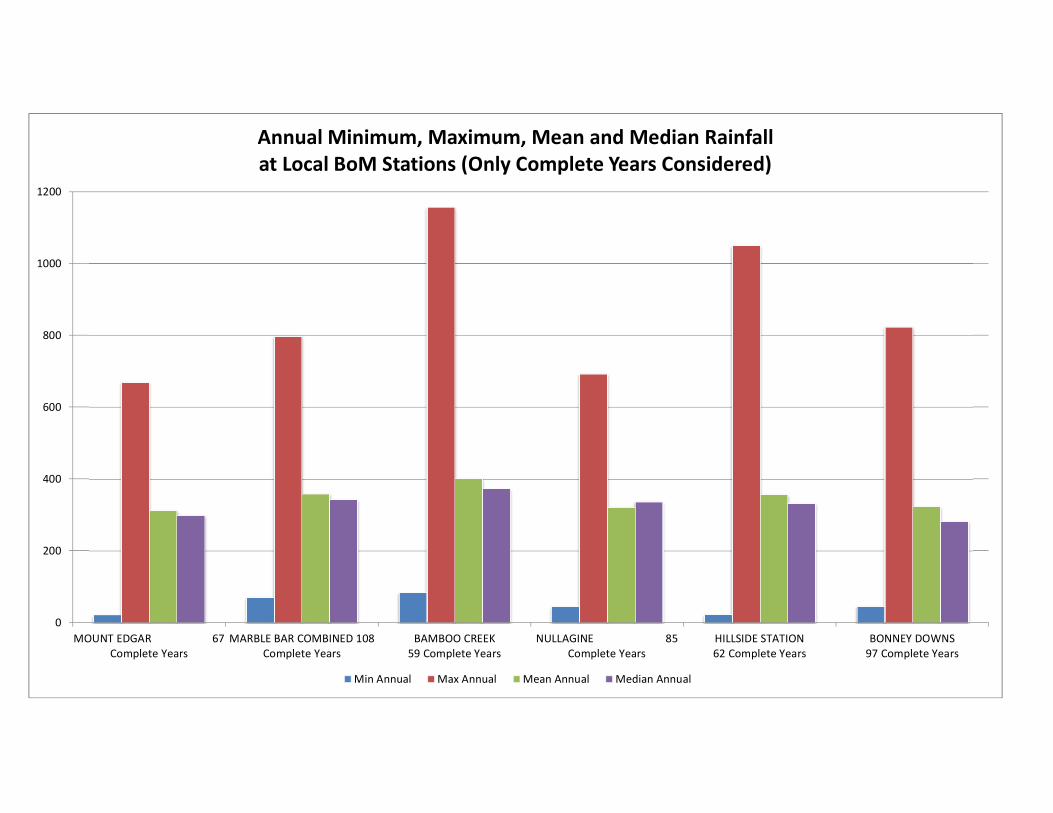
0
200
400
600
800
1000
1200
MOUNT EDGAR 67
Complete Years
MARBLE BAR COMBINED 108
Complete Years
BAMBOO CREEK
59 Complete Years
NULLAGINE 85
Complete Years
HILLSIDE STATION
62 Complete Years
BONNEY DOWNS
97 Complete Years
Annual Minimum, Maximum, Mean and Median Rainfall
at Local BoM Stations (Only Complete Years Considered)
Min Annual Max Annual Mean Annual Median Annual
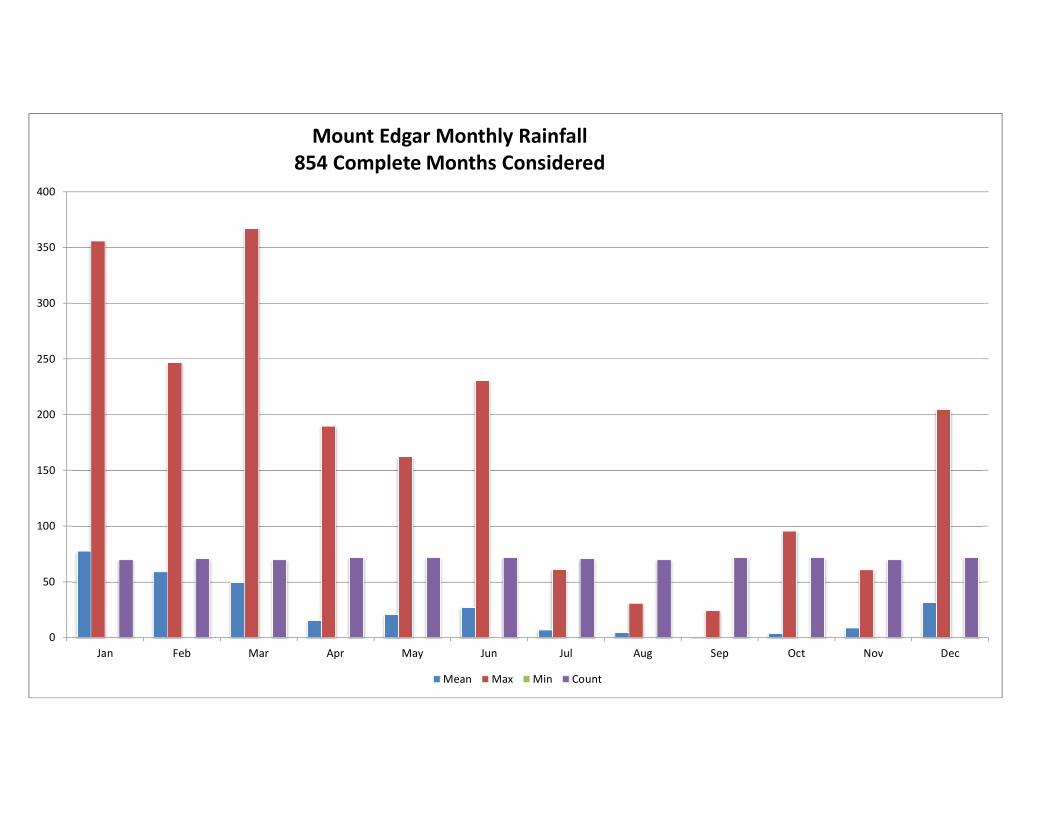
0
50
100
150
200
250
300
350
400
Jan Feb Mar Apr May Jun Jul Aug Sep Oct Nov Dec
Mount Edgar Monthly Rainfall
854 Complete Months Considered
Mean Max Min Count

0
50
100
150
200
250
300
350
400
450
Jan Feb Mar Apr May Jun Jul Aug Sep Oct Nov Dec
Marble Bar Combined Monthly Rainfall
1377 Complete Months Considered
Mean Max Min Count
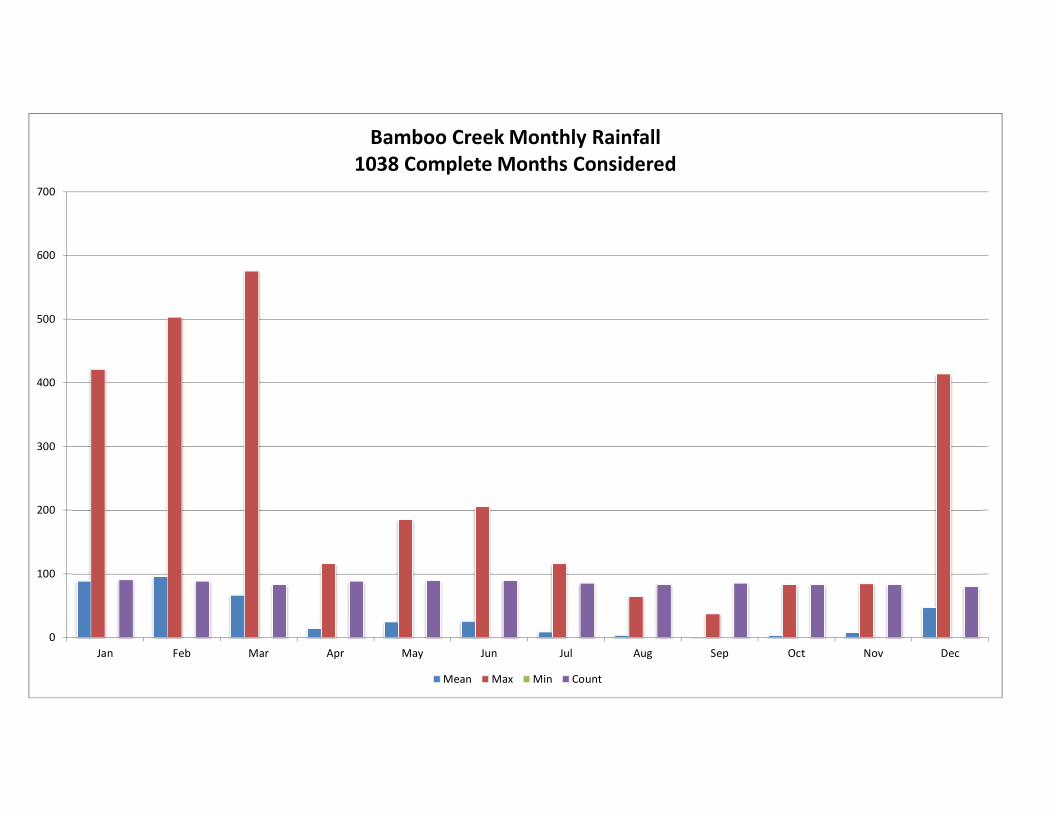
0
100
200
300
400
500
600
700
Jan Feb Mar Apr May Jun Jul Aug Sep Oct Nov Dec
Bamboo Creek Monthly Rainfall
1038 Complete Months Considered
Mean Max Min Count
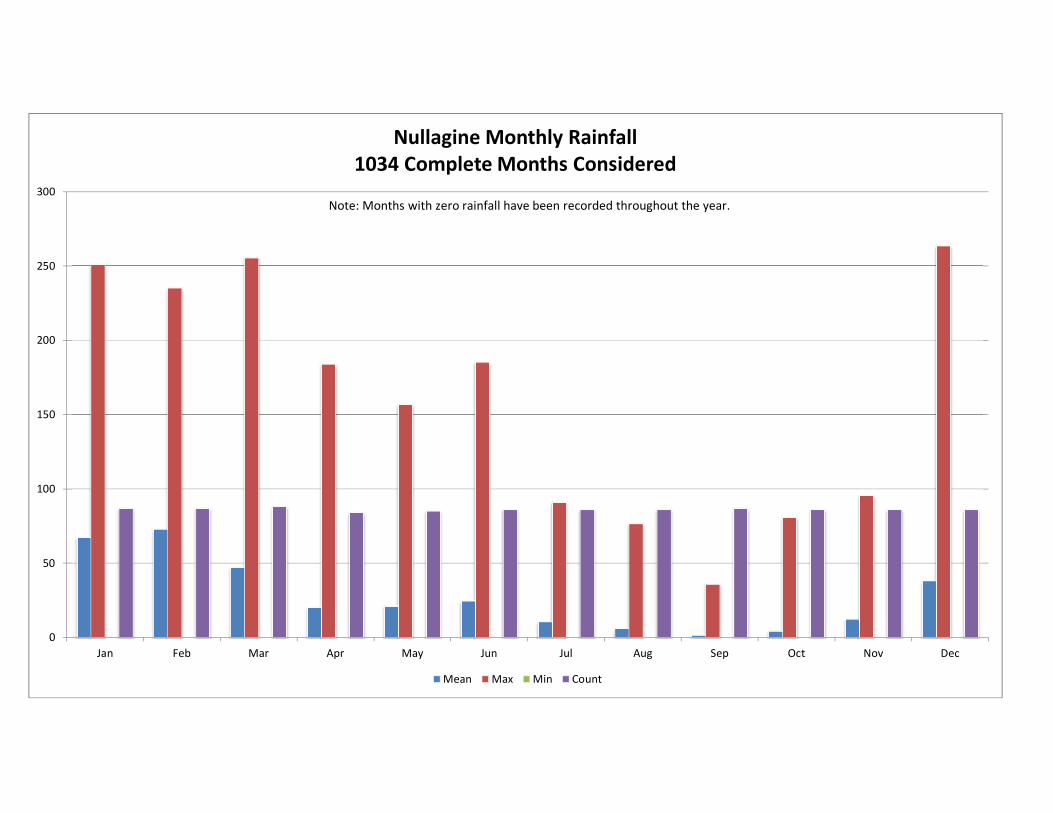
0
50
100
150
200
250
300
Jan Feb Mar Apr May Jun Jul Aug Sep Oct Nov Dec
Nullagine Monthly Rainfall
1034 Complete Months Considered
Mean Max Min Count
Note: Months with zero rainfall have been recorded throughout the year.
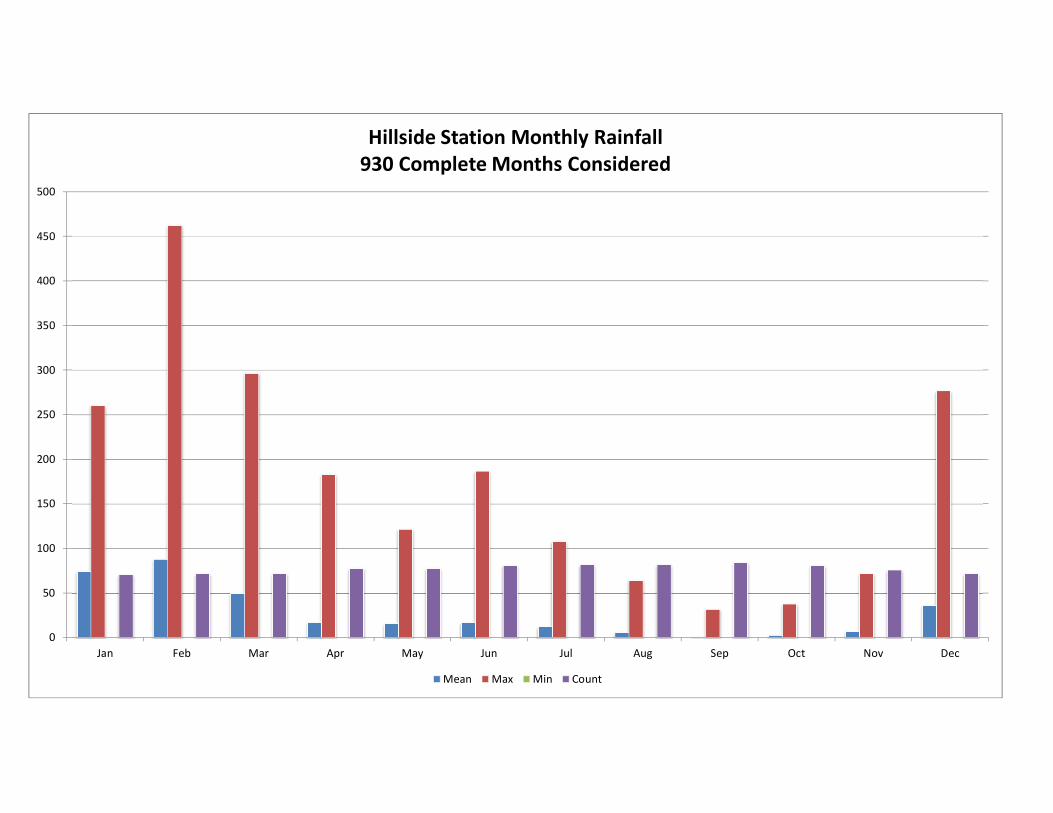
0
50
100
150
200
250
300
350
400
450
500
Jan Feb Mar Apr May Jun Jul Aug Sep Oct Nov Dec
Hillside Station Monthly Rainfall
930 Complete Months Considered
Mean Max Min Count
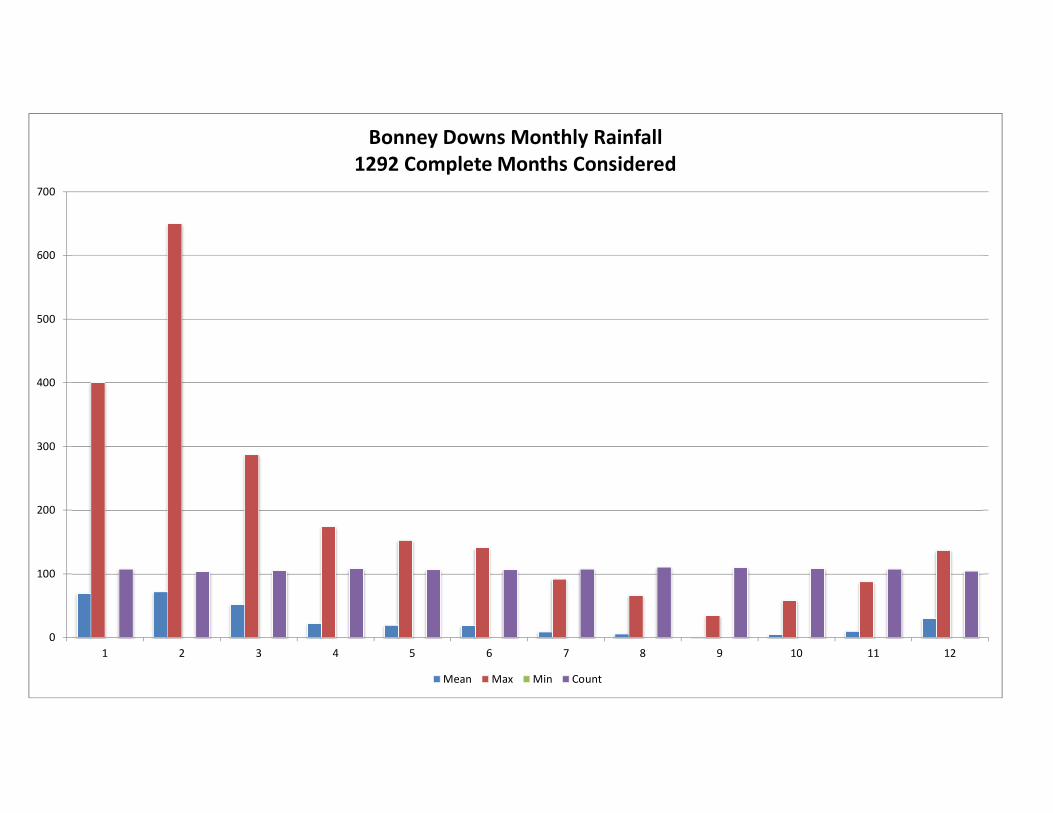
0
100
200
300
400
500
600
700
1 2 3 4 5 6 7 8 9 10 11 12
Bonney Downs Monthly Rainfall
1292 Complete Months Considered
Mean Max Min Count
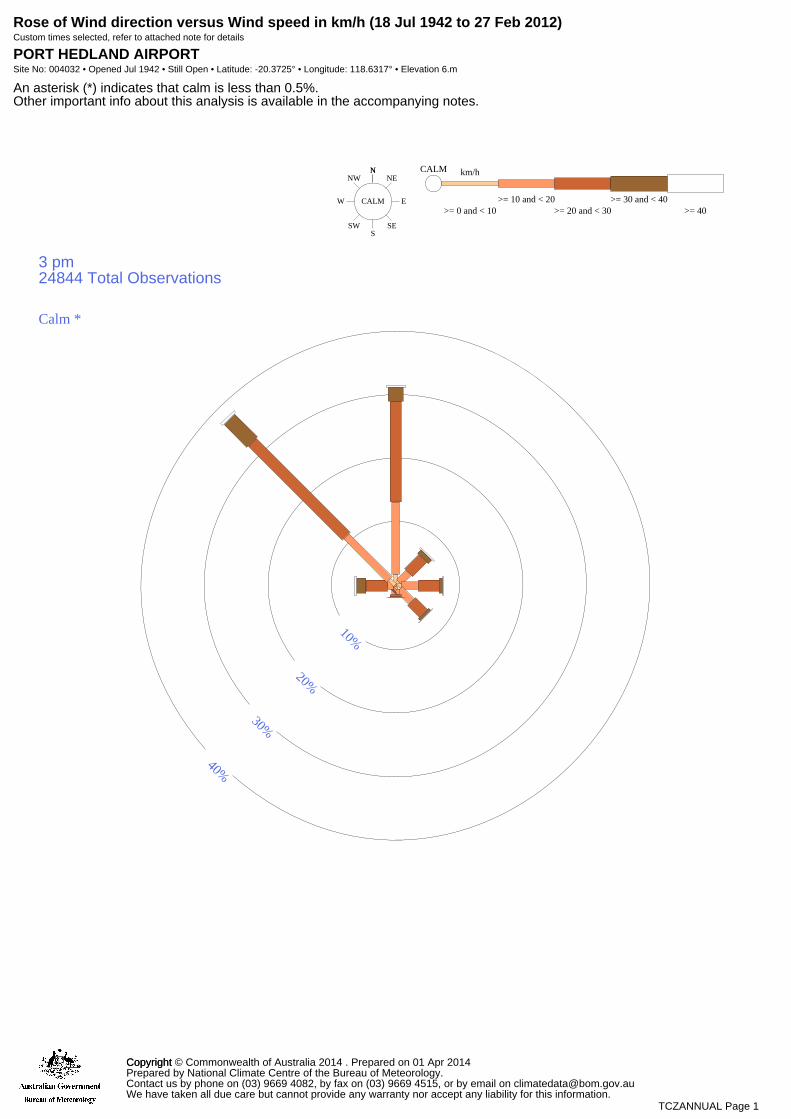
Rose of Wind direction versus Wind speed in km/h (18 Jul 1942 to 27 Feb 2012)Custom times selected, refer to attached note for details
PORT HEDLAND AIRPORTSite No: 004032 • Opened Jul 1942 • Still Open • Latitude: -20.3725° • Longitude: 118.6317° • Elevation 6.m
An asterisk (*) indicates that calm is less than 0.5%.Other important info about this analysis is available in the accompanying notes.
NNE
E
SES
SW
W
NWN
CALM>= 0 and < 10
km/hCALM
>= 10 and < 20>= 20 and < 30
>= 30 and < 40>= 40
3 pm24844 Total Observations
10%
20%
30%
40%
Calm *
CopyrightCopyright © Commonwealth of Australia 2014 . Prepared on 01 Apr 2014Prepared by National Climate Centre of the Bureau of Meteorology.Contact us by phone on (03) 9669 4082, by fax on (03) 9669 4515, or by email on [email protected] have taken all due care but cannot provide any warranty nor accept any liability for this information.
TCZANNUAL Page 1

Rose of Wind direction versus Wind speed in km/h (18 Jul 1942 to 27 Feb 2012)Custom times selected, refer to attached note for details
PORT HEDLAND AIRPORTSite No: 004032 • Opened Jul 1942 • Still Open • Latitude: -20.3725° • Longitude: 118.6317° • Elevation 6.m
An asterisk (*) indicates that calm is less than 0.5%.Other important info about this analysis is available in the accompanying notes.
NNE
E
SES
SW
W
NWN
CALM>= 0 and < 10
km/hCALM
>= 10 and < 20>= 20 and < 30
>= 30 and < 40>= 40
9 am24845 Total Observations
10%
20%
30%Calm 7%
CopyrightCopyright © Commonwealth of Australia 2014 . Prepared on 01 Apr 2014Prepared by National Climate Centre of the Bureau of Meteorology.Contact us by phone on (03) 9669 4082, by fax on (03) 9669 4515, or by email on [email protected] have taken all due care but cannot provide any warranty nor accept any liability for this information.
TCZANNUAL Page 1
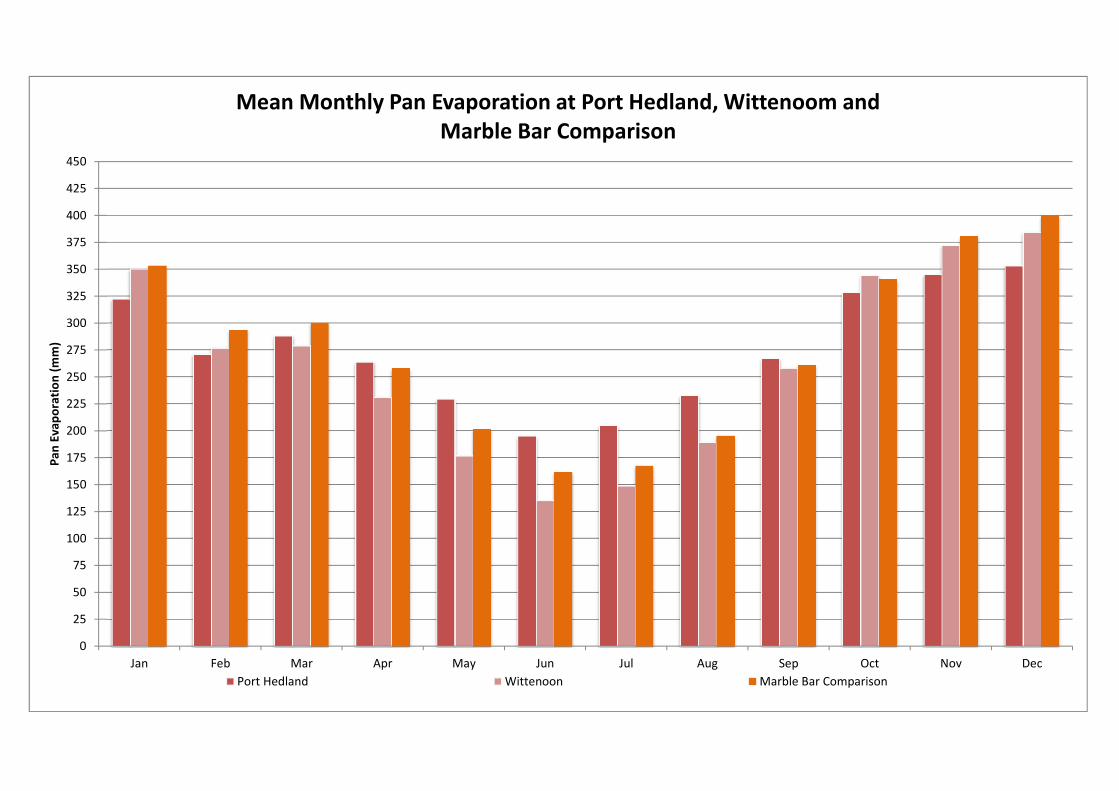
0
25
50
75
100
125
150
175
200
225
250
275
300
325
350
375
400
425
450
Jan Feb Mar Apr May Jun Jul Aug Sep Oct Nov Dec
Pan
Evap
orat
ion
(mm
)
Mean Monthly Pan Evaporation at Port Hedland, Wittenoom and Marble Bar Comparison
Port Hedland Wittenoon Marble Bar Comparison

49.248.3
46.745.0
39.5
35.835.0
37.2
42.6
45.647.2
48.3
18.9
13.915.0
10.0
5.6
1.12.2
3.95.6
10.0
14.4
17.0
0.0
5.0
10.0
15.0
20.0
25.0
30.0
35.0
40.0
45.0
50.0
55.0
Jan Feb Mar Apr May Jun Jul Aug Sep Oct Nov Dec
Air T
empe
ratu
re (°
C)
Marble Bar Comparison Maximum & Minimum Air Temperature (°C) 1901 to 2006
Maximum Recorded Temperature Mean Maximum Temperature Mean Minimum Temperature Minimum Recorded Temperature
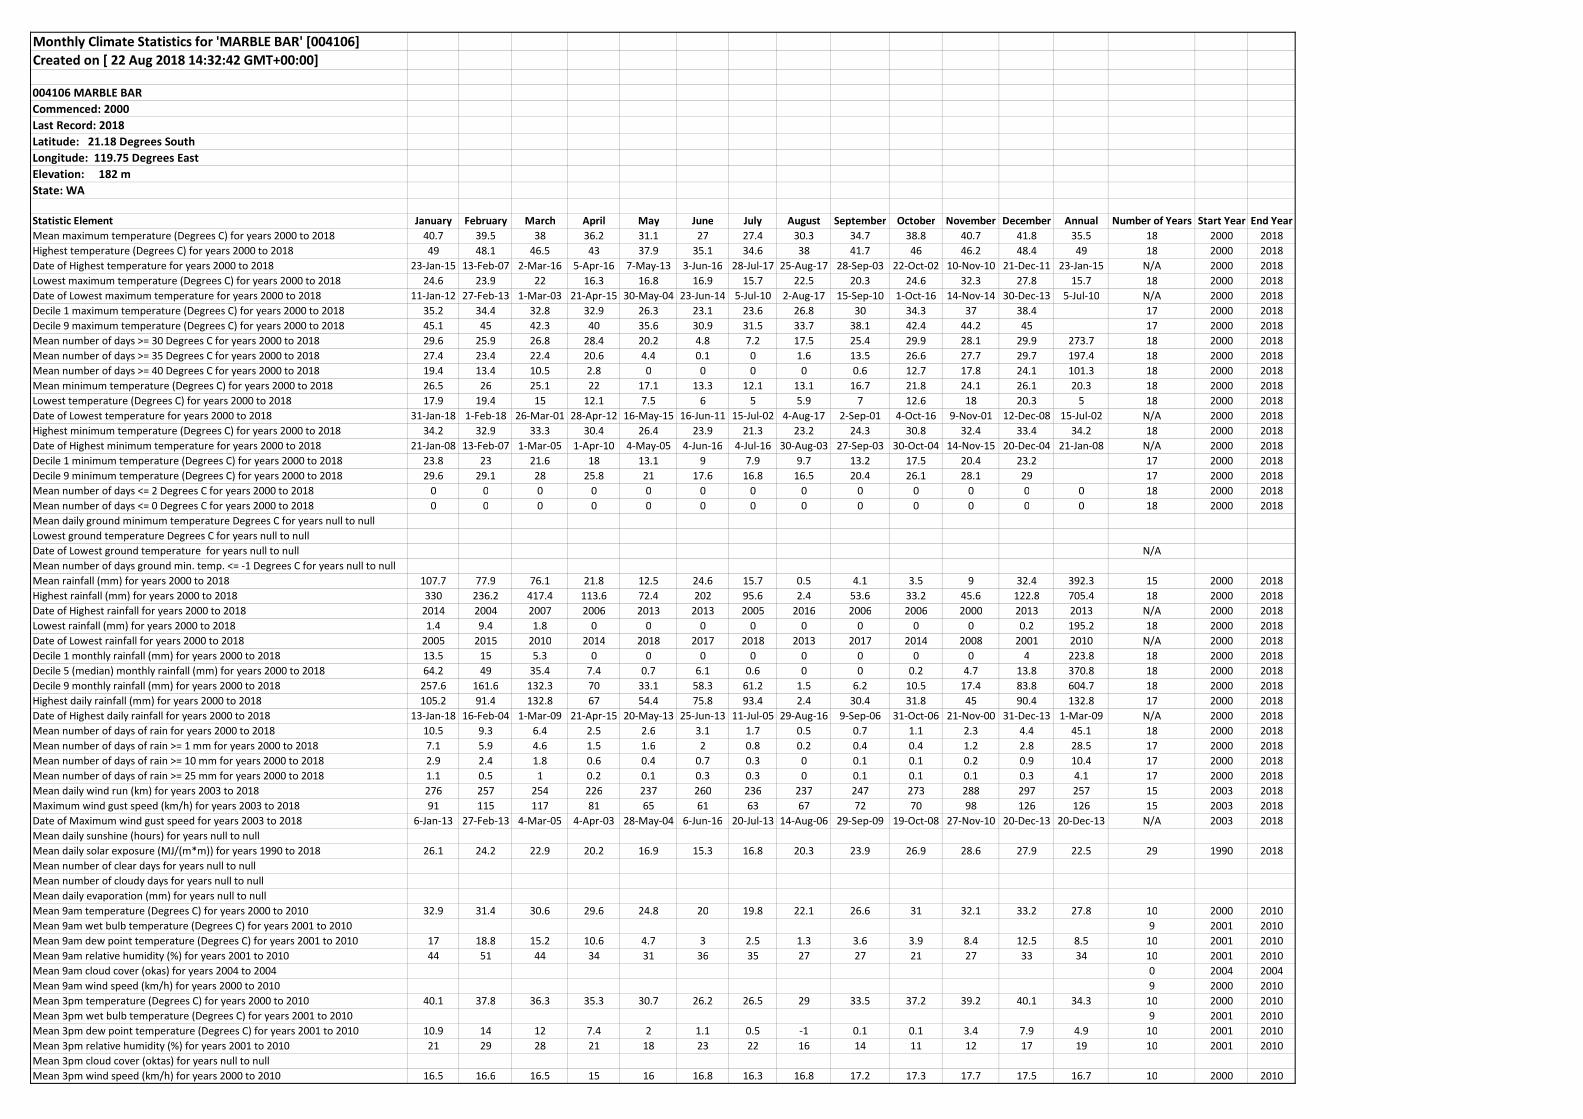
Monthly Climate Statistics for 'MARBLE BAR' [004106]Created on [ 22 Aug 2018 14:32:42 GMT+00:00]
004106 MARBLE BARCommenced: 2000Last Record: 2018Latitude: 21.18 Degrees SouthLongitude: 119.75 Degrees EastElevation: 182 mState: WA
Statistic Element January February March April May June July August September October November December Annual Number of Years Start Year End YearMean maximum temperature (Degrees C) for years 2000 to 2018 40.7 39.5 38 36.2 31.1 27 27.4 30.3 34.7 38.8 40.7 41.8 35.5 18 2000 2018Highest temperature (Degrees C) for years 2000 to 2018 49 48.1 46.5 43 37.9 35.1 34.6 38 41.7 46 46.2 48.4 49 18 2000 2018Date of Highest temperature for years 2000 to 2018 23-Jan-15 13-Feb-07 2-Mar-16 5-Apr-16 7-May-13 3-Jun-16 28-Jul-17 25-Aug-17 28-Sep-03 22-Oct-02 10-Nov-10 21-Dec-11 23-Jan-15 N/A 2000 2018Lowest maximum temperature (Degrees C) for years 2000 to 2018 24.6 23.9 22 16.3 16.8 16.9 15.7 22.5 20.3 24.6 32.3 27.8 15.7 18 2000 2018Date of Lowest maximum temperature for years 2000 to 2018 11-Jan-12 27-Feb-13 1-Mar-03 21-Apr-15 30-May-04 23-Jun-14 5-Jul-10 2-Aug-17 15-Sep-10 1-Oct-16 14-Nov-14 30-Dec-13 5-Jul-10 N/A 2000 2018Decile 1 maximum temperature (Degrees C) for years 2000 to 2018 35.2 34.4 32.8 32.9 26.3 23.1 23.6 26.8 30 34.3 37 38.4 17 2000 2018Decile 9 maximum temperature (Degrees C) for years 2000 to 2018 45.1 45 42.3 40 35.6 30.9 31.5 33.7 38.1 42.4 44.2 45 17 2000 2018Mean number of days >= 30 Degrees C for years 2000 to 2018 29.6 25.9 26.8 28.4 20.2 4.8 7.2 17.5 25.4 29.9 28.1 29.9 273.7 18 2000 2018Mean number of days >= 35 Degrees C for years 2000 to 2018 27.4 23.4 22.4 20.6 4.4 0.1 0 1.6 13.5 26.6 27.7 29.7 197.4 18 2000 2018Mean number of days >= 40 Degrees C for years 2000 to 2018 19.4 13.4 10.5 2.8 0 0 0 0 0.6 12.7 17.8 24.1 101.3 18 2000 2018Mean minimum temperature (Degrees C) for years 2000 to 2018 26.5 26 25.1 22 17.1 13.3 12.1 13.1 16.7 21.8 24.1 26.1 20.3 18 2000 2018Lowest temperature (Degrees C) for years 2000 to 2018 17.9 19.4 15 12.1 7.5 6 5 5.9 7 12.6 18 20.3 5 18 2000 2018Date of Lowest temperature for years 2000 to 2018 31-Jan-18 1-Feb-18 26-Mar-01 28-Apr-12 16-May-15 16-Jun-11 15-Jul-02 4-Aug-17 2-Sep-01 4-Oct-16 9-Nov-01 12-Dec-08 15-Jul-02 N/A 2000 2018Highest minimum temperature (Degrees C) for years 2000 to 2018 34.2 32.9 33.3 30.4 26.4 23.9 21.3 23.2 24.3 30.8 32.4 33.4 34.2 18 2000 2018Date of Highest minimum temperature for years 2000 to 2018 21-Jan-08 13-Feb-07 1-Mar-05 1-Apr-10 4-May-05 4-Jun-16 4-Jul-16 30-Aug-03 27-Sep-03 30-Oct-04 14-Nov-15 20-Dec-04 21-Jan-08 N/A 2000 2018Decile 1 minimum temperature (Degrees C) for years 2000 to 2018 23.8 23 21.6 18 13.1 9 7.9 9.7 13.2 17.5 20.4 23.2 17 2000 2018Decile 9 minimum temperature (Degrees C) for years 2000 to 2018 29.6 29.1 28 25.8 21 17.6 16.8 16.5 20.4 26.1 28.1 29 17 2000 2018Mean number of days <= 2 Degrees C for years 2000 to 2018 0 0 0 0 0 0 0 0 0 0 0 0 0 18 2000 2018Mean number of days <= 0 Degrees C for years 2000 to 2018 0 0 0 0 0 0 0 0 0 0 0 0 0 18 2000 2018Mean daily ground minimum temperature Degrees C for years null to null Lowest ground temperature Degrees C for years null to null Date of Lowest ground temperature for years null to null N/A Mean number of days ground min. temp. <= -1 Degrees C for years null to null Mean rainfall (mm) for years 2000 to 2018 107.7 77.9 76.1 21.8 12.5 24.6 15.7 0.5 4.1 3.5 9 32.4 392.3 15 2000 2018Highest rainfall (mm) for years 2000 to 2018 330 236.2 417.4 113.6 72.4 202 95.6 2.4 53.6 33.2 45.6 122.8 705.4 18 2000 2018Date of Highest rainfall for years 2000 to 2018 2014 2004 2007 2006 2013 2013 2005 2016 2006 2006 2000 2013 2013 N/A 2000 2018Lowest rainfall (mm) for years 2000 to 2018 1.4 9.4 1.8 0 0 0 0 0 0 0 0 0.2 195.2 18 2000 2018Date of Lowest rainfall for years 2000 to 2018 2005 2015 2010 2014 2018 2017 2018 2013 2017 2014 2008 2001 2010 N/A 2000 2018Decile 1 monthly rainfall (mm) for years 2000 to 2018 13.5 15 5.3 0 0 0 0 0 0 0 0 4 223.8 18 2000 2018Decile 5 (median) monthly rainfall (mm) for years 2000 to 2018 64.2 49 35.4 7.4 0.7 6.1 0.6 0 0 0.2 4.7 13.8 370.8 18 2000 2018Decile 9 monthly rainfall (mm) for years 2000 to 2018 257.6 161.6 132.3 70 33.1 58.3 61.2 1.5 6.2 10.5 17.4 83.8 604.7 18 2000 2018Highest daily rainfall (mm) for years 2000 to 2018 105.2 91.4 132.8 67 54.4 75.8 93.4 2.4 30.4 31.8 45 90.4 132.8 17 2000 2018Date of Highest daily rainfall for years 2000 to 2018 13-Jan-18 16-Feb-04 1-Mar-09 21-Apr-15 20-May-13 25-Jun-13 11-Jul-05 29-Aug-16 9-Sep-06 31-Oct-06 21-Nov-00 31-Dec-13 1-Mar-09 N/A 2000 2018Mean number of days of rain for years 2000 to 2018 10.5 9.3 6.4 2.5 2.6 3.1 1.7 0.5 0.7 1.1 2.3 4.4 45.1 18 2000 2018Mean number of days of rain >= 1 mm for years 2000 to 2018 7.1 5.9 4.6 1.5 1.6 2 0.8 0.2 0.4 0.4 1.2 2.8 28.5 17 2000 2018Mean number of days of rain >= 10 mm for years 2000 to 2018 2.9 2.4 1.8 0.6 0.4 0.7 0.3 0 0.1 0.1 0.2 0.9 10.4 17 2000 2018Mean number of days of rain >= 25 mm for years 2000 to 2018 1.1 0.5 1 0.2 0.1 0.3 0.3 0 0.1 0.1 0.1 0.3 4.1 17 2000 2018Mean daily wind run (km) for years 2003 to 2018 276 257 254 226 237 260 236 237 247 273 288 297 257 15 2003 2018Maximum wind gust speed (km/h) for years 2003 to 2018 91 115 117 81 65 61 63 67 72 70 98 126 126 15 2003 2018Date of Maximum wind gust speed for years 2003 to 2018 6-Jan-13 27-Feb-13 4-Mar-05 4-Apr-03 28-May-04 6-Jun-16 20-Jul-13 14-Aug-06 29-Sep-09 19-Oct-08 27-Nov-10 20-Dec-13 20-Dec-13 N/A 2003 2018Mean daily sunshine (hours) for years null to null Mean daily solar exposure (MJ/(m*m)) for years 1990 to 2018 26.1 24.2 22.9 20.2 16.9 15.3 16.8 20.3 23.9 26.9 28.6 27.9 22.5 29 1990 2018Mean number of clear days for years null to null Mean number of cloudy days for years null to null Mean daily evaporation (mm) for years null to null Mean 9am temperature (Degrees C) for years 2000 to 2010 32.9 31.4 30.6 29.6 24.8 20 19.8 22.1 26.6 31 32.1 33.2 27.8 10 2000 2010Mean 9am wet bulb temperature (Degrees C) for years 2001 to 2010 9 2001 2010Mean 9am dew point temperature (Degrees C) for years 2001 to 2010 17 18.8 15.2 10.6 4.7 3 2.5 1.3 3.6 3.9 8.4 12.5 8.5 10 2001 2010Mean 9am relative humidity (%) for years 2001 to 2010 44 51 44 34 31 36 35 27 27 21 27 33 34 10 2001 2010Mean 9am cloud cover (okas) for years 2004 to 2004 0 2004 2004Mean 9am wind speed (km/h) for years 2000 to 2010 9 2000 2010Mean 3pm temperature (Degrees C) for years 2000 to 2010 40.1 37.8 36.3 35.3 30.7 26.2 26.5 29 33.5 37.2 39.2 40.1 34.3 10 2000 2010Mean 3pm wet bulb temperature (Degrees C) for years 2001 to 2010 9 2001 2010Mean 3pm dew point temperature (Degrees C) for years 2001 to 2010 10.9 14 12 7.4 2 1.1 0.5 -1 0.1 0.1 3.4 7.9 4.9 10 2001 2010Mean 3pm relative humidity (%) for years 2001 to 2010 21 29 28 21 18 23 22 16 14 11 12 17 19 10 2001 2010Mean 3pm cloud cover (oktas) for years null to null Mean 3pm wind speed (km/h) for years 2000 to 2010 16.5 16.6 16.5 15 16 16.8 16.3 16.8 17.2 17.3 17.7 17.5 16.7 10 2000 2010

Monthly Climate Statistics for 'MARBLE BAR COMPARISON' [004020]Created on [ 17 Apr 2019 14:55:13 GMT+00:00]
004020 MARBLE BAR COMPARISONCommenced: 1895Last Record: 2006Latitude: 21.18 Degrees SouthLongitude: 119.75 Degrees EastElevation: 182 mState: WA
Statistic Element January February March April May June July August September October November December Annual Number of Years Start Year End YearMean maximum temperature (Degrees C) for years 1901 to 2006 41 39.8 39 36 30.7 27.1 26.8 29.6 33.9 37.6 40.5 41.6 35.3 106 1901 2006Highest temperature (Degrees C) for years 1901 to 2006 49.2 48.3 46.7 45 39.5 35.8 35 37.2 42.6 45.6 47.2 48.3 49.2 106 1901 2006Date of Highest temperature for years 1901 to 2006 3-Jan-22 4-Feb-16 6-Mar-32 2-Apr-28 8-May-90 7-Jun-98 29-Jul-17 27-Aug-54 29-Sep-42 22-Oct-02 28-Nov-28 29-Dec-56 3-Jan-22 N/A 1901 2006Lowest maximum temperature (Degrees C) for years 1901 to 2006 25 22.8 21.1 20.1 14.7 12.7 12.7 13.2 17.2 22.8 23.9 25.1 12.7 106 1901 2006Date of Lowest maximum temperature for years 1901 to 2006 23-Jan-26 23-Feb-49 28-Mar-13 8-Apr-99 13-May-14 19-Jun-31 1-Jul-01 11-Aug-72 30-Sep-37 9-Oct-66 16-Nov-34 8-Dec-75 1-Jul-01 N/A 1901 2006Decile 1 maximum temperature (Degrees C) for years 1901 to 2006 36 34.4 34.4 31.6 26.1 23.2 22.8 25.6 29.7 33.3 36.8 38 106 1901 2006Decile 9 maximum temperature (Degrees C) for years 1901 to 2006 45.2 44.4 42.8 40 35 31 30.6 33.3 37.8 41.4 43.9 45 106 1901 2006Mean number of days >= 30 Degrees C for years 1901 to 2006 30.3 27.3 30 28 19.5 5.6 5.2 14.6 26.3 30.5 29.7 30.5 277.5 106 1901 2006Mean number of days >= 35 Degrees C for years 1901 to 2006 28.5 24.6 27.2 20.8 3.2 0 0 1 12 25 28.8 30 201.1 106 1901 2006Mean number of days >= 40 Degrees C for years 1901 to 2006 21.3 15.9 14.2 3 0 0 0 0 0.4 7.6 18.6 23.7 104.7 106 1901 2006Mean minimum temperature (Degrees C) for years 1901 to 2006 26.1 25.6 24.7 21.4 16.6 13.2 11.7 13.3 16.7 20.3 23.6 25.5 19.9 105 1901 2006Lowest temperature (Degrees C) for years 1901 to 2006 18.9 13.9 15 10 5.6 1.1 2.2 3.9 5.6 10 14.4 17 1.1 105 1901 2006Date of Lowest temperature for years 1901 to 2006 2-Jan-58 25-Feb-49 26-Mar-01 30-Apr-01 31-May-36 30-Jun-35 19-Jul-61 7-Aug-03 17-Sep-03 31-Oct-09 5-Nov-48 16-Dec-99 30-Jun-35 N/A 1901 2006Highest minimum temperature (Degrees C) for years 1901 to 2006 35.1 32.8 32.7 30 26.2 23.3 21.2 22.2 27.6 31.1 33.9 35 35.1 105 1901 2006Date of Highest minimum temperature for years 1901 to 2006 24-Jan-16 3-Feb-59 8-Mar-32 1-Apr-51 4-May-05 4-Jun-98 28-Jul-74 17-Aug-38 13-Sep-81 30-Oct-67 21-Nov-51 28-Dec-02 24-Jan-16 N/A 1901 2006Decile 1 minimum temperature (Degrees C) for years 1901 to 2006 23.3 22.8 21.6 17.2 12.2 8.9 7.8 9 12.8 16.1 19.9 22.2 105 1901 2006Decile 9 minimum temperature (Degrees C) for years 1901 to 2006 28.9 28.4 27.8 25.4 21 17.8 16.1 17.2 21 24.6 27.6 28.6 105 1901 2006Mean number of days <= 2 Degrees C for years 1901 to 2006 0 0 0 0 0 0 0 0 0 0 0 0 0 105 1901 2006Mean number of days <= 0 Degrees C for years 1901 to 2006 0 0 0 0 0 0 0 0 0 0 0 0 0 105 1901 2006Mean daily ground minimum temperature Degrees C for years null to null Lowest ground temperature Degrees C for years null to null Date of Lowest ground temperature for years null to null N/A Mean number of days ground min. temp. <= -1 Degrees C for years null to null Mean rainfall (mm) for years 1895 to 2006 76.3 87.8 56.7 21.9 23 23 12.6 6.4 0.9 3.8 9.1 39.6 358.4 110 1895 2006Highest rainfall (mm) for years 1895 to 2006 309.8 347.2 388.6 240.5 186.7 165.3 133.9 88.9 24.1 116.3 71.2 314.9 797.9 112 1895 2006Date of Highest rainfall for years 1895 to 2006 1917 1995 1941 1898 1970 1968 1901 1993 1937 1916 1982 1998 1980 N/A 1895 2006Lowest rainfall (mm) for years 1895 to 2006 0 0 0 0 0 0 0 0 0 0 0 0 71.1 112 1895 2006Date of Lowest rainfall for years 1895 to 2006 1921 1953 1932 2005 2006 2006 2006 2006 2005 2005 2003 2001 1924 N/A 1895 2006Decile 1 monthly rainfall (mm) for years 1895 to 2006 15.9 12.2 2.4 0 0 0 0 0 0 0 0 2 190.9 108 1895 2006Decile 5 (median) monthly rainfall (mm) for years 1895 to 2006 55.5 67.8 28.2 3.2 5.4 6.6 1.4 0 0 0 2.5 21.8 337.7 108 1895 2006Decile 9 monthly rainfall (mm) for years 1895 to 2006 164.3 179.8 135.5 59.1 70.7 74 41.7 23.6 1.8 7 30.5 90.7 555.6 108 1895 2006Highest daily rainfall (mm) for years 1895 to 2006 151.6 121.4 304.8 124.7 91.4 104.6 105.6 73.1 24.1 84.3 60.5 150.4 304.8 108 1895 2006Date of Highest daily rainfall for years 1895 to 2006 11-Jan-80 3-Feb-71 2-Mar-41 16-Apr-20 31-May-70 15-Jun-09 11-Jul-05 14-Aug-93 30-Sep-37 26-Oct-16 26-Nov-42 29-Dec-30 2-Mar-41 N/A 1895 2006Mean number of days of rain for years 1895 to 2006 7.4 7.7 4.9 1.9 2.4 2.3 1.5 0.9 0.3 0.6 1.5 4.6 36 108 1895 2006Mean number of days of rain >= 1 mm for years 1895 to 2006 5.8 6.2 3.8 1.5 1.7 1.7 1.1 0.6 0.2 0.4 1 3.6 27.6 108 1895 2006Mean number of days of rain >= 10 mm for years 1895 to 2006 2.2 2.4 1.4 0.5 0.7 0.6 0.3 0.2 0 0.1 0.3 1.1 9.8 108 1895 2006Mean number of days of rain >= 25 mm for years 1895 to 2006 0.8 1 0.5 0.2 0.3 0.3 0.1 0 0 0 0.1 0.4 3.7 108 1895 2006Mean daily wind run (km) for years null to null Maximum wind gust speed (km/h) for years null to null Date of Maximum wind gust speed for years null to null N/A Mean daily sunshine (hours) for years null to null Mean daily solar exposure (MJ/(m*m)) for years 1990 to 2019 26.1 24.3 22.9 20.2 16.9 15.3 16.8 20.4 23.8 26.9 28.7 28 22.5 29 1990 2019Mean number of clear days for years 1939 to 2006 7.5 5.5 8.9 10.5 12.8 14.5 17.6 18.7 18.3 19 15.3 11 159.6 67 1939 2006Mean number of cloudy days for years 1939 to 2006 8 9.5 6.8 5.3 6.4 4.8 3.1 2.1 1.4 1.7 2.2 4.3 55.6 67 1939 2006Mean daily evaporation (mm) for years 1968 to 1988 11.4 10.4 9.7 8.6 6.5 5.4 5.4 6.3 8.7 11 12.7 12.9 9.1 16 1968 1988Mean 9am temperature (Degrees C) for years 1939 to 2006 32.9 31.7 31.5 28.9 23.7 20 19.1 21.6 26 30.1 32.8 33.9 27.7 67 1939 2006Mean 9am wet bulb temperature (Degrees C) for years 1939 to 2006 23.4 23.4 21.7 18.8 15.5 13.3 12 13.2 15.4 17.8 19.8 22 18 60 1939 2006Mean 9am dew point temperature (Degrees C) for years 1939 to 2006 17.7 18.5 15 10.3 7.3 5.9 3.5 3.4 4.3 6.3 8.9 13.9 9.6 60 1939 2006Mean 9am relative humidity (%) for years 1939 to 2006 45 51 41 35 39 43 39 33 28 26 27 35 37 60 1939 2006Mean 9am cloud cover (okas) for years 1939 to 2006 3.5 4.1 3.2 2.9 3 2.7 2.1 1.7 1.6 1.4 1.7 2.5 2.5 67 1939 2006Mean 9am wind speed (km/h) for years 1939 to 2006 10.4 10.8 12.1 11.8 12.1 12.1 13.4 13.5 14.1 13.5 12.3 10.9 12.3 63 1939 2006Mean 3pm temperature (Degrees C) for years 1939 to 2006 39.6 38.1 37.7 35 29.7 26.5 26.2 28.8 33 36.6 39.1 40.3 34.2 67 1939 2006Mean 3pm wet bulb temperature (Degrees C) for years 1939 to 2006 23.8 23.9 22.7 20.5 17.7 15.9 15 16.1 17.9 19.7 21.1 22.8 19.8 60 1939 2006Mean 3pm dew point temperature (Degrees C) for years 1939 to 2006 13.8 15.3 12.4 8.9 6.3 4.9 2.5 2.5 2.9 4.6 6.3 10.6 7.6 60 1939 2006Mean 3pm relative humidity (%) for years 1939 to 2006 26 31 26 23 27 28 24 21 17 16 16 20 23 60 1939 2006Mean 3pm cloud cover (oktas) for years 1939 to 2006 4.6 4.9 4.3 3.8 3.3 2.8 2.1 1.8 1.9 2.3 3 3.9 3.2 67 1939 2006Mean 3pm wind speed (km/h) for years 1939 to 2006 11.4 11.8 11.5 10.7 10.7 11 11.5 11.3 12 12 12.1 10.9 11.4 63 1939 2006
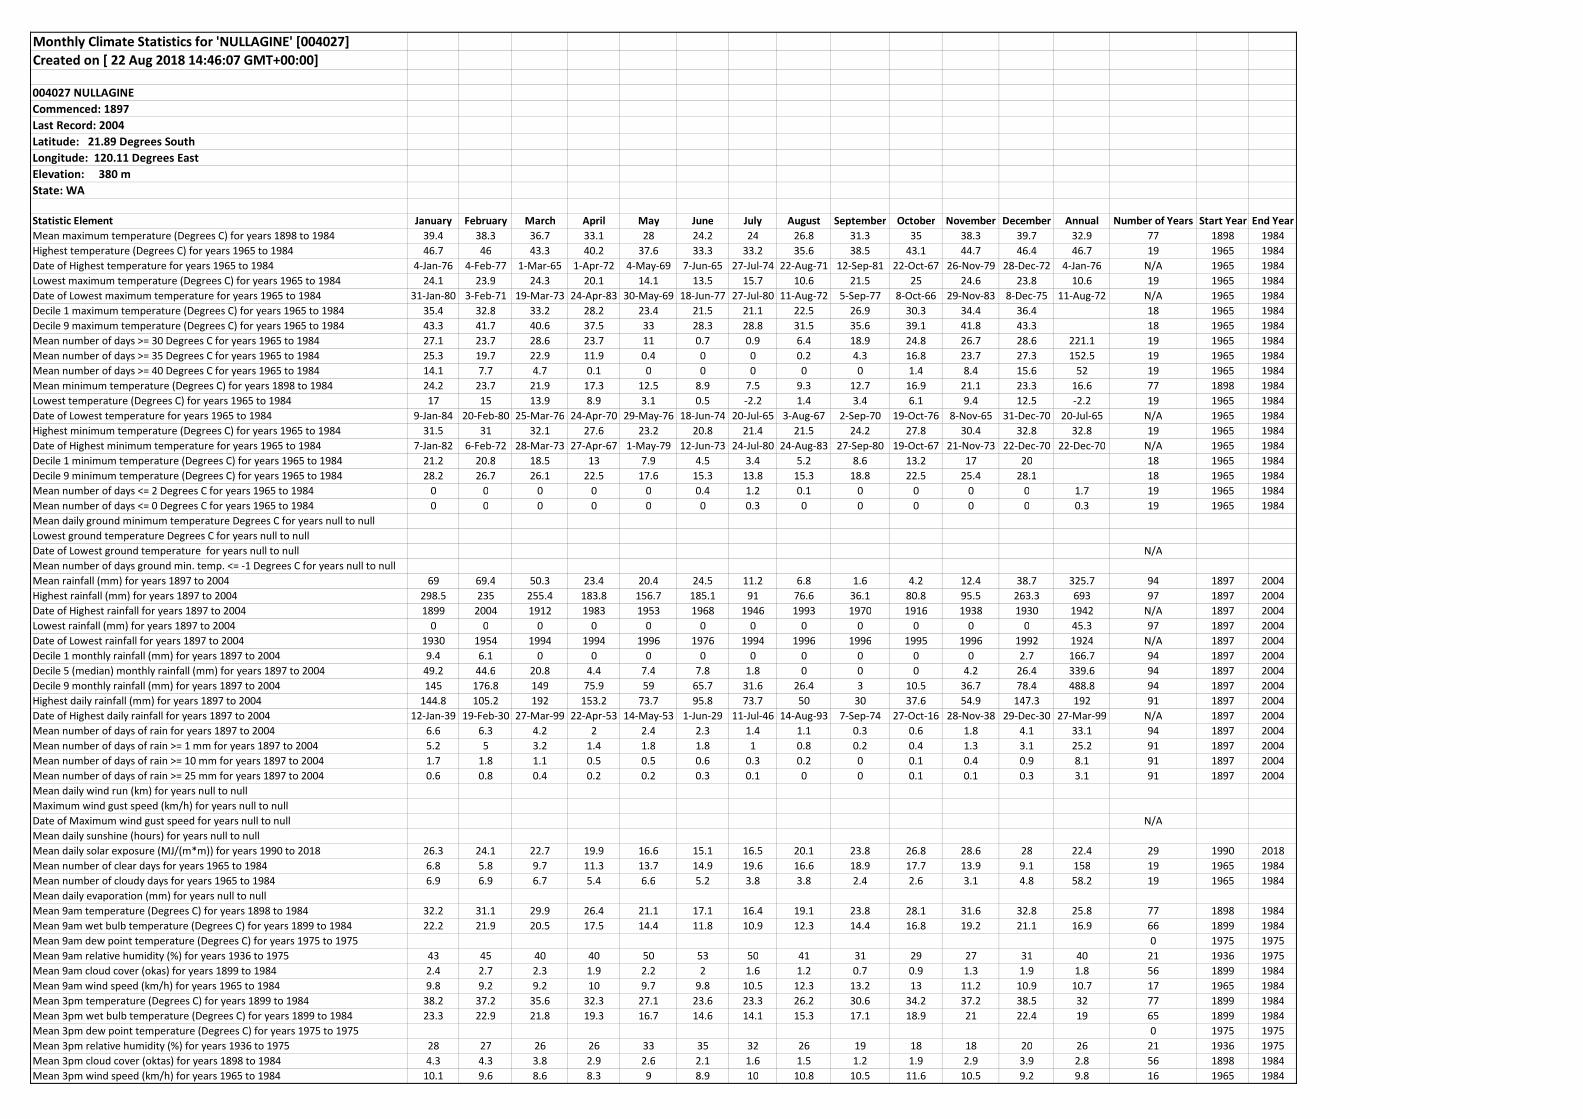
Monthly Climate Statistics for 'NULLAGINE' [004027]Created on [ 22 Aug 2018 14:46:07 GMT+00:00]
004027 NULLAGINECommenced: 1897Last Record: 2004Latitude: 21.89 Degrees SouthLongitude: 120.11 Degrees EastElevation: 380 mState: WA
Statistic Element January February March April May June July August September October November December Annual Number of Years Start Year End YearMean maximum temperature (Degrees C) for years 1898 to 1984 39.4 38.3 36.7 33.1 28 24.2 24 26.8 31.3 35 38.3 39.7 32.9 77 1898 1984Highest temperature (Degrees C) for years 1965 to 1984 46.7 46 43.3 40.2 37.6 33.3 33.2 35.6 38.5 43.1 44.7 46.4 46.7 19 1965 1984Date of Highest temperature for years 1965 to 1984 4-Jan-76 4-Feb-77 1-Mar-65 1-Apr-72 4-May-69 7-Jun-65 27-Jul-74 22-Aug-71 12-Sep-81 22-Oct-67 26-Nov-79 28-Dec-72 4-Jan-76 N/A 1965 1984Lowest maximum temperature (Degrees C) for years 1965 to 1984 24.1 23.9 24.3 20.1 14.1 13.5 15.7 10.6 21.5 25 24.6 23.8 10.6 19 1965 1984Date of Lowest maximum temperature for years 1965 to 1984 31-Jan-80 3-Feb-71 19-Mar-73 24-Apr-83 30-May-69 18-Jun-77 27-Jul-80 11-Aug-72 5-Sep-77 8-Oct-66 29-Nov-83 8-Dec-75 11-Aug-72 N/A 1965 1984Decile 1 maximum temperature (Degrees C) for years 1965 to 1984 35.4 32.8 33.2 28.2 23.4 21.5 21.1 22.5 26.9 30.3 34.4 36.4 18 1965 1984Decile 9 maximum temperature (Degrees C) for years 1965 to 1984 43.3 41.7 40.6 37.5 33 28.3 28.8 31.5 35.6 39.1 41.8 43.3 18 1965 1984Mean number of days >= 30 Degrees C for years 1965 to 1984 27.1 23.7 28.6 23.7 11 0.7 0.9 6.4 18.9 24.8 26.7 28.6 221.1 19 1965 1984Mean number of days >= 35 Degrees C for years 1965 to 1984 25.3 19.7 22.9 11.9 0.4 0 0 0.2 4.3 16.8 23.7 27.3 152.5 19 1965 1984Mean number of days >= 40 Degrees C for years 1965 to 1984 14.1 7.7 4.7 0.1 0 0 0 0 0 1.4 8.4 15.6 52 19 1965 1984Mean minimum temperature (Degrees C) for years 1898 to 1984 24.2 23.7 21.9 17.3 12.5 8.9 7.5 9.3 12.7 16.9 21.1 23.3 16.6 77 1898 1984Lowest temperature (Degrees C) for years 1965 to 1984 17 15 13.9 8.9 3.1 0.5 -2.2 1.4 3.4 6.1 9.4 12.5 -2.2 19 1965 1984Date of Lowest temperature for years 1965 to 1984 9-Jan-84 20-Feb-80 25-Mar-76 24-Apr-70 29-May-76 18-Jun-74 20-Jul-65 3-Aug-67 2-Sep-70 19-Oct-76 8-Nov-65 31-Dec-70 20-Jul-65 N/A 1965 1984Highest minimum temperature (Degrees C) for years 1965 to 1984 31.5 31 32.1 27.6 23.2 20.8 21.4 21.5 24.2 27.8 30.4 32.8 32.8 19 1965 1984Date of Highest minimum temperature for years 1965 to 1984 7-Jan-82 6-Feb-72 28-Mar-73 27-Apr-67 1-May-79 12-Jun-73 24-Jul-80 24-Aug-83 27-Sep-80 19-Oct-67 21-Nov-73 22-Dec-70 22-Dec-70 N/A 1965 1984Decile 1 minimum temperature (Degrees C) for years 1965 to 1984 21.2 20.8 18.5 13 7.9 4.5 3.4 5.2 8.6 13.2 17 20 18 1965 1984Decile 9 minimum temperature (Degrees C) for years 1965 to 1984 28.2 26.7 26.1 22.5 17.6 15.3 13.8 15.3 18.8 22.5 25.4 28.1 18 1965 1984Mean number of days <= 2 Degrees C for years 1965 to 1984 0 0 0 0 0 0.4 1.2 0.1 0 0 0 0 1.7 19 1965 1984Mean number of days <= 0 Degrees C for years 1965 to 1984 0 0 0 0 0 0 0.3 0 0 0 0 0 0.3 19 1965 1984Mean daily ground minimum temperature Degrees C for years null to null Lowest ground temperature Degrees C for years null to null Date of Lowest ground temperature for years null to null N/A Mean number of days ground min. temp. <= -1 Degrees C for years null to null Mean rainfall (mm) for years 1897 to 2004 69 69.4 50.3 23.4 20.4 24.5 11.2 6.8 1.6 4.2 12.4 38.7 325.7 94 1897 2004Highest rainfall (mm) for years 1897 to 2004 298.5 235 255.4 183.8 156.7 185.1 91 76.6 36.1 80.8 95.5 263.3 693 97 1897 2004Date of Highest rainfall for years 1897 to 2004 1899 2004 1912 1983 1953 1968 1946 1993 1970 1916 1938 1930 1942 N/A 1897 2004Lowest rainfall (mm) for years 1897 to 2004 0 0 0 0 0 0 0 0 0 0 0 0 45.3 97 1897 2004Date of Lowest rainfall for years 1897 to 2004 1930 1954 1994 1994 1996 1976 1994 1996 1996 1995 1996 1992 1924 N/A 1897 2004Decile 1 monthly rainfall (mm) for years 1897 to 2004 9.4 6.1 0 0 0 0 0 0 0 0 0 2.7 166.7 94 1897 2004Decile 5 (median) monthly rainfall (mm) for years 1897 to 2004 49.2 44.6 20.8 4.4 7.4 7.8 1.8 0 0 0 4.2 26.4 339.6 94 1897 2004Decile 9 monthly rainfall (mm) for years 1897 to 2004 145 176.8 149 75.9 59 65.7 31.6 26.4 3 10.5 36.7 78.4 488.8 94 1897 2004Highest daily rainfall (mm) for years 1897 to 2004 144.8 105.2 192 153.2 73.7 95.8 73.7 50 30 37.6 54.9 147.3 192 91 1897 2004Date of Highest daily rainfall for years 1897 to 2004 12-Jan-39 19-Feb-30 27-Mar-99 22-Apr-53 14-May-53 1-Jun-29 11-Jul-46 14-Aug-93 7-Sep-74 27-Oct-16 28-Nov-38 29-Dec-30 27-Mar-99 N/A 1897 2004Mean number of days of rain for years 1897 to 2004 6.6 6.3 4.2 2 2.4 2.3 1.4 1.1 0.3 0.6 1.8 4.1 33.1 94 1897 2004Mean number of days of rain >= 1 mm for years 1897 to 2004 5.2 5 3.2 1.4 1.8 1.8 1 0.8 0.2 0.4 1.3 3.1 25.2 91 1897 2004Mean number of days of rain >= 10 mm for years 1897 to 2004 1.7 1.8 1.1 0.5 0.5 0.6 0.3 0.2 0 0.1 0.4 0.9 8.1 91 1897 2004Mean number of days of rain >= 25 mm for years 1897 to 2004 0.6 0.8 0.4 0.2 0.2 0.3 0.1 0 0 0.1 0.1 0.3 3.1 91 1897 2004Mean daily wind run (km) for years null to null Maximum wind gust speed (km/h) for years null to null Date of Maximum wind gust speed for years null to null N/A Mean daily sunshine (hours) for years null to null Mean daily solar exposure (MJ/(m*m)) for years 1990 to 2018 26.3 24.1 22.7 19.9 16.6 15.1 16.5 20.1 23.8 26.8 28.6 28 22.4 29 1990 2018Mean number of clear days for years 1965 to 1984 6.8 5.8 9.7 11.3 13.7 14.9 19.6 16.6 18.9 17.7 13.9 9.1 158 19 1965 1984Mean number of cloudy days for years 1965 to 1984 6.9 6.9 6.7 5.4 6.6 5.2 3.8 3.8 2.4 2.6 3.1 4.8 58.2 19 1965 1984Mean daily evaporation (mm) for years null to null Mean 9am temperature (Degrees C) for years 1898 to 1984 32.2 31.1 29.9 26.4 21.1 17.1 16.4 19.1 23.8 28.1 31.6 32.8 25.8 77 1898 1984Mean 9am wet bulb temperature (Degrees C) for years 1899 to 1984 22.2 21.9 20.5 17.5 14.4 11.8 10.9 12.3 14.4 16.8 19.2 21.1 16.9 66 1899 1984Mean 9am dew point temperature (Degrees C) for years 1975 to 1975 0 1975 1975Mean 9am relative humidity (%) for years 1936 to 1975 43 45 40 40 50 53 50 41 31 29 27 31 40 21 1936 1975Mean 9am cloud cover (okas) for years 1899 to 1984 2.4 2.7 2.3 1.9 2.2 2 1.6 1.2 0.7 0.9 1.3 1.9 1.8 56 1899 1984Mean 9am wind speed (km/h) for years 1965 to 1984 9.8 9.2 9.2 10 9.7 9.8 10.5 12.3 13.2 13 11.2 10.9 10.7 17 1965 1984Mean 3pm temperature (Degrees C) for years 1899 to 1984 38.2 37.2 35.6 32.3 27.1 23.6 23.3 26.2 30.6 34.2 37.2 38.5 32 77 1899 1984Mean 3pm wet bulb temperature (Degrees C) for years 1899 to 1984 23.3 22.9 21.8 19.3 16.7 14.6 14.1 15.3 17.1 18.9 21 22.4 19 65 1899 1984Mean 3pm dew point temperature (Degrees C) for years 1975 to 1975 0 1975 1975Mean 3pm relative humidity (%) for years 1936 to 1975 28 27 26 26 33 35 32 26 19 18 18 20 26 21 1936 1975Mean 3pm cloud cover (oktas) for years 1898 to 1984 4.3 4.3 3.8 2.9 2.6 2.1 1.6 1.5 1.2 1.9 2.9 3.9 2.8 56 1898 1984Mean 3pm wind speed (km/h) for years 1965 to 1984 10.1 9.6 8.6 8.3 9 8.9 10 10.8 10.5 11.6 10.5 9.2 9.8 16 1965 1984
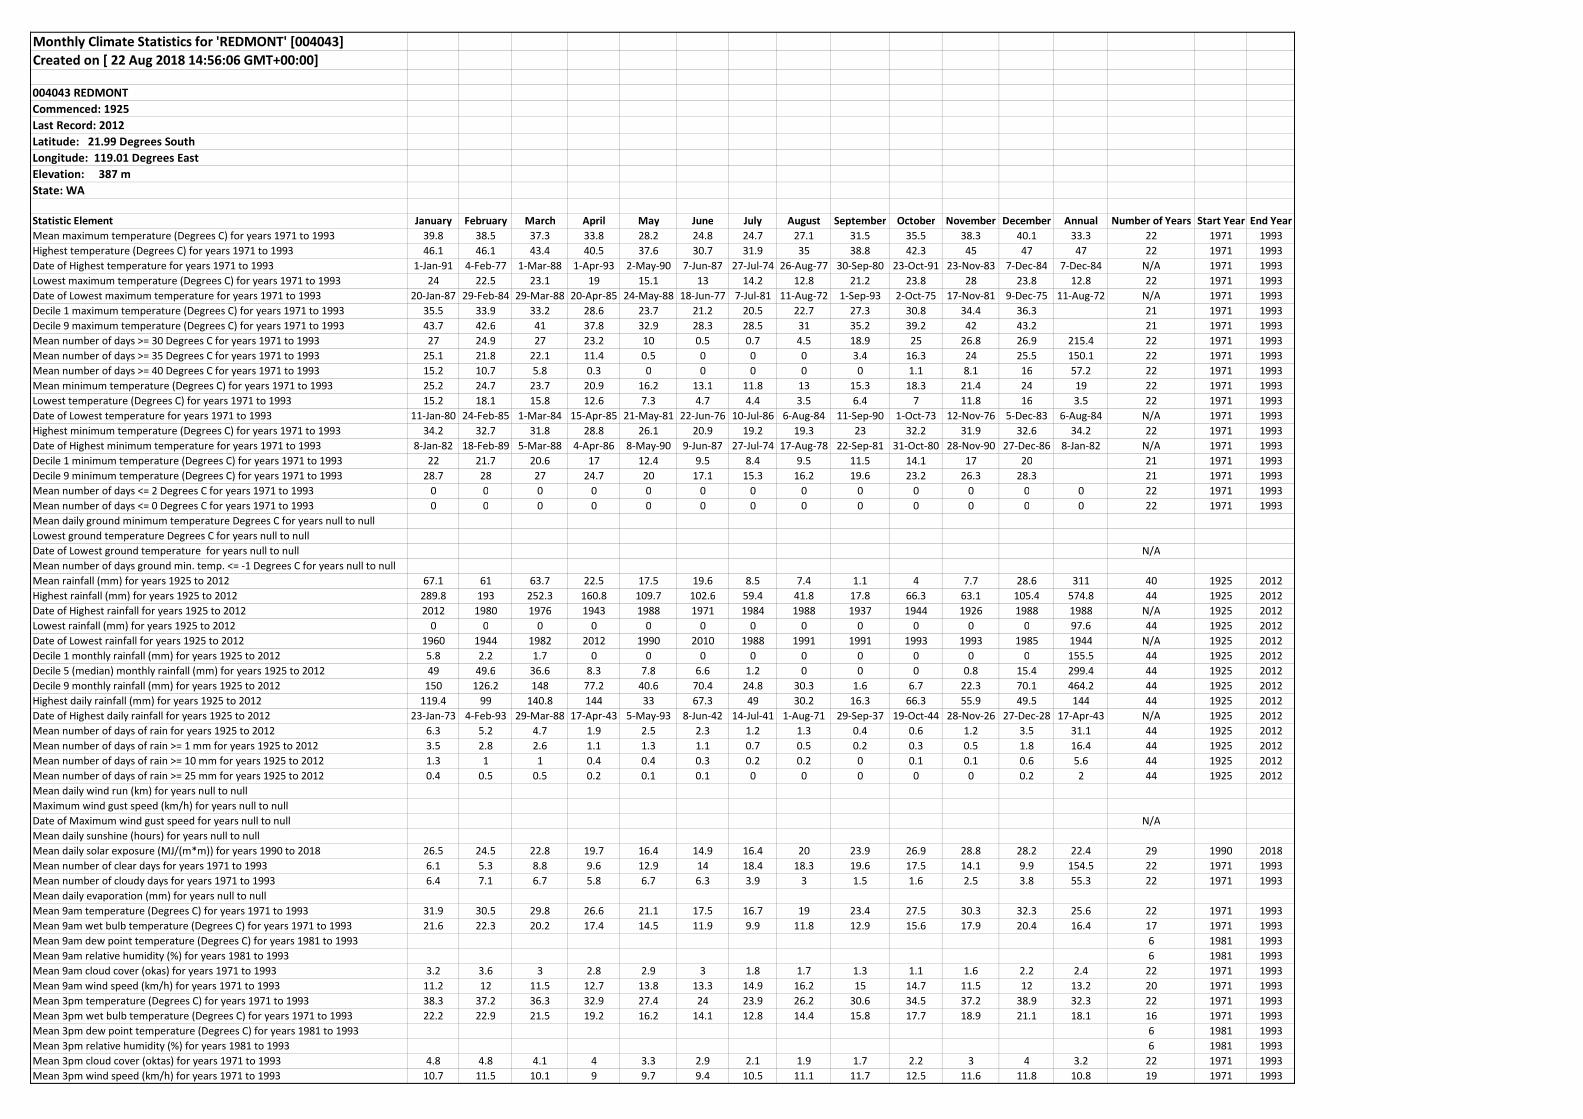
Monthly Climate Statistics for 'REDMONT' [004043]Created on [ 22 Aug 2018 14:56:06 GMT+00:00]
004043 REDMONTCommenced: 1925Last Record: 2012Latitude: 21.99 Degrees SouthLongitude: 119.01 Degrees EastElevation: 387 mState: WA
Statistic Element January February March April May June July August September October November December Annual Number of Years Start Year End YearMean maximum temperature (Degrees C) for years 1971 to 1993 39.8 38.5 37.3 33.8 28.2 24.8 24.7 27.1 31.5 35.5 38.3 40.1 33.3 22 1971 1993Highest temperature (Degrees C) for years 1971 to 1993 46.1 46.1 43.4 40.5 37.6 30.7 31.9 35 38.8 42.3 45 47 47 22 1971 1993Date of Highest temperature for years 1971 to 1993 1-Jan-91 4-Feb-77 1-Mar-88 1-Apr-93 2-May-90 7-Jun-87 27-Jul-74 26-Aug-77 30-Sep-80 23-Oct-91 23-Nov-83 7-Dec-84 7-Dec-84 N/A 1971 1993Lowest maximum temperature (Degrees C) for years 1971 to 1993 24 22.5 23.1 19 15.1 13 14.2 12.8 21.2 23.8 28 23.8 12.8 22 1971 1993Date of Lowest maximum temperature for years 1971 to 1993 20-Jan-87 29-Feb-84 29-Mar-88 20-Apr-85 24-May-88 18-Jun-77 7-Jul-81 11-Aug-72 1-Sep-93 2-Oct-75 17-Nov-81 9-Dec-75 11-Aug-72 N/A 1971 1993Decile 1 maximum temperature (Degrees C) for years 1971 to 1993 35.5 33.9 33.2 28.6 23.7 21.2 20.5 22.7 27.3 30.8 34.4 36.3 21 1971 1993Decile 9 maximum temperature (Degrees C) for years 1971 to 1993 43.7 42.6 41 37.8 32.9 28.3 28.5 31 35.2 39.2 42 43.2 21 1971 1993Mean number of days >= 30 Degrees C for years 1971 to 1993 27 24.9 27 23.2 10 0.5 0.7 4.5 18.9 25 26.8 26.9 215.4 22 1971 1993Mean number of days >= 35 Degrees C for years 1971 to 1993 25.1 21.8 22.1 11.4 0.5 0 0 0 3.4 16.3 24 25.5 150.1 22 1971 1993Mean number of days >= 40 Degrees C for years 1971 to 1993 15.2 10.7 5.8 0.3 0 0 0 0 0 1.1 8.1 16 57.2 22 1971 1993Mean minimum temperature (Degrees C) for years 1971 to 1993 25.2 24.7 23.7 20.9 16.2 13.1 11.8 13 15.3 18.3 21.4 24 19 22 1971 1993Lowest temperature (Degrees C) for years 1971 to 1993 15.2 18.1 15.8 12.6 7.3 4.7 4.4 3.5 6.4 7 11.8 16 3.5 22 1971 1993Date of Lowest temperature for years 1971 to 1993 11-Jan-80 24-Feb-85 1-Mar-84 15-Apr-85 21-May-81 22-Jun-76 10-Jul-86 6-Aug-84 11-Sep-90 1-Oct-73 12-Nov-76 5-Dec-83 6-Aug-84 N/A 1971 1993Highest minimum temperature (Degrees C) for years 1971 to 1993 34.2 32.7 31.8 28.8 26.1 20.9 19.2 19.3 23 32.2 31.9 32.6 34.2 22 1971 1993Date of Highest minimum temperature for years 1971 to 1993 8-Jan-82 18-Feb-89 5-Mar-88 4-Apr-86 8-May-90 9-Jun-87 27-Jul-74 17-Aug-78 22-Sep-81 31-Oct-80 28-Nov-90 27-Dec-86 8-Jan-82 N/A 1971 1993Decile 1 minimum temperature (Degrees C) for years 1971 to 1993 22 21.7 20.6 17 12.4 9.5 8.4 9.5 11.5 14.1 17 20 21 1971 1993Decile 9 minimum temperature (Degrees C) for years 1971 to 1993 28.7 28 27 24.7 20 17.1 15.3 16.2 19.6 23.2 26.3 28.3 21 1971 1993Mean number of days <= 2 Degrees C for years 1971 to 1993 0 0 0 0 0 0 0 0 0 0 0 0 0 22 1971 1993Mean number of days <= 0 Degrees C for years 1971 to 1993 0 0 0 0 0 0 0 0 0 0 0 0 0 22 1971 1993Mean daily ground minimum temperature Degrees C for years null to null Lowest ground temperature Degrees C for years null to null Date of Lowest ground temperature for years null to null N/A Mean number of days ground min. temp. <= -1 Degrees C for years null to null Mean rainfall (mm) for years 1925 to 2012 67.1 61 63.7 22.5 17.5 19.6 8.5 7.4 1.1 4 7.7 28.6 311 40 1925 2012Highest rainfall (mm) for years 1925 to 2012 289.8 193 252.3 160.8 109.7 102.6 59.4 41.8 17.8 66.3 63.1 105.4 574.8 44 1925 2012Date of Highest rainfall for years 1925 to 2012 2012 1980 1976 1943 1988 1971 1984 1988 1937 1944 1926 1988 1988 N/A 1925 2012Lowest rainfall (mm) for years 1925 to 2012 0 0 0 0 0 0 0 0 0 0 0 0 97.6 44 1925 2012Date of Lowest rainfall for years 1925 to 2012 1960 1944 1982 2012 1990 2010 1988 1991 1991 1993 1993 1985 1944 N/A 1925 2012Decile 1 monthly rainfall (mm) for years 1925 to 2012 5.8 2.2 1.7 0 0 0 0 0 0 0 0 0 155.5 44 1925 2012Decile 5 (median) monthly rainfall (mm) for years 1925 to 2012 49 49.6 36.6 8.3 7.8 6.6 1.2 0 0 0 0.8 15.4 299.4 44 1925 2012Decile 9 monthly rainfall (mm) for years 1925 to 2012 150 126.2 148 77.2 40.6 70.4 24.8 30.3 1.6 6.7 22.3 70.1 464.2 44 1925 2012Highest daily rainfall (mm) for years 1925 to 2012 119.4 99 140.8 144 33 67.3 49 30.2 16.3 66.3 55.9 49.5 144 44 1925 2012Date of Highest daily rainfall for years 1925 to 2012 23-Jan-73 4-Feb-93 29-Mar-88 17-Apr-43 5-May-93 8-Jun-42 14-Jul-41 1-Aug-71 29-Sep-37 19-Oct-44 28-Nov-26 27-Dec-28 17-Apr-43 N/A 1925 2012Mean number of days of rain for years 1925 to 2012 6.3 5.2 4.7 1.9 2.5 2.3 1.2 1.3 0.4 0.6 1.2 3.5 31.1 44 1925 2012Mean number of days of rain >= 1 mm for years 1925 to 2012 3.5 2.8 2.6 1.1 1.3 1.1 0.7 0.5 0.2 0.3 0.5 1.8 16.4 44 1925 2012Mean number of days of rain >= 10 mm for years 1925 to 2012 1.3 1 1 0.4 0.4 0.3 0.2 0.2 0 0.1 0.1 0.6 5.6 44 1925 2012Mean number of days of rain >= 25 mm for years 1925 to 2012 0.4 0.5 0.5 0.2 0.1 0.1 0 0 0 0 0 0.2 2 44 1925 2012Mean daily wind run (km) for years null to null Maximum wind gust speed (km/h) for years null to null Date of Maximum wind gust speed for years null to null N/A Mean daily sunshine (hours) for years null to null Mean daily solar exposure (MJ/(m*m)) for years 1990 to 2018 26.5 24.5 22.8 19.7 16.4 14.9 16.4 20 23.9 26.9 28.8 28.2 22.4 29 1990 2018Mean number of clear days for years 1971 to 1993 6.1 5.3 8.8 9.6 12.9 14 18.4 18.3 19.6 17.5 14.1 9.9 154.5 22 1971 1993Mean number of cloudy days for years 1971 to 1993 6.4 7.1 6.7 5.8 6.7 6.3 3.9 3 1.5 1.6 2.5 3.8 55.3 22 1971 1993Mean daily evaporation (mm) for years null to null Mean 9am temperature (Degrees C) for years 1971 to 1993 31.9 30.5 29.8 26.6 21.1 17.5 16.7 19 23.4 27.5 30.3 32.3 25.6 22 1971 1993Mean 9am wet bulb temperature (Degrees C) for years 1971 to 1993 21.6 22.3 20.2 17.4 14.5 11.9 9.9 11.8 12.9 15.6 17.9 20.4 16.4 17 1971 1993Mean 9am dew point temperature (Degrees C) for years 1981 to 1993 6 1981 1993Mean 9am relative humidity (%) for years 1981 to 1993 6 1981 1993Mean 9am cloud cover (okas) for years 1971 to 1993 3.2 3.6 3 2.8 2.9 3 1.8 1.7 1.3 1.1 1.6 2.2 2.4 22 1971 1993Mean 9am wind speed (km/h) for years 1971 to 1993 11.2 12 11.5 12.7 13.8 13.3 14.9 16.2 15 14.7 11.5 12 13.2 20 1971 1993Mean 3pm temperature (Degrees C) for years 1971 to 1993 38.3 37.2 36.3 32.9 27.4 24 23.9 26.2 30.6 34.5 37.2 38.9 32.3 22 1971 1993Mean 3pm wet bulb temperature (Degrees C) for years 1971 to 1993 22.2 22.9 21.5 19.2 16.2 14.1 12.8 14.4 15.8 17.7 18.9 21.1 18.1 16 1971 1993Mean 3pm dew point temperature (Degrees C) for years 1981 to 1993 6 1981 1993Mean 3pm relative humidity (%) for years 1981 to 1993 6 1981 1993Mean 3pm cloud cover (oktas) for years 1971 to 1993 4.8 4.8 4.1 4 3.3 2.9 2.1 1.9 1.7 2.2 3 4 3.2 22 1971 1993Mean 3pm wind speed (km/h) for years 1971 to 1993 10.7 11.5 10.1 9 9.7 9.4 10.5 11.1 11.7 12.5 11.6 11.8 10.8 19 1971 1993
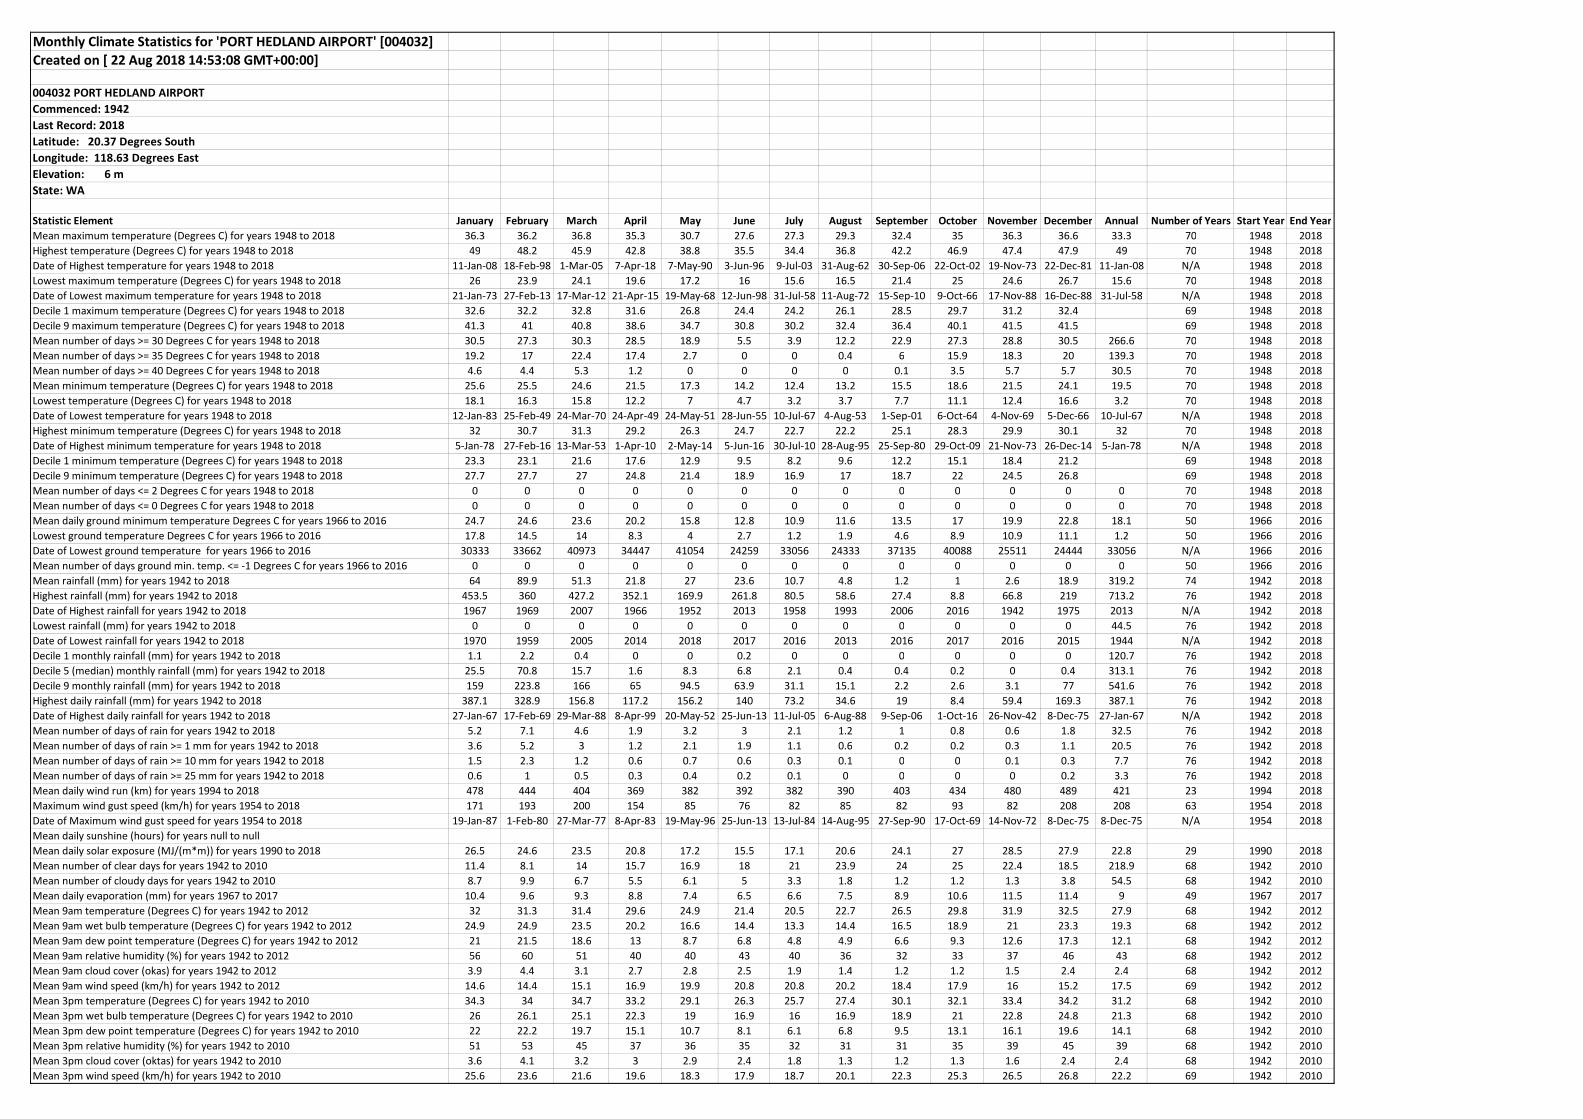
Monthly Climate Statistics for 'PORT HEDLAND AIRPORT' [004032]Created on [ 22 Aug 2018 14:53:08 GMT+00:00]
004032 PORT HEDLAND AIRPORTCommenced: 1942Last Record: 2018Latitude: 20.37 Degrees SouthLongitude: 118.63 Degrees EastElevation: 6 mState: WA
Statistic Element January February March April May June July August September October November December Annual Number of Years Start Year End YearMean maximum temperature (Degrees C) for years 1948 to 2018 36.3 36.2 36.8 35.3 30.7 27.6 27.3 29.3 32.4 35 36.3 36.6 33.3 70 1948 2018Highest temperature (Degrees C) for years 1948 to 2018 49 48.2 45.9 42.8 38.8 35.5 34.4 36.8 42.2 46.9 47.4 47.9 49 70 1948 2018Date of Highest temperature for years 1948 to 2018 11-Jan-08 18-Feb-98 1-Mar-05 7-Apr-18 7-May-90 3-Jun-96 9-Jul-03 31-Aug-62 30-Sep-06 22-Oct-02 19-Nov-73 22-Dec-81 11-Jan-08 N/A 1948 2018Lowest maximum temperature (Degrees C) for years 1948 to 2018 26 23.9 24.1 19.6 17.2 16 15.6 16.5 21.4 25 24.6 26.7 15.6 70 1948 2018Date of Lowest maximum temperature for years 1948 to 2018 21-Jan-73 27-Feb-13 17-Mar-12 21-Apr-15 19-May-68 12-Jun-98 31-Jul-58 11-Aug-72 15-Sep-10 9-Oct-66 17-Nov-88 16-Dec-88 31-Jul-58 N/A 1948 2018Decile 1 maximum temperature (Degrees C) for years 1948 to 2018 32.6 32.2 32.8 31.6 26.8 24.4 24.2 26.1 28.5 29.7 31.2 32.4 69 1948 2018Decile 9 maximum temperature (Degrees C) for years 1948 to 2018 41.3 41 40.8 38.6 34.7 30.8 30.2 32.4 36.4 40.1 41.5 41.5 69 1948 2018Mean number of days >= 30 Degrees C for years 1948 to 2018 30.5 27.3 30.3 28.5 18.9 5.5 3.9 12.2 22.9 27.3 28.8 30.5 266.6 70 1948 2018Mean number of days >= 35 Degrees C for years 1948 to 2018 19.2 17 22.4 17.4 2.7 0 0 0.4 6 15.9 18.3 20 139.3 70 1948 2018Mean number of days >= 40 Degrees C for years 1948 to 2018 4.6 4.4 5.3 1.2 0 0 0 0 0.1 3.5 5.7 5.7 30.5 70 1948 2018Mean minimum temperature (Degrees C) for years 1948 to 2018 25.6 25.5 24.6 21.5 17.3 14.2 12.4 13.2 15.5 18.6 21.5 24.1 19.5 70 1948 2018Lowest temperature (Degrees C) for years 1948 to 2018 18.1 16.3 15.8 12.2 7 4.7 3.2 3.7 7.7 11.1 12.4 16.6 3.2 70 1948 2018Date of Lowest temperature for years 1948 to 2018 12-Jan-83 25-Feb-49 24-Mar-70 24-Apr-49 24-May-51 28-Jun-55 10-Jul-67 4-Aug-53 1-Sep-01 6-Oct-64 4-Nov-69 5-Dec-66 10-Jul-67 N/A 1948 2018Highest minimum temperature (Degrees C) for years 1948 to 2018 32 30.7 31.3 29.2 26.3 24.7 22.7 22.2 25.1 28.3 29.9 30.1 32 70 1948 2018Date of Highest minimum temperature for years 1948 to 2018 5-Jan-78 27-Feb-16 13-Mar-53 1-Apr-10 2-May-14 5-Jun-16 30-Jul-10 28-Aug-95 25-Sep-80 29-Oct-09 21-Nov-73 26-Dec-14 5-Jan-78 N/A 1948 2018Decile 1 minimum temperature (Degrees C) for years 1948 to 2018 23.3 23.1 21.6 17.6 12.9 9.5 8.2 9.6 12.2 15.1 18.4 21.2 69 1948 2018Decile 9 minimum temperature (Degrees C) for years 1948 to 2018 27.7 27.7 27 24.8 21.4 18.9 16.9 17 18.7 22 24.5 26.8 69 1948 2018Mean number of days <= 2 Degrees C for years 1948 to 2018 0 0 0 0 0 0 0 0 0 0 0 0 0 70 1948 2018Mean number of days <= 0 Degrees C for years 1948 to 2018 0 0 0 0 0 0 0 0 0 0 0 0 0 70 1948 2018Mean daily ground minimum temperature Degrees C for years 1966 to 2016 24.7 24.6 23.6 20.2 15.8 12.8 10.9 11.6 13.5 17 19.9 22.8 18.1 50 1966 2016Lowest ground temperature Degrees C for years 1966 to 2016 17.8 14.5 14 8.3 4 2.7 1.2 1.9 4.6 8.9 10.9 11.1 1.2 50 1966 2016Date of Lowest ground temperature for years 1966 to 2016 30333 33662 40973 34447 41054 24259 33056 24333 37135 40088 25511 24444 33056 N/A 1966 2016Mean number of days ground min. temp. <= -1 Degrees C for years 1966 to 2016 0 0 0 0 0 0 0 0 0 0 0 0 0 50 1966 2016Mean rainfall (mm) for years 1942 to 2018 64 89.9 51.3 21.8 27 23.6 10.7 4.8 1.2 1 2.6 18.9 319.2 74 1942 2018Highest rainfall (mm) for years 1942 to 2018 453.5 360 427.2 352.1 169.9 261.8 80.5 58.6 27.4 8.8 66.8 219 713.2 76 1942 2018Date of Highest rainfall for years 1942 to 2018 1967 1969 2007 1966 1952 2013 1958 1993 2006 2016 1942 1975 2013 N/A 1942 2018Lowest rainfall (mm) for years 1942 to 2018 0 0 0 0 0 0 0 0 0 0 0 0 44.5 76 1942 2018Date of Lowest rainfall for years 1942 to 2018 1970 1959 2005 2014 2018 2017 2016 2013 2016 2017 2016 2015 1944 N/A 1942 2018Decile 1 monthly rainfall (mm) for years 1942 to 2018 1.1 2.2 0.4 0 0 0.2 0 0 0 0 0 0 120.7 76 1942 2018Decile 5 (median) monthly rainfall (mm) for years 1942 to 2018 25.5 70.8 15.7 1.6 8.3 6.8 2.1 0.4 0.4 0.2 0 0.4 313.1 76 1942 2018Decile 9 monthly rainfall (mm) for years 1942 to 2018 159 223.8 166 65 94.5 63.9 31.1 15.1 2.2 2.6 3.1 77 541.6 76 1942 2018Highest daily rainfall (mm) for years 1942 to 2018 387.1 328.9 156.8 117.2 156.2 140 73.2 34.6 19 8.4 59.4 169.3 387.1 76 1942 2018Date of Highest daily rainfall for years 1942 to 2018 27-Jan-67 17-Feb-69 29-Mar-88 8-Apr-99 20-May-52 25-Jun-13 11-Jul-05 6-Aug-88 9-Sep-06 1-Oct-16 26-Nov-42 8-Dec-75 27-Jan-67 N/A 1942 2018Mean number of days of rain for years 1942 to 2018 5.2 7.1 4.6 1.9 3.2 3 2.1 1.2 1 0.8 0.6 1.8 32.5 76 1942 2018Mean number of days of rain >= 1 mm for years 1942 to 2018 3.6 5.2 3 1.2 2.1 1.9 1.1 0.6 0.2 0.2 0.3 1.1 20.5 76 1942 2018Mean number of days of rain >= 10 mm for years 1942 to 2018 1.5 2.3 1.2 0.6 0.7 0.6 0.3 0.1 0 0 0.1 0.3 7.7 76 1942 2018Mean number of days of rain >= 25 mm for years 1942 to 2018 0.6 1 0.5 0.3 0.4 0.2 0.1 0 0 0 0 0.2 3.3 76 1942 2018Mean daily wind run (km) for years 1994 to 2018 478 444 404 369 382 392 382 390 403 434 480 489 421 23 1994 2018Maximum wind gust speed (km/h) for years 1954 to 2018 171 193 200 154 85 76 82 85 82 93 82 208 208 63 1954 2018Date of Maximum wind gust speed for years 1954 to 2018 19-Jan-87 1-Feb-80 27-Mar-77 8-Apr-83 19-May-96 25-Jun-13 13-Jul-84 14-Aug-95 27-Sep-90 17-Oct-69 14-Nov-72 8-Dec-75 8-Dec-75 N/A 1954 2018Mean daily sunshine (hours) for years null to null Mean daily solar exposure (MJ/(m*m)) for years 1990 to 2018 26.5 24.6 23.5 20.8 17.2 15.5 17.1 20.6 24.1 27 28.5 27.9 22.8 29 1990 2018Mean number of clear days for years 1942 to 2010 11.4 8.1 14 15.7 16.9 18 21 23.9 24 25 22.4 18.5 218.9 68 1942 2010Mean number of cloudy days for years 1942 to 2010 8.7 9.9 6.7 5.5 6.1 5 3.3 1.8 1.2 1.2 1.3 3.8 54.5 68 1942 2010Mean daily evaporation (mm) for years 1967 to 2017 10.4 9.6 9.3 8.8 7.4 6.5 6.6 7.5 8.9 10.6 11.5 11.4 9 49 1967 2017Mean 9am temperature (Degrees C) for years 1942 to 2012 32 31.3 31.4 29.6 24.9 21.4 20.5 22.7 26.5 29.8 31.9 32.5 27.9 68 1942 2012Mean 9am wet bulb temperature (Degrees C) for years 1942 to 2012 24.9 24.9 23.5 20.2 16.6 14.4 13.3 14.4 16.5 18.9 21 23.3 19.3 68 1942 2012Mean 9am dew point temperature (Degrees C) for years 1942 to 2012 21 21.5 18.6 13 8.7 6.8 4.8 4.9 6.6 9.3 12.6 17.3 12.1 68 1942 2012Mean 9am relative humidity (%) for years 1942 to 2012 56 60 51 40 40 43 40 36 32 33 37 46 43 68 1942 2012Mean 9am cloud cover (okas) for years 1942 to 2012 3.9 4.4 3.1 2.7 2.8 2.5 1.9 1.4 1.2 1.2 1.5 2.4 2.4 68 1942 2012Mean 9am wind speed (km/h) for years 1942 to 2012 14.6 14.4 15.1 16.9 19.9 20.8 20.8 20.2 18.4 17.9 16 15.2 17.5 69 1942 2012Mean 3pm temperature (Degrees C) for years 1942 to 2010 34.3 34 34.7 33.2 29.1 26.3 25.7 27.4 30.1 32.1 33.4 34.2 31.2 68 1942 2010Mean 3pm wet bulb temperature (Degrees C) for years 1942 to 2010 26 26.1 25.1 22.3 19 16.9 16 16.9 18.9 21 22.8 24.8 21.3 68 1942 2010Mean 3pm dew point temperature (Degrees C) for years 1942 to 2010 22 22.2 19.7 15.1 10.7 8.1 6.1 6.8 9.5 13.1 16.1 19.6 14.1 68 1942 2010Mean 3pm relative humidity (%) for years 1942 to 2010 51 53 45 37 36 35 32 31 31 35 39 45 39 68 1942 2010Mean 3pm cloud cover (oktas) for years 1942 to 2010 3.6 4.1 3.2 3 2.9 2.4 1.8 1.3 1.2 1.3 1.6 2.4 2.4 68 1942 2010Mean 3pm wind speed (km/h) for years 1942 to 2010 25.6 23.6 21.6 19.6 18.3 17.9 18.7 20.1 22.3 25.3 26.5 26.8 22.2 69 1942 2010
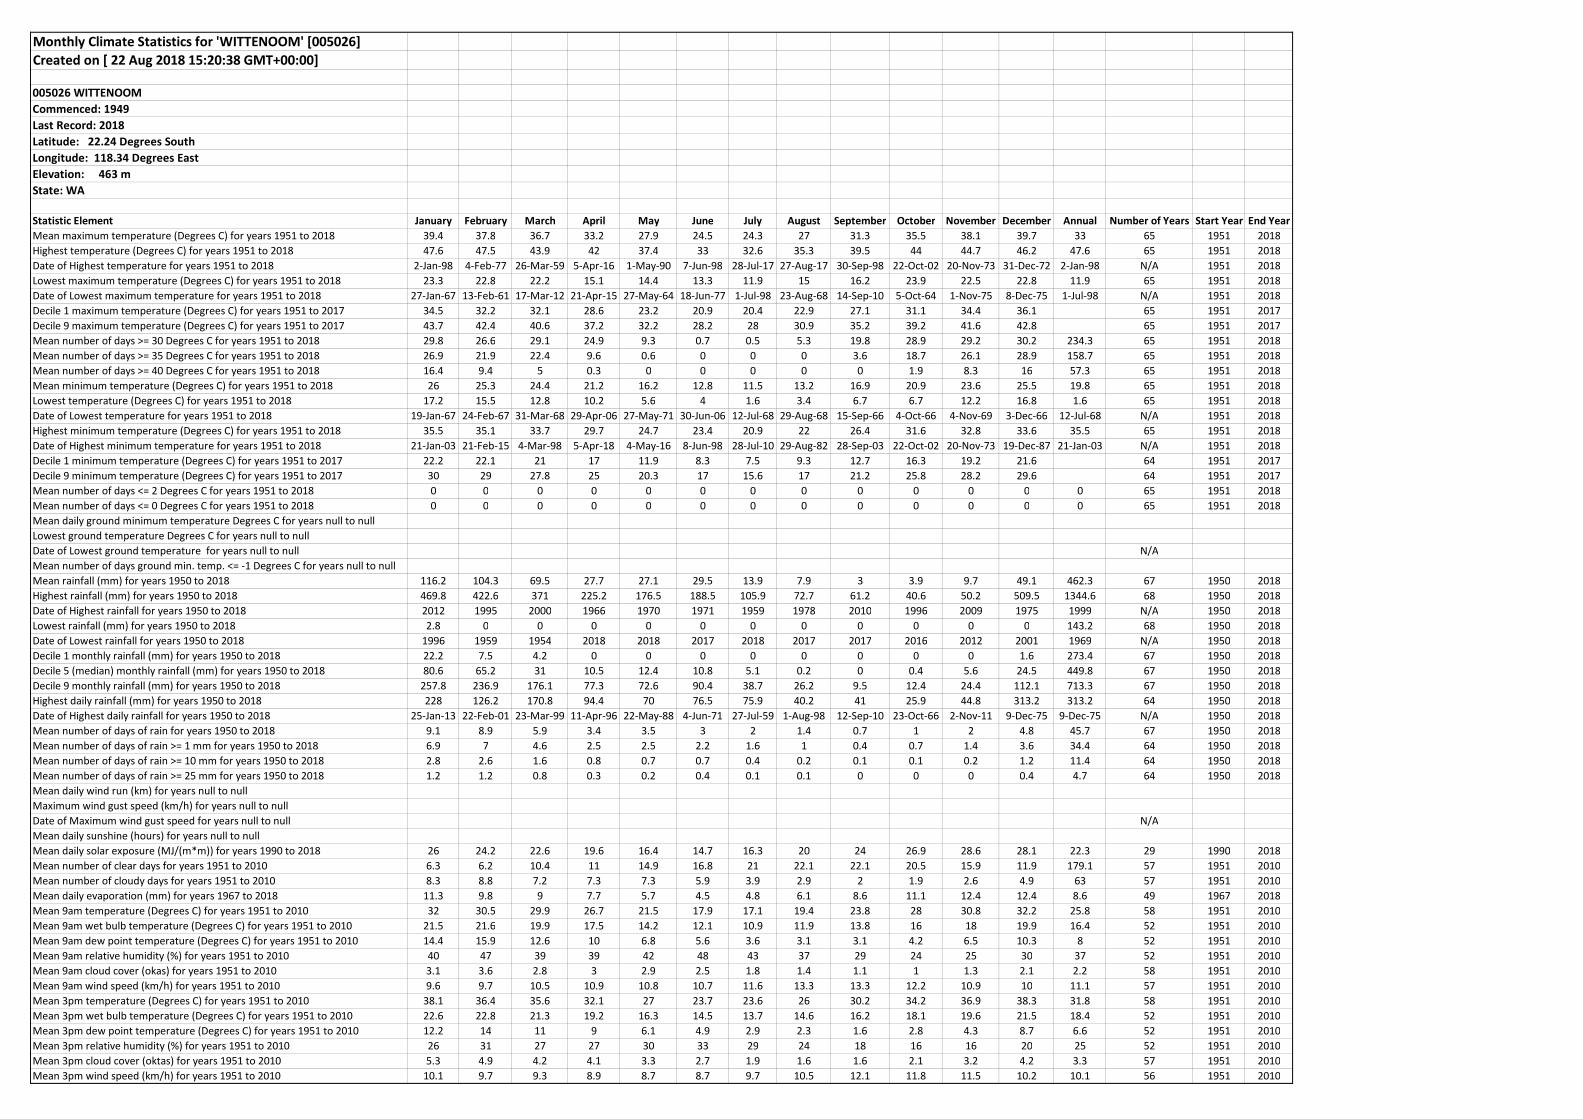
Monthly Climate Statistics for 'WITTENOOM' [005026]Created on [ 22 Aug 2018 15:20:38 GMT+00:00]
005026 WITTENOOMCommenced: 1949Last Record: 2018Latitude: 22.24 Degrees SouthLongitude: 118.34 Degrees EastElevation: 463 mState: WA
Statistic Element January February March April May June July August September October November December Annual Number of Years Start Year End YearMean maximum temperature (Degrees C) for years 1951 to 2018 39.4 37.8 36.7 33.2 27.9 24.5 24.3 27 31.3 35.5 38.1 39.7 33 65 1951 2018Highest temperature (Degrees C) for years 1951 to 2018 47.6 47.5 43.9 42 37.4 33 32.6 35.3 39.5 44 44.7 46.2 47.6 65 1951 2018Date of Highest temperature for years 1951 to 2018 2-Jan-98 4-Feb-77 26-Mar-59 5-Apr-16 1-May-90 7-Jun-98 28-Jul-17 27-Aug-17 30-Sep-98 22-Oct-02 20-Nov-73 31-Dec-72 2-Jan-98 N/A 1951 2018Lowest maximum temperature (Degrees C) for years 1951 to 2018 23.3 22.8 22.2 15.1 14.4 13.3 11.9 15 16.2 23.9 22.5 22.8 11.9 65 1951 2018Date of Lowest maximum temperature for years 1951 to 2018 27-Jan-67 13-Feb-61 17-Mar-12 21-Apr-15 27-May-64 18-Jun-77 1-Jul-98 23-Aug-68 14-Sep-10 5-Oct-64 1-Nov-75 8-Dec-75 1-Jul-98 N/A 1951 2018Decile 1 maximum temperature (Degrees C) for years 1951 to 2017 34.5 32.2 32.1 28.6 23.2 20.9 20.4 22.9 27.1 31.1 34.4 36.1 65 1951 2017Decile 9 maximum temperature (Degrees C) for years 1951 to 2017 43.7 42.4 40.6 37.2 32.2 28.2 28 30.9 35.2 39.2 41.6 42.8 65 1951 2017Mean number of days >= 30 Degrees C for years 1951 to 2018 29.8 26.6 29.1 24.9 9.3 0.7 0.5 5.3 19.8 28.9 29.2 30.2 234.3 65 1951 2018Mean number of days >= 35 Degrees C for years 1951 to 2018 26.9 21.9 22.4 9.6 0.6 0 0 0 3.6 18.7 26.1 28.9 158.7 65 1951 2018Mean number of days >= 40 Degrees C for years 1951 to 2018 16.4 9.4 5 0.3 0 0 0 0 0 1.9 8.3 16 57.3 65 1951 2018Mean minimum temperature (Degrees C) for years 1951 to 2018 26 25.3 24.4 21.2 16.2 12.8 11.5 13.2 16.9 20.9 23.6 25.5 19.8 65 1951 2018Lowest temperature (Degrees C) for years 1951 to 2018 17.2 15.5 12.8 10.2 5.6 4 1.6 3.4 6.7 6.7 12.2 16.8 1.6 65 1951 2018Date of Lowest temperature for years 1951 to 2018 19-Jan-67 24-Feb-67 31-Mar-68 29-Apr-06 27-May-71 30-Jun-06 12-Jul-68 29-Aug-68 15-Sep-66 4-Oct-66 4-Nov-69 3-Dec-66 12-Jul-68 N/A 1951 2018Highest minimum temperature (Degrees C) for years 1951 to 2018 35.5 35.1 33.7 29.7 24.7 23.4 20.9 22 26.4 31.6 32.8 33.6 35.5 65 1951 2018Date of Highest minimum temperature for years 1951 to 2018 21-Jan-03 21-Feb-15 4-Mar-98 5-Apr-18 4-May-16 8-Jun-98 28-Jul-10 29-Aug-82 28-Sep-03 22-Oct-02 20-Nov-73 19-Dec-87 21-Jan-03 N/A 1951 2018Decile 1 minimum temperature (Degrees C) for years 1951 to 2017 22.2 22.1 21 17 11.9 8.3 7.5 9.3 12.7 16.3 19.2 21.6 64 1951 2017Decile 9 minimum temperature (Degrees C) for years 1951 to 2017 30 29 27.8 25 20.3 17 15.6 17 21.2 25.8 28.2 29.6 64 1951 2017Mean number of days <= 2 Degrees C for years 1951 to 2018 0 0 0 0 0 0 0 0 0 0 0 0 0 65 1951 2018Mean number of days <= 0 Degrees C for years 1951 to 2018 0 0 0 0 0 0 0 0 0 0 0 0 0 65 1951 2018Mean daily ground minimum temperature Degrees C for years null to null Lowest ground temperature Degrees C for years null to null Date of Lowest ground temperature for years null to null N/A Mean number of days ground min. temp. <= -1 Degrees C for years null to null Mean rainfall (mm) for years 1950 to 2018 116.2 104.3 69.5 27.7 27.1 29.5 13.9 7.9 3 3.9 9.7 49.1 462.3 67 1950 2018Highest rainfall (mm) for years 1950 to 2018 469.8 422.6 371 225.2 176.5 188.5 105.9 72.7 61.2 40.6 50.2 509.5 1344.6 68 1950 2018Date of Highest rainfall for years 1950 to 2018 2012 1995 2000 1966 1970 1971 1959 1978 2010 1996 2009 1975 1999 N/A 1950 2018Lowest rainfall (mm) for years 1950 to 2018 2.8 0 0 0 0 0 0 0 0 0 0 0 143.2 68 1950 2018Date of Lowest rainfall for years 1950 to 2018 1996 1959 1954 2018 2018 2017 2018 2017 2017 2016 2012 2001 1969 N/A 1950 2018Decile 1 monthly rainfall (mm) for years 1950 to 2018 22.2 7.5 4.2 0 0 0 0 0 0 0 0 1.6 273.4 67 1950 2018Decile 5 (median) monthly rainfall (mm) for years 1950 to 2018 80.6 65.2 31 10.5 12.4 10.8 5.1 0.2 0 0.4 5.6 24.5 449.8 67 1950 2018Decile 9 monthly rainfall (mm) for years 1950 to 2018 257.8 236.9 176.1 77.3 72.6 90.4 38.7 26.2 9.5 12.4 24.4 112.1 713.3 67 1950 2018Highest daily rainfall (mm) for years 1950 to 2018 228 126.2 170.8 94.4 70 76.5 75.9 40.2 41 25.9 44.8 313.2 313.2 64 1950 2018Date of Highest daily rainfall for years 1950 to 2018 25-Jan-13 22-Feb-01 23-Mar-99 11-Apr-96 22-May-88 4-Jun-71 27-Jul-59 1-Aug-98 12-Sep-10 23-Oct-66 2-Nov-11 9-Dec-75 9-Dec-75 N/A 1950 2018Mean number of days of rain for years 1950 to 2018 9.1 8.9 5.9 3.4 3.5 3 2 1.4 0.7 1 2 4.8 45.7 67 1950 2018Mean number of days of rain >= 1 mm for years 1950 to 2018 6.9 7 4.6 2.5 2.5 2.2 1.6 1 0.4 0.7 1.4 3.6 34.4 64 1950 2018Mean number of days of rain >= 10 mm for years 1950 to 2018 2.8 2.6 1.6 0.8 0.7 0.7 0.4 0.2 0.1 0.1 0.2 1.2 11.4 64 1950 2018Mean number of days of rain >= 25 mm for years 1950 to 2018 1.2 1.2 0.8 0.3 0.2 0.4 0.1 0.1 0 0 0 0.4 4.7 64 1950 2018Mean daily wind run (km) for years null to null Maximum wind gust speed (km/h) for years null to null Date of Maximum wind gust speed for years null to null N/A Mean daily sunshine (hours) for years null to null Mean daily solar exposure (MJ/(m*m)) for years 1990 to 2018 26 24.2 22.6 19.6 16.4 14.7 16.3 20 24 26.9 28.6 28.1 22.3 29 1990 2018Mean number of clear days for years 1951 to 2010 6.3 6.2 10.4 11 14.9 16.8 21 22.1 22.1 20.5 15.9 11.9 179.1 57 1951 2010Mean number of cloudy days for years 1951 to 2010 8.3 8.8 7.2 7.3 7.3 5.9 3.9 2.9 2 1.9 2.6 4.9 63 57 1951 2010Mean daily evaporation (mm) for years 1967 to 2018 11.3 9.8 9 7.7 5.7 4.5 4.8 6.1 8.6 11.1 12.4 12.4 8.6 49 1967 2018Mean 9am temperature (Degrees C) for years 1951 to 2010 32 30.5 29.9 26.7 21.5 17.9 17.1 19.4 23.8 28 30.8 32.2 25.8 58 1951 2010Mean 9am wet bulb temperature (Degrees C) for years 1951 to 2010 21.5 21.6 19.9 17.5 14.2 12.1 10.9 11.9 13.8 16 18 19.9 16.4 52 1951 2010Mean 9am dew point temperature (Degrees C) for years 1951 to 2010 14.4 15.9 12.6 10 6.8 5.6 3.6 3.1 3.1 4.2 6.5 10.3 8 52 1951 2010Mean 9am relative humidity (%) for years 1951 to 2010 40 47 39 39 42 48 43 37 29 24 25 30 37 52 1951 2010Mean 9am cloud cover (okas) for years 1951 to 2010 3.1 3.6 2.8 3 2.9 2.5 1.8 1.4 1.1 1 1.3 2.1 2.2 58 1951 2010Mean 9am wind speed (km/h) for years 1951 to 2010 9.6 9.7 10.5 10.9 10.8 10.7 11.6 13.3 13.3 12.2 10.9 10 11.1 57 1951 2010Mean 3pm temperature (Degrees C) for years 1951 to 2010 38.1 36.4 35.6 32.1 27 23.7 23.6 26 30.2 34.2 36.9 38.3 31.8 58 1951 2010Mean 3pm wet bulb temperature (Degrees C) for years 1951 to 2010 22.6 22.8 21.3 19.2 16.3 14.5 13.7 14.6 16.2 18.1 19.6 21.5 18.4 52 1951 2010Mean 3pm dew point temperature (Degrees C) for years 1951 to 2010 12.2 14 11 9 6.1 4.9 2.9 2.3 1.6 2.8 4.3 8.7 6.6 52 1951 2010Mean 3pm relative humidity (%) for years 1951 to 2010 26 31 27 27 30 33 29 24 18 16 16 20 25 52 1951 2010Mean 3pm cloud cover (oktas) for years 1951 to 2010 5.3 4.9 4.2 4.1 3.3 2.7 1.9 1.6 1.6 2.1 3.2 4.2 3.3 57 1951 2010Mean 3pm wind speed (km/h) for years 1951 to 2010 10.1 9.7 9.3 8.9 8.7 8.7 9.7 10.5 12.1 11.8 11.5 10.2 10.1 56 1951 2010

Monthly Climate Statistics for 'TELFER AERO' [013030]Created on [ 22 Aug 2018 15:06:43 GMT+00:00]
013030 TELFER AEROCommenced: 1974Last Record: 2018Latitude: 21.71 Degrees SouthLongitude: 122.23 Degrees EastElevation: 292 mState: WA
Statistic Element January February March April May June July August September October November December Annual Number of Years Start Year End YearMean maximum temperature (Degrees C) for years 1974 to 2018 40.3 38.6 37.5 34.6 29.1 25.3 25.4 28.5 32.9 37.3 39.5 40.3 34.1 44 1974 2018Highest temperature (Degrees C) for years 1974 to 2018 48.1 47.1 45.2 42.3 38 33.9 33.4 36.2 41.3 44.1 46 47.5 48.1 44 1974 2018Date of Highest temperature for years 1974 to 2018 10-Jan-08 13-Feb-07 1-Mar-16 3-Apr-16 7-May-90 4-Jun-98 24-Jul-09 25-Aug-17 30-Sep-98 24-Oct-02 19-Nov-90 21-Dec-90 10-Jan-08 N/A 1974 2018Lowest maximum temperature (Degrees C) for years 1974 to 2018 22 25 22.4 17.9 15 14.5 13.1 15 18.4 25.8 22.8 25 13.1 44 1974 2018Date of Lowest maximum temperature for years 1974 to 2018 31-Jan-18 2-Feb-98 1-Mar-03 8-Apr-99 14-May-78 29-Jun-90 5-Jul-10 29-Aug-92 15-Sep-10 16-Oct-74 17-Nov-88 17-Dec-93 5-Jul-10 N/A 1974 2018Decile 1 maximum temperature (Degrees C) for years 1974 to 2018 35.3 33 32.5 30.4 23.9 21.2 21 24 27.8 32.6 35.6 36.2 42 1974 2018Decile 9 maximum temperature (Degrees C) for years 1974 to 2018 44.5 43.7 41.5 38.5 33.8 29.5 29.9 32.8 37.2 41.1 43.1 44 42 1974 2018Mean number of days >= 30 Degrees C for years 1974 to 2018 28.3 25.4 28 25.4 13.3 2.4 2.8 10.6 21.9 28.7 28.1 27.7 242.6 44 1974 2018Mean number of days >= 35 Degrees C for years 1974 to 2018 26.3 21.9 22.7 14.5 1.4 0 0 0.3 9 22.7 26.3 26.1 171.2 44 1974 2018Mean number of days >= 40 Degrees C for years 1974 to 2018 18.2 11.6 8.5 0.9 0 0 0 0 0.1 6.5 13.4 17.4 76.6 44 1974 2018Mean minimum temperature (Degrees C) for years 1974 to 2018 26 25.4 24.1 20.6 15.4 11.9 10.7 12.6 16.5 21.1 23.6 25.5 19.4 44 1974 2018Lowest temperature (Degrees C) for years 1974 to 2018 17.2 17 14.4 11.5 5.6 2.1 3 2.5 6.2 10.5 13 16.5 2.1 44 1974 2018Date of Lowest temperature for years 1974 to 2018 11-Jan-83 1-Feb-18 27-Mar-01 23-Apr-80 30-May-87 14-Jun-11 1-Jul-90 4-Aug-75 1-Sep-01 3-Oct-93 11-Nov-90 8-Dec-94 14-Jun-11 N/A 1974 2018Highest minimum temperature (Degrees C) for years 1974 to 2018 33.4 33 31.5 29.6 25 23 21.5 22.4 27 30.3 33.2 33.1 33.4 44 1974 2018Date of Highest minimum temperature for years 1974 to 2018 4-Jan-16 19-Feb-92 9-Mar-92 11-Apr-05 29-May-91 2-Jun-16 29-Jul-10 21-Aug-09 28-Sep-89 31-Oct-14 23-Nov-15 12-Dec-15 4-Jan-16 N/A 1974 2018Decile 1 minimum temperature (Degrees C) for years 1974 to 2018 23 22.3 20.8 16.5 10.7 7.5 6.6 8.4 12.1 16.5 19.4 22 41 1974 2018Decile 9 minimum temperature (Degrees C) for years 1974 to 2018 29 28.5 27.5 24.4 19.6 16.7 15.4 16.7 21 25.6 27.6 29 41 1974 2018Mean number of days <= 2 Degrees C for years 1974 to 2018 0 0 0 0 0 0 0 0 0 0 0 0 0 44 1974 2018Mean number of days <= 0 Degrees C for years 1974 to 2018 0 0 0 0 0 0 0 0 0 0 0 0 0 44 1974 2018Mean daily ground minimum temperature Degrees C for years 1990 to 1990 0 1990 1990Lowest ground temperature Degrees C for years 1990 to 1990 0 1990 1990Date of Lowest ground temperature for years 1990 to 1990 N/A 1990 1990Mean number of days ground min. temp. <= -1 Degrees C for years 1990 to 1990 0 1990 1990Mean rainfall (mm) for years 1974 to 2018 63 100.1 71.9 18.8 19.1 12.9 11.9 4.8 2.2 3.1 15.6 48.5 371.2 44 1974 2018Highest rainfall (mm) for years 1974 to 2018 382.4 344.3 466 115.2 141.2 101 86 55.6 24 29.4 137.2 296 817.4 45 1974 2018Date of Highest rainfall for years 1974 to 2018 2017 1995 2007 2000 1988 2013 2005 1978 1984 1999 1983 1993 2000 N/A 1974 2018Lowest rainfall (mm) for years 1974 to 2018 2 0.4 0 0 0 0 0 0 0 0 0 0 113.8 45 1974 2018Date of Lowest rainfall for years 1974 to 2018 1996 2007 2014 2018 2018 2017 2018 2017 2017 2013 2007 1992 1991 N/A 1974 2018Decile 1 monthly rainfall (mm) for years 1974 to 2018 10.2 9.3 0.6 0 0 0 0 0 0 0 0 4.4 177.5 45 1974 2018Decile 5 (median) monthly rainfall (mm) for years 1974 to 2018 43 56.8 44.4 4.6 3.2 4.2 0.2 0 0 0.2 6.9 31 310.8 45 1974 2018Decile 9 monthly rainfall (mm) for years 1974 to 2018 132.6 212.4 171.8 51.2 63.5 41.2 41.7 7.9 6.9 9.2 40.6 87.6 624.6 45 1974 2018Highest daily rainfall (mm) for years 1974 to 2018 134.8 177 199.6 72.8 69.6 33 56 47.4 15.8 21.6 120.6 202.4 202.4 44 1974 2018Date of Highest daily rainfall for years 1974 to 2018 19-Jan-17 28-Feb-13 29-Mar-04 8-Apr-11 7-May-16 19-Jun-98 11-Jul-05 14-Aug-93 15-Sep-10 31-Oct-11 30-Nov-83 18-Dec-93 18-Dec-93 N/A 1974 2018Mean number of days of rain for years 1974 to 2018 8.1 8.6 5.9 2.7 2.7 2.9 1.5 1 0.7 1.2 2.4 5.4 43.1 45 1974 2018Mean number of days of rain >= 1 mm for years 1974 to 2018 5.8 6.4 4.1 1.7 1.8 1.7 1 0.5 0.5 0.6 1.7 4 29.8 44 1974 2018Mean number of days of rain >= 10 mm for years 1974 to 2018 1.9 2.6 1.8 0.6 0.6 0.4 0.3 0.1 0.1 0.1 0.4 1.1 10 44 1974 2018Mean number of days of rain >= 25 mm for years 1974 to 2018 0.6 1.3 0.9 0.2 0.2 0.1 0.2 0.1 0 0 0.1 0.5 4.2 44 1974 2018Mean daily wind run (km) for years 1976 to 2018 9 1976 2018Maximum wind gust speed (km/h) for years 2008 to 2018 111 120 91 70 70 78 70 72 70 87 115 94 120 10 2008 2018Date of Maximum wind gust speed for years 2008 to 2018 7-Jan-13 9-Feb-14 27-Mar-17 2-Apr-15 11-May-16 7-Jun-16 20-Jul-13 1-Aug-16 11-Sep-13 3-Oct-11 16-Nov-12 14-Dec-15 9-Feb-14 N/A 2008 2018Mean daily sunshine (hours) for years null to null Mean daily solar exposure (MJ/(m*m)) for years 1990 to 2018 26.5 24.4 23 20.3 16.9 15.3 16.9 20.2 23.7 26.7 28.2 27.5 22.5 29 1990 2018Mean number of clear days for years 1974 to 1995 7.8 7 10.7 12.3 14.8 13.1 19 20.4 18.2 18.6 15.6 11.4 168.9 21 1974 1995Mean number of cloudy days for years 1974 to 1995 5.4 8.1 5.2 3.7 4.9 4.5 2.5 1.4 1.7 1.2 1.9 3.2 43.7 21 1974 1995Mean daily evaporation (mm) for years 1974 to 1995 14.3 12.9 12.3 10.7 7.8 6.4 6.9 8.4 11.2 14.2 15.5 15.1 11.3 20 1974 1995Mean 9am temperature (Degrees C) for years 1974 to 2010 32.8 31.3 30.5 27.9 22.3 18.2 17.7 20.6 25.3 30 32.1 33 26.8 36 1974 2010Mean 9am wet bulb temperature (Degrees C) for years 1974 to 2010 22.3 22.6 20.5 17.5 14.2 11.8 10.7 12.1 14.1 16.7 18.7 20.9 16.8 34 1974 2010Mean 9am dew point temperature (Degrees C) for years 1975 to 2010 15.5 17.1 13.3 8.6 5.7 4.4 1.9 1.7 1.5 3.3 6.8 11.8 7.6 34 1975 2010Mean 9am relative humidity (%) for years 1975 to 2010 41 48 40 33 37 43 38 32 24 21 24 32 34 34 1975 2010Mean 9am cloud cover (okas) for years 1974 to 1995 3.1 3.8 2.7 2.6 2.5 2.5 1.6 1.2 1 1.1 1.6 2 2.1 21 1974 1995Mean 9am wind speed (km/h) for years 1974 to 2010 17.5 17.4 19.4 18.8 18.4 19.2 20.1 21 20.9 21.5 19.7 18.5 19.4 34 1974 2010Mean 3pm temperature (Degrees C) for years 1974 to 2010 39 37.3 36.2 33.6 28.3 24.6 24.6 27.5 31.8 36 38.3 38.8 33 36 1974 2010Mean 3pm wet bulb temperature (Degrees C) for years 1974 to 2010 22.5 23 21.3 19 16.2 14.2 13.5 14.7 16.3 18.3 19.8 21.5 18.4 34 1974 2010Mean 3pm dew point temperature (Degrees C) for years 1975 to 2010 11.1 13.5 10.3 6.6 4.1 2.6 0.3 -0.1 -0.9 0.9 3.3 8.1 5 34 1975 2010Mean 3pm relative humidity (%) for years 1975 to 2010 24 30 26 22 25 27 23 19 14 12 13 19 21 34 1975 2010Mean 3pm cloud cover (oktas) for years 1974 to 1995 4.1 4.6 3.9 3.1 2.8 2.5 1.5 1.5 1.6 2 2.7 3.5 2.8 21 1974 1995Mean 3pm wind speed (km/h) for years 1974 to 2010 16 16.5 16.4 15 15.5 16.6 16.4 16.4 16.1 16.4 16.5 15.6 16.1 32 1974 2010

J1827R01 Final 29 May 2019
B1
APPENDIX B
Warrawoona Rainfall Intensity‐Duration‐Frequency Relationship
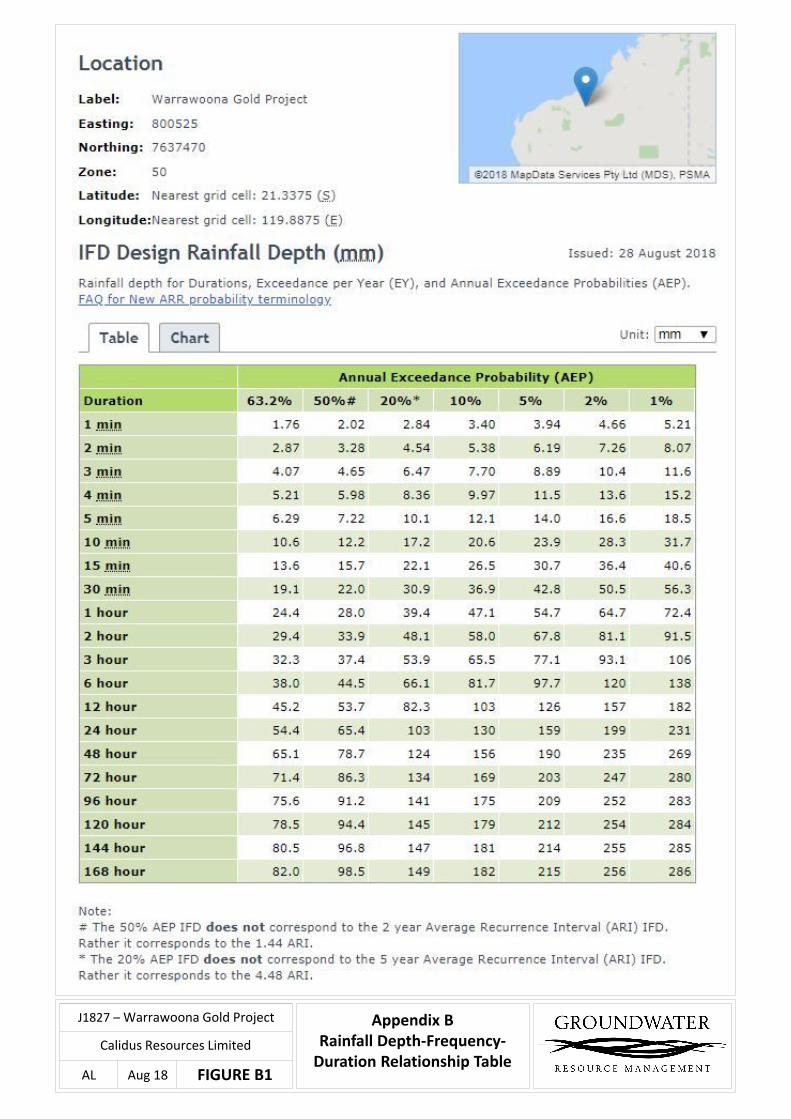
AL
Appendix B Rainfall Depth-Frequency-
Duration Relationship TableFIGURE B1
J1827 – Warrawoona Gold Project
Calidus Resources Limited
Aug 18
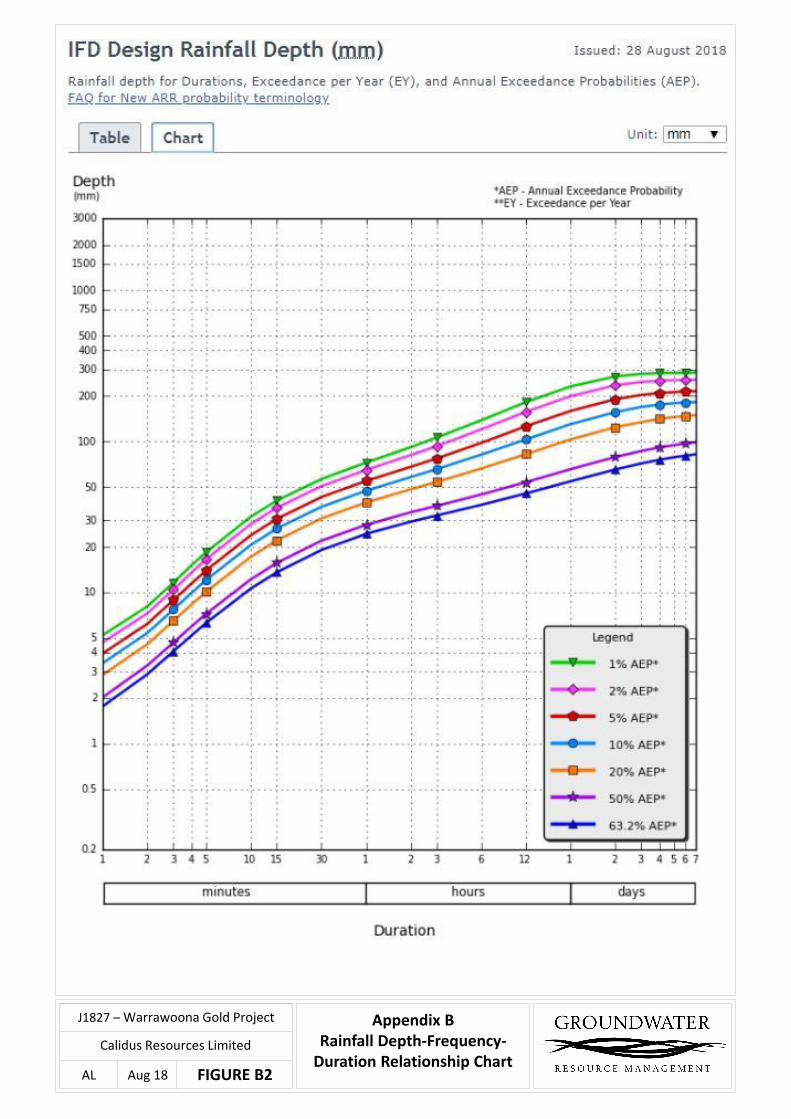
Appendix B Rainfall Depth-Frequency-
Duration Relationship ChartAL FIGURE B2
J1827 – Warrawoona Gold Project
Calidus Resources Limited
Aug 18

Appendix B Rainfall Intensity-Frequency-Duration Relationship Table
AL FIGURE B3
J1827 – Warrawoona Gold Project
Calidus Resources Limited
Aug 18

Appendix B Rainfall Intensity-Frequency-Duration Relationship Chart
AL FIGURE B4
J1827 – Warrawoona Gold Project
Calidus Resources Limited
Aug 18
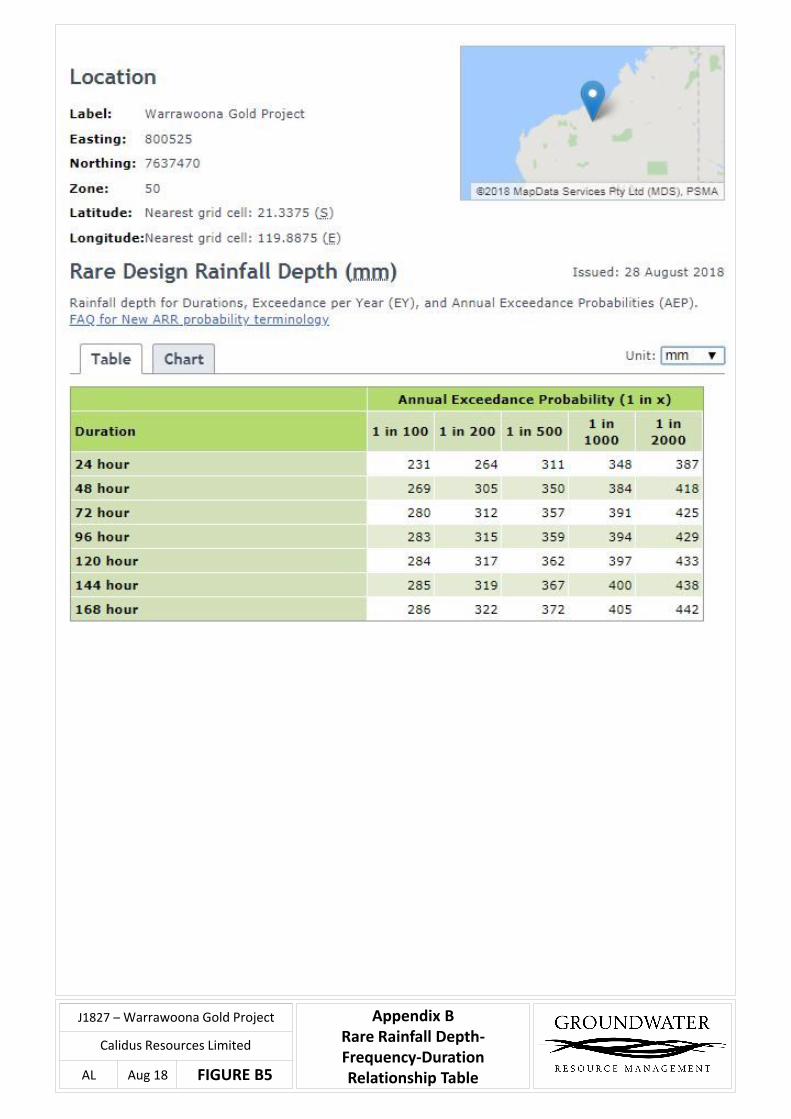
Appendix B Rare Rainfall Depth-Frequency-Duration Relationship TableAL FIGURE B5
J1827 – Warrawoona Gold Project
Calidus Resources Limited
Aug 18
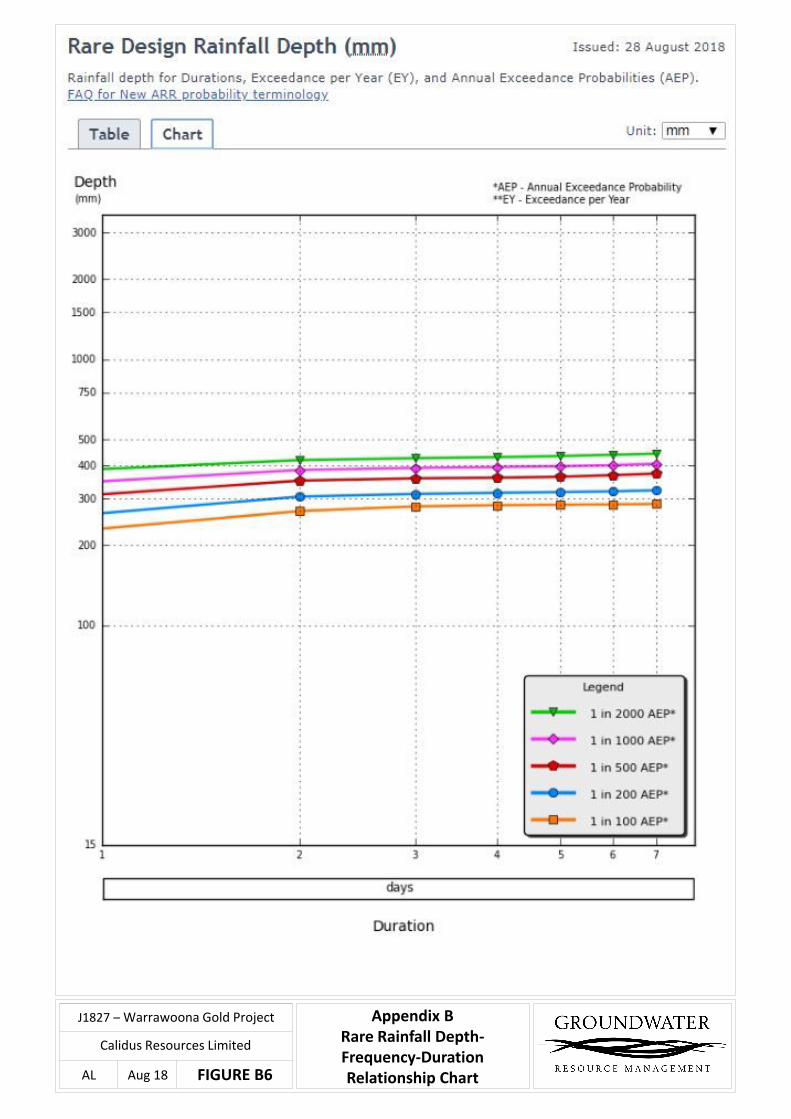
Appendix B Rare Rainfall Depth-Frequency-Duration Relationship ChartAL FIGURE B6
J1827 – Warrawoona Gold Project
Calidus Resources Limited
Aug 18

Appendix B Rare Rainfall Intensity-
Frequency-Duration Relationship TableAL FIGURE B7
J1827 – Warrawoona Gold Project
Calidus Resources Limited
Aug 18
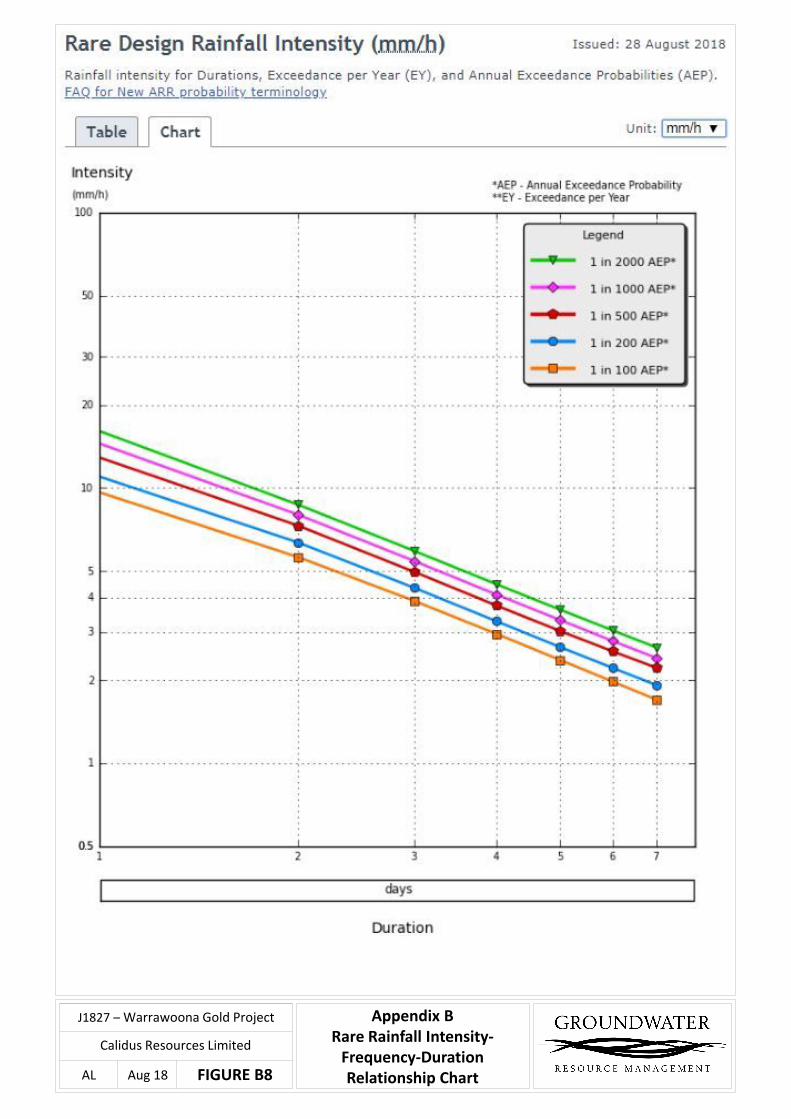
Appendix B Rare Rainfall Intensity-
Frequency-Duration Relationship ChartAL FIGURE B8
J1827 – Warrawoona Gold Project
Calidus Resources Limited
Aug 18

J1827R01 Final 29 May 2019
C1
APPENDIX C
Cyclone Path Analysis
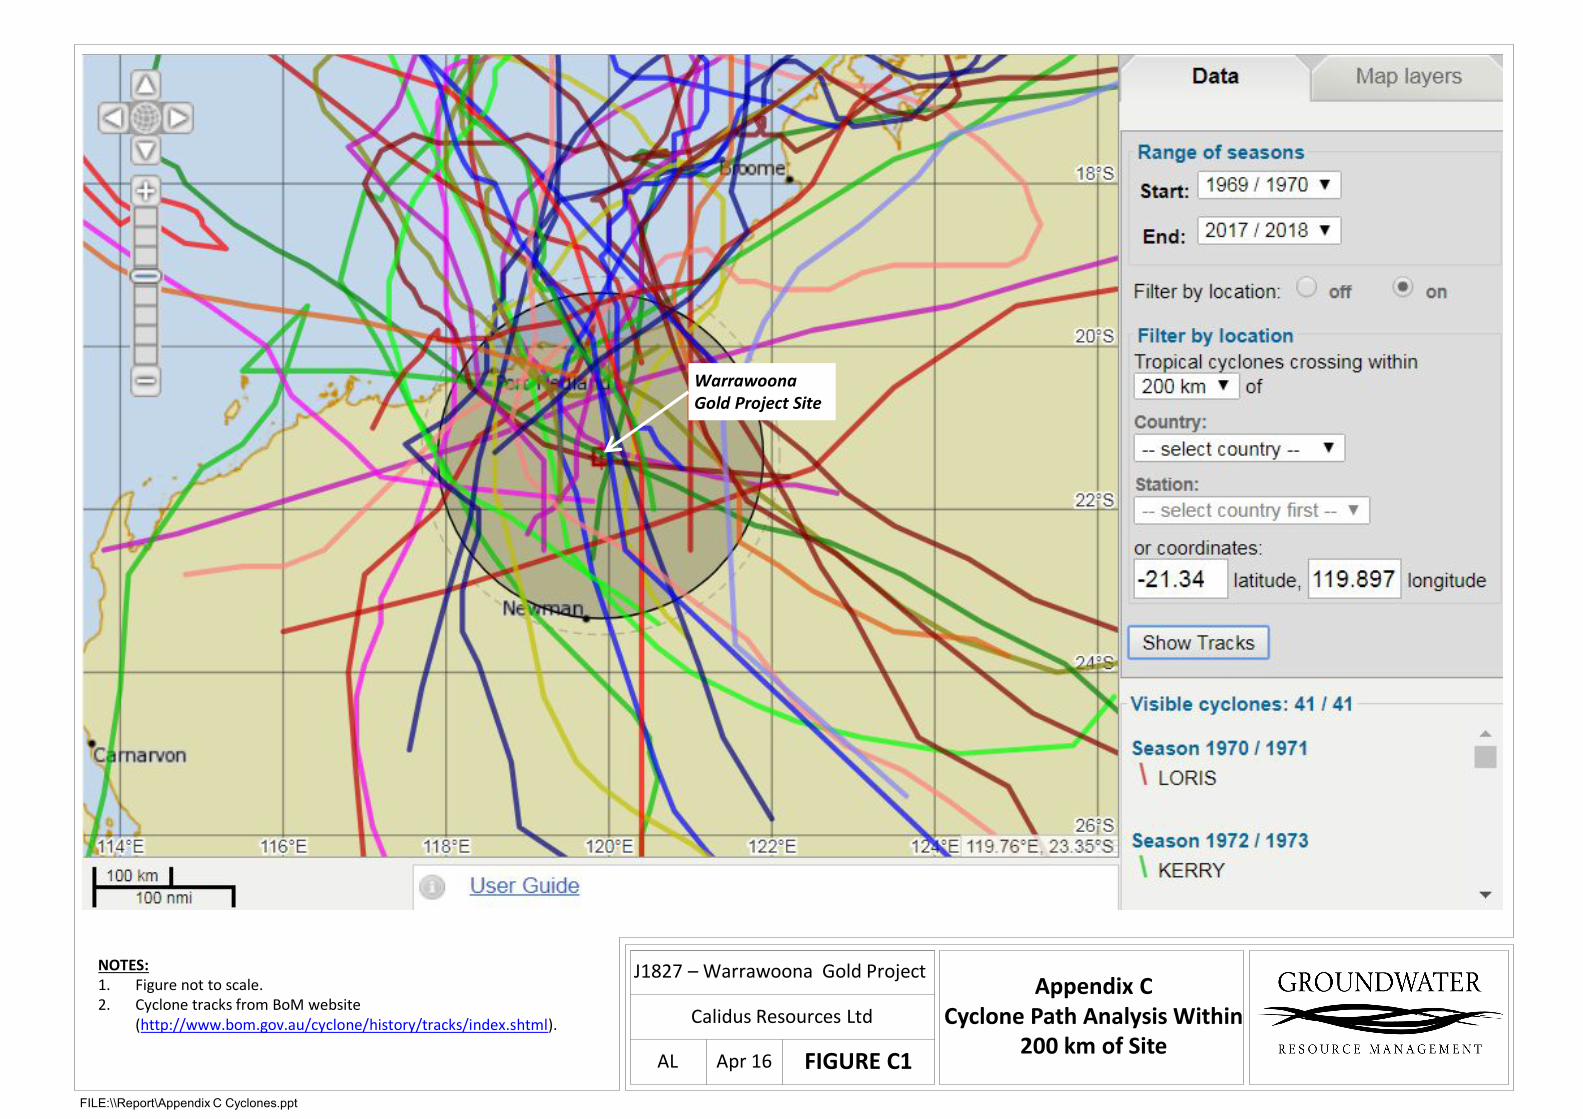
AL Apr 16
Appendix C Cyclone Path Analysis Within
200 km of Site
FILE:\\Report\Appendix C Cyclones.ppt
Calidus Resources Ltd
FIGURE C1
Warrawoona Gold Project Site
NOTES:1. Figure not to scale.2. Cyclone tracks from BoM website
(http://www.bom.gov.au/cyclone/history/tracks/index.shtml).
J1827 – Warrawoona Gold Project

AL Apr 16
Appendix C Cyclone Path Analysis Within
100 km of Site
FILE:\\Report\Appendix C Cyclones.ppt
Calidus Resources Ltd
FIGURE C2
Warrawoona Gold Project Site
NOTES:1. Figure not to scale.2. Cyclone tracks from BoM website
(http://www.bom.gov.au/cyclone/history/tracks/index.shtml).
J1827 – Warrawoona Gold Project
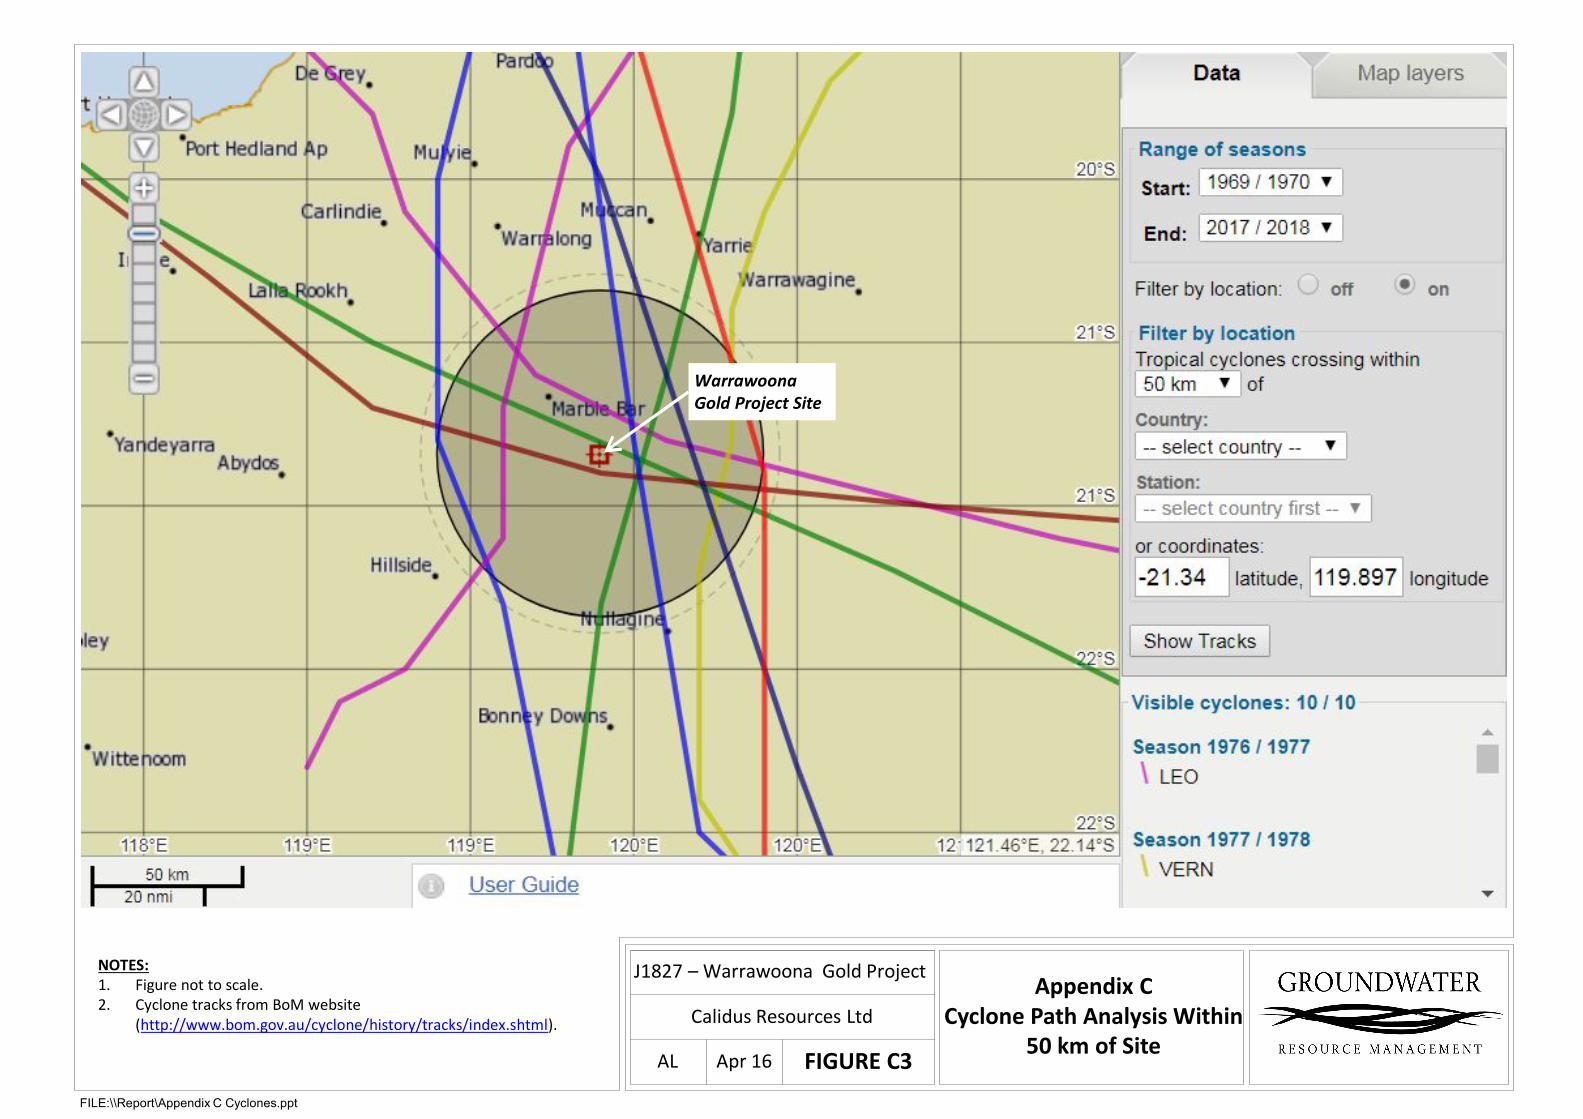
AL Apr 16
Appendix C Cyclone Path Analysis Within
50 km of Site
FILE:\\Report\Appendix C Cyclones.ppt
Calidus Resources Ltd
FIGURE C3
Warrawoona Gold Project Site
NOTES:1. Figure not to scale.2. Cyclone tracks from BoM website
(http://www.bom.gov.au/cyclone/history/tracks/index.shtml).
J1827 – Warrawoona Gold Project

J1827R01 Final 29 May 2019
D1
APPENDIX D
Probable Maximum Precipitation Estimate
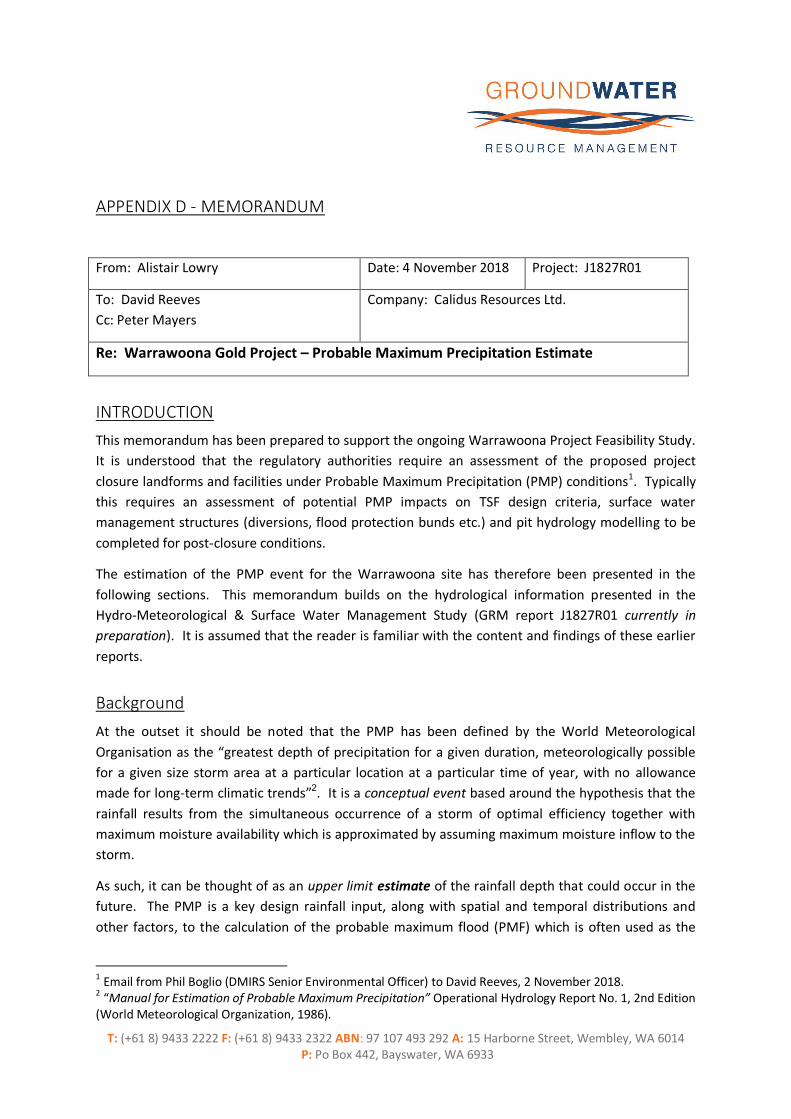
T: (+61 8) 9433 2222 F: (+61 8) 9433 2322 ABN: 97 107 493 292 A: 15 Harborne Street, Wembley, WA 6014 P: Po Box 442, Bayswater, WA 6933
APPENDIX D - MEMORANDUM
INTRODUCTION This memorandum has been prepared to support the ongoing Warrawoona Project Feasibility Study. It is understood that the regulatory authorities require an assessment of the proposed project closure landforms and facilities under Probable Maximum Precipitation (PMP) conditions1. Typically this requires an assessment of potential PMP impacts on TSF design criteria, surface water management structures (diversions, flood protection bunds etc.) and pit hydrology modelling to be completed for post-closure conditions.
The estimation of the PMP event for the Warrawoona site has therefore been presented in the following sections. This memorandum builds on the hydrological information presented in the Hydro-Meteorological & Surface Water Management Study (GRM report J1827R01 currently in preparation). It is assumed that the reader is familiar with the content and findings of these earlier reports.
Background At the outset it should be noted that the PMP has been defined by the World Meteorological Organisation as the “greatest depth of precipitation for a given duration, meteorologically possible for a given size storm area at a particular location at a particular time of year, with no allowance made for long-term climatic trends”2. It is a conceptual event based around the hypothesis that the rainfall results from the simultaneous occurrence of a storm of optimal efficiency together with maximum moisture availability which is approximated by assuming maximum moisture inflow to the storm.
As such, it can be thought of as an upper limit estimate of the rainfall depth that could occur in the future. The PMP is a key design rainfall input, along with spatial and temporal distributions and other factors, to the calculation of the probable maximum flood (PMF) which is often used as the
1 Email from Phil Boglio (DMIRS Senior Environmental Officer) to David Reeves, 2 November 2018. 2 “Manual for Estimation of Probable Maximum Precipitation” Operational Hydrology Report No. 1, 2nd Edition (World Meteorological Organization, 1986).
From: Alistair Lowry Date: 4 November 2018 Project: J1827R01
To: David Reeves Cc: Peter Mayers
Company: Calidus Resources Ltd.
Re: Warrawoona Gold Project – Probable Maximum Precipitation Estimate

ATTN: David Reeves J1827R01
4 November 2018
2
design flood event for large dams and for other sensitive water management works and floodplain management studies.
A number of different methods have been used historically in Australia for PMP estimation including the in-situ maximisation of data recorded at a specific location and also storm transposition methods which allowed the displacement of a storm from the location where it occurred to a target location assuming the storm could just as likely have occurred there. However since the mid 1970’s generalised methods have been developed that allow rainfall from much wider geographical regions to be analysed and these are generally considered to be an improvement over the earlier transposition methods.
Successive revisions of these generalised methods have, in turn, brought progressively higher estimates of PMP depths for individual catchments as each revision has utilised a greater amount of data and better analytical techniques. Currently the Generalised Short Duration Method (GSDM3, also known as the “Thunderstorm Method”) is used to derive PMP estimates for durations less than six hours across all of Australia, while the Revised Generalised Tropical Storm Method (GTSMR4) is used for longer duration events and covers the majority of continental Australia affected by tropical storms. The Generalised Southeast Australia Method (GSAM) is used for longer-duration PMP estimates in south-east Australia.
Although, the WMO definition of PMP relates to the “theoretical” greatest rainfall depth of precipitation for a given duration that is physically possible, it is recognised that limitations in data and understanding of extreme meteorological conditions means that there is a finite probability, albeit small, of the PMP estimate being exceeded. In order to take into consideration the inability to accurately estimate the theoretical upper limit of rainfall, the term “operational estimate of the PMP” has been adopted5. This represents the best estimate of the PMP depth for a particular location that can currently be made using information obtained from observed large events and the generalised PMP methods. Therefore, it should be noted that the GSDM and GTSMR PMP estimates presented in this memorandum are the operational estimates of the PMP as opposed to the theoretical PMP. This distinction acknowledges the finite probability of occurrence of the PMP as discussed above.
The average recurrence interval (ARI) or annual exceedance probability (AEP) of the PMP is uncertain and results in much debate within the field of hydrology. However, it is considered to be an extremely rare event of at least 100,000 to 1 million year ARI (i.e. 0.001% to 0.0001% AEP). The PMF is considered to be an even more extreme event as it not only requires the PMP to occur, but also needs the most severe antecedent moisture and other hydrological conditions to prevail. Consequently the PMF is generally considered to be one or two orders of magnitude greater than the PMP (i.e. at least 1 million to 10 million year ARI or 0.0001% to 0.00001% AEP).
3 “The Estimation or Probable Precipitation in Australia: Generalised Short-Duration Method” (BoM, 2003). 4 “Revision of the Generalised Tropical Storm Method for Estimating Probable Maximum Precipitation”, Hydrology Report Series No.8, Hydrometeorological Advisory Service (BoM, 2003). 5 “PMP and Other Extreme Storms: Concepts and Probabilities” (Schaefer, M.G., 1994).
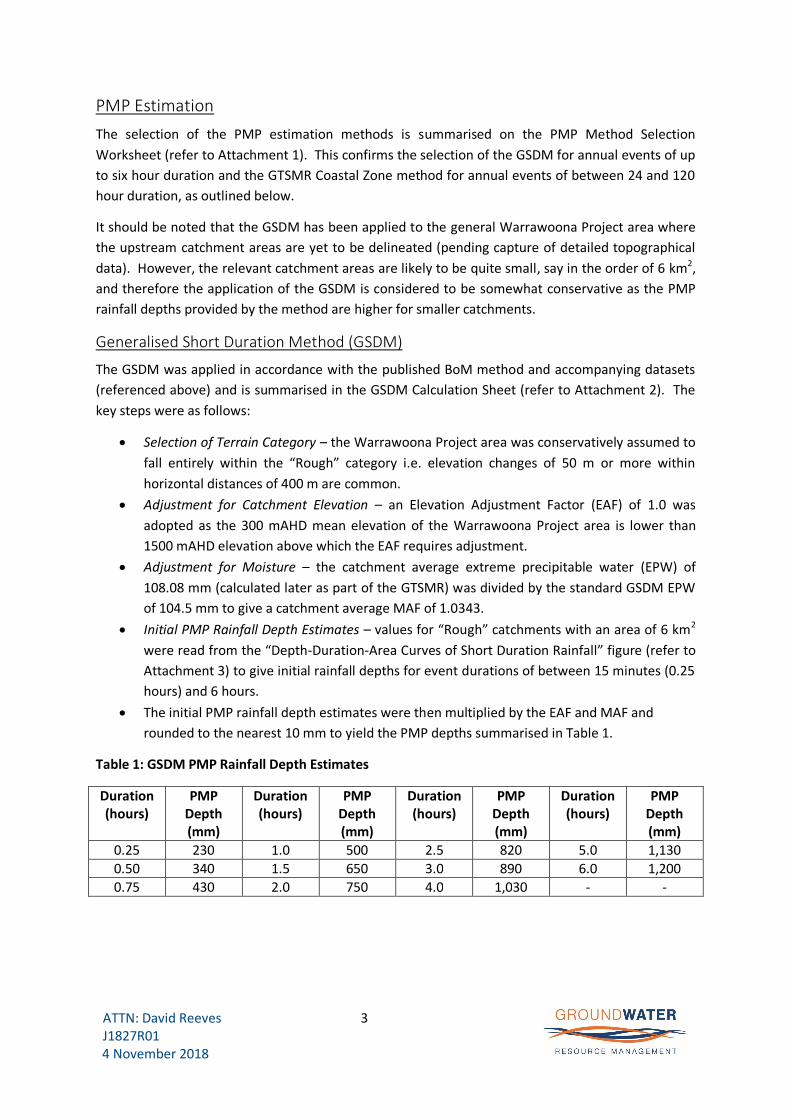
ATTN: David Reeves J1827R01
4 November 2018
3
PMP Estimation The selection of the PMP estimation methods is summarised on the PMP Method Selection Worksheet (refer to Attachment 1). This confirms the selection of the GSDM for annual events of up to six hour duration and the GTSMR Coastal Zone method for annual events of between 24 and 120 hour duration, as outlined below.
It should be noted that the GSDM has been applied to the general Warrawoona Project area where the upstream catchment areas are yet to be delineated (pending capture of detailed topographical data). However, the relevant catchment areas are likely to be quite small, say in the order of 6 km2, and therefore the application of the GSDM is considered to be somewhat conservative as the PMP rainfall depths provided by the method are higher for smaller catchments.
Generalised Short Duration Method (GSDM)
The GSDM was applied in accordance with the published BoM method and accompanying datasets (referenced above) and is summarised in the GSDM Calculation Sheet (refer to Attachment 2). The key steps were as follows:
Selection of Terrain Category – the Warrawoona Project area was conservatively assumed to fall entirely within the “Rough” category i.e. elevation changes of 50 m or more within horizontal distances of 400 m are common.
Adjustment for Catchment Elevation – an Elevation Adjustment Factor (EAF) of 1.0 was adopted as the 300 mAHD mean elevation of the Warrawoona Project area is lower than 1500 mAHD elevation above which the EAF requires adjustment.
Adjustment for Moisture – the catchment average extreme precipitable water (EPW) of 108.08 mm (calculated later as part of the GTSMR) was divided by the standard GSDM EPW of 104.5 mm to give a catchment average MAF of 1.0343.
Initial PMP Rainfall Depth Estimates – values for “Rough” catchments with an area of 6 km2 were read from the “Depth-Duration-Area Curves of Short Duration Rainfall” figure (refer to Attachment 3) to give initial rainfall depths for event durations of between 15 minutes (0.25 hours) and 6 hours.
The initial PMP rainfall depth estimates were then multiplied by the EAF and MAF and rounded to the nearest 10 mm to yield the PMP depths summarised in Table 1.
Table 1: GSDM PMP Rainfall Depth Estimates
Duration (hours)
PMP Depth (mm)
Duration (hours)
PMP Depth (mm)
Duration (hours)
PMP Depth (mm)
Duration (hours)
PMP Depth (mm)
0.25 230 1.0 500 2.5 820 5.0 1,130 0.50 340 1.5 650 3.0 890 6.0 1,200 0.75 430 2.0 750 4.0 1,030 - -
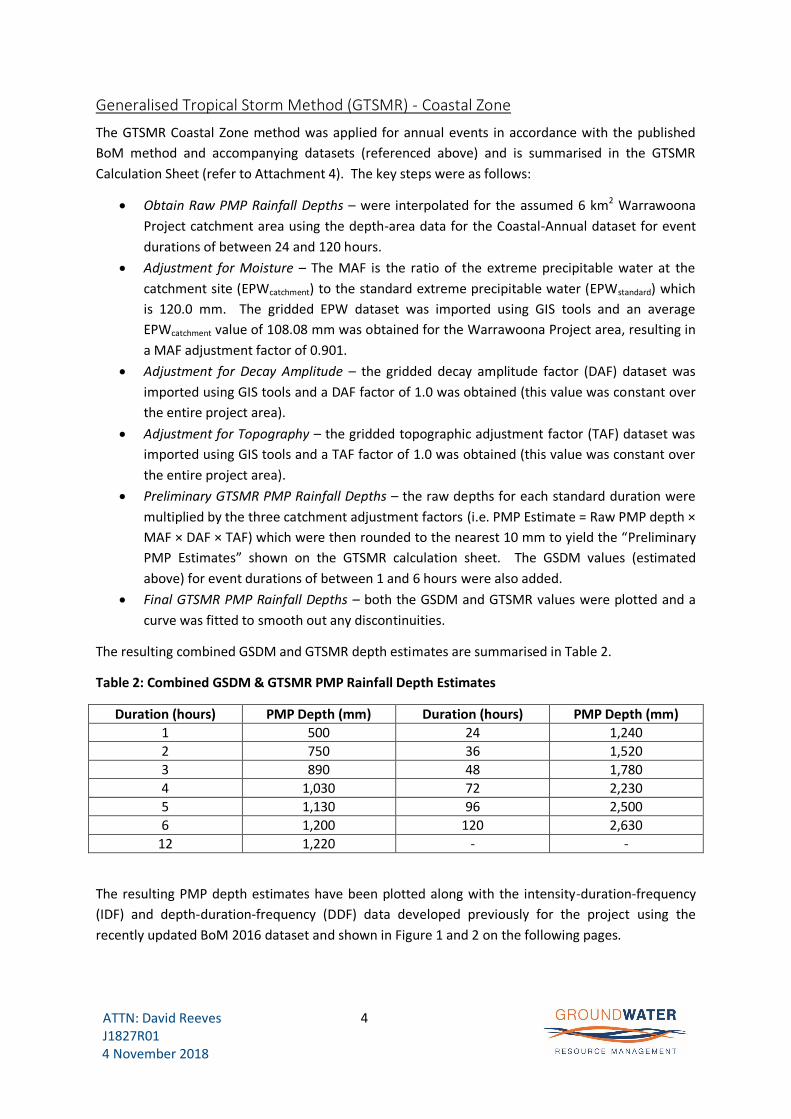
ATTN: David Reeves J1827R01
4 November 2018
4
Generalised Tropical Storm Method (GTSMR) - Coastal Zone
The GTSMR Coastal Zone method was applied for annual events in accordance with the published BoM method and accompanying datasets (referenced above) and is summarised in the GTSMR Calculation Sheet (refer to Attachment 4). The key steps were as follows:
Obtain Raw PMP Rainfall Depths – were interpolated for the assumed 6 km2 Warrawoona Project catchment area using the depth-area data for the Coastal-Annual dataset for event durations of between 24 and 120 hours.
Adjustment for Moisture – The MAF is the ratio of the extreme precipitable water at the catchment site (EPWcatchment) to the standard extreme precipitable water (EPWstandard) which is 120.0 mm. The gridded EPW dataset was imported using GIS tools and an average EPWcatchment value of 108.08 mm was obtained for the Warrawoona Project area, resulting in a MAF adjustment factor of 0.901.
Adjustment for Decay Amplitude – the gridded decay amplitude factor (DAF) dataset was imported using GIS tools and a DAF factor of 1.0 was obtained (this value was constant over the entire project area).
Adjustment for Topography – the gridded topographic adjustment factor (TAF) dataset was imported using GIS tools and a TAF factor of 1.0 was obtained (this value was constant over the entire project area).
Preliminary GTSMR PMP Rainfall Depths – the raw depths for each standard duration were multiplied by the three catchment adjustment factors (i.e. PMP Estimate = Raw PMP depth × MAF × DAF × TAF) which were then rounded to the nearest 10 mm to yield the “Preliminary PMP Estimates” shown on the GTSMR calculation sheet. The GSDM values (estimated above) for event durations of between 1 and 6 hours were also added.
Final GTSMR PMP Rainfall Depths – both the GSDM and GTSMR values were plotted and a curve was fitted to smooth out any discontinuities.
The resulting combined GSDM and GTSMR depth estimates are summarised in Table 2.
Table 2: Combined GSDM & GTSMR PMP Rainfall Depth Estimates
Duration (hours) PMP Depth (mm) Duration (hours) PMP Depth (mm) 1 500 24 1,240 2 750 36 1,520 3 890 48 1,780 4 1,030 72 2,230 5 1,130 96 2,500 6 1,200 120 2,630
12 1,220 - -
The resulting PMP depth estimates have been plotted along with the intensity-duration-frequency (IDF) and depth-duration-frequency (DDF) data developed previously for the project using the recently updated BoM 2016 dataset and shown in Figure 1 and 2 on the following pages.

ATTN: David Reeves J1827R01
4 November 2018
5
Figure 1: PMP Rainfall Intensity Estimates and Warrawoona Project Rainfall Intensity-Duration-Frequency Relationship (BoM, 2016)

ATTN: David Reeves J1827R01
4 November 2018
6
Figure 2: PMP Rainfall Intensity Estimates and Warrawoona Project Rainfall Depth-Duration-Frequency Relationship (BoM, 2016)

ATTN: David Reeves J1827R01
4 November 2018
7
Inspection of Figures 1 and 2 clearly demonstrates the extreme nature of the PMP event with rainfall intensities and depths, on average, some five times greater than the corresponding values for the 0.05% AEP (i.e. 2,000 year ARI) event.
PMP Spatial Distribution
Given the relatively small upstream catchment areas in the vicinity of the Warrawoona Project site, it has conservatively been assumed that there is no spatial distribution of the PMP and that, if it were to occur, it would be distributed uniformly across the catchment i.e. all parts would experience the same rainfall depth.
If a much larger catchment area (say >1,000 km2) was being considered, then it would be prudent to make allowances for the spatial distribution as it is unlikely that all parts of the catchment would record the same rainfall depth.
PMP Temporal Distribution
In order to transform the PMP into PMF design flood events of various durations it is necessary to consider the temporal distribution of the rainfall during the storm as it is highly unlikely that it will occur with the same intensity throughout the entire storm. Both the GSDM and GTSMR methodologies include design temporal patterns that have been based on temporal patterns of observed significant storms. These design patterns will be reviewed and adopted as necessary in the PMF estimates to be used for the project (to come).
Conclusion PMP and PMF estimates have been developed for the proposed Warrawoona Project site. These estimates show that PMP rainfall depths of approximately 500, 1,240 and 2,230 mm could occur over 1, 24 and 72 hour periods respectively.
Should you have any queries regarding the findings of this memorandum please do not hesitate to contact us.
Yours sincerely,
Alistair Lowry Peter Mayers
Civil Engineering Hydrologist Principal Hydrogeologist Attachments:
1. PMP Method Selection Worksheet
2. GSDM Calculation Sheet
3. GSDM Depth-Duration-Area Curves of Short Duration Rainfall
4. GTSMR Calculation Sheet

ATTACHMENT No. 1 - PMP METHOD SELECTION WORKSHEET
Catchment Name: Warrawoona Project Upstream Catchment Area: <500 km2
LONG DURATION PMP
Note: Not to Scale – Project location approximate.
CIRCLE THE ZONE IN WHICH THE CATCHMENT IS LOCATED:
GTSMR (Coastal)
GTSMR (Inland)
GTSMR (Coastal &
SWWA)
Coastal Transition
- GTSMR Coastal - GSAM Coastal
GSAM
(Coastal)
WA Transition
- GTSMR Coastal - GSAM Inland
GSAM (Inland) WCTas
SHORT DURATION PMP (GSDM) Short duration PMP estimates can not be calculated for the
catchment PMP estimates for up to 6 hours can be calculated using the GSDM for this catchment PMP estimates for up to 6 hours can be calculated using the GSDM for this catchment and can include winter estimates
PMP METHOD SUMMARY
Fill in the table below with the PMP method/s applicable to the catchment, referring to Table 1.1 for any additional information needed. NB: for the Transition zones, write separate entries for GTSMR and GSAM.
METHOD ZONE SEASON DURATIONS GSDM 6 hours Annual 1-6 hours GTSMR Coastal Annual 24-120 hours WHAT NEXT?
GTSMR: Calculate the PMP estimates for the catchment following the procedures in this guidebook
GSDM: Calculate the PMP estimates for up to 6 hours following the GSDM (Bureau of Meteorology, 2003) guidebook (http://www.bom.gov.au/hydro/has/gsdm_document.shtml)
GSAM: Contact the Hydrometeorological Advisory Service, Bureau of Meteorology
WCTas: Contact the Hydrometeorological Advisory Service, Bureau of Meteorology
West CoastTasmaniaMethod Zone
Inland Zone
Inland Zone
HOBART
DARWIN
PERTH
Port Hedland
Townsville
BRISBANE
CANBERRACANBERRA
SYDNEYSYDNEYSW WA Winter Zone
Coastal Transition Zone
Coastal Zone
Coastal Zone
ADELAIDE
GTSMR
GSAM
GTSMR
GTSMR
GSAM
GSAM-GTSMR
GSAM-GTSMR WA Transition Zone
Warrawoona Project
Is the catchment less than 500km² and south of 30°S?
Is the catchment less than 1000km²?
NO
NO
YES
YES
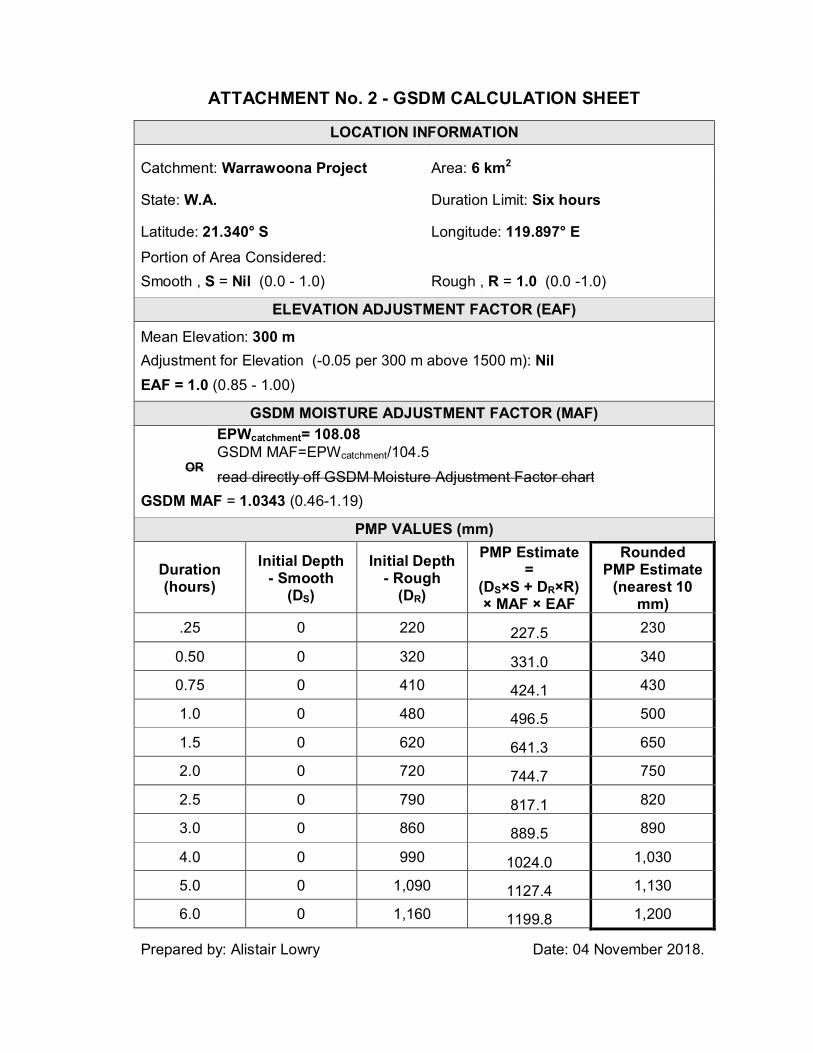
ATTACHMENT No. 2 - GSDM CALCULATION SHEET
LOCATION INFORMATION
Catchment: Warrawoona Project Area: 6 km2
State: W.A. Duration Limit: Six hours
Latitude: 21.340° S Longitude: 119.897° E
Portion of Area Considered: Smooth , S = Nil (0.0 - 1.0) Rough , R = 1.0 (0.0 -1.0)
ELEVATION ADJUSTMENT FACTOR (EAF)
Mean Elevation: 300 m Adjustment for Elevation (-0.05 per 300 m above 1500 m): Nil EAF = 1.0 (0.85 - 1.00)
GSDM MOISTURE ADJUSTMENT FACTOR (MAF)
EPWcatchment= 108.08 GSDM MAF=EPWcatchment/104.5
OR read directly off GSDM Moisture Adjustment Factor chart
GSDM MAF = 1.0343 (0.46-1.19)
PMP VALUES (mm)
Duration (hours)
Initial Depth - Smooth
(DS)
Initial Depth - Rough
(DR)
PMP Estimate =
(DS×S + DR×R) × MAF × EAF
Rounded PMP Estimate
(nearest 10 mm)
.25 0 220 227.5 230
0.50 0 320 331.0 340
0.75 0 410 424.1 430
1.0 0 480 496.5 500
1.5 0 620 641.3 650
2.0 0 720 744.7 750
2.5 0 790 817.1 820
3.0 0 860 889.5 890
4.0 0 990 1024.0 1,030
5.0 0 1,090 1127.4 1,130
6.0 0 1,160 1199.8 1,200
Prepared by: Alistair Lowry Date: 04 November 2018.
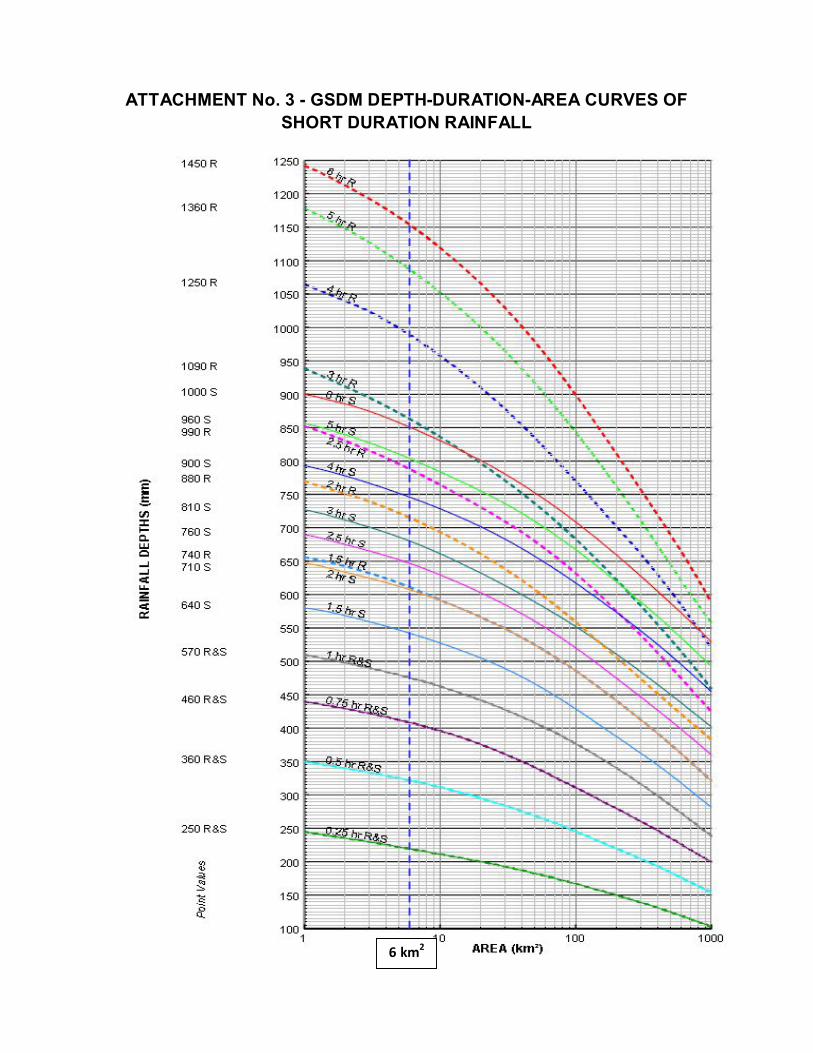
ATTACHMENT No. 3 - GSDM DEPTH-DURATION-AREA CURVES OF SHORT DURATION RAINFALL
6 km2

ATTACHMENT No. 4: GTSMR CALCULATION WORKSHEET
Prepared by: Alistair Lowry Date: 04 November 2018
LOCATION INFORMATION
Catchment Name: Warrawoona Project State: W.A. GTSMR zone(s): Coastal Zone
CATCHMENT FACTORS
Topographical Adjustment Factor TAF = 1.0 (1.0 – 2.0)
Decay Amplitude Factor DAF = 1.0 (0.7 – 1.0)
Annual Moisture Adjustment Factor MAFa = EPWcatchment/120.00 Extreme Precipitable Water (EPWcatchment) = 108.08 MAFa = 0.901 (0.4 - 1.1) Winter Moisture Adjustment Factor (where applicable) MAFw = EPWcatchment_winter/82.30
Winter EPW (EPWcatchment_winter) = ………… MAFw = ………………. (0.4 – 1.1)
PMP VALUES (mm) - Annual
Duration (hours)
Initial Depth (Da)
PMP Estimate =DaxTAFxDAFxMAFa
Preliminary PMP Estimate (nearest 10mm)
Final PMP Estimate (from envelope)
1
Where applicable, calculate GSDM (Bureau of Meteorology, 2003) depths
500 500 2 750 750 3 890 890 4 1,030 1,030 5 1,130 1,130 6 1,200 1,200 12 (no preliminary estimates available) 1,220 24 1,368 1,233 1,240 1,240 36 1,678 1,512 1,520 1,520 48 1,966 1,771 1,780 1,780 72 2,475 2,230 2,230 2,230 96 2,771 2,497 2,500 2,500 120 2,913 2,625 2,630 2,630
PMP VALUES (mm) – Winter (where applicable)
Duration (hours)
Initial Depth (Dw)
PMP Estimate =DwxTAFxDAFxMAFw
Preliminary PMP Estimate (nearest 10mm)
Final PMP Estimate (from envelope)
1
Where applicable, calculate GSDM (Bureau of Meteorology, 2003) depths
N/A 2 N/A 3 N/A 4 N/A 5 N/A 6 N/A 12 (no preliminary estimates available) N/A 24 N/A 36 N/A 48 N/A 72 N/A 96 N/A

J1827R01 Final 29 May 2019
E1
APPENDIX E
Pre & Post‐Mining Catchment Delineation
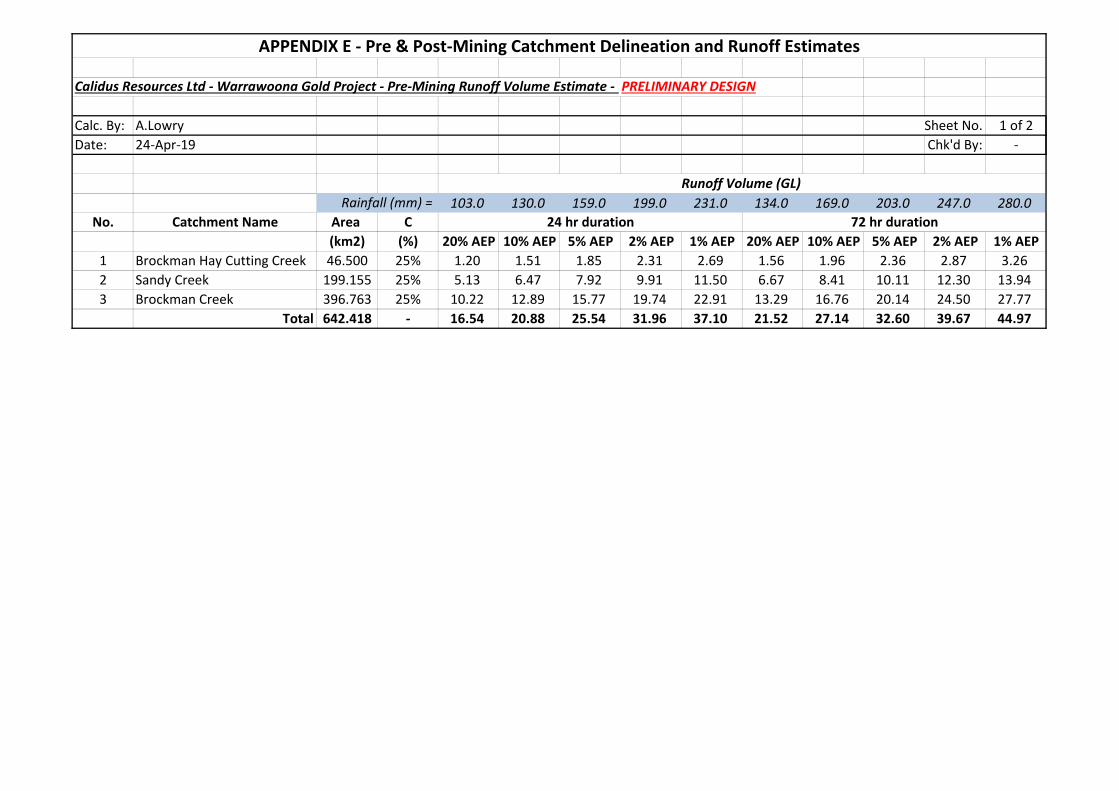
Calidus Resources Ltd - Warrawoona Gold Project - Pre-Mining Runoff Volume Estimate - PRELIMINARY DESIGN
Calc. By: A.Lowry Sheet No. 1 of 2Date: 24-Apr-19 Chk'd By: -
Rainfall (mm) = 103.0 130.0 159.0 199.0 231.0 134.0 169.0 203.0 247.0 280.0No. Catchment Name Area C
(km2) (%) 20% AEP 10% AEP 5% AEP 2% AEP 1% AEP 20% AEP 10% AEP 5% AEP 2% AEP 1% AEP1 Brockman Hay Cutting Creek 46.500 25% 1.20 1.51 1.85 2.31 2.69 1.56 1.96 2.36 2.87 3.262 Sandy Creek 199.155 25% 5.13 6.47 7.92 9.91 11.50 6.67 8.41 10.11 12.30 13.943 Brockman Creek 396.763 25% 10.22 12.89 15.77 19.74 22.91 13.29 16.76 20.14 24.50 27.77
Total 642.418 - 16.54 20.88 25.54 31.96 37.10 21.52 27.14 32.60 39.67 44.97
24 hr duration 72 hr duration
Runoff Volume (GL)
APPENDIX E - Pre & Post-Mining Catchment Delineation and Runoff Estimates
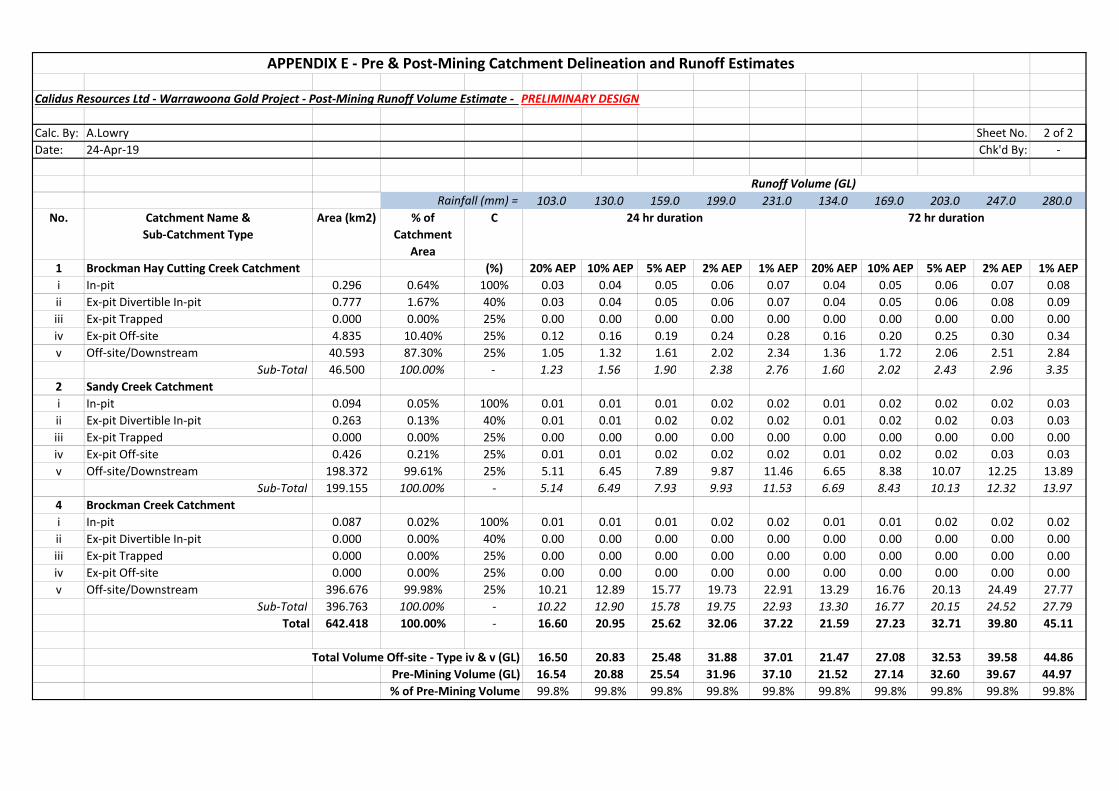
Calidus Resources Ltd - Warrawoona Gold Project - Post-Mining Runoff Volume Estimate - PRELIMINARY DESIGN
Calc. By: A.Lowry Sheet No. 2 of 2Date: 24-Apr-19 Chk'd By: -
Rainfall (mm) = 103.0 130.0 159.0 199.0 231.0 134.0 169.0 203.0 247.0 280.0No. Catchment Name &
Sub-Catchment TypeArea (km2) % of
Catchment Area
C
1 Brockman Hay Cutting Creek Catchment (%) 20% AEP 10% AEP 5% AEP 2% AEP 1% AEP 20% AEP 10% AEP 5% AEP 2% AEP 1% AEPi In-pit 0.296 0.64% 100% 0.03 0.04 0.05 0.06 0.07 0.04 0.05 0.06 0.07 0.08ii Ex-pit Divertible In-pit 0.777 1.67% 40% 0.03 0.04 0.05 0.06 0.07 0.04 0.05 0.06 0.08 0.09iii Ex-pit Trapped 0.000 0.00% 25% 0.00 0.00 0.00 0.00 0.00 0.00 0.00 0.00 0.00 0.00iv Ex-pit Off-site 4.835 10.40% 25% 0.12 0.16 0.19 0.24 0.28 0.16 0.20 0.25 0.30 0.34v Off-site/Downstream 40.593 87.30% 25% 1.05 1.32 1.61 2.02 2.34 1.36 1.72 2.06 2.51 2.84
Sub-Total 46.500 100.00% - 1.23 1.56 1.90 2.38 2.76 1.60 2.02 2.43 2.96 3.352 Sandy Creek Catchmenti In-pit 0.094 0.05% 100% 0.01 0.01 0.01 0.02 0.02 0.01 0.02 0.02 0.02 0.03ii Ex-pit Divertible In-pit 0.263 0.13% 40% 0.01 0.01 0.02 0.02 0.02 0.01 0.02 0.02 0.03 0.03iii Ex-pit Trapped 0.000 0.00% 25% 0.00 0.00 0.00 0.00 0.00 0.00 0.00 0.00 0.00 0.00iv Ex-pit Off-site 0.426 0.21% 25% 0.01 0.01 0.02 0.02 0.02 0.01 0.02 0.02 0.03 0.03v Off-site/Downstream 198.372 99.61% 25% 5.11 6.45 7.89 9.87 11.46 6.65 8.38 10.07 12.25 13.89
Sub-Total 199.155 100.00% - 5.14 6.49 7.93 9.93 11.53 6.69 8.43 10.13 12.32 13.974 Brockman Creek Catchmenti In-pit 0.087 0.02% 100% 0.01 0.01 0.01 0.02 0.02 0.01 0.01 0.02 0.02 0.02ii Ex-pit Divertible In-pit 0.000 0.00% 40% 0.00 0.00 0.00 0.00 0.00 0.00 0.00 0.00 0.00 0.00iii Ex-pit Trapped 0.000 0.00% 25% 0.00 0.00 0.00 0.00 0.00 0.00 0.00 0.00 0.00 0.00iv Ex-pit Off-site 0.000 0.00% 25% 0.00 0.00 0.00 0.00 0.00 0.00 0.00 0.00 0.00 0.00v Off-site/Downstream 396.676 99.98% 25% 10.21 12.89 15.77 19.73 22.91 13.29 16.76 20.13 24.49 27.77
Sub-Total 396.763 100.00% - 10.22 12.90 15.78 19.75 22.93 13.30 16.77 20.15 24.52 27.79Total 642.418 100.00% - 16.60 20.95 25.62 32.06 37.22 21.59 27.23 32.71 39.80 45.11
Total Volume Off-site - Type iv & v (GL) 16.50 20.83 25.48 31.88 37.01 21.47 27.08 32.53 39.58 44.86 Pre-Mining Volume (GL) 16.54 20.88 25.54 31.96 37.10 21.52 27.14 32.60 39.67 44.97
% of Pre-Mining Volume 99.8% 99.8% 99.8% 99.8% 99.8% 99.8% 99.8% 99.8% 99.8% 99.8%
24 hr duration 72 hr duration
Runoff Volume (GL)
APPENDIX E - Pre & Post-Mining Catchment Delineation and Runoff Estimates

J1827R01 Final 29 May 2019
F1
APPENDIX F
Water Management Calculations

AL FIGURE F1
J1827 – Warrawoona Gold Project
Calidus Resources Limited
May 19
Appendix F Copenhagen Mining Area
North ast Creek Catchment Area Peak Flow Estimate

AL
Appendix F Mine Access Road Upstream
Catchment Area No. 1Peak Flow EstimateFIGURE F2
J1827 – Warrawoona Gold Project
Calidus Resources Limited
May 19

AL
Appendix F Mine Access Road Upstream
Catchment Area No. 2Peak Flow EstimateFIGURE F3
J1827 – Warrawoona Gold Project
Calidus Resources Limited
May 19
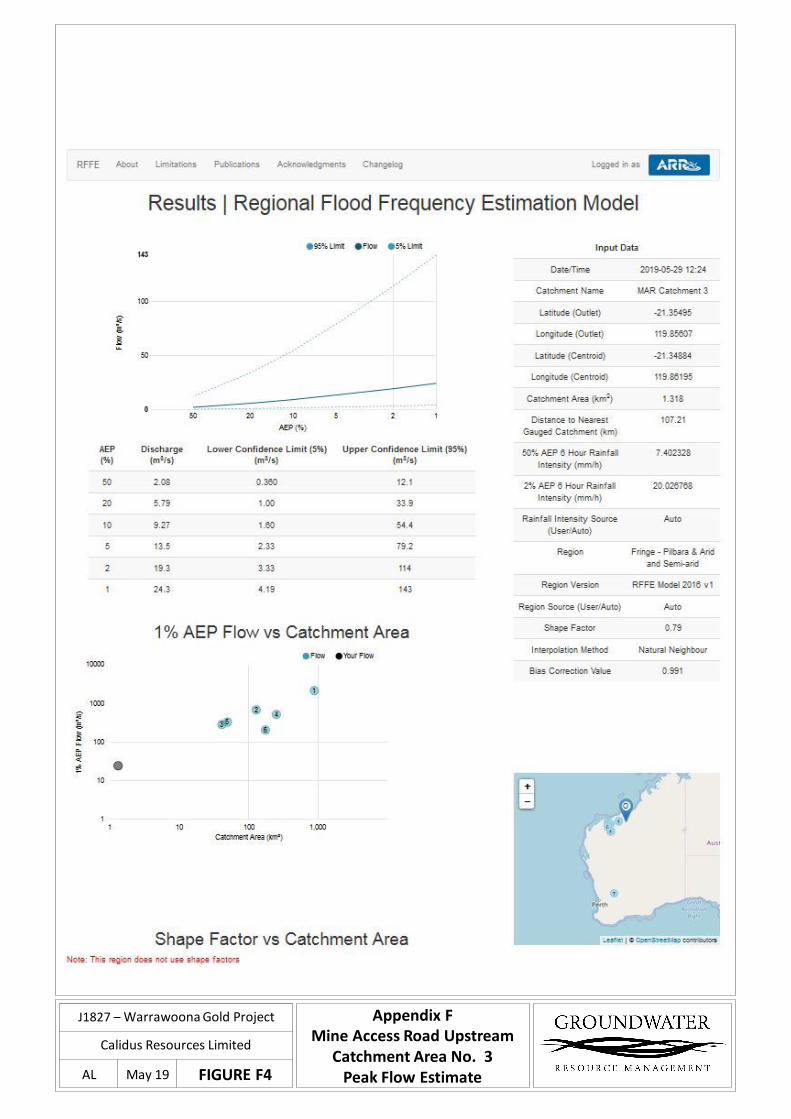
AL
Appendix F Mine Access Road Upstream
Catchment Area No. 3Peak Flow EstimateFIGURE F4
J1827 – Warrawoona Gold Project
Calidus Resources Limited
May 19
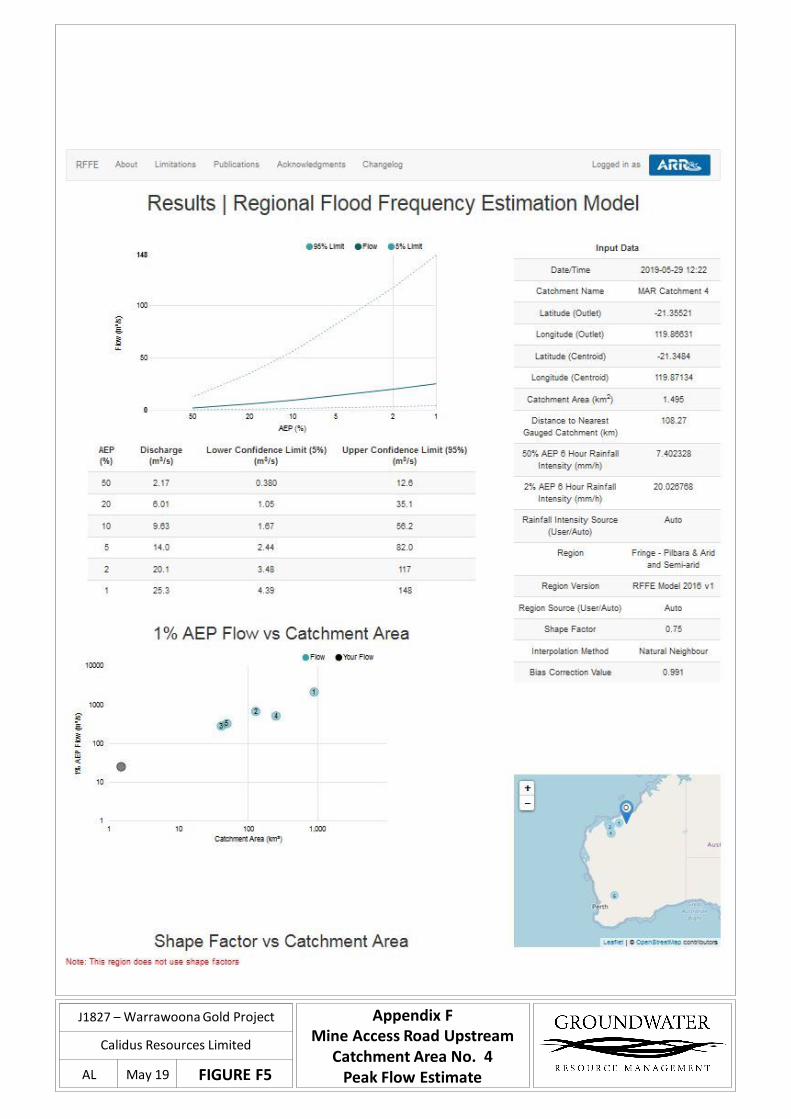
AL
Appendix F Mine Access Road Upstream
Catchment Area No. 4Peak Flow EstimateFIGURE F5
J1827 – Warrawoona Gold Project
Calidus Resources Limited
May 19

AL
Appendix F Mine Access Road Upstream
Catchment Area No. 5Peak Flow EstimateFIGURE F6
J1827 – Warrawoona Gold Project
Calidus Resources Limited
May 19
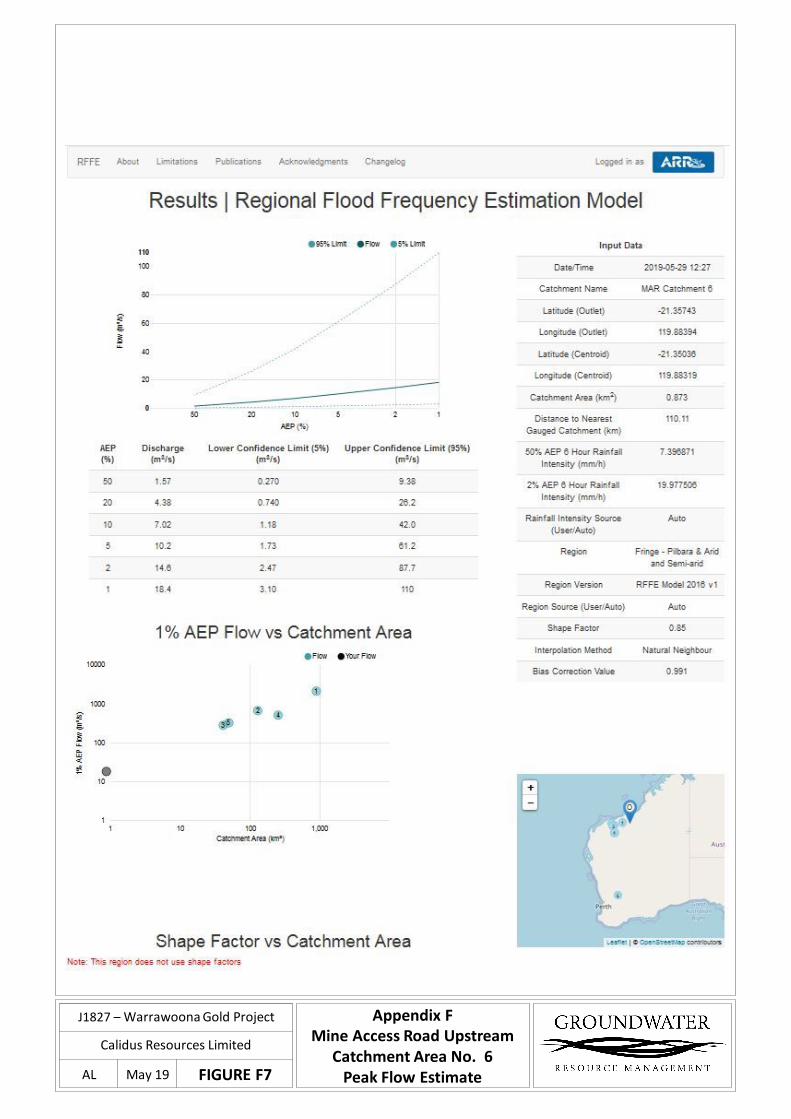
AL
Appendix F Mine Access Road Upstream
Catchment Area No. 6Peak Flow EstimateFIGURE F7
J1827 – Warrawoona Gold Project
Calidus Resources Limited
May 19
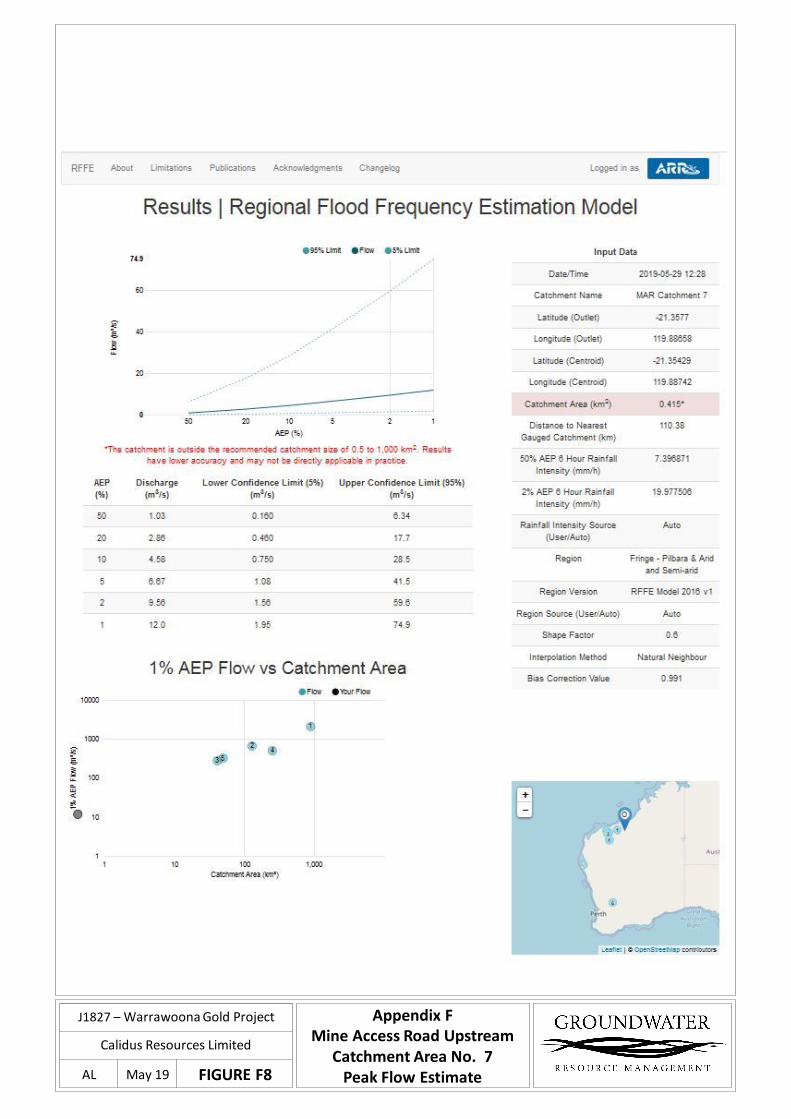
AL
Appendix F Mine Access Road Upstream
Catchment Area No. 7Peak Flow EstimateFIGURE F8
J1827 – Warrawoona Gold Project
Calidus Resources Limited
May 19

AL
Appendix F Mine Access Road Upstream
Catchment Area No. 8Peak Flow EstimateFIGURE F9
J1827 – Warrawoona Gold Project
Calidus Resources Limited
May 19

AL
Appendix F Mine Access Road Upstream
Catchment Area No. 9Peak Flow EstimateFIGURE F10
J1827 – Warrawoona Gold Project
Calidus Resources Limited
May 19